Compressed Natural Gas Vehicles for the City of Milwaukee ...
63
Compressed Natural Gas Vehicles for the City of Milwaukee’s Department of Public Works: A Cost-Benefit Analysis Prepared for the: City of Milwaukee, Department of Public Works, Operations Division by Erika Cheng Lael Grigg Erika Jones Adam Smith Workshop in Public Affairs Spring 2011
Transcript of Compressed Natural Gas Vehicles for the City of Milwaukee ...

Compressed Natural Gas Vehicles for the City of Milwaukee’s Department of Public Works:
A Cost-Benefit Analysis
Prepared for the:
City of Milwaukee, Department of Public Works, Operations Division
by Erika Cheng Lael Grigg Erika Jones Adam Smith
Workshop in Public Affairs Spring 2011

ii
©2011 Board of Regents of the University of Wisconsin System All rights reserved.
For additional copies: Publications Office
La Follette School of Public Affairs 1225 Observatory Drive, Madison, WI 53706
www.lafollette.wisc.edu/publications/workshops.html [email protected]
The Robert M. La Follette School of Public Affairs is a teaching
and research department of the University of Wisconsin–Madison. The school takes no stand on policy issues; opinions expressed in these pages
reflect the views of the authors.

iii
Table of Contents
Tables and Figures .............................................................................................................. v Foreword ............................................................................................................................ vi Acknowledgments............................................................................................................ viii Executive Summary ........................................................................................................... ix Acronyms ............................................................................................................................ x Introduction ......................................................................................................................... 1 Problem Statement .............................................................................................................. 1 Analysis Framework ........................................................................................................... 2 Why Natural Gas? ............................................................................................................... 2 Features of the Milwaukee Department of Public Works Fleet .......................................... 4 Problem Approach ............................................................................................................ 12 Costs and Benefits............................................................................................................. 12
Vehicle Purchase Price ...................................................................................................13 Fuel Costs and Fuel Economy ........................................................................................13 Energy Dependence ........................................................................................................15 Environmental Emissions ...............................................................................................15 Health Impacts ................................................................................................................16 Tax Credits, Incentives, and Reimbursements ...............................................................17 Garage Facilities .............................................................................................................19 Fuel Safety ......................................................................................................................19 Fueling Stations ..............................................................................................................19 Labor and Training .........................................................................................................20 Maintenance and Operations ..........................................................................................20
Analysis............................................................................................................................. 21 Model Specifications ......................................................................................................21 Sensitivity Analyses .......................................................................................................22
Results ............................................................................................................................... 23 Model Specification 1 ....................................................................................................23 Model Specification 2 ....................................................................................................23 Model Specification 3 ....................................................................................................23 Model Specification 4 ....................................................................................................23 Results from Sensitivity Analyses ..................................................................................24
Conclusions and Recommendations ................................................................................. 25 References ......................................................................................................................... 27 Appendix A: Milwaukee’s Department of Public Works ................................................. 33 Appendix B: Existing Research on Compressed Natural Gas Use ................................... 34
Greening Garbage Trucks: New Technologies for Cleaner Air .....................................34 The Business Case for Compressed Natural Gas in Municipal Fleets ...........................35 Modified Vehicle and Infrastructure Cash-Flow Evaluation .........................................36 Natural Gas Vehicles: What State Public Utility Commissions Should Know and Ask ...........................................................................................................................36 City of Toronto ...............................................................................................................36
iv
Appendix C: Detailed Information on Fuel Costs and Fuel Economy ............................. 38 Appendix D: Hydraulic Fracturing ................................................................................... 40 Appendix E: Diesel and Natural Gas Recent Historical Prices ........................................ 41 Appendix F: Detailed Information on Energy Dependence ............................................. 43 Appendix G: Detailed Information on Environmental Emissions .................................... 44 Appendix H: Health Impacts of Diesel Exhaust Exposure ............................................... 46 Appendix I: Detailed Information on Fueling Stations ..................................................... 48 Appendix J: Monte Carlo Assumptions and Model Parameters ....................................... 50
Explanation of Parameter Ranges ..................................................................................51

v
Tables and Figures Table 1: Equipment Maintained by DPW Fleet Services, 2008 ............................. 5 Table 2: Age of DPW’s Refuse Packers, 2010 ....................................................... 9 Table 3: DPW Refuse Packer Fleet Characteristics, 2008 – 2010* ...................... 10 Table 4: DPW Refuse Packer Characteristics by Fuel Type, 2010 ...................... 11 Table 5: Parameter Estimates Used in Analyses by Fuel Type ............................ 21 Table 6: Cost-Benefit Model Specifications ......................................................... 22 Table 7: Net Present Values of 2012 CNG Refuse Packer Purchases for
Milwaukee DPW Using Static Point Estimates ............................................. 23 Table 8: Net Present Value Estimates and Ranges from Sensitivity Analyses..... 24 Table 9: Probability of Positive Net Benefits ....................................................... 24 Table 10: Probability of Net Benefit Loss Greater Than $100,000 ...................... 24 Table H-1: Vehicular Pollutants Associated with Adverse Health Effects .......... 46 Table J-1: Parameters and Sources ....................................................................... 50 Table J-2: NWC Fuel Price Growth Rate Estimates ............................................. 52 Table J-3: Formulas for Model Specifications ...................................................... 52 Figure 1: DPW 2010 Fleet Characteristics by Fuel Type – On-Road Vehicles ..... 6 Figure 2: 2010 Fuel Consumption per DPW Vehicle ............................................. 7 Figure 3: 2010 Fuel Cost per DPW Vehicle ........................................................... 8 Figure 4: DPW Fleet Composition ......................................................................... 9 Figure 5: DPW Total Refuse Packer Fleet Costs 2008 – 2010 ............................. 11 Figure A-1: Organizational Chart for Milwaukee Department of Public Works . 33 Figure C-1: Delivered Natural Gas Prices: Transportation Sector: East North
Central Census ............................................................................................... 38 Figure C-2: Delivered Natural Gas Prices: Transportation Sector: East North
Central Census 2009 Dollars per Diesel Gallon Equivalent .......................... 39 Figure C-3: Petroleum Prices: Transportation Diesel Fuel: AEO 2011 Reference
Case ............................................................................................................... 39 Figure E-1 Annual U.S. No. 2 Diesel Retail Sales by All Sellers ........................ 41 Figure E-2: Monthly U.S. No. 2 Diesel Ultra-Low Sulfur Retail Sales by All
Sellers ............................................................................................................ 41 Figure E-3: Annual U.S. Natural Gas Citygate Price ........................................... 42 Figure F-1: U.S. Historical Petroleum Prices ....................................................... 43

vi
Foreword This report is the result of collaboration between the Robert M. La Follette School of Public Affairs at the University of Wisconsin–Madison and the Budget and Management Division of the City of Milwaukee’s Department of Administration. Our objective is to provide graduate students at La Follette the opportunity to improve their policy analysis skills while contributing to the capacity of the city government to provide public services to the residents of Milwaukee.
The La Follette School offers a two-year graduate program leading to a master’s degree in public affairs. Students study policy analysis and public management, and they can choose to pursue a concentration in a policy focus area. They spend the first year and a half of the program taking courses in which they develop the expertise needed to analyze public policies.
The authors of this report are all in their last semester of their degree program and are enrolled in Public Affairs 869 Workshop in Public Affairs. Although acquiring a set of policy analysis skills is important, there is no substitute for doing policy analysis as a means of learning policy analysis. Public Affairs 869 gives graduate students that opportunity.
This year the students in the workshop were divided into six teams, three under my supervision and three supervised by my La Follette School colleague Professor Karen Holden. The Milwaukee-related research topics were solicited from various city government departments by Eric Pearson, Budget and Policy Manager in the Division of Budget and Management. The authors of this report were assigned to work on a research project for the Operations Division of the city’s Department of Public Works.
Rising fuel costs and growing concern about air pollution and global warming have spurred the Department of Public Works to consider using alternative fuels for its vehicle fleet. In this report, the students conduct a detailed cost-benefit analysis of the replacement of a portion of the city’s fleet of diesel-powered garbage trucks with trucks powered by compressed natural gas.
This report would not have been possible without the support and encouragement of city Budget Director Mark Nicolini and project coordinator Eric Pearson. Other people in the Department of Public Works and elsewhere also contributed to the success of the report. Their names are listed in the acknowledgments section of the report.
The report also benefited greatly from the support of the staff of the La Follette School. Cindy Manthe contributed logistic support, and Karen Faster, the La Follette Publications Director, managed production of the final bound document.

vii
By involving La Follette students in the tough issues confronting city government in Milwaukee, I hope they not only have learned a great deal about doing policy analysis but have gained an appreciation of the complexities and challenges facing city governments in Wisconsin and elsewhere. I also hope that this report will contribute to the decisions the city will make about the composition of the Department of Public Works vehicle fleet.
Andrew Reschovsky May 2011
Madison, Wisconsin

viii
Acknowledgments We would like to thank the individuals who provided assistance, guidance, and support throughout the course of our research and analysis. We thank City of Milwaukee staff for their guidance and interest in alternative fuel vehicles. In particular, we thank Thomas Bell, Budget and Management Special Assistant; Michael O’Donnell, Quality Assurance Coordinator; Paul Klajbor, Administrative Services Manager; and Jeffrey A. Tews, CPFP, Fleet Operations Manager. We also thank Caley Johnson, author and creator of the Vehicle and Infrastructure Cash-Flow Evaluation tool. Finally, we thank the faculty and staff at the Robert M. La Follette School of Public Affairs, especially Professor Andrew Reschovsky, for providing valuable feedback.

ix
Executive Summary The Fleet Services section of the Milwaukee Department of Public Works (DPW) aims to provide low cost service delivery while mitigating environmental impacts. This analysis focuses on the costs of expanding the Department’s use of compressed natural gas (CNG) refuse packers (garbage trucks). To this end, we estimate and compare the marginal cost of replacing retired refuse packers with CNG-fueled refuse packers to the current practice, which replaces retired refuse packers with diesel-fueled refuse packers. In this report, we identify and estimate the costs associated with choosing between CNG- or diesel-fueled refuse packers. We construct a cost-benefit model with four specifications that incorporate assumptions about renewed tax incentives and the non-fiscal costs associated with fuel emissions. A sensitivity analysis accounts for the inherent uncertainty associated with some factors, such as fuel costs. Results, given in net present value (NPV) estimates, indicate positive net benefits associated with the 2012 purchase and use of 10 CNG-fueled refuse packers over a 12-year vehicle life. Further, the relative vehicle purchase price, fuel costs, and fuel economy are the most influential factors in determining a positive net benefit. We recommend that the Fleet Services section purchase 10 CNG refuse packers in 2012; however, the section must continue to monitor vehicle performance and external circumstances to ensure the achievement of an economically and environmentally sustainable refuse packer fleet.

x
Acronyms AEO Annual Energy Outlook
CMAQ Congestion Mitigation and Air Quality
CNG Compressed natural gas
CO2 Carbon dioxide
CO2e Carbon dioxide equivalent
DGE Diesel gallon equivalent
DOE U.S. Department of Energy
DPW Milwaukee Department of Public Works
EERE U.S. Department of Energy – Energy Efficiency and Renewable Energy Alternative Fuels and Advanced Vehicles Data Center
EIA U.S. Energy Information Administration
EPA U.S. Environmental Protection Agency
GhG Greenhouse gas
LNG Liquefied natural gas
MpDGE Miles per diesel gallon equivalent
NPV Net present value
NOx Nitrogen oxides
OPEC Organization of Petroleum Exporting Countries
PM Particulate matter
ULSD Ultra-low sulfur diesel fuel
VICE Vehicle and Infrastructure Cash-Flow Evaluation

1
Introduction Growing interest in environmental stewardship, stress on natural resources, rising fuel costs, and shrinking public budgets have led local municipalities around the United States to diversify the fuels they use in their fleets (Gordon, Burdelski, & Cannon, 2003). In 2010, the Milwaukee Department of Public Works (DPW) received a grant from the federal Congestion Mitigation and Air Quality (CMAQ) program for the purchase of 20 compressed natural gas (CNG) fueled refuse packers (garbage trucks) and the installation of two CNG fueling stations (Wisconsin Department of Transportation [WisDOT], 2010). The Department’s leadership would like to determine the costs and benefits of expanding the use of alternative fuel vehicles in its fleet, beyond the purchase of the 20 CMAQ grant-funded CNG vehicles. When considering alternative fuel vehicles, the Department wants to fulfill the following goals: 1) mitigate the fleet’s environmental impacts and promote efficient energy consumption; 2) maintain low cost service delivery; and 3) hedge against spikes in fuel costs by utilizing a variety of fuel types. In short, DPW’s leaders would like to know the most cost-efficient method to “green” its fleet. The Department’s goals align with both City of Milwaukee (n.d.) and Milwaukee County efforts to enhance environmental sustainability goals, improve efficiency in service delivery, and reduce operating costs (see Appendix A for more information on DPW’s organizational structure). Problem Statement DPW leaders face declining budget resources, high fuel costs, and concerns regarding the environmental impacts of fleet vehicles. Ensuring the continuation of cost-effective service represents a major challenge for the Department over the next decade. According to Jeffrey Tews, DPW Fleet Operations Manager, and Michael O’Donnell, DPW Quality Assurance Coordinator, the Fleet Services section has been forced to delay equipment purchases in the past two years as a result of constrained resources (Tews and O’Donnell, personal communication, April 15, 2011). Because the Fleet Services budget is not expected to increase significantly for 2012, the section is looking for a long-term solution to maintain current levels of service. While the Operations Division budget has remained relatively stable between 2003 and 2009, fuel costs, which account for a significant portion of DPW’s expenses, fluctuated considerably. Between 2007 and 2008, the Fleet Operations section experienced a 41-percent increase in energy expenditures. The following year, these expenditures decreased 38 percent (City of Milwaukee Department of Administration [DOA], 2009; City of Milwaukee DOA, 2010; City of Milwaukee DOA, 2011). According to DPW Fleet Services, in 2010 fleet vehicles consumed

2
over $3.2 million worth of diesel fuel.1 Simultaneously, DPW expressed a commitment to improving overall fleet sustainability, particularly in instances in which cost savings may accrue. In addition, diesel consumption results in emissions that contribute to global warming and general air pollution. Compressed natural gas vehicles may represent a long-term option that effectively addresses these problems, allowing DPW to reduce the amount of money spent on fuel, take advantage of federal financial incentives, and reduce harmful emissions. Analysis Framework This report examines the costs and benefits of replacing DPW’s diesel-fueled refuse packers with CNG-fueled refuse packers. In consultation with DPW staff members, we focus on refuse packers because of their high levels of fuel consumption and the potential benefits achieved through CNG replacement of existing refuse packers. Then we estimate and compare the costs of replacing retired refuse packers with CNG-fueled refuse packers to the current DPW policy, which replaces retired refuse packers with diesel-fueled refuse packers. The analysis in this report is based largely on data provided by the City of Milwaukee DPW. We obtained the data by special requests from the Department and by accessing its annual fleet and budget reports, which are available online. In addition, we completed an extensive review of the literature to inform our analysis (See Appendix B for more information on the literature reviewed for this analysis). The National Renewable Energy Laboratory’s CNG Vehicle and Infrastructure Cash-Flow Evaluation (VICE) model provided an initial framework for our analysis (Johnson, 2010). Using the VICE model parameters as a guide, we analyze a comprehensive collection of monetary costs and benefits associated with the decision to purchase CNG vehicles. In the future, DPW can use the methodology we employ to analyze other alternative fuel types or types of fleet vehicles. Why Natural Gas? The transportation sector contributed 26 percent of total U.S. greenhouse gas (GhG) emissions in 2009 (U.S. Environmental Protection Agency [EPA], 2010c).2 Diesel-fueled trucks are among the oldest, most polluting, and least fuel efficient fleet vehicles in the United States (Gordon, Burdelski, & Cannon, 2003). Several alternative fuels exist, including propane (also known as liquefied petroleum gas), battery-electric systems, hybrid electric systems, biodiesel, and hydrogen fuel cells. Obstacles, however, exist in adopting these fuels for refuse packers.
1 Data provided by DPW Fleet Services, March 2011. 2 The EPA attributed 1,719.7 million metric tons of CO2 emissions to the transportation sector out of the total 6,633.2 million metric tons of GhG inventoried in 2009.

3
For propane, the obstacles include safety concerns about its density and flammability as well as price volatility. According to the U.S. Department of Energy – Energy Efficiency and Renewable Energy Alternative Fuels and Advanced Vehicles Data Center (EERE) (n.d.d), no manufacturers currently offer propane-burning refuse packers. Battery electric and hybrid electric fuel systems show considerable potential for refuse packers, especially given the start-and-stop nature of refuse packer driving. These systems, however, are not in widespread commercial use due to the prohibitive weight and cost of the batteries. In fact, our search of the EERE database and website found only one diesel/electric hybrid refuse packer, made by Peterbilt Motors, available for purchase. Biodiesel and synthetic diesel fuels are feasible given the existing engine technologies; however, these fuels are not yet available on a commercial scale and would require new production facilities before refuse packer fleet adoption is feasible. Fuel cell systems are promising for heavy-duty vehicle application, but they remain in the development and demonstration stage. Our EERE search did not find any refuse packers using fuel cell technology available for purchase. Additionally, access to the liquid hydrogen needed for operating fuel cells is extremely limited. We conclude that, given the state of current technology and existing infrastructure, natural gas is the most feasible fuel alternative for refuse packers. We found nine natural gas-operated refuse packer models available for purchase in our search of the EERE database. The EERE website also lists several examples of refuse packer fleets around the country using natural gas vehicles. Other alternative fuels are primarily used for passenger or light-duty vehicles (U.S. DOE EERE, 2011a). Natural gas is a mixture of hydrocarbon compounds, primarily methane (U.S. Energy Information Administration [EIA], 2011a). As a transportation fuel, it can be delivered through existing pipeline systems, has a high octane rating, and works well for spark-ignited combustion engines. The Energy Information Administration of the Department of Energy (2010d) estimates that in 2007, 84 percent of the natural gas consumed in the United States was sourced domestically, and production is projected to reach 94 percent by 2035. The clean-burning nature of natural gas adds to the growing interest in its use as an alternative transportation fuel. The carbon content of CNG fuel is lower than diesel fuel, so during combustion less carbon is oxidized, which results in reduced carbon dioxide (CO2) emissions. Approximately 25 percent of the energy consumed in the United States comes from natural gas, and, of that, users consume only about 0.1 percent for transportation-related activities (U.S. DOE EERE, n.d.a). To use natural gas

4
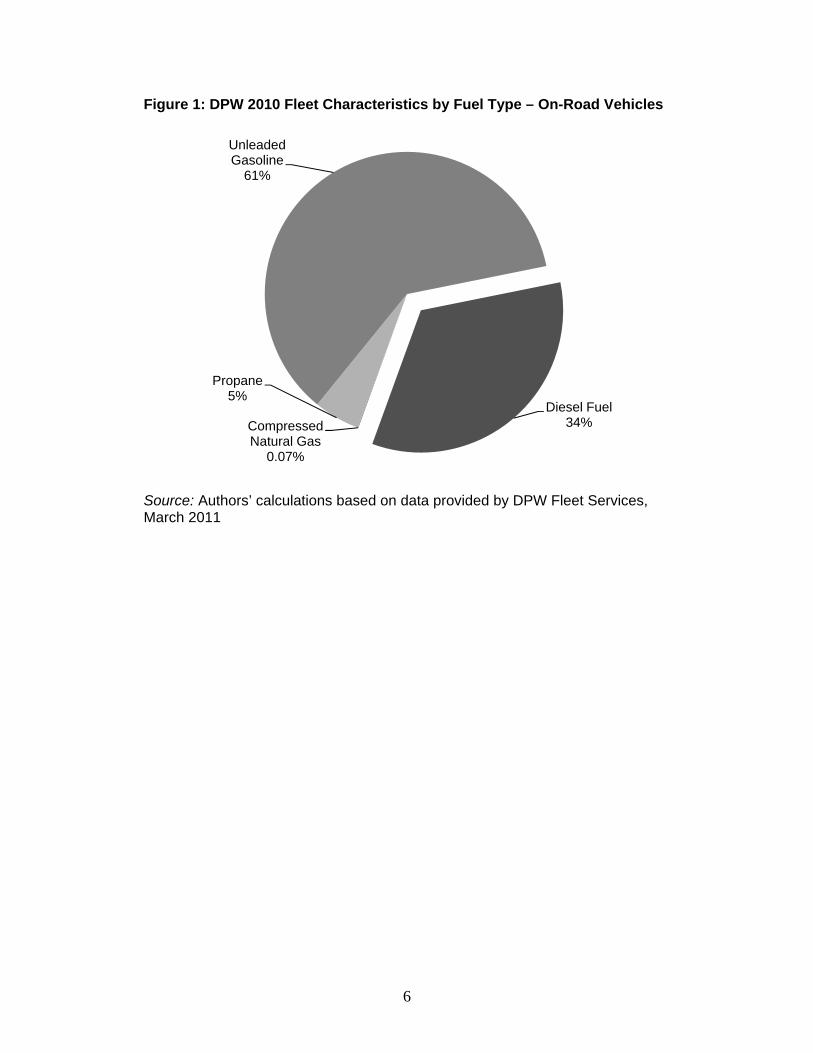
for transportation, the fuel must be compressed or liquefied to store it on-board a vehicle.3 Existing CNG Fueling Infrastructure Users often prefer CNG to liquefied natural gas (LNG) alternatives when existing infrastructure is available, as is the case for the Milwaukee DPW. Although LNG provides higher energy storage density, which lends itself to faster refueling and greater on-board capacity, these characteristics are more valuable for fleets traveling long distances before requiring refueling. On-board capacity levels of refuse packers can be lower because they travel short distances and return to a centrally located fueling station. Access to a fueling station is frequently the most important factor determining the choice of fuel type (Gordon, Burdelski, & Cannon, 2003). Because the federal Congestion Mitigation and Air Quality (CMAQ) grant is already funding the construction of two fueling stations for exclusive DPW use, CNG is becoming a more attractive option for DPW. In addition to the new fueling stations, Wisconsin Electric (We) Energies (2011) operates four natural gas fueling stations that are open to the public in the City of Milwaukee. Additionally, the Clark Oil Company maintains a CNG station located at the Milwaukee airport (U.S. DOE, 2010a). According to DPW’s Fleet Operations Manager, Jeffrey Tews, however, fueling heavy-duty vehicles at these public access stations is time-consuming and inefficient (Tews, personal communication, March 18, 2011). Features of the Milwaukee Department of Public Works Fleet Milwaukee’s Fleet Services is located within the Operations Division of the Department of Public Works (See Appendix A). Table 1 displays the equipment type, quantity, and replacement value estimates that comprise DPW’s fleet (City of Milwaukee, 2008). In 2011, on-road vehicles in DPW’s fleet use four different fuel types: unleaded gasoline (61 percent), diesel fuel (34 percent), propane gas (5 percent), and compressed natural gas (less than 1 percent) (Figure 1).
3 CNG tanks store the fuel at high pressure (about 3,600 pounds per square inch) requiring roughly four times the space of diesel fuel. Liquefied natural gas (LNG) is condensed into a liquid (by cooling it to –260°F) and stored in double-wall, vacuum-insulated pressure vessels requiring roughly twice the space of diesel fuel (U.S. DOE EERE, n.d.a).

5
Table 1: Equipment Maintained by DPW Fleet Services, 2008 Type
Quantity in Fleet
% of Total Fleet Value
Replacement Value (millions $)
Refuse Collection 201 27 $ 44.6 Trucks and Motorized Equip. 497 18 30.0 Dump Trucks 266 15 26.0 Police Equipment 676 11 17.7 Construction Equipment 493 7 11.2 Non-Automotive Equipment 1,258 6 10.0 Aerials, Equipment 53 5 8.0 Passenger Vehicles 365 5 8.3 Street Sweepers 22 2 3.3 Light Trucks 158 2 3.8 Small Tractors 56 2 3.8
Total 4,045 100 $166.7
Source: City of Milwaukee, 2008 In 2010, the Milwaukee DPW Fleet Services section had 705 on-road vehicles in its fleet that used diesel fuel. These vehicles consumed over 966,700 gallons of diesel fuel in 2010, resulting in a total fuel cost exceeding $2.8 million.4 Per vehicle, the fleet’s diesel fueled vehicles consumed more fuel (Figure 2) and cost the Department more money (Figure 3) than any other fuel type.
4 Data provided by DPW Fleet Services, March 2011.
6
Figure 1: DPW 2010 Fleet Characteristics by Fuel Type – On-Road Vehicles
Source: Authors’ calculations based on data provided by DPW Fleet Services, March 2011
Compressed Natural Gas
0.07%
Propane5%
Unleaded Gasoline
61%
Diesel Fuel34%

7
Figure 2: 2010 Fuel Consumption per DPW Vehicle
Source: Authors’ calculations using data provided by DPW Fleet Services, March 2011
0
200
400
600
800
1000
1200
1400
1600
Compressed Natural Gas Diesel Fuel Propane Unleaded Gasoline
Gal
lons
8
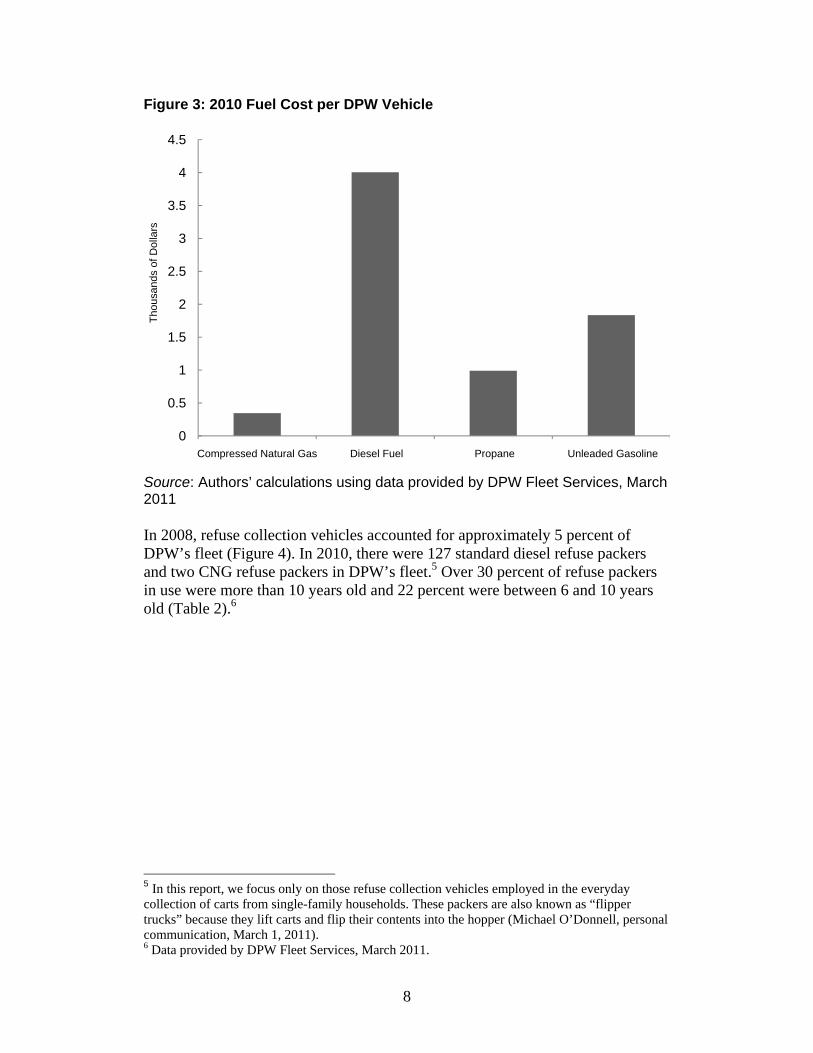
Figure 3: 2010 Fuel Cost per DPW Vehicle
Source: Authors’ calculations using data provided by DPW Fleet Services, March 2011 In 2008, refuse collection vehicles accounted for approximately 5 percent of DPW’s fleet (Figure 4). In 2010, there were 127 standard diesel refuse packers and two CNG refuse packers in DPW’s fleet.5 Over 30 percent of refuse packers in use were more than 10 years old and 22 percent were between 6 and 10 years old (Table 2).6
5 In this report, we focus only on those refuse collection vehicles employed in the everyday collection of carts from single-family households. These packers are also known as “flipper trucks” because they lift carts and flip their contents into the hopper (Michael O’Donnell, personal communication, March 1, 2011). 6 Data provided by DPW Fleet Services, March 2011.
0
0.5
1
1.5
2
2.5
3
3.5
4
4.5
Compressed Natural Gas Diesel Fuel Propane Unleaded Gasoline
Thou
sand
s of
Dol
lars

9
Figure 4: DPW Fleet Composition
Source: Authors’ calculations using data provided by DPW Fleet Services, March 2011 Table 2: Age of DPW’s Refuse Packers, 2010
Vehicle Age Number Percentage of Refuse Packer Fleet 0-5 years 61 47% 6-10 years 28 22% Over 10 years 40 31% Total 129 100% Source: Authors’ calculations using data provided by DPW Fleet Services, March 2011
DPW policy identifies an ideal service life of 11 years for refuse packers and fleet records suggest a life of 12 years; therefore, the Department will need to purchase 10 or 11 new vehicles annually to maintain the size of its packer fleet. In addition, the Department faces the low fuel efficiency, low environmental performance, and high maintenance costs associated with an aging fleet. Table 3 shows the annual use and cost of diesel fuel for Milwaukee DPW to operate its diesel refuse packers. In 2010, the Department’s refuse packer fleet traveled over 763,000 miles and consumed almost 373,000 gallons of fuel, indicating slightly more than 2 miles per gallon (mpg) fuel efficiency (Table 3).7 7 Data provided by DPW Fleet Services, March 2011.
Police Equipment17%
Refuse Collection- All
Types5%
Dump Truck - All Types
7%
Passenger Vehicles
9%
Construction Equipment
12%
Trucks and Motorized
Equipment -Other 12%
Aerials Equipment, Street Sweepers, Light
Trucks, and Small Tractors
7%
Non-Automotive Equipment -
Other31%

10
On average, each refuse packer in the Milwaukee DPW fleet traveled 6,761 miles in 2010.8 This figure results from Milwaukee’s urban nature. Refuse packers in Milwaukee travel short distances to provide the same service as routes in suburban or rural areas, which spend more time on highways. Tews notes: “the engine is also powering the hydraulic pump and compacting the trash while the truck idles” (Tews, personal communication, March 18, 2011). For example, a refuse packer that only travels 28 miles over the course of an 8-hour workday may perform the equivalent of 240 miles in terms of engine wear and tear. In 2010, the average cost of diesel fuel consumed by DPW refuse packers was $2.93 per gallon, resulting in a total fuel cost of roughly $1.1 million.9 A significant portion of costs associated with packer fleet operations were fuel costs, a trend that has remained constant between 2008 and 2010. Table 3: DPW Refuse Packer Fleet Characteristics, 2008 – 2010*
Total Values 2008 2009 2010 Average
Total Meter Use (Miles) 711,493 734,349 763,276 736,363
Total Fuel Qty (Gallons) 378,580 357,725 372,500 369,602
Average Miles per Gallon 1.9 2.1 2.1
Average Vehicle Age (yrs) 7.2 8.0 8.0
Costs (Dollars)
Fuel 1,455,034 870,297 1,095,424
Labor 665,073 726,173 855,850
Parts 506,916 624,722 685,585
Misc - 576 11,475
Total 2,627,023 2,221,768 2,648,334
Total Cost per Mile (Dollars) 3.69 3.03 3.47
Average Cost per Gallon (Dollars) 6.94 6.21 7.10
Number of Vehicles 113 110 129 * Annual fluctuations in fuel usage may reflect a number of factors including cyclical vehicle replacement, use of packers as snow plows, the number of special collections, or the effects of an idle reduction program (Jeffrey Tews, personal communication, April 25, 2011). Source: Authors’ calculations using data provided by DPW Fleet Services, March 2011
8 Average based on diesel refuse packers in service for the entirety of 2010. Data provided by DPW Fleet Services, March 2011. 9 Data provided by DPW Fleet Services, March 2011.

11
Figure 5: DPW Total Refuse Packer Fleet Costs 2008 – 2010
Source: Authors’ calculations using data provided by DPW Fleet Services, March 2011
Two CNG refuse packers entered service in the Milwaukee fleet on November 17, 2010. They covered 584 meter use-miles before the end of the year, using about 417 diesel gallon equivalents (DGE) for a fuel economy of 1.4 meter use-miles per DGE (Table 4).10 Table 4: DPW Refuse Packer Characteristics by Fuel Type, 2010 Entire Fleet Diesel Only CNG Only Meter Use (Miles) 763,276 762,692 584 Fuel Qty (Gallons) 372,500 372,500 417 Miles per Gallon 2.1 2.1 1.4 Costs (Dollars)
Fuel 1,095,424 1,094,728 695 Labor 855,850 852,183 3,667 Parts 685,585 685,577 8 Misc 11,475 11,475 -
Total 2,648,334 2,643,963 4,370 Total Cost per Mile (Dollars) 3.47 3.47 7.48
Number of Vehicles 129 127 2 Source: Data provided by DPW Fleet Services, March 2011
10 Meter-use-miles refer to the miles traveled by the vehicle, as measured by onboard meters similar to odometers in passenger cars.
Fuel
Fuel
Fuel
Labor Labor Labor
Parts Parts Parts
Misc Misc 0
200
400
600
800
1,000
1,200
1,400
1,600
2008 2009 2010
Thou
sand
s of
Dol
lars

12
Problem Approach In order to compare the relative costs of diesel- and CNG-fueled refuse packers, we made the following assumptions and predictions regarding future DPW purchases: 1) the Department intends to retain its current fleet size; 2) the Department will purchase new packers beginning in 2012 in order to maintain the current fleet size, despite purchasing CNG vehicles with funds from the Congestion Mitigation and Air Quality (CMAQ) grant; 3) the Department replaces refuse packers once they reach the end of their useful life of 12 years (we call these retired refuse packers); and 4) new refuse packers replace the oldest vehicles in the fleet. Based on these assumptions, we predict the Department will purchase 10 new refuse packers in 2012 and use each through the end of 2023. Our period of analysis thus begins in 2012. We use a cost-benefit analysis to compare a policy of replacing retired refuse packers with CNG-fueled refuse packers to the current DPW policy that replaces retired refuse packers with diesel-fueled refuse packers. Our cost-benefit model estimates the net present value (NPV) associated with the purchase and operation of CNG vehicles.11
We estimate four specifications of this model, each with a different set of assumptions. In addition, we calculate the probability of gains and losses associated with CNG vehicle purchase. Costs and Benefits The following factors may impact the decision to transition from diesel to CNG vehicles:
1. Vehicle Purchase Price 2. Fuel Costs and Fuel Economy 3. Energy Dependence 4. Environmental Emissions 5. Health Impacts 6. Tax Credits, Incentives, and Reimbursements 7. Project Life and Salvage Value 8. Garage Facilities 9. Fuel Safety 10. Fueling Stations 11. Labor and Training 12. Maintenance and Operations
In the following section, we analyze these factors in the context of relevant research and provide justification for the estimates used in our cost-benefit model. 11 NPV represents the difference between the present value of a stream of benefits and a stream of costs.

13
Vehicle Purchase Price The initial cost of CNG refuse packers represents the biggest obstacle when changing from diesel-fueled vehicles. In 2003, the purchase price of CNG refuse packers, accounting for federal credits, was $30,295 higher than the price of equivalent diesel packers (Gordon, Burdelski, & Cannon, 2003). The average cost of the 15 diesel refuse packers DPW purchased in 2010 was $206,462 each, while the CNG refuse packers purchased in 2010 were $265,807 each. This resulted in an extra expense of nearly $60,000 per CNG vehicle. According to Tews, however, bid estimates for the fleet’s next 19 CNG refuse packers suggest an additional cost of only $37,000 per CNG vehicle (personal communication, March 24, 2011). This figure excludes the Alternative Motor Vehicle Credit, which expired at the end of 2010. Presently, CNG refuse trucks are more expensive than diesel trucks; however, this could change. In 2004, the government introduced increased emissions standards for heavy-duty diesel vehicles requiring low-sulfur fuel and pollution control devices such as particulate filters and oxidation catalysts (Gordon, Burdelski, & Cannon, 2003). Higher emissions standards are possible; the 2004 required technologies do not address all of the pollution problems associated with diesel exhaust. Higher standards could increase manufacturing and initial costs for diesel refuse packers. Furthermore, increased demand for CNG refuse packers around the country could increase the efficiency of production, lead to economies of scale, and reduce the initial cost for CNG vehicles. Our analysis, therefore, is conservative since we assume that the additional cost of each CNG packer will remain about $37,000. Fuel Costs and Fuel Economy A significant cost difference exists between CNG and diesel fuel. Lower and more stable prices for CNG relative to diesel translate to lower fuel costs for CNG, even with some reduction in fuel economy (U.S. EIA, 2010a). Because refuse packers consume large quantities of fuel, this cost difference could result in significant fuel cost savings. Diesel refuse packers have a national average fuel economy of 2.80 miles per gallon (mpg), and CNG refuse packers have a fuel economy of 2.51 miles per diesel gallon equivalent (mpDGE) (a 10.5 percent efficiency reduction from diesel trucks) (Johnson, 2010). Tews estimates a 15 to 20 percent efficiency reduction from diesel trucks (personal communication, March 15, 2011). We employ a 15-percent reduction in efficiency as a point estimate in our analysis. As discussed, the urban nature of Milwaukee’s routes accounts for DPW’s lower average meter use-miles per diesel gallon than the national diesel mpg. The Department’s CNG fuel economy is also lower than the national average. The total cost for the 417 diesel gallon equivalents (DGE) purchased in 2010 was $695, with an average cost per DGE of $1.67. This is significantly less than the

14
$2.94 paid for diesel per gallon; however, the CNG price is based on only 6 weeks of data and 417 purchased DGEs. The data for the natural gas and diesel projections from the U.S. Energy Information Administration (EIA) Annual Energy Outlook 2011 report suggest that natural gas will remain significantly less expensive than diesel fuel through 2035 (see Appendix C for more information). EIA’s projections assume that current policy guidelines and any applicable sunset provisions influence fuel prices without predicting the actions of future legislators. Further, the projections assume that member nations of the Organization of Petroleum Exporting Countries (OPEC) will continue to produce a consistent share of the world’s oil supply. The estimates also account for the geopolitical and economic instability of non-OPEC nations (U.S. EIA, 2010c). Based on these data, our analysis uses a starting diesel fuel cost of $2.96 per gallon in 2012 with a 1.8 percent growth rate. For natural gas, the starting cost in 2012 is estimated at $1.68 per DGE with a 0.2 percent growth rate (U.S. EIA, 2010a). Fuel price and supply projections involve numerous uncertainties and assumptions. One major assumption is that current laws and regulations will not change over the course of the projections. Future projections of natural gas prices are based on the assumption that a provision of the Energy Policy Act of 2005 that exempts the hydraulic fracturing (“hydrofracking”) process from regulations in the Clean Water Act and the Clean Air Act will remain in force.12 In June 2009, bills were introduced in the House (H.R. 2766) and the Senate (S. 1215) to remove this exemption, with the goal of protecting groundwater resources from contamination (Fracturing Responsibility and Awareness of Chemicals Act, 2009). If these bills become law, the cost of extracting natural gas will likely increase. Uncertainty also surrounds the future regulatory environment for diesel fuel – policymakers have continually tightened diesel emissions standards. If Congress approves more stringent regulations, the price of diesel fuel will likely increase more quickly than our projected growth rate. Price fluctuations and occasional spikes are a concern for all fossil fuels. The price of crude oil has increased from about $25 per barrel in January 2000 to an average of $127 per barrel in January 2008, with prices close to $150 per barrel on some days (U.S. EIA, n.d.d). Oil prices also spike when triggered by events such as Hurricane Katrina, turmoil in oil-producing countries, or cuts in oil production by OPEC countries (U.S. EIA, n.d.e). The market is also vulnerable to large temporary price movements since limited short-term alternatives exist for natural gas (U.S. EIA, 2010e). Natural gas prices have experienced significant wellhead price fluctuations in the past. After deregulation in the 1980s, the price hovered around $2.30 per million British thermal units (Btu), but in 2000, prices reached $10 per million Btu at the wellhead, with averages around $6 per million 12 Monetizing the impacts of hydrofracking, a process used to recover natural gas, is beyond the scope of this analysis (see Appendix D for more information about hydrofracking).

15
Btu in 2006 (Northwest Power and Conservation Council [NWC], 2010; See Appendix E). Our analysis uses the projected national average fuel prices for 2012 converted to 2010 dollars, or $1.68 per DGE and $2.96 per gallon for CNG and diesel, respectively (U.S. EIA, 2010b). Over a 6-week period in 2010, the Department paid $1.67 per DGE for CNG and $2.94 per gallon for diesel. Energy Dependence Natural gas proponents frequently cite energy security and energy independence as an incentive for changing from diesel to CNG fuel. Milwaukee refuse packers represent an extremely small share of the national natural gas market, so changing the entire fleet to CNG would have an infinitesimally small effect on U.S. foreign oil dependence. Estimating a monetized benefit to Milwaukee from reduced national foreign oil dependence is beyond the scope of this analysis, and the contribution Milwaukee’s fleet will make toward this goal is effectively zero (See Appendix F for more information about energy dependence). The United States can only achieve the national goal of energy independence if many government agencies, individuals, and businesses take steps to reduce oil, gasoline, and diesel use.
Environmental Emissions The U.S. Environmental Protection Agency (EPA) Office of Transportation and Air Quality (2006) produced a report on recent trends in U.S. greenhouse gas (GhG) emissions that attributes 19 percent of the total U.S. carbon dioxide equivalent (CO2e ) emissions, or 343 Teragrams (Tg) CO2e, to heavy-duty diesel powered vehicles in 2003.13 The California Air Resources Board produced a study that found 20 to 29 percent reductions were achieved in CO2e when heavy-duty diesel trucks were changed to CNG fuel (Gordon, Burdelski, & Cannon, 2003). Additional studies show GhG emissions reductions of 18 to 25 percent from changing to natural gas from diesel (U.S. EPA, n.d.b). The change to CNG would also lead to significant localized benefits from reducing air pollution, which Milwaukee DPW leadership may weigh more heavily than small contributions to overall GhG reductions. Milwaukee DPW uses ultra-low sulfur diesel (ULSD) fuel in compliance with a nationwide mandate that took effect in 2010 requiring 100 percent of diesel fuel refined in or imported into the United States to be ULSD (U.S. DOE EERE, 2011b). According to the EPA (n.d.a; n.d.b), CNG releases 7,773 grams of carbon dioxide (CO2) per DGE and ULSD fuel emits 9,966 grams of CO2 per gallon. For the last 3 years, Milwaukee DPW used an average of approximately 369,600 gallons of diesel fuel per year.14 If each gallon produces 9,966 grams of CO2 13 One Teragram is equal to 1012 grams. 14 Data provided by DPW, March 2011.

16
during combustion, or 21.9 pounds per gallon (U.S. EPA, n.d.a), then Milwaukee’s fleet emits 8,940,300 pounds or roughly 4,047 tons of CO2 annually. The lowest reduction estimate suggests that converting DPW’s entire refuse packer fleet to CNG vehicles will result in an 18 percent annual reduction in emissions, or 728 tons of CO2. The high-end estimate points to a 29 percent annual reduction, or 1,174 tons of CO2 (this is equivalent to removing 129 to 209 passenger vehicles from the road [U.S. EPA, n.d.b]). These figures assume that each vehicle type uses the same amount of fuel; in fact, fuel efficiency differences between diesel and CNG vehicles may reduce or even negate the emissions benefits of changing to CNG (we consider this possibility in our Monte Carlo analysis). (See Appendix G for further discussion of environmental emissions). Overall, the change from diesel to CNG may result in CO2 emissions reductions, depending on the fuel economy of the refuse packers. To monetize emissions reductions requires assigning a social cost to CO2 and air pollution emissions. Matthews and Lave (2000) conducted a review of studies that quantify the social cost of emissions based on health impacts and lost productivity through damage functions and willingness to pay estimates. Since many complicated and often controversial assumptions are involved in these studies, resulting in large variation in estimates, our analysis conservatively uses Matthews and Lave’s minimum numbers for our point estimates of the cost per ton of CO2.
Health Impacts According to Gordon, Burdelski, & Cannon’s report for INFORM, Inc. (2003), emission output and noise pollution place conventional diesel-fueled refuse packers among the most polluting fleet vehicles in the United States. Community members and refuse packer drivers are both susceptible to immediate and long-lasting effects of diesel exhaust exposure (Lipsett & Campleman, 1999; Jakobsson, Gustavsson, & Lundberg, 1997; see Appendix H for more information on the health impacts of diesel exhaust exposure). Perhaps the most damaging aspect of diesel exhaust is particulate matter (PM).15 These small exhaust particles are likely to lodge and linger in the deepest air sacs of the lung, aggravating respiratory illnesses, such as bronchitis, emphysema, and asthma, and are associated with premature deaths from cardio-pulmonary disorders (Feuer, Carmichael, Campbell, Solomon, & Hathaway, 1998). Long-term exposure to diesel exhaust particles poses the highest cancer risk of any toxic air contaminant. In fact, the EPA recently credited regular occupational exposure to diesel exhaust with up to a 50 percent increased risk of lung cancer (California
15 Since 1987, the EPA has a PM10 air quality standard. The PM10 standard focuses on small particles that reach the lower regions of the respiratory tract and are likely responsible for adverse health effects. The PM10 standard includes particles with a diameter of 10 micrometers or less (0.0004 inches or one-seventh the width of a human hair) (U.S. EPA, 2010a).
17
Office of Environmental Health Hazard Assessment, 2002). Epidemiological evidence indicates that the risk of lung cancer increases with length of employment (Apostolopoulos, Sönmez, Shattell, & Belzer, 2010). Incorporating CNG vehicles into DPW’s fleet would reduce PM emissions and lower the risk of many of these health effects. Our analysis adopts PM emission estimates from Lyford-Pike (2003). The analysis compared emissions from heavy-duty vehicles and found more than a 90-percent reduction in particulate matter from CNG trucks compared to diesel trucks. Specifically, the report estimated the average concentration of PM10 emissions for heavy-duty diesel vehicles at 0.24 grams per mile and at 0.015 grams per mile for CNG vehicles.
Tax Credits, Incentives, and Reimbursements The federal government offers a number of subsidies and incentives to help mitigate the additional costs associated with a change to CNG vehicles. First, the Alternative Fuel Excise Tax Credit provides a credit of $0.50 for each gasoline gallon equivalent of CNG purchased (U.S. DOE EERE, n.d.b). Current law specifies that this incentive expires at the end of calendar year 2011. Wisconsin imposes an excise tax of 32.9 cents per gallon (including 2 cents per gallon fee) on motor fuels (including diesel and CNG). A federal fuel tax of 24.4 cents per gallon applies to diesel and 18.3 cents per GGE applies to CNG. As a public entity, DPW is exempt from these federal taxes; however, DPW pays federal fees for motor fuels (Wisconsin Legislative Fiscal Bureau, 2011; U.S. Internal Revenue Service, 2009; Tews, personal communication, 2011). Extension of the Alternative Fuel Excise Tax Credit would significantly reduce the costs associated with CNG. The Alternative Fuel Infrastructure Tax Credit covers 30 percent of alternative fueling equipment costs, not to exceed $30,000 (U.S. DOE EERE, n.d.c). This credit can be applied toward multiple fueling facilities. Under current law, this credit also expires at the end of 2011. We will not incorporate this incentive into our analysis because our framework assumes the city already has funds allocated for building two fueling stations. Another program, the Alternative Motor Vehicle Credit, expired on December 31, 2010. This credit, first established in 2005, reimbursed vehicle purchasers 80 percent of the cost difference between diesel and alternative fuel vehicles, up to $32,000 per vehicle (Johnson, 2010; U.S. Internal Revenue Service, n.d.). The expiration of this credit significantly increases the costs associated with the purchase of CNG vehicles. In addition to tax credit-based incentives, a number of grant and loan opportunities exist via the federal government, including the Congestion Mitigation and Air Quality (CMAQ) program, through which Milwaukee received its initial funding for CNG vehicles and two fueling stations. CMAQ remains a

18
prospective source of funding, assuming Milwaukee County maintains eligibility as an air quality non-attainment and maintenance area.16 In fiscal year 2010, Wisconsin received $17.8 million in federal CMAQ funding (WisDOT, 2010). According to the Wisconsin Department of Transportation, which administers the program, the next application cycle will take place near the end of 2011. CMAQ requires a 20 percent local funding match for any federal monies received (WisDOT, 2010). Based on the uncertainty surrounding the Wisconsin and federal budgets, including the federal transportation reauthorization bill, there is no guarantee these credits will continue. A review of Governor Walker’s 2011–2013 budget revealed no state incentives for alternative fuels or vehicles (Wisconsin, Department of Administration, Division of Executive Budget & Finance, 2011). President Obama’s 2012 Budget proposal includes some funding for projects that improve the sustainability and livability of cities (Office of Management and Budget, 2011). At the time of this analysis, the funds for the CMAQ program have not been renewed, and discussions surrounding the federal transportation reauthorization bill are ongoing. In two of our cost-benefit model specifications, we assume that Congress extends none of the tax credits discussed above; in the other two, we assume that the legislature extends each incentive throughout the life of the project. Additionally, we do not assume that DPW secures any additional grant funding from federal or state sources; however, based on its past success, pursuit of these opportunities should remain a priority for the Department in future years.
Project Life and Salvage Value To compare diesel and CNG refuse packers accurately, we must account for any differences in the useful life of the alternative vehicle types, along with their salvage value.17 The literature suggests that few differences exist between CNG and diesel vehicles in terms of both parameters (Gordon, Burdelski, & Cannon, 2003; Johnson, 2010). The Vehicle and Infrastructure Cash-Flow Evaluation (VICE) model projects a useful life of 12 years for each type of vehicle. DPW sets a policy of an 11-year expected life for refuse packers based upon a combination of industry standards and experience; this figure represents ideal practice, budgetary constraints notwithstanding (Tews, personal communication, March 31, 2011). Actual DPW data suggest that budget constraints required the Department to fall behind in replacing these vehicles. Thirty-one refuse packers were over 12 years old in 2010.18 Our analysis uses a 12-year timeframe to approximate ideal practice.
16 The EPA defines a non-attainment area as an area of the country where air pollution levels persistently exceed the national ambient air quality standards (U.S. EPA, 2010b). 17 A salvage value is any variation in each vehicle’s value at the end of its useful life. 18 Data provided by DPW, March 2011.

19
Johnson (2010) also identifies a negligible difference between the salvage values of each vehicle type. In communication with Milwaukee DPW staff (January 28, 2011), a refuse packer’s salvage value lies primarily in its use as a source of replacement parts for other vehicles. We assume no difference between the value of diesel refuse packer parts and those of a CNG-fueled unit.
Garage Facilities Based on previous literature, we assume that the garage and facility costs associated with the addition of CNG vehicles are identical to those for diesel vehicles (Adams, 2006). Storage needs for CNG vehicles are not fundamentally different than those of diesel refuse packers. According to Tews, however, a number of regulations govern service facilities for CNG vehicles. Tews states that the Department has upgraded one of its garages in order to “create a safe workspace for the CNG trucks serviced there” (personal communication, March 18, 2011). We assume that any additional CNG refuse packers purchased by the city can be maintained in these upgraded facilities, and, therefore, omit garage retrofit costs from our analysis.
Fuel Safety Physical properties of natural gas provide some safety and environmental benefits over diesel fuel. Natural gas is lighter than air and will disperse into the atmosphere if it leaks from its storage vessel – having a negative impact on greenhouse gas (GhG) emissions, but a positive impact on fuel safety. Diesel and other liquid fuels may leak and form pools, which is an environmental and safety concern. Natural gas is flammable between 5 and 15 percent concentration in air, a narrow range that is managed with ventilation systems in fuel garages. A leak of liquid diesel fuel remains a hazard until the pooled gas is manually contained. Diesel is flammable at temperatures less than 500˚F, whereas natural gas is flammable above 900˚F (Adams, 2006). Overall, natural gas is no more or less hazardous than diesel fuel.
Fueling Stations The U.S. Department of Energy (2003; 2010b) suggests considering the number and type of vehicles fueled, fueling patterns, location, future growth, and permitting restrictions when determining the type of fuel station for a fleet. Because Milwaukee experiences a cold weather climate, indoor fuel station garages may be desirable. Indoor fuel station garages may incur additional costs due to safety requirements, such as ventilation systems and other potential code requirements; however, these costs are unlikely to be any greater than those for an indoor diesel fuel station (Adams, 2006). Tews indicated that Milwaukee’s CNG fueling stations will have the capacity to continuously fuel vehicles without any service delays, suggesting that Milwaukee plans to install stations with the buffered-fast fill fueling method (personal communication, March 24, 2011).

20
(For a detailed explanation of the types of fueling stations and the costs associated with each, see Appendix I). Our analysis assumes that all fueling station costs are sunk costs because: 1) the Department is currently in the process of installing two stations; and 2) the Department must maintain the stations regardless of future CNG purchases. We also assume these stations can accommodate the additional 10 vehicles considered in this analysis (Tews, personal communication, 2011).
Labor and Training Johnson (2010) identified no significant staff cost differences between diesel and CNG refuse vehicles. While conversion of a fleet may add or reduce labor requirements slightly, possible additional hostlers (those who refuel, clean, and maintain vehicles) should not overly sway financial considerations. We assume equivalent labor and training costs for diesel and CNG refuse packers.
Maintenance and Operations Johnson (2010) assumes annual maintenance costs of about $13,000 per vehicle for both diesel and CNG vehicles. DPW data from 2010 puts this figure at $13,550 per vehicle.19 As mentioned, refuse packers in Milwaukee serve large numbers of residents, adding wear and tear to engines while traveling relatively short distances. This dynamic explains the higher figure for the city’s vehicles. Additionally, Tews associates the high maintenance costs for Milwaukee’s two CNG vehicles with initial activities necessary to prepare the vehicles for use and the fact that this estimate only applies to 6 weeks of data (personal communication, March 18, 2011). In our model, we assume CNG maintenance and operations costs equivalent to those of diesel vehicles and employ an estimate of $2.03 per mile for each vehicle type. Table 5 summarizes the point estimate (or, our best guess) for each factor by fuel type. The point estimates of some of the factors of interest are uncertain because their true value likely falls within a range of possible values, as reflected in the table.
19 Data provided by DPW, March 2011.

21
Table 5: Parameter Estimates Used in Analyses by Fuel Type
Factor Diesel Point Estimate (Range)
CNG Point Estimate (Range)
Vehicle Purchase Price (dollars) - 37,000 (30,000 to 40,000)
Fuel Costs (dollars) 2.96 1.68 Fuel Cost Growth Rate (annual percent)
1.8 (~–0.60 to ~4.20)
0.2 (~–1.91 to ~2.31)
Fuel Economy 2.15 mpg (~2.10 to ~2.20)
1.83 mpDGE (~1.73 to ~1.93)
Energy Dependence - -
Environmental Emissions (CO2e) 9,966 g/gal 7,773 g/DGE
Health Impacts (PM10) 0.244 g/mi 0.015 g/mi Project Life and Salvage Value (dollars) - -
Garage Facilities - - Fuel Safety - - Fueling Stations - - Labor and Training - - Maintenance and Operations - -
Source: Authors Analysis We use the point estimates in Table 5 to calculate the net present value (NPV) of the additional cost of replacing 10 diesel refuse packers with CNG refuse packers in 2012. Our primary analysis employs a cost-benefit model. The model considers static point estimates of the different purchase price of diesel or CNG vehicles, labor and training costs, maintenance and operations costs, and potential fuel cost savings. Subsequent analyses account for the potential range of values for some of the factors. All monetary values are in 2010 dollars.20
Model Specifications We devise four specifications of our model that allow separate assumptions regarding tax incentives and environmental emissions. The first specification accounts solely for the direct financial expenditures and savings associated with transitioning to CNG refuse packers. The NPV is a revenue-only estimate that considers only the parameters that have a fiscal impact for the Milwaukee DPW budget, which the Department can use to isolate the budget impacts of replacing diesel packers with CNG packers in the absence of any incentives. 20 In addition to the VICE model, we used SAS 9.2 (SAS Institute Inc., Cary, NC) to perform descriptive analyses and Excel (Microsoft) to perform Monte Carlo analyses.

22
The second model specification assumes renewal of current tax credits and incentives in 2012. The NPV is a revenue estimate that includes federal tax incentives; this specification assumes that these incentives are renewed in 2012. The third model specification includes health benefits and avoided carbon dioxide (CO2) and particulate matter (PM10) emissions associated with CNG fuel consumption compared to diesel fuel consumption. The Department’s goal is to “green” its fleet, so this model incorporates environmental impacts. Finally, the fourth model specification calculates the NPV incorporating both renewed government incentives and any benefits related to avoided health impacts and emissions. Our cost-benefit model specifications are outlined in Table 6. Table 6: Cost-Benefit Model Specifications
Incentives Not Renewed Incentives Renewed
Emissions Excluded Specification 1 Specification 2 Emissions Included Specification 3 Specification 4
Source: Authors Sensitivity Analyses To account for the uncertainty of some factors, we conduct sensitivity analyses for each specification using the Monte Carlo approach, which uses repeated random sampling to predict scenario outcomes within a range of probabilities (Boardman, Greenberg, Vining, & Weimer, 2011). Our analysis takes into consideration the potential variability in average vehicle miles traveled, fuel economy, fuel growth rate, initial cost of a CNG refuse packer, and the shadow price of environmental emissions (See Appendix J for an explanation of the parameters varied in the sensitivity analyses). In addition, we apply a discount rate of 3.5 percent because we calculate costs accrued over time.21 The analysis uses 10,000 trials for each model specification to establish a mean value and distribution of realized net benefits.22 We also predict the probabilities of positive net benefits and of losses greater than $100,000 under each model specification.
21 The point estimate we employ for the discount rate is the midpoint of the range (3 to 4 percent) provided by Thomas Bell, Budget and Management Special Assistant for the City of Milwaukee (personal communication, March 24). 22 In our sensitivity analyses, we bound the variability of each parameter and employed normal distributions to the fuel cost growth rate and the fuel economy for both CNG and diesel in order to cluster the draws around our point estimates.

23
Results Table 7 presents the findings from our primary analysis, which uses static point estimates. Each specification of our model shows marginal gains associated with investment in CNG refuse packers. NPV point estimates range from $34,000 to $462,000. Table 7: Net Present Values of 2012 CNG Refuse Packer Purchases for Milwaukee DPW Using Static Point Estimates
Incentives Not Renewed Incentives Renewed
Emissions Excluded $34,000 $449,000 Emissions Included $47,000 $462,000
Source: Authors Model Specification 1 With static point estimates, we calculate modest net benefits associated with purchasing 10 new CNG refuse packers in 2012. Over the 12-year life of the vehicles, we estimate that the Department would save roughly $34,000 by investing in CNG packers rather than diesel packers. This estimate omits consideration of any tax incentives or benefits accruing from emissions reductions.
Model Specification 2 In the second model specification, we introduce CNG-related federal tax incentives into the model. In this case, as expected, the benefits of purchasing CNG packers result in a dramatically larger NPV. We estimate that the Department would save $449,000 over the 12-year project life if tax incentives are renewed and remain in effect for the entire project life.
Model Specification 3 In the third model specification, we consider costs associated with environmental emissions, specifically carbon dioxide (CO2) and particulate matter (PM10). These results show only a small improvement accruing from social benefits, when compared with the original specification. Static point estimates result in an NPV of $47,000 and 343 tons of avoided CO2 emissions for 10 CNG packers purchased and used over 12 years.
Model Specification 4 Model specification 4 includes both tax incentives and environmental emissions. This specification produced the most positive results—an NPV of $462,000. Compared to pure budgetary considerations, the monetary impact of environmental benefits is modest.

24
Results from Sensitivity Analyses Table 8 contains a complete listing of results from our Monte Carlo sensitivity analysis, and Table 9 provides the probability of realizing positive net benefits under each model specification. Accounting for parameter variability in our first specification provides a mean NPV of $54,000 with range from –$316,000 to $456,000. In total, 71 percent of individual trials resulted in a positive NPV. In the second model specification, we find a mean NPV of $455,000 and trials ranging from $117,000 to $824,000. In this version, 100 percent of individual trials exhibit a positive NPV associated with the purchase of CNG refuse packers. The mean NPV is $101,000 under the third model specification, with trials as low as –$289,000 and as high as $513,000. In this case, 85 percent of trials see a positive NPV. The final specification of the model, including both tax incentives and emissions, exhibits a positive mean NPV of $501,000. The individual trials vary from $144,000 to $880,000. Not surprisingly, under this version, 100 percent of the 10,000 trials resulted in a positive NPV associated with purchasing 10 new CNG vehicles in 2012.
Table 8: Net Present Value Estimates and Ranges from Sensitivity Analyses Incentives Not Renewed Incentives Renewed
Emissions Excluded $54,000 (–$316,000 to $456,000)
$455,000 ($117,000 to $824,000)
Emissions Included $101,000 (–$289,000 to $513,000)
$501,000 ($144,000 to $880,000)
Source: Authors Table 9: Probability of Positive Net Benefits
Incentives Not Renewed Incentives Renewed
Emissions Excluded 71% 100% Emissions Included 85% 100%
Source: Authors Table 10 provides the probability of a net benefit loss greater than $100,000 under each model specification. Our calculations indicate that the chance of losing more than $100,000 is less than 5 percent across all model specifications.
Table 10: Probability of Net Benefit Loss Greater Than $100,000 Incentives Not Renewed Incentives Renewed
Emissions Excluded 4.6% 0% Emissions Included 1.7% 0%
Source: Authors

25
Conclusions and Recommendations Based on the results from this analysis, we recommend that DPW Fleet Services purchase 10 CNG refuse packers in 2012. CNG-fueled refuse packers are more cost effective than diesel-fueled refuse packers and their purchase and use would result in 343 tons of avoided CO2 emissions over the life of the vehicles. Further, DPW faces a small chance of experiencing a substantial financial loss. The wide range in NPV estimates generated by our model, however, reflects significant uncertainty. The presence of federal policies in support of natural gas significantly improves the financial viability and certainty associated with the decision to invest in natural gas vehicles. While our analyses only consider the possibility for fully-funded tax incentives and credits, we realize the dynamic nature of public policy may lead to some other combination of incentives. With this in mind, DPW should consider any available incentives in future decisions. In the future, the relevance of our estimates will be strongly influenced by three parameters – relative costs of vehicle purchase, fuel, and fuel economy. For example, economies of scale may lead to reductions in the cost of CNG vehicles or higher emissions standards may make diesel vehicles more expensive to produce. Under model specification 1, our most conservative version, the NPV for purchasing CNG vehicles would increase by more than 50 percent – from approximately $34,000 to about $52,000 (holding all other parameters constant) – if the cost difference between CNG and diesel vehicles decreases by only 5 percent. On the other hand, changes in fuel costs or price spikes affecting either fuel could change the NPV calculations in either direction. In fact, modest changes in initial price differences cause substantial changes in our NPV estimates, so it is important to be aware that this parameter has huge implications for the estimates.23 Holding all other variables constant, if the price difference between CNG and diesel increases by 5 percent, (i.e., if the CNG price stays the same and the price of diesel increases from $2.96 to $3.02), then our NPV estimate increases by 62 percent, from roughly $34,000 to over $55,000. Conversely, if the price difference decreases by 5 percent (i.e., if the CNG price stays the same and the price of diesel decreases from $2.96 to $2.90), the NPV estimate decreases by 65 percent, from $34,000 to $12,000. With a 10-percent change in price difference, the NPV increases by 126 percent to $77,000 or decreases by 129 percent to –$10,000. Changes to the growth rates for CNG and diesel fuel costs also affect our NPV estimations, but not as substantially as the effect of the initial fuel cost differences. A 5-percent increase in the difference between the two growth rates leads to a 15-percent increase in NPV, and a 5-percent decrease in
23 On April 15, 2011, the spot price for CNG converted to dollars per DGE was $1.21 and the spot price for diesel was $3.87; this much larger increase in price difference would lead to an NPV of $516,000 if it were stable. It is important to note, this price differential is not stable and the changes in prices will have a significant impact on the benefits or costs of the project.
26
the difference between the growth rates leads to an 18-percent decrease in the NPV. A change in the relative fuel economy of CNG refuse packers to diesel vehicles also would also impact our NPV calculations significantly. For example, a relative improvement in CNG fuel economy of 5 percent (i.e., assuming only a 10-percent reduction in efficiency from diesel vehicles to CNG vehicles) would dramatically improve the NPV calculations, nearly doubling the net benefits from $34,000 to $63,000. Assuming a 5-percent relative decline in fuel efficiency (i.e., assuming a 20-percent reduction from diesel to CNG) leads to similarly striking results. Holding all other variables constant, this assumption results in a negative NPV of about –$1,000. The relative costs of vehicle purchase, fuel, and fuel economy greatly influence the fiscal outcome when deciding between diesel and CNG refuse packers. Our analysis accounts for the implications of renewed tax incentives and the social costs of air pollutant emissions in choosing between the diesel and CNG options. The Department should continue to pursue available grant or other funding opportunities to support efforts toward a more sustainable fleet. In summary, we recommend that the Milwaukee DPW purchase 10 CNG refuse packers in 2012; however, the Fleet Services section must continue to monitor vehicle performance and influential external circumstances to ensure the achievement of an economically and environmentally sustainable refuse packer fleet.

27
References Adams, R. (2006). Designing New Transit Bus Garages to be Fuel Flexible.
Heidelberg, Ontario, Canada: Marathon Technical Services. Retrieved from http://www.afdc.energy.gov/afdc/pdfs/bus_garage_design.pdf.
Apostolopoulos, Y., Sönmez, S., Shattell, M. M., & Belzer, M. (2010). Worksite-induced Morbidities Among Truck Drivers in the United States. AAOHN: Official Journal of the American Association of Occupational Health Nurses, 58(7), 285-96. doi: 10.3928/08910162-20100625-01.
Boardman, A. E., Greenberg, D. H., Vining, A. R., & Weimer, D. L. (2011). Cost-Benefit Analysis: Concepts and Practice, Fourth Edition. Prentice Hall.
California Office of Environmental Health Hazard Assessment. (2002). Health Effects of Diesel Exhaust. Retrieved from http://oehha.ca.gov/public_info/facts/dieselfacts.html.
Chiaravallotti, C., Hill, C., & Shintani, D. (2004). Green Fleet Transition Plan 2004–2007. Toronto. Retrieved from http://www.toronto.ca/fleet/pdf/ gftp_apr04.pdf.
City of Milwaukee. (n.d.). Department of Public Works Home Page. Retrieved from http://county.milwaukee.gov/DPW/MilwaukeeCountysGreenPrint.htm.
City of Milwaukee. (2008). Department of Public Works 2008 Fleet Report. Retrieved from http://city.milwaukee.gov/ImageLibrary/Groups/ cityDPW/divisions/operations/docs/FleetReport-2008.pdf.
City of Milwaukee. (2009). Department of Public Works 2009 Fleet Report. Retrieved from http://city.milwaukee.gov/ImageLibrary/ Groups/cityDPW/divisions/operations/docs/FleetReport-2009.pdf.
City of Milwaukee Department of Administration. (2009). 2009 Budget. Retrieved from http://city.milwaukee.gov/BudgetDocumentsDetailed.htm.
City of Milwaukee Department of Administration. (2010). 2010 Budget. Retrieved from http://city.milwaukee.gov/budget/ 2010ProposedBudget/ 2010AdoptedDetail.htm.
City of Milwaukee Department of Administration. (2011). 2011 Budget. Retrieved from http://city.milwaukee.gov/ImageLibrary/User/ crystali/2010budget/2011budget/2011adopted/adopted_2011_budget1.pdf.

28
City of Milwaukee Department of Public Works. (2011a). Compressed Natural Gas (CNG) Fueling System Equipment – Northwest Garage. Retrieved from http://city.milwaukee.gov/ImageLibrary/Groups/doaPurchasing/NewBids/2469/2469SpecsNW.pdf.
City of Milwaukee Department of Public Works. (2011b). Compressed Natural Gas (CNG) Fueling System Equipment – Lincoln Garage. Retrieved from http://city.milwaukee.gov/ImageLibrary/Groups/doaPurchasing/NewBids/2469/2469SpecsNW.pdf.
Costello, K. (2010). Natural Gas Vehicles: What State Public Utility Commissions Should Know and Ask. Silver Spring. Retrieved from http://www.nrri.org/pubs/gas/NRRI_natural_gas_vehicles_dec10-16.pdf.
Energy Policy Act of 2005, 42 U.S.C. § 300h(d) (2005).
Feuer, G. R., Carmichael, T., Campbell, T., Solomon, G., & Hathaway, J. (1998). Exhausted by Diesel: How America’s Dependence on Diesel Engines Threatens Our Health. New York. Retrieved from http://www.policyarchive.org/handle/10207/6188.
Fracturing Responsibility and Awareness of Chemicals Act, S. 1215, 111th Cong., 1st Sess. (2009).
Gingrich, S., & Pietschmann, G. (2008). Green Fleet Plan 2008 –2011. Toronto. Retrieved from http://www.toronto.ca/fleet/pdf/gfp.pdf.
Gordon, D., Burdelski, J., & Cannon, J. S. (2003). Greening Garbage Trucks: New Technologies for Cleaner Air. Garbage (pp. 1-114). New York. Retrieved from http://www.informinc.org/pages/research/sustainable-transportation/reports/119.html.
Howarth, R. W., Santoro, R., & Ingraffea, A. (2011). Methane and the Greenhouse-gas Footprint of Natural Gas from Shale Formations. Climatic Change. Retrieved from http://www.eeb.cornell.edu/howarth/Howarth%20et%20al%20%202011.pdf.
Jakobsson, R., Gustavsson, P., & Lundberg, I. (1997). Increased Risk of Lung Cancer Among Male Professional Drivers in Urban but Not Rural Areas of Sweden. Occupational and Environmental Medicine, 54(3), 189-93.
Johnson, C. (2010). Business Case for Compressed Natural Gas in Municipal Fleets. NREL Technical Report TP-7A2-47919. Retrieved from http://www.afdc.energy.gov/afdc/pdfs/47919.pdf.

29
Lipsett, M., & Campleman, S. (1999). Occupational Exposure to Diesel Exhaust and Lung Cancer: A Meta-Analysis. American Journal of Public Health, 89(7), 1009-17.
Lyford-Pike, E. J. (2003). An Emission and Performance Comparison of the Natural Gas C-Gas Plus Engine in Heavy-Duty Trucks – Final Report. National Renewable Energy Laboratory Technical Report NREL/SR-540-32863. Retrieved from http://www.nrel.gov/docs/fy03osti/32863.pdf.
Matthews, H. S., & Lave, L. B. (2000). Applications of Environmental Valuation for Determining Externality Costs. Environmental Science & Technology, 34(8), 1390-95.
Northwest Power and Conservation Council. (2010). Sixth Northwest Conservation and Electric Power Plan. Retrieved from http://www.nwcouncil.org/energy/powerplan/6/default.htm.
Office of Management and Budget. (2011). Fiscal Year 2012 Budget of the United States Government. Washington, D.C.: Office of Management and Budget.
Pollution Issues. (n.d.). Vehicular Pollution. Retrieved from http://www.pollutionissues.com/Ve-Z/Vehicular-Pollution.html.
Ris, C. (2007). U.S. EPA Health Assessment for Diesel Engine Exhaust: A Review. Inhalation Toxicology, 19 Suppl 1, 229-39.
Rosenfeld, Jeffrey, and Jackson, Michael D. (2008). Life-Cycle Cost Model and Pollutant Emissions Estimator. Vancouver: Westport Innovations, Inc. Vancouver. Retrieved from http://www.westport.com/pdf/ GHG_and_Criteria_Pollutant_Emissions_Estimator.pdf.
Urbina, I. (2011). Drilling Down. Retrieved from New York Times, http://topics.nytimes.com/top/news/us/series/drilling_down/index.html.
U.S. Department of Energy. (2010a). Compressed Natural Gas Fueling Stations in Wisconsin. Retrieved from http://www.afdc.energy.gov/afdc/ progs/ind_state.php/WI/CNG.
U.S. Department of Energy. (2010b). Issues Affecting Adoption of Natural Gas Fuel in Light- and Heavy-Duty Vehicles. Richland: Whyatt, G. Retrieved from http://www.pnl.gov/main/publications/external/technical_reports/ PNNL-19745.pdf.

30
U.S. Department of Energy. (2003). What Makes It Work? Alternative Fuel News, 7(1), 4-7. Retrieved from http://www.afdc.energy.gov/cleancities/ccn/ pdfs/afn7_1.pdf.
U.S. Department of Energy – Energy Efficiency and Renewable Energy Alternative Fuels and Advanced Vehicles Data Center. (2011a). Refuse Hauler Fleet Experiences. Retrieved from http://www.afdc.energy.gov/afdc/fleets/refuse_haulers_experiences.html.
U.S. Department of Energy – Energy Efficiency and Renewable Energy Alternative Fuels and Advanced Vehicles Data Center. (2011b). Ultra-Low Sulfur Diesel Fuel. Retrieved from http://www.eere.energy.gov/basics/ vehicles/ultra_low_sulfer_diesel.html.
U.S. Department of Energy – Energy Efficiency and Renewable Energy Alternative Fuels and Advanced Vehicles Data Center. (n.d.a). Alternative & Advanced Fuels: What is Natural Gas? Retrieved from http://www.afdc.energy.gov/afdc/fuels/natural_gas_what_is.html.
U.S. Department of Energy – Energy Efficiency and Renewable Energy Alternative Fuels and Advanced Vehicles Data Center. (n.d.b). Alternative Fuel Excise Tax Credit. Retrieved from http://www.afdc.energy.gov/afdc/laws/law/US/319.
U.S. Department of Energy – Energy Efficiency and Renewable Energy Alternative Fuels and Advanced Vehicles Data Center. (n.d.c). Alternative Fuel Infrastructure Tax Credit. Retrieved from http://www.afdc.energy.gov/afdc/laws/law/US/351.
U.S. Department of Energy – Energy Efficiency and Renewable Energy Alternative Fuels and Advanced Vehicles Data Center. (n.d.d). Alternative Heavy-Duty Vehicle and Engine Search. Retrieved from http://www.afdc.energy.gov/afdc/vehicles/search/heavy/.
U.S. Energy Information Administration. (n.d.a). AEO Table Browser. Retrieved from http://www.eia.gov/oiaf/aeo/tablebrowser/.
U.S. Energy Information Administration. (n.d.b). Annual U.S. Price of Natural Gas Sold to Commercial Consumers. Retrieved from http://www.eia.gov/dnav/ng/hist/n3020us3a.htm.
U.S. Energy Information Administration. (n.d.c). Critical Petroleum-Related Events and U.S. Refiner Acquisition Cost, 1970–2000. Retrieved from http://www.eia.doe.gov/pub/oil_gas/petroleum/analysis_publications/chronology/petrochrohotgraph.htm.
31
U.S. Energy Information Administration. (n.d.d). Petroleum & Other Liquids, Weekly Retail Gasoline and Diesel Prices. Retrieved from http://www.eia.doe.gov/petroleum/.
U.S. Energy Information Administration. (n.d.e). Primer on Gasoline Prices. Retrieved from http://www.eia.doe.gov/pub/oil_gas/petroleum/ analysis_publications/primer_on_gasoline_prices/html/petbro.html.
U.S. Energy Information Administration. (2011a). Natural Gas Glossary. Retrieved from http://www.eia.gov/tools/glossary/index.cfm?id=natural gas.
U.S. Energy Information Administration. (2011b). Petroleum & Other Liquids: U.S. Imports by Country of Origin. Retrieved from http://tonto.eia.doe.gov/dnav/pet/pet_move_impcus_a2_nus_ep00_im0_mbbl_m.htm.
U.S. Energy Information Administration. (2010a). Annual Energy Outlook 2011 Early Release Overview. Retrieved from http://www.eia.gov/forecasts/aeo.
U.S. Energy Information Administration. (2010b). Annual Energy Outlook 2010 with Projections to 2035. Retrieved from http://www.eia.doe.gov/oiaf/aeo/ otheranalysis/aeo_2010analysispapers/woprices.html.
U.S. Energy Information Administration. (2010c). Assumptions to the Annual Energy Outlook 2010 with Projections to 2035. Retrieved from http://www.eia.gov/oiaf/aeo/assumption/pdf/0554%282010%29.pdf.
U.S. Energy Information Administration. (2010d). International Energy Outlook 2010: Natural Gas. Retrieved from http://www.eia.doe.gov/oiaf/ieo/ nat_gas.html.
U.S. Energy Information Administration. (2010e). Natural Gas Explained: Factors Affecting Natural Gas Prices. Retrieved from http://www.eia.doe.gov/energyexplained/index.cfm?page=natural_gas_factors_affecting_prices.
U.S. Environmental Protection Agency. (2010a). AIRTrends 1995 Summary. Retrieved from http://www.epa.gov/airtrends/aqtrnd95/pm10.html.
U.S. Environmental Protection Agency. (2010b). The Green Book Nonattainment Areas for Criteria Pollutants. Retrieved from http://www.epa.gov/ oaqps001/greenbk/.

32
U.S. Environmental Protection Agency. (2010c). U.S. Greenhouse Gas Inventory 2011: Executive Summary. Retrieved from http://www.epa.gov/ climatechange/emissions/downloads11/US-GHG-Inventory-2011-Executive-Summary.pdf.
U.S. Environmental Protection Agency. (n.d.a). Emission Facts: Average Carbon Dioxide Emissions Resulting from Gasoline and Diesel Fuel. Retrieved from http://www.epa.gov/oms/climate/420f05001.htm.
U.S. Environmental Protection Agency. (n.d.b). Greenhouse Gas Equivalencies Calculator. Retrieved from http://www.epa.gov/cleanenergy/energy-resources/calculator.html#results.
U.S. Environmental Protection Agency. (n.d.c). Natural Gas STAR Program. Retrieved from http://www.epa.gov/gasstar/newsroom/ getting-results.html.
U.S. Environmental Protection Agency Office of Transportation and Air Quality. (2006). Greenhouse Gas Emissions from the U.S. Transportation Sector, 1990–2003. Retrieved from http://www.epa.gov/otaq/climate/420r06003.pdf.
U.S. Internal Revenue Service. (n.d.). Alternative Motor Vehicle Credit. Retrieved from http://www.irs.gov/businesses/corporations/article/ 0,,id=202341,00.html.
U.S. Internal Revenue Service. (2009). Excise Taxes. Retrieved from http://www.irs.gov/pub/irs-pdf/p510.pdf.
United Nations Framework Convention on Climate Change. (1995). The Science of Climate Change: Global Warming Potentials. Summary for Policymakers and Technical Summary of the Working Group 1 Report. Retrieved from http://unfccc.int/ghg_data/items/3825.php.
We Energies. (2011). CNG Fueling Stations. Retrieved from http://www.we-energies.com/business/altenergy/ngv_fuelingstations.htm.
Wisconsin Department of Administration, Division of Executive Budget & Finance. (2011). State of Wisconsin 2011–13 Executive Budget. Retrieved from http://www.doa.state.wi.us/debf/pdf_files/bib1113.pdf.
Wisconsin Department of Transportation. (2010). 2010 CMAQ Funded Projects. Retrieved from http://www.dot.state.wi.us/localgov/docs/cmaq-grants.pdf.
Wisconsin Legislative Fiscal Bureau. (2011). Motor Vehicle and Alternate Fuel Tax. Retrieved from http://legis.wisconsin.gov/lfb/ Informationalpapers/40_Motor%20Vehicle%20Fuel%20and%20Alternate%20Fuel%20Tax.pdf.
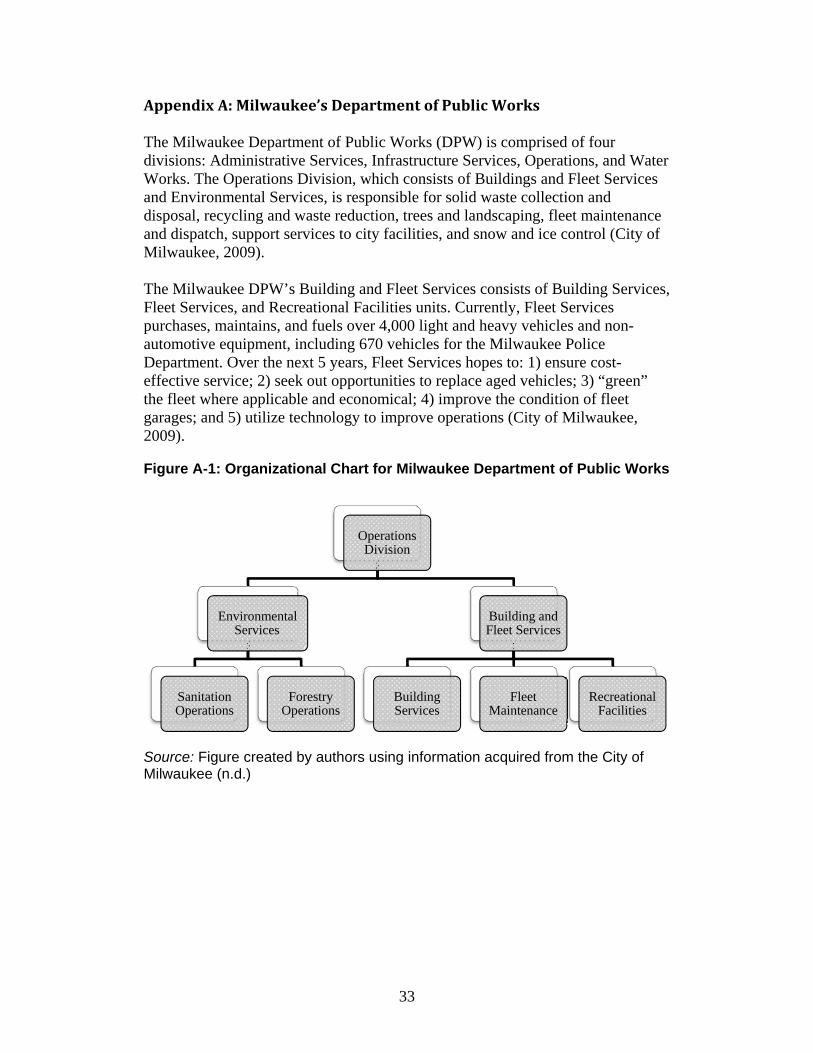
33
Appendix A: Milwaukee’s Department of Public Works
The Milwaukee Department of Public Works (DPW) is comprised of four divisions: Administrative Services, Infrastructure Services, Operations, and Water Works. The Operations Division, which consists of Buildings and Fleet Services and Environmental Services, is responsible for solid waste collection and disposal, recycling and waste reduction, trees and landscaping, fleet maintenance and dispatch, support services to city facilities, and snow and ice control (City of Milwaukee, 2009).
The Milwaukee DPW’s Building and Fleet Services consists of Building Services, Fleet Services, and Recreational Facilities units. Currently, Fleet Services purchases, maintains, and fuels over 4,000 light and heavy vehicles and non-automotive equipment, including 670 vehicles for the Milwaukee Police Department. Over the next 5 years, Fleet Services hopes to: 1) ensure cost-effective service; 2) seek out opportunities to replace aged vehicles; 3) “green” the fleet where applicable and economical; 4) improve the condition of fleet garages; and 5) utilize technology to improve operations (City of Milwaukee, 2009). Figure A-1: Organizational Chart for Milwaukee Department of Public Works
Source: Figure created by authors using information acquired from the City of Milwaukee (n.d.)
Operations Division
Environmental Services
Sanitation Operations
Forestry Operations
Building and Fleet Services
Building Services
Fleet Maintenance
Recreational Facilities

34
Appendix B: Existing Research on Compressed Natural Gas Use To gain an understanding of a variety of perspectives regarding compressed natural gas (CNG) vehicle use, fueling options, costs, benefits, and policy implications, our team reviewed a wide array of literature. A few key documents have informed our work and methods extensively and are, therefore, relevant as resources and as a framework for this report.
Greening Garbage Trucks: New Technologies for Cleaner Air Written by Deborah Gordon, Juliet Burdelski, and James S. Cannon (2003) of the non-profit INFORM, Inc., “Greening Garbage Trucks: New Technologies for Cleaner Air” is a report that captures many of the social and environmental impacts surrounding a fleet’s conversion from diesel to CNG. The authors profiled 19 hauling districts using natural gas trucks from the United States, Japan, and the Netherlands. Additionally, they interviewed natural gas providers, vehicle manufacturers, and other agencies in the industry. The report provides stakeholders from several fields, including the refuse industry, environmentalists, policy-makers, and health organizations, information on the effects of garbage truck (refuse packer) operations including emissions, costs, availability, and types of fuel and vehicles. The report considered the “direct vehicle-related impacts on public health and worker health and safety, including the effects of tailpipe emissions, fuel storage, and spills” (Gordon, Burdelski, & Cannon, 2003). The report did not include a full fuel life-cycle analysis, which accounts for costs associated with fuel from procurement through use and disposal. The report cites refuse packers as some of the oldest, least fuel-efficient, and most polluting (including air, water, and noise pollution) vehicles on the road. Additionally, the report attributed 3 percent of total diesel fuel consumption in the United States to refuse packers. The report found viable commercial options in the form of both CNG and liquefied natural gas (LNG) refuse packer fleet vehicles (Gordon, Burdelski, & Cannon, 2003). INFORM reported that waste haulers transitioning to natural gas found improved air quality and public health benefits. Economic benefits varied based on natural gas fuel prices, availability of economic incentives such as tax credits or grants, refueling infrastructure, and other training or maintenance costs. “Greening Garbage Trucks” offered the following recommendations and findings for industry decision-makers:
1. Transitions to alternative-fuel refuse packers now to avoid future expenses
as emission regulations become more stringent.

35
2. Policies provide strong incentives for transitioning to cleaner fuels; therefore, policy-makers should implement stronger regulations to encourage this shift, along with other industry incentives.
3. Governments should offer, and the industry should use, available
economic incentives to make the transition to a greener fleet.
4. Partnering with suppliers and manufacturers, as well as public and private companies, is necessary to bolster the infrastructure, reduce costs, and ensure a successful transition.
5. Research and collect data on existing fleets, available technologies, and
emissions reductions.
6. Educate the public and decision-makers on the benefits of alternative-fuel fleets.
The Business Case for Compressed Natural Gas in Municipal Fleets The 2010 report, “The Business Case for Compressed Natural Gas in Municipal Fleets,” authored by Caley Johnson and funded by the U.S. Department of Energy Vehicle Technologies Clean Cities Program, reviews the National Renewable Energy Laboratory’s CNG Vehicle and Infrastructure Cash-Flow Evaluation (VICE) model. The purpose of the report and the development of the VICE model is “to assist fleets and businesses in evaluating the profitability of potential CNG projects” (Johnson, 2010).
The report focuses on cost variables that can determine the financial feasibility of CNG for transit vehicles, school buses, and refuse packers. These vehicles “drive circular routes that enable refueling at the same station,” making them an appropriate fit for CNG. The VICE tool includes a comprehensive collection of monetary costs and benefits associated with CNG conversion. Additionally, Johnson (2010) identifies long-term cost-effectiveness, more consistent operational costs, increased energy security, lower emissions, and reduced air and noise pollution as advantages of CNG. In developing the VICE model, Johnson established common parameters that would affect the profitability of the three fleet types she considered. These parameters establish the “base-case” scenario, or what she considers as average for each type of fleet. The VICE model spreadsheet displays the common parameters which the user can then manipulate to gauge the extent to which profitability would vary with changes parameter values assumptions. The clear advantage of the VICE model is that it allows fleets to adjust parameters and estimate the costs associated with CNG vehicle use. In some cases, the

36
assumptions are based on industry data; in other cases, they are based on anecdotal evidence from interviews with industry representatives.
Modified Vehicle and Infrastructure CashFlow Evaluation The Vehicle and Infrastructure Cash-Flow Evaluation (VICE) model provides a framework for our analysis of the additional costs to the City of Milwaukee DPW for purchasing CNG-fueled refuse packers as opposed to diesel-fueled refuse packers. This tool helped guide the construction of our model, particularly in identifying cost categories and financial incentives to consider.24 To incorporate environmental and health costs and account for uncertainty in our parameters, however, we created and utilized our own model.
Natural Gas Vehicles: What State Public Utility Commissions Should Know and Ask The National Regulatory Research Institute’s briefing paper “Natural Gas Vehicles: What State Public Utility Commissions Should Know and Ask” outlines a broad range of economic, environmental, and social questions to consider before entering the natural gas vehicle fuel market (Costello, 2010). While this paper focuses primarily on public utility commissions, the questions and considerations included provide a general framework around the costs, benefits, regulatory, and environmental implications of natural gas for vehicles. Of particular interest to us are two questions regarding CNG vehicle usage that emerge from this paper: 1) Are the existing policies, regulatory structures, and infrastructure conducive to adopting CNG? and 2)What strategic partners exist within the community that may provide cost-sharing benefits? (Costello, 2010).
City of Toronto The City of Toronto instituted a comprehensive plan to “green” its municipal fleet beginning with Phase I in 2004 and moving into Phase II in 2008 (Chiaravallotti, Hill & Shintani, 2004; Gingrich & Pietschmann, 2008). Toronto is comparable to Milwaukee because of its climate; however, Toronto is substantially larger in population and area and has a larger budget than Milwaukee. In 2008, the City of Toronto had 4,700 vehicles including vehicles used by the Parks Department, Transportation Services, and Toronto Water and Solid Waste Management Services. As of December 31, 2007, Toronto had 141 natural gas vehicles out of its 283 green vehicles (Gingrich & Pietschmann, 2008).
The City of Toronto defines a green vehicle as one: “that reduces fuel consumption and/or reduces emissions of greenhouse gases and air pollutants, relative to a conventional vehicle. Examples of green vehicles include those with an ultra-fuel-efficient design, hybrid-electric or plug-in electric drive system, or
24 The baseline inputs for the VICE model use national averages, and in our analysis we have made every effort to use DPW-specific data in place of these averages.

37
an engine that uses cleaner alternative fuel or electricity as its energy source” (Gingrich & Pietschmann, 2008).
The city’s comprehensive plan to green its fleet includes reaching target numbers for emissions reduction, numbers of green vehicles added to the fleet each year, expansion of fuel types used, and incorporating new research findings into its choices.
As of 2008, the City’s natural gas vehicles did not include any refuse packers; however, the Phase II plan included plans to pilot test green trucks including heavy-duty refuse packers (Gingrich & Pietschmann, 2008).
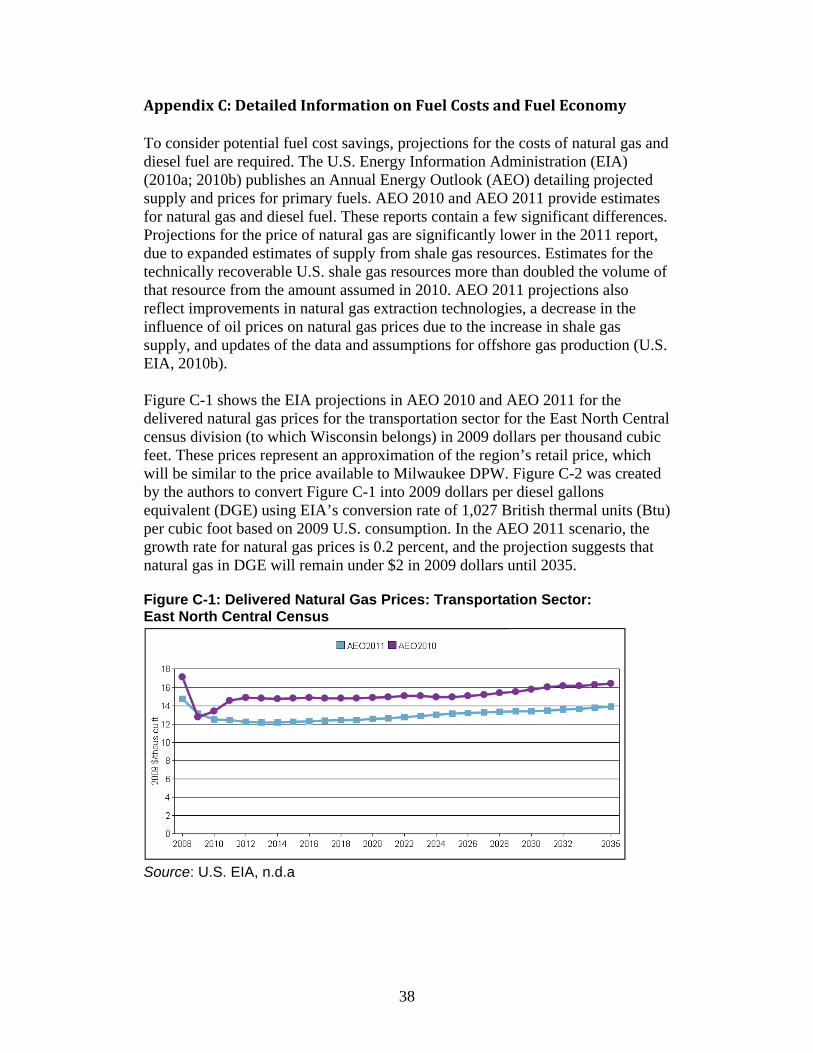
38
Appendix C: Detailed Information on Fuel Costs and Fuel Economy To consider potential fuel cost savings, projections for the costs of natural gas and diesel fuel are required. The U.S. Energy Information Administration (EIA) (2010a; 2010b) publishes an Annual Energy Outlook (AEO) detailing projected supply and prices for primary fuels. AEO 2010 and AEO 2011 provide estimates for natural gas and diesel fuel. These reports contain a few significant differences. Projections for the price of natural gas are significantly lower in the 2011 report, due to expanded estimates of supply from shale gas resources. Estimates for the technically recoverable U.S. shale gas resources more than doubled the volume of that resource from the amount assumed in 2010. AEO 2011 projections also reflect improvements in natural gas extraction technologies, a decrease in the influence of oil prices on natural gas prices due to the increase in shale gas supply, and updates of the data and assumptions for offshore gas production (U.S. EIA, 2010b).
Figure C-1 shows the EIA projections in AEO 2010 and AEO 2011 for the delivered natural gas prices for the transportation sector for the East North Central census division (to which Wisconsin belongs) in 2009 dollars per thousand cubic feet. These prices represent an approximation of the region’s retail price, which will be similar to the price available to Milwaukee DPW. Figure C-2 was created by the authors to convert Figure C-1 into 2009 dollars per diesel gallons equivalent (DGE) using EIA’s conversion rate of 1,027 British thermal units (Btu) per cubic foot based on 2009 U.S. consumption. In the AEO 2011 scenario, the growth rate for natural gas prices is 0.2 percent, and the projection suggests that natural gas in DGE will remain under $2 in 2009 dollars until 2035.
Figure C-1: Delivered Natural Gas Prices: Transportation Sector: East North Central Census
Source: U.S. EIA, n.d.a

39
Source: Author’s calculations based on U.S. EIA, n.d.a The data presented in Figure C-3 are for transportation diesel fuel in 2009 dollars per gallon. According to AEO 2011, the price growth rate for diesel fuel is 1.8 percent (U.S. EIA, 2010a). The AEO projections do not specify ultra-low sulfur diesel (ULSD) fuel. In 2010, a nationwide mandate went into effect requiring that 100 percent of the diesel fuel refined in or imported into the United States be ULSD, so these projections are for the cost of ULSD fuel (U.S. DOE EERE, 2011b).
Source: U.S. EIA, n.d.a
Figure C-2: Delivered Natural Gas Prices: Transportation Sector: East North Central Census 2009 Dollars per Diesel Gallon Equivalent
Figure C-3: Petroleum Prices: Transportation Diesel Fuel: AEO 2011 Reference Case

40
Appendix D: Hydraulic Fracturing
Drilling for natural gas is a relatively new technology. A recent New York Times series, “Drilling Down,” by Ian Urbina (2011) outlines some of the environmental and health impacts of obtaining natural gas. The method used is high-volume horizontal hydraulic fracturing otherwise known as hydrofracking. Hydrofracking has greatly increased in recent years as interest in natural gas has grown due to its use as a cleaner burning fuel source. According to Urbina (2011), hydrofracking can produce more than 1 million gallons of wastewater containing contaminants including known carcinogens and other radioactive materials. This wastewater is hauled to sewage plants that cannot adequately treat this water. The water may then be discharged into rivers that supply drinking water. Some natural gas companies reuse the contaminated wastewater. Across the industry, however, less than half is reused, and the question of how to dispose of wastewater remains. Currently, the natural gas drilling industry remains exempt from federal laws that would consider their waste hazardous (Urbina, 2011). In a letter issued by the Environmental Protection Agency (EPA) on March 7, 2011, the EPA indicated it was prepared to enforce federal laws regulating the disposal of wastewater. The previous week, federal lawmakers reportedly began calling for continued monitoring of hydrofracking wastewater disposal and started drafting legislation to require more stringent monitoring. If the hazardous waste exemption is lifted, or more stringent regulations mandated, the industry would have to monitor and test waste for toxins. This may increase overall production costs that would be passed on to consumers as increased. Based upon the natural gas price forecasts developed by the U.S. Energy Information Administration’s (EIA) Annual Energy Outlook (AEO), we assume that current policy will direct natural gas prices into the future. We do not monetize the environmental risks associated with hydrofracking, which is consistent with our treatment of diesel fuel, since we also do not monetize the risks diesel fuel poses to water resources (U.S. EIA, 2010b).

41
Appendix E: Diesel and Natural Gas Recent Historical Prices Comparing the recent history of diesel prices and natural gas prices shows a tendency for both diesel and natural gas fuel prices to change significantly. Figure E-1 shows overall diesel costs in dollars per gallon, and Figure E-2 shows the cost of ultra-low sulfur diesel fuel beginning in 2007 (U.S. EIA, n.d.d). The natural gas curve shown in Figure E-3 shows a similar pattern, especially from 2000 to 2010, while natural gas prices were partially linked to oil prices (U.S. EIA, n.d.b). This link is projected to diminish due to increased U.S. natural gas reserves.
Source: U.S. EIA, n.d.d
Source: U.S. EIA, n.d.d
Figure E-1 Annual U.S. No. 2 Diesel Retail Sales by All Sellers
Figure E-2: Monthly U.S. No. 2 Diesel Ultra-Low Sulfur Retail Sales by All Sellers

42
Figure E-3: Annual U.S. Natural Gas Citygate Price
Source: U.S. EIA, n.d.b

43
Appendix F: Detailed Information on Energy Dependence
In 2009, the United States imported roughly 616.4 million barrels of crude oil from Persian Gulf countries (approximately 14 percent) and 1,743 million barrels from the Organization of Petroleum Exporting Countries (OPEC) countries (approximately 41 percent of the 4,267 million barrels of total U.S. imports (U.S. EIA, 2011b). Milwaukee DPW management may recognize that increased use of CNG is advantageous for national energy security, since it reduces U.S. dependence on foreign oil. U.S. reliance on foreign oil has led to price spikes and fuel shortages in the past, especially in the 1970s with the 1973 Arab Oil Embargo and the 1979 energy crisis during the Iranian Revolution. In 1999, oil prices climbed again when OPEC countries cut production (U.S. EIA, n.d.c; Figure F-1). As demand for oil increases around the world, including within OPEC countries, their willingness to export oil to the United States may diminish. Overall, this creates a higher potential for diesel price spikes than for CNG price spikes.
Source: U.S. EIA, n.d.c
Figure F-1: U.S. Historical Petroleum Prices
44
Appendix G: Detailed Information on Environmental Emissions Quantifying the emissions from heavy-duty vehicles per gallon or gallon equivalent of fuel involves uncertainty. Generally emissions produced by refuse packers are four times those of heavy -duty trucks per unit distance, which is largely due to stopping and starting, trash compacting, and other inefficiencies in use patterns. In 2008, Westport Innovations Inc. and Clean Energy Fuels Corporation developed a Life-Cycle Cost and Emissions Estimator to compare the emissions from heavy-duty vehicle engines run on different fuels, including diesel and CNG (U.S. EPA, n.d.b). The report compares ultra-low sulfur diesel fuel (ULSD) and pipeline natural gas compressed on-site in various life-cycle stages. For our analysis, their tank-to-wheel (TTW) estimates are most relevant. In a TTW scenario, ULSD releases 9,966 g carbon dioxide equivalent (CO2e) per diesel gallon equivalent (DGE), while CNG releases 7,773 g CO2e per DGE by their calculations, resulting in emissions reductions of 18 to 25 percent (U.S. EPA, n.d.b).
CNG contains significantly less carbon than diesel fuel; however, it is predominantly composed of methane, which is a potent greenhouse gas (GhG) that has significantly higher global warming potential (GWP) than carbon dioxide (CO2). CO2 by convention has a GWP of 1. Methane is over 20 times more powerful with a GWP of 21 over a 100-year time horizon and a GWP of 56 over a 20-year time horizon (United Nations Framework Convention on Climate Change, 1995). Although methane is a more potent GhG, its residence time in the atmosphere is significantly shorter than CO2; methane has an approximately 12 year residence time whereas CO2 has a 100- to 500-year residence time. According to the U.S. Environmental Protection Agency (n.d.c), roughly 1 percent of natural gas production is lost in transmission in the United States; although substantially higher losses ranging from 3 to 7 percent occur in Russia’s natural gas system. For an environmental impact calculation, the source of natural gas that Milwaukee DPW uses is important. For our analysis, we assume that the natural gas is produced domestically and is subject to 1 percent transmission losses. The available data do not include any estimates of increases to those losses as a result of increased natural gas use, so we will assume that the 1 percent loss will not change substantially as natural gas use increases. Although our analysis focuses on the difference in GhG emissions during the combustion or use phase, to truly quantify total GhG emissions produced by different fuel types would require a life-cycle analysis (LCA). LCA would examine the fuel from cradle to grave, essentially from the fuel procurement stage through all use phases to any waste disposal. LCA is extremely complicated, especially when determining the boundary limits for the analysis. For example, preliminary LCA results suggest that CNG from shale using hydrofracking may be more emissions intensive than oil or diesel, due to the leaking of methane directly into the atmosphere from hydraulically fractured wells (Howarth, Santoro, and Ingraffea, 2011). Howarth, Santoro, and Ingraffea (2011) estimate

45
that over the lifetime of hydraulically fractured wells methane escapes into the atmosphere in amounts ranging from 3.6 to 7.9 percent of that produced. This is at least 30 percent more and in some cases twice as much as for conventional gas wells, where the estimates are from 1.7 to 6 percent of methane escapes. Given methane’s higher GWP, the GhG footprint for shale gas is greater than conventional gas or oil when viewed on any time horizon (Howarth, Santoro, & Ingraffea, 2011). The Howarth, Santoro, and Ingraffea report does not estimate CO2e emissions on a per DGE basis for the fuels examined. The life-cycle emissions estimator referenced produced well-to-wheel estimates with CO2e savings from changing from ULSD to CNG, although this did not account for shale gas production (Rosenfeld & Jackson, 2008). Since we do not currently have estimates for the amount of CNG coming from shale resources as opposed to conventional natural gas resources for the Milwaukee area, we cannot include this information about shale gas emissions in our analysis. Additional research needs to be done in this area for future studies looking at the environmental impacts of these fuels.

46
Appendix H: Health Impacts of Diesel Exhaust Exposure Vehicular pollutants associated with adverse health effects include ozone (O3), particulate matter (PM), nitrogen oxides (NOx), carbon monoxide (CO), sulfur dioxide (SO2), and other hazardous air pollutants (toxics) (Pollution Issues, n.d.; Table H-1). Table H-1: Vehicular Pollutants Associated with Adverse Health Effects
Pollutant Health Effect
Ozone (O3) Ground-level ozone can irritate the respiratory system, causing coughing, choking, and reduced lung capacity.
Particulate matter (PM) Among vehicular pollution, fine particles (those less than one-tenth the diameter of a human hair) pose the most serious threat to human health by penetrating deep into lungs.
Nitrogen oxides (NOx) Causing lung irritation, NOx also weakens the body’s defenses against respiratory infections such as pneumonia and influenza
Carbon monoxide (CO) When inhaled, CO blocks the transport of oxygen to the brain, heart, and other vital organs in the human body.
Sulfur dioxide (SO2) SO2 can react in the atmosphere to form fine particles and can pose a health risk to young children and asthmatics
Hazardous air pollutants (toxics)
These chemical compounds have been linked to birth defects, cancer, and other serious illnesses. It is estimated that air toxics emitted from cars and trucks account for half of all cancers caused by air pollution
Source: Pollution Issues, n.d.
Immediate effects associated with diesel exhaust exposure include irritation to the eyes, nose, throat, and lungs, as well as cough, congestion, headaches, light-headedness, and nausea (Lipsett & Campleman, 1999). Chronic exposure to diesel exhaust has been associated with wheezing, asthma, loss of pulmonary function, and allergic lung inflammation. Lung inflammation may aggravate chronic respiratory symptoms and increase the frequency or intensity of asthma attacks (Apostolopoulos, Sönmez, Shattell, & Belzer, 2010).
Furthermore, refuse packer drivers are also exposed to high levels of noise. The Occupational Safety and Health Administration (OSHA) currently permits 90 decibels of noise exposure for up to 8 hours. Diesel refuse packers, however, generate noise levels up to 100 decibels, a level that can cause hearing damage (Gordon, Burdelski, & Cannon, 2003). Exposure to noise can cause fatigue, insomnia, and headaches; prolonged exposure may cause hearing loss and contribute to circulatory, bowel, and respiratory problems (Apostolopoulos, Sönmez, Shattell, & Belzer, 2010).

47
The health effects of diesel exhaust are not limited to those with direct occupational exposure. Refuse packers operate on neighborhood streets, significantly affecting ambient air quality by releasing smog-forming compounds, particulate matter, and toxic chemical constituents (Gordon, Burdelski, & Cannon, 2003). In residential neighborhoods, the intensity of truck traffic is associated with childhood respiratory conditions and symptoms, including wheezing, phlegm, bronchitis, eye irritation, and allergic reactions to dust and pets. Individuals living in highly polluted areas have an increased risk of lung cancer mortality (Ris, 2007).
In terms of noise pollution, Gordon, Burdelski, & Cannon’s (2003) study of workers at nine refuse packer operations found a significant decline in noise morbidity among refuse packer drivers of CNG vehicles relative to liquefied natural gas (LNG) vehicles. CNG vehicle use was associated with 98 percent, 90 percent, and 50 percent reductions in noise alongside, inside, and behind the truck, respectively.
In Ardmore, PA, a fleet of CNG school buses led to emissions reductions of 87 percent NOx, 69 percent CO, 87 percent (non-methane organic gases), 20 percent CO2, and near elimination of PM. These substantial reductions in carcinogenic pollutants are likely to decrease the risk of health effects associated with diesel exhaust for both drivers and the community in which they work.

48
Appendix I: Detailed Information on Fueling Stations
Costs for indoor fuel station garages include ceiling height, structure, ventilation system, garage door type, heating system, and electrical equipment. Marathon Technical Services estimates minor additional costs compared with a traditional diesel garage construction and installation (Adams, 2006). The potential additional costs are primarily due to ventilation, wall reinforcement, and garage door style.
There are three main types of CNG fueling stations: time-fill, cascade fast-fill, and buffered fast-fill. Time-fill stations work well for vehicles that are parked for an extended period of time because they fill vehicles over the course of 6 to 8 hours. Gas is dispensed from the pipeline through compressors to compress the gas to the appropriate pressure and temperature into the vehicle tank.
Cascade fast-fill stations use CNG storage tanks that are filled with compressed gas. The tanks then fill the vehicles, similar to a liquid fuel station. Light-duty vehicles typically use the cascade fill method at public fuel stations. They work well with taxi or police fleets that have peak fueling times.
Buffered fast-fill stations provide high-volume continuous fueling for high capacity fuel heavy-duty vehicles. These stations fill vehicles directly from the gas pipeline as in time-fill stations, as well as a storage tank that provides a “buffer” as in cascade fill stations. These stations allow the compressors to run for long periods of time (U.S. DOE, 2003).
The Vehicle and Infrastructure Cash-Flow Evaluation (VICE) model calculates station costs using a cost calculator developed by Marathon Technical Services. This cost calculator holds the following variables constant and assumes the construction of a buffered fast-fill station.
1. Spare ratio – estimates that 10 percent of the fleet will not refuel on a given day
2. Station inlet pressure – 100 pound-force per square inch gauge (psig) 3. Compressor package – a fully enclosed electric drive 4. Dryer
a. Single manual tower for stations dispensing fewer than 30,000 diesel gallons equivalent (DGE) per month (depending on fleet type)
b. Fully automatic twin tower for stations dispensing more than 30,000 DGEs per month
5. System – stores CNG at 5,500 psig 6. Installation costs – assumed to be 50 percent of the equipment costs
based on numerous Marathon projects of a variety of sizes

49
Station costs are also calculated based on the amount of fuel dispensed per month (throughput), the refueling window, and peak capacity. According to Johnson (2010), “these parameters affect the size and number of tanks, compressors, and supporting equipment.” Throughput is calculated by dividing the number of vehicles by the average fuel economy of the fleet. Refuse truck fleets are assumed to have a 12-hour refueling window (Johnson, 2010). The VICE baseline calculation assumes that the builder reduces the purchase price by the amount equal to the federal Alternative Fuel Infrastructure Tax Credit, which reimburses 50 percent of the cost of installing a CNG station, up to $50,000 for tax exempt entities (Johnson, 2010). This tax credit is set to expire at the end of 2011. In this analysis, we assume that DPW incurs zero additional costs for CNG fueling stations because the Department’s Congestion Mitigation and Air Quality (CMAQ) grant supports the construction of two stations.
The Milwaukee DPW released its plans for CNG fueling system equipment for its Northwest and Lincoln garages on March 7, 2011. Separate construction bid documents will be released for the installation of the equipment. These specifications include the requirement for movable skids to enable expansion and reconfiguration, gas pipeline specifications from We Energies, compressor specifications, and electrical service plans. The Milwaukee plans also outline the codes and standards to be used for the equipment requirements as well as specific models or products under consideration (City of Milwaukee DPW, 2011a; City of Milwaukee DPW, 2011b).

50
Appendix J: Monte Carlo Assumptions and Model Parameters Table J-1: Parameters and Sources
Parameter Name Parameter Point Estimate (Range or Standard Deviation) Source(s)
Alternative Fuel Additional Tax Credit 0.55 U.S. DOE EERE, n.d.b Annual CNG Use (DGE) 3,648 Average VMT/CNG Fuel Economy Annual Diesel Use (Gallons) 3,105 Average VMT/Diesel Fuel Economy Average Vehicle Miles Travelled* 6,675 (6,475 to 6,875) DPW Data and Jeffrey Tews CNG CO2 Emissions 7,773 U.S. EPA, n.d.b CNG Fuel Excise Tax Credit 0.202 U.S. Internal Revenue Service, 2009 CNG Maintenance Costs 2.03 DPW Data, Johnson, 2010 CNG PM10 Emissions 0.015 Lyford-Pike, 2003 Diesel CO2 Emissions 9,966 U.S. EPA, n.d.a Diesel Fuel Excise Tax Credit 0.244 U.S. Internal Revenue Service, 2009 Diesel Maintenance Costs 2.03 DPW Data Diesel PM10 Emissions 0.24 Lyford-Pike, 2003 Discount Rate* 0.035 (0.03 to 0.04) Thomas Bell Federal CNG Vehicle Tax Incentive $0.80 up to $32,000 Johnson, 2010 Fuel Economy CNG (mpDGE)**
1.83 (1.79 to 1.87) Standard Deviation 0.0485
DPW Data and Jeffrey Tews Authors calculation
Fuel Economy Diesel (gallons)**
2.15 (2.1 to 2.2) Standard Deviation 0.025
DPW Data and Jeffrey Tews Authors calculation
Growth Rate for CNG**
0.002 (–0.0122 to 0.0289) Standard Deviation 0.0106
AEO 2011 estimate Authors calculation, NWC, 2010
Growth Rate for Diesel**
0.018 (–0.0211 to 0.0268) Standard Deviation 0.011975
AEO 2011 estimate Authors calculation, NWC, 2010
Additional Cost of CNG Packer* 37,000 (30,000 to 40,000) Jeffrey Tews Price of CNG 1.68 AEO 2011 for year 2012 Price of Diesel 2.96 AEO 2011 for year 2012 Shadow Price of Avoided CO2 Emissions ($/ton)* 3 (3 to 20) Matthews and Lave, 2000 Shadow Price of Avoided PM10 Emissions ($/ton)* 1,500 (1,500 to 6,700) Matthews and Lave, 2000 Total Number of Vehicles Purchased in 2012 10 Authors Useful Vehicle Life (years) 12 Jeffrey Tews *Variables assume a uniform distribution; **Variables assume a normal distribution
51
Explanation of Parameter Ranges Average Vehicle Miles Traveled Our point estimate, 6,675, represents the average vehicle miles traveled for all vehicles between 2008 and 2010.25 For the 2010 average, we omit those vehicles entering into service during 2010. The range, 6,475 to 6,875, is a reasonable variation based on the averages for the fleet over the last 3 years. Discount Rate Based upon personal communication with Thomas Bell (March 24, 2011), our Monte Carlo analysis selects estimates for discount rate from a uniform distribution between 3 and 4 percent. Fuel Costs Our analysis uses the projected national average fuel prices for 2012 converted to 2010 dollars (U.S. EIA, 2010b), or $1.68 per diesel gallons equivalent (DGE) and $2.96 per gallon for CNG and diesel, respectively. In 2010, the Department paid $1.67 per DGE for CNG and $2.94 per gallon for diesel. Fuel Economy
1. Diesel – Our point estimate for diesel, 2.15 miles per gallon, was provided by Jeffrey Tews, as was the range of 2.1 to 2.2 miles per gallon (Tews, personal communication, April 15, 2011). Based upon this range, our Monte Carlo analysis draws from a normal distribution with a mean of 2.15 and a standard deviation of 0.025.
2. CNG – Our point estimate for CNG, 1.8275, was developed based upon an assumption of a 15-percent reduction in efficiency compared with the point estimate for diesel vehicles (Tews, personal communication, April 15, 2011). Since there is more uncertainty associated with this estimate, we develop a standard deviation of 0.05 based upon the range between a 20 percent efficiency decline from the low diesel fuel economy estimate (1.72) and a 15 percent efficiency reduction from the high diesel fuel economy estimate (1.94).
Fuel Growth Rate Our analysis uses the projected fuel price growth rates, 0.2 percent for CNG and 1.8 percent for diesel, from the Annual Energy Outlook (AEO) as the mean for a normal distribution of growth rates (U.S. EIA, 2010a; Table J-2). The range of projected growth rates comes from the Northwest Power and Conservation Council (NWC) fuel price projection scenarios. The NWC natural gas growth rates for 2007 to 2030 range from –2.11 percent to 2.68 percent (NWC, 2010). The NWC (2010) also has oil price growth rates for 2007 to 2030 ranging from –2.1 percent to 2.7 percent. Our analysis uses these ranges to determine an appropriate standard deviation to apply to the AEO point estimates. We selecte
25 Data provided by DPW, March 2011.

52
the medium estimate and calculated that 95 percent of the time the growth rates would fall between the medium low and medium high estimates for each fuel type. The low and high estimates would fall in the tail of the normal distribution. Table J-2: NWC Fuel Price Growth Rate Estimates
Low Medium Low Medium Medium High High Natural Gas –1.33% 0.14% 1.22% 1.93% 2.89%
Oil –2.11% –0.51% 0.60% 1.64% 2.68% Source: NWC, 2010 Additional Cost of CNG Packer The range in values for the additional cost of a CNG packer, from $30,000 to $40,000, is based on a conversation with Tews, wherein he postulated that the cost difference may decline in the future, although not as sharply as the difference between DPW’s initial purchases and their second bid (personal communication, April 15, 2011). Our analysis assumes that it is more likely for the cost to decrease based on manufacturing economies of scale and lower bids for purchasing in bulk. Shadow Price of Environmental Emissions To account for uncertainty in the shadow prices of emissions, our model draws estimates from a range between the minimum and mean values provided by Matthews and Lave (2000) for both carbon dioxide (CO2) and particulate matter (PM10). We draw from a uniform distribution, because the range of values is conservative. Table J-3 provides the specific formulas used in our analysis.
Table J-3: Formulas for Model Specifications Model
Specification PV
Years Formula*
1
1
{Vehicle Number Purchased * (–Additional Cost of CNG packer) + [((Diesel Use * Diesel Price*(1+Diesel Growth Rate^Year)) – (Diesel Use * Diesel Tax exemption)) – ((CNG Use*CNG Price*(1 + CNG Growth Rate^Year)) – (CNG Use*CNG Tax Exemption))] + (Diesel Maintenance Costs – CNG Maintenance Costs)} / (1+Discount Rate)^(Year–0.5)
2-12
{Vehicle Number Purchased * [((Diesel Use * Diesel Price*(1+Diesel Growth Rate^Year)) – (Diesel Use * Diesel Tax exemption)) – ((CNG Use*CNG Price*(1+CNG Growth Rate^Year)) – (CNG Use*CNG Tax Exemption))] + (Diesel Maintenance Costs – CNG Maintenance Costs)} / (1+Discount Rate)^(Year–0.5)
2 1
{Vehicle Number Purchased * (–Additional Cost of CNG Packer + Federal CNG Vehicle Tax Incentive) + [((Diesel Use * Diesel Price*(1+Diesel Growth Rate^Year)) – (Diesel Use * Diesel Tax exemption)) – ((CNG Use*CNG Price*(1+CNG Growth Rate^Year)) – (CNG Use*(CNG Tax Exemption+Alternative Fuel Additional Tax Credit))] + (Diesel Maintenance Costs – CNG Maintenance Costs)} /

53
Model Specification
PV Years Formula*
(1+Discount Rate)^(Year–0.5)
2-12
PV Years 2 to 12 = {Vehicle Number Purchased * [((Diesel Use * Diesel Price*(1+Diesel Growth Rate^Year)) – (Diesel Use * Diesel Tax exemption)) – ((CNG Use*CNG Price*(1+CNG Growth Rate^Year)) – (CNG Use*(CNG Tax Exemption+Alternative Fuel Additional Tax Credit))] + (Diesel Maintenance Costs – CNG Maintenance Costs)} / (1+Discount Rate)^(Year–0.5)
3
1
Vehicle Number Purchased * (–Additional Cost of CNG packer) + [((Diesel Use * Diesel Price*(1+Diesel Growth Rate^Year)) – (Diesel Use * Diesel Tax exemption)) – ((CNG Use*CNG Price*(1+CNG Growth Rate^Year)) – (CNG Use*CNG Tax Exemption))] + (Diesel Maintenance Costs – CNG Maintenance Costs)+(Shadow Price of Avoided CO2 Emissions * ((((Diesel CO2 Emissions * Monthly Diesel Use*12) – (CNG CO2 Emissions*Monthly CNG Use*12))/1000)/907.1847) + (Shadow Price of Avoided PM Emissions*((((Diesel PM Emissions * Diesel Fuel Economy * Monthly Diesel Use*12) – (CNG Emissions*CNG Fuel Economy*Monthly CNG Use*12))/1000)/907.1847) / (1+Discount Rate)^(Year–0.5)
2-12
Vehicle Number Purchased * [((Diesel Use * Diesel Price*(1+Diesel Growth Rate^Year)) – (Diesel Use * Diesel Tax exemption)) – ((CNG Use*CNG Price*(1+CNG Growth Rate^Year)) – (CNG Use*CNG Tax Exemption))] + (Diesel Maintenance Costs – CNG Maintenance Costs)+(Shadow Price of Avoided CO2 Emissions * ((((Diesel CO2 Emissions * Monthly Diesel Use*12) – (CNG CO2 Emissions*Monthly CNG Use*12))/1000)/907.1847) + (Shadow Price of Avoided PM Emissions*((((Diesel PM Emissions * Diesel Fuel Economy * Monthly Diesel Use*12) – (CNG Emissions*CNG Fuel Economy * Monthly CNG Use*12))/1000)/907.1847))/ (1+Discount Rate)^(Year–0.5)
4
1
Vehicle Number Purchased * (–Additional Cost of CNG Packer + Federal CNG Vehicle Tax Incentive) + [((Diesel Use * Diesel Price*(1+Diesel Growth Rate^Year)) – (Diesel Use * Diesel Tax exemption)) – ((CNG Use*CNG Price*(1+CNG Growth Rate^Year)) – (CNG Use*(CNG Tax Exemption+Alternative Fuel Additional Tax Credit))] + (Diesel Maintenance Costs – CNG Maintenance Costs)+(Shadow Price of Avoided CO2 Emissions * ((((Diesel CO2 Emissions * Monthly Diesel Use*12) – (CNG CO2 Emissions*Monthly CNG Use*12))/1000)/907.1847) + (Shadow Price of Avoided PM Emissions*((((Diesel PM Emissions * Diesel Fuel Economy * Monthly Diesel Use*12) – (CNG Emissions*CNG Fuel Economy * Monthly CNG Use*12))/1000)/907.1847)) / (1+Discount Rate)^(Year–0.5)
2-12
Vehicle Number Purchased * [((Diesel Use * Diesel Price*(1+Diesel Growth Rate^Year)) – (Diesel Use * Diesel Tax exemption)) – ((CNG Use*CNG Price*(1+CNG Growth Rate^Year)) – (CNG Use*(CNG Tax Exemption+Alternative Fuel Additional Tax Credit))] + (Diesel Maintenance Costs – CNG Maintenance Costs)+(Shadow Price of Avoided CO2 Emissions * ((((Diesel CO2 Emissions * Monthly Diesel Use*12) – (CNG CO2 Emissions*Monthly CNG Use*12))/1000)/907.1847) + (Shadow Price of Avoided PM Emissions*((((Diesel PM Emissions * Diesel Fuel Economy * Monthly Diesel Use*12) – (CNG Emissions*CNG Fuel Economy * Monthly CNG Use*12))/1000)/907.1847)) / (1+Discount Rate)^(Year–0.5)
*All costs and benefits discounted back by 1/2 year (assumes they accrue at mid-year) Source: Authors