Compressed Air System
29
Compressed Air System
description
gsgsgs
Transcript of Compressed Air System

Compressed Air System

Types of Air Compressors
There are three basic types of air compressors:Reciprocating (Recip)Rotary Screw (Screw) Rotary Centrifugal (Centrifugal)
These types are further defined by:the number of compression stages method of cooling (air, water, oil) drive method (motor, engine, steam, other) how they are lubricated (oil, oil-free) packaged or custom-built

General Selection Criteria for
Compressors
Capacity (m3/h) Pressure (bar) Type of Compressor
From To From To
Roots power compressor single stage
100 30000 0.1 1
Reciprocating
- Single / Two stage 100 12000 0.8 12
- Multi stage 100 12000 12.0 700
Screw
- Single stage 100 2400 0.8 13
- Two stage 100 2200 0.8 24
Centrifugal 600 300000 0.1 450

SYSTEM COMPONENTS Intake Air Filters : Prevent dust and atmospheric impurities from entering compressor. Dust causes sticking valves, scored cylinders, excessive wear etc.
Inter-stage Coolers : Reduce the temperature of the air (gas) before it enters the next stage to reduce the work of compression and increase efficiency. They can be water-or air-cooled.
After Coolers : Reduce the temperature of the discharge air, and thereby reduce the moisture carrying capacity of air.
Air-dryers : Air dryers are used to remove moisture, as air for instrument and pneumatic equipment needs to be relatively free of any moisture. The moisture is removed by suing adsorbents or refrigerant dryers, or state of the art heatless dryers.
Moisture Traps : Air traps are used for removal of moisture in the compressed air distribution lines. They resemble steam traps wherein the air is trapped and moisture is removed.
Receivers : Depending on the system requirements, one or more air receivers are generally provided to reduce output pulsations and pressure variations.
Dryers
Refrigerant-type dryers cool the air to 35 to 40F and then remove the condensed moisture before the air is reheated and dischargedDeliquescent-type dryers use a hygroscopic desiccant material with a high affinity for water. The desiccant absorbs water vapor and is dissolved in the liquid formed. Dew point suppression of 15 to 50F degrees can be expected when the proper bed level is maintainedTwin tower regenerative-type dryers use a desiccant which adsorbs water vapor in the air stream. Adsorb means that the moisture adheres to the desiccant, collecting in the thousands of small pores within each desiccant bead. The composition of the desiccant is not changed and the moisture can be driven off in a regeneration process by applying dry purge air, by the application of heat, or a combination of both. Regenerative desiccant-type dryers typically are of twin tower construction. One tower dries the air from the compressor while the desiccant in the other tower is being regenerated, after the pressure in the tower being regenerated has been reduced to atmospheric pressure. The purge air requirement can range from 10 to 18% of the total air flow, depending on the type of dryer. The typical regenerative desiccant dryer at 100 psig has a pressure dew point rating of -20F to -40F, but a dew point as low as -100F can be obtained.
When air leaves an aftercooler and moisture separator, it is typically saturated. Any further radiant cooling as it passes through the distribution piping, which may be exposed to colder temperatures, will cause further condensation of moisture with detrimental effects such as corrosion and contamination of point-of-use processes. This problem can be avoided by the proper use of compressed air dryers. The most common types are:
Air ReceiverReceivers are used to provide compressed air storage capacity to meet peak demand events and help control system pressure. Receivers are especially effective for systems with widely varying compressed air flow requirements. Where peaks are intermittent, a large air receiver may allow a smaller air compressor to be used and can allow the capacity control system to operate more effectively and improve system efficiency. An air receiver after a reciprocating air compressor can provide dampening of pressure pulsations, radiant cooling, and collection of condensate. Demand-side control will optimize the benefit of the air receiver storage volume by stabilizing system header pressure and "flattening" the load peaks.

Heat Recovery with Water-Cooled Compressors
Heat recovery for space heating is not as common with water-cooled compressors because an extra stage of heat exchange is required and the temperature of the available heat is lower. Since many water-cooled compressors are quite large, however, heat recovery for space heating can be an attractive opportunity. Recovery efficiencies of 50-60% are typical.

Traps and DrainsAutomatic condensate drains or traps are used to prevent the loss of air through open petcocks and valves. Drain valves should allow removal of condensate but not compressed air. Two types of traps are common: mechanical and electrical. Mechanical traps link float devices to open valves when condensate rises to a preset level. Electric solenoid drain valves operate on a preset time cycle, but may open even when condensate is not present. Other electrical devices sense liquid level and open to drain only when condensate is present. Improperly operating or maintained traps can create excessive air usage and waste energy


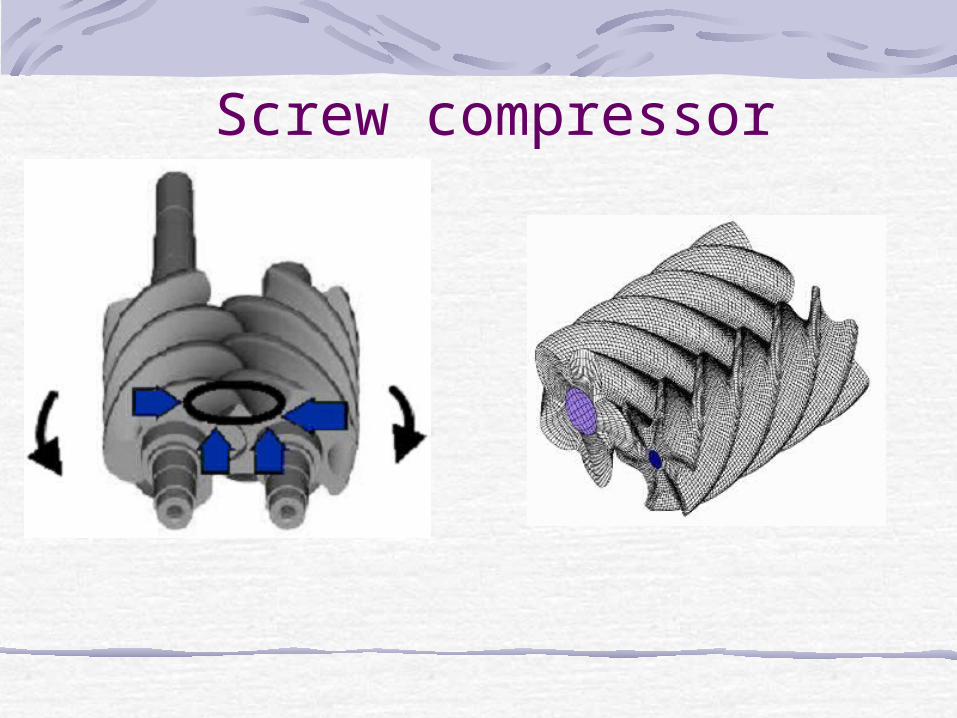
Screw compressor

Centrifugal Compressor

Compressor efficiency
1 -
PP 0.612 / P Q 1-KNK / NK
1-K
s
ds
N = No. of stagesK = Ratio of specific heats (1.35 for air)Ps = suction pressure in kg/cm2
Pd = Discharge pressure in kg/cm2
Q = Actual air flow (m3/min.)Actual kW = 3 V I PF as measured
Efficiency of compressor and motor combination = kW Actual
kW lTheoretica100
Theoretical kW =

Energy Efficiency practices in compressed air systems

Effect of Intake Air temperature on Power
Consumption
Inlet Temperature (0C)
Relative Air Delivery (%)
Power Saved (%)
10.0 102.0 + 1.4
15.5 100.0 Nil
21.1 98.1 - 1.3
26.6 96.3 - 2.5
32.2 94.1 - 4.0
37.7 92.8 - 5.0
43.3 91.2 - 5.8
Every 40C rise in inlet air temperature results in a higher energy consumption by 1 % to achieve equivalent output. Hence, cool air intake leads to a more efficient compression.

Effect of Pressure Drop Across Air Inlet Filter on
Power Consumption
Pressure Drop Across air filter
(mmWC)
Increase in Power Consumption (%)
0 0
200 1.6
400 3.2
600 4.7
800 7.0
For every 25 mbar pressure lost at the inlet due to choked filters, the compressor performance is reduced by about 2 percent.

ElevationPercentage Relative
Volumetric Efficiency Compared with Sea Level
Altitude Meters
Barometric Pressure
Mbar At 4 bar At 7 bar
Sea level 1013 100.0 100.0
500 945 98.7 97.7
1000 894 97.0 95.2
1500 840 95.5 92.7
2000 789 93.9 90.0
2500 737 92.1 87.0
It is evident that compressors located at higher altitudes consume more power to achieve a particular delivery pressure than those at sea lvel, as the compression ratio is higher.

Efficacy of Inter and After Coolers
Details Imperfect Cooling
Perfect Cooling
Chilled Water Cooling
1 Stage inlet temperature 0C 21.1 21.1 21.1 2 Stage inlet temperature 0C 26.6 21.1 15.5 Capacity (m3/min) 15.5 15.6 15.7 Shaft Power (kW) 76.3 75.3 74.2 Specific energy consumption kW (m3/min)
4.9 4.8 4.7
Percent Change + 2.1 - - 2.1
It can be seen from the table that an increase of 5.50C in the inlet to the second stage results in a 2 % increase in the specific energy consumption. Use of cold water reduces power consumption.

Cooling Water Requirement
Compressor Type
Minimum quantity of Cooling Water required
for 2.85 m3/min. FAD at 7 bar (lpm)
Single-stage 3.8 Two-stage 7.6 Single-stage with after-cooler 15.1 Two-stage with after-cooler 18.9
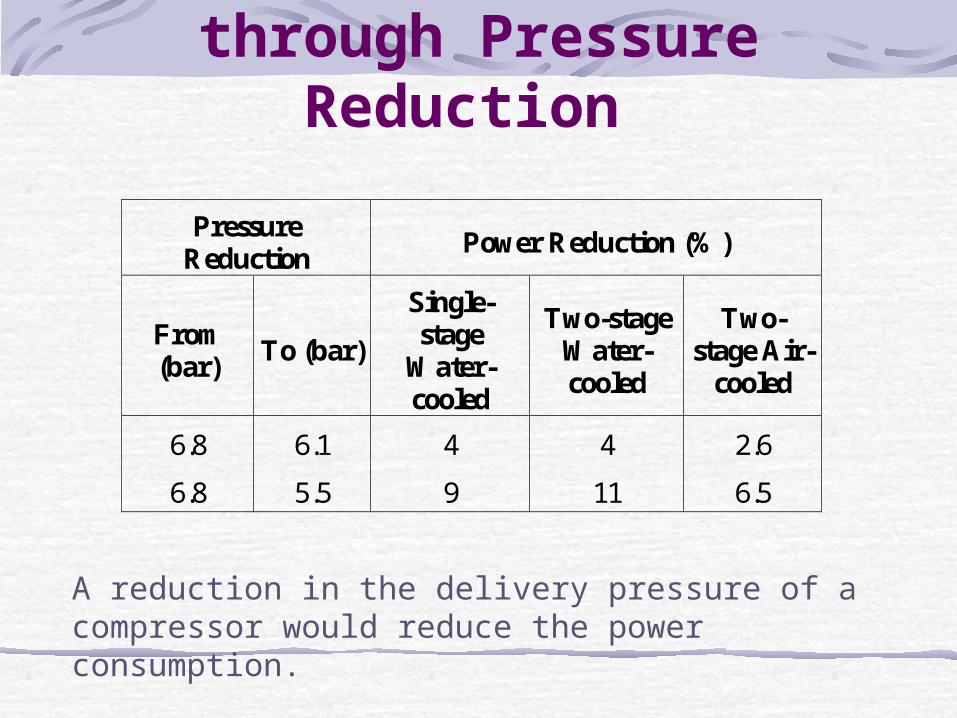
Power Reduction through Pressure
Reduction
Pressure Reduction
Power Reduction (%)
From (bar)
To (bar)
Single-stage
Water-cooled
Two-stage Water-cooled
Two-stage Air-
cooled
6.8 6.1 4 4 2.6
6.8 5.5 9 11 6.5
A reduction in the delivery pressure of a compressor would reduce the power consumption.

Expected Specific Power Consumption of Reciprocating Compressors (based on
motor input)
Pressure bar No. of Stages Specific Power kW/170 CMH
1 1 6.29
2 1 9.64
3 1 13.04
4 2 14.57
7 2 18.34
8 2 19.16
10 2 21.74
15 2 26.22

Energy Wastage due to Smaller Pipe Diameter
Pipe Nominal
Bore (mm)
Pressure drop (bar) per 100 meters
Equivalent power losses (kW)
40 1.80 9.5
50 0.65 3.4
65 0.22 1.2
80 0.04 0.2
100 0.02 0.1
Typical acceptable pressure drop in industrial practice is 0.3 bar in mains header at the farthest point and 0.5 bar in distribution system

Discharge of Air through Orifice
Gauge Pressure
Bar 0.5 mm 1 mm 2 mm 3 mm 5 mm 10 mm 12.5 mm
0.5 0.06 0.22 0.92 2.1 5.7 22.8 35.5
1.0 0.08 0.33 1.33 3.0 8.4 33.6 52.5
2.5 0.14 0.58 2.33 5.5 14.6 58.6 91.4
5.0 0.25 0.97 3.92 8.8 24.4 97.5 152.0
7.0 0.33 1.31 5.19 11.6 32.5 129.0 202.0

Cost of Air Leakage
Orifice Size mm
KW Wasted
* Energy Waste (Rs/Year)
0.8 0.2 8000
1.6 0.8 32000
3.1 3.0 120000
6.4 12.0 480000
* based on Rs. 5 / kWh ; 8000 operating hours; air at 7.0 bar

Steps in simple shop-floor method for leak
quantificationShut off compressed air operated equipments (or conduct test when no equipment is using compressed air).Run the compressor to charge the system to set pressure of operationNote the sub-sequent time taken for ‘on load’ and ‘off load’ cycles of the compressors. For accuracy, take ON & OFF times for 8 – 10 cycles continuously. Then calculate total ‘ON’ Time (T) and Total ‘OFF’ time (t).The system leakage is calculated as System leakage (cmm) = Q T / (T + t)Q = Actual free air being supplied during trial, in cubic meters per minuteT = Time on load in minutest = Time unload in minutes

Leak test: exampleCompressor capacity (CMM) = 35Cut in pressure kg/SQCMG = 6.8Cut out pressure kg/SQCMG = 7.5On load kW drawn = 188 kWUnload kW drawn = 54 kWAverage ‘On-load’ time = 1.5 minutesAverage ‘Unload’ time = 10.5 minutes
Comment on leakage quantity and avoidable loss of power due to air leakages.
a) Leakage quantity (CMM) =
= 4.375 CMMb) Leakage per day = 6300 CM/dayc) Specific power for compressed air generation=
= 0.0895 kwh/m3
d) Power lost due to leakages/day = 563.85 kWh
35
5.105.1
1.5
CMH6035
kWh 188

Capacity Assessment in Shop-floor
Isolate the compressor along with its individual receiver being taken for test from main compressed air system by tightly closing the isolation valve or blanking it, thus closing the receiver outlet.Open water drain valve and drain out water fully and empty the receiver and the pipe line. Make sure that water trap line is tightly closed once again to start the test.Start the compressor and activate the stop watch.
Note the time taken to attain the normal operational pressure P2 (in the receiver) from initial pressure P1.Calculate the capacity as per the formulae given below :
Actual Free air discharge Min./NM T
V
P
PP Q 3
0
12
Where
P2 = Final pressure after filling (kg/cm2 a)
P1 = Initial pressure (kg/cm2a) after bleeding
P0 = Atmospheric Pressure (kg/cm2 a)
V = Storage volume in m3 which includes receiver, after cooler, and delivery piping
T = Time take to build up pressure to P2 in minutes

ExamplePiston displacement : 16.88 CMMTheoretical compressor capacity : 14.75 CMM @ 7 kg/SQCMG Compressor rated rpm 750 : Motor rated rpm : 1445Receiver Volume : 7.79 CMAdditional hold up volume, i.e., pipe / water cooler, etc., is : 0.4974 CMTotal volume : 8.322 CM
Initial pressure P1 : 0.5 Kgf / SQCMG
Final pressure P2 : 7.03 Kgf / SQCMG
Atmospheric pressure P0 : 1.026 Kgf/cm2A
Compressor output CMM : 2 1P P Total Volume
Atm. Pressure Pumpup time
4.021 .0261
8.322 5.003.7
= 13.17 CMM