Comprehensive Wind Analysis Of Stress Ribbon Bridge€¦ · stayed suspension and stress-ribbon...
14
Siddhartha Ray 1 , Roshni John 2 , D.M.Joshi 3 1 P.G student, Saraswati College of Engineering,Kharghar,Maharashtra,India, [email protected] 2 Associate Professor, Saraswati College of Engineering,Kharghar,Maharashtra,India, [email protected] 3 Associate Professor, Saraswati College of Engineering,Kharghar,Maharashtra,India, [email protected] Abstract— A stressed ribbon bridge (also known as stress-ribbon bridge or catenary bridge) is primarily a structure under tension. The tension cables form the part of the deck which follows an inverted catenary between supports. The ribbon is stressed such that it is in compression, thereby increasing the rigidity of the structure where as a suspension spans tend to sway and bounce. Such bridges are typically made RCC structures with tension cables to support them. Such bridges are generally not designed for vehicular traffic but where it is essential, additional rigidity is essential to avoid the failure of the structure in bending. A stress ribbon bridge of 45 meter span is modelled and analyzed using ANSYS version 12. For simplicity in importing civil materials and civil cross sections, Civil FEM version 12 add-on of ANSYS was used. A 3D model of the whole structure was developed and analyzed and according to the analysis results, the design was performed manually. A comprehensive wind analysis was performed under IRC 6 guidelines for the bridge for spans 45m, 50m, 55m and 60m. Further, depth optimization was performed 45m span for the wind zone located in Mumbai (Zone III) Keywords— Introduction Pedestrian bridges (or footbridges as they are called in many parts of the world) have been used by man since antiquity to cross rivers, deep gorges and narrowmountain passes. One commonly used method has been to suspend a walkway from a fibre rope catenary span somewhat similar to a primitive suspension bridge. The stress ribbon concept borrows the suspension bridge principle but develops it further by using high strength materials and modern engineering technology especially precasting and prestressing methods. Stress-ribbon is the term that has been coined to describe structures formed by directly walked prestressed concrete deck with the shape of a catenary. The bearing structure consists of slightly sagging tensioned cables, bedded in a concrete slab that is very thin compared with the span. This slab serves as a deck, but apart from the distributing the load locally and preserving the continuity, it has no other function. It is a kind of suspension structure where the cables are tensioned so tightly that the traffic can be placed directly on the concrete slab embedding the cables. Compared with other structural types the structure is extremely simple. On the other hand, the force in the cables is very large making the anchoring of the cable expensive. Fig 1 shows the typical stress ribbon bridge. Figure1: Typical Stress Ribbon Bridge It is seen that stress ribbon bridge is used in European countries for people to walk which reduces the traffic intensity on crowded roads. So in developing countries like India stress ribbon bridge can be a solution to traffic reduction in crowded area like Mumbai, Delhi, Bangalore and many more. Load transfer mechanism of stress ribbon bridge A typical stress ribbon bridge deck consists of precast concrete planks with bearing tendons to support them during construction and separate prestressing tendons which are tensioned to create the final designed geometicform. The joints between the planks are most often sealed with in-situ concrete before stressing the deck. The prestressing tendons transfer horizontal forces in to the abutments and then to the ground most often using ground anchors. The tendons are encased in ducts which are generally grouted after tensioning in order to lock in the stress and protect them from corrosion. Since the bending in the deck is low, the depth can be minimized and results in reduction in dead load and horizontal forces in abutments. The abutments are designed to transfer the horizontal forces from the deck cables into the ground via ground anchors. Pedestrians, wind and temperature loads can cause large changes in the bending moments in the deck close to the abutments and accordingly crack width sand fatigue in reinforcement must be considered. The soil pressure, over turning and sliding has to be checked Comprehensive Wind Analysis Of Stress Ribbon Bridge International Journal of Scientific & Engineering Research, Volume 8, Issue 3, March-2017 ISSN 2229-5518 287 IJSER © 2017 http://www.ijser.org IJSER
Transcript of Comprehensive Wind Analysis Of Stress Ribbon Bridge€¦ · stayed suspension and stress-ribbon...
Siddhartha Ray1, Roshni John2, D.M.Joshi3
1P.G student, Saraswati College of Engineering,Kharghar,Maharashtra,India, [email protected] 2Associate Professor, Saraswati College of Engineering,Kharghar,Maharashtra,India, [email protected]
3Associate Professor, Saraswati College of Engineering,Kharghar,Maharashtra,India, [email protected]
Abstract— A stressed ribbon bridge (also known as stress-ribbon bridge or
catenary bridge) is primarily a structure under tension. The tension cables
form the part of the deck which follows an inverted catenary between
supports. The ribbon is stressed such that it is in compression, thereby
increasing the rigidity of the structure where as a suspension spans tend to
sway and bounce. Such bridges are typically made RCC structures with
tension cables to support them. Such bridges are generally not designed for
vehicular traffic but where it is essential, additional rigidity is essential to
avoid the failure of the structure in bending. A stress ribbon bridge of 45
meter span is modelled and analyzed using ANSYS version 12. For simplicity
in importing civil materials and civil cross sections, Civil FEM version 12
add-on of ANSYS was used. A 3D model of the whole structure was
developed and analyzed and according to the analysis results, the design was
performed manually. A comprehensive wind analysis was performed under
IRC 6 guidelines for the bridge for spans 45m, 50m, 55m and 60m. Further,
depth optimization was performed 45m span for the wind zone located in
Mumbai (Zone III)
Keywords—
Introduction
Pedestrian bridges (or footbridges as they are called in many parts
of the world) have been used by man since antiquity to cross rivers, deep
gorges and narrowmountain passes. One commonly used method has been to
suspend a walkway from a fibre rope catenary span somewhat similar to a
primitive suspension bridge. The stress ribbon concept borrows the
suspension bridge principle but develops it further by using high strength
materials and modern engineering technology especially precasting and
prestressing methods.
Stress-ribbon is the term that has been coined to describe
structures formed by directly walked prestressed concrete deck with the shape
of a catenary. The bearing structure consists of slightly sagging tensioned
cables, bedded in a concrete slab that is very thin compared with the span.
This slab serves as a deck, but apart from the distributing the load locally and
preserving the continuity, it has no other function. It is a kind of suspension
structure where the cables are tensioned so tightly that the traffic can be
placed directly on the concrete slab embedding the cables. Compared with
other structural types the structure is extremely simple. On the other hand, the
force in the cables is very large making the anchoring of the cable expensive.
Fig 1 shows the typical stress ribbon bridge.
Figure1: Typical Stress Ribbon Bridge
It is seen that stress ribbon bridge is used in European countries for people to
walk which reduces the traffic intensity on crowded roads. So in developing
countries like India stress ribbon bridge can be a solution to traffic reduction in
crowded area like Mumbai, Delhi, Bangalore and many more.
Load transfer mechanism of stress ribbon bridge
A typical stress ribbon bridge deck consists of precast
concrete planks with bearing tendons to support them during construction
and separate prestressing tendons which are tensioned to create the final
designed geometicform. The joints between the planks are most often
sealed with in-situ concrete before stressing the deck. The prestressing
tendons transfer horizontal forces in to the abutments and then to the
ground most often using ground anchors. The tendons are encased in
ducts which are generally grouted after tensioning in order to lock in the
stress and protect them from corrosion. Since the bending in the deck is
low, the depth can be minimized and results in reduction in dead load and
horizontal forces in abutments. The abutments are designed to transfer the
horizontal forces from the deck cables into the ground via ground
anchors. Pedestrians, wind and temperature loads can cause large changes
in the bending moments in the deck close to the abutments and
accordingly crack width sand fatigue in reinforcement must be
considered. The soil pressure, over turning and sliding has to be checked
Comprehensive Wind Analysis Of Stress Ribbon
Bridge
International Journal of Scientific & Engineering Research, Volume 8, Issue 3, March-2017 ISSN 2229-5518
287
IJSER © 2017 http://www.ijser.org
IJSER

for construction as well as permanent condition.
The ideal ground condition for resisting large horizontal
forces from the ribbon is a rock base. This occurs rarely but suitable
foundations can be devised even if competent soils are only found at so
me depth below the abutments. In some case where soil conditions do not
permit the use of anchors, piles can also be used. Horizontal deformations
can be significant and are considered in the design. It is also possible to
use a combination of anchors and drilled shafts. Battered micropilingis
another alternative which can resist the load from the ribbon because of
its compression and tension capacity.
Literature Survey
In a prestressed concrete traditional stress ribbon bridge high
strength steel cables are passed through a series of precast concrete
components, the deck assembly of which can be tensioned from stiff
abutments. Whereas in a suspension bridge the main load carrying
component is the cable with the deck acting as a stiffening element, in a
stress ribbon bridge both the cable and the deck can be independently
tensioned, thus adding considerable rigidity to the structure.
Lacey et al. (1975) explained the economic advantages of
precasting can be combined with the structural efficiency of prestressed
concrete box girders for long span bridge structures when erected by
segmental construction. The complete superstructure is precast in box
segments of convenient size for transportation and erection. These precast
segments are erected in cantilever and post-tensioned together to form the
complete superstructure.
Strasky (1987) explained that the stress ribbon concept borrows
the suspension bridge principle but develops it further by using high
strength materials and modern engineering technology, especially
precasting and prestressing methods.
Nakazawa (1988) carried out an experiment based dynamic
behavior of the cable suspension bridge. This experiment explained that the
interest resonance curve such as the shape of hardening type for the first
natural frequency and the shapes of softening type for second and third
natural frequencies respectively.
Aso et al. (1990) conducted the dynamic analyses of three span
continues stress ribbon bridge was clarified by exciting test and eigen value
analysis. Results of three dimensional analyses are cross agreement to
results of exciting test. The natural frequencies of this bridge up to 10th
mode are below 3.0 Hz and are very close to each other due to low
flexibility of ribbon. Some modes clearly indicate that tensional vibration
and out-of-plane vibration are coupled. These modes are must be
considered in aeronautical stability.
Kulhavy (1998)carried out research on the development of hybrid
stress-ribbon pedestrian bridges. In this research the classic stress ribbon
deck is combined with arches or cables and large horizontal forces that is
created near the abutments is eliminated with the help of a slender arch.
Stoyanoff et al. (2000) explained that the lowest natural frequencies
of short span footbridges (e.g., less than 30 m) are usually sufficiently high
that they are not susceptible to human-induced vibrations. As spans increase
(spans up to 200 m have been proposed), their lowest natural frequencies
become lower and human-induced vibrations become a concern. Therefore,
it is important that this phenomenon is well understood and that reliable
theoretical methods are introduced to determine practical solutions.
Arco et al. (2001) presented the structural behavior of prestressed
concrete stress ribbon bridge emphasizing the geometrical non linear
character based on the preliminary design, the final design can be worked
out addressing other loading conditions like pedestrian-induced movements.
Tanaka et al. (2002) explained the aerodynamic stability together
with the static characteristics of the proposals for the stress-ribbon cable-
stayed suspension and stress-ribbon suspension bridges for pedestrian use
were examined in the wind tunnel and by numerical analysis.
Newland (2003) summarised his findings as the growth process of
the lateral vibration of the girder under the congested pedestrians can be
explained as follows. First a small lateral motion is induced by the random
lateral human walking forces, and walking of some pedestrians is
synchronised to the girder motion. Then resonant force acts on the girder,
consequently the girder motion is increased. Walking of more pedestrians
are synchronised, increasing the lateral girder motion. In this sense, this
vibration was a self-excited nature. Of course, because of adaptive nature of
human being, the girder amplitude will not go to infinity and will reach a
steady state.
Newland (2004) theorised that the adoption of a non-dimensional
number which measures the susceptibility of a bridge to pedestrian
excitation. Although currently there are not many good bridge response
data, predictions using this non-dimensional number are compared with the
data that are available and found to be in satisfactory agreement. Both
lateral and vertical vibrations are considered.
Low and Burnton (2004) carried out the studies for the retrofit of the
London Millennium Bridge have provided a model of SLE(Synchronous
Lateral Excitation) which allows footbridge designs to be checked for SLE
phenomenon.
Caetano and Cunha (2004) study focused on the analysis of the
dynamic behaviour of a stress-ribbon footbridge, using both experimental
and numerical tools. The investigation has demonstrated the complex
behaviour of a simple footbridge, and the important role of experimental
testing in the characterisation of the corresponding structural behaviour and
in the tuning of a finite-element model. On the other hand, the significant
variability of the structural response for frequencies of excitation close to
natural frequencies and the difficulty in inducing resonance in the
prototype, show the advantages of using numerical methods to complement
field measurements, in order to extrapolate the most extreme structural
response.
Kalafaticet al. (2006)carried out the experimental work todescribe
the preliminary static design procedure for one span post-tensioned stress
ribbon bridge taking into account real length of the structure and different
International Journal of Scientific & Engineering Research, Volume 8, Issue 3, March-2017 ISSN 2229-5518
288
IJSER © 2017 http://www.ijser.org
IJSER
heights of abutments.
Strasky (2006) elaborates the structural arrangement and static
function of a traditional stress ribbon bridge during construction and service
stages. The article explains that the super structure of the pedestrian bridge
is formed by a prestressed and which is attached to rigid end abutments.
Strasky (2008) describes in detail, primarily about stress ribbon
bridges supported or suspended on arches. The study describes about the
structural arrangement and the special self-anchoring quality..
Stavridis (2009) proposed an analytical method for the evaluation
of static response of a prestressed concrete ribbon pedestrian bridge, the
static response of a prestressed-ribbon bridge under live load was obtained
using only two dimensionsless design parameters, i.e. ratio of thickness over
span length and ratio of prestressing steel area over concrete section area.
Poon et al. (2009) Span-to-depth ratio is an important bridge
design parameter that affects structural behaviour, construction costs and
aesthetics. A study of 86 constant-depth girders indicates that conventional
ratios have not changed significantly since 1958. These conventional ratios
are now questionable, because recently developed high-strength concrete
has enhanced mechanical properties that allow for slenderer sections.
Strasky (2010) the only unique fact about the research is the
mention of Curved Stress Ribbon and Flat Arch Bridges but is not
elaborated as it is still in development stage. The author mentions that the
curved structures have to be designed in such a way that for the dead load
there is no torsion in the deck.
Sandovič and Juozapaitis (2012) the article dwells on a new
structural solution for pedestrian steel suspension bridges. This new
structural system ofpedestrian stress-ribbon bridges includes suspension
members with bending stiffness and a pre-stressed tie.
Wang et al. (2012) performed an analysis of the dynamic character,
wind-resistant stability and flutter instability are analyzed, especially the
analysis of the flutter stability at maximum double cantilever stage during
construction phase. This paper analyzes the dynamic characters of the FE
model of the whole bridge through response spectrum method to reap the
natural frequency, the vibration modes and other parameters, and then
checks the flutter stability. The results show that the bridge is very safe. The
analysis method provides bases and references for the wind-resistant of
Lanqi Song Hua River Bridge.
Cacho-Perez et al. (2013) focused on a stress-ribbon footbridge, the
analytic response for the static and modal problem corresponding to a
simple suspended steel plate is studied. The typical mechanical response
under its own weight (catenary) is modified to take into account the
elongation and thermal effects. The equilibrium equations describing the
problem are ordinary differential equations that require a pair of coupled
nonlinear equations to calculate the value of the stress at one end and then
the rest of the parameters. The understanding of the static response is very
important not only for the determination of the deformed equilibrium
configuration but also for its influence on both the modal analysis and the
dynamic response of the suspended cable. Most of the analytical effort is
paid for the vertical response of the equivalent suspended cable, that is
believed to match, once updated, with the vertical response of the steel-
plated stress-ribbon footbridge under study (80m single span Pedro Gomez
Bosque footbridge in Valladolid, crossing the Pisuerga River).
Mukherjee et al. (2013) The criteria used to judge the acceptability
of the wind load and the corresponding structural responses along with the
serviceability considerations are also presented. Then based on the given
methods the wind forces acting on a continuous bridge whose main span is
larger than the 50 meters (i.e. > 50 meter requires dynamic assessment) is
studied and compared with the results which could be obtained from the
simplified methods recommended in the Euro Code 1.
Findings of Literature Review
The literature focuses primarily on static analysis of stress ribbon
bridges for span upto40m. The dynamic behavior of stress ribbon bridge is
still scare in the literature. The present work is dealing primarily with a
simplified explanation of static analysis with the dynamic aspect of such
bridges and the effect of pedestrian excitation has on such slender decks.
Multiple spans are taken in order to get clarity under the static and dynamic
conditions for various spans.
Problem Definition
For the Static and Dynamic Analysis of Traditional Stress Ribbon Bridge
following parameters are considered;
(Note: Winds zones of India are considered considered are as per IRC 6.)
Span = 45m, 50m, 55m and 60m (Wind Zone III), 45m and 60m (All Wind
Zones)
Sag (dip) of Bridge deck (f) = 0.02*L
Width of footway = 4 m wide (End to end)
Effective width= 3.7m
Deck thickness = 200mm, 225mm and 250 mm (45m and 60m)
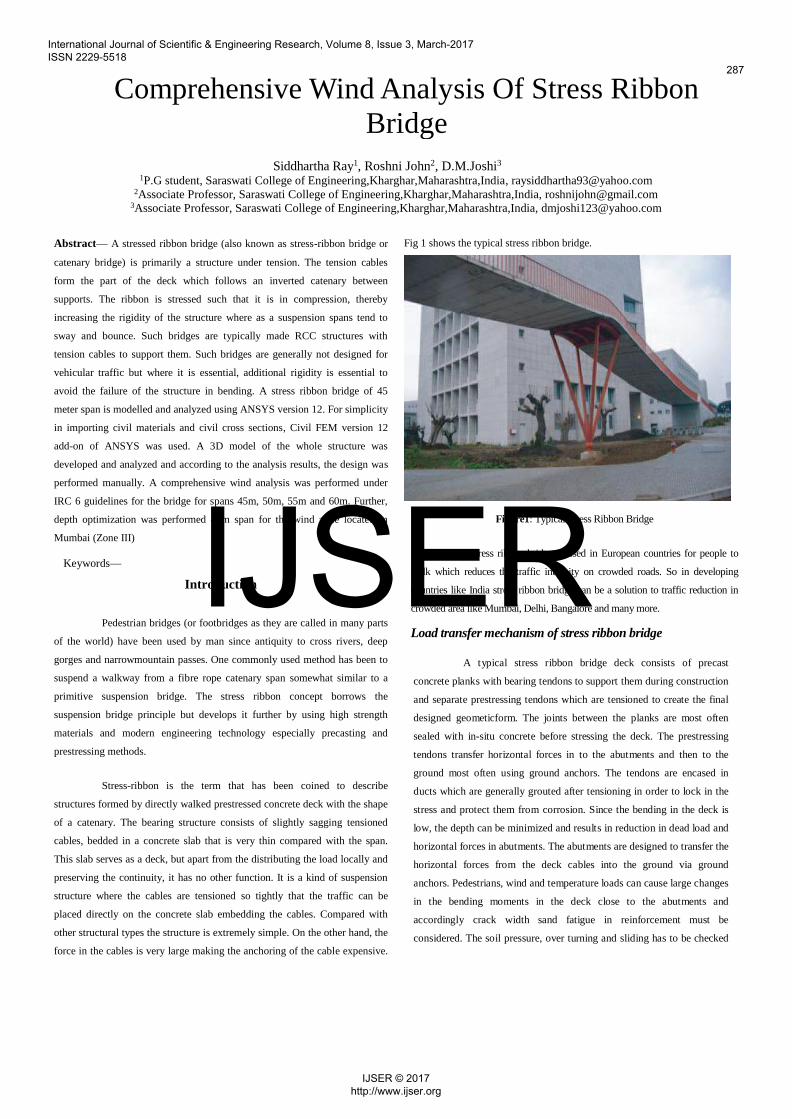
Figure2: Structural arrangement of a Stress Ribbon Bridge
Figure 2 shows the general arrangement of a traditional stress
ribbon bridge. Stress ribbon bridges have an advantage that they can be
constructed for higher spans. It is this advantage combined with a slender
deck that helps the stress ribbon bridge to be a viable option for pedestrian
bridges. The deck slab is discreatized into ‘l’ no of two nodded rectangular
elements. Every element is considered as beam interconnected at an interval
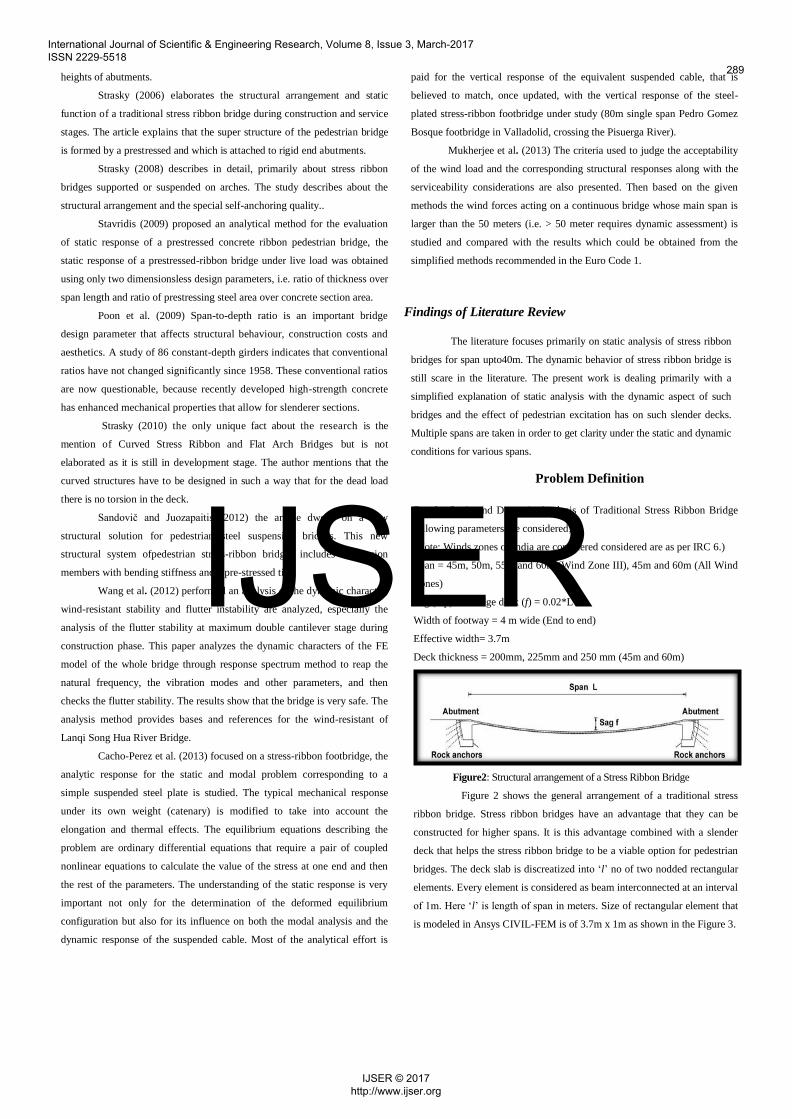
of 1m. Here ‘l’ is length of span in meters. Size of rectangular element that
is modeled in Ansys CIVIL-FEM is of 3.7m x 1m as shown in the Figure 3.
International Journal of Scientific & Engineering Research, Volume 8, Issue 3, March-2017 ISSN 2229-5518
289
IJSER © 2017 http://www.ijser.org
IJSER
Figure3: Rectangular element in Ansys-Civil FEM
Aims and Objectives
The aims and objective of the work are as follows.
1. To develop a simplified model for a traditional stress ribbon bridge
using ANSYS
2. To perform static analysis of traditional stress ribbon bridge for IRC
loading conditions.
3. To obtain the permissible pedestrian excitations of the stress ribbon
bridge and its mode shapes.
4. To Analyse and check the structure for safety against pedestrian
excitation of bridges as per BS 5400.
5. To perform the wind analysis of the stress ribbon bridge of particular
spans and to optimize the depth of these spans as per IRC.
6. To decide a suitable abutment for the stress ribbon bridge to transmit
the high cable forces to the foundation below.
Scope of Work
Stress ribbon bridges can prove to be an innovative, aesthetic and
economical alternative to traditional pedestrian bridges. In the present
project, a traditional stress ribbon bridge for a span of 45m, 50m, 55m and
60mis analysed which includes.
1. Analysis of traditional stress ribbon bridge for various spans.
2. Study of effect of variation of depth in stress ribbon bridge for a
particular span.
3. To improve the foundation design for the bridge that suits different
soil conditions.
4. Analyse the abutment which will support different size of slender
deck.
5. Wind tunnel analysis of the same stress ribbon bridge can be
performed.
Methodology
Various steps involved in modeling the deck structure, loading it and then
analyzing the final structure in the software package ANSYS. An add-on for
ANSYS named Civil-FEM was used to import civil material properties and
common civil cross sections. Civil-FEM also simplifies the process of selection of
commonly used civil elements and association the cross section properties
with the element selected. Civil-FEM is also used to simplify the process of view
the bending moment and shear force diagrams for the structure.
This topic will describe the various procedures involved in modeling the
structure, the selection of element, material selection, cross-section editor,
merging the section properties with the element selected and finally creating the
structure ready for loading.
Stress ribbon bridges are very slender in nature and have a natural
frequency very close to the pedestrian walking frequency of 2 Hz. The
synchronous excitation of The Millennium Bridge in 2001 which led to
additional cost of £5 million in order to install fluid viscous dampers and
tuned mass dampers in order to control the vibrations of the bridge is the
best example as to how pedestrian excitation can cause resonance. The
codes of choice for structural engineers around the world for pedestrian
excitation analysis are The British Standard BS 5400 Part 2 and Ontario
Highway Bridge Design Code OHBDCONT 83. Both these codes contain
the same loading model which is the single pedestrian load model. For this
report, we will be using BS 5400 Part 2 model for pedestrian excitation
analysis which has been improved in fib 32.
Analysis
The traditional stress ribbon bridge is analyzed in static condition
for different loading conditions also for pedestrian excitation. The
analysis is carryout using software Ansys CIVIL-FEM. Loading
combinations considered for designs are given below:
Types of Loads 1. Dead Load
The dead load taken for the bridge was 26 kN/m which is calculated as
D.L= (Thickness of the deck slab× width of the deck slab× Density of
concrete) + 1
The above load includes the cable dead load the load of the railings and the
prestressing steel dead load.
2. Live Load
The live load calculations are computed using IRC 6:2010 Clause 206.3.
The equation for the live load calculation for effective spans above 30
meters is given below:
𝑃 = (𝑃1 − 260 +4800
𝐿) (
16.5 − 𝑊
15)
3. Lateral Wind Load
The wind loads are calculated as per IRC 6:2010 clause 209.3.5 for
International Journal of Scientific & Engineering Research, Volume 8, Issue 3, March-2017 ISSN 2229-5518
290
IJSER © 2017 http://www.ijser.org
IJSER
transverse wind loads respectively.
4. Transverse Wind Load
The wind loads are calculated as per IRC 6:2010 clause 209.3.3 for
transverse wind loads respectively.
5. Temperature Load (±)
Temperature loads in the structure are calculated as per IRC:6:2010 clause
215.2. The maximum and minimum temperatures in Mumbai are 40ºC and
10ºC respectively. Hence the structure will be analyzed for a mean
temperature of (25º ± 10º) C whichever is critical.
6. Prestressed load
The prestressing force is being applied in such a way that the equivalent
up thrust generated is 20kN/m.
Loading Combination
1. Normal combination
The normal combination consists of D.L.+L.L only. There is no increase of
permissible stresses allowed in this combination.
2. Temperature combination
The temperature combination consists of D.L.+L.L.+Temp(+). The positive
value of temperature is taken since it is critical. The IRC 6:2010 also allows
an increase in permissible stresses by 15%.
3. Wind and Temperature combination
The wind and temperature combination consists of
D.L.+L.L+Temp(+)+Wind. The vertical value of wind is taken since it is
critical. The IRC 6:2010 also allows an increase in permissible stresses by
33% in this combination.
4. Dead load and Prestress combination
Stress is also a critical condition during prestressing. IRC 18:2000 mentions
that the temporary stresses in compression and tension are 50% of the
compression stress at the day of prestressing subject to a maximum of 20
N/mm2and 10% of the permissible compressive stress in concrete
respectively.
5. Dead load, live load, Prestress and temperature results
In this condition, the Prestress force is applied to the temperature
combination which is the most critical combination for the bridge amongst
the three critical combinations.
In dynamic analysis the pedestrian excitation is considered. There are three
primary mode shapes for the deck, namely, vertical, lateral and torsion
modes. The first three modes are vertical. The first lateral mode is the
fourth mode and the first torsion mode is the seventh mode. The first two
vertical modes have a frequencies f1=1.379 Hz and f2=1.788 Hz
respectively. Normal practice suggests that that the second mode shape
f2should actually be the first mode shape but, this mode requires an
elongation of the cable, hence the corresponding frequency in some cases is
higher and mode shape of f1 becomes the first mode.
Results and Discussions
General
A45m, 50m, 55m and 60m span length of slender deck slab having dept of
250mm was analyzed using Ansys CIVIL-FEM. In static analysis the
deflection, bending moment and stress is compared and the same deck is
analyzed in different wind zones of India. Similarly in dynamic analysis the
pedestrian excitation of the bridges is compared. The results are obtained in
the form deflection, bending moments, stresses for various loading
combinations by using various parameters. Lastly suitable abutment is also
figured out in particular type of soil.
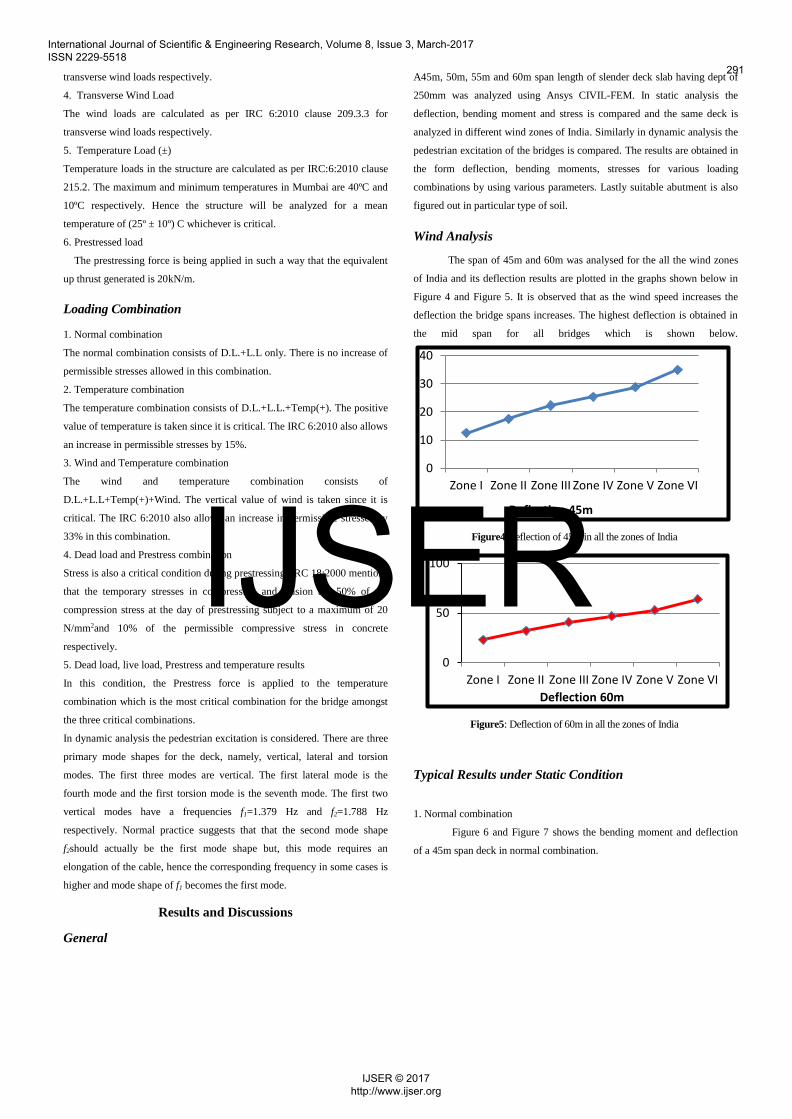
Wind Analysis
The span of 45m and 60m was analysed for the all the wind zones
of India and its deflection results are plotted in the graphs shown below in
Figure 4 and Figure 5. It is observed that as the wind speed increases the
deflection the bridge spans increases. The highest deflection is obtained in
the mid span for all bridges which is shown below.
Figure4:Deflection of 45m in all the zones of India
Figure5: Deflection of 60m in all the zones of India
Typical Results under Static Condition
1. Normal combination
Figure 6 and Figure 7 shows the bending moment and deflection
of a 45m span deck in normal combination.
0
10
20
30
40
Zone I Zone II Zone III Zone IV Zone V Zone VI
Deflection 45m
0
50
100
Zone I Zone II Zone III Zone IV Zone V Zone VI
Deflection 60m
International Journal of Scientific & Engineering Research, Volume 8, Issue 3, March-2017 ISSN 2229-5518
291
IJSER © 2017 http://www.ijser.org
IJSER
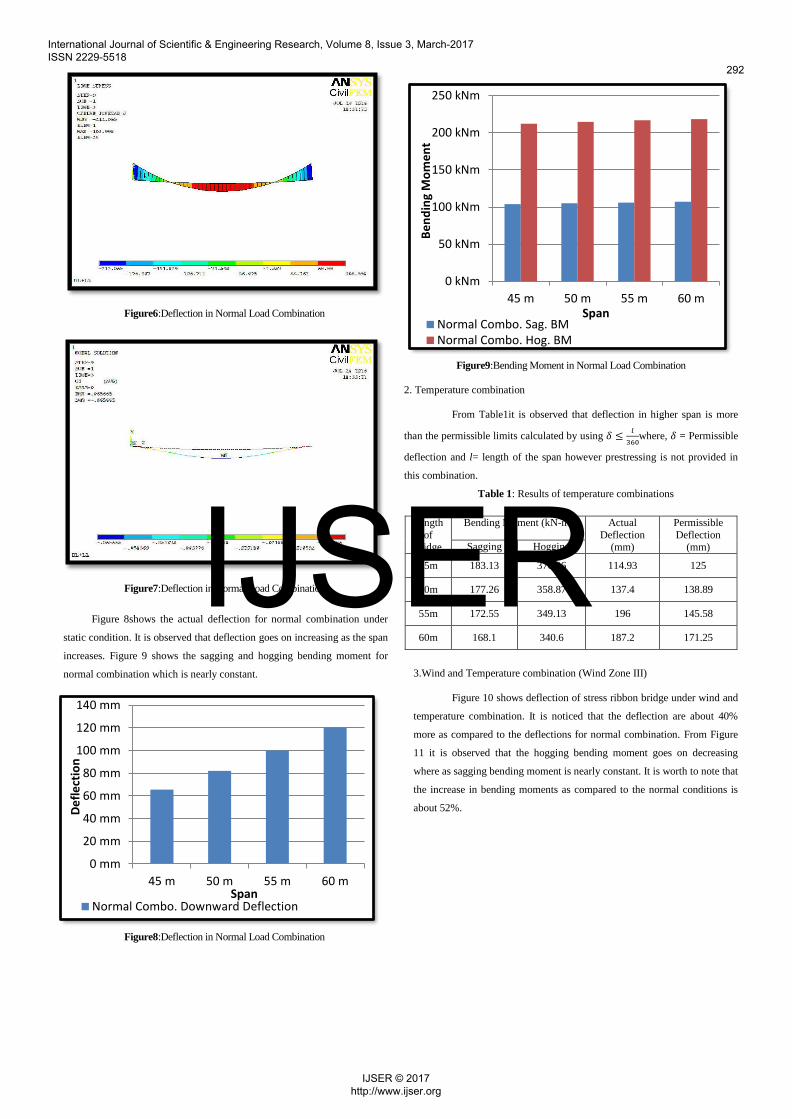
Figure6:Deflection in Normal Load Combination
Figure7:Deflection in Normal Load Combination
Figure 8shows the actual deflection for normal combination under
static condition. It is observed that deflection goes on increasing as the span
increases. Figure 9 shows the sagging and hogging bending moment for
normal combination which is nearly constant.
Figure8:Deflection in Normal Load Combination
Figure9:Bending Moment in Normal Load Combination
2. Temperature combination
From Table1it is observed that deflection in higher span is more
than the permissible limits calculated by using 𝛿 ≤𝑙
360where, 𝛿 = Permissible
deflection and l= length of the span however prestressing is not provided in
this combination.
Table 1: Results of temperature combinations
Length
of bridge
Bending Moment (kN-m) Actual
Deflection (mm)
Permissible
Deflection (mm) Sagging Hogging
45m 183.13 370.06 114.93 125
50m 177.26 358.87 137.4 138.89
55m 172.55 349.13 196 145.58
60m 168.1 340.6 187.2 171.25
3.Wind and Temperature combination (Wind Zone III)
Figure 10 shows deflection of stress ribbon bridge under wind and
temperature combination. It is noticed that the deflection are about 40%
more as compared to the deflections for normal combination. From Figure
11 it is observed that the hogging bending moment goes on decreasing
where as sagging bending moment is nearly constant. It is worth to note that
the increase in bending moments as compared to the normal conditions is
about 52%.
0 mm
20 mm
40 mm
60 mm
80 mm
100 mm
120 mm
140 mm
45 m 50 m 55 m 60 m
De
fle
ctio
n
SpanNormal Combo. Downward Deflection
0 kNm
50 kNm
100 kNm
150 kNm
200 kNm
250 kNm
45 m 50 m 55 m 60 m
Be
nd
ing
Mo
me
nt
SpanNormal Combo. Sag. BMNormal Combo. Hog. BM
International Journal of Scientific & Engineering Research, Volume 8, Issue 3, March-2017 ISSN 2229-5518
292
IJSER © 2017 http://www.ijser.org
IJSER
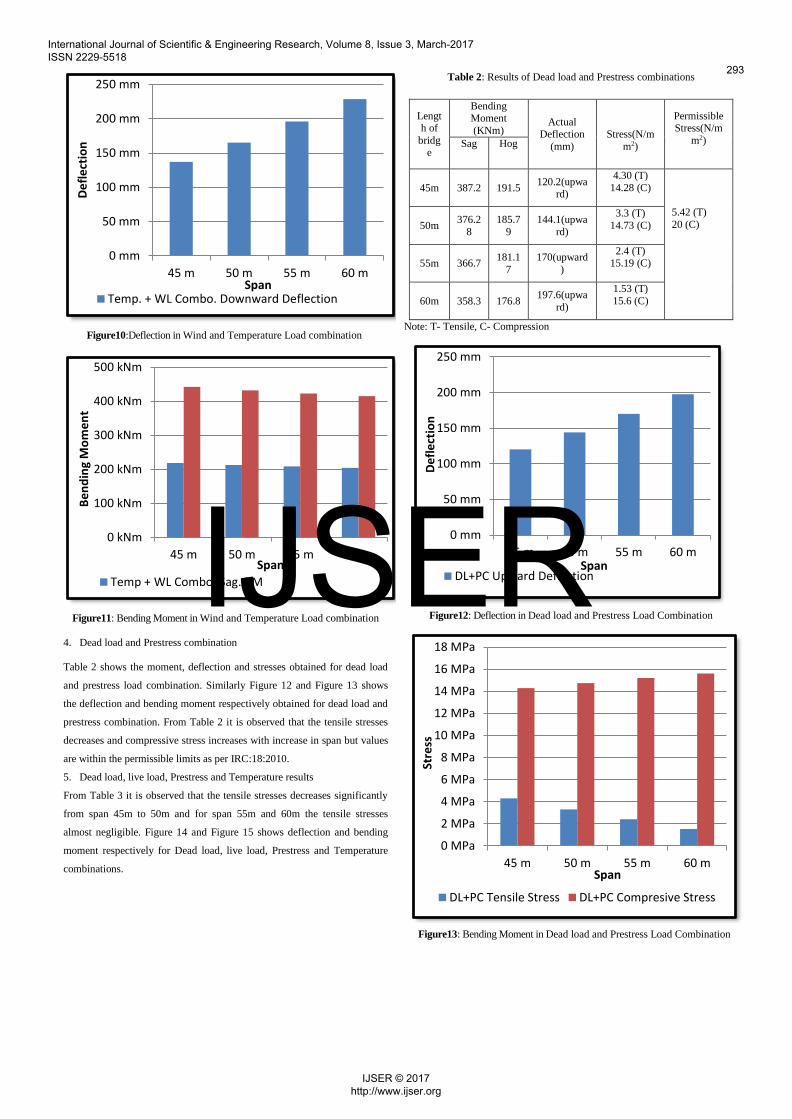
Figure10:Deflection in Wind and Temperature Load combination
Figure11: Bending Moment in Wind and Temperature Load combination
4. Dead load and Prestress combination
Table 2 shows the moment, deflection and stresses obtained for dead load
and prestress load combination. Similarly Figure 12 and Figure 13 shows
the deflection and bending moment respectively obtained for dead load and
prestress combination. From Table 2 it is observed that the tensile stresses
decreases and compressive stress increases with increase in span but values
are within the permissible limits as per IRC:18:2010.
5. Dead load, live load, Prestress and Temperature results
From Table 3 it is observed that the tensile stresses decreases significantly
from span 45m to 50m and for span 55m and 60m the tensile stresses
almost negligible. Figure 14 and Figure 15 shows deflection and bending
moment respectively for Dead load, live load, Prestress and Temperature
combinations.
Table 2: Results of Dead load and Prestress combinations
Length of
bridge
Bending
Moment
(KNm) Actual
Deflection
(mm)
Stress(N/m
m2)
Permissible Stress(N/m
m2)
Sag Hog
45m 387.2 191.5 120.2(upwa
rd)
4.30 (T)
14.28 (C)
5.42 (T)
20 (C)
50m
376.2
8
185.7
9
144.1(upwa
rd)
3.3 (T)
14.73 (C)
55m 366.7 181.1
7
170(upward
)
2.4 (T) 15.19 (C)
60m 358.3 176.8 197.6(upwa
rd)
1.53 (T)
15.6 (C)
Note: T- Tensile, C- Compression
Figure12: Deflection in Dead load and Prestress Load Combination
Figure13: Bending Moment in Dead load and Prestress Load Combination
0 mm
50 mm
100 mm
150 mm
200 mm
250 mm
45 m 50 m 55 m 60 m
De
fle
ctio
n
SpanTemp. + WL Combo. Downward Deflection
0 kNm
100 kNm
200 kNm
300 kNm
400 kNm
500 kNm
45 m 50 m 55 m 60 m
Be
nd
ing
Mo
me
nt
Span
Temp + WL Combo. Sag. BM
0 mm
50 mm
100 mm
150 mm
200 mm
250 mm
45 m 50 m 55 m 60 m
De
fle
ctio
n
SpanDL+PC Upward Deflection
0 MPa
2 MPa
4 MPa
6 MPa
8 MPa
10 MPa
12 MPa
14 MPa
16 MPa
18 MPa
45 m 50 m 55 m 60 m
Stre
ss
Span
DL+PC Tensile Stress DL+PC Compresive Stress
International Journal of Scientific & Engineering Research, Volume 8, Issue 3, March-2017 ISSN 2229-5518
293
IJSER © 2017 http://www.ijser.org
IJSER
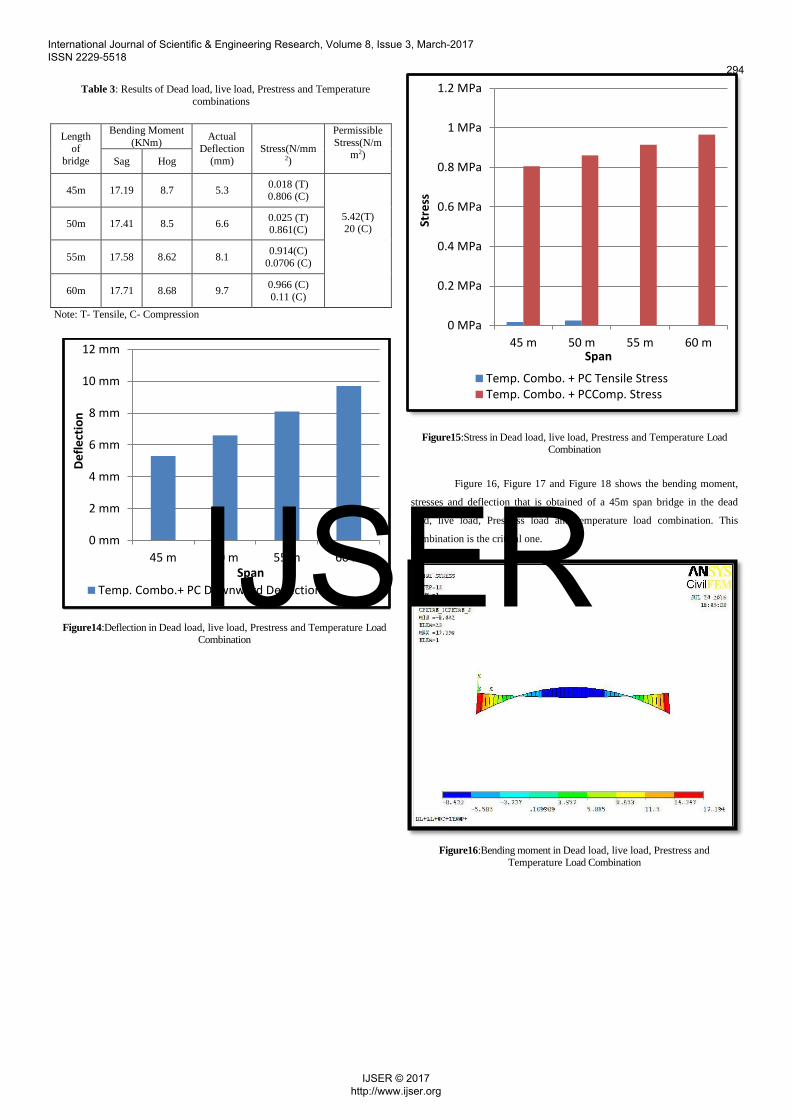
Table 3: Results of Dead load, live load, Prestress and Temperature
combinations
Length
of
bridge
Bending Moment
(KNm) Actual
Deflection
(mm)
Stress(N/mm2)
Permissible
Stress(N/mm2)
Sag Hog
45m 17.19 8.7 5.3 0.018 (T) 0.806 (C)
5.42(T) 20 (C)
50m 17.41 8.5 6.6 0.025 (T) 0.861(C)
55m 17.58 8.62 8.1 0.914(C)
0.0706 (C)
60m 17.71 8.68 9.7 0.966 (C)
0.11 (C)
Note: T- Tensile, C- Compression
Figure14:Deflection in Dead load, live load, Prestress and Temperature Load Combination
Figure15:Stress in Dead load, live load, Prestress and Temperature Load Combination
Figure 16, Figure 17 and Figure 18 shows the bending moment,
stresses and deflection that is obtained of a 45m span bridge in the dead
load, live load, Prestress load and temperature load combination. This
combination is the critical one.
Figure16:Bending moment in Dead load, live load, Prestress and Temperature Load Combination
0 mm
2 mm
4 mm
6 mm
8 mm
10 mm
12 mm
45 m 50 m 55 m 60 m
De
fle
ctio
n
Span
Temp. Combo.+ PC Downward Deflection
0 MPa
0.2 MPa
0.4 MPa
0.6 MPa
0.8 MPa
1 MPa
1.2 MPa
45 m 50 m 55 m 60 m
Stre
ss
Span
Temp. Combo. + PC Tensile StressTemp. Combo. + PCComp. Stress
International Journal of Scientific & Engineering Research, Volume 8, Issue 3, March-2017 ISSN 2229-5518
294
IJSER © 2017 http://www.ijser.org
IJSER
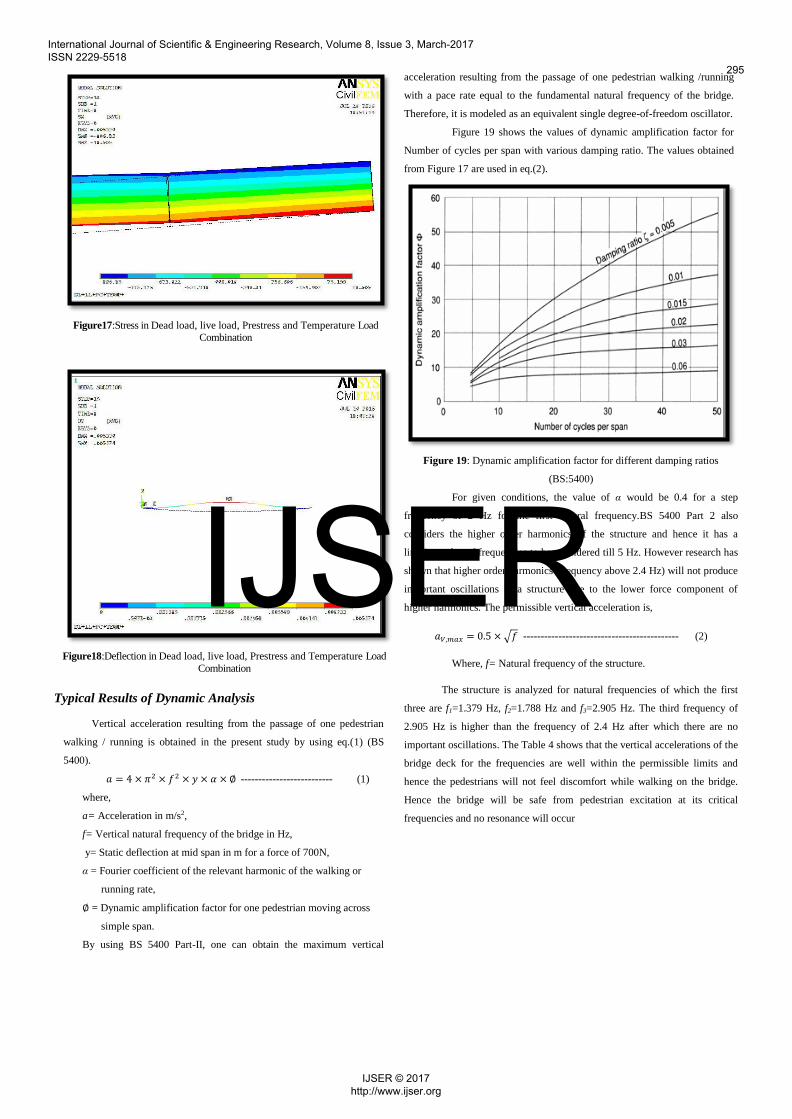
Figure17:Stress in Dead load, live load, Prestress and Temperature Load Combination
Figure18:Deflection in Dead load, live load, Prestress and Temperature Load
Combination
Typical Results of Dynamic Analysis
Vertical acceleration resulting from the passage of one pedestrian
walking / running is obtained in the present study by using eq.(1) (BS
5400).
𝑎 = 4 × 𝜋2 × 𝑓2 × 𝑦 × 𝛼 × ∅ -------------------------- (1)
where,
a= Acceleration in m/s2,
f= Vertical natural frequency of the bridge in Hz,
y= Static deflection at mid span in m for a force of 700N,
α = Fourier coefficient of the relevant harmonic of the walking or
running rate,
∅ = Dynamic amplification factor for one pedestrian moving across
simple span.
By using BS 5400 Part-II, one can obtain the maximum vertical
acceleration resulting from the passage of one pedestrian walking /running
with a pace rate equal to the fundamental natural frequency of the bridge.
Therefore, it is modeled as an equivalent single degree-of-freedom oscillator.
Figure 19 shows the values of dynamic amplification factor for
Number of cycles per span with various damping ratio. The values obtained
from Figure 17 are used in eq.(2).
Figure 19: Dynamic amplification factor for different damping ratios
(BS:5400)
For given conditions, the value of α would be 0.4 for a step
frequency of 2 Hz for the first natural frequency.BS 5400 Part 2 also
considers the higher order harmonics of the structure and hence it has a
limiting value of frequencies to be considered till 5 Hz. However research has
shown that higher order harmonics (frequency above 2.4 Hz) will not produce
important oscillations in a structure due to the lower force component of
higher harmonics. The permissible vertical acceleration is,
𝑎𝑉,𝑚𝑎𝑥 = 0.5 × √𝑓 -------------------------------------------- (2)
Where, f= Natural frequency of the structure.
The structure is analyzed for natural frequencies of which the first
three are f1=1.379 Hz, f2=1.788 Hz and f3=2.905 Hz. The third frequency of
2.905 Hz is higher than the frequency of 2.4 Hz after which there are no
important oscillations. The Table 4 shows that the vertical accelerations of the
bridge deck for the frequencies are well within the permissible limits and
hence the pedestrians will not feel discomfort while walking on the bridge.
Hence the bridge will be safe from pedestrian excitation at its critical
frequencies and no resonance will occur
International Journal of Scientific & Engineering Research, Volume 8, Issue 3, March-2017 ISSN 2229-5518
295
IJSER © 2017 http://www.ijser.org
IJSER
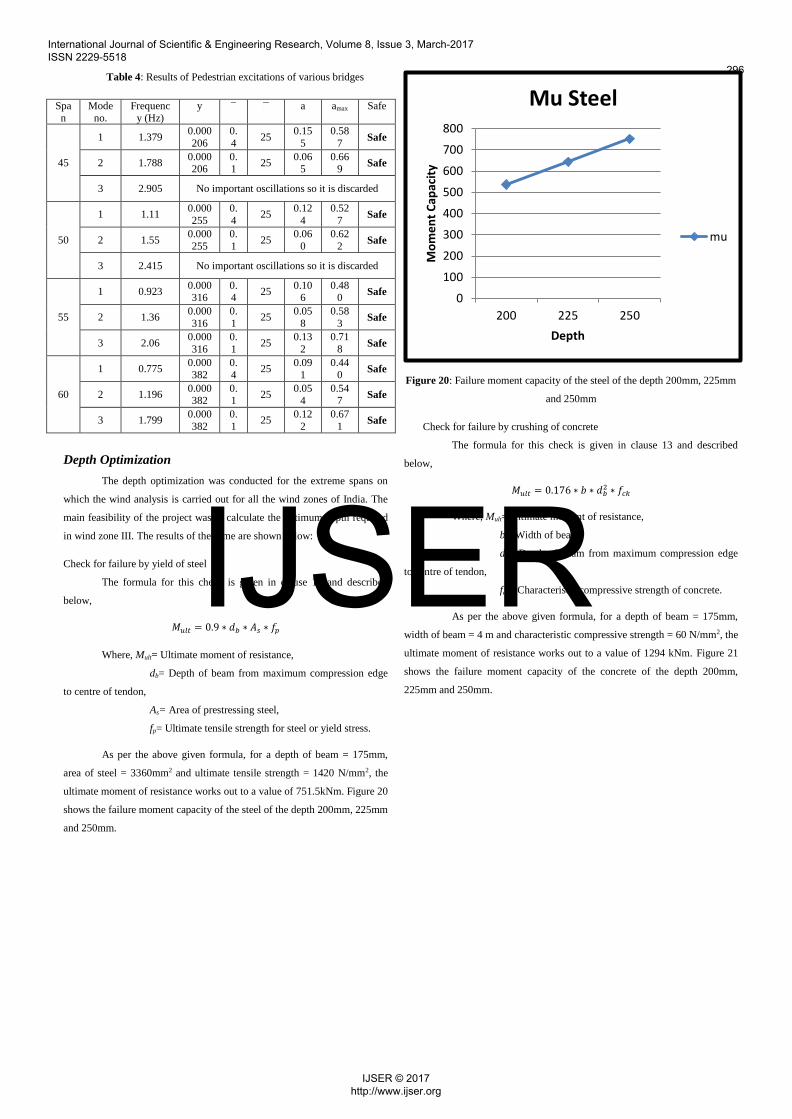
Table 4: Results of Pedestrian excitations of various bridges
Spa
n
Mode
no.
Frequenc
y (Hz)
y a amax Safe
45
1 1.379 0.000
206
0.
4 25
0.15
5
0.58
7 Safe
2 1.788 0.000206
0.1
25 0.06
5 0.66
9 Safe
3 2.905 No important oscillations so it is discarded
50
1 1.11 0.000
255
0.
4 25
0.12
4
0.52
7 Safe
2 1.55 0.000
255
0.
1 25
0.06
0
0.62
2 Safe
3 2.415 No important oscillations so it is discarded
55
1 0.923 0.000316
0.4
25 0.10
6 0.48
0 Safe
2 1.36 0.000
316
0.
1 25
0.05
8
0.58
3 Safe
3 2.06 0.000
316
0.
1 25
0.13
2
0.71
8 Safe
60
1 0.775 0.000
382
0.
4 25
0.09
1
0.44
0 Safe
2 1.196 0.000382
0.1
25 0.05
4 0.54
7 Safe
3 1.799 0.000
382
0.
1 25
0.12
2
0.67
1 Safe
Depth Optimization
The depth optimization was conducted for the extreme spans on
which the wind analysis is carried out for all the wind zones of India. The
main feasibility of the project was to calculate the optimum depth required
in wind zone III. The results of the same are shown below:
Check for failure by yield of steel
The formula for this check is given in clause 13 and described
below,
𝑀𝑢𝑙𝑡 = 0.9 ∗ 𝑑𝑏 ∗ 𝐴𝑠 ∗ 𝑓𝑝
Where, Mult= Ultimate moment of resistance,
db= Depth of beam from maximum compression edge
to centre of tendon,
As= Area of prestressing steel,
fp= Ultimate tensile strength for steel or yield stress.
As per the above given formula, for a depth of beam = 175mm,
area of steel = 3360mm2 and ultimate tensile strength = 1420 N/mm2, the
ultimate moment of resistance works out to a value of 751.5kNm. Figure 20
shows the failure moment capacity of the steel of the depth 200mm, 225mm
and 250mm.
Figure 20: Failure moment capacity of the steel of the depth 200mm, 225mm
and 250mm
Check for failure by crushing of concrete
The formula for this check is given in clause 13 and described
below,
𝑀𝑢𝑙𝑡 = 0.176 ∗ 𝑏 ∗ 𝑑𝑏2 ∗ 𝑓𝑐𝑘
Where, Mult= Ultimate moment of resistance,
b= Width of beam,
db= Depth of beam from maximum compression edge
to centre of tendon,
fck= Characteristic compressive strength of concrete.
As per the above given formula, for a depth of beam = 175mm,
width of beam = 4 m and characteristic compressive strength = 60 N/mm2, the
ultimate moment of resistance works out to a value of 1294 kNm. Figure 21
shows the failure moment capacity of the concrete of the depth 200mm,
225mm and 250mm.
0
100
200
300
400
500
600
700
800
200 225 250
Mo
me
nt
Cap
acit
y
Depth
Mu Steel
mu
International Journal of Scientific & Engineering Research, Volume 8, Issue 3, March-2017 ISSN 2229-5518
296
IJSER © 2017 http://www.ijser.org
IJSER
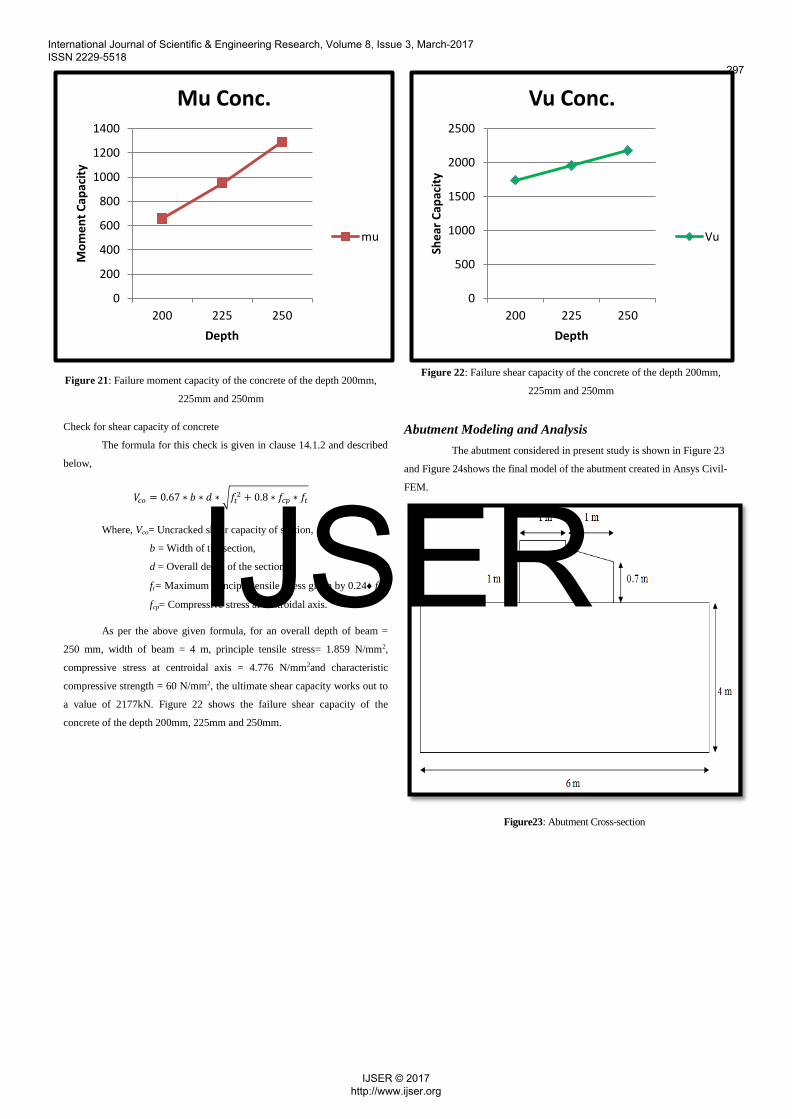
Figure 21: Failure moment capacity of the concrete of the depth 200mm,
225mm and 250mm
Check for shear capacity of concrete
The formula for this check is given in clause 14.1.2 and described
below,
𝑉𝑐𝑜 = 0.67 ∗ 𝑏 ∗ 𝑑 ∗ √𝑓𝑡2 + 0.8 ∗ 𝑓𝑐𝑝 ∗ 𝑓𝑡
Where, Vco= Uncracked shear capacity of section,
b = Width of the section,
d = Overall depth of the section,
ft= Maximum principle tensile stress given by 0.24fck,
fcp= Compressive stress at centroidal axis.
As per the above given formula, for an overall depth of beam =
250 mm, width of beam = 4 m, principle tensile stress= 1.859 N/mm2,
compressive stress at centroidal axis = 4.776 N/mm2and characteristic
compressive strength = 60 N/mm2, the ultimate shear capacity works out to
a value of 2177kN. Figure 22 shows the failure shear capacity of the
concrete of the depth 200mm, 225mm and 250mm.
Figure 22: Failure shear capacity of the concrete of the depth 200mm,
225mm and 250mm
Abutment Modeling and Analysis
The abutment considered in present study is shown in Figure 23
and Figure 24shows the final model of the abutment created in Ansys Civil-
FEM.
Figure23: Abutment Cross-section
0
200
400
600
800
1000
1200
1400
200 225 250
Mo
me
nt
Cap
acit
y
Depth
Mu Conc.
mu
0
500
1000
1500
2000
2500
200 225 250
She
ar C
apac
ity
Depth
Vu Conc.
Vu
International Journal of Scientific & Engineering Research, Volume 8, Issue 3, March-2017 ISSN 2229-5518
297
IJSER © 2017 http://www.ijser.org
IJSER
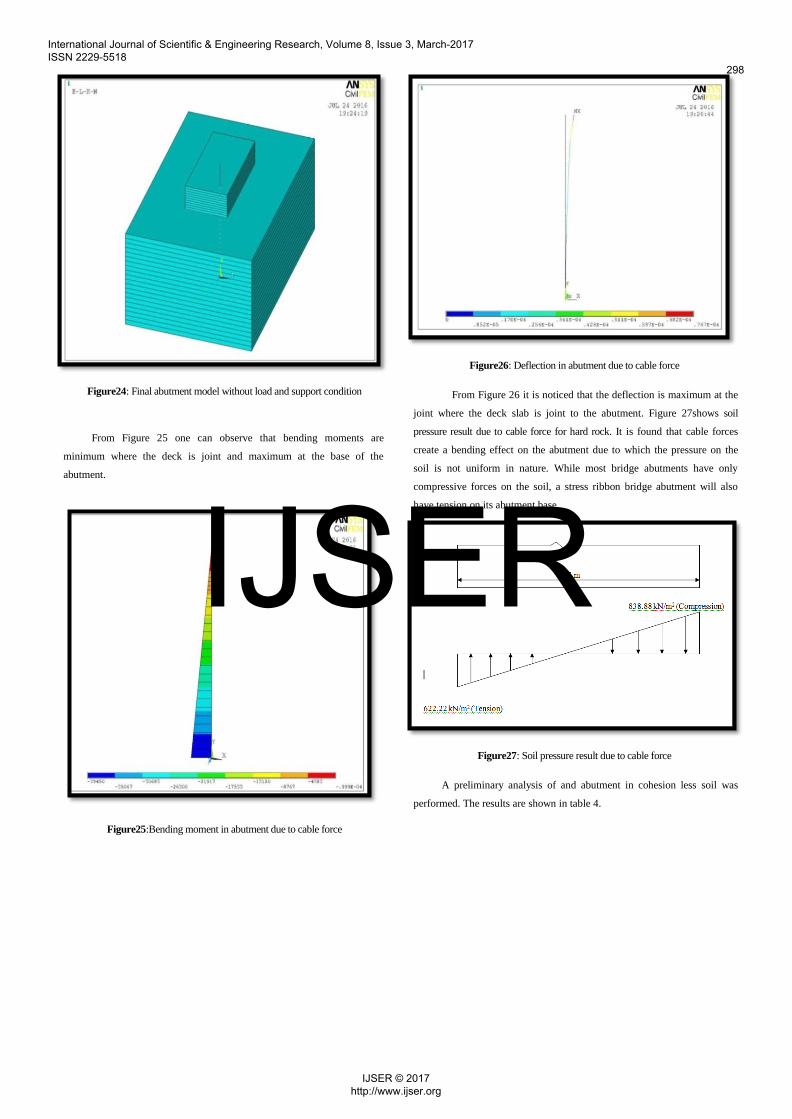
Figure24: Final abutment model without load and support condition
From Figure 25 one can observe that bending moments are
minimum where the deck is joint and maximum at the base of the
abutment.
Figure25:Bending moment in abutment due to cable force
Figure26: Deflection in abutment due to cable force
From Figure 26 it is noticed that the deflection is maximum at the
joint where the deck slab is joint to the abutment. Figure 27shows soil
pressure result due to cable force for hard rock. It is found that cable forces
create a bending effect on the abutment due to which the pressure on the
soil is not uniform in nature. While most bridge abutments have only
compressive forces on the soil, a stress ribbon bridge abutment will also
have tension on its abutment base.
Figure27: Soil pressure result due to cable force
A preliminary analysis of and abutment in cohesion less soil was
performed. The results are shown in table 4.
International Journal of Scientific & Engineering Research, Volume 8, Issue 3, March-2017 ISSN 2229-5518
298
IJSER © 2017 http://www.ijser.org
IJSER
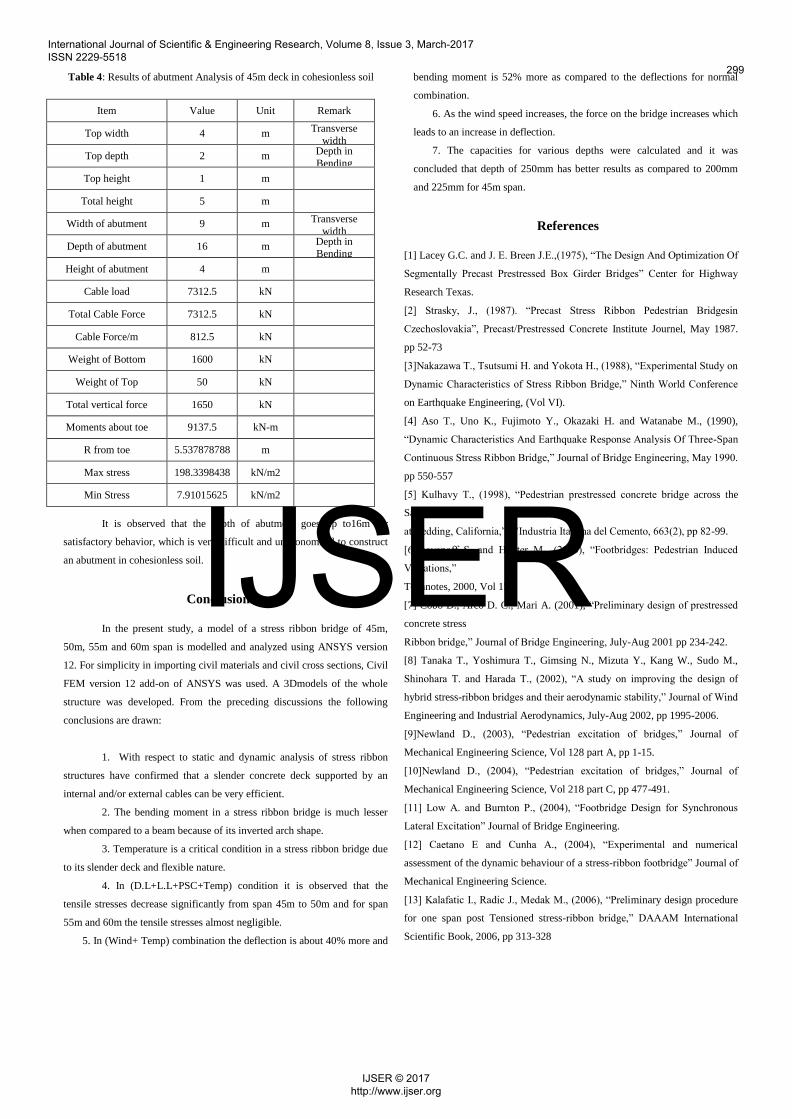
Table 4: Results of abutment Analysis of 45m deck in cohesionless soil
Item Value Unit Remark
Top width 4 m Transverse
width
Top depth 2 m Depth in
Bending
Top height 1 m
Total height 5 m
Width of abutment 9 m Transverse
width
Depth of abutment 16 m Depth in Bending
Height of abutment 4 m
Cable load 7312.5 kN
Total Cable Force 7312.5 kN
Cable Force/m 812.5 kN
Weight of Bottom 1600 kN
Weight of Top 50 kN
Total vertical force 1650 kN
Moments about toe 9137.5 kN-m
R from toe 5.537878788 m
Max stress 198.3398438 kN/m2
Min Stress 7.91015625 kN/m2
It is observed that the depth of abutment goes up to16m for
satisfactory behavior, which is very difficult and uneconomical to construct
an abutment in cohesionless soil.
Conclusions
In the present study, a model of a stress ribbon bridge of 45m,
50m, 55m and 60m span is modelled and analyzed using ANSYS version
12. For simplicity in importing civil materials and civil cross sections, Civil
FEM version 12 add-on of ANSYS was used. A 3Dmodels of the whole
structure was developed. From the preceding discussions the following
conclusions are drawn:
1. With respect to static and dynamic analysis of stress ribbon
structures have confirmed that a slender concrete deck supported by an
internal and/or external cables can be very efficient.
2. The bending moment in a stress ribbon bridge is much lesser
when compared to a beam because of its inverted arch shape.
3. Temperature is a critical condition in a stress ribbon bridge due
to its slender deck and flexible nature.
4. In (D.L+L.L+PSC+Temp) condition it is observed that the
tensile stresses decrease significantly from span 45m to 50m and for span
55m and 60m the tensile stresses almost negligible.
5. In (Wind+ Temp) combination the deflection is about 40% more and
bending moment is 52% more as compared to the deflections for normal
combination.
6. As the wind speed increases, the force on the bridge increases which
leads to an increase in deflection.
7. The capacities for various depths were calculated and it was
concluded that depth of 250mm has better results as compared to 200mm
and 225mm for 45m span.
References
[1] Lacey G.C. and J. E. Breen J.E.,(1975), “The Design And Optimization Of
Segmentally Precast Prestressed Box Girder Bridges” Center for Highway
Research Texas.
[2] Strasky, J., (1987). “Precast Stress Ribbon Pedestrian Bridgesin
Czechoslovakia”, Precast/Prestressed Concrete Institute Journel, May 1987.
pp 52-73
[3]Nakazawa T., Tsutsumi H. and Yokota H., (1988), “Experimental Study on
Dynamic Characteristics of Stress Ribbon Bridge,” Ninth World Conference
on Earthquake Engineering, (Vol VI).
[4] Aso T., Uno K., Fujimoto Y., Okazaki H. and Watanabe M., (1990),
“Dynamic Characteristics And Earthquake Response Analysis Of Three-Span
Continuous Stress Ribbon Bridge,” Journal of Bridge Engineering, May 1990.
pp 550-557
[5] Kulhavy T., (1998), “Pedestrian prestressed concrete bridge across the
Sacramento River
at Redding, California,” L’Industria Italiana del Cemento, 663(2), pp 82-99.
[6]Stoyanoff S. and Hunter M., (2000), “Footbridges: Pedestrian Induced
Vibrations,”
Technotes, 2000, Vol 15
[7] Cobo D., Arco D. C., Mari A. (2001), “Preliminary design of prestressed
concrete stress
Ribbon bridge,” Journal of Bridge Engineering, July-Aug 2001 pp 234-242.
[8] Tanaka T., Yoshimura T., Gimsing N., Mizuta Y., Kang W., Sudo M.,
Shinohara T. and Harada T., (2002), “A study on improving the design of
hybrid stress-ribbon bridges and their aerodynamic stability,” Journal of Wind
Engineering and Industrial Aerodynamics, July-Aug 2002, pp 1995-2006.
[9]Newland D., (2003), “Pedestrian excitation of bridges,” Journal of
Mechanical Engineering Science, Vol 128 part A, pp 1-15.
[10]Newland D., (2004), “Pedestrian excitation of bridges,” Journal of
Mechanical Engineering Science, Vol 218 part C, pp 477-491.
[11] Low A. and Burnton P., (2004), “Footbridge Design for Synchronous
Lateral Excitation” Journal of Bridge Engineering.
[12] Caetano E and Cunha A., (2004), “Experimental and numerical
assessment of the dynamic behaviour of a stress-ribbon footbridge” Journal of
Mechanical Engineering Science.
[13] Kalafatic I., Radic J., Medak M., (2006), “Preliminary design procedure
for one span post Tensioned stress-ribbon bridge,” DAAAM International
Scientific Book, 2006, pp 313-328
International Journal of Scientific & Engineering Research, Volume 8, Issue 3, March-2017 ISSN 2229-5518
299
IJSER © 2017 http://www.ijser.org
IJSER

[14]Strasky, J., (2006). “Stress Ribbon and Cable Supported Pedestrian
Bridges”, Academy of Sciences of the Czech Republic, Brno, Czech
Republic.
[15] Strasky,J., (2008), “Stress Ribbon Pedestrian Bridges Supported or
Suspended on Arches”Chinese-Croatian joint colloquium, Long Arch
Bridges, Brijuni Islands, Croatia.
[16] Stavridis L., (2009) “Evaluation of static response in stress-ribbon
concrete pedestrian
bridges,” Structural Engineering and Mechanics, Vol. 34, No. 2 (2009) pp
213-229.
[17] Poon Y., (2009), “Optimization Of Span-To-Depth Ratios In High-
Strength Concrete Girder Bridges”, University of Toronto (2009).
[18] Strasky,J., (2010) ‘Stress Ribbon and Arch Pedestrian Bridges”, 6th
International Conference on Arch Bridges, Fuzhou, China.
[19] Sandovič G. and Juozapaitis A., (2012) “The analysis of the behaviour of
an innovative pedestrian steel bridge”. Procedia Engineering, Vol 40 ( 2012 )
pp 411 – 416
[20]Wang H., Qin S., Tan Y., (2012) “Analysis Of Wind Stability Of Cable-
Stayed Bridge With Single Cable Plane”, Journal of Mechanical Engineering
Science Vol 21 (2012) pp 22-24.
[21]Cacho-Perez M., Frechilla N., Diaz M. I. and Lorenzana A., (2013)
“Simplified mechanical model for a stress-ribbon monitorized footbridge.
Analytical and experimental results”, University of Valladolid.
[22] Sajad M. M. and Mukherjee R.(2013) “Wind Loads On Bridges Analysis
Of A Three Span Bridge Based On Theoretical Methods And Euro code 1”,
Royal Institute of Technology Department of Civil and Architectural
Engineering, Division of Structural Design and Bridges ,Stockholm, Sweden,
Master Thesis 385 (2013)
[23]Guidelines for the design of footbridges”, federation internationale du
béton (fib), Bulletin 32.
[24]Modifications for AASHTO LRFD Bridge Design Specifications to
Incorporate or Update the Guide Specifications for Design of Pedestrian
Bridges
[25]IRC 6 (2010) “Standard specification and code of practice for road
bridges section: II. Load and Stresses” Fifth Revision.
[26]IRC 18 (2000) “Design criteria for prestressed concrete road bridges Post-
tensioned concrete” Third Revision.
[27]IRC 103 (1988) “Guidelines for Pedestrian facilities” Fourth Revision.
[28]IRC 21 (2000) “Standard specification and code of practice for road
bridges section: III Cement concrete (plain and reinforcement)” Third
revision
International Journal of Scientific & Engineering Research, Volume 8, Issue 3, March-2017 ISSN 2229-5518
300
IJSER © 2017 http://www.ijser.org
IJSER