Comprehensive Vehicle Total Cost of Ownership (TCO) Framework
ANL/ESD-21/4
Comprehensive Total Cost of Ownership Quantification for Vehicles with Different Size Classes and Powertrains
Energy Systems Division
About Argonne National Laboratory
Argonne is a U.S. Department of Energy laboratory managed by UChicago Argonne, LLC
under contract DE-AC02-06CH11357. The Laboratory’s main facility is outside Chicago,
at 9700 South Cass Avenue, Lemont, Illinois 60439. For information about Argonne
and its pioneering science and technology programs, see www.anl.gov.
DOCUMENT AVAILABILITY
Online Access: U.S. Department of Energy (DOE) reports produced after 1991 and a growing
number of pre-1991 documents are available free at OSTI.GOV (http://www.osti.gov/),
a service of the US Dept. of Energy’s Office of Scientific and Technical Information.
Reports not in digital format may be purchased by the public
from the National Technical Information Service (NTIS):
U.S. Department of Commerce
National Technical Information Service
5301 Shawnee Road
Alexandria, VA 22312
www.ntis.gov
Phone: (800) 553-NTIS (6847) or (703) 605-6000
Fax: (703) 605-6900
Email: [email protected]
Reports not in digital format are available to DOE and DOE contractors
from the Office of Scientific and Technical Information (OSTI):
U.S. Department of Energy
Office of Scientific and Technical Information
P.O. Box 62
Oak Ridge, TN 37831-0062
www.osti.gov
Phone: (865) 576-8401
Fax: (865) 576-5728
Email: [email protected]
Disclaimer
This report was prepared as an account of work sponsored by an agency of the United States Government. Neither the United States
Government nor any agency thereof, nor UChicago Argonne, LLC, nor any of their employees or officers, makes any warranty, express
or implied, or assumes any legal liability or responsibility for the accuracy, completeness, or usefulness of any information, apparatus,
product, or process disclosed, or represents that its use would not infringe privately owned rights. Reference herein to any specific
commercial product, process, or service by trade name, trademark, manufacturer, or otherwise, does not necessarily constitute or
imply its endorsement, recommendation, or favoring by the United States Government or any agency thereof. The views and opinions
of document authors expressed herein do not necessarily state or reflect those of the United States Government or any agency thereof,
Argonne National Laboratory, or UChicago Argonne, LLC.

ANL/ESD-21/4
Comprehensive Total Cost of Ownership Quantification for Vehicles with Different Size Classes and Powertrains
by
Andrew Burnham1, David Gohlke1, Luke Rush1, Thomas Stephens1, Yan Zhou1, Mark A. Delucchi2, Alicia Birky3,
Chad Hunter3, Zhenhong Lin4, Shiqi Ou4, Fei Xie4, Camron Proctor5, Steven Wiryadinata5, Nawei Liu6, and Madhur
Boloor7 1 Energy Systems Division, Argonne National Laboratory 2 Lawrence Berkeley National Laboratory 3 National Renewable Energy Laboratory 4 Oak Ridge National Laboratory 5 Sandia National Laboratories 6 University of Tennessee 7 U.S. Department of Energy, Vehicle Technologies Office
April 2021

Erratum to accompany “Comprehensive Total Cost of Ownership Quantification for Vehicles with
Different Size Classes and Powertrains” (Argonne National Laboratory report ANL/ESD-21/4)
July 2021
After initial publication of this report, the authors were made aware of some minor typographical
errors and omissions. As these mistakes can potentially confuse the results, they have been corrected
in the present version.
In the executive summary on page xxiii, “HEV” (hybrid electric vehicle) was once written as
“BEV” (battery electric vehicle), contrary to the findings shown in the accompanying figure.
Tables B.5 and B.6 previously stated the incorrect all-electric ranges for the battery electric
vehicle and plug-in hybrid electric vehicle for the class 8 day cab tractor and class 4 delivery
truck, respectively. These ranges have been corrected. Additionally, two sentences were added
to Appendix B on page 143 to explicitly state the correctly modeled all-electric range for all
medium- and heavy-duty vehicles.
Several stakeholders have been added explicitly to the acknowledgments section.
iii
CONTENTS
ACKNOWLEDGMENTS ............................................................................................................ xii
LIST OF ACRONYMS ............................................................................................................... xiii
EXECUTIVE SUMMARY ........................................................................................................ xvii
1. INTRODUCTION ................................................................................................................... 1
2. TCO CALCULATION METHODOLOGY AND BACKGROUND ..................................... 6
2.1. Conceptual Framework for Vehicle Costs ..................................................................... 6
2.2. Review of TCO Literature .............................................................................................. 8
2.2.1. Highlights from Specific Studies ..................................................................... 10
2.3. Quantification of TCO .................................................................................................. 14
2.3.1. Financial Analysis ............................................................................................ 19
2.3.2. Analysis Timeframe and Survivability ............................................................. 23
2.3.3. Vehicle Travel and Mileage ............................................................................. 24
3. COST ELEMENT DATA AND ASSUMPTIONS ............................................................... 28
3.1. Data Source Summary .................................................................................................. 28
3.2. Vehicle .......................................................................................................................... 29
3.2.1. Vehicle Retail Prices ........................................................................................ 29
3.2.2. Vehicle Fuel Economy ..................................................................................... 35
3.2.3. Validation of Retail Price and Fuel Economy .................................................. 43
3.2.4. Vehicle Financing ............................................................................................. 46
3.2.5. Vehicle Cost / Depreciation ............................................................................. 47
3.3. Fuel Costs and Infrastructure ....................................................................................... 61
3.4. Insurance Cost .............................................................................................................. 63
3.4.1. Passenger Light-Duty Insurance ...................................................................... 63
3.4.2. Commercial Heavy-Duty and Light-Duty Insurance ....................................... 70
3.5. Maintenance and Repair Costs ..................................................................................... 71
3.5.1. Annual M&R Costs, LDV ................................................................................ 72
3.5.2. Per-Mile M&R Costs, LDV ............................................................................. 76
3.5.3. Maintenance Costs by Service Schedule, LDV ................................................ 81
3.5.4. Repair Costs, LDV ........................................................................................... 86
3.5.5. Maintenance and Repair Costs, MHDV ........................................................... 90
3.6. Taxes and Fees ............................................................................................................. 92
3.6.1. Taxes and Fees, LDV ....................................................................................... 93
3.6.2. Taxes and Fees, MHDV ................................................................................... 95
3.7. Costs and Considerations Specific to Commercial Vehicles ....................................... 95
3.7.1. Summary of Qualitative Workshop Findings ................................................... 96
3.7.2. Commercial Vehicle Priorities ......................................................................... 99
3.7.3. Key Cost Elements ......................................................................................... 101
4. RESULTS ............................................................................................................................ 108
4.1. Base Case ................................................................................................................... 108
4.2. Side Cases................................................................................................................... 114
iv
CONTENTS (CONT.)
4.2.1. Vehicle Technology Advancement ................................................................ 114
4.2.2. Current Vehicles ............................................................................................. 115
4.2.3. Vehicle Ownership Period.............................................................................. 116
4.2.4. Component Replacement ............................................................................... 117
4.2.5. Taxi Cabs ........................................................................................................ 118
4.2.6. Labor costs while Fueling .............................................................................. 119
4.3. Sensitivity Analysis .................................................................................................... 120
5. DISCUSSION AND CONCLUSIONS ............................................................................... 132
APPENDIX A: COMPARISON OF PRIVATE AND SOCIETAL TCO.................................. 135
APPENDIX B: TABULAR TCO AND LCOD DATA ............................................................. 143
APPENDIX C: ADDITIONAL SENSITIVITY ANALYSES ................................................... 160
REFERENCES ........................................................................................................................... 172
FIGURES
ES-1 Levelized cost of ownership of a model year 2025, small ICE SUV, and a
model year 2025, class 8 sleeper cab BEV ..................................................................... xviii
ES-2 Depreciation trends by powertrain and size class .............................................................. xx
ES-3 Annual premium for comprehensive and collision insurance by size class and
by powertrain ..................................................................................................................... xxi
ES-4 Per-mile maintenance costs by powertrain ....................................................................... xxii
ES-5 LCOD across powertrains for light-duty SUV, MY2025 ............................................... xxiv
ES-6 TCO and LCOD across MHDV vocations, MY2025 ...................................................... xxv
ES-7 TCO across vehicle lifetime for class 8 diesel truck and gasoline SUV ......................... xxvi
ES-8 TCO for small SUV and class 8 day cab from MY2020 to MY2050 ............................ xxvii
2.1 Left: Costs for driving medium SUV, data from AAA. Right: Costs for driving
class 8 tractor trailer, data from ATRI. .............................................................................. 13
2.2 Discounted cash flow graphic, MY2025 small SUV example ........................................... 16
2.3 Annual cost of ownership graphic, MY2025 small SUV example .................................... 17
2.4 Cost per mile as a function of vehicle age graphic, MY2025 small SUV
example .............................................................................................................................. 18
2.5 Cost of driving as a function of cumulative lifetime mileage, small SUV
example .............................................................................................................................. 18
2.6 Lifetime costs for operating a gasoline-powered MY2025 small SUV ............................. 19

v
FIGURES (CONT.)
2.7 Left: VMT schedules for LDV and medium-duty delivery vehicles. Right:
VMT schedules for heavy-duty vehicles. ........................................................................... 25
3.1 Cost modeling for Autonomie LDV for small SUV in MY2020 and MY2025................. 30
3.2 Cost modeling for Autonomie MDV in MY2020 and MY2025 ........................................ 31
3.3 Cost modeling for Autonomie HDV in MY2020 and MY2025 ........................................ 31
3.4 Fuel consumption rates for small SUV and pickup truck as modeled by
Autonomie for MY2020 and MY2025 ............................................................................... 37
3.5 Comparisons of weighted average fuel economies of luxury and non-luxury
LDVs .................................................................................................................................. 39
3.6 Fuel consumption rates for class 4 delivery truck and class 8 day-cab tractor
trailer truck as modeled by Autonomie for MY2020 and MY2025 ................................... 41
3.7 Mile per gallon variation in truck fuel economies with different driving cycles
and payload levels for Kenworth long haul tractors ........................................................... 42
3.8 Ton-mile per gallon variation in truck fuel economies with different driving
cycles and payload levels for Kenworth long haul tractors ................................................ 43
3.9 Average annual ARR by powertrain and market segment. Solid lines represent
luxury vehicles while dashed lines represent mass market vehicles. ................................. 52
3.10 Average annual ARR by powertrain and regulatory size class. Solid lines
represent cars while dashed lines represent light trucks. .................................................... 53
3.11 Size-class adjusted ARR for mass-market ICEV used as TCO input ................................ 55
3.12 Sample prediction interval sensitivity analysis: Mass-market BEV .................................. 57
3.13 Sample selection of maximum vehicle value ..................................................................... 58
3.14 Comparison between price datasets, by age: class 8 sleeper cab tractors .......................... 59
3.15 Sample effect of mileage on price: class 8 sleeper cab tractors ......................................... 60
3.16 Annual insurance rates by state for MY2015 Honda Accord EX for a 30-year
old single male with a good driving history ....................................................................... 64
3.17 National average liability insurance premium for light-duty vehicles ............................... 65
3.18 Annual premium for comprehensive and collision insurance for gasoline
vehicles plotted against MSRP ........................................................................................... 67
3.19 Annual premium for comprehensive and collision insurance for gasoline, HEV,
and BEV cars plotted against MSRP .................................................................................. 68
3.20 Consumer Expenditure Surveys 1984–2018 – Annual maintenance and repair
expenditures per vehicle ..................................................................................................... 72
3.21 Consumer Expenditure Surveys 2014–2018 – Detailed annual maintenance and
repair expenditures per vehicle ........................................................................................... 73
vi
FIGURES (CONT.)
3.22 Consumer Expenditure Survey 2012 – Detailed annual maintenance and repair
expenditures per vehicle by age ......................................................................................... 74
3.23 Annual maintenance and repair costs by age ..................................................................... 75
3.24 Per-mile maintenance and repair costs by age ................................................................... 77
3.25 Per-mile maintenance and repair costs by mileage interval ............................................... 78
3.26 Per-mile maintenance and repair costs by make and model over first 150,000
miles ................................................................................................................................... 79
3.27 Per-mile maintenance and repair costs by mileage interval and powertrain ...................... 80
3.28 Scheduled maintenance costs for ICEV, HEV, PHEV, and BEV ...................................... 83
3.29 Annual repair costs as a percentage of MSRP by vehicle age ........................................... 87
3.30 Average repair costs per mile for all vehicle types in year 5 plotted against
MSRP ................................................................................................................................. 88
3.31 Average repair costs per mile for all vehicle types in year 10 plotted against
MSRP ................................................................................................................................. 89
3.32 Diesel HDV per mile maintenance and repair costs by age ............................................... 91
3.33 Sales tax, registration fee, and documentation fee by state ................................................ 93
3.34 Consumer Expenditure Surveys 2014–2018 – Annual fee expenditures per
vehicle ................................................................................................................................ 94
3.35 Average freight truck costs by calendar year, inflation adjusted ..................................... 102
3.36 Hourly and per-mile compensation for drivers of different vehicle types. LTL:
less-than-truckload service; TL: truckload service; specialized: includes tankers
and flatbed carriers. Sources: ATRI, Glassdoor, Zip Recruiter, Indeed.com,
Payscale.com, and Neuvoo.com. ...................................................................................... 103
3.37 Time and energy shares of PTO and idling for utility trucks ........................................... 104
3.38 Operating weight distribution for class 7 and class 8 tractors .......................................... 105
3.39 Schematic diagram representing refueling costs .............................................................. 107
4.1 TCO and LCOD for small SUVs, MY2025 ..................................................................... 109
4.2 Comparison of LCOD for different LDV size classes of MY2025 conventional
gasoline vehicles, 12,000 miles per year .......................................................................... 110
4.3 TCO and LCOD for medium-duty and heavy-duty trucks ............................................... 111
4.4 LCOD comparison across powertrains for MY2025 long-haul tractor trailers ................ 112
4.5 LCOD comparison across powertrains for MY2025 day cab tractor trailers ................... 113
4.6 LCOD comparison across powertrains for MY2025 class 4 delivery trucks ................... 113
vii
FIGURES (CONT.)
4.7 LCOD for small SUV and class 8 sleeper cab from MY2020 to MY2050,
modeled using the Autonomie high technology progress case ........................................ 114
4.8 LCOD for class 8 sleeper cab and class 8 day cab from MY2020 to MY2050,
modeled using the Autonomie high technology progress case ........................................ 115
4.9 Average cost of driving across powertrain, small SUV sold in 2019 .............................. 116
4.10 Short-ownership LCOD analysis for small SUVs and class 8 sleeper cab
tractors in MY2025 .......................................................................................................... 117
4.11 Change in LCOD from major powertrain repair or replacement for small SUVs
in MY2025 ....................................................................................................................... 118
4.12 LCOD comparison across powertrains for MY2025 small SUV taxi .............................. 119
4.13 TCO for class 8 sleeper cab comparison of ICEV and different BEV charging
rates in MY2025 ............................................................................................................... 120
4.14 Tornado chart for LCOD of MY2025 small SUV BEV300 ............................................ 121
4.15 Tornado chart for LCOD of MY2025 small SUV ICEV and HEV ................................. 123
4.16 Tornado chart for LCOD of MY2025 sleeper cab ICEV, 10 year analysis
window ............................................................................................................................. 126
4.17 Tornado chart for LCOD of MY2025 sleeper cab HEV, 10 year analysis
window ............................................................................................................................. 127
4.18 Tornado chart for LCOD of MY2025 sleeper cab BEV, 10 year analysis
window ............................................................................................................................. 127
4.19 Tornado chart for LCOD of MY2025 class 8 day cab ICEV, 10 year analysis
window ............................................................................................................................. 128
4.20 Tornado chart for LCOD of MY2025 class 8 day cab HEV, 10 year analysis
window ............................................................................................................................. 129
4.21 Tornado chart for LCOD of MY2025 class 8 day cab BEV, 10 year analysis
window ............................................................................................................................. 129
4.22 Tornado chart for LCOD of MY2025 class 4 delivery ICEV, 10 year analysis
window ............................................................................................................................. 130
4.23 Tornado chart for LCOD of MY2025 class 4 delivery HEV, 10 year analysis
window ............................................................................................................................. 131
4.24 Tornado chart for LCOD of MY2025 class 4 delivery BEV, 10 year analysis
window ............................................................................................................................. 131
C.1 Tornado chart for LCOD of MY2025 small SUV ICEV, 5 year analysis
window ............................................................................................................................. 160
C.2 Tornado chart for LCOD of MY2025 small SUV HEV, 5 year analysis window ........... 161
C.3 Tornado chart for LCOD of MY2025 small SUV BEV, 5 year analysis window ........... 161

viii
FIGURES (CONT.)
C.5 Tornado chart for LCOD of MY2025 small SUV HEV, purchased used ........................ 163
C.6 Tornado chart for LCOD of MY2025 small SUV BEV, purchased used ........................ 163
C.7 Tornado chart for LCOD of a real-world small SUV ICEV, purchased in 2019 ............. 164
C.8 Tornado chart for LCOD of a real-world small SUV HEV, purchased in 2019 .............. 165
C.9 Tornado chart for LCOD of a real-world small SUV BEV300, purchased in
2019 .................................................................................................................................. 165
C.10 Tornado chart for LCOD of MY2025 class 4 delivery ICEV, 3 year analysis
window ............................................................................................................................. 166
C.11 Tornado chart for LCOD of MY2025 class 4 delivery HEV, 3 year analysis
window ............................................................................................................................. 167
C.12 Tornado chart for LCOD of MY2025 class 4 delivery BEV, 3 year analysis
window ............................................................................................................................. 167
C.13 Tornado chart for LCOD of MY2025 class 8 day cab ICEV, 3 year analysis
window ............................................................................................................................. 168
C.14 Tornado chart for LCOD of MY2025 class 8 day cab HEV, 3 year analysis
window ............................................................................................................................. 169
C.15 Tornado chart for LCOD of MY2025 class 8 day cab BEV, 3 year analysis
window ............................................................................................................................. 169
C.16 Tornado chart for LCOD of MY2025 sleeper cab ICEV, 3 year analysis
window ............................................................................................................................. 170
C.17 Tornado chart for LCOD of MY2025 sleeper cab HEV, 3 year analysis
window ............................................................................................................................. 171
C.18 Tornado chart for LCOD of MY2025 sleeper cab BEV, 3 year analysis window ........... 171
TABLES
ES-1 Study scope: cost components and other key parameters used in this study .................. xvii
ES-2 Repair cost scaling factors by powertrain and size class, relative to ICE car or
MHDV truck with same MSRP ..................................................................................... xxiii
1.1 Private passenger vehicle cost components quantified and vehicle size classes,
powertrains, and years modeled .......................................................................................... 1
1.2 Commercial vehicle cost components quantified and vehicle size classes,
powertrains, and years modeled .......................................................................................... 2
1.3 New knowledge of TCO cost components delivered by the present study ........................ 4
ix
TABLES (CONT.)
2.1 Cost elements and methodological comments for the private-quantitative,
private-qualitative, and societal-quantitative categories on lifetime cost of
motor vehicles ..................................................................................................................... 7
2.2a Summary of quality of studies reviewed ............................................................................ 8
2.2b Explanation of quality of studies reviewed ......................................................................... 9
2.2c List of studies with A1 or A1 ratings in three or more cost aspects ................................... 9
2.3 Discussion of research needs ............................................................................................ 10
2.4 Cost components and interdependencies .......................................................................... 15
2.5 Key economic parameters for financial analysis .............................................................. 22
2.6 Changes in VMT related to vehicle powertrain technology not accounted for
in this study that affect the costs but not the baseline benefits of travel ........................... 27
3.1 Cost modeling for Autonomie LDV for all size classes in MY2020 and
MY2025 ............................................................................................................................ 32
3.2 Cost modeling for Autonomie MHDV for all size classes in MY2020 and
MY2025 ............................................................................................................................ 32
3.3 Collected energy use data for MHDVs by powertrain technology and vehicle
descriptor........................................................................................................................... 36
3.4 Fuel economy for Autonomie LDV for all size classes in MY2020 and
MY2025 ............................................................................................................................ 38
3.5 Fuel economy for Autonomie MHDV for all size classes in MY2020 and
MY2025 (blanks not modeled) ......................................................................................... 41
3.6 Autonomie simulation/Real-world retail price comparison, percentage
difference of Autonomie modeling from real-world data ................................................. 45
3.7 Autonomie simulation/Real-world fuel economy comparison, percentage
difference of Autonomie modeling from real-world data ................................................. 45
3.8 Makes and models selected for depreciation analysis ...................................................... 50
3.9 Annual depreciation rates and first-year value adjustment by powertrain and
market segment ................................................................................................................. 54
3.10 Proportional differences (of average ARR) between size classes .................................... 54
3.11 Parameter values for effect of age and mileage of MHDV, by size class ........................ 60
3.12 2025 energy prices by type in natural units, $/gge, and $/dge .......................................... 61
3.13 Percentage of licensed drivers and insurance premiums by age ....................................... 66
3.14 Alternative Fuel Vehicle models and their ICEV counterparts ........................................ 69
3.15 Summary of insurance costs for LDVs ............................................................................. 70
3.16 Maintenance service schedule by powertrain ................................................................... 85
x
TABLES (CONT.)
3.17 Summary of repair cost multipliers by vehicle type and powertrain compared
to gasoline car on MSRP-basis ......................................................................................... 90
3.18 Summary of transit bus maintenance and repair cost multipliers ..................................... 92
3.19 Summary of tax and fee assumptions ............................................................................... 94
3.20 MHDV market segmentation and prioritization ............................................................. 100
3.21 Costs unique to commercial vehicles .............................................................................. 101
4.1 Input variables examined in LDV TCO sensitivity analysis .......................................... 122
4.2 Input variables examined in MHDV TCO sensitivity analysis ...................................... 125
A.1 Cost elements and parameters that vary by vehicle fuel or powertrain .......................... 136
A.2 Detailed description of costs related to motor vehicle use ............................................. 141
B.1 Small SUV, MY2025; Figures 4.1 and ES-5 .................................................................. 144
B.2 Gasoline LDV, MY2025; Figure 4.2 .............................................................................. 144
B.3 Class 8 diesel truck, MY2025; Figure 4.3 and ES-6....................................................... 145
B.4 Class 8 sleeper cab tractor, MY2025; Figure 4.4 ............................................................ 145
B.5 Class 8 day cab tractor, MY2025; Figure 4.5 ................................................................. 146
B.6 Class 4 delivery truck, MY2025; Figure 4.6................................................................... 146
B.7a Small SUV, gasoline HEV, MY2020–2050; Figures 4.7 and ES-8 ............................... 147
B.7b Small SUV, electric BEV300, MY2020–2050; Figures 4.7 and ES-8 ........................... 147
B.7c Small SUV, hydrogen FCEV, MY2020–2050; Figures 4.7 and ES-8............................ 148
B.7d Small SUV, gasoline ICEV, MY2020–2050; Figures 4.7 and ES-8 .............................. 148
B.7e Small SUV, gasoline/electric PHEV50, MY2020–2050; Figures 4.7 and ES-8 ............ 149
B.7f Class 4 delivery truck, diesel HEV, MY2020–2050; Figure 4.7 .................................... 149
B.7g Class 4 delivery truck, electric BEV150, MY2020–2050; Figure 4.7 ............................ 150
B.7h Class 4 delivery truck, hydrogen FCEV, MY2020–2050; Figure 4.7 ............................ 150
B.7i Class 4 delivery truck, diesel ICEV, MY2020–2050; Figure 4.7 ................................... 151
B.7j Class 4 delivery truck, diesel/electric PHEV75, MY2020–2050; Figure 4.7 ................. 151
B.8a Class 8 sleeper cab tractor, diesel HEV, MY2020–2050; Figure 4.8 ............................. 152
B.8b Class 8 sleeper cab tractor, electric BEV500, MY2020–2050; Figure 4.8 ..................... 152
B.8c Class 8 sleeper cab tractor, hydrogen FCEV, MY2020–2050; Figure 4.8 ..................... 153
B.8d Class 8 sleeper cab tractor, diesel ICEV, MY2020–2050; Figure 4.8 ............................ 153
B.8e Class 8 sleeper cab tractor, diesel/electric PHEV250, MY2020–2050;
Figure 4.8 ........................................................................................................................ 154

xi
TABLES (CONT.)
B.8f Class 8 day cab tractor, diesel HEV, MY2020–2050; Figures 4.8 and ES-8 ................. 154
B.8g Class 8 day cab tractor, electric BEV250, MY2020–2050;
Figures 4.8 and ES-8 ....................................................................................................... 155
B.8h Class 8 day cab tractor, hydrogen FCEV, MY2020–2050;
Figures 4.8 and ES-8 ....................................................................................................... 155
B.8i Class 8 day cab tractor, diesel ICEV, MY2020–2050; Figures 4.8 and ES-8 ................ 156
B.8j Class 8 day cab tractor, diesel/electric PHEV125, MY2020–2050;
Figures 4.8 and ES-8 ....................................................................................................... 156
B.9 Small SUV, sales-weighted U.S. sales in 2019; Figure 4.9 ............................................ 157
B.10a Small SUV, 5-year ownership, MY2025; Figure 4.10 ................................................... 157
B.10b Class 8 sleeper cab tractor, 3-year ownership, MY2025; Figure 4.10 ............................ 158
B.11 Small SUV with major component replacement, MY2025; Figure 4.11 ....................... 158
B.12 Small SUV taxicab, MY2025; Figure 4.12 ..................................................................... 159
B.13 Class 8 sleeper cab tractor with fueling time costs, MY2025; Figure 4.13 .................... 159

xii
ACKNOWLEDGMENTS
This research was supported by the Vehicle Technologies Office in the Office of Energy
Efficiency and Renewable Energy at the U.S. Department of Energy, and the authors express
their thanks to VTO, and in particular Jacob Ward, Raphael Isaac, and Mark Smith, for guidance
and helpful discussion. The authors thank members of the U.S. DRIVE government-industry
partnership Integrated Systems Analysis Technical Team for insightful discussions. The authors
also thank attendees and panelists of the Total Cost of Ownership workshops for medium- and
heavy-duty vehicles, held in April 2020, for their valuable insights and perspectives. In
particular, the authors would like to thank Mike Tunnell (American Transportation Research
Institute), Mike Roeth (North American Council for Freight Efficiency), Scott Phillippi (UPS),
Dawn Fenton (Volvo Group NA), Alan Mace (Ballard Power Systems), and Randal Kaufman
(Black & Veatch) for being panelists. The authors especially thank Sandra Loi of NREL for her
invaluable assistance in reorganizing and hosting the workshops as virtual events after the
implementation of nationwide travel restrictions due to COVID-19. The authors also thank
Douglas Cheung and Kenneth Levin of Edmunds, Chris Harto of Consumer Reports, Paul Milner
of Utilimarc, Bob Boundy and John Thomas of Oak Ridge National Laboratory, and Anant Vyas
of Argonne National Laboratory for helpful discussions.
This report was prepared as an account of work sponsored by an agency of the United
States government. Neither the United States government nor any agency thereof, nor any of
their employees, makes any warranty, express or implied, or assumes any legal liability or
responsibility for the accuracy, completeness, or usefulness of any information, apparatus,
product, or process disclosed or represents that its use would not infringe privately owned rights.
Reference herein to any specific commercial product, process, or service by trade name,
trademark, manufacturer, or otherwise does not necessarily constitute or imply its endorsement,
recommendation, or favoring by the United States government or any agency thereof. The views
and opinions of authors expressed herein do not necessarily state or reflect those of the United
States government or any agency thereof.
xiii
LIST OF ACRONYMS
AAA Automobile Association of America
AEO Annual Energy Outlook
AFDC Alternative Fuel Data Center
AFV alternative fuel vehicle
APR annual percentage rate
APU auxiliary power unit
ARR adjusted retention rate
ATRI American Transportation Research Institute
AVCEM Advanced Vehicle Cost and Energy-use Model
BEA Bureau of Economic Analysis
BEV battery electric vehicle
BLS Bureau of Labor Statistics
CARB California Air Resources Board
C&C comprehensive and collision
CD charge depleting
CE Consumer Expenditures
CI compression ignition
CNGV compressed natural gas vehicle
CPI consumer price index
CR Consumer Reports
CS charge sustaining
dge diesel-gallon equivalent
DOE Department of Energy
DPF diesel particulate filter
EIA Energy Information Administration
EPA Environmental Protection Agency
EPRI Electric Power Research Institute
EVSE electric vehicle supply equipment
FCEV fuel cell electric vehicle
FET federal excise tax
FRB Federal Reserve Board
FRIA final regulatory impact analysis
GDP gross domestic product
gge gasoline-gallon equivalent
GVWR gross vehicle weight rating
HDV heavy-duty vehicle
HEV hybrid electric vehicle
xiv
HFTO Hydrogen and Fuel Cell Technologies Office
HOS hours of service
HVUT Heavy Vehicle Use Tax
ICEV internal combustion engine vehicle
IPD implicit price deflator
IRS Internal Revenue Service
ISG integrated starter generator
KBB Kelley Blue Book
LCOD levelized cost of driving
LDV light-duty vehicle
LRR low rolling resistance
LTL less-than-truckload
MHDV medium-duty vehicle
MHDV medium- and heavy-duty vehicles
MPG miles per gallon
mpgge miles per gasoline-gallon equivalent
M&R maintenance and repair
MSRP manufacturer suggested retail price
MY model year
NADA National Automobile Dealers Association
NAIC National Association of Insurance Commissioners
NAS National Academies of Science
NHTS National Household Travel Survey
NHTSA National Highway Traffic Safety Administration
NIPA National Income Product Accounts
NRC National Research Council
NREL National Renewable Energy Laboratory
OEM original equipment manufacturer
PEV plug-in electric vehicles
PHEV plug-in hybrid electric vehicles
PHIS public highway infrastructure and services
PTO power take-off
RIA regulatory impact analysis
RPE retail price equivalent
SAFE Safer Affordable Fuel-Efficient Vehicles rule
SI spark ignition
SUV sport utility vehicle
SWA sales-weighted average

xv
TCO total cost of ownership
TL truckload
TMV True Market Value
TRB Transportation Research Board
VIUS Vehicle Inventory Use Survey
VMT vehicle miles traveled
VTO Vehicle Technologies Office

xvi
This page left intentionally blank.

xvii
EXECUTIVE SUMMARY
In order to accurately compare the costs of two vehicles, the total cost of ownership
(TCO) should consist of all costs related to both purchasing and operating the vehicle. This TCO
analysis builds on previous work to provide a comprehensive perspective of all relevant vehicle
costs of ownership. In this report, we present what we believe to be the most comprehensive
explicit financial analysis of the costs that will be incurred by a vehicle owner. This study
considers vehicle cost and depreciation, financing, fuel costs, insurance costs, maintenance and
repair costs, taxes and fees, and other operational costs to formulate a holistic total cost of
ownership and operation of multiple different vehicles. For each of these cost parameters that
together constitute a comprehensive TCO, extensive literature review and data analysis were
performed to find representative values in order to build a holistic TCO for vehicles of all size
classes. The light- and heavy-duty vehicles selected for analysis in this report are representative
of those that are on the road today and expected to be available in the future. Table ES-1
summarizes the main parameters in this study, including the cost components which comprise
TCO, the sizes and vocations of vehicles which are analyzed, the powertrains of these vehicles,
and the model year for analysis of both current and future vehicles.
TABLE ES-1 Study scope: cost components and other key parameters used in this study
Cost Components Sizes and Vocations Powertrains
Purchase Cost Compact Sedan Internal Combustion Engine
Depreciation Midsize Sedan Hybrid Electric Vehicle
Financing Small Sport Utility Vehicle Plug-in Hybrid Electric Vehicle
Fuel Large Sport Utility Vehicle Fuel Cell Electric Vehicle
Insurance Pickup Truck Battery Electric Vehicle
Maintenance Class 4 Delivery
Repair Class 6 Delivery Timeframe
Taxes Class 8 Bus 2020
Registration Fees Class 8 Refuse 2025
Tolls and Parking Class 8 Vocational 2030
Payload Capacity Class 8 Tractor – Day Cab 2035
Labor Class 8 Tractor – Sleeper Cab 2050
Previous analyses of TCO, particularly those dealing with alternative fuel vehicles
(AFVs), have often focused on the purchase cost and the fuel cost. While these are two of the
most important factors making up the cost of the vehicle, we find sizeable variations in other
operational costs across powertrains, size classes, and usage parameters. We use vehicles
modeled in Autonomie to estimate vehicle costs and fuel economy along with fuel price
projections from the Energy Information Administration (EIA), and focus on developing
internally consistent estimates for other relevant cost parameters. Important additive analyses in

xviii
this study include systematic analysis of vehicle depreciation, in-depth examination of insurance
premium costs, comprehensive maintenance and repair estimates, analysis of all relevant taxes
and fees, and considerations of specific costs applicable to commercial vehicles. This study,
which considers these additional cost components, provides a more holistic and comprehensive
perspective of TCO for a wider range of vehicle sizes, types, and vocations than have previously
been analyzed.
TCO can be presented in aggregate terms over the entire span of the analysis timeframe,
on an annualized basis, or on a per-mile basis as a levelized cost of driving (LCOD). Figure ES-1
shows the discounted lifetime costs of owning and operating two representative vehicles: a small
sport utility vehicle (SUV) with a gasoline-fueled internal combustion engine (ICE) for 15 years
and a heavy-duty battery electric truck (BEV) for 10 years in model year (MY) 2025. Many of
our cost components, including vehicle cost and depreciation, financing, taxes, insurance, and
repair, scale with manufacturer suggested retail price (MSRP). As such, all of these cost
components will continue to decrease in the future as retail prices for AFVs are projected to
decrease, contributing to significantly more competitive TCOs.
FIGURE ES-1 Levelized cost of ownership of a model year 2025, small ICE SUV (left), and a
model year 2025, class 8 sleeper cab BEV (right)
To populate the data for these graphics, we undertook a thorough literature exploration on
each of the cost components listed in Table ES-1. The following bullet points summarize our prior
knowledge for the major additive cost components in our analysis as well as the new review,
analysis and findings of our study which identify and fill what were previously gaps in our
understanding of TCO, for both light-duty vehicles (LDV) and medium- and heavy-duty vehicles
(MHDV) as well.
$0.00
$0.05
$0.10
$0.15
$0.20
$0.25
$0.30
$0.35
$0.40
$0.45
$0.50
Per-Mile Cost of Ownership, Gasoline ICE, Small SUV, MY2025
Tax & fees
Repair
Maintenance
Insurance
Fuel
Financing
Vehicle
$0.00
$0.40
$0.80
$1.20
$1.60
$2.00
$2.40
Per-Mile Cost of Ownership, BEV, Tractor - Sleeper, MY2025
Labor
Payload
Tax & fees
M&R
Insurance
Fuel
Financing
Vehicle

xix
Depreciation
New analysis: Systematic analysis of depreciation by powertrain (LDVs), development of
multi-variable HDV depreciation model.
Key findings: Cars depreciate faster than light trucks. MY13-16 electric vehicles have a
greater depreciation rate than newer PEVs.
Insurance
New analysis: In-depth analysis of liability, comprehensive and collision insurance costs
for LDVs by powertrain for selected size classes, development of simple MHDV
insurance cost model from several sources for a range of vocations.
Key findings: LDV insurance costs show comparable costs for different powertrains,
lower costs for larger size classes. MHDV insurance costs vary significantly by vocation.
Maintenance and Repair (M&R)
New analysis: Systematic analysis of LDV maintenance and repair costs: maintenance
schedule for LDVs by powertrain for selected size classes, model for LDV repair costs by
powertrain for selected size classes. Developed estimates for MHDV M&R costs.
Key findings: Electric and electrified powertrains have lower maintenance and repair
costs than ICE powertrains for all vehicle sizes, relative to vehicle price. MHDV M&R
costs depend heavily on vocation and duty cycle.
Taxes, fees, parking, tolls, etc.
New analysis: Development of consistent costs for both LDVs and MHDVs by size class
and powertrain, covering a comprehensive range of relevant taxes and fee-related costs.
Key findings: LDV taxes and fees are comparable across powertrain types and size
classes; marginally higher registration fees for AFVs. MHDV costs depend on the
vocation, weight rating, and state.
Costs unique to commercial vehicles
New analysis: Models developed to estimate labor costs of BEV charging and heavy-duty
payload capacity costs.
Key findings: Many vehicles would be affected by additional battery weight, reducing the
available payload capacity, and this cost can be substantial. BEV charging can be time-
consuming; labor rates can cause this cost to dominate TCO. Auxiliary Power Units to
minimize idling are cost effective ways to minimize fuel consumption.
Financial analysis
New analysis: Examination of discount rates, inflation rates, and loan terms.
Key findings: Real loan terms of 4% for 5.25 years are appropriate for analysis along
with a 1.2% discount rate for households, 3% for businesses.
Our study builds on previous work to provide a more comprehensive analysis of
depreciation trends based on various vehicle attributes using resale values for a larger number of
makes and models than previously investigated. We analyzed residual value of 98 vehicle
models across a variety of powertrain types, size classes, and other characteristics for
MYs 2013–2019 to derive a systematic model of LDV depreciation trends based on key
xx
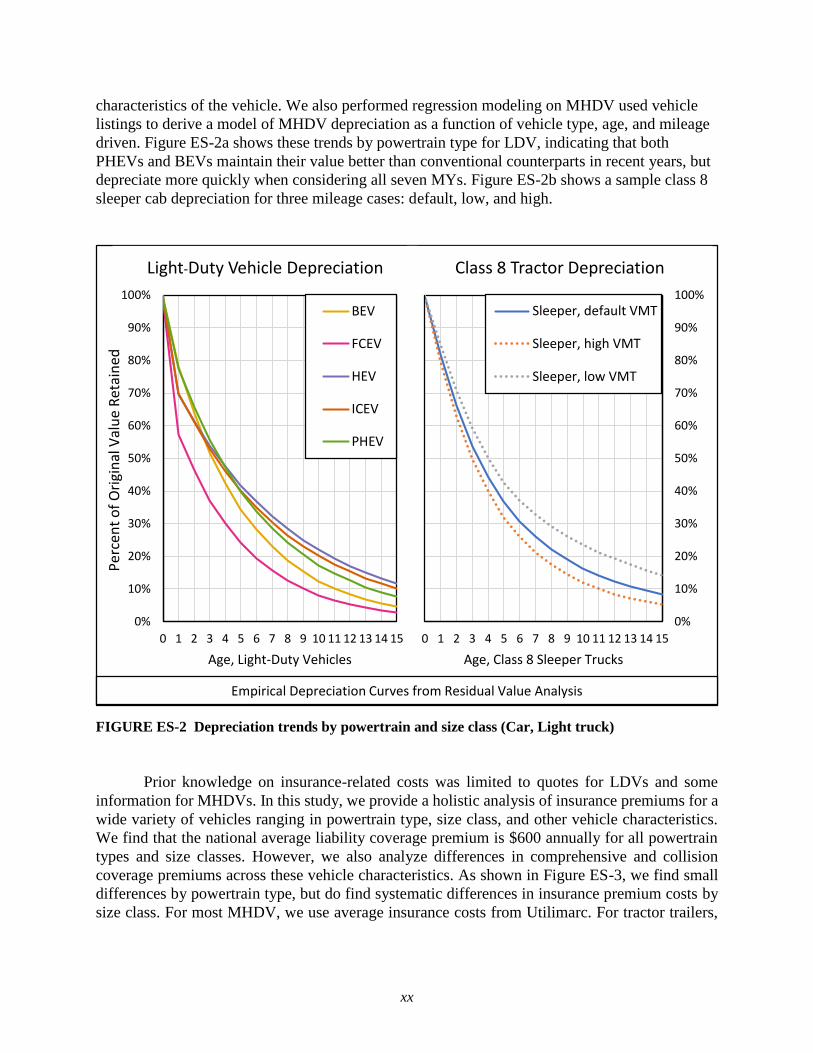
characteristics of the vehicle. We also performed regression modeling on MHDV used vehicle
listings to derive a model of MHDV depreciation as a function of vehicle type, age, and mileage
driven. Figure ES-2a shows these trends by powertrain type for LDV, indicating that both
PHEVs and BEVs maintain their value better than conventional counterparts in recent years, but
depreciate more quickly when considering all seven MYs. Figure ES-2b shows a sample class 8
sleeper cab depreciation for three mileage cases: default, low, and high.
FIGURE ES-2 Depreciation trends by powertrain and size class (Car, Light truck)
Prior knowledge on insurance-related costs was limited to quotes for LDVs and some
information for MHDVs. In this study, we provide a holistic analysis of insurance premiums for a
wide variety of vehicles ranging in powertrain type, size class, and other vehicle characteristics.
We find that the national average liability coverage premium is $600 annually for all powertrain
types and size classes. However, we also analyze differences in comprehensive and collision
coverage premiums across these vehicle characteristics. As shown in Figure ES-3, we find small
differences by powertrain type, but do find systematic differences in insurance premium costs by
size class. For most MHDV, we use average insurance costs from Utilimarc. For tractor trailers,
0%
10%
20%
30%
40%
50%
60%
70%
80%
90%
100%
0 1 2 3 4 5 6 7 8 9 10 11 12 13 14 15
Age, Light-Duty Vehicles
Light-Duty Vehicle Depreciation
BEV
FCEV
HEV
ICEV
PHEV
0%
10%
20%
30%
40%
50%
60%
70%
80%
90%
100%
0 1 2 3 4 5 6 7 8 9 10 11 12 13 14 15
Age, Class 8 Sleeper Trucks
Class 8 Tractor Depreciation
Sleeper, default VMT
Sleeper, high VMT
Sleeper, low VMT
Per
cen
to
f O
rigi
nal
Val
ue
Ret
ain
ed
Empirical Depreciation Curves from Residual Value Analysis

xxi
we supplement average liability insurance costs from ATRI with information about physical
damage insurance which exhibit differences by vehicle residual value (and thus powertrain).
FIGURE ES-3 Annual premium for comprehensive and collision insurance by size class and by
powertrain
Previous TCO studies largely omitted consideration of maintenance and repair (M&R)
costs or used estimates which were assumption-based. Our TCO also includes a comprehensive
analysis of M&R cost data for both LDVs and MHDVs. In addition to reviewing a wide variety
of literature on combined M&R costs, we construct a generalized maintenance service schedule
for each of the powertrain types. Many services have different schedules for the different
powertrains (14 of the 24 in Figure ES-4, indicated by asterisks), as advanced powertrains can
either extend service intervals (e.g. spark plugs for HEVs and PHEVs) or eliminate the service
(e.g. oil changes for BEVs). We find that AFVs, especially BEVs, systematically have lower
maintenance costs than ICEVs, as illustrated by Figure ES-4.
Gas Car = 0.0089x + 221.42
HEV Car = 0.0103x + 182.77
BEV Car = 0.0074x + 258.11
$0
$200
$400
$600
$800
$1,000
$1,200
$1,400
$0 $20k $40k $60k $80k $100k
MSRP, Cars
Powertrain Correlation
Gasoline
HEV
BEV
Car = 0.0089x + 221.42
SUV = 0.0046x + 241.39
PUT = 0.0059x + 206.42
0
200
400
600
800
1000
1200
1400
$0 $20k $40k $60k $80k $100k
MSRP, Gasoline Vehicles
Size Class Correlation
Car
SUV
PUT
An
nu
al P
rem
ium
Comprehensive & Collision - $500 deductible

xxii
FIGURE ES-4 Per-mile maintenance costs by powertrain
(*Service intervals that vary by powertrain)
Our analysis also included in-depth examination and modeling of repair cost data for
real-world vehicles for a variety of powertrain types and size classes. We find that repair cost is
an increasing exponential function of MSRP and varies significantly by vehicle characteristics;
scaling factors for the powertrain type and size class of the vehicle of interest are shown in
Table ES-2. The percent in each cell indicates the ratio of the repair costs for a vehicle with the
given size class and powertrain to the repair costs of an ICE car with the same MSRP. Larger
vehicles and AFVs both systematically tend to have lower repair costs as a percentage of MSRP.
For MHDV, no size class dependence was found, but a difference in M&R costs by powertrain
was observed, shown in the final row of Table ES-2.
$0.101
$0.094 $0.090
$0.061
$0.000
$0.010
$0.020
$0.030
$0.040
$0.050
$0.060
$0.070
$0.080
$0.090
$0.100
$0.110
ICEV HEV PHEV BEV
Mai
nte
nan
ce C
ost
pe
r M
ileScheduled LDV Maintenance Costs
Transmission Service* Spark Plugs* Oxygen Sensor* Timing Belt* Fuel Filter* Engine Air Filter* Oil Filter* Cabin Air Filter Engine Coolant* EV Battery Coolant* Brake Fluid Engine Oil* Brake Rotors* Brake Calipers* Brake Pads* Shocks and Struts Tire Rotation Tires Replaced HVAC Service Headlight Bulbs Accessory Drive Belt* Wiper Blades Starter Battery Multi-Point Inspection

xxiii
TABLE ES-2 Repair cost scaling factors by powertrain and size
class, relative to ICE car or MHDV truck with same MSRP
LDV ICEV HEV PHEV BEV / FCEV
Car 100% 89% 86% 67%
SUV 91% 81% 78% 61%
Pickup 70% 62% 60% 47%
MHDV 100% 87% 83% 60%
While information was previously available on taxes, fees, and other miscellaneous costs
such as parking, tolls, etc., prior TCO work did not consistently synthesize or include these data.
We analyzed the most important tax- and fee-related expenses for different powertrains, size
classes, and states of purchase and registration. We find little variation in taxes and fees across
different powertrain types, though find that this cost component is not insignificant in the TCO.
Prior TCO work has largely focused on LDVs, leaving a lack of thorough analysis of
TCO for MHDVs. In addition to collecting and analyzing the available data for MHDVs for each
of the above components, we also examine several cost components specific to these commercial
vehicles that are important to a comprehensive analysis of MHDV TCO. We developed models
to quantify the value of payload capacity loss resulting from heavy batteries, which can increase
total TCO by over 10% for large batteries. We also explore labor costs, and particularly labor
costs incurred during BEV charging. If vehicle fueling qualifies as working, the driver could
spend more time charging than driving, causing the TCO for BEVs to increase dramatically.
The above results demonstrate the most important new knowledge in each of the additive
cost components of our comprehensive and holistic TCO. We then aggregate each of the cost
components in Table ES-1 to calculate a lifetime TCO for comparison across vehicles of
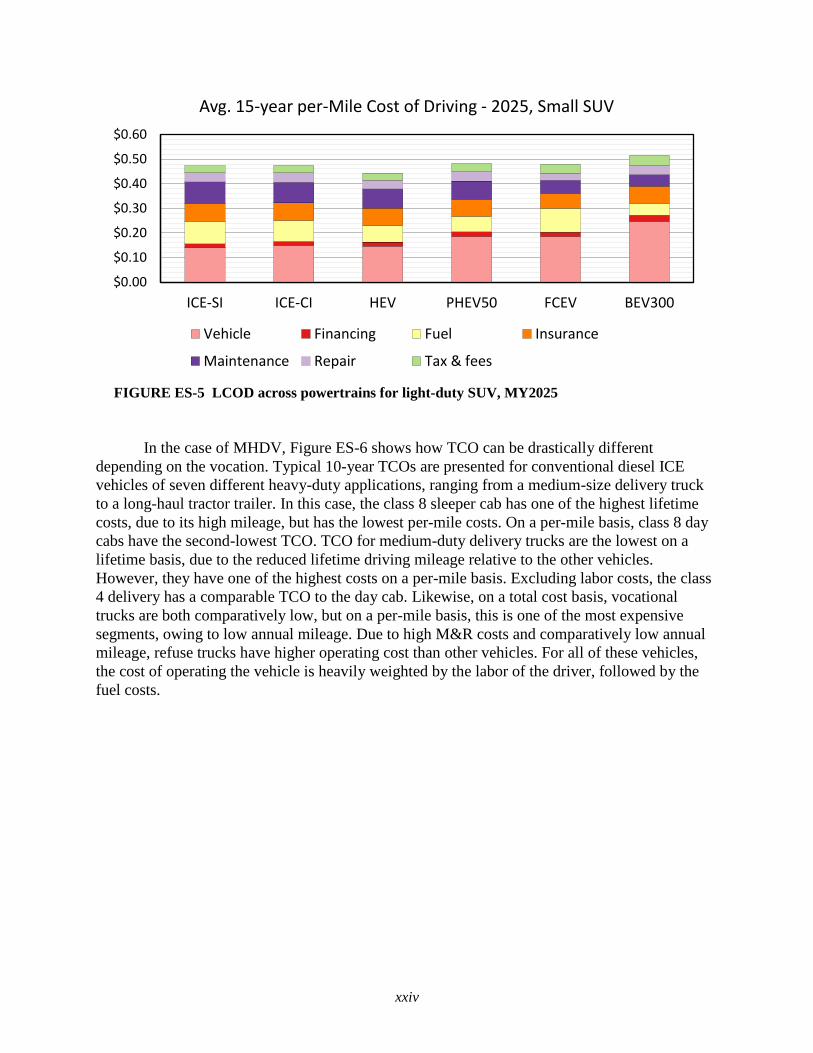
different types and attributes. Figure ES-5 shows TCO results from this study comparing the
LCOD of six different powertrains for a small SUV in 2025, modeled using Autonomie. Based
on the assumptions chosen, the hybrid electric vehicle (HEV) has the lowest cost, followed by
the conventional gasoline-fueled spark-ignition internal combustion engine (ICE-SI). The fuel
cell electric vehicle (FCEV), the diesel-fueled compression-ignition internal combustion engine
(ICE-CI) vehicle, and the plug-in hybrid electric vehicle (PHEV) have similar costs, while the
BEV is the most expensive. The lower operating cost (especially fuel and maintenance) is not
sufficient to offset the higher incremental cost of purchasing the BEV. For the non-combustion
vehicles, the cost of ownership is high due to batteries (for plug-in electric vehicles) or the cost
of hydrogen fuel for fuel cell electric vehicles (FCEV).
xxiv
FIGURE ES-5 LCOD across powertrains for light-duty SUV, MY2025
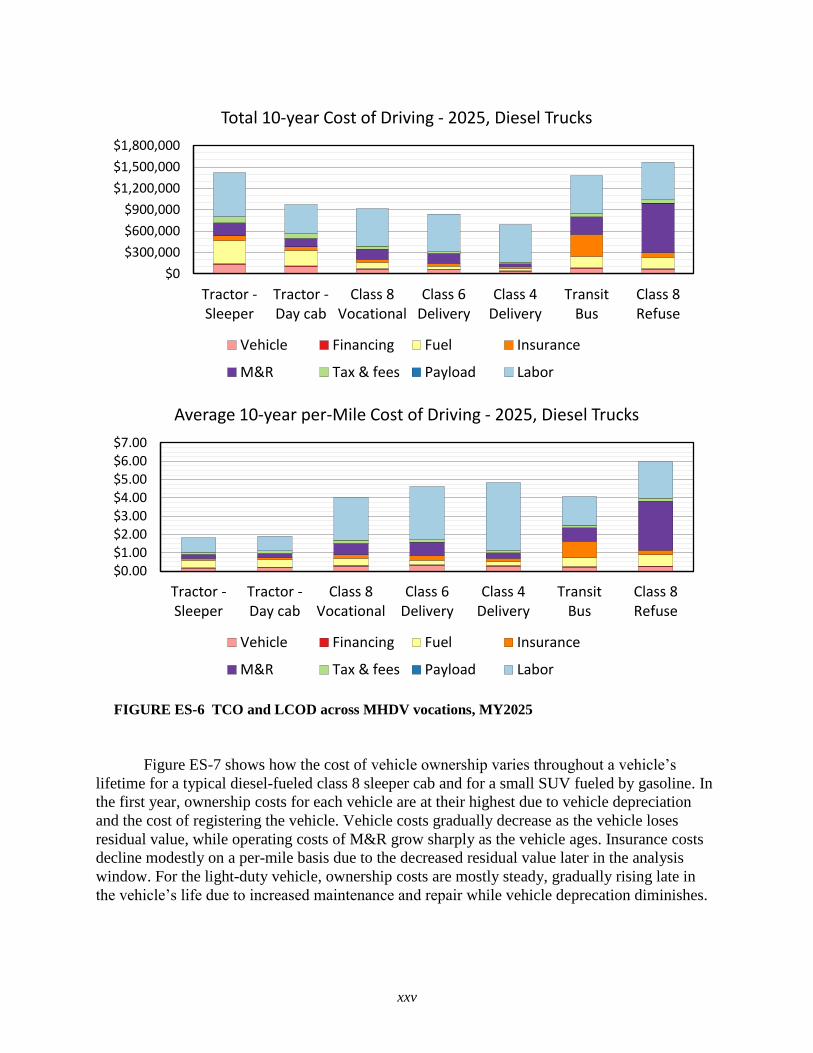
In the case of MHDV, Figure ES-6 shows how TCO can be drastically different
depending on the vocation. Typical 10-year TCOs are presented for conventional diesel ICE
vehicles of seven different heavy-duty applications, ranging from a medium-size delivery truck
to a long-haul tractor trailer. In this case, the class 8 sleeper cab has one of the highest lifetime
costs, due to its high mileage, but has the lowest per-mile costs. On a per-mile basis, class 8 day
cabs have the second-lowest TCO. TCO for medium-duty delivery trucks are the lowest on a
lifetime basis, due to the reduced lifetime driving mileage relative to the other vehicles.
However, they have one of the highest costs on a per-mile basis. Excluding labor costs, the class
4 delivery has a comparable TCO to the day cab. Likewise, on a total cost basis, vocational
trucks are both comparatively low, but on a per-mile basis, this is one of the most expensive
segments, owing to low annual mileage. Due to high M&R costs and comparatively low annual
mileage, refuse trucks have higher operating cost than other vehicles. For all of these vehicles,
the cost of operating the vehicle is heavily weighted by the labor of the driver, followed by the
fuel costs.
$0.00
$0.10
$0.20
$0.30
$0.40
$0.50
$0.60
ICE-SI ICE-CI HEV PHEV50 FCEV BEV300
Avg. 15-year per-Mile Cost of Driving - 2025, Small SUV
Vehicle Financing Fuel Insurance
Maintenance Repair Tax & fees
xxv
FIGURE ES-6 TCO and LCOD across MHDV vocations, MY2025
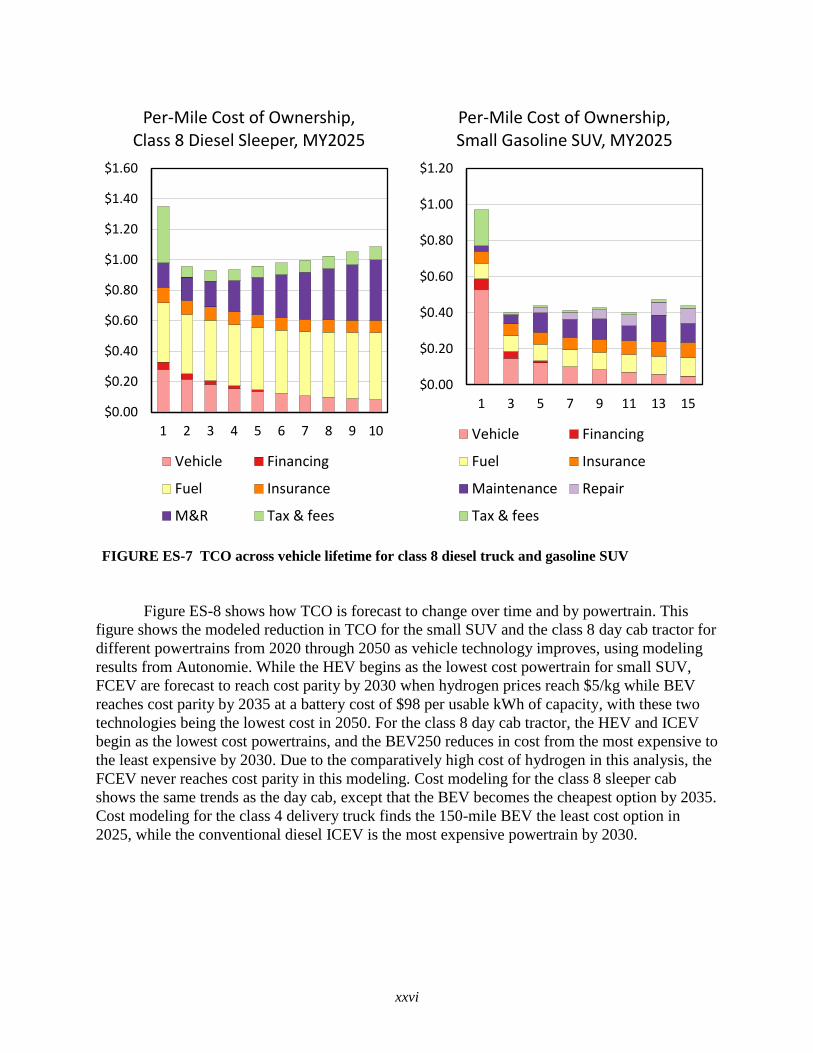
Figure ES-7 shows how the cost of vehicle ownership varies throughout a vehicle’s
lifetime for a typical diesel-fueled class 8 sleeper cab and for a small SUV fueled by gasoline. In
the first year, ownership costs for each vehicle are at their highest due to vehicle depreciation
and the cost of registering the vehicle. Vehicle costs gradually decrease as the vehicle loses
residual value, while operating costs of M&R grow sharply as the vehicle ages. Insurance costs
decline modestly on a per-mile basis due to the decreased residual value later in the analysis
window. For the light-duty vehicle, ownership costs are mostly steady, gradually rising late in
the vehicle’s life due to increased maintenance and repair while vehicle deprecation diminishes.
$0
$300,000
$600,000
$900,000
$1,200,000
$1,500,000
$1,800,000
Tractor -Sleeper
Tractor -Day cab
Class 8Vocational
Class 6Delivery
Class 4Delivery
TransitBus
Class 8Refuse
Total 10-year Cost of Driving - 2025, Diesel Trucks
Vehicle Financing Fuel Insurance
M&R Tax & fees Payload Labor
$0.00$1.00$2.00$3.00$4.00$5.00$6.00$7.00
Tractor -Sleeper
Tractor -Day cab
Class 8Vocational
Class 6Delivery
Class 4Delivery
TransitBus
Class 8Refuse
Average 10-year per-Mile Cost of Driving - 2025, Diesel Trucks
Vehicle Financing Fuel Insurance
M&R Tax & fees Payload Labor
xxvi
FIGURE ES-7 TCO across vehicle lifetime for class 8 diesel truck and gasoline SUV
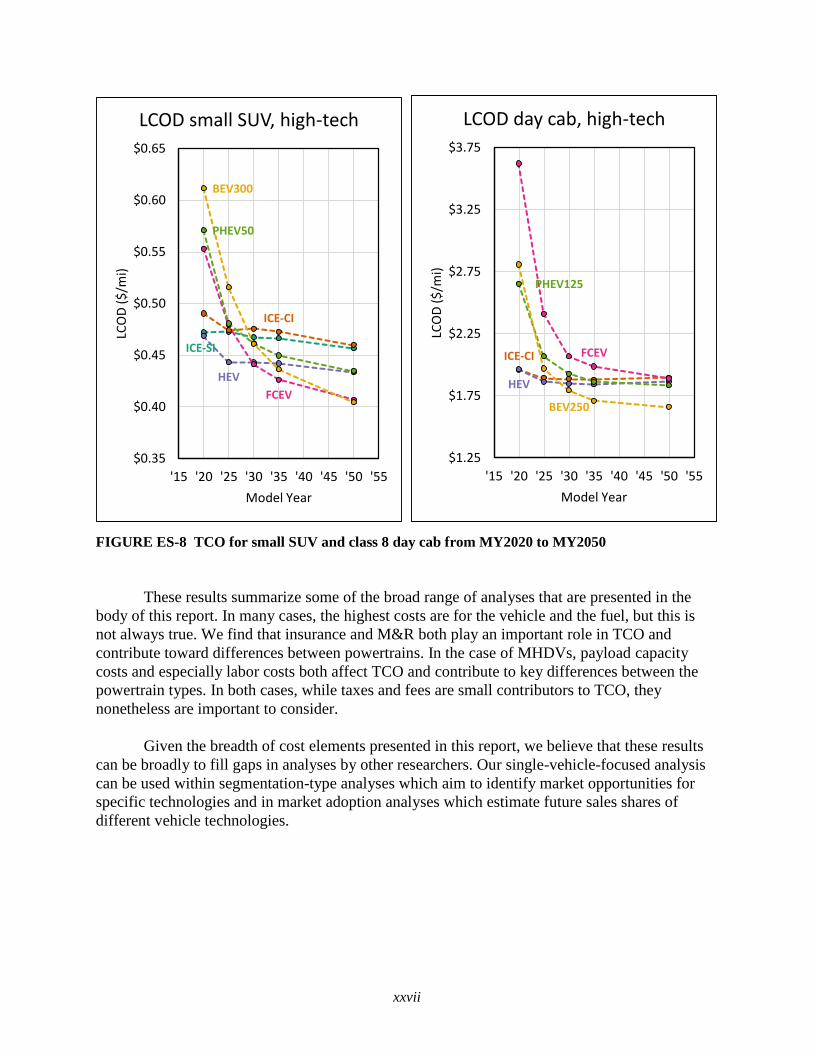
Figure ES-8 shows how TCO is forecast to change over time and by powertrain. This
figure shows the modeled reduction in TCO for the small SUV and the class 8 day cab tractor for
different powertrains from 2020 through 2050 as vehicle technology improves, using modeling
results from Autonomie. While the HEV begins as the lowest cost powertrain for small SUV,
FCEV are forecast to reach cost parity by 2030 when hydrogen prices reach $5/kg while BEV
reaches cost parity by 2035 at a battery cost of $98 per usable kWh of capacity, with these two
technologies being the lowest cost in 2050. For the class 8 day cab tractor, the HEV and ICEV
begin as the lowest cost powertrains, and the BEV250 reduces in cost from the most expensive to
the least expensive by 2030. Due to the comparatively high cost of hydrogen in this analysis, the
FCEV never reaches cost parity in this modeling. Cost modeling for the class 8 sleeper cab
shows the same trends as the day cab, except that the BEV becomes the cheapest option by 2035.
Cost modeling for the class 4 delivery truck finds the 150-mile BEV the least cost option in
2025, while the conventional diesel ICEV is the most expensive powertrain by 2030.
$0.00
$0.20
$0.40
$0.60
$0.80
$1.00
$1.20
$1.40
$1.60
1 2 3 4 5 6 7 8 9 10
Per-Mile Cost of Ownership, Class 8 Diesel Sleeper, MY2025
Vehicle Financing
Fuel Insurance
M&R Tax & fees
$0.00
$0.20
$0.40
$0.60
$0.80
$1.00
$1.20
1 3 5 7 9 11 13 15
Per-Mile Cost of Ownership, Small Gasoline SUV, MY2025
Vehicle Financing
Fuel Insurance
Maintenance Repair
Tax & fees
xxvii
FIGURE ES-8 TCO for small SUV and class 8 day cab from MY2020 to MY2050
These results summarize some of the broad range of analyses that are presented in the
body of this report. In many cases, the highest costs are for the vehicle and the fuel, but this is
not always true. We find that insurance and M&R both play an important role in TCO and
contribute toward differences between powertrains. In the case of MHDVs, payload capacity
costs and especially labor costs both affect TCO and contribute to key differences between the
powertrain types. In both cases, while taxes and fees are small contributors to TCO, they
nonetheless are important to consider.
Given the breadth of cost elements presented in this report, we believe that these results
can be broadly to fill gaps in analyses by other researchers. Our single-vehicle-focused analysis
can be used within segmentation-type analyses which aim to identify market opportunities for
specific technologies and in market adoption analyses which estimate future sales shares of
different vehicle technologies.
ICE-SI
ICE-CI
HEV
FCEV
PHEV50
BEV300
$0.35
$0.40
$0.45
$0.50
$0.55
$0.60
$0.65
'15 '20 '25 '30 '35 '40 '45 '50 '55
LCO
D (
$/m
i)
Model Year
LCOD small SUV, high-tech
ICE-CI
HEV
FCEV
PHEV125
BEV250
$1.25
$1.75
$2.25
$2.75
$3.25
$3.75
'15 '20 '25 '30 '35 '40 '45 '50 '55
LCO
D (
$/m
i)
Model Year
LCOD day cab, high-tech

xxviii
This page left intentionally blank.

1
1. INTRODUCTION
This report documents a comprehensive analysis of vehicle ownership costs, yielding a
total cost of ownership (TCO). The purpose of this study is to estimate all of the components of
the national-average TCO from the perspective of an individual or firm doing an explicit,
complete, internally consistent, data-based estimation of the TCO of vehicles having a range of
vehicle fuels and powertrain technologies. Our findings can be used by analysts, researchers, and
policymakers when determining the relative ownership costs of alternative fuel vehicles (AFVs)
and deciding directions for future research, and by consumers and fleet operators to select cost-
effective vehicles. A detailed literature review supplemented by discussions with subject matter
experts shows the need for a more consistent, comprehensive approach to vehicle ownership
costs and for sufficient data to support a comprehensive analysis. The costs listed in Table 1.1
were quantified for the light-duty passenger vehicle size classes and powertrains in 2020 and
future years shown in the table.
TABLE 1.1 Private passenger vehicle cost components quantified and vehicle size classes,
powertrains, and years modeled
Cost Components Size Classes Powertrains Years
Purchase & Depreciation Compact Sedan Internal Combustion Engine 2020
Financing Midsize Sedan Hybrid Electric Vehicle 2025
Fuel Small Sport Utility Vehicle Plug-in Hybrid Electric Vehicle 2030
Insurance Large Sport Utility Vehicle Fuel Cell Electric Vehicle 2035
Maintenance & Repair Pickup Truck Battery Electric Vehicle 2050
Taxes & Fees
For commercial vehicles, we included the same cost components as for passenger
vehicles as well as direct operational costs, including both labor expenses and the marginal
payload expenses relative to a conventional engine. The cost components listed in Table 1.2 were
quantified for commercial vehicles of selected combinations of size classes and vocations with
powertrains in the years listed.
In this analysis, direct costs were quantified at a national level (averages or representative
values) from the perspective of a rational vehicle owner. Of particular interest here are direct,
monetary costs incurred by owners of light-duty passenger vehicles and owners/operators of
light-, medium- and heavy-duty commercial vehicles with different powertrains. No “soft” costs,
such as value of driver preferences for comfort, performance, styling etc., and no costs external
to purchasing and operating the vehicle, such as costs due to congestion, pollution, or noise
impacts were included. Because this analysis focuses on the ownership and operation costs of an
individual vehicle, it is distinct from segmentation-type analyses which aim to identify market
opportunities for specific technologies (e.g. Morrison et al. 2018; Hunter et al. 2021
forthcoming). Likewise, this analysis does not attempt to model market adoption to estimate

2
TABLE 1.2 Commercial vehicle cost components quantified and vehicle size classes, powertrains,
and years modeled
Cost Components Size Classes Powertrains Years
Purchase & Depreciation Class 4 Delivery Internal Combustion Engine 2020
Financing Class 6 Delivery Hybrid Electric Vehicle 2025
Fuel Class 8 Transit Bus Plug-in Hybrid Electric Vehicle 2030
Insurance Class 8 Refuse Fuel Cell Electric Vehicle 2035
Maintenance & Repair Class 8 Vocational Battery Electric Vehicle 2050
Taxes & Fees Class 8 Tractor – Day Cab
Payload Capacity Class 8 Tractor – Sleeper Cab
Labor
future sales shares of different vehicle technologies, as these analyses depend on consumer
behavior which is not completely tied to vehicle cost of ownership (e.g. Stephens et al. 2020;
Brooker et al. 2021 forthcoming). That noted, the results from this output can be used to
supplement those types of analyses, as this report includes rigorous and self-consistent analysis
of many of the costs that comprise a TCO calculation.
Previous ownership cost analysis supported by the Department of Energy Vehicles
Technology Office (DOE VTO) has focused on vehicle manufacturing cost (and the resulting
vehicle retail price, typically represented as the manufacturer suggested retail price, or MSRP)
and fuel cost. In this study, we expand upon this work by focusing on other cost components and
use the vehicle cost and fuel economy modeling from existing VTO-supported work, specifically
vehicle modeling by the Argonne Autonomie team and documented in Islam et al. (2020), and
Vijayagopal et al. (2019), as discussed in Section 3.2.
While vehicle and fuel costs are two of the largest factors in the TCO for many vehicles,
examining solely these two components does not fully capture the differences in total costs
between powertrain types. Initial vehicle retail price is the largest cost in early years, but over a
longer analysis window of 15 years, recurring costs such as maintenance, repair, insurance,
registration fees, and others become increasingly important. As such, establishing more
scientifically-sound bases for these cost components is crucial for gaining a more holistic
understanding of lifetime TCO. We find that costs for maintenance, repair, taxes and fees, and, to
an extent, insurance, all vary significantly between powertrains and are systematically lower for
AFVs. This indicates that past work, which has focused primarily on vehicle and fuel costs, may
have misrepresented differences in TCO between powertrain types.
We developed estimates of the cost components listed above by collecting and analyzing
data to establish a firmer basis for costs such as maintenance and repair, insurance, depreciation,
and some operating costs for commercial vehicles. Such data were available for specific makes
and models, but had not been systematically and consistently analyzed in a manner sufficient to
support general comparisons of these costs across powertrains for different vehicle size classes.
We also provided a firmer basis for economic and financial assumptions, including appropriate

3
rates for discounting, inflation, and vehicle loans. As discussed in the literature review
(Section 2), previous studies of ownership costs have made different assumptions about many of
these factors, often without a firm technical basis. We establish a comprehensive conceptual
framework for defining and estimating the TCO, and identify and begin to fill critical data gaps
in estimates of the TCO of both light-duty vehicles (LDV) and medium- and heavy-duty vehicles
(MDV and HDV, together MHDV).
We modeled depreciation of cars and light trucks of model years (MY) 2013–2019 with
different powertrain types capturing the dependence on model year, powertrain, market segment
(luxury and mass market), and size class. Our results indicate that, on average, battery electric
vehicles (BEV), plug-in hybrid electric vehicles (PHEV), and fuel cell electric vehicles (FCEV)
depreciate somewhat more quickly than their hybrid electric vehicle (HEV) and internal
combustion engine vehicle (ICEV) counterparts do, but recent model year plug-in electric
vehicles (PEV), especially luxury BEVs, hold their value about as well as if not better than
ICEVs. We also analyzed depreciation of MHDV, capturing the dependence on age and
cumulative mileage for each size class, though data limitations prevented analysis of the
depreciation of MHDV with different powertrains.
We collected and analyzed insurance cost information on LDV and modeled these costs
for cars, sport utility vehicles (SUV), and pickup trucks. We found that insurance costs depend
on MSRP and size class, but are similar across powertrains. The available data on insurance
costs for commercial vehicles is more limited, but we could estimate annual costs for each of the
size classes listed in Table 1.2. We also estimated insurance costs as a function of vehicle value
for tractor trailers, giving an implicit variation as a function of powertrain.
Analyzing maintenance costs of LDVs of different powertrains as a function of vehicle
age, vehicle mileage and time (maintenance schedule), we found that on average electrified
powertrains (HEVs, PHEVs, BEVs, and FCEVs) all have lower scheduled maintenance costs
than ICEVs. We also analyzed LDV repair (not including scheduled or unscheduled maintenance
or costs covered by warranties), and estimated costs for cars, SUVs, and pickup trucks by
powertrain. We found that average repair costs, as a percentage of MSRP, were lower for HEVs,
PHEVs, and BEVs than for ICEVs, ranging from 11% to 33% lower. For MHDV, we found
expected annual costs for maintenance and repair (M&R) as a function of vehicle age for each of
the size classes in Table 1.2, and adjusted these for AFVs, as informed by data for maintenance
and repair for transit buses.
We collected information on taxes, fees, parking, tolls, inspection, licensing, and other
costs and found modest differences between these costs for passenger vehicles with different
powertrains, largely due to state-level differences in vehicle registration. For MHDV taxes and
fees, we found no explicit powertrain dependence, but we did account for changes in highway
use tax related to the heavier weight of AFVs.
We compiled data on the additional costs incurred for operating commercial vehicles. We
also identified important data gaps for labor costs associated with charging PEVs and costs for
battery electric freight trucks from to the loss of payload weight capacity due to the increased
weight of the large battery itself. The payload capacity cost was estimated by comparing the

4
distribution of real-world freight truck operating weight with the estimated weights of class 8
tractor trailers trucks from Autonomie simulations. The labor cost for time spent recharging a
commercial electric vehicle was estimated based on the difference in time required to charge a
PEV and the time required to refuel an ICEV and typical driver wages. Recharging labor costs
can be quite high, depending on assumptions about expected charging power rates, and whether
personnel are required for the full time spent recharging.
Our contributions to knowledge of TCO are summarized in Table 1.3. Our work resulted
in improved estimates of cost components that have not been well addressed in previous work,
and our results support a more comprehensive assessment of ownership costs for a wide range of
vehicles of different size classes and powertrain types, including commercial vehicles. Further,
the calculations in this analysis are internally consistent, in spite of pulling from a disparate set
of data sources.
TABLE 1.3 New knowledge of TCO cost components delivered by the present study
Cost component Prior knowledge New knowledge
Depreciation Resale values by make & model Systematic analysis of depreciation by
powertrain (LDVs). Developed simple HDV
depreciation model.
Maintenance and
Repair
Estimates from different sources
available, but no consistent analysis.
Previous TCO work largely
assumption-based
Analysis of LDV maintenance and repair, model
for LDV maintenance by powertrain for selected
size classes. LD PEV M&R costs lower or
comparable to ICEV M&R costs. Developed
estimates for HDV M&R costs.
Insurance Quotes for LDVs available, some
information for HDVs available
Analyses of LDV insurance costs show
comparable costs for different powertrains.
Developed simple HDV insurance cost model
Taxes, fees, parking,
tolls, etc.
Information available, but not
consistently synthesized
Consistent estimates developed for LDVs by
size class and powertrain. Developed estimates
for HDV costs.
Costs unique to
commercial vehicles
Labor costs associated with BEV
charging, lower payload capacity, not
well understood
Models developed to estimate labor costs of
BEV charging and HDV BEV payload capacity
costs
The literature on TCO was reviewed to inform our analytic approach, and the approaches
taken in previous studies and findings of selected studies are reviewed in Section 2, along with a
discussion of the method for calculation and core analytical assumptions. Section 3 presents the
data necessary to calculate each cost component, including vehicle cost and fuel economy,
residual value, fuel costs, insurance costs, maintenance and repair costs, taxes and fees,
commercial vehicle operational costs, and labor costs. Literature relevant to these specific cost
components is also presented in the section on each cost component. Section 4 presents results
for our core modeling cases, as well as sensitivity analyses to show the most impactful and most
uncertain cost components. We conclude with a discussion on the implications of these results in
Section 5. Appendix A has additional information about alternative methods for calculating
TCO. Appendix B presents results for TCO calculations in tabular form. Appendix C explores

5
sensitivity analyses for the TCO calculations in greater detail, while the references are a
comprehensive documentation of the many studies which supplied data for this analysis.

6
2. TCO CALCULATION METHODOLOGY AND BACKGROUND
2.1. CONCEPTUAL FRAMEWORK FOR VEHICLE COSTS
The total lifetime cost of owning and operating a vehicle comprises a set of mutually
exclusive and collectively exhaustive elements, which are usefully delineated according to the
perspective from which lifetime cost is viewed and the general approach to estimating lifetime
cost. At the most general level we distinguish between: i) the perspective of private individuals
or firms and the perspective of society, and ii) a completely quantitative approach to estimating
vehicle costs and an approach that is not 100% quantitative, which for convenience we designate
“(partially) qualitative.” (A “partially qualitative” approach thus can include some
quantification.) This gives four over-arching categories:
1) Private perspective, 100% quantitative approach: an explicit, mathematical accounting of
the costs and benefits for a private individual or firm. This study is in this category.
2) Private perspective, (partially) qualitative approach: an informal and at least partially
subjective consideration of costs and benefits for a private individual or firm.
3) Societal perspective, 100% quantitative approach: an explicit, mathematical accounting
of all of the costs and benefits for the whole society, over many generations.
4) Societal perspective, (partially) qualitative approach: an informal and at least partially
non-quantitative assessment of the costs and benefits for society.
The four categories comprise different cost elements and use different detailed methods to
estimate lifetime cost. As mentioned above, the purpose of this study is to estimate all of the
components of the national-average TCO with the approach and perspective of category 1: an
explicit, complete, internally consistent, data-based estimation of all of elements of the TCO of
advanced-technology vehicles for private individuals or firms. Although category 1 (private-
quantitative) has the same perspective as category 2 (private-qualitative), and the same general
approach as category 3 (societal-quantitative), it actually comprises substantially different cost
elements and involves different estimation methods than do the other categories (Table 2.1).
Analysts should understand these differences to avoid mistakenly applying category-1 estimates,
such as in this study, to category-2 or category-3 estimates. In particular, the classification of
Table 2.1 and the extended related discussion in Appendix A show that, common practice
notwithstanding, it is not correct to estimate societal costs simply as the sum of private costs and
external costs (e.g., of air pollution or climate change). Appendix A provides a complete
delineation of the differences between categories 1, 2, and 3, and explains in detail how the
societal-quantitative costs are not merely private-quantitative plus external costs. Table 2.1 and
Appendix A do not discuss category-4 costs, societal-qualitative, because these share nothing in
common with the private-quantitative costs that are the subject of this report.

7
TABLE 2.1 Cost elements and methodological comments for the private-quantitative, private-
qualitative, and societal-quantitative categories on lifetime cost of motor vehicles
Perspective Private Societal
General
approach (Partially) qualitative 100% quantitative
Scope of the
cost analysis
Whatever private individuals or
firms perceive as costs in the
context
Market/financial
costs to private
individuals or firms,
Effects on everyone
and everything in large-
scale social, economic,
and environmental
systems
What is as a
“cost”
Actual price-times-
quantity payments,
which include transfer
payments (e.g., taxes,
producer surplus), but
exclude external costs
Only true economic
resource cost, which is
the area under the long-
run marginal cost curve,
including external costs,
but excluding transfer
payments
How costs are
estimated
Consumer:
subjective
judgement
Analyst modeling
consumers:
econometric
analysis; surveys
Explicit financial
accounting
Social cost-benefit or
welfare analysis;
damage-function
analysis
How estimates
are used
Consumer:
making
own
decisions
Analyst: to
understand and
model consumer
behavior
To evaluate and
compare the full
private costs and
benefits of vehicle
ownership and use
To evaluate and
compare the full social
costs and benefits of
transportation projects,
policies, and scenarios
Time frame,
analysis
window
The period of initial vehicle
ownership (implicitly)
The period of initial
vehicle ownership
(explicitly)
For vehicle: lifetime to
scrappage
For effects of vehicle
use: many generations
into the future
Financial
parameters:
discount rate,
loans, risk
Considered qualitatively,
typically with budget
constraints, very short time
horizons, and aversion to loss
and uncertainty
Included
quantitatively, based
on actual interest
payments and
financial opportunity
costs
The social discount rate
includes only a national
productivity component;
the social cost of a loan
is the administration cost
Note: The green-shaded column is the private-quantitative perspective/approach in this project.
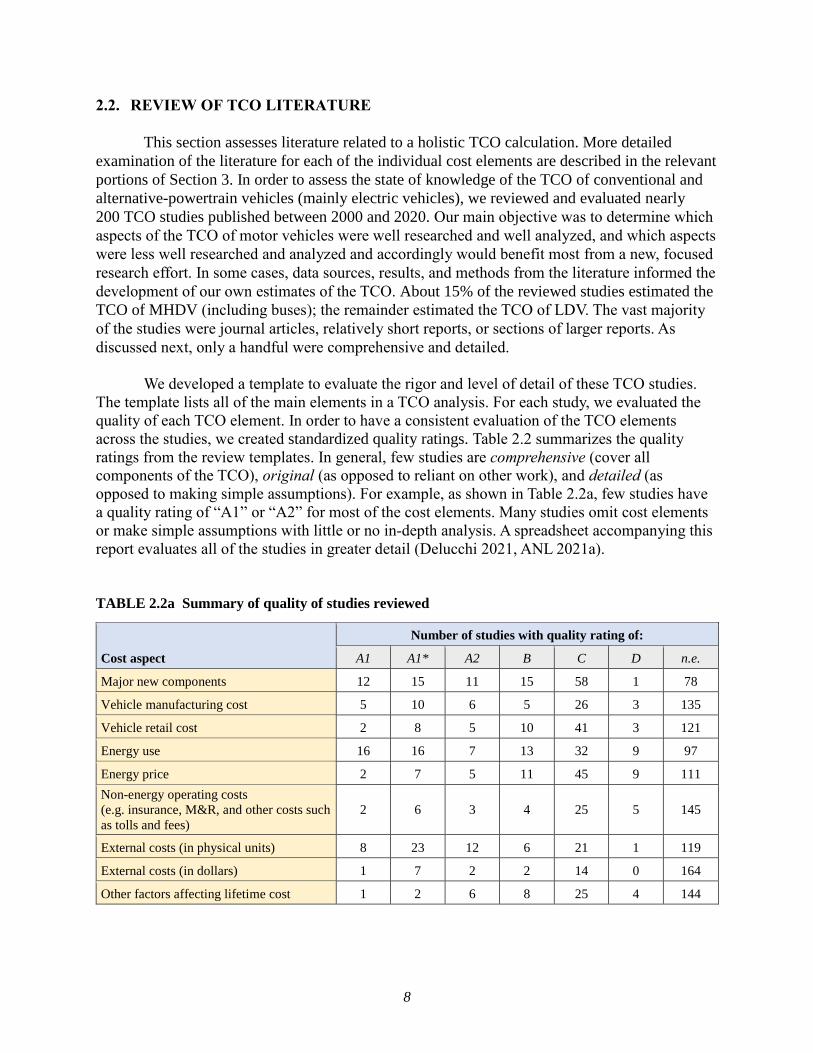
8
2.2. REVIEW OF TCO LITERATURE
This section assesses literature related to a holistic TCO calculation. More detailed
examination of the literature for each of the individual cost elements are described in the relevant
portions of Section 3. In order to assess the state of knowledge of the TCO of conventional and
alternative-powertrain vehicles (mainly electric vehicles), we reviewed and evaluated nearly
200 TCO studies published between 2000 and 2020. Our main objective was to determine which
aspects of the TCO of motor vehicles were well researched and well analyzed, and which aspects
were less well researched and analyzed and accordingly would benefit most from a new, focused
research effort. In some cases, data sources, results, and methods from the literature informed the
development of our own estimates of the TCO. About 15% of the reviewed studies estimated the
TCO of MHDV (including buses); the remainder estimated the TCO of LDV. The vast majority
of the studies were journal articles, relatively short reports, or sections of larger reports. As
discussed next, only a handful were comprehensive and detailed.
We developed a template to evaluate the rigor and level of detail of these TCO studies.
The template lists all of the main elements in a TCO analysis. For each study, we evaluated the
quality of each TCO element. In order to have a consistent evaluation of the TCO elements
across the studies, we created standardized quality ratings. Table 2.2 summarizes the quality
ratings from the review templates. In general, few studies are comprehensive (cover all
components of the TCO), original (as opposed to reliant on other work), and detailed (as
opposed to making simple assumptions). For example, as shown in Table 2.2a, few studies have
a quality rating of “A1” or “A2” for most of the cost elements. Many studies omit cost elements
or make simple assumptions with little or no in-depth analysis. A spreadsheet accompanying this
report evaluates all of the studies in greater detail (Delucchi 2021, ANL 2021a).
TABLE 2.2a Summary of quality of studies reviewed
Cost aspect
Number of studies with quality rating of:
A1 A1* A2 B C D n.e.
Major new components 12 15 11 15 58 1 78
Vehicle manufacturing cost 5 10 6 5 26 3 135
Vehicle retail cost 2 8 5 10 41 3 121
Energy use 16 16 7 13 32 9 97
Energy price 2 7 5 11 45 9 111
Non-energy operating costs
(e.g. insurance, M&R, and other costs such
as tolls and fees)
2 6 3 4 25 5 145
External costs (in physical units) 8 23 12 6 21 1 119
External costs (in dollars) 1 7 2 2 14 0 164
Other factors affecting lifetime cost 1 2 6 8 25 4 144
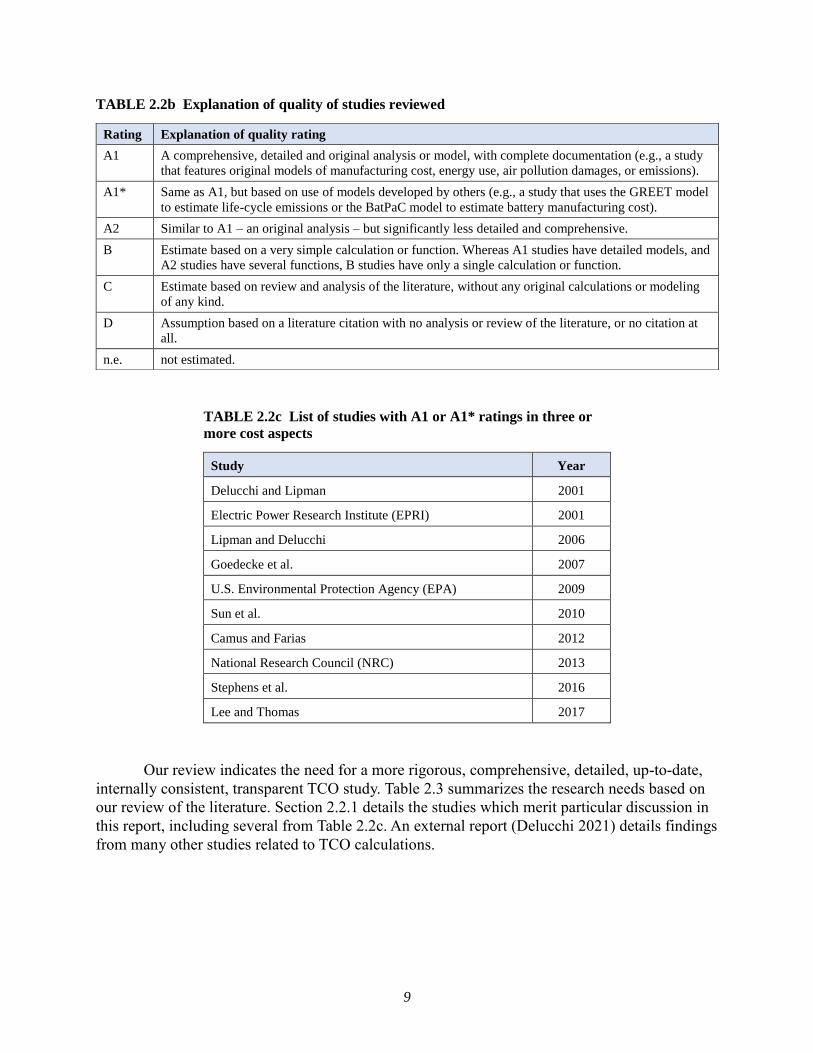
9
TABLE 2.2b Explanation of quality of studies reviewed
TABLE 2.2c List of studies with A1 or A1* ratings in three or
more cost aspects
Study Year
Delucchi and Lipman 2001
Electric Power Research Institute (EPRI) 2001
Lipman and Delucchi 2006
Goedecke et al. 2007
U.S. Environmental Protection Agency (EPA) 2009
Sun et al. 2010
Camus and Farias 2012
National Research Council (NRC) 2013
Stephens et al. 2016
Lee and Thomas 2017
Our review indicates the need for a more rigorous, comprehensive, detailed, up-to-date,
internally consistent, transparent TCO study. Table 2.3 summarizes the research needs based on
our review of the literature. Section 2.2.1 details the studies which merit particular discussion in
this report, including several from Table 2.2c. An external report (Delucchi 2021) details findings
from many other studies related to TCO calculations.
Rating Explanation of quality rating
A1 A comprehensive, detailed and original analysis or model, with complete documentation (e.g., a study
that features original models of manufacturing cost, energy use, air pollution damages, or emissions).
A1* Same as A1, but based on use of models developed by others (e.g., a study that uses the GREET model
to estimate life-cycle emissions or the BatPaC model to estimate battery manufacturing cost).
A2 Similar to A1 – an original analysis – but significantly less detailed and comprehensive.
B Estimate based on a very simple calculation or function. Whereas A1 studies have detailed models, and
A2 studies have several functions, B studies have only a single calculation or function.
C Estimate based on review and analysis of the literature, without any original calculations or modeling
of any kind.
D Assumption based on a literature citation with no analysis or review of the literature, or no citation at
all.
n.e. not estimated.

10
TABLE 2.3 Discussion of research needs
Cost aspect Research need Discussion
Major new
components Modest
Detailed models of costs of batteries and fuel cells are available for
LDVs and have been used in or developed for TCO studies, but need to
be extended to MHDVs. More work is needed to develop cost data and
models for electric powertrains and for gaseous fuel tanks, for LDVs and
MHDVs.
Vehicle
manufacturing cost Significant
Relatively little work has been done on estimating manufacturing cost
and retail cost, apart from modeling the cost of new components. More
work is needed on cost of new materials for gliders, body, etc. Vehicle retail cost
Energy use Minor Detailed energy-use models for conventional and electric-powertrain
vehicles are available and have been used in prior TCO studies.
Energy price Modest
Very few TCO studies have developed original estimates of energy price,
but detailed energy-price estimates and projections are available from the
Energy Information Administration (EIA) and other organizations. More
work is needed on the cost of PEV charging infrastructure.
Non-energy
operating costs
Significant,
especially for
insurance, M&R
Very few studies have made original, detailed estimates of the main non-
energy operating costs, insurance and maintenance and repair.
External costs (in
physical units) Minor/ modest
Few TCO studies have developed original estimates of emissions of
pollutants or greenhouse gases, but some studies have used detailed
models developed by others.
External costs (in
dollars) Modest
Very few TCO studies have developed original estimates of external
costs, but some studies have used detailed models developed by others.
Other factors
Significant,
especially for
depreciation
Few studies have developed or used detailed estimates of other factors
affecting lifetime costs.
2.2.1. Highlights from Specific Studies
As shown in Table 2.2, studies generally do not develop a proper conceptual framework
for estimating the TCO. General discussions of cost-benefit analysis can be found in any number
of texts and papers (e.g., Johansson and Kriström 2018; Carolus et al. 2018). Van Velzen et al.
(2019) propose a framework for estimating the future total cost of ownership of electric vehicles.
They state that the main purpose of their framework is to focus on a few factors that can
significantly affect future EV costs, such as the mark-up from manufacturing cost to retail price
and the effects of scale economies and learning-by-doing. While they propose an influence
diagram showing connections between factors and the TCO of electric vehicles, they do not
develop a general conceptual framework.
Delucchi and Lipman (2001) developed a detailed, integrated model of the performance,
energy use, manufacturing cost, retail cost, and lifecycle cost of electric vehicles and comparable
gasoline internal-combustion engine vehicles (ICEVs). The integrated model has three major

11
parts: a sub-model of vehicle cost and weight; a sub-model of vehicle energy use; and an
assessment of periodic ownership and operating costs. The sub-model of vehicle cost and weight
consists of a model of manufacturing cost and weight, and a model of all of the other costs –
division costs, corporate costs, and dealer costs – that compose the total retail cost of a vehicle.
The manufacturing cost is the materials and labor cost of making the vehicle, estimated for each
of the nearly 40 sub-systems that make up a complete vehicle. This sub-model also performs
detailed analyses of the manufacturing cost of batteries and electric drivetrains. The lifecycle
cost aspect of the model handles insurance payments in some detail, establishing a relationship
between the liability and physical-damage insurance premiums, and the value and annual travel
of a vehicle. The maintenance and repair cost analysis is based mainly on the comprehensive
data on sales of motor-vehicle services and parts reported by the Bureau of the Census.
The Electric Power Research Institute (EPRI 2001) estimated the vehicle manufacturing
cost using Component-Based Cost Analysis. This method estimates glider costs, engine costs,
transmission costs, electric traction costs, accessory costs, storage system costs, battery module
cost, other battery component costs and charger costs. To estimate Retail Price Equivalents
(RPE) of the vehicle components, they examined both the cost of labor and materials for each
component as well as what a manufacturer would pay to build the component itself or buy it
from a supplier. Operating costs, including costs for fuel and maintenance, are calculated using
label-adjusted fuel economies and representative driving patterns based on survey results.
Lipman and Delucchi (2006) analyzed the manufacturing costs, retail prices, and
lifecycle costs of five hybrid gasoline-electric vehicle types in high-volume production. Updating
and major modifications were made to a detailed motor vehicle retail and lifecycle cost
spreadsheet model that had previously been used to analyze the costs of conventional vehicles,
electric-drive vehicles, and other alternative-fuel vehicles (Delucchi and Lipman 2001). This cost
model was combined with a hybrid vehicle design and performance analysis using the
ADVISOR vehicle simulation model. The U.S. Environmental Protection Agency (EPA 2009)
published an extremely detailed cost analysis for hybrid electric vehicles, plug-in hybrids, and
full electric vehicles. The report considers several vehicle classes: subcompact, compact,
midsize, large passenger car, large multi-purpose vehicle, small truck and large truck. In general,
the costing methodology employed in this analysis is based on the development of detailed
production process flow charts and the transferring and processing of key information from the
process flows into standardized cost worksheets.
Sun et al. (2010) estimated the societal lifetime cost of hydrogen FCEVs and
conventional gasoline internal combustion engine vehicles. They used AVCEM (Advanced
Vehicle Cost and Energy-use Model), a vehicle performance and design model, to design a
vehicle to exactly satisfy performance and range specification with no more power and storage
than is needed (Delucchi 2005). They used the Steady State City Hydrogen Infrastructure System
Model to estimates regional hydrogen infrastructure costs, emissions and primary energy
requirements, and used the Lifecycle Emissions Model to estimate energy use, criteria pollutant
emissions, and CO2-equivalent greenhouse-gas emissions from a variety of transportation and
energy lifecycles (Delucchi 2003). Sun et al. estimate the external costs of oil use, air pollution,
climate change and vehicle noise. The external costs of oil use per mile are calculated simply as
the external cost per gallon of petroleum divided by the fuel economy. The fuel economy is
12
calculated within AVCEM; Sun et al. use the results. The external cost per gallon is based upon a
base-year value and an assumed rate of change.
The National Resource Council (NRC 2013) assessed the potential of alternative fuels
and alternative powertrains to reduce oil use and GHG emissions from the US LDV fleet by 80%
by the year 2050. The report uses four models to estimate future vehicle characteristics, vehicle
penetration into the market, and the impact on petroleum consumption and GHG emissions. To
estimate energy use, the NRC used an ICEV model developed by a consultant that projects
vehicle efficiency out to 2050 by focusing on the reduction of energy losses from vehicle use. To
estimate the costs of vehicle technologies, the NRC developed a spreadsheet model of
technology costs. To estimate GHG emissions and oil use, the NRC modified and updated
ANL’s VISION model (Singh et al. 2004). The NRC then reviewed the literature and applied
estimates of the social cost of carbon and the social cost of petroleum use. To model consumer
demand for vehicles, the NRC used the LAVE-Trans model.
Stephens et al. (2016) estimated the benefits of successfully developing advanced vehicle
technologies, including battery-electric, hybrid, and fuel-cell vehicles. The incremental costs
associated with advanced powertrains were estimated based on DOE cost and performance
targets and cost models developed by Ricardo Engineering and the ANL Autonomie group (ANL
2019). The Autonomie model also was used to simulate vehicle energy use. The fleet mix was
modeled using several consumer vehicle choice models, and GHG emissions and oil use were
estimated using the GREET model (ANL 2020) and the VISION model (Singh et al. 2004). The
researchers concluded that their analysis demonstrates that “successful VTO and FCTO
programs will significantly reduce (1) oil consumption and oil dependence, (2) GHG emissions,
and (3) consumer energy expenditures…[and that] these programs offer American drivers [other]
benefits…including increased mobility, and reduced exposure to potential oil price shocks.”
Lee and Thomas (2017) focused on medium- and heavy-duty vehicles to analyze
ownership costs for diesel, hybrid electric compressed natural gas, biofuel and electric class 6
freight trucks, including vehicle purchase, fuel, maintenance, diesel emission fluid, and electric
vehicle supply equipment (EVSE). Fuel economy was based on vehicle simulations, and costs
were estimated from a variety of publicly available estimates.
Beyond the conceptual framing of the above studies, several reports have presented TCO
from a consumer-focused perspective. The Automobile Association of America (AAA) and
Consumer Reports have published reports for LDV, while the American Transportation Research
Institute has published an annual series of papers for tractor trailers. Every year, AAA releases
its Your Driving Costs report, which estimates of the cost of owning a new vehicle for five years,
including depreciation, fuel, maintenance, insurance and other fees for several light-duty
passenger vehicle size classes (e.g. AAA 2020). The latest version of this report found that HEV
are cheaper to own than most ICE sedans and SUVs, and that BEV and HEV had the lowest
operating costs but BEV have the highest depreciation costs. The representative proportions of
each of the cost components (for a small gasoline-fueled SUV) are presented in Figure 2.1a. The
CR white paper compared costs of electric vehicles with conventional vehicles (Harto 2020a).
They found that BEV and PHEV can be cost-competitive with gasoline-fueled ICE after
accounting for reduced maintenance and fuel costs. Relatedly, Runzheimer and Company (now

13
part of Motus) has historically quantified the cost of driving in terms of business reimbursements
for the Internal Revenue Service (IRS). In 2021, the business mileage standard rate is 56 cents
per mile (Motus 2020).
Likewise, a number of recent papers on ownership costs of heavy-duty vehicles cite the
annual report issued by the American Transportation Research Institute (ATRI) on the
operational cost of trucks (Murray and Glidewell 2019). The annual ATRI reports provides
valuable data on current and historical costs of long-haul diesel trucks. These reports include
both average annual labor and vehicle costs as shown in Figure 2.1b. Labor and fuel costs are the
two largest costs for commercial freight carriers, with labor costs increasing sharply since 2012.
Although fuel costs have often been volatile, though have been relatively low the past few years
due to a drop in diesel prices and improvements in truck fuel economy. Truck payments are the
third highest cost-category and have been rising since 2013.
FIGURE 2.1 Left: Costs for driving medium SUV, data from AAA (2020). Right: Costs for driving
class 8 tractor trailer, data from ATRI (Murray and Glidewell 2019).
Murray and Glidewell (2019) report that maintenance and repair costs have declined from
$0.17 per mile in 2008 to $0.10 per mile in 2018, while tire costs have been fairly consistent,
$0.04 per mile in 2018, as shown. Given an average freight truck VMT of 88,250 in 2018,
maintenance and repair and tire costs were $12,400. Finally they note that the EPA 2007
emission standards required the installation of a diesel particulate filter (DPF) to meet particulate
matter emissions requirements. This DPF must be “regenerated” occasionally to remove
accumulated material from the filter. While this increased M&R costs for fleets with urban duty-
cycles, it did not significantly impact the commercial trucking industry as highway duty-cycles
enable passive regeneration, which limits DPF clogging.
Although vehicle ownership costs have been the subject of a number of studies,
particularly light-duty vehicles, gaps remain that make it difficult to comprehensively assess
ownership costs of vehicle of a wide range of powertrain types and size classes. Purchase and
fuel costs of currently available vehicles can be estimated, though some costs and factors
influencing costs remain uncertain and insufficiently well documented in the literature. Other
Average TCO for Small SUV(from AAA, Your Driving Costs, 2020)
Depreciation
Finance charge
Fuel
Maintenance, repair and tires
Full-coverage insurance
License, registration, taxes
Total: $0.56/mile
Average TCO for Tractor Trailer(from ATRI, Operational Costs of Trucking, 2019)
Fuel Costs
Lease or Purchase Payments
Repair & Maintenance
Tires
Truck Insurance Premiums
Permits and Licenses
Tolls
Driver Wages & Benefits
Total: $1.82/mile

14
costs, such as taxes and fees, are well-known, but variable from state to state and across vehicle
classes. Operational costs and factors that influence these vary significantly, especially for
commercial medium- and heavy-duty vehicles and studies vary in assumptions about these
(neglecting them in some cases). A synthesis of available data and modeling results for future
vehicles and systematic analysis of ownership costs is needed to enable assessment of these costs
for a range of vehicle with different powertrain types under a variety of assumptions.
2.3. QUANTIFICATION OF TCO
For the private-quantitative cost analysis described in Section 2.1, we have identified the
most relevant cost elements for a total cost of ownership analysis in this study. With the inputs
from Section 3, we can combine the values of each of these cost elements in a cohesive total cost
of ownership calculation. In this analysis, TCO is split into nine components (see Table 2.4):
Vehicle cost
o The vehicle cost includes the cost of purchase less the residual value of the sale of the
vehicle at the end of the analysis window.
Financing
o Financing represents the cost of interest payments beyond the retail price of the
vehicle.
Fuel
o Fuel cost is proportional to the driving distance, the fuel efficiency of the vehicle, and
the cost of the specific fuel needed by the vehicle.
Insurance
o Insurance costs cover both liability and vehicle replacement or repair, using national
average of costs for light-duty drivers, and all typical costs for each MHDV vocation.
Maintenance and repair
o Maintenance includes the cost of scheduled vehicle repairs as the vehicle ages, as
well as unscheduled services for inspection and replacement of vehicle parts that do
not have set replacement intervals.
Repair
o Repair accounts for unexpected costs to operate a vehicle, after accounting for regular
maintenance and fixes made while under warranty.
o For heavy-duty vehicles, maintenance and repair are combined due to lack of data
distinguishing the two categories.
Taxes & fees
o Taxes and fees include taxes on vehicle sales as well as any recurring annual costs,
such as registration fees, parking, and tolls.
Payload capacity expenses
o Payload capacity expenses are additional costs from adjustments in fleet vehicle
operation due to the increased weight of new vehicle technologies.
Labor
o Labor costs are representative of the typical wages and benefits for drivers. This also
includes additional time for charging or fueling vehicles. For light-duty vehicles used
as household vehicles, operational and labor costs are both zero.
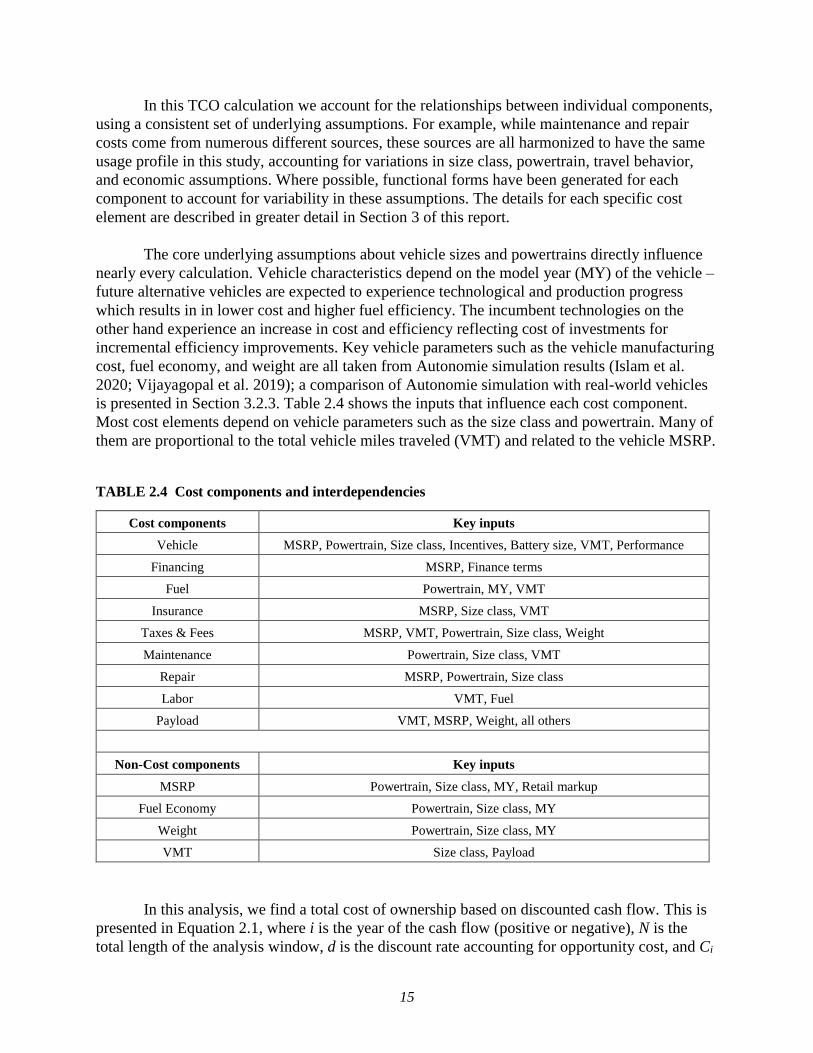
15
In this TCO calculation we account for the relationships between individual components,
using a consistent set of underlying assumptions. For example, while maintenance and repair
costs come from numerous different sources, these sources are all harmonized to have the same
usage profile in this study, accounting for variations in size class, powertrain, travel behavior,
and economic assumptions. Where possible, functional forms have been generated for each
component to account for variability in these assumptions. The details for each specific cost
element are described in greater detail in Section 3 of this report.
The core underlying assumptions about vehicle sizes and powertrains directly influence
nearly every calculation. Vehicle characteristics depend on the model year (MY) of the vehicle –
future alternative vehicles are expected to experience technological and production progress
which results in in lower cost and higher fuel efficiency. The incumbent technologies on the
other hand experience an increase in cost and efficiency reflecting cost of investments for
incremental efficiency improvements. Key vehicle parameters such as the vehicle manufacturing
cost, fuel economy, and weight are all taken from Autonomie simulation results (Islam et al.
2020; Vijayagopal et al. 2019); a comparison of Autonomie simulation with real-world vehicles
is presented in Section 3.2.3. Table 2.4 shows the inputs that influence each cost component.
Most cost elements depend on vehicle parameters such as the size class and powertrain. Many of
them are proportional to the total vehicle miles traveled (VMT) and related to the vehicle MSRP.
TABLE 2.4 Cost components and interdependencies
Cost components Key inputs
Vehicle MSRP, Powertrain, Size class, Incentives, Battery size, VMT, Performance
Financing MSRP, Finance terms
Fuel Powertrain, MY, VMT
Insurance MSRP, Size class, VMT
Taxes & Fees MSRP, VMT, Powertrain, Size class, Weight
Maintenance Powertrain, Size class, VMT
Repair MSRP, Powertrain, Size class
Labor VMT, Fuel
Payload VMT, MSRP, Weight, all others
Non-Cost components Key inputs
MSRP Powertrain, Size class, MY, Retail markup
Fuel Economy Powertrain, Size class, MY
Weight Powertrain, Size class, MY
VMT Size class, Payload
In this analysis, we find a total cost of ownership based on discounted cash flow. This is
presented in Equation 2.1, where i is the year of the cash flow (positive or negative), N is the
total length of the analysis window, d is the discount rate accounting for opportunity cost, and Ci

16
represents a cash flow in year i, in real (not nominal) dollars, adjusted for inflation, but not
discounted.
𝑇𝐶𝑂 = ∑𝐶𝑖
(1 + 𝑑)𝑖
𝑁
𝑖=1
Eq 2.1
The present value of expenses in each year are added, i.e., values beyond the first year are
discounted using the relevant real discount rate, described in greater detail in Section 2.3.1. For
LDVs, we assume a discount rate of 1.2% while for MHDVs we use a discount rate of 3.0%. We
treat all cash values as 2019 dollars. Figure 2.2 shows the discounted cash flow for a
conventional gasoline-fueled spark-ignition (SI) internal combustion engine SUV, simulated for
MY 2025. In this calculation, we assume that the vehicle cost includes a down payment of 12%
in the first year and loan payments in the first through fifth years, and that the vehicle is sold or
scrapped in year 15. We also assume the miles driven per year decreases from 16,000 mi in the
first year to under 11,000 in year 15 for a total of 201,400 miles, based on NHTSA and EPA
regulatory analysis (NHTSA and EPA 2020), see Section 2.3.3 for more detail. Over this time
window, the vehicle is the most expensive single component, followed by the fuel, maintenance,
and insurance. In years 2 through 5, vehicle and financing costs sum to a constant value,
representing fixed monthly loan payments, while year 1 has additional incurred costs from the
vehicle downpayment along with sales tax and vehicle titling. The negative cash flow for vehicle
cost in Year 15 is the residual value from the vehicle being sold.
FIGURE 2.2 Discounted cash flow graphic, MY2025 small SUV example
-$5,000
$0
$5,000
$10,000
$15,000
$20,000
1 2 3 4 5 6 7 8 9 10 11 12 13 14 15
Discounted Cash Flow, ICE-SI, Small SUV, MY2025
Vehicle Financing Fuel Insurance
Maintenance Repair Tax & fees
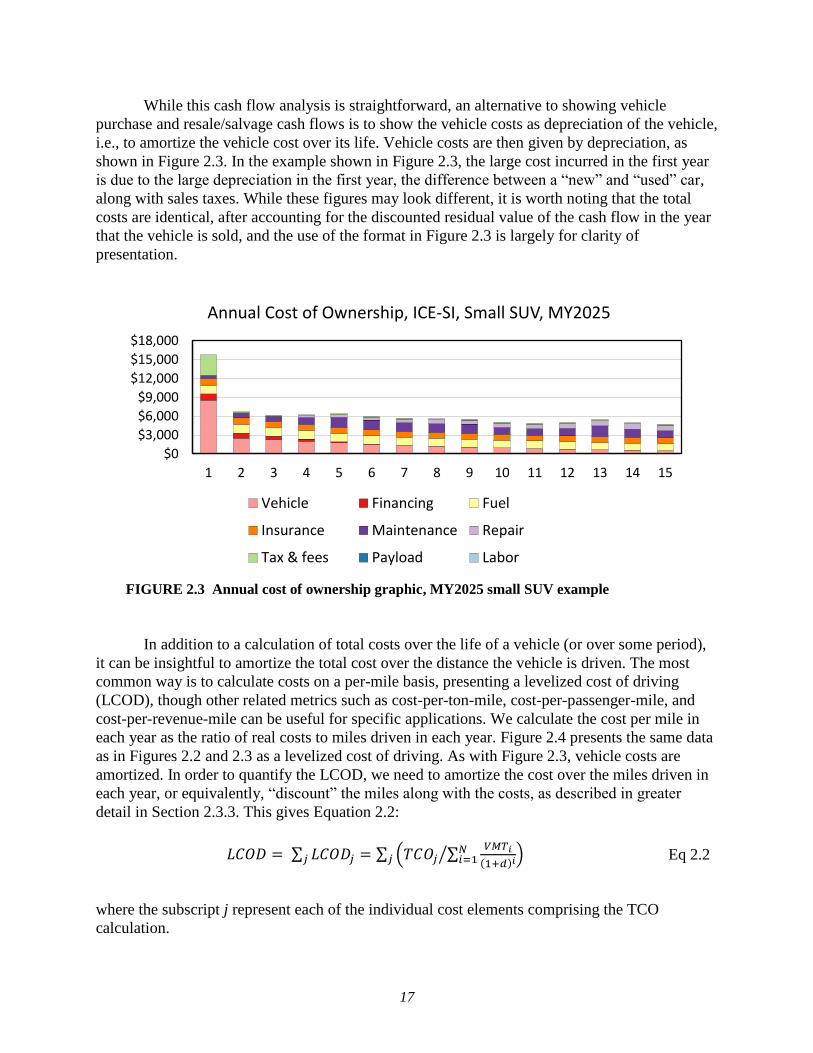
17
While this cash flow analysis is straightforward, an alternative to showing vehicle
purchase and resale/salvage cash flows is to show the vehicle costs as depreciation of the vehicle,
i.e., to amortize the vehicle cost over its life. Vehicle costs are then given by depreciation, as
shown in Figure 2.3. In the example shown in Figure 2.3, the large cost incurred in the first year
is due to the large depreciation in the first year, the difference between a “new” and “used” car,
along with sales taxes. While these figures may look different, it is worth noting that the total
costs are identical, after accounting for the discounted residual value of the cash flow in the year
that the vehicle is sold, and the use of the format in Figure 2.3 is largely for clarity of
presentation.
FIGURE 2.3 Annual cost of ownership graphic, MY2025 small SUV example
In addition to a calculation of total costs over the life of a vehicle (or over some period),
it can be insightful to amortize the total cost over the distance the vehicle is driven. The most
common way is to calculate costs on a per-mile basis, presenting a levelized cost of driving
(LCOD), though other related metrics such as cost-per-ton-mile, cost-per-passenger-mile, and
cost-per-revenue-mile can be useful for specific applications. We calculate the cost per mile in
each year as the ratio of real costs to miles driven in each year. Figure 2.4 presents the same data
as in Figures 2.2 and 2.3 as a levelized cost of driving. As with Figure 2.3, vehicle costs are
amortized. In order to quantify the LCOD, we need to amortize the cost over the miles driven in
each year, or equivalently, “discount” the miles along with the costs, as described in greater
detail in Section 2.3.3. This gives Equation 2.2:
𝐿𝐶𝑂𝐷 = ∑ 𝐿𝐶𝑂𝐷𝑗𝑗 = ∑ (𝑇𝐶𝑂𝑗 ∑𝑉𝑀𝑇𝑖
(1+𝑑)𝑖𝑁𝑖=1⁄ )𝑗 Eq 2.2
where the subscript j represent each of the individual cost elements comprising the TCO
calculation.
$0
$3,000
$6,000
$9,000
$12,000
$15,000
$18,000
1 2 3 4 5 6 7 8 9 10 11 12 13 14 15
Annual Cost of Ownership, ICE-SI, Small SUV, MY2025
Vehicle Financing Fuel
Insurance Maintenance Repair
Tax & fees Payload Labor
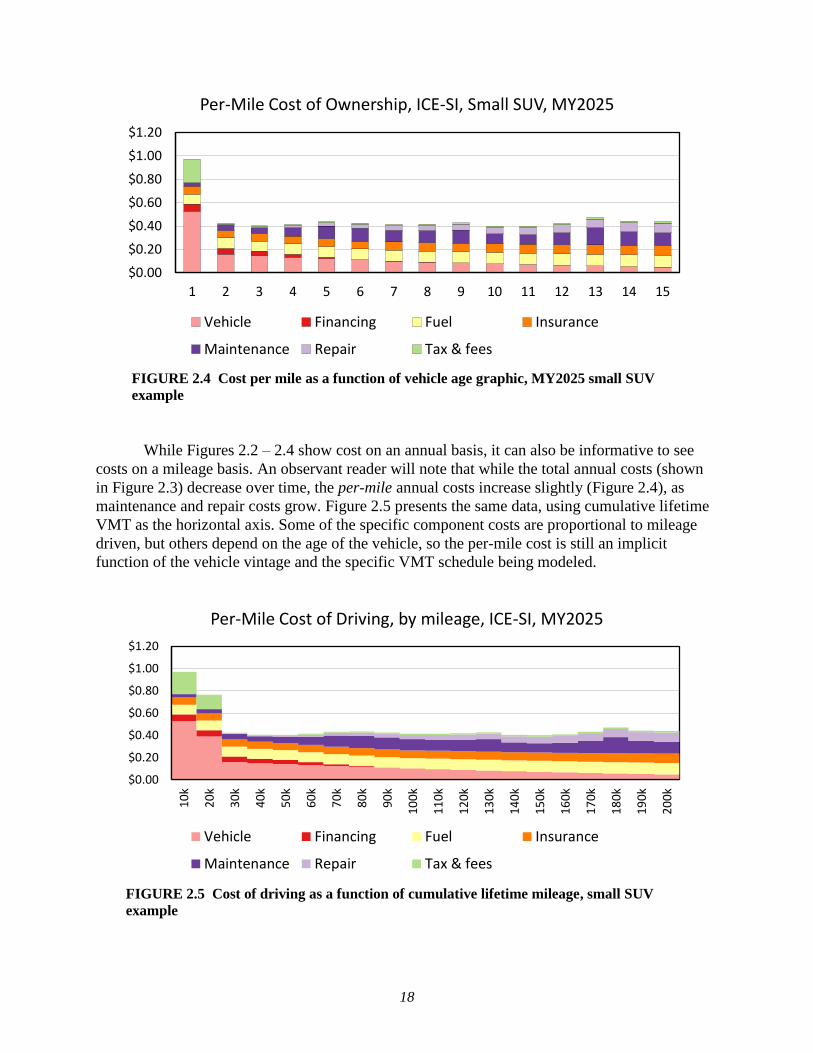
18
FIGURE 2.4 Cost per mile as a function of vehicle age graphic, MY2025 small SUV
example
While Figures 2.2 – 2.4 show cost on an annual basis, it can also be informative to see
costs on a mileage basis. An observant reader will note that while the total annual costs (shown
in Figure 2.3) decrease over time, the per-mile annual costs increase slightly (Figure 2.4), as
maintenance and repair costs grow. Figure 2.5 presents the same data, using cumulative lifetime
VMT as the horizontal axis. Some of the specific component costs are proportional to mileage
driven, but others depend on the age of the vehicle, so the per-mile cost is still an implicit
function of the vehicle vintage and the specific VMT schedule being modeled.
FIGURE 2.5 Cost of driving as a function of cumulative lifetime mileage, small SUV
example
$0.00
$0.20
$0.40
$0.60
$0.80
$1.00
$1.20
1 2 3 4 5 6 7 8 9 10 11 12 13 14 15
Per-Mile Cost of Ownership, ICE-SI, Small SUV, MY2025
Vehicle Financing Fuel Insurance
Maintenance Repair Tax & fees
$0.00
$0.20
$0.40
$0.60
$0.80
$1.00
$1.20
10
k
20
k
30
k
40
k
50
k
60
k
70
k
80
k
90
k
10
0k
11
0k
12
0k
13
0k
14
0k
15
0k
16
0k
17
0k
18
0k
19
0k
20
0k
Per-Mile Cost of Driving, by mileage, ICE-SI, MY2025
Vehicle Financing Fuel Insurance
Maintenance Repair Tax & fees
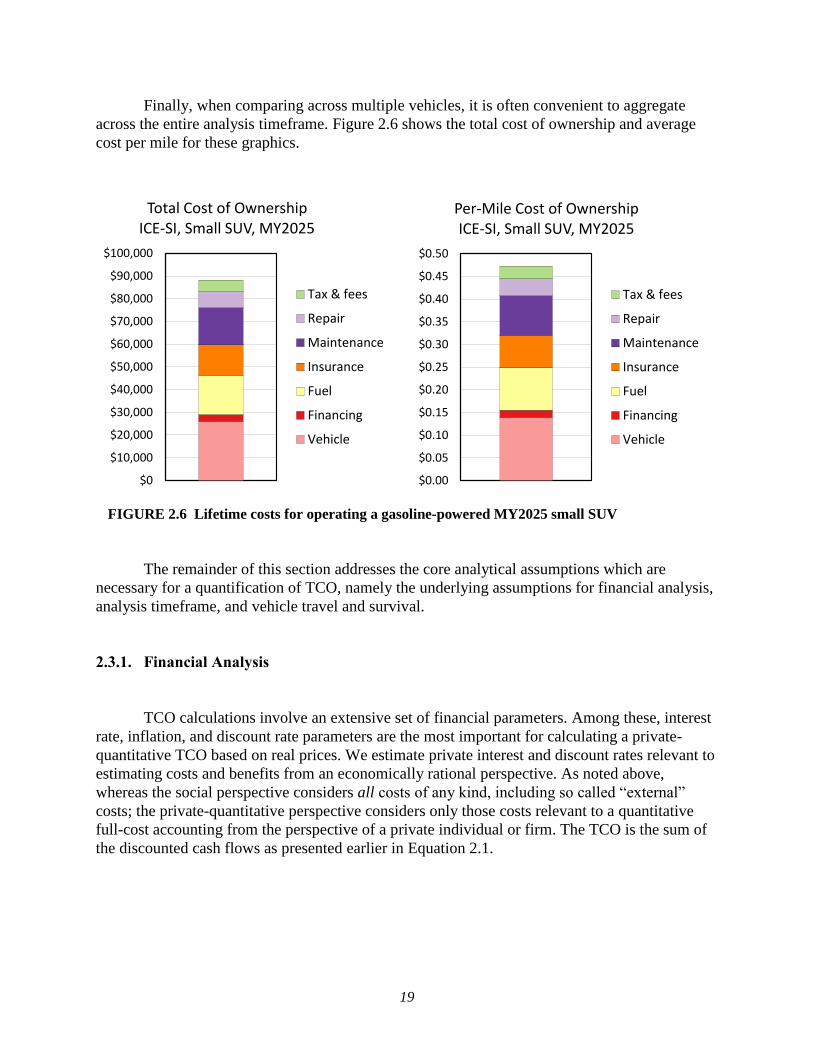
19
Finally, when comparing across multiple vehicles, it is often convenient to aggregate
across the entire analysis timeframe. Figure 2.6 shows the total cost of ownership and average
cost per mile for these graphics.
FIGURE 2.6 Lifetime costs for operating a gasoline-powered MY2025 small SUV
The remainder of this section addresses the core analytical assumptions which are
necessary for a quantification of TCO, namely the underlying assumptions for financial analysis,
analysis timeframe, and vehicle travel and survival.
2.3.1. Financial Analysis
TCO calculations involve an extensive set of financial parameters. Among these, interest
rate, inflation, and discount rate parameters are the most important for calculating a private-
quantitative TCO based on real prices. We estimate private interest and discount rates relevant to
estimating costs and benefits from an economically rational perspective. As noted above,
whereas the social perspective considers all costs of any kind, including so called “external”
costs; the private-quantitative perspective considers only those costs relevant to a quantitative
full-cost accounting from the perspective of a private individual or firm. The TCO is the sum of
the discounted cash flows as presented earlier in Equation 2.1.
$0
$10,000
$20,000
$30,000
$40,000
$50,000
$60,000
$70,000
$80,000
$90,000
$100,000
Total Cost of Ownership ICE-SI, Small SUV, MY2025
Tax & fees
Repair
Maintenance
Insurance
Fuel
Financing
Vehicle
$0.00
$0.05
$0.10
$0.15
$0.20
$0.25
$0.30
$0.35
$0.40
$0.45
$0.50
Per-Mile Cost of Ownership ICE-SI, Small SUV, MY2025
Tax & fees
Repair
Maintenance
Insurance
Fuel
Financing
Vehicle

20
2.3.1.1. Discount Rate
The discount rate mathematically represents the opportunity costs of cash flows at
different times. We distinguish between upfront costs and ongoing costs, as future costs are
discounted. For the vehicle purchase, we further distinguish between paying cash up front and
financing. For an up-front cash payment, the opportunity cost is the alternative use of the money,
which may be represented, for example, by an interest rate for ordinary saving accounts or safe
short-term investments. Thus, an initial cash payment can be annualized at the real after-tax
interest rate on investments or savings foregone by paying cash for transportation.
In the case of a loan, the actual cost to the borrower is not the initial cost of the vehicle,
but rather the periodic cash loan payment. Hence, for a borrower, one first must calculate the
actual loan payments, which depend on the amount of the loan, the life of the loan, and the
interest rate on the loan, measured as an annual percentage rate (APR). The resulting loan
payment series then is treated as an ordinary annuity; one finds the present value of the loan
payment series, on the basis now of the discount rate: the interest rate for consumer savings or
similar safe short-term investments. Finally, this present value can be annualized over the entire
life of the vehicle, again on the basis of the discount rate qua personal opportunity cost of
money. This procedure is necessary because the interest rate that pertains to loans is different
from discount rate – the interest rates that express consumers’ opportunity cost of money – and
because the life of the loan is different from the life of the vehicle financed with the loan. (Note
that it is standard practice to calculate the lifetime cost on the basis of monthly interest rates and
monthly travel, rather than annual interest rates and annual travel. There is a slight difference
between the two methods. The monthly interest rate is 1/12th of the assumed annual rate, and the
monthly mileage rate is 1/12th of the estimated annual mileage.) If the discount rate is lower than
the interest rate on the loan, such as with low-APR purchase incentives, it can be financially
advantageous to finance a vehicle in spite of the nominal increase in cost. In general, however,
loan rates are higher than the discount rate.
The opportunity cost can be viewed as a foregone reasonable investment over the given
timeframe. For large, infrequent purchases, this can be assumed to be comparable to interest
rates on treasury notes, which have historically averaged about 3.2% (FRB 2021b, table H.15).
For ongoing expenses, this can be compared to a savings account, which generally offers lower
interest rates than longer-term certificates of deposit. For businesses, a nominal cost of capital of
5% is assumed. This is necessarily higher than for individual consumers, as otherwise a business
would solely invest in bonds rather than into the company itself.
2.3.1.2. Loans and Financing
Data from Experian notes that 87% of new vehicle purchases were financed, and
approximately 40% were from banks and 60% from financing companies (Zabritski 2020).
According to Experian, the average loan rate in 2019 was 5.9%. Personal loan rates can range as
a function of creditworthiness and loan terms, with higher interest rates typical of consumers
with lower credit ratings. The average loan for a new vehicle in the highest credit tier was just
under 4% APR in 2019, while the average APR in the lowest credit tier was nearly 15%. The
21
Federal Reserve Board (FRB) also publishes information about average loan characteristics: the
average APR on a 48-month bank loan was 5.4%, the average APR on a 60-month bank loan
was 5.3%, and the average interest rate from a finance company was 6.4% on a 67-month term
(FRB 2021a, table G.19). Historically, the typical APR is somewhat volatile year-over-year.
Since 2000, the FRB data notes that the annual average APR for a prime bank loan has ranged
from 3.25% to 9.23%, with an average of 4.79% (FRB 2021b, table H.15).
As noted above, finance rates on personal loans are a function of credit score, which in
turn is moderately correlated with income (Beer et al. 2018). However, vehicle purchase choices
are also a function of income, and so real-world interest rates may vary across vehicles, because
of differences in the populations buying them (Cox 2021). In this analysis, we present an
analysis from the perspective of a private individual or firm doing a comprehensive, quantitative,
data-based estimation of the TCO, rather than an analysis across a broad population. Therefore,
we do not account for differences in national-average loan rates across vehicles (or consumers)
outside of sensitivity analyses.
Interest rates for commercial vehicles are even less uniform than for LDV. The FRB
prime rate, or the average majority prime rate charged by banks on short-term loans to business,
was 5.3% in 2019 (FRB 2021b, table H.15). Data from Nav shows traditional commercial bank
loans ranged from 2–13% APR in 2020 (Luthi 2020), while other funding sources such as online
loans and invoice financing extend even beyond that range of interest rates (Brex 2020). In this
analysis, we use the same default loan parameters for MHDV as for LDV.
The average loan term has increased over the last decade. Experian reports that the
average loan term for new vehicles was 69 months in 2019, while the average loan term for the
highest credit tier was 63 months. The FRB reports an average loan time of 67 months for loans
from finance companies, but does not present a weighted average loan term for loans from banks
and credit unions. Value Penguin reports the average loan term of 63 months (Wamala 2020)
while Credit Karma reports the average loan term of 71 months (Clarke 2020). In this analysis,
we will use 63 months (5.25 years) as the default loan term.
The average down payment on a vehicle loan is approximately 12% (Montoya 2019).
This is similar to historical data from the FRB of a 90% loan-to-value ratio, though this data set
has been discontinued (FRED 2012). In this analysis, we use 12% as our default value.
2.3.1.3. Inflation and Real Discount and Interest Rates
Prices can change because of general price inflation, whereby prices throughout the
economy rise for a given level of total output – i.e., a fixed level of costs. Since our purpose is to
estimate changes in actual costs, we account for changes in prices due to general inflation.
To avoid mistaking price inflation for changes in actual cost, we want to express and
compare all cost estimates in terms of the same price level – the same amount of money per unit
of output. Implicit Price Deflators (IPD) can be used to account for general price inflation. We
call the designated year of price/output level the price year. Dollar values expressed with respect

22
to a single price year are called “constant” or “real” dollars (because they are based on prices at a
constant output level). In this analysis, we use dollar year 2019$ for all costs. Given that
different data sources may have different assumptions, we convert all prices to 2019$.
To estimate the rate of inflation we use the Gross Domestic Product (GDP) Implicit Price
Deflator from the U.S. National Income Product Accounts (NIPA) compiled by the U.S. Bureau
of Economic Analysis (BEA, 2020). This expresses the yearly change in the relationship
between prices and output. Thus, we can pick a single price/output year upon which to base all of
our cost estimates, and use the GDP IPDs to convert all estimates to this particular year. The
“real” GDP is calculated with base-year prices but also with a “chained dollar” current-year
quantity index known as a Fisher index. The chained-dollar Fisher quantity index is calculated
by compounding the year-over-year changes between the base year and the current year
(Landefeld et al. 2003).
Alternatively, the Consumer Price Index (CPI) from the Bureau of Labor Statistics (BLS)
is a weighted average of the prices of a fixed bundle of goods and services purchased by wage
earners in urban areas (BLS 2021). It thus differs from GDP IPDs in several ways: it is based on
a subset of goods and services in the economy, whereas the IPDs pertain to all goods and
services that make up GDP; CPI is based on a fixed bundle of goods and services, whereas the
IPDs are based on the actual mix of goods and services in the economy year to year; it is limited
to purchases by wage earners in urban areas, whereas the IPDs cover all economic activity; and it
is referenced to prices in a base year, whereas IPDs are not.
We compiled inflation forecasts by experts from surveys from 1990 to 2019 (Federal
Reserve Bank of Philadelphia 2020), the historical general CPI from 1990 to 2019, historical
GDP IPDs from 1990 to 2019, and the average of all three. We believe that the full data series
(1990 to 2019) is most representative, because it includes periods of relatively high and low
inflation. In general, the GDP IPDs give a broader measure of inflation than does the CPI. Also,
Dotsey et al. (2003) argue that IPDs are more consistent than are CPIs. Therefore, we use GDP
IPDs for evaluating macroeconomic parameters such as the discount rate and rate of inflation. In
this study, we assume an annual inflation rate of 2% for future costs, similar to recent historical
data from the IPDs (BEA 2021). By subtracting this rate of inflation from nominal discount rates
and APR (OMB 1992), we find real discount rates and APRs, as shown in Table 2.5.
TABLE 2.5 Key economic parameters for financial analysis
Parameter LDV MHDV
Inflation rate 2.0% 2.0%
Discount rate (nominal) 3.2% 5.0%
Discount rate (real) 1.2% 3.0%
APR (nominal) 6.0% 6.0%
APR (real) 4.0% 4.0%
Loan maturity term 5.25 years 5.25 years
Down payment 12% 12%

23
Our recommended values can be compared with others. Bekdache (1999) develops a
model of ex ante real interest rates that depends on economic variables other than just historical
values. Bekdache (1999), Chen (2001), and Dotsey et al. (2003) estimate that from 1960 to the
mid 1990s real rates were in the range of 2 to 4% for government notes, excluding the period of
relatively volatile inflation from about 1972 to 1987. This is comparable to, but somewhat higher
than, the discount rates in Table 2.5 because those data include several years of estimated
negative real returns. Bekdache concludes that “short term movements in nominal interest rates
are more closely related to changes in real borrowing costs than they are to changes in
inflationary expectations” (Bekdache 1999, 188).
2.3.2. Analysis Timeframe and Survivability
As mentioned above, the lifetime cost of motor-vehicle use is some aggregation of the
costs related to owning and operating motor vehicles over some period. We can compare the
costs of individual vehicles over some analysis period, or the cost of vehicle fleets that evolve
over some period of time. In either case, the basic method is to estimate the present value of all
the pertinent cost streams (i.e., those that differ across vehicles) over a given analysis period. In
this analysis, we choose a fixed analysis window as an exogenous input to our TCO calculations.
In actuality, it is quite possible that the vehicle ownership period is affected by operational costs,
such as the need for major repairs or unaffordable fuel prices. In this analysis, a sudden vehicle
retirement (such as if a vehicle crashes and is scrapped) would change the analysis window, but
also necessitate the purchase of a replacement vehicle. Such a dynamic model for a multi-vehicle
TCO is a particularly interesting research topic, but outside the scope of this report.
Two common choices for the analysis window are over the entire lifetime of a vehicle,
and over the assumed ownership time of the first owner of the vehicle. In either case, we must be
careful to properly treat cost streams that actually continue past the analysis period. At the end of
the analysis window, the vehicle will have some residual value. The vehicle can be sold to a new
owner based on its market value, or salvaged for parts or scrap at the end of its life. Calculations
for vehicle depreciation assume that the vehicle is in good, drivable condition, and so innately
account for repairs throughout the vehicle life. However, the calculation may underestimate
residual value for vehicles with major M&R expenses to replace components late in the vehicle’s
life. Some repairs or components that are replaced during the life of a vehicle (assuming for the
moment that the analysis period is to the end of vehicle life), such as the battery pack in electric
vehicles, still have value at the end of vehicle life, beyond what would be typically expected by
depreciation. Generally, for an investment in a vehicle near the end of the analysis window, N,
there will be substantial residual value for investment made in year N, less residual value for
investments made in year N-1, and so on back to the initial vehicle purchase. The present value
of the sum of these residual values in year Y should be deducted from the present value of the
cost streams. Therefore, in this analysis, we assume that major repairs (e.g. engine rebuild,
battery replacement) do not occur late in the vehicle’s life in the baseline scenario, and that
minor repairs are incorporated into the model for residual value.
In this analysis, we use a default timeframe of 15 years for light duty vehicles. While this
is longer than the first owner typically holds possession of the vehicle, it is representative of the
24
costs that will be incurred over the ownership of the vehicle. We analyzed survivability rates
from data published by the National Highway Traffic Safety Administration (NHTSA) of the
U.S. Department of Transportation (Lu 2006) and by the EPA (EPA 2016), finding the average
lifetime of a vehicle in the United States was approximately 14 years in 2006 and just under
16 years in 2016. Independent analysis by Bento et al. also found an average lifetime of just
under 16 years as well, which has grown over time (Bento 2018). The ultimate ownership period
of the vehicle is often determined by if a vehicle is cost effective to operate for the owner. Using
a 15-year lifetime allows for exploration of the growth of maintenance and repair costs as the
vehicle ages. An analysis published by the US DRIVE industry-government partnership assessed
multiple time periods ranging from 3 to 15 years (Elgowainy et al. 2016): “The shorter time
periods capture the perspective of the typical first purchaser. The longer time period, chosen to
cover the entire life of the vehicle, provides a societal perspective. Both perspectives are
important in comparing different vehicle-fuel technology combinations.” (Elgowainy et al. 2016,
98)
For medium- and heavy-duty vehicles, a default analysis window of 10 years is assumed.
For vocational vehicles, the analysis window is related to a payback period. Ricardo found that
the typical desired payback is not over the vehicle's full useful life. “Based on the data that was
collected, the typical desired payback period is half of a vehicle’s useful life… class 8 long haul
trucks will replace their trucks after about 3 years and desire an 18-month payback period…
Class 7 & 8 vocational trucks and class 4-6 urban delivery vehicles have longer useful life, so
customers can accept a 3- to 5-year payback window.” (Ricardo 2017, 7)
Many of these vehicles go through multiple owners over a 10- or 15-year time window.
The VMT schedules that are used in this study are representative of average vehicles for a given
vintage, as these are broadly representative of fleet usage. Because of this, it makes sense to
consider an analysis window beyond a first owner for these fleet vehicles. However, a shorter
analysis window increases the relative importance of depreciation rates early in a vehicle's life,
therefore we consider a shorter window in some sensitivity cases.
2.3.3. Vehicle Travel and Mileage
In this analysis, our default assumption for driving behavior comes from vehicle mileage
schedules published by NHTSA and EPA for LDV (NHTSA and EPA 2020) and by the
U.S. Census Bureau for MHDV (U.S. Census 2004), which are reproduced in Figure 2.7. The
baseline mileage schedules for VMT for passenger cars and for light-duty trucks are from the
Final Regulatory Impact Analysis (FRIA) from the Safer Affordable Fuel-Efficient (SAFE)
Vehicles Rule published by NHTSA and EPA. We note that these mileage schedules are derived
by averaging across vehicles which have different ownership patterns as opposed to focusing on
a single owner. These mileage schedules show higher mileage early in a vehicle’s life, gradually
decreasing as the vehicle ages. For cars and SUVs, initial VMT is approximately 16,000 which
drops to approximately 10,000 by year 15. Pickup truck VMT decreases from 19,000 to 10,000
over the same time window. Vehicle driving behavior is assumed to be independent of
powertrain. Short-range BEVs have been found to drive less than comparable ICEV, but on

25
average a 300-mile range BEV is expected to be driven within 4% of the average distance that a
typical ICEV is driven (Gohlke and Zhou 2020).
VMT schedules for MHDV come from the Vehicle Inventory Use Survey (VIUS), last
performed by the U.S. Census Bureau in 2002 (U.S. Census 2004). Like LDV, MHDVs also
exhibit a decrease in mileage over time, and have a very large variance in annual miles across
each of the different MHDV vocations and size classes. These range from medium-duty delivery
trucks which drive comparably to passenger LDV to heavy-duty tractor-trailers which can drive
over 100,000 miles per year early in their lives. Sleeper-cab tractors represent long-haul trucks,
while day-cab tractors represent regional and local trucking, and so sleeper-cab tractors drive
approximately 50% more than day-cab tractors. A class 8 vocational truck can have many
different configurations; in this analysis we use a VMT representing a single-unit heavy-duty
freight truck, which is aligned with the underlying modeling assumptions from Autonomie. The
class 8 vocational and refuse trucks each drive more than 30,000 miles per year early in their
lifetimes, dropping below 20,000 after 15 years. Transit buses drive consistent distances
throughout their lifetime, approximately 40,000 miles per year. For nearly all MHDV mileage
schedules, the annual VMT increases in the second year; this is likely a quirk in the underlying
sampling for the VIUS data including partial-year driving, as opposed to an increase in daily
VMT.
FIGURE 2.7 Left: VMT schedules for LDV and medium-duty delivery vehicles. Right: VMT
schedules for heavy-duty vehicles.
Using a monotonically decreasing mileage schedule accounts for variations in travel
behavior and for changes in vehicle use over its lifetime. An analysis of the National Household
Travel Survey (FHWA and ORNL 2019) shows that even within a household, older vehicles are
driven less than newer vehicles. However, a common alternative for VMT is to use a fixed
0
5,000
10,000
15,000
20,000
25,000
30,000
1 2 3 4 5 6 7 8 9 10 11 12 13 14 15
Baseline Annual VMT - LDV & MDV
LDV: Cars LDV: SUVs
LDV: Pickups Class 6 Delivery
Class 4 Delivery
0
20,000
40,000
60,000
80,000
100,000
120,000
140,000
1 2 3 4 5 6 7 8 9 10 11 12 13 14 15
Baseline Annual VMT - HDV
Tractor: Sleeper Cab Tractor: Day Cab
Class 8 Vocational Transit Bus
Class 8 Refuse

26
mileage, as that would supply a constant utility to a household. Using a constant mileage instead
of a monotonically decreasing mileage schedule would result in fewer miles in the first year and
more miles in future years. In a discounted cash flow analysis, future costs are given less weight
than earlier costs. Using a constant mileage schedule would delay many variable costs until later
years, reducing the overall cost of these miles by a small factor. At a real discount rate of 1.2%
over an analysis window of 15 years, a constant mileage schedule would reduce the discounted
fuel cost by 0.7% and lifetime maintenance costs by 1.3%.
Use of these mileage schedules is conditional upon vehicle survivability. Subtly, the
mileage schedules generated by NHTSA and EPA are intrinsically based on observed VMT,
representing “the usage of vehicles on the road at the time of the sample” (NHTSA and EPA
2020). More directly, eventually every vehicle will be removed from service, and their VMT will
be zero. A survivability-weighted VMT will account for this fraction of vehicles no longer in
use, resulting in a reduced average VMT. This analysis implicitly accounts for vehicle
survivability by use of a 15-year analysis window for LDV, and 10-year analysis window for
MHDV, as described in Section 2.3.2. With this truncated lifetime, the total VMT is comparable
to a much longer analysis window with a survivability-weighted VMT.
Quantification of a levelized cost of driving, in $/mi, requires careful consideration of the
cumulative vehicle miles traveled (EPA 2014, OMB 2003). Intuitively, it can seem that there can
be no such thing as discounted VMT, because discounting applies to money or money-
denominatable flows over time, and VMT is not in money units. Nonetheless, it turns out that
cumulative VMT must be discounted in order to obtain the correct estimate of the lifetime cost
per mile (in $/mi). Formally, this can be demonstrated using annuities. The basic reason is that
the lifetime cost is a function of the cost per mile in year t, and we should discount the annual
cost values themselves. That is, we should value a given $/mi cost in a later year less than we
value the same $/mi cost in an earlier year – and this effectively discounts miles as well as
dollars. The conceptual or intuitive difficulty in understanding that we should discount VMT
probably stems from the fact that while we are used to discounting time streams of money, we
are not used to discounting $/mi values over time, perhaps because $/mi value itself seems like it
is time-independent. In any case, the proper accounting for LCOD on a per-mile basis uses
discounted cash flows as well as “discounted” VMT, as shown in Equation 2.2 in Section 2.3.
In Table 2.6, VMT corresponds to the access benefits of travel in the current conventional
petroleum-fuel vehicle baseline. This baseline, fundamental benefit of travel is the same for all
vehicles. Table 2.6 lists ways in which VMT can vary by vehicle type and affect costs but not
baseline benefits. These changes in VMT are outside of the scope of this analysis, which looks at
broadly representative mileage schedules, but could be important in TCO and LCOD
quantification for households and individual fleets.
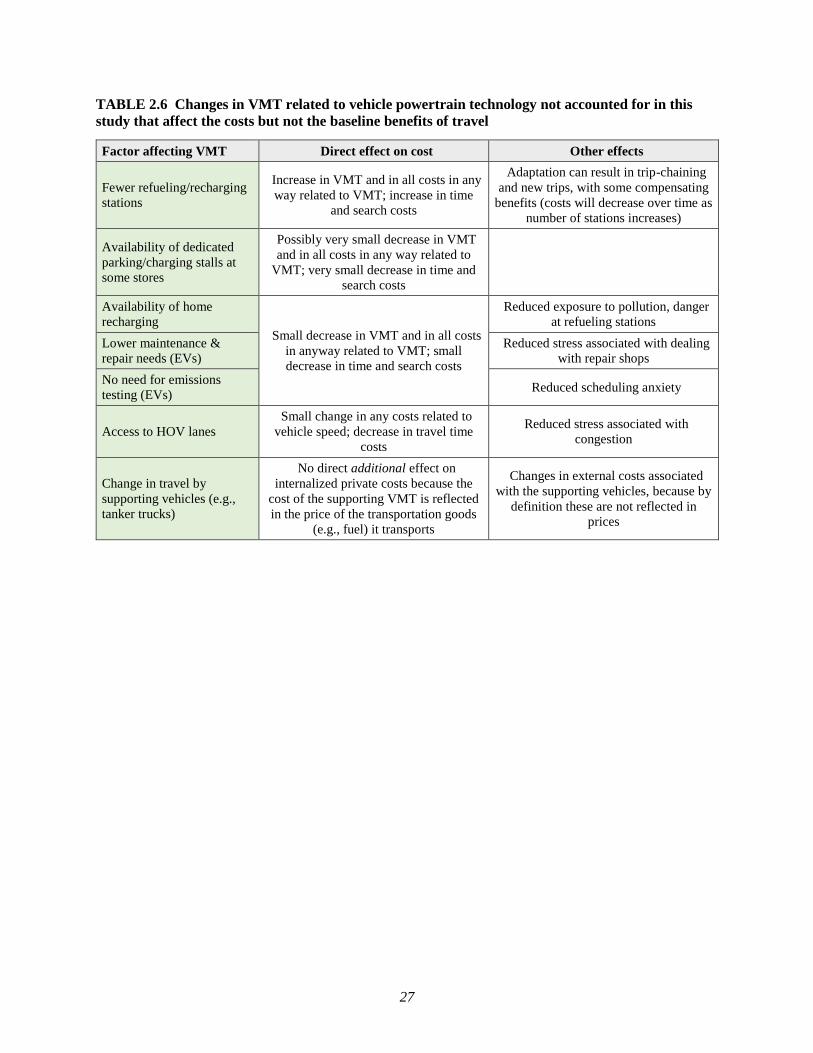
27
TABLE 2.6 Changes in VMT related to vehicle powertrain technology not accounted for in this
study that affect the costs but not the baseline benefits of travel
Factor affecting VMT Direct effect on cost Other effects
Fewer refueling/recharging
stations
Increase in VMT and in all costs in any
way related to VMT; increase in time
and search costs
Adaptation can result in trip-chaining
and new trips, with some compensating
benefits (costs will decrease over time as
number of stations increases)
Availability of dedicated
parking/charging stalls at
some stores
Possibly very small decrease in VMT
and in all costs in any way related to
VMT; very small decrease in time and
search costs
Availability of home
recharging Small decrease in VMT and in all costs
in anyway related to VMT; small
decrease in time and search costs
Reduced exposure to pollution, danger
at refueling stations
Lower maintenance &
repair needs (EVs)
Reduced stress associated with dealing
with repair shops
No need for emissions
testing (EVs) Reduced scheduling anxiety
Access to HOV lanes
Small change in any costs related to
vehicle speed; decrease in travel time
costs
Reduced stress associated with
congestion
Change in travel by
supporting vehicles (e.g.,
tanker trucks)
No direct additional effect on
internalized private costs because the
cost of the supporting VMT is reflected
in the price of the transportation goods
(e.g., fuel) it transports
Changes in external costs associated
with the supporting vehicles, because by
definition these are not reflected in
prices

28
3. COST ELEMENT DATA AND ASSUMPTIONS
This section examines the data available for calculating the cost of vehicle ownership for
each TCO cost element. Section 3.1 summarizes general data sources important for calculating
TCO, with further explanation in the relevant sections. Section 3.2 presents information about
the vehicle, including both modeling of the cost and residual value, along with the fuel economy.
Section 0 presents information about energy prices and fuel costs. Section 0 presents insurance.
Section 3.5 presents maintenance and repair. Section 3.6 discusses taxes and fees. Section 3.7
presents costs and considerations unique to commercial vehicles.
3.1. DATA SOURCE SUMMARY
Characteristics of the vehicles in this analysis came from Autonomie modeling, validated
against real-world vehicle sales data from Wards Auto and fuel economy data from
FuelEconomy.gov. Depreciation rates for LDV were obtained from Edmunds from their “True
Market Value” (Edmunds TMV 2020), based on historical sales, which included average resale
value (private party sale) for used vehicle models up to 7 years old. Depreciation rates for
MHDV came from used vehicle listing data from Commercial Truck Trader and
TruckPaper.com, validated against data from PriceDigests. Fuel prices for these vehicles came
from EIA forecasts for regular gasoline, diesel, and electricity. Premium gasoline prices were
extrapolated from regular gasoline prices, while hydrogen prices were set to match DOE
Hydrogen and Fuel Cell Technologies Office (HFTO) targets.
For LDV insurance costs, we combined information from the National Association of
Insurance Commissioners (NAIC), The Zebra, Progressive, and Edmunds to find average
insurance rates for liability, collision, and comprehensive insurance coverage. For MHDV
insurance, we used information from Progressive, ATRI, Commercial Truck Insurance HQ, Bus
Insurance HQ, and Trusted Choice to find insurance rates for each of the size classes and
vocations in this study. Maintenance and repair costs come from many different sources,
including the Consumer Expenditure Survey, YourMechanic, Utilimarc, ATRI, Consumer
Reports, Edmunds, RepairPal, MIT, and prior studies published by Argonne National Laboratory
and Oak Ridge National Laboratory.
As described in Section 2.3.1, default financial parameters and analytical parameters
were informed by a thorough literature review, and specifically by data from the U.S.
Department of Commerce, the Federal Reserve Board, Experian, Nav, and Edmunds. Travel and
ownership behavior is derived largely from prior analyses by NHTSA, EPA, and the U.S. Census
Bureau. Key economic parameters are summarized in Table 2.5.
As will be discussed in greater detail in Section 4.3, we considered the influence of
uncertain inputs on TCO and individual cost components. For cost components for which we had
sufficient data, we used data one standard deviation higher and lower than the median value,
representing the variability of uncertainty of the respective inputs. For data where distributions
exist, but not clear statistics, we used the 15th and 85th quantiles for the lower and upper bounds,

29
which corresponds to one standard deviation (in a normal distribution). We chose these as robust
statistics, i.e., not influenced much by outliers. Our sensitivity analysis therefore assessed the
uncertainty in TCO due to the uncertainty in the inputs where possible, rather than to an arbitrary
variation in inputs.
3.2. VEHICLE
In this section, we discuss all data, methods, and assumptions related to the vehicle. We
begin with a short discussion on Autonomie-simulated vehicle retail prices, both for current and
future MY vehicles. We then consider battery pack manufacturing and retail costs as well as
salvage value, which is used in several sensitivity cases as discussed later. The following section
discusses vehicle fuel economy findings for both LDV and MHDV. Finally, we consider vehicle
depreciation, which is the direct vehicle-related costs. We examine retail price and residual value
to determine the depreciation of the vehicle, which is interpreted as the Vehicle Cost in our TCO
and LCOD calculations.
3.2.1. Vehicle Retail Prices
Projected future LDV and MHDV retail prices were obtained from the results of Argonne
Autonomie modeling (Islam et al. 2020; Vijayagopal et al. 2019). These prices were estimated
from a bottom-up estimate of manufacturing costs of major components, including battery packs
in hybrid and plug-in electric vehicles, and fuel cells and hydrogen storage tanks in fuel cell
vehicles (Islam et al. 2020; Vijayagopal et al. 2019). These prices were estimated using a
combination of cost models from Ricardo and inputs from experts from Argonne, DOE, and
industry, based on assumptions about technological progress in electrification, lightweight
materials, fuel cell and hydrogen storage, and engine technologies. Future vehicle and
component costs were estimated for two cases, one assuming high technology progress,
consistent with DOE technology targets, and one assuming slower technology progress, with
higher costs for batteries, fuel cells and hydrogen tanks, and other vehicle components. These
two sets of projections were intended to represent technology progress with and without
continued technology research and development investment by the DOE Vehicles Technologies
Office and the Hydrogen and Fuel Cells Technologies Office. Autonomie models vehicles in
terms of “lab year”; this analysis adds five years to the lab year for the model year to account for
a technology being deployed. In this analysis, we use model year 2025 (lab year 2020) as the
baseline vehicle.
We estimated future vehicle retail prices from vehicle manufacturing costs (i.e. the ratio
of vehicle retail price to manufacturing cost) using a factor of 1.5 for LDV. This retail price
equivalent factor is based on Vyas et al. (2000). We applied this factor to LDVs of all powertrain
types, even though this may not be accurate for some powertrains. Other estimates of this factor,
and an alternate approach using indirect cost multipliers, have been reviewed (see, e.g., Kelly
2020; NRC 2013), but no adequate basis for a more refined estimate is available. The influence
of production volumes on costs was not considered for LDV, with the reasoning that only
vehicles being produced at scale would be broadly of interest and available to consumers.

30
Vijayagopal et al. (2019) included a retail price markup in their MDHV cost calculations; this
markup factor varies by powertrain.
Figure 3.1 shows modeled prices for MY2020 and MY2025 small SUV for spark-ignition
(SI) ICEV, compression-ignition (CI) ICEV, HEV, PHEV, BEV, and FCEV. The default all-
electric range for PHEV was 50 miles, and the default all-electric range for BEV was 300 miles
(i.e., BEV300), though a BEV200 was also modeled. Figure 3.2 shows similar modeling for
MDV delivery trucks, while Figure 3.3 shows the same for HDV regional-haul day-cab tractors.
The BEV range was 150 miles for the class 4 delivery truck and the BEV range was 250 miles
for the class 8 day-cab tractor. The simulated PHEV range for each MHDV was one-half the
BEV all-electric range in all cases. Between 2020 and 2025, the prices drop for most AFV due to
reduction in technology costs, while prices increase for ICEVs (both SI and CI) due to required
increases in fuel economy. For MY2025 vehicles, both low technology progress and high
technology progress cases are shown, underscoring how research and development can minimize
consumer costs when purchasing a vehicle for all powertrains. All of the cost modeling for
MY2020 and MY2025 is summarized in Tables 3.1 and 3.2 for all five LDV size classes and all
seven MHDV vocations.
FIGURE 3.1 Cost modeling for Autonomie LDV for small SUV in MY2020 and MY2025
$0
$10,000
$20,000
$30,000
$40,000
$50,000
$60,000
$70,000
MY2
0
MY2
5 -
low
MY2
5 -
hig
h
MY2
0
MY2
5 -
low
MY2
5 -
hig
h
MY2
0
MY2
5 -
low
MY2
5 -
hig
h
MY2
0
MY2
5 -
low
MY2
5 -
hig
h
MY2
0
MY2
5 -
low
MY2
5 -
hig
h
MY2
0
MY2
5 -
low
MY2
5 -
hig
h
ICE-SI ICE-CI HEV PHEV50 FCEV BEV300
Retail Cost - Small SUV

31
FIGURE 3.2 Cost modeling for Autonomie MDV in MY2020 and MY2025
FIGURE 3.3 Cost modeling for Autonomie HDV in MY2020 and MY2025
$0$20,000$40,000$60,000$80,000
$100,000$120,000$140,000$160,000$180,000
MY2
0
MY2
5 -
low
MY2
5 -
hig
h
MY2
0
MY2
5 -
low
MY2
5 -
hig
h
MY2
0
MY2
5 -
low
MY2
5 -
hig
h
MY2
0
MY2
5 -
low
MY2
5 -
hig
h
MY2
0
MY2
5 -
low
MY2
5 -
hig
h
ICE-CI HEV PHEV FCEV BEV
Retail Cost - Class 4 Delivery
$0
$100,000
$200,000
$300,000
$400,000
$500,000
$600,000
MY2
0
MY2
5 -
low
MY2
5 -
hig
h
MY2
0
MY2
5 -
low
MY2
5 -
hig
h
MY2
0
MY2
5 -
low
MY2
5 -
hig
h
MY2
0
MY2
5 -
low
MY2
5 -
hig
h
MY2
0
MY2
5 -
low
MY2
5 -
hig
h
ICE-CI HEV PHEV FCEV BEV
Retail Cost - Day Cab Tractor

32
TABLE 3.1 Cost modeling for Autonomie LDV for all size classes in MY2020 and MY2025
ICE-SI ICE-CI HEV PHEV FCEV BEV
Compact sedan
MY20 $19,095 $22,945 $24,166 $37,147 $26,578 $45,566
MY25 – low $21,496 $25,136 $24,031 $32,686 $26,246 $39,023
MY25 – high $21,486 $23,855 $22,736 $27,982 $25,724 $35,948
Midsize sedan
MY20 $24,068 $27,697 $29,391 $43,342 $33,261 $52,827
MY25 – low $27,783 $31,170 $30,376 $39,443 $33,628 $46,379
MY25 – high $27,749 $29,708 $28,815 $34,220 $32,840 $42,413
Small SUV
MY20 $27,243 $30,787 $33,014 $48,266 $37,352 $61,033
MY25 – low $30,576 $33,938 $33,490 $43,488 $37,442 $53,216
MY25 – high $30,175 $32,136 $31,586 $37,493 $36,247 $48,876
Medium SUV
MY20 $28,874 $32,430 $34,697 $51,304 $39,344 $66,084
MY25 – low $33,649 $36,977 $36,534 $47,331 $40,496 $58,412
MY25 – high $32,101 $34,040 $33,512 $40,030 $38,436 $52,876
Pickup
MY20 $32,406 $37,581 $41,721 $59,644 $48,457 $76,418
MY25 – low $37,513 $42,337 $42,923 $54,126 $48,788 $66,943
MY25 – high $35,173 $38,274 $38,367 $44,891 $45,833 $59,768
TABLE 3.2 Cost modeling for Autonomie MHDV for all size classes in MY2020 and MY2025
(blanks not modeled)
ICE-CI HEV PHEV FCEV BEV
Tractor - Sleeper
MY20 $143,548 $155,852 $568,370 $359,511 $949,389
MY25 – low $146,084 $155,573 $435,322 $288,939 $693,354
MY25 – high $149,736 $159,667 $288,494 $233,172 $416,399
Tractor - Day cab
MY20 $122,338 $133,243 $351,950 $312,713 $536,185
MY25 – low $123,704 $132,297 $276,542 $248,147 $398,444
MY25 – high $129,307 $134,462 $194,493 $198,898 $248,186
Class 8 Vocational
MY20 $96,772 $110,520 $262,745 $204,890 $391,536
MY25 – low $98,113 $108,340 $209,357 $167,628 $294,293
MY25 – high $102,315 $108,669 $155,044 $139,466 $193,812
Class 6 -
Pickup/Delivery
MY20 $73,439 $87,182 $169,263 $158,481 $231,840
MY25 – low $73,831 $84,003 $137,699 $127,973 $177,683
MY25 – high $77,373 $84,360 $108,916 $104,860 $121,426
Class 4 -
Pickup/Delivery
MY20 $59,051 $69,630 $115,458 $124,717 $158,909
MY25 – low $59,599 $66,967 $94,653 $98,614 $120,865
MY25 – high $63,814 $68,748 $76,734 $79,914 $83,382
Transit Bus MY20 $120,303 $134,798 $233,663 $209,542 $324,794
Class 8 Refuse MY20 $102,949 $112,333 $329,349
In our analysis, we use the high-technology, MY2025 vehicle as our baseline vehicle,
specifically the small SUV for LDV. For sensitivity analyses on vehicle manufacturing costs, we
used the two sets of results from Autonomie simulations, the low and high technology price
simulations, as upper and lower bounds on manufacturing price. For the retail price markup
factor, we assumed a range from 1.2 to 2.0, based on estimates from literature (NRC 2013; Kelly
2020). Additionally, Autonomie models vehicles with a baseline trim and a performance-level

33
trim with greater acceleration. In lieu of more detailed modeling of trim levels, we use the
performance vehicles as a stand-in for luxury vehicles in the sensitivity analysis.
3.2.1.1. Other Vehicle Cost Literature
In the literature on ownership costs of LDVs, few studies estimate vehicle manufacturing
costs using a bottom-up approach in which vehicle costs are estimated by adding up estimated
direct costs of components and the estimated indirect manufacturing costs. Owing to a lack of
publicly available manufacturing cost data, and to uncertainty about costs of new technologies
such as batteries, electric motors, hydrogen storage tanks, and fuel cells, many studies that
attempt such an approach rely on assumptions or approximate cost models to estimate the
component manufacturing costs and the indirect costs. Hamza et al. (2020), MIT Energy
Initiative (2019), Morrison et al. (2018), Elgowainy et al. (2018), Rousseau et al. (2015), Burke
et al. (2015), NRC (2013), and Delucchi and Lipman (2001) all estimated vehicle costs using
estimates of costs of vehicle components. Often cost models and projections are available for
individual components, including PEV battery packs (e.g., Nelson et al. 2019) and fuel cells and
hydrogen tanks for FCEVs (James 2020; Kleen and Padgett 2021). Other LDV TCO studies have
used more aggregate or top-down estimates derived from values reported in earlier literature or
based on MSRPs of conventional or hybrid electric vehicles and modifying these to account for
differences in prices of vehicles with other powertrains (e.g., Al-Alawi and Bradley 2013).
Additionally, uncertainties in the assumptions about vehicle manufacturing costs, fuel
economy, and other factors make it difficult to draw definitive or robust conclusions about the
relative costs of ownership of vehicles with different powertrains. Wu et al. (2015) used Monte
Carlo analysis to estimate distributions of ownership costs of ICEV, HEV, PHEV, and BEV with
assumed distributions of vehicle prices, electric drive component costs, and fuel prices in
Germany. They reported fairly wide distributions of ownership costs estimated for the year 2025,
with significant sensitivity to assumed driving distance, vehicle purchase price, and vehicle size
class.
The National Academy of Sciences (NAS) recently published a comprehensive, 400-page
techno-economic evaluation of technologies to reduce the fuel use and GHG emissions of MDTs
and HDTs (NAS 2020). The NAS considered powertrain modifications, alternative fuels, and
battery-electric vehicles. They provided a comprehensive review of estimates of: 1) the technical
characteristics and manufacturing cost of batteries; 2) the climate, air-quality, and energy-
security benefits of different fuel and technology options; and 3) the indirect-cost component of
the total retail price (e.g., corporate costs, sales costs, engineering costs, and engineering and
advertising). The authors of the NAS 2020 study did not develop new estimates of vehicle
manufacturing costs, but reviewed literature documenting such estimates, including direct
manufacturing costs, indirect costs, retail price equivalents, indirect cost multipliers, economies
of scale, learning effects, and stranded capital. They did update manufacturing costs of some
technologies (waste heat recovery and electrified powertrain components). They found that with
expected reductions in cost and improvements in reliability of lithium-ion batteries, hybrid
powertrains would be economically attractive in medium-duty vehicles in some applications,
especially in applications with stop-and-go driving. They mentioned that although costs of

34
electric machines and battery systems continue to decline, the requirements for commercial
vehicles are more stringent than those of passenger vehicles, therefore costs of electrified
powertrains would be higher, and adoption of electric powertrains in commercial vehicles would
probably be limited over the next ten years.
3.2.1.2. Battery Pack Costs and Considerations
As seen in Figures 3.1 to 3.3, PEVs are forecasted to have a higher retail cost than other
types of vehicles, due to having expensive batteries. The U.S. DOE Vehicle Technologies Office
(VTO) has targets for reducing the manufacturing costs of lithium-ion batteries at large scale to
less than $100/kWh and decreasing charging time to 15 minutes or less, with an ultimate goal of
$80/kWh (Boyd 2020).
Many estimates of battery pack costs are available from cost modeling and industry
announcements and the range of battery pack costs is fairly wide, both for forecasts and for
batteries already on the market. Sakti et al. (2017) reported estimates of BEV battery pack costs
in 2020 ranging from less than $200/kWh to over $400/kWh (nameplate capacity), but some of
these estimates were published in 2010. Future battery pack costs are more uncertain. Hsieh et al.
(2019) modeled Li-ion battery pack costs in 2030 under a range of assumptions about chemistry,
design, raw materials costs, and other factors and estimated BEV pack costs ranging from $93 to
$140/kWh. They compared their model with others, which under the same assumptions gave
battery pack costs in 2030 ranging from $77 to $150/kWh. A more optimistic estimate of
$62/kWh by 2030 was made by Goldie-Scot (2019).
In our base case we assumed that battery packs in PEVs would last the lifetime of the
vehicle, i.e., no battery repair or replacement cost was assumed. This is reasonable to assume for
LDV PEVs, since although some degradation in usable battery pack energy capacity occurs with
use, few PEVs have required battery pack replacement. In addition, battery technology continues
to improve, with new chemistries and battery management systems promising to reduce capacity
degradation (Harlow et al. 2019; Boyd 2020). Lifetimes of battery packs in medium- and heavy-
duty PEVs are less well-established. Currently, electric transit buses may have a battery
replacement at mid-life, though recent warranty plans, cycle-life analysis, and preliminary field
reports suggest that for many original equipment manufacturers (OEMs) the battery will last the
12-year life of the buses (Johnson et al. 2020). Therefore, we assume battery packs in MHDVs
will last as long as the vehicles.
In the sensitivity analysis, we assumed a lower bound on battery pack salvage value of
zero (Dai et al. 2019; Gaines 2019; Harper et al. 2019). For an upper bound on the salvage value
of battery packs, we used a model developed by the National Renewable Energy Laboratory
(NREL) which provides battery salvage value as a percentage of initial purchase price,
accounting for the forecasted future new battery price, forecasted battery health, relative cost of
refurbishment, and a used product discount (Neubauer and Pesaran 2010). The salvage value of a
BEV battery pack was estimated as:
35
𝑉𝑆𝑎𝑙𝑣𝑎𝑔𝑒 = (1 − 𝐾𝑟 − 𝐾𝑢)(1 − 𝐾ℎ)(𝐶𝑛𝑒𝑤)(𝐹𝑅𝑃𝐸) Eq 3.1
where
VSalvage = the salvage value of the battery pack
Kr = refurbishment cost factor = 15%
Ku = used product discount factor = 15%
Kh = battery health factor = 0% in year 0; increases by 3%/yr
Cnew = cost per usable kWh of usable battery pack capacity for a new battery (in the year
the pack is salvaged)
FRPE = ratio of retail price to manufacturing cost = 1.5 (retail price equivalent)
We assumed a value of $185/kWh for Cnew in 2020, which we took as the current
manufacturing price of BEV lithium-ion battery pack. This price is consistent with
manufacturing costs estimated using Argonne BatPaC model for typical battery pack designs and
current production volumes (Nelson et al. 2019). For MY2025, we used Cnew from Autonomie
modeling, starting at $150/kWh in 2025 (Islam et al. 2020). We assumed that Cnew decreases
annually consistent with battery price reductions projected by Bloomberg New Energy Finance
(Holland 2019), following a power function trend over the 15-year analysis window.
3.2.2. Vehicle Fuel Economy
In this section, we discuss fuel economy data for both LDVs and MHDVs, which most
directly impacts total fuel costs. As it is a characteristic of the vehicle, it can have an impact on
retail price, among many other factors. Fuel economy is an important consideration in a TCO
analysis as it can vary significantly between powertrain types, size classes, market segments, and
vocations for MHDVs. Since fuel is the second-largest cost component in our TCO for most
LDVs and MHDVs, this variation is clearly important to consider. We first discuss the fuel
consumption data collection and then present fuel economy results for LDVs followed by
MHDVs.
3.2.2.1. Vehicle Fuel Consumption Data Collection
For comparison, real-world and simulated fuel use data were collected for different fuel
types from multiple other sources. We collected data for ICE (both SI and CI), HEV, PHEV,
BEV, and FCEV across multiple light-duty size classes. These data total 1,047 records for LDV
energy use and 1,684 records for MHDV energy use. Each record is distinguishable by vehicle
type (e.g., powertrain, class, and use type), driving conditions (e.g., charge-sustaining, CS, and
charge-depleting, CD), and data source (i.e., different papers and reports). For energy use and
idling fuel rate of medium- and heavy-duty vehicles (MHDVs), there is no single recent,
representative, and comprehensive data source that contains the energy use data for most of the
MHDV types. To validate the Autonomie modeling results, the team collected related data from
journal papers, conference papers, and government and lab reports (e.g., Reinhart 2015; Davis
and Boundy 2020). Also, compared to LDVs, vehicle type classification is more complex with
MHDVs.

36
For most MHDV, the incumbent powertrain is some form of an internal combustion
engine, typically a CI fueled by diesel, but occasionally an SI fueled by gasoline, natural gas, or
propane instead. For improved fuel economy, conventional ICE engines are becoming more
hybridized, either with integrated starter generators (ISG) or as mild to full HEV. Table 3.3
shows the extent to which each of these powertrains has been studied across MHDV vocations.
A summary of generalized vocation and body types is listed in Table 3.3, using identifications in
the Vehicle Inventory Use Survey (VIUS) (U.S. Census 2004) and other literature (CARB
2015a; b; c; d; e; Barnitt et al. 2008; Burke and Fulton 2020; Gao et al. 2018; Gao et al. 2017;
Jaller et al. 2018; Lammert et al. 2012; Reinhart 2015; Sripad and Viswanathan 2019; Zhao et al.
2013). For each of these vehicle powertrains, fuel economy measurements or simulations for
different size classes and vehicle use cases were collected from the literature, and compared with
Autonomie as data validation. Even within a single label, fuel economy and body style can vary
enormously.
TABLE 3.3 Collected energy use data for MHDVs by powertrain technology and vehicle descriptor
Powertrain Fuel Generalized Vehicle Descriptor
BEV Electric Bucket truck, Construction, Delivery (class 3-7), Drayage, Long-haul, Refuse,
School bus, Service utility, Short-haul, Transit bus, Utility, Van (class 2-3),
Vocational (class 8), Walk-in (class 4)
FCEV Hydrogen Construction, Delivery (class 4-6), Long-haul, Short-haul, Transit bus,
Vocational (class 8)
HEV Diesel Construction, Delivery (class 4-6), Long-haul, Refuse, School bus, Service
utility, Short-haul, Transit bus, Utility, Van (class 2-3), Vocational (class 8),
Walk-in
ICE Biodiesel Transit bus
ICE Diesel Bucket truck, Construction, Delivery (class 3-7), Drayage, Long-haul, Pickup
(class 2-3), Platform, Refuse, School bus, Service utility, Short-haul, Tanker,
Tow truck, Transit bus, Utility, Van (class 2-3), Vocational (class 7-8), Walk-in
(class 4)
ICE Gasoline Delivery (class 6), Pickup (class 2-3), Short-haul, Tow truck
ICE Natural gas Long-haul, Short-haul
ISG Diesel Construction, Delivery (class 4-6), Long-haul, Refuse, School bus, Service
utility, Short-haul, Transit bus, Utility, Van (class 2-3), Vocational (class 8),
Walk-in
PHEV Diesel +
Electric
Bucket truck, Construction, Delivery (class 4-7), Long-haul, Refuse, School bus,
Service utility, Short-haul, Transit bus, Utility, Van (class 2-3), Vocational
(class 8), Walk-in
3.2.2.2. LDV Fuel Economy
As with vehicle prices, Autonomie results of light-duty fuel economy were provided for
two sets of projections: low and high technology progress, representing pessimistic and
optimistic estimates of future vehicle attributes including fuel economy, for five vehicle classes
(Islam et al. 2020). For illustration, Autonomie simulation fuel consumption results for the small
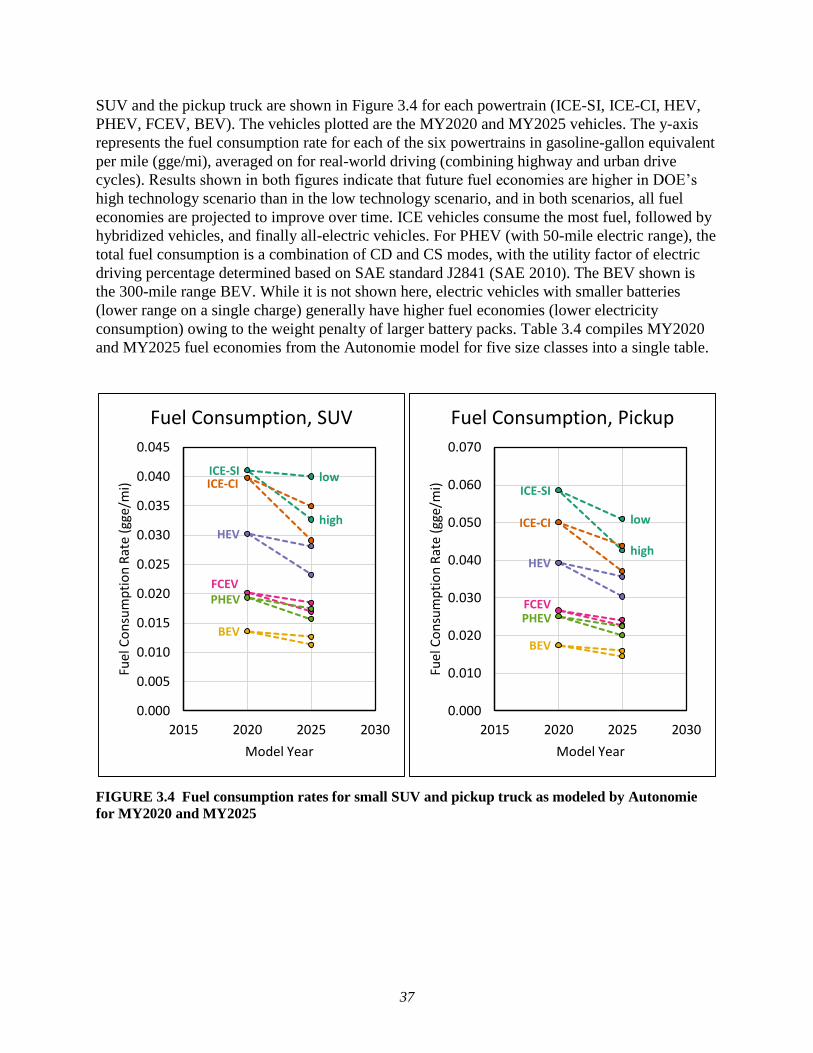
37
SUV and the pickup truck are shown in Figure 3.4 for each powertrain (ICE-SI, ICE-CI, HEV,
PHEV, FCEV, BEV). The vehicles plotted are the MY2020 and MY2025 vehicles. The y-axis
represents the fuel consumption rate for each of the six powertrains in gasoline-gallon equivalent
per mile (gge/mi), averaged on for real-world driving (combining highway and urban drive
cycles). Results shown in both figures indicate that future fuel economies are higher in DOE’s
high technology scenario than in the low technology scenario, and in both scenarios, all fuel
economies are projected to improve over time. ICE vehicles consume the most fuel, followed by
hybridized vehicles, and finally all-electric vehicles. For PHEV (with 50-mile electric range), the
total fuel consumption is a combination of CD and CS modes, with the utility factor of electric
driving percentage determined based on SAE standard J2841 (SAE 2010). The BEV shown is
the 300-mile range BEV. While it is not shown here, electric vehicles with smaller batteries
(lower range on a single charge) generally have higher fuel economies (lower electricity
consumption) owing to the weight penalty of larger battery packs. Table 3.4 compiles MY2020
and MY2025 fuel economies from the Autonomie model for five size classes into a single table.
FIGURE 3.4 Fuel consumption rates for small SUV and pickup truck as modeled by Autonomie
for MY2020 and MY2025
lowICE-SI
high
ICE-CI
HEV
FCEVPHEV
BEV
0.000
0.005
0.010
0.015
0.020
0.025
0.030
0.035
0.040
0.045
2015 2020 2025 2030
Fuel
Co
nsu
mp
tio
n R
ate
(gge
/mi)
Model Year
Fuel Consumption, SUV
low
ICE-SI
high
ICE-CI
HEV
FCEVPHEV
BEV
0.000
0.010
0.020
0.030
0.040
0.050
0.060
0.070
2015 2020 2025 2030
Fuel
Co
nsu
mp
tio
n R
ate
(gge
/mi)
Model Year
Fuel Consumption, Pickup
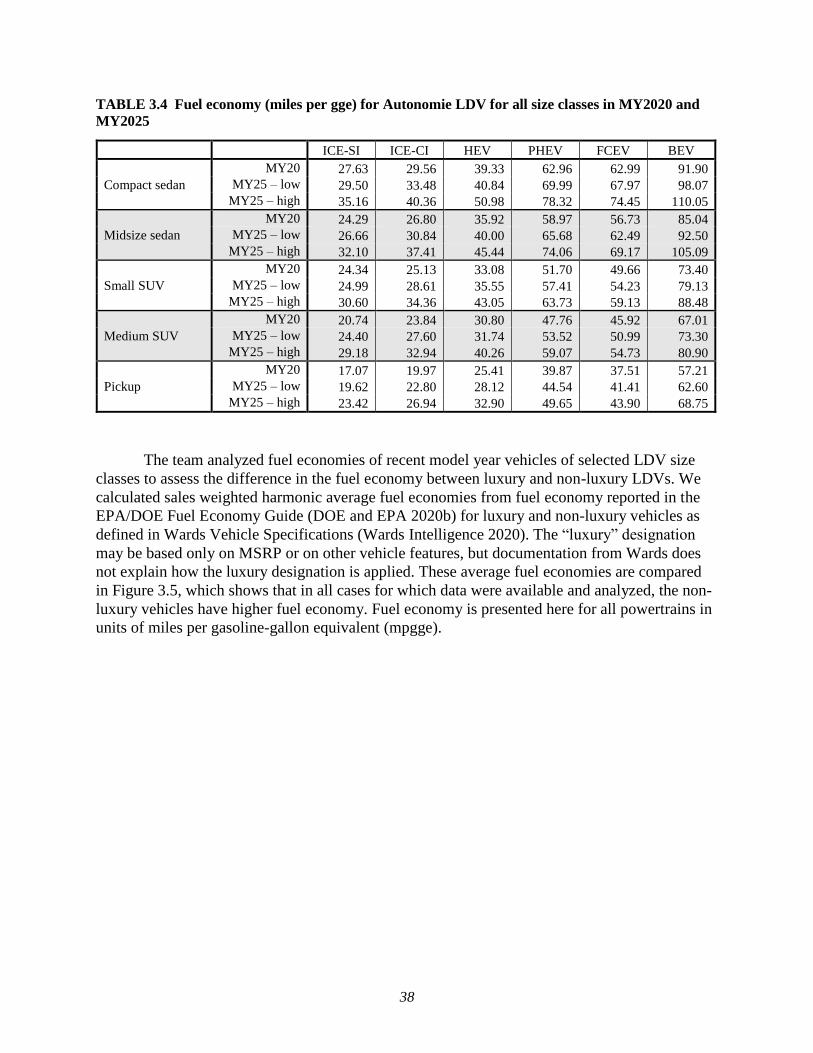
38
TABLE 3.4 Fuel economy (miles per gge) for Autonomie LDV for all size classes in MY2020 and
MY2025
ICE-SI ICE-CI HEV PHEV FCEV BEV
Compact sedan
MY20 27.63 29.56 39.33 62.96 62.99 91.90
MY25 – low 29.50 33.48 40.84 69.99 67.97 98.07
MY25 – high 35.16 40.36 50.98 78.32 74.45 110.05
Midsize sedan
MY20 24.29 26.80 35.92 58.97 56.73 85.04
MY25 – low 26.66 30.84 40.00 65.68 62.49 92.50
MY25 – high 32.10 37.41 45.44 74.06 69.17 105.09
Small SUV
MY20 24.34 25.13 33.08 51.70 49.66 73.40
MY25 – low 24.99 28.61 35.55 57.41 54.23 79.13
MY25 – high 30.60 34.36 43.05 63.73 59.13 88.48
Medium SUV
MY20 20.74 23.84 30.80 47.76 45.92 67.01
MY25 – low 24.40 27.60 31.74 53.52 50.99 73.30
MY25 – high 29.18 32.94 40.26 59.07 54.73 80.90
Pickup
MY20 17.07 19.97 25.41 39.87 37.51 57.21
MY25 – low 19.62 22.80 28.12 44.54 41.41 62.60
MY25 – high 23.42 26.94 32.90 49.65 43.90 68.75
The team analyzed fuel economies of recent model year vehicles of selected LDV size
classes to assess the difference in the fuel economy between luxury and non-luxury LDVs. We
calculated sales weighted harmonic average fuel economies from fuel economy reported in the
EPA/DOE Fuel Economy Guide (DOE and EPA 2020b) for luxury and non-luxury vehicles as
defined in Wards Vehicle Specifications (Wards Intelligence 2020). The “luxury” designation
may be based only on MSRP or on other vehicle features, but documentation from Wards does
not explain how the luxury designation is applied. These average fuel economies are compared
in Figure 3.5, which shows that in all cases for which data were available and analyzed, the non-
luxury vehicles have higher fuel economy. Fuel economy is presented here for all powertrains in
units of miles per gasoline-gallon equivalent (mpgge).
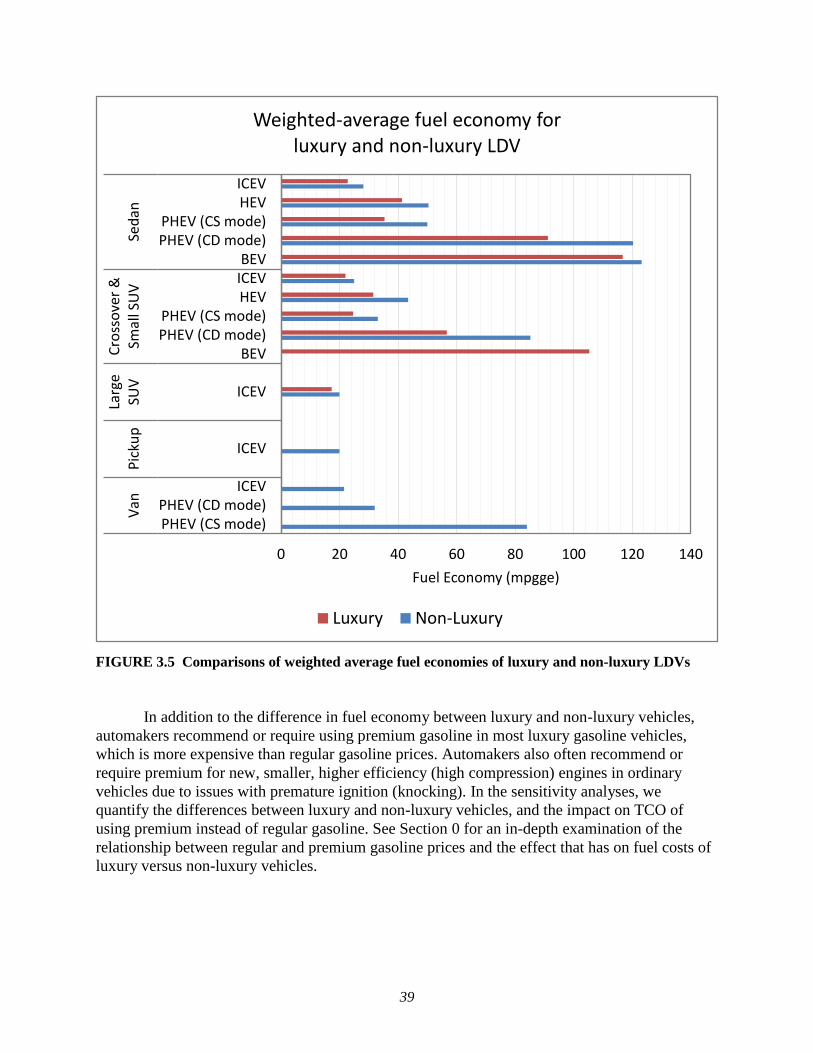
39
FIGURE 3.5 Comparisons of weighted average fuel economies of luxury and non-luxury LDVs
In addition to the difference in fuel economy between luxury and non-luxury vehicles,
automakers recommend or require using premium gasoline in most luxury gasoline vehicles,
which is more expensive than regular gasoline prices. Automakers also often recommend or
require premium for new, smaller, higher efficiency (high compression) engines in ordinary
vehicles due to issues with premature ignition (knocking). In the sensitivity analyses, we
quantify the differences between luxury and non-luxury vehicles, and the impact on TCO of
using premium instead of regular gasoline. See Section 0 for an in-depth examination of the
relationship between regular and premium gasoline prices and the effect that has on fuel costs of
luxury versus non-luxury vehicles.
0 20 40 60 80 100 120 140
PHEV (CS mode)PHEV (CD mode)
ICEV
ICEV
ICEV
BEVPHEV (CD mode)PHEV (CS mode)
HEVICEVBEV
PHEV (CD mode)PHEV (CS mode)
HEVICEV
Van
Pic
kup
Larg
eSU
VC
ross
ove
r &
Smal
l SU
VSe
dan
Fuel Economy (mpgge)
Weighted-average fuel economy for luxury and non-luxury LDV
Luxury Non-Luxury
40
3.2.2.3. MHDV Fuel Economy
Autonomie simulation results served as the primary source for consistent MHDV fuel
consumption estimates. These simulations used regulatory drive cycles and weighting factors
from the Phase 2 MDHD fuel efficiency standards (EPA and NHTSA 2016). We obtained fuel
economy results for MHDVs for low and high technology progress in years 2020-2050
(Vijayagopal et al. 2019). In addition, we collected some fuel economy values for selected
MHDVs from literature sources, including fuel consumption during idling and power-take-off
(PTO). Certain commercial vehicles, e.g., utility trucks, can consume a significant amount of
energy during idling and PTO use. We provide an in-depth discussion on how idling may affect
overall fuel use for commercial vehicles in Section 3.7.3.2. We also use limited case studies to
show the important of payload variation, though the analysis presented here uses average
payloads.
Fuel economy data of various MHDV types are used. For illustration, Figure 3.6 shows
Autonomie simulation fuel consumption results for the class 4 delivery truck and the class 8 day-
cab tractor trailer. Here, the y-axis represents the fuel consumption rate in diesel-gallon
equivalent per mile (dge/mi). For the medium-duty delivery truck, the fuel economy follows the
same trend as the LDV in Figure 3.4, with ICE consuming the most fuel, with hybridized
vehicles performing better, and BEVs consuming the least energy. However, for the day-cab
truck, most powertrains have very similar total fuel consumption. This is because the driving
cycle is primarily at highway speed, where hybridized powertrains offer the least benefit over
conventional ICE, while also carrying an extra weight burden. Table 3.5 summarizes MY2020
and MY2025 fuel economy for all seven size classes considered.
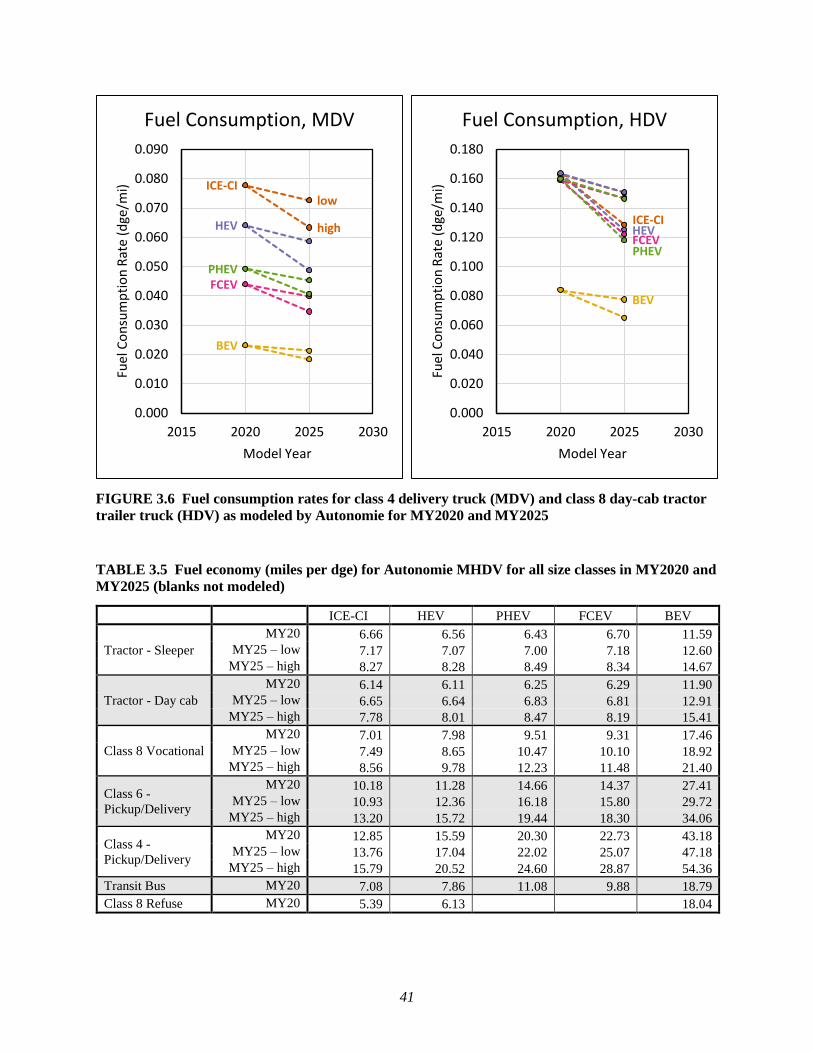
41
FIGURE 3.6 Fuel consumption rates for class 4 delivery truck (MDV) and class 8 day-cab tractor
trailer truck (HDV) as modeled by Autonomie for MY2020 and MY2025
TABLE 3.5 Fuel economy (miles per dge) for Autonomie MHDV for all size classes in MY2020 and
MY2025 (blanks not modeled)
ICE-CI HEV PHEV FCEV BEV
Tractor - Sleeper
MY20 6.66 6.56 6.43 6.70 11.59
MY25 – low 7.17 7.07 7.00 7.18 12.60
MY25 – high 8.27 8.28 8.49 8.34 14.67
Tractor - Day cab
MY20 6.14 6.11 6.25 6.29 11.90
MY25 – low 6.65 6.64 6.83 6.81 12.91
MY25 – high 7.78 8.01 8.47 8.19 15.41
Class 8 Vocational
MY20 7.01 7.98 9.51 9.31 17.46
MY25 – low 7.49 8.65 10.47 10.10 18.92
MY25 – high 8.56 9.78 12.23 11.48 21.40
Class 6 -
Pickup/Delivery
MY20 10.18 11.28 14.66 14.37 27.41
MY25 – low 10.93 12.36 16.18 15.80 29.72
MY25 – high 13.20 15.72 19.44 18.30 34.06
Class 4 -
Pickup/Delivery
MY20 12.85 15.59 20.30 22.73 43.18
MY25 – low 13.76 17.04 22.02 25.07 47.18
MY25 – high 15.79 20.52 24.60 28.87 54.36
Transit Bus MY20 7.08 7.86 11.08 9.88 18.79
Class 8 Refuse MY20 5.39 6.13 18.04
lowICE-CI
highHEV
FCEVPHEV
BEV
0.000
0.010
0.020
0.030
0.040
0.050
0.060
0.070
0.080
0.090
2015 2020 2025 2030
Fuel
Co
nsu
mp
tio
n R
ate
(dge
/mi)
Model Year
Fuel Consumption, MDV
ICE-CIHEVFCEVPHEV
BEV
0.000
0.020
0.040
0.060
0.080
0.100
0.120
0.140
0.160
0.180
2015 2020 2025 2030Fu
el C
on
sum
pti
on
Rat
e (d
ge/m
i)Model Year
Fuel Consumption, HDV

42
Another important consideration for the fuel consumption by commercial vehicles is
payload, especially for freight vehicles. For example, a tractor trailer operating at maximum
gross vehicle weight rating can weigh more than twice as much as a tractor pulling an empty
trailer. Duty cycles can also vary considerably both across and within applications, with varying
proportions of highway speeds and lower speed transient cycles with more frequent braking and
acceleration events. Duty cycles specific to each application are important considerations in
determining alternative powertrain applicability, design, and TCO. Figure 3.7 shows the
variation in fuel economy of a Kenworth class 8 tractor trailer under different driving cycles and
payloads (Reinhart 2015). Five driving cycles and three different payload levels were considered.
The figure shows significant variation in fuel economy, ranging from 3.78 miles per gallon
(MPG) for the CARB driving cycle with full payload to 9.26 MPG for 55 MPH driving cycle
with empty payload. For all driving cycles, the payload assumption is an important factor that
affects the fuel economies. Generally, higher payloads result in lower fuel economy in terms of
miles per gallon, but higher freight efficiency in terms of ton-mile per gallon, which is reflected
by Figure 3.8. This figure shows the variation in freight efficiency in ton mile per gallon for the
same driving cycles and payload levels as shown in Figure 3.7. 50% payload is 23,020 pounds
and 100% is 46,040 pounds in cargo weight.
Due to the high variation in payload and the difficulty in modeling the payload of a
general vehicle of certain characteristics, we do not include adjustments in fuel economy due to
payload in our calculations. The effect of payload on fuel economy is important future work.
FIGURE 3.7 Mile per gallon variation in truck fuel economies with different driving cycles and
payload levels for Kenworth long haul tractors (data from Reinhart 2015)
5.90
9.26
7.55 7.71 7.42
4.63
8.12
6.756.20
6.56
3.78
7.22
6.11
5.135.80
0
1
2
3
4
5
6
7
8
9
10
CARB 55MPH 65MPH WHVC NESCCAF
Mile
s p
er G
allo
n
Fuel Efficiency for Class 8 Long-Haul Tractor
0% Payload 50% Payload 100% Payload

43
FIGURE 3.8 Ton-mile per gallon variation in truck fuel economies with different driving cycles
and payload levels for Kenworth long haul tractors (data from Reinhart 2015)
3.2.3. Validation of Retail Price and Fuel Economy
In this section, we compare Autonomie simulation fuel economy and retail price results
with real-world values from FuelEconomy.gov for selected powertrain types and size classes
(DOE and EPA 2020a). We use simulated values in order to examine certain vehicle and
powertrain types that may not exist in the real-world, such as AFV pickup trucks, among others.
They are also advantageous in that they allow us to examine future MY vehicles, and to make
comparisons across powertrains with comparable characteristics of the vehicles. However,
simulated vehicles can differ from real-world ones for a variety of reasons, and particularly with
fuel economy and retail price. Table 3.6 compares MY2020 Autonomie simulation retail price
results with real-world data. The real-world data was sales-weighted data, acquired from Wards
Auto, with the fuel economy from the FuelEconomy.gov database, and the retail price equal to
the base trim MSRP for that vehicle (Wards Intelligence 2020; DOE and EPA 2020a). Each cell
in Table 3.6 indicates the percentage difference between the Autonomie values and the real-
world values (i.e., a positive value indicates that the Autonomie price is higher; a blank cell
indicates that there is no real-world vehicle of that type). While not included in this table,
Autonomie also models a BEV400, which was not commercially available in 2019. Noting
differences in retail price is key, as MSRP affects nearly every other cost component in the TCO,
explicitly for the vehicle cost, but also for financing, insurance, repairs, and taxes and fees, as
described in the sections to follow. Lower retail prices for certain powertrain types may
significantly reduce the TCO for these vehicles.
0 0 0 0 0
53
93
7871 76
87
166
141
118
134
0
20
40
60
80
100
120
140
160
180
200
CARB 55MPH 65MPH WHVC NESCCAF
Ton
-Mile
s p
er G
allo
nFreight Efficiency for Class 8 Long-Haul Tractor
0% Payload 50% Payload 100% Payload

44
Using a sales-weighted average, the Autonomie simulation results nearly perfectly
estimate retail prices for ICE-SI vehicles, though it varies from one size class to another. For
HEVs, the Autonomie simulation results overestimate retail prices by about 9% on average. This
is a key difference; although HEVs already have the lowest TCO over a 15-year window, a
downward adjustment in the retail price of our modeled HEVs would further decrease the TCO
of vehicles with a hybridized powertrain.
For PHEVs, Autonomie slightly underestimates the retail price compared to the real-
world vehicles, though it severely overestimates the price of longer-range PHEVs. As a stand-in
for PHEV20, real-world PHEV with between 15 and 25 miles of all-electric range were used; for
PHEV50, any real-world PHEV with over 30 miles of all-electric range was considered. This
eliminated many, but not all, of the high-power luxury short-range PHEV available for sale
today. Once again, an overestimation of retail prices for these longer-range PHEVs is key; as the
TCO of the ICE-SI and PHEV50 are so similar, even a small decrease in the retail price of the
PHEVs could easily affect the rank order of these two powertrain types. For both BEV200s and
BEV300s, and severely for all BEVs in terms of sales-weighted average, Autonomie
overestimates retail prices. One possible explanation for this discrepancy is the manufacturing to
retail price equivalent markup factor (RPE). For this analysis, we use an RPE of 1.5 for all
powertrain types; however, it is thought that a single value may fail to capture the complexity in
original equipment manufacturer (OEM) markups for emerging technologies (Kelly 2020).
Specifically, it is thought that AFVs may be sold at lower profit margins; using a lower RPE
factor for HEVs and BEVs might explain some of the discrepancy between the real-world and
simulated values.
Regardless of RPE, the vehicle costs used in our base case analysis severely overestimate
the cost of BEVs in comparison to real-world data. Once again, this can have a large impact on
TCO, as nearly all of the component costs scale with retail price. Although our current results
indicate that BEVs have the highest lifetime TCO, a downward adjustment on the retail price of
BEVs similar to that suggested by our real-world comparison could make BEV TCO as low or
lower than that of the other powertrain types. In general, lower retail prices for all of these
alternative fuel vehicles may make them more competitive or even cheaper than conventional
counterparts, in terms of lifetime TCO, than the current results indicate. Although there are
limited data for FCEVs and diesel vehicles, Autonomie tends to underestimate the retail price of
these powertrain types across all size classes.
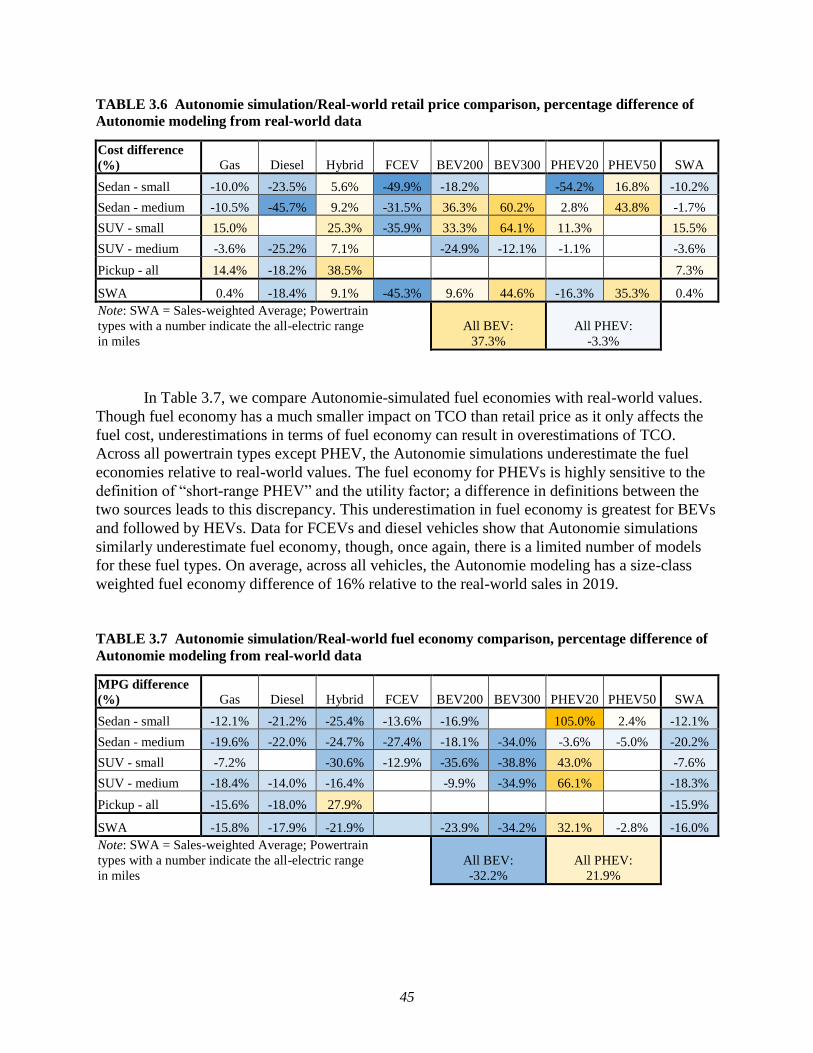
45
TABLE 3.6 Autonomie simulation/Real-world retail price comparison, percentage difference of
Autonomie modeling from real-world data
Cost difference
(%) Gas Diesel Hybrid FCEV BEV200 BEV300 PHEV20 PHEV50 SWA
Sedan - small -10.0% -23.5% 5.6% -49.9% -18.2% -54.2% 16.8% -10.2%
Sedan - medium -10.5% -45.7% 9.2% -31.5% 36.3% 60.2% 2.8% 43.8% -1.7%
SUV - small 15.0% 25.3% -35.9% 33.3% 64.1% 11.3% 15.5%
SUV - medium -3.6% -25.2% 7.1% -24.9% -12.1% -1.1% -3.6%
Pickup - all 14.4% -18.2% 38.5% 7.3%
SWA 0.4% -18.4% 9.1% -45.3% 9.6% 44.6% -16.3% 35.3% 0.4%
Note: SWA = Sales-weighted Average; Powertrain
types with a number indicate the all-electric range
in miles
All BEV:
37.3%
All PHEV:
-3.3%
In Table 3.7, we compare Autonomie-simulated fuel economies with real-world values.
Though fuel economy has a much smaller impact on TCO than retail price as it only affects the
fuel cost, underestimations in terms of fuel economy can result in overestimations of TCO.
Across all powertrain types except PHEV, the Autonomie simulations underestimate the fuel
economies relative to real-world values. The fuel economy for PHEVs is highly sensitive to the
definition of “short-range PHEV” and the utility factor; a difference in definitions between the
two sources leads to this discrepancy. This underestimation in fuel economy is greatest for BEVs
and followed by HEVs. Data for FCEVs and diesel vehicles show that Autonomie simulations
similarly underestimate fuel economy, though, once again, there is a limited number of models
for these fuel types. On average, across all vehicles, the Autonomie modeling has a size-class
weighted fuel economy difference of 16% relative to the real-world sales in 2019.
TABLE 3.7 Autonomie simulation/Real-world fuel economy comparison, percentage difference of
Autonomie modeling from real-world data
MPG difference
(%) Gas Diesel Hybrid FCEV BEV200 BEV300 PHEV20 PHEV50 SWA
Sedan - small -12.1% -21.2% -25.4% -13.6% -16.9% 105.0% 2.4% -12.1%
Sedan - medium -19.6% -22.0% -24.7% -27.4% -18.1% -34.0% -3.6% -5.0% -20.2%
SUV - small -7.2% -30.6% -12.9% -35.6% -38.8% 43.0% -7.6%
SUV - medium -18.4% -14.0% -16.4% -9.9% -34.9% 66.1% -18.3%
Pickup - all -15.6% -18.0% 27.9% -15.9%
SWA -15.8% -17.9% -21.9% -23.9% -34.2% 32.1% -2.8% -16.0%
Note: SWA = Sales-weighted Average; Powertrain
types with a number indicate the all-electric range
in miles
All BEV:
-32.2%
All PHEV:
21.9%

46
Real-world comparison of fuel economy for medium- and heavy-duty vehicles across
powertrains is much more limited as there is extreme data scarcity for alternative fuel vehicles in
the MHDV sector, since only diesel and compressed natural gas vehicles (CNGV) have seen
appreciable historical sales. Furthermore, the available real-world data for both retail price and
fuel economy of MDHVs is much more limited than LDVs. We compared Autonomie results
with existing real-world retail price data from Commercial Truck Trader and Truck Paper (CTT
2019; Truck Paper 2019). While there is uncertainty and variation based on the vocation and
other factors, we find that for the pickup and delivery and vocational trucks, sleeper and day
cabs, the difference between the Autonomie and real-world retail prices for diesel trucks is less
than 10%. We are aware that the Autonomie retail prices for the class 8 bus and refuse truck are
lower than other sources. Real-world bus prices tend to be much higher than the Autonomie
results, but there is significant variation in bus prices due to configuration options, sources of
contract, federal grants, and certain types of restrictions.
We compared Autonomie fuel economy results with existing real-world analysis as well
as the model year 2021 estimates from the EPA Regulatory Impact Analysis (RIA) for the Phase
2 MHDV fuel efficiency standards (EPA and NHTSA 2016). We find that the simulated results
for class 8 sleeper and day cab trucks are within 2% of the real-world analysis (Stephens et al.
2020) and only slightly worse for the RIA comparison: within about 5%. While the other
MHDVs are generally modeled as more fuel efficient than the fuel economy regulations, a direct
comparison based on both the weight class and the vocation is sometimes unavailable. For the
MHDV vocations other than sleepers and day cabs, the Autonomie simulations results are
generally within 15% of the existing real-world analysis.
Though there are discrepancies between the Autonomie simulation results and real-world
values in terms of both retail price and fuel economy, there are certain distinct reasons for using
the simulated values. For example, modeling vehicles that do not yet exist on the market is one
advantage of using simulated values. Furthermore, simulations represent distinct configurations
and duty cycles rather than real-world, highly variable operations that depend on payload,
geography, driving style, and day-to-day operational demands. This enables fair one-to-one
comparisons across powertrain types and model years and, as such, avoids issues arising from
use of real-world average fuel economies. The focus of this study is not to create new vehicle
cost or fuel economy estimates; therefore, we use the Autonomie modeling results as they are
available for a wide variety of powertrain types, size classes and vocations, and model years.
However, we do find it valuable to compare the results with real-world data to note several key
differences that should be taken into account when considering the TCO results in this report.
3.2.4. Vehicle Financing
In this analysis, vehicle financing charges are payments of interest on a loan taken out to
purchase the vehicle (and payments for processing the loan, but these are assumed to be
incorporated into the interest rate for analytical simplicity). For a given vehicle, calculations are
made for the cost of interest on a typical loan with a fixed monthly payment, as shown in the
following equation:

47
𝐹𝑖𝑥𝑒𝑑 𝑃𝑎𝑦𝑚𝑒𝑛𝑡 = 𝑉𝑒ℎ𝑖𝑐𝑙𝑒 𝐶𝑜𝑠𝑡 × 𝑅𝑎𝑡𝑒 × (1 + 𝑅𝑎𝑡𝑒)𝑛
(1 + 𝑅𝑎𝑡𝑒)𝑛 − 1 Eq 3.2
The financing cost is directly proportional to the vehicle retail price. For monthly
payments, the rate in the above equation is the monthly interest rate, approximately one-twelfth
of the APR. This is calculated using standard loan parameters, assuming a 12% down payment, a
63-month loan term, and a 4% APR (in constant-dollars). These parameters are described in
greater detail in Section 2.3.1. As the loan reaches maturity, a growing fraction of the monthly
payment is applied to the principal, as opposed to the interest.
This analysis does not explicitly account for leased vehicles. In 2019, 30% of new vehicle
purchases were leased in the United States (Zabritski 2020). Lease shares vary widely
geographically, with approximately 3% of new vehicles leased in Arkansas to over two-thirds of
vehicles in Michigan. In this analysis, we assume that all vehicles are purchased outright (with or
without financing).
In the sensitivity analysis, we account for interest rates which are 0% and 8%,
representing sales incentives from the dealership and loan terms for less creditworthy consumers,
respectively.
3.2.5. Vehicle Cost / Depreciation
In the following section, we introduce vehicle depreciation and then describe the
methodology for determining the resale value of a certain used LDV. Next, we provide some
important results, including the vehicle cost input for the TCO calculations and key depreciation
insights across powertrains and mass-market/luxury. We then present two sensitivity cases,
including a discussion on battery salvage value, followed by MHDV vehicle cost data and
results.
If depreciation is assumed to incur every year, but we only want to discount actual cash
flows, then the net vehicle ownership cost for a vehicle purchased prior to year 1 and sold in year
m is:
𝑁𝑒𝑡 𝑉𝑒ℎ𝑖𝑐𝑙𝑒 𝐶𝑜𝑠𝑡 = ∑ 𝑉𝑒ℎ𝑖𝑐𝑙𝑒 𝐶𝑜𝑠𝑡𝑛
𝑚
1
= ∑(𝑅𝑉𝑛−1 − 𝑅𝑉𝑛)
𝑚
1
= (𝐶−𝑅𝑉𝑚) Eq 3.3
In this telescoping sum, C represents the initial vehicle cost, RVn represents the residual
value at the end of year n. Therefore, the goal is then to estimate a resale value based on the
characteristics of the vehicle of interest. For LDVs, we provide resale values for each year based
on the MSRP, powertrain, market segment (mass-market/luxury), and size class of the vehicle.
For MHDV, we provide resale values for each year based on the MSRP, weight class/body type,
and mileage of the vehicle.
48
Depreciation is one of the largest factors in a calculation of the TCO of a vehicle,
especially in the first few years of the vehicle’s life (Hamza et al. 2020; AAA 2019). However,
the vehicle is an asset which retains resale value through its life. Since most new car buyers do
not own their vehicle for the entirety of its lifetime, residual value is an important consideration
in the TCO calculation for a new car. For those that lease a vehicle, for whom resale value may
not seem to be as important as the vehicle need not be resold, the depreciation is factored into the
monthly/annual vehicle leasing costs.
In general, many factors affect the residual value of used vehicles. The National
Automobile Dealers Association (NADA) User Guide, Autoblog, Consumer Reports, Kelley
Blue Book (KBB), and Edmunds all provide estimations of used car resale values based on
vehicle conditions. The major factors these providers utilize when determining price include
vehicle make, model and model year, mileage, location, overall condition, and some other
vehicle characteristics such as specific trim lines or additional equipment. Variation is especially
evident in the case of PEVs, whose battery performance and range, as well as accessibility to
charging, may have a large effect on residual value. Additional factors such as market
fluctuations, economic impacts, and various incentives at the federal, state, and local levels also
affect depreciation; many of these exogenous factors are not directly captured in our analysis.
Despite the scarcity of data, several past studies have explored the resale value of PEVs.
In 2016, Zhou et al. (2016) analyzed residual value across different powertrains using adjusted
(i.e., accounting for federal PEV incentives) retention rate. They found that PEV retention rates
were comparable to HEVs and ICEVs in the early years but somewhat lower at three years and
beyond. In a follow-up study, Guo and Zhou (2019) found that the long-range, high-performance
Tesla Model S holds value better than any other vehicle type evaluated. HEVs and PHEVs were
comparable to each other and held slightly less value than conventional models, but significantly
more than short-range BEVs. In their TCO calculation, Hamza et al. (2020) similarly found that
PHEVs and ICEVs hold value relatively the same, while BEVs experience 11% lower 5-year
retention. This could be due to many factors, including actual or a perceived fear of battery
degradation or range/charging availability anxiety, as battery range is the most important vehicle
aspect for consumers when considering purchasing a BEV (Schoettle and Sivak 2018), and to
decreasing prices of new BEVs, which lead to lower prices for used PEVs (Holweg and
Kattuman 2006).
To determine the residual value of LDVs, we assume that when an owner decides to sell
their vehicle, they choose the greatest of three options:
1) Sell the vehicle on the used market
2) Scrap the vehicle for $500, or analytically equivalently, take an IRS deductible charitable
donation of $500 for donating the vehicle
3) For PHEVs and BEVs, salvage the battery to be repurposed for further use
We describe the methodology for determining the resale value of the used vehicle below.
While the IRS deduction is not quite equivalent to cash value, we assume that consumers value
the deductible at $500 regardless of the age, mileage, or any other characteristic of the vehicle
(IRS 2015). For the battery salvage value, we use a baseline case of $0 for the primary analysis.

49
A PEV owner can salvage the battery by selling it for second-life applications or recycling;
unfortunately, both second-life applications and recycling are not profitable at present and will
remain so in the near future (Dai et al. 2019; Gaines 2019; Harper et al. 2019). We examine a
non-zero battery salvage value in the sensitivity analysis.
3.2.5.1. LDV Depreciation
We access data on the value of used light-duty vehicles from Edmunds.com (Edmunds
TMV 2020). Edmunds provides “True Market Value” (TMV) of used vehicles based on real
transactions. These estimates are updated monthly and reflect market conditions. Edmunds also
projects annual depreciation for the first five years of a new vehicle’s life as a part of their True
Cost to Own® data (Edmunds TCO 2020). Edmunds True Cost to Own® provides future
projections and is not based on actual transactions; for this reason and to eliminate the projection
bias by Edmunds, we selected the first method (TMV).
We selected Edmunds over other data sources because many of the other third-party
sources such as KBB, Autoblog and Consumer Reports only provide TCO-formulated
depreciation costs, which are based on projected costs rather than actual transaction prices.
Furthermore, while we are aware of other sources that provide self-reported transaction data,
such as truecar.com, it is challenging to validate the self-reported values with the true transaction
prices. Finally, while there are sources such as KBB, Cars.com, Craigslist and Facebook
Marketplace that provide vehicle listing prices, it is difficult to ascertain the relationship between
listing price and transaction price. Our research purpose is to quantify the general vehicle
depreciation trends by vehicle class, segment, and powertrain type, not by make and model. As
such, we selected one data source, Edmunds, as (1) its TMV data are based on real transactions,
and (2) to be consistent with the data source used in other sections (e.g. insurance, maintenance
and repair). Future research is needed to compare the market values estimates from different
resources.
The data presented here represent TMV from July 2020 for MYs 2013–2019. As opposed
to tracking TMV data for one MY over several years, this method provides a snapshot of TMV
estimates at the time of collection. For example, TMVs at year one are estimates of MY2019 in
2020 and TMVs at year three are estimates of MY2017 in 2020. All TMV values we collected
were for private party transactions for used vehicles in clean condition with 12,000 annual VMT,
in between the average annual VMT for cars and light trucks reported by the Transportation
Energy Data Book (Davis and Boundy 2020). We performed a sensitivity analysis of annual
VMT and observed little effect on TMV for adjustments under several thousand annual VMT.
We selected 23 makes and 98 models (Table 3.8) for 51 zip codes: one in each of the
50 U.S. states and Washington D.C. While Edmunds provides TMV data for all available trim
lines, we selected the most popular 2019 trim line and then used the same trim for each previous
MY. These models were selected to cover different powertrain technologies, size classes, market
segments, and various popular manufacturer brands and originating countries. We began by
selecting the best-selling non-conventional vehicles; our analysis included 33 best-selling PEV
models, 22 best-selling HEV models, and the 3 FCEV models in the U.S., accounting for 97%

50
and 96% of total 2019 PEV and HEV sales (ANL 2021b). To compare depreciation rates for
alternative fuel vehicles with ICEVs, we picked conventional ICEV versions of the PEV, HEV,
and FCEV models (e.g., Kia Soul, Kia Soul EV). When a direct conventional counterpart was
unavailable, we picked a comparable model that fell into the same EPA size class and MSRP
range (e.g., Nissan Leaf, Nissan Altima). In total, our analysis included 40 ICEV models.
We obtained MSRP and size class data from the fueleconomy.gov website (DOE and
EPA 2020a) and PEV federal incentive data from the IRS website (IRS 2020). For models for
which federal incentives were being phased out during 2019 (GM, Tesla), we computed a 2019
sales-weighted average incentive (ANL 2021b). We aggregated depreciation by market segment
(luxury/mass-market) as defined by Wards (Wards Intelligence 2020).
TABLE 3.8 Makes and models selected for depreciation analysis
Make ICEV BEV PHEV HEV FCEV
Acura MDX, ILX,
RLX
MDX, RLX
Sport Hybrid
Audi A4, Q7 E-tron A8
BMW X6, 5 Series, 7
Series
i3 5 Series Plug-
in, 7 Series
Plug-in, i8
Cadillac XTS
Chevrolet Cruze, Malibu,
Spark
Bolt EV Volt Malibu Hybrid
Chrysler Pacifica Pacifica Hybrid
FIAT 500 500e
Ford Fusion, Escape Fusion Energi Fusion Hybrid,
C-Max Hybrid
Honda Civic, Accord Clarity Clarity Accord Hybrid,
Insight
Clarity
Hyundai Sonata, Kona Ioniq Electric,
Kona Electric
Sonata Plug-in,
Ioniq Plug-in
Sonata Hybrid,
Ioniq Hybrid
Nexo
Kia Optima, Soul Soul EV, Niro
EV
Optima Plug-in,
Niro Plug-in
Optima Hybrid,
Niro
Land Rover Range Rover,
Range Rover
Sport
Lexus ES350 ES300h,
RX450h,
NX300h
Lincoln MKZ MKZ Hybrid
Mercedes-Benz GLE-Class, G-
Class
B-Class Electric
Drive
GLC-Class
Mitsubishi Outlander Outlander Plug-
in
Nissan Sentra, Altima Leaf
Porsche Panamera,
Cayenne
Panamera Plug-
in, Cayenne
Plug-in
Subaru Crosstrek Crosstrek

51
TABLE 3.8 (Cont.)
Make ICEV BEV PHEV HEV FCEV
Tesla Model S, Model
X, Model 3
Toyota Camry, RAV4,
Highlander,
Avalon
Prius Prime Camry Hybrid,
RAV4 Hybrid,
Highlander
Hybrid, Avalon
Hybrid, Prius,
Prius c
Mirai
Volkswagen Golf GTI E-golf
Volvo XC90 XC90 Plug-in
To control for the effect of the federal tax incentive for PHEVs and BEVs, we define an
adjusted retention rate, ARRi, such that
𝐴𝑅𝑅𝑖 =𝑃0 − 𝐼 − ∆𝑖
𝑃0 − 𝐼, 𝑖 = 1,2,3, … Eq 3.4
where
ARRi = the adjusted retention rate at year i,
P0 = the original MSRP,
Δi = the accumulated depreciation through year i, and
I = the federal income tax credit applicable to a specific model.
For each vehicle’s MSRP, we used the 2019 MSRP of the most similar make and model
to minimize concerns about inflation across the analysis window. We also ran a sensitivity
analysis where P0 was equal to the MSRP in the year the car was sold as new (i.e. MSRP of
MY2017 for Δ3, etc.) and found no significant effect on ARRi. Ideally, we would include state
and dealer incentives in addition to the federal one; however, it is very difficult to track these
incentives as they change over time and may not be applied to each vehicle.
Using the ARR allows us to normalize across MSRPs and powertrain types that qualify
for different federal tax credits. As discussed by Zhou et al. (2016), adjusted retention rate is a
more objective metric for comparing depreciation of BEVs, PHEVs, and conventional vehicles;
since the Edmunds TMV data is based on real-world value, they are relative to this adjusted
initial cost. As such, we use ARR. In this case, the cumulative depreciation through year i is
given by
𝑃0 − 𝐼 − 𝑇𝑀𝑉𝑖 = (𝑃0 − 𝐼)(1 − 𝐴𝑅𝑅𝑖), 𝑖 = 1,2,3, … Eq 3.5
where TMVi = the resale value in year i. In order to calculate a value for ARRi for each year i of
the lifetime of a vehicle, accounting for effects of powertrain, market segment, and size class, we
disaggregate the data by powertrain and market segment (luxury/mass-market); later, we
performed an adjustment for the size class.

52
Figure 3.9 shows the average ARR of different powertrain types for each MY in luxury
and mass markets. In general, luxury vehicles tend to depreciate more slowly than mass-market
vehicles. We also see that BEVs and PHEVs depreciate more quickly than their HEV and ICEV
counterparts do. We aggregated vehicle size class into the two regulatory size classes, light truck
(Small SUV, Standard SUV, Minivan) and car (all other LDV) to examine depreciation by
powertrain type. Further disaggregation (by vehicle type) is not considered in order to maintain
sufficiently large samples for analysis by powertrain. The ARRs plotted in Figure 3.10 show the
average ARR for different powertrains for cars (shown as solid lines) and for light trucks (shown
as dashed lines). Figure 3.10 shows that light trucks have higher adjusted retention rates than
cars across all powertrains. The difference between light trucks and cars is higher for alternative
fuel vehicles.
FIGURE 3.9 Average annual ARR by powertrain and market segment. Solid lines represent
luxury vehicles while dashed lines represent mass market vehicles.
0%
10%
20%
30%
40%
50%
60%
70%
80%
90%
100%
MY20 MY19 MY18 MY17 MY16 MY15 MY14 MY13
Ad
just
ed R
eten
tio
n R
ate
Model Year
BEV FCEV HEV ICEV PHEV
PowertrainMarket Segment
LuxuryMass Market

53
FIGURE 3.10 Average annual ARR by powertrain and regulatory size class. Solid lines
represent cars while dashed lines represent light trucks.
In order to forecast depreciation for the lifetime of any generalized vehicle, we fit an
exponential model of the form for the adjusted retention rate ARRi,l,p as a function of age (i),
powertrain type (p), and luxury classification (l)
𝐴𝑅𝑅𝑖,𝑙,𝑝 = 𝑏𝑙,𝑝 × 𝑒𝑥𝑝(𝑘𝑙,𝑝 ∙ 𝑖), Eq 3.6
where exp(kl,p) is the percentage value retention from the previous year for a vehicle of
luxury classification l and powertrain p, and
bl,p is a scaling factor representing the loss in residual value immediately upon initial sale,
assuming a constant annual depreciation rate (percentage of previous year resale value) for
vehicles in each powertrain/market segment subset. As exp(kl,p) is the percentage value retention
from the previous year, the annual depreciation rate (percentage decrease in resale value for each
one-year increment in age) is calculated by [1 − exp(𝑘𝑙,𝑝)]. While there are several possible
methods to fit an exponential model of the TMV data, we found little variation among the
methods we explored; all fell within or near the 68% prediction interval examined in the
sensitivity analysis (i.e. within approximately one standard deviation) for the method we chose.
We fit the function only starting after the first year (years 1-7) and did not use the initial sales
price as a data point because the depreciation from year 0 to year 1 is not representative of the
0%
10%
20%
30%
40%
50%
60%
70%
80%
90%
100%
MY20 MY19 MY18 MY17 MY16 MY15 MY14 MY13
Ad
just
ed R
eten
tio
n R
ate
Model Year
BEV FCEV HEV ICEV PHEV
PowertrainSize Class
Car Light Truck

54
depreciation over the rest of the vehicle’s life (Krome 2018; Lewerer 2018), and so we introduce
the factor bl,p to account for this first-year depreciation. For each powertrain/market segment
subset, we estimated ARRi,l,p for each year by extrapolating the exponential fit from year 1 to the
entire analysis horizon. For FCEV, we do not make a distinction for luxury/mass-market due to
data scarcity. Table 3.9 summarizes the annual depreciation rates (percentage decrease relative to
previous year resale value) and the additional first-year depreciation for each powertrain and
luxury segment, as derived from the exponential model fitting. Note that the values for bl,p are on
top of the annual depreciation; at the end of the first year, a vehicle has depreciated by the
product of bl,p and exp(kl,p).
TABLE 3.9 Annual depreciation rates and first-year value adjustment by powertrain
and market segment
Annual Depreciation Rates, 1-exp(kl,p)
BEV FCEV HEV ICEV PHEV
Mass-market 19.2% 19.5%
12.1% 11.3% 16.6%
Luxury 17.4% 12.0% 14.5% 14.3%
Additional First-Year Value Adjustment, bl,p
BEV FCEV HEV ICEV PHEV
Mass-market 92.2% 71.4%
80.0% 80.3% 98.6%
Luxury 97.9% 77.8% 79.5% 85.9%
While Figures 3.9 and 3.10 show real-world data based on specific models, our TCO
calculations require a more generalized comparison between cars and light-trucks that is
independent of specific model years. We calculated the average difference between the ARRs of
the two size classes (cars and light trucks) within each powertrain type (but not segmenting by
luxury/mass-market due to small sample sizes), and adjusted the ARRs for each powertrain type
and market segment as a proportion of the average ARR for each year, where
𝐴𝑅𝑅𝑖,𝑝,𝑘 = 𝐴𝑅𝑅𝑖,𝑝 × (1 ± 𝑆𝑝 / 2), Eq 3.7
where i is the age of the vehicle, p labels each powertrain, k represents the size class, and Sp is
the adjustment for the size for each powertrain. The values of these proportional differences for
cars and light trucks are shown in Table 3.10. For all powertrain types, we make an upward
adjustment for light trucks and a downward adjustment for cars.
TABLE 3.10 Proportional differences (of average ARR) between size classes (Car and Light
trucks)
Powertrain BEV FCEV HEV ICEV PHEV
Difference 21.6% 14.1% 22.6% 3.2% 7.6%

55
We show a sample result for a mass-market ICEV in Figure 3.11. Individual data points
represent the residual value of actual vehicles as a function of vehicle age. The dashed line
represents ARR for ICE vehicles, while the solid lines represent the ARR for cars and light
trucks. An inset is included in Figure 3.11 to show the differences in ARR more clearly. Note
how light trucks exhibit marginally higher ARRs than cars throughout the analysis window,
though they both approach zero over time. Also note the variation in ARR of individual vehicles
decreases from initial purchase through the end of the data window (years 6-7).
FIGURE 3.11 Size-class adjusted ARR for mass-market ICEV used as TCO input
0
0.1
0.2
0.3
0.4
0.5
0.6
0.7
0.8
0.9
1
0 1 2 3 4 5 6 7 8 9 10 11 12 13 14 15
AR
R
Year
Cars Cars Exponential Model Light Trucks Light Trucks
0.4
0.45
0.5
0.55
0.6
1 2 3 4 5 6 7
AR
R
Year
56
Comparing depreciation across powertrains, we find some interesting differences. As
shown in Figure 3.9, both BEVs and PHEVs tend to have higher ARRs in early years before
dropping off between MY17 and MY16. A recent study conducted by Guo and Zhou (2019)
using TMV data on MY13 - MY16 found that powertrain accounted for over 10% of the
variance in 3-year ARR while we found that it explains less than 5%, indicating that depreciation
differences between powertrains are diminishing. We also found that BEVs and PHEVs both
have higher 3-year ARRs than their HEV and ICEV counterparts do, albeit only marginally
higher in the case of BEVs. This is a key difference from Guo and Zhou (2019), who found that
BEVs and PHEVs had lower 3-year ARRs than HEVs and ICEVs, substantially lower in the case
of BEVs.
This key finding indicates that both BEVs and PHEVs increasingly maintain higher
residual value; in fact, we found that BEVs and PHEVs have higher 3-year ARRs than ICEVs
and HEVs. This is consistent with recent industry reports of improving resale values of used
PEVs (e.g., Halvorson 2019). This suggests that alternative powertrain technology has reached
the point where it can compete with conventional models, after accounting for federal incentives;
possibly indicating growing consumer confidence in the capability of BEVs and PHEVs. This
could be due to improving BEV technology in recent MYs, including increased electric range
and charging capability. BEV sales-weighted average range increased from 228 miles in August
2017 to 304 miles in August 2020 (ANL 2021b). Moreover, sales-weighted average electricity
consumption across the BEV market, a measure of how much electricity is needed to drive a
given distance, decreased from 33 kWh/100 miles in August 2017 to 29 kWh/100 miles in
August 2020 (ANL 2021b). Both of these trends indicate increasing electric range for BEVs,
making them more viable alternatives to conventional powertrain vehicles.
In order to assess the uncertainty in depreciation during the first few years of a vehicle’s
life, we examined the variability in depreciation data within each powertrain/market segment
subset. We performed linear regression on a semi-log plot to obtain a 68% prediction interval for
the first 7 years after transforming back to the original variables. This provides an interval within
which we expect new data points to fall with 68% confidence. We selected a 68% interval to be
consistent with the plus/minus one standard deviation range, as described in Section 3.1. As an
example, Figure 3.12 shows a prediction interval for mass-market BEVs. In sensitivity analyses
involving deprecation at different confidence intervals, we find the counterintuitive result that
increased deprecation early in the vehicle life has little impact on TCO and can even lead to
decreased TCO over the lifetime of the vehicle. This is because a lower residual value decreases
the cost of insurance earlier in the vehicle lifetime (as will be described in Section 0), but the
ultimate sale price at the end of the analysis window (e.g., year 15) is very similar.
We also considered a non-zero battery salvage value for PHEVs and BEVs for a second
sensitivity analysis. While second life applications and recycling of PEV batteries are not
profitable at present, it is plausible that this could change in the future (Dai et al. 2019). We used
a model developed by NREL, as described in Section 3.2.1.1, that provides battery salvage value
as a percentage of age, battery size, and initial purchase price, accounting for the forecasted
future new battery price, forecasted battery health, relative cost of refurbishment, the used
product discount, and the retail price to manufacturing cost ratio of 1.5 (Neubauer and Pesaran
2010).

57
FIGURE 3.12 Sample prediction interval sensitivity analysis: Mass-market BEV
In calculating the value of the vehicle each year, we then used the greatest of the vehicle
resale value, battery salvage value, and $500 vehicle scrappage value. Using an Autonomie result
as an example, Figure 3.13 shows the maximum vehicle value of a mass-market BEV,
unadjusted for size class, with an MSRP of $34,649 and a battery size of 61.3 kWh. To estimate
initial battery price, we multiplied the battery size of the vehicle of interest by the current battery
manufacturing cost of $185/kWh (Boyd 2020). The solid line indicates the maximum of the three
curves. Note how the resale value is by far the greatest in early years but drops quickly due to the
fast depreciation of the vehicle in comparison to the battery. Salvaging the battery becomes the
most valuable option around year 9 and remains so until year 28 when it finally drops below the
$500 vehicle scrappage value. While this is beyond the analysis timeframe in this report, we
include this result to emphasize how late the battery salvage value finally falls below the vehicle
scrappage value. Without accounting for battery salvage, scrappage becomes more cost effective
than selling the vehicle around year 20.
0
0.1
0.2
0.3
0.4
0.5
0.6
0.7
0.8
0.9
1
0 1 2 3 4 5 6 7 8 9 10 11 12 13 14 15
AR
R
Year
ARR Data Low 68% PI High 68% PI Expon. (ARR Data)

58
FIGURE 3.13 Sample selection of maximum vehicle value (solid line = maximum)
3.2.5.2. MHDV Vehicle Depreciation
While the available MHDV depreciation data are more limited than for LDVs, we
analyzed listing price data from Commercial Truck Trader and TruckPaper.com (CTT 2019;
Truck Paper 2019). Note that the data used in this section come from listing data, not actual
transaction data nor estimated market values made by a third party. These data sources were
advantageous because they provided data about other characteristics of the vehicle beyond the
list price and are two of the only publicly available sources for such data. These data were
collected in September 2019 and included vehicle age, mileage, weight class, and body style in
addition to the list price. While we do not know the exact prices of each transaction, the listing
price is a good estimator of the sale price. Unfortunately, there is extreme data scarcity for
alternative powertrain vehicles in the medium-duty and heavy-duty sectors, since only
compressed natural gas vehicles have seen appreciable historical sales. Therefore, we are unable
to differentiate depreciation rates across powertrain types. However, we are able to subset the
listing price data into five vehicle segments defined by weight class and body type: class 8
sleeper tractors, class 8 Day Cab, class 8 Box Truck, class 6 Box Truck, and class 4 Step Van
(Davis and Boundy 2020).
For validation, we also accessed market value estimates from PriceDigests for two
segments, class 8 sleeper and day cab tractors (Carr 2020). Overall, the two datasets agree quite
closely, with Pearson correlation coefficients of 0.973 and 0.989 for sleeper cabs and day cabs,
respectively. Figure 3.14 also shows the agreement between the two datasets (in this case, for
sleepers), as well as how MHDVs depreciate with vehicle age.
$0
$5,000
$10,000
$15,000
$20,000
$25,000
$30,000
0 5 10 15 20 25 30
Val
ue
Ret
enti
on
Age of Vehicle
Market Value Battery Salvage Vehicle Scrappage

59
FIGURE 3.14 Comparison between price datasets, by age: class 8 sleeper cab tractors
To estimate the MHDV depreciation in the TCO calculation, we used a regression model
of the listing price data for each segment to estimate the price of a vehicle based on its age and
mileage. This functional form provides flexibility to account for the effect of both age and
cumulative mileage under different VMT schedule assumptions. For each segment, we estimated
a regression model for the residual value (RV) of the form
𝑅𝑉(𝑎, 𝑚) = 𝐶 ∙ exp(𝐴 ∙ 𝑎 + 𝑀 ∙ 𝑚) Eq 3.8
where C is the regression-estimated retail price at age 0 with no mileage,
a is the age in years,
m is the mileage in thousands,
exp(A) is the percentage price retention from the previous year, and
exp(M) is the percentage price retention from the previous 1000 miles,
which assumes that the effects of both age and mileage are exponential. Figures 3.14 (above) and
3.15 (below) demonstrate the effect of age and mileage on price for class 8 Sleepers, indicating
an exponential relationship for both; the other size classes show similar trends. In this case, C is
a scaling factor to account for differences in initial retail price across segments and can be
interpreted as the regression-estimated retail price for a vehicle in a given segment. In Figure
3.15 below, the dotted line shows an exponential fit for all model years simultaneously to guide
the eye and show the exponential dependence.
0 5 10 15 20
$0
$20,000
$40,000
$60,000
$80,000
$100,000
$120,000
$140,000
-100
-90
-80
-70
-60
-50
-40
-30
-20
-10
0
MH
DV
Pri
ce
Pri
ceD
iges
ts A
ccu
mu
late
d D
epre
ciat
ion
(%
)
AgePriceDigests Data MHDV Listing Price Data Expon. (MHDV Listing Price Data)
MHDV Price Data axis scaled to align with Accumulated Depreciation (%): 0% = Avg Year 0 Price; -100% = $0 Price
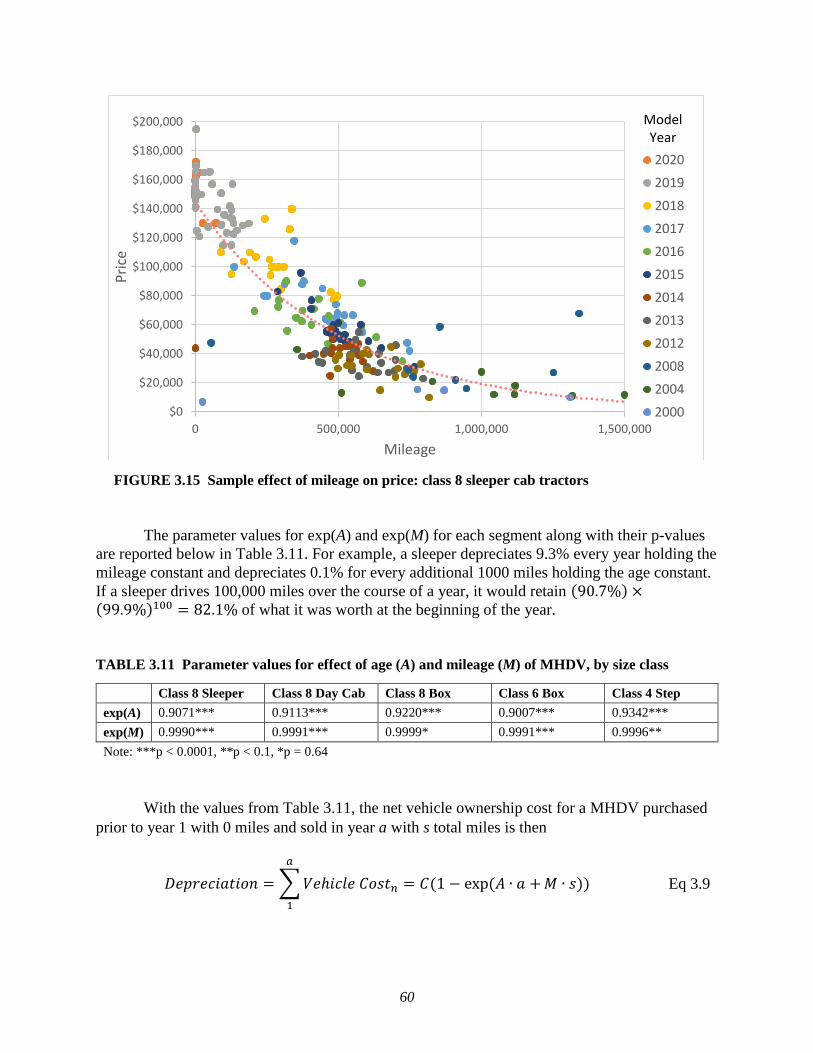
60
FIGURE 3.15 Sample effect of mileage on price: class 8 sleeper cab tractors
The parameter values for exp(A) and exp(M) for each segment along with their p-values
are reported below in Table 3.11. For example, a sleeper depreciates 9.3% every year holding the
mileage constant and depreciates 0.1% for every additional 1000 miles holding the age constant.
If a sleeper drives 100,000 miles over the course of a year, it would retain (90.7%) ×(99.9%)100 = 82.1% of what it was worth at the beginning of the year.
TABLE 3.11 Parameter values for effect of age (A) and mileage (M) of MHDV, by size class
Class 8 Sleeper Class 8 Day Cab Class 8 Box Class 6 Box Class 4 Step
exp(A) 0.9071*** 0.9113*** 0.9220*** 0.9007*** 0.9342***
exp(M) 0.9990*** 0.9991*** 0.9999* 0.9991*** 0.9996**
Note: ***p < 0.0001, **p < 0.1, *p = 0.64
With the values from Table 3.11, the net vehicle ownership cost for a MHDV purchased
prior to year 1 with 0 miles and sold in year a with s total miles is then
𝐷𝑒𝑝𝑟𝑒𝑐𝑖𝑎𝑡𝑖𝑜𝑛 = ∑ 𝑉𝑒ℎ𝑖𝑐𝑙𝑒 𝐶𝑜𝑠𝑡𝑛
𝑎
1
= 𝐶(1 − exp(𝐴 ∙ 𝑎 + 𝑀 ∙ 𝑠)) Eq 3.9
$0
$20,000
$40,000
$60,000
$80,000
$100,000
$120,000
$140,000
$160,000
$180,000
$200,000
0 500,000 1,000,000 1,500,000
Pri
ce
Mileage
2020
2019
2018
2017
2016
2015
2014
2013
2012
2008
2004
2000
Model Year

61
3.3. FUEL COSTS AND INFRASTRUCTURE
In this section, we examine energy prices to determine fuel costs for both LDVs and
MHDVs. The total cost for fuel over the analysis window can be expressed in the form:
𝐹𝑢𝑒𝑙 𝐶𝑜𝑠𝑡 = (𝑓𝑢𝑒𝑙 𝑝𝑟𝑖𝑐𝑒) × (𝑓𝑢𝑒𝑙 𝑐𝑜𝑛𝑠𝑢𝑚𝑝𝑡𝑖𝑜𝑛 𝑟𝑎𝑡𝑒)× (𝑎𝑛𝑛𝑢𝑎𝑙 𝑉𝑀𝑇) × (𝑎𝑛𝑎𝑙𝑦𝑠𝑖𝑠 𝑤𝑖𝑛𝑑𝑜𝑤)
Eq 3.10
Thus fuel cost is linked to the specific fuel, the vehicle fuel economy, and behavior by the
vehicle owner. Differences in price across fuel types can have a significant effect on the TCO of
various powertrain types as fuel is the second-largest cost component in the TCO for many
LDVs and MHDVs. We collected energy price data and projections of future prices for gasoline,
diesel, electricity, and hydrogen from the Energy Information Agency’s 2020 Annual Energy
Outlook (AEO), recent reports on VTO and HFTO prospective program benefits analyses (EIA
2020; Islam et al. 2020; Vijayagopal et al. 2019; Stephens et al. 2020), and the DOE’s
Alternative Fuel Data Center (AFDC) alternative fuel price reports (Bourbon 2020). We also
collected historical prices of regular and premium gasoline from the EIA, and analyzed the
difference between these over recent years to try to forecast premium gasoline prices in the
future. Fuel prices are assumed to be those delivered to the vehicle; we do not add additional
costs for fueling or charging infrastructure in our baseline case.
We created a database of energy price from compiling data from the sources described
above, totaling 123 records, including estimates for 2020 and projections for future years. The
2025 energy price assumptions used as the first year in the baseline TCO calculations are
aggregated in Table 3.12. In Table 3.12, we provide the cost-per-natural-unit for each type as
well as in dollar per gasoline gallon equivalent (gge) and diesel gallon equivalent (dge) for easy
comparison. We convert energy content between fuels using the lower heating values in the
Transportation Energy Data Book (Davis and Boundy 2020).
TABLE 3.12 2025 energy prices by type in natural units, $/gge, and $/dge
Energy Type cost-per-natural-unit $/gge $/dge
Gasoline (regular) $2.63 / gallon gasoline $2.63 $3.01
Gasoline (premium) $2.99 / gallon gasoline $2.99 $3.42
Diesel $3.08 / gallon diesel $2.69 $3.08
Hydrogen $9.41 / kg H2 $9.41 $10.77
Electricity (LDV) $0.129 / kWh $4.33 $4.96
Electricity (HDV) $0.123 / kWh $4.16 $4.76
Regular gasoline and diesel prices come from AEO 2020 reference case. Hydrogen prices
come from HFTO targets, starting at a 2020 price of $13.82/kg of H2 in 2020 and reaching
$5.00/kg delivered by 2030, with a linear decrease in price until then. The electricity price for
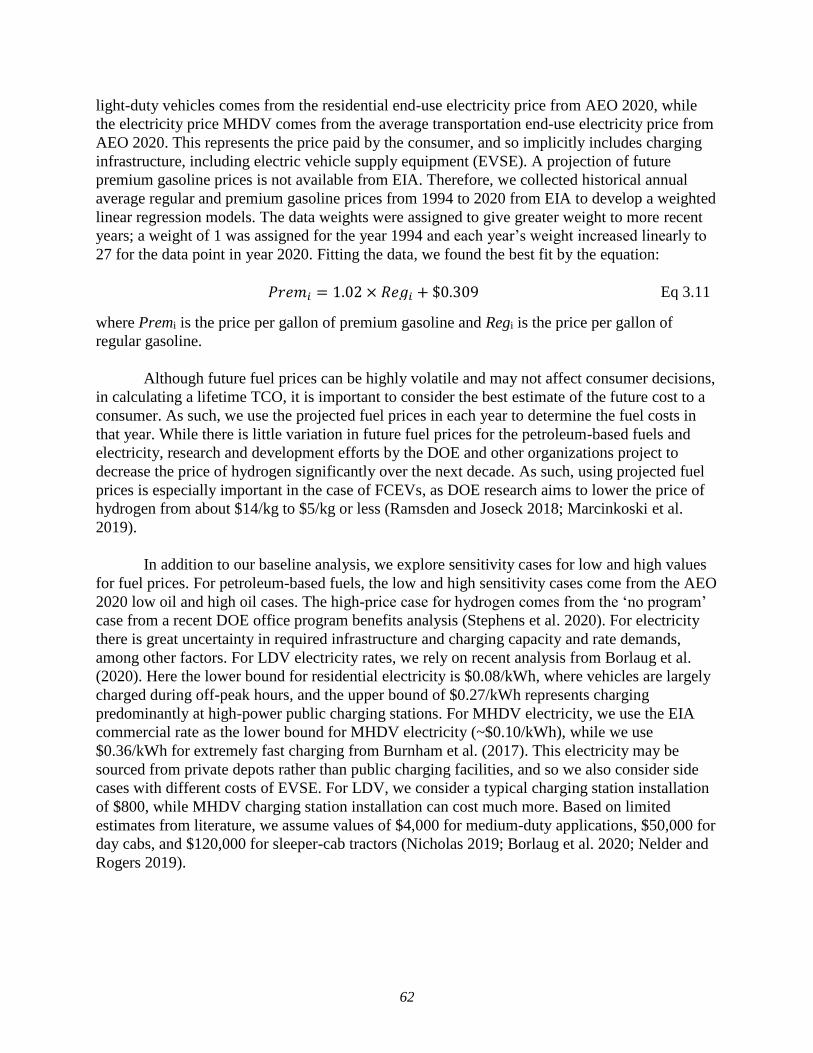
62
light-duty vehicles comes from the residential end-use electricity price from AEO 2020, while
the electricity price MHDV comes from the average transportation end-use electricity price from
AEO 2020. This represents the price paid by the consumer, and so implicitly includes charging
infrastructure, including electric vehicle supply equipment (EVSE). A projection of future
premium gasoline prices is not available from EIA. Therefore, we collected historical annual
average regular and premium gasoline prices from 1994 to 2020 from EIA to develop a weighted
linear regression models. The data weights were assigned to give greater weight to more recent
years; a weight of 1 was assigned for the year 1994 and each year’s weight increased linearly to
27 for the data point in year 2020. Fitting the data, we found the best fit by the equation:
𝑃𝑟𝑒𝑚𝑖 = 1.02 × 𝑅𝑒𝑔𝑖 + $0.309 Eq 3.11
where Premi is the price per gallon of premium gasoline and Regi is the price per gallon of
regular gasoline.
Although future fuel prices can be highly volatile and may not affect consumer decisions,
in calculating a lifetime TCO, it is important to consider the best estimate of the future cost to a
consumer. As such, we use the projected fuel prices in each year to determine the fuel costs in
that year. While there is little variation in future fuel prices for the petroleum-based fuels and
electricity, research and development efforts by the DOE and other organizations project to
decrease the price of hydrogen significantly over the next decade. As such, using projected fuel
prices is especially important in the case of FCEVs, as DOE research aims to lower the price of
hydrogen from about $14/kg to $5/kg or less (Ramsden and Joseck 2018; Marcinkoski et al.
2019).
In addition to our baseline analysis, we explore sensitivity cases for low and high values
for fuel prices. For petroleum-based fuels, the low and high sensitivity cases come from the AEO
2020 low oil and high oil cases. The high-price case for hydrogen comes from the ‘no program’
case from a recent DOE office program benefits analysis (Stephens et al. 2020). For electricity
there is great uncertainty in required infrastructure and charging capacity and rate demands,
among other factors. For LDV electricity rates, we rely on recent analysis from Borlaug et al.
(2020). Here the lower bound for residential electricity is $0.08/kWh, where vehicles are largely
charged during off-peak hours, and the upper bound of $0.27/kWh represents charging
predominantly at high-power public charging stations. For MHDV electricity, we use the EIA
commercial rate as the lower bound for MHDV electricity (~$0.10/kWh), while we use
$0.36/kWh for extremely fast charging from Burnham et al. (2017). This electricity may be
sourced from private depots rather than public charging facilities, and so we also consider side
cases with different costs of EVSE. For LDV, we consider a typical charging station installation
of $800, while MHDV charging station installation can cost much more. Based on limited
estimates from literature, we assume values of $4,000 for medium-duty applications, $50,000 for
day cabs, and $120,000 for sleeper-cab tractors (Nicholas 2019; Borlaug et al. 2020; Nelder and
Rogers 2019).
63
3.4. INSURANCE COST
Insurance is a large component of the total cost of ownership for both light-duty and
medium-/heavy-duty vehicles (Hagman et al. 2016). Vehicle insurance costs depend on many
factors including the type of coverage, the type of vehicle, the value of the vehicle, where the
vehicle is operated, and characteristics of the driver. There are over 650 U.S. automotive
insurance companies and they use a mix of more than 40,000 rating factors to generate insurance
premiums (The Zebra 2020). In this analysis, we examine both average insurance rates for
passenger light-duty vehicles, as well as data using a base profile (i.e. location and driver profile
held constant) to explore the impact of vehicle cost, vehicle class, and powertrain type on rates.
We examine average insurance rates for select commercial heavy-duty vehicles, as well as data
using a base profile. Publicly-available HDV insurance data is very limited in comparison to
LDV data.
3.4.1. Passenger Light-Duty Insurance
The three major types of coverage for private passenger vehicles are liability, collision,
and comprehensive. Liability insurance covers bodily injuries and property damage to other
people if the policyholder is responsible for an accident. Nearly every state requires a minimum
level of liability coverage for owners of light-duty passenger vehicles, though that level of
coverage can vary significantly. There are three major components of a liability policy, which
are typically represented in this format “50/100/25”. The first number (“50” in above example)
represents the maximum the insurance company will pay for bodily injury per person injured in
an accident, the second (“100”) is the maximum amount for bodily injury per accident, and the
third (“25”) is the maximum amount for property damage, in thousands of dollars (e.g.,
$50,000/$100,000/$25,000). Increasing any one of these coverages will increase the cost of the
policy (i.e. premium).
Collision insurance covers damage of the policyholder’s vehicle if they are responsible
for an accident, while comprehensive insurance covers theft and damage of the policyholder’s
vehicle in cases not involving an accident (e.g. fire, flood, hail). Comprehensive and collision
(C&C) policies may have a deductible, which is the amount the policyholder will pay out-of-
pocket on a damage claim. For example, if the policyholder has a $500 deductible and has a
collision claim for $3,000, the insurance company would only cover $2,500. Decreasing the
deductible will increase the cost of the policy. States do not require collision or comprehensive
insurance, but if the car is financed (or leased), the lender typically will (Pogol 2020). Most
often, these coverages are bundled together; in 2017, 74% of insured drivers purchased collision
coverage, while 78% purchased comprehensive (III 2020). As a vehicle depreciates, the value of
C&C insurance diminishes and a rule of thumb is to drop these coverages when the annual
premium exceeds 10% of the maximum payout (i.e. value of vehicle minus deductible) (Pogol
2020).
Vehicle location has a significant effect on the cost of each coverage type, as state policy
can limit what rating factors are eligible to be used, mandate discounts for certain safety features,
and determine if and when rates can be raised (The Zebra 2020). In addition, insurance rates are
64
affected by other local factors, such as the number of uninsured drivers, vehicle thefts, and
severe weather events. Figure 3.16 shows the annual insurance premium by state for a MY 2015
Honda Accord EX for a 30-year old single male with a good driving history (The Zebra 2020).
As seen in Figure 3.16, the cheapest insurance is typically in low density states that also have
low numbers of uninsured drivers. In contrast, Michigan has had one of the highest insurance
rates due to the requirement that drivers carry unlimited, lifetime medical coverage resulting
from car accident injuries, and the resulting large number of uninsured drivers due to this rule. In
2020, Michigan lowered the personal injury protection requirements to help reduce these rates.
FIGURE 3.16 Annual insurance rates by state for MY2015 Honda Accord EX for a 30-year old
single male with a good driving history (data from The Zebra 2020)
3.4.1.1. LDV Liability Insurance
As seen in data presented by the National Association of Insurance Commissioners
(NAIC) in Figure 3.17, national average liability premiums for private passenger vehicles have
stayed relatively constant in real dollars (2019 dollars) for the past two decades, about $600 per
year (NAIC 2020). We similarly found that liability insurance premiums are relatively constant
across light-duty vehicle classes and powertrains when analyzing quotes from Progressive (2020)
for a variety of makes and models. However, this is an area that requires further study to
understand how vehicle size and weight impacts claim cost and frequency, as one would expect
larger vehicles to cause more bodily injury and property damage in an accident.
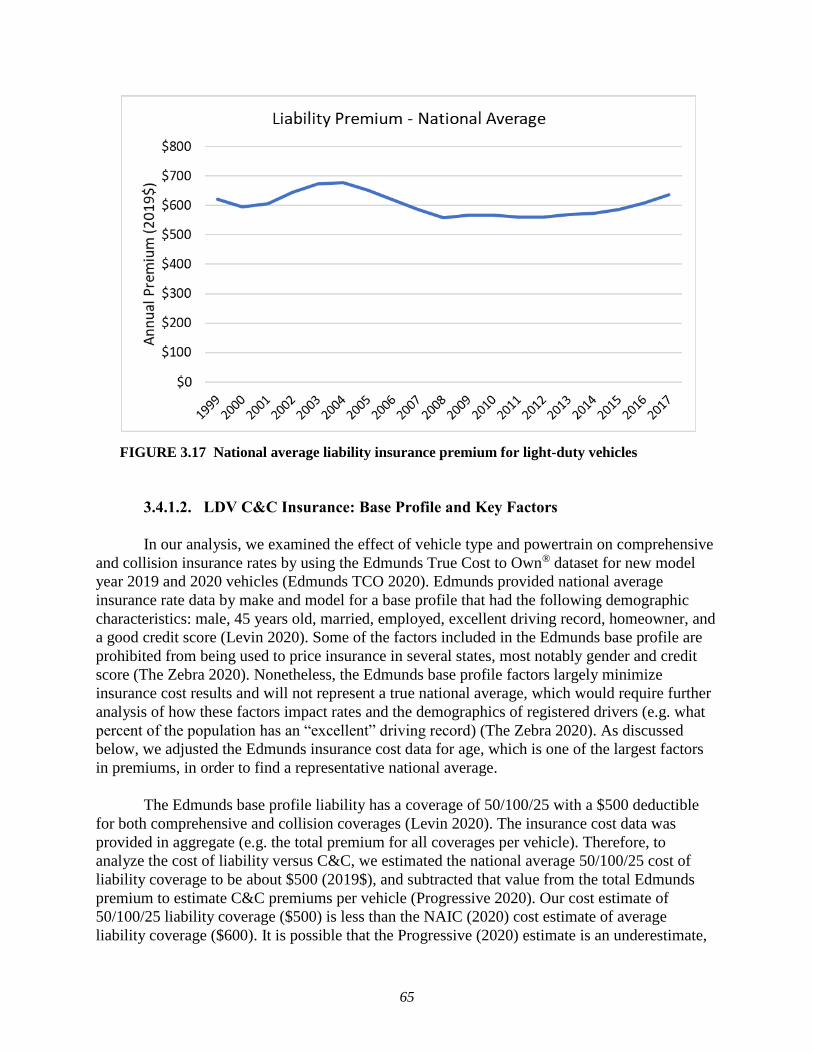
65
FIGURE 3.17 National average liability insurance premium for light-duty vehicles
3.4.1.2. LDV C&C Insurance: Base Profile and Key Factors
In our analysis, we examined the effect of vehicle type and powertrain on comprehensive
and collision insurance rates by using the Edmunds True Cost to Own® dataset for new model
year 2019 and 2020 vehicles (Edmunds TCO 2020). Edmunds provided national average
insurance rate data by make and model for a base profile that had the following demographic
characteristics: male, 45 years old, married, employed, excellent driving record, homeowner, and
a good credit score (Levin 2020). Some of the factors included in the Edmunds base profile are
prohibited from being used to price insurance in several states, most notably gender and credit
score (The Zebra 2020). Nonetheless, the Edmunds base profile factors largely minimize
insurance cost results and will not represent a true national average, which would require further
analysis of how these factors impact rates and the demographics of registered drivers (e.g. what
percent of the population has an “excellent” driving record) (The Zebra 2020). As discussed
below, we adjusted the Edmunds insurance cost data for age, which is one of the largest factors
in premiums, in order to find a representative national average.
The Edmunds base profile liability has a coverage of 50/100/25 with a $500 deductible
for both comprehensive and collision coverages (Levin 2020). The insurance cost data was
provided in aggregate (e.g. the total premium for all coverages per vehicle). Therefore, to
analyze the cost of liability versus C&C, we estimated the national average 50/100/25 cost of
liability coverage to be about $500 (2019$), and subtracted that value from the total Edmunds
premium to estimate C&C premiums per vehicle (Progressive 2020). Our cost estimate of
50/100/25 liability coverage ($500) is less than the NAIC (2020) cost estimate of average
liability coverage ($600). It is possible that the Progressive (2020) estimate is an underestimate,
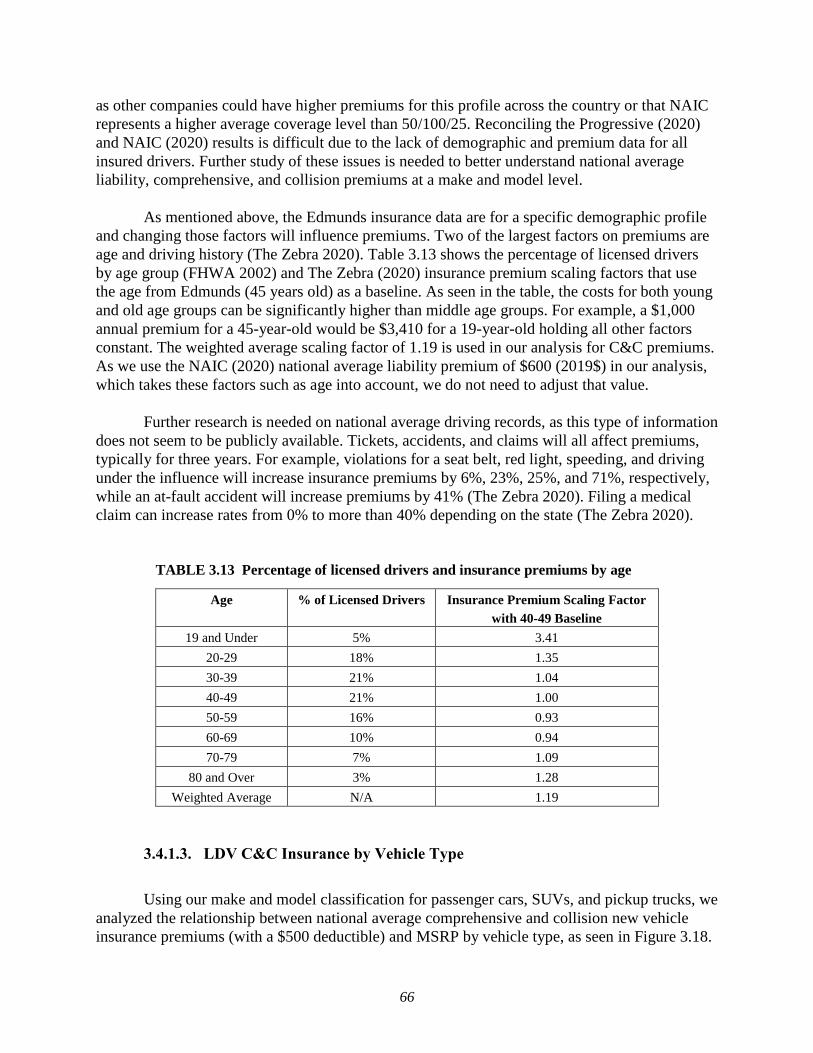
66
as other companies could have higher premiums for this profile across the country or that NAIC
represents a higher average coverage level than 50/100/25. Reconciling the Progressive (2020)
and NAIC (2020) results is difficult due to the lack of demographic and premium data for all
insured drivers. Further study of these issues is needed to better understand national average
liability, comprehensive, and collision premiums at a make and model level.
As mentioned above, the Edmunds insurance data are for a specific demographic profile
and changing those factors will influence premiums. Two of the largest factors on premiums are
age and driving history (The Zebra 2020). Table 3.13 shows the percentage of licensed drivers
by age group (FHWA 2002) and The Zebra (2020) insurance premium scaling factors that use
the age from Edmunds (45 years old) as a baseline. As seen in the table, the costs for both young
and old age groups can be significantly higher than middle age groups. For example, a $1,000
annual premium for a 45-year-old would be $3,410 for a 19-year-old holding all other factors
constant. The weighted average scaling factor of 1.19 is used in our analysis for C&C premiums.
As we use the NAIC (2020) national average liability premium of $600 (2019$) in our analysis,
which takes these factors such as age into account, we do not need to adjust that value.
Further research is needed on national average driving records, as this type of information
does not seem to be publicly available. Tickets, accidents, and claims will all affect premiums,
typically for three years. For example, violations for a seat belt, red light, speeding, and driving
under the influence will increase insurance premiums by 6%, 23%, 25%, and 71%, respectively,
while an at-fault accident will increase premiums by 41% (The Zebra 2020). Filing a medical
claim can increase rates from 0% to more than 40% depending on the state (The Zebra 2020).
TABLE 3.13 Percentage of licensed drivers and insurance premiums by age
Age % of Licensed Drivers Insurance Premium Scaling Factor
with 40-49 Baseline
19 and Under 5% 3.41
20-29 18% 1.35
30-39 21% 1.04
40-49 21% 1.00
50-59 16% 0.93
60-69 10% 0.94
70-79 7% 1.09
80 and Over 3% 1.28
Weighted Average N/A 1.19
3.4.1.3. LDV C&C Insurance by Vehicle Type
Using our make and model classification for passenger cars, SUVs, and pickup trucks, we
analyzed the relationship between national average comprehensive and collision new vehicle
insurance premiums (with a $500 deductible) and MSRP by vehicle type, as seen in Figure 3.18.
67
This insurance data can be modeled with a linear function. The SUV equation in Figure 3.18 is
based on SUV models for MSRPs less than $60,000. The SUV data points beyond that price
become scattered due to the limited number of makes and models at those prices, which likely
are impacted strongly by the OEM, rather than the vehicle type. From this data, we find that
insurance rates are higher for passenger cars than for SUVs and pickups, when MSRP is held
constant. SUVs and pickup trucks currently have much higher profit margins than cars, meaning
they have lower manufacturing and component costs as a percentage of MSRP (Ulrich 2019).
Therefore, it is likely this reduces repair costs (and resulting C&C premiums) as a percentage of
MSRP for these vehicles. This is further discussed in Section 3.5. Another possible reason for
lower comprehensive and collision insurance costs for pickup trucks and SUVs is their
prevalence in lower-density areas where claim frequencies are lower (Vallet 2019). Vehicle
weight and dimensions could be another factor why cars have different insurance rates than
SUVs and pickups, and which should be analyzed further.
While the above equations are based on MSRP, as a vehicle depreciates insurance
companies will reduce the maximum payout for C&C coverage based on the vehicle’s value at
the time of the claim, which will lead to a lower premium (Allstate 2018). There is little public
information on the magnitude of C&C premium changes as different vehicle types age year-to-
year and further analysis is needed. However, The Zebra (2020) presents data for a Honda
Accord that suggests that premiums may directly be tied to depreciated value, with a large
decrease in the first year and smaller changes in following years.
FIGURE 3.18 Annual premium for comprehensive and collision insurance for gasoline
vehicles plotted against MSRP
Car = 0.0089x + 221.42
SUV = 0.0046x + 241.39
PUT = 0.0059x + 206.42
$0
$200
$400
$600
$800
$1,000
$1,200
$1,400
$0 $20,000 $40,000 $60,000 $80,000 $100,000 $120,000
An
nu
al P
rem
ium
MSRP
Gasoline ICEV - Comp. and Coll. ($500 Deductible)
Car
SUV
PUT

68
3.4.1.4. LDV C&C Insurance by Powertrain Type
Next, we analyzed the relationship between comprehensive and collision insurance
premiums and the MSRP by powertrain. As passenger cars have significantly more advanced
powertrain models available in 2020 than SUVs and especially pickups, we show their results in
Figure 3.19 for gasoline cars, HEVs, and BEVs (there was very limited PHEV data). As the
number of makes and models are limited for powertrains other than gasoline, it is difficult to
determine how much powertrain impacts C&C rates using this data. This is similar to the issue
with gasoline SUVs described above in that the insurance rates are potentially impacted more by
the OEM than the powertrain.
FIGURE 3.19 Annual premium for comprehensive and collision insurance for gasoline, HEV,
and BEV cars plotted against MSRP
Therefore, to examine this issue further, we compared the insurance rates of HEVs,
PHEVs, and BEVs to their ICEV counterparts with an equivalent make, model, and trim as listed
in Table 3.14. This approach allows us to isolate the impact of changing the powertrain on
insurance costs, removing the impact of specific OEMs and other outliers. The total annual
insurance (liability, comprehensive, and collision) costs as a percentage of MSRP were 12% for
HEVs, and the total insurance costs for their ICE counterparts were also 12%. Similarly, annual
costs were 9% for PHEVs, and 12% for BEVs, while for their ICEV counterparts were 10% and
15%, respectively. These results suggest that total annual insurance rates as a percentage of
MSRP for each of these powertrain types are at least equal and potentially lower than rates for
comparable ICEVs.
When estimating just comprehensive and collision costs (assuming the liability costs are
fixed at $500 per year for the Edmunds 50/100/25 coverage), their costs as percentage of MSRP
Gas Car = 0.0089x + 221.42
HEV Car = 0.0103x + 182.77
BEV Car = 0.0074x + 258.11
$0
$200
$400
$600
$800
$1,000
$1,200
$1,400
$1,600
$0 $20,000 $40,000 $60,000 $80,000 $100,000 $120,000
An
nu
al P
rem
ium
MSRP
ICEV, HEV, BEV cars - Comp. and Coll. ($500 Deductible)
GasolineHEVBEV

69
were 5% for HEVs, 4% for PHEVs, and 6% for BEVs, while their ICEV counterpart were 5%,
4%, and 5%, respectively. These data suggest that C&C rates as a percentage of MSRP for these
powertrain types are either equal to or slightly higher than those for ICEVs. While there might be
differences by powertrain, these data (Table 3.14) suggest the differences are limited. Therefore,
we do not make any insurance cost adjustments by powertrain for the TCO calculations in this
study.
TABLE 3.14 Alternative Fuel Vehicle models and their ICEV counterparts
Powertrain Make (AFV) Model (AFV)
Make (ICEV
counterpart)
Model (ICEV
counterpart)
HEV Acura MDX Acura MDX
HEV Acura RLX Acura RLX
HEV Buick LaCrosse Buick LaCrosse
HEV Chevrolet Malibu Hybrid Chevrolet Malibu
HEV Ford Fusion Hybrid Ford Fusion
HEV Honda Accord Honda Accord
HEV Hyundai Sonata Hybrid Hyundai Sonata
HEV Kia Optima Hybrid Kia Optima
HEV Lexus ES 300h Lexus ES 350
HEV Lexus NX 300h Lexus NX 300
HEV Lincoln MKZ Hybrid Lincoln MKZ
HEV Toyota Avalon Hybrid Toyota Avalon
HEV Toyota Camry Hybrid Toyota Camry
HEV Toyota RAV4 Toyota RAV4
PHEV BMW 5-Series BMW 5-Series
PHEV Chrysler Pacifica Hybrid Chrysler Pacifica
PHEV Ford Fusion Energi Ford Fusion
PHEV Subaru Crosstrek Hybrid Subaru Crosstrek
PHEV Volvo XC90 AWD PHEV Volvo XC90
BEV BMW i3 BMW 3 Series
BEV Fiat 500e Fiat 500
BEV Kia Soul Electric Kia Soul
3.4.1.5. LDV Insurance Cost Findings and Results
A summary of our results is listed in Table 3.15 for use as inputs to the TCO calculation.
Liability premiums are estimated to be the $600 (2019$) for all vehicle types and powertrains
using NAIC (2020) national average data. Comprehensive and collision premiums are estimated
using the linear regression equations presented in Figure 3.18 for cars, SUVs, and pickups,
respectively multiplied by the age adjustment factor of 1.19 derived from The Zebra (2020) and
FHWA (2002) data. The equation is based on annual vehicle value, with the first year using
MSRP and future years using resale value. The year-over-year change in premiums is known as

70
the escalation rate; escalation rates listed in Table 3.15 are assumed to be zero since costs are
presented in real 2019 dollars.
TABLE 3.15 Summary of insurance costs for LDVs
Vehicle Type ICEV HEV PHEV EV
Annual liability premium (2019$) All $600 $600 $600 $600
Annual liability escalation rate % (2019$) All 0% 0% 0% 0%
Annual comprehensive and collision premium with
$500 deductible (2019$) Car = (vehicle value * 0.009 + $220) * 1.19
Annual comprehensive and collision premium with
$500 deductible (2019$) SUV = (vehicle value * 0.005 + $240) * 1.19
Annual comprehensive and collision premium with
$500 deductible (2019$) Pickup = (vehicle value * 0.006 + $210) * 1.19
Annual comprehensive and collision premium
escalation rate % (2019$) All 0% 0% 0% 0%
3.4.2. Commercial Heavy-Duty and Light-Duty Insurance
Commercial vehicle insurance depends on similar factors as consumer insurance such as
levels for liability, comprehensive, and collision insurance and vehicle location, while factors
like cargo type for freight or number of passengers for buses will also play a major role.
Commercial vehicles typically cost much more to insure than consumer vehicles due to the
potential for larger liability claims and the higher cost of the vehicle for property damage. Using
Progressive (2020) quotes for 50/100/25 liability and a $500 deductible for comprehensive and
collision for a 40-year-old male, business owner in Illinois, the annual insurance premiums for a
class 4 delivery, class 6 delivery, class 8 vocational (dump), and class 8 refuse truck were about
$3,000, $5,000, $5,000, and $7,500, respectively.
The U.S. government requires for-hire freight and passenger carriers to have minimum
liability insurance coverage, ranging from $750,000 for general freight to $5 million for
hazardous freight and $1.5 million to $5 million for passenger carriers with below and above a
seating capacity of 15, respectively (Hymel et al. 2012). In 2018, the average insurance premium
cost (2019$) for commercial freight trucks surveyed by ATRI was $0.086 per mile or $7,500 per
year (Murray and Glidewell 2019). While this gives a suitable average value for freight truck
insurance costs, it does not account for variations in driving distance or vehicle value nor does it
distinguish between liability and comprehensive and collision insurance. The cost of
comprehensive and collision insurance for commercial freight trucks is typically between $2 to
$3 per month per thousand dollars of vehicle value (Podris 2019). For an ATRI-average truck of
4.4 years of age and 92,000 miles per year, this is approximately $0.021 per mile for physical
damage insurance. Subtracting the estimated comprehensive and collision premium from the
ATRI average premium from Murray and Glidewell (2019), $0.086 per mile, provides an
estimated liability insurance cost of $0.065 per mile for freight trucks, which is assumed to be
independent of vehicle powertrain.
71
The estimated annual premium for commercial buses with more than 15 passengers is
$35,000 and $9,000 for 15 or less (Huneck 2020; Bus Insurance HQ 2018). Typically, public
fleets (and some large fleets) are self-insured, as they have the resources to cover losses and the
administrative capability, and doing so can lead to cost savings by cutting out much of the profit
that is embedded in commercial premiums (Casale 2008; Government Fleet 2011). However, no
per-vehicle cost data or expected average savings was available. For public fleet vocational
vehicles and buses, estimates should be similar to those from commercial providers with small
discounts, as a conservative assumption. Self-insurance is an area that should be researched
further.
Many LDV owners have started to use their vehicles for ridehailing services, such as
Uber or Lyft. These Transportation Network Companies (TNC) link passengers to willing
drivers for single rides, like taxicabs. While the personally-owned vehicle is in service, it is
typically not covered by a personal auto policy (III 2017). TNCs only provide liability coverage
while the app is on and the driver is waiting for a ride request, so a driver would not be covered
for their own injuries and damage to their vehicle from an at-fault accident. TNCs do provide
C&C coverage once a driver has received a ride request, but deductibles are high ranging from
$1,000 for Uber and $2,500 for Lyft. To supplement this insurance, drivers can add rideshare
insurance. Kiernan (2021) analyzed rideshare insurance cost estimates from five insurance
companies, finding an average incremental cost of approximately $150 per year (Kiernan 2021).
3.5. MAINTENANCE AND REPAIR COSTS
Maintenance and repair (M&R) are large components of vehicle total cost of ownership
(TCO) for both LDV and MHDV. The category can be separated into 1) maintenance, which is
the regular service to prevent damage and prolong vehicle life and 2) repairs, which are done to
fix malfunctioning parts that inhibit the use of the vehicle. Maintenance may be further classified
into scheduled and unscheduled maintenance (Edmunds TCO 2020). Scheduled maintenance
includes the preventative replacement of vehicle parts and other maintenance services at regular
intervals as described in a vehicle’s owner’s manual. Examples of scheduled maintenance
include oil changes, tire rotation, spark plug replacement, and brake fluid replacement; however,
the services listed depend on the automaker. Unscheduled maintenance includes the cost of
services for inspection and replacement of vehicle parts that do not have set replacement
intervals and are replaced based on inspection and diagnostic tests. Examples of unscheduled
maintenance include tire replacement, starter battery replacement, and brake work. The
differentiation between the items that are included in unscheduled maintenance versus repairs is
likely arbitrary, but the items considered repairs seem to follow the systems that are covered in
vehicle comprehensive (i.e., “bumper-to-bumper”) warranties offered by automakers, which
exclude common “wear” items like tires, brakes, and starter batteries (Muller 2017). Often,
publicly available M&R cost estimates are aggregated, so it is not clear which services were
considered either maintenance or repair. Therefore, caution is needed when comparing either
maintenance or repair costs from different data sources. If specific data is lacking, it is best to
consider total M&R costs to make sure these costs are being compared on a consistent basis.
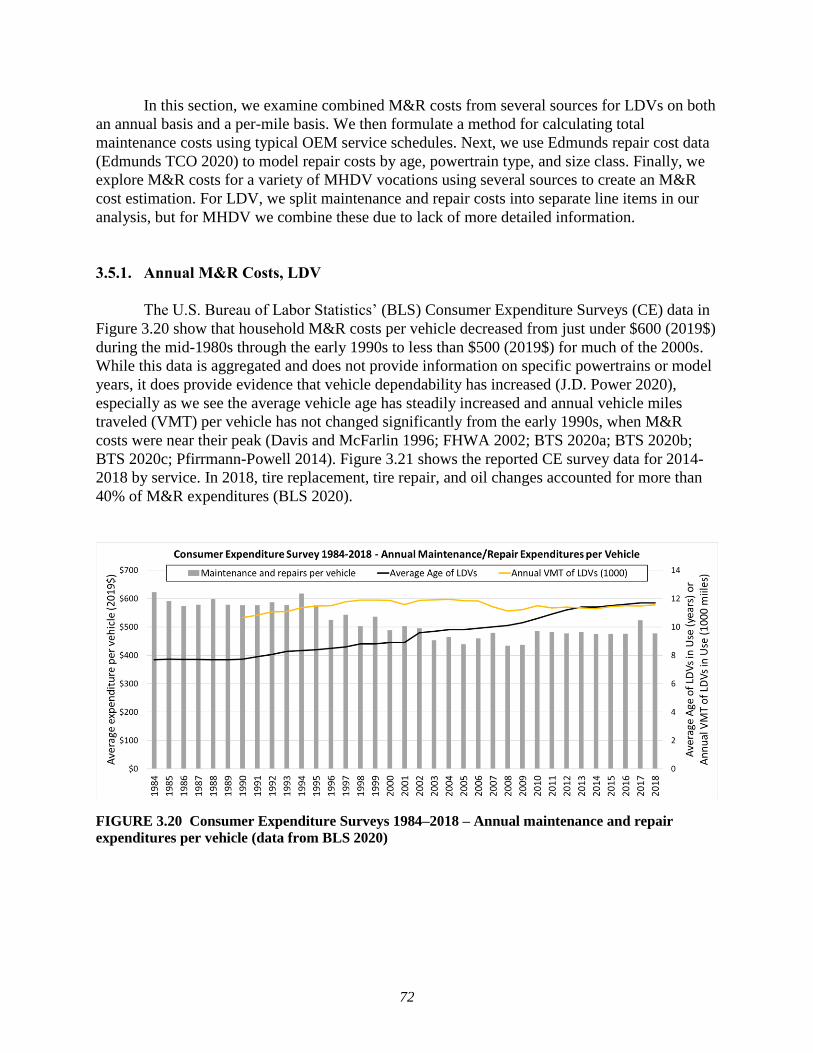
72
In this section, we examine combined M&R costs from several sources for LDVs on both
an annual basis and a per-mile basis. We then formulate a method for calculating total
maintenance costs using typical OEM service schedules. Next, we use Edmunds repair cost data
(Edmunds TCO 2020) to model repair costs by age, powertrain type, and size class. Finally, we
explore M&R costs for a variety of MHDV vocations using several sources to create an M&R
cost estimation. For LDV, we split maintenance and repair costs into separate line items in our
analysis, but for MHDV we combine these due to lack of more detailed information.
3.5.1. Annual M&R Costs, LDV
The U.S. Bureau of Labor Statistics’ (BLS) Consumer Expenditure Surveys (CE) data in
Figure 3.20 show that household M&R costs per vehicle decreased from just under $600 (2019$)
during the mid-1980s through the early 1990s to less than $500 (2019$) for much of the 2000s.
While this data is aggregated and does not provide information on specific powertrains or model
years, it does provide evidence that vehicle dependability has increased (J.D. Power 2020),
especially as we see the average vehicle age has steadily increased and annual vehicle miles
traveled (VMT) per vehicle has not changed significantly from the early 1990s, when M&R
costs were near their peak (Davis and McFarlin 1996; FHWA 2002; BTS 2020a; BTS 2020b;
BTS 2020c; Pfirrmann-Powell 2014). Figure 3.21 shows the reported CE survey data for 2014-
2018 by service. In 2018, tire replacement, tire repair, and oil changes accounted for more than
40% of M&R expenditures (BLS 2020).
FIGURE 3.20 Consumer Expenditure Surveys 1984–2018 – Annual maintenance and repair
expenditures per vehicle (data from BLS 2020)
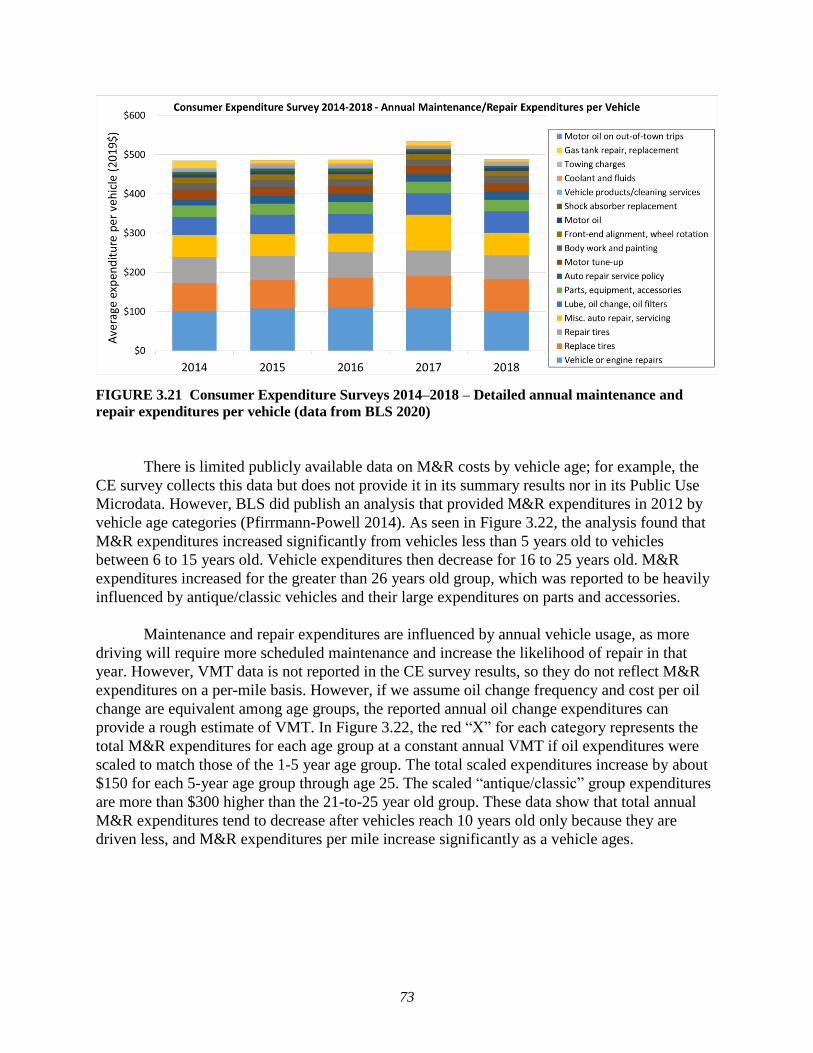
73
FIGURE 3.21 Consumer Expenditure Surveys 2014–2018 – Detailed annual maintenance and
repair expenditures per vehicle (data from BLS 2020)
There is limited publicly available data on M&R costs by vehicle age; for example, the
CE survey collects this data but does not provide it in its summary results nor in its Public Use
Microdata. However, BLS did publish an analysis that provided M&R expenditures in 2012 by
vehicle age categories (Pfirrmann-Powell 2014). As seen in Figure 3.22, the analysis found that
M&R expenditures increased significantly from vehicles less than 5 years old to vehicles
between 6 to 15 years old. Vehicle expenditures then decrease for 16 to 25 years old. M&R
expenditures increased for the greater than 26 years old group, which was reported to be heavily
influenced by antique/classic vehicles and their large expenditures on parts and accessories.
Maintenance and repair expenditures are influenced by annual vehicle usage, as more
driving will require more scheduled maintenance and increase the likelihood of repair in that
year. However, VMT data is not reported in the CE survey results, so they do not reflect M&R
expenditures on a per-mile basis. However, if we assume oil change frequency and cost per oil
change are equivalent among age groups, the reported annual oil change expenditures can
provide a rough estimate of VMT. In Figure 3.22, the red “X” for each category represents the
total M&R expenditures for each age group at a constant annual VMT if oil expenditures were
scaled to match those of the 1-5 year age group. The total scaled expenditures increase by about
$150 for each 5-year age group through age 25. The scaled “antique/classic” group expenditures
are more than $300 higher than the 21-to-25 year old group. These data show that total annual
M&R expenditures tend to decrease after vehicles reach 10 years old only because they are
driven less, and M&R expenditures per mile increase significantly as a vehicle ages.

74
FIGURE 3.22 Consumer Expenditure Survey 2012 – Detailed annual maintenance and repair
expenditures per vehicle by age (data from Pfirrmann-Powell 2014)
Annual M&R costs by vehicle age presented in Figure 3.23 were collected from Martin
(2016a), who used data from the YourMechanic consumer automotive repair database, and
Burnham (2020), who used information from the Utilimarc fleet benchmarking database of
municipal and utility vehicles. Costs by Martin (2016a) are similar to CE survey expenditures for
vehicles less than five years old. However, even when using our scaled CE survey estimates that
assume equal VMT per age group, the Martin (2016a) data are significantly higher for vehicles
that are 6 to 10 years old ($1,080 vs. vs. $650 CE vs. $640 CE scaled) and 11 to 15 years old
($1,780 vs. $640 CE vs. $810 CE scaled). The reasons for the discrepancy are unclear, but it is
likely that the Martin (2016a) data does not have a representative sample, as it is skewed by
vehicles that undergo expensive repairs and does not account for vehicles that do not visit a
mechanic. In addition, annual VMT data was not provided so it is unclear whether there is a
skew due to high mileage vehicles.

75
FIGURE 3.23 Annual maintenance and repair costs by age (data from
Burnham 2020; Martin 2016a)
The Utilimarc dataset covers calendar years 2008 to 2017 and included information for
gasoline passenger cars (94,000 units), gasoline HEV passenger cars (19,000 units), gasoline
SUVs (85,000 units), and gasoline pickup trucks (270,000 units). One unit represents one vehicle
in one calendar year. Fleet M&R cost data for light-duty vehicles from Utilimarc (Burnham
2020) were significantly higher than Martin (2016a). As the Utilimarc data is aggregated, it is
not clear why the fleet costs are so much higher. However, it is likely that both the fleet
management (e.g. technicians more frequently inspecting vehicles, costly overhead due to
maintaining heavy-duty vehicles) and driving conditions (e.g. more idling and aggressive
driving) of these vehicles are significantly different from consumer passenger vehicles.
Specifically, M&R costs for new fleet gasoline HEV cars, gasoline cars, gasoline SUVs,
and gasoline pickups were $560, $740, $870, and $990, respectively. The new cars were driven
on average 10,500 miles for the HEV and 11,500 miles for the ICEV, while the gasoline SUVs
and pickups were driven each about 13,000 miles. As discussed later in this section, HEV M&R
costs are significantly lower than their gasoline counterparts until a spike in year 10, which is
just after the 8-year hybrid powertrain warranty ends (California has a 10-year warranty).
There is a lack of publicly available detailed light-duty M&R cost data to compare these
results; however, a survey of more than 100,000 light-duty vehicles estimated the average M&R
costs were $850 in 2019 (Antich 2020). It is not clear how the duty-cycles of these vehicles
differ from those in the Utilimarc dataset, though it does include corporate LDVs, while

76
Utilimarc does not. Utilimarc suggested that potentially other data sources included vehicles that
were not active and not in service for the entire year (Milner 2020). For Utilimarc, this is about
15% of vehicle data they receive from fleets (the Utilimarc dataset used in this analysis does not
include those vehicles). The Antich (2020) data did not differentiate total M&R costs by age nor
estimate the average age of the vehicles in their survey. However, they did provide repair costs
by months in service and average 2019 repair costs are similar to their repair estimate for 3-year-
old vehicles. If we assume that the $850 M&R cost is representative of 3-year-old vehicles, the
cost data from Antich (2020) is lower than that from Utilimarc. The annual M&R costs of the
New York City gasoline passenger car fleet in 2018, ranging from $920 to $1810 per year, were
similar to Utilimarc values (Kerman 2019), suggesting there is likely significant variation
between fleets.
3.5.2. Per-mile M&R costs, LDV
While the above annual data help bound our estimates, they are lacking context that could
help us better understand what factors are driving M&R costs as a vehicle ages. An important
factor that should be controlled for is annual VMT. The Utilimarc dataset provided annual
mileage, so we can estimate fleet M&R costs per mile by age of the vehicle, as shown in Figure
3.24. The gasoline car, SUV, and pickup M&R costs increase annually in a roughly linear
fashion from about $0.06-$0.08 per mile in year 1 to about $0.29 to $0.34 per mile in year 15
(Burnham 2020). Similar to the annual costs shown above, the per-mile HEV costs are lower
than all of the gasoline LDVs until increasing significantly starting for 10-year-old vehicles.
Over 150,000 total miles, each of the fleet vehicles had a weighted average per-mile cost of
about $0.18 (Burnham 2020). While the gasoline cars had lower costs per mile than SUVs and
pickups for each year, these vehicles have different mileage schedules. Specifically, gasoline
cars were driven less miles per year than SUVs and pickups, with gasoline cars reaching 150,000
VMT in year 21, while SUVs and pickups reached the same threshold in year 14. Gasoline HEV
data does not reach 150,000 VMT, but rather gets to 140,000 VMT in year 17.
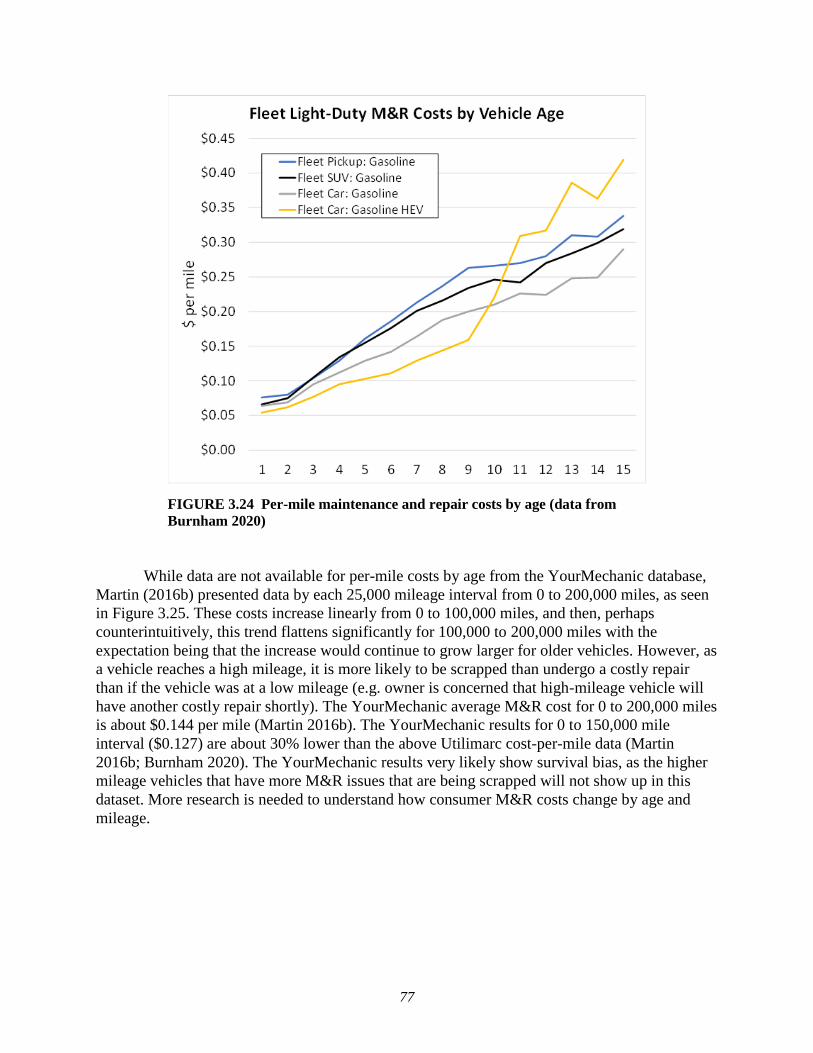
77
FIGURE 3.24 Per-mile maintenance and repair costs by age (data from
Burnham 2020)
While data are not available for per-mile costs by age from the YourMechanic database,
Martin (2016b) presented data by each 25,000 mileage interval from 0 to 200,000 miles, as seen
in Figure 3.25. These costs increase linearly from 0 to 100,000 miles, and then, perhaps
counterintuitively, this trend flattens significantly for 100,000 to 200,000 miles with the
expectation being that the increase would continue to grow larger for older vehicles. However, as
a vehicle reaches a high mileage, it is more likely to be scrapped than undergo a costly repair
than if the vehicle was at a low mileage (e.g. owner is concerned that high-mileage vehicle will
have another costly repair shortly). The YourMechanic average M&R cost for 0 to 200,000 miles
is about $0.144 per mile (Martin 2016b). The YourMechanic results for 0 to 150,000 mile
interval ($0.127) are about 30% lower than the above Utilimarc cost-per-mile data (Martin
2016b; Burnham 2020). The YourMechanic results very likely show survival bias, as the higher
mileage vehicles that have more M&R issues that are being scrapped will not show up in this
dataset. More research is needed to understand how consumer M&R costs change by age and
mileage.

78
FIGURE 3.25 Per-mile maintenance and repair costs by mileage interval (data from Martin 2016b)
As shown in Figure 3.26, Martin (2016b) also presented models with the top ten highest
and lowest M&R costs per 150,000 miles, which helps us bound costs even though the study
does not state the range of model years examined. The average of the lowest M&R costs was
$0.066 per mile, while the average of the highest was $0.150 per mile. If we assume the data for
the large number of models between the top ten highest and lowest is not significantly skewed,
the average M&R cost per mile would be about $0.108 per mile. This is similar to the results for
their 0 to 150,000 mileage interval data shown in Figure 3.25.
The data from Martin (2016b) also shows that M&R costs vary by both make and model.
Toyota had five of the ten lowest M&R costs by vehicle model, including three cars, an SUV,
and a pickup. The only advanced powertrain vehicle presented by Martin (2016b) is the Toyota
Prius, which had the lowest M&R costs of all models analyzed, at about $0.045 per mile. The
Prius costs were 21% lower than the next vehicle, the Nissan Versa ($0.057), 35% lower than the
Toyota Corolla ($0.069, also in the 10 lowest), and 69% lower than the Ford Focus ($0.144, in
the 10 highest). As the Prius was one of the first HEVs introduced in 2000, its inclusion in this
dataset of vehicles with 150,000 miles makes sense, though it is unclear how many other HEVs
are in this 2016 dataset. PHEVs and BEVs were introduced in December 2010, so this dataset
likely did not include any that had reached 150,000 miles. Further data collection is needed to
analyze these advanced powertrain vehicles as they reach higher mileages. The other factor that
should be taken into account is that when a new model is introduced, especially one with a new
powertrain, it will typically undergo changes each model year, tending to improve reliability.

79
Therefore, focusing on just the earliest model years of a specific vehicle will likely overestimate
the M&R costs of newer model years (Linkov 2019).
FIGURE 3.26 Per-mile maintenance and repair costs by make and model over first 150,000 miles
(data from Martin 2016b)
Consumer Reports (CR) conducts an annual survey on car reliability, asking its members
for maintenance and repair costs, annual mileage, and odometer readings for their vehicle over
the previous 12 months (Consumer Reports 2019). The 2019 CR survey covered 420,000
vehicles for model years 2000 to 2020 and a subset of those (removing incomplete and outlier
responses) were used by Harto (2020a) to examine the M&R costs for ICEVs, PHEVs, and
BEVs. The study included survey data for vehicles with an annual VMT between 2,000 and
60,000 miles and annual M&R costs less than $20,000. With such a high VMT cut-off, the
results most likely include ride-hail drivers. Similar to Martin (2016b), the CR study provided
M&R costs per mile for three cumulative mileage intervals: 0 to 50,000; 50,000 to 100,000; and
100,000 to 200,000. It was noted that there was a small sample size for PHEVs (200 vehicles)
and BEVs (55 vehicles) for the 100,000 to 200,000 mileage interval. To account for differences
in OEM M&R costs, the estimates for ICEVs were averaged for each automaker and were
weighted by the latest 5-year average market share. Harto (2020a) stated the sample size was not
large enough to do the same for PHEVs and BEVs. This further points to the need to analyze
data of advanced powertrain vehicles as they reach higher mileage operation.
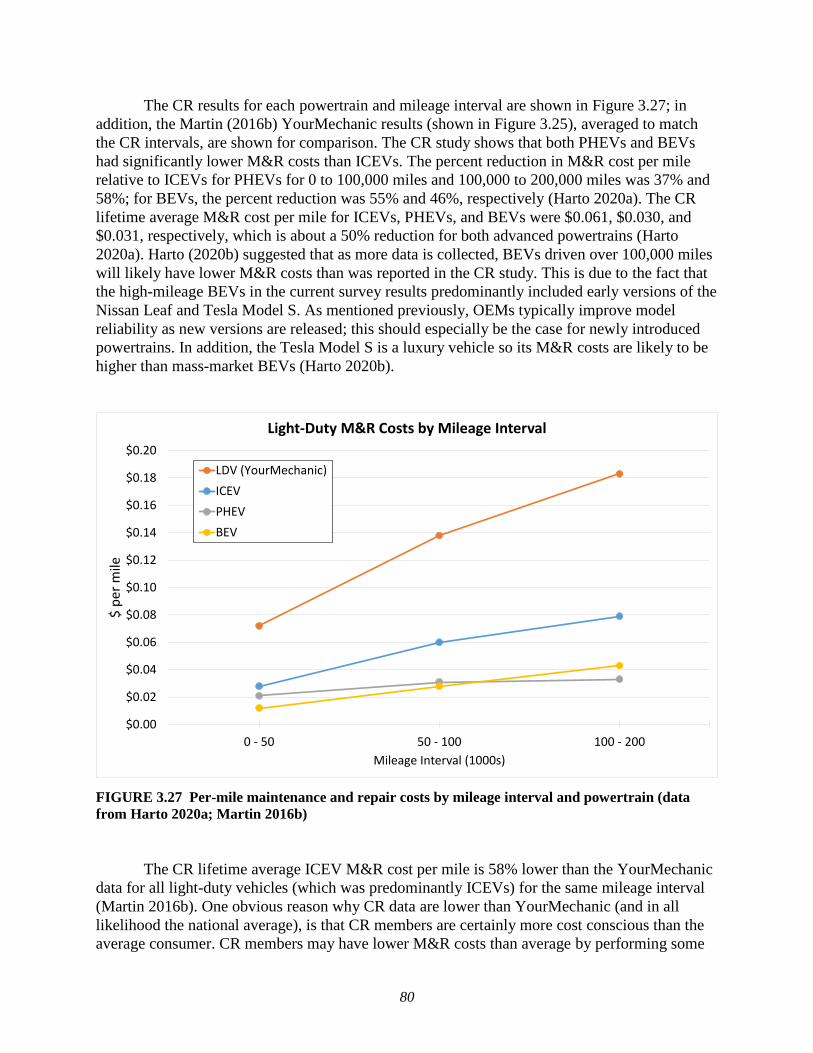
80
The CR results for each powertrain and mileage interval are shown in Figure 3.27; in
addition, the Martin (2016b) YourMechanic results (shown in Figure 3.25), averaged to match
the CR intervals, are shown for comparison. The CR study shows that both PHEVs and BEVs
had significantly lower M&R costs than ICEVs. The percent reduction in M&R cost per mile
relative to ICEVs for PHEVs for 0 to 100,000 miles and 100,000 to 200,000 miles was 37% and
58%; for BEVs, the percent reduction was 55% and 46%, respectively (Harto 2020a). The CR
lifetime average M&R cost per mile for ICEVs, PHEVs, and BEVs were $0.061, $0.030, and
$0.031, respectively, which is about a 50% reduction for both advanced powertrains (Harto
2020a). Harto (2020b) suggested that as more data is collected, BEVs driven over 100,000 miles
will likely have lower M&R costs than was reported in the CR study. This is due to the fact that
the high-mileage BEVs in the current survey results predominantly included early versions of the
Nissan Leaf and Tesla Model S. As mentioned previously, OEMs typically improve model
reliability as new versions are released; this should especially be the case for newly introduced
powertrains. In addition, the Tesla Model S is a luxury vehicle so its M&R costs are likely to be
higher than mass-market BEVs (Harto 2020b).
FIGURE 3.27 Per-mile maintenance and repair costs by mileage interval and powertrain (data
from Harto 2020a; Martin 2016b)
The CR lifetime average ICEV M&R cost per mile is 58% lower than the YourMechanic
data for all light-duty vehicles (which was predominantly ICEVs) for the same mileage interval
(Martin 2016b). One obvious reason why CR data are lower than YourMechanic (and in all
likelihood the national average), is that CR members are certainly more cost conscious than the
average consumer. CR members may have lower M&R costs than average by performing some
$0.00
$0.02
$0.04
$0.06
$0.08
$0.10
$0.12
$0.14
$0.16
$0.18
$0.20
0 - 50 50 - 100 100 - 200
$ p
er m
ile
Mileage Interval (1000s)
Light-Duty M&R Costs by Mileage Interval
LDV (YourMechanic)
ICEV
PHEV
BEV
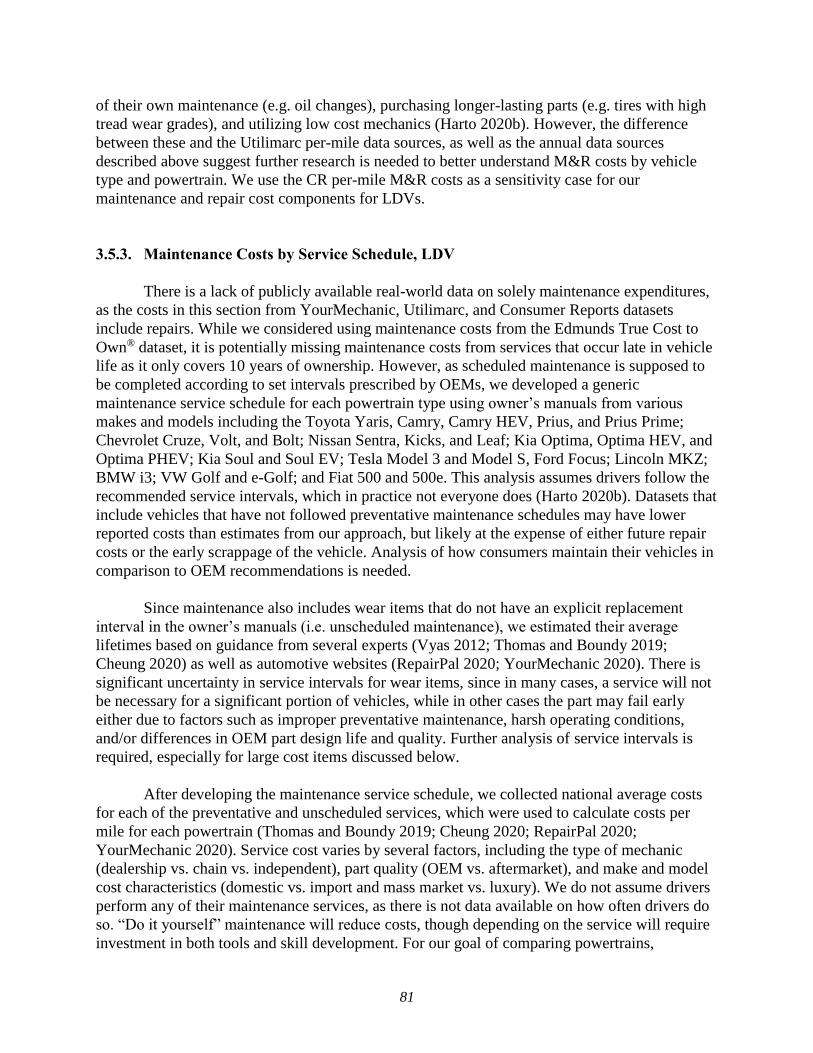
81
of their own maintenance (e.g. oil changes), purchasing longer-lasting parts (e.g. tires with high
tread wear grades), and utilizing low cost mechanics (Harto 2020b). However, the difference
between these and the Utilimarc per-mile data sources, as well as the annual data sources
described above suggest further research is needed to better understand M&R costs by vehicle
type and powertrain. We use the CR per-mile M&R costs as a sensitivity case for our
maintenance and repair cost components for LDVs.
3.5.3. Maintenance Costs by Service Schedule, LDV
There is a lack of publicly available real-world data on solely maintenance expenditures,
as the costs in this section from YourMechanic, Utilimarc, and Consumer Reports datasets
include repairs. While we considered using maintenance costs from the Edmunds True Cost to
Own® dataset, it is potentially missing maintenance costs from services that occur late in vehicle
life as it only covers 10 years of ownership. However, as scheduled maintenance is supposed to
be completed according to set intervals prescribed by OEMs, we developed a generic
maintenance service schedule for each powertrain type using owner’s manuals from various
makes and models including the Toyota Yaris, Camry, Camry HEV, Prius, and Prius Prime;
Chevrolet Cruze, Volt, and Bolt; Nissan Sentra, Kicks, and Leaf; Kia Optima, Optima HEV, and
Optima PHEV; Kia Soul and Soul EV; Tesla Model 3 and Model S, Ford Focus; Lincoln MKZ;
BMW i3; VW Golf and e-Golf; and Fiat 500 and 500e. This analysis assumes drivers follow the
recommended service intervals, which in practice not everyone does (Harto 2020b). Datasets that
include vehicles that have not followed preventative maintenance schedules may have lower
reported costs than estimates from our approach, but likely at the expense of either future repair
costs or the early scrappage of the vehicle. Analysis of how consumers maintain their vehicles in
comparison to OEM recommendations is needed.
Since maintenance also includes wear items that do not have an explicit replacement
interval in the owner’s manuals (i.e. unscheduled maintenance), we estimated their average
lifetimes based on guidance from several experts (Vyas 2012; Thomas and Boundy 2019;
Cheung 2020) as well as automotive websites (RepairPal 2020; YourMechanic 2020). There is
significant uncertainty in service intervals for wear items, since in many cases, a service will not
be necessary for a significant portion of vehicles, while in other cases the part may fail early
either due to factors such as improper preventative maintenance, harsh operating conditions,
and/or differences in OEM part design life and quality. Further analysis of service intervals is
required, especially for large cost items discussed below.
After developing the maintenance service schedule, we collected national average costs
for each of the preventative and unscheduled services, which were used to calculate costs per
mile for each powertrain (Thomas and Boundy 2019; Cheung 2020; RepairPal 2020;
YourMechanic 2020). Service cost varies by several factors, including the type of mechanic
(dealership vs. chain vs. independent), part quality (OEM vs. aftermarket), and make and model
cost characteristics (domestic vs. import and mass market vs. luxury). We do not assume drivers
perform any of their maintenance services, as there is not data available on how often drivers do
so. “Do it yourself” maintenance will reduce costs, though depending on the service will require
investment in both tools and skill development. For our goal of comparing powertrains,

82
standardizing assumptions enables us to compare key services, though further analysis is needed
to make these estimates more accurate.
As our data are based primarily on gasoline passenger cars and their advanced powertrain
counterparts, we also wanted to examine the potential maintenance cost differences between
vehicle types (e.g. car vs. SUV vs. pickup), gasoline and diesel powertrains, and BEV and FCEV
powertrains. Vehicle type may influence maintenance costs as some part sizes and fluid
capacities can be larger for bigger vehicles (e.g. larger tires needed for a pickup). However,
when examining the Edmunds dataset, no significant difference was found over 10 years of
ownership. Total maintenance and repair costs of medium-duty diesel vehicles were about 34%
higher than of their gasoline counterparts, based on the Utilimarc dataset (Burnham 2020). While
it is not clear whether the cost difference is due to maintenance or repairs, it seems most likely
repairs are the issue since the most obvious maintenance difference between the vehicles is that
diesels do not have spark plugs, which is a relatively small cost. The Edmunds dataset has a very
limited number of diesel vehicles and there is no clear trend. In this analysis, we assume that the
maintenance cost is the same for gasoline and diesel. As there are no FCEVs in the Edmunds
dataset, and with the expectation that BEVs and FCEVs should have similar maintenance
schedules, we assume their maintenance costs are the same. Each of these data gaps should,
however, be examined further in the future as more data become available.
Table 3.16 summarizes the service schedules and costs for each major powertrain type.
Many services have different schedules for the different powertrains (14 of the 24 in Table 3.16),
as advanced powertrains can either extend service intervals (e.g. spark plugs for HEVs and
PHEVs) or eliminate the service (e.g. oil changes for BEVs). The results show that the reduction
in maintenance cost per mile for HEVs, PHEVs, and BEVs as compared to ICEVs were 7%,
11%, and 41%, respectively. Figure 3.28 presents the same data as Table 3.16. In Figure 3.28,
red items represent powertrain maintenance, purple items represent filter replacement, green
items represent fluid changes, orange items represent brake maintenance, gray items represent
suspension maintenance, yellow items represent tire maintenance, and blue items represent
general service items. Items marked with asterisks have service intervals that vary across
powertrains. Hybridized powertrains have cost reductions relative to the conventional ICEV for
the brakes and powertrains. BEVs have reduced costs for powertrain, filters, fluids, and brake
maintenance.
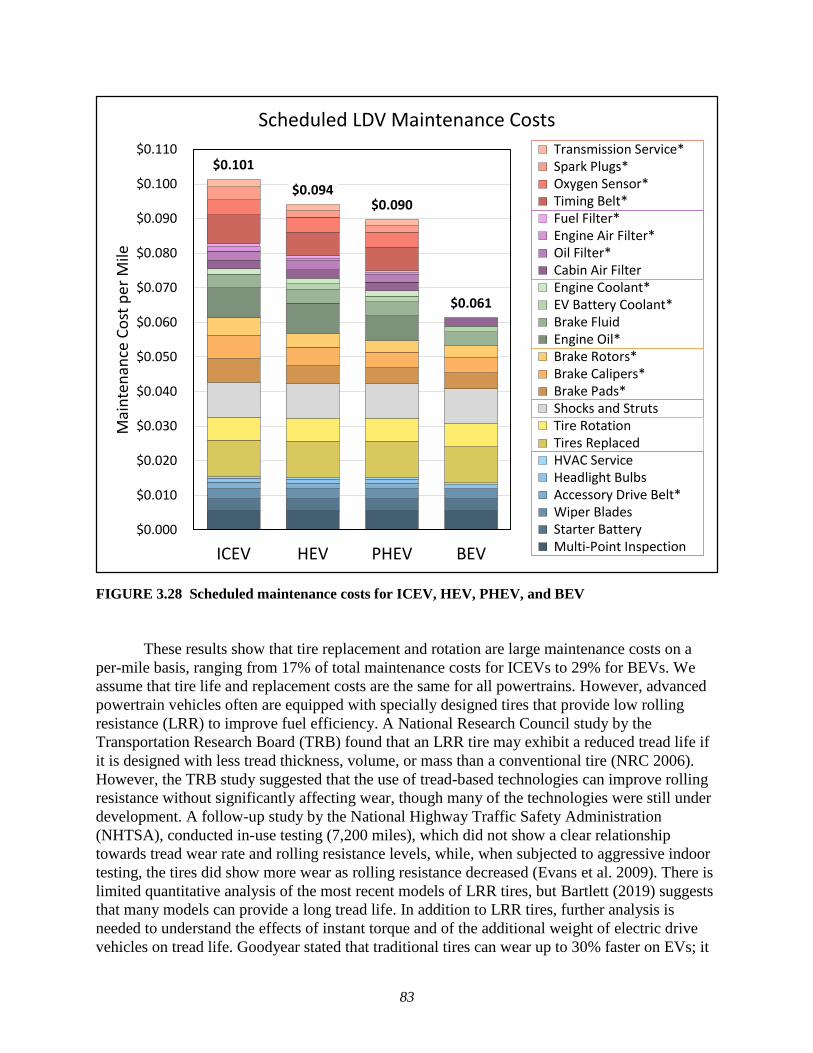
83
FIGURE 3.28 Scheduled maintenance costs for ICEV, HEV, PHEV, and BEV
These results show that tire replacement and rotation are large maintenance costs on a
per-mile basis, ranging from 17% of total maintenance costs for ICEVs to 29% for BEVs. We
assume that tire life and replacement costs are the same for all powertrains. However, advanced
powertrain vehicles often are equipped with specially designed tires that provide low rolling
resistance (LRR) to improve fuel efficiency. A National Research Council study by the
Transportation Research Board (TRB) found that an LRR tire may exhibit a reduced tread life if
it is designed with less tread thickness, volume, or mass than a conventional tire (NRC 2006).
However, the TRB study suggested that the use of tread-based technologies can improve rolling
resistance without significantly affecting wear, though many of the technologies were still under
development. A follow-up study by the National Highway Traffic Safety Administration
(NHTSA), conducted in-use testing (7,200 miles), which did not show a clear relationship
towards tread wear rate and rolling resistance levels, while, when subjected to aggressive indoor
testing, the tires did show more wear as rolling resistance decreased (Evans et al. 2009). There is
limited quantitative analysis of the most recent models of LRR tires, but Bartlett (2019) suggests
that many models can provide a long tread life. In addition to LRR tires, further analysis is
needed to understand the effects of instant torque and of the additional weight of electric drive
vehicles on tread life. Goodyear stated that traditional tires can wear up to 30% faster on EVs; it
$0.101
$0.094 $0.090
$0.061
$0.000
$0.010
$0.020
$0.030
$0.040
$0.050
$0.060
$0.070
$0.080
$0.090
$0.100
$0.110
ICEV HEV PHEV BEV
Mai
nte
nan
ce C
ost
pe
r M
ileScheduled LDV Maintenance Costs
Transmission Service* Spark Plugs* Oxygen Sensor* Timing Belt* Fuel Filter* Engine Air Filter* Oil Filter* Cabin Air Filter Engine Coolant* EV Battery Coolant* Brake Fluid Engine Oil* Brake Rotors* Brake Calipers* Brake Pads* Shocks and Struts Tire Rotation Tires Replaced HVAC Service Headlight Bulbs Accessory Drive Belt* Wiper Blades Starter Battery Multi-Point Inspection

84
is one of the tire companies with tires specifically designed for these issues (Goodyear 2018;
Adams 2018). If BEV tire life is reduced by 30%, then BEV maintenance cost per mile would
increase by about 7%, from $0.060 to $0.064 per mile.
The replacement of brake fluids, pads, rotors, and calipers are another major maintenance
cost on a per-mile basis, ranging from 18% for PHEVs to 26% for BEVs. We assume that brake
pad, rotor, and caliper replacement intervals can be extended from ICEVs by 33% for HEVs and
by 50% for PHEVs and BEVs due to less friction wear that results from the use of regenerative
braking (Vyas 2012). We assume that PHEVs and BEVs have more regenerative braking
capabilities than HEVs and, therefore, that their service intervals can be extended longer than
HEVs due to their larger battery capacity and electric motor (Varocky 2011; Vyas 2012).
However, it has been assumed that both HEVs and PEVs may not need any brake work during a
150,000 mile vehicle life (Davis et al. 2013), while another analysis suggested that BEV brake
pad life could be around 134,000 miles (Logtenberg et al. 2018). Further study of brake life for
advanced powertrain vehicles should be conducted as there is a dearth of real-world data
available. If HEV, PHEV, and BEV brake pad and rotor service intervals were increased to
150,000 miles, their total maintenance cost per mile would decrease about 4%, 3%, and 4%,
respectively. In a best case scenario, in which no brake pad, rotor, or caliper work is ever needed
for these advanced powertrain vehicles, maintenance costs for HEV, PHEV, and BEV would be
22%, 24%, and 53% lower than a comparable ICEV, respectively.
Within this analysis, we use the generalized maintenance schedules in Table 3.16 for
each powertrain. We further smooth these schedules by averaging costs over five years (two
years prior and two years later), in order to account for both variations in driving behavior and
deviations from a strict maintenance schedule.

85
TABLE 3.16 Maintenance service schedule by powertrain (Vyas 2012; Thomas and Boundy 2019; Cheung 2020; RepairPal 2020;
YourMechanic 2020)
Service
Service Interval (mi)
Service
Cost ($) Cost per Mile ($) Cost per Mile (%)
ICEV HEV PHEV BEV All ICEV HEV PHEV BEV ICEV HEV PHEV BEV
Engine Oil* 7,500 7,500 9,000 $65 $0.009 $0.009 $0.007 $0.000 9% 9% 8% 0%
Oil Filter* 7,500 7,500 9,000 $20 $0.003 $0.003 $0.002 $0.000 3% 3% 2% 0%
Tire Rotation 7,500 7,500 7,500 7,500 $50 $0.007 $0.007 $0.007 $0.007 7% 7% 7% 11%
Wiper Blades 15,000 15,000 15,000 15,000 $45 $0.003 $0.003 $0.003 $0.003 3% 3% 3% 5%
Cabin Air Filter 20,000 20,000 20,000 20,000 $50 $0.003 $0.003 $0.003 $0.003 2% 3% 3% 4%
Multi-Point Inspection 20,000 20,000 20,000 20,000 $110 $0.006 $0.006 $0.006 $0.004 5% 6% 6% 7%
Engine Air Filter* 30,000 66,667 83,333 $40 $0.001 $0.001 $0.000 $0.000 1% 1% 1% 0%
Brake Fluid 37,500 37,500 37,500 37,500 $150 $0.004 $0.004 $0.004 $0.004 4% 4% 4% 7%
Tires Replaced 50,000 50,000 50,000 50,000 $525 $0.011 $0.011 $0.011 $0.011 10% 11% 12% 18%
Brake Pads* 50,000 66,667 75,000 75,000 $350 $0.007 $0.005 $0.005 $0.005 7% 6% 5% 8%
Starter Battery 50,000 50,000 50,000 50,000 $175 $0.004 $0.004 $0.004 $0.004 3% 4% 4% 6%
Spark Plugs* 60,000 120,000 120,000 $225 $0.004 $0.002 $0.002 $0.000 4% 2% 2% 0%
Oxygen Sensor* 80,000 80,000 80,000 $350 $0.004 $0.004 $0.004 $0.000 4% 5% 5% 0%
Headlight Bulbs 80,000 80,000 80,000 80,000 $90 $0.001 $0.001 $0.001 $0.001 1% 1% 1% 2%
Transmission Service* 90,000 110,000 110,000 $200 $0.002 $0.002 $0.002 $0.000 2% 2% 2% 0%
Timing Belt* 90,000 110,000 110,000 $750 $0.008 $0.007 $0.007 $0.000 8% 7% 8% 0%
Accessory Drive Belt* 90,000 110,000 110,000 $165 $0.002 $0.002 $0.002 $0.000 2% 2% 2% 0%
HVAC Service 100,000 100,000 100,000 100,000 $50 $0.001 $0.001 $0.001 $0.001 0% 1% 1% 1%
Brake Rotors* 100,000 125,000 150,000 150,000 $500 $0.005 $0.004 $0.003 $0.003 5% 4% 4% 6%
Shocks and Struts 100,000 100,000 100,000 100,000 $1,000 $0.010 $0.010 $0.010 $0.010 10% 11% 11% 17%
Engine Coolant* 125,000 125,000 125,000 $190 $0.002 $0.002 $0.002 $0.000 1% 2% 2% 0%
EV Battery Coolant* 125,000 125,000 125,000 $210 $0.000 $0.002 $0.002 $0.002 0% 2% 2% 3%
Fuel Filter* 150,000 150,000 200,000 $110 $0.001 $0.001 $0.001 $0.000 1% 1% 1% 0%
Brake Calipers* 150,000 187,500 225,000 225,000 $1,000 $0.007 $0.005 $0.004 $0.004 7% 6% 5% 7%
Total Cost per Mile $0.101 $0.094 $0.090 $0.060 100% 100% 100% 100%
* Service intervals that vary by powertrain

86
3.5.4. Repair Costs, LDV
There is a lack of publicly available real-world repair costs for vehicle types, powertrains,
makes, or models, as the total M&R cost data in this section from YourMechanic, Utilimarc, and
Consumer Reports include maintenance costs. The best dataset available was the Edmunds True
Cost to Own® dataset, which estimates the costs of repairs not covered by the OEM's warranties
using the cost of a zero deductible extended warranty (i.e. service contract) for each make and
model, minus their estimate of the warranty provider's overhead and profit (Edmunds TCO
2020). The challenge of this approach is that many of the factors that impact the estimated repair
cost are not transparent from the Edmunds dataset, including the exact extended warranty
coverage level and Edmunds overhead and profit estimate (Cheung 2020).
The two types of extended warranty coverages are inclusionary, which enumerate what
services are covered, and exclusionary, which state what services are not covered. Similar to an
OEM warranty, even a “bumper-to-bumper” extended warranty will not cover most wear items
(Vincent 2018; Endurance 2015). However, in our analysis we were mindful that an extended
warranty could potentially cover services that were included in our maintenance schedule in
Section 3.5.3. Therefore, we examined a “bumper-to-bumper” extended warranty service
contract with the highest level of coverage to make sure we were not double-counting costs
(Endurance 2015). This approach also helped clarify that we should include several services
(e.g. oxygen sensors, shocks, struts, belts) in our maintenance schedule as they were not included
in extended warranties. Therefore, assuming Edmunds data is based on a similar level of
coverage, our repair results can be added to our maintenance schedule to estimate total M&R
costs.
The Edmunds dataset included the 5-year ownership projections of both used (going back
to MY2014) and new vehicles. We used the 5-year repair projections of both MY2014 and
MY2019 vehicles. This allows us to look at a 10-year ownership window, with the caveat that
the estimates for years 1-5 and 6-10 are for different model years. While it varies by OEM, a new
vehicle “factory” warranty typically covers “bumper-to-bumper” for 3 years/36,000 miles and
the powertrain for 5 years/60,000 miles. As seen in Figure 3.29, estimated repair costs are zero
for the first two years and near zero for the third year, as the “bumper-to-bumper” warranty
expires due to Edmunds’ assumed 15,000 annual VMT. In this figure, we see the transition from
the model year 2019 to 2014, as year six does not follow the previous trend; the repair cost in
that year is an artifact of using two different model years, and so this is presented as a dotted
line. However, we do see in years 6-10 that repair costs increase at roughly the same rate across
the vehicle types.
Figure 3.29 shows that pickup trucks have lower average repair costs as a percentage of
MSRP than cars, a 35% reduction for years 1-5 and 30% reduction for years 6-10, relative to
cars. SUVs also had lower costs than cars, a 17% reduction for years 1-5 and 9% reduction for
years 6-10, relative to cars. As mentioned previously in Section 3.4.1.3 a potential reason for this
difference in repairs is because pickups and SUVs currently have higher profit margins than cars
and thus lower component costs as a percentage of MSRP (Ulrich 2019). This would then likely
reduce repair costs for these vehicles, since part costs as a percentage of MSRP are lower.
Another potential reason could be the difference between repair frequency and/or cost between

87
various OEMs and their model availability for each vehicle type (J.D. Power 2020). For
example, many of the largest OEMs have focused production on SUVs and pickups, and those
OEMs tend to have low repair costs for all vehicle types they produce (including cars). The
OEMs that only produce cars (or cars and SUVs) tend to have higher repair costs. While the
Edmunds TCO (2020) dataset does not exactly match the JD Power (2020) dependability
rankings, it shows that of the 32 OEMs, 6 of the 12 OEMs with the lowest repair costs produced
all three vehicle types, while the other 20 OEMs either produced only cars and/or SUVs. For
some of the OEMs that only produce cars (or cars and SUVS), these higher repair costs might be
at least partially attributable to the lack of mechanics and more difficulty sourcing parts for lower
volume imported vehicles.
FIGURE 3.29 Annual repair costs as a percentage of MSRP by vehicle age (data from
Edmunds TCO 2020)
We examined repair costs per mile as a function of MSRP for each vehicle age and type.
Figures 3.30 and 3.31 show sample results for years 5 and 10 with the vehicle types aggregated
to show the exponential form of the results. These empirical exponential fits have reasonably
high R^2 values of 0.80 and 0.85. The model of repair costs developed from the Edmunds
dataset for each year is of the form:
𝑅𝑒𝑝𝑎𝑖𝑟𝑖 = 𝑎𝑖𝑒𝑏𝑥, 𝑖 = 1, … ,15 Eq 3.12
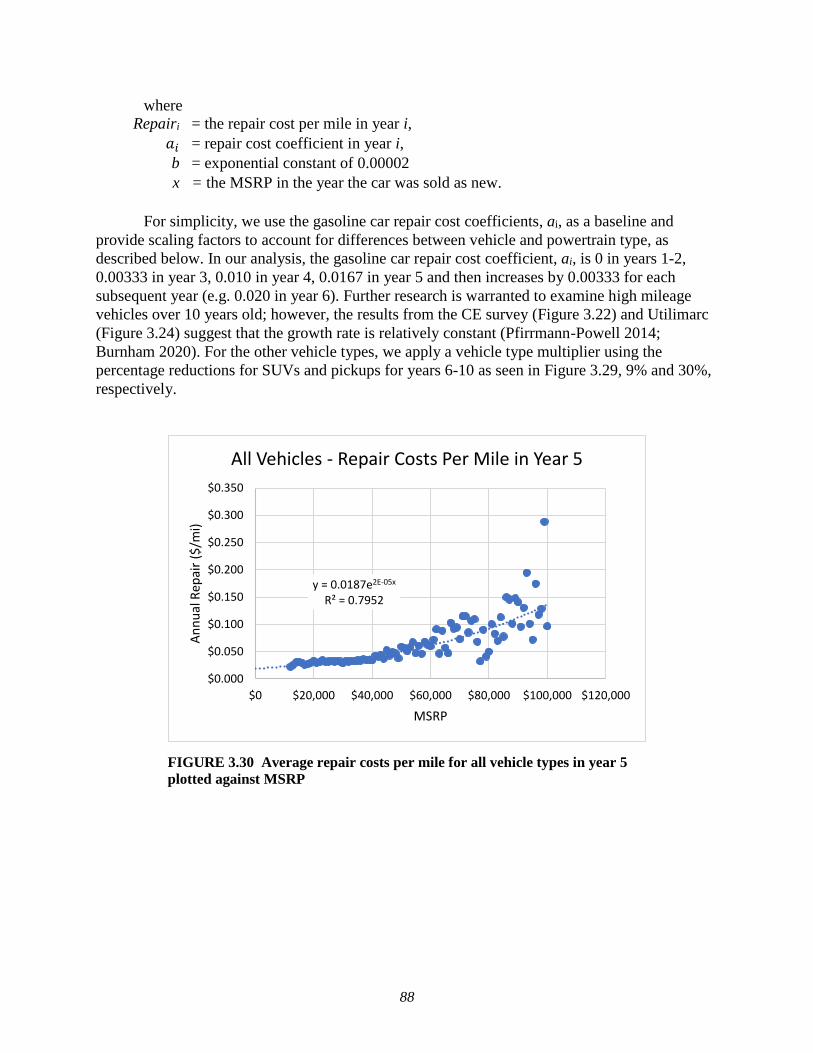
88
where
Repairi = the repair cost per mile in year i,
𝑎𝑖 = repair cost coefficient in year i,
b = exponential constant of 0.00002
x = the MSRP in the year the car was sold as new.
For simplicity, we use the gasoline car repair cost coefficients, ai, as a baseline and
provide scaling factors to account for differences between vehicle and powertrain type, as
described below. In our analysis, the gasoline car repair cost coefficient, ai, is 0 in years 1-2,
0.00333 in year 3, 0.010 in year 4, 0.0167 in year 5 and then increases by 0.00333 for each
subsequent year (e.g. 0.020 in year 6). Further research is warranted to examine high mileage
vehicles over 10 years old; however, the results from the CE survey (Figure 3.22) and Utilimarc
(Figure 3.24) suggest that the growth rate is relatively constant (Pfirrmann-Powell 2014;
Burnham 2020). For the other vehicle types, we apply a vehicle type multiplier using the
percentage reductions for SUVs and pickups for years 6-10 as seen in Figure 3.29, 9% and 30%,
respectively.
FIGURE 3.30 Average repair costs per mile for all vehicle types in year 5
plotted against MSRP
y = 0.0187e2E-05x
R² = 0.7952
$0.000
$0.050
$0.100
$0.150
$0.200
$0.250
$0.300
$0.350
$0 $20,000 $40,000 $60,000 $80,000 $100,000 $120,000
An
nu
al R
epai
r ($
/mi)
MSRP
All Vehicles - Repair Costs Per Mile in Year 5

89
FIGURE 3.31 Average repair costs per mile for all vehicle types in year 10
plotted against MSRP
Next, we analyzed the relationship between repair costs and the MSRP by powertrain. As
was discussed in the insurance analysis in Section 0, the Edmunds dataset has a limited number
of makes and models for powertrains other than gasoline, so it is difficult to use that data to
model and compare. Instead, we compared the repair costs of HEVs, PHEVs, and BEVs to their
ICEV counterparts with an equivalent make, model, and trim; these are the same vehicles used in
the insurance analysis listed in Table 3.14.
The total repair costs across all vehicle types for HEVs, PHEVs, and BEVs were 9%,
14%, and 33% lower than each ICEV counterpart on a percentage of MSRP-basis. We use these
percent differences as the powertrain multipliers in Table 3.17. These percent differences are
similar to the values generated for each powertrain from our maintenance service schedule in
Section 3.5.3 (7%, 11%, and 41%, respectively). As discussed in Section 3.5.3, there is a lack of
data on the repair costs of light-duty diesel vehicles and FCEVs. In this analysis, we assume that
diesel costs are equal to gasoline and FCEVs equal BEVs, though suggest that this topic should
be explored further. We assume that the fuel cell systems in FCEVs will last the lifetime of the
vehicle, consistent with modeling and analysis by the HFTO (Joseck et al. 2018; James 2020;
Kleen and Padgett 2021).
A summary of our scaling factors by vehicle and powertrain type is shown in Table 3.17
for use as inputs to the below repair cost per mile equation. The multipliers by vehicle (v) and
powertrain (p) type are shaded in the table below. We also show the net multiplier (i.e. product
of the two axes) in the non-shaded cells. For example, the repair cost per mile in a given year
would be 39% lower for a BEV SUV than a gasoline car, if they had the same MSRP. The repair
cost for a vehicle in year i is then given by Eq. 3.13:
y = 0.0303e2E-05x
R² = 0.8485
$0.000
$0.050
$0.100
$0.150
$0.200
$0.250
$0 $20,000 $40,000 $60,000 $80,000 $100,000 $120,000
An
nu
al R
epai
r ($
/mi)
MSRP
All Vehicles - Repair Costs Per Mile in Year 10

90
𝑅𝑒𝑝𝑎𝑖𝑟𝑖 = 𝑣 𝑝 𝑎𝑖𝑒𝑏𝑥, 𝑖 = 1, … ,15 Eq 3.13
where
Repairi = the repair cost per mile in year i,
v = the appropriate vehicle type multiplier from Table 3.17,
p = the appropriate powertrain type multiplier from Table 3.17,
𝑎𝑖 = gasoline car repair cost coefficient in year i,
b = exponential constant of 0.00002,
x = the MSRP in the year the car was sold as new.
TABLE 3.17 Summary of repair cost multipliers by vehicle type and powertrain compared to
gasoline car on MSRP-basis
Powertrain ICEV HEV PHEV BEV FCEV
Vehicle Type Multipliers 1.00 0.91 0.86 0.67 0.67
Car 1.00 1.00 0.91 0.86 0.67 0.67
SUV 0.91 0.91 0.81 0.78 0.61 0.61
Pickup 0.70 0.70 0.62 0.60 0.47 0.47
3.5.5. Maintenance and Repair Costs, MHDV
For medium- and heavy-duty vehicles, we used the Utilimarc dataset to estimate MHDV
M&R costs per mile by vehicle age as shown in Figure 3.32. The results can be grouped into
categories: semi-tractors; medium-duty vans and pickups; transit buses; box, utility aerial, and
dump trucks; and refuse trucks. The semi-tractor results were developed using both ATRI
(Murray and Glidewell 2019) and the Utilimarc datasets, while all other values relied solely on
Utilimarc.
The semi-tractors in municipal and utility service from Utilimarc had an average annual
VMT that was much lower (25,000 when new) than those analyzed by ATRI and thus do not
represent a commercial freight duty-cycle. The ATRI dataset only provides an average cost for
all vehicles and the average age of those vehicles (4.4 years). Therefore, we scaled the Utilimarc
semi-tractor cost curve to match ATRI costs for a 4-year-old vehicle, resulting in an M&R cost
of $0.12 per mile in year 1 and $0.57 per mile in year 15. Further analysis is needed to
understand commercial semi-tractor M&R costs as the vehicle ages since the truck will change
vocations (e.g. moving from long haul to regional haul to drayage operations). A well-
maintained semi-tractor engine may have a life of 1,000,000 miles, though a rebuild, which costs
$20,000 to $30,000, can be expected by around 750,000 miles (Shadof 2017).
The medium-duty van and pickup M&R costs increase annually in a roughly linear
fashion from about $0.07-$0.15 per mile in year 1 to about $0.55-$0.65 per mile in year 15.
Transit bus life is typically 12 years and we see an increase from $0.20 per mile in year 1 to
$1.70 in year 12. The box, utility, and dump trucks costs increase from $0.35-$0.50 per mile in
year 1 to $1.55-$1.60 in year 15. The refuse truck costs have by far the largest costs for M&R,
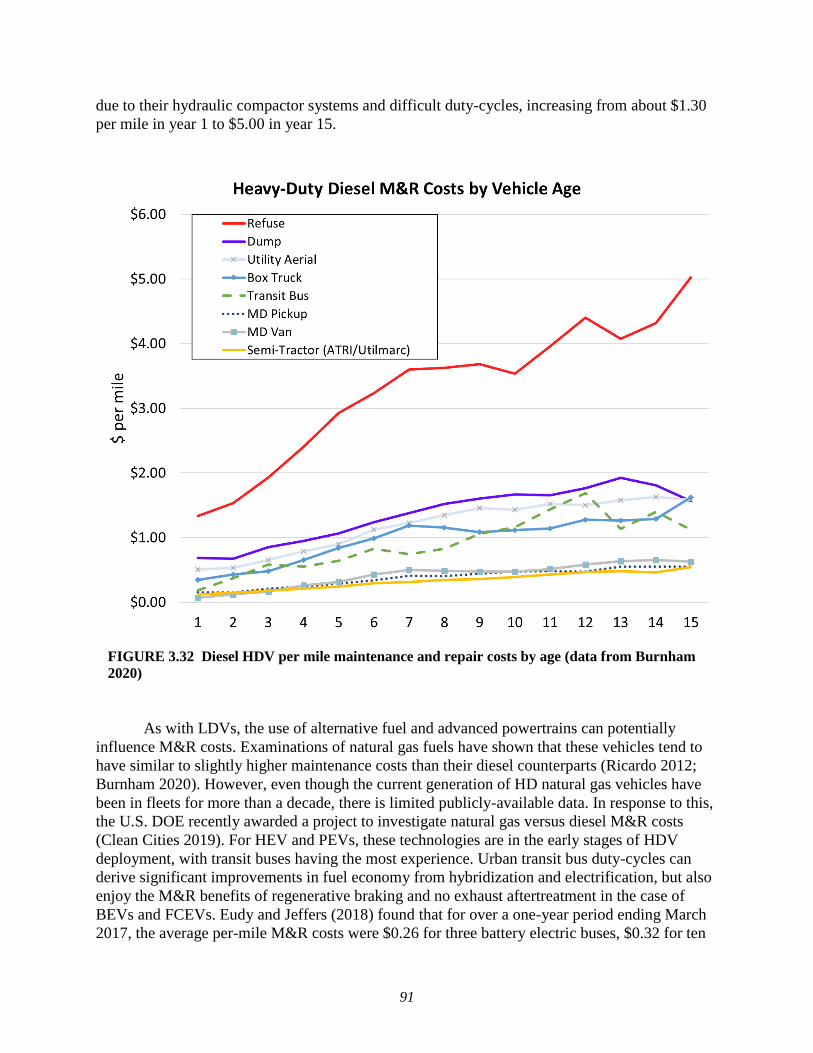
91
due to their hydraulic compactor systems and difficult duty-cycles, increasing from about $1.30
per mile in year 1 to $5.00 in year 15.
FIGURE 3.32 Diesel HDV per mile maintenance and repair costs by age (data from Burnham
2020)
As with LDVs, the use of alternative fuel and advanced powertrains can potentially
influence M&R costs. Examinations of natural gas fuels have shown that these vehicles tend to
have similar to slightly higher maintenance costs than their diesel counterparts (Ricardo 2012;
Burnham 2020). However, even though the current generation of HD natural gas vehicles have
been in fleets for more than a decade, there is limited publicly-available data. In response to this,
the U.S. DOE recently awarded a project to investigate natural gas versus diesel M&R costs
(Clean Cities 2019). For HEV and PEVs, these technologies are in the early stages of HDV
deployment, with transit buses having the most experience. Urban transit bus duty-cycles can
derive significant improvements in fuel economy from hybridization and electrification, but also
enjoy the M&R benefits of regenerative braking and no exhaust aftertreatment in the case of
BEVs and FCEVs. Eudy and Jeffers (2018) found that for over a one-year period ending March
2017, the average per-mile M&R costs were $0.26 for three battery electric buses, $0.32 for ten
92
hybrid buses, and $0.46 for three diesel buses. Transit buses have many M&R issues and the cost
differential was not fully due to the powertrains; for example, repairs to seats, doors, tires, and
HVAC system were also included. The per-mile powertrain-only M&R costs were $0.05, $0.12,
and $0.13 for the BEV, HEV, and diesel, respectively (Eudy and Jeffers 2018).
It is difficult to draw conclusions from individual transit bus fleet case studies, as M&R
costs can vary widely for buses within an agency and between different agencies due to
operating conditions like average speed, the size of the bus fleet, and experience of the
maintenance staff (Clark et al. 2009). Therefore, it is useful to examine a wide range of studies to
better understand this variance. Blynn (2018) surveyed the M&R cost savings claimed by battery
electric bus manufacturers, projected savings by academic and government studies for CNGVs,
HEVs, and BEVs, and estimated savings from empirical studies. Blynn (2018) developed values
for three cases (low, mid, and high) for the relative M&R costs of the alternative fuel and
advanced powertrains in comparison to diesel buses, as summarized in Table 3.18. The mid-case
M&R reductions for CNGVs, HEVs, and BEVs were 0%, 13%, and 40% respectively. The
results for HEVs and BEVs are very similar to both our LDV maintenance and LDV repairs
estimates in Sections 3.5.3 and 3.5.4. Blynn (2018) did not provide estimates for HDV PHEVs or
FCEVs; therefore, based on our light-duty analysis, we used the relative weighting of our LDV
HEV, PHEV, and BEV M&R reductions versus gasoline to generate reductions of HDV PHEVs
and assumed FCEVs have the same M&R reductions as BEVs. As mentioned in Section 3.2.1.1,
we assume that PHEV and BEV battery packs in MHDV PHEVs and BEVs last the lifetime of
the vehicle. As with LDV FCEVs we assume that the fuel cell systems in MHDV FCEVs will
last the lifetime of the vehicle, consistent with analysis by the HFTO (Marcinkoski et al. 2019).
These estimates can be applied as reasonable bounds for other HDV types as well, until further
demonstration and analysis is conducted. As such, we use the mid-case results for all MHDV
types as input for the TCO calculation. A summary of all of these results is found in Table 3.18.
TABLE 3.18 Summary of transit bus maintenance and repair cost
multipliers (adapted from Blynn 2018)
Case Powertrain
CNGV HEV PHEV BEV FCEV
Low 111% 96% 94% 79% 79%
Mid 100% 87% 84% 60% 60%
High 88% 73% 69% 41% 41%
3.6. TAXES AND FEES
Vehicle taxes and fees, including sales tax, license, registration, tolls, and parking, are an
important component for comparing TCO across powertrains in both the LDV and MHDV
sectors. In some cases, these fees can be dependent on the powertrain type (e.g. registration),
while in others, the incremental price of advanced vehicles can play a role (e.g. sales tax). In this
analysis, we focus on national average data, but also examine state and local data, as fees depend
on enacted policies that vary by area.

93
3.6.1. Taxes and Fees, LDV
When purchasing a new vehicle, the owner will need to pay several different fees. In
most states, a sales tax is placed on the purchase price of a vehicle. Local governments often add
an additional tax on top of the state tax. Vehicle registration fees are paid to the state, which
include the cost to register, title, and obtain license plates. In addition, dealerships charge a
documentation fee for the administrative work to process paperwork involved in a vehicle sale,
such as preparing the sales contract and filing for the title and registration. In some states, the
documentation fee is capped by law, but in most, there is no limit (Gareffa 2019). Figure 3.33
shows state-based sales tax, registration fee, and documentation fees based on Gareffa (2019)
and Avalara (2020) for a $38,000 LDV, which was the average new vehicle transaction price in
2020 (KBB 2020). The sales tax data in the figure represent the maximum rate accounting for
both the state rate and the highest local rate in that state, which tend to be in place in a state’s
most populous areas. Delaware and Georgia do not have a vehicle sales tax, but have higher
registration fees than most other states. The population-weighted national sales tax rate, initial
vehicle registration fees, and documentation fee are 8.4%, $268, and $300, respectively.
FIGURE 3.33 Sales tax, registration fee, and documentation fee by state (data from Gareffa 2019;
Avalara 2020)
In addition to registering a vehicle at the time of purchase, each state has either annual or
biennial vehicle registration fees. Depending on the state, registration can be a flat fee or is
scaled by metrics such as vehicle weight and age. As seen in Figure 3.34, results from the
Consumer Expenditure Surveys reported average annual state and local registration expenditures
to be $68 in 2018.
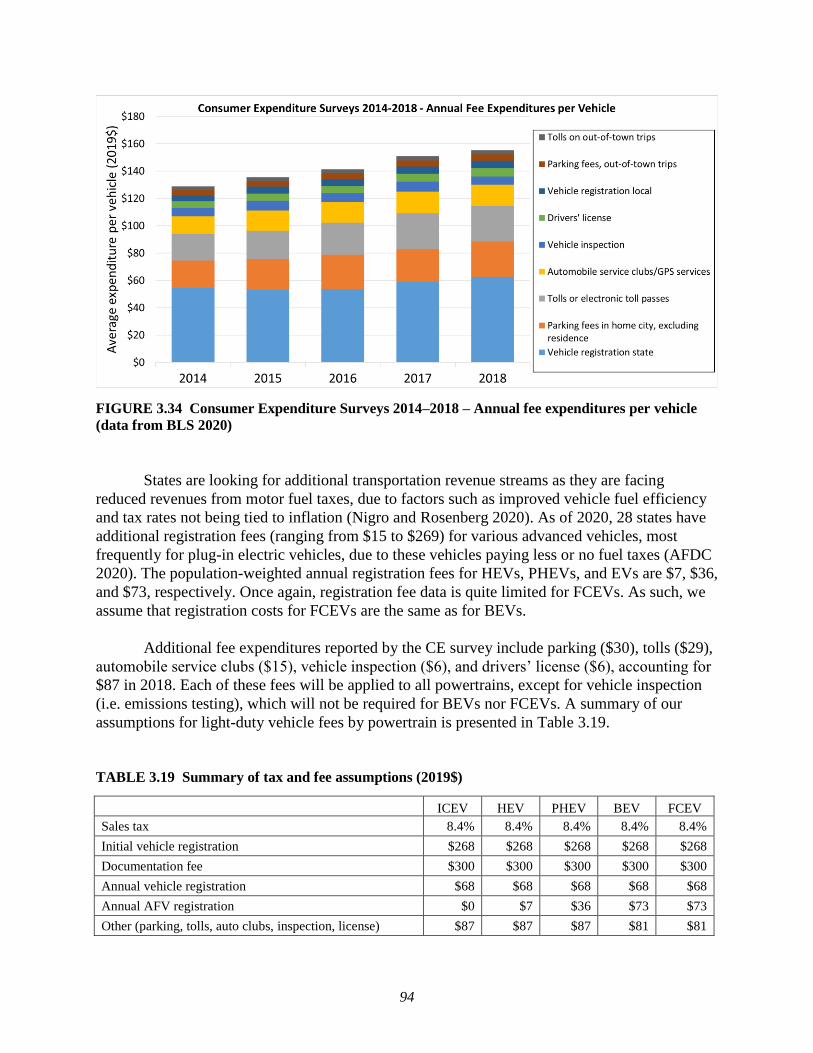
94
FIGURE 3.34 Consumer Expenditure Surveys 2014–2018 – Annual fee expenditures per vehicle
(data from BLS 2020)
States are looking for additional transportation revenue streams as they are facing
reduced revenues from motor fuel taxes, due to factors such as improved vehicle fuel efficiency
and tax rates not being tied to inflation (Nigro and Rosenberg 2020). As of 2020, 28 states have
additional registration fees (ranging from $15 to $269) for various advanced vehicles, most
frequently for plug-in electric vehicles, due to these vehicles paying less or no fuel taxes (AFDC
2020). The population-weighted annual registration fees for HEVs, PHEVs, and EVs are $7, $36,
and $73, respectively. Once again, registration fee data is quite limited for FCEVs. As such, we
assume that registration costs for FCEVs are the same as for BEVs.
Additional fee expenditures reported by the CE survey include parking ($30), tolls ($29),
automobile service clubs ($15), vehicle inspection ($6), and drivers’ license ($6), accounting for
$87 in 2018. Each of these fees will be applied to all powertrains, except for vehicle inspection
(i.e. emissions testing), which will not be required for BEVs nor FCEVs. A summary of our
assumptions for light-duty vehicle fees by powertrain is presented in Table 3.19.
TABLE 3.19 Summary of tax and fee assumptions (2019$)
ICEV HEV PHEV BEV FCEV
Sales tax 8.4% 8.4% 8.4% 8.4% 8.4%
Initial vehicle registration $268 $268 $268 $268 $268
Documentation fee $300 $300 $300 $300 $300
Annual vehicle registration $68 $68 $68 $68 $68
Annual AFV registration $0 $7 $36 $73 $73
Other (parking, tolls, auto clubs, inspection, license) $87 $87 $87 $81 $81
95
3.6.2. Taxes and Fees, MHDV
There is a 12% federal excise tax (FET) on the retail sale of most new heavy-duty trucks
(Government Printing Office 2012). In addition, sales taxes apply to sales of commercial
vehicles in some states. There is also the federal Heavy Vehicle Use Tax (HVUT) for heavy-duty
vehicles with a weight rating of 55,000 lb or greater (FHWA 2020). The amount depends on the
unloaded weight and the maximum load customarily carried on the vehicle. For HDVs with a
weight rating between 55,000 lb and 75,500 lb, the tax is $100, plus $22 per 1,000 lb over
55,000 lb. For vehicles exceeding 75,500 lb, the tax is $550. Some HDVs are exempt from the
HVUT, such as government vehicles, non-profit emergency response vehicles, mass transit
vehicles, and other vehicles in special cases.
The latest data collected on annual state-level commercial HDV registration fees was by
the FHWA (2008), which estimated the national average for single-unit trucks and class 8 semi-
tractors to be about $880 and $1425 per year, respectively (2019$). As commercial truck
registration fees are typically based on either empty or gross vehicle weight, we used the FHWA
data to estimate the annual fees on an empty weight-basis for single-unit trucks and semi-tractors
to be, $0.14 and $0.10 per pound, respectively. Fees such as permits, licenses, and tolls paid by
HDV operators depend on the state in which the HDV travels. In 2018, ATRI found commercial
freight carriers spent about $0.05 per mile or $4,800 per year on these fees (Murray and
Glidewell 2019). No per-vehicle data was available for public fleets, but they likely do not pay
local fees.
In this analysis, the baseline operational weights for each vehicle come from Autonomie
modeling, and represent a typical load for each size class. In the TCO analysis, these vehicles are
then taxed appropriately based on their modeled sales price and loaded vehicle weight.
3.7. COSTS AND CONSIDERATIONS SPECIFIC TO COMMERCIAL VEHICLES
Commercial vehicle purchase decisions are largely driven by economics, but purchasers
also consider a variety of “soft” costs and benefits that are difficult to quantify, such as driver
retention, payload capacity, and corporate image. Several TCO calculators are publicly available,
but many do not include cost data because they are developed for fleet purchasers and users are
expected to have information specific to their operations. However, they do provide guidance on
what parameters are most relevant to consumers. To identify and prioritize cost elements unique
to commercial vehicles, we reviewed available TCO tools and conducted two virtual workshops
with fleets and manufacturers. These workshops also provided insights on data sources, valuation
methodologies, and experience with early production electrified commercial vehicles.
Section 3.7.1 provides a summary of the qualitative workshop findings. In Section 3.7.2,
we identify priority cost elements, and describe recommended calculations for the
comprehensive TCO calculations. Finally, Section 3.7.3 documents the key assumptions,
derivations, and findings for these cost components specific to commercial vehicles.

96
3.7.1. Summary of Qualitative Workshop Findings
The study team conducted two virtual workshops, the first focusing on manufacturer
perspectives and the second on fleet perspectives on TCO for commercial vehicles. Both
workshops were well attended, demonstrating industry-wide interest in TCO for emerging
technologies. This section summarizes the key points highlighted by the workshop participants,
primarily focusing on cost differences that may arise between powertrain types.
3.7.1.1. Use of TCO and Methodology Issues
Participants indicated that TCO is a widely used criterion in manufacturers’ product
planning and fleet purchase decisions. However, manufacturers cautioned that using bottom-up
cost estimation to determine future vehicle costs is misleading because it underestimates or
neglects recovery of investment in R&D, training, marketing, etc., required to bring new
technologies to market. Fleets and manufacturers both indicated that there is high variation and
uncertainty in many variables and the appropriate value to use - average, maximum, fleet
specific, etc. – depends on the purpose or application of the calculation.
While participants indicated that fleets desire equivalent performance in new
technologies, this requirement can underestimate the adoption potential in applications for which
certain technologies are best suited. Conversely, if future powertrains are evaluated using
parameters for the most suitable applications, this approach discounts the value of versatility,
which is an important feature for many commercial vehicles. In addition, many parameters are
interrelated (e.g., range, vehicle utilization, and charging opportunity), and input assumptions
must be consistent. This greatly complicates assessing TCO for unknown future vehicle
configurations. Finally, while fleets value versatility and want one-to-one replacements for their
current vehicles, in the longer term, vehicles may be purpose-built for specific duty cycles,
especially if they can be kept in service longer at a lower TCO.
Stakeholders indicated that publicly available TCO tools should be comprehensive, with
all possible costs included, but give the user the choice whether to value certain costs and the
option to use their own values. This is particularly true for highly variable, uncertain, and soft
costs. The developer should clearly indicate where values are uncertain. Stakeholders that have
provided TCO calculators cautioned that users may apply the tool without careful attention to the
caveats provided, yet still attribute their results to the tool developer.
3.7.1.2. Vehicle Utilization and VMT
Workshop attendees noted their belief that high vehicle utilization is important to offset
purchase costs when adopting new technologies (i.e. to achieve early payback). Stakeholders’
analyses of BEVs in China showed low utilization for electric trucks compared to diesel trucks,
but it is unclear whether this is due to technology limits (range and charge time) or fear of using
these trucks for more or different applications (range anxiety). When vehicle range or charging
are real limits to operation, a fleet may need to buy more trucks to meet its business needs.

97
New operating regimes (e.g., drop and hook) may offer potential for high utilization by
increasing daily usage, but may also reduce charging opportunities. Similarly, full automation
could increase vehicle utilization since driver hours of service (HOS) regulations by the Federal
Motor Carrier Safety Administration would no longer limit usage, but would also reduce
charging opportunities since continuous usage would be possible for any fleet.
While high utilization may be needed to achieve short payback, if the new technology
continues to be reliable and to save money, it may be kept in the original use profile longer than
a conventional diesel would be, thereby increasing the life over which fuel cost savings are
calculated.
3.7.1.3. Depreciation
In the commercial truck market, trucks are moved to shorter routes closer to their home
base as they age and become less reliable, or for BEVs, as the battery and range degrade. Leasing
companies and large fleets are able to move vehicles within their own operations, while smaller
fleets will sell the vehicles to other fleets that specialize in shorter range operations. However,
for larger long-haul fleets, commercial truck replacement may be driven more by the need to
attract and retain drivers with comfortable up-to-date vehicles than shortcomings in on-road
vehicle performance. Residual value therefore is a key factor in many fleets’ purchase decisions.
The residual value of new technologies will depend on used truck buyers’ confidence in that
technology. While building this confidence, depreciation for new technologies will initially be
accelerated relative to mature diesel technology. This may be further accelerated by performance
advances and cost reductions in each new generation that make new vehicles more attractive than
used ones. The used market also could be depressed by a real or perceived lack of maintenance
support infrastructure.
In the longer term, depreciation will depend on the value of new technology in the
vehicle’s “second-life” application. However, some stakeholders raised the possibility that BEVs
will change this lifecycle phenomenon and that fleets may keep them longer than conventional
diesel trucks if they still show positive cash flow. This would reduce the availability of used
vehicles, increase residual value, and change the appropriate ownership period to use in TCO
calculations that support initial purchase decisions.
Finally, battery life and the development of a secondary market for used batteries is a
factor in whether the battery has a positive or negative impact on BEV residual value. As
discussed in Section 3.2.1.1, while future battery salvage value is still largely unknown, batteries
of the size required for many MHDVs hold the potential for a sizeable salvage value for second-
life application beyond use in the vehicle.
3.7.1.4. Refueling and Recharging
The time required to charge BEVs could result in lost revenue or the need for a larger
fleet compared to diesel. This is likely a greater factor in needing more trucks than reduction in
98
payload capacity. Given HOS rules, the time required to charge may reduce a truck’s potential
daily mileage. This impacts schedule and driver wages since many drivers are paid by the
revenue-mile, especially in longer haul applications. While many analysts assume that trucks
have time to charge overnight, many regional trucks are used in slip-seating / 2-shift operations.
Data for one package delivery fleet show that 68% of the fleet’s tractors were in long-run 2-shift
operations. Stakeholders believe these operations are becoming more commonplace. Long haul
trucks also may be driven by team drivers, which doubles the amount of time the trucks may be
driven and decreases time available for charging.
The energy price for charging MHDVs is unknown and will depend on infrastructure
upgrade costs, which utilities will need to recover, equipment costs, local utility rate structures,
and charging station utilization rates. Utility upgrades and associated costs required to electrify a
fleet are site-specific, variable, and largely unknown. As a result, electricity pricing will vary by
site. Stakeholders reported that today, for low-scale deployment, cost may be around $100,000 /
truck (as noted in Section 0), but costs are non-linear with the scale of deployment. In addition,
the cost of smart charging software should be included in TCO.
3.7.1.5. Maintenance and Repair
There is little to no public data on powertrain repair, maintenance costs, and failure rates
for MHDVs. While OEM’s have warranty data and fleets have out-of-warranty data, it is
considered proprietary. With this lack of data, stakeholders suggested using engineering
judgement and inference from LDV experience.
Diesel technology is very mature, but technologies used to meet the 2007 and 2010
emissions regulations initially were plagued by reliability issues and increased emissions-related
costs. Since 2010, reliability has increased dramatically and these costs have decreased, though
the latter did not return to pre-regulation values. Through the elimination of the M&R associated
with diesel engines and exhaust after-treatment, MHDV BEVs are expected to have lower M&R
costs. However, stakeholders indicated that this has not been the experience to date. Similar to
the diesel emissions control experience, stakeholders voiced expectations for elevated BEV
M&R costs and lower reliability relative to diesel trucks during the learning phase. These costs
will be driven by the initial high cost of major powertrain components and electronics, as well as
lengthy downtime for repairs. In addition, servicing BEVs will require a significant skill set
change, and there are significant challenges with high voltage that will require new procedures,
training, and certification. As a result, stakeholders felt that maintenance initially will be
outsourced and labor will be more expensive. While larger fleets likely will return to in-house
service as the technology matures, smaller fleets and local repair shops may never be able to do
so.
Fleets express concerns over battery lifetime, replacement cost, and residual value.
Experience to date in the U.S. is limited to buses, as discussed in Section 3.5.5, but there is
experience with trucks internationally. According to one stakeholder, battery degradation has
been faster than anticipated, with a life of about 1,000 cycles and replacement required at about 3
99
years. Meanwhile, heavy diesel engines are typically designed for one million miles, which
occurs in 13 to 14 years for the sleeper tractor mileage schedule used in this study.
Finally, M&R costs for trucks of all types could be reduced by application of telematics
for diagnostics and preventative maintenance, but the industry is still learning how to tap that
potential.
3.7.2. Commercial Vehicle Priorities
The wide variety of commercial vehicle configurations, applications, and duty cycles
complicates the calculation of TCO. In addition, data for MHDVs is more scarce and often more
proprietary compared to privately owned, passenger LDVs. Based on stakeholder feedback,
analysis of vehicle population and energy use, new powertrain research activity, and data
availability, the team identified and prioritized vehicle segments and cost elements to focus this
study’s efforts.
The MHDV market was segmented by gross vehicle weight rating (GVWR) class and
body style as shown in Table 3.20. Highest priority was given to segments with high energy
consumption and vehicle population, indicated by colored circles: green: high, yellow: medium,
red: low, no color: very low. Green shading in population and fuel use columns indicates highest
fractions within each. Unfortunately, data were not available for several high population or use
segments, including dump trucks, specialty hauling (flatbeds, stake side, etc.), pickup trucks, and
vans. In this graphic, “Other” includes emergency vehicles and motor homes. Fractions may not
add to 100% due to rounding. Population and fuel use fractions were estimated by NREL using
VIUS 2002 (U.S. Census 2004), 2013 R.L. Polk registration counts (R.L. Polk 2013), and other
published fuel economy and VMT sources (Lustbader et al. 2021).

100
TABLE 3.20 MHDV market segmentation and prioritization
The study team then identified cost parameters unique to commercial vehicles that would
vary by powertrain type, other new technologies, or other considerations, including vehicle
segment or vocation, shown in Table 3.21.
2b 3 4 5 6 7 8 Population Fuel use
Day Cab Tractor 14.3% 25.8%
Sleeper Cab Tractor 14.3% 44.8%
Beverage 0.5% 0.2%
Box Reefer 1.2% 0.8%
Box Truck 9.5% 4.0%
Bus, School 5.6% 1.8%
Bus, Transit/Commuter 1.2% 2.9%
Bus, Shuttle/other 0.0% 0.0%
Concrete 1.1% 0.9%
Dump 9.5% 3.7%
Specialty Delivery 0.1% 0.0%
Specialty Hauling 11.3% 3.3%
Specialty Service 0.3% 0.1%
Pickup 10.3% 3.0%
Refuse 1.5% 1.5%
Step/Walk-in Van 3.5% 1.6%
Tanker 2.8% 1.2%
Tow 1.7% 1.0%
Utility Aerial 3.8% 1.3%
Utility Non-aerial 2.4% 1.1%
Van 4.0% 0.8%
Other 1.2% 0.2%
Weight ClassBody type / vocation
Fraction
Tractor
Single Unit

101
TABLE 3.21 Costs unique to commercial vehicles
3.7.3. Key Cost Elements
As noted in Section 2.2.1, ATRI annually publishes a report describing the operational
costs of trucking (Murray and Glidewell 2019). Figure 3.35 shows how TCO cost elements have
changed over the last decade, though this data is almost entirely based on conventional ICEV.
Based on the cost parameter examination described above, the team identified several of the
most important and quantifiable variable cost parameters specific to commercial vehicles,
particularly those which may vary with the introduction of AFV MHDVs. These include driver
compensation/labor costs, idling, payload capacity costs, and refueling/recharging costs. To
Parameter
Power-
train
Other
Techs Other*
Maintenance and repair
Exhaust after-treatment
Downtime and reliability valuation
Maintenance employee training, expertise, availability
Maintenance facility upgrade
Tank inspection (gaseous fuels)
Battery health
Vehicle washing and interior cleaning
Vehicle / equipment purchase, replacement, removal
Exhaust after-treatment
Full-service lease ?
Refrigerator unit
Idle reduction device (e.g. APU)
PTO / hydraulics
Business operations, administration
Commercial vehicle taxes, registrations, licensing, etc.
Idle time and fuel
ELDs and data plans
Fueling infrastructure
Administrative (fleet)
Drivers, productivity – specifically as it relates to alternative powertrains
Driver compensation
Driver training and turnover
Driver licensing?
Payload opportunity cost
Yard management (charging)
Out of route mileage, time to charge, foregone miles
Varies With

102
estimate each of these costs, we formulated calculation methodologies by reviewing literature
and collecting and analyzing real world data, as described in the following sections.
FIGURE 3.35 Average freight truck costs by calendar year, inflation adjusted (data adapted from
Hooper and Murray 2017; Murray and Glidewell 2019)
3.7.3.1. Labor Costs
Driver wages and benefits for freight and passenger movement are key elements in a
comprehensive TCO as, together, they constitute one of the largest cost components for many
vocations. Estimates of driver wages and benefits are also required to quantify the cost of
refueling time, which can be quite long for MHDV BEVs with large batteries, since current HOS
rules dictate that fueling counts as working, so refueling/recharging counts against the total daily
limit of vehicle operation (FMSCA 2015). Furthermore, labor/benefit rates would be required to
assess possible cost savings for fully automated vehicles. As such, it is important to have an
accurate data-based estimate.
ATRI (Murray and Glidewell 2019) reports total driver compensation as hourly and per
mile values for tractor drivers in truckload (TL), less-than-truckload (LTL), and specialized
hauling sectors. According to the ATRI data, salary accounts for about 77% of total driver
compensation. The ATRI salary fraction was applied to additional hourly driver salaries obtained
from online job listings for local, regional, and long haul truck drivers to scale up to the full
compensation rate, which also includes benefits. Per-mile labor rates for these additional
segments were developed using average duty cycle speeds from the Phase 2 fuel efficiency
standards (EPA and NHTSA 2016). For service vehicles, such as utility bucket trucks, plumbers,

103
etc., operating the vehicle is secondary to performing the service job and wages depend on the
specific vocation. For this study, we assume that these vehicles must be able to complete these
services during a normal work shift and charge overnight. Figure 3.36 shows a comparison of
driver compensation for different tractor-trailer operation, measured both per-hour and per-mile.
FIGURE 3.36 Hourly and per-mile compensation for drivers of different vehicle types. LTL: less-
than-truckload service; TL: truckload service; specialized: includes tankers and flatbed carriers.
Sources: ATRI (Murray and Glidewell 2019), Glassdoor (2020), Zip Recruiter (2020), Indeed.com
(2020), Payscale.com (2020), and Neuvoo.com (2020).
We assume that tractor drivers, including sleepers and day cabs, are paid using a per-mile
rate and drivers for all other vocations (Pick-up and Delivery, Vocational, Refuse, Bus) are paid
by the hour. For the vocations paid by the mile, we assume a rate of $0.79/mile and for vocations
paid by the hour, we assume a rate of $30/hour. To determine the total annual labor costs, we
assume 2000 hours/year for the hourly rate vocations and use the applicable VMT schedule for
the per-mile vocations.
3.7.3.2. Idling
In addition to fuel consumption from driving a commercial vehicle, considerable amounts
of fuel can be consumed during idling, such as when a vehicle is temporarily parked during a
delivery, in stop-and-go traffic, or during overnight hoteling for sleeper cabs. Figure 3.37 shows
the roles of idling and PTO for utility truck activities from a study by NREL (Konan et al. 2017),
showing idling can take 30% of total operation time and 10% of total energy use. The
Autonomie fuel economy simulation results utilize duty cycles with a mix of highway and
transient driving based on weighting factors found in the Phase 2 fuel efficiency standards (EPA
and NHTSA 2016). The transient driving cycle includes a certain amount of on-road idling
(though may underestimate idling for delivery trucks), but does not including idling during
hoteling. Therefore, we focus on hoteling for sleeper cabs since it has the potential for the
greatest amount of idling time and is not accounted for in the Autonomie duty cycle.
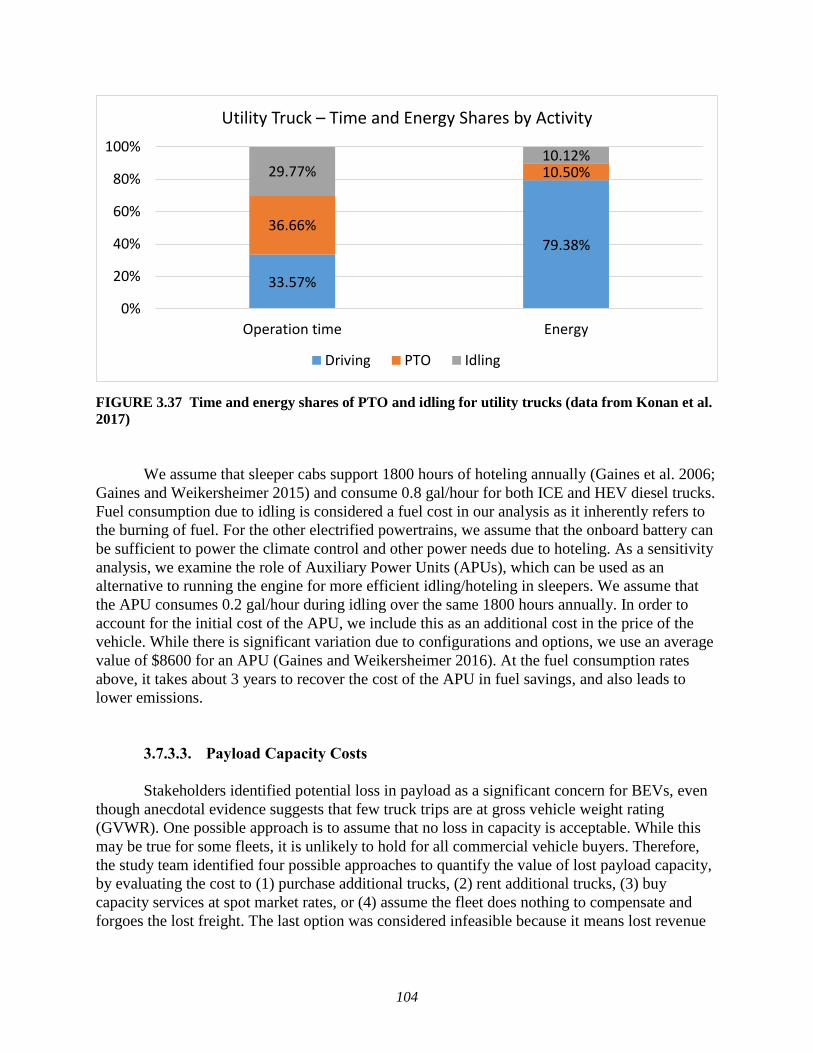
104
FIGURE 3.37 Time and energy shares of PTO and idling for utility trucks (data from Konan et al.
2017)
We assume that sleeper cabs support 1800 hours of hoteling annually (Gaines et al. 2006;
Gaines and Weikersheimer 2015) and consume 0.8 gal/hour for both ICE and HEV diesel trucks.
Fuel consumption due to idling is considered a fuel cost in our analysis as it inherently refers to
the burning of fuel. For the other electrified powertrains, we assume that the onboard battery can
be sufficient to power the climate control and other power needs due to hoteling. As a sensitivity
analysis, we examine the role of Auxiliary Power Units (APUs), which can be used as an
alternative to running the engine for more efficient idling/hoteling in sleepers. We assume that
the APU consumes 0.2 gal/hour during idling over the same 1800 hours annually. In order to
account for the initial cost of the APU, we include this as an additional cost in the price of the
vehicle. While there is significant variation due to configurations and options, we use an average
value of $8600 for an APU (Gaines and Weikersheimer 2016). At the fuel consumption rates
above, it takes about 3 years to recover the cost of the APU in fuel savings, and also leads to
lower emissions.
3.7.3.3. Payload Capacity Costs
Stakeholders identified potential loss in payload as a significant concern for BEVs, even
though anecdotal evidence suggests that few truck trips are at gross vehicle weight rating
(GVWR). One possible approach is to assume that no loss in capacity is acceptable. While this
may be true for some fleets, it is unlikely to hold for all commercial vehicle buyers. Therefore,
the study team identified four possible approaches to quantify the value of lost payload capacity,
by evaluating the cost to (1) purchase additional trucks, (2) rent additional trucks, (3) buy
capacity services at spot market rates, or (4) assume the fleet does nothing to compensate and
forgoes the lost freight. The last option was considered infeasible because it means lost revenue
33.57%
79.38%36.66%
10.50%29.77%10.12%
0%
20%
40%
60%
80%
100%
Operation time Energy
Utility Truck – Time and Energy Shares by Activity
Driving PTO Idling

105
in the short run and potential customer or market loss long term, which would equate to
extremely high cost.
The first approach adds an operational cost equivalent to the value of buying a portion of
a similar truck to fulfill the unmet needs of the fleet. This methodology first computes the
levelized cost of purchasing the new option, then adds the fractional amount of additional trucks
required. For example, if the BEV has 10% less payload, the capacity cost is 0.10 times the
lifetime total cost without considering payload impacts. The second approach quantifies the cost
for a fleet to rent a fraction of a similar truck to meet their needs. This is mathematically similar
to the first option, but there are differences in capital depreciation, overhead charges, and taxes.
The third approach quantifies the cost to buy cargo capacity services on the TL and LTL spot
markets. LTL rates for marginal cargo capacity are significantly higher than the levelized cost of
ownership of a fully-loaded truck, resulting in capacity costs as much as ten times higher. The
study team decided that the first approach was the most tractable and reflects likely fleet
behavior.
The next step is to determine whether to value the entire payload capacity loss as if the
vehicle were always weight limited. Since this is reportedly seldom the case, the team adopted a
probabilistic approach based on VIUS 2002 vehicle operating weight distributions (U.S. Census
2004). As shown in Figure 3.38(a), for tractors, the distribution in operating weight, expressed as
a percentage of total tractor miles, can be used to establish how often trucks are likely to lose
revenue as a result of reduced capacity. We first assume that tractors operating over the
maximum GVWR of 80,000 lb already have a weight exemption and do not lose payload. Then
the distribution to the left of 80,000 lb represents the probability of incurring a payload capacity
cost. The shaded portion of Figure 3.38(b) illustrates the part of this distribution for which the
capacity cost would apply for a 10,000 lb increase in the vehicle empty weight due to new
powertrain technology.
(a) (b)
FIGURE 3.38 Operating weight distribution for class 7 and class 8 tractors
106
The expected payload loss is then:
𝐸(𝑃𝑎𝑦𝐿𝐷𝐿𝑜𝑠𝑠) = ∫ 𝑃(𝑤) ∗𝐺
𝐺−∆𝑣𝑒ℎ_𝑤𝑡
[𝑤 − (𝐺 − ∆𝑣𝑒ℎ𝑤𝑡)] 𝑑𝑤 Eq 3.14
where
G = maximum gross vehicle weight rating
Δveh_wt = increase in empty vehicle weight due to technology
w = operating weight
P = probability density function based on operating weight distribution
To calculate the per-mile payload capacity cost, the expected payload loss is divided by
the new vehicle payload capacity then multiplied by the per-ton-mile estimated TCO without
considering payload capacity. However, nearly all states have enacted a 2,000 lb weight
allowance for BEVs, which we subtract from the vehicle weight increase for BEVs. In this
analysis, we find that a MY2025 BEV sleeper cab loses a total of 5100 lbs of cargo capacity
relative to the ICEV (after accounting for the one-ton weight allowance), for an expected loss of
2300 lbs. This increases costs by 4.9%. However, in the Autonomie low-technology case, the
MY2025 BEV sleeper cab loses a total of 8700 lbs relative to the ICEV, because the batteries
have lower energy density (kWh/kg). In this case, the expected payload loss is 4400 lbs, resulting
in a 10.3% increase in costs. In this analysis, we attribute all of these costs to the ‘payload’ cost
item.
3.7.3.4. Refueling Labor Costs
Refueling advanced powertrains may incur two additional costs: (1) time and out-of-route
mileage due to searching for refueling, and (2) dwell time costs. The first cost depends on the
location and pervasiveness of refueling infrastructure and may be a transitional issue. The second
cost depends on charge power or refill speed and storage capacity. Even trucks using public
overnight charging could incur these costs if the facility is not located along their normal or
optimum route. However, as illustrated in Figure 3.39, for fleets that install their own refueling
infrastructure and only refuel between shifts, there are no additional refueling costs, assuming
this does not represent a change in operations. Consistent with stakeholder feedback, the TCO
tool allows analysis with and without considering dwell time and re-routing costs. However,
scenarios should be defined with consistent assumptions about daily / annual mileage and
charging opportunities.

107
FIGURE 3.39 Schematic diagram representing
refueling costs
The time to refuel may be valued using the cost of driver and administrative labor. Since
conventional diesel trucks do require time to refuel, this cost, Crefuel_dwell, is evaluated as the
increase in time times the labor rate. For BEVs, this can be calculated as:
𝐶𝑟𝑒𝑓𝑢𝑒𝑙_𝑑𝑤𝑒𝑙𝑙 = (𝐵𝑎𝑡𝐶𝑎𝑝
𝐶ℎ𝑎𝑟𝑔𝑒𝑃𝑜𝑤𝑒𝑟−
𝑇𝑎𝑛𝑘𝑉𝑜𝑙
𝐹𝑖𝑙𝑙𝑅𝑎𝑡𝑒) ∗ 𝐿𝑎𝑏𝑜𝑟𝑅𝑎𝑡𝑒 Eq 3.15
where:
BatCap = battery capacity (kWh)
ChargePower = EVSE charge power (kW)
TankVol = diesel tank volume (gal)
FillRate = diesel nozzle fill rate (30–60 gallons/min)
LaborRate = loaded driver labor costs + administrative labor cost ($/hr)
Because the diesel fueling rate is so much faster than electric vehicle charging, we can
generally focus on the electric charging aspect. At 45 gallons/minute, a typical ICEV costs
approximately 0.1 cent/mile to fuel. Hypothetical charging rates for MHDV BEV are unknown,
and estimates range from approximately 50 kW (equivalent to a fast charger for LDV today) to
over 1 MW. Using Autonomie results, we find that even with megawatt-level charging, refueling
would take over an hour for 500-mile range tractors. If we use the hourly labor rate described in
Section 3.7.3.1 of $30/hour, this increases costs by 8 cents per mile, while 400 kW charging
would increase costs by 20 cents per mile. In this analysis, refueling labor fits into the labor item
of the TCO calculation. This is analyzed in greater detail in Section 4.2.6.
Re-routing can be valued using the per-mile TCO estimated prior to adding the cost to re-
route. Much like the payload capacity cost, this increases the total use of the vehicle, acting as a
multiplier to all costs. Because VMT increases with re-routing, the total VMT increases. When
quantifying a levelized cost of driving, it is important to treat the metric as dollars-per-
operational-mile, as the additional mileage is not earning revenue. Due to lack of information
about how refueling for AFVs will change vehicle operation, we set the additional mileage
parameter to zero in the baseline analysis.

108
4. RESULTS
Having developed a methodology for quantification of vehicle ownership costs and with
a robust series of assumptions for each of the individual cost elements, we turn our attention to
exploring economic results. In Section 4.1, we present results from our primary case, MY2025
vehicles across different LDV and MHDV size classes and powertrains. In Section 4.2, we
present results from side cases of particular interest, while Section 4.3 presents a more detailed
sensitivity analysis comparing the influence of uncertainties in different TCO cost parameters.
Results are presented in tabular form in Appendix B for each of the graphics in Sections 4.1 and
4.2.
4.1. BASE CASE
As discussed in Section 2.3, total cost of ownership will be presented in terms of a
discounted cash flow analysis and as a levelized cost of driving (LCOD) per mile. TCO is
particularly important for comparing differences across alternative technologies in order to
understand when a new technology can become cost-effective. Figure 4.1 shows a TCO
comparison of six different powertrain technologies for a small SUV. This vehicle was modeled
in Autonomie and is meant to be representative of a vehicle that could be available in 2025. A
15-year analysis window was assumed, along with a 1.2% discount rate and a 4.0 interest rate on
a 63-month loan. The upper graphic is the total (discounted) cost of ownership, integrated over
the entire 15-year analysis window. The lower graphic is the levelized cost of driving in $/mile,
averaged across the full analysis timeframe.

109
FIGURE 4.1 TCO and LCOD for small SUVs, MY2025
Comparing across powertrains, the HEV is the vehicle powertrain with the lowest cost of
ownership over a 15-year span, at 44.6¢/mile. The ICE-SI, ICE-CI, FCEV, and PHEV50 all have
costs around 48¢/mile. The BEV300 has the highest cost, at 51.8¢/mile, though the shorter-range
BEV200 (not pictured) has a cost of 45.3¢/mile. The comparatively high costs for BEV300 come
from assumed battery costs of $170/kWh in 2025 in the Autonomie model (Islam et al. 2020),
though BEV would reach cost parity with HEV at a cost of $102/kWh. For all powertrains, the
vehicle cost is the single most expensive cost over the 15-year analysis window. Maintenance
and repair taken together is the second most expensive for all powertrain types except FCEV. For
petroleum-fueled vehicles, this is followed by fuel, then insurance. For electric-fueled vehicles
(both BEV and PHEV) and hybrids, reduced fuel costs lead to higher insurance costs than fuel
costs. Hydrogen fuel cells have a different cost breakdown, where the cost of fuel is higher than
$0
$20,000
$40,000
$60,000
$80,000
$100,000
$120,000
ICE-SI ICE-CI HEV PHEV50 FCEV BEV300
Total 15-year Cost of Driving - 2025, Small SUV
Vehicle Financing Fuel Insurance
Maintenance Repair Tax & fees
$0.00
$0.10
$0.20
$0.30
$0.40
$0.50
$0.60
ICE-SI ICE-CI HEV PHEV50 FCEV BEV300
Average 15-year per-Mile Cost of Driving - 2025, Small SUV
Vehicle Financing Fuel Insurance
Maintenance Repair Tax & fees

110
maintenance and repair and insurance. This is due to the high price of hydrogen as described in
Section 0.
Figure 4.2 demonstrates that the TCO depends on the size of the vehicle as well, as larger
vehicles tend to be more expensive and less fuel efficient. We show the levelized TCO for the
five LDV size classes for a MY2025 ICE-SI vehicle in Figure 4.2; the trend that larger vehicles
are modeled as more expensive is true for all powertrain types. For a more direct comparison, all
vehicles were assumed to drive exactly 12,000 miles per year, rather than using the different
mileage schedules for the cars and light trucks.
FIGURE 4.2 Comparison of LCOD for different LDV size classes of MY2025 conventional gasoline
vehicles, 12,000 miles per year
Beyond light-duty vehicles, heavy-duty vehicles can be quantified in this framework. As
with the LDV, we use Autonomie to model vehicles available today and in the near future based
on technological advancements. In this analysis, we consider 7 different types of vehicles:
Sleeper cab Class 8 tractor, Day cab Class 8 tractor, Class 8 Vocational, Class 6 -
Pickup/Delivery, Class 4 - Pickup/Delivery, Class 8 Transit Bus, Class 8 Refuse. These vehicles
are compared in Figure 4.3. As in Figure 4.1, both an aggregate cost of ownership and a
levelized cost of driving are presented. Note that these vehicles have drastically different mileage
schedules, and therefore the LCOD is a more direct way of comparing across these vehicles
rather than the total 10-year discounted cost of ownership. For these commercial vehicles, we use
a discount rate of 3.0%, highlighting both the enhanced value of investment capital in a
commercial setting relative to households, and the desire for rapid payback by fleet operators.
$0.00
$0.10
$0.20
$0.30
$0.40
$0.50
$0.60
Compact sedan Midsize sedan Small SUV Medium SUV Pickup
Average 15-year per-Mile Cost of Driving - 2025, ICE-SI
Vehicle Financing Fuel Insurance
Maintenance Repair Tax & fees

111
FIGURE 4.3 TCO and LCOD for medium-duty and heavy-duty trucks
Figure 4.3 shows that these vehicles do not have a definite rank order in terms of the most
expensive cost component. For all of these, driver wages and benefits are a major expense for
fleet operators, making up nearly half the cost for freight trucking, and an even greater fraction
for MDV delivery vehicles. While a sleeper cab is the most expensive vehicle considered here, it
has the lowest cost-per-mile due to the long driving distance (870,000 miles over the 10-year
analysis window). For buses, the largest (non-labor) cost is for liability insurance, while refuse
trucks have exceptionally high maintenance and repair costs, as described in Section 3.5.5. Over
the lifetime of the tractor trailers, fuel costs are much higher than the initial vehicle purchase.
Improving fuel economy is one pathway for economic freight operation. Figures 4.4 and 4.5
show cost of ownership for class 8 sleeper cabs and day cabs with different powertrains,
excluding labor costs which are the same across powertrains.
$0
$300,000
$600,000
$900,000
$1,200,000
$1,500,000
$1,800,000
Tractor -Sleeper
Tractor -Day cab
Class 8Vocational
Class 6Delivery
Class 4Delivery
TransitBus
Class 8Refuse
Total 10-year Cost of Driving - 2025, Diesel Trucks
Vehicle Financing Fuel Insurance
M&R Tax & fees Payload Labor
$0.00$1.00$2.00$3.00$4.00$5.00$6.00$7.00
Tractor -Sleeper
Tractor -Day cab
Class 8Vocational
Class 6Delivery
Class 4Delivery
TransitBus
Class 8Refuse
Average 10-year per-Mile Cost of Driving - 2025, Diesel Trucks
Vehicle Financing Fuel Insurance
M&R Tax & fees Payload Labor
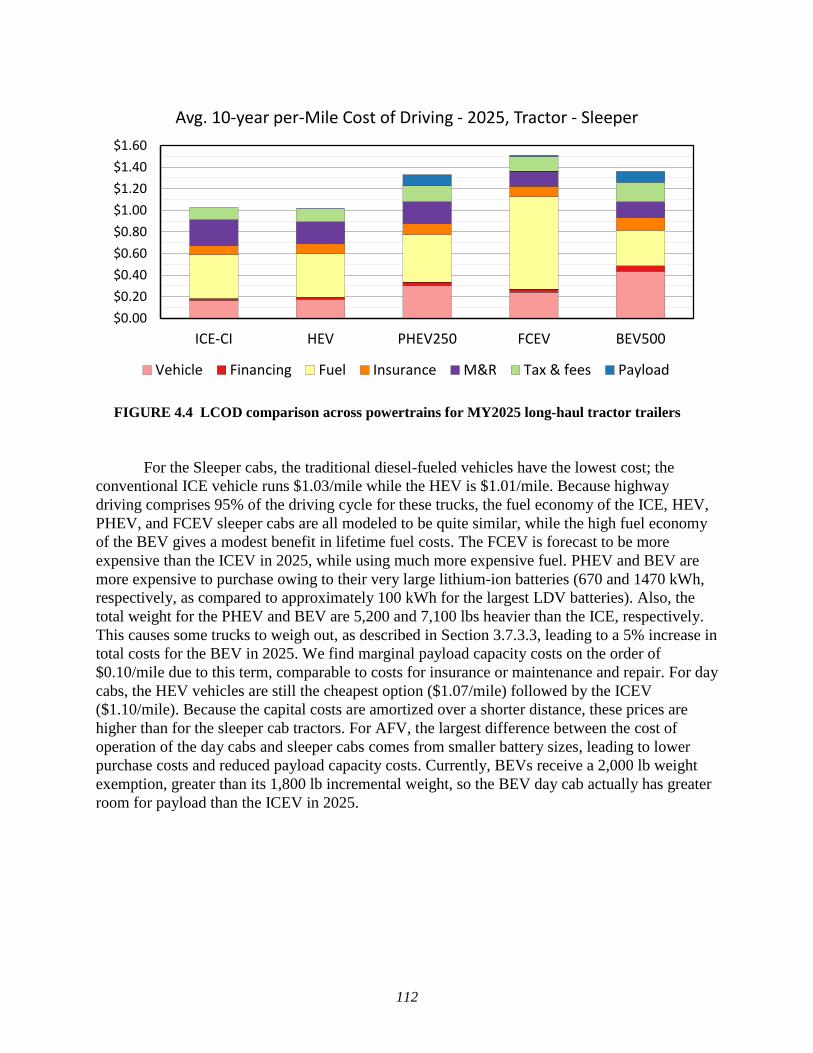
112
FIGURE 4.4 LCOD comparison across powertrains for MY2025 long-haul tractor trailers
For the Sleeper cabs, the traditional diesel-fueled vehicles have the lowest cost; the
conventional ICE vehicle runs $1.03/mile while the HEV is $1.01/mile. Because highway
driving comprises 95% of the driving cycle for these trucks, the fuel economy of the ICE, HEV,
PHEV, and FCEV sleeper cabs are all modeled to be quite similar, while the high fuel economy
of the BEV gives a modest benefit in lifetime fuel costs. The FCEV is forecast to be more
expensive than the ICEV in 2025, while using much more expensive fuel. PHEV and BEV are
more expensive to purchase owing to their very large lithium-ion batteries (670 and 1470 kWh,
respectively, as compared to approximately 100 kWh for the largest LDV batteries). Also, the
total weight for the PHEV and BEV are 5,200 and 7,100 lbs heavier than the ICE, respectively.
This causes some trucks to weigh out, as described in Section 3.7.3.3, leading to a 5% increase in
total costs for the BEV in 2025. We find marginal payload capacity costs on the order of
$0.10/mile due to this term, comparable to costs for insurance or maintenance and repair. For day
cabs, the HEV vehicles are still the cheapest option ($1.07/mile) followed by the ICEV
($1.10/mile). Because the capital costs are amortized over a shorter distance, these prices are
higher than for the sleeper cab tractors. For AFV, the largest difference between the cost of
operation of the day cabs and sleeper cabs comes from smaller battery sizes, leading to lower
purchase costs and reduced payload capacity costs. Currently, BEVs receive a 2,000 lb weight
exemption, greater than its 1,800 lb incremental weight, so the BEV day cab actually has greater
room for payload than the ICEV in 2025.
$0.00
$0.20
$0.40
$0.60
$0.80
$1.00
$1.20
$1.40
$1.60
ICE-CI HEV PHEV250 FCEV BEV500
Avg. 10-year per-Mile Cost of Driving - 2025, Tractor - Sleeper
Vehicle Financing Fuel Insurance M&R Tax & fees Payload

113
FIGURE 4.5 LCOD comparison across powertrains for MY2025 day cab tractor trailers
Figure 4.6 shows the comparison across powertrains for the class 4 delivery truck in
2025. In this case, the BEV is the lowest-cost option, with a total cost of $1.01/mile, followed by
the HEV at $1.08. The largest difference in price comes from reduced fuel costs of using
electricity in a more efficient vehicle. The BEV class 4 delivery vehicle was modeled to have a
150-mile range, lower than the class 8 tractors, at a battery cost of $150/kWh in Autonomie,
before vehicle-specific markup (Vijayagopal et al. 2019). The class 6 delivery vehicle (data in
the Appendix) exhibits similar cost behavior.
FIGURE 4.6 LCOD comparison across powertrains for MY2025 class 4 delivery trucks
$0.00
$0.20
$0.40
$0.60
$0.80
$1.00
$1.20
$1.40
$1.60
$1.80
ICE-CI HEV PHEV125 FCEV BEV250
Avg. 10-year per-Mile Cost of Driving - 2025, Tractor - Day cab
Vehicle Financing Fuel Insurance M&R Tax & fees Payload
$0.00
$0.20
$0.40
$0.60
$0.80
$1.00
$1.20
$1.40
ICE-CI HEV PHEV75 FCEV BEV150
Avg. 10-year per-Mile Cost of Driving - 2025, Class 4 Delivery
Vehicle Financing Fuel Insurance M&R Tax & fees Payload

114
4.2. SIDE CASES
4.2.1. Vehicle Technology Advancement
Looking toward the future, alternative powertrains make strides toward cost parity.
Figure 4.7 shows the modeled reduction in TCO for the small SUV and the class 4 delivery truck
for different powertrains from 2020 through 2050 as vehicle technology improves, using the
high-tech progress cost modeling from Autonomie (Islam et al. 2020; Vijayagopal et al. 2019).
While the HEV begins as the lowest cost powertrain for small SUV, FCEV are forecast to reach
cost parity by 2030 when hydrogen prices reach $5/kg while BEV reaches cost parity with the
HEV by 2035 at a battery cost of $98 per usable kWh of capacity, with these two technologies
being the lowest cost in 2050. For the class 4 delivery truck, the BEV150 becomes the lowest
cost vehicle by 2025, at a nominal $170/kWh of usable battery capacity. The FCEV tracks the
BEV closely, being approximately 7 cents/mile more expensive through 2050. The conventional
ICEV is the most costly powertrain by 2030. The largest cause for the cost reductions for both
the BEV and the FCEV is the reduction in vehicle cost, which causes additional reductions in
insurance and M&R expenses as well.
FIGURE 4.7 LCOD for small SUV and class 8 sleeper cab from MY2020 to MY2050, modeled
using the Autonomie high technology progress case
ICE-SI
ICE-CI
HEVFCEV
PHEV50
BEV300
$0.35
$0.40
$0.45
$0.50
$0.55
$0.60
$0.65
'15 '20 '25 '30 '35 '40 '45 '50 '55
LCO
D (
$/m
i)
Model Year
LCOD small SUV (high)
ICE-CI
HEV
FCEV
PHEV75
BEV150
$4.40
$4.50
$4.60
$4.70
$4.80
$4.90
$5.00
$5.10
$5.20
$5.30
$5.40
'15 '20 '25 '30 '35 '40 '45 '50 '55
LCO
D (
$/m
i)
Model Year
LCOD class 4 delivery (high)
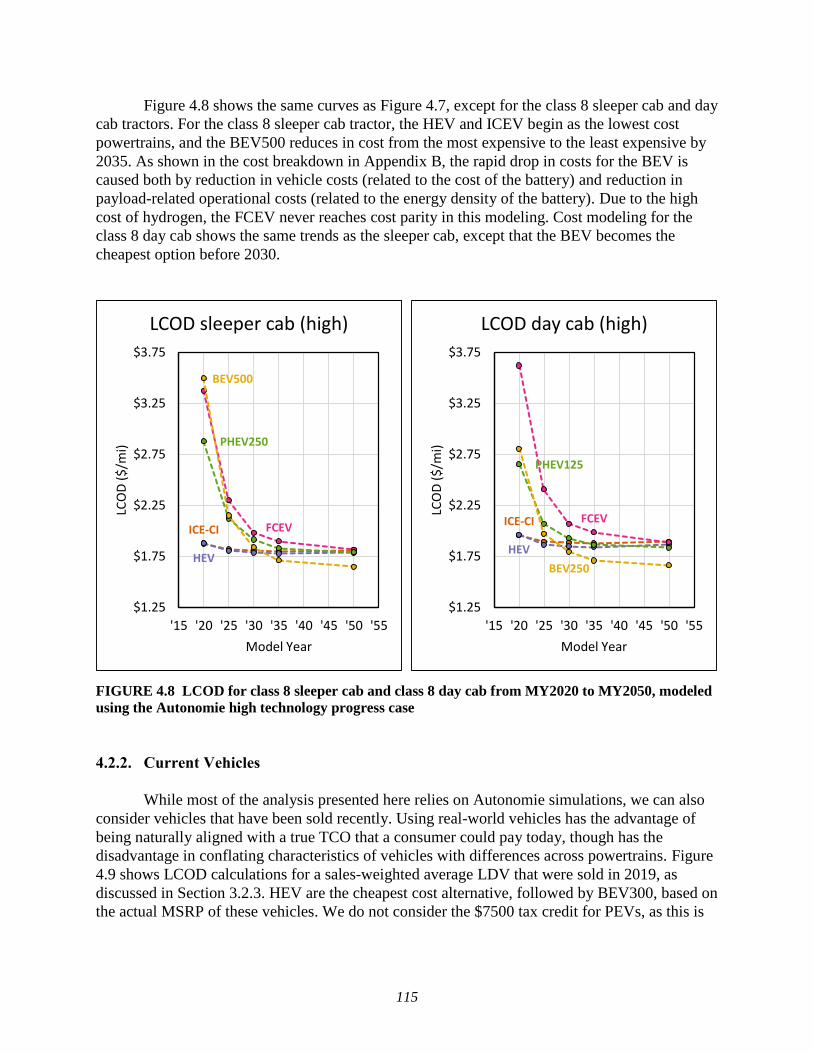
115
Figure 4.8 shows the same curves as Figure 4.7, except for the class 8 sleeper cab and day
cab tractors. For the class 8 sleeper cab tractor, the HEV and ICEV begin as the lowest cost
powertrains, and the BEV500 reduces in cost from the most expensive to the least expensive by
2035. As shown in the cost breakdown in Appendix B, the rapid drop in costs for the BEV is
caused both by reduction in vehicle costs (related to the cost of the battery) and reduction in
payload-related operational costs (related to the energy density of the battery). Due to the high
cost of hydrogen, the FCEV never reaches cost parity in this modeling. Cost modeling for the
class 8 day cab shows the same trends as the sleeper cab, except that the BEV becomes the
cheapest option before 2030.
FIGURE 4.8 LCOD for class 8 sleeper cab and class 8 day cab from MY2020 to MY2050, modeled
using the Autonomie high technology progress case
4.2.2. Current Vehicles
While most of the analysis presented here relies on Autonomie simulations, we can also
consider vehicles that have been sold recently. Using real-world vehicles has the advantage of
being naturally aligned with a true TCO that a consumer could pay today, though has the
disadvantage in conflating characteristics of vehicles with differences across powertrains. Figure
4.9 shows LCOD calculations for a sales-weighted average LDV that were sold in 2019, as
discussed in Section 3.2.3. HEV are the cheapest cost alternative, followed by BEV300, based on
the actual MSRP of these vehicles. We do not consider the $7500 tax credit for PEVs, as this is
ICE-CI
HEV
FCEV
PHEV250
BEV500
$1.25
$1.75
$2.25
$2.75
$3.25
$3.75
'15 '20 '25 '30 '35 '40 '45 '50 '55
LCO
D (
$/m
i)
Model Year
LCOD sleeper cab (high)
ICE-CI
HEV
FCEV
PHEV125
BEV250
$1.25
$1.75
$2.25
$2.75
$3.25
$3.75
'15 '20 '25 '30 '35 '40 '45 '50 '55
LCO
D (
$/m
i)
Model Year
LCOD day cab (high)

116
not uniform across all electric vehicles, though a $7500 incentive would be sufficient for the
BEV300 to have lower LCOD than the HEV.
FIGURE 4.9 Average cost of driving across powertrain, small SUV sold in 2019
4.2.3. Vehicle Ownership Period
Most of the analysis presented in Section 4.1 uses a 15-year analysis window for LDV
and a 10-year analysis window for MHDV. While this corresponds to typical use over the
lifetime of the vehicle, we can also consider a first-owner analysis. For a passenger vehicle, this
is approximately 5 years, while 3 years is a common period of ownership for a heavy duty truck.
Figure 4.10 shows comparison of TCO across powertrains for a small SUV and for a day cab
tractor trailer with a reduced analysis window. These can be directly compared with Figures 4.1
and 4.4. While the AFVs are more expensive upfront, they also maintain a larger residual value,
and so there is little substantive difference in the rank ordering of technologies. HEV maintain
their position as the cheapest LDV choice, while ICEV are marginally cheaper than HEV for the
sleeper cabs, implying a technology payback period of 3 years.
$0.00
$0.10
$0.20
$0.30
$0.40
$0.50
$0.60
$0.70
$0.80
ICE-SI HEV PHEV20 FCEV BEV300
Avg. 15-year per-Mile Cost of Driving - 2019 sales, Small SUV
Vehicle Financing Fuel Insurance
Maintenance Repair Tax & fees
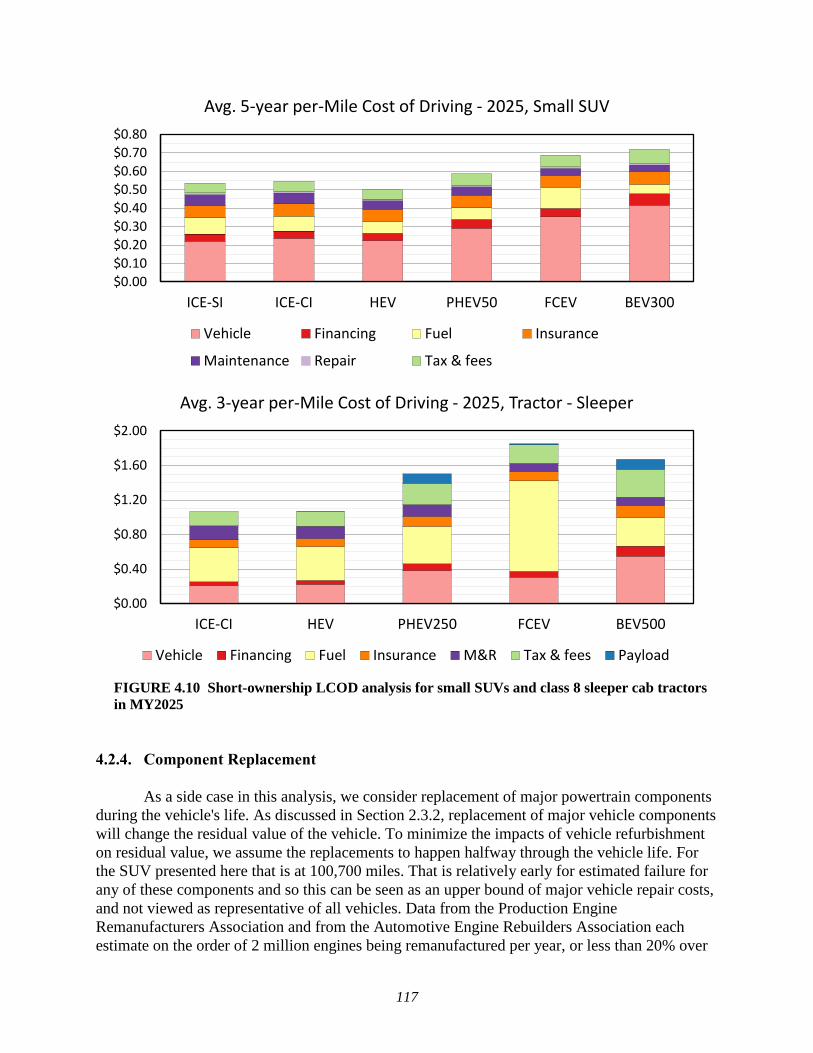
117
FIGURE 4.10 Short-ownership LCOD analysis for small SUVs and class 8 sleeper cab tractors
in MY2025
4.2.4. Component Replacement
As a side case in this analysis, we consider replacement of major powertrain components
during the vehicle's life. As discussed in Section 2.3.2, replacement of major vehicle components
will change the residual value of the vehicle. To minimize the impacts of vehicle refurbishment
on residual value, we assume the replacements to happen halfway through the vehicle life. For
the SUV presented here that is at 100,700 miles. That is relatively early for estimated failure for
any of these components and so this can be seen as an upper bound of major vehicle repair costs,
and not viewed as representative of all vehicles. Data from the Production Engine
Remanufacturers Association and from the Automotive Engine Rebuilders Association each
estimate on the order of 2 million engines being remanufactured per year, or less than 20% over
$0.00
$0.10
$0.20
$0.30
$0.40
$0.50
$0.60
$0.70
$0.80
ICE-SI ICE-CI HEV PHEV50 FCEV BEV300
Avg. 5-year per-Mile Cost of Driving - 2025, Small SUV
Vehicle Financing Fuel Insurance
Maintenance Repair Tax & fees
$0.00
$0.40
$0.80
$1.20
$1.60
$2.00
ICE-CI HEV PHEV250 FCEV BEV500
Avg. 3-year per-Mile Cost of Driving - 2025, Tractor - Sleeper
Vehicle Financing Fuel Insurance M&R Tax & fees Payload

118
the vehicle lifetime, and largely focused on high-power applications (PERA 2021; Kaufman
2015). The replacement of high-voltage batteries in the HEV, BEV, and PHEV are just outside
typical warranty periods, making this an unlikely out-of-pocket replacement for the vehicle
owner.
For internal combustion engine vehicles we consider replacement of the combustion
engine; for HEV we consider replacement of the high-voltage battery and the integrated starter
generator; for BEV and PHEV we consider replacement of the high-voltage battery; for FCEV
we consider replacement of the fuel cell stack. These costs come from Autonomie modeling,
with a 50% retail markup over the manufacturing costs, as described in Section 3.2. Given the
forecasted reduction in prices of the core components for AFVs, this may be an overestimate of
costs for the parts but we do neglect labor costs, so these two simplifying assumptions should
somewhat offset each other. Figure 4.11 shows the costs per mile amortized over the lifetime of
the vehicle for each of these six powertrains. Rather than comparing across powertrains it may be
more informative to compare with Figure 4.1; the sum values from the base case are included as
diamond overlays. We see that the lifetime per-mile cost of the gasoline ICEV increases by 1.6
cent/mile, 2.0 cent/mile for the diesel ICEV, 1.5 cent/mile for the HEV, 2.8 cent/mile for the
PHEV, 3.4 cent/mile for the FCEV, and 11.8 cent/mile for the BEV300.
FIGURE 4.11 Change in LCOD from major powertrain repair or replacement for small SUVs
in MY2025
4.2.5. Taxi Cabs
Taxi cabs and rideshare vehicles, such as Uber and Lyft, represent an interesting use case
for LDV, as they are typically driven with much higher intensity than personally owned vehicles.
In this side analysis, we consider small SUVs used as taxicabs. We add $150/year in ridehailing
insurance, though dedicated taxicabs may have different commercial insurance policies. We
$0.00
$0.10
$0.20
$0.30
$0.40
$0.50
$0.60
$0.70
ICE-SI ICE-CI HEV PHEV50 FCEV BEV300
Average 15-year per-Mile Cost of Driving - 2025, Small SUV
Vehicle Financing Fuel Insurance
Maintenance Repair Tax & fees No major repair
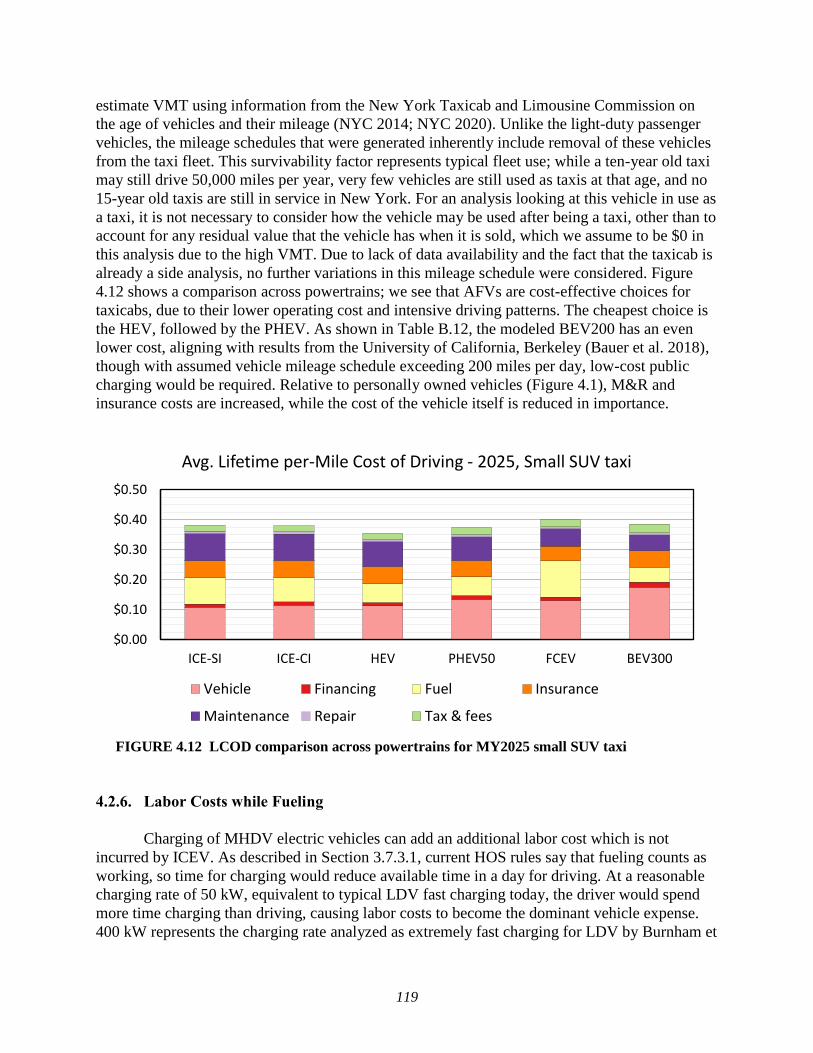
119
estimate VMT using information from the New York Taxicab and Limousine Commission on
the age of vehicles and their mileage (NYC 2014; NYC 2020). Unlike the light-duty passenger
vehicles, the mileage schedules that were generated inherently include removal of these vehicles
from the taxi fleet. This survivability factor represents typical fleet use; while a ten-year old taxi
may still drive 50,000 miles per year, very few vehicles are still used as taxis at that age, and no
15-year old taxis are still in service in New York. For an analysis looking at this vehicle in use as
a taxi, it is not necessary to consider how the vehicle may be used after being a taxi, other than to
account for any residual value that the vehicle has when it is sold, which we assume to be $0 in
this analysis due to the high VMT. Due to lack of data availability and the fact that the taxicab is
already a side analysis, no further variations in this mileage schedule were considered. Figure
4.12 shows a comparison across powertrains; we see that AFVs are cost-effective choices for
taxicabs, due to their lower operating cost and intensive driving patterns. The cheapest choice is
the HEV, followed by the PHEV. As shown in Table B.12, the modeled BEV200 has an even
lower cost, aligning with results from the University of California, Berkeley (Bauer et al. 2018),
though with assumed vehicle mileage schedule exceeding 200 miles per day, low-cost public
charging would be required. Relative to personally owned vehicles (Figure 4.1), M&R and
insurance costs are increased, while the cost of the vehicle itself is reduced in importance.
FIGURE 4.12 LCOD comparison across powertrains for MY2025 small SUV taxi
4.2.6. Labor Costs while Fueling
Charging of MHDV electric vehicles can add an additional labor cost which is not
incurred by ICEV. As described in Section 3.7.3.1, current HOS rules say that fueling counts as
working, so time for charging would reduce available time in a day for driving. At a reasonable
charging rate of 50 kW, equivalent to typical LDV fast charging today, the driver would spend
more time charging than driving, causing labor costs to become the dominant vehicle expense.
400 kW represents the charging rate analyzed as extremely fast charging for LDV by Burnham et
$0.00
$0.10
$0.20
$0.30
$0.40
$0.50
ICE-SI ICE-CI HEV PHEV50 FCEV BEV300
Avg. Lifetime per-Mile Cost of Driving - 2025, Small SUV taxi
Vehicle Financing Fuel Insurance
Maintenance Repair Tax & fees

120
al. (2017). Beyond this rate would require dedicated high-power charging for MHDV. Figure
4.13 shows the TCO for class 8 sleeper cab tractor trailers for ICEV and BEV at several different
charging profiles, accounting for this additional cost. For each of these electricity rates, the same
price of approximately $0.12/kWh is used, though it is possible that infrastructure for high-
power charging will increase the cost of delivered electricity. The extra costs are clearly much
higher than any other cost element at low power rates, but can be manageable at higher rates,
showing that on-road charging of long-haul BEV will not be feasible without either increased
charging power, some kind of depot-based charging independent of the presence of the vehicle
driver, or federal policy changes allowing unmanned, overnight vehicle charging.
FIGURE 4.13 TCO for class 8 sleeper cab comparison of ICEV and different BEV charging
rates in MY2025
4.3. SENSITIVITY ANALYSIS
The TCO results for the base case (Section 4.1) are based on the best available data for
the many inputs on which the various cost elements depend, but many of these inputs are
uncertain or vary widely between vehicles and drivers. We assessed the influence of uncertainty
in many of these inputs on the TCO for a number of LDVs and MHDVs. In order to do so, we
analyzed the ranges of TCO for conventional ICEV, HEV, and BEV by sequentially adjusting
over 20 parameters. We plotted these results in tornado charts, so termed because the varied
parameters are sorted by magnitude to identify the most impactful variables. One such chart is
presented in Figure 4.14, showing the LCOD for the MY2025 small SUV BEV. The baseline
case is 51.6 cents/mile, and each of the bars represents how the LCOD changes by changing a
single parameter of the calculation.
$0.00
$1.00
$2.00
$3.00
$4.00
ICE-CI BEV, 50 kW BEV, 200 kW BEV, 400 kW BEV, 1000 kW BEV, 2000 kW
Avg. 10-year per-Mile Cost of Driving - 2025, Tractor - Sleeper
Vehicle Financing Fuel Insurance
M&R Tax & fees Payload Labor
121
FIGURE 4.14 Tornado chart for LCOD of MY2025 small SUV BEV300
In this graphic, the gold bars represent changes that increase the total lifetime vehicle
cost, while silver bars represent changes that decrease the total vehicle cost over the analysis
window, with each starting from the baseline of 51.6 cents/mile. Note that the colors in Figure
4.14 are reversed for variations in driving distance, ownership time, and discount rate, showing
that amortizing costs over a greater distance reduces per-mile costs.
In order to properly compare the impacts of multiple different variables, we aim to have
comparable adjustments across all parameters. Where possible, we select values that are one
standard deviation, σ, from the baseline case, or approximately the 15th and 85th percentiles. For
other non-categorical variables, we selected values that represent a broad range of possible
scenarios while generally avoiding outliers and unlikely extremal cases. Table 4.1 summarizes
the basis of the choice of the low and high values used in assessing sensitivity for LDV.
$0.00 $0.20 $0.40 $0.60 $0.80 $1.00 $1.20
Gasoline blend
Depreciation
EVSE costs
Comp/coll ins.
Salvage
Luxury vehicle
Residual value
Liability ins.
Tech progress
Battery costs
Finance rate
PEV tax credit
Maintenance
Discount rate
Fuel prices
Vehicle size
Ownership time
Used vehicle
BEV range
Retail markup
Driving distance
LCOD Tornado chart - MY2025 BEV300 SUV, 15 yr ($/mi)
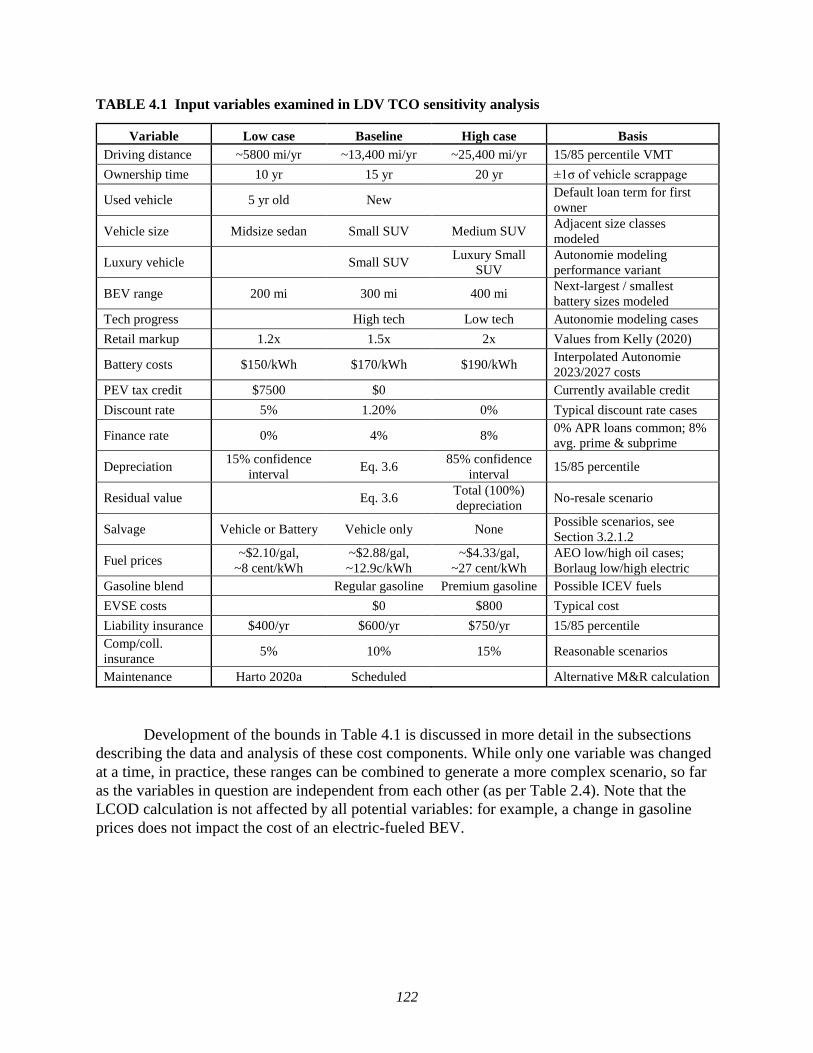
122
TABLE 4.1 Input variables examined in LDV TCO sensitivity analysis
Variable Low case Baseline High case Basis
Driving distance ~5800 mi/yr ~13,400 mi/yr ~25,400 mi/yr 15/85 percentile VMT
Ownership time 10 yr 15 yr 20 yr ±1σ of vehicle scrappage
Used vehicle 5 yr old New Default loan term for first
owner
Vehicle size Midsize sedan Small SUV Medium SUV Adjacent size classes
modeled
Luxury vehicle Small SUV Luxury Small
SUV
Autonomie modeling
performance variant
BEV range 200 mi 300 mi 400 mi Next-largest / smallest
battery sizes modeled
Tech progress High tech Low tech Autonomie modeling cases
Retail markup 1.2x 1.5x 2x Values from Kelly (2020)
Battery costs $150/kWh $170/kWh $190/kWh Interpolated Autonomie
2023/2027 costs
PEV tax credit $7500 $0 Currently available credit
Discount rate 5% 1.20% 0% Typical discount rate cases
Finance rate 0% 4% 8% 0% APR loans common; 8%
avg. prime & subprime
Depreciation 15% confidence
interval Eq. 3.6
85% confidence
interval 15/85 percentile
Residual value Eq. 3.6 Total (100%)
depreciation No-resale scenario
Salvage Vehicle or Battery Vehicle only None Possible scenarios, see
Section 3.2.1.2
Fuel prices ~$2.10/gal,
~8 cent/kWh
~$2.88/gal,
~12.9c/kWh
~$4.33/gal,
~27 cent/kWh
AEO low/high oil cases;
Borlaug low/high electric
Gasoline blend Regular gasoline Premium gasoline Possible ICEV fuels
EVSE costs $0 $800 Typical cost
Liability insurance $400/yr $600/yr $750/yr 15/85 percentile
Comp/coll.
insurance 5% 10% 15% Reasonable scenarios
Maintenance Harto 2020a Scheduled Alternative M&R calculation
Development of the bounds in Table 4.1 is discussed in more detail in the subsections
describing the data and analysis of these cost components. While only one variable was changed
at a time, in practice, these ranges can be combined to generate a more complex scenario, so far
as the variables in question are independent from each other (as per Table 2.4). Note that the
LCOD calculation is not affected by all potential variables: for example, a change in gasoline
prices does not impact the cost of an electric-fueled BEV.

123
FIGURE 4.15 Tornado chart for LCOD of MY2025 small SUV ICEV and HEV
Figure 4.15 shows tornado charts for the MY2025 ICEV and HEV small SUVs. Note that
the order of the specific input parameters is not the same across Figures 4.14 and 4.15. This
shows that particular parameters may be more/less relevant when considering alternative
powertrains. Like the BEV tornado chart, the largest cost uncertainty by far comes from
variations in typical driving distances (truncated on Figure 4.15 for space). The TCO of the 85th
percentile VMT MY2025 ICEV was approximately twice that of the 15th percentile VMT (VMT
varied by a factor of four over the 15-year ownership period), as was the LCOD, or per-mile
TCO. The sensitivity of TCO to VMT over 15 years was slightly lower for the BEV small SUV,
due to the lower fuel cost and higher purchase price. The cumulative TCO of the BEV increased
by about 50% when VMT increased by a little over a factor of four. For the same VMT increase,
the TCO per mile of the BEV decreased by a factor of three, due to the greater amortization of
the vehicle. For each vehicle, the next most impactful factor in cost uncertainty is the amount of
retail markup. The TCO per mile is sensitive to the assumed value of the RPE factor (ratio of
purchase price to manufacturing cost) as the vehicle purchase price is a large component of TCO.
Because of the higher MSRP of the BEV, it is more sensitive to cost parameters that are
directly related to vehicle depreciation early in the vehicle life, such as the length of vehicle
ownership and purchasing a vehicle used rather than new. To consider TCO of used vehicles, we
model a used vehicle here by setting the ownership period to 5–15 years (5-year-old vehicle is
purchased and owned for 10 years). The TCO of used vehicles is notably lower than that of new
vehicles, and the difference is higher for BEVs than for ICEVs or HEVs, owing to the higher
depreciation of BEVs in the first five years. The TCO per mile for the used BEV300 is lower
$0.35 $0.40 $0.45 $0.50 $0.55
EVSE costs
Salvage
PEV tax credit
BEV range
Battery costs
Depreciation
Comp/coll ins.
Gasoline blend
Residual value
Luxury vehicle
Ownership time
Tech progress
Liability ins.
Used vehicle
Vehicle size
Finance rate
Discount rate
Fuel prices
Maintenance
Retail markup
Driving distance
LCOD MY25 ICE SUV, 15 yr
$0.35 $0.40 $0.45 $0.50 $0.55
EVSE costs
Salvage
PEV tax credit
BEV range
Battery costs
Depreciation
Comp/coll ins.
Gasoline blend
Luxury vehicle
Residual value
Ownership time
Liability ins.
Tech progress
Used vehicle
Finance rate
Vehicle size
Discount rate
Fuel prices
Maintenance
Retail markup
Driving distance
LCOD MY25 HEV SUV, 15 yr

124
than that of the used ICEV and the used HEV. Likewise, since operational costs such as fuel,
insurance, and maintenance are a larger portion of the TCO for ICEV, variations in these
operating costs are more impactful for the ICEV. Additionally, financing, comprehensive
insurance, repair costs, and taxes are assumed to scale with purchase price, and this increases the
dependence of TCO on the RPE factor. LCOD for all three powertrains is reduced by
considering the maintenance costs published by Consumer Reports (Harto 2020a), though the
difference is similar across powertrains.
We found TCO to be largely insensitive to parameters which focus on late in the vehicle
lifetime. This can be seen by looking at the asymmetry in the ‘Ownership time’ bars, where the
reduction in costs from extending the vehicle lifetime are smaller than the additional per-mile
costs from shortening the lifetime. Likewise, variations in vehicle and battery salvage and
alternative considerations for C&C insurance are less impactful parameters.
In Appendix C, tornado charts are shown with different baseline scenarios, namely
having a baseline ownership period of only five years (similar to a first-owner analysis), and
considering a vehicle purchased at five years old (i.e., a second-owner analysis). These side cases
were selected for further examination because they both change the baseline vehicle ownership
parameters (from Table 2.4); as nearly all other cost parameters depend on these factors, these
are among the least ‘additive’ parameters. An additional side case presents analysis for vehicles
representative of those sold in 2019, adjusting the vehicle cost and fuel economy to match the
sales-weighted average.
Table 4.2 shows the key input parameters examined in the analysis of MHDV. This
section considers class 8 sleeper cab tractors, class 8 day cab tractors, and class 4 delivery trucks,
with additional cases considered in Appendix C as well. Note that several cost elements can be
considered or not considered in a typical fleet-oriented TCO calculation; these parameters (such
as idling costs, labor costs, and payload capacity) are explicitly removed from the calculation in
the side cases. Additionally, several of these costs are only relevant to the sleeper cab, and are
removed from the calculation for other vehicles. For M&R and insurance, the range of ±10%
represents the historical annual variation in average costs for this component since 2008 (Murray
and Glidewell 2019).
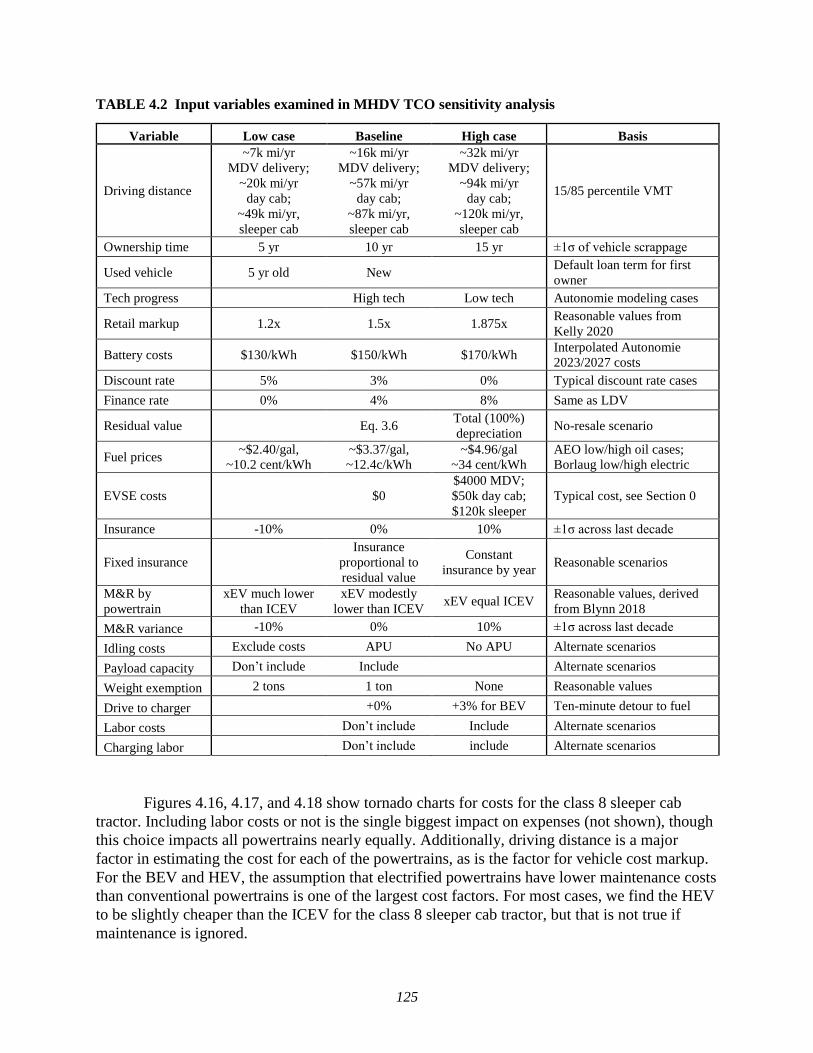
125
TABLE 4.2 Input variables examined in MHDV TCO sensitivity analysis
Variable Low case Baseline High case Basis
Driving distance
~7k mi/yr
MDV delivery;
~20k mi/yr
day cab;
~49k mi/yr,
sleeper cab
~16k mi/yr
MDV delivery;
~57k mi/yr
day cab;
~87k mi/yr,
sleeper cab
~32k mi/yr
MDV delivery;
~94k mi/yr
day cab;
~120k mi/yr,
sleeper cab
15/85 percentile VMT
Ownership time 5 yr 10 yr 15 yr ±1σ of vehicle scrappage
Used vehicle 5 yr old New Default loan term for first
owner
Tech progress High tech Low tech Autonomie modeling cases
Retail markup 1.2x 1.5x 1.875x Reasonable values from
Kelly 2020
Battery costs $130/kWh $150/kWh $170/kWh Interpolated Autonomie
2023/2027 costs
Discount rate 5% 3% 0% Typical discount rate cases
Finance rate 0% 4% 8% Same as LDV
Residual value Eq. 3.6 Total (100%)
depreciation No-resale scenario
Fuel prices ~$2.40/gal,
~10.2 cent/kWh
~$3.37/gal,
~12.4c/kWh
~$4.96/gal
~34 cent/kWh
AEO low/high oil cases;
Borlaug low/high electric
EVSE costs $0
$4000 MDV;
$50k day cab;
$120k sleeper
Typical cost, see Section 0
Insurance -10% 0% 10% ±1σ across last decade
Fixed insurance
Insurance
proportional to
residual value
Constant
insurance by year Reasonable scenarios
M&R by
powertrain
xEV much lower
than ICEV
xEV modestly
lower than ICEV xEV equal ICEV
Reasonable values, derived
from Blynn 2018
M&R variance -10% 0% 10% ±1σ across last decade
Idling costs Exclude costs APU No APU Alternate scenarios
Payload capacity Don’t include Include Alternate scenarios
Weight exemption 2 tons 1 ton None Reasonable values
Drive to charger +0% +3% for BEV Ten-minute detour to fuel
Labor costs Don’t include Include Alternate scenarios
Charging labor Don’t include include Alternate scenarios
Figures 4.16, 4.17, and 4.18 show tornado charts for costs for the class 8 sleeper cab
tractor. Including labor costs or not is the single biggest impact on expenses (not shown), though
this choice impacts all powertrains nearly equally. Additionally, driving distance is a major
factor in estimating the cost for each of the powertrains, as is the factor for vehicle cost markup.
For the BEV and HEV, the assumption that electrified powertrains have lower maintenance costs
than conventional powertrains is one of the largest cost factors. For most cases, we find the HEV
to be slightly cheaper than the ICEV for the class 8 sleeper cab tractor, but that is not true if
maintenance is ignored.
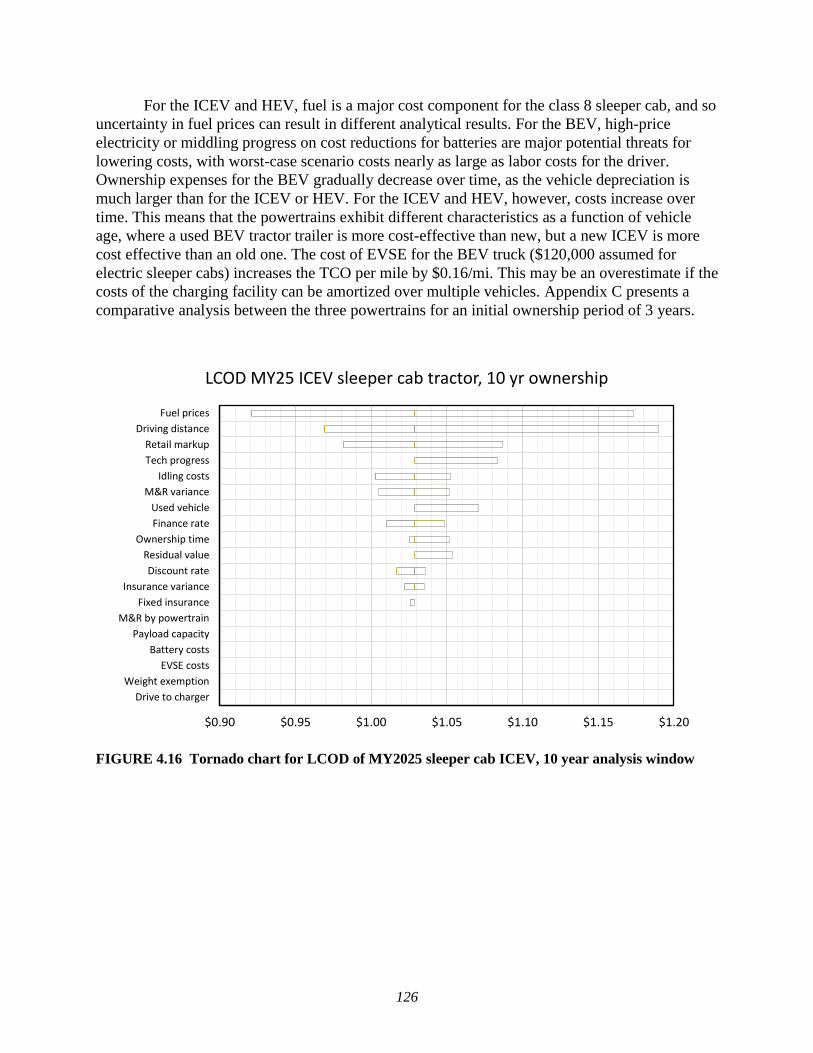
126
For the ICEV and HEV, fuel is a major cost component for the class 8 sleeper cab, and so
uncertainty in fuel prices can result in different analytical results. For the BEV, high-price
electricity or middling progress on cost reductions for batteries are major potential threats for
lowering costs, with worst-case scenario costs nearly as large as labor costs for the driver.
Ownership expenses for the BEV gradually decrease over time, as the vehicle depreciation is
much larger than for the ICEV or HEV. For the ICEV and HEV, however, costs increase over
time. This means that the powertrains exhibit different characteristics as a function of vehicle
age, where a used BEV tractor trailer is more cost-effective than new, but a new ICEV is more
cost effective than an old one. The cost of EVSE for the BEV truck ($120,000 assumed for
electric sleeper cabs) increases the TCO per mile by $0.16/mi. This may be an overestimate if the
costs of the charging facility can be amortized over multiple vehicles. Appendix C presents a
comparative analysis between the three powertrains for an initial ownership period of 3 years.
FIGURE 4.16 Tornado chart for LCOD of MY2025 sleeper cab ICEV, 10 year analysis window
$0.90 $0.95 $1.00 $1.05 $1.10 $1.15 $1.20
Drive to charger
Weight exemption
EVSE costs
Battery costs
Payload capacity
M&R by powertrain
Fixed insurance
Insurance variance
Discount rate
Residual value
Ownership time
Finance rate
Used vehicle
M&R variance
Idling costs
Tech progress
Retail markup
Driving distance
Fuel prices
LCOD MY25 ICEV sleeper cab tractor, 10 yr ownership
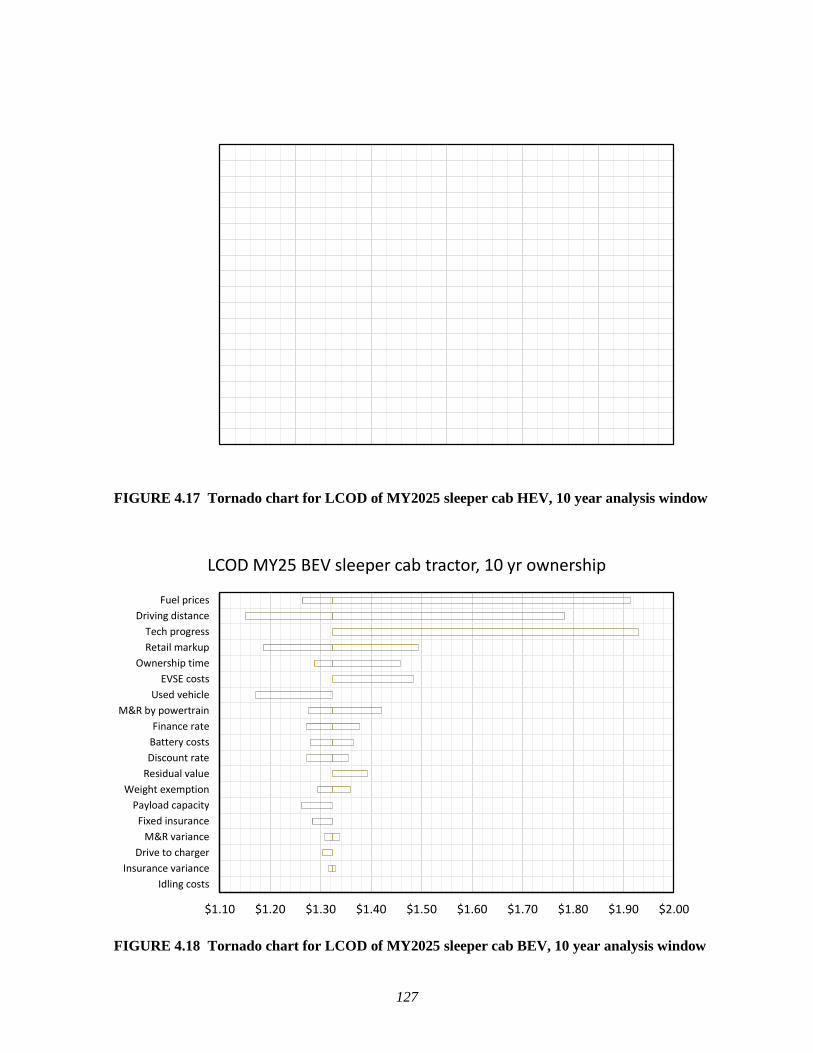
127
FIGURE 4.17 Tornado chart for LCOD of MY2025 sleeper cab HEV, 10 year analysis window
FIGURE 4.18 Tornado chart for LCOD of MY2025 sleeper cab BEV, 10 year analysis window
$0.90 $0.95 $1.00 $1.05 $1.10 $1.15 $1.20
Drive to charger
Weight exemption
EVSE costs
Battery costs
Payload capacity
Fixed insurance
Insurance variance
Ownership time
Discount rate
Used vehicle
Residual value
Finance rate
M&R variance
Idling costs
Tech progress
M&R by powertrain
Retail markup
Driving distance
Fuel prices
LCOD MY25 HEV sleeper cab tractor, 10 yr ownership
$1.10 $1.20 $1.30 $1.40 $1.50 $1.60 $1.70 $1.80 $1.90 $2.00
Idling costs
Insurance variance
Drive to charger
M&R variance
Fixed insurance
Payload capacity
Weight exemption
Residual value
Discount rate
Battery costs
Finance rate
M&R by powertrain
Used vehicle
EVSE costs
Ownership time
Retail markup
Tech progress
Driving distance
Fuel prices
LCOD MY25 BEV sleeper cab tractor, 10 yr ownership

128
Figures 4.19, 4.20, and 4.21 show tornado charts for costs for the class 8 day cab tractor
for ICEV, HEV, and BEV. For the BEV, the factor with the largest potential spread in TCO is
the driving distance, with an even larger spread than the cost of labor, included on these graphics
for comparison. This underscores the desire for fleet managers to keep their vehicles on the road
as much as possible, while showing the breadth of driving applications for medium- and heavy-
duty vehicles. Fuel prices are important for all vehicles, while continued research and
development will help bring operating costs down as well. The BEV is the vehicle most
impacted by variations in driving distance; a battery electric vehicle traveling about 65% more
than average (one standard deviation above the mean) is cheaper than an HEV or ICEV. At 260
miles per day, this vehicle is on the cusp on being range-limited for a typical day’s trip, but
optimized trip management can make this a feasible, cost-effective choice for a fleet.
Used vehicles exhibit interesting behavior for these day cab tractors. Much like the
sleeper cab tractors, vehicle costs gradually increase with age for ICEV due to maintenance and
repair costs. This has the effect of making a used BEV cost competitive with the lowest-price
HEV, rather than being the most expensive as is true for the remaining sensitivities. Appendix C
presents a comparative analysis between the three powertrains for an initial ownership period of
3 years.
FIGURE 4.19 Tornado chart for LCOD of MY2025 class 8 day cab ICEV, 10 year analysis
window
$0.90 $1.10 $1.30 $1.50 $1.70 $1.90 $2.10 $2.30
Payload capacity
Weight exemption
Drive to charger
EVSE costs
Battery costs
M&R by powertrain
Insurance variance
Ownership time
Fixed insurance
Discount rate
Residual value
M&R variance
Finance rate
Used vehicle
Tech progress
Retail markup
Fuel prices
Driving distance
Labor costs
LCOD MY25 ICEV day cab tractor, 10 yr ownership
129
FIGURE 4.20 Tornado chart for LCOD of MY2025 class 8 day cab HEV, 10 year analysis
window
FIGURE 4.21 Tornado chart for LCOD of MY2025 class 8 day cab BEV, 10 year analysis
window
$0.90 $1.10 $1.30 $1.50 $1.70 $1.90 $2.10 $2.30
Payload capacity
Weight exemption
Drive to charger
EVSE costs
Battery costs
Insurance variance
Ownership time
Fixed insurance
Used vehicle
Discount rate
M&R variance
Residual value
Finance rate
M&R by powertrain
Tech progress
Retail markup
Fuel prices
Driving distance
Labor costs
LCOD MY25 HEV day cab tractor, 10 yr ownership
$0.90 $1.10 $1.30 $1.50 $1.70 $1.90 $2.10 $2.30
Payload capacity
Fixed insurance
Insurance variance
Weight exemption
Drive to charger
M&R variance
Battery costs
Used vehicle
Discount rate
Residual value
Finance rate
EVSE costs
Ownership time
M&R by powertrain
Retail markup
Tech progress
Fuel prices
Labor costs
Driving distance
LCOD MY25 BEV day cab tractor, 10 yr ownership

130
Figures 4.22, 4.23, and 4.24 show tornado charts for costs for the class 4 delivery truck.
In nearly all cases, the BEV is the cheapest vehicle powertrain. If differences in M&R costs
across powertrains are not considered, then the HEV is slightly less expensive than the BEV, but
both are still cheaper than the ICEV. Similarly, if the cost of electricity is very high, then the
BEV may not be the most cost-effective option. For each of these powertrains, it is more
expensive to own and operate a used vehicle than a new one. Even if the BEV RPE factor is 25%
higher than the ICEV, the BEV still has a lower cost of operation over 10 years. All of this is
predicated on continued improvement in BEV energy efficiency and reduction of battery costs,
as the low-technology-progress case (effectively $170/kWh for the battery) finds the BEV to be
the most expensive vehicle.
Because AFVs are most cost-competitive within the class 4 delivery truck segment,
Appendix C presents a side case where the class 4 delivery trucks are owned for only 3 years to
see if AFVs have a sufficiently low breakeven time to be considered by fleet managers. This
analysis shows that in the baseline case, that BEV still manage to be the lowest cost powertrain,
even at under 3 years before resale of the vehicle.
FIGURE 4.22 Tornado chart for LCOD of MY2025 class 4 delivery ICEV, 10 year
analysis window
$0.60 $0.80 $1.00 $1.20 $1.40 $1.60 $1.80
Drive to charger
EVSE costs
Battery costs
M&R by powertrain
Tech progress
Insurance variance
M&R variance
Discount rate
Finance rate
Fuel prices
Retail markup
Residual value
Ownership time
Used vehicle
Driving distance
LCOD MY25 ICEV class 4 delivery truck, 10 yr ownership

131
FIGURE 4.23 Tornado chart for LCOD of MY2025 class 4 delivery HEV, 10 year analysis
window
FIGURE 4.24 Tornado chart for LCOD of MY2025 class 4 delivery BEV, 10 year analysis
window
$0.60 $0.80 $1.00 $1.20 $1.40 $1.60 $1.80
Drive to charger
EVSE costs
Battery costs
Tech progress
Insurance
M&R adjust
Discount rate
M&R by powertrain
Finance rate
Fuel prices
Ownership time
Retail markup
Residual value
Used vehicle
Driving distance
LCOD MY25 HEV class 4 delivery truck, 10 yr ownership
$0.60 $0.80 $1.00 $1.20 $1.40 $1.60 $1.80
Drive to charger
EVSE costs
M&R variance
Insurance variance
Battery costs
Ownership time
Discount rate
Finance rate
Used vehicle
Fuel prices
M&R by powertrain
Retail markup
Residual value
Tech progress
Driving distance
LCOD MY25 BEV class 4 delivery truck, 10 yr ownership
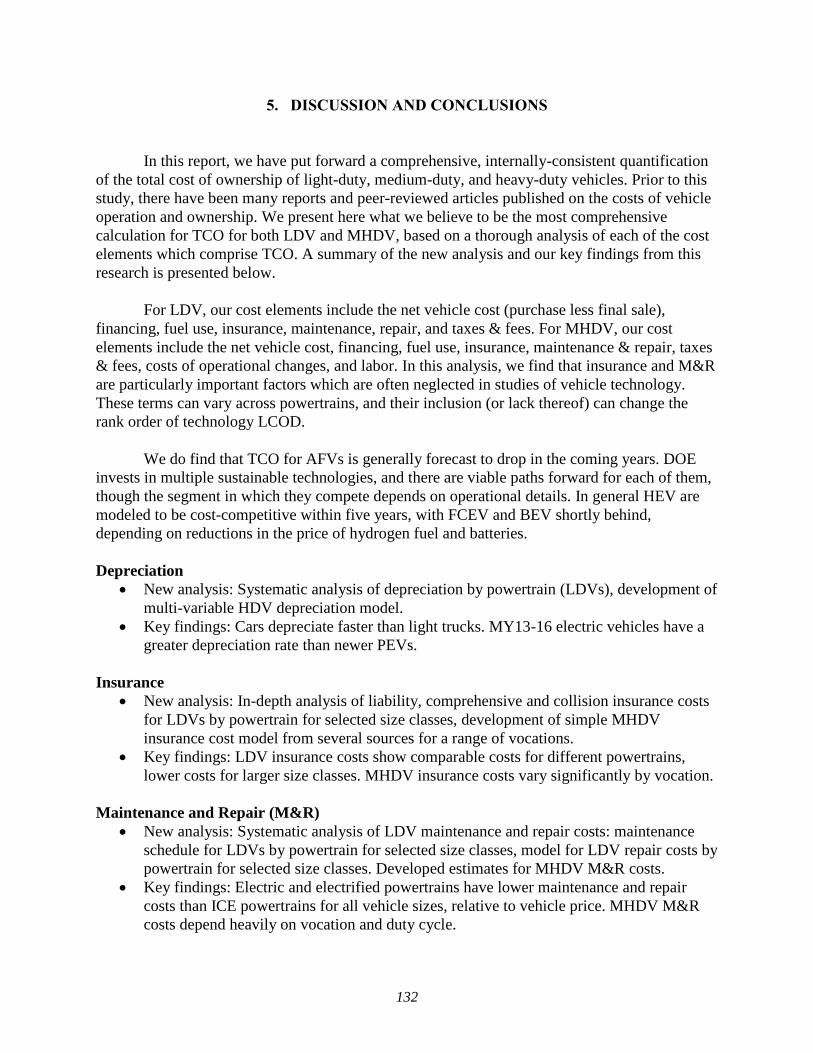
132
5. DISCUSSION AND CONCLUSIONS
In this report, we have put forward a comprehensive, internally-consistent quantification
of the total cost of ownership of light-duty, medium-duty, and heavy-duty vehicles. Prior to this
study, there have been many reports and peer-reviewed articles published on the costs of vehicle
operation and ownership. We present here what we believe to be the most comprehensive
calculation for TCO for both LDV and MHDV, based on a thorough analysis of each of the cost
elements which comprise TCO. A summary of the new analysis and our key findings from this
research is presented below.
For LDV, our cost elements include the net vehicle cost (purchase less final sale),
financing, fuel use, insurance, maintenance, repair, and taxes & fees. For MHDV, our cost
elements include the net vehicle cost, financing, fuel use, insurance, maintenance & repair, taxes
& fees, costs of operational changes, and labor. In this analysis, we find that insurance and M&R
are particularly important factors which are often neglected in studies of vehicle technology.
These terms can vary across powertrains, and their inclusion (or lack thereof) can change the
rank order of technology LCOD.
We do find that TCO for AFVs is generally forecast to drop in the coming years. DOE
invests in multiple sustainable technologies, and there are viable paths forward for each of them,
though the segment in which they compete depends on operational details. In general HEV are
modeled to be cost-competitive within five years, with FCEV and BEV shortly behind,
depending on reductions in the price of hydrogen fuel and batteries.
Depreciation
New analysis: Systematic analysis of depreciation by powertrain (LDVs), development of
multi-variable HDV depreciation model.
Key findings: Cars depreciate faster than light trucks. MY13-16 electric vehicles have a
greater depreciation rate than newer PEVs.
Insurance
New analysis: In-depth analysis of liability, comprehensive and collision insurance costs
for LDVs by powertrain for selected size classes, development of simple MHDV
insurance cost model from several sources for a range of vocations.
Key findings: LDV insurance costs show comparable costs for different powertrains,
lower costs for larger size classes. MHDV insurance costs vary significantly by vocation.
Maintenance and Repair (M&R)
New analysis: Systematic analysis of LDV maintenance and repair costs: maintenance
schedule for LDVs by powertrain for selected size classes, model for LDV repair costs by
powertrain for selected size classes. Developed estimates for MHDV M&R costs.
Key findings: Electric and electrified powertrains have lower maintenance and repair
costs than ICE powertrains for all vehicle sizes, relative to vehicle price. MHDV M&R
costs depend heavily on vocation and duty cycle.

133
Taxes, fees, parking, tolls, etc.
New analysis: Development of consistent costs for both LDVs and MHDVs by size class
and powertrain, covering a comprehensive range of relevant taxes and fee-related costs.
Key findings: LDV taxes and fees are comparable across powertrain types and size
classes; marginally higher registration fees for AFVs. MHDV costs depend on the
vocation, weight rating, and state.
Costs unique to commercial vehicles
New analysis: Models developed to estimate labor costs of BEV charging and heavy-duty
payload capacity costs.
Key findings: Many vehicles would be affected by additional battery weight, reducing the
available payload capacity, and this cost can be substantial. BEV charging can be time-
consuming; labor rates can cause this cost to dominate TCO. Auxiliary Power Units to
minimize idling are cost effective ways to minimize fuel consumption.
Financial analysis
New analysis: Examination of discount rates, inflation rates, and loan terms.
Key findings: Real loan terms of 4% for 5.25 years are appropriate for analysis along
with a 1.2% discount rate for households, 3% for businesses.
Because this analysis focuses on the ownership and operation costs of an individual
vehicle, it is distinct from segmentation-type analyses which aim to identify market opportunities
for specific technologies (e.g. Morrison et al. 2018; Hunter et al. 2021 forthcoming). Likewise,
this analysis does not attempt to model market adoption to estimate future sales shares of
different vehicle technologies, as these analyses depend on consumer behavior which is not
completely tied to vehicle cost of ownership (e.g. Stephens et al. 2020; Brooker et al. 2021
forthcoming). That noted, the results from this output can be used to supplement those types of
analyses, as this report includes rigorous and self-consistent analysis of many of the costs that
comprise a TCO calculation. Furthermore, forecasting costs into the future is challenging. For
AFV along with their energy infrastructure, variations in the rate of technical improvement can
change which vehicles are most affordable and when. Combining vehicle-level cost modeling
with technoeconomic analysis of fueling/charging infrastructure and market analysis and
modeling can strengthen assumptions used across analyses.
While the analysis presented here is sufficient for a robust analysis, there are still gaps in
the available data. AFVs are nascent technologies, and have smaller market share, which leads to
a lack of information about insurance and M&R costs, particularly for MHDV. Beyond looking
at an average TCO for each vocation, we can consider the distributions of TCO within a broader
population. Geographic differences in fuel prices, insurance requirements, and labor rates can
lead to differences in TCO throughout the country, while socioeconomic factors can impact
vehicle choice and travel behavior.
The authors hope that the information presented here can be used by the research
community broadly. Beyond the tables of data which are available in Appendices B and C, the
authors have developed a web-based tool for calculating TCO (Wiryadinata and Lehrer 2021).

134
Details of the comprehensive literature review will also be published alongside this report
(Delucchi 2021, ANL 2021a).
This research was supported by the Vehicle Technologies Office in the Office of Energy
Efficiency and Renewable Energy at the U.S. Department of Energy, and the authors express
their thanks to VTO, and in particular Jacob Ward, Raphael Isaac, and Mark Smith, for guidance
and helpful discussion. The authors thank members of the U.S. DRIVE government-industry
partnership Integrated Systems Analysis Technical Team for insightful discussions. The authors
also thank attendees and panelists of the Total Cost of Ownership workshops for medium- and
heavy-duty vehicles, held in April 2020, for their valuable insights and perspectives. In
particular, the authors would like to thank Mike Tunnell (American Transportation Research
Institute), Mike Roeth (North American Council for Freight Efficiency), Scott Phillippi (UPS),
Dawn Fenton (Volvo Group NA), Alan Mace (Ballard Power Systems), and Randal Kaufman
(Black & Veatch) for being panelists. The authors especially thank Sandra Loi of NREL for her
invaluable assistance in reorganizing and hosting the workshops as virtual events after the
implementation of nationwide travel restrictions due to COVID-19.
This report was prepared as an account of work sponsored by an agency of the United
States government. Neither the United States government nor any agency thereof, nor any of
their employees, makes any warranty, express or implied, or assumes any legal liability or
responsibility for the accuracy, completeness, or usefulness of any information, apparatus,
product, or process disclosed or represents that its use would not infringe privately owned rights.
Reference herein to any specific commercial product, process, or service by trade name,
trademark, manufacturer, or otherwise does not necessarily constitute or imply its endorsement,
recommendation, or favoring by the United States government or any agency thereof. The views
and opinions of authors expressed herein do not necessarily state or reflect those of the United
States government or any agency thereof.
135
APPENDIX A: COMPARISON OF PRIVATE AND SOCIETAL TCO
The majority of this report addresses a complete, quantitative, data-based estimation of
the cost of ownership of different on-road vehicles having a range of vehicle fuels and
powertrain technologies, from the perspective of a private individual or firm. However, there are
key distinctions between this private calculation and a societal benefits calculation, as shown in
Table 2.1. This appendix will look deeper into the differences between a social lifetime cost
analysis and a quantitative private-cost analysis, and show that one cannot estimate social
lifetime cost merely by adding external costs to private costs.
A lifetime-cost analysis can provide anything from detailed cost models to simple
estimates of total cost, which can be used to: i) evaluate the costs and benefits of transportation
projects, policies, and long-range scenarios; ii) help establish efficient prices for and ensure
efficient use of transportation services and commodities; iii) compare the costs and benefits of
different kinds of vehicles; and iv) prioritize research and funding to reduce transportation costs
and maximize benefits. Table A.1 presents key cost elements for TCO calculations, and
examines how their treatment differs depending on which perspective and calculation approach
is being used – societal-quantitative, private-quantitative, or private-qualitative.

136
TABLE A.1 Cost elements and parameters that vary by vehicle fuel or powertrain
Perspective/approach
Cost element Societal
Private-
quantitative
Private-
qualitative
Vehicle cost Included
Combined into full vehicle retail
price (cost+profit+taxes+incentive)
and considered jointly with vehicle
loan payments
Automaker profit
Not included, because is an
intra-society transfer from
consumers to producers
Vehicle sales tax
Not included, because taxes are
an intra-society transfer from
consumers to government
Purchase incentives
Not included, because they are
designed to manipulate demand,
not recover costs
Vehicle loan payments
Includes only the cost of
administering the loan; principal is
part of “vehicle cost;” loan interest
is a transfer from consumers to
lenders; social discount rate
accounts for opportunity cost of
resources used to make vehicle )
An ordinary
periodic cost to be
discounted by the
relevant discount
rate
Considered
qualitatively,
rather than in a
full, explicit
financial
accounting
Vehicle resale value
Includes only the actual (very
small) transaction costs; the rest is
a transfer between consumers Considered
quantitatively
Considered
qualitatively Period of first
ownership (when
vehicle is resold)
Relevant only via (trivial) effect
on timing of resale transaction
cost
Average vehicle lifetime
to scrappage
Included quantitatively (this is
the only relevant lifetime)
If vehicle is resold, lifetime to
scrappage is reflected in resale value;
otherwise, it is considered
quantitatively or qualitatively
Battery replacement
Included quantitatively Considered
qualitatively Vehicle energy use

137
TABLE A.1 (Cont.)
Perspective
Cost element Societal
Private-
quantitative
Private-
qualitative
Energy cost – retail cost
of dispensed fuel Included
Included
quantitatively
based on full
energy prices
(including cost,
profit, and taxes)
Considered
qualitatively, based
on full energy
prices (including
cost, profit, and
taxes), in
conjunction with
vehicle efficiency
Energy firm profit
Not included, because producer
surplus is an intra-society transfer
from consumers to producers
Energy (excise) taxes
Not included, because taxes are
an intra-society transfer from
consumers and producers to
government
Corporate income taxes
Not included, because taxes are
an intra-society transfer from
producers to government
Included
quantitatively
based on actual
prices
Considered
qualitatively, based
on actual prices
Insurance
Includes only actual
administrative cost; excludes
industry true profit (producer
surplus) in premiums
Included based
on actual
premiums paid Perhaps
considered
qualitatively
Maintenance and repair
Included; must avoid double-counting repair costs
covered by warranties and insurance premiums; costs
must be consistent with vehicle usage and lifetime;
costs for EVs will decrease with scale and learning
Engine oil
Included
Probably not
explicitly
considered in
purchase or use
decisions
Inspection fees
Replacement tires
Paid driver time Not applicable
External costs (e.g., air
pollution, climate change,
energy security
Included (note that estimates
should use discount rate consistent
with rate assumed for present-
value calculations)
Not included

138
TABLE A.1 (Cont.)
Perspective
Cost element Societal Private-quantitative Private-qualitative
Parking
Included
Probably not explicitly
considered in purchase
or use decisions
Accessories
Tolls and fines Not included, because they
are a transfer from
consumers to government
Included
Registration fees*
Annual VMT,
base-line travel
benefits** Included Perhaps considered
qualitatively Inflation, cost
escalation
Discount rate
Social discount rate;
mainly the opportunity cost
of foregone productivity
growth
Interest foregone on
short-to-medium term,
relatively safe savings
and investments
Implicit discounting of
the future due to risk
aversion, uncertainty,
and limited time to
fully enjoy benefits of
transportation
Motor-vehicle
road
infrastructure and
public services
Not included, because they do not vary appreciably*** by vehicle technology;
they would be included in a cost-benefit analysis comparing motor-vehicles with
other transport modes, such as trains
* Registration fees can vary slightly from state to state, by powertrain.
** This is the annual VMT corresponding to the access benefits of travel in the current conventional petroleum-
fuel vehicle baseline. This baseline, fundamental benefit of travel is the same for all vehicles. Table 2.6 lists
ways in which VMT can vary by vehicle type and affect costs but not baseline benefits. See the text for further
discussion.
*** Because road wear is a function of vehicle weight, changes in powertrains that affected average in-use vehicle
weight would affect road wear.
An important point to make here is that, contrary to common (if not heretofore universal)
practice, one can not produce an estimate of the social lifetime cost simply by adding estimates
of external costs to estimates of private costs. As summarized in Table A.1, and described in
greater detail in Table A.2, there are a number of non-trivial differences between the societal-
quantitative and the private-quantitative perspective/approach other than the treatment of
external costs (or, more generally, non-market costs):

139
1) The difference between price-times-quantity payments (private-quantitative) and the area
under the long-run marginal-cost curve (societal-quantitative). This difference potentially is
quite large. For example, Delucchi (2004) estimates that tax and fee payments by motor-
vehicle users towards the use of public highway infrastructure and services (PHIS) (mainly
fuel taxes, registration and license fees, tolls and fines) are 20% to 31% of the costs “usually
included in GNP-type accounts” (see top part of column 2 of Table A.2) and 12% to 17% of
the sum of: i) priced-private sector costs (column 2 of Table A.2) and ii) the cost of motor-
vehicle goods and services provided by the public sector (column 4 of Table 2). Because
these tax and fee payments towards PHIS “have no straightforward relevance in an analysis
of social costs or efficient pricing” (Delucchi 2007, 988), they should be treated as transfers
and excluded from a social-cost analysis (which would estimate separately the actual cost of
the PHIS – column 4 of Table 2). And one cannot reasonably choose not to estimate and
deduct tax and fee payments on the grounds that doing so would not change the relative
social costs of alternative transportation options, because the claim is false: tax and fee
payments are potentially different, in relative as well as absolute terms, between, say, electric
and gasoline vehicles, and certainly are different between motor-vehicles and other
transportation options.
Moreover, Delucchi’s (2004) estimate of tax and fee payments for PHIS do not include sales
taxes, corporate income taxes, property taxes, or personal income taxes related to the
production and use of motor vehicles, motor fuels, and public roads. Delucchi and Murphy
(2008) estimate that in total these taxes could amount to several tens of billions of dollars.
Delucchi and Murphy (2008) also estimate the associated “tax subsidy,” defined as the
difference between the actual tax payments and the amount that would have been paid had
the entities been taxed at a national average rate: on the order of $10 to $50 billion in the year
2000. We point this out not because the tax subsidy is a social cost – it is not – but because it
speaks to and invalidates the tempting argument that embedded taxes need not be removed in
a social cost analysis because removing them would not change relative social costs. The
only way to get a proper picture of relative and absolute social costs is to remove all taxes
from an estimate of the private cost.
Finally, Sun et al (2019) estimate that producer surplus is about 40% of total price-times-
quantity payments for gasoline in the US over the period 2005 to 2030. In an illustrative
calculation, they estimate that failing to deduct producer surplus from price-times-quantity
payments overstates the present value of lifetime social costs for a single gasoline vehicle by
about $7,000.
2) The difference between considering the period of first ownership, depreciation, and resale
value and ignoring these. As discussed in the background report, this difference – i.e., the
absolute, unambiguous error that results from incorrectly assuming that social costs =
business costs + external costs – is potentially quite large, at least several thousand dollars,
and perhaps over $20,000. For example, assuming a $30,000 dollar vehicle (based on Table
3.1), the annual VMT schedule for SUVs from the NHTSA & EPA (2020) LDV rulemaking,
an 18-year vehicle life to scrappage, a real discount rate of 1.2% (Table 2.5), and resale of
the vehicle after 7 years with a resale value of 34% of the initial cost (Figure 3-11), then the
difference in the net present value of annualized vehicle costs between the societal

140
perspective and the private-quantitative perspective is $13,400. This figure increases if the
lifetime to scrappage is longer or if the resale value percentage for a given year is lower.
This entire error comes into play when comparing the social cost of different modes. But
there also is an absolute and relative error here when comparing the social cost of vehicles
with different powertrains. Note that difference increases linearly with the initial cost. This
means that, for a given depreciation schedule, assuming that social costs = private costs +
external costs not only introduces a very large error, the error is greater for more costly
vehicles. From the standpoint of society, ownership aspects are irrelevant; what matters are
actual vehicle lifetime to scrappage and actual M&R costs over the entire lifetime.
3) The difference between loan rates and discount rates pertinent to individuals and firms and
the much lower discount rate for society. There are two aspects to this. First, the private-
quantitative case includes loan interest payments that from the perspective of society are
transfers from borrowers to lenders, assuming that who holds the interest portion – which
banks or companies or public entities – makes no difference economically. The social cost of
a loan, then is only the cost of administering the loan.
Second, a financial discount rate perhaps is a bit higher than the social discount rate. Loss
aversion, budget constraints, and pertain only to individuals and perhaps companies, but not
to society; thus the social discount rate includes only a national productivity component.
The difference due to the treatment of loans is not trivial: for example, the difference
between i) the stream of payments on a loan to finance 90% of the cost of a $25,000 vehicle
at an annual rate of 5% over 5 years, and ii) the stream of payments at 0% has a present value
of about $2000.
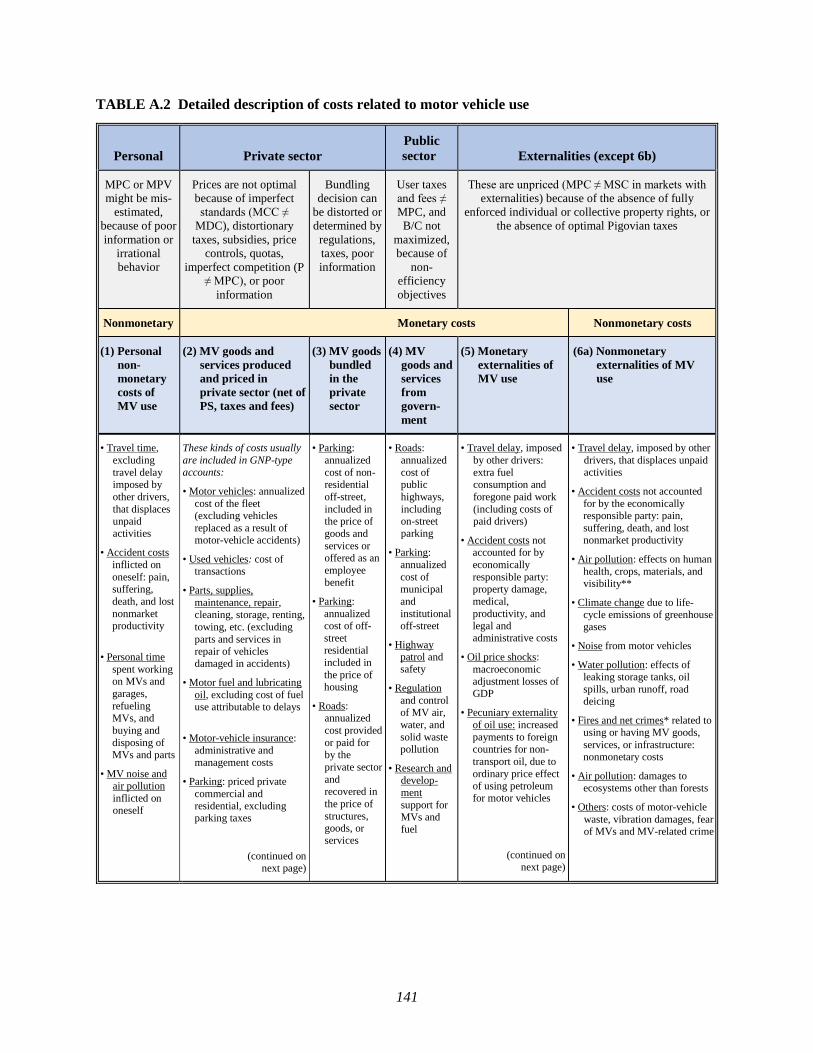
141
TABLE A.2 Detailed description of costs related to motor vehicle use
Personal Private sector Public
sector Externalities (except 6b)
MPC or MPV
might be mis-
estimated,
because of poor
information or
irrational
behavior
Prices are not optimal
because of imperfect
standards (MCC ≠
MDC), distortionary
taxes, subsidies, price
controls, quotas,
imperfect competition (P
≠ MPC), or poor
information
Bundling
decision can
be distorted or
determined by
regulations,
taxes, poor
information
User taxes
and fees ≠
MPC, and
B/C not
maximized,
because of
non-
efficiency
objectives
These are unpriced (MPC ≠ MSC in markets with
externalities) because of the absence of fully
enforced individual or collective property rights, or
the absence of optimal Pigovian taxes
Nonmonetary Monetary costs Nonmonetary costs
(1) Personal
non-
monetary
costs of
MV use
(2) MV goods and
services produced
and priced in
private sector (net of
PS, taxes and fees)
(3) MV goods
bundled
in the
private
sector
(4) MV
goods and
services
from
govern-
ment
(5) Monetary
externalities of
MV use
(6a) Nonmonetary
externalities of MV
use
• Travel time,
excluding
travel delay imposed by
other drivers,
that displaces unpaid activities
• Accident costs
inflicted on
oneself: pain, suffering,
death, and lost
nonmarket productivity
• Personal time
spent working on MVs and
garages,
refueling MVs, and
buying and
disposing of MVs and parts
• MV noise and air pollution
inflicted on oneself
These kinds of costs usually
are included in GNP-type accounts:
• Motor vehicles: annualized
cost of the fleet (excluding vehicles
replaced as a result of motor-vehicle accidents)
• Used vehicles: cost of transactions
• Parts, supplies,
maintenance, repair, cleaning, storage, renting,
towing, etc. (excluding
parts and services in repair of vehicles damaged in accidents)
• Motor fuel and lubricating
oil, excluding cost of fuel use attributable to delays
• Motor-vehicle insurance:
administrative and
management costs
• Parking: priced private
commercial and residential, excluding parking taxes
(continued on next page)
• Parking:
annualized
cost of non-residential
off-street,
included in the price of
goods and
services or offered as an
employee benefit
• Parking:
annualized cost of off-
street residential
included in
the price of housing
• Roads: annualized
cost provided
or paid for by the
private sector
and recovered in
the price of
structures, goods, or services
• Roads:
annualized
cost of public
highways,
including on-street parking
• Parking:
annualized
cost of municipal
and
institutional off-street
• Highway patrol and safety
• Regulation
and control of MV air,
water, and
solid waste pollution
• Research and develop-
ment
support for MVs and fuel
• Travel delay, imposed
by other drivers:
extra fuel consumption and
foregone paid work
(including costs of paid drivers)
• Accident costs not accounted for by
economically
responsible party: property damage,
medical,
productivity, and legal and administrative costs
• Oil price shocks:
macroeconomic adjustment losses of GDP
• Pecuniary externality
of oil use: increased
payments to foreign countries for non-
transport oil, due to
ordinary price effect of using petroleum for motor vehicles
(continued on next page)
• Travel delay, imposed by other
drivers, that displaces unpaid activities
• Accident costs not accounted
for by the economically responsible party: pain,
suffering, death, and lost nonmarket productivity
• Air pollution: effects on human
health, crops, materials, and visibility**
• Climate change due to life-cycle emissions of greenhouse gases
• Noise from motor vehicles
• Water pollution: effects of leaking storage tanks, oil
spills, urban runoff, road deicing
• Fires and net crimes* related to using or having MV goods,
services, or infrastructure: nonmonetary costs
• Air pollution: damages to ecosystems other than forests
• Others: costs of motor-vehicle
waste, vibration damages, fear of MVs and MV-related crime
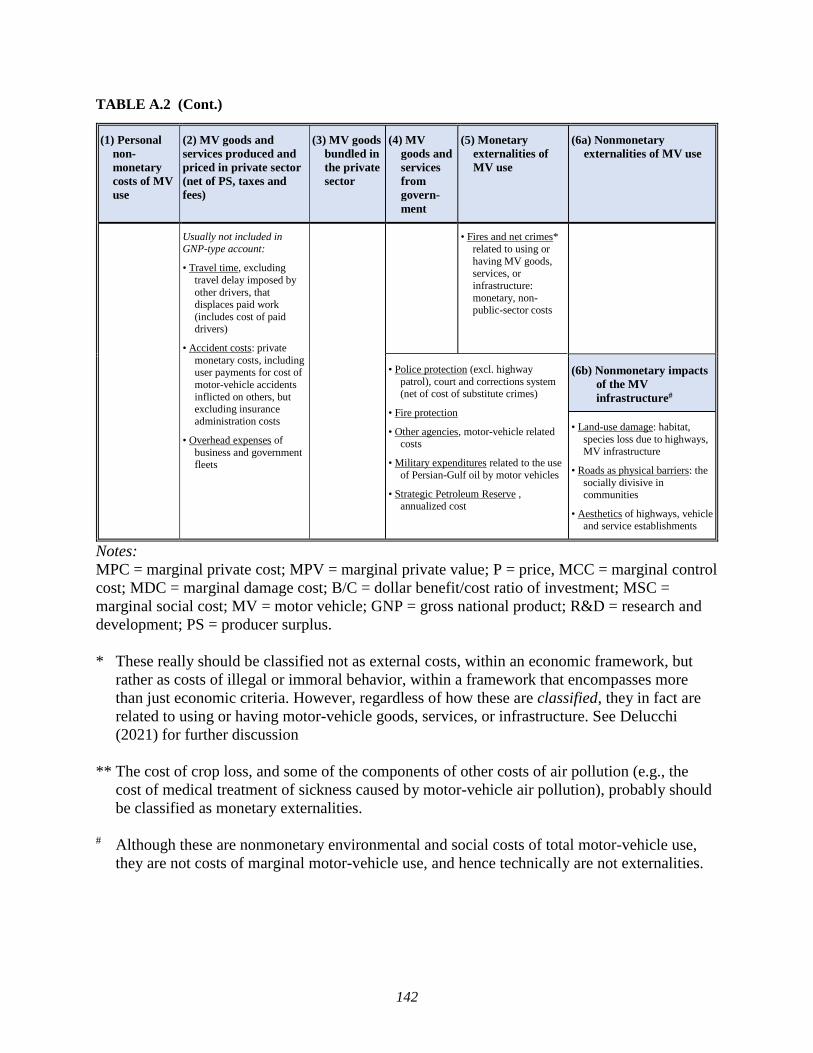
142
TABLE A.2 (Cont.)
(1) Personal
non-
monetary
costs of MV
use
(2) MV goods and
services produced and
priced in private sector
(net of PS, taxes and
fees)
(3) MV goods
bundled in
the private
sector
(4) MV
goods and
services
from
govern-
ment
(5) Monetary
externalities of
MV use
(6a) Nonmonetary
externalities of MV use
Usually not included in GNP-type account:
• Travel time, excluding
travel delay imposed by
other drivers, that displaces paid work
(includes cost of paid
drivers)
• Accident costs: private
monetary costs, including user payments for cost of
motor-vehicle accidents
inflicted on others, but excluding insurance administration costs
• Overhead expenses of
business and government fleets
• Fires and net crimes*
related to using or
having MV goods, services, or
infrastructure:
monetary, non-public-sector costs
• Police protection (excl. highway
patrol), court and corrections system (net of cost of substitute crimes)
• Fire protection
• Other agencies, motor-vehicle related costs
• Military expenditures related to the use of Persian-Gulf oil by motor vehicles
• Strategic Petroleum Reserve , annualized cost
(6b) Nonmonetary impacts
of the MV
infrastructure#
• Land-use damage: habitat,
species loss due to highways, MV infrastructure
• Roads as physical barriers: the
socially divisive in communities
• Aesthetics of highways, vehicle and service establishments
Notes:
MPC = marginal private cost; MPV = marginal private value; P = price, MCC = marginal control
cost; MDC = marginal damage cost; B/C = dollar benefit/cost ratio of investment; MSC =
marginal social cost; MV = motor vehicle; GNP = gross national product; R&D = research and
development; PS = producer surplus.
* These really should be classified not as external costs, within an economic framework, but
rather as costs of illegal or immoral behavior, within a framework that encompasses more
than just economic criteria. However, regardless of how these are classified, they in fact are
related to using or having motor-vehicle goods, services, or infrastructure. See Delucchi
(2021) for further discussion
** The cost of crop loss, and some of the components of other costs of air pollution (e.g., the
cost of medical treatment of sickness caused by motor-vehicle air pollution), probably should
be classified as monetary externalities.
# Although these are nonmonetary environmental and social costs of total motor-vehicle use,
they are not costs of marginal motor-vehicle use, and hence technically are not externalities.

143
APPENDIX B: TABULAR TCO AND LCOD DATA
This appendix presents the figures of Section 4 in tabular form, presenting the lifetime
TCO and the per-mile LCOD by cost element, as described in Section 2.3. A more
comprehensive set of results including additional side cases is published online accompanying
this report (ANL 2021a). For LDV, ‘Payload’ and ‘Labor’ costs are always zero, while for
MHDV, ‘Repair’ is zero because it is incorporated into the combined ‘M&R’.
The following powertrains were analyzed:
ICE-SI: Internal Combustion Engine, Spark Ignition
o Fueled by gasoline
ICE-CI: Internal Combustion Engine, Compression Ignition
o Fueled by diesel
HEV: Hybrid Electric Vehicle
o Fueled by gasoline for light-duty vehicles
o Fueled by diesel for medium- and heavy-duty vehicles
PHEVxx: Plug-in Hybrid Electric Vehicle with an all-electric range of xx miles
o Fueled by gasoline and electricity for light-duty vehicles
o Fueled by diesel and electricity for medium- and heavy-duty vehicles
FCEV: Fuel Cell Electric Vehicle
o Fueled by hydrogen
BEVxx: Battery Electric Vehicle with an all-electric range of xx miles
o Fueled by electricity
Light-duty vehicle size classes ranging from compact sedans to pickup trucks were
considered, with the primary focus on small sport utility vehicles. The following medium- and
heavy-duty vocations were analyzed:
Class 8 sleeper-cab tractor trailer
Class 8 day-cab tractor trailer
Class 8 vocational truck
Class 6 pickup and delivery truck
Class 4 pickup and delivery truck
Class 8 transit bus
Class 8 refuse truck
Vehicle costs and fuel economy were modeled using the Autonomie model. The BEV
range was assumed to be 500 miles for class 8 sleeper-cab tractor trailers, 250 miles for class 8
day-cab tractor trailers, 200 miles for class 8 vocational vehicles, and 150 miles for the other four
vocations. MHDV PHEV were modeled to have exactly half this range. Further information
about the modeling assumptions for the vehicles can be found in (Islam et al. 2020) and
(Vijayagopal et al. 2019).

144
TABLE B.1 Small SUV, MY2025; Figures 4.1 and ES-5
Lifetime Costs ICE-SI ICE-CI HEV PHEV50 FCEV BEV300 BEV200
Vehicle $26,051 $27,744 $27,419 $34,505 $34,515 $46,031 $37,621
Financing $2,884 $3,072 $3,019 $3,584 $3,465 $4,672 $3,818
Fuel $17,488 $15,939 $12,433 $11,981 $18,118 $9,254 $8,770
Insurance $13,289 $13,357 $13,376 $12,667 $11,495 $12,870 $12,349
Maintenance $16,302 $15,714 $14,518 $13,968 $9,829 $8,920 $8,920
Repair $6,990 $7,270 $6,543 $6,959 $5,288 $6,808 $5,694
Tax & fees $5,244 $5,409 $5,460 $6,356 $6,763 $7,741 $6,991
Total $88,248 $88,505 $82,768 $90,020 $89,474 $96,295 $84,164
Per-Mile Costs ICE-SI ICE-CI HEV PHEV50 FCEV BEV300 BEV200
Vehicle $0.1395 $0.1486 $0.1469 $0.1848 $0.1849 $0.2465 $0.2015
Financing $0.0154 $0.0165 $0.0162 $0.0192 $0.0186 $0.0250 $0.0205
Fuel $0.0937 $0.0854 $0.0666 $0.0642 $0.0970 $0.0496 $0.0470
Insurance $0.0712 $0.0715 $0.0716 $0.0678 $0.0616 $0.0689 $0.0661
Maintenance $0.0873 $0.0842 $0.0778 $0.0748 $0.0526 $0.0478 $0.0478
Repair $0.0374 $0.0389 $0.0350 $0.0373 $0.0283 $0.0365 $0.0305
Tax & fees $0.0281 $0.0290 $0.0292 $0.0340 $0.0362 $0.0415 $0.0374
Total $0.4727 $0.4740 $0.4433 $0.4822 $0.4792 $0.5158 $0.4508
TABLE B.2 Gasoline LDV, MY2025; Figure 4.2
Lifetime Costs Compact sedan Midsize sedan Small SUV Medium SUV Pickup
Vehicle $18,626 $24,055 $26,051 $27,714 $30,366
Financing $2,054 $2,652 $2,884 $3,068 $3,362
Fuel $13,605 $14,902 $15,631 $16,392 $20,422
Insurance $12,715 $13,605 $13,289 $13,356 $13,216
Maintenance $14,202 $14,202 $14,202 $14,202 $14,202
Repair $6,244 $7,077 $6,760 $7,025 $5,747
Tax & fees $4,514 $5,040 $5,244 $5,406 $5,664
Total $71,960 $81,534 $84,061 $87,165 $92,978
Per-Mile Costs Compact sedan Midsize sedan Small SUV Medium SUV Pickup
Vehicle $0.1123 $0.1451 $0.1571 $0.1672 $0.1831
Financing $0.0124 $0.0160 $0.0174 $0.0185 $0.0203
Fuel $0.0821 $0.0899 $0.0943 $0.0989 $0.1232
Insurance $0.0767 $0.0821 $0.0802 $0.0806 $0.0797
Maintenance $0.0857 $0.0857 $0.0857 $0.0857 $0.0857
Repair $0.0377 $0.0427 $0.0408 $0.0424 $0.0347
Tax & fees $0.0272 $0.0304 $0.0316 $0.0326 $0.0342
Total $0.4340 $0.4918 $0.5070 $0.5257 $0.5608

145
TABLE B.3 Class 8 diesel truck, MY2025; Figure 4.3 and ES-6
Lifetime Costs Sleeper Day cab Vocational 6-Delivery 4-Delivery Transit Bus Refuse
Vehicle $129,699 $98,661 $62,928 $55,890 $37,223 $74,612 $63,467
Financing $14,793 $12,081 $9,559 $7,229 $5,962 $11,240 $9,618
Fuel $318,806 $215,658 $87,920 $44,954 $29,661 $157,578 $158,676
Insurance $67,898 $49,989 $43,931 $43,931 $26,358 $307,514 $65,896
M & R $183,575 $121,090 $144,162 $135,383 $43,216 $248,708 $697,718
Tax & fees $90,484 $69,765 $41,428 $24,413 $21,149 $51,061 $43,255
Payload $0 $0 $0 $0 $0 $0 $0
Labor $618,509 $405,871 $527,167 $527,167 $527,167 $527,167 $527,167
Total $1,423,765 $973,116 $917,095 $838,967 $690,737 $1,377,878 $1,565,797
Per-Mile Costs Sleeper Day cab Vocational 6-Delivery 4-Delivery Transit Bus Refuse
Vehicle $0.1657 $0.1920 $0.2740 $0.3077 $0.2603 $0.2206 $0.2436
Financing $0.0189 $0.0235 $0.0416 $0.0398 $0.0417 $0.0332 $0.0369
Fuel $0.4072 $0.4197 $0.3828 $0.2475 $0.2074 $0.4660 $0.6089
Insurance $0.0867 $0.0973 $0.1913 $0.2419 $0.1843 $0.9093 $0.2529
M & R $0.2345 $0.2357 $0.6276 $0.7453 $0.3022 $0.7354 $2.6776
Tax & fees $0.1156 $0.1358 $0.1804 $0.1344 $0.1479 $0.1510 $0.1660
Payload $0.0000 $0.0000 $0.0000 $0.0000 $0.0000 $0.0000 $0.0000
Labor $0.7900 $0.7900 $2.2951 $2.9023 $3.6869 $1.5588 $2.0231
Total $1.8185 $1.8940 $3.9927 $4.6188 $4.8309 $4.0744 $6.0089
TABLE B.4 Class 8 sleeper cab tractor, MY2025; Figure 4.4
Lifetime Costs ICE-CI HEV PHEV250 FCEV BEV500
Vehicle $129,699 $137,834 $236,316 $191,000 $341,088
Financing $14,793 $15,721 $26,953 $21,785 $38,903
Fuel $318,806 $318,297 $345,926 $669,896 $258,583
Insurance $67,898 $68,982 $82,097 $76,062 $96,050
M & R $183,575 $159,710 $154,203 $110,145 $110,145
Tax & fees $90,484 $92,510 $117,036 $105,751 $143,129
Payload $0 $747 $78,947 $8,595 $77,972
Labor $618,509 $618,509 $618,509 $618,509 $618,509
Total $1,423,765 $1,412,311 $1,659,988 $1,801,742 $1,684,380
Per-Mile Costs ICE-CI HEV PHEV250 FCEV BEV500
Vehicle $0.1657 $0.1760 $0.3018 $0.2439 $0.4356
Financing $0.0189 $0.0201 $0.0344 $0.0278 $0.0497
Fuel $0.4072 $0.4065 $0.4418 $0.8556 $0.3303
Insurance $0.0867 $0.0881 $0.1049 $0.0971 $0.1227
M & R $0.2345 $0.2040 $0.1970 $0.1407 $0.1407
Tax & fees $0.1156 $0.1182 $0.1495 $0.1351 $0.1828
Payload $0.0000 $0.0010 $0.1008 $0.0110 $0.0996
Labor $0.7900 $0.7900 $0.7900 $0.7900 $0.7900
Total $1.8185 $1.8038 $2.1202 $2.3012 $2.1513

146
TABLE B.5 Class 8 day cab tractor, MY2025; Figure 4.5
Lifetime Costs ICE-CI HEV PHEV125 FCEV BEV250
Vehicle $98,661 $102,594 $148,398 $151,759 $189,365
Financing $12,081 $12,563 $18,171 $18,583 $23,187
Fuel $215,658 $209,582 $228,365 $446,172 $161,522
Insurance $49,989 $50,658 $58,443 $59,014 $65,405
M & R $121,090 $105,348 $101,716 $72,654 $72,654
Tax & fees $69,765 $70,817 $83,063 $83,962 $94,017
Payload $0 $0 $19,562 $0 $0
Labor $405,871 $405,871 $405,871 $405,871 $405,871
Total $973,116 $957,433 $1,063,587 $1,238,013 $1,012,022
Per-Mile Costs ICE-CI HEV PHEV125 FCEV BEV250
Vehicle $0.1920 $0.1997 $0.2888 $0.2954 $0.3686
Financing $0.0235 $0.0245 $0.0354 $0.0362 $0.0451
Fuel $0.4197 $0.4079 $0.4445 $0.8684 $0.3144
Insurance $0.0973 $0.0986 $0.1137 $0.1149 $0.1273
M & R $0.2357 $0.2050 $0.1980 $0.1414 $0.1414
Tax & fees $0.1358 $0.1378 $0.1617 $0.1634 $0.1830
Payload $0.0000 $0.0000 $0.0381 $0.0000 $0.0000
Labor $0.7900 $0.7900 $0.7900 $0.7900 $0.7900
Total $1.8940 $1.8635 $2.0701 $2.4096 $1.9698
TABLE B.6 Class 4 delivery truck, MY2025; Figure 4.6
Lifetime Costs ICE-CI HEV PHEV75 FCEV BEV150
Vehicle $37,223 $40,101 $44,760 $46,615 $48,638
Financing $5,962 $6,423 $7,169 $7,466 $7,790
Fuel $29,661 $22,821 $23,261 $34,522 $12,744
Insurance $26,358 $26,358 $26,358 $26,358 $26,358
M & R $43,216 $37,598 $36,302 $25,930 $25,930
Tax & fees $21,149 $21,618 $22,515 $23,070 $23,315
Payload $0 $0 $0 $0 $0
Labor $527,167 $527,167 $527,167 $527,167 $527,167
Total $690,737 $682,087 $687,532 $691,128 $671,942
Per-Mile Costs ICE-CI HEV PHEV75 FCEV BEV150
Vehicle $0.2603 $0.2805 $0.3130 $0.3260 $0.3402
Financing $0.0417 $0.0449 $0.0501 $0.0522 $0.0545
Fuel $0.2074 $0.1596 $0.1627 $0.2414 $0.0891
Insurance $0.1843 $0.1843 $0.1843 $0.1843 $0.1843
M & R $0.3022 $0.2630 $0.2539 $0.1813 $0.1813
Tax & fees $0.1479 $0.1512 $0.1575 $0.1613 $0.1631
Payload $0.0000 $0.0000 $0.0000 $0.0000 $0.0000
Labor $3.6869 $3.6869 $3.6869 $3.6869 $3.6869
Total $4.8309 $4.7704 $4.8085 $4.8336 $4.6994

147
TABLE B.7a Small SUV, gasoline HEV, MY2020–2050; Figures 4.7 and ES-8
Lifetime Costs 2020 2025 2030 2035 2050
Vehicle $28,660 $27,419 $27,172 $27,359 $26,553
Financing $3,156 $3,019 $2,992 $3,012 $2,924
Fuel $15,403 $12,433 $12,707 $12,240 $11,819
Insurance $13,427 $13,376 $13,365 $13,373 $13,340
Maintenance $14,518 $14,518 $14,518 $14,518 $14,518
Repair $6,733 $6,543 $6,506 $6,534 $6,414
Tax & fees $5,580 $5,460 $5,436 $5,454 $5,376
Total $87,476 $82,768 $82,696 $82,491 $80,943
Per-Mile Costs 2020 2025 2030 2035 2050
Vehicle $0.1535 $0.1469 $0.1455 $0.1465 $0.1422
Financing $0.0169 $0.0162 $0.0160 $0.0161 $0.0157
Fuel $0.0825 $0.0666 $0.0681 $0.0656 $0.0633
Insurance $0.0719 $0.0716 $0.0716 $0.0716 $0.0714
Maintenance $0.0778 $0.0778 $0.0778 $0.0778 $0.0778
Repair $0.0361 $0.0350 $0.0348 $0.0350 $0.0344
Tax & fees $0.0299 $0.0292 $0.0291 $0.0292 $0.0288
Total $0.4685 $0.4433 $0.4429 $0.4418 $0.4335
TABLE B.7b Small SUV, electric BEV300, MY2020–2050; Figures 4.7 and ES-8
Lifetime Costs 2020 2025 2030 2035 2050
Vehicle $57,480 $46,031 $39,091 $36,103 $32,658
Financing $5,834 $4,672 $3,967 $3,664 $3,314
Fuel $11,030 $9,254 $8,692 $8,149 $6,998
Insurance $13,482 $12,870 $12,392 $12,305 $11,929
Maintenance $8,920 $8,920 $8,920 $8,920 $8,920
Repair $8,682 $6,808 $5,875 $5,514 $5,125
Tax & fees $8,762 $7,741 $7,122 $6,855 $6,548
Total $114,190 $96,295 $86,060 $81,511 $75,492
Per-Mile Costs 2020 2025 2030 2035 2050
Vehicle $0.3079 $0.2465 $0.2094 $0.1934 $0.1749
Financing $0.0312 $0.0250 $0.0212 $0.0196 $0.0178
Fuel $0.0591 $0.0496 $0.0466 $0.0436 $0.0375
Insurance $0.0722 $0.0689 $0.0664 $0.0659 $0.0639
Maintenance $0.0478 $0.0478 $0.0478 $0.0478 $0.0478
Repair $0.0465 $0.0365 $0.0315 $0.0295 $0.0274
Tax & fees $0.0469 $0.0415 $0.0381 $0.0367 $0.0351
Total $0.6116 $0.5158 $0.4609 $0.4366 $0.4043

148
TABLE B.7c Small SUV, hydrogen FCEV, MY2020–2050; Figures 4.7 and ES-8
Lifetime Costs 2020 2025 2030 2035 2050
Vehicle $35,568 $34,515 $31,844 $31,419 $29,861
Financing $3,570 $3,465 $3,196 $3,154 $2,997
Fuel $30,528 $18,118 $14,784 $12,551 $10,980
Insurance $11,518 $11,495 $11,153 $11,144 $11,111
Maintenance $9,829 $9,829 $9,829 $9,829 $9,829
Repair $5,406 $5,288 $5,000 $4,955 $4,796
Tax & fees $6,856 $6,763 $6,527 $6,490 $6,352
Total $103,275 $89,474 $82,333 $79,542 $75,926
Per-Mile Costs 2020 2025 2030 2035 2050
Vehicle $0.1905 $0.1849 $0.1706 $0.1683 $0.1599
Financing $0.0191 $0.0186 $0.0171 $0.0169 $0.0161
Fuel $0.1635 $0.0970 $0.0792 $0.0672 $0.0588
Insurance $0.0617 $0.0616 $0.0597 $0.0597 $0.0595
Maintenance $0.0526 $0.0526 $0.0526 $0.0526 $0.0526
Repair $0.0290 $0.0283 $0.0268 $0.0265 $0.0257
Tax & fees $0.0367 $0.0362 $0.0350 $0.0348 $0.0340
Total $0.5531 $0.4792 $0.4410 $0.4260 $0.4067
TABLE B.7d Small SUV, gasoline ICEV, MY2020–2050; Figures 4.7 and ES-8
Lifetime Costs 2020 2025 2030 2035 2050
Vehicle $23,520 $26,051 $26,824 $27,154 $26,380
Financing $2,604 $2,884 $2,970 $3,006 $2,921
Fuel $20,931 $17,488 $15,451 $14,754 $14,009
Insurance $13,187 $13,289 $13,320 $13,334 $13,302
Maintenance $16,302 $16,302 $16,302 $16,302 $16,302
Repair $6,592 $6,990 $7,117 $7,171 $7,044
Tax & fees $4,998 $5,244 $5,320 $5,352 $5,276
Total $88,134 $88,248 $87,303 $87,071 $85,234
Per-Mile Costs 2020 2025 2030 2035 2050
Vehicle $0.1260 $0.1395 $0.1437 $0.1454 $0.1413
Financing $0.0139 $0.0154 $0.0159 $0.0161 $0.0156
Fuel $0.1121 $0.0937 $0.0828 $0.0790 $0.0750
Insurance $0.0706 $0.0712 $0.0713 $0.0714 $0.0712
Maintenance $0.0873 $0.0873 $0.0873 $0.0873 $0.0873
Repair $0.0353 $0.0374 $0.0381 $0.0384 $0.0377
Tax & fees $0.0268 $0.0281 $0.0285 $0.0287 $0.0283
Total $0.4721 $0.4727 $0.4676 $0.4664 $0.4565

149
TABLE B.7e Small SUV, gasoline/electric PHEV50, MY2020–2050; Figures 4.7 and ES-8
Lifetime Costs 2020 2025 2030 2035 2050
Vehicle $44,420 $34,505 $32,281 $31,443 $30,377
Financing $4,613 $3,584 $3,353 $3,266 $3,155
Fuel $14,168 $11,704 $11,195 $10,126 $8,788
Insurance $13,546 $12,667 $12,592 $12,563 $12,527
Maintenance $13,968 $13,968 $13,968 $13,968 $13,968
Repair $8,632 $6,959 $6,631 $6,511 $6,362
Tax & fees $7,261 $6,356 $6,153 $6,077 $5,980
Total $106,609 $89,743 $86,172 $83,954 $81,157
Per-Mile Costs 2020 2025 2030 2035 2050
Vehicle $0.2379 $0.1848 $0.1729 $0.1684 $0.1627
Financing $0.0247 $0.0192 $0.0180 $0.0175 $0.0169
Fuel $0.0759 $0.0627 $0.0600 $0.0542 $0.0471
Insurance $0.0726 $0.0678 $0.0674 $0.0673 $0.0671
Maintenance $0.0748 $0.0748 $0.0748 $0.0748 $0.0748
Repair $0.0462 $0.0373 $0.0355 $0.0349 $0.0341
Tax & fees $0.0389 $0.0340 $0.0330 $0.0325 $0.0320
Total $0.5710 $0.4807 $0.4615 $0.4497 $0.4347
TABLE B.7f Class 4 delivery truck, diesel HEV, MY2020–2050; Figure 4.7
Lifetime Costs 2020 2025 2030 2035 2050
Vehicle $40,616 $40,101 $38,959 $36,981 $37,566
Financing $6,505 $6,423 $6,240 $5,923 $6,017
Fuel $28,324 $22,821 $21,719 $20,254 $20,507
Insurance $26,358 $26,358 $26,358 $26,358 $26,358
M & R $37,598 $37,598 $37,598 $37,598 $37,598
Tax & fees $21,638 $21,564 $21,399 $21,114 $21,199
Payload $0 $0 $0 $0 $0
Labor $527,167 $527,167 $527,167 $527,167 $527,167
Total $688,206 $682,032 $679,440 $675,396 $676,412
Per-Mile Costs 2020 2025 2030 2035 2050
Vehicle $0.2841 $0.2805 $0.2725 $0.2586 $0.2627
Financing $0.0455 $0.0449 $0.0436 $0.0414 $0.0421
Fuel $0.1981 $0.1596 $0.1519 $0.1417 $0.1434
Insurance $0.1843 $0.1843 $0.1843 $0.1843 $0.1843
M & R $0.2630 $0.2630 $0.2630 $0.2630 $0.2630
Tax & fees $0.1513 $0.1508 $0.1497 $0.1477 $0.1483
Payload $0.0000 $0.0000 $0.0000 $0.0000 $0.0000
Labor $3.6869 $3.6869 $3.6869 $3.6869 $3.6869
Total $4.8132 $4.7700 $4.7519 $4.7236 $4.7307
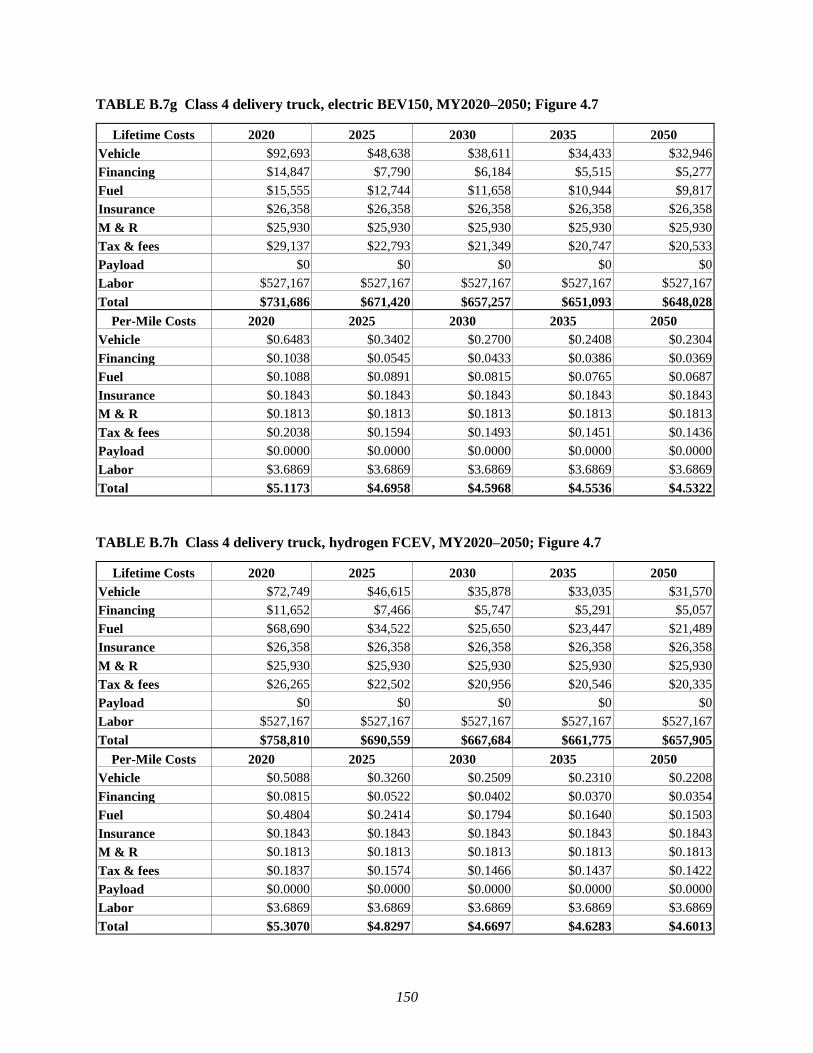
150
TABLE B.7g Class 4 delivery truck, electric BEV150, MY2020–2050; Figure 4.7
Lifetime Costs 2020 2025 2030 2035 2050
Vehicle $92,693 $48,638 $38,611 $34,433 $32,946
Financing $14,847 $7,790 $6,184 $5,515 $5,277
Fuel $15,555 $12,744 $11,658 $10,944 $9,817
Insurance $26,358 $26,358 $26,358 $26,358 $26,358
M & R $25,930 $25,930 $25,930 $25,930 $25,930
Tax & fees $29,137 $22,793 $21,349 $20,747 $20,533
Payload $0 $0 $0 $0 $0
Labor $527,167 $527,167 $527,167 $527,167 $527,167
Total $731,686 $671,420 $657,257 $651,093 $648,028
Per-Mile Costs 2020 2025 2030 2035 2050
Vehicle $0.6483 $0.3402 $0.2700 $0.2408 $0.2304
Financing $0.1038 $0.0545 $0.0433 $0.0386 $0.0369
Fuel $0.1088 $0.0891 $0.0815 $0.0765 $0.0687
Insurance $0.1843 $0.1843 $0.1843 $0.1843 $0.1843
M & R $0.1813 $0.1813 $0.1813 $0.1813 $0.1813
Tax & fees $0.2038 $0.1594 $0.1493 $0.1451 $0.1436
Payload $0.0000 $0.0000 $0.0000 $0.0000 $0.0000
Labor $3.6869 $3.6869 $3.6869 $3.6869 $3.6869
Total $5.1173 $4.6958 $4.5968 $4.5536 $4.5322
TABLE B.7h Class 4 delivery truck, hydrogen FCEV, MY2020–2050; Figure 4.7
Lifetime Costs 2020 2025 2030 2035 2050
Vehicle $72,749 $46,615 $35,878 $33,035 $31,570
Financing $11,652 $7,466 $5,747 $5,291 $5,057
Fuel $68,690 $34,522 $25,650 $23,447 $21,489
Insurance $26,358 $26,358 $26,358 $26,358 $26,358
M & R $25,930 $25,930 $25,930 $25,930 $25,930
Tax & fees $26,265 $22,502 $20,956 $20,546 $20,335
Payload $0 $0 $0 $0 $0
Labor $527,167 $527,167 $527,167 $527,167 $527,167
Total $758,810 $690,559 $667,684 $661,775 $657,905
Per-Mile Costs 2020 2025 2030 2035 2050
Vehicle $0.5088 $0.3260 $0.2509 $0.2310 $0.2208
Financing $0.0815 $0.0522 $0.0402 $0.0370 $0.0354
Fuel $0.4804 $0.2414 $0.1794 $0.1640 $0.1503
Insurance $0.1843 $0.1843 $0.1843 $0.1843 $0.1843
M & R $0.1813 $0.1813 $0.1813 $0.1813 $0.1813
Tax & fees $0.1837 $0.1574 $0.1466 $0.1437 $0.1422
Payload $0.0000 $0.0000 $0.0000 $0.0000 $0.0000
Labor $3.6869 $3.6869 $3.6869 $3.6869 $3.6869
Total $5.3070 $4.8297 $4.6697 $4.6283 $4.6013
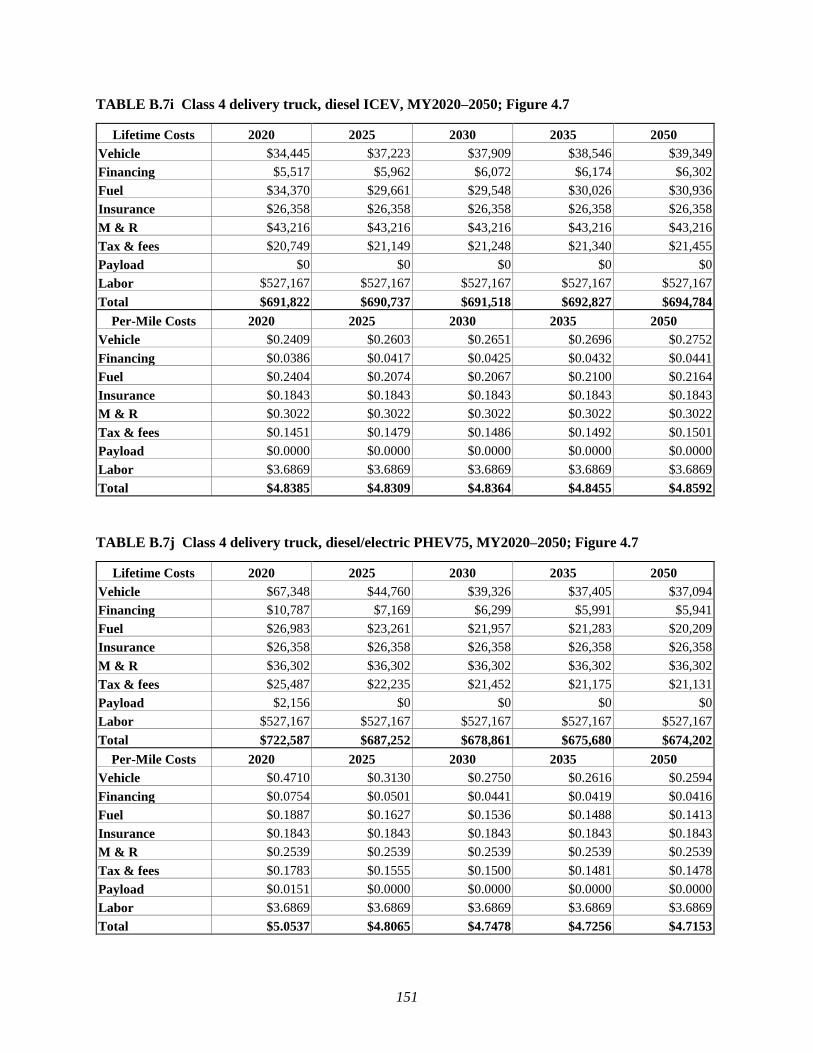
151
TABLE B.7i Class 4 delivery truck, diesel ICEV, MY2020–2050; Figure 4.7
Lifetime Costs 2020 2025 2030 2035 2050
Vehicle $34,445 $37,223 $37,909 $38,546 $39,349
Financing $5,517 $5,962 $6,072 $6,174 $6,302
Fuel $34,370 $29,661 $29,548 $30,026 $30,936
Insurance $26,358 $26,358 $26,358 $26,358 $26,358
M & R $43,216 $43,216 $43,216 $43,216 $43,216
Tax & fees $20,749 $21,149 $21,248 $21,340 $21,455
Payload $0 $0 $0 $0 $0
Labor $527,167 $527,167 $527,167 $527,167 $527,167
Total $691,822 $690,737 $691,518 $692,827 $694,784
Per-Mile Costs 2020 2025 2030 2035 2050
Vehicle $0.2409 $0.2603 $0.2651 $0.2696 $0.2752
Financing $0.0386 $0.0417 $0.0425 $0.0432 $0.0441
Fuel $0.2404 $0.2074 $0.2067 $0.2100 $0.2164
Insurance $0.1843 $0.1843 $0.1843 $0.1843 $0.1843
M & R $0.3022 $0.3022 $0.3022 $0.3022 $0.3022
Tax & fees $0.1451 $0.1479 $0.1486 $0.1492 $0.1501
Payload $0.0000 $0.0000 $0.0000 $0.0000 $0.0000
Labor $3.6869 $3.6869 $3.6869 $3.6869 $3.6869
Total $4.8385 $4.8309 $4.8364 $4.8455 $4.8592
TABLE B.7j Class 4 delivery truck, diesel/electric PHEV75, MY2020–2050; Figure 4.7
Lifetime Costs 2020 2025 2030 2035 2050
Vehicle $67,348 $44,760 $39,326 $37,405 $37,094
Financing $10,787 $7,169 $6,299 $5,991 $5,941
Fuel $26,983 $23,261 $21,957 $21,283 $20,209
Insurance $26,358 $26,358 $26,358 $26,358 $26,358
M & R $36,302 $36,302 $36,302 $36,302 $36,302
Tax & fees $25,487 $22,235 $21,452 $21,175 $21,131
Payload $2,156 $0 $0 $0 $0
Labor $527,167 $527,167 $527,167 $527,167 $527,167
Total $722,587 $687,252 $678,861 $675,680 $674,202
Per-Mile Costs 2020 2025 2030 2035 2050
Vehicle $0.4710 $0.3130 $0.2750 $0.2616 $0.2594
Financing $0.0754 $0.0501 $0.0441 $0.0419 $0.0416
Fuel $0.1887 $0.1627 $0.1536 $0.1488 $0.1413
Insurance $0.1843 $0.1843 $0.1843 $0.1843 $0.1843
M & R $0.2539 $0.2539 $0.2539 $0.2539 $0.2539
Tax & fees $0.1783 $0.1555 $0.1500 $0.1481 $0.1478
Payload $0.0151 $0.0000 $0.0000 $0.0000 $0.0000
Labor $3.6869 $3.6869 $3.6869 $3.6869 $3.6869
Total $5.0537 $4.8065 $4.7478 $4.7256 $4.7153

152
TABLE B.8a Class 8 sleeper cab tractor, diesel HEV, MY2020–2050; Figure 4.8
Lifetime Costs 2020 2025 2030 2035 2050
Vehicle $134,709 $137,834 $139,019 $142,223 $146,127
Financing $15,364 $15,721 $15,856 $16,221 $16,667
Fuel $376,717 $318,297 $303,077 $291,275 $291,150
Insurance $68,566 $68,982 $69,140 $69,566 $70,086
M & R $159,710 $159,710 $159,710 $159,710 $159,710
Tax & fees $91,732 $92,510 $92,805 $93,603 $94,575
Payload $5,899 $747 $0 $0 $0
Labor $618,509 $618,509 $618,509 $618,509 $618,509
Total $1,471,207 $1,412,311 $1,398,116 $1,391,108 $1,396,824
Per-Mile Costs 2020 2025 2030 2035 2050
Vehicle $0.1721 $0.1760 $0.1776 $0.1816 $0.1866
Financing $0.0196 $0.0201 $0.0203 $0.0207 $0.0213
Fuel $0.4811 $0.4065 $0.3871 $0.3720 $0.3719
Insurance $0.0876 $0.0881 $0.0883 $0.0889 $0.0895
M & R $0.2040 $0.2040 $0.2040 $0.2040 $0.2040
Tax & fees $0.1172 $0.1182 $0.1185 $0.1196 $0.1208
Payload $0.0075 $0.0010 $0.0000 $0.0000 $0.0000
Labor $0.7900 $0.7900 $0.7900 $0.7900 $0.7900
Total $1.8790 $1.8038 $1.7857 $1.7767 $1.7840
TABLE B.8b Class 8 sleeper cab tractor, electric BEV500, MY2020–2050; Figure 4.8
Lifetime Costs 2020 2025 2030 2035 2050
Vehicle $777,681 $341,088 $236,096 $189,322 $173,091
Financing $88,699 $38,903 $26,928 $21,593 $19,742
Fuel $316,266 $258,583 $233,901 $214,088 $190,829
Insurance $154,193 $96,050 $82,068 $75,839 $73,677
M & R $110,145 $110,145 $110,145 $110,145 $110,145
Tax & fees $251,859 $143,129 $116,982 $105,333 $101,291
Payload $419,357 $77,972 $15,137 $5,407 $1,686
Labor $618,509 $618,509 $618,509 $618,509 $618,509
Total $2,736,709 $1,684,380 $1,439,766 $1,340,236 $1,288,968
Per-Mile Costs 2020 2025 2030 2035 2050
Vehicle $0.9933 $0.4356 $0.3015 $0.2418 $0.2211
Financing $0.1133 $0.0497 $0.0344 $0.0276 $0.0252
Fuel $0.4039 $0.3303 $0.2987 $0.2734 $0.2437
Insurance $0.1969 $0.1227 $0.1048 $0.0969 $0.0941
Maintenance $0.1407 $0.1407 $0.1407 $0.1407 $0.1407
Tax & fees $0.3217 $0.1828 $0.1494 $0.1345 $0.1294
Payload $0.5356 $0.0996 $0.0193 $0.0069 $0.0022
Labor $0.7900 $0.7900 $0.7900 $0.7900 $0.7900
Total $3.4954 $2.1513 $1.8389 $1.7118 $1.6463

153
TABLE B.8c Class 8 sleeper cab tractor, hydrogen FCEV, MY2020–2050; Figure 4.8
Lifetime Costs 2020 2025 2030 2035 2050
Vehicle $294,489 $191,000 $147,198 $135,036 $129,165
Financing $33,588 $21,785 $16,789 $15,402 $14,732
Fuel $1,311,377 $669,896 $493,030 $445,609 $390,896
Insurance $89,844 $76,062 $70,229 $68,609 $67,827
M & R $110,145 $110,145 $110,145 $110,145 $110,145
Tax & fees $131,524 $105,751 $94,842 $91,813 $90,351
Payload $52,170 $8,595 $0 $0 $0
Labor $618,509 $618,509 $618,509 $618,509 $618,509
Total $2,641,646 $1,801,742 $1,550,743 $1,485,123 $1,421,626
Per-Mile Costs 2020 2025 2030 2035 2050
Vehicle $0.3761 $0.2439 $0.1880 $0.1725 $0.1650
Financing $0.0429 $0.0278 $0.0214 $0.0197 $0.0188
Fuel $1.6749 $0.8556 $0.6297 $0.5691 $0.4993
Insurance $0.1148 $0.0971 $0.0897 $0.0876 $0.0866
M & R $0.1407 $0.1407 $0.1407 $0.1407 $0.1407
Tax & fees $0.1680 $0.1351 $0.1211 $0.1173 $0.1154
Payload $0.0666 $0.0110 $0.0000 $0.0000 $0.0000
Labor $0.7900 $0.7900 $0.7900 $0.7900 $0.7900
Total $3.3739 $2.3012 $1.9806 $1.8968 $1.8157
TABLE B.8d Class 8 sleeper cab tractor, diesel ICEV, MY2020–2050; Figure 4.8
Lifetime Costs 2020 2025 2030 2035 2050
Vehicle $124,630 $129,699 $132,853 $136,780 $141,718
Financing $14,215 $14,793 $15,153 $15,601 $16,164
Fuel $370,985 $318,806 $305,272 $294,923 $295,865
Insurance $67,223 $67,898 $68,318 $68,841 $69,499
M & R $183,575 $183,575 $183,575 $183,575 $183,575
Tax & fees $89,222 $90,484 $91,270 $92,248 $93,477
Payload $0 $0 $0 $0 $0
Labor $618,509 $618,509 $618,509 $618,509 $618,509
Total $1,468,360 $1,423,765 $1,414,950 $1,410,477 $1,418,807
Per-Mile Costs 2020 2025 2030 2035 2050
Vehicle $0.1592 $0.1657 $0.1697 $0.1747 $0.1810
Financing $0.0182 $0.0189 $0.0194 $0.0199 $0.0206
Fuel $0.4738 $0.4072 $0.3899 $0.3767 $0.3779
Insurance $0.0859 $0.0867 $0.0873 $0.0879 $0.0888
M & R $0.2345 $0.2345 $0.2345 $0.2345 $0.2345
Tax & fees $0.1140 $0.1156 $0.1166 $0.1178 $0.1194
Payload $0.0000 $0.0000 $0.0000 $0.0000 $0.0000
Labor $0.7900 $0.7900 $0.7900 $0.7900 $0.7900
Total $1.8754 $1.8185 $1.8072 $1.8015 $1.8121

154
TABLE B.8e Class 8 sleeper cab tractor, diesel/electric PHEV250, MY2020–2050; Figure 4.8
Lifetime Costs 2020 2025 2030 2035 2050
Vehicle $465,573 $236,316 $181,651 $159,116 $152,517
Financing $53,102 $26,953 $20,718 $18,148 $17,396
Fuel $435,472 $345,926 $310,102 $287,559 $272,314
Insurance $112,628 $82,097 $74,817 $71,816 $70,937
M & R $154,203 $154,203 $154,203 $154,203 $154,203
Tax & fees $174,131 $117,036 $103,422 $97,810 $96,167
Payload $240,692 $78,947 $36,362 $25,871 $20,234
Labor $618,509 $618,509 $618,509 $618,509 $618,509
Total $2,254,310 $1,659,988 $1,499,785 $1,433,032 $1,402,276
Per-Mile Costs 2020 2025 2030 2035 2050
Vehicle $0.5946 $0.3018 $0.2320 $0.2032 $0.1948
Financing $0.0678 $0.0344 $0.0265 $0.0232 $0.0222
Fuel $0.5562 $0.4418 $0.3961 $0.3673 $0.3478
Insurance $0.1439 $0.1049 $0.0956 $0.0917 $0.0906
M & R $0.1970 $0.1970 $0.1970 $0.1970 $0.1970
Tax & fees $0.2224 $0.1495 $0.1321 $0.1249 $0.1228
Payload $0.3074 $0.1008 $0.0464 $0.0330 $0.0258
Labor $0.7900 $0.7900 $0.7900 $0.7900 $0.7900
Total $2.8792 $2.1202 $1.9155 $1.8303 $1.7910
TABLE B.8f Class 8 day cab tractor, diesel HEV, MY2020–2050; Figures 4.8 and ES-8
Lifetime Costs 2020 2025 2030 2035 2050
Vehicle $101,664 $102,594 $104,167 $106,848 $113,076
Financing $12,449 $12,563 $12,755 $13,083 $13,846
Fuel $258,992 $209,582 $199,272 $192,058 $193,009
Insurance $50,500 $50,658 $50,925 $51,381 $52,439
M & R $105,348 $105,348 $105,348 $105,348 $105,348
Tax & fees $70,568 $70,817 $71,238 $71,954 $73,620
Payload $3,362 $0 $0 $0 $0
Labor $405,871 $405,871 $405,871 $405,871 $405,871
Total $1,008,754 $957,433 $949,576 $946,543 $957,210
Per-Mile Costs 2020 2025 2030 2035 2050
Vehicle $0.1979 $0.1997 $0.2027 $0.2080 $0.2201
Financing $0.0242 $0.0245 $0.0248 $0.0255 $0.0269
Fuel $0.5041 $0.4079 $0.3879 $0.3738 $0.3757
Insurance $0.0983 $0.0986 $0.0991 $0.1000 $0.1021
M & R $0.2050 $0.2050 $0.2050 $0.2050 $0.2050
Tax & fees $0.1374 $0.1378 $0.1387 $0.1400 $0.1433
Payload $0.0065 $0.0000 $0.0000 $0.0000 $0.0000
Labor $0.7900 $0.7900 $0.7900 $0.7900 $0.7900
Total $1.9634 $1.8635 $1.8482 $1.8423 $1.8631

155
TABLE B.8g Class 8 day cab tractor, electric BEV250, MY2020–2050; Figures 4.8 and ES-8
Lifetime Costs 2020 2025 2030 2035 2050
Vehicle $409,108 $189,365 $140,393 $119,996 $113,370
Financing $50,095 $23,187 $17,191 $14,693 $13,882
Fuel $202,193 $161,522 $148,040 $135,941 $121,197
Insurance $102,753 $65,405 $57,082 $53,616 $52,489
M & R $72,654 $72,654 $72,654 $72,654 $72,654
Tax & fees $152,768 $94,017 $80,923 $75,470 $73,698
Payload $47,064 $0 $0 $0 $0
Labor $405,871 $405,871 $405,871 $405,871 $405,871
Total $1,442,507 $1,012,022 $922,153 $878,241 $853,161
Per-Mile Costs 2020 2025 2030 2035 2050
Vehicle $0.7963 $0.3686 $0.2733 $0.2336 $0.2207
Financing $0.0975 $0.0451 $0.0335 $0.0286 $0.0270
Fuel $0.3935 $0.3144 $0.2881 $0.2646 $0.2359
Insurance $0.2000 $0.1273 $0.1111 $0.1044 $0.1022
M & R $0.1414 $0.1414 $0.1414 $0.1414 $0.1414
Tax & fees $0.2973 $0.1830 $0.1575 $0.1469 $0.1434
Payload $0.0916 $0.0000 $0.0000 $0.0000 $0.0000
Labor $0.7900 $0.7900 $0.7900 $0.7900 $0.7900
Total $2.8076 $1.9698 $1.7948 $1.7094 $1.6606
TABLE B.8h Class 8 day cab tractor, hydrogen FCEV, MY2020–2050; Figures 4.8 and ES-8
Lifetime Costs 2020 2025 2030 2035 2050
Vehicle $238,600 $151,759 $114,871 $106,306 $100,209
Financing $29,216 $18,583 $14,066 $13,017 $12,270
Fuel $913,227 $446,172 $329,640 $299,455 $259,322
Insurance $73,773 $59,014 $52,744 $51,289 $50,253
M & R $72,654 $72,654 $72,654 $72,654 $72,654
Tax & fees $107,180 $83,962 $74,099 $71,809 $70,179
Payload $20,204 $0 $0 $0 $0
Labor $405,871 $405,871 $405,871 $405,871 $405,871
Total $1,860,726 $1,238,013 $1,063,945 $1,020,402 $970,758
Per-Mile Costs 2020 2025 2030 2035 2050
Vehicle $0.4644 $0.2954 $0.2236 $0.2069 $0.1950
Financing $0.0569 $0.0362 $0.0274 $0.0253 $0.0239
Fuel $1.7775 $0.8684 $0.6416 $0.5828 $0.5047
Insurance $0.1436 $0.1149 $0.1027 $0.0998 $0.0978
M & R $0.1414 $0.1414 $0.1414 $0.1414 $0.1414
Tax & fees $0.2086 $0.1634 $0.1442 $0.1398 $0.1366
Payload $0.0393 $0.0000 $0.0000 $0.0000 $0.0000
Labor $0.7900 $0.7900 $0.7900 $0.7900 $0.7900
Total $3.6216 $2.4096 $2.0708 $1.9861 $1.8894
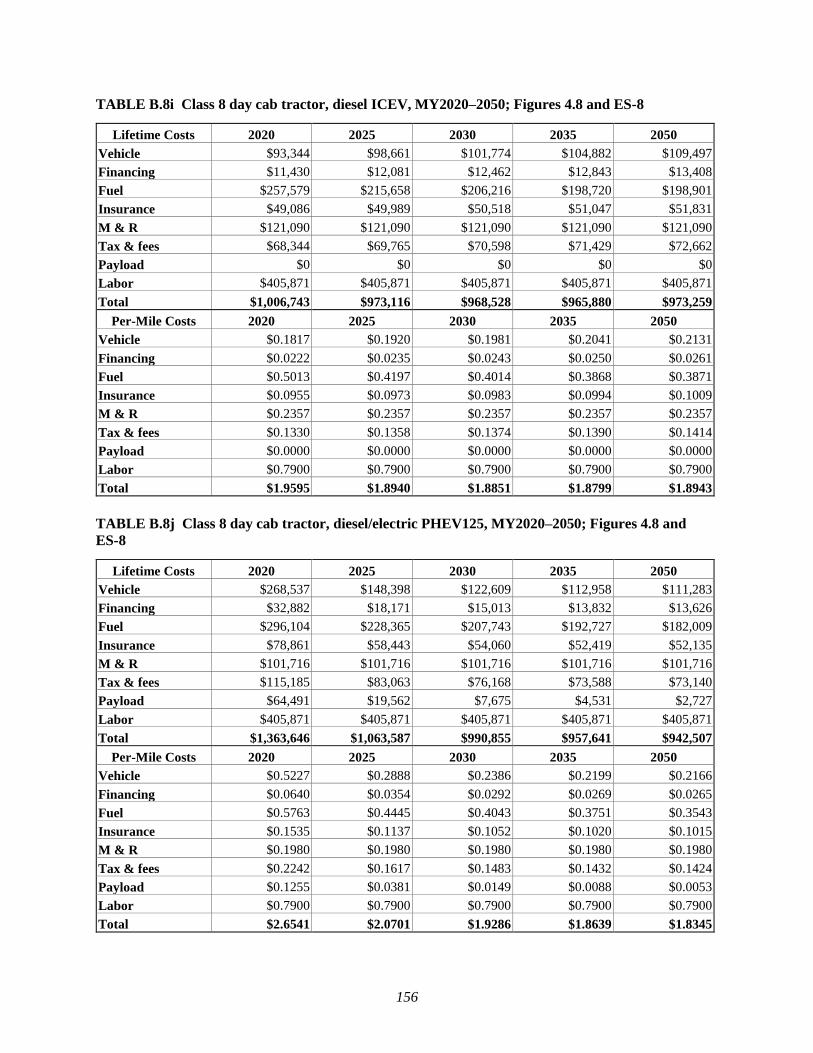
156
TABLE B.8i Class 8 day cab tractor, diesel ICEV, MY2020–2050; Figures 4.8 and ES-8
Lifetime Costs 2020 2025 2030 2035 2050
Vehicle $93,344 $98,661 $101,774 $104,882 $109,497
Financing $11,430 $12,081 $12,462 $12,843 $13,408
Fuel $257,579 $215,658 $206,216 $198,720 $198,901
Insurance $49,086 $49,989 $50,518 $51,047 $51,831
M & R $121,090 $121,090 $121,090 $121,090 $121,090
Tax & fees $68,344 $69,765 $70,598 $71,429 $72,662
Payload $0 $0 $0 $0 $0
Labor $405,871 $405,871 $405,871 $405,871 $405,871
Total $1,006,743 $973,116 $968,528 $965,880 $973,259
Per-Mile Costs 2020 2025 2030 2035 2050
Vehicle $0.1817 $0.1920 $0.1981 $0.2041 $0.2131
Financing $0.0222 $0.0235 $0.0243 $0.0250 $0.0261
Fuel $0.5013 $0.4197 $0.4014 $0.3868 $0.3871
Insurance $0.0955 $0.0973 $0.0983 $0.0994 $0.1009
M & R $0.2357 $0.2357 $0.2357 $0.2357 $0.2357
Tax & fees $0.1330 $0.1358 $0.1374 $0.1390 $0.1414
Payload $0.0000 $0.0000 $0.0000 $0.0000 $0.0000
Labor $0.7900 $0.7900 $0.7900 $0.7900 $0.7900
Total $1.9595 $1.8940 $1.8851 $1.8799 $1.8943
TABLE B.8j Class 8 day cab tractor, diesel/electric PHEV125, MY2020–2050; Figures 4.8 and
ES-8
Lifetime Costs 2020 2025 2030 2035 2050
Vehicle $268,537 $148,398 $122,609 $112,958 $111,283
Financing $32,882 $18,171 $15,013 $13,832 $13,626
Fuel $296,104 $228,365 $207,743 $192,727 $182,009
Insurance $78,861 $58,443 $54,060 $52,419 $52,135
M & R $101,716 $101,716 $101,716 $101,716 $101,716
Tax & fees $115,185 $83,063 $76,168 $73,588 $73,140
Payload $64,491 $19,562 $7,675 $4,531 $2,727
Labor $405,871 $405,871 $405,871 $405,871 $405,871
Total $1,363,646 $1,063,587 $990,855 $957,641 $942,507
Per-Mile Costs 2020 2025 2030 2035 2050
Vehicle $0.5227 $0.2888 $0.2386 $0.2199 $0.2166
Financing $0.0640 $0.0354 $0.0292 $0.0269 $0.0265
Fuel $0.5763 $0.4445 $0.4043 $0.3751 $0.3543
Insurance $0.1535 $0.1137 $0.1052 $0.1020 $0.1015
M & R $0.1980 $0.1980 $0.1980 $0.1980 $0.1980
Tax & fees $0.2242 $0.1617 $0.1483 $0.1432 $0.1424
Payload $0.1255 $0.0381 $0.0149 $0.0088 $0.0053
Labor $0.7900 $0.7900 $0.7900 $0.7900 $0.7900
Total $2.6541 $2.0701 $1.9286 $1.8639 $1.8345
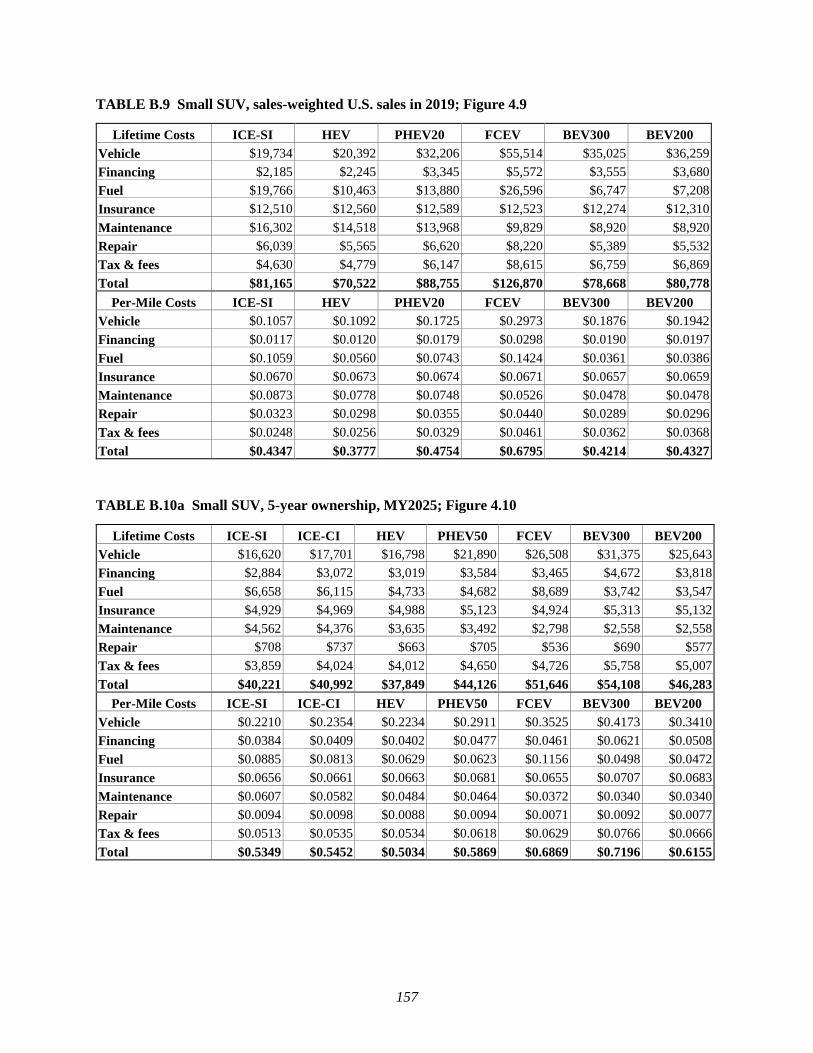
157
TABLE B.9 Small SUV, sales-weighted U.S. sales in 2019; Figure 4.9
Lifetime Costs ICE-SI HEV PHEV20 FCEV BEV300 BEV200
Vehicle $19,734 $20,392 $32,206 $55,514 $35,025 $36,259
Financing $2,185 $2,245 $3,345 $5,572 $3,555 $3,680
Fuel $19,766 $10,463 $13,880 $26,596 $6,747 $7,208
Insurance $12,510 $12,560 $12,589 $12,523 $12,274 $12,310
Maintenance $16,302 $14,518 $13,968 $9,829 $8,920 $8,920
Repair $6,039 $5,565 $6,620 $8,220 $5,389 $5,532
Tax & fees $4,630 $4,779 $6,147 $8,615 $6,759 $6,869
Total $81,165 $70,522 $88,755 $126,870 $78,668 $80,778
Per-Mile Costs ICE-SI HEV PHEV20 FCEV BEV300 BEV200
Vehicle $0.1057 $0.1092 $0.1725 $0.2973 $0.1876 $0.1942
Financing $0.0117 $0.0120 $0.0179 $0.0298 $0.0190 $0.0197
Fuel $0.1059 $0.0560 $0.0743 $0.1424 $0.0361 $0.0386
Insurance $0.0670 $0.0673 $0.0674 $0.0671 $0.0657 $0.0659
Maintenance $0.0873 $0.0778 $0.0748 $0.0526 $0.0478 $0.0478
Repair $0.0323 $0.0298 $0.0355 $0.0440 $0.0289 $0.0296
Tax & fees $0.0248 $0.0256 $0.0329 $0.0461 $0.0362 $0.0368
Total $0.4347 $0.3777 $0.4754 $0.6795 $0.4214 $0.4327
TABLE B.10a Small SUV, 5-year ownership, MY2025; Figure 4.10
Lifetime Costs ICE-SI ICE-CI HEV PHEV50 FCEV BEV300 BEV200
Vehicle $16,620 $17,701 $16,798 $21,890 $26,508 $31,375 $25,643
Financing $2,884 $3,072 $3,019 $3,584 $3,465 $4,672 $3,818
Fuel $6,658 $6,115 $4,733 $4,682 $8,689 $3,742 $3,547
Insurance $4,929 $4,969 $4,988 $5,123 $4,924 $5,313 $5,132
Maintenance $4,562 $4,376 $3,635 $3,492 $2,798 $2,558 $2,558
Repair $708 $737 $663 $705 $536 $690 $577
Tax & fees $3,859 $4,024 $4,012 $4,650 $4,726 $5,758 $5,007
Total $40,221 $40,992 $37,849 $44,126 $51,646 $54,108 $46,283
Per-Mile Costs ICE-SI ICE-CI HEV PHEV50 FCEV BEV300 BEV200
Vehicle $0.2210 $0.2354 $0.2234 $0.2911 $0.3525 $0.4173 $0.3410
Financing $0.0384 $0.0409 $0.0402 $0.0477 $0.0461 $0.0621 $0.0508
Fuel $0.0885 $0.0813 $0.0629 $0.0623 $0.1156 $0.0498 $0.0472
Insurance $0.0656 $0.0661 $0.0663 $0.0681 $0.0655 $0.0707 $0.0683
Maintenance $0.0607 $0.0582 $0.0484 $0.0464 $0.0372 $0.0340 $0.0340
Repair $0.0094 $0.0098 $0.0088 $0.0094 $0.0071 $0.0092 $0.0077
Tax & fees $0.0513 $0.0535 $0.0534 $0.0618 $0.0629 $0.0766 $0.0666
Total $0.5349 $0.5452 $0.5034 $0.5869 $0.6869 $0.7196 $0.6155
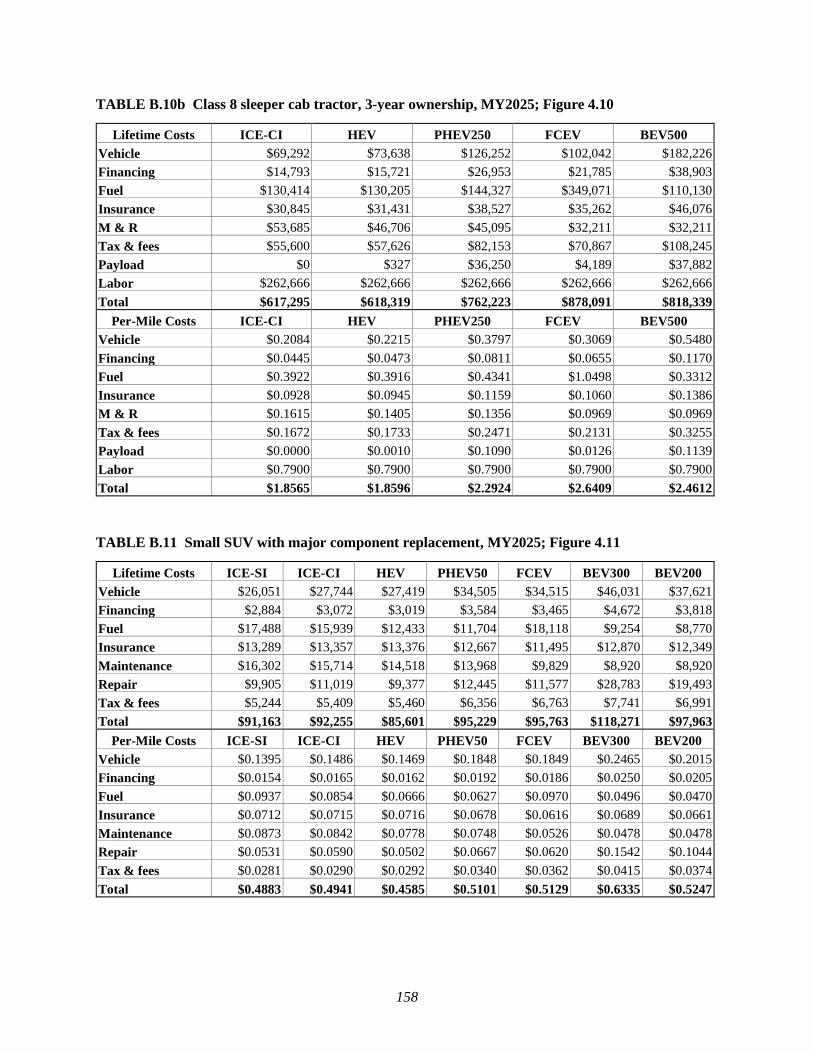
158
TABLE B.10b Class 8 sleeper cab tractor, 3-year ownership, MY2025; Figure 4.10
Lifetime Costs ICE-CI HEV PHEV250 FCEV BEV500
Vehicle $69,292 $73,638 $126,252 $102,042 $182,226
Financing $14,793 $15,721 $26,953 $21,785 $38,903
Fuel $130,414 $130,205 $144,327 $349,071 $110,130
Insurance $30,845 $31,431 $38,527 $35,262 $46,076
M & R $53,685 $46,706 $45,095 $32,211 $32,211
Tax & fees $55,600 $57,626 $82,153 $70,867 $108,245
Payload $0 $327 $36,250 $4,189 $37,882
Labor $262,666 $262,666 $262,666 $262,666 $262,666
Total $617,295 $618,319 $762,223 $878,091 $818,339
Per-Mile Costs ICE-CI HEV PHEV250 FCEV BEV500
Vehicle $0.2084 $0.2215 $0.3797 $0.3069 $0.5480
Financing $0.0445 $0.0473 $0.0811 $0.0655 $0.1170
Fuel $0.3922 $0.3916 $0.4341 $1.0498 $0.3312
Insurance $0.0928 $0.0945 $0.1159 $0.1060 $0.1386
M & R $0.1615 $0.1405 $0.1356 $0.0969 $0.0969
Tax & fees $0.1672 $0.1733 $0.2471 $0.2131 $0.3255
Payload $0.0000 $0.0010 $0.1090 $0.0126 $0.1139
Labor $0.7900 $0.7900 $0.7900 $0.7900 $0.7900
Total $1.8565 $1.8596 $2.2924 $2.6409 $2.4612
TABLE B.11 Small SUV with major component replacement, MY2025; Figure 4.11
Lifetime Costs ICE-SI ICE-CI HEV PHEV50 FCEV BEV300 BEV200
Vehicle $26,051 $27,744 $27,419 $34,505 $34,515 $46,031 $37,621
Financing $2,884 $3,072 $3,019 $3,584 $3,465 $4,672 $3,818
Fuel $17,488 $15,939 $12,433 $11,704 $18,118 $9,254 $8,770
Insurance $13,289 $13,357 $13,376 $12,667 $11,495 $12,870 $12,349
Maintenance $16,302 $15,714 $14,518 $13,968 $9,829 $8,920 $8,920
Repair $9,905 $11,019 $9,377 $12,445 $11,577 $28,783 $19,493
Tax & fees $5,244 $5,409 $5,460 $6,356 $6,763 $7,741 $6,991
Total $91,163 $92,255 $85,601 $95,229 $95,763 $118,271 $97,963
Per-Mile Costs ICE-SI ICE-CI HEV PHEV50 FCEV BEV300 BEV200
Vehicle $0.1395 $0.1486 $0.1469 $0.1848 $0.1849 $0.2465 $0.2015
Financing $0.0154 $0.0165 $0.0162 $0.0192 $0.0186 $0.0250 $0.0205
Fuel $0.0937 $0.0854 $0.0666 $0.0627 $0.0970 $0.0496 $0.0470
Insurance $0.0712 $0.0715 $0.0716 $0.0678 $0.0616 $0.0689 $0.0661
Maintenance $0.0873 $0.0842 $0.0778 $0.0748 $0.0526 $0.0478 $0.0478
Repair $0.0531 $0.0590 $0.0502 $0.0667 $0.0620 $0.1542 $0.1044
Tax & fees $0.0281 $0.0290 $0.0292 $0.0340 $0.0362 $0.0415 $0.0374
Total $0.4883 $0.4941 $0.4585 $0.5101 $0.5129 $0.6335 $0.5247

159
TABLE B.12 Small SUV taxicab, MY2025; Figure 4.12
Lifetime Costs ICE-SI ICE-CI HEV PHEV50 FCEV BEV300 BEV200
Vehicle $29,481 $31,397 $30,860 $36,631 $35,414 $47,753 $39,028
Financing $2,884 $3,072 $3,019 $3,584 $3,465 $4,672 $3,818
Fuel $24,067 $22,116 $17,110 $16,969 $32,755 $13,570 $12,860
Insurance $15,361 $15,430 $15,448 $14,739 $13,567 $14,942 $14,422
Maintenance $24,857 $23,989 $22,905 $21,672 $15,823 $14,367 $14,367
Repair $2,087 $2,171 $1,954 $2,078 $1,579 $2,033 $1,700
Tax & fees $5,244 $5,409 $5,460 $6,356 $6,763 $7,741 $6,991
Total $103,982 $103,584 $96,756 $102,029 $109,366 $105,078 $93,187
Per-Mile Costs ICE-SI ICE-CI HEV PHEV50 FCEV BEV300 BEV200
Vehicle $0.1081 $0.1152 $0.1132 $0.1343 $0.1299 $0.1751 $0.1431
Financing $0.0106 $0.0113 $0.0111 $0.0131 $0.0127 $0.0171 $0.0140
Fuel $0.0883 $0.0811 $0.0628 $0.0622 $0.1201 $0.0498 $0.0472
Insurance $0.0563 $0.0566 $0.0567 $0.0541 $0.0498 $0.0548 $0.0529
Maintenance $0.0912 $0.0880 $0.0840 $0.0795 $0.0580 $0.0527 $0.0527
Repair $0.0077 $0.0080 $0.0072 $0.0076 $0.0058 $0.0075 $0.0062
Tax & fees $0.0192 $0.0198 $0.0200 $0.0233 $0.0248 $0.0284 $0.0256
Total $0.3814 $0.3799 $0.3549 $0.3742 $0.4011 $0.3854 $0.3418
TABLE B.13 Class 8 sleeper cab tractor with fueling time costs, MY2025; Figure 4.13
Lifetime Costs ICE-CI BEV, 50 kW BEV, 200 kW BEV, 400 kW BEV, 1 MW BEV, 2 MW
Vehicle $129,699 $341,088 $341,088 $341,088 $341,088 $341,088
Financing $14,793 $38,903 $38,903 $38,903 $38,903 $38,903
Fuel $318,806 $258,583 $258,583 $258,583 $258,583 $258,583
Insurance $67,898 $96,050 $96,050 $96,050 $96,050 $96,050
M & R $183,575 $110,145 $110,145 $110,145 $110,145 $110,145
Tax & fees $90,484 $143,129 $143,129 $143,129 $143,129 $143,129
Payload $0 $137,918 $92,959 $85,465 $80,970 $79,471
Labor $619,561 $1,853,517 $927,261 $772,885 $680,259 $649,384
Total $1,424,817 $2,979,334 $2,008,118 $1,846,249 $1,749,128 $1,716,754
Per-Mile Costs ICE-CI BEV, 50 kW BEV, 200 kW BEV, 400 kW BEV, 1 MW BEV, 2 MW
Vehicle $0.1657 $0.4356 $0.4356 $0.4356 $0.4356 $0.4356
Financing $0.0189 $0.0497 $0.0497 $0.0497 $0.0497 $0.0497
Fuel $0.4072 $0.3303 $0.3303 $0.3303 $0.3303 $0.3303
Insurance $0.0867 $0.1227 $0.1227 $0.1227 $0.1227 $0.1227
M & R $0.2345 $0.1407 $0.1407 $0.1407 $0.1407 $0.1407
Tax & fees $0.1156 $0.1828 $0.1828 $0.1828 $0.1828 $0.1828
Payload $0.0000 $0.1762 $0.1187 $0.1092 $0.1034 $0.1015
Labor $0.7913 $2.3673 $1.1843 $0.9871 $0.8688 $0.8294
Total $1.8198 $3.8052 $2.5648 $2.3581 $2.2340 $2.1927

160
APPENDIX C: ADDITIONAL SENSITIVITY ANALYSES
This section presents additional sensitivity analyses with different baseline vehicles than
those presented in Section 4.3. For LDV, the side cases are presented in Table 4.1, while side
cases for MHDV are presented in Table 4.2.
Figures C.1 through C.3 show tornado charts for MY2025 small SUV, assuming a
baseline vehicle ownership of five years. These are similar to those for fifteen year, though
early-year costs are increased in importance. The ‘residual value’ term represents scrapping the
vehicle at the end of the analysis window; this is an unlikely case as sale to a second owner is
much more economical.
FIGURE C.1 Tornado chart for LCOD of MY2025 small SUV ICEV, 5 year analysis window
$0.00 $0.10 $0.20 $0.30 $0.40 $0.50 $0.60 $0.70 $0.80 $0.90 $1.00
EVSE costs
PEV tax credit
BEV range
Battery costs
Gasoline blend
Discount rate
Liability ins.
Tech progress
Maintenance
Vehicle size
Depreciation
Used vehicle
Fuel prices
Finance rate
Ownership time
Retail markup
Residual value
Driving distance
LCOD MY25 ICEV small SUV, 5 yr ownership

161
FIGURE C.2 Tornado chart for LCOD of MY2025 small SUV HEV, 5 year analysis window
FIGURE C.3 Tornado chart for LCOD of MY2025 small SUV BEV, 5 year analysis window
$0.00 $0.10 $0.20 $0.30 $0.40 $0.50 $0.60 $0.70 $0.80 $0.90 $1.00
EVSE costs
PEV tax credit
BEV range
Battery costs
Gasoline blend
Discount rate
Liability ins.
Vehicle size
Luxury vehicle
Maintenance
Tech progress
Fuel prices
Used vehicle
Depreciation
Finance rate
Ownership time
Retail markup
Residual value
Driving distance
LCOD MY25 HEV small SUV, 5 yr ownership
$0.00 $0.20 $0.40 $0.60 $0.80 $1.00 $1.20 $1.40
Gasoline blend
EVSE costs
Liability ins.
Luxury vehicle
Maintenance
Discount rate
Tech progress
Battery costs
Fuel prices
Depreciation
PEV tax credit
Vehicle size
Used vehicle
Finance rate
Ownership time
Residual value
BEV range
Retail markup
Driving distance
LCOD MY25 BEV small SUV, 5 yr ownership
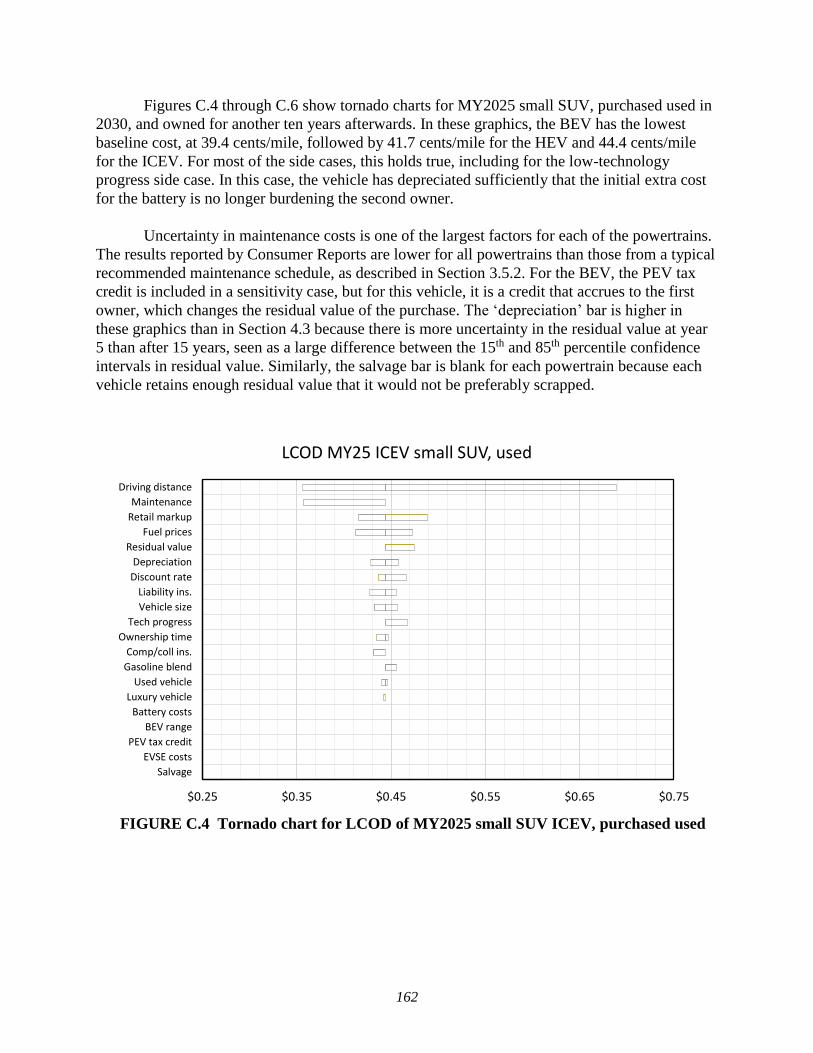
162
Figures C.4 through C.6 show tornado charts for MY2025 small SUV, purchased used in
2030, and owned for another ten years afterwards. In these graphics, the BEV has the lowest
baseline cost, at 39.4 cents/mile, followed by 41.7 cents/mile for the HEV and 44.4 cents/mile
for the ICEV. For most of the side cases, this holds true, including for the low-technology
progress side case. In this case, the vehicle has depreciated sufficiently that the initial extra cost
for the battery is no longer burdening the second owner.
Uncertainty in maintenance costs is one of the largest factors for each of the powertrains.
The results reported by Consumer Reports are lower for all powertrains than those from a typical
recommended maintenance schedule, as described in Section 3.5.2. For the BEV, the PEV tax
credit is included in a sensitivity case, but for this vehicle, it is a credit that accrues to the first
owner, which changes the residual value of the purchase. The ‘depreciation’ bar is higher in
these graphics than in Section 4.3 because there is more uncertainty in the residual value at year
5 than after 15 years, seen as a large difference between the 15th and 85th percentile confidence
intervals in residual value. Similarly, the salvage bar is blank for each powertrain because each
vehicle retains enough residual value that it would not be preferably scrapped.
FIGURE C.4 Tornado chart for LCOD of MY2025 small SUV ICEV, purchased used
$0.25 $0.35 $0.45 $0.55 $0.65 $0.75
Salvage
EVSE costs
PEV tax credit
BEV range
Battery costs
Luxury vehicle
Used vehicle
Gasoline blend
Comp/coll ins.
Ownership time
Tech progress
Vehicle size
Liability ins.
Discount rate
Depreciation
Residual value
Fuel prices
Retail markup
Maintenance
Driving distance
LCOD MY25 ICEV small SUV, used

163
FIGURE C.5 Tornado chart for LCOD of MY2025 small SUV HEV, purchased used
FIGURE C.6 Tornado chart for LCOD of MY2025 small SUV BEV, purchased used
$0.25 $0.35 $0.45 $0.55 $0.65 $0.75
Salvage
EVSE costs
PEV tax credit
BEV range
Battery costs
Used vehicle
Gasoline blend
Luxury vehicle
Comp/coll ins.
Ownership time
Tech progress
Liability ins.
Residual value
Discount rate
Fuel prices
Depreciation
Vehicle size
Retail markup
Maintenance
Driving distance
LCOD MY25 HEV small SUV, used
$0.25 $0.35 $0.45 $0.55 $0.65 $0.75
Salvage
Gasoline blend
EVSE costs
Comp/coll ins.
Residual value
Tech progress
Battery costs
Liability ins.
PEV tax credit
Luxury vehicle
Discount rate
Used vehicle
Depreciation
Ownership time
Maintenance
Fuel prices
Vehicle size
BEV range
Retail markup
Driving distance
LCOD MY25 BEV small SUV, used

164
Figures C.7, C.8, and C.9 show tornado charts for costs for real-world vehicles, based on
a sales-weighted average of vehicles sold in 2019. The baseline cost of the HEV small SUV is
the lowest at 40.6 cents/mile, followed by the BEV300 at 42.1 cents/mile and the ICEV at 44.2
cents/mile. While this analysis does not include RPE markup factors, it does show clear impacts
of the vehicle market, especially looking at vehicle size and luxury designation. TCO as a
function of vehicle size does not exhibit a clear monotonic trend as in the Autonomie-modeled
values. For the ICEV and HEV, the small SUV is lower cost than the midsize sedan, and for the
BEV300, the medium SUV has a large premium over the small SUV, at more than double the
purchase price. The luxury ICEV and HEV have notable price premiums as well, while the lack
of data for the BEV300 is due to the lack of available models in the market. The BEV200 only
has a slight reduction in price relative to the BEV300, as opposed to the large difference in prices
in the Autonomie modeling.
In most cases the HEV is the cheapest option followed by the BEV, but the BEV
becomes the cheapest option when considering a midsize car rather than a small SUV, a used
vehicle, long driving distances, or inclusion of the IRS tax credit. In no scenario considered here
is the ICEV the lowest-cost option, though an ICEV held for only 5 years and driven lightly can
be cheaper than the similarly-owned HEV. Conversely, a BEV held for only 5 years is nearly
always the most expensive of the three powertrains, unless is it driven much farther than average.
FIGURE C.7 Tornado chart for LCOD of a real-world small SUV ICEV, purchased in 2019
$0.25 $0.35 $0.45 $0.55 $0.65 $0.75 $0.85
BEV range
EVSE costs
Salvage
PEV tax credit
Depreciation
Comp/coll ins.
Ownership time
Gasoline blend
Residual value
Used vehicle
Finance rate
Liability ins.
Discount rate
Fuel prices
Vehicle size
Maintenance
Luxury vehicle
Driving distance
LCOD small SUV ICEV, 2019 real-world sales

165
FIGURE C.8 Tornado chart for LCOD of a real-world small SUV HEV, purchased in 2019
FIGURE C.9 Tornado chart for LCOD of a real-world small SUV BEV300, purchased in 2019
$0.25 $0.35 $0.45 $0.55 $0.65 $0.75 $0.85
BEV range
EVSE costs
Salvage
PEV tax credit
Depreciation
Gasoline blend
Comp/coll ins.
Residual value
Used vehicle
Ownership time
Fuel prices
Liability ins.
Finance rate
Discount rate
Vehicle size
Maintenance
Luxury vehicle
Driving distance
LCOD small SUV HEV, 2019 real-world sales
$0.25 $0.35 $0.45 $0.55 $0.65 $0.75 $0.85
Gasoline blend
Luxury vehicle
Depreciation
BEV range
EVSE costs
Salvage
Residual value
Comp/coll ins.
Liability ins.
Finance rate
Maintenance
Discount rate
PEV tax credit
Fuel prices
Ownership time
Used vehicle
Vehicle size
Driving distance
LCOD small SUV BEV, 2019 real-world sales

166
Figures C.10, C.11, and C.12 show tornado charts for costs for the class 4 delivery truck,
with a baseline ownership period of 3 years. The baseline case has BEV as the lowest cost
powertrain, which holds for many of the sensitivity cases as well. The lowest-cost powertrain is
the ICEV for a two-year-old resale, and so the payback for the AFVs are between 2 and 3 years.
The side case where the vehicle is scrapped at the end of its 3-year ownership is the highest cost,
but this is an unlikely scenario and not plotted on this graphic.
FIGURE C.10 Tornado chart for LCOD of MY2025 class 4 delivery ICEV, 3 year analysis
window
$0.60 $0.80 $1.00 $1.20 $1.40 $1.60 $1.80
Drive to charger
EVSE costs
Battery costs
M&R by powertrain
Tech progress
Discount rate
M&R variance
Insurance variance
Ownership time
Used vehicle
Fuel prices
Retail markup
Finance rate
Driving distance
LCOD MY25 ICEV class 4 delivery truck, 3 yr ownership

167
FIGURE C.11 Tornado chart for LCOD of MY2025 class 4 delivery HEV, 3 year analysis
window
FIGURE C.12 Tornado chart for LCOD of MY2025 class 4 delivery BEV, 3 year analysis
window
$0.60 $0.80 $1.00 $1.20 $1.40 $1.60 $1.80
Drive to charger
EVSE costs
Battery costs
Discount rate
Tech progress
M&R variance
Insurance variance
M&R by powertrain
Used vehicle
Fuel prices
Ownership time
Retail markup
Finance rate
Driving distance
LCOD MY25 HEV class 4 delivery truck, 3 yr ownership
$0.60 $0.80 $1.00 $1.20 $1.40 $1.60 $1.80
Discount rate
M&R variance
Used vehicle
Drive to charger
Insurance variance
Battery costs
EVSE costs
M&R by powertrain
Ownership time
Fuel prices
Retail markup
Tech progress
Finance rate
Driving distance
LCOD MY25 BEV class 4 delivery truck, 3 yr ownership
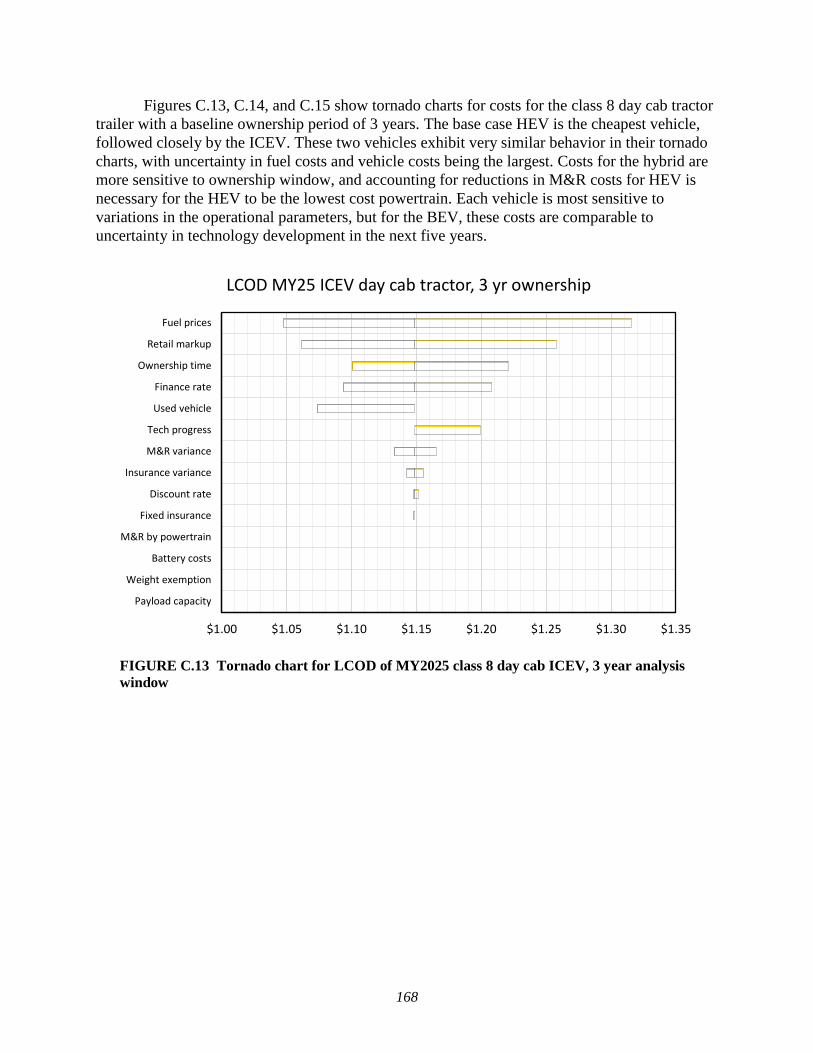
168
Figures C.13, C.14, and C.15 show tornado charts for costs for the class 8 day cab tractor
trailer with a baseline ownership period of 3 years. The base case HEV is the cheapest vehicle,
followed closely by the ICEV. These two vehicles exhibit very similar behavior in their tornado
charts, with uncertainty in fuel costs and vehicle costs being the largest. Costs for the hybrid are
more sensitive to ownership window, and accounting for reductions in M&R costs for HEV is
necessary for the HEV to be the lowest cost powertrain. Each vehicle is most sensitive to
variations in the operational parameters, but for the BEV, these costs are comparable to
uncertainty in technology development in the next five years.
FIGURE C.13 Tornado chart for LCOD of MY2025 class 8 day cab ICEV, 3 year analysis
window
$1.00 $1.05 $1.10 $1.15 $1.20 $1.25 $1.30 $1.35
Payload capacity
Weight exemption
Battery costs
M&R by powertrain
Fixed insurance
Discount rate
Insurance variance
M&R variance
Tech progress
Used vehicle
Finance rate
Ownership time
Retail markup
Fuel prices
LCOD MY25 ICEV day cab tractor, 3 yr ownership
169
FIGURE C.14 Tornado chart for LCOD of MY2025 class 8 day cab HEV, 3 year analysis
window
FIGURE C.15 Tornado chart for LCOD of MY2025 class 8 day cab BEV, 3 year analysis
window
$1.00 $1.05 $1.10 $1.15 $1.20 $1.25 $1.30 $1.35
Payload capacity
Weight exemption
Battery costs
Fixed insurance
Discount rate
Insurance variance
M&R adjust
M&R by powertrain
Tech progress
Used vehicle
Finance rate
Ownership time
Retail markup
Fuel prices
LCOD MY25 HEV day cab tractor, 3 yr ownership
$1.00 $1.20 $1.40 $1.60 $1.80 $2.00 $2.20 $2.40 $2.60
Payload capacity
Discount rate
Insurance variance
Weight exemption
M&R variance
Drive to charger
Fixed insurance
Battery costs
M&R by powertrain
Finance rate
EVSE costs
Used vehicle
Ownership time
Retail markup
Fuel prices
Tech progress
Labor costs
Driving distance
LCOD MY25 BEV day cab tractor, 3 yr ownership

170
Figures C.16, C.17, and C.18 show tornado charts for costs for the class 8 sleeper cab
tractor trailer with a baseline ownership period of 3 years. Unlike the analysis presented in
Section 4.3, the Autonomie modeling shows the ICEV to be the lowest cost powertrain for this
first-owner analysis, marginally cheaper than the HEV. The payback period of the HEV
technology is approximately 4 years in this analysis.
For the BEV, the uncertainty in technical progress, particularly in lowering battery costs,
is the single largest factor, larger even than the cost of labor. Fuel costs can also be quite
impactful, particularly if high-power charging is billed at an expensive rate. Fuel costs are also
the largest source of uncertainty for the ICEV and HEV sleeper cab tractors, followed by
variations in the driving distance.
FIGURE C.16 Tornado chart for LCOD of MY2025 sleeper cab ICEV, 3 year analysis
window
$0.90 $0.95 $1.00 $1.05 $1.10 $1.15 $1.20 $1.25
Battery costs
Payload capacity
M&R by powertrain
Discount rate
Insurance variance
Fixed insurance
M&R variance
Idling costs
Tech progress
Used vehicle
Finance rate
Ownership time
Retail markup
Driving distance
Fuel prices
LCOD MY25 ICEV sleeper cab tractor, 3 yr ownership
171
FIGURE C.17 Tornado chart for LCOD of MY2025 sleeper cab HEV, 3 year analysis window
FIGURE C.18 Tornado chart for LCOD of MY2025 sleeper cab BEV, 3 year analysis window
$0.90 $0.95 $1.00 $1.05 $1.10 $1.15 $1.20 $1.25
Payload capacity
Discount rate
Insurance variance
M&R variance
Fixed insurance
Idling costs
M&R by powertrain
Tech progress
Used vehicle
Finance rate
Ownership time
Retail markup
Driving distance
Fuel prices
LCOD MY25 HEV sleeper cab tractor, 3 yr ownership
$1.20 $1.40 $1.60 $1.80 $2.00 $2.20 $2.40 $2.60
Idling costs
Discount rate
Insurance variance
M&R adjust
Drive to charger
Payload capacity
Fixed insurance
Weight exemption
M&R by powertrain
Battery costs
Finance rate
EVSE costs
Ownership time
Used vehicle
Retail markup
Driving distance
Fuel prices
Labor costs
Tech progress
LCOD MY25 BEV sleeper cab tractor, 3 yr ownership

172
REFERENCES
AAA (American Automobile Association). 2019. “AAA’s Your Driving Costs: How Much Are
You Really Paying to Drive?” https://exchange.aaa.com/automotive/driving-costs/ Cited in
Section 3.2.5.
AAA (American Automobile Association). 2020. “Your Driving Costs: 2020.” December 9,
2020. https://newsroom.aaa.com/wp-content/uploads/2020/12/2020-Your-Driving-Costs-
Brochure-Interactive-FINAL-12-9-20.pdf Cited in Section 2.2.1.
Adams, Eric. 2018. “Hankook's New Tire Uses Tree Resin to Keep Electric Cars Rolling.”
Wired Magazine. October 10, 2018. https://www.wired.com/story/hankook-ev-electric-car-
kinergy-tire/ Cited in Section 3.5.3.
AFDC (Alternative Fuels Data Center). 2020. “Search Federal and State Laws and Incentives.”
U.S. Department of Energy, Office of Energy Efficiency and Renewable Energy. Accessed May
1, 2020. https://afdc.energy.gov/laws/search Cited in Section 3.6.1.
Al-Alawi, Baha M. and Thomas H. Bradley. 2013. “Total cost of ownership, payback, and
consumer preference modeling of plug-in hybrid electric vehicles.” Applied Energy, Volume
103, March 2013, Pages 488-506.
https://www.sciencedirect.com/science/article/abs/pii/S0306261912007131 Cited in Section
3.2.1.
Allstate. 2018. “Insurance Considerations For Older Cars.” January 2018.
https://www.allstate.com/tr/car-insurance/older-car-insurance.aspx Cited in Section 3.4.1.
ANL (Argonne National Laboratory). 2019. “Autonomie Vehicle System Simulation Tool.”
Updated October 4, 2019. https://www.anl.gov/es/autonomie-vehicle-system-simulation-tool
Cited in Section 2.2.1.
ANL (Argonne National Laboratory). 2020. “GREET: The Greenhouse gases, Regulated
Emissions, and Energy use in Technologies Model.” Updated October 9, 2020.
https://greet.es.anl.gov/ Cited in Section 2.2.1.
ANL (Argonne National Laboratory). 2021a. “Comprehensive Total Cost of Ownership
Quantification for Vehicles with Different Size Classes and Powertrains, Supplemental
Material.” April 2021. https://anl.box.com/s/pzc4dh2qgstomlrol9u66ncdi8fanvh5 Cited in
Sections 2.2, 5, Appendix B.
ANL (Argonne National Laboratory). 2021b. “Light Duty Electric Drive Vehicles Monthly Sales
Updates.” Updated March 16, 2021. https://www.anl.gov/es/light-duty-electric-drive-vehicles-
monthly-sales-updates Cited in Section 3.2.5.

173
Antich, Mike. 2020. “Passenger Vehicle Maintenance Spend Increased 4% in CY-2019.”
Automotive Fleet. March 17, 2020. https://www.automotive-fleet.com/353389/passenger-
vehicle-maintenance-spend-increased-4-in-cy-2019 Cited in Section 3.5.1.
Avalara. 2020. “Sales tax calculator and rate lookup tool.” Accessed August 24, 2020.
https://www.avalara.com/taxrates/en/calculator.html Cited in Section 3.6.1.
Barnitt, R., R.L. McCormick and M. Lammert. 2008. “St. Louis Metro Biodiesel (B20) Transit
Bus Evaluation: 12-Month Final Report.” NREL, report NREL/TP-540-43486. July 2008.
https://www.osti.gov/biblio/935593 Cited in Section 3.2.2.
Bartlett, Jeff S. 2019. “Low-Rolling-Resistance Tires Can Save You Money at the Pump.”
Consumer Reports. May 31, 2019. https://www.consumerreports.org/tires/low-rolling-resistance-
tires-can-save-you-money-at-pump/ Cited in Section 3.5.3.
Bauer, Gordon S., Jeffery B. Greenblatt and Brian F. Gerke. 2018. “Cost, Energy, and
Environmental Impact of Automated Electric Taxi Fleets in Manhattan.” Environmental Science
& Technology 2018, 52, 4920−4928. https://pubs.acs.org/doi/pdf/10.1021/acs.est.7b04732 Cited
in Section 4.2.5.
BEA (Bureau of Economic Analysis). 2020. “NIPA Handbook: Concepts and Methods of the
U.S. National Income and Product Accounts.” U.S. Department of Commerce. December 2020.
https://www.bea.gov/resources/methodologies/nipa-handbook Cited in Section 2.3.1.
BEA (Bureau of Economic Analysis). 2021. “GDP & Personal Income.” January 29, 2021.
https://apps.bea.gov/iTable/index_nipa.cfm Cited in Section 2.3.1.
Beer, Rachael, Felicia Ionescu and Geng Li. 2018. “Are Income and Credit Scores Highly
Correlated?” FEDS Notes. Washington: Board of Governors of the Federal Reserve System.
August 13, 2018. https://www.federalreserve.gov/econres/notes/feds-notes/are-income-and-
credit-scores-highly-correlated-20180813.htm Cited in Section 2.3.1.
Bekdache, Basma. 1999. “The time‐varying behaviour of real interest rates: a re‐evaluation of
the recent evidence.” Journal of Applied Econometrics, Volume14, Issue 2, March/April 1999,
Pages 171-190. https://onlinelibrary.wiley.com/doi/abs/10.1002/(SICI)1099-
1255(199903/04)14:2%3C171::AID-JAE502%3E3.0.CO;2-U Cited in Section 2.3.1.
Bento, Antonio, Kevin Roth, Yiou Zuo. 2018. “Vehicle Lifetime Trends and Scrappage Behavior
in the U.S. Used Car Market.” Energy Journal, Volume 39, 1, 159-184.
http://www.iaee.org/en/publications/ejarticle.aspx?id=3032 Cited in Section 2.3.2.
BLS (U.S. Bureau of Labor Statistics). 2020. “All CU Prepublication Means, Variances, and
Percent reporting (MVP) Tables 2014-2018.” Consumer Expenditure Survey, U.S. Department
of Labor. August 24, 2020. https://www.bls.gov/cex/csxresearchtables.htm Cited in Sections
3.5.1, 3.6.1.

174
BLS (U.S. Bureau of Labor Statistics). 2021. “CPI for All Urban Consumers (CPI-U).” Data set
CUSR0000SA0. April 7, 2021.
https://data.bls.gov/timeseries/CUSR0000SA0&output_view=data Cited in Section 2.3.1.
Blynn, Kelly. 2018. “Accelerating Bus Electrification: Enabling a sustainable transition to low
carbon transportation systems.” Masters thesis, Massachusetts Institute of Technology. February
2018. https://dspace.mit.edu/handle/1721.1/115600 Cited in Sections 3.5.5, 4.3.
Borlaug, Brennan, Shawn Salisbury, Mindy Gerdes and Matteo Muratori. 2020. “Levelized Cost
of Charging Electric Vehicles in the United States.” Joule, Volume 4, Issue 7, 15 July 2020,
Pages 1470-1485. https://www.sciencedirect.com/science/article/abs/pii/S2542435120302312
Cited in Sections 3.3, 4.3.
Bourbon, Ellen. 2020. “Clean Cities Alternative Fuel Price Report.” U.S. Department of Energy,
Office of Energy Efficiency and Renewable Energy. July 2020.
https://afdc.energy.gov/files/u/publication/alternative_fuel_price_report_july_2020.pdf Cited in
Section 3.3.
Boyd, Steven. 2020. “Batteries and Electrification R&D.” 2020 DOE Vehicle Technologies
Office Program Review, presentation bat920. June 1, 2020.
https://www.energy.gov/sites/prod/files/2020/08/f77/Boyd-2020_AMR_Plenary-
Batteries_and_Electrification_Overview_0.pdf Cited in Sections 3.2.1, 3.2.5.
Brex. 2020. “The average business loan rates for 7 types of loans.” Brex.com. April 9, 2020.
https://www.brex.com/blog/business-loan-rates/ Cited in Section 2.3.1.
Brooker, Aaron, Alicia Birky, Evan Reznicek, Jeff Gonder, Chad Hunter, Jason Lustbader, Chen
Zhang, Lauren Sittler, Arthur Yip, Fan Yang, and Dong-Yeon Lee. 2021. “Vehicle Technologies
and Hydrogen and Fuel Cells Technologies Office Research and Development Programs
Benefits Assessment Report.” NREL, report NREL/TP-5400-79617.
https://www.nrel.gov/docs/fy21osti/79617.pdf Cited in Sections 1, 5.
BTS (Bureau of Transportation Statistics). 2020a. “U.S. Vehicle-Miles.” U.S. Department of
Transportation, National Transportation Statistics. https://www.bts.gov/content/us-vehicle-miles
Cited in Section 3.5.1.
BTS (Bureau of Transportation Statistics). 2020b. “Number of U.S. Aircraft, Vehicles, Vessels,
and Other Conveyances.” U.S. Department of Transportation, National Transportation Statistics.
https://www.bts.gov/content/number-us-aircraft-vehicles-vessels-and-other-conveyances Cited
in Section 3.5.1.
BTS (Bureau of Transportation Statistics). 2020c. “Average Age of Automobiles and Trucks in
Operation in the United States.” U.S. Department of Transportation, National Transportation
Statistics. https://www.bts.gov/content/average-age-automobiles-and-trucks-operation-united-
states Cited in Section 3.5.1.
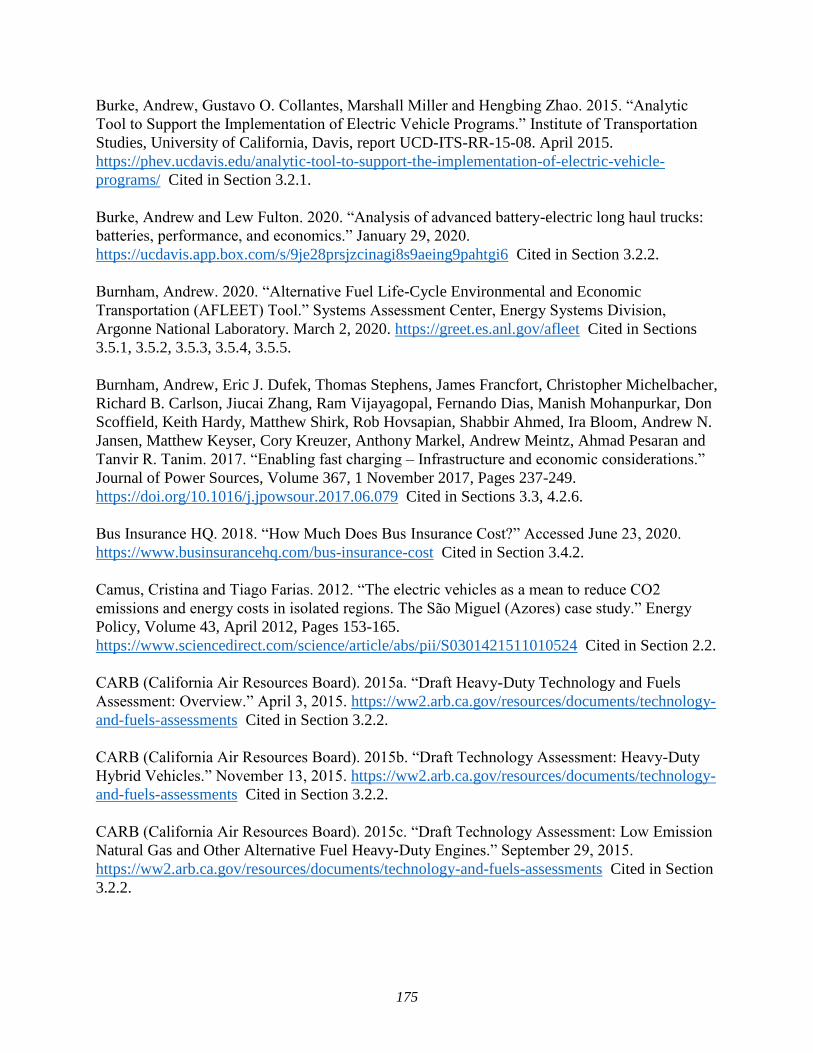
175
Burke, Andrew, Gustavo O. Collantes, Marshall Miller and Hengbing Zhao. 2015. “Analytic
Tool to Support the Implementation of Electric Vehicle Programs.” Institute of Transportation
Studies, University of California, Davis, report UCD-ITS-RR-15-08. April 2015.
https://phev.ucdavis.edu/analytic-tool-to-support-the-implementation-of-electric-vehicle-
programs/ Cited in Section 3.2.1.
Burke, Andrew and Lew Fulton. 2020. “Analysis of advanced battery-electric long haul trucks:
batteries, performance, and economics.” January 29, 2020.
https://ucdavis.app.box.com/s/9je28prsjzcinagi8s9aeing9pahtgi6 Cited in Section 3.2.2.
Burnham, Andrew. 2020. “Alternative Fuel Life-Cycle Environmental and Economic
Transportation (AFLEET) Tool.” Systems Assessment Center, Energy Systems Division,
Argonne National Laboratory. March 2, 2020. https://greet.es.anl.gov/afleet Cited in Sections
3.5.1, 3.5.2, 3.5.3, 3.5.4, 3.5.5.
Burnham, Andrew, Eric J. Dufek, Thomas Stephens, James Francfort, Christopher Michelbacher,
Richard B. Carlson, Jiucai Zhang, Ram Vijayagopal, Fernando Dias, Manish Mohanpurkar, Don
Scoffield, Keith Hardy, Matthew Shirk, Rob Hovsapian, Shabbir Ahmed, Ira Bloom, Andrew N.
Jansen, Matthew Keyser, Cory Kreuzer, Anthony Markel, Andrew Meintz, Ahmad Pesaran and
Tanvir R. Tanim. 2017. “Enabling fast charging – Infrastructure and economic considerations.”
Journal of Power Sources, Volume 367, 1 November 2017, Pages 237-249.
https://doi.org/10.1016/j.jpowsour.2017.06.079 Cited in Sections 3.3, 4.2.6.
Bus Insurance HQ. 2018. “How Much Does Bus Insurance Cost?” Accessed June 23, 2020.
https://www.businsurancehq.com/bus-insurance-cost Cited in Section 3.4.2.
Camus, Cristina and Tiago Farias. 2012. “The electric vehicles as a mean to reduce CO2
emissions and energy costs in isolated regions. The São Miguel (Azores) case study.” Energy
Policy, Volume 43, April 2012, Pages 153-165.
https://www.sciencedirect.com/science/article/abs/pii/S0301421511010524 Cited in Section 2.2.
CARB (California Air Resources Board). 2015a. “Draft Heavy-Duty Technology and Fuels
Assessment: Overview.” April 3, 2015. https://ww2.arb.ca.gov/resources/documents/technology-
and-fuels-assessments Cited in Section 3.2.2.
CARB (California Air Resources Board). 2015b. “Draft Technology Assessment: Heavy-Duty
Hybrid Vehicles.” November 13, 2015. https://ww2.arb.ca.gov/resources/documents/technology-
and-fuels-assessments Cited in Section 3.2.2.
CARB (California Air Resources Board). 2015c. “Draft Technology Assessment: Low Emission
Natural Gas and Other Alternative Fuel Heavy-Duty Engines.” September 29, 2015.
https://ww2.arb.ca.gov/resources/documents/technology-and-fuels-assessments Cited in Section
3.2.2.
176
CARB (California Air Resources Board). 2015d. “Draft Technology Assessment: Medium- and
Heavy-Duty Battery Electric Trucks and Buses.” October 14, 2015.
https://ww2.arb.ca.gov/resources/documents/technology-and-fuels-assessments Cited in Section
3.2.2.
CARB (California Air Resources Board). 2015e. “Draft Technology Assessment: Medium- and
Heavy-Duty Fuel Cell Electric Vehicles.” November 18, 2015.
https://ww2.arb.ca.gov/resources/documents/technology-and-fuels-assessments Cited in
Section 3.2.2.
Carolus, Johannes Friedrich, Nick Hanley, Søren Bøye Olsen and Søren Marcus Pedersen. 2018.
“A Bottom-up Approach to Environmental Cost-Benefit Analysis.” Ecological Economics,
Volume 152, October 2018, Pages 282-295.
https://www.sciencedirect.com/science/article/abs/pii/S0921800918303598 Cited in Section
2.2.1.
Carr, Jessica. 2020. “Heavy Duty Truck Used Price Depreciation Due to High Utilization.”
EquipmentWatch.com. March 6, 2020. https://equipmentwatch.com/intel/equipment-values-
market-data/heavy-duty-truck-used-price-depreciation-due-high-utilization/ Cited in Section
3.2.5.
Casale, Jeff. 2008. “Self-insurance helps trucking firms lower costs.” Business Insurance.
September 14. 2008.
https://www.businessinsurance.com/article/20080914/ISSUE03/100025868/self-insurance-helps-
trucking-firms-lower-costs Cited in Section 3.4.2.
Chen, Li-Hsueh. 2001. “A model for ex ante real interest rates.” Applied Economics Letters,
Volume 8, 2001, Issue 11, 713-718.
https://www.tandfonline.com/doi/abs/10.1080/13504850010017681 Cited in Section 2.3.1.
Cheung, D. 2020. Personal communication, Edmunds. August 25, 2020. Cited in Sections 3.5.3,
3.5.4.
Clark, Nigel N., Feng Zhen and W. Scott Wayne. 2009. “Assessment of Hybrid-Electric Transit
Bus Technology.” Transportation Research Board, Washington, D.C. Transit Cooperative
Research Program, report 132. ISBN 978-0-309-11803-3.
http://reconnectingamerica.org/assets/Uploads/2009HybridElectricBusTechnology2.pdf Cited in
Section 3.5.5.
Clarke, Warren. 2020. “What’s the average car loan length?” CreditKarma.com. November 17,
2020. https://www.creditkarma.com/auto/i/car-loan-term Cited in Section 2.3.1.
Clean Cities. 2019. “2019 Commercial Trucks and Off-Road Applications.” U.S. Department of
Energy, Vehicle Technologies Office.
https://cleancities.energy.gov/partnerships/search?project_search=2019+Commercial+Trucks+an
d+Off-Road+Applications Cited in Section 3.5.5.
177
Consumer Reports. 2019. “Consumer Reports' Car Reliability FAQ.” Consumer Reports.
November 19, 2020. https://www.consumerreports.org/car-reliability-owner-
satisfaction/consumer-reports-car-reliability-faq/ Cited in Section 3.5.2.
Cox Automotive. 2021. “Industry Insights 2021: Q4 Manheim Used Vehicle Value Index.”
January 8, 2021. https://www.coxautoinc.com/wp-content/uploads/2021/01/Jan-8-2021-Cox-
Automotive-Industry-Insights-Appendix.pdf Cited in Section 2.3.1.
CTT (Commercial Truck Trader). 2019. “New and Used Vehicles for Sale.” Accessed
September 2019. https://www.commercialtrucktrader.com/ Cited in Sections 3.2.3, 3.2.5.
Dai, Qiang, Jeffrey Spangenberger, Shabbir Ahmed, Linda Gaines, Jarod C. Kelly and Michael
Wang. 2019. “EverBatt: A Closed-loop Battery Recycling Cost and Environmental Impacts
Model.” Argonne National Laboratory, report ANL-19/16. April 2019.
https://www.osti.gov/biblio/1530874 Cited in Sections 3.2.1, 3.2.5.
Davis, M., M. Alexander and M. Duvall. 2013. “Total Cost of Ownership Model for Current
Plug-in Electric Vehicles.” EPRI, report 3002001728. June 2013.
http://www.ehcar.net/library/rapport/rapport079.pdf Cited in Section 3.5.3.
Davis, Stacy C. and Robert G. Boundy. 2020. “Transportation Energy Data Book, Edition 38.2.”
ORNL, report ORNL/TM-2019/1333. August 2020. https://tedb.ornl.gov/data/ Cited in
Sections 3.2.2, 3.2.5, 3.3.
Davis, Stacy C. and David N. McFarlin. 1996. “Transportation Energy Data Book, Edition 16.”
ORNL, report ORNL-6898. July 1996. https://tedb.ornl.gov/wp-
content/uploads/2019/03/Edition16_Full_Doc.pdf Cited in Section 3.5.1.
Delucchi, Mark. 2003. “A Lifecycle Emissions Model (LEM): Lifecycle Emissions from
Transportation Fuels, Motor Vehicles, Transportation Modes, Electricity Use, Heating and
Cooking Fuels, and Materials.” Institute of Transportation Studies, University of California,
Davis, report UCD-ITS-RR-03-17. December 2003. https://escholarship.org/uc/item/9vr8s1bb
Cited in Section 2.2.1.
Delucchi, Mark A. 2004. “Motor Vehicle Use, Social Costs of.” In Encyclopedia of Energy,
edited by Cutler J. Cleveland, 65-75. Elsevier Inc., the Netherlands,
https://www.sciencedirect.com/science/article/pii/B012176480X005453 Cited in Appendix A.
Delucchi, Mark A. 2005. “AVCEM: Advanced-Vehicle Cost and Energy Use Model.” Institute
of Transportation Studies, University of California, Davis, report UCD-ITS-RR-05-17(1).
October 2005. https://escholarship.org/uc/item/9v30m3n9 Cited in Section 2.2.1.
Delucchi, Mark A. 2007. “Do motor-vehicle users in the US pay their way?” Transportation
Research Part A: Policy and Practice, Volume 41, Issue 10, December 2007, Pages 982-1003.
https://www.sciencedirect.com/science/article/pii/S0965856407000444 Cited in Appendix A.

178
Delucchi, Mark A. 2021. “AVCEM Documentation Part 3: Review of the Literature on the
Private and Social Lifetime Cost of Electric and Alternative-Fuel Vehicle Costs.” Institute of
Transportation Studies, University of California, Davis, report UCD-ITS-RR-21-13. February
2021. https://escholarship.org/uc/item/8dq1b82q Cited in Sections 2.2, 5, Appendix A.
Delucchi, Mark A. and Timothy E. Lipman. 2001. “An analysis of the retail and lifecycle cost of
battery-powered electric vehicles.” Transportation Research Part D: Transport and Environment,
Volume 6, Issue 6, November 2001, Pages 371-404.
https://www.sciencedirect.com/science/article/abs/pii/S1361920900000316 Cited in
Sections 2.2, 2.2.1, 3.2.1.
Delucchi, Mark A. and James J. Murphy. 2008. “How large are tax subsidies to motor-vehicle
users in the US?” Transport Policy, Volume 15, Issue 3, May 2008, Pages 196-208.
https://www.sciencedirect.com/science/article/abs/pii/S0967070X08000218 Cited in
Appendix A.
DOE and EPA (U.S. Department of Energy and Environmental Protection Agency). 2020a.
“Find and Compare Cars.” FuelEconomy.gov. April 6, 2021.
https://www.fueleconomy.gov/feg/findacar.shtml Cited in Sections 3.2.3, 3.2.5.
DOE and EPA (U.S. Department of Energy and Environmental Protection Agency). 2020b.
“Fuel Economy Guide: Model Year 2020.” DOE, report DOE/EE-1982. April 6, 2021.
https://www.fueleconomy.gov/feg/pdfs/guides/FEG2020.pdf Cited in Section 3.2.2.
Dotsey, Michael, Carl Lantz and Brian Scholl. 2003. “The Behavior of the Real Rate of Interest.”
Journal of Money, Credit and Banking, Vol. 35, No. 1 (Feb., 2003), pp. 91-110.
https://www.jstor.org/stable/3649846?seq=1 Cited in Section 2.3.1.
Edmunds. 2020. “Cost of Car Ownership.” Edmunds.com. Accessed July 11, 2020.
https://www.edmunds.com/tco.html Cited in Sections 3.2.5, 3.4.1, 3.5, 3.5.4.
Edmunds. 2020. “Edmunds TMV - True Market Value / True Car Value.” Edmunds.com.
Accessed July 11, 2020. https://www.edmunds.com/tmv.html Cited in Sections 3.1, 3.2.5.
EIA (U.S. Energy Information Administration). 2020. “Annual Energy Outlook 2020.” U.S.
Department of Energy, report DOE/EIA-0383(2020). January 29, 2020.
https://www.eia.gov/outlooks/archive/aeo20/ Cited in Sections 3.3, 4.3.
Elgowainy, Amgad, Jeongwoo Han, Jacob Ward, Fred Joseck, David Gohlke, Alicia Lindauer,
Todd Ramsden, Mary Biddy, Marcus Alexander, Steven Barnhart, Ian Sutherland, Laura
Verduzco and Timothy J. Wallington. 2016. “Cradle-to-Grave Lifecycle Analysis of U.S. Light-
Duty Vehicle-Fuel Pathways: A Greenhouse Gas Emissions and Economic Assessment of
Current (2015) and Future (2025-2030) Technologies.” Argonne National Laboratory, report
ANL/ESD-16/7, Rev. 1. September 2016. https://greet.es.anl.gov/publication-c2g-2016-report
Cited in Section 2.3.2.
179
Elgowainy, Amgad, Jeongwoo Han, Jacob Ward, Fred Joseck, David Gohlke, Alicia Lindauer,
Todd Ramsden, Mary Biddy, Mark Alexander, Steven Barnhart, Ian Sutherland, Laura Verduzco
and Timothy J. Wallington. 2018. “Current and Future US Light-Duty Vehicle Pathways:
Cradle-to-Grave Lifecycle Greenhouse Gas Emissions and Economic Assessment.”
Environmental Science and Technology, 52 (4), 2392–2399.
https://pubs.acs.org/doi/abs/10.1021/acs.est.7b06006 Cited in Section 3.2.1.
Endurance. 2015. “Vehicle Service Contract.” Form VSC-01D-SPM-EDS-2012 (rev. 2/15).
https://www.endurancewarranty.com/wp-content/uploads/2018/10/endurance-coverage-
supreme.pdf Cited in Section 3.5.4.
EPA (U.S. Environmental Protection Agency). 2009. “An In-Depth Cost Analysis for New
Light-Duty Vehicle Technologies.” EPA, report EPA-420-R-09-020. December 2009.
https://cfpub.epa.gov/si/si_public_record_report.cfm?Lab=OTAQ&dirEntryID=210065 Cited in
Sections 2.2, 2.2.1.
EPA (U.S. Environmental Protection Agency). 2016. “Draft Technical Assessment Report:
Midterm Evaluation of Light-Duty Vehicle Greenhouse Gas Emission Standards and Corporate
Average Fuel Economy Standards for Model Years 2022-2025.” EPA, report EPA-420-D-16-
900. July 2016. https://www.epa.gov/regulations-emissions-vehicles-and-engines/midterm-
evaluation-light-duty-vehicle-greenhouse-gas Cited in Section 2.3.2.
EPA and NHTSA (U.S. Environmental Protection Agency and National Highway Traffic Safety
Administration). 2016. “Final Rule for Phase 2 Greenhouse Gas Emissions Standards and Fuel
Efficiency Standards for Medium- and Heavy-Duty Engines and Vehicles.” Federal Register,
Vol. 81, No. 206. October 25, 2016. https://www.epa.gov/regulations-emissions-vehicles-and-
engines/final-rule-phase-2-greenhouse-gas-emissions-standards-and Cited in Sections 3.2.2,
3.2.3, 3.7.3.
EPRI (Electric Power Research Institute). 2001. “Comparing the Benefits and Impacts of Hybrid
Electric Vehicle Options.” EPRI, report 1000349. July 2001.
https://www.ourenergypolicy.org/wp-
content/uploads/2011/11/2001_07_EPRI_ComparingHybridElectricVehicleOptions.pdf Cited in
Sections 2.2, 2.2.1.
Eudy, Leslie and Matthew Jeffers. 2018. “Zero-Emission Bus Evaluation Results: King County
Metro Battery Electric Buses.” U.S. Department of Transportation, Federal Transit
Administration, report No. 0118. February 2018.
https://www.transit.dot.gov/sites/fta.dot.gov/files/docs/research-innovation/115086/zero-
emission-bus-evaluation-results-king-county-metro-battery-electric-buses-fta-report-no-0118.pdf
Cited in Section 3.5.5.
Evans, Larry R., James D. MacIsaac Jr., John R. Harris, Kenneth Yates, Walter Dudek, Jason
Holmes, James Popio, Doug Rice and M. Kamel Salaani. 2009. “NHTSA Tire Fuel Efficiency
Consumer Information Program Development: Phase 2 – Effects of Tire Rolling Resistance
Levels on Traction, Treadwear, and Vehicle Fuel Economy.” NHTSA, report DOT HS 811 154.
180
August 2009.
https://www.nhtsa.gov/DOT/NHTSA/NVS/Vehicle%20Research%20&%20Test%20Center%20
%28VRTC%29/ca/Tires/811154.pdf Cited in Section 3.5.3.
Federal Reserve Bank of Philadelphia. 2020. “One-Year-Ahead and 10-Year-Ahead Inflation
Forecasts from the Survey of Professional Forecasters.” August 14, 2020.
https://www.philadelphiafed.org/surveys-and-data/real-time-data-research/inflation-forecasts
Cited in Section 2.3.1.
FHWA (Federal Highway Administration). 2002. “Our Nation's Highways - 2000.” Office of
Highway Policy Information, report FHWA-PL-01-1012.
https://www.fhwa.dot.gov/ohim/onh00/onh.htm Cited in Sections 3.4.1, 3.5.1.
FHWA (Federal Highway Administration). 2008. “Motor Fuel Data and the Highway Trust
Fund.” Office of Highway Policy Information, report FHWA-PL-08-019. April 2008.
https://www.fhwa.dot.gov/policyinformation/motorfuel/hwytaxes/2008/ Cited in Section 3.6.2.
FHWA (Federal Highway Administration). 2020. “Heavy Vehicle Use Tax.” U.S. Department of
Transportation. June 23, 2020.
https://www.fhwa.dot.gov/policyinformation/hvut/mod1/whatishvut.cfm Cited in Section 3.6.2.
FHWA and ORNL (Federal Highway Administration and Oak Ridge National Laboratory).
2020. “2017 National Household Travel Survey.” Version 1.2. August 2020. http://nhts.ornl.gov
Cited in Section 2.3.3.
FMSCA (Federal Motor Carrier Safety Administration). 2015. “Interstate Truck Driver’s Guide
to Hours of Service.” U.S. Department of Transportation, Washington, D.C.. March 2015.
https://www.fmcsa.dot.gov/sites/fmcsa.dot.gov/files/docs/Drivers%20Guide%20to%20HOS%20
2015_508.pdf Cited in Section 3.7.3.
FRB (Board of Governors of the Federal Reserve System). 2021a. “Consumer Credit.” Data set
G.19. January 8, 2021. https://www.federalreserve.gov/releases/g19/current/ Cited in Section
2.3.1.
FRB (Board of Governors of the Federal Reserve System). 2021b. “Selected Interest Rates.”
Data set H.15. January 21, 2021. https://www.federalreserve.gov/releases/h15/ Cited in Section
2.3.1.
FRED (Federal Reserve Economic Data). 2012. “Loan-To-Value Ratio of New Car Loans at
Auto Finance Companies.” Data set TERMFCLVRNCNS (discontinued). June 26, 2012.
https://fred.stlouisfed.org/series/TERMFCLVRNCNS Cited in Section 2.3.1.
Gaines, Linda. 2019. “Profitable Recycling of Low-Cobalt Lithium-Ion Batteries Will Depend
on New Process Developments.” One Earth, Volume 1, Issue 4, 20 December 2019, Pages 413-
415. https://www.osti.gov/biblio/1608012 Cited in Sections 3.2.1, 3.2.5.
181
Gaines, Linda, Anant Vyas, and John L. Anderson. 2006. “Estimation of Fuel Use by Idling
Commercial Trucks.” Transportation Research Record 1983, no. 1 (January 2006): 91–98.
https://journals.sagepub.com/doi/abs/10.1177/0361198106198300113 Cited in Section 3.7.3.
Gaines, Linda and Patricia Weikersheimer. 2015. “Status and Issues for Idling Reduction in the
United States: Alternative Fuel and Advanced Vehicle Technology Market Trends.” Argonne
National Laboratory. February 2015.
https://cleancities.energy.gov/files/u/news_events/document/document_url/93/2015_strategic_pl
anning_idling_reduction.pdf Cited in Section 3.7.3.
Gaines, Linda and Patricia Weikersheimer. 2016. “Idling Reduction for Long-Haul Trucks: An
Economic Comparison of On-Board and Wayside Technologies.” Argonne National Laboratory,
report ANL/ESD-16/16. September 2016.
https://anl.app.box.com/s/ordxowhhcqrp7fe3yd3oy2fqpwt3fpiw Cited in Section 3.7.3.
Gao, Zhiming, Zhenhong Lin, Stacy Cagle Davis and Alicia K. Birky. 2018. “Quantitative
Evaluation of MD/HD Vehicle Electrification using Statistical Data.” Transportation Research
Record 2672, no. 24 (December 2018): 109–21.
https://journals.sagepub.com/doi/full/10.1177/0361198118792329 Cited in Section 3.2.2.
Gao, Zhiming, Zhenhong Lin and Oscar Franzese. 2017. “Energy Consumption and Cost
Savings of Truck Electrification for Heavy-Duty Vehicle Applications.” Transportation Research
Record 2628, no. 1 (January 2017): 99–109. https://journals.sagepub.com/doi/10.3141/2628-11
Cited in Section 3.2.2.
Gareffa, Peter. 2019. “What New Car Fees Should You Pay?” Edmunds.com. December 9, 2019.
https://www.edmunds.com/car-buying/what-fees-should-you-pay.html Cited in Section 3.6.1.
Glassdoor. 2020. “Company Salaries.” Accessed October 21, 2020.
https://www.glassdoor.com/Salaries Cited in Section 3.7.3.
Goedecke, Martin, Supaporn Therdthianwong, and Shabbir H. Gheewala. 2007. “Life cycle cost
analysis of alternative vehicles and fuels in Thailand.” Energy Policy, Volume 35, Issue 6, June
2007, Pages 3236-3246.
https://www.sciencedirect.com/science/article/abs/pii/S0301421506004514 Cited in Section 2.2.
Gohlke, David and Yan Zhou. 2020. “Assessment of Light-Duty Plug-in Electric Vehicles in the
United States, 2010 – 2019.” Argonne National Laboratory, report ANL/ESD-20/4. June 2020.
https://www.osti.gov/biblio/1642115 Cited in Section 2.3.3.
Goldie-Scot, Logan. 2019. “A Behind the Scenes Take on Lithium-ion Battery Prices.”
BloombergNEF. March 5, 2019. https://about.bnef.com/blog/behind-scenes-take-lithium-ion-
battery-prices/ Cited in Section 3.2.1.

182
Goodyear. 2018. “Goodyear Presents New Tire Technology Designed to Advance the
Performance of Electric Vehicles.” March 6, 2018. https://news.goodyear.eu/goodyear-presents-
new-tire-technology-designed-to-advance-the-performance-of-electric-vehicles/ Cited in Section
3.5.3.
Government Fleet. 2011. “State of Kentucky to Save $750,000 Annually by Self-Insuring
Vehicles.” Government Fleet. October 10, 2011. https://www.government-
fleet.com/75772/kentucky-to-self-insure-state-vehicles Cited in Section 3.4.2.
Government Printing Office. 2012. “Imposition of tax on heavy trucks and trailers sold at retail.”
26 CFR § 145.4051-1. April 1, 2012. https://www.govinfo.gov/app/details/CFR-2012-title26-
vol17/CFR-2012-title26-vol17-sec145-4051-1 Cited in Section 3.6.2.
Guo, Zhaomiao and Yan Zhou. 2019. “Residual value analysis of plug-in vehicles in the United
States.” Energy Policy, Volume 125, February 2019, Pages 445-455.
https://www.osti.gov/biblio/1494668 Cited in Section 3.2.5.
Hagman, Jens, Sofia Ritzén, Jenny Janhager Stier and Yusak Susilo. 2016. “Total cost of
ownership and its potential implications for battery electric vehicle diffusion.” Research in
Transportation Business & Management, Volume 18, March 2016, Pages 11-17.
https://www.sciencedirect.com/science/article/pii/S2210539516000043 Cited in Section 3.4.
Halvorson, Bengt. 2019. “Beyond Tesla, electric cars lose value faster than other vehicles.”
Green Car Reports. June 13, 2019. https://www.greencarreports.com/news/1123583_beyond-
tesla-electric-cars-lose-value-faster-than-other-vehicles Cited in Section 3.2.5.
Hamza, Karim, Ken Laberteaux and Kang-Ching Chu. 2020. “On Modeling the Total Cost of
Ownership of Electric and Plug-in Hybrid Vehicles.” WCX SAE World Congress Experience.
SAE Technical Paper 2020-01-1435. https://www.sae.org/publications/technical-
papers/content/2020-01-1435/ Cited in Sections 3.2.1, 3.2.5.
Harlow, Jessie E., Xiaowei Ma, Jing Li, Eric Logan, Yulong Liu, Ning Zhang, Lin Ma, Stephen
L. Glazier, Marc M.E. Cormier and Matthew Genovese. 2019. “A Wide Range of Testing
Results on an Excellent Lithium-Ion Cell Chemistry to be used as Benchmarks for New Battery
Technologies.” Journal of The Electrochemical Society, Volume 166, Number 13, A3031.
https://iopscience.iop.org/article/10.1149/2.0981913jes Cited in Section 3.2.1.
Harper, Gavin, Roberto Sommerville, Emma Kendrick, Laura Driscoll, Peter Slater, Rustam
Stolkin, Allan Walton, Paul Christensen, Oliver Heidrich, Simon Lambert, Andrew Abbott, Karl
Ryder, Linda Gaines and Paul Anderson . 2019. “Recycling lithium-ion batteries from electric
vehicles.” Nature volume 575, pages 75–86 (2019). https://www.nature.com/articles/s41586-
019-1682-5 Cited in Sections 3.2.1, 3.2.5.

183
Harto, Chris. 2020a. “Electric Vehicle Ownership Costs: Today’s Electric Vehicles Offer Big
Savings for Consumers.” October 2020. https://advocacy.consumerreports.org/wp-
content/uploads/2020/10/EV-Ownership-Cost-Final-Report-1.pdf Cited in Sections 2.2.1, 3.5.2,
4.3.
Harto, Chris. 2020b. Personal communication, Consumer Reports. October 2020. Cited in
Sections 3.5.2, 3.5.3.
Holland, Maximilian. 2019. “Powering The EV Revolution — Battery Packs Now At
$156/KWh, 13% Lower Than 2018, Finds BNEF.” CleanTechnica. December 4, 2019.
https://cleantechnica.com/2019/12/04/powering-the-ev-revolution-battery-packs-now-at-156-
kwh-13-lower-than-2018-finds-bnef/ Cited in Section 3.2.1.
Holweg, Matthias and Paul A. Kattuman. 2006. “A Dynamic Determination of the Residual
Product Value: Empirical Evidence from the Automotive Industry.” OM in the new world
uncertainties: POMS Annual Conference, 17th, 28 Apr-1 May 2006, Boston, MA.
https://www.pomsmeetings.org/confpapers/004/004-0144.pdf Cited in Section 3.2.5.
Hooper, Alan and Dan Murray. 2017. “An Analysis of the Operational Costs of Trucking: 2017
Update.” Prepared by the American Transportation Research Institute (ATRI). October 2017.
https://truckingresearch.org/wp-content/uploads/2017/10/ATRI-Operational-Costs-of-Trucking-
2017-10-2017.pdf Cited in Section 3.7.3.
Hsieh, I-Yun Lisa, Menghsuan Sam Pan, Yet-Ming Chiang and William H. Green. 2019.
“Learning only buys you so much: Practical limits on battery price reduction.” Applied Energy,
Volume 239, 1 April 2019, Pages 218-224.
https://www.sciencedirect.com/science/article/abs/pii/S0306261919301606 Cited in Section
3.2.1.
Huneck, Jessica. 2020. “How Much Does Commercial Vehicle Insurance Cost?”
TrustedChoice.com. March 11, 2020. https://www.trustedchoice.com/commercial-vehicle-
insurance/compare-coverage/rate-cost/ Cited in Section 3.4.2.
Hunter, Chad, Michael Penev, Evan Reznicek, Jason Lustbader, Alicia Birky, and Chen Zhang.
2021. “Spatial and Temporal Analysis of the Total Cost of Ownership for Class 8 Tractors and
Class 4 Parcel Delivery Trucks.” NREL, report NREL/TP-5400-71796.
https://www.nrel.gov/docs/fy21osti/71796.pdf Cited in Sections 1, 5.
Hymel, Kent, Douglass B. Lee, Jonathan Pearlman, Robert Pritchard and Lydia Rainville. 2012.
“Financial Responsibility Requirements for Commercial Motor Vehicles.” FMSCA, report
FMCSA-RRA-12-045. November 2012.
https://www.fmcsa.dot.gov/sites/fmcsa.dot.gov/files/docs/Financial-Responsibility-Study.pdf
Cited in Section 3.4.2.

184
III (Insurance Information Institute). 2017. “Ride-sharing and insurance: Q&A.” Accessed
January 21, 2021. https://www.iii.org/article/ride-sharing-and-insurance-qa Cited in Section
3.4.2.
III (Insurance Information Institute). 2020. “Facts + Statistics: Auto insurance.” Accessed
September 2, 2020. https://www.iii.org/fact-statistic/facts-statistics-auto-insurance Cited in
Section 3.4.1.
Indeed. 2020. “Salaries.” Accessed October 21, 2020. https://www.indeed.com/career Cited in
Section 3.7.3.
IRS (Internal Revenue Service). 2015. “A Donor’s Guide to Vehicle Donation.” U.S.
Department of the Treasury, Publication 4303 (Rev. 1-2015). January 2015.
https://www.irs.gov/pub/irs-pdf/p4303.pdf Cited in Section 3.2.5.
IRS (Internal Revenue Service). 2020. “IRC 30D New Qualified Plug-In Electric Drive Motor
Vehicle Credit.” U.S. Department of the Treasury. March 15, 2021.
https://www.irs.gov/businesses/irc-30d-new-qualified-plug-in-electric-drive-motor-vehicle-credit
Cited in Section 3.2.5.
Islam, Ehsan Sabri, Ayman Moawad, Namdoo Kim, and Aymeric Rousseau. 2020. “Energy
Consumption and Cost Reduction of Future Light-Duty Vehicles through Advanced Vehicle
Technologies: A Modeling Simulation Study Through 2050.” Argonne National Laboratory,
report ANL/ESD-19/10. June 10, 2020. https://www.osti.gov/biblio/1647165 Cited in Sections
1, 2.3, 3.2.1, 3.2.2, 3.3, 4.1, 4.2.1, Appendix B.
J.D. Power. 2020. “More Owners Loving Dependability of Their Three-Year-Old Vehicles,
J.D. Power Finds.” J.D. Power Corporate Communications. February 12, 2020.
https://www.jdpower.com/business/press-releases/2020-us-vehicle-dependability-study Cited in
Sections 3.5.1, 3.5.4.
Jaller, Miguel, Leticia Pineda and Hanjiro Ambrose. 2018. “Evaluating the Use of Zero-
Emission Vehicles in Last Mile Deliveries.” Institute of Transportation Studies, University of
California, Davis, report UC-ITS-2017-33. July 2018. https://escholarship.org/uc/item/7kr753nm
Cited in Section 3.2.2.
James, Brian D. 2020. “Fuel Cell Systems Analysis.” 2020 DOE Hydrogen and Fuel Cells
Program Review, presentation FC163. May 30, 2020.
https://www.hydrogen.energy.gov/pdfs/review20/fc163_james_2020_o.pdf Cited in Sections
3.2.1, 3.5.4.
Johansson, Per-Olov and Bengt Kriström. 2018. “Cost-Benefit Analysis.” Cambridge University
Press, Cambridge. ISBN 9781108660624. http://dx.doi.org/10.1017/9781108660624 Cited in
Section 2.2.1.

185
Johnson, Caley, Erin Nobler, Leslie Eudy and Matthew Jeffers. 2020. “Financial Analysis of
Battery Electric Transit Buses.” NREL, report NREL/TP-5400-74832. June 2020.
https://www.nrel.gov/docs/fy20osti/74832.pdf Cited in Section 3.2.1.
Joseck, Fred, Eric Miller, Ned Stetson and Dimitrios Papageorgopoulos. 2018. “FCTO FY18
Inputs and Assumptions for Program Analysis.” DOE Hydrogen Program Record #18001.
September 17, 2018.
https://www.hydrogen.energy.gov/pdfs/18001_fcto_fy18_inputs_assumptions.pdf Cited in
Section 3.5.4.
Kaufman, Doug. 2015. “Machine Shop Market Profile.” Engine Builder Magazine. July 1, 2015.
https://www.enginebuildermag.com/2015/07/machine-shop-market-profile-5/ Cited in Section
4.2.4.
KBB (Kelley Blue Book). 2020. “Average New-Vehicle Prices Up 2% Year-Over-Year in July
2020, According to Kelley Blue Book.” Cox Automotive. August 3, 2020.
https://mediaroom.kbb.com/2020-08-03-Average-New-Vehicle-Prices-Up-2-Year-Over-Year-in-
July-2020-According-to-Kelley-Blue-Book Cited in Section 3.6.1.
Kelly, J. 2020. “Light-Duty Vehicle Cost Markup Analysis: Literature Review and Evaluation.”
Systems Assessment Group, Energy Systems Division, Argonne National Laboratory. July 2020.
https://greet.es.anl.gov/publication-ldv_cost_literature Cited in Sections 3.2.1, 3.2.3, 4.3.
Kerman, Keith T. 2019. “Reducing Maintenance Costs With Electric Vehicles.” NYC Citywide
Administrative Services. NYC Fleet Newsletter. March 8, 2019 - Issue 255.
https://www1.nyc.gov/assets/dcas/downloads/pdf/fleet/NYC-Fleet-Newsletter-255-March-8-
2019-Reducing-Maintenance-Costs-With-Electric-Vehicles.pdf Cited in Section 3.5.1.
Kiernan, John S. 2021. “Rideshare Insurance.” WalletHub. March 25, 2021.
https://wallethub.com/edu/ci/rideshare-insurance/13884 Cited in Section 3.4.2.
Kleen, Gregory and Elliot Padgett. 2021. “Durability-Adjusted Fuel Cell System Cost.” DOE
Hydrogen Program Record #21001. January 7, 2021.
https://www.hydrogen.energy.gov/pdfs/21001-durability-adjusted-fcs-cost.pdf Cited in Sections
3.2.1, 3.5.4.
Konan, Arnaud, Adam Duran, Kenneth Kelly, Eric Miller and Robert Prohaska. 2017.
“Characterization of PTO and Idle Behavior for Utility Vehicles.” NREL, report NREL/TP-
5400-66747. September 2017.
https://afdc.energy.gov/files/u/publication/pto_idle_behavior_utility_vehicles.pdf Cited in
Section 3.7.3.
Krome, Charles. 2018. “Car Depreciation: How Much Value Will a New Car Lose?”
Carfax.com. November 9, 2018.
http://web.archive.org/web/20201019052954/https://www.carfax.com/blog/car-depreciation
Cited in Section 3.2.5.

186
Lammert, Michael P., Kevin Walkowicz, Adam Duran and Petr Sindler. 2012. “Measured
Laboratory and In-Use Fuel Economy Observed over Targeted Drive Cycles for Comparable
Hybrid and Conventional Package Delivery Vehicles.” SAE 2012 Commercial Vehicle
Engineering Congress. SAE Technical Paper 2012-01-2049.
https://www.osti.gov/biblio/1054025 Cited in Section 3.2.2.
Landefeld, J. Steven, Brent R. Moulton and Cindy M. Vojtech. 2003. “Chained-Dollar Indexes:
Issues, Tips on Their Use, and Upcoming Changes.” Survey of Current Business, November, 8-
16. November 2003. https://www.bea.gov/resources/methodologies/chained-dollar-indexes
Cited in Section 2.3.1.
Lee, Dong-Yeon and Valerie M. Thomas. 2017. “Parametric modeling approach for economic
and environmental life cycle assessment of medium-duty truck electrification.” Journal of
Cleaner Production, Volume 142, Part 4, 20 January 2017, Pages 3300-3321.
https://www.sciencedirect.com/science/article/abs/pii/S095965261631770X Cited in
Sections 2.2, 2.2.1.
Levin, K. 2020. Personal communication, Edmunds. June 2, 2020. Cited in Section 3.4.1.
Lewerer, Greg. 2018. “Car Depreciation: How Much Have You Lost?” TrustedChoice.com.
May 14, 2018. https://www.trustedchoice.com/insurance-articles/wheels-wings-motors/car-
depreciation/ Cited in Section 3.2.5.
Linkov, Jon. 2019. “Special Report: The Electric Car Comes of Age.” Consumer Reports.
August 8, 2019. https://www.consumerreports.org/hybrids-evs/electric-car-comes-of-age/ Cited
in Section 3.5.2.
Lipman, Timothy E. and Mark A. Delucchi. 2006. “A retail and lifecycle cost analysis of hybrid
electric vehicles.” Transportation Research Part D: Transport and Environment, Volume 11,
Issue 2, March 2006, Pages 115-132.
https://www.sciencedirect.com/science/article/abs/pii/S1361920905000878 Cited in
Sections 2.2, 2.2.1.
Logtenberg, Ryan, James Pawley and Barry Saxifrage. 2018. “Comparing Fuel and Maintenance
Costs of Electric and Gas Powered Vehicles in Canada.” 2 Degrees Institute, Sechelt, British
Columbia, Canada. September 2018.
https://www.2degreesinstitute.org/reports/comparing_fuel_and_maintenance_costs_of_electric_a
nd_gas_powered_vehicles_in_canada.pdf Cited in Section 3.5.3.
Lu, S. 2006. “Vehicle Survivability and Travel Mileage Schedules.” NHTSA, report DOT HS
809 952. January 2006. https://crashstats.nhtsa.dot.gov/Api/Public/ViewPublication/809952
Cited in Section 2.3.2.

187
Lustbader, Jason, Chen Zhang, Alicia Birky, and Chad Hunter. 2021. “Transportation
Technology Total Cost of Ownership (T3CO) Methodology and Application to Class 8
Commercial Vehicle Electrification.” NREL, report NREL/TP-5400-79737.
https://www.nrel.gov/docs/fy21osti/79737.pdf Cited in Section 3.7.2.
Luthi, Ben. 2020. “The Average Business Loan Interest Rate in 2020.” Nav.com. December 10,
2020. https://www.nav.com/blog/what-is-the-average-business-loan-interest-rate-37650/ Cited
in Section 2.3.1.
Marcinkoski, Jason. 2019. “Hydrogen Class 8 Long Haul Truck Targets.” DOE Hydrogen
Program Record #19006. October 31, 2019.
https://www.hydrogen.energy.gov/pdfs/19006_hydrogen_class8_long_haul_truck_targets.pdf
Cited in Sections 3.3, 3.5.5.
Martin, Maddy. 2016a. “How Much Do Car Maintenance Costs Increase with Mileage?”
YourMechanic. July 21, 2016. https://www.yourmechanic.com/article/how-much-do-
maintenance-costs-increase-by-mileage-by-maddy-martin Cited in Section 3.5.1.
Martin, Maddy. 2016b. “The Most and Least Expensive Cars to Maintain.” YourMechanic. June
1, 2016. https://www.yourmechanic.com/article/the-most-and-least-expensive-cars-to-maintain-
by-maddy-martin Cited in Section 3.5.2.
Milner, P. 2020. Personal communication, Utilimarc. October 7, 2020. Cited in Section 3.5.1.
MIT Energy Initiative. 2019. “Insights into Future Mobility.” Massachusetts Institute of
Technology, Cambridge, MA. November 2019. https://energy.mit.edu/publication/insights-into-
future-mobility/ Cited in Section 3.2.1.
Montoya, Ronald. 2019. “How Much Should a Car Down Payment Be?” Edmunds.com. July 5,
2019. https://www.edmunds.com/car-buying/how-much-should-a-car-down-payment-be.html
Cited in Section 2.3.1.
Morrison, Geoff, John Stevens, and Fred Joseck. 2018. “Relative economic competitiveness of
light-duty battery electric and fuel cell electric vehicles.” Transportation Research Part C:
Emerging Technologies, Volume 87, February 2018, Pages 183-196.
https://www.sciencedirect.com/science/article/pii/S0968090X18300056 Cited in Sections 1,
3.2.1, 5.
Motus. 2020. “Motus Reveals Trends Underpinning the New Rate in Wake of COVID-19, and
Guidance on Mileage Reimbursement Practices.” Motus.com. Boston, MA. December 22, 2020.
https://www.motus.com/2021-irs-business-mileage-rate/ Cited in Section 2.2.1.
Muller, David. 2017. “Warranties Defined: The Truth behind the Promises.” Car and Driver.
May 29, 2017. https://www.caranddriver.com/news/a15341220/warranties-defined-the-meaning-
behind-the-quickly-spoken-selling-points/ Cited in Section 3.5.
188
Murray, Dan and Seth Glidewell. 2019. “An Analysis of the Operational Costs of Trucking:
2019 Update.” Prepared by the American Transportation Research Institute (ATRI). November
2019. https://truckingresearch.org/wp-content/uploads/2019/11/ATRI-Operational-Costs-of-
Trucking-2019-1.pdf Cited in Sections 2.2.1, 3.4.2, 3.5.5, 3.6.2, 3.7.3, 4.3.
NAIC (National Association of Insurance Commissioners). 2020. “Auto Insurance Database
Reports: 2016/2017, 2012/2013, 2007/2008, and 2002/2003.” Accessed September 2, 2020.
https://www.naic.org/prod_serv_alpha_listing.htm#auto_ins_database Cited in Section 3.4.1.
NAS (National Academies of Sciences, Engineering, and Medicine). 2020. “Reducing Fuel
Consumption and Greenhouse Gas Emissions of Medium- and Heavy-Duty Vehicles, Phase
Two: Final Report.” National Academies Press, Washington, DC. ISBN 978-0-309-49635-3.
https://www.nap.edu/catalog/25542/ Cited in Section 3.2.1.
NCEE (National Center for Environmental Economics). 2014. “Guidelines for Preparing
Economic Analyses.” EPA, report EPA-240-R-10-001. December 17, 2010, updated May 2014.
https://www.epa.gov/environmental-economics/guidelines-preparing-economic-analyses Cited
in Section 2.3.3.
Nelder, Chris and Emily Rogers. 2019. “Reducing EV Charging Infrastructure Costs.” Rocky
Mountain Institute. https://rmi.org/ev-charging-costs Cited in Section 3.3.
Nelson, Paul A., Shabbir Ahmed, Kevin G. Gallagher and Dennis W. Dees. 2019. “Modeling the
Performance and Cost of Lithium-Ion Batteries for Electric-Drive Vehicles, Third Edition.”
Argonne National Laboratory, report ANL/CSE-19/2. March 2019.
https://www.osti.gov/biblio/1503280 Cited in Section 3.2.1.
Neubauer, J. and A. Pesaran. 2010. “NREL’s PHEV/EV Li-ion Battery Secondary-Use Project.”
Advanced Automotive Batteries Conference (AABC) 2010, Orlando, Florida. NREL, report
NREL/CP-540-48042. June 2010. https://www.nrel.gov/docs/fy10osti/48042.pdf Cited in
Sections 3.2.1, 3.2.5.
Neuvoo. 2020. “Your job search starts here.” Accessed November 11, 2020.
https://www.neuvoo.com Cited in Section 3.7.3.
NHTSA and EPA (National Highway Traffic Safety Administration and U.S. Environmental
Protection Agency). 2020. “The Safer Affordable Fuel-Efficient 'SAFE' Vehicles Rule.” March
31, 2020. https://www.nhtsa.gov/corporate-average-fuel-economy/safe Cited in Sections 2.3,
2.3.3, Appendix A.
Nicholas, Michael. 2019. “Estimating electric vehicle charging infrastructure costs across major
U.S. metropolitan areas.” ICCT Working Paper 2019-14. August 2019.
https://theicct.org/sites/default/files/publications/ICCT_EV_Charging_Cost_20190813.pdf Cited
in Section 3.3.

189
Nigro, Nick and Josh Rosenberg. 2019. “Highway Revenue Assessment Tool.” Atlas Public
Policy. June 11, 2020. https://atlaspolicy.com/rand/highway-revenue-assessment-tool/ Cited in
Section 3.6.1.
NRC (National Research Council). 2006. “Tires and Passenger Vehicle Fuel Economy.”
Transportation Research Board, Washington, D.C. TRB Special Report 286. ISBN 0-309-09421-
6. http://onlinepubs.trb.org/onlinepubs/sr/sr286.pdf Cited in Section 3.5.3.
NRC (National Research Council). 2013. “Transitions to Alternative Vehicles and Fuels.”
National Academies Press, Washington, DC. ISBN 978-0-309-26852-3.
https://www.nap.edu/catalog/18264/ Cited in Sections 2.2, 2.2.1, 3.2.1.
NYC (New York City). 2014. “2014 Taxicab Factbook.” Taxi & Limousine Commission.
https://web.archive.org/web/20160308083344/http://www.nyc.gov/html/tlc/downloads/pdf/2014
_taxicab_fact_book.pdf Cited in Section 4.2.5.
NYC (New York City). 2020. “Medallion Vehicles - Authorized.” Taxi and Limousine
Commission (TLC). Accessed June 17, 2020.
https://data.cityofnewyork.us/Transportation/Medallion-Vehicles-Authorized/rhe8-mgbb Cited
in Section 4.2.5.
OMB (Office of Management and Budget). 1992. “Guidelines and Discount Rates for Benefit-
Cost Analysis of Federal Programs.” White House, Circular A-94. October 29, 1992.
https://www.whitehouse.gov/omb/information-for-agencies/circulars/ Cited in Section 2.3.1.
OMB (Office of Management and Budget). 2003. “Regulatory Analysis.” White House, Circular
A-4. September 17, 2003. https://www.whitehouse.gov/omb/information-regulatory-
affairs/regulatory-matters/ Cited in Section 2.3.3.
Payscale. 2020. “Salary Data & Career Research Center (United States).” Accessed October 21,
2020. https://www.payscale.com/research/US Cited in Section 3.7.3.
PERA (Production Engine Remanufacturers Association). 2021. “FAQ.” Accessed February 8,
2021. https://www.pera.org/faq/ Cited in Section 4.2.4.
Pfirrmann-Powell, Ryan. 2014. “Americans’ aging autos.” U.S. Bureau of Labor Statistics.
Beyond the Numbers: Prices & Spending, Vol. 3, No. 9, May 2014.
https://www.bls.gov/opub/btn/volume-3/americans-aging-autos.htm Cited in Sections 3.5.1,
3.5.4.
Podris, Fred. 2019. “Physical Damage Insurance for a Commercial Truck Insurance Policy.”
Commercial Truck Insurance HQ. November 29, 2019.
https://www.commercialtruckinsurancehq.com/physical-damage-insurance-for-a-commercial-
truck-insurance-policy Cited in Section 3.4.2.
190
Pogol, Gina. 2020. “Comprehensive and collision coverage.” Insurance.com. March 5, 2020.
https://www.insurance.com/auto-insurance/coverage/comprehensive-and-collision-auto-
insurance.html Cited in Section 3.4.1.
Progressive. 2020. “Car Insurance.” Accessed June 23, 2020.
https://autoinsurance1.progressivedirect.com/1/UQA/Quote/ Cited in Sections 3.4.1, 3.4.2.
R.L. Polk and Co. 2013. “U.S. Vehicle Registration Data for Class 4-8.” IHS Markit. December
31, 2013. Cited in Section 3.7.2.
Ramsden, Todd and Fred Joseck. 2018. “Hydrogen R&D Cost Target Calculation—2018
Update.” DOE Hydrogen Program Record #18004. September 6, 2018.
https://www.hydrogen.energy.gov/pdfs/18004_h2_cost_target_calculation_2018.pdf Cited in
Section 3.3.
Reinhart, Thomas E. 2015. “Commercial Medium- and Heavy-Duty Truck Fuel Efficiency
Technology Study – Report #1.” NHTSA, report DOT HS 812 146. October 2015.
https://www.nhtsa.gov/sites/nhtsa.dot.gov/files/812146-commercialmdhd-
truckfuelefficiencytechstudy-v2.pdf Cited in Section 3.2.2.
RepairPal. 2020. “Free Car Repair Estimate.” Accessed July 20, 2020.
https://repairpal.com/estimator Cited in Section 3.5.3.
Ricardo. 2012. “Fleet Technology General TCO Model, Version 1.0.” RD.12/412001.1. October
3, 2012. https://www.aga.org/natural-gas/good-for-business/calculator/ Cited in Section 3.5.5.
Ricardo. 2017. “Valuation of Fuel Economy of Medium Duty/Heavy Duty Vehicles.” June 13,
2017. https://rsc.ricardo.com/downloads/valuation-of-fuel-economy-of-medium-duty-heavy-dut
Cited in Section 2.3.2.
Rousseau, A., T. Stephens, J. Brokate, E.D. Özdemir, M. Klötzke, S.A. Schmid, P. Plötz,
F. Badin, J. Ward and O.T. Lim. 2015. “Comparison of Energy Consumption and Costs of
Different Plug-in Electric Vehicles in European and American Context.” EVS28, Kintex, Korea,
May 3-6, 2015. January 2015. https://www.researchgate.net/publication/312457280 Cited in
Section 3.2.1.
SAE (Society of Automotive Engineers). 2010. “Utility Factor Definitions for Plug-In Hybrid
Electric Vehicles Using Travel Survey Data.” SAE Standard J2841_201009. September 21,
2010. https://www.sae.org/standards/content/j2841_201009/ Cited in Section 3.2.2.
Sakti, Apurba, Inês M.L. Azevedo, Erica R.H. Fuchs, Jeremy J. Michalek, Kevin G. Gallagher
and Jay F. Whitacre. 2017. “Consistency and robustness of forecasting for emerging
technologies: The case of Li-ion batteries for electric vehicles.” Energy Policy, Volume 106, July
2017, Pages 415-426.
https://www.sciencedirect.com/science/article/abs/pii/S0301421517302161 Cited in Section
3.2.1.

191
Schoettle, Brandon and Michael Sivak. 2018. “Resale Values of Electric and Conventional
Vehicles: Recent Trends and Influence on the Decision to Purchase a New Vehicle.” University
of Michigan, Sustainable Worldwide Transportation, report SWT-2018-4. March 2018.
http://umich.edu/~umtriswt/PDF/SWT-2018-4.pdf Cited in Section 3.2.5.
Shadof, Keith. 2017. “Making the Most of Your Diesel Engine Overhaul.” JX Enterprises.
August 22, 2017. https://jxe.com/making-diesel-engine-overhaul/ Cited in Section 3.5.5.
Singh, Margaret, Anant Vyas and Elyse Steiner. 2004. “VISION Model: description of model
used to estimate the impact of highway vehicle technologies and fuels on energy use and carbon
emissions to 2050.” Argonne National Laboratory, report ANL/ESD/04-1. February 19, 2004.
https://www.osti.gov/biblio/822561 Cited in Section 2.2.1.
Sripad, Shashank and Venkatasubramanian Viswanathan. 2019. “Quantifying the Economic
Case for Electric Semi-Trucks.” ACS Energy Letters, 2019, 4, 1, 149–155.
https://pubs.acs.org/doi/10.1021/acsenergylett.8b02146 Cited in Section 3.2.2.
Stephens, T.S., A. Birky, and M. Dwyer. 2020. “Vehicle Technologies Office Research and
Development Programs: Prospective Benefits Assessment Report for Fiscal Year 2020.”
Argonne National Laboratory, report ANL/ESD-20/7. October 2020.
https://www.osti.gov/biblio/1764609 Cited in Sections 1, 3.2.3, 3.3, 5.
Stephens, T.S., C.H. Taylor, J.S. Moore and J. Ward. 2016. “Vehicle Technologies and Fuel Cell
Technologies Program: Prospective Benefits Assessment Report for Fiscal Year 2016.” Argonne
National Laboratory, report ANL/ESD-16/2. February 23, 2016.
https://publications.anl.gov/anlpubs/2016/04/126043.pdf Cited in Sections 2.2, 2.2.1.
Sun, Yongling, Mark A. Delucchi, C.-Y. Cynthia L. Lawell and Joan M. Ogden. 2019. “The
Producer Surplus Associated with Gasoline Fuel Use in the United States.” UC Berkeley:
Institute of Transportation Studies at UC Berkeley. January 2019.
https://escholarship.org/uc/item/0591r5x3 Cited in Appendix A.
Sun, Yongling, Joan M. Ogden, and Mark A. Delucchi. 2010. “Societal Life-Cycle Buy-Down
Cost of Hydrogen Fuel Cell Vehicles.” Transportation Research Record 2191, no. 1 (January
2010): 34–42. https://journals.sagepub.com/doi/abs/10.3141/2191-05 Cited in Sections 2.2,
2.2.1.
The Zebra. 2020. “Instantly Compare Insurance Quotes - Insurance in black & white.” Accessed
September 2, 2020. https://www.thezebra.com/ Cited in Sections 3.4, 3.4.1.
Thomas, J. and B. Boundy. 2019. Personal communication, ORNL. May 1, 2019. Cited in
Section 3.5.3.
Truck Paper. 2019. “Trucks For Sale & Trailers For Sale - New and Used.” Accessed September
2019. https://www.truckpaper.com/ Cited in Sections 3.2.3, 3.2.5.
192
U.S. Census Bureau. 2004. “2002 Vehicle Inventory and Use Survey.” U.S. Department of
Commerce, report EC02TV-US. December 2004.
https://www.census.gov/library/publications/2002/econ/census/vehicle-inventory-and-use-
survey.html Cited in Sections 2.3.3, 3.2.2, 3.7.2, 3.7.3.
Ulrich, Lawrence. 2019. “S.U.V. vs. Sedan, and Detroit vs. the World, in a Fight for the Future.”
New York Times. September 15, 2019. https://www.nytimes.com/2019/09/12/business/suv-
sedan-detroit-fight.html Cited in Section 3.4.1.
Vallet, Mark. 2019. “Cheapest trucks to insure, most expensive trucks to insure: 2019 models.”
Insure.com. August 20, 2019. https://www.insure.com/car-insurance/average-pickup-truck-
insurance-costs Cited in Section 3.4.1.
van Velzen, Arjan, Jan Anne Annema, Geerten van de Kaa and Bert van Wee. 2019. “Proposing
a more comprehensive future total cost of ownership estimation framework for electric vehicles.”
Energy Policy, Volume 129, June 2019, Pages 1034-1046.
https://www.sciencedirect.com/science/article/pii/S0301421519301612 Cited in Section 2.2.1.
Varocky, B.J. 2011. “Benchmarking of Regenerative Braking for a Fully Electric Car.” TNO
Automotive, Helmond & Technische Universiteit Eindhoven, report No. D&C 2011.002.
January 2011. http://www.mate.tue.nl/mate/pdfs/12673.pdf Cited in Section 3.5.3.
Vijayagopal, R., D. Nieto Prada, and A. Rousseau. 2019. “Fuel Economy and Cost Estimates for
Medium- and Heavy-Duty Trucks.” Argonne National Laboratory, report ANL/ESD-19/8.
December 2019. https://www.autonomie.net/pdfs/ANL-
MDHD%20Vehicle%20Simulation%20Report.pdf Cited in Sections 1, 2.3, 3.2.1, 3.2.2, 3.3, 4.1,
4.2.1, Appendix B.
Vincent, John M. 2018. “Should I Get an Extended Warranty on a New or Used Car?”
U.S. News and World Report. April 25, 2018. https://cars.usnews.com/cars-trucks/should-you-
get-an-extended-warranty Cited in Section 3.5.4.
Vyas, A. 2012. Personal communication, ANL. November 27, 2012. Cited in Section 3.5.3.
Vyas, Anant, Dan Santini and Roy Cuenca. 2000. “Comparison of Indirect Cost Multipliers for
Vehicle Manufacturing.” Center for Transportation Research, Energy Systems Division,
Argonne National Laboratory. April 2000.
https://publications.anl.gov/anlpubs/2000/05/36074.pdf Cited in Section 3.2.1.
Wamala, Yowana. 2020. “Average Auto Loan Interest Rates: Facts & Figures.”
ValuePenguin.com. October 29, 2020. https://www.valuepenguin.com/auto-loans/average-auto-
loan-interest-rates Cited in Section 2.3.1.
Wards Intelligence. 2020. “Data Center.” Wards. January 3, 2020.
https://wardsintelligence.informa.com/datacenter Cited in Sections 3.2.2, 3.2.3, 3.2.5.

193
Wiryadinata, Steven and Griffin Lehrer. 2021. “User Guide TCO Tool.” Sandia National
Laboratory technical report SAND2021-3325 O.
https://anl.box.com/s/pzc4dh2qgstomlrol9u66ncdi8fanvh5 Cited in Section 5.
Wu, Geng, Alessandro Inderbitzin and Catharina Bening. 2015. “Total cost of ownership of
electric vehicles compared to conventional vehicles: A probabilistic analysis and projection
across market segments.” Energy Policy, Volume 80, May 2015, Pages 196-214.
https://www.sciencedirect.com/science/article/abs/pii/S0301421515000671 Cited in
Section 3.2.1.
YourMechanic. 2020. “Get Over 500 Auto Services at Your Home or Office.” Accessed July 20,
2020. https://www.yourmechanic.com/services/ Cited in Section 3.5.3.
Zabritski, Melinda. 2020. “State of the Automotive Finance Market: Quarterly review.”
Experian: Automotive Industry Insights series. November 23, 2020.
https://www.experian.com/automotive/auto-credit-webinar-form Cited in Sections 2.3.1, 3.2.4.
Zhao, Hengbing, Andrew Burke and Lin Zhu. 2013. “Analysis of Class 8 hybrid-electric truck
technologies using diesel, LNG, electricity, and hydrogen, as the fuel for various applications.”
2013 World Electric Vehicle Symposium and Exhibition (EVS27), Barcelona, Spain.
https://ieeexplore.ieee.org/document/6914957 Cited in Section 3.2.2.
Zhou, Y., D. Santini, T. Stephens and J. Ward. 2016. “Comparison of Value Retention of Plug-in
Vehicles and Conventional Vehicles and Potential Contributing Factors.” EVS29 Symposium,
Montréal, Québec, Canada, June 19-22, 2016.
https://anl.app.box.com/s/2dc92xmxpy99lx755o5ortgsjp94ze3t Cited in Section 3.2.5.
Zip Recruiter. 2020. “Real Salaries from Real Employers.” Accessed October 21, 2020.
https://www.ziprecruiter.com/Salaries Cited in Section 3.7.3.

194


Energy Systems Division Argonne National Laboratory
9700 South Cass Avenue, Bldg. 362
Lemont, IL 60439-4832
www.anl.gov