A Comprehensive guide to-Quality Analysis of Fruit Juices ...

COMPREHENSIVE STUDY OF TRACE ELEMENTS
IN JUICES AND SOFT DRINKS AND THEIR
IMPACT ON HUMAN HEALTH
ANILA ANWAR
DEPARTMENT OF CHEMISTRY FEDERAL URDU UNIVERSITY OF ARTS
SCIENCE AND TECHNOLOGY GULSHAN-E-IQBAL, KARACHI-75270
PAKISTAN 2014


“IN THE NAME OF ALLAH, MOST GRACIOUS AND
MOST MERCIFUL”
O’ ALLAH, O’ Our Lord from you alone is my help
And upon you alone is my reliance, you alone we worship and
from you alone we seek help.
(Al-Quran)

THESIS SUBMITTED FOR THE
FULLFILMENT OF THE
DEGREE OF DOCTOR OF PHILOSOPHY
BY
ANILA ANWAR
DEPARTMENT OF CHEMISTRY FEDERAL URDU UNIVERSITY
OF ARTS SCIENCE AND TECHNOLOGY GULSHAN‐E‐IQBAL KARACHI‐75270
PAKISTAN

Dedicated to
Loving parents, my husband Syed Anwar Ali and Sons S. Zain Ali and S. Anas Ali, without their commitment and
support this work could not be Completed on time.

DECLARATION
This is to certify that this dissertation in entitled “COMPREHENSIVE STUDY
OF TRACE ELEMENTS IN JUICES AND SOFT DRINKS AND THEIR
IMPACT ON HUMAN HEALTH” submitted by ANILA ANWAR is accepted
in its present from by the department of Chemistry, Federal Urdu University,
Karachi, Pakistan, as satisfying the partial requirement for degree of Doctor of
Philosophy in ANALYTICAL CHEMISTRY.
THESIS APPROVED BY
Prof. Dr. Qamar-ul-Haque __________________ Supervisor and Internal Examiner Dr.Talat Mahmood __________________ Co-Supervisor and Internal Examiner Prof. Dr. Arif Zubair __________________ Dean, Faculty of Science Federal Urdu University of Arts Science and Technology Gulshan-e-Iqbal Karachi, Pakistan
Dr. Iffat Mahmood __________________ Chairman, Chemistry Department Federal Urdu University of Arts Science and Technology Gulshan-e-Iqbal Karachi, Pakistan

CONTENTS
Acknowledgement Abstract Urdu Khulasa INTRODUCTION 1.1 Background of the study……………………………………………... 2 1.2 Composition of Fruit juices …………………………………………. 3 1.3 Types of Fruit drinks ………………………………………………… 4 1.4 Significance of fruit juices …………………………………………... 5 1.5 Soft drinks …………………………………………………………… 5 1.6 Physicochemical parameters…………………………………………. 6
1.6.1 Temperature …………………………………………………. 6 1.6.2 PH scale ……………………………………………………... 7 1.6.3. Dissolve solid ………………………………………………... 7 1.6.4 Conductivity………………………………………………….. 8 1.6.5 Dissolve oxygen……………………………………………… 8 1.6.6 Salinity………………………………………………………. 9 1.6.7 Specific gravity ……………………………………………… 9
1.7 Packing materials ……………………………………………………. 9 1.8 Factors affecting the microbial contamination………………………. 14 1.9 Factors affecting the heavy metals contamination…………………… 17 1.10 Heavy metals (Trace essential and toxic metals)……………………. 18
Chromium (Cr) ……………………………………………………….18 Iron (Fe)……………………………………………………………… 18 Zinc (Zn) …………………………………………………………….. 19 ckel (Ni) …………………………………………………………... 19 Manganese (Mn)……………………………………………………... 19 Cobalt (Co)……………………………………………………………20 Copper (Cu)………………………………………………………….. 20 Lead (Pb)…………………………………………………………….. 20 Cadmium (Cd)……………………………………………………….. 21
1.11 Motivation of the study………………………………………………. 21 1.12 Objective of the study ……………………………………………….. 23
LITERATURE REVIEWED ……………………………………. 26 MATERIALS AND METHOD
3.1 Materials……………………………………………………………... 33 3.2 Sample collection ……………………………………………………. 33 3.3 Determination of Physicochemical parameters……………………… 33 3.4 Instrumentation ……………………………………………………… 33 3.5 Digestion of sample………………………………………………….. 34 3.6 Statistically analysis………………………………………………….. 34 3.7 Identification of fungi………………………………………………... 34 3.8 Bacterial identification……………………………………………….. 35

RESULT AND DISCUSSION
4 Apple Juice ………………………………………………………….. 39
5 Mango Juice …………………………………………………………. 50
6 Orange Juice ………………………………………………………… 62
7 Grape Juice ………………………………………………………….. 74
8 Punch Juice………………………………………………………….. 85
9 Miscellaneous Juices………………………………………………… 97
10 Soft Drinks…………………………………………………………… 132
11 Statistical analysis (ANOVA) ……………………………………….. 140
12 Packing Material …………………………………………………... 143
13 CONCLUSION …………………………………………………… 147
14 RECOMMENDATION …………………………………………... 153
15 REFERENCES …………………………………………………… 154
16 LIST OF PUBLICATIONS ………………………………………. 170

LIST OF TABLES 3. Material and Method 3.1 Representing sample categories with type and packing ……………. 36 3.2 Instrumental parameters for determination of element by
flame atomic absorption……………………………………………… 37 4. Apple 4.1 Physicochemical parameters of Apple juices……………………….. 40 4.2 Range of heavy metals (ppm) in Apple juices………………………. 45 4.3 Isolated Fungal species in Apple juices of different brands…………. 48 4.4 Microbial load in apple juices of different brands…………………… 49 5. Mango 5.1 Physicochemical parameters of Mango juices……………………….. 51 5.2 Range of heavy metals (ppm) in Mango juices……………………… 56 5.3 Isolated Fungal species in Mango juices of different brands………… 60 5.4 Microbial load in Mango juices of different brands…………………. 61 6. Orange 6.1 Physicochemical parameters of Orange juice………………………... 63 6.2 Range of heavy metals (ppm) in Orange juice………………………. 69 6.3 Isolated Fungal species in Orange juices of different brands………... 72 6.4 Microbial load in Orange juices of different brands…………………. 73
7. Grape 7.1 Physicochemical parameters of Grape juices………………………... 75 7.2 Range of heavy metals (ppm) in Grape juices ………………………. 80 7.3 Isolated Fungal species in Grape juices……………………………… 83 7.4 Microbial load in Grape juices of different brands…………………... 84
8. Punch 8.1 Physicochemical parameters in Punch juices……………………….. 86 8.2 Range of heavy metals (ppm) in Punch juices………………………. 92 8.3 Isolated Fungal species in Punch juices of different brands………… 95 8.4 Microbial load in Punch juices of different brands………………….. 96 9. Miscellaneous 9.1 Physicochemical parameters in miscellaneous juice………………… 102 9.2 Range of heavy metals (ppm) in miscellaneous juice……………….. 121 9.3 Fungal species isolated from miscellaneous juices of different brands………………………………………………………. 130 9.4 Microbial load in miscellaneous juices of different brands………….. 131 10. Soft Drink 10.1 Physicochemical parameters of soft drinks of different brands……… 133 10.2 Range of heavy metals (ppm) in soft drinks…………………………. 135 10.3 Isolated Fungal species in Soft drinks of different brands…………… 138 10.4 Bacterial load in soft drinks of different brands…………………….. 139

CONTENTS 11. Statistical analysis 11.1 Univariate analysis of variance for fruit juices in ……………… 141 different packing materials 11.2 Univariate analysis of variance for soft drinks in ……………… 142
different packing materials 12. Packing Material 12.1 Mean (range) of heavy (ppm) in different packing materials ……….. 145
of a variety of fruit juices. 12.2 Mean of heavy metals (ppm) in soft drinks of different packing
Material………………………………………………………………. 146
APPENDIX
I Drinking water contaminants and maximum admissible limits ……... 167
by different international organization
II Dietary in take of trace elements in the human body………………… 168
III The recommended microbiological standards for any
Fruit juice all numbers are as per ml of juice consumed…………….. 169

LISTS OF FIGURE 4. Apple 4.1 pH of apple juice…………………………………………………….. 41 4.2 conductivity of apple juice…………………………………………… 41 4.3 TDS in Apple juice…………………………………………………... 42 4.4 Salinity in apple juice…………………………………………………42 4.5 DO in Apple juice……………………………………………………. 43 4.6 Specific gravity of apple juice……………………………………….. 43 4.7 Metals in Apple juice………………………………………………… 46 4.8 Toxic metals in Apple juice………………………………………….. 46 5. Mango 5.1 pH of mango juice……………………………………………………. 52 5.2 conductivity in Apple juice…………………………………………... 52 5.3 TDS in Apple juice ………………………………………………….. 53 5.4 Salinity in Apple juice……………………………………………….. 53 5.5 DO in Mango juice…………………………………………………...54 5.6 Specific gravity of mango juice……………………………………… 54 5.7 Metals in Mango juice……………………………………………….. 57 5.8 Toxic metals in Mango juice………………………………………… 57 6. Orange 6.1 pH of Orange juice…………………………………………………… 64 6.2 conductivity in Orange juice…………………………………………. 64 6.3 TDS in Orange juice…………………………………………………. 65 6.4 Salinity in orange juice………………………………………………. 65 6.5 DO in Orange juice …………………………………………………. 66 6.6 Specific gravity in orange juice……………………………………… 66 6.7 Metals in Orange juice……………………………………………….. 70 6.8 Toxic metals in Orange juice………………………………………… 70 7. Grape 7.1 pH in Grape juice…………………………………………………….. 76 7.2 conductivity in Grape juice…………………………………………... 76 7.3 TDS in Grape juice ………………………………………………….. 77 7.4 Salinity in Grape juice……………………………………………….. 77 7.5 DO in Grape juice……………………………………………………. 78 7.6 Specific gravity in Grape juice………………………………………. 78 7.7 Metals in Grape juice………………………………………………… 81 7.8 Toxic metals in Grape juice 81 8. Punch 8.1 pH of punch juice…………………………………………………….. 87 8.2 conductivity of Punch juice………………………………………….. 87 8.3 TDS of punch juice…………………………………………………... 88 8.4 Salinity of Punch juice……………………………………………….. 88 8.5 DO in Punch juice……………………………………………………. 89 8.6 Specific gravity of Punch juice………………………………………. 89

8.7 Metals in Punch juice………………………………………………… 93 8.8 Toxic metals in Punch juice………………………………………….. 93 9. Miscellaneous Fruit Juice 9.1 pH of Guava juice……………………………………………………. 103 9.2 conductivity in Guava juice………………………………………….. 103 9.3 TDS in Guava juice…………………………………………………... 104 9.4 Salinity in Guava juice……………………………………………….. 104 9.5 DO in Guava juice…………………………………………………… 105 9.6 Specific gravity of Guava juice……………………………………… 105 9.7 pH of pine apple juice………………………………………………... 106 9.8 conductivity in pine apple juice……………………………………… 106 9.9 TDS in pineapple juice………………………………………………..107 9.10 Salinity in pine apple juice…………………………………………… 107 9.11 DO in pine apple juice……………………………………………….. 108 9.12 Specific gravity of pine apple juice…………………………...……... 108 9.13 pH of peach juice…………………………………………………….. 109 9.14 conductivity of peach juice…………………………………………... 109 9.15 TDS in Peach juice……………………………………………………110 9.16 Salinity of peach juice………………………………………………... 110 9.17 DO in Peach juice……………………………………………………. 111 9.18 Specific gravity of Peach juice………………………………………. 111 9.19 pH of lemon juice……………………………………………………..112 9.20 conductivity in Lemon juice…………………………………………. 112 9.21 TDS in Lemon juice………………………………………………….. 113 9.22 Salinity of lemon …………………………………………………….. 113 9.23 DO in lemon juice……………………………………………………. 114 9.24 Specific gravity of Lemon juice……………………………………… 114 9.25 pH of Strawberry juice……………………………………………….. 115 9.26 conductivity in Strawberry juice……………………………………... 116 9.27 TDS in Strawberry juice……………………………………………... 116 9.28 Salinity in Strawberry juice………………………………………….. 116 9.29 DO in Strawberry juice………………………………………………. 117 9.30 Specific gravity of Strawberry juice…………………………………. 117 9.31 Metals in Guava juice………………………………………………... 124 9.32 Toxic metals in Guava juice…………………………………………. 124 9.33 Metals in pineapple juice…………………………………………….. 125 9.34 Toxic metals in pineapple juice……………………………………… 125 9.35 Metals in peach juice………………………………………………… 126 9.36 Toxic metals in peach juice………………………………………….. 126 9.37 Metals in lemon juice………………………………………………… 127 9.38 Toxic metals in lemon juice…………………………………………. 127 9.39 Metals in strawberry juice…………………………………………… 128 9.40 Toxic metals in strawberry juice……………………………………... 128 10. Soft drinks 10.1 Metals in soft drink ………………………………………………….. 136 10.2 Toxic metals in soft drink……………………………………………. 136

ABBREVATIONS LIST
US-EPA United State Environmental
Protection Agency
W.H.O. World Health Organization
TDS Total Dissolved Solids
DO Dissolved Oxygen
HNO3 Nitric Acid
Cr Chromium
Fe Iron
Zn Zinc
Ni Nickel
Cd Cadmium
Cu Copper
Pb Lead
Co Cobalt
Mn Manganese
TVC Total viable count
TCC Total coliform count
FCC Fecal coliform count
T Tetra pack
B Plastic Bottle
S Sachet pack
ppm Parts per million
NGL No guideline
NM Not mention
HO Null hypothesis
HA Alternative hypothesis
L.OS Level of significance
- No (Absent)
> larger

SAMPLE ID (CODE) LISTS
Sample ID A
B
C
D
E
F
G
H
I
J
K
L
M
N
O
P
Q
R
S
T
U
V
W
X
Y
Z
AB
BC

ACKNOWLEDGEMENTS
I am thankful to almighty ALLAH beholder of the un seen force within
and around us, for providing me with the strength and impetus to over come even
the biggest of impediments during the entire length of my work.
I would like to thanks Prof Dr. Zafar Iqbal Vice-Chancellor of Federal
Urdu University for providing a study leaf for completing a research work.
I would like to thank H.O.D Dr. Iffat Mahmood Associate professor
Department of Chemistry for their cooperation and making all necessary things
available in the department.
I would like to pay reverence of my supervisor Dr. Qamar-ul-Haque,
Professor, Department of Chemistry, Federal Urdu University of Arts, Science
and Technology (FUAST) Karachi for keen interest, inspiration and guidance
throughout the course of this study.
I am deeply grateful to my co-supervisor Dr. Talat Mahmood Associate
professor, Department of Chemistry, FUAST Karachi for her detailed and
constructive comments and for her valuable support throughout the course of this
work.
I would like to thank Dr. Moinuddin Ahmed, Director of Laboratory of
Dandrochronolagy and plant Ecology (LDPE) Department of Botany Federal
Urdu University of Arts, Science and Technology for providing laboratory
facilities.
I would like to thank Dr. Kanwal Nasim, Department of Marine Reference
Collection and Resources Center, University of Karachi Pakistan for providing
multiparameter instrument for the determination of physicochemical parameters.

I would like to thank Mr. Sikander Sherwani, Department of
Microbiology, Federal Urdu University of Arts, Science and Technology helped
in the Microbiological Analysis.
I would like to thanks Dr. Kausor Yasmeen for heavy metals Analysis by
atomic absorption spectrophotometer.
I would like to thank Zohaib Aziz department of Statistic Federal Urdu
University for statistical analysis.
I would like to thank Azam Ali Deputy Director of State Bank he has
critically read and correct manuscript and taken personal interest in preparation of
this thesis.
My special thanks and deep appreciation are due to my courteous
colleagues Federal Urdu University for their suggestion and encouragement that
have been a constant source of inspiration.
I owe my success to my husband Syed Anwar Ali and sons Syed Zain Ali
and Syed Anas Ali without their encouragement and understanding it would have
been impossible for me to complete this work.
I would like to pay homage, to my Parents, Sisters, Brother for their
prayers, loves and moral support they provided me during the entire work.
ANILA ANWAR

ABSTRACT
A comprehensive study carried out for determination of heavy metals including
trace (Cr, Fe, Zn, Ni, Mn, Co, Cu) and toxic (Pb, Cd) metals in variety of fruit
juices and soft drinks and also studies the impact of these on human health. These
heavy metals were determined by atomic absorption technique. Statistical analysis
(ANOVA) was also done for heavy metals of a variety of juices and soft drinks of
different packing material and also determined various physicochemical
parameters like (PH, Conductivity, TDS, Salinity, DO, Specific gravity) as well as
isolation of fungal species and microbial load in variety of fruit juices and soft
drink. The results of heavy metal were compared with permissible limit in
drinking water imposed by the United State Environmental Protection Agency
(US-EPA), World Health Organization (W.H.O) both for fruit juices and soft
drinks and recommended dietary allowances (RDA) only for fruit juices. Isolated
fungal species compared with literature review both in fruit juices and soft drinks
and microbial load with Gulf standard (only in fruit juices) as well as these were
correlated with physicochemical parameters.
Present study shows that order range of concentration for Cr was not permissible
above within the standards sets by the organization and also dietary intake It was
found that upper limit of Fe in tetra pack and plastic bottle also range was found
in sachet pack was not safe within limits but if compared with dietary intake order
and concentration range below the standards.
It was found that Mean (range) of Zn was below the US-EPA also dietary intake
of trace element. Range of concentration and order for Ni (T> B >S) was above
within the standards also was not permissible with dietary intake Upper limit of
Mn in all packing was not lies within standards except range of Mn in plastic
bottle permissible by W.H.O recommendation. Range of Mn in tetra pack and
plastic bottle was below within in daily intake level but upper level in sachet pack
was high.
Mean range of Cu and Co in all packaging was within in all standards was also
small within a dietary intake. In the present work range of Pb was measured in all
packing was within US-EPA but not safe according to W.H.O recommendation.

Upper limit of range of Cd in tetra pack and plastic bottle and range was found in
sachet pack was not safe within standards.
Mean of heavy metals (ppm) in soft drinks was accessible. In present work it was
found that means value of Cr and Ni in both packaging (plastic pack and tin pack)
was not permissible and above within standards Mean value of Fe in both
packaging was high and not safe within 0.3 ml/L. It was observed that range of Zn
(plastic pack and tin pack) was low as compared to standards Mean concentration
of Mn, Co and Cd was approximate within standards Mean concentration of Pb in
(plastic pack and tin pack) was expectable within US-EPA, but obove within
W.H.O.
Statistical analysis (ANOVA) Result showed that null hypothesis for Zn and Ni
was rejected for fruit juices as well in soft drinks Zn, Cu, and Cd were rejected
synthetic chemicals used in the packaging, storage, and processing of food stuffs.
This is because most of these substances are not inert and can leach into the foods,
harmful to human health over the long period.
For identification of fungi in the juices, direct plating technique was
applied and the species were recovered in a variety of tetra pack fruit juices and
plastic bottle soft drinks. A.flavus, A.niger, Penicillium sp, Rhizopus sp, Mucor
saccromyces, Fusarium, A. Fumigate, Monilia, A. Wentii and Candida albicans.
In present study genus Aspergillus was most frequent in juices. None fungal
contamination was observed in plastic bottle and sachet pack of a variety of fruit
juices and tin pack of soft drink Furthermore present work showed that presence
of fungi was frequently observed in tetrapacks of fruit juices may be due to
permeability of packing by which they are made cartons was more risk than
plastic bottle carton are bent and hot filled in vacuum condition this process
causes a depression within the carton which may lead to the entry of air and
consequently favors mould(fungi) production.
For the evaluation of total viable count (TVE) total coliform count (TCC) fecal
coliform (FCC) and total staphylococcal count (TSC) Standard cultural techniques
were applied.

In the present work observed bacterial load in tetra pack and plastic bottle of a
variety of juices and soft drinks but none bacterial load was seen in sachet pack of
fruit juices and tin pack of soft drinks. Present work observed that Total viable
count (TVC) in Apple, Mango, Punch and strawberry juice was below the
standard while in orange and grape was found within the standard (TCC.) Total
coliform count in Apple, Mango, Orange, Grape, Punch and strawberry juices was
above the standard. Fecal coliform count (FCC) in Mango, Grape, Punch and
strawberry was above the standard while they were absent in Apple and Orange.
Staphylococcal count was found in Apple, Mango, Punch juices was within the
standard while in Orange was above the standard, they were absent in grape and
strawberry. But in present work presence of coliform, fecal coliform and
staphylococci in fruit juices and soft drinks of different packing materials indicate
that they were contaminated. Fruits become contaminated with microorganism
during preharvest, harvest and post harvest period of time all the way through
fecal material harvesting equipment, domestic animals and wild animal human
use, transport container, wild and domestic animals, ice or water. Many
microorganisms was found as natural contaminants in soft drink, but moderately
the minority be able to cultivate inside the acidic and little oxygen atmosphere
All assessment it was determined that fruits juices and soft drinks might cause
serious hazards to human health. It was concluded that care and caution should be
taken to improve the quality of consumer product in every as pact on the basis of
may research work for health view do not use ready to eat drinks like juices and
soft drinks should be utilize fruits and homemade juices since they are actually
favorable for our health and life.


1
INTRODUCTION
2
1.1 BACKGROUND OF THE STUDY
Fruit juices are becoming an essential part of the modern diet in many
communities. Fruit juices are nourishing beverages, in a healthy diet can play a
major part because a variety of nutrients found naturally in fruits. Also offer good
taste Juices exist in natural concentrations or processed forms. (Tasnim et al.,
2010) Fruit juices are available in any place in the world are available in bottles,
cans, laminated paper packs, pouches, cups and almost every other form of
packaging in the diet of most people, irrespective of age included significantly
thus, it contribute to good health(Tasnim et al., 2010). In most countries, the hot
climate means that the intake of liquids must be high to compensate for the
expected losses from respiration (Al Jedah and Robinson, 2002; Victor et al.,
2012).
All over the country Liquid consumption increases in hot weather.
Directly available drinks become better-looking and important for Metro cities
and towns and for seasonal consumers (especially in Northern areas) because fruit
juice is measured to be particularly agro based industry, when fresh crop is
coming into the bazaar and pulp is easily offered at low prices, Juice manufacture
should be in progress. Manufacture must be started this will also be extremely
dependable on what fruit is being chosen for juice manufacture. Fruit produce,
Fruit juice which can be mainly consumed by infants, children and adults to meet
their nutrient requirement mainly that of micro nutrients (Nnam and Njoku, 2005).
Fruit juice is clear or uniformly recovered from fruits by pressing and other
mechanical means (Harmankaya et al., 2012).In general juice is a liquid extracted
from the fruit, although numerous fruit juices are the results of expressing the
liquid from the complete or cut fruit. There are some fruits where the difference is
not so apparent, e.g. fruits like mango, apple and banana when squeezed yields
little or no juice; somewhat flesh is obtained which when comminutes will result
in a thick pulp and directly cannot be consumed as drink. While in case of lemon,
expressed fluid cannot be called juice, it is also bitter to consume and can only be
used as juice when diluted with sugar and water. The ingredients of processed
juices contain mainly water, sugar, preservatives, and color and fruit pulps.

3
Commonly used preservatives are benzoate and sulphur dioxide (Rah man et al.,
2011).
1.2 COMPOSITION OF FRUIT JUICES
Fruit juices contain nutrients, minerals, trace elements, vitamins and
phytochemicals. Phytochemicals are a group of plant derived compounds to be
responsible for much of the disease resistance from diets high in fruits, vegetables,
beans, cereals, and plant based beverages such as tea and wine (Arts and Hollman,
2005)
Transfers of electron or hydrogen from a substance to an agents call
oxidation. In oxidation Free radicals are produce can begin chain reactions. In a
cell chain reaction occurs it can source rupture or death to the cell. Antioxidants
stop these chain reactions by removing free radical intermediates, and inhibit
other oxidation reactions. Antioxidants are often reducing agents such as thiols,
ascorbic acid, or polyphenols (Prabhat, 1995).
A vitamin is an organic compound required by an organism as a very
important nutrient in partial amounts.(Lieberman and Bruning,1990) Vitamins are
classifying as either water soluble or fat soluble. In humans there are 13vitamins:
4 fat-soluble (A, D, E, and K) and 9 water-soluble (8 B vitamins and vitamin C
Water soluble vitamins dissolve easily in water are readily excreted from the
body, to the degree that urinary output is a strong predictor of vitamin
consumption (Fukuwatari and Shibata 2008), because they are not as readily
stored, more consistent intake is important (Bellows and Moore, 2008). Many
types of water-soluble vitamins are synthesized by bacteria. (Said and
Mohammed, 2006) through the intestinal tract with the help of lipids, fat soluble
vitamins are absorbed because they are further possible to build up in the body,
they are more likely to lead to hypervitaminosis than are water soluble vitamins.
In cystic fibrosis Regulation of fat soluble vitamin is of particular importance
(Maqbool and Stallings, 2008).
Minerals beside with vitamins are components of enzymes.Minerals also
makes up of bone and blood tissue and help to retain normal cell functions.The

4
major minerals comprise calcium, chloride, magnesium, phosphorus, potassium,
sodium and sulfur. Trace minerals, needed in very small amounts; include boron,
chromium, cobalt, copper, fluoride, manganese, nickel, selenium, vanadium and
zinc.
Dietary fiber is the edible parts of plants that are opposed to digestion and
absorption in the human small intestine, with complete or partial fermentation in
the large intestine. Dietary fiber includes polysaccharides, oligosaccharides,
lignin, and associated plant substances. Dietary fibers support favorable
physiologic effects including laxation, and/or blood cholesterol decrease, and/or
blood glucose attenuation (American Association of Cereal Chemists, 2001).
1.3 TYPES OF FRUIT DRINKS
Sport or Isotonnesic beverages are planned to re-establish fluids and
electrolytes and provide additional power during periods of powerful exercise.
They have 5 to 10 low content juice base and added levels of sucrose, glucose
(less sweet). These are premeditated to increase the customer’s awareness that
they can have more energy also by increasing the levels of sugars in the beverage
or having a stimulant like caffeine. These can be marketed to office employees in
cities or to laborers who require extra energy throughout a long day.(Pre
Feasibility Study Fruit Juice, 2007).
Nutraceutical type is considered to contribute strong benefits and decrease
the hazard of a variety of diseases. They include vitamin C as of citrus, vitamin A
from fruits or vegetable juices and a blend of plant extracts.
Herbal beverages are similar to to Nutraceutical drinks, except in addition
herbs to a beverage these herbs are not risky at little levels of consumption; upper
levels, can be converted into poisonous.
Smart beverages may contain local herbs be helpful for growing mental
capabilities.

5
Fun beverages is proposed to cover a most eye appeal and good taste
Some of these have lynching colored particles or have extraordinary names that
demand to kids. Fun beverages include a smallest amount of juice, but a most
amount of advertising and sticky tag type. (Pre Feasibility Study Fruit Juice,
2007).
1.4 SIGNIFICANCE OF FRUIT JUICES
Against diseases Juices are most effective associated to chronic
inflammation, cancer, heart and bone diseases, problems related to cognition and
aging, and possibly
Vitamins take considerable role, since are vital for life; however the
majorities are not formed by the body. The body needs vitamin C (ascorbic acid)
to form collagen, cartilage, muscle, and blood vessels, and to help absorb iron.
Orange juice is rich in vitamin C, an excellent source of bioavailable antioxidant
phytochemicals (Frank et al., 2005), and significantly improves blood lipid
profiles in people affected by hyper-cholesterolemia (Kurowska et al., 2000).
Fruit juices support detoxification inside the human body (Deanna and Jeffrey,
2007). Fruit juices is really recognized for their capability to raise serum
antioxidant power and even equalize the thing cannot be attributed to fruit juices.
On the opposing oxidative pressure and inflammation normally caused by high fat
and high sugar meals. (Ghanim et al., 2010), juice consumption overall in Europe,
Australia, New Zealand and the US has increased possibly due to public
awareness of juices as a healthy natural source of nutrients and increased public
interest in health issues(TOC, 2007). In fact intake of fruit juice has been
constantly related with reduced risk of many cancer types (Brock et al., 1988;
Uzcudun et al., 2002 ; Kwan et al., 2004) might be protective beside stroke
(Feldman,. 2001) and holdup the beginning of Alzheimer's disease (Dai et al.,
2006).

6
1.5 SOFT DRINKS
Soft drinks are sweet water based nonalcoholic beverages, mostly with balanced
acidity (Eyong et al., 2010). They are usually flavoured and coloured and the main
component being water which is necessary for hydration (Adepoju Bello et al., 2012).
The use of sugar sweet beverages is related with load and obesity, and
changes in utilization can help predict changes in weight (Malik et al., 2006)
(Vartanian et al., 2007).The consumption of sugar syrupy soft drinks can also be
connected among a lot of diseases, include. Metabolic syndrome and
cardiovascular risk factors, (Yoo et al., 2004), and elevated blood pressure (Raben
et al., 2002).
Soft drinks contain high concentration of simple carbohydrates: glucose,
fructose, sucrose and other simple sugars. Through oral bacteria Acid produce by
fermentation of carbohydrates which dissolve tooth enamel in the dental decay
process; consequently, increase threat of dental caries. The hazard is larger if the
time of use is high. (Marshall et al., 2004).
Hypokalemia (low potassium levels) related to chronic excessive
consumption (4-10 L/day) of colas. (Tsimihodimos et al., 2009) Soft drinks
related to bone density and bone loss One theory to explain this relationship is that
the phosphoric acid contained in some soft drinks (colas), displaces calcium from
the bones, lower bone density of the skeleton and leading to weakened bones, or
osteoporosis.( Heaney and Rafferty, 2001).
1.6 PHYSICOCHEMICAL PARAMETER 1.6.1 Temperature
In food growth of microorganism depend on temperature blow its freezing
point, water becomes crystalline and inaccessible, effectively halting microbial
growth Many enzymatic reactions are either very slow or nonexistent at a
temperature obove freezing with a result that some microorganism are unable to
grow. Those that can do so at a reduce rate (Nester et al., 2004). Various species

7
of fungi can grow at a temperature range from 6 to 50 degree centigrade and
optimum temperature range is 20 to 35 degree centrigrade. Storage of products at
refrigerator temperature or below is not always best for the maintenance of
desirable quality of some fruits.
1.6.2 PH Scale
The concentration of acid of sample is expressed by its pH. The total
acidity of fruit juices is due to the presence of a mixture of organic acids, whose
composition varies depending on fruit nature and maturity. The main acids in
fruits are tartaric, malic, citric, succinic, lactic and acetic acids. Organic acids take
the lead in importance for characteristics and nutritive value of fruit juices and
confer individual originality among natural beverages. (Tasnim et al., 2010).Fruits
juices generally have relatively high levels of sugar and a low pH and this favors
growth yeasts, molds and some acid tolerant bacteria (Doyle, 2007). Benzoic,
sorbic and propionic acid are weak organic acid are added to food such as bread,
cheese and juice to prevent microbial growth. AT low pH this organic acid
predominates they change cell membrane Function and interfere with energy
transformation.
1.6.3 DISSOLVE SOLID
Minerals, salts, metals, cations or anions dissolved in water are called
dissolved solid. They are united simultaneously with sugar and fruit acid. Major
contributors of pectin, glycosidic material, salt of metals and electrolytes sodium,
potassium, calcium etc. TDS content is widely influenced by the joint effect of
storage of maturity and ripening are more important quality factors for most fruit
juices (Tasnim et al., 2010). The solid content of food foodstuffs are linked to
their food values. The greater the solid content of fruit the larger is its dietary
value (Ikegwu and Ekwu, 2009).
The moisture content of foods besides influencing engineering properties
of fruits and vegetable is also of profound importance in determination of shelf
life of unprocessed and processed fruit and vegetables since it effects

8
physicochemical properties,microbiological spoilage and enzymatic change.
Furthermore the high moisture nutritional contents of the fruits and their juices
make them suitable for spoilage organisms and agent to grow and multiply. Their
moisture content has to be reducing to the level that will create moisture
unavailable for microbial growth. These can be achieving through refrigerating,
freezing, or drying. All these process require transfer of heat (Ikegwu and Ekwu,
2009).
1.6.4 CONDUCTIVITY
Conductivity evaluates the capability to conduct electric current (Braun,
1983). It can sometimes be used to determine the amount of total dissolve solid.
1.6.5 DISSOLVE OXYGEN
Dissolved oxygen is the thing that determines whether the natural changes
are brought about by aerobic or by anaerobic organisms (Sawyer et al., 2003) In
intercellular spaces of fruit air is naturally present during extraction of juice cell
are compressed cell wall is disrupt and air is mixed into the juice and dissolved
gas associated with the soft tissue particles. Juices contain compartmentalized
active enzymes in the shape of organelles such as mitochondria, endoplasmic
reticulum, ribosome and lysosomes. The serums of the juices and juice blends
contain cytoplasmic respiratory enzymes which are capable of breaking down
sugars to pyruvic acid. Pyruvic acid can be broken down in the mitochondria, in
the presence of oxygen, to carbon dioxide and water by respiratory enzymes
(Calderon and Bolin 1990).
In the aerobic respiration of a fruit, sugars and acids are degraded
enzymatic ally in the respiration process to carbon dioxide and water. As well,
adenosine triphosphate (ATP), a high energy biocompound, is produced in the
aerobic respiration pathway. ATP is necessary for the protection of the structures
of organelle membranes, aerobic respiration process and the synthesis of pigments
and flavour compounds (Calderon and Bolin 1990).but oxygen is absent in the
fresh juice blends, then anaerobic respiration may continue. In the anaerobic

9
respiration pathway, pyruvic acid is decomposed to off flavour compounds such
as ethanol, lactic acid and acetaldehyde.Further, only small amounts of ATP are
formed and thus membrane structures may decompose with possible quality
deterioration of the juice during storage.(Torres et al., 2009).
1.6.6 SALINITY
Salinity indicates the presence of salt in the sample and is important from
the viewpoint of pH
1.6.7 SPECIFIC GRAVITY
Density is the measure of how close and how heavy is the particle of
matter in a sample. The value of a particular fruit can be determined by its density
(Ikegwu and Ekwu, 2009). According to(Nwanekezi and Ukagu, 1999). Density is
a manufacturing characteristic that is functional for the safeguarding during
separation and is regarded as an essential worth of fruit and vegetables.
Specific gravity is the ratio of the density (mass of a unit volume) of a
substance to the density (mass of the same unit volume) of a reference substance.
The reference substance is water for liquids or air for gases. Specific gravity is a
ratio and thus dimensionless. If the measurement temperature of water is 4°C, the
numerical values of density and specific gravity are the same.
1.7 PACKING MATERIALS.
Food packaging can wait product drop, remain the valuable effect of
processing, increase shelf life, and keep or raise the value and safety of food.
Packaging provides resistance from three main classes of outside influences like
chemical, natural, and physical (IFT, 2007).
Environmental influences such as exposure to gases (typically oxygen),
moisture (gain or loss), or light (visible, infrared, or ultraviolet). Chemical safety

10
minimizes these changes. Glass and metals give absolute wall to chemical and
extra ecological agents.
Natural defense provides a barrier to microorganisms, preventing disease.
further sustain conditions to control ripening and aging.
Physical protection shields food from mechanical damage and includes
cushioning against the shock and vibration encountered during distribution.
Typically developed from paperboard and corrugated materials, physical barriers
resist impacts, abrasions, and crushing damage, so they are widely used as
shipping containers and as packaging for delicate foods such as eggs and fresh
fruits.
Package aim and construction take part in determining the shelf life of a
food product. The correct choice of packaging materials and technologies
maintains product quality and freshness in delivery and storage. Materials that
have conventionally been used in food packaging include glass, metals
(aluminum, foils and laminates, tinplate, and tin-free steel), paper and
paperboards, and plastics
Glass has an very long history in food packaging; the 1st glass objects for
holding food are believed to have appeared around 3000 BC (Sacharow and
Griffin, 1980). The manufacture of glass containers involves heating a mixture of
silica (the glass former), sodium carbonate (the melting agent), and
limestone/calcium carbonate and alumina (stabilizers) to high temperatures until
the materials melt into a thick liquid mass that is then poured into molds.
Recycled broken glass (cullet) is also used in glass manufacture and may account
for as much as 60% of all raw materials. Glass containers used in food packaging
are often surface-coated to provide lubrication in the production line and eliminate
scratching or surface abrasion and line jams. Glass coatings also increase and
preserve the strength of the bottle to reduce breakage. Improved break resistance
allows manufacturers to use thinner glass, which reduces weight and is better for
disposal and transportation (McKown , 2000).

11
Glass has several advantages for food packaging applications because it is
odorless and chemically inert with virtually all food products, it is impermeable to
gases and vapors, so it maintains product freshness for a long period of time
without impairing taste or flavor. The ability to withstand high processing
temperatures makes glass useful for heat sterilization of both low acid and high-
acid foods. Glass is rigid, provides good insulation, and can be produced in
numerous different shapes. The transparency of glass allows consumers to see the
product, yet variations in glass color can protect light-sensitive contents. Finally,
glass packaging benefits the environment because it is reusable and recyclable.
Its heavy weight adds to transportation costs. Susceptibility to breakage
from internal pressure, impact, or thermal shock. However, metal is the most
versatile of all packaging forms. It offers a combination of excellent physical
protection and barrier properties, formability and attractive potential, recyclability,
and consumer acceptance.
The two metals most predominantly used in packaging are aluminum and
steel. Whereas, aluminum is used to make cans, foil, and laminated paper or
plastic packaging, aluminum is a lightweight, silvery white metal derived from
bauxite ore, where it exists in combination with oxygen as alumina. Magnesium
and manganese are often added to aluminum to improve its strength properties
(Page et al., 2003). Aluminum is highly resistant to most forms of corrosion its
natural coating of aluminum oxide provides a highly effective barrier to the
effects of air, temperature, moisture, and chemical attack. Aluminum has good
elasticity and surface resilience, excellent malleability and formability, and
outstanding embossing potential. It is also an ideal material for recycling because
it is easy to reclaim and process into new products. Pure aluminum is used for
light packaging of primarily soft-drink cans, pet food, seafood, and prethreaded
closures. Contrary to this, the main disadvantages of aluminum are its high cost
compared to other metals (for example, steel) and its inability to be welded, which
renders it useful only for making seamless containers.

12
Aluminum foil is made by rolling pure aluminum metal into very thin
sheets Moreover; aluminum foil is available in a wide range of thicknesses, with
thinner foils used to wrap food and thicker foils used for trays. Like all aluminum
packaging, foil provides an excellent barrier to moisture, air, odors, light, and
microorganisms. It is inert to acidic foods and does not require lacquer or other
protection. Although aluminum is easily recyclable, foils cannot be made from
recycled aluminum without pinhole formation in the thin sheets.
The binding of aluminum foil to paper or plastic film to develop blockade
property is called lamination. While lamination to plastic enables heat seal ability,
the seal does not completely block moisture and air.. A less expensive alternative
to laminated packaging is metalized film.
Metalized films are plastics containing a thin layer of aluminum metal
(Fellows and Axtell 2002). These films have improved barrier properties to
moisture, oils, air, and odors, and the highly reflective surface of the aluminum is
attractive to consumers. More flexible than laminated films, metalized films are
mainly used to package food and drink.
Tin plate Produced from low carbon steel (blackplate), tinplate is the result
of coating both sides of blackplate with thin layers of tin. The coating is achieved
by dipping sheets of steel in molten tin (hot-dipped tinplate) or by the electro-
deposition of tin on the steel sheet (electrolytic tinplate). Although tin provides
steel with some corrosion resistance, tinplate containers are often lacquered to
provide an inert barrier between the metal and the food product. Commonly used
lacquers are materials in the epoxy phenolic and oleoresinous groups and vinyl
resins.
In addition to its excellent barrier properties to gases, water vapor, light,
and odors, tinplate can be heat treated and sealed hermetically, making it suitable
for sterile products. Because it has good ductility and formability, tinplate can be
used for containers of many different shapes. Thus, tinplate is widely used to form
cans for drinks, processed foods etc.Tinplate is an excellent substrate for modern
metal coating and litho printing technology, enabling outstanding graphical

13
decoration. Its relatively low weight and high mechanical strength make it easy to
ship and store. Finally, tinplate is easily recycled many times without loss of
quality and is significantly lower in cost than aluminum.
Plastics are made by condensation polymerization (polycondensation) or
addition polymerization (polyaddition) of monomer units. There are several
advantages to using plastics for food packaging.. Because they are chemically
resistant, plastics are low cost and lightweight with a wide range of physical and
optical properties. Reality, many plastics are heat sealable, easy to print, and can
be incorporated into manufacture processes where the package is formed, filled,
and sealed in the same production line. The major disadvantage of plastics is their
variable permeability to light, gases, vapors, and low molecular weight molecules.
In food packaging use of plastics has continuous to increase due to the
low cost of materials and functional advantages (such as thermosealability,
microwave ability, optical properties, and unlimited sizes and shapes) above usual
materials such as glass and tinplate (Lopez Rubio et al., 2004).
Pete is most frequently used polyester in food covering, provides a good
barrier to gases (oxygen and carbon dioxide) and moisture. In addition has good
resistance to temperature, mineral oils, solvents, and acids, but not to bases.
Consequently, Pete is suitable particularly beverages and mineral waters. The use
of Pete to build plastic bottles for carbonated drinks is increasing steadily (IFT ,
2007) The main reasons for its reputation are its glass-like transparency, adequate
gas barrier for protection of carbonation, light mass.
Paper and paperboard are sheet resources made from cellulose fibers
derived from wood by using sulfate and sulfite. The fibers are then pulped and/or
bleached and treated with chemicals such as slimicides and strengthening agents
to produce the paper product .To develop their poor blockade property, coatings
such as waxes or polymeric materials can be used to Apart from their poor barrier
properties oxygen, carbon dioxide and water vapor other drawbacks include their
being opaque, porous and not heat sealable (Raheem, 2012).

14
1.8 FACTORS AFFECTING THE MICROBIAL CONTAMINATION
Soil is a rich pond for a variety of microbes and the non pathogenic flora is
important for the mineralisation of plants and animals after their death in the
environment. Due to irrigation and fertilisation with manure and sludge or due to
droppings of animals in the farming area, pathogenic organisms from the human /
animal reservoir can be found in the soil. Tissue degrading properties of this flora
contaminating fruits and vegetables may cause damage during transport and
storage of products thereby exposing them to further microbial attack. Soil is a
tank of foodborne pathogens, such as Bacillus cereus, Clostridium botulinum, and
Clostridium perfringens (Lund, 1986).
Water is mainly used for irrigation of plants and its value will be different
depending on whether it is surface water or potable Water can be a cause of
contaminating microorganisms. Surface water from streams and lakes may be
contaminated with pathogenic protozoa, bacteria and viruses. The transfer of
foodborne pathogenic microorganisms from irrigation water to fruits and
vegetables will depend the irrigation technique and on the nature of the produce
(NACMCF, 1999a). Spray irrigation would be likely to raise the risk of
contamination in variation to drip irrigation or flooding, water is used for the
transfer of nutrients to the plant in hydroponic water from sewage plants can be
used for this purpose. Without further hygienic treatment it may represent a risk
for contaminating the crop.
For the Production of fruit and vegetable commonly used organic fertiliser
as Sewage, manure, slurry, sludge and compost of human and animal origin
particularly in organic production systems. These fertilisers have a faecal source
indicates a potential risk of contamination by viruses, bacteria and parasites
pathogenic to humans.
Fruits and vegetables can become infected with pathogenic
microorganisms during harvesting through faecal material, human handling,
15
harvesting equipment, transport containers, wild and domestic animals, transport
ice or water (Beuchat, 1995)
Environmental conditions and transportation time will also influence the
hygienic quality of the produce prior to processing or consumption. Treatment of
fruits and vegetables includes handling, storage, transportation and cleaning.
During these practices conditions may arise which lead to cross contamination of
the produce from other agricultural materials or from the workers. Poor handling
can damage fresh produce, rendering the product susceptible to the
growth/survival of spoilage and pathogenic microorganisms. This damage can
also occur during packaging and transport. The presence of cut and damaged
surfaces provides an opportunity for contamination and growth of microorganisms
and opening into plant tissues (Francis et al., 1999).
Food spoilage is the chemical reactions that cause unpleasant sensory
changes in foods are mediated by a variety of microbes that use food as a carbon
and energy source. Spoilage microbes are often common inhabitants of soil,
water, or the intestinal tracts of animals and may be dispersed through the air and
water and by the activities of small animals, particularly insects. These organisms
include prokaryotes (bacteria) single celled organisms lacking defined nuclei and
other organelles, and eukaryotes, single celled (yeasts) and multicellular (molds)
organisms with nuclei and other organelles.
Coliform are commonly found in the environment (e.g., soil or vegetation)
and are generally not dangerous. If only total coliform bacteria are detected in
drinking water, the source may be environmental. Fecal contamination is not
possible. Still, if environmental pollution can enter the system, there may also be a
way for pathogens to enter the system.
Fecal coliform are sub group of total coliform bacteria. They come out in
large quantity in the intestines and feces of people and animals. The presence of
fecal coliform in a drinking water sample often indicates recent fecal
contamination, meaning that there is a greater risk that pathogens are present than
if only total coliform bacteria is detected.
16
Yeasts are a division of a large group of organisms called fungi that also
includes molds and mushrooms. They are generally single celled organisms that
are modified for life in particular, usually liquid, environments and, unlike some
molds and mushrooms, do not produce toxic secondary metabolites. There are
over 800 species of yeasts currently described except simply about 10 are
commonly associated with spoilage of foods prepared in factories operating good
standards of hygiene and using properly applied chemical preservatives (Pitt and
Hocking, 1997). Others are found if something goes wrong during manufacture;
for example, incorrect preservative level, poor hygiene or poor quality raw
ingredients.
Molds are filamentous fungi that remain in nature but also attack a wide
variety of foods and other materials useful to humans. They are well adapted for
growth on and through solid substrates, generally produce airborne spores, and
require oxygen for their metabolic processes. Most molds grow at a pH range of 3
to 8 and some can grow at very low water activity levels (0.7–0.8) on dried foods.
Spores can tolerate harsh environmental conditions but most are sensitive to heat
treatment.. Different mold species have different optimal growth temperatures,
with some able to grow in refrigerators.
Mycotoxins are toxic secondary metabolites produced by fungi growing
within or on foods. Patulin is the most common mycotoxins associated with fruit
juice, particularly apple juice (Pitt and Hocking, 1997).Mycotoxins causing severe
disorders like cancer, immune suppression, or endocrine disruption. Since
mycotoxins are very stable and mainly resistant against heat treatment and acidic
environment, they remain in the food during processing and storage, causing a
serious food safety problem (Filtenberg et al., 1996). Mould troubles can be
separated into two types:
1. Growth of a multiplicity of moulds due to reduced cleanliness inside the
plant or field atmosphere. The previous type can source tainting, discolouration
and other universal problems associated with unpleasant mould growth.

17
2. Growth of heat resistant moulds within heat processed juices. The later
type can effect in slow growth of the mould surrounded by the processed product.
(Pitt and Hocking, 2009).
1.9 FACTORS AFFECTING THE CONTAMINATION OF
HEAVY METALS
In the past century due a significant increase in economic activities and
industrialization. Primary sources of atmospheric metallic burden such as burning
of fossil fuels and petroleum industry activities have been identified as leading to
environmental pollution. Several studies have shown that heavy metals such as
lead, cadmium, nickel, manganese and chromium amongst others are responsible
for certain diseases (Hughes, 1996).Heavy metals gain into the surroundings
through water, soil, air and land activities like powerful agriculture, power
generation, industrial discharges, leakage of municipal landfills, infected tank
effluent (Hughes, 1996).
In fruits, vegetables and other crops contamination of heavy metal main
concern since their accumulation in food crops in higher concentrations might
cause serious hazard to human health if the crops are consumed (Ashworth and
Alloway, 2004) Such addition has been reported by (Okoronkow; et al 2005)
Arsenic, lead, zinc and other metals have been found in food crops a limit that top
over the recommended nutritional allowance. While many heavy metals do not
play any important role in the body of plants. In plant body iron, zinc is essential
due to their physiological functions. The essential elements are very vital since
they are concern in a variety of enzymes systems in the human body. But high
concentrations are poisonous (Miller and Miller 2000).
Systems in which toxic metal elements can induce impairment and
dysfunction include the blood and cardiovascular, eliminative pathways (colon,
liver, kidneys, skin), endocrine (hormonal), energy production pathways,
enzymatic, gastrointestinal, immune, nervous (central and peripheral),
reproductive and urinary that have lethal effects on man and animals. These

18
diseases include abdominal pain, chronic bronchitis, kidney disease, pulmonary
edema (accumulation of fluid in the lungs), cancer of the lung and nasal sinus
ulcers, convulsions, liver damage and even death (Hughes, 1996).
1.10 HEAVY METALS (Trace Essentional and Toxic Metals)
A set of elements through mass density larger than 4.5 g /cm3are called
heavy metals.(Szyczewski et al., 2009) Traces Metals consist of that metals which
are required by the body in biological system of the human body are discussed
below.
Chromium (Cr)
It is found in meat, Fat, Vegetable oilman refined food .Chromium
maintain the normal glucose tolerance in the body, its deficiency result impaired
glucose tolerance can lead to diabetes mellitus Toxicity of metal ion depends on
its chemical form as chromium six more toxic than chromium four because it is
strong oxidizing agent and can cause oxidative degradation of the bimolecular
(Bhattacharya ,2005).
Iron (Fe)
In the food iron occur in two forms Heme iron and non heme iron .Heme
iron derived from animals such as meat, poultry and Fish. Iron serve as a cofactor
to enzymes involved in redox reactions. Most of the body iron is found in two
protein in the red blood cell hemoglobin and in the muscle cell is the myoglobin
There are special protein which helps the body to absorb iron from the food,
Mucosal ferreting receives iron from the GI tract and store it in the mucosal cells
of the of the small intestine ,when body required iron mucosal ferritin release
some iron to another protein called mucosal transferritin ,which transfer iron to
another protein called blood transferritin to rest of the body (Whitney and Rolfes,
2002). Excess metal deposit in liver, kidney and brain and can lead to their
collapse (Bhattacharya,2005) Iron deficiency and iron deficiency anemia are not
same iron deficiency refers to depleted body iron store within regard to the degree

19
of depletion or to the presence of anemia. While iron deficiency anemia refers to
the severe depletion of iron store that result in a tow hemoglobin concentration. In
iron deficiency anemia, red blood cells are pall small they cannot carry enough
oxygen from the lungs.( Whitney and Rolfes, 2008). .
Zinc (Zn)
Zinc is found in high rich foods such as beef. Poultry, legumes and nuts.
Zinc is an essential element and occurs in many enzymes. Acts as a cofactor in
various enzymatic reactions.. It is very essential for human nutrition and its
absence from the diet lead to retarded growth.(Whitney and Rolfes)
Defficiency of Zinc may effect on Zn containing enzyme. The toxicity of zinc due
to unnecessary intake may lead to electrolyte imbalance, nausea, anemia, and
lethargy (Onianwa et al. 1999) Excess of Zinc cause deficiency of copper and
calcium. Large excess cause paralysis and even death is occur (Bhattacharya,
2005)
Nickel (Ni)
It is essential in trace amount. The usual oral intake of Nickel in human
diet is 0.3-0.6 /day.Nickle play important role in biological system, such as
protein synthesis .control of hormone and activate many enzyme.Nickle
deficiency can lead anemia, dermatitis and deformities of the leg bone(Said et al.,
1987) Ingestion of Nickel is in excess may cause bronchial cancer, skin and
respiratory disorder. Toxicity of nickel has the following consequences: higher
chances of development of lung cancer, nose cancer, larynx cancer and prostate
cancer, sickness and dizziness after exposure to nickel gas, lung embolism,
respiratory failure, birth defects, asthma, chronic bronchitis and allergic reactions
(Kasprzak et al., 2003).
Manganese (Mn)
It is an essential element required by the body sources of manganese are
fruits, vegetable nuts, grains, tea etc. In a lot enzymatic reaction Mn acts as a
cofactor. It stimulates bio synthesis of cholesterol and fatty acids (sing, 2007).

20
It absence from diet leads to retard growth, rarefaction of bones, reproductive
function as well as disorder of central nervous system (said et al., 1987).Toxicity
can lead carcinogenesis which is common industrial problem in mine, refinery and
battery workers. (Said et al., 1987).
Cobalt (Co)
It is found in daily edible routine items. Nutritional requirements of cobalt
are 0.3-4.0 mg/day in the form of Cyanocobalamine. Cobalt as an integral
component of vitamin B12 (Cyanococobalamine) as a coenzyme it is an essential
for the production of blood cell. Defficiency of cobalt result in hematological
disorder such as precious anemia, thalassemia, and sickle cell anemia. Toxicity
leads to polycythemia.( Said et al, 1987).
Copper (Cu)
Sources of copper are sea food, seeds, legumes and whole grain. Copper is
a component of several enzyme, involved in electron transfer, oxygenation and
oxidation process, therefore deficiency of copper can cause deactivation of obove
process can result anemia(Bhattacharya , 2005)
It play role in formation of bone Wilson disease ,in which copper cannot tolerated
at a normal level ,clinical manifestation are liver disease ,neurological damage and
brown or green ring in the cornea of the eye (Said et al., 1987).
Lead (Pb)
Is an important component of many processes it is also used in so many
products ,Lead is used in primers and explosives as asides ( Stockinger et al.,
1981) It was used as gasoline additive, tetraethyl and tetraethyl (ATSDR, 1999).
Use of lead packing in storage and transport ingestion of lead occur and
then absorbed in soft tissues. Lead great affinity for SH group of enzymes and
hence gets bound and deactivate them as a results biosynthesis of heme inhibited
leading anemia. Furthermore effects biosynthesis of bone because replaces
calcium in bone through divalent lead. (Bhattacharya, 2005)

21
Cadmium (Cd)
Cd is a group nephrotoxicant that is absorbed into the body from
nutritional sources and cigarette smoking (Satarug et al., 2004) Cadmium replaces
zinc biochemically, causes high blood pressure, kidney damage, and destruction
of red blood cell. Cadmium is a toxic and carcinogenic element. The International
Agency for Research on Cancer has identified Cd as a known human carcinogen
(Satarug et al.,2004) Pb and Cd poisoning consequences from the interaction of
the metal with biological electron donor groups, such as the sulfhydryl groups,
which interferes with a multitude of enzymatic processes(Krejpcio et al., 2005).
1.11 MOTIVATION OF THE STUDY
predictably in Pakistan and in general all over the world citizens favor to
consume ordinary drinks rather than carbonated soft drinks and this knowledge is
gaining more money day by day which also adds to the expand of the fruit juice
industry. In addition hotels, hospitals are also rising day by day where juices
could be marketed productively. As well the worldwide progress of preferring
fresh fruits and juices also marks possibilities of growth in this sector. Also, the
growing exports volume and removal of CED (customs and excise duty) on fruit
juices (produced locally) could further supplement significant growth in the fruit
juice industry. Most of the available fruit juice units are being operated in Lahore,
Bahawalpur, Karachi, Hyderabad, Hatter (NWFP), Lorelei, and Sargodha.
In current years juices have been incorporated considerably in the diet of
most people, irrespective of age. as a result, give to good health (Tasnim et al.,
2010). In mainly countries, intake of liquids must be high to recompense for the
probable losses from respiration (Al Jedah and Robinson, 2002; Victor et al.,
2012). Fruit juices are appropriate a vital part of the recent diet in much
community. They are healthful beverages and can play a major part in a healthy
diet since they suggest good taste and a variety of nutrients found naturally in
fruits. Fruit juices contain nutrients, minerals, trace elements, vitamins and
phytochemicals that have a complete range of fitness benefits. Vitamins play a
major role, because they are necessary for life, yet most are not produced by the

22
body. Soft drinks contain high concentration of simple carbohydrates: glucose,
fructose, sucrose and other simple sugars. through oral bacteria Acid produce by
fermentation of carbohydrates which dissolve tooth enamel in the dental decay
process; therefore, sweetened drinks are probable to increase danger of dental
caries. The hazard is larger if the rate of use is high. (Marshall et al., 2004). Food
packaging can wait product drop, remain the valuable effects of processing,
expand shelf life, and keep or raise the quality and safety of food. Packaging
provides protection from three major classes of external influences: chemical,
natural, and physical. During harvesting through faecal material, human handling,
harvesting equipment, transport containers, wild and domestic animals, air,
transport vehicles, ice or water Fruits and vegetables can become
contaminated(Beuchat, 1999). Environmental conditions and transportation time
will also influence the hygienic quality of the produce prior to processing or
consumption. Treatment of fruits and vegetables includes handling, storage,
transportation and cleaning. During these practices conditions may arise which
lead to cross contamination of the produce from other agricultural materials or
from the workers. Poor handling can damage fresh produce, rendering the product
susceptible to the growth/survival of spoilage and pathogenic microorganisms.
This injures can also happen in wrapping and transportation. The presence of slice
and broken surfaces provides a possibility for pollution and development of
microorganisms and opening into plant tissues (Francis and Beirne, 1999).
Environmental pollution as a consequence of man’s growing behavior such as
burning of fossil fuels and vehicle exhaust emission has increased. In the long-ago
century due mainly to significant increases in economic activities and
industrialization. Burning of fossil fuels and petroleum industry activities have
been recognized as primary sources of atmospheric metallic load most important
to environmental pollution. Several studies have shown that heavy metals such as
lead, cadmium, nickel, manganese and chromium amongst others are responsible
for certain diseases (Hughes, 1996).Heavy metals obtain into the environment
through water, soil, air and land activities like powerful agriculture, power
generation, industrial discharges, leakage of municipal landfills, infected tank
effluent.

23
Taking into description these and other matter and factors affecting human
life, we are motivated to identify the hazardous impacts of fruit juices on human
health with diverse analysis of their use, their packing, their contamination due to
unhealthy ingredients and other numerous reasons.
Based on the literature reviewed for the study, it can be said that at yet, no
one identified the factors that affect the health of those humans who are using fruit
juices. This study is unique as it analyses the contamination of juices and soft
drinks with specific focus on heavy metal their packing and microbial load present
in the juices and soft drinks.
11.12 OBJECTIVE OF THE STUDY
The present study aims to identify the presence of heavy metals that
include essential trace and toxic elements in a variety of fruit juices and soft
drinks of different packing materials. The packing material includes tetra pack
(paper card board) plastic bottle, sachet pack (Laminated paper) and tin pack.
The study mainly focuses to determine the actual concentration in ppm in
consumer product. Concentrations of sample that are obtained by the analysis are
compared with the standard set by united state environmental protection agency
(US-EPA) and world health organization (W.H.O) for drinking water. In addition
results are compared by the daily intake requirements of the body. Furthermore
we also compare mean of heavy metals by applying (ANOVA) test to estimate the
level of heavy metals in different juices and soft drinks packed in various packing.
Study work measured the physiochemical parameters such as pH, conductivity
dissolved solid, dissolved oxygen and salinity, by using HACH sension 105
parameter, and specific gravity by R.D bottle method.
The study isolates the fungal species and microbial load in a variety of
commercially available fruit juices and soft drinks of different packaging material.

24
In this study we also correlate physicochemical parameters with microbiological
finding of the study. Result of bacterial load in a variety of fruit juices compare
with gulf standards as well as isolated fungal species with literature review in
juices also in soft drinks.

25
LITERATURE REVIEWED

26
LITERATURE REVIEWED
Based on the literature reviewed for the study, it can be thought that at
up till now, no one identified the factors that influence on health of those humans
who are using fruit juices and soft drinks. This study is unique in nature as it
analyses the contamination of juices and soft drinks with specific focus on their
packing and heavy metals to analyze microbial load present in the juices and soft
drinks.
(Pasha et al., 1994) Study showed that brand and the bacthes dissimilar
significantly in chemical composition and sensory characteristic.
(Niazi et al., 1997). In the reported work a simple and low price process
has been described for the determination of Na, Ca, Cr, Fe, and Zn in mango fruit
juices using atomic absorption spectrometry technique. Method involves digestion
of samples with nitric acid at 105oc on an oil bath for 45 minute. Relative standard
-deviation for major elements was superior than 1% and for trace element around
7%.
(De Donno et al., 1998) Reported that juices in soft pack cartons seemed
extra at danger than the juices in glass bottles. Heat resistant moulds (Chrysonilia
sitophila, Aspergillus spp.), representing that the heat treatment was not sufficient,
and all over environmental moulds (Rhizopus oryzae, Penicillium spp., Botrytis
cinerea, Trichoderma viridae, etc.) due to exogenous contamination during the
processing and filling stages were isolated.
(Khan et al., 1999). Juices of different citrus fruit samples have been
studied. The toxic metallic constituents (Ni, Cd, Cu, Zn, and Mn) were low in
contraction.
(Ashraf et al., 2000) In reported work heavy trace metals and
macronutrients were determined in various soft drinks and juices by applying
atomic absorption spectrophotometer technique The study exposed that dietary
value of local carbonated waters was better than that of fruit juices. The local
27
pepsi cola sample contain highest mercury (0.535) mg/l, while TOP showed
maximum arsenic (0.837) mg/l. Out of cardboard packed juices, apple juice was
found to have(2.920) maximum arsenic.
(Watto et al., 2003) In this study an assessment of trace and toxic elements
in glass bottle soft drinks was done by means of atom ic absorption
spectrophotometer technique values of Fe, Ni, Pb, Cd and Al were measured
above recommendation also may soft drinks contain disease producing
microorganism.
(Krejpcio et al., 2005). Study was accepted out in poland.content of Pb,
Cd, Cu and Zn in fresh fruit and juices was determined using atomic absorption
spectrometry (AAS)most fruit samples (90.4%) contained low levels of heavy
metals. But, the remaining 9.6% had increased heavy metal contents (Pb 2.2%, Cd
4.4%, Cu, 1.5%, Zn 1.5%.
(Lewis et al., 2006). In a metropolitan city (Visakhapatnam) in south
India, based on standard techniques (e.g. culturing on selective media), showed
that in most localities the street vended fruit juices remained hygienically poor.
(Okeri et al., 2008) Study examined that levels of the trace metals
Chromium (Cr), Copper (Cu), Iron (Fe), Lead (Pb), Manganese (Mn) and Zinc
(Zn) in water and juice consumed in Benin City.
(Nazim et al., 2008) In this work studied the micro flora in drinking water
as well in juices fungal species were isolated from juices using direct plating
techniques, highest number. Aspergillus niger was originate to be dominant
fungus in drinking water and juices
(Addo et al., 2008) In Kumasi, Ghana study showed that in the apple and
mango fruit juices major increase in microbial load. Orange juice showed the
lowest microbial count of 3.1 × 10³ and 9.5 × 10 microbial load. In the apple yeast

28
numbers were moderately lower than bacterial counts in both apple and mango
fruit juices.
(Iwegbue et al., 2008) In this study heavy metals was determined in
canned fruit drunk by applied graphite furnace atomic absorption
spectrophotometer. Except Pb and zinc concentration of the heavy metals showed
appreciable p < 0.05 variability within a brand
Okoye and Ibeto, 2009). In the work juices had a pH range of 1.80-3.40,
specific gravity of 1.002-1.054. The Nigerian made fruit juices had higher amount
of added sugar. The pineapple juice brand had very high concentration of iron and
the presence of cadmium and lead in some of the samples is a clear case of
contamination.
(Akhtar et al., 2010) the present study was carried out to assess the
Physicochemical attributes and heavy metal content of 4 popular mango varieties.
Mango varieties collected from MUL showed a higher concentration metals as
compared to other regions which may be attributed to irrigation from industrial
effluents and sewage water. This study concludes that the levels of heavy metals
in tested Pakistani mango varieties are higher than the safe limits laid down by
W.H.O.
(Bingol et al., 2010) Quantitative determination of heavy metals, in
canned soft drinks in Turkey was carried out by ICP-OES (Inductively Coupled
Plasma-Optical Emission Spectrometry) method. The mean levels (± SE) of
arsenic, copper, zinc, cadmium, and lead were found to be 0.037 ± 0.002 mg/kg,
0.070 ±0.009 mg/kg, 0.143 ± 0.012 mg/kg, 0.005 ± 0.0003 mg/kg, and 0.029 ±
0.002 mg/kg, respectively.(2010)
(Tasnim et al., 2010) in Dhaka City quality of industrially processed
packed fruit juices of mango and orange to estimate the dietary and
microbiological value. Arsenic, lead, copper and zinc in the juices were within the

29
limits. The microbiological qualities of all the products were within the limits of
the Gulf standards.
(Mukhtar et al., 2010) Study showed that gram positive bacteria were the
main strains related with apple surface. Aspergillus and Penicillium was mainly
common genus of fungi grown on the surface. Study observed that reduced the
microbial contamination on apple surface by washing with chilly running hit
(2010).
(Farid and Enani , 2010) in Jeddah, Saudi Arabia level of trace element in fruit
juices were determined by using Atomic absorption spectrometry. In this work
heavy metals in ppb of Apple, Mango and Orange juice were determined(2010).
(Jalbani et al., 2010). In this work concentration of essential elements were
measured, by using flame atomic absorption spectrometry (FAAS) wet acid
digestion method was used for determination of essential elements.
(Tufuor et al., 2011) Abura-Asebu- Kwamankese District of the Central
Region of Ghana levels of heavy metal in lime, lemon and orange was
determined.Inductive Coupled Plasma (ICP) Atomic Emission Spectrophotometer
Fe, Zn, and Pb were found in all the samples with mean concentrations. Cu and
As were found in the lime. Cr and Ni were not detected in any of the samples
analysed.
(Mukhopadhya et al., 2011) In Kolkata city, India. analyzed the microbial
quality of the street vended juices Total viable count, Yeast and mold count,
Coliform count, vibrio count was analyzed using standard methods. The total
viable counts (TVC) were high ranging from 265-700×104 CFU/1000ml. Yeast
count varied between 1.8 - 360×104CFU/1000ml where as Mould varies between
1.1-620×104CFU/1000ml. Coliforms include both the presence of fecal (.5-
45×104CFU/1000ml) and non fecal (.15-76×104CFU/1000ml).

30
(Bagde and Tumane 2011) In Nagpur city microbial flora were determined
in fruit juices and cold drink sample diluted serially and then plated on nutrient
agar plate and on different selective media Staphylococcus aureus was found in
fruit juice sample also in soft drink while E.coli in only in soft drink.
(Ameyaw et al., 2011) in Accra metropolis, Ghana determines the levels
of trace elements in some selected fruit juices and carbonated beverages. The
technique used in this study was Instrumental neutron activation analysis (INAA)
the trace elements in the fruit juices were found to be more than that of the
carbonated beverages (2011).
(Harmankay et al., 2012) Micro and macroelement contents of several
commercial fruit juices were determined by inductively coupled plasma atomic
emission spectroscopy. Result of metals below the daily intake values (2012).
(Hossain et al., 2012) in the reported work heavy metals were determined
using Atomic absorption technique. This study illustrates the benefit of
multivariate statistical techniques for analyzing and interpretation of complex data
sets and to plan for future studies. DA indicated that copper was the main
contributor in discriminating the two types of fruit juices. The t-tests results
obtained showed that there were no significant differences in acidity, arsenic,
lead, zinc, copper and standard plate count content between samples standards,
while significant differences were observed in total soluble solid, ash and vitamin
C compositions between samples standards.
(Solidum , 2012) study in Philippines determined the presence or absence
of heavy metal lead in packaged snacks, powdered fruit juices and distilled water.
Atomic absorption spectrophotometer technique was used. Study showed the
occurrence of heavy metal lead in packaged snacks, powdered fruit juice and
distilled water (2012).

31
(Nma and Ola, 2013) In Port Harcourt Metropolis, Nigeria. Total
heterotrophic bacteria count of some of the packaged fruit juice samples ranged
from 3.5x10² to 7.1x10³ CFU/ml (for orange juice), 4.2x10² to 6.6x10⁴ CFU/ml
(for apple juice), and 3.0x10² to 9.0x10⁴ CFU/ml (for pineapple juice). Total fungi
count of some of the packaged fruit juice samples ranged from 1.5x10² to 2.5x10²
CFU/ml (for orange juice), 2.0x10² to 4.2x10² CFU/ml (for apple juice) and
0.0x10² to 2.2x10² CFU/ml (for pineapple juice ‘/ The results also showed that the
fungi isolates obtained from packaged fruit juice, Penicillium sp. (57.1%) was
predominant over Saccharomyces sp (42.9 %.) No coliform bacteria were
observed in all packaged fruit juice samples.
(Rashed et al ., 2013) Dhaka city twenty six vendor fruit juices and 15
packed juices were examined for the presence of total bacterial load, coliforms
and staphylococci. Samples were found to harbor viable bacteria within the range
between 102 -107 cfu/ml. thirty samples exhibited the presence of staphylococci.
Total coliforms were detected in 31 samples within the range of 102 -106 cfu/ml.
Fecal coliforms were found in 4 vendor fruit juice samples (102 cfu/ ml), while in
the industrially packed samples, they were completely absent.
(Dehelean and Magdas, 2013) Romanian market was investigated from
the heavy metals and mineral content ICP-MS. For Mn the obtained values
exceeded the limits imposed by international organizations. Co, Cu, Zn, As, and
Cd concentrations were below the acceptable limit for drinking water for all
samples while the concentrations of Ni and Pb exceeded the limits imposed by
US-EPA and W.H.O for some fruit juices.
(Ofori et al., 2013) In Ghana analysis of fruit juice and soft drinks was
carried out in Ghana. For sample preparation. Acid digestion was carried out.
Flame atomic absorption spectrophotometer technique was used for the
measurements of concentration. In this study mean concentration heavy metals
were in the sequence Fe > Zn > Pb > Co for fruit and soft drinks.

32
MATERIALS AND METHOD

33
3.1 MATERIALS
Analytical grade HNO3 Merck 65% and deionized water were used
throughtout this research work. Standard stock solutions (1000 ppm) of respective
metal ions, which were obtain from Merck. The Laboratory glass wares including
beaker, pipettes, Volumetric flasks, Petri dish, Funnels wash with detergent and
rinsed with distilled water dried in oven and stored in a place which was free from
dust and fumes. Watman filter paper 40 was used to filter digested juice samples.
3.2 SAMPLE COLLECTION
Total 100 Commercial Samples including Fruit juices and soft drinks of
different packing materials were collected during in the years of 2011 to 2012
from different market locations and retail stores in Karachi city Pakistan.
Convenient sampling method is used that represents sample categories with type
and packaging was shown in table 3.1.
3.3 DETERMINATIONS OF PHYSICO-CHEMICAL PARAMETERS
Physical parameters like pH, conductivity, TDS (total dissolve solid),
salinity, dissolve solid (DO) were measured by using HACH sension 105 multi
parameter. First of all dissolve oxygen was measure just after opening the packet
of sample. Specific gravity was measured by relative density (R.D) bottle method.
3.4 INSTRUMENTATION
The Atomic Absorption Spectrophotometer instrument PE-AAnalyst 700,
USA model was used in this study. Instrumental condition such as pressure of
fuel, oxidant and others were adjusted according to the Atomic Absorption
Spectrophotometer. Instrument was calibrated by blank solution and finally
analyzed metals content in the fruit juice and soft drink samples. Instrumental
parameters for the determination of elements by atomic absorption technique was
shown in table 3.2.

34
3.5 DIGESTION OF SAMPLE
In the present study Wet digestion methods has been used for this
purposes single acid or mixture of acids with or without oxidizing agent were
required( Niazi et al., 1997). 50 ml of each liquid juice and 5g powder juice(
sachet pack) sample was taken in a Acid washed 250ml of beaker and add 25ml of
nitric acid, then heated on the hot plate for 60 minute at 105oc The beaker were
shaken during heating after heating mixture was cool and then filter ,filtrated and
washing were collected in a 100ml volumetric flask and then diluted up to the
mark with deionized water.
3.6 STATISTICAL ANALYSES Data analyses were performed using Statistical Package for the Social Sciences
(SPSS version 21 Values were expressed as mean. appropriate test statistics
(ANOVA) were done to determine heavy metals content in fruit juices and soft
drinks which were pack in different packing.
3.7 IDENTIFICATION OF FUNGI In direct plating technique 0.01 ml of sugar cane juice spread in hygienic
Petri plate and about 10-15 ml of liquefy melt chilled SDA dextrose agar) was
poured containing 200 mg/l streptomycin and then after slightly rotating the Petri
plate was left for solidification For the assessment of colony forming unit of
mycobiota, 2 ml juice sample was suspended in sterilized test tube containing 18
ml of sterilized distilled water was shaken well which gave dilution of 1:10. 2 ml
of suspension from 1: 10 was transferred to second test tube which gave 1:100
dilutions. Similarly 1:1000 and 1:10000 dilutions were made. There were three
replicates for 1:1000 and 1:10000 dilutions. 1 ml aliquot from 1:1000 and 1:10000
dilutions were transferred to the sterilized Petri plates and 10-15 ml of molten
cooled agar poured containing 20,000 units/liters penicillin and 200 mg/liters
streptomycin. Petri dishes were incubated at 28±2 o C for 5-7 days (Nelson et al.,
1983).

35
3.8 BACTERIAL IDENTIFICATION
Serial dilutions of samples were made up to 10-7 with sterile normal
saline. 0.1ml of each dilution was evenly spread on the nutrient agar medium and
incubated at 37o C for 24 hours. Plates were screened for the presence of discrete
colonies after incubation period and the actual numbers of bacteria were
estimated as colony forming unit per ml (cfu/ml). Quantitative analysis for
the presence or absence of specific microorganisms was done by plating on
selective media. Total coliform count (TCC), fecal coliform count (FCC)
and total staphylococcal count (TSC) were performed in similar manner as
described above using MacConkey agar, membrane fecal coliform (mFC) agar
and Mannitol Salt Agar (MSA) medium, consecutively. (Cowan, 1975).
The microbiological condition of safety and hygiene were then assayed by
comparing the obtained results with the limit of Gulf standard known as the
recommended microbiological standard for fruit juices in the Gulf region (Basar
and Rahman, 2007; Rahman et al., 2011).

36
Table 3.1
Representing sample categories with type and packing.
Sample category Specific Type Packing Type
Fruit juice Apple juice Tetra pack, Plastic bottle
Mango Tetra pack, Plastic bottle,
Sachet pack
Orange Tetra pack, Plastic bottle,
Sachet pack
Grape Tetra pack,
Punch Tetra pack, Plastic bottle,
Sachet pack
Miscellaneous Fruit juice Guava Tetra pack, Plastic bottle
Pine Apple Tetra pack, Sachet pack
Peach Tetra pack, Plastic bottle
Lemon Sachet pack
Strawberry Tetra pack
Soft drink Cold drink Plastic bottle, Tin pack

37
Table 3.2
Instrumental parameters for the determination of elements by
flame atomic absorption
Element Symbol Wavelength (nm) Slit width (nm)
Chromium Cr 357.9 0.7
Iron Fe 248.3 0.2
Zinc Zn 213.9 0.7
Nickel Ni 232 0.7
Manganese Mn 403.1 0.7
Cobalt Co 240.7 0.7
Copper Cu 324.8 0.7
Lead Pb 283.3 0.7
Cadmium Cd 228.8 0.7

38
RESULT AND DISCUSSION

39
4. APPLE JUICE
PH of apple juice in different packing material was shown in Table and
Fig. 4.1. In this study largest mean value of pH 3.9 was found in tetra pack, while
smallest mean value of pH 3.3 was measured in plastic bottle. Range of pH was
measured between 3.1 to 4.7.
Conductivity of apple juice in different packing material was mention in
Table 4.1 and Fig. 4.2. In the present work largest mean conductivity 2.4 ms/cm
was recorded in plastic bottle, while smallest mean conductivity 1.609 ms/cm was
measured in tetra pack. Range of conductivity was found to be 0.97 to 3.83
ms/cm.
Total dissolved solid of apple juice in different packing material was
shown in Table 4.1 and Fig. 4.3. In this study largest TDS with mean 752.22 mg/L
was found in tetra pack while smallest 705 mg/L was found in plastic bottle.
Range of TDS was found between 445 to 1338 mg/L.
Salinity of apple juice in different packing material was presented in Table
4.1 and Fig. 4.4. In the present work largest mean 4.15 ppt salinity was measured
in plastic bottle while smallest mean salinity 0.72 ppt was recorded in tetra pack.
Range of salinity was measured between 0.4 to 1.9 ppt.
Dissolved oxygen of apple juice in different packing material was
presented in Table 4.1 and Fig. 4.5. The present study maximum mean 7.91 mg/L
was recorded in plastic bottle least mean 0.83 mg/L was found in tetra pack.
Dissolve oxygen was found between a range 0.44 to 14.3 mg/L.
Specific gravity of Apple juice of different packing material was presented
in Table 4.1 and Fig. 4.6. In the present investigation specific gravity was
measured which was high 1.106 in plastic bottle and low 1.076 in tetra pack.
Range of specific gravity was observed between 1.004 to 1.112.

40
Table 4.1
Physico chemical parameters of apple juices
sample code
Packing material pH Conductivity TDS Salinity DO Temp Specific
gravity ms/cm mg/L ppt mg/L ( OC ) A Tetra pack 3.9 1.135 539 0.5 0.95 27.6 1.099 B Tetra pack 3.6 1.322 617 0.6 0.82 27.6 1.015 C Tetra pack 4.7 1.667 854 0.8 0.44 24 1.078 D Tetra pack 3.8 1.875 865 0.8 0.59 30.4 1.11 E Tetra pack 3.5 1.559 700 0.7 0.54 30.5 1.004 F Tetra pack 3.8 1.074 539 0.5 0.46 24.1 1.108 G Tetra pack 3.9 1.721 719 0.7 0.62 31.1 1.098 H Tetra pack 3.8 1.339 599 0.6 1.54 29.5 1.080 I Tetra pack 4.1 2.79 1338 1.3 1.56 28.6 1.093
J Plastic bottle 3.6 0.97 445 0.4 1.52 28.7 1.112
K Plastic bottle 3.1 3.83 965 1.9 14.3 28.7 1.100

41
Figure 4.1
Figure 4.2

42
Figure 4.3
Figure 4.4

43
Figure 4.5
Figure 4.6

44
RANGE OF HEAVY METALS (ppm) IN APPLE JUICES
Range of heavy metals in apple juice was presented in Table 4.2. It was
found that lower limit of the range of Cr, Mn, Co and Pb was permissible however
high limit was not permissible within the standard by the organization (see
appendix I).
It can be seen that range of Fe concentration from analysis Apple samples
was over as safe limit of 0.3 mg/L of both (W.H.O, 1985; Ofori et al., 2013) for
iron. Range of Zn and Cu was below the permissible limit sets by US-EPA (see
appendix I).
It was observed that range of Ni and Cd concentration from the analysed
apple samples was not within the standard (see appendix I).
METALS IN APPLE JUICE
The concentrations of heavy metals, Cr, Fe, Mn, Co, Ni, Cu, and Zn in
Apple juice of different packing material were presented in Fig. 4.7. The highest
concentration of Fe was seen with a concentration of 9.286 ppm, but Co was
determined at the low level was seen with the concentration 0.042 ppm. The
highest concentration of Fe was seen in plastic bottle with a concentration of
5.782 ppm Whereas Cu was determined at the low level was seen with the
concentration 0.014ppm
TOXIC METALS IN APPLE JUICES
The concentrations of toxic metals, in Apple juice of different packing
material presented in Fig 4.8. The highest concentration of Pb was seen in both
packing materials with high concentration of 0.98 ppm in tetra pack and 0.773
ppm in plastic bottle, in the same way Cd was found with the high concentration
0.051 ppm in tetra pack and low 0.034 ppm in plastic bottle.

45
Table 4.2
Range of heavy metals (ppm) in Apple juices
Cr Fe Zn Ni Mn Co Cu Pb Cd
0.013 - 0.558 0.564 -13.064 0 - 0.458 0.136 - 6.626 0.029 - 0.466 0.014 - 0.188 0.006 - 0.121 0-2.07 0.022 - 0.062

46
Figure 4.7
Figure 4.8

47
ISOLATED FUNGAL SPECIES IN APPLE JUICES
Isolated fungal species in Apple tetra packs and plastic bottles have been
shown in Table 4.3. The fungal species recovered were A. flavus, A. niger,
Rhizopus sp. Mucor and Candida albicans. Sample H was exhibited highest and
sample C was displayed comparatively least number of fungal contaminations.
Candida albicans was found in E sample. Tetra pack of companies A, B, D, F, I,
J, and K fungal contaminated were not seen. None of sample of plastic bottle
showed fungal contamination.
MICROBIAL LOAD IN APPLE JUICES
Microbial load in Apple juice of different packing was presented in Table
4.4. In Apple juices total viable count (TVC) was found between 1.2 x 10² to 1.6
x 103 cfu/ml highest bacterial load (1.6 x 10³cfu/ml) was measured in D sample
and the lowest load 1.2 x 10² was measured in K sample. In Apple juices total
coliform count(TCC) was found between 1.3 x 10² to 1.8 x 10² cfu/ml highest
coliform bacterial load (1.8 x 10³cfu/ml) was measured in D sample and the
lowest 1.3 x 10² was measured in G and K samples.
None fecal coliform was observed in all Apple juice samples. In present
study, staphylococci were measured between 1.2 x10² to 1.6 x 10³ samples. The
highest total staphylococcal count (1.6 x 10³cfu/ml) was found in K sample on the
other opposing least in G sample.
Our results showed that total viable count was present in apple juices was
below within the standards. While total coliform count was measured obove
within standard and total staphylococcal count was within the standard (see
appendix III).
Study showed that total viable count and total coliform count was higher
in tetra pack as compared to plastic bottle. On the other side total staphylococcal
count was higher in plastic bottle than tetra packs in all apple samples.

48
Table 4.3
Isolated fungal species in Apple juices of different brands
code Packing material Fungal Species cfu/ml
A Tetra pack - - B Tetra pack - -
C Tetra pack Rhizopus sp, A.niger , A.flavus, Mucor 0.4
D Tetra pack - -
E Tetra pack Rhizopus sp, A.niger, Candida albicans 0.5
F Tetra pack - - G Tetra pack A.flavus, Rhizopus sp 0.75 H Tetra pack A.flavus, A.niger 2.25 I Tetra pack - - J Plastic bottle - - K Plastic bottle - -

49
Table 4.4 Microbial load in Apple juices of different brands
code Packing material
Total viable count
Total coliform
count
Fecal coliform
count
Total staphylococca
l count cfu/ml cfu/ml cfu/ml cfu/ml
A Tetra pack - - - - B Tetra pack - - - - C Tetra pack 1.5 x 10² 1.4 x10² - 1.3 x 10² D Tetra pack 1.6 x 10³ 1.8 x 10² - 1.4 x 10² E Tetra pack - - - - F Tetra pack - - - - G Tetra pack 1.4 x 10² 1.3 x 10² - 1.2 x 10² H Tetra pack 1.5 x 10³ 1.7 x 10² - 1.3 x 10² I Tetra pack - - - - J Plastic bottle - - - - K Plastic bottle 1.2 x 10² 1.3 x 10² - 1.6 x 10³

50
5. MANGO JUICE
PHYSICOCHEMICAL PARAMETERS OF MANGO JUICES
PH of mango juice in different packing material was shown in Table 5.1
and Fig. 5.1. In this study largest mean value of pH 4.4 was found in plastic bottle
while smallest mean value of pH 3.65 was measured in sachet pack. Range of pH
was measured between 3.1 to 5.2.
Conductivity of Mango juice in different packing material was mention in
Table 5.1 and Fig. 5.2 largest mean conductivity 4.25 ms/cm was recorded in
sachet pack, while smallest mean conductivity 1.37 ms/cm was measured in tetra
pack. Range of conductivity was found to be 1.01 to 5.48 ms/cm.
Total dissolved solid of Mango juice in different packing material was
shown in Table 5.1 and Fig. 5.3. In this study largest TDS with mean value 10.30
mg/L was found in sachet pack while smallest 659 mg/L was found in tetra pack.
Table 5.1 range of TDS was found between 472 to 1381 mg/L in juice samples.
Salinity of Mango juice in different packing material was presented in
Table 5.1 and Fig.5.4. In the present work largest mean 1.4 ppt salinity was
measured in sachet pack while smallest mean salinity 0.639 ppt was recorded in
tetra pack. Mango juice sample range of salinity was measured between 0.4 to 1.4
ppt.
Dissolved oxygen of mango juice in different packing material was
presented in Table 5.1 and Fig.5.5. In the presented study maximum mean 5 mg/L
DO was recorded in sachet pack least mean 0.71 mg/L was found in tetra pack.
Range of dissolve oxygen was found between 0.33 to 7.6 mg/L.
Specific gravity of mango juice of different packing material was
presented in Table 5.1 and Fig 5.6 In the present investigation specific gravity was
measured which was high 1.132 in sachet pack and low in 1.032 plastic bottle.
Range of specific gravity was measured between 0.92 to 1.135.

51
Table 5.1
Physicochemical parameters of Mango juices
code #
Packing material pH Conductivity TDS Salinity Do Temp Specific
gravity ms/cm mg/L ppt mg/L ( oc ) A Tetra pack 4.4 1.57 791 0.8 0.49 24.6 1.050 B Tetra pack 3.8 1.28 617 0.5 0.73 33.5 0.970 C Tetra pack 3.6 1.11 517 0.5 0.81 27.5 1.015 D Tetra pack 3.9 1.35 650 0.6 0.9 27.5 1.0713 E Tetra pack 4.9 1.53 650 0.6 0.46 23.7 1.078 F Tetra pack 5.2 1.53 784 0.8 0.46 23.6 1.0422 G Tetra pack 3.9 1.01 472 0.4 0.73 27.6 1.005 H Tetra pack 4.3 1.35 691 0.7 o,48 24.5 1.016 I Tetra pack 4.5 1.18 890 0.8 0.64 32.5 1.003 J Tetra pack 3.7 1.07 798 0.8 0.64 23 1.015 K Tetra pack 3.1 1.12 497 0.5 0.33 30.1 1.048L Tetra pack 3.3 2.00 940 0.9 0.48 23.3 1.023 M Tetra pack 4.2 2.05 894 0.9 0.73 33.4 1.047 N Tetra pack 3.7 1.12 571 0.6 0.49 23.3 1.026O Tetra pack 4.1 1.19 536 0.5 0.65 30.6 1.054 P Tetra pack 4.2 1.82 777 0.7 0.61 32.9 1.052 Q Tetra pack 4.5 1.31 666 0.7 0.46 23.9 1.059 R Tetra pack 3.6 1.17 527 0.5 1.54 30.3 1.010 S Tetra pack 3.8 1.28 558 0.5 0.73 33.5 1.020 T Tetra pack 3.7 1.51 683 0.7 1.59 30.3 1.016 U Tetra pack 4.2 1.13 565 0.5 0.48 24.5 1.069 V Tetra pack 3.9 1.52 698 0.7 0.62 30.8 1.063 W Tetra pack 3.5 1.32 584 0.6 0.35 31.1 1.064 X Tetra pack 3.8 1.51 599 0.7 1.53 29.7 1.037 Y plastic bottle 4.4 1.71 818 0.8 7.6 26 1.062 Z plastic bottle 4.4 1.91 932 0.9 6.1 20.7 1.020
AB Solid sachet 3.7 3.02 1381 1.4 5.5 30.8 1.13 BC Solid sachet 3.5 5.48 679 1.4 4.5 31.5 1.135

52
Figure 5.1
Figure 5.2

53
Figure 5.3
Figure 5.4

54
Figure 5.5
Figure 5.6

55
RANGE OF HEAVY METALS (ppm) IN MANGO JUICES
Heavy metals concentration range in Mango juice was mention in Table
5.1. It was found that upper limit of Cr, Ni, Co, Pb, and Cd was not safe within
standard (see appendix 1). In this study upper limit of iron range was not safe
within a safe limit as in (W.H.O, 1985; Ofori et al, 2013) Range of Zinc was
below within the standard (see appendix I).
In this study range of Mn and Cu was almost permissible within the standards set
by the organization (see appendix I)
METALS IN MANGO JUICEs
The concentration of heavy metals in different packing material of Mango
fruit juice was presented in Fig 5.7. The highest concentration of Fe was seen with
a concentration of 9.12 ppm but Co was determined at the low level 0.052 ppm. In
plastic bottle Ni was observed with maximum amount 3.54 ppm, however Co was
seen with low 0.073 ppm. In sachet packs Fe was observed with highest amount
3.433 ppm however Cu was measured with least amount 0.044 ppm.
TOXIC METALS IN MANGO JUICES
Toxic metals were shown in Fig 5.8. Outstanding toxic metal Pb was
frequent in all packing material with the range of 0.41 to 0.93 High in plastic
bottle and while small in tetra pack.
However Cd was found with maximum level 0.249 ppm in sachet pack
and minimum level 0.016 ppm in plastic bottle.

56
Table 5.2
Range of heavy metals (ppm) in Mango Juices
Cr Fe Zn Ni Mn Co Cu Pb Cd
0.012 -0.482 0-19.286 0.05 - 0.596 0.002 -6.216 0-0.412 0-0.137 0.004 - 0.19 0 - 2.726 0 - 0.446

57
Figure 5.7
Figure 5.8

58
ISOLATED FUNGAL SPECIES IN MANGO JUICES
Isolated fungal species in mango juices of different packing material have
been shown in Table 5.3. Species were recovered in the present work A. niger, A.
Flavus, A. wentii A. fumigate, Monilia sp, Fusarium sp. Penicillium sp, and
Saccharomyces.
Sample P as exhibited highest and sample U was displayed comparatively
least number of fungal contaminations. Fungal count was found between 0.14 to
0.8 cfu/ ml. Samples R and X were shown unidentified fungal contamination.
In this study A. niger was found in tetra packs of B, E and P samples, A.
higher which in the identical to the fungal contamination in mango juices in tetra
pack available in Egypt (Faten et al., 2001) while A. flavus was found in E and O
samples.
A. fumigates and Fusarium sp was found recorded in V sample while H
sample was shown the presence of Saccharomyces. Rhizopus sp was found in H,
O and P tetra pack samples. Monilia was only found in U tetra pack sample.
Sample J and O were shown the presence of Penicillium and A. wentii
none of growth was seen in plastic bottle and sachet pack of mango sample.
MICROBIAL LOAD IN MANGO JUICES
Microbial load in mango juices of different packing material was
presented in Table 5.4. In Mango juice total viable count (TVC) was found
between 1.0 x 10² to 1.3 x 10³ cfu / ml. Highest viable load 1.3 x 10³ cfu / ml was
found in D sample and lowest load 1.0 x 10² cfu/ml was measured in J , Q and BC
samples. In mango tetra pack juice total coliform count (TCC) was found between
1.0 x 10² to 1.4 x 10²cfu / ml
Fecal coliform count was found between 1.0 x 10² to 1.2 x 10² cfu/ml. In
our study, staphylococci were found between 1.1 x 10² to1.4 x 102 cfu / ml in tetra
packs of mango juice samples.

59
While coliform, fecal coliform and staphylococci were not found in plastic
bottle and sachet pack of mango juice samples. Present study showed that total
viable count was present in mango juice sample was below the standards while
total coliform count and fecal coliform was upon within the standards (See
appendix III).
Range of staphylococcal count in tetra packs mango samples was within
the expectable standard limits.

60
Table 5.3
Isolated fungal species in Mango juices of different brands
Code Packing material Fungal Species cfu/ml
A Tetra pack - - B Tetra pack A. niger 0.36
C Tetra pack - -
D Tetra pack - -
E Tetra pack A. flavus, A. niger 0.42
F Tetra pack - -
G Tetra pack - -
H Tetra pack Saccharomyces sp, Rhizopus sp. 0.66
I Tetra pack - -
J Tetra pack Penicillium sp, A. wentii 0.21
K Tetra pack - -
L Tetra pack - -
M Tetra pack - -
N Tetra pack -
O Tetra pack A. flavus, Rhizopus sp, A.Wentii, Penicillium sp
0.78
P Tetra pack Rhizopus sp. A. niger 0.88
Q Tetra pack - -
R Tetra pack unidentified 0.9
S Tetra pack - -
T Tetra pack - -
U Tetra pack Monilia sp 0.14.
V Tetra pack A. fumigates, Fusarium sp. . 0.55
W Tetra pack - -
X Tetra pack unidentified 0.2
Y plastic bottle - - Z plastic bottle - -
AB Sachet pack - - BC Sachet pack - -

61
Table 5.4
Microbial load in Mango juices of different brands
code Packing material
Total viable count
Total coliform
count
Fecal coliform
count
Total staphylococcal
count cfu/ml cfu/ml cfu/ml cfu/ml
A Tetra pack - - - - B Tetra pack 1.2x10³ 1.0x10² 1.1x10² - C Tetra pack - - - - D Tetra pack 1.3x10³ 1.0x10² 1.2x10² 1.4 x 10² E Tetra pack - - - - F Tetra pack - - - - G Tetra pack - - - - H Tetra pack - - - - I Tetra pack - - - - J Tetra pack 1.0x10² 1.3x10² - - K Tetra pack - - - -
L Tetra pack - - - - M Tetra pack 1.9x10² 1.1x10² - - N Tetra pack - - - - O Tetra pack - - - - P Tetra pack - - - - Q Tetra pack 1.0x10² - - - R Tetra pack - - - - S Tetra pack - - - - T Tetra pack - - - - U Tetra pack - - - - V Tetra pack 1.9x10² 1.4x10² 1.0x10² 1.1 x 10² W Tetra pack - - - - X Tetra pack 1.4x10² - - -
Y plastic bottle 1.3x10² - - -
Z plastic bottle - - - -
AB Solid
saachet - - - -
BC Solid
saachet 1.0x10² - - -

62
6. ORANGE JUICE
PHYSICO CHEMICAL PARAMETERS OF ORANGE JUICES
PH of orange juice in different packing material was shown in Table and
Fig. 6.1. In this study largest mean value of pH 4.02 was found in tetra pack,
while smallest mean value of pH 3.06 was measured in sachet pack Range of pH
was measured between 2.9 to 4.5 in orange.
Conductivity of orange juice in different packing material was mention in
Table 6.1 and Fig. 6.2. largest mean conductivity 7.11 ms/cm was recorded in
tetra pack, while smallest mean conductivity 2.46 ms/cm was measured in sachet
pack. Range of conductivity was found to be 1.00 to 9.79 ms/cm.
Total dissolved solid of orange juice in different packing material was
shown in Table 6.1 and Fig. 6.3. In this study largest TDS with mean value 1113
mg/L was found in plastic bottle while smallest 985 mg/L was found in tetra pack.
Range of TDS was found between 231 to 1901mg/L.
Salinity of orange juice in different packing material was presented in
Table 6.1 and Fig 6.4. In the present work largest mean 1.1 ppt salinity was
measured in plastic bottle while smallest mean salinity 1.00 ppt was recorded in
sachet pack. Range of salinity was measured between 0.4 to 2.3 ppt.
Dissolve oxygen of orange juice in different packing material was
presented in Table 6.1 and Fig. 6.5. In the present study maximum mean 7.81
mg/L Do was recorded in plastic bottle least mean 0.628 mg/L was found in tetra
pack. Range of DO was found between 0.43 to 14.2 mg/L.
Specific gravity of orange juice in different packing material was
presented in Table 6.1 and Fig. 6.6 in the present investigation specific gravity
was measured which was high 1.12 in sachet pack and low in 1.040 in plastic
bottle. Specific gravity was found between a range 1.027 to 1.147.

63
Table 6.1
Physicochemical parameters of Orange juices
code
Packing material pH Conductivity TDS Salinity DO Temp Density
ms/cm mg/L ppt mg/L (cC ) A Tetra pack 4.5 7.65 1587 0.6 0.7 31.5 1.035 B Tetra pack 3.1 9.79 413 0.4 0.69 31.4 1.035 C Tetra pack 4.4 3.56 1658 1.7 0.72 30 1.052 D Tetra pack 4.0 8.49 426 0.4 0.43 23.9 1.048 E Tetra pack 3.5 8.87 1595 0.7 0.8 30.1 1.043 G Tetra pack 4.4 4.32 231 2.3 0.43 24.1 1.042
H plastic bottle 3.6 1.09 500 0.5 0.65 28.4 1.027
I plastic bottle 4.2 1.88 938 0.9 8.6 27.9 1.052
J plastic bottle 4.1 3.83 1901 1.9 14.2 29.6 1.042
K sachet 2.9 3.4 1533 1.5 4.4 31.3 1.122 L sachet 2.9 2.44 1084 1.1 4.6 31.6 1.147 M sachet 3.1 1.00 523 0.5 5.6 30.6 1.120 N sachet 3.2 3.00 951 0.9 4.1 29.4 1.120

64
Figure 6.1
Figure 6.2

65
Figure 6.3
Figure 6.4

66
Figure 6.5
Figure 6.6

67
RANGE OF HEAVY METALS (ppm) IN ORANGE JUICES
In our study Range of heavy metals in orange juice was presented in Table
6.2 it was found that higher limit of Cr was above the acceptable limit for drinking
water within US EPA. Range for Cr was exceeded the limit allowed by W.H.O.
(see Appendix I)
In the present investigation upper limit of the range of Fe was not within
the 0.3 mg/L as a limit (W.H.O, 1985; Ofori et al., 2013). In present study
concentration range of Zn was low within US-EPA (see Appendix I). Low limit of
range of Ni was low while higher limit was high; within standards sets by the
organization of (see Appendix I).
Concentration range of Mn was found to be safe within W.H.O but upper
limit was not within US-EPA. Range was found for Cu and Co metals were within
the standard sets by the organization (see Appendix I). In this study upper limit of
concentration range Pb and Cd was not within standards sets by the organization
of (see Appendix I).
METALS IN ORANGE JUICES
The concentration of heavy metals was presented in different packing
material of orange fruit juice in Fig 6.7. The highest concentration of Fe was seen
with a concentration of 2.944 ppm but Co was seen with low concentration which
was 0.046ppm The highest concentration of Ni was seen with a concentration of
2.55 ppm in plastic bottle , whereas Cu was determined at the low level was seen
with the concentration 0.074 ppm in sachet packs of orange fruit juice The highest
concentration of Fe was seen with a concentration of 3.305 ppm, whereas Co
was determined at the low level was seen with the concentration 0.033 ppm.
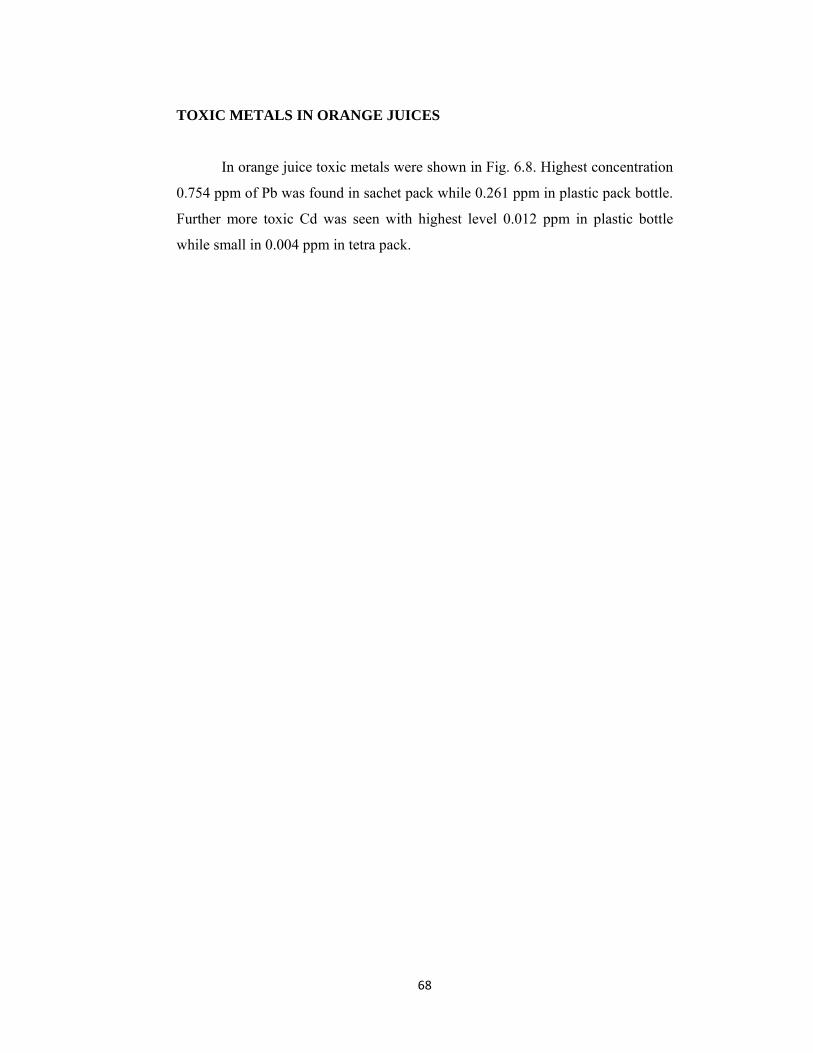
68
TOXIC METALS IN ORANGE JUICES
In orange juice toxic metals were shown in Fig. 6.8. Highest concentration
0.754 ppm of Pb was found in sachet pack while 0.261 ppm in plastic pack bottle.
Further more toxic Cd was seen with highest level 0.012 ppm in plastic bottle
while small in 0.004 ppm in tetra pack.

69
Table 6.2 Range of heavy metals (ppm) in Orange Juices
Cr Fe Zn Ni Mn Co Cu Pb Cd
0.052−0.984 0 −7.74 0.028 – 0.386 0.001 – 5.214 0.010 – 0.128 0.0023 – 0.094 0.032 – 0.236 0 – 0.816 0 – 0.038
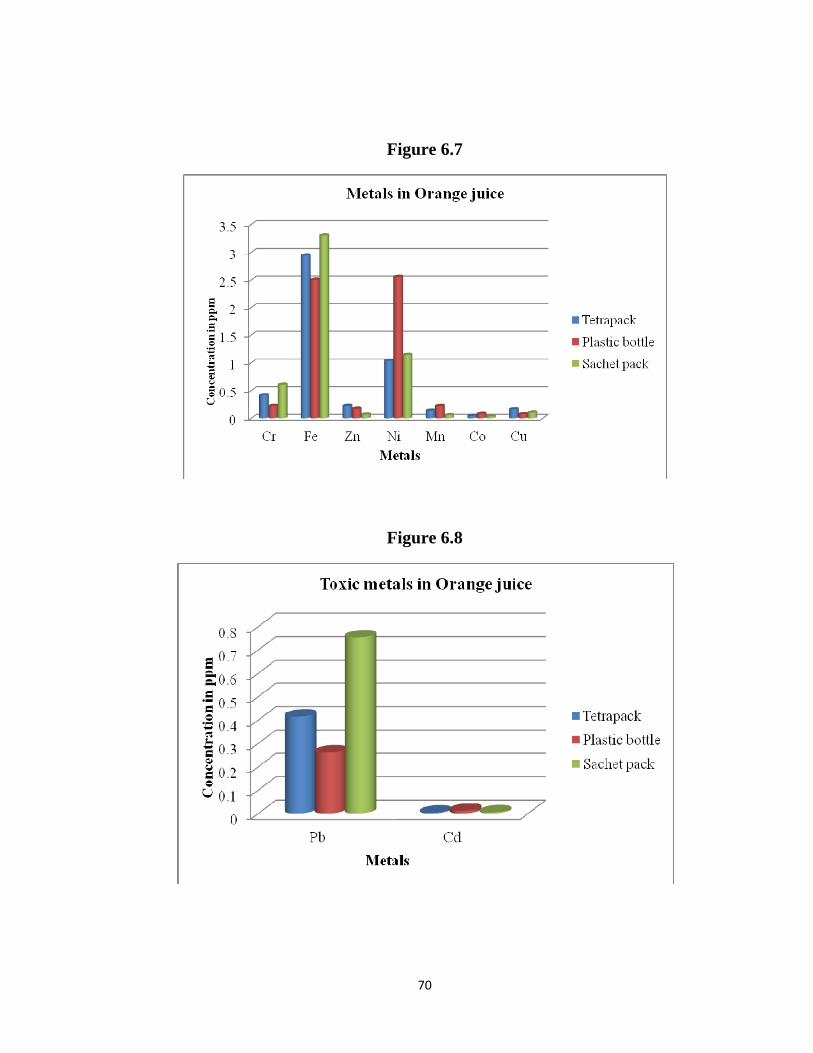
70
Figure 6.7
Figure 6.8

71
ISOLATED FUNGAL SPECIES IN ORANGE JUICES
Isolated fungal species in orange juices in different packing material have
been mentioned in Table 6.3.
The fungal species recovered were A. niger and Rhizopus sp. Sample E
was exhibited highest fungal count, however plastic sample G was displayed
comparatively least number of fungal count. None fungal contamination was seen
in sachet pack of orange juice. (Oranusi et al., 2012) reported fungal species
Saccharomyces, Aspergillus sp and Penicillium sp were found in orange juice.
MICROBIAL LOAD IN ORANGE JUICES
Microbial load in Orange juice of different packing was mentioned in
Table 6.4. In orange juice total viable count (TVC) was found between 1.2 x 10²
to 1.89 x 10⁵ cfu/ml in plastic pack orange juices; however total was not seen in
tetra pack and sachet pack orange juice samples. In orange juice total coliform
count was measured between 4.45 x10⁵ to 6.2 x 10⁶ cfu/ml in plastic bottle
orange juice sample. None growth was observed in tetra pack and sachet pack
orange juice samples.
Fecal coliform was not measured in all orange juice samples of different
packing material. Staphylococcal count was found between 1.2 x 10² to 5.5 x 10⁴
cfu/ml in plastic orange juice samples but none was found in tetra pack and
sachet pack samples of orange juice. Study showed that two samples G and H of
plastic bottle had maximum bacterial load, so they were highly contaminated.
Total viable count in plastic pack was within a standard. While in sample G and H
total coliform count were above the standards also sample G showed the higher
staphylococcal count was high within the standards. (See appendix III).

72
Table 6.3
Isolated Fungal species in Orange juices of different Brands
Code Packing material Fungal Species cfu/ml
A Tetra pack - -
B Tetra pack - -
C Tetra pack - -
D Tetra pack - -
E Tetra pack Rhizopus sp, A. niger 0.3
F Tetra pack - -
G plastic bottle A. niger 0.1
H plastic bottle - -
I plastic bottle - -
J Sachet pack - -
K Sachet pack - -
L Sachet pack - -
M Sachet pack - -

73
Table 6.4
Microbial load in Orange juices of different brands
Code Packing material
Total viable count
Total coliform
count
Fecal coliform
count
Total staphylococcal
count
cfu/ml cfu/ml cfu/ml cfu/ml
A Tetra pack - - - -
B Tetra pack - - - -
C Tetra pack - - - -
D Tetra pack - - - -
E Tetra pack - - - -
F Tetra pack - - -
G plastic bottle 1.2x10³ 4.45x10⁴ - 5.5x10⁴
H plastic bottle 1.89x10⁵ 6.2x10⁶ - 1.2x10²
I plastic bottle - -
- -
J Sachet pack - - - -
K Sachet pack - - - -
L Sachet pack - - - -
M Sachet pack - - - -
74
7. GRAPE JUICE
PHYSICOCHEMICAL PARAMETERS OF GRAPE JUICES
PH of grape juice was shown in Table and Fig. 7.1. In this study mean value of
pH 3.43 was found in tetra pack. Range was measured between 3.0 to 3.7
Conductivity of grape juice was shown in Table 7.1 and Fig. 7.2 mean
conductivity 1.526 ms/cm was recorded in tetra pack. Range of conductivity was
found to be 1.061 to 1.954 mg/L.
Total dissolved solid of grape juice was shown in Table 7.1 and Fig. 7.3.
In this study TDS with mean value 690 mg/L was found in tetra pack range of
TDS between 499 to 908 mg/L in grape juice samples.
Salinity of grape juice in tetra pack was presented in Table 7.1 and Fig.
7.4. In the present work mean value of salinity 0.68ppt was measured. Range of
salinity was measured between 0.5 to 0.9 ppt.
Dissolve oxygen of Grape juice in tetra pack was presented in Table 7.1
and Fig. 7.5. In the present study mean value 0.7 mg/L was recorded. Dissolve
oxygen was found with a range 0.9 to 0.65 mg/L.
Specific gravity of grape juice in tetra pack was presented in table 7.1 and
fig 7.6. In the present investigation mean value 1.059 of specific gravity was
measured. Range and specific gravity was found between 1.038 to 1.082.

75
Table 7.1
Physicochemical parameters of Grape juices
code Packing
material pH Conductivity TDS Salinity Do Temp Specific gravity
ms/cm mg/L ppt mg/L ( oC ) A Tetra pack 3.3 1.061 499 0.5 0.9 27.6 1.073
B Tetra pack 3.7 1.638 691 0.7 0.66 31.7 1.044
C Tetra pack 3.5 1.631 735 0.7 0.65 30.7 1.082
D Tetra pack 3.0 1.354 617 0.6 0.67 29.8 1.038
E Tetra pack
3.4 1.954 908 0.9 0.65 29.8
1.067

76
Figure 7.1
Figure 7.2

77
Figure 7.3
Figure 7.4

78
Figure 7.5
Figure 7.6

79
RANGE OF HEAVY METALS (ppm) IN GRAPE JUICES
In this study range of Cr, Cd and Pb was not safe within the standards set
by organization, but range of Pb was within US-EPA (see appendix I) upper limit
of iron was found in this study was not saved within (W.H.O, 1985; Ofori et al.,
2013) Range of Zn, Mn and Cu was below within the standard, but upper limit of
Mn was not within US-EPA (see appendix I). Lower limit of Ni and Co range was
within the standards but higher was not permissible (see appendix I).
METALS IN GRAPE JUICES
Concentration of heavy metals in tater pack grape juice was presented in
Fig 7.7. The highest concentration of Fe was seen with a concentration 1.977
ppm, but Cu was observed at low level 0.025 ppm.
TOXIC METALS IN GRAPE JUICES
Toxic metals in tetra pack of grape juice were shown in Fig 7.8. Highest
concentration of Pb was seen with a concentration of 0.214 ppm but Cd was found
with lowest 0.02 ppm concentration.

80
Table 5.2
Range of heavy metals (ppm) in Grape Juices
Cr Fe Zn Ni Mn Co Cu Pb Cd
0.326 – 0.906 0 – 2.792 0. 066 – 0.234 0.08 – 3.662 0.020 – 0.122 0.004 – 0.17 0.111 – 0.046 0.038 – 0.246 0.016 – 0.026

81
Figure 7.7
Figure 7.8

82
ISOLATED FUNAL SPECIES IN GRAPES JUICES
Isolated fungal species in grape juice was show in Table 7.3. Sample D
tetra pack was shown the fungal contamination. Isolated fungal species in Grape
juices were Rhizopus sp and A. niger.
MICROBIAL LOAD IN GRAPE JUICES
Microbial load of grape juice in tetra pack samples was presented
in table 7.4. Total viable count 1.6 x 10³ cfu/ml was measured Total coliform
count 1.3 x 10² cfu/ml was measured in D sample. D sample grape juice also
indicate the presence of coliform was found to be 1.1 x 10² cfu/ml staphylococci
was not seen in all samples. In present study one sample D showed the presence
of (TVC) was within standard. While total coliform and fecal count were above
the standard (see appendix III).Study showed that in grape sample D fecally
contaminated.

83
Table 7.3
Isolated fungal species in Grape juices of different brands
code # Packing material Fungal Species cfu/ml
A Tetra pack - -
B Tetra pack - -
C Tetra pack - -
D Tetra pack Rhizopus sp , A.niger 0.3
E Tetra pack - -
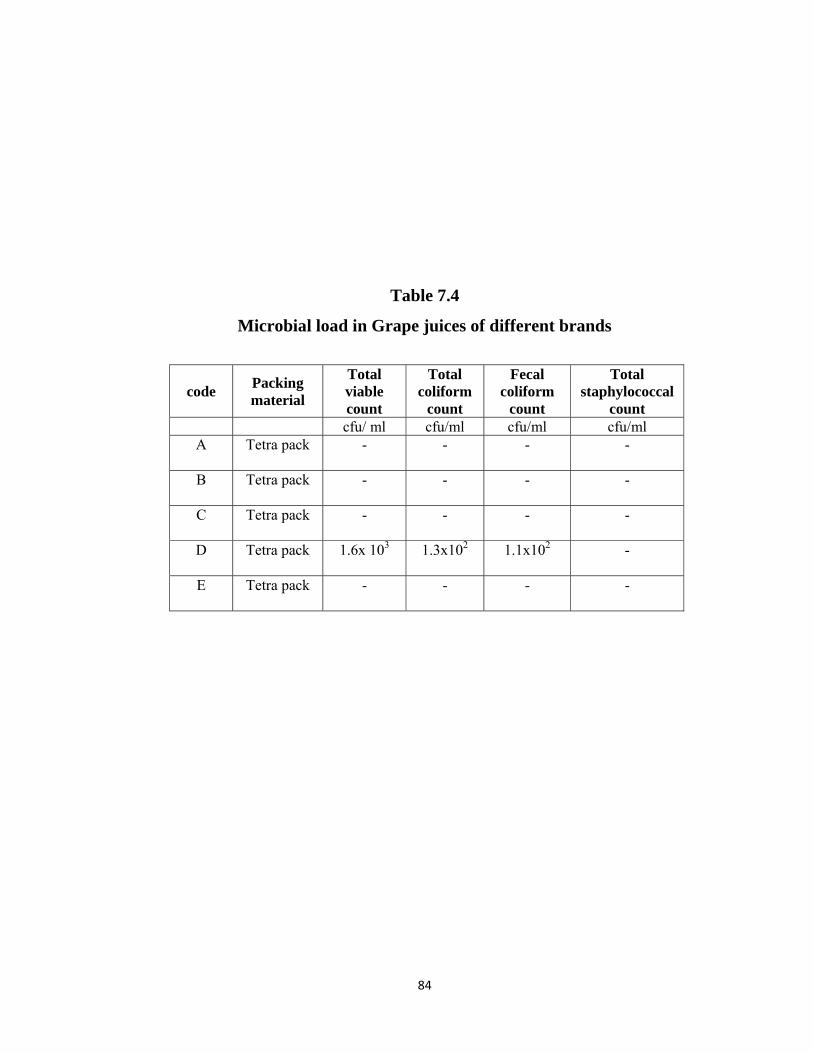
84
Table 7.4
Microbial load in Grape juices of different brands
code Packing material
Total viable count
Total coliform
count
Fecal coliform
count
Total staphylococcal
count cfu/ ml cfu/ml cfu/ml cfu/ml
A Tetra pack - - - -
B Tetra pack - - - -
C Tetra pack - - - -
D Tetra pack 1.6x 10³ 1.3x10² 1.1x10² -
E Tetra pack - - - -

85
8. PUNCH
PH of punch juice in different packing material was shown in Table and
Fig. 8.1. In this study largest mean value of pH 4.1 was found in sachet pack,
while smallest mean value of pH 3.8 was measured in tetra pack Rang of pH was
measured between 3.3 – 4.5 in punch sample.
Conductivity of punch juice in different packing material was shown in
Table 8.1 and Fig. 8.2. Largest 1.824 ms/cm mean conductivity was recorded in
tetra pack, while smallest mean conductivity 1.056 ms/cm was measured in plastic
bottle. Range of conductivity was found to be 0.281 to 3.03 ms/cm
Total dissolved solid of punch juice in different packing material was
shown in Table 8.1 and Fig. 8.3. In this study largest TDS with mean value 978
mg/L was found in plastic bottle while smallest 649.76 mg/L was found in sachet
pack. Range of TDS between 463 to 1362 in punch juice samples.
Salinity of punch juice in different packing material was presented in
Table 8.1 and Fig. 8.4. In the present work largest mean ppt salinity was measured
in plastic bottle tetra pack while smallest mean salinity 0.6 ppt was recorded in
sachet pack. Range of salinity was measured between 0 to 1.4 ppt.
Dissolve oxygen of Punch juice in different packing of material was
presented in Table 8.1 and Fig. 8.5. In the present study maximum mean 5.23
mg/L Do was recorded in sachet pack while least mean 0.65 mg/L was found in
tetra pack. Dissolve oxygen was found between a range 0.49 to 5.7 mg/L.
Specific gravity of punch juice in different packing material was presented
in Table 8.1 and Fig. 8.6 in the present investigation specific gravity was
measured which was high 1.146 in sachet pack and low in 1.042 tetra pack.
Specific gravity was found between a range 1.009 to 1.156.

86
Table 8.1
Physicochemical parameters of Punch juices
code
Packing material pH Conductivity TDS Salinity Do Temp
Specific
gravity
ms/cm mg/L ppt mg/L oC A Tetra pack 4.2 1. 433 718 0.7 0.49 24.5 1.042
B Tetra pack 3.3 1.121 471 0.4 0.72 33.3 1.053
C Tetra pack 3.7 1.276 554 0.5 0.75 33.4 1.016
D Tetra pack 4.1 2.91 1346 1.3 0.68 30.5 1.071
E Tetra pack 3.9 2.35 1260 1.2 0.65 31.5 1.04
F Tetra pack 3.5 1.044 474 0.4 0.64 30.3 1.053
G Tetra pack 4.1 2.06 879 0.9 0.64 31.7 1.055
H Tetra pack 3.6 2.01 932 0.9 0.66 29.6 1.009
I Plastic bottle 3.8 1.056 978 0.7 0.89 31 1.045
J Sachet pack 3.4 3.03 1362 1.4 4.4 31.3 1.139
K Sachet pack 4.5 0.289 124.3 0 5.7 30.6 1.156
L Sachet pack 4.3 1.054 463 0.4 5.6 30.5 1.143

87
Figure 8.1
Figure 8.2

88
Figure 8.3
Figure 8.4

89
Figure 8.5
Figure 8.6

90
RANGE OF HEAVY METALS (ppm) IN PUNCH JUICES
Heavy metals in punch juice were represented in Table 8.2. It was found
that Cr was not lies within Standards (see appendix I). Fe was above within both
standards (W.H.O, 1985; Ofori et al, 2013). Range of Zn in punch juice was low
within the US-EPA.
It can be notice that upper limit of Ni was not lies within the standards
(See Appendix I). In this study it was found that upper limit of range of Mn was
not lies within US-EPA standard but range lies within W.H.O standard. Range of
Co and Cu was within standards sets by the organization (See Appendix I). Range
of Pb lies within US-EPA standards, however it was not lies within W.H.O (See
Appendix I). In present work upper limit of range of Cd was not lies within
standard (See Appendix I).
METALS IN PUNCH JUICES
The concentrations of heavy metals, Cr, Fe, Mn, Co, Ni, Cu, and Zn in
Punch juices of different packing material presented in Fig. 8.7. In tetra pack
highest mean value of Ni was seen with a concentration of 2.801ppm, but Cu was
determined at the low level was seen with the mean concentration 0.048 ppm. The
highest concentration of Ni was seen in plastic bottle with a mean concentration of
2.038ppm; while Mn was determined at the low level was seen with the
concentration 0.002ppm. In sachet packing Ni was observed with highest mean
concentration 3.41 ppm however Zn was measured with least amount 0.044ppm.

91
TOXIC METALS IN PUNCH JUICES
Toxic metals were found in punch juices in Fig. 8.2. In this study Pb was
major with highest concentration 1.061 ppm in tetra pack while 0.04 ppm in
plastic bottle.
However Cd was found in Sachet pack with the highest concentration 0. 006 ppm
and small 0.005 ppm in tetra pack none was observed in plastic bottle.

92
Table 8.2
Range of heavy metals (ppm) in Punch Juices
Cr Fe Zn Ni Mn Co Cu Pb Cd
0−0.328 0−4.014 0−0.432 0.1 – 4.962 0.002 – 0.19 0.016 – 0.102 0 − 0.166 0.04 – 1.644 0 − 0.034

93
Figure 8.7
Figure 8.8

94
Isolated fungal species in punch juices
Isolated fungal species in punch (mix) fruit juices was shown in Table 8.3
the fungal species recovered were A. niger, A. Flavus, Rhizopus, sp, Monilia sp
and Penicillium sp. In this study fungal count was measured between 0.12 to 0.44
cfu/ml in tetra pack samples of punch juice.
Most frequent species was A. flavus was found in three C, D and G tetra
pack punch juice samples. Rhizopus sp was found in C and G samples while
Monilia sp. was present in D sample. A. niger and Penicillium sp were found in D
and G punch tetra pack juices. None of fungal contamination was seen in plastic
and sachet pack samples (.Oranusi et al., 2012) reported Aspergillus sp was
observed in punch juice.
Microbial load in punch juices
Microbial load in punch juices of different packing material was presented
in Table 8.4, In punch tetra pack juice total viable count (TVC) was found
between 2.2 x 10³ to 1.9x10² cfu/ml but was not observed in plastic and sachet
packs of punch juices. Total coliform count was measured between 1.2 x 10² to
1.7 x 10² cfu/ml in tetra pack punch juice where none was found in plastic bottle
and sachet pack samples. Fecal coliform 1.3x10² cfu/ml was found only in G tetra
pack sample. But in remaining samples fecal coliform was not found. Two tetra
pack samples F and G were showed the presence of staphylococci, was found
between 1.9 x 10² to 1.1 x 10³ cfu / ml.
Total viable count in punch juice sample was below the standard in this
study range of total coliform count in tetra packs punch juice were above the
standard sample G of punch juice showed the presence of fecal contamination.
Two samples F and G showed the staphylococcal count were within the standards
(See appendix III ).

95
Table 8.3
Isolated Fungal species in punch juices of different Brands
Code
Packing material Fungal Species cfu/ml
A Tetra pack - -
B Tetra pack - -
C Tetra pack Rhizopus sp, A. flavus 0.12
D Tetra pack A.niger , Monilia sp, A flavus 0.16
E Tetra pack - -
F Tetra pack - -
G Tetra pack A flavus, Rhizopus sp, Penicillium sp 0.44
H Tetra pack - -
I Plastic bottle - -
J Sachet pack - -
K Sachet pack - -
L Sachet pack - -

96
Table 8.4
Microbial load in Punch juices of different of different brands
code Packing material
Total viable count
Total coliform
count
Fecal coliform count
Total staphylococcal
count
cfu/ml cfu/ml cfu/ml cfu/ml
A Tetra pack - - - -
B Tetra pack - - - -
C Tetra pack - - - -
D Tetra pack 1.9 x10² 1.2 x 10² - -
E Tetra pack - - - -
F Tetra pack 1.3 x 10³ 1.7 x 10² - 1.1 x 10³
G Tetra pack 2.2 x 10³ 1.2 x 10² 1.3 x 10² 1.9 x 10²
H Tetra pack - - - -
I Plastic bottle - - - -
J Sachet pack - - - -
K Sachet pack - - - -
L Sachet pack - - - -

97
9. MISCELLANEOUS
PHYSICOCHEMICAL PARAMETERS OF MISCELLANEOUS JUICES
Guava juice
PH of guava juice in different packing material was shown in Table 9.1
and Fig. 9.1. In this study largest mean value of pH 4.3 was found in tetra pack,
while smallest mean value of pH 4.3 was measured in plastic. Range of pH was
measured between 4.2 to 4.4 in guava samples.
Conductivity of guava juice in different packing material was mention in
Table 9.1 and Fig. 9.2 mean conductivity 2.48 ms/cm was same in both packing.
Range of conductivity was found to be 2.40 to 2.56 ms/cm.
Dissolved solid of guava juice in different packing material was shown in
Table 9.1 and Fig. 9.3. In this study largest TDS with mean value 1170 mg/L was
found in tetra pack while smallest 998 mg/L was found in plastic bottle. Range of
TDS between 998 to 1225mg/L.
. Salinity of guava juice in different packing material was presented in Table 9.1
and Fig. 9.4. In the present work largest mean 1.0 ppt salinity was measured in
tetra pack while smallest mean salinity 0.8 ppt was recorded in plastic bottle.
range of salinity was measured between 0.8 to 1.1 ppt.
Dissolve oxygen of guava juice in different packing material was presented in
Table 9.1 and Fig. 9.5. In the present study maximum mean 0.65 mg/L DO was
recorded in tetra pack least mean 0.59 mg/L was found in plastic bottle. Dissolve
range of DO was measured between 0.59 to 0.62 mg/L.
Specific gravity of guava juice in different packing material was presented
in Table 9.1 and Fig. 9.6. In the present investigation specific gravity was

98
measured. Which was high 1.08 in plastic bottle and low in 1.035 in tetra pack?
Specific gravity was found between a range 1.023 to 1.08.
Pine Apple
PH of pine apple juice in different packing material was shown in Table
9.1 and Fig. 9.7. In this study largest mean value of pH 3.3 was found in sachet
pack, while smallest mean value of pH 3.2 was measured in tetra pack. Range of
pH was measured between 2.7 to 3.5.
Conductivity of pine apple juice in different packing material was mention
in Table 9.1 and Fig. 9.8 largest mean conductivity 1.623 ms/cm was recorded in
tetra pack while smallest mean conductivity 1.523 ms/cm was measured in sachet
pack. Rang of conductivity was found to be 1.17 to 2.17 ms/cm.
Total dissolved solid of pine apple juice in different packing material was
shown in Table 9.1 and Fig. 9.9. In this study largest TDS with mean value 750.33
mg/L was found in tetra pack while smallest 664 mg/L was found in sachet pack.
Range of TDS was found between 493 to 954 mg/L in samples.
Salinity of pine apple in different packing material was presented in Table
9.1 and Fig. 9.10. In the present work largest mean 0.7 ppt salinity was measured
in tetra pack while smallest mean salinity 0.6 ppt was recorded in sachet pack.
Range of salinity was measured between 0.5 to 0.9 ppt.
Dissolve oxygen of pine apple juice in different packing material was
presented in Table 9.1 and Fig. 9.11. In the present study maximum mean 4.9
mg/L of DO was recorded in sachet pack least mean 0.45 mg/L was found in tetra
pack. Range of Dissolve oxygen was found between 0.29 to 4.9 mg/L.
Specific gravity of pine apple juice in different packing material was
presented in Table 9.1 and Fig. 9.12 in the present investigation specific gravity

99
was measured which was high 1.146 in sachet pack and low in 1.030 in tetra pack.
Range of specific gravity was found between1.022 to 1.146.
Peach
PH of peach juice in different packing material was shown in Table 9.1
and Fig. 9.13. In this study largest mean value of pH 3.7 was found in tetra pack,
while smallest mean value of pH 3.5 was measured in plastic bottle. Range of pH
was measured between 3.5 to 3.7 in pine apple sample.
Conductivity of peach juice in different packing material was mention in
Table 9.1 and Fig. 9.14 largest mean conductivity 1.88 ms/cm was recorded in
tetra pack while smallest mean conductivity 1.529 ms/cm was measured in plastic
bottle. Range of conductivity was found to be 1.37 to 1.88 ms/cm.
Total dissolved solid of Peach juice in different packing material was
shown in Table 9.1 and Fig. 9.15. In this study largest TDS with mean value 734.5
mg/L was found in plastic bottle while smallest 653 mg/L was found in tetra pack.
Range of TDS between 640 to 829 was observed.
Salinity of peach juice in different packing material was presented in
Table 9.1 and Fig. 9.16. In the present work largest mean 0.7 ppt salinity was
measured in plastic bottle while smallest mean salinity 0.62 ppt was measured in
recorded in tetra pack. Range of salinity was measured between 0.6 to 0.8 ppt.
Dissolve oxygen of peach juice in different packing material was
presented in Table 9.1 and Fig. 9.17. In the present study maximum mean 7.49
mg/L DO was recorded in plastic bottle but least mean 0.92 mg/L was found in
tetra pack. Dissolve oxygen was found between a range 0.89 to 14.1 mg/L.
Specific gravity of peach juice in different packing material was presented
in Table 9.1 and Fig. 9.18 in the present investigation specific gravity was

100
measured which was high 1.071 in plastic bottle and low in 1.069 in tetra pack.
Range of specific gravity was found between1.069 to 1.08.
Lemon
PH of lemon juice was shown in Table 9.1 and Fig. 9.19. Mean value 3.3
of PH was observed in sachet pack. Range of pH 3.3 to 3.7 in lemon juice was
recorded.
Conductivity of lemon juice was shown in Table 9.1 and Fig. 9.20 Mean
value 2.784 ms/cm conductivity in sachet pack was measured. Range of
conductivity in lemon juice was found to be 1.78 to 4.14 ms/cm.
TDS of lemon juice in sachet pack was presented in Table 9.1and Fig. 9.21
mean value 1241.25 mg/L of TDS was measured in sachet packs. Range of TDS
between 807 to 1915 mg/L was recorded.
Salinity of lemon juice in sachet packs was mention in Table 9.1 and Fig.
9.22. Mean value of salinity 1.2ppt was recorded. Range of salinity between 0.8
to 1.9 ppt was measured.
DO in lemon juice of sachet pack was mention in Table 9.1 and Fig. 9.23
mean value 7.475mg/L of Do was measured. Range of DO between 2.5 to 17.3
mg/L was measured.
Specific gravity of sachet pack lemon juice was shown in Table 9.1 and
Fig. 9.24 mean values 1.112 were measured. Range of specific gravity between
1.049 to 1.1494 was recorded.
Strawberry
PH of strawberry juice was shown in Table 9.1 and Fig. 9.25 mean value
3.52 of pH was measured in strawberry tetra packs. Range of pH 3.4 to 3.6 was
measured.

101
Conductivity of strawberry juice was shown in Table 9.1and Fig. 9.26.
Mean value 1.349 ms/cm of conductivity was measured in strawberry tetra packs
.Range of conductivity 1.12 to 1.57 was recorded.
TDS of strawberry was mention in Table 9.1 and Fig. 9.27 mean value 609.5
mg/L was recorded. Range of TDS 515 to 704 mg/L was measured.
Salinity of strawberry was shown in Table 9.1 and Fig. 9.28. Mean value
6.6 ppt was recorded. Range of salinity 0.5 to 0.7ppt was measured.
DO was shown in Table 9.1 and Fig 9.29. Mean value 0.845 mg/L was
found. Range of DO 0.5 to 0.7 mg/L was measured.
Specific gravity was presented in Table 9.1 and Fig. 9.30. Mean value 1.06
was observed. Range of specific gravity was found to be 1.056 to 1.065.

102
Table 9.1
Physicochemical parameters of miscellaneous fruit juices
Code Packing material
Type of fruit pH Conductivity TDS Salinity Do Temp Specific
gravity Guava ms/cm mg/L ppt mg/L ( o C )
A Tetra pack 4.2 2.4 1225 0.9 0.61 32 1.023 B Tetra pack 4.4 2.56 1115 1.1 0.62 31.8 1.048 C Plastic bottle 4.3 2.48 998 0.8 0.59 31.5 1.08 A Tetra pack pine apple 2.7 1.17 493 0.5 0.73 31.5 1.022 B Tetra pack 3.5 2.17 954 0.9 0.35 30.2 1.024C Tetra pack 3.3 1.52 804 0.7 0.29 31.2 1.045 D S0lid 3.3 1.52 664 0.6 4.9 30.8 1.146 Peach A Tetra pack 3.7 1.88 653 0.6 0.92 27.6 1.069 B Plastic bottle 3.5 1.37 640 0.7 0.89 28 1.08 C Plastic bottle 3.5 1.68 829 0.8 14.1 28.7 1.071 Lemon A Solid 3.5 2.06 948 0.9 2.5 29.3 1.049 B Solid 3.7 3.15 1295 1.2 4.7 30 1.114C Solid 3.0 4.14 1915 1.9 5.4 29 1.137 D Solid 3.3 1.78 807 0.8 17.3 30 1.149 Strawberry A Tetra pack 3.4 1.12 515 0.5 0.62 29.7 1.056 B Tetra pack 3.6 1.57 704 0.7 0.35 30.3 1.065

103
Figure 9.1
Figure 9.2

104
Figure 9.3
Figure 9.4

105
Figure 9.5
Figure 9.6
106
Figure 9.7
Figure 9.8

107
Figure 9.9
Figure 9.10

108
Figure 9.11
Figure 9.12

109
Figure 9.13
Figure 9.14

110
Figure 9.15
Figure 9.16

111
Figure 9.17
Figure 9.18

112
Figure 9.19
Figure 9.20

113
Figure 9.21
Figure 9.22

114
Figure 9.23
Figure 9.24

115
Figure 9.25
Figure 9.26
116
Figure 9.27
Figure 9.28

117
Figure 29
Figure 30

118
RANGE OF HEAVY METALS (ppm) IN MISCELLANEOUS JUICES
Guava
Heavy metals concentration in Guava was presented in Table 9.2. It can be
seen that lower limit of Cr range of Guava juice was almost within the standard
same while upper limit was high within US-EPA, but range of Guava juice was
not permissible within W.H.O standards (see Appendix I). In this study Fe was
absent range of Ni almost high so, it was not safe within the standard (see
Appendix I).
Lower limit of range of Mn and Co in Guava juice was permissible within
us-EPA while upper limit of range was almost high. With W.H.O. (see Appendix
I). In this study range of Cu was measured within standards while range of Zn was
low (see Appendix I).
Range of Pb was permissible within the US-EPA but it was high as
compared to W.H.O. standard (see Appendix I). Upper limits of Range of Cd was
not allowable within the organization (see Appendix I).
Pine Apple
Heavy metals range of concentration in pine apple juices was presented in
Table 9.2 it was found that lowest limit of range of Cr was within the standard
while highest limit was not allowable within the standard (see Appendix I).
In our study upper limit of the range of Fe was above within (W.H.O,
1985; Ofori et al 2013). It was seen that in table 9.2 concentration range of Zn
was well below the US-EPA.
It can be notice that concentration range of Ni and Mn was not permissible
set by different organization, but low limit was within W.H.O (see Appendix I).
Co and Cu were within the standard (see Appendix I). Range of Pb and upper
limit of Cd was permissible within US-EPA but not safe within W.H.O. standards
(see appendix I).

119
Peach
Heavy metals range of concentration in peach juice was presented in Table
9.2. It was found that lower limit of concentration range of Cr was within the
standards while upper limit was not standards (see Appendix I). In this study
smallest limit of concentration range of Fe was almost same but upper limit was
not safe within the standards ((W.H.O, 1985; Ofori et al, 2013) range of Zn and
Cu was found was below (see Appendix I).
It was notice that range of Ni was above the (see Appendix I). It was
estimated that smallest limit of range of Mn was within US-EPA but upper was
not safe on the other side range was safe within W.H.O. organization (see
Appendix I). Range of Co and Cu in all samples of peach was within the US-EPA
and W.H.O (see Appendix I). In this study it was seen that upper limit of
concentration range of Pb was found within the US-EPA while upper limit was
not safe within W.H.O. in the present study upper limit of Cd was not safe within
the recommendation (see Appendix I).
Lemon
Range of Cr was shown in Table 9.2. It can be seen that low limit of range
of Cr was permissible, while upper permissible exceed the limits (see Appendix
I). Range of Fe was not permissible because it was very high within ( W.H.O
,1985 ; Ofori et al., 2013) it was found that range of Zn and Cu in all samples of
lemon was very below the recommendation (see Appendix I).
On the other side concentration range of Ni of lemon juice was very high
therefore it was not safe according to the standard (see Appendix I). It was seen
that upper limit concentration range of Mn was not permissible within the US-
EPA while it was allowable within W.H.O standard. Range of Co was permissible
according to US-EPA. Concentration range of Pb in lemon juices was within US-
EPA but it was high within W.H.O. limits therefore it was not safe. Upper limit of

120
concentration range of Cd was not allowable within both standards (see Appendix
I).
Strawberry
Range of heavy metal was presented in Table 9.2. It can be found that
lower limit of Cr of concentration range was permissible within both standards,
however upper limit above within the standard set by different organization (see
Appendix I) range of Fe was not permissible within the (W.H.O, 1985; Ofori et
al., 2013) Range of Zn was below the recommendation (see Appendix I).
Range of Ni in strawberry samples was not allowable within standards
(Appendix I) because it was very high. Concentration ranges of Co, Cu were
within standards (Appendix I). Range of Mn and Pb was within standards but Pb
was not within W.H.O (see appendix I). Cd was not found in strawberry samples.

121
Table 9.2
Range of heavy metals (ppm) in Misalliance Fruit Juices
Type of fruit juice
Cr Fe Zn Ni Mn Co Cu Pb Cd
Guava 0.1-0.68 0 0.089-0.178 1.142-1982 0.03-0.794 0-0.712 0.08-0.124 0.33-0.43 0-0.006
Pine apple 0.008-0.61 0-3.584 0.06-0.438 1.834-3.782 0.054-13.492 0-0.036 0-0.154 0.24-0.562 0-0.004
Peach 0.01-0.12 0.3-3.248 0.124-0.278 3.582-6.306 0.039-0.142 0-0.082 0.028-0.15 0-0.918 0-0.01
Lemon 0.032-0.756 1.056-7.196 0.042-0.088 3.184-4.286 0-0.1805 0.022-0.081 0.07-0.116 0.204-0.61 0-0.046
Strawberry 0.047-0.562 3.95-4.406 0.102-0.128 4.594-5.956 0.010-0.51 0.0841-0.086 0.12-0.168 0.068-0.124 0-0
122
METALS IN GUAVA JUICE.
Metals in Guava juice were shown in Fig 31. Highest concentration of Ni
was observed in both packing with a mean concentration 1.562 ppm in guava tetra
pack mean value 1.648 ppm was observed in plastic bottle. None of iron was
measured in both packing.
TOXIC METALS IN GUAVA JUICE
Toxic metals in Guava juice were presented in Fig. 32. Highest
concentration of Pb was measured in both packing. Mean value 0.472 ppm was
observed in plastic bottle while 0.389 ppm in tetra packs. Toxic Cd was found
with a concentration 0.006 ppm in tetra pack but none Cd was found in plastic
bottle.
METALS IN PINE APPLE JUICES
Metals in Pine Apple juice were shown in Fig 33. Ni was observed with
the highest concentration 2.18ppm in tetra pack and 13.492ppm in sachet pack
respectively. But Co was measured with minimum concentration in both packing
0.014 ppm and 0.00369 ppm
TOXIC METALS IN PINE APPLE JUICES
Toxic metals in Pine Apple juice were shown in Fig 34. In the present
work Pb was measured with mean value 0.401 ppm in tetra pack while 0.54 ppm
was observed in sachet pack. Mean concentration of Cd in sachet pack was found
to be 0.004 ppm. However none of Cd was measured in tetra pack.
METALS IN PEACH JUICES
Metals in peach juice were shown in Fig.35. It was observed that Ni was observed
with a maximum concentration in tetra pack and plastic bottle packing was 4.61
ppm and 4.944 ppm respectively. None of Co was observed in tetra pack Cr was
observed with last mean concentration 0.041 ppm in plastic bottle.

123
TOXIC METALS IN PEACH JUICE
Toxic metals in Peach juice were shown in Fig. 36. It was observed that
highest of mean value of Pb 0.918 ppm was measured in tetra pack but lowest was
found with a mean value 0.116 ppm toxic metals Cd was measured with mean
value 0.005 in plastic bottle while none was measured in tetra pack.
METALS IN LEMON JUICES
Metals in peach juice were shown in Fig 37. It was observed that in lemon
juice maximum mean concentration of Fe was observed with a concentration
4.012 ppm while minimum mean concentration of Cr 0.474 was measured.
TOXIC METALS IN LEMON JUICES
Toxic metals in peach juice were shown in Fig 38. Toxic metals Pb and
Cd were measured in lemon juice with mean value were 0.363 ppm and
0.0125ppm.
METALS IN STRAWBERRY JUICES
Metals in Strawberry juice were presented in Fig 38. In strawberry tetra
pack highest mean concentration 5.275 ppm of Ni was observed, while smallest
mean value 0.0313ppm of Mn was observed.
TOXIC METALS IN STRAWBERRY JUICES
Toxic metal were shown in Fig 40. It was found that Pb was found with
mean value 0.096 ppm, but none of Cd was measured in strawberry.
124
Figure 31
Figure 32

125
Figure 33
Figure 34

126
Figure 35
Figure 36

127
Figure 37
Figure 38

128
Figure 39
Figure 40

129
FUNGAL SPECIES ISOLATED FROM MISCELLANEOUS JUICES OF DIFFERENT BRANDS
Fungal species isolated was mention in Table 9.3.In this study it was seen
that only B sample of tetra pack of strawberry juice indicate the fungal
contamination with 0.34 cfu/ml. Penicillium sp, A. Flavus and A. niger were
recovered while none fungal growth was observed in miscellaneous type fruit
juices.
MICROBIAL LOAD IN MISCELLANEOUS JUICES OF DIFFERENT BRANDS
Microbial load was shown in Table 9.4 in strawberry juice. In sample B
2.8 x10³ cfu/ml total viable count was observed while 2.2 x 10² cfu/ml coliform
was measured. None microbial load was seen in all miscellaneous fruit juices.
In strawberry sample B total viable count was measured below the standard,
however total coliform and fecal coliform count was found obove the standard.
Furthermore Staphylococci were not measured.

130
Table 9.3
Isolated fungal species in miscellaneous juices of different brands
code Packing material Type of fruit Fungal Species cfu/ ml Guava A Tetra pack - - B Tetra pack - - C Plastic bottle - - Pineapple A Tetra pack - - B Tetra pack - - C Tetra pack - - D Sachet pack - -
Peach A Tetra pack - - B Plastic bottle - - C Plastic bottle - -
Lemon A Sachet pack - -
B Sachet pack - -
C Sachet pack
- -
D Sachet pack - - Strawberry
A Tetra pack - -
B Tetra pack
Penicillium sp, A .niger, A. flavus
0.34

131
Table 9.4
Microbial load in miscellaneous juices of different Brands
code
Packing material
Type of fruit
Total viable count
Total coliform
count
Fecal coliform
count
Total staphylococcal
count cfu/ml cfu/ml cfu/ml cfu/ml
Guava A Tetra pack - - - - B Tetra pack - - - - C Plastic bottle - - - - Pineapple A Tetra pack - - - - B Tetra pack - - - - C Tetra pack - - - - Solid - - - - Peach A Tetra pack - - - - B Plastic bottle - - - -l C Plastic bottle - - - - Lemon A Sachet pack - - - - B Sachet pack - - - - C Sachet pack - - - - D Sachet pack - - - - Strawberry A Tetra pack - - - - B Tetra pack 2.8X10³ 2.2X10² 1.2X10² -

132
10. SOFT DRINKS
PHYSICOCHEMICAL PARAMETERS OF SOFT DRINKS OF DIFFERENT BRANDS
Physiochemical parameters in soft drinks of different brands were shown
in table 10.1. In the present work range of pH in plastic bottle was measured
between 2.7 to 3.2 while in tin pack 2.7 to 3.01.
Range of conductivity was found in plastic bottle to be 0.423 – 1.339
ms/cm. However in tin pack was measured between 0.587-0.765 ms/cm.
Range of TDS in plastic bottle was found between 203 to 643 mg/L while
in tin pack was measured between 278-295 mg/L.
Range of salinity in plastic bottle was found between 0.2 to 0.6 ppt but in
tin pack 0.6 to 0.7 ppt was measured.
Range of DO in plastic bottle soft drinks was found 11.9 to 13.5 mg/L
while in tin pack 11.8 to 12.6 mg/L range was measured.
Range of specific gravity was measured in plastic bottle soft drinks
between 1.022 to 1.054 where as in tin pack 1.031 to 1.045.
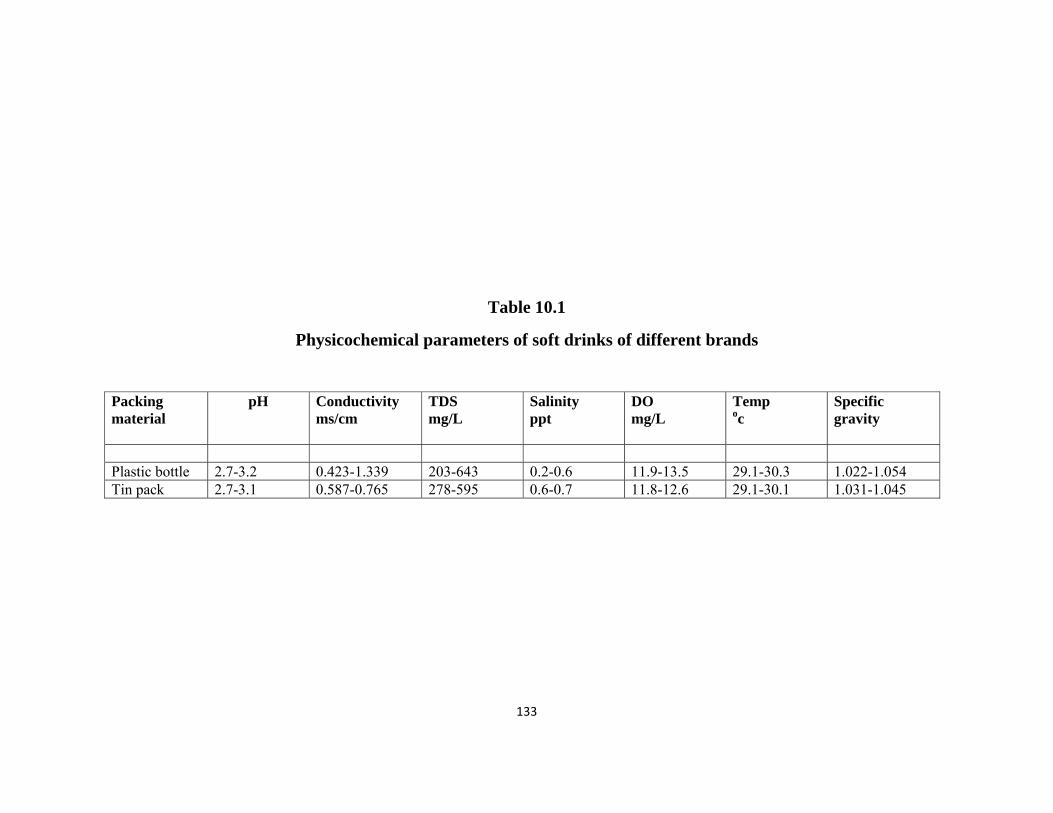
133
Table 10.1
Physicochemical parameters of soft drinks of different brands
Packing material
pH Conductivity ms/cm
TDS mg/L
Salinity ppt
DO mg/L
Temp oc
Specific gravity
Plastic bottle 2.7-3.2 0.423-1.339 203-643 0.2-0.6 11.9-13.5 29.1-30.3 1.022-1.054 Tin pack 2.7-3.1 0.587-0.765 278-595 0.6-0.7 11.8-12.6 29.1-30.1 1.031-1.045

134
RANGE OF HEAVY METALS (ppm) IN SOFT DRINKS
Upper limit of Cr in plastic bottle and range which was found in tin pack
was not within the W.H.O standards but not within US EPA in tin pack. Upper
limit of Iron in plastic bottle and range was found in tin pack was not save as in
(W.H.O, 1985; Ofori et al, 2013). In the present work range of Zn in both packing
was below the US-EPA. Range of Ni in both packing was high within both
standards. Upper limit of Mn in plastic bottle was not within standards, but in tin
pack range was permissible (see appendix I). Range Cu in both packing was
permissible within recommendation (see Appendix I). Upper limit of Co in plastic
bottle was not within standard but Range was found in tin pack was within the
standards (see Appendix I).Pb and Cd was not within standard (see Appendix I).
METALS IN SOFT DRINKS
Concentration of heavy metal in soft drinks was shown in Table 11.1. In
plastic bottle highest concentration of Ni was seen with the concentration 4.832
ppm where as Zn was observed with at tow level 0.046 ppm.
The highest concentration of Fe was seen in Tin pack with a concentration
2.21 ppm while Mn was observed at low level 0.062 ppm.
TOXIC METALS IN SOFT DRINKS
A toxic metal was shown in Fig 11.2 Toxic metal Pb was dominant in both
plastic bottle and tin pack with a concentration 0.1288 ppm and 0.378 ppm. While
Cd was measured with a smaller concentration in both packaging with a
concentration 0.1005 in plastic bottle but 0.004 ppm in tin pack.

135
Table 10.2
Range of heavy metals (ppm) in soft drinks of different brands
Packing Cr Fe Zn Ni Mn Co Cu Pb Cd
Plastic bottle 0-6.84 0-4.082 0-0.096 0.152-6.144 0.010- 0.466 0.01-0.174 0.072-.156 0-0.378 0-0.01
Tin pack 0.065- 0747 1.814-4.436 0.086-0.1 6.364-7.002 0.036-0.094 0.042-0.1 0-0.042 0-0.084 0.008-0.022

136
Figure 10.1
Figure 10.2

137
ISOLATED FUNGAL SPECIES IN SOFT DRINKS OF DIFFERENT BRANDS
Fungal species isolated from soft drinks of different packing material was
presented in Table 10.1. In present study fungal species which was isolated in
plastic bottle soft drink were Monilia sp, A. flavus, Rhizopus sp and Penicillium
sp. None of fungal growth was observed in tin pack soft drinks. In reported work
(Shanker et al., 2012) isolated the fungal species were Penicillium and genus
Aspergillus in soft drink.
MICROBIAL LOAD IN SOFT DRINKS OF DIFFERENT BRANDS
Bacterial load in soft drinks of different packing material was shown in
Table 10.2. Three samples of plastic bottle E, G and I were shown the bacterial
contamination. Sample E showed the maximum viable count while least count in
sample G. Range of total coliform count was found between 1.7 x10² to 2.2 x10²
in plastic bottle soft drinks while in tin pack soft drinks none was observed. E and
I sample showed fecal contamination on the other side fecal contamination in tin
pack soft drinks was not observed. Staphylococcal count in plastic bottle soft
drinks was found between 1.0 x 10² to 1.4 x10³cfu/ml. But none of growth was
observed in tin pack soft drinks.
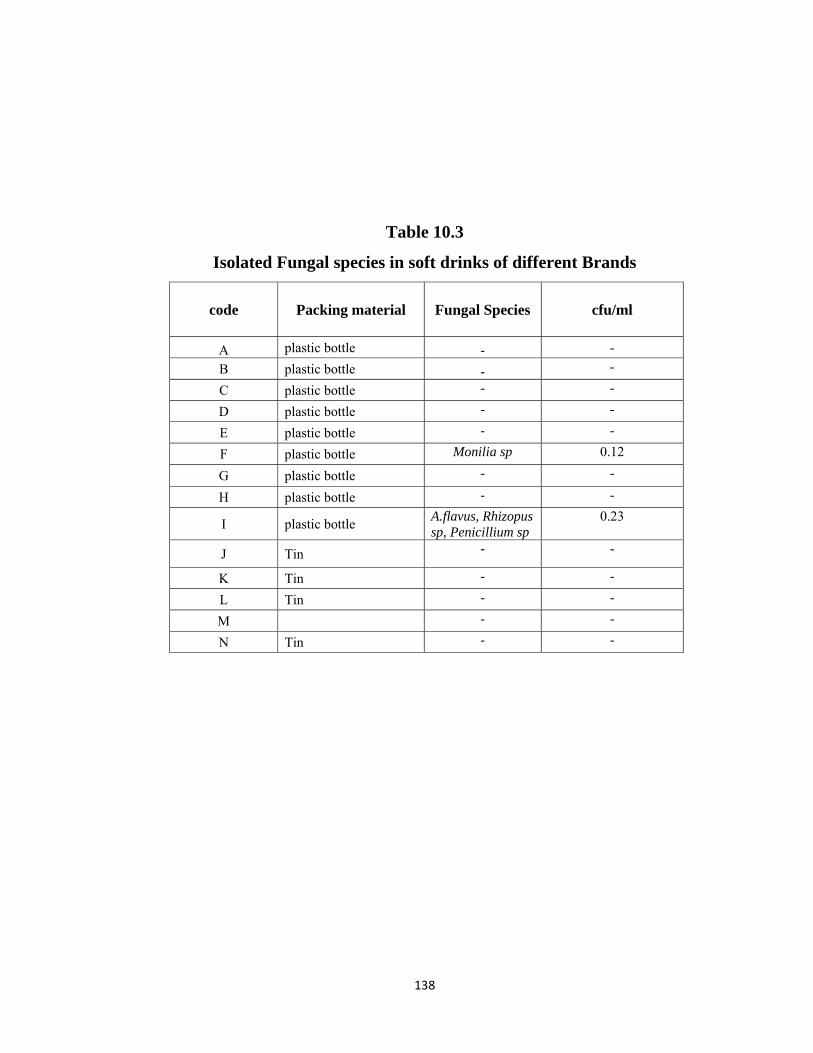
138
Table 10.3
Isolated Fungal species in soft drinks of different Brands
code Packing material Fungal Species cfu/ml
A plastic bottle - - B plastic bottle - -
C plastic bottle - -
D plastic bottle - -
E plastic bottle - -
F plastic bottle Monilia sp 0.12
G plastic bottle - -
H plastic bottle - -
I plastic bottle A.flavus, Rhizopus sp, Penicillium sp
0.23
J Tin - -
K Tin - -
L Tin - -
M - -
N Tin - -

139
Table 10.4
Microbial load in soft drink of different Brands
Code Packing material
Total viable count
coliform count
Fecal coliform
count
Total staphylococcal
count cfu/ml cfu/ ml cfu /ml cfu /ml
A Plastic bottle - - - - B Plastic bottle - - - - C Plastic bottle - - - - /D Plastic bottle - - - - E Plastic bottle 2.8 x 10³ 2.2x10² 1.2x10² 1.0x10² F Plastic bottle - - - - G Plastic bottle 1.2 x 10³ 1.7X10² - 1.4x10³ H Plastic bottle - - - - I Plastic bottle 2.6 x 10³ 1.8x10² 2.3x10² 2.9x10²
J Plastic bottle - - - - K Tin - - - - L Tin - - - - M Tin - - - - N Tin - - - -

140
11. STATISTIC ANALYSIS (ANOVA)
STATISTICAL ANALYSIS OF FRUIT JUICES OF DIFFERENT PACKING MATERIAL
For statistical analysis of data apply (ANOAV) technique for fruit juices
and soft drunks separately. In Table 11.1 mean concentration of Zn and Ni in tetra
pack, plastic bottle and sachet pack were equal hence study accepted null
hypothesis. However means of Cr, Fe, Mn, Co, Cu, Pb and Cd are not equal
hence rejected null hypothesis.
STATISTICAL ANALYSIS OF SOFT DINKS OF DIFFERENT PACKING MATERIAL
In Table 11.2 mean concentration of Zn, Cu, and Cd in plastic bottle and
Tin pack were equal hence study accepted null hypothesis. However the means of
Cr, Fe, Ni, Mn, Co and Pb are were not equal hence rejected null hypothesis.

141
Table 11.1
Univariate analysis of variance for fruit juices in different
Packing material Heavy metals
Null hypothesis
HO
Alternative hypothesis
HA
Level of significance
L.OS
F-Statistic P-Value Remarks
Cr All means are equal
All means are not equal
0.05 1.618 20.5 Reject HO
Fe do do 0.05 2.764 0.069 Reject HO
Zn do do 0.05 3.577 0.032 Accept HO
Ni do do 0.05 6.677 0.002 Accept HO
Mn do do 0.05 2.077 0.132 Reject HO
Co do do 0.05 .819 0.444 Reject HO
Cu do do 0.05 .615 0.543 Reject HO
Pb do do 0.05 .166 0.848 Reject HO
Cd do do 0.05 1.283 0.283 Reject HO
P-value was considered by means of one Way ANOVA F-test between varieties
of juices.
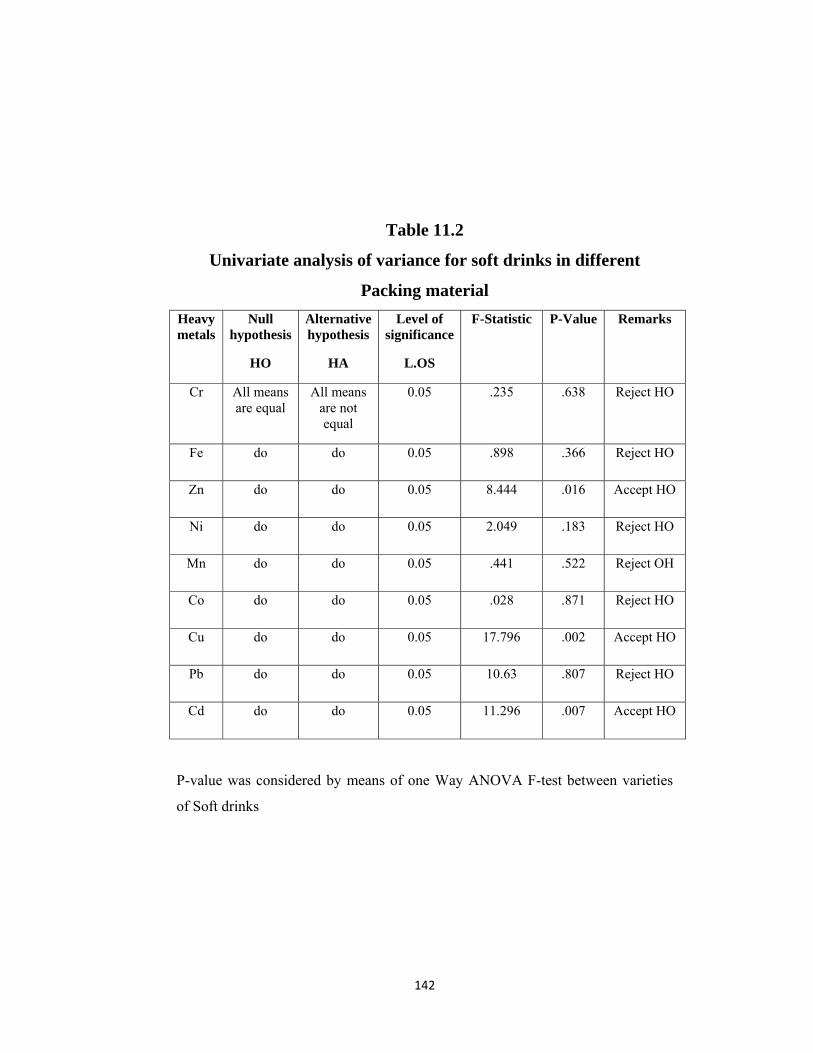
142
Table 11.2
Univariate analysis of variance for soft drinks in different
Packing material Heavy metals
Null hypothesis
HO
Alternative hypothesis
HA
Level of significance
L.OS
F-Statistic P-Value Remarks
Cr All means are equal
All means are not equal
0.05 .235 .638 Reject HO
Fe do do 0.05 .898 .366 Reject HO
Zn do do 0.05 8.444 .016 Accept HO
Ni do do 0.05 2.049 .183 Reject HO
Mn do do 0.05 .441 .522 Reject OH
Co do do 0.05 .028 .871 Reject HO
Cu do do 0.05 17.796 .002 Accept HO
Pb do do 0.05 10.63 .807 Reject HO
Cd do do 0.05 11.296 .007 Accept HO
P-value was considered by means of one Way ANOVA F-test between varieties
of Soft drinks

143
12. PACKING MATERIAL
Presence of Heavy metals in different fruit packing
Mean (range) of heavy metals in a variety of fruit juice of different
packing material was shown in Table 12.1
Present study shows that order range of concentration for Cr in Table 12.1
was not permissible above within the standards sets by the organization and also
dietary intake (see appendix I and II).It was found that upper limit of Fe in tetra
pack and plastic bottle also range was found in sachet pack was safe within limits
as in (W.H.O, 1985; Ofori et al., 2013) but if compared with dietary intake order
and concentration range below the standards.
It was found that Mean (range) of Zn was below the US-EPA also dietary
intake of trace element (see appendix I and II). Range of concentration and order
for Ni (T> B >S) was above within the standards in table 12.1 also was not
permissible with dietary intake Upper limit of Mn in all packing was not lies
within standards except range of Mn in plastic bottle permissible by W.H.O.
recommendation (see appendix I).Range of Mn in tetra pack and plastic bottle was
below within in daily intake level but upper level in sachet pack was high.
Mean range of Cu and Co in all packaging was within in all standards (see
appendix I) was also small within a dietary intake. In the present work range of Pb
was measured in all packing was within US-EPA but not safe according to W.H.O
recommendation. Upper limit of range of Cd in tetra pack and plastic bottle and
range was found in sachet pack was not safe within reference (see appendix I)

144
Presence of Heavy metals in different Soft drinks packing
Mean of heavy metals (ppm) in soft drinks was accessible in Table 12.2 In present
work it was found that means value of Cr and Ni in both packaging (plastic pack
and tin pack) was not permissible and above within standards (sees Appendix I)
Mean value of Fe in both packaging was high and not safe within 0.3 ml/L as a
(limit W.H.O., 1985; Ofori et al., 2013)
It was observed that range of Zn (plastic pack and tin pack) was low as
compared to standards Mean concentration of Mn, Co and Cd was approximate
within standards (see appendix I). Mean concentration of Pb in (plastic pack and
tin pack) was expectable within US-EPA, but obove within W.H.O (see
Appendix1).

145
Table 12.1
Mean range of heavy (ppm) in different packing materials of a
variety of fruit juices Heavy metal Tetra pack Plastic bottle Sachet pack Order
Cr 0.119 - 2.595 0.41 - 0.608 0.124 - 0.609 T> S>B
Fe 0-9.286 0-5.782 3.136-4.012 T> B>S
Zn 0.11-0.222 0.026-0.298 0.046-0.264 B> S>T
Ni 0.84-5.275 1.648-4.944 1.15-3.789 T> B>S
Mn 0.03-3.433 0.002-0.219 0.049 - 13.492 S> T>B
Co 0-0.101 0.048-0.081 0-0.00369 T> B>S
Cu 0.025-0.161 0.14-0.144 0.044-0.154 T> S>B
Pb 0.098 - 1.061 0-0.116 0.363-0.754 T> S>B
Cd 0-0.032 0-.016 0.0091 -0.249 S> T>B
T = Tetra pack B = plastic bottle S = Sachet pack

146
Table 12.2
Mean of heavy metals (ppm) in soft drinks of different
Packing material Heavy metal Plastic bottle Tin pack Order
Cr 1.038 1.028 Plastic bottle > Tin
Fe 2.330 2.21 Plastic bottle > Tin
Zn 0.046 0.076 Tin pack > Plastic bottle
Ni 4.832 0.152 Plastic bottle > Tin pack
Mn 0.151 0.062 Plastic bottle > Tin pack
Co 0.065 0.078 Tin pack> plastic bottle
Cu 0.103 0.092 Plastic bottle > Tin pack
Pb 0.128 0.378 Tin > Plastic bottle
Cd 0.005 0.004 Plastic bottle > Tin

147
CONCLUSION
In modern years, fruit juices have been incorporated extensively in the diet
of most the populace irrespective of age to meet their nutrient requirement
especially trace elements which are involved in the biological system of human
body and they contribute to good health. Rather than carbonated soft drinks
people favor to use natural drinks all over world and this knowledge is in advance
more currency day by day which also adds to the benefit of the fruit juice
production. Moreover hotels, hospitals are as well upward day by day anywhere
juices may perhaps be marketed effectively. Also the worldwide progress of
preferring fresh fruits and juices also makes possibilities of growth in this sector.
in addition, the growing exports volume and removal of CED (customs and excise
duty) on fruit juices (produced locally) could further supplement significant
growth in the fruit juice industry.
Therefore the assessment of fruit juices and soft drink is a fundamental
issue for consumer safety as they are widely consumed throughout the world. For
the study collected 100 samples including fruits juices and soft drinks of different
packing materials from different market location and retail stores of Karachi, the
largest city in Pakistan. The study aims to determine the physicochemical
parameters (PH, Conductivity, TDS, Salinity, DO, Specific gravity) of variety of
fruit juices and soft drinks by using HACH- session 105 parameters and correlates
of these with microbiological findings of the analysis In present work almost all
fruit juices have acidic pH-Range (2.7 to 4.7) due to high levels of sugar and a
low pH fruits juices usually favors mould and yeasts growth. but soft drinks have
acidic range (2.7 to 3.2), due to acid content PH of soft drinks is low(Jayalakshmi
et al ., 2011)
In present work range of TDS (445 to 1915) mg/L was observed in a
variety of fruit juices but in soft drink (203 to 295) mg/L .Total dissolve solid
contain electrolytes and salt of metals. Solid content of foodstuffs are associated
to their food values, better the solid content of the fruit greater is its nutritional

148
value( (Ikegwu and Ekwu, 2009) and this favors spoilage organism and agents to
produce and grow in fruits and their juices due to the reason in the present work
fungal contamination and microbial load in a variety of fruit have seen
.Conductivity can be used to find out the amount of total dissolved solid(TDS)
,because solid content are charge particles due to they conduct the electric current.
Density is the measure of how close and heavy is the particle of matter in
a sample. The values of specific gravity were recorded in the range of 1.003 to
1.156, however in soft drinks (1.022 to 1.054).Density can determined the value
of a specific fruit (Ikegwu and Ekwu, 2009). (Nwanekezi and Ukagu ,1999) report
that during separation of vital quality of fruit and vegetables density is an
engineering aspect that is functional for quality assessment.
In the present work show that dissolve oxygen is small in
tetra packs of fruit juices as compared to plastic bottles. However sachet packs
have dissolve oxygen in permissible limits. (Calderon and Bolin 1990) reported
that dissolve oxygen level in juices after gasification should be 2-9 ppm. In food
packaging Oxygen and water vapors are most important concerns in relation to
shelf life. In shelf life of produce existence of oxygen a key factor that limits the
Oxidation can reason changes in flavour, colour, and odour, in addition to destroy
nutrients and make feasible the development of aerobic bacteria, moulds, and
insects. (Raheem D, 2012).
Present work determined the mean-values of heavy metals of different
packing material in a variety of fruit juices and soft drinks of different packing
material for this purpose Atomic absorption technique was applied involves the
digestion of samples with HNO3. The results were compared with permissible
limit in drinking water imposed by the US-EPA, W.H.O (both for fruit juices and
soft drinks) and Recommended dietary allowances (RDA) only for fruit juices.
Present study shows that order and concentration of Cr was not permissible above
within the standards sets by the organization and also dietary intake (see appendix
I and II).It was found that upper limit of Fe in tetra pack and plastic bottle also
range was found in sachet pack was not safe within limits as in (W.H.O, 1985;

149
Ofori et al., 2013) but if compared with dietary intake order and concentration
range below the standards.
It was found that Mean (range) of Zn was below the US-EPA also dietary
intake of trace element (see appendix I and II). Range of concentration and order
for Ni (T> B >S) was above within the standards also was not permissible with
dietary intake (Appendix I and II).Upper limit of Mn in all packing was not lies
within standards except range of Mn in plastic bottle permissible by W.H.O.
recommendation (see appendix I).Range of Mn in tetra pack and plastic bottle was
below within in daily intake level but upper level in sachet pack was high.
Mean range of Cu and Co in all packaging was within in all standards (see
appendix I) was also small within a dietary intake. In the present work range of Pb
was measured in all packing was within US-EPA but not safe according to W.H.O
recommendation. Upper limit of range of Cd in tetra pack and plastic bottle and
range was found in sachet pack was not safe within reference (see appendix I)
Mean of heavy metals (ppm) in soft drinks was accessible In present work
it was found that means value of Cr and Ni in both packaging (plastic pack and tin
pack) was not permissible and above within standards (see Appendix I) Mean
value of Fe in both packaging was high and not safe within 0.3 ml/L as a (limit
W.H.O., 1985; Ofori et al., 2013)
It was observed that range of Zn (plastic pack and tin pack) was low as
compared to standards Mean concentration of Mn, Co and Cd was approximate
within standards (see appendix I). Mean concentration of Pb in (plastic pack and
tin pack) was expectable within US-EPA, but obove within W.H.O (see
Appendix1).
Contamination of heavy metals in fruits, vegetable and other crops are
main concern heavy metals acquire in the environment through water soil, air and
land activities like industrial discharge, leakage of municipal landfills, infected
tank effluent therefore their addition in food crops in higher concentration might
cause serious hazards to human health(Hughes ,1996).

150
Lead and Cadmium based additives used for plastic and dye give to heavy
metals content of MWC ash (IFT 2007).
Statistical analysis (ANOVA) was also carried out for a variety of juices
and soft drinks of different packing material. Result showed that null hypothesis
for Zn and Ni was rejected for fruit juices as well in soft drinks Zn, Cu, and Cd
were rejected. Synthetic chemicals used in the packaging, storage, and processing
of food stuffs, because most of these substances are not inert and can leach into
the foods, harmful to human health over the long period.(Science daily
2014).Packing acts like a wall against all sorts of pollution, although they are also
a cause of contamination(Everts S, 2009).
For identification of fungi in the juices, direct plating technique was
applied and the species were recovered in a variety of tetra pack fruit juices and
plastic bottle soft drinks. A. flavus was found in Apple, Mango, Punch,
strawberry and soft drinks while A.niger was found in Apple, Mango, Orange,
Grape, Punch and strawberry Penicillium was found in Orange, Punch,
Strawberry, and bottle drinks., Rhizopus was found in Apple, Mango, Orange,
Grape, Punch and Plastic bottles soft drinks ; Mucor and Candida albicans were
found only in Apple while saccromyces, Fusarium, Fumigate were found only in
Mango juice ; Monilia was found in Mango, Punch and soft drinks while Wentii
only in Mango juice. Genus Aspergillus was most frequent in juices in present
study. In food particularly in juices mould and yeast are common pollutant
(Batool et al., 2013).
(Oranusi et al., 2012; De Donno et al., 1998) reported fungal sp such as
Penicillium, Rhizopus, saccromyces and Aspergillus were observed in a variety of
fruit juices. (Jayalakshmi et al., 2011) reported, fungal species of Penicillium were
measured in Soft drink. None fungal contamination was observed in plastic bottle
and sachet pack of a variety of fruit juices and tin pack of soft.
Furthermore study indicated that a fungus was frequently observed in
tetrapacks of fruit juices may be due to permeability of packing by which they are
made. (De Donno et al., 1998) reported that 70% cartons was more risk than
151
plastic bottle 26.6% also carton are bent and hot filled in vacuum condition this
process causes a depression within the carton which may lead to the entry of air
and consequently favors mould (fungi) production
Standard cultural techniques were applied to assess the total viable count
(TVE) total coliform count (TCC) fecal coliform (FCC) and total staphylococcal
count (TSC). In the present work bacterial load was seen in tetra pack and plastic
bottle of a variety of juices and soft drinks but none bacterial load was seen in
sachet pack of fruit juices and tin pack of soft drinks. Bacterial load in a variety of
fruit juices was compared with gulf standards and fungal species with literature
review. Study observed that in some fruit juices bacterial load was within the
limits of gulf standard. Total viable count (TVC) in Apple, Mango, Punch and
strawberry juice was below the standard while in orange and grape was found
within the standard. Total coliform count (TCC) in Apple, Mango, Orange, Grape
Punch and strawberry juices was above the standard. Fecal coliform count (FCC)
in Mango, Grape, Punch and strawberry was above the standard while they were
absent in Apple and Orange. In preparation of juice water may source of total
coliform, fecal coliform, fecal streptococci(Ali et al.,2013).Staphylococcal count
was found in Apple, Mango, Punch juices was within the standard while in
Orange was above the standard they were absent in grape and
strawberry.Staphylococus is present in warm blooded animals particular in
humans, during processing of juice they perhaps origin of transmission (Batool et
al., 2013) But in present work presence of coliform, fecal coliform and
staphylococci in fruit juices and soft drinks of different packing materials indicate
that they were contaminated. Fruits become contaminated with microorganism
during preharvest, harvest and post harvest period of time through many sources
like fecal material harvesting equipment, human handling transport container,
wild and domestic animals, ice or water (Beuchat, 1995). In soft drink, many
microorganisms were originated as ecological contaminants but comparatively a
small number can cultivate inside the acidic or small oxygen atmosphere.
(Jayalakshmi et al., 2011).

152
All assessment it was determined that fruits juices and soft drinks might
cause serious hazards to human health. It was concluded that care and caution
should be taken to improve the quality of consumer product in every as pact on
the basis of may research work for health view do not use ready to eat drinks like
juices and soft drinks should be utilize fruits and homemade juices since they are
actually favorable for our health and life

153
Recommendation
• It is consequently suggested that utilization of a different fuels be
persistently pursued and included into the power mix of countries
international. Since, these fuels include biogas, biodiesel and bio-ethanol
and are suitable gradually more important not only because of the
diminishing petroleum reserves but also because of the environmental
consequences of exhaust gases from petroleum fuelled engines.
• Water used during irrigation, washing of fruits and vegetables and for
making fruit juices and soft drinks must be free from contaminated waste
and as well should not begin microorganisms through a period that be
capable of basis of spoil to the consumer.
• Must be treated organic fertilisers and sewage sludge. They do not
contaminate with germs at levels that may source of hazardous to the
produce.
• Juices and soft drinks should be labeled properly with respect to trace
elements like Cr, Fe, Zn, Ni, Co, Cu, Mn because they are essential and
are involved in metabolic system of human body. Pure Aluminum should
be used for packing and use of alloy of Aluminum should avoid. Safety of
chemicals used for purification processes and in production of packing
materials is suggested to be assessed.

154
REFERENCES
Addo M.G .,Akanwariwiak W.G., Addo-Fordjour P., Obiri-Dariao
KMicrobiological and Sensory Analysis of Imported Fruit Juices in Kumasi,
Ghana. Res. J. Microbiol , 3: 552-558. (2008).
Adepoju-Bello AA., Oguntibeju O.O., Onuegbu M.T., Ayoola G.A.A., Coker
H.A.B. Analysis of selected metallic impurities in soft drinks marketed in Lagos
Niger . Afr J Biotechnol, 11: 4676-4680. (2012).
Akhtar S., Naz, S., Sultan M.T., Mahmood, S., Nasir M., Ahmad A. Physico-
chemical attributes and heavy metal content of mangoes (mangifera indica l.)
Cultivated in different regions of Pakistan. Pak. J. Bot., 42 : 2691-2702. (2010).
Al Jedah J.H., Robinson R.K. Nutritional Value and Microbiological Safety of
Fresh Fruit Juices sold through Retail Outlets in Qatar. Pak J. of Nutr, 1: 79-81.
(2002).
Ali J., Ullah N., Khan F.A ., Akhtar S., -Rahman Z.U.R ., Ahmad I. Comparative
Microbiological Quality Evaluation of Un-Branded and Branded Juices of Street
Vended Sold in Retail Outlet of Peshawar City. American-Eurasian J. Agric. And
Environ. Sci, 13: 1155-1159 (2013).
American Association of Cereal Chemists. Cereal Foods World. 46: 26 – 112
(2001).
Ameyaw F., Ayivor J.E., Debrah S.K., Dzide S., Opata N.S., Sarfo Kantanka, D.
Determination of some trace elements in soft drinks from Ghana using INAA
method. Elixir Appl. Chem, 41: 5969-5971. (2011).
Arts I.C. and Hollman P.C. Polyphenols and disease risk in epidemiologic
studies. Am J Clin Nutr, 81: 317S-325. (2005).
Asharf W., Jaffar, M., Masud, K. Heavy trace metal and macronutrient levels in
various soft drinks and juices. Jour. Chem. soc. Pak, 22: 2. (2000).

155
Ashworth, .D.J., Alloway, B.J. Soil mobility of sewage sludge-derived dissolved
organic matter, copper, nickel and zinc, Environmental Pollut, 127: 137-144.
(2004
ATSDR (Agency for Toxic Substances and Disease Registry, Disease Registry.
Toxicological profile for lead. Washington DC: US Department of Health and
Human Services, Public Health Service, (1999).
Bagde N.I., Tumane, P.M. Studied on microbial flora of fruit juices and cold
drinks Asiatic Journal of Biotechnology Resources, 2: 454-460. (2011).
Basar M.A., Rahman S.R. Assessment of microbiological quality of processed
fruit juice. Bangladesh J. Microbiol, 166-168. (2007).
Batool S.A., Tahir S.S., Rafu N., Kalsoom R.Microbiological analysis
ofpasteurized and fresh fruit juices sold in Rawalpindi of Pakistan..Bangladesh J.
Sci. Ind.Res, 48: 185 – 192(2013).
Bellows L., Moore R. Water-Soluble Vitamins. Colored State University.
Retrieved, 12-07. (2008).
Beuchat C.R. Pathogenic microorganisms associated with fresh produce. J. Food
Prot. 59: 204-216. (1995).
Bhattacharya. Metal ion Biochemistry Narosa Publishing House New Delhi
Chennai Mumbai Kolka, 191, 193,194 - 195 (2005).
Bingöl M., gülderen., YeNtür G., er B., Öktem A.B. Determination of Some
Heavy Metal Levels in Soft Drinks from Turkey Using ICP-OES Method Czech J.
Food Sci., 28: 213–216. (2010).
Braun, R.D. Intrduction to chemical analysis. International Student Edition,
Mcgraw-hill book company 329, (1983).

156
Brock K.E., Berry G., Mock P., Lennan R.M., Truswell A.S., Brinton L.A.
Nutrients in diet and plasma and risk of in situ cervical cancer. J. Natl. Cancer
Inst, 80: 580-5 (1988).
Calderon M., Bolin B. Physiological and Biochemical Effects of Controlled
Atmosphere on Fruits and Vegetables. Food Preservation by Modified
Atmosphere, CRC Press, Boca Raton, Fla., 197-2. (1990).
Cowan, S.T. Manual for the identification of medical bactaria. 2nd edn. London:
Cambridge University Press, (1975).
Dai Q., Borenstein A.R., Wu Y., Jackson J.C., Larson E.B. Fruit and vegetable
juices and Alzheimer's disease the Kame Project. Am J Med, 119: 751-9 (2006).
De Donno A., Montagna M.T., Erroi R., Liaci, D., Sanapo, S., Caggiano, G.
Food products and fungal contamination Note II. Study on moulds presence in
pasteurized and fresh fruit juices. J Prev Med Hyg, 39: 71‐73 (1998).
Deanna M.M., Jeffrey S.B. Acid-alkaline balance role in chronic disease and
detoxification. Alternative Therapies, 13: 62–65 (2007).
Deboer M.D., Scharf R.J., Demmer R.T. Sugar-Sweetened Beverages and Weight
Gain in 2- to 5-Year-Old Children. Pediatrics, 132: 41 (2013).
Dehelean A., Magdas D.A. Analysis of Mineral and Heavy Metal Content of
Some Commercial Fruit Juices by Inductively Coupled PlasmaMass
Spectrometry. The Scientific World Journal, 2013 Article ID 215423: 6 (2013).
Doyle M.E. Fri Briefing Microbial Food Spoilage — Losses and Control
Strategies : 1, 3(2007)
Everts S. Chemicals Leach From packaging. Chemicals and Engineering News
home ,87: 11-15 (2009).

157
Eyong E.U., EtengM.U., Eyong, U.O. Comparative chemical analysis of some
brand of soft drinks consumed in Sout Nigeria. Nig. J. Biochem. Mol. Biol, 25: 36-
39 (2010).
Faried S.M., Enani, M.A. Levels of trace elements in commercial fruit juices in
Jeddah Saudi Arabia. journal of Islamic World Academy of Sciences, 18:1: 31-38.
(2010).
Faten, S.N., Khaled M.S ., Amal,T.A., Askar K.A. (2011). Factors affecting the
fungal contamination of some fruit juices packaged in tetra pack Afr. J.
Biotechnol , 10: 12957-12918 (2011)
Feldman, E.B. Fruits and vegetables and the risk of stroke. Nutr Rev, 59: 24-7
(2001).
Fellows P., Axtell B. Packaging materials. In: Fellows P, Axtell B, editors.
Appropriate food packaging: materials and methods for small businesses. Essex ,
U.K. : ITDG Publishing, 25-77. (2002).
Filtenborg O., Frisvad J.C., Thrane U. Moulds in food spoilage. International
Journal of FooMicrobiology, 33: 85-102 (1996).
Francis, G.A., Thomas, C., O’Beirne, T. The microbiological safety of minimally
processed vegetables. Int J Food Sci Technol, 34: 1-22. (1999).
Franke A.A., Cooney R.V., Henning S.M., Custer L.J. Bioavailability and
antioxidant effects of orange juice components in humans. J Agric Food Chem,
53: 5170-8. (2005).
Fukuwatari T., Shibata K. Urinary water-soluble vitamins and their metabolite
contents as nutritional markers for evaluating vitamin intakes in young Japanese
women. J. Nutr. Sci. Vitaminol, 54: 223–9 (2008).
Ghanim H., Sia C.L., Upadhyay M., Korzeniewski K., Viswanathan P.,
Abuaysheh S., Mohanty P., Dandona P. Orange juice neutralizes the proin

158
flammatory effect of a high-fat, high-carbohydrate meal and prevents endotoxin
increase and Toll-like receptor expression. Am. J. Clin. Nutr., 91: 940-9 (2010).
Gulf Standards. Microbiological Criteria for, Part-1, GCC, Riyadh (2000).
Harmankaya M., Gezgin, S., Özcan, M.M. Comparative evaluation of some
macro- and micro-element and heavy metal contents in commercial fruit juices,
Environ Monit Assess, 184: 5415–5420. (2012).
Heaney R.P., Rafferty K. Carbonated beverages and urinary calcium excretion.
Am. J. Clin. Nutr., 74: 343–347 (2001).
Hossain M.A., Rahman, M., Shabuz, M.Z.R. Quality of Industrially Processed
Fruit Juices: An Assessment Using Multivariate Framework. Dhaka Univ. J. Sci,
60: 169-173 (2012).
http://www.cdph.ca.gov/certlic/drinkingwater/Documents/DWdocuments/EPAand
CDPH-11-28-2008.pdf.
Hughes, W.W. Essentials of environmental toxicology. The effects of
environmental hazardous substances on human health. Loma, Lind Califonia. Tay
and Francais Publishers, 3: 87-95 (1996).
IFT. Food Packaging - Roles, Materials, and Environmental Issues. J Food Sci,
72: 1- 23 (2007).
IKegwu O.J., Ekwu F.C. Thermal And Physical Properties Of Some Tropical
Fruits And Their Juices In Nigeria. J Food Technol, 7: 38-42 (2009).
Iwegbue C.M.A., Nwozo S.O., Ossai E.K., Nwajei, G.E. Heavy Metal
Composition of Some Importted Canned Fruit Drinks in Nigeria. Am. J. Food
Technol, 3: 220-223. (2008)
Jalbani N., Ahmed F., Kazi T.G ., Rashid U., Alia Bano Munshi A.B., Kandhro
A. determination of essential elements (Cu, Fe, Zn) in juices of commercially
available in Pakistan. Food Chem. Toxicol, 48: 2737-2740 (2010).

159
Jayalakshmi T., Krishnamoorthy P.,. Ramesh G., Kumar Sivamani P., The
Microbiological Quality of Fruit Containing Soft Drinks from Chennai J. Chem.
Pharm. Res, 3: 626-630(2011)
Kasprzak K.S., Sunderman F.W .Jr., Salnikow K. Nickel carcinogenesis. Mutat.
Res, 533: 67-97 (2003).
Khan G., Anjum, T., Uddin F. Some Heavy and Toxic Metallic Constituents in
Citrus Fruits. Hamdard,. XLII: 109 - 112 (1999).
Krejpcio, Z., Sionkowski, S., Bartela, J. “Safety of fresh fruits and juices available
on the polish market as determined by heavy metal residues. POL J ENVIRON
STUD, 14: 877–881 (2005)
Kurowska E.M., Spence J.D., Jordan J., Wetmore S., FreemanD.J., Piché L.A.,
Serratore P.H.D.L. Cholesterol-raising effect of orange juice in subjects with
hyper- cholesterolemia. Am J Clin Nutr, 72: 1095 – 100 (2000).
Kwan M.L., Block G., Selvin S., Month S., Buffler P.A. Food consumption by
children and the risk of childhood acute leukemia. Am. J. Epidemiol, 16: 1098-107
(2004). .
Lewis J.E. Thompson P., Rao B.C. Human Bacteria in Street Vended Fruit Juices:
A Case Study of Visakhapatnam City. Internet Journal of Food Safety, 8: 35-38.
(2006).
Lieberman S., Bruning N. The Real Vitamin and Mineral Book. NY: Avery
Group: 3 (1990).
Lopez-Rubio, A., Almenar, E., Hernandez-Munoz, P., Lagaron, J.M., Catala, R.,
Gavara, R. Overview of active polymer-based packaging technologies for food
application. Food Rev Int, 20: 357–87. (2004).
Lund, B.M. Anaerobes in relation to foods of plant origin. In: Anaerobic Bacteria
in other than Man,In editors name (Barnes E.M., Mead G.C) Blackwell Scientific
Publications, 351-372: Oxford (1986).

160
Makhopadhyay M., Majumdar, M., Basu, P. Microbial Contamination of Street
vended Fruit Juices In Kolkata City Internet Journal of Food Safety, 13: 1-5.
(2011).
Malik V.S., Schulze M.B., Hu F.B. Intake of sugar-sweetened beverages and
weight gain a systematic review. Am. J. Clin. Nutr., 84: 274–328 (2006)
Maqbool A., Stallings V.A. Update on fat-soluble vitamins in cystic fibrosis. Curr
Opin Pulm Med, 14: 574–81. (2008).
Marshall T.A., Levy S.M., Broffitt,B., Warren J.J., Eichenberger-Gilmore J.M.,
Burns TL., Stumbo P.J. Dental caries and beverage consumption in young
children Pediatrics, 112: 84-91. (2003).
McKown C. Containers. In: Coatings on glass—technology roadmap workshop.
2000 Jan 18–19. Livermore , Calif : Sandia National Laboratories report, 8-10.
(2000).
Miller, D.M., Miller, W.P. Land application of waste. Summer M.E(ed)
Handbook of soil science CRC Books New York. (2000).
Mukhtar, A., Gilani, A.H., Bhattyurface, N. Some Nutritional and microbiological
aspects of apples of common varieties available for household Consumption J.
Animal and plant sci, 20: 253 (2010).
NACMCF (National Advisory Committee on Microbiological Criteria for Foods).
Microbiological safety evaluations and recommendations on fresh produce. Food
Control, 10: 117-143. (1999a).
NAZIM S, DAWAR S, TARIQ M., AND. ZAKI M.J. Quantitative estimation of
mycoflora in drinking water and fruit juices of Karachi. Pak. J. Bot., 40: 1263-
1268. (2008).
Nazim S., Dawar,S., Tariq, M., and Zaki, M.J. Quantitative estimation of
mycoflora in drinking water and fruit juices of Karachi Pak. J. Bot., 40: 1263-
1268. (2008).

161
Nelson, P.E., Toussoun T.A., Marasas W.F.U. Fusarium species. An Illustrated
Manual for Identification. The State Univ. Press, 193. (1983)
Nester E.W., Anderson D.G., Jr C.E.R., Pearsall N.N., Nester M.T. Microbiology
A Human perspective 4th Edition Mc GRAW- HILL 86 (2004)
Niazi S.B., Mahmood, F., Asghar, M.Z. Levels of some Major and Trace
Elements in commercial Mango fruit juices determined by Flame atomic
Absorption Spectrometery. Jour. Chem.Soc. Pak 19 : 122- 127 (1997).
Nma O.N .,Ola A.A. Microbiological Analysis of some Packaged Fruit Juices sold
in Port Hacourt Metropolis, Nigeria. Nature and Science,11(4). (2013).
Nnam N.M., Njoku I. E. Production and evaluation of nutrient and sensory
properties of juices made from citrus fruits. Nigerian Journal of Nutrition Science,
26: 62-66. (2005).
Nwanekezi E.C., Ukagu J.C. Determination of Engineering properties of some
Nigerian Fruit and Vegetables. Ig Food J, 17: 55-60 (1999).
Ofori H., Owusu, M., Anyebuno, G. Heavy metal analysis of fruit juice and soft
drinks brought from retail market in accra,Ghana Iournal of scientific report, 2:
423-428. (2013).
Okeri, H.A., Mmeremikwu, A.C., Ifeadi, A.N. Determination of Trace Metal
Levels in Drinking Water and Fruit Juice in Benin City, Nigeria Nutritional
Health Sciences, Vol. 1: 56-57. (2008).
Okoronkow, N.E., Igwe, JC., Nwuchekwa, E.C. Risk and health implications of
polluted soils for crop production. African J. of Biotechnol, 4: 1521-1524. (2005).
Okoye C.O.B., Ibeto, C.N. Analysis of Different Brands of Fruit Juice with
Emphasis on their Sugar and Trace Metal Content. Journal Home 7: 2. (2009).

162
Onianwa P.C., Adetola I.G., Iwegbue C.M.A., Ojo M.E ., Tella O.O. Trace heavy
metals composition of some Nigerian beverages and food drinks. Food Chem, 66:
275-279 (1999).
Oranusi, U.S., Braide, W., Nezianya, H.O. Microbiological and chemical quality
assessment of some commercially packed fruit juices sold in Nigria. Greener
Journal of Biological Sciences, 2: 001-006,(2012).
Page B., Edwards M., May N. Metal cans. In: Coles R, McDowell D, Kirwan
MJ, editors. Food packaging technology. London , U.K. : Blackwell Publishing,
CRC Press, 121-51. (2003).
Pasha, A.R., Butt, M.S., Mohinyudd, G. Quality evaluation of some commercial
manufactured fruit beverages. pak.j.Agri Sci, 31: 208 - 2014. (1994).
Pitt J.I., Hocking A.D. Fungi and Food Spoilage. Blackie Academic and
Professional, New York. (1997).
Pitt J.I. and A.D. Hocking A.D. Primary keys and miscellaneous fungi. New
York, Springer; 1: 122-124(2009).
Prabhat P., Flather M., Lonn E., Farkouh M., Yusuf S. The Antioxidant Vitamins
and Cardiovascular Disease A Critical Review of Epidemiologic and Clinical
Trial Data. Annals of Internal Medicine, 123: 860-872. (1995).
Pre Feasibility Study Fruit Juice Manufacturing Small and Medium Enterprise
Development Authority(SMEDA) Government of Pakistan. 4 6, 11, (2007)
Raben, A., Vasilaras T.H., Moller A.C., Astrup A. Sucrose compared with
artificial sweeteners different effects on a libitum food intake and body weight
after 10 weeks of supplementation in overweight subjects. Am. J. Clin. Nutr.,
76: 721-729 (2002).
Raheem D . Application of plastics and paper as food packaging materials – An
overvie. Emir. J. Food Agric. 212. 25 (3): 177-188

163
Rahman T., Hasan S., Noor R. An Assessment of Microbiological Quality of
Some Commercially Packed and Fresh Fruit Juice Available in Dhaka City: A
Comparative Study. Stamford Journal of Microbiology, 1: 13 - 18 (2011).
Rashed, N., Aftab M. U., Azizul M.H., Saurab, K. Microbiological study of
vendor and packed fruit juices locally available in Dhaka city, Bangladesh.
International Food Research Journal, 20: 1011-1015 (2013).
Sacharow S., Griffin Jr.R.C. The evolution of food packaging. Principles of food
packaging. 2nd ed. Westport , Conn. : AVI Publishing Co. Inc: 1‐61, (1980).
Said H.M., Mohammed Z.M. Intestinal absorption of water-soluble vitamins: an
update. Curr. Opin. Gastroenterol, 22: 140–6 (2006).
Said M., Rahman M.A., Dsilva A.L. Elements in Health and Disease Published
by Hamdard university press Medinat al Hikmat Bund Murad khan. And Prienters
: 122,124-125 , Karachi (1987).
Satarug S., Moore M.R. Adverse health effects of chronic exposure to low-level
cadmium in foodstuffs and cigarette smoke. Environ. Health Perspect, 112: 1099
-1103 (2004).
Sawyer C.N., Perry L., Mccarty G.F. Parkin. Chemistry for Environmental
Engineering and science. 5th Edition, Tata HILL Publishing Company Limited:
595 ,(2003).
Science daily news. Food packaging chemicals may be harmful to human health over long term. 2014.
Shanker A S., Kodaparthi A ., Pindi P.K. Microbiological Diversity in soft drinks.
JPSI, 1: 23 - 26 (2012).
Singh, S.P. Text book of Biochemistry 4th edition. CBS Publishers and
Distributon : 589, New Delhi Bangalore (2007).

164
Solidum J.N. Safety of Children from Lead in Packaged Snacks, Fruit Juices and
Distilled Water Marketed in Manila, Philippines International Journal of Chemical
Engineering and Applications, 3: 5. (2012).
Stockinge, H.E. The metal,” In editors name ( Clayton GD, Clayton FE). Patty’s
industrial hygiene and toxicology. Wiley interscience : 1687-1728 New York
(1881).
Szyczewski P., Siepak J. , Niedzielski P., Sobczyński T. Research on Heavy
Metals in Poland. Polish J. of Environ. Stud. 18: 755-768(2009)
Tasnim, F., Hossain M .A., Nusrath, S., Hossain K.M., Lopa, D., Formuzul
Haque, K.M. Quality Assessment of Industrially Processed Fruit Juices Available
in Dhaka City. Mal J Nutr, 16: 431 – 438. (2010) .
Tasnim, F., Hossain A.M., Hossain, N.S.K., Haque, F. Quality Assessment of
Industrially Processed Fruit Juice in Dhaka City, Banglades. East and Central
African Journal of Pharmaceutical Sciences, 14: 81-88 (2010).
TOC. West Europe Fruit Juice Market Research, Trends, Analysis Zenith
International, 190. (2008).
Torres G.R., Ponagandla N.R., Rouseff R.L., Goodrich-Schneider R.M., Reyes-
De-Corcuera J.I. Effects of Dissolved Oxygen in Fruit Juices and Methods of
removal. IN FOOD SCIENCE AND FOOD SAFETY, 8 : 409 - 423 (2009).
Tsimihodimos V., Kakaidi V., Elisaf M. Cola-induced hypokalaemiapatho
physiological mechanisms and clinical implications. INT J CLIN PRACT , 63:
900–2 (2009).
Tufuor, J.K., Bentum, D.K., Essumang, J.E. Kora. Analysis of heavy metals
incitrus juice from the Abura-Asebu- Kwamankese District, Ghana J. Chem.
Pharm. Res, 3: 397-402. (2011).
Uzcudun A.E., Retolaza I.R., Fernández P.B., Sánchez Hernández J.J., Grande
A.G., García, A.G., Olivar L.M., Sastre S.I.D., Barón M.G., Bouzas J.G. Nutrition

165
and pharyngeal cancer: results from a case-control study in Spain. Head Neck, 24:
830-4. (2002).
Vartanian L.R., Schwartz M.B., Brownell K.D. Effects of soft drink consumption
on nutrition and health a systematic review and meta-analysis. Am J Public
Health, 97: 667–675 (2007).
Victor B., Peter M., Lourdes Z. Trace element in fruit juice. Academic J, 146: 256
(2012).
Watto, M.H.S., T.G. Kazi, M.A. jakhrani, F. Anwar Q. U. Haque (2003)
Microbiological and elemental status assessments of trace and toxic elements in
locally produced glass bottled soft drinks. Jour. Chem. Soc. Pak 25: 133 1375,
(2003)
Welshimer, H.J., Donker-Voet, J. Listeria monocytogenes in nature.
Appl.Microbiol., 21: 516-519. (1971).
Whitney E.N., Rolfes, S.R. Understanding Nutrition. Ninth Edition Thomson
wadsworthcorporatio: 430 – 431, U.S.A (2002).
Whitney Ellie Sharon Rady Rolfes Understandrding Nutrition 11th Edition
Thomsonwadsworth corporation : 446, 453 ,U.S.A (2008)
WHO (World Health Organization) Guidelines for Drinking Water Quality,
Geneva, Switzerland, (2008).
WHO (World Health Organization) Guidelines for Drinking Water Quality,
Geneva, 1: 130 (1985).
Yoo S., Nicklas T., Baranowski T., IF et al., Yang SJ., Srinivasan SR., Berenson,
G.S. Comparison of dietary intakes associated with metabolic syndrome risk
factors in young adults the Bogalusa Heart Study. Am J Clin Nutr, 80: 841–848
(2004).

166
APPENDIX

167
APPENDIX-I
Drinking water contaminant and maximum admissible limits by
different organization
Heavy metal Contaminates
US-EPA Limits (ppm)
W.H.O. Limits (PPM)
Cr 0.0.1 0.05
Fe - -
Zn 5 NGLa
Ni 0.1 0.07
Mn 0.05 0.4
Co 0.1 NMb
Cu 1.3 2
Pb 1.5 0.01
Cd 0.005 0.003
NGLa: no guide line, because it occur in drinking water at concentrations well below those at which toxic effects may occur.
W.H.O, 2008 ; US-EPA, 2008 ; Dehelean and Magdas, 2013.

168
Appendix II:
Dietary in take of trace elements in the human body
S.No. Essential trace elements Diet mg/day
1- Chromium 0.05 - 0.1
2- Iron 15.0
3- Zinc 8.0 - 15.0
4- Nickel 0.4
5- Manganese 2.2 - 8.8
6- Cobalt 0.3
7- Copper 3.2
Said et al., 1987

169
Appendix III:
The recommended microbiological standards for any fruit juice
all numbers are as per ml of juice consumed
Parameter Total viable count
Coliform Fecal coliform
Staphylococci
Maximum count anticipated
5.0x10³ 10 0 100
Maximum count permitted
1.0x10⁴ 100 0 1.0x10³
(Gulf standards 2000; Rahman et al., 2001)

170
LIST OF PUBLICATIONS
• Anila Anwar., Rubina Perveen., Kanwal Nazim., S. Shaid Shaukat., Talat
Mehmood., Qamar-ul-Haque. INT.J. BIOOL. BIOTECH., 10(3): 411-516
(2013).
• Anila Anwar., Talat Mahmood., Qamar-ul-Haque., Sikander Sherwani
Quality assessment of commercial processed apple juice available in
Karachi City. FUUAST Journal of Biology, 4:(1) 33 - 37 (2014).