
Comprehensive study of the Assam dairy sector
88
International Livestock Research Institute 2007 Comprehensive study of the Assam dairy sector Action plan for pro-poor dairy development
Transcript of Comprehensive study of the Assam dairy sector
International Livestock Research Institute
2007
Comprehensive study of the Assam dairy sector
Action plan for pro-poor dairy development
i
Table of contents
Page
List of tables ....................................................................................................................... ii List of figures ..................................................................................................................... iii Acknowledgements........................................................................................................... 1 Overview............................................................................................................................ 2 Highlights of patterns of consumption of milk and dairy products in Assam............. 4 Highlights of milk and dairy product marketing in Assam ......................................... 14 Highlights of milk quality analysis ................................................................................ 24 Highlights of milk production systems in Assam ......................................................... 40 Action plan for dairy development in Assam............................................................... 58 Indicative budget............................................................................................................. 83
ii
List of tables
Table 1: Median physical and bacteriological quality parameters for raw and pasteurized milk .................................................................................................................................25 Table 2: Comparing quality of milk sold from an insulated van and an open vehicle at the same dairy .......................................................................................................................26 Table 3: Positive and negative food safety practices .........................................................30 Table 4: Access to livestock services ................................................................................49 Table 5: Source of last service for cows, as reported by survey farmers ............................50 Table 6: Main source of reported veterinary services in the previous 12 months ..............51 Table 7: Cattle- and buffalo-keeping by community group (among agricultural households)........................................................................................................................................56 Table 8: List of target tahsils and blocks for farmer cluster development interventions and higher grade cattle interventions ......................................................................................80
iii
List of figures
Figure 1: Overall preference rating for various types of dairy products ...............................5 Figure 2: Per capita consumption of fresh milk from survey data and compared with State of Assam estimates ............................................................................................................. 6 Figure 3: Weekly household expenditure on milk and dairy products ................................7 Figure 4: Quantity of home-produced and purchased raw milk for home consumption......7 Figure 5: Away-from-home weekly expenditure on milk and dairy products ......................8 Figure 6: Weekly household expenditures on different milk and dairy products .................9 Figure 7: Sources of milk and dairy product purchases by consumers ..............................10 Figure 8: Proportion of consumer responses to the statement “I am well satisfied with the present level of hygiene and quality of milk available”.....................................................11 Figure 9: Proportion of consumer responses to the statement “I am well satisfied with the purity of raw milk being sold by milk vendors” ................................................................11 Figure 10: Proportion of consumer responses to the statement “Procuring milk from milk vendors is not safe” ..........................................................................................................12 Figure 11: Flow chart of approximate milk and dairy product flow (in liquid milk equivalent) through the nine study districts ......................................................................15 Figure 12: Sources of initial capital for milk market agents ...............................................16 Figure 13: Proportion of milk purchased by raw milk traders from different sources .........17 Figure 14: Proportion of milk sold by raw milk traders to different types of clients ...........17 Figure 15: Net return per litre in raw milk trading across districts .....................................20 Figure 16: Net return per litre in traditional milk processing across districts .....................20 Figure 17: Average net return per litre of milk in raw milk trade and milk product processing........................................................................................................................21 Figure 18: Percentage of milk samples meeting local standards........................................24 Figure 19: Associations between quality aspects in raw and pasteurized milk ..................26 Figure 20: Example of a milk pathway..............................................................................28 Figure 21: Bad practice (improper manure disposal).........................................................30 Figure 22: Good practice (sieving milk)............................................................................30 Figure 23: Mean hygiene scores of different actors (n=75)................................................31 Figure 24: Samples with coliform quality problems fall into two categories......................31 Figure 25: Change in bacterial counts of milk sweets during processing and storage ........33 Figure 26: Differences in hygiene practices between shops producing safe and unsafe sweets ..............................................................................................................................34 Figure 27: Ability of consumers to judge adulterated milk ................................................36 Figure 28: Consumers’ actual ability to judge milk compared with self assessments .........36 Figure 29: Average herd size (cattle and buffalo) in tropical livestock units (1 local cow=0.7), by district ........................................................................................................41 Figure 30: Average milk production (kg per day) for local breed cows, by district ............41 Figure 31: Percentage of cows in the herd, by district.......................................................42 Figure 32: Average household milk production (kg/day/household)..................................43 Figure 33: Percentage change in milk production between 1996 and 2006......................43 Figure 34: Percentage of farmers keeping cross-bred cattle...............................................45 Figure 35: Feeding systems and market orientation for farmers keeping local breed cattle 47 Figure 36: Feeding systems and market orientation for farmers keeping cross-bred cattle .47 Figure 37: Reported feeding systems now and 10 years ago .............................................48 Figure 38: Percentages of farmers with at least one visit to different services in the previous 12 months, by district.......................................................................................................49

iv
Figure 39: Percentage of farmers citing diseases as one of the top three most important health problems ...............................................................................................................50 Figure 40: Milk sold as a percentage of total production ..................................................52 Figure 41: Milk sold as a percentage of total production, by district .................................52 Figure 42: Percentage of farmers selling cow milk, by market outlet and type of producer53 Figure 43: Percentage of farmers whose main outlet for milk sales is via traders...............54 Figure 44: Variation in average farmer-reported milk price received (Rs/litre) ...................55 Figure 45: Current DCS and milk plant activity and capacity............................................67 Figure 46: Local milk surplus and deficit based on projected production and consumption........................................................................................................................................67 Figure 47: Estimated travel time to nearest large urban centre ..........................................75 Figure 48: Percentage of farmer-reported local availability of veterinary services .............75 Figure 49: Percentage of milk sold by cattle and buffalo keepers......................................76 Figure 50: Recommended domains for initial farmer cluster development interventions...77 Figure 51: Human population density ..............................................................................78 Figure 52: Elevation (metres above sea level) ...................................................................79 Figure 53: Recommended domains for targeting of higher grade dairy cattle....................79
1
Acknowledgements A number of people and organizations participated in the process of developing the
information that has led to this action plan. Key partners included the Centre for
Humanistic Development, Assam Institute of Management, the Indian Institute of
Entrepreneurship, and the College of Veterinary Science, Assam Agricultural University.
The Department of Dairy Development of the Government of Assam played an
instrumental role in initiating the process, convening the stakeholders and partners, and
providing logistical and institutional support. Many other individuals and stakeholders
from various public and private institutions, non-governmental organizations and
cooperatives played important roles in providing guidance and feedback during the
process. Finally, thanks are due to the many farmers, market agents, processors,
consumers who took the time to provide the information on which this work is based.

2
Overview
This document outlines an action plan for pro-poor dairy development in Assam. It is
based on key findings of a preliminary report on a comprehensive study of Assam’s dairy
sector. The final version of the action plan contained in that report may be revised based
on feedback received from stakeholders.
Dairy production in Assam is mostly characterized by rural smallholder production using
indigenous cattle and buffalo, with pockets of more specialized dairy production. While
increasing farm-level production and productivity will require more improved animals,
improved fodder/feed technology and access to livestock services, access of smallholders
to reliable markets to absorb more milk at remunerative prices may remain a critical
constraint. Organized marketing of milk in Assam remains relatively insignificant, despite
past efforts to develop and promote collective market mechanisms. The traditional markets
for fresh liquid milk and traditional dairy products such as sweets account for most of the
market opportunities for farmers.
It is in this context that the International Livestock Research Institute (ILRI), in collaboration
with the Directorate of Dairy Development (DDD), Government of Assam, led a
comprehensive study on the dairy sector in Assam. ILRI is the only international research
institute which focuses on livestock systems in developing countries, working specifically
to benefit the poor. ILRI brought to the process a strong track record of pragmatic but
science-based research, conducted in partnership with national institutions and targeted at
increasing the welfare of smallholder dairy farmers in developing countries. Central to the
work of the team was strong collaboration with local research and development partners.
The overall objective of the study was to generate information and enhance local capacity-
building through joint learning to allow subsequent preparation of a pro-poor dairy
development action plan.
The specific objectives of the study were to:
• improve the performance of the traditional market, in terms of quality of milk and
dairy products, and marketing services and market access to small producers;

3
• contribute to the evolution of the traditional market towards the more formal milk
market and create conditions for convergence of the two;
• facilitate the evolution of smallholder producers to meet new opportunities and
threats posed by changing traditional and organized milk markets; and
• contribute to the overall growth and pro-poor development of the dairy sub-sector
in Assam.
Components of the study
• Initial qualitative assessment of the dairy sector to guide the subsequent project
activities
• Three integrated structured surveys of 1500 consumers, 600 traditional and formal
market agents and 3000 dairy producers in eight districts
• Study of successes and failures in the formal sector in Assam
• Sampling and quality analysis of milk and dairy products in traditional and formal
sectors
• Regular engagement and discussions with stakeholders to share study design,
progress and findings

4
Highlights of patterns of consumption of milk and dairy products in Assam
This section summarizes the key findings of the consumer survey of approximately 1500
households and institutions in the eight Assam Agriculture Competitiveness Project (AACP)
districts plus some selected areas in the North Cachar Hills district.
Fresh milk is the most preferred liquid milk product and is generally consumed by most
Assam-based consumers. Most urban and rural households usually or occasionally
consume fresh milk, and the widely accepted practice is to purchase raw milk and boil it
before consumption. There is general consensus among urban and rural consumers that
fresh milk is the most preferred for drinking and mixing with tea or coffee.
Consumption of pasteurized milk is very low and occurs only among urban households.
Overall, pasteurized milk was found to comprise less than 1% of all milk consumed, and
1.3% of urban consumption. However, pasteurized milk accounted for half of the liquid
milk consumption by the few urban households that consumed pasteurized milk (about 3%
of survey respondents). This suggests that demand for pasteurized milk is limited to a very
small segment of the urban society in Assam.
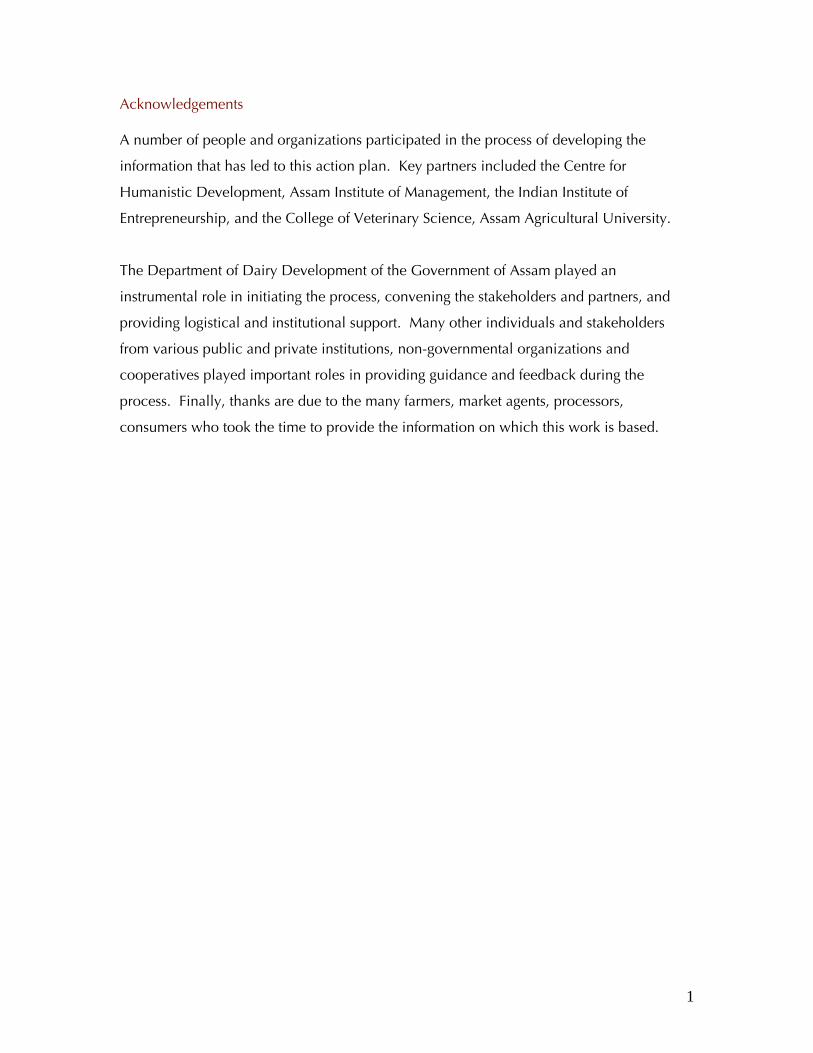
Differences in consumption preferences were observed between urban and rural
consumers. Consumers were asked to rate specific and overall attributes of different dairy
products on a scale of 0 to 10 (10 = strongest preference). Preferred attributes of milk
products by both urban and rural consumers were high fat content, fresh smell, milk from
local breeds, and generally cow milk rather than buffalo milk. Some of these attributes are
generally associated with fresh raw milk and not pasteurized milk, indicating the source of
demand driving the traditional market. However, among various product types, overall
preferences for powder, skimmed, pasteurized milk and lassi were much higher in urban
than in rural areas. For raw milk, packed fresh milk, condensed milk and ghol/matha/whey
the preferences were slightly different or about the same in rural and urban areas (Figure
1). This indicative demand for processed milk products by urban consumers could be
attributed to greater availability and awareness of such product types in urban areas and
the relatively higher purchasing power of urban consumers.
5
0123456789
Raw
Packe
d
G/M/W
Packe
d
Skimmed
Pasteu
r
Powder
Conden
sed
Lass
i
Rural Urban
Figure 1: Overall preference rating for various types of dairy products
The quantity and value of fresh milk consumption in urban and rural areas were similar.
Average per capita consumption of liquid milk from survey data in nine districts was about
44 and 37 litres per year in urban and rural areas, respectively (Figure 2). These figures are
relatively higher than the state average of 26 and 14 litres per capita per year in urban and
rural areas, respectively, based on a national household survey conducted by the
Government of India in 2000. The observed difference could be attributed to the survey
being conducted in districts with a long tradition of milk production and consumption,
indicating greater potential for dairy development than the rest of Assam. However, these
survey results are still way below the national average annual per capita milk consumption
that is estimated at 90 litres, based on the government national household survey.

6
05
101520253035404550
Sample Assam
Lite
rs/c
ap/y
ear
Rural Urban
Figure 2: Per capita consumption of fresh milk from survey data and compared with State of Assam estimates
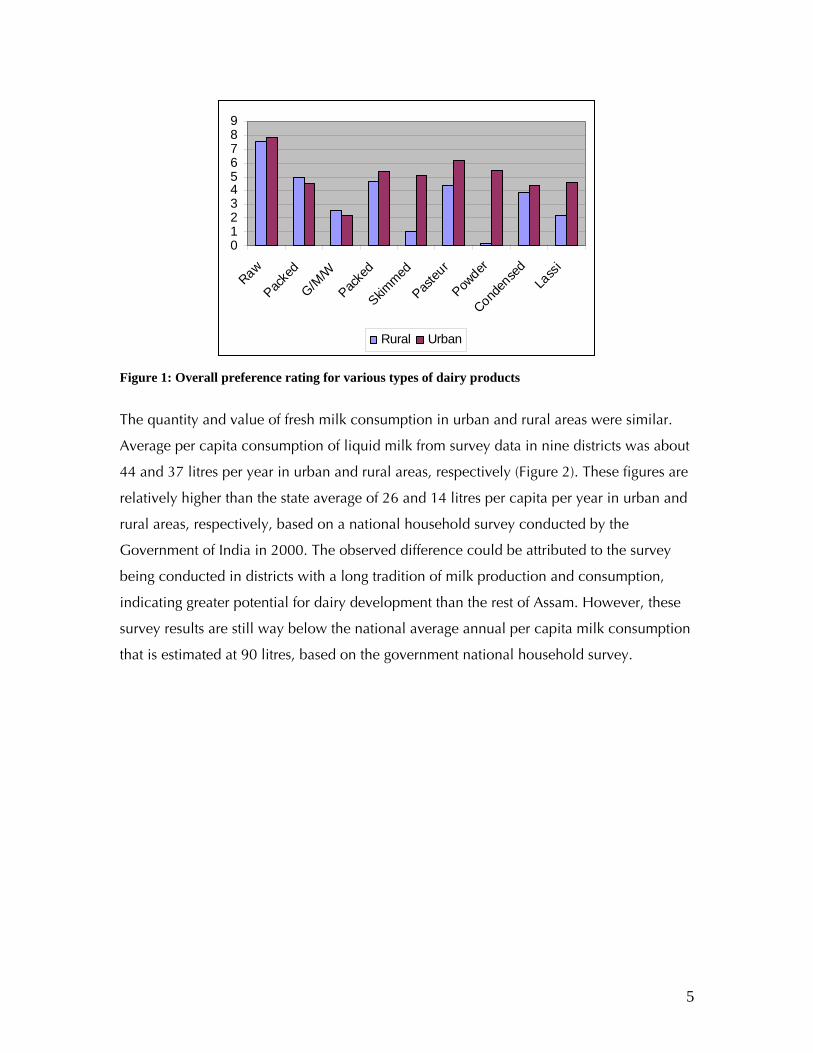
Total expenditure on milk and dairy products was higher among urban areas. On average,
surveyed urban households spent 152 rupees per week on home consumption of milk and
dairy products compared to 73 rupees by rural households. Raw milk purchases accounted
for most of the weekly home consumption expenditures on dairy products; on average, 67
and 34 rupees per household in urban and rural areas, respectively (Figure 3). Powdered
milk and other processed milk products (e.g. pasteurized, skimmed and flavoured) formed
a small part of dairy product purchases, with urban households spending relatively more
on these items than their rural counterparts. Urban consumers also spent twice as much as
their rural counterparts on purchases of milk-based sweets and other processed dairy
products (e.g. curd, ghee, paneer, butter) for home consumption during the same reference
period (Figure 3).
7
0
10
20
30
40
50
60
70
80
Raw processed liquidmilk
Powder Sweets other processeddairy products
Rupe
es/H
H/w
eek
Rural Urban
Source: Consumer survey, Assam dairy project (2006)
Figure 3: Weekly household expenditure on milk and dairy products
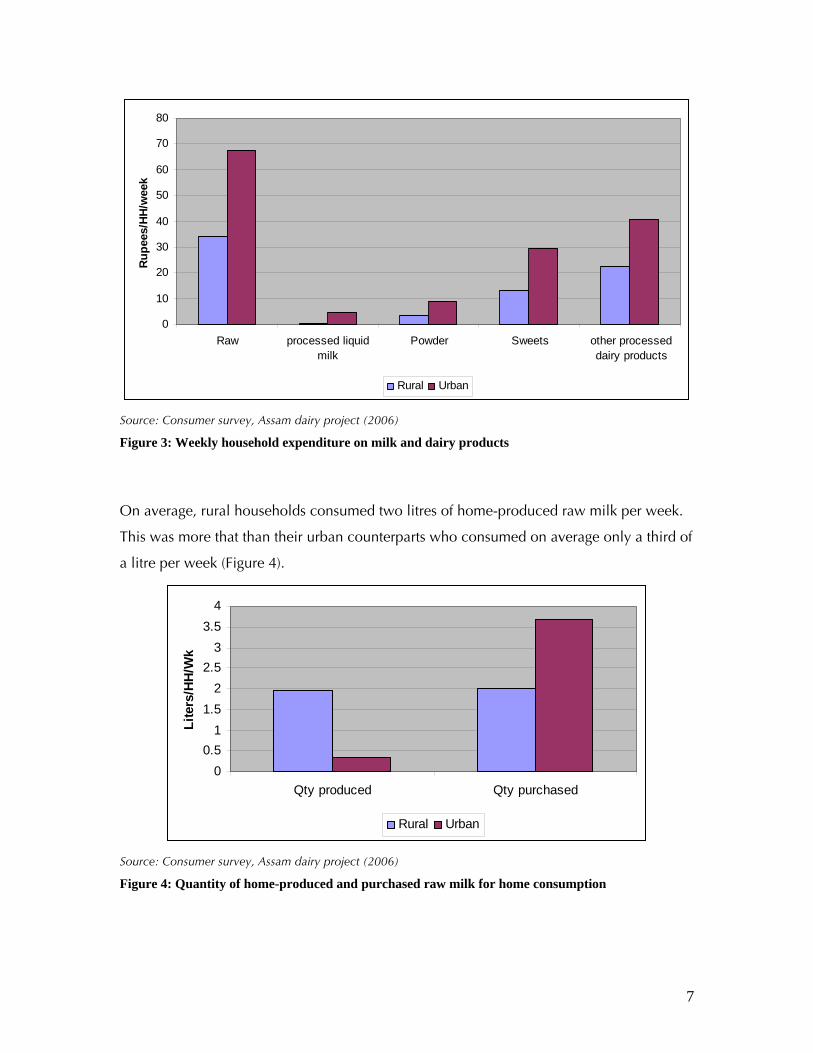
On average, rural households consumed two litres of home-produced raw milk per week.
This was more that than their urban counterparts who consumed on average only a third of
a litre per week (Figure 4).
00.5
11.5
22.5
33.5
4
Qty produced Qty purchased
Lite
rs/H
H/W
k
Rural Urban
Source: Consumer survey, Assam dairy project (2006)
Figure 4: Quantity of home-produced and purchased raw milk for home consumption
8
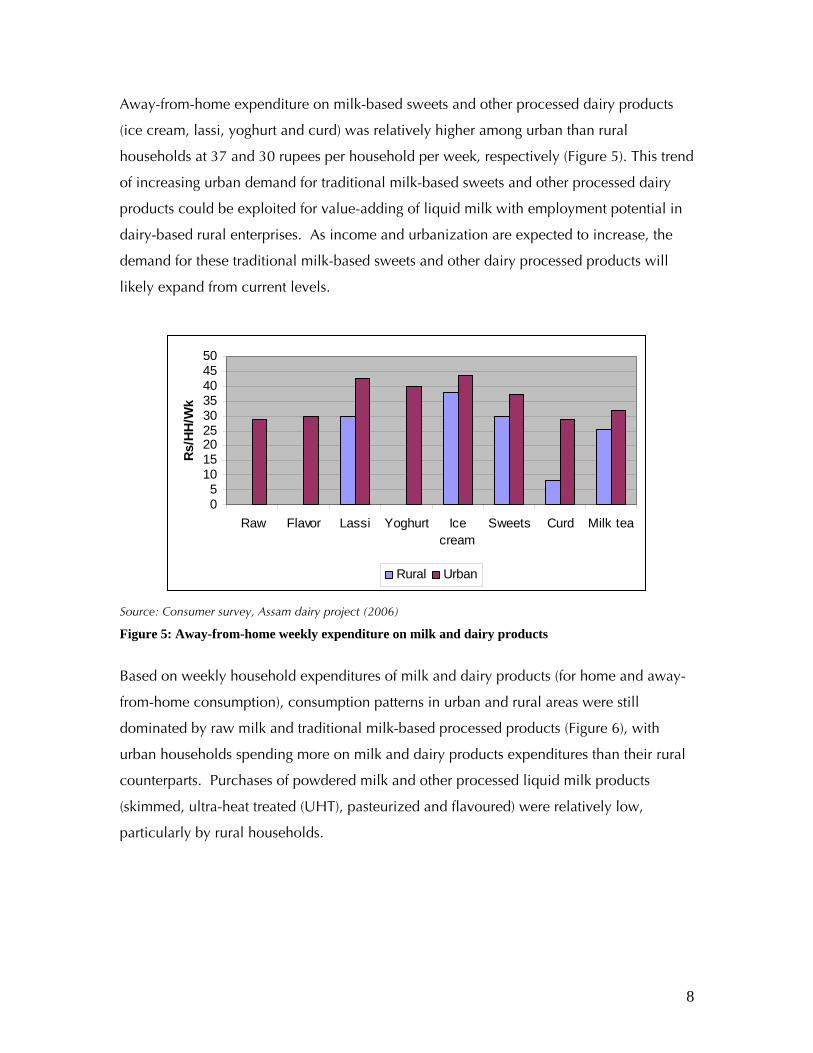
Away-from-home expenditure on milk-based sweets and other processed dairy products
(ice cream, lassi, yoghurt and curd) was relatively higher among urban than rural
households at 37 and 30 rupees per household per week, respectively (Figure 5). This trend
of increasing urban demand for traditional milk-based sweets and other processed dairy
products could be exploited for value-adding of liquid milk with employment potential in
dairy-based rural enterprises. As income and urbanization are expected to increase, the
demand for these traditional milk-based sweets and other dairy processed products will
likely expand from current levels.
05
101520253035404550
Raw Flavor Lassi Yoghurt Icecream
Sweets Curd Milk tea
Rs/H
H/W
k
Rural Urban
Source: Consumer survey, Assam dairy project (2006)
Figure 5: Away-from-home weekly expenditure on milk and dairy products
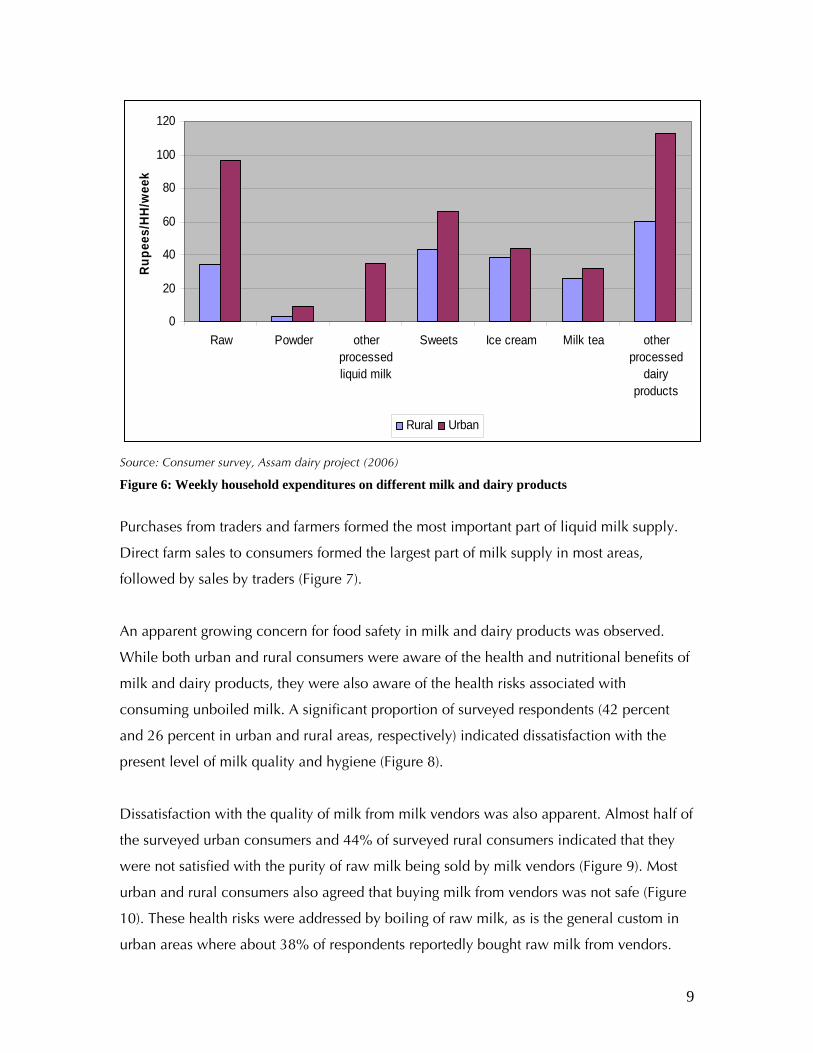
Based on weekly household expenditures of milk and dairy products (for home and away-
from-home consumption), consumption patterns in urban and rural areas were still
dominated by raw milk and traditional milk-based processed products (Figure 6), with
urban households spending more on milk and dairy products expenditures than their rural
counterparts. Purchases of powdered milk and other processed liquid milk products
(skimmed, ultra-heat treated (UHT), pasteurized and flavoured) were relatively low,
particularly by rural households.
9
0
20
40
60
80
100
120
Raw Powder otherprocessedliquid milk
Sweets Ice cream Milk tea otherprocessed
dairyproducts
Rup
ees/
HH/
wee
k
Rural Urban
Source: Consumer survey, Assam dairy project (2006)
Figure 6: Weekly household expenditures on different milk and dairy products
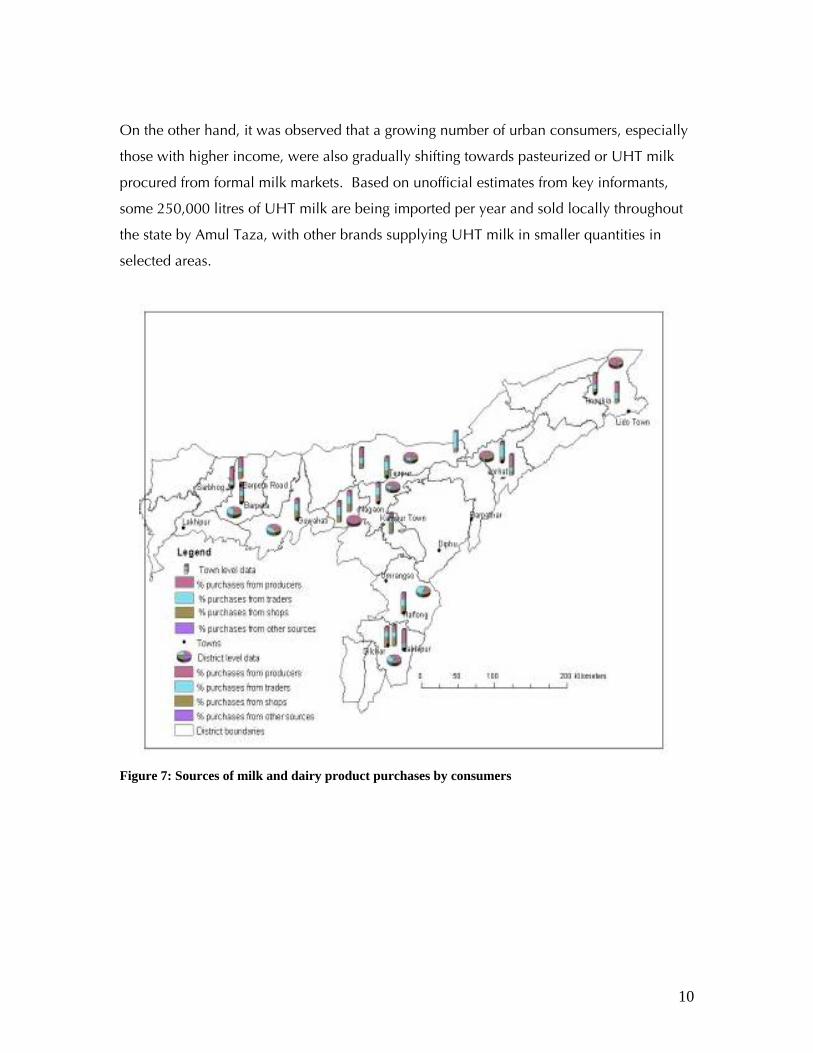
Purchases from traders and farmers formed the most important part of liquid milk supply.
Direct farm sales to consumers formed the largest part of milk supply in most areas,
followed by sales by traders (Figure 7).
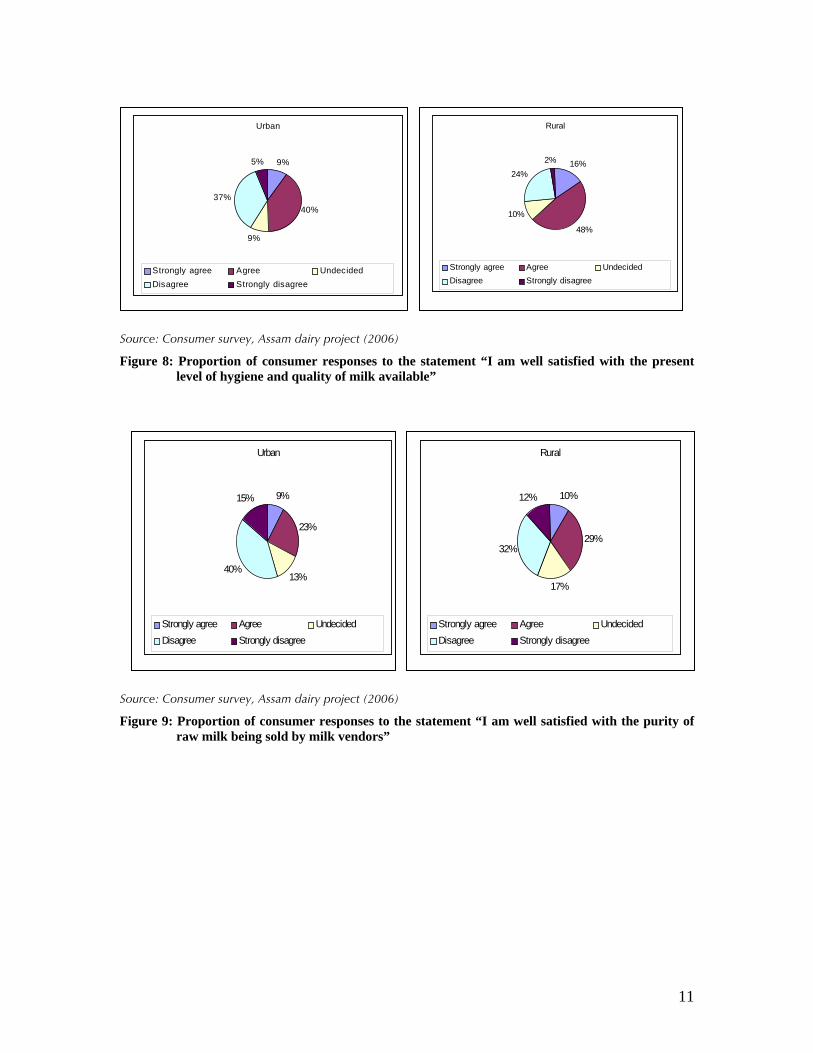
An apparent growing concern for food safety in milk and dairy products was observed.
While both urban and rural consumers were aware of the health and nutritional benefits of
milk and dairy products, they were also aware of the health risks associated with
consuming unboiled milk. A significant proportion of surveyed respondents (42 percent
and 26 percent in urban and rural areas, respectively) indicated dissatisfaction with the
present level of milk quality and hygiene (Figure 8).
Dissatisfaction with the quality of milk from milk vendors was also apparent. Almost half of
the surveyed urban consumers and 44% of surveyed rural consumers indicated that they
were not satisfied with the purity of raw milk being sold by milk vendors (Figure 9). Most
urban and rural consumers also agreed that buying milk from vendors was not safe (Figure
10). These health risks were addressed by boiling of raw milk, as is the general custom in
urban areas where about 38% of respondents reportedly bought raw milk from vendors.
10
On the other hand, it was observed that a growing number of urban consumers, especially
those with higher income, were also gradually shifting towards pasteurized or UHT milk
procured from formal milk markets. Based on unofficial estimates from key informants,
some 250,000 litres of UHT milk are being imported per year and sold locally throughout
the state by Amul Taza, with other brands supplying UHT milk in smaller quantities in
selected areas.
Figure 7: Sources of milk and dairy product purchases by consumers
11
Source: Consumer survey, Assam dairy project (2006)
Figure 8: Proportion of consumer responses to the statement “I am well satisfied with the present level of hygiene and quality of milk available”
Source: Consumer survey, Assam dairy project (2006)
Figure 9: Proportion of consumer responses to the statement “I am well satisfied with the purity of raw milk being sold by milk vendors”
Urban
9%
40%
9%
37%
5%
Strongly agree Agree UndecidedDisagree Strongly disagree
Rural
16%
48%
10%
24%
2%
Strongly agree Agree UndecidedDisagree Strongly disagree
Urban
9%
23%
13%40%
15%
Strongly agree Agree UndecidedDisagree Strongly disagree
Rural
10%
29%
17%
32%
12%
Strongly agree Agree UndecidedDisagree Strongly disagree

12
Source: Consumer survey, Assam dairy project (2006)
Figure 10: Proportion of consumer responses to the statement “Procuring milk from milk vendors is not safe”
Direct purchase from producers or close substitutes was the most preferred mode of
purchase of fresh milk by urban and rural consumers. Trust in the seller was the most
frequently cited reason by most urban and rural consumers in their choice of outlet for
purchasing raw milk. Econometric modelling of consumer choice of outlet for fresh milk
indicated that this decision is significantly influenced by several factors. These include
socio-demographics (e.g. ethnicity, location and income), willingness to pay a price
premium for quality/safety, packaging and consumer perceptions on quality and safety.
Specifically, Nepali respondents or those from minority tribal and low-income groups were
more likely to buy milk from producers than traders or milk vendors. Conversely, urban
consumers were less likely to purchase milk from producers. Those who rated purchased
milk as ‘satisfactory’ or ‘poor/bad’ were less likely to purchase from producers than those
who rated their purchased milk as ‘good’. Coupled with earlier results about the tendency
of urban consumers not to purchase milk from producers, this suggests that producers as
outlets are less accessible in urban areas. This is consistent with qualitative results from the
survey. Therefore, while urban consumers may indicate preference for direct purchase
from producers, it is not likely to be the main source of milk in urban Assam due to lack of
access to producers. Consumers who were satisfied with the purity of milk sold by vendors
were also less likely to purchase from producers. Those who bought milk from producers
Urban
13%
52%
21%
14% 0%
Strongly agree Agree UndecidedDisagree Strongly disagree
Rural
11%
55%
18%
16% 0%
Strongly agree Agree UndecidedDisagree Strongly disagree

13
were more likely to be satisfied with the unit cost of milk at a given quality. Also, those
who were willing to pay a premium price for quality milk were less likely to purchase milk
from producers. These results are linked to consumer concerns about milk quality and
indicate that trust in the seller is the most reliable manner of getting assurance on milk
quality.
Implications of the study highlights
The consumption study highlights point to the following implications that are directly
relevant to the action plan:
• Local fresh (raw) milk forms the most important part of dairy product consumption
and is supplied to consumers either directly from producers or through vendors.
Any dairy development plan must, therefore, constructively address the local fresh
milk market.
• Urban consumers were particularly concerned about the quality of local fresh milk,
especially that sold by producers and vendors. They addressed this concern by
buying milk only from well-known suppliers. Any plan to increase consumption of
milk must, therefore, address local fresh milk quality in a standardized manner that
builds consumer confidence in suppliers. Quality will have to be addressed to raise
consumption of fresh milk among existing and new consumers.
• Pasteurized milk formed a very small proportion of total milk consumption and was
limited almost entirely to the urban areas. It is thus unlikely that a development
plan focusing mostly on pasteurized milk supply will have positive impact on a
large number of producers and consumers.
• Urban households that bought pasteurized milk depended on it significantly. This
suggests that if awareness of and preference for pasteurized milk can be developed,
then demand can grow substantially.
• Urban consumers spent significantly more money on milk and dairy products,
particularly on high-value products such as sweets. This practice offers good
opportunities for value-addition and associated quality and safety assurance in
small-scale dairy processing of these traditional products. Such initiatives would
also contribute towards small-scale employment opportunities.
14
Highlights of milk and dairy product marketing in Assam
This section summarizes the key findings of a survey of 598 milk and dairy product market
agents from eight AACP districts and the North Cachar Hills. Of the market agents
surveyed, 590 were traditional and the remaining eight were formal milk market agents or
institutions. Of the traditional agents, 355 (60%) sold raw milk, 222 (38 %) processed
traditional dairy products and the remainder did both. Six of the eight formal milk market
agents were dairy co-operatives and the rest were self-help groups (SHGs).
The traditional milk market, comprising unprocessed milk and traditionally processed dairy
products, sold 97% of all milk and dairy products in the State with the remaining 3% being
sold by the formal milk market. However, because producers on average sell only 17% of
the milk they produce, the local market only supplies 66% of total consumption. The rest
is supplied by dairy products imported from outside the State.
An overview of milk and dairy product flows in the target districts, expressed in liquid milk
equivalents, is shown in Figure 11. This is estimated based on a combination of the results
of the main surveys (consumer, market agent and producer), and NSSO (Government of
India) data. The percentages add up to 100% for each step of the market channel, showing
relative shares of the milk flow emerging from that step.
Traditional processors (mainly sweet-makers) were found to have higher levels of
education (11 years) compared to raw milk traders (7 years). This indicates that education
may be a barrier to entry into value-added dairy activities or that milk processing families
were better able to educate their children than raw milk traders. Traditional milk trading
was found to be primarily a male activity, as only 2 out of 590 milk traders surveyed were
women. Further, the traditional milk trading in the state was dominated by very small
traders; 78% of the milk market agents sold a maximum of only 60 litres of milk per day.
Milk marketing and livelihoods
Sixty seven percent of milk market agents depended solely on milk marketing for their
household incomes. For the remaining market agents, the role of milk marketing in their
household income was still significant. On average, milk market agents had been in

15
business for about 12 years and 86% of them began their businesses themselves. These
findings point to the fact that small-scale milk marketing and traditional processing are
becoming family businesses and they form important long-term livelihoods for a large
number of people who may have few other opportunities.
Figure 11: Flow chart of approximate milk and dairy product flow (in liquid milk equivalent)
through the nine study districts
Sources of initial capital
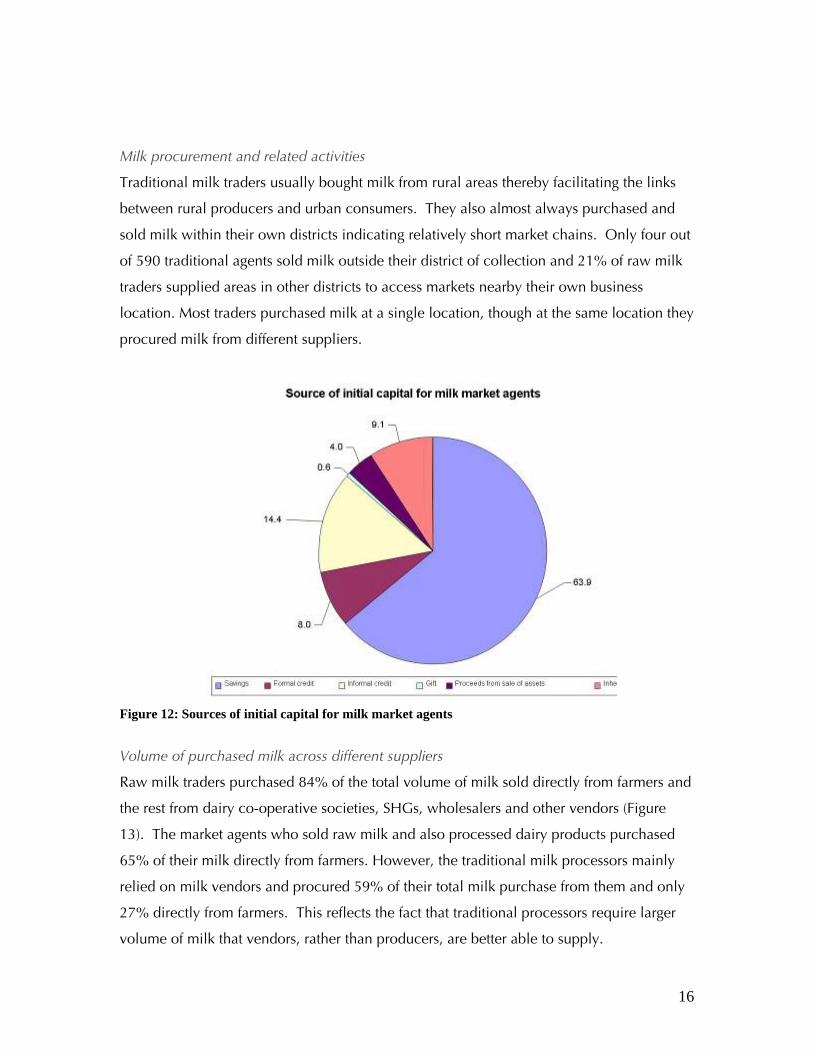
Sixty-four per cent of the surveyed market agents started their businesses with their own
savings, while 14% and 8% of them, respectively, used informal and formal credit (Figure
12). The high dependence of market agents on their own resources and informal credit
may constrain them from scaling up their activities and entering into more remunerative
value-addition activities, which are generally more capital-intensive. The econometric
analysis indicated capital to be one of the most important factors for scaling up of the
business and participation in milk processing activities.
16
Milk procurement and related activities
Traditional milk traders usually bought milk from rural areas thereby facilitating the links
between rural producers and urban consumers. They also almost always purchased and
sold milk within their own districts indicating relatively short market chains. Only four out
of 590 traditional agents sold milk outside their district of collection and 21% of raw milk
traders supplied areas in other districts to access markets nearby their own business
location. Most traders purchased milk at a single location, though at the same location they
procured milk from different suppliers.
Figure 12: Sources of initial capital for milk market agents
Volume of purchased milk across different suppliers
Raw milk traders purchased 84% of the total volume of milk sold directly from farmers and
the rest from dairy co-operative societies, SHGs, wholesalers and other vendors (Figure
13). The market agents who sold raw milk and also processed dairy products purchased
65% of their milk directly from farmers. However, the traditional milk processors mainly
relied on milk vendors and procured 59% of their total milk purchase from them and only
27% directly from farmers. This reflects the fact that traditional processors require larger
volume of milk that vendors, rather than producers, are better able to supply.

17
% of milk purchased by raw milk trader from different sources
0.4
1.4
84.4
1.4
8.3
3.80.3
Individual farmer Dairy coop/society Self-help group for dairy WholesalerRetailer Trader (mobile) Private processor
Figure 13: Proportion of milk purchased by raw milk traders from different sources
% milk sold by raw milk trader to different type of client
55.95
0.06
0.06
0.98
5.21
1.17
6.11
0.37
27.87
2.23
Household consumers Wholesalers Retailers (with kiosks) Private dairy processorsDairy plants Cooperatives Traders (mobile) SupermarketsHotels/restaurants Govt. institutions
Figure 14: Proportion of milk sold by raw milk traders to different types of clients
Milk prices
The milk procurement prices varied with type of milk market agents and scale of
procurement. The price of milk paid by the larger traders (Rs. 14.20/litre) was higher than
that paid by small (Rs.13.50/litre) and medium (Rs.13.60/litre) traders. Large milk traders
18
were able to offer higher prices to their suppliers and maximize total profit by handling
larger quantities of milk thereby fetching higher prices from customers and reducing the
cost per unit of milk handled. The different markets were relatively integrated as the
variation in purchase or sale price was not very large. The price differences with scale,
however, point to potential incentives to scaling up and returns to those traders who have
access to the capital required to do that. Again, this points to the fact that capital is a
constraint to scaling up in the local dairy industry.
Nature and scope of contracts
The terms and conditions for purchase and sale of milk were generally observed to be
informal and largely relying on mutual trust. For instance in Kamrup, dairy farmers’
associations negotiate prices with traders’ associations and the same has to be followed by
the member farmers. The mechanism of price determination is flexible so that agreed
prices often change. Milk market agents rarely enter into any form of written contract or
agreement for the quantity, quality or price of milk procured. The common quality control
measures reported by traders were visual inspection and use of lactometer and centrifuges.
However, more than one-third of the milk traders did not adopt any quality control
measures and relied on mutual trust. Few traders provided services and inputs such as
veterinary medicines or cattle feed to producers but 55% of the market agents reported
advancing cash to their suppliers without interest to assure future milk supply. Again, this
points to the capital needs for larger scale operations, in this case working capital, which
can be redressed by providing credit to suppliers.
Processing of milk products
The various types of milk products processed by traditional milk market agents in Assam
were sweets, cream, paneer, channa and other minor products. The volume and frequency
of processing a specific milk product depended on demand for the product. Processing of
milk products was done in a processing centre in the trading premise or at a simple
processing facility at the residence of the agent depending upon the volume of business.
On average, up to 60 litres of milk was processed per day. Sixty one percent of milk was
processed into milk sweets, 15% into cream, 9% into paneer and 9% into channa. The rest
of the milk was used for to prepare ghee and cultured milk.

19
Training in milk handling and processing of milk and milk products
Nearly 99% of the respondents started their enterprise without any kind of formal training;
many learned from other family members or while working in a milk processing shop
before starting their own shops. This, however, leaves some scope for training interventions
aimed at increasing the efficiency of these agents and improving the quality of milk they
sell because the quality and hygiene of most products were below standard. Interventions
to train small-scale milk traders in other countries and regions have been demonstrated to
lead to improvements in quality and consumer satisfaction.
Adulteration of milk and other processed milk products
There were instances of widespread adulteration of milk by traders. These were higher
among raw milk traders (36% of cases). Water was the most common adulterant of milk
and a few traders also conceded to adding skim milk powder to raw milk. The magnitude
of adulteration with water varied from 10 to 50% of the volume of the milk. The most
common reason for adulteration was to take advantage of increased prices resulting from
the demand-supply gap in milk and milk products.
Costs and returns in milk marketing
The returns from milk and dairy product trading (either fresh or processed) appeared to be
high in comparison to the available alternatives. On average, the surveyed milk traders
earned a profit of Rs. 259 per day that varied across districts and scale of business (Figure
15). The returns per unit of milk handled from fresh milk trade were significantly lower
than those from value-added traditional products (Figures 16 and 17). But value-addition
requires a higher capital investment and it has its inherent risks. In raw milk trading, small
traders turned out to be the most efficient in terms of profit per unit output but their
household income was meagre because of the small scale of business. Scaling up of their
businesses would be helpful in improving their incomes. The margins in fresh or raw milk
trading depended on several factors, e.g. volume of business, distance, level of
infrastructure, urbanization, availability of milk with respect to demand, and purchasing
power, tastes and preferences of consumers. As these parameters changed across different
locations, the net return received by milk market agents also exhibited considerable spatial
variations. However, milk processing seems to be scale-efficient in favour of larger units.
20
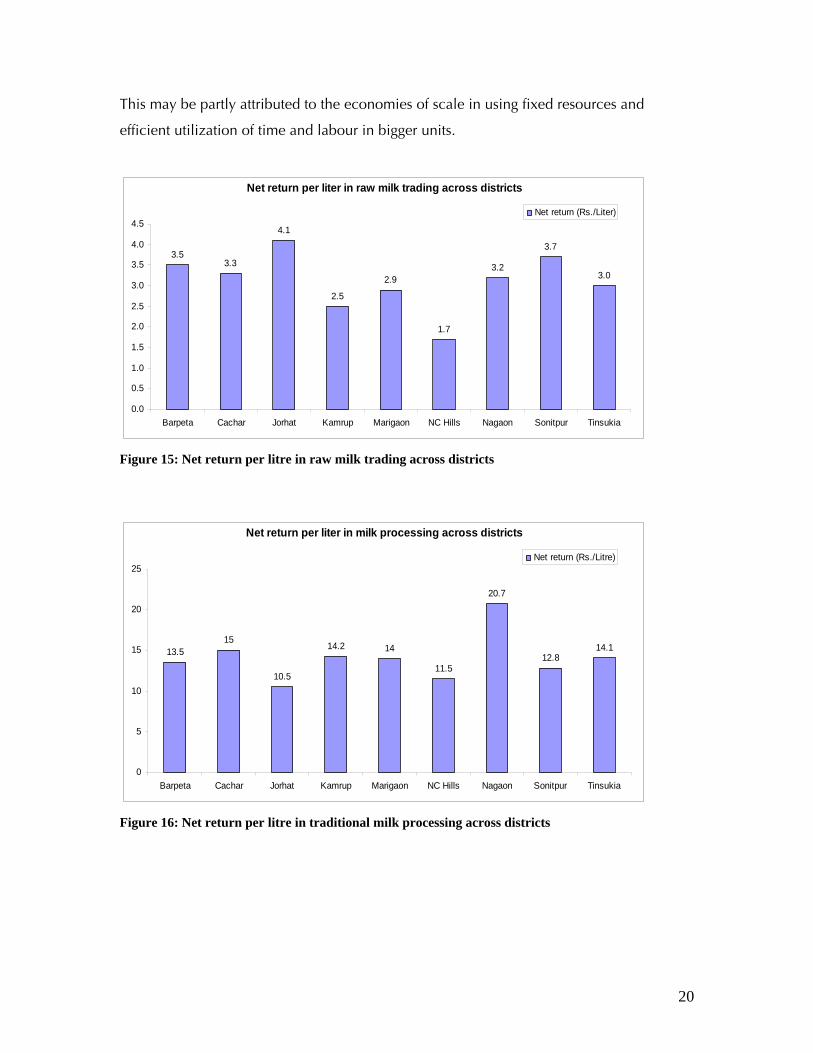
This may be partly attributed to the economies of scale in using fixed resources and
efficient utilization of time and labour in bigger units.
Net return per liter in raw milk trading across districts
3.53.3
4.1
2.5
2.9
1.7
3.2
3.7
3.0
0.0
0.5
1.0
1.5
2.0
2.5
3.0
3.5
4.0
4.5
Barpeta Cachar Jorhat Kamrup Marigaon NC Hills Nagaon Sonitpur Tinsukia
Net return (Rs./Liter)
Figure 15: Net return per litre in raw milk trading across districts
Net return per liter in milk processing across districts
13.515
10.5
14.2 14
11.5
20.7
12.814.1
0
5
10
15
20
25
Barpeta Cachar Jorhat Kamrup Marigaon NC Hills Nagaon Sonitpur Tinsukia
Net return (Rs./Litre)
Figure 16: Net return per litre in traditional milk processing across districts

21
Net return per litre of milk
3.3
14.8
0
2
4
6
8
10
12
14
16
Raw milk trade Milk product processing
Figure 17: Average net return per litre of milk in raw milk trade and milk product processing
The formal dairy processing units have not made a significant impact on the marketing of
milk and milk products, despite several attempts by the state government. The
dependence of consumers on the informal sector is likely to continue for the foreseeable
future because of several factors such as tastes/preferences, costs and prices. However, the
consumer awareness regarding milk quality and safety is increasing. Therefore, quality
assurance measures through branding/labelling, licensing, regulation and monitoring need
to be considered to link these traditional milk market agents with their formal market
counterparts. Such an approach would enhance the credibility of the milk market agents
by assuring the quality of milk and milk products and also dispel the generally perceived
notion that they are exploiters of the dairy farmers and bad business practitioners.
Marketing through the formal milk sector
Since 1963, eight dairy processing plants have been established in different parts of Assam
with a total installed capacity of 109,000 litres of milk per day. Of these processing plants,
seven are functional, though not to full capacity. Two more plants with a combined
installed capacity of 55,000 litres per day are currently under construction. Additionally,
15 chilling plants with total installed capacity of over 30,000 litres per day have been
established but nearly all of them are presently non-functional. Three more are under
construction.
Among the functional processing plants, capacity utilization varies from four to 34% and
there is a long-term decline in overall capacity utilization. Moreover, there are significant
22
losses due to handling and curdling (2–8%) and losses of fat and solids-not-fat (SNF).
Market returns of packaged products range from 10-27%. All these lead to high costs per
unit output, low labour productivity and large overall losses that are subsidized by the
government. Reasons for this poor performance include low and inflexible procurement
price, lack of adequate collection points and facilities, delayed payments to suppliers
leading to inadequate supplies of raw materials, lack of a strategy for procurement and
marketing, inappropriate location of plants, establishment of plants without proper
economic analysis, poor skills and human resource capacity, lack of product innovation
and diversification, and administrative rigidities in running the system.
Any plan to continue operation of these plants or establish new plants under any kind of
reorganized ownership and management (private, public-private partnership or
cooperative) needs to address these issues. The plan should also (a) take stock of the
demand for products that has emerged from this study (types of products, volumes,
locations, price and income elasticity of products being offered, local vs. imported
products), (b) take stock of the key supply areas identified in this study and their proximity
to demand areas, (c) consider alternative low-cost and reliable institutional and
infrastructure arrangements for collection, (d) consider economic feasibility analysis
(private profitability over time, pay back period, subsidy requirements, alternative sources
of investment capital), (e) encompass a business and management plan to run the entire
system not just the plants, and (f) focus on maintaining high and reliable quality of
products delivered to consumers.
The unreliable quality of locally processed, pasteurized milk may be one of the key
barriers to development of the formal dairy industry in Assam. The existing plants may be
ranked on the basis of such analysis and those found unviable may be considered as sunk
cost and shut down altogether. Alternatively, they may be relocated to more suitable
locations if feasible, or new ones if appropriate.
Implications of the study highlights
The market study highlights point to the following implications that are directly relevant to
the action plan:

23
• The study has confirmed the predominance of traditional market agents in Assam.
They form the key link between local milk producers and consumers and focus
nearly exclusively on local milk products. Any dairy development plan to address
the needs of the producers, market agents and consumers should fully address the
traditional sector, particularly if the aim is to increase the share of demand that is
supplied by local production as opposed to imports from other states and regions.
• Most traditional traders operate on a small scale (handling less than 60 litres per
day), have been in business for an average of 12 years and rely solely on their dairy
market activities for income. This implies important small-scale employment
opportunities along the dairy value chain, again indicating that dairy development
activities can be highly pro-poor if they focus on small-scale traditional agents.
• Very few traditional milk market agents have received any type of training; poor
hygiene and milk adulteration are commonly encountered in the informal milk
market. Training of milk market agents in proper hygiene, milk quality and best
business practices should be an essential part of a dairy development plan, to be
linked with a branding system that would be easily recognized by the consumers.
• Average returns to labour in raw milk trading are 3.3 Rs. per litre of raw milk and
14 Rs. per litre of milk in traditional processing (sweets, channa, etc.). This implies
strong value addition in traditional processing. However, there are barriers to entry
into the local traditional processing business due to low education and poor access
to credit. Access to formal micro- or small-scale credit may alleviate this problem.
24
Highlights of milk quality analysis
A cross-sectional survey covered six administrative areas (wards) in Guwahati and three
types of milk vendor (shops, distribution point and traders). The third type of milk vendor
was represented by milk obtained from a household that just purchased from a trader. A
total of 345 samples were analyzed; 202 in Guwahati and 143 in Jorhat. Importantly and
unusually for such type of analysis, this study used a sampling frame and a stratified,
randomized design. Hence, the results can be confidently generalized to the population of
interest (Guwahati and Jorhat).
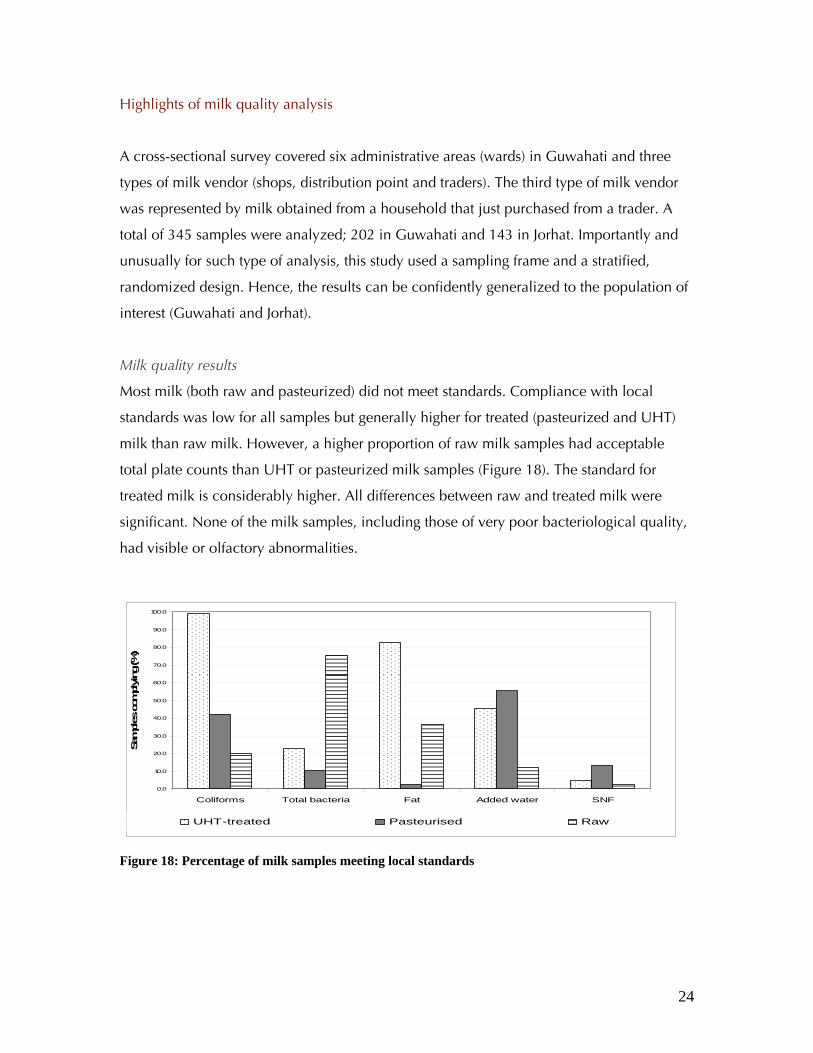
Milk quality results
Most milk (both raw and pasteurized) did not meet standards. Compliance with local
standards was low for all samples but generally higher for treated (pasteurized and UHT)
milk than raw milk. However, a higher proportion of raw milk samples had acceptable
total plate counts than UHT or pasteurized milk samples (Figure 18). The standard for
treated milk is considerably higher. All differences between raw and treated milk were
significant. None of the milk samples, including those of very poor bacteriological quality,
had visible or olfactory abnormalities.
Figure 18: Percentage of milk samples meeting local standards
0.0
10.0
20.0
30.0
40.0
50.0
60.0
70.0
80.0
90.0
100.0
Coliforms Total bacteria Fat Added water SNF
Sam
ples
com
plying
(%)
UHT-treated Pasteurised Raw

25
Results presented in Table 1 show that raw milk had substantially more added water while
UHT milk had higher bacteriological quality (because of the method of processing) and
higher fat (presumably because it originates from states with a higher proportion of dairy
buffaloes). Milk from Jorhat tended to be of higher quality than milk from Guwahati, but
only the differences in fat and total bacteria were significant.
Table 1: Median physical and bacteriological quality parameters for raw and pasteurized milk Type Fat (%) SNF (%) Added
water (%)
Total bacteria
(log)
Total coliforms
(log)
UHT milk 3.6 7.9 6.0 3.5 0.0
Pasteurized 3.0 8.0 4.0 5.5 3.5
Raw 3.1 6.6 20.5 6.1 4.1
Associations between quality and sales point • There was significantly more added water, less SNF and higher total plate count (TPC) in
milk delivered by vendors to consumers (hawked milk) compared to milk bought at
distribution points. This indicates adulteration by hawkers.
• Milk sold from an insulated van was sold at a premium price compared to milk from the
same dairy sold from a pickup: presumably customers had more confidence in its
quality. Surprisingly, it was actually of poorer bacteriological quality (Table 2),
indicating a perception-reality gap.
• Milk from local dairies (n=30) contained significantly less fat and significantly higher
levels of total bacteria and coliforms than milk from dairies outside Assam (n=134); other
differences were not significant.
• However, if we consider only those dairies that produce pasteurized milk, then milk
from local dairies had substantially better bacteriological quality than the pasteurized
milk from the dairy outside Assam (a mean of 1.1 million bacteria and 47,000 coliforms
per ml, versus 16.2 million bacteria and 805,000 coliforms per ml).
• Among local dairies, there was considerable variation in adulteration with water (from 2
to 20%). Bacteriological quality was high in one of the four dairies producing
pasteurized milk. In the other three it was moderate to poor and not substantially
different from the dairies producing packed but unpasteurized milk.

26
Table 2: Comparing quality of milk sold from an insulated van and an open vehicle at the same dairy Total bacteria Total coliforms Added water
Insulated van 2,494,00 5300 14.5%
Pickup 159,000 3,540 14.1%
Exploring the causes of poor quality • There was a strong statistical association between added water and SNF indicating that
adulteration with water rather than powdered milk or sugar/salt solutions (Figure 19).
• In terms of correlation between total bacteria and coliforms, two broad groupings are
discernible: samples with good correlation and those with no correlation. This suggests
distinct populations (one in which faecal contamination and poor hygiene/storage are
related and another in which they are independent problems), and hence different
strategies needed to address the problem.
• The weak association between added water and bacterial counts suggests that
adulteration with water is not a major factor in poor bacteriological quality. The similar
pattern for the association of added water with both total bacteria and coliforms suggests
added water is not contaminated by sewage (coliforms are more strongly associated with
faecal contamination than is total bacteria count).
Figure 19: Associations between quality aspects in raw and pasteurized milk
SNF
Addedwater
Coliformslog
Totalbacteria
log
4
6
8
10
4 6 8 10
0
50
0 50
0
5
10
0 5 100
5
10
0 5 10
27
Summary of key findings on milk quality analysis
• All raw, pasteurized and UHT milk samples were unsatisfactory, according to the
relevant standards for composition and bacteriological quality.
• Organoleptic properties of milk (clots, colour and smell) were not a good indicator of
quality.
• Perceptions that certain products are of higher quality may not be correct.
• There is wide variation in the quality of pasteurized milk from different dairies.

28
Raw milk pathways in Guwahati and Jorhat, Assam
Introduction
We constructed “farm to fork” pathways for the flow of milk from cow to consumer (Figure
20).This allows a better understanding of where risk from milk hazards originates and how
it is amplified or mitigated, as well as identification of critical control points (steps at which
action can be taken to prevent or eliminate a food safety hazard or to reduce it to an
acceptable level).1
Figure 20: Example of a milk pathway
Pathway structure
Most pathways are short and the predominant model was found to be farmer-vendor-
consumer. The private informal, traditional sector models predominate, but two other
chains were included in the analysis: dairy co-operatives and “Gosala” (a system in which
several hundred cows are housed together and the milk sold directly to consumers without
an intermediary). As was demonstrated in the market analysis, there is a high level of 1 Pathway analysis is also the basis of a risk analysis or quantitative estimate (with range of uncertainty) of the likelihood and type of harm to human health caused by drinking raw milk, which will be presented in the final project report.
29
diversity. Farmers may market their own or other farmers’ milk to a combination of traders,
vendors, co-operatives or direct to households. They may also sell milk indirectly via a
hired intermediary or consume own-farm milk. Traders may sell to other traders, hotels,
sweetshops or households as well as consume their own purchased milk.
Quality of milk at point of consumption
• All raw milk was of acceptable overall bacteriological quality (total plate counts) at the
point of consumption. The majority of samples (75%) were of good or excellent quality.
• Coliform quality was not good: only half the samples were of acceptable quality in this
regard.
• Nearly all milk had some additional water at the point of consumption and in more than
half the chains, the amount was sufficiently high to indicate deliberate addition (>10%).
• The only two path structures without water adulteration were the “Gosala” and the milk
co-operative model. The incentives they use to prevent adulteration may be transferable.
Good and bad practices along the raw milk path
A checklist of 30 simple and important farm hygiene practices was administered. Only one
farm performed acceptably. Some of the most problematic practices were:
• Using the same container for milk fit and unfit for human consumption: 92% of farms
• Dirty milk storage area: 83% of farms
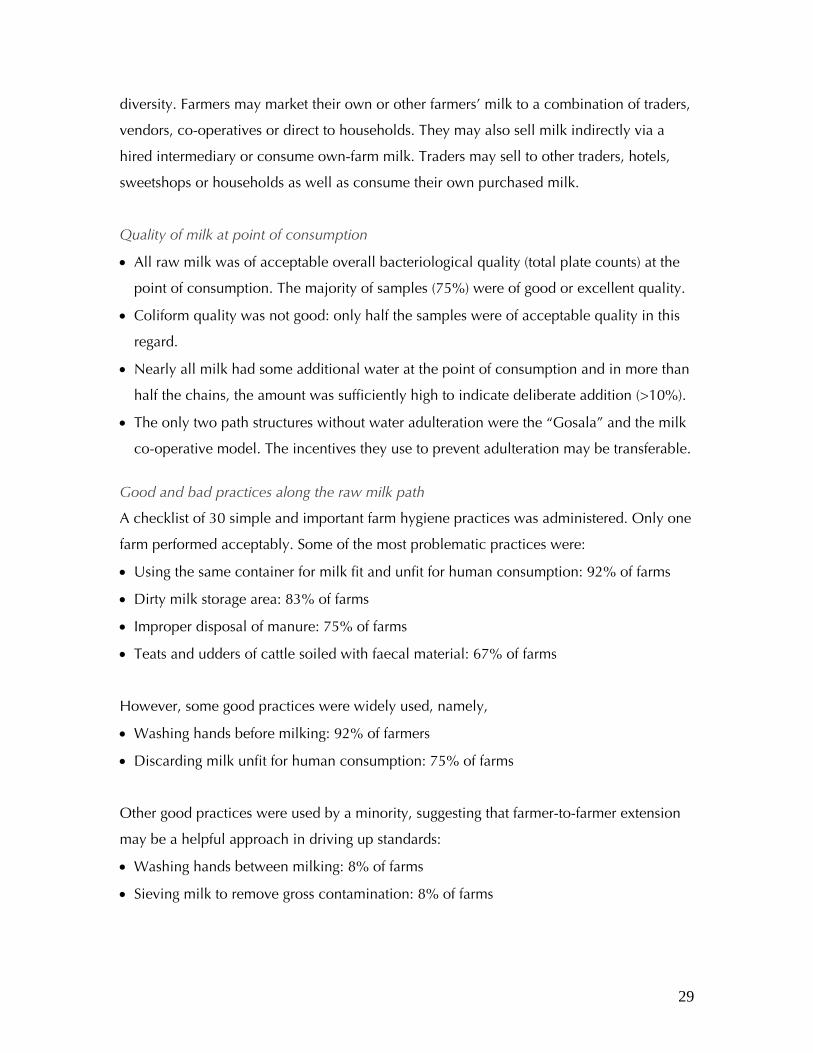
• Improper disposal of manure: 75% of farms
• Teats and udders of cattle soiled with faecal material: 67% of farms
However, some good practices were widely used, namely,
• Washing hands before milking: 92% of farmers
• Discarding milk unfit for human consumption: 75% of farms
Other good practices were used by a minority, suggesting that farmer-to-farmer extension
may be a helpful approach in driving up standards:
• Washing hands between milking: 8% of farms
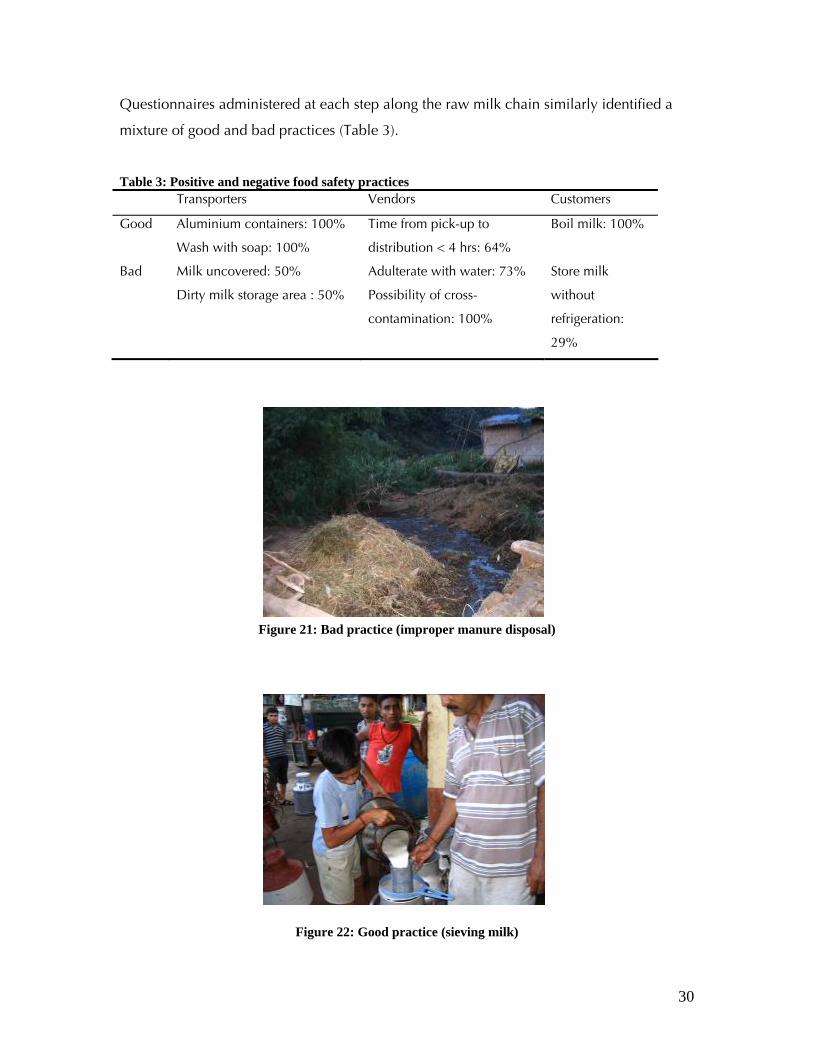
• Sieving milk to remove gross contamination: 8% of farms
30
Questionnaires administered at each step along the raw milk chain similarly identified a
mixture of good and bad practices (Table 3).
Table 3: Positive and negative food safety practices Transporters Vendors Customers
Good Aluminium containers: 100%
Wash with soap: 100%
Time from pick-up to
distribution < 4 hrs: 64%
Boil milk: 100%
Bad Milk uncovered: 50%
Dirty milk storage area : 50%
Adulterate with water: 73%
Possibility of cross-
contamination: 100%
Store milk
without
refrigeration:
29%
Figure 21: Bad practice (improper manure disposal)
Figure 22: Good practice (sieving milk)

31
The worst offenders
The milk pathways analysis showed that consumer concerns about food safety, raised by
other actors in the milk pathways, seem justified. Consumers scored higher than all other
actors on milk-handling hygiene (Figure 23). The scores were based on 12 indicators.
However, even consumers need to improve their practices: the ideal safe-handling score is
100% while the average consumer score was 57%.
Figure 23: Mean hygiene scores of different actors (n=75)
COLIFORM COUNTS (samples)
Low High
Low 13 9
TPC
(sam
ples
)
High 1 10
Figure 24: Samples with coliform quality problems fall into two categories
Critical control points for the raw milk pathway
In the case of coliform quality, the main risk amplification step was between the last
vendor and the consumer. This may be a critical control point that requires attention.
When comparing coliforms and total bacteria counts, two patterns are seen: (a) coliforms
35 40 45 50 55 60
Farmer
Trader
Co-op
Transporter
Consumer
Milk-handling hygiene (%)

32
with low TPC and (b) high coliforms with high TPC (this was also seen in the cross-
sectional survey). This suggests two different types of problems, firstly a problem with post-
farm contamination (66% of cases) and secondly excessive storage and/or gross
contamination (30% of cases).
Again, the main point of water adulteration was the step immediately preceding the
consumer. Nearly half (46%) of farmers and intermediaries reported adding water to milk,
suggesting it is a socially acceptable practice. More investigation is needed of the
motivations for, and risks of, water adulteration.
Milk sweet pathway
The process of sweet-making was analyzed in ten shops, five each in Guwahati and Jorhat.
A flow chart was constructed of the movement of milk from entry into the shop to finished
product. Raw milk and sweets were sampled at the start of display, half way through
display and at the end, and checked for total bacteria, coliforms and Listeria
monocytogenes, an emerging and important pathogen often associated with dairy
products.
Change in bacterial quality along the milk sweet pathway
One-third of sweet samples met national quality standards and half – though sub-standard
– were of reasonable quality2. The remaining 13% were poor. L. monocytogenes was not
found in any samples. In all cases, bacteria count declined as a result of processing and
then increased again with storage time (Figure 25) indicating that storage is a critical
control point (CCP) for milk sweets. Samples from Jorhat were of significantly higher
quality than Guwahati (67% meeting standards versus 0%; p<0.000 Chi 2).
2 Both in absolute terms and compared to other surveys of milk sweets in India

33
Figure 25: Change in bacterial counts of milk sweets during processing and storage
Influence of food-handler practice on quality of sweets
An extensive basic hygiene check list was also carried out among sweet shops. The
average score was 37% indicating considerable need for improvement. Shops which
produced sweets of good or moderate quality had a median score of 42% while those
producing sweets of poor quality scored 20%; the difference was highly significant, despite
the small sample size (10 shops), indicating a powerful influence of hygienic practice on
safety of milk sweets.
Comparing shops with good food safety outcomes and those with poor results showed
greatest difference in the areas of selling area hygiene, ingredient storage, cold storage and
cleaning regime, suggesting efforts to improve sweet safety should focus on these CCPs
(Figure 26).
0
20000
40000
60000
80000
100000
120000
140000
160000
Raw Milk Fresh sweet Stored sweet Longest-keptsweet
Bac
terio
logi
cal c
ount
/gra
m

34
Figure 26: Differences in hygiene practices between shops producing safe and unsafe sweets
Summary of key findings on raw milk pathways
• Short pathways predominate for raw milk, reducing risk to the consumer.
• At the point of consumption, all raw milk was of acceptable overall bacteriological
quality.
• Most raw milk samples were adulterated with water and only half of the samples had
acceptable coliform counts.
• Hygienic milk handling was highest among consumers, intermediate among traders and
vendors and lowest at farm level.
• Quality of milk sweets was generally good to moderate; Listeria monocytogenes, a major
milk-borne pathogen, is not a problem in milk sweets.
• Transforming raw milk to sweets is strongly risk mitigating: the end product (sweets) is
safer than the initial (raw milk).
• Despite the reduction in bacteria associated with processing, only one-third of sweets
sampled met national quality standards.
• Good hygienic practice is a powerful predictor of higher milk–sweet safety.
• A preliminary investigation of good and bad practices and critical control points (CCPs)
in dairy hygiene, raw milk handling and sweet-making can form the basis of
interventions to improve quality and safety of raw milk and milk sweets.
-1
0
1
2
3
4
5
6
7
Waste Disposal Utensils Cleaningregime
Cold storage Personalhygiene
Ingredientstorage
Preparation Selling areahygiene
Hyg
iene
sco
re
Poor quality sweeetsGood or moderate quality sweets

35
Ability of consumers to judge milk quality
We evaluated one important aspect of milk quality: adulteration. Panel tests were carried
out in Jorhat and Guwahati, in which consumers (n=150) blindly assessed milk adulterated
with water, sugar solution and reconstituted milk powder at different levels (5%, 10%,
20% and 30%).
Consumers were unable to detect adulteration
Overall, consumers’ ability to detect adulteration was not significantly different from
chance, i.e. consumers were unable to detect adulterated milk. Receiver operating
characteristic curve (ROC)3 analysis, showed an area under the curve (AUC) of 0.52 (95%
CI, 0.49-0.54) which was not significantly different from random chance.
Consumers’ ability to detect substantial adulteration (milk comprising 20% and 30%
adulterant) was slightly better than random chance but still very poor. Although not
significantly different from chance, consumers tended to be best at detecting adulteration
with water, followed by sugar solution and powdered milk. However, these differences
were not statistically significant. In the case of substantially adulterated milk, consumers
had no ability to detect adulteration with re-constituted milk, extremely poor ability to
detect adulteration with sugar solution and very poor ability to detect adulteration with
water. The difference in ability to detect adulterants was significant.
Consumers were poor judges of their own ability to detect adulteration
Most consumers considered they were average (55%) or good (34%) judges of milk. Only
4% considered themselves excellent and 7% poor judges. Those who considered
themselves good or excellent judges consumed significantly more milk than (2.4 versus 1.7
litres, respectively). However, there was no significant association between participants’
estimation of their ability to detect adulteration milk and their actual ability to do so
(p=0.785, chi square). Figure 28 shows that most consumers in each self-assigned
category were no better than random chance in their ability to detect adulterated milk.
3 Receiver operating characteristic curves are a standard way of evaluating diagnostic ability, which incorporates sensitivity (proportion of true positives) and specificity (proportion of true negatives). An AUC of 0.5 implies the test has no discriminatory power, while (by convention), an AUC of 0.6-0.7 is considered poor, 0.7-0.8 acceptable/fair, 0.8-0.9 excellent/good and >0.9 outstanding.

36
Figure 27: Ability of consumers to judge adulterated milk
Figure 28: Consumers’ actual ability to judge milk compared with self assessments
0 10 20 30 40 50 60 70 80 90 100
Poor
Average
Good
Excellent
Self-
asse
ssm
ent o
f jud
gem
ent
abili
ty
Actual judgement ability (% respondents)
No better than chance Worse than chance Better than chance
0.00
0.25
0.50
0.75
1.00
Sen
sitiv
ity
0.00 0.25 0.50 0.75 1.001 - Specificity
Area under ROC curve = 0.5178
Perfect test
Consumer judgement
Completely useless test

37
Factors associated with ability to detect adulteration
There was a small positive correlation between consumption of milk and ability to detect
adulteration (0.13).
• Consumers in the age category 41-50 were significantly better at detecting adulteration4.
• Differences between test sites, social category and sexes were all small and non-
significant.
Why consumers are such poor judges of adulteration and what this implies
Marketed milk has high levels of adulteration – the sample analysis showed that local raw
milk contains on average 20% water, with some samples as much as 53%.
• Consumers rarely drink raw milk (since they generally boil it first) and hence are not
used to judging its organoleptic characteristics.
• The divergence between consumers’ real and perceived ability to judge milk quality has
adverse consequences:
o Health risk: consumers expose themselves to risk because they are unable
to judge quality.
o Lemons market: superior products are unable to signal their higher quality
and increase market share.
o False signalling: consumers may prefer products which they associate with
higher quality (packaged milk, milk from an insulated van) although these
may be of no better or even worse quality than raw milk.
Summary of key findings on consumer quality perception
• Consumers are very poor judges of milk adulteration.
• Consumers over-estimate their ability to detect adulteration.
• Consumers have little insight into their own ability to detect adulteration.
Key action-oriented implications of the milk quality study
• Consumer concerns over the quality of milk and milk sweets are justified. The majority
of samples do not meet bacteriological standards implying a potential risk to human
4 Given this was a fishing expedition (there was no a priori hypothesis concerning age and judgement ability and multiple comparisons were made), the finding may be spurious.
38
health, unless consumers further process the milk before consumption. However, this
study looked at general bacteriological quality rather than specific pathogens.
o Action 1: Further studies are needed to identify and quantify specific risks to
human health and hence better target interventions. This can be done through
risk assessment adapted to the context of developing countries, i.e.
“participatory risk assessment”.
o Action 2: There is already enough evidence to warrant interventions to improve
milk quality. These should address both the raw and pasteurized milk sectors.
In particular, UHT milk (produced elsewhere in India) is generally of much
higher quality than local pasteurized milk. Development of demand for
locally-processed milk will depend heavily on the quality of local formal
processing.
• The high level of coliform bacteria in both pasteurized and raw milk as well as milk
sweets is worrying. Coliform bacteria are found only in the intestines of man and
animals and their presence indicates faecal contamination. Not only can some
coliforms cause serious and sometimes fatal disease, their presence is an indicator of
the many human and zoonotic pathogens spread via the faecal-oral route (bacteria,
viruses, intestinal parasites etc.).
o Action: Further bacteriological testing is needed to identify the origin of
coliforms (human or animal) and identify critical control points for coliforms.
• Pathway analysis suggested that problems of raw milk quality could be attributed to
two main causes: poor hygiene along the chain and delays between production and
consumption.
o Action: Interventions and training packages should address both hygiene and
distribution systems.
• Adulteration with milk is widespread and appears to be the standard among some
actors. Some pathways are free of adulteration, but not the predominant private sector
model. However, adulteration with water does not seem to represent a major health
risk in terms of adding bacteria.

39
• Consumers are very poor judges of adulteration and have unfounded confidence in
their ability to judge milk quality, creating a market failure in the provision of pure
milk. The same applies to bacteriological quality, which was often poor, but
indiscernible to consumers. Customer willingness to pay for quality is obviously
contingent on ability to detect quality. Some systems seem to be better at self-
regulation (e.g. co-operative and “Gosala” model) but not the traditional private sector
model that predominates.
o Action 1: Consumers need to be better informed about the quality problems of
milk, both raw and pasteurized, and their own lack of ability to assess these.
o Action 2: Simple tests for quality and institutional mechanisms for their
adoption need to be developed and disseminated.
• Manufacture of milk sweets can be an effective way of reducing the risk associated
with poor quality raw milk, but only if sweet-shop hygiene is adequate. Quality of milk
sweets correlates strongly with hygienic practices. However, this study was small (10
shops) and non-random and looked at only one type of sweet.
o Action: The study has identified the specific practices that lead to higher quality
in milk sweets. The check lists developed for this study are a tool for improving
quality and monitoring change. These should be incorporated into training
programs specifically aimed at traditional processors and sweetshop keepers.

40
Highlights of milk production systems in Assam
This section describes the key findings of a comprehensive survey of rural production
systems across the eight AACP districts and the North Cachar Hills. The study comprised a
random survey of 3,006 rural households in these locations and thus portrays a
representative picture of agricultural and livestock systems and their associated livelihoods.
Of the households surveyed, 1,910 (64%) kept cattle, 126 (4%) buffalo and 65 (3.4 %)
cross-bred cattle. In Assam, cattle are an integral part of the livelihoods of most rural
households. There is an emerging dairy industry based on milk produced by low-yielding
local (desi) cattle and increasingly by high-yielding dairy cross-breds, which are currently
managed by only a few cattle-keeping households. In response to the increasing demand
for milk in Assam, expanding the dairy cross-bred herd, improving the productivity of local
dairy cows and putting in place good access to input and output markets are the major
challenges for sustainable pro-poor dairy development in the state.
Overview of dairy production systems
The majority of agricultural households in the surveyed districts kept cattle. About 82 % of
agricultural households in Assam kept cattle (79%) or buffalo (5%) mainly in Cachar and
North Cachar Hills districts. Cattle are used traditionally as draught power and this
explains the importance of the species in the rural communities, with milk production
being supplementary to the provision of draught power. Mixed farming (crops and
livestock) is the main form of livelihood in rural Assam. Figure 29 shows the average herd
size (in tropical livestock units) by district. Herd sizes are larger in North Cachar Hills,
although results for this district should be taken with caution due to the small sample size.

41
0
2
4
6
8
10
12
Barpeta
Cachar
Jorha
t
Kamrup
Marigao
n
NCHills
Nagaon
Sonitp
ur
Tinsuk
ia
Figure 29: Average herd size (cattle and buffalo) in tropical livestock units (1 local cow=0.7), by
district
Milk productivity and production are low
Milk production is low with an average of one litre per day of lactation for local breeds
(nondescript cattle), 1.6 litres for buffalo and 3.6 litres for dairy cross-bred cattle. Among
the surveyed districts, the average yield per day for local breed cows ranged from 0.8 litres
per lactation day in Jorhat district to 1.4 litres in both Barpeta and North Cachar Hills.
0
0.25
0.5
0.75
1
1.25
1.5
Barpeta
Cachar
Jorha
t
Kamrup
Marigao
n
NCHills
Nagaon
Sonitp
ur
Tinsuk
ia
Figure 30: Average milk production (kg per day) for local breed cows, by district
Not only is milk productivity per cow low, but about one quarter of cattle/buffalo owners
did not keep any cows. In fact, on average, only one animal in three is a cow. The
percentage of cows in total herd (cattle/buffalo TLU) was slightly higher in Cachar and
Kamrup districts (40%).

42
05
1015202530354045
Barpeta
Cachar
Jorha
t
Kamrup
Marigao
n
NCHills
Nagaon
Sonitp
ur
Tinsuk
ia
Figure 31: Percentage of cows in the herd, by district
Household average milk production is therefore low, given the low milk yields and the
limited number of milking animals kept on farm. On average, households with cattle and
buffalo produce 1.9 litres of milk per day. There are important differences between areas,
as Figure 32 shows, with relatively high levels near the capital city Guwahati and in the
southern parts of the state, i.e. milk clusters with good market access to inputs and for milk
marketing is the way forward.

43
Figure 32: Average household milk production (kg/day/household)
Source: NSSO, Government of India
Figure 33: Percentage change in milk production between 1996 and 2006

44
Despite low milk production, according to government figures, milk production has
increased significantly in percentage terms in some districts of Assam, although from a very
low base (Figure 33). In several districts, including Kamrup, growth in milk production
between 1996 and 2006 exceeded 30%. While this points to some progress as a result of
government interventions to stimulate milk production, it still only represents an annual
growth rate of 3.4% annually, and only in selected districts. In other districts, such as
Jorhat, there has been no apparent growth at all in that 10-year period. Even in Barpeta, a
focus area for public investment in dairy development, there has been only minimal
growth, less than 3% over the period.
The key route to achieving high milk production is through crossbreeding. Currently, only
about 3.4% of the surveyed cattle owners keep cross-bred cattle, and are located in
specific areas as seen in Figure 34. However, even among these cross-bred herds, the
average number of cows is only about 1.6. Total milk production per day on these farms is
about 7.8 litres (inclusive of milk from local cows), in comparison with an average of 1.7
for households with only local cattle. The average milk productivity of cross-bred cows is
3.5 litres per lactation day (median =3 litres). Further, it is interesting to note that the top
10% producers have daily milk production above 6.5 litres, which is more than six times
the daily production of local breed cows. This significantly higher level of production in
some cases shows that there is potential to substantially increase milk production in Assam
through cross-breeding.

45
Figure 34: Percentage of farmers keeping cross-bred cattle
One way to better understand the low rate of adoption of cross-bred cows is to compare
households who currently have cross-bred cattle with those who do not. Households with
cross-bred cattle are older, which may indicate that experience is needed. As expected
with a technology that requires some level of expertise, those with cross-bred cattle are
slightly more educated; they also have more family members, suggesting that labour
availability may be a constraint to the uptake of grade cattle. Also, adopters have better
market access (in terms of being closer to urban centres), but distance to the nearest dairy
cooperative society does not differ significantly between the two groups of farmers. Less
than one percent of the surveyed farmers were member of a dairy cooperative, although
farmers can deliver milk to cooperatives, even if they are not members. This result shows
that good market access is a key factor for farmers to increase milk production, but it also
shows that cooperatives do not create enough incentives to do so. This partly explains the
fact that most of the milk does not go through the organized (formal) sector.
Farmers with cross-bred animals had larger land size and a higher percentage lived in
permanent houses (68% versus 35%). At this stage, it is not possible to conclude whether
farmers who succeeded in acquiring cross-bred animals were able to increase their living
conditions through sale of milk; or whether those who are better off are also those able to
start cross-bred dairying.
46
Feeding systems
Most farmers practised extensive grazing as the majority of the farmers either only or
mainly grazed cattle. This was particularly the case for local breed cattle where only about
23% of the farmers mainly or only stall-fed their cattle during the rainy season and only
7% did so during the dry season (Figure 35). A higher percentage of farmers stall-feed cross
breed cattle: 64% during the dry season and 43% during the rainy season (Figure 36).
Types of feeding systems are good indicators of dairy intensification: in fact, farmers who
either mainly or only stall-feed cattle market a higher percentage of their milk (for example
52% for households who stall feed local breed cattle during the rainy season versus 22%
for those who practise grazing). Moreover, farmers who stall feed cross-bred cows during
the rainy season have higher household milk production (12.8 litres) than those who graze
(2.8) and they market a significantly higher percentage of their milk (59% versus 25%).
This suggests that an increase in milk production can be achieved by providing farmers
with the appropriate set of technologies, particularly those related to intensification of
feeding systems.
The predominance of grazing suggests that currently there is still available land for pasture,
giving farmers a variety of options for feeding strategies to suit their resource availability,
particularly labour. While the results suggest that grass is often available, farmers report
that there is a trend of decreasing availability of quality green grass, a primary fodder, and
are substituting straw, which in itself is increasing in price. While grazing and collection of
grass remains an important feed resource for many producers, intensification through
greater use of specialized fodder production will be necessary for market-oriented
producers. Also, only about half of the households regularly fed their cows on
concentrates. This may explain the low level of milk production per cow. All cross-bred
cattle keepers fed concentrates, while slightly less than half of farmers with local breed
cattle fed concentrates.)
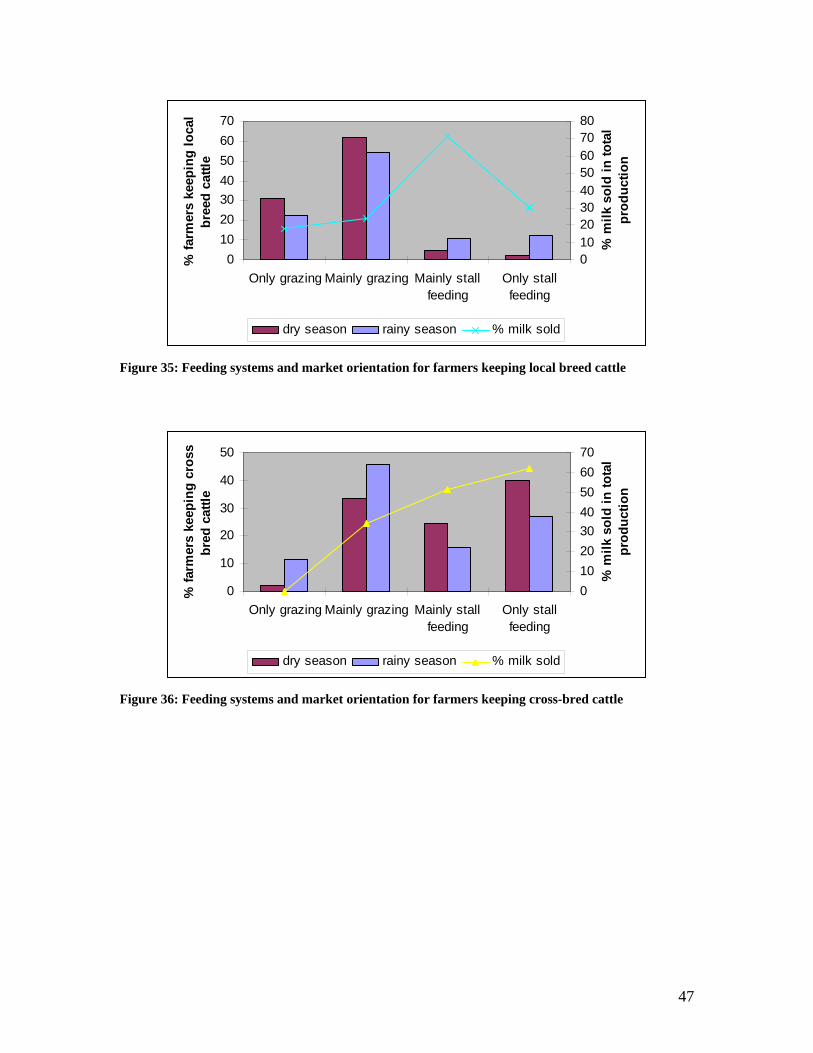
47
010203040506070
Only grazing Mainly grazing Mainly stallfeeding
Only stallfeeding
% fa
rmer
s ke
epin
g lo
cal
bree
d ca
ttle
01020304050607080
% m
ilk s
old
in to
tal
prod
uctio
n
dry season rainy season % milk sold
Figure 35: Feeding systems and market orientation for farmers keeping local breed cattle
0
10
20
30
40
50
Only grazing Mainly grazing Mainly stallfeeding
Only stallfeeding
% fa
rmer
s ke
epin
g cr
oss
bred
cat
tle
010203040506070
% m
ilk s
old
in to
tal
prod
uctio
n
dry season rainy season % milk sold
Figure 36: Feeding systems and market orientation for farmers keeping cross-bred cattle
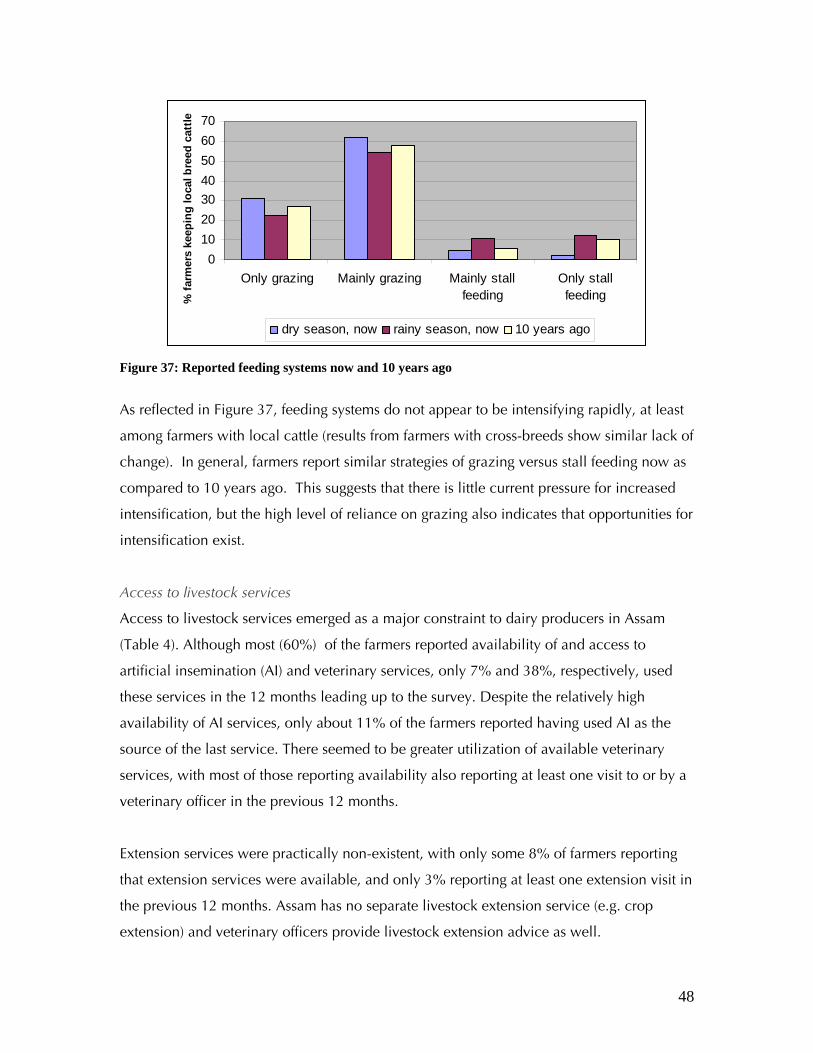
48
010203040506070
Only grazing Mainly grazing Mainly stallfeeding
Only stallfeeding%
farm
ers
keep
ing
loca
l bre
ed c
attle
dry season, now rainy season, now 10 years ago
Figure 37: Reported feeding systems now and 10 years ago
As reflected in Figure 37, feeding systems do not appear to be intensifying rapidly, at least
among farmers with local cattle (results from farmers with cross-breeds show similar lack of
change). In general, farmers report similar strategies of grazing versus stall feeding now as
compared to 10 years ago. This suggests that there is little current pressure for increased
intensification, but the high level of reliance on grazing also indicates that opportunities for
intensification exist.
Access to livestock services
Access to livestock services emerged as a major constraint to dairy producers in Assam
(Table 4). Although most (60%) of the farmers reported availability of and access to
artificial insemination (AI) and veterinary services, only 7% and 38%, respectively, used
these services in the 12 months leading up to the survey. Despite the relatively high
availability of AI services, only about 11% of the farmers reported having used AI as the
source of the last service. There seemed to be greater utilization of available veterinary
services, with most of those reporting availability also reporting at least one visit to or by a
veterinary officer in the previous 12 months.
Extension services were practically non-existent, with only some 8% of farmers reporting
that extension services were available, and only 3% reporting at least one extension visit in
the previous 12 months. Assam has no separate livestock extension service (e.g. crop
extension) and veterinary officers provide livestock extension advice as well.

49
Table 4: Access to livestock services Type of livestock
service
% farmers reporting
access to services
% farmers with at
least one visit in the
previous 12 months
Average no. of
visits for those
with at least one
visit
Artificial insemination 61 7 2.3
Extension 8 3 1.5
Veterinary 61 38 2.5
010203040506070
Barpeta
Cachar
Jorha
t
Kamrup
Marigao
n
NCHills
Nagaon
Sonitp
ur
Tinsuk
ia
% fa
rmer
s
% with at least 1 visit to veterinary services% with at least 1 visit to AI services% with at least 1 visit to extension services
Figure 38: Percentages of farmers with at least one visit to different services in the previous 12
months, by district
Access to livestock services varied considerably across the districts surveyed. AI services
were more frequently accessed in Jorhat, Kamrup, Marigaon and Tinsukia. Within the latter
case nearly 20% of livestock farmers reported at least one visit to AI in the past 12 months.
This suggests that under some local circumstances, utilization of AI can be promoted
successfully. More generally, however, farmers reported that there was inadequate supply
of semen straws, especially for the higher potential stall fed system of dairy production.
Moreover the quality of semen provided by the State Veterinary and Animal Husbandry
Department was perceived to be of inferior quality, with high incidence of “repeat
breeding” and inferior quality calves born, at least as perceived by farmers. Particularly in
the stall-fed setting, producers had to buy quality semen at a higher price from private
agents which are inaccessible to most producers. Further, government AI providers supply
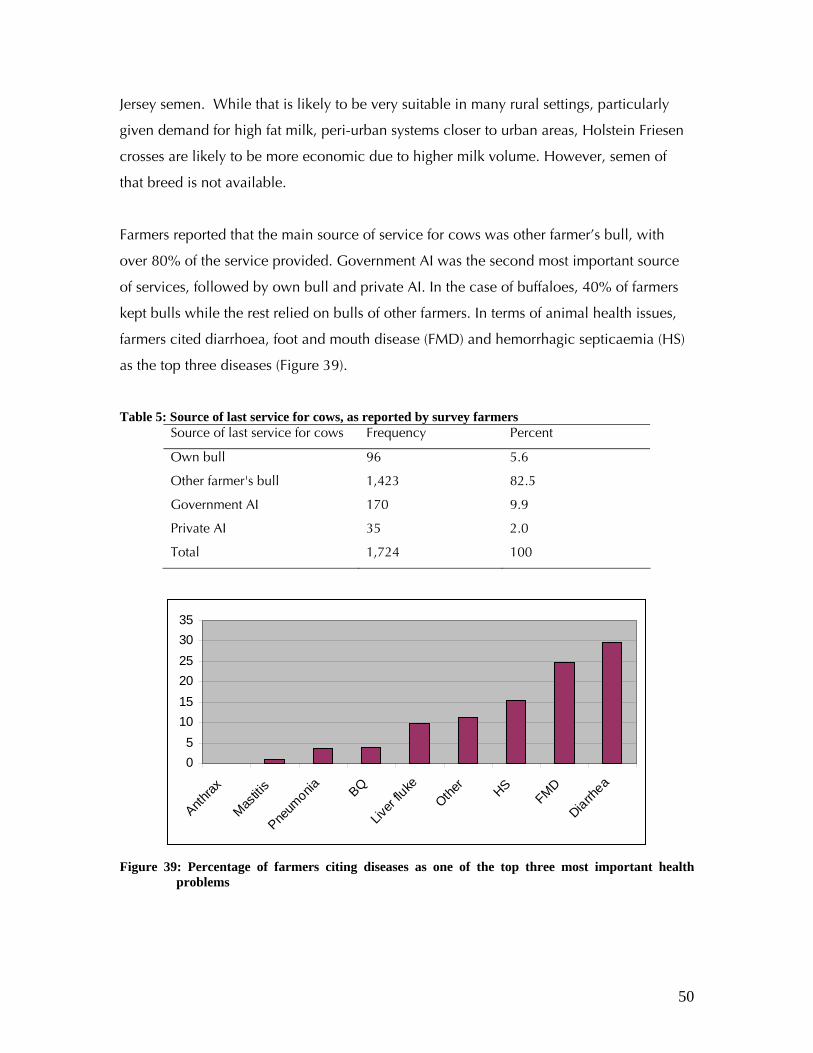
50
Jersey semen. While that is likely to be very suitable in many rural settings, particularly
given demand for high fat milk, peri-urban systems closer to urban areas, Holstein Friesen
crosses are likely to be more economic due to higher milk volume. However, semen of
that breed is not available.
Farmers reported that the main source of service for cows was other farmer’s bull, with
over 80% of the service provided. Government AI was the second most important source
of services, followed by own bull and private AI. In the case of buffaloes, 40% of farmers
kept bulls while the rest relied on bulls of other farmers. In terms of animal health issues,
farmers cited diarrhoea, foot and mouth disease (FMD) and hemorrhagic septicaemia (HS)
as the top three diseases (Figure 39).
Table 5: Source of last service for cows, as reported by survey farmers Source of last service for cows Frequency Percent
Own bull 96 5.6
Other farmer's bull 1,423 82.5
Government AI 170 9.9
Private AI 35 2.0
Total 1,724 100
05
101520253035
Anthrax
Mastiti
s
Pneum
onia BQ
Liver
fluke
Other
HSFMD
Diarrhea
Figure 39: Percentage of farmers citing diseases as one of the top three most important health
problems
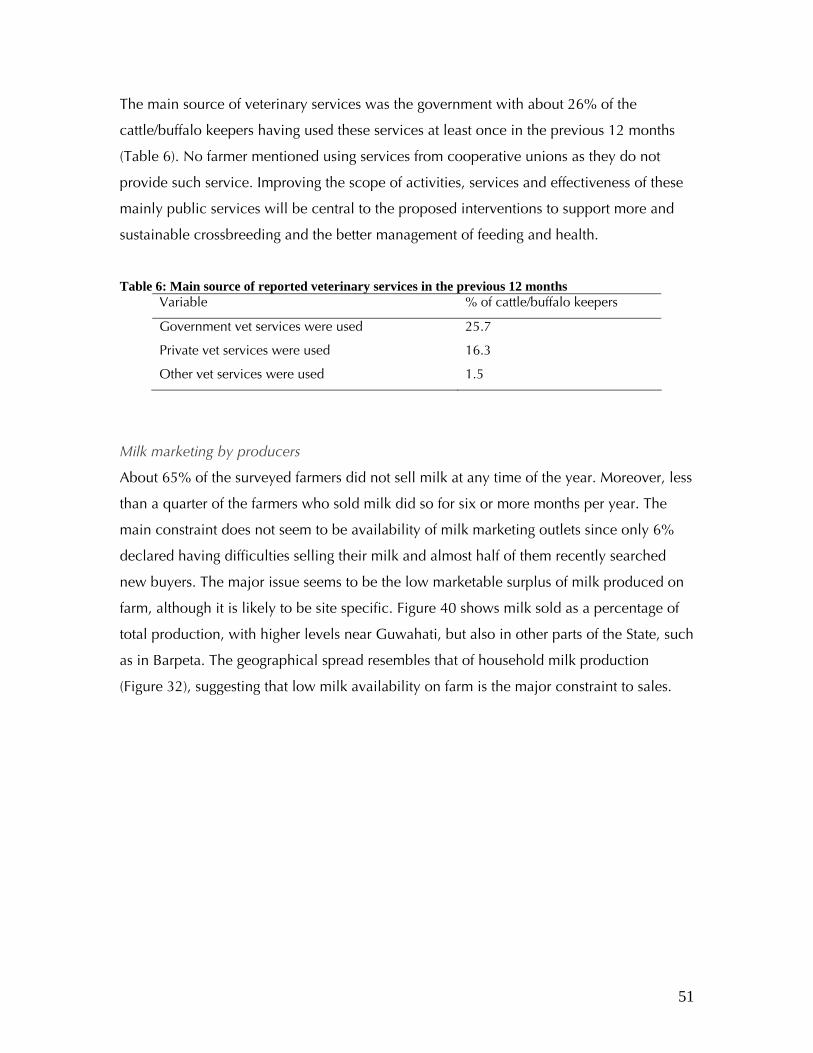
51
The main source of veterinary services was the government with about 26% of the
cattle/buffalo keepers having used these services at least once in the previous 12 months
(Table 6). No farmer mentioned using services from cooperative unions as they do not
provide such service. Improving the scope of activities, services and effectiveness of these
mainly public services will be central to the proposed interventions to support more and
sustainable crossbreeding and the better management of feeding and health.
Table 6: Main source of reported veterinary services in the previous 12 months Variable % of cattle/buffalo keepers
Government vet services were used 25.7
Private vet services were used 16.3
Other vet services were used 1.5
Milk marketing by producers
About 65% of the surveyed farmers did not sell milk at any time of the year. Moreover, less
than a quarter of the farmers who sold milk did so for six or more months per year. The
main constraint does not seem to be availability of milk marketing outlets since only 6%
declared having difficulties selling their milk and almost half of them recently searched
new buyers. The major issue seems to be the low marketable surplus of milk produced on
farm, although it is likely to be site specific. Figure 40 shows milk sold as a percentage of
total production, with higher levels near Guwahati, but also in other parts of the State, such
as in Barpeta. The geographical spread resembles that of household milk production
(Figure 32), suggesting that low milk availability on farm is the major constraint to sales.

52
Figure 40: Milk sold as a percentage of total production
The fact that about 65% of livestock producers did not sell any milk points to the
continued predominance of subsistence dairy production for home consumption, using
local breed cattle. The average overall percentage of total production of milk sold was
17%, although with huge variability by district as Figure 41 shows.
0102030405060
Barpeta
Cachar
Jorha
t
Kamrup
Marigao
n
NCHills
Nagaon
Sonitp
ur
Tinsuk
ia
% milk sold
Figure 41: Milk sold as a percentage of total production, by district
In terms of farmer choice of milk market outlets, as in other developing country dairy
systems, most milk sales are directly from producer to consumers, with 64% of producers
selling their milk to individual customers (Figure 42). About 31% sold to traders while less

53
than 3% of the surveyed producers sold to organized dairy cooperatives. Some 9% of
cross-bred cattle keepers sold to cooperatives. Figure 43 shows the geographical variation
in the proportion of milk sold by producers to traders. Of note is the fact that cross-bred
cattle keepers sold more frequently to traders than to individual customers, certainly
because of the higher milk volumes they produce. This suggests that as milk production
expands, marketing arrangements other than producer to final consumer type will need to
be used, with required changes in contractual arrangements.
010203040506070
other dairy coop traders individualcustomers
% farmers using this channel to sell cow milk- all farmers% farmers using this channel to sell cow milk- cross bred cattle farmers only
Figure 42: Percentage of farmers selling cow milk, by market outlet and type of producer

54
Figure 43: Percentage of farmers whose main outlet for milk sales is via traders
There was great variation in the average milk prices received by farmers (Figure 44). The
highest prices were received by farmers in Kampur, parts of NC Hills and Cachar. The
extreme variation shows the significant effect of differences in road infrastructure, distance
to main markets and availability of competing buyers. Sales to individual customers
fetched a higher price (Rs. 17 per litre) while milk traders paid an average of Rs. 13 per
litre.
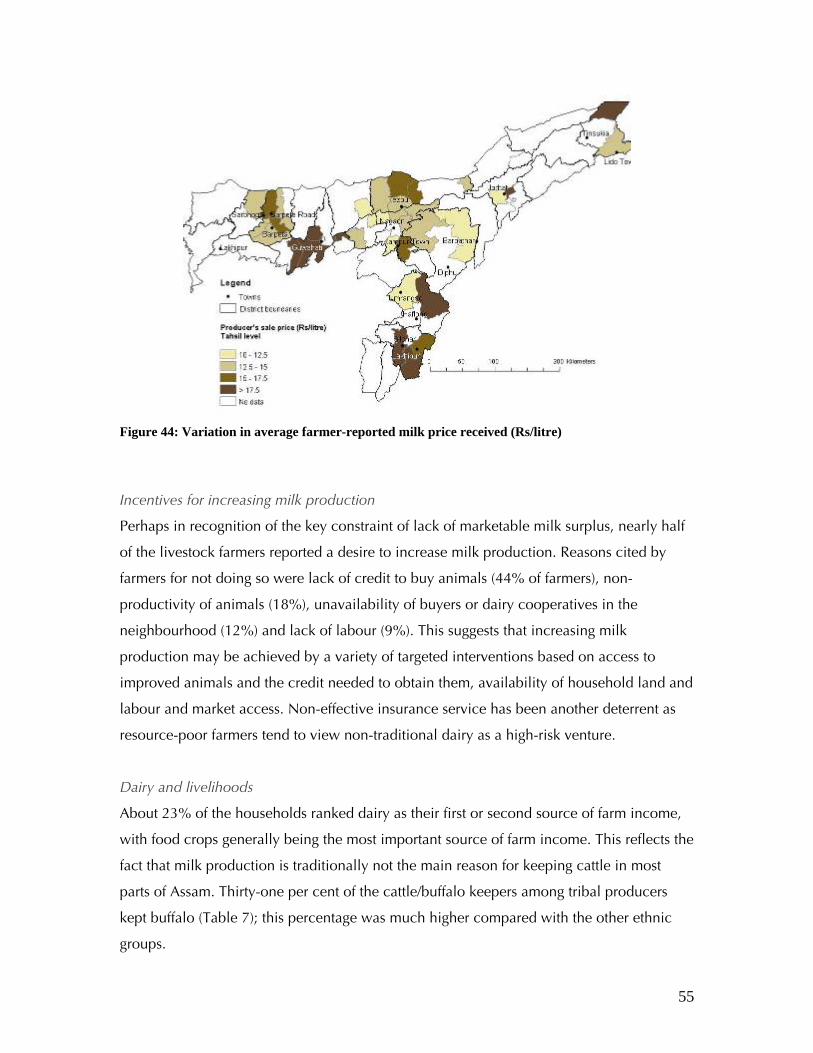
55
Figure 44: Variation in average farmer-reported milk price received (Rs/litre)
Incentives for increasing milk production
Perhaps in recognition of the key constraint of lack of marketable milk surplus, nearly half
of the livestock farmers reported a desire to increase milk production. Reasons cited by
farmers for not doing so were lack of credit to buy animals (44% of farmers), non-
productivity of animals (18%), unavailability of buyers or dairy cooperatives in the
neighbourhood (12%) and lack of labour (9%). This suggests that increasing milk
production may be achieved by a variety of targeted interventions based on access to
improved animals and the credit needed to obtain them, availability of household land and
labour and market access. Non-effective insurance service has been another deterrent as
resource-poor farmers tend to view non-traditional dairy as a high-risk venture.
Dairy and livelihoods
About 23% of the households ranked dairy as their first or second source of farm income,
with food crops generally being the most important source of farm income. This reflects the
fact that milk production is traditionally not the main reason for keeping cattle in most
parts of Assam. Thirty-one per cent of the cattle/buffalo keepers among tribal producers
kept buffalo (Table 7); this percentage was much higher compared with the other ethnic
groups.
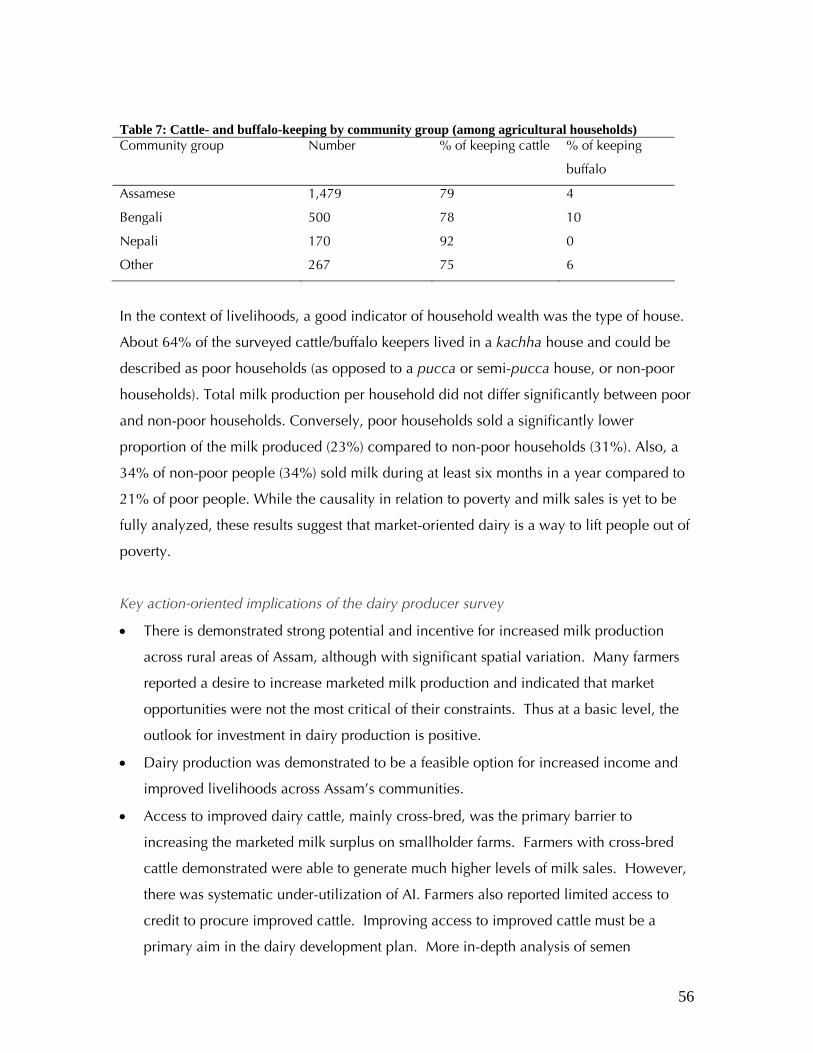
56
Table 7: Cattle- and buffalo-keeping by community group (among agricultural households) Community group Number % of keeping cattle % of keeping
buffalo
Assamese 1,479 79 4
Bengali 500 78 10
Nepali 170 92 0
Other 267 75 6
In the context of livelihoods, a good indicator of household wealth was the type of house.
About 64% of the surveyed cattle/buffalo keepers lived in a kachha house and could be
described as poor households (as opposed to a pucca or semi-pucca house, or non-poor
households). Total milk production per household did not differ significantly between poor
and non-poor households. Conversely, poor households sold a significantly lower
proportion of the milk produced (23%) compared to non-poor households (31%). Also, a
34% of non-poor people (34%) sold milk during at least six months in a year compared to
21% of poor people. While the causality in relation to poverty and milk sales is yet to be
fully analyzed, these results suggest that market-oriented dairy is a way to lift people out of
poverty.
Key action-oriented implications of the dairy producer survey
• There is demonstrated strong potential and incentive for increased milk production
across rural areas of Assam, although with significant spatial variation. Many farmers
reported a desire to increase marketed milk production and indicated that market
opportunities were not the most critical of their constraints. Thus at a basic level, the
outlook for investment in dairy production is positive.
• Dairy production was demonstrated to be a feasible option for increased income and
improved livelihoods across Assam’s communities.
• Access to improved dairy cattle, mainly cross-bred, was the primary barrier to
increasing the marketed milk surplus on smallholder farms. Farmers with cross-bred
cattle demonstrated were able to generate much higher levels of milk sales. However,
there was systematic under-utilization of AI. Farmers also reported limited access to
credit to procure improved cattle. Improving access to improved cattle must be a
primary aim in the dairy development plan. More in-depth analysis of semen
57
production and AI delivery systems will be required to identify bottlenecks to effective
services.
• Selection of best performing local breed cows is another route to increase milk
productivity, especially in areas where there is high demand for dual purpose cattle.
• While feeding systems did not appear to present major constraints, there was a trend
towards scarcity of grazing and grass from common areas. Interventions will need to
focus on enhancing producer ability to intensify fodder production.
• Milk markets may not be a major constraint in many areas, except in pockets where
milk production is high or where the road network to urban markets is still poor.
However, cooperatives and SHGs currently play a small role and, alone, are unlikely to
be able to serve all needs in the medium term. Thus alternative milk collection and
marketing options should be explored, including links to private market agents.
58
Action plan for dairy development in Assam
Recent dairy development strategies in Assam have focused on two main tracks: (a)
increasing productivity through providing improved cattle under government-run semen
production and AI schemes and (b) increasing milk collection through dairy cooperative
societies and SHGs, mainly linked to formal processing channels. This study has shown
that these efforts have met with limited success, although in some dairy pockets there has
been some clear positive impact. It is apparent that dairy systems in Assam may be too
diverse to have a singular policy thrust. We need to recognize such diversities of the
system and place them within pro-poor dairy intervention designs and enable poor
households to take part in the process.
The real challenges are as follows:
• To increase the intensity of smallholder dairy activity at the poor household level by
providing access to improved production means and associated support systems
centered around improved cattle, though not exclusively.
• To bring the low level surplus generated by the poor households to the market.
• To boost to the demand for milk through improved hygiene and quality of local products
and diversified dairy products that made from local milk production.
Further, while designing programs, it must be kept in mind that many small actors (e.g.
milk collectors) are already playing a decisive role by creating vital links in the value
chain. The idea is not to have a parallel competitive system to the traditional one, but it
would be more effective to recognize the traditional system and built a more modern and
professional system around it.
Therefore, the proposed action plan suggests and covers the key areas where the analysis
has identified constraints and opportunities to development of the dairy industry in Assam.
These key areas are: consumption, marketing of milk, quality control and production. The
action plan is based on the pillars of Business Development Services (BDS) and the Cluster
Development (CD) approach, which emphasize process development and coordination
among different actors to ensure sustainability of the dairy development initiatives. It has
been empirically established that BDS and CD approaches are a very important means of

59
supporting the development of micro-, small- and medium-sized enterprises. These
enterprises have potential to create employment, generate income and contribute to
overall economic development and growth. India has successful cases of BDS and CDs in
other sectors.
A. Generic promotion of milk consumption and quality awareness
Issue: Low demand for dairy products. As shown in the consumer survey information, the
current level of per capita consumption of milk (i.e., less than one litre per week) is still
way below the national average of about 1.57 litres per capita per week (National
Household Survey, Government of India, 2004-2005). On the other hand, there are
indications of strong demand, e.g. the majority of respondents in both urban and rural
areas indicated preference for milk as part of their daily diets and this is also bolstered by
the indication that the majority of respondents in both urban and rural areas are aware of
the health and nutritional benefits of milk consumption. The analysis has also shown
clearly that consumers are not able to judge milk quality accurately.
Recommendation: Invest in specific steps to increase demand for fresh milk and dairy
products derived from local production, in a State-level campaign.
Action: Conduct a generic public information campaign, through multiple media, for
increasing consumption of fresh milk and for awareness of quality, in partnership with
private and cooperative sectors. The campaign should also establish Assam milk loyalty
through state-level branding and certification.
Target location: State-wide
Specific steps
1. Recruit a proficient advertising firm with expertise in generic food campaigns.
2. Establish a coalition of public, private and cooperative partners involved in dairy
processing and marketing, to guide the campaign design and also to make
supplementary investment in public awareness.
3. Design a State dairy identity or brand, to be used on all Assam dairy products.
60
4. Conduct the milk awareness and dairy promotion campaign over a 2 year period,
using a variety of media outlets. Focus should be on a) quality and nutrition
awareness, including school milk programme as improving child nutrition is a key
way to improve welfare of many poor families and b) livelihood awareness in that
dairy development contributes to overall rural development in Assam.
B. Improving the performance of the milk market, both formal and traditional
The study has identified a number of weaknesses throughout the marketing channels
serving the State dairy industry, both in the dominant traditional sector, and in the smaller
formal sector. These include unreliable quality and inappropriate product mix in formal
markets, adulteration, and poor hygiene and constraints to scaling up in the traditional
sector.
Issue: Support to improving the milk quality and product mix in formal milk processing.
Based on information from the consumer survey, nearly half of urban consumers and about
one-fourth of rural consumers are generally not satisfied with the present level of hygiene
and quality of milk available in the market. There was also some indication that
consumers were not attracted to the “toned” milk supplied by processors, favouring instead
whole fresh milk. The milk quality analysis demonstrated very clearly that locally
processed milk was the main problem area and was generally of inferior quality to milk
and dairy products from sources outside the State. This is a clearly an obstacle to consumer
acceptance and increased consumption of local milk and dairy products. Without
increased consumption of locally-produced products, dairy development in Assam will
continue to be constrained.
Recommendation: Support local dairy processors to improve quality and product mix.
This is a critical step to increasing demand for local dairy products, which currently are
regarded as inferior to imported products by consumers.
Action: Design and implement a program of support and training to local dairy processors
(private and cooperative) in product quality control and product targeting.

61
Target location: Kamrup, Barpeta, Sonitpur, Jorhat and Cachar and then extended to other
districts
Specific steps
1. Recruit a reputable firm with private-sector expertise in dairy processing, quality
control, product design, and application of HAACP methods. Also recruit one or
more local firms that could develop the same capacity.
2. In consultation with local processors and dairy regulators, design a training
program for processor managers and technical staff to address quality control and
product design.
3. Conduct the training locally, combined with visits to model dairies in nearby
States, over a 1 year period.
4. Conduct follow-up regular monitoring and support to ensure quality control is
maintained, over a 3 year period.
5. Design and conduct training program for local service firms and local dairy
regulators to better enable them to support and monitor local dairy product quality.
Issue: Variable and generally low quality and performance of traditional small-scale milk
market agents. The testing of milk quality in the traditional sector indicated that the milk
marketed had a high level of adulteration with water and low bacteriological quality, i.e.,
average water added in raw milk was about 19%. These results suggest the need to
improve the practices, as well as the monitoring of those practices, of the small-scale milk
agents who currently dominate raw milk trading and indeed to dairy industry overall, to
ensure better quality and hygienic milk for sale. Moreover, there are indications that urban
consumers are willing to pay a premium for milk that is guaranteed to be safe and
hygienic, so this presents opportunities for market agents who can deliver what these
consumers require. Priority should be given to the majority of informal milk agents who
have been shown to lack appropriate training in milk handling based on the market agent
survey; i.e., some 99% of informal milk agent respondents indicated not having any
training in milk processing and handling.
In order to ensure better compliance with quality and hygiene standards of milk and milk
products, there also needs to first agree on appropriate standards and monitoring process to
62
maintain quality control among small-scale milk agents, and then capacity enhancement
on the part of the regulatory agencies tasked with monitoring food quality and safeguarding
the public health interest. Specifically this should be targeted to key people tasked with
developing and implementing dairy development projects, as well as those personnel who
are directly involved in the actual monitoring of compliance with milk quality standards in
order to enforce them properly, including not only public regulatory agencies, but also
milk trader associations etc.
Recommendation: It has been demonstrated in other regions and countries (East Africa
region, and Kenya in particular) that a program to address small scale traditional milk
market agents through a combination o f training in hygiene and small enterprise skills
leading to certification, combined with development and enforcement of appropriate
standards, can improve milk quality and market performance. It is recommended that this
approach is tested and applied in Assam.
Action: Develop and implement a program of TCM (training, certification and monitoring)
for traditional milk market agents, in consultation with public regulators and stakeholders,
tailored to specific channels where opportunities are greatest.
Target locations: Initially in the districts where small-scale milk agents play the largest role
in general (Figure 43): Barpeta, Sonitpur, Kamrup, North Chachar, Chachar, during first
two years. The program will later be implemented in the remaining districts.
Specific steps
1. Identify and recruit a reputable lead NGO with experience in capacity building and
training of informal sector market actors. Identify local NGOs or firms with
capacity and interest in supporting training and certification of traders, following a
business development services (BDS) approach.
2. Establish and conduct a consultation process among State and local quality
regulators, dairy development agencies, private sector and small scale market
agents and their associations, and other stakeholders, to agree on appropriate
standards, certification process and monitoring procedure, including sampling
regime.
63
3. Develop the training materials with focus on quality concepts, hygienic milk
handling, and small business skills, in consultation with local stakeholders. Also
develop the monitoring regime and tools.
4. Train local firms/NGOs to provide the training of market agents, and local regulator
in the certification and monitoring practices.
5. Conduct the market agent training in target sites.
6. Establish and implement the certification and monitoring procedure.
7. After 2 years, review progress and changes in milk quality, and revise the program
as required, based on stakeholder feedback.
Issue: Capturing opportunities in traditional value addition (processing)
Based on the consumer survey information, there appears to be increasing demand for
local traditional sweets, e.g., households in urban areas spend on average some three
rupees for every 10 rupees spent on milk, and this is about 25% higher than what rural
consumers spend on milk based sweets. Rising demand for these products will generate
new employment opportunities. However, the dairy product quality analysis showed that
in some cases sweets producers and vendors did not follow good hygiene practices, and
that very simple changes would improve product quality.
Recommendation: To design and implement a program of basic training in hygiene and
processing for traditional sweet and product manufacturers and vendors. Attention should
also be given to innovation in product packaging and presentation to increase
preservation, quality and consumer satisfaction. This would increase product quality, and
potentially increase consumption of local dairy products.
Action: Design and implement a program of basic training in hygiene and processing for
traditional sweet and product manufacturers and vendors.
Target location: All major urban areas in the target districts.

64
Specific steps
1. Identify and recruit a reputable lead NGO with experience in capacity building and
training of informal sector market actors. This may be the same organization
enlisted to develop training for milk market agents above.
2. Develop the training materials with focus on quality concepts, hygienic practices,
and small business skills, in consultation with local stakeholders.
3. Train local firms/NGOs to provide the training of local sweet and dairy product
processors and agents.
4. Conduct the training in target sites, over a period of 2 years.
Issue: Lack of clear coordinating and information gathering and sharing mechanisms in
the Assam dairy industry to support private sector investment. The existing set up of
involvement of multiple departments/agencies/organizations in dairy development is
complex and thus is not effective in harnessing the complementarities. During the course
of the study, and the during the process of engagement with local partners, it became
apparent that while there were many players in Assam dairy industry, both small and large,
there did not exist an effective coordinating mechanism for dairy development, nor a
central repository of information on the dairy industry, or a mechanism for regularly
updating that information. The coordinating agencies are focused on public and
cooperative actors, with less attention to the private sector who will be critical in driving
dairy development in the State. Small scale agents have little voice, and have no clear
support to reach required services, such as micro-credit and other business support
services.
Recommendation: Invest in the resources and organizational mechanisms required to
support greater information sharing and private sector investment in Assam dairy.
Action: Establish a Facilitation Centre for Dairy Development (FCDD).
Target location: Dairy Development Department, Khanapara, or other suitable location if
agreed by stakeholders.

65
Specific steps
1. Consult with stakeholders to agree the terms and structure for the proposed FCDD.
Priority should be given to the needs of private sector investors and agents, and
also cooperative and NGO agencies. Agree a simple steering committee or other
mechanism to backstop and guide the FCDD, and the staffing structure. The FCDD
could be linked to a new Assam Dairy Development Board (ADDB), with voluntary
dues-paying membership, if desired by stakeholders.
2. Recruit a dynamic individual with experience in business development services,
and in public awareness principles and practices. Recruit support staff with
expertise in information materials, databases, etc.
3. Develop a database of dairy stakeholders and enterprises, and dairy development
activities, and a procedure for regular updating.
4. Develop a database of potential dairy business support services providers, such as
credit and finance agencies, dairy technology and quality support providers, animal
health and genetics services providers, cattle traders, business skills providers,
marketing and advertising agencies, etc, and a procedure for regular updating of
the same.
5. Identify the regular market information needs of dairy stakeholders, and a
procedure for collecting and disseminating that information. That is likely to
include information on a regular basis across key locations in the State on milk and
dairy product prices, feed and fodder prices, prices of dairy cattle and buffaloes,
veterinary drugs, etc, as well as information on quantities of milk volume traded
and processed, and results of milk and product quality analysis, etc.
6. Maintain the FCDD for a period of 5 years, with a mid-term review of progress.
Towards the end of the 5 year period, identify mechanisms to continue long-term
support to the FCDD.
C. Supporting pro-poor smallholder dairy production systems
The analysis has identified a range of constraints to the increased development of
smallholder dairy production systems, and to their improved productivity and scaling up.
The areas identified as priorities for support to pro-poor dairy development, which the
Action Plan will ensure are addressed, include:
66
• improved access to milk markets;
• the availability of more dairy cross-bred cows;
• the increased capacity of milk producers to manage the breeding, feeding and health of
their dairy cows; and
• public and private support services that are better equipped to satisfy the needs of their
clients, small-scale dairy producers.
The most appropriate approach to tackling these needs is to employ a cluster approach to
new smallholder dairy farmer development, integrating breed improvement, feed and
management skills development and new market development. Site-specific targeted
development of new dairy farmer clusters serving traditional milk markets, particularly in
regions where the formal market is not yet a viable option. However, these should be
linked to on-going existing dairy cooperative development efforts.
Key development partners
A key ingredient for success for all of the recommended activities below is the presence
and active participation of a key national NGO with significant experience in smallholder
dairy development. The experience in Assam suggests that interventions driven only by
public agencies are unlikely to achieve the desired outcomes, and so an experienced NGO
with experience from other parts of India will be required to be the lead agency in all the
cluster development efforts described below. If it is not possible to identify a single NGO
with expertise in the different fields, a consortium of NGOs will be put in place, with a
pre-defined coordination structure.
Targeting: Locating the action plan
While the consumer and market oriented interventions described above can be relatively
easily targeted to specific locations, largely aimed at urban market areas, the targeting of
producer interventions must consider a wider range of variables across the districts. These
may include access to market and to livestock services, availability of grazing and fodder
resources, the agro-climate and elevation, among other factors. In the section, a

67
preliminary targeting is done to begin to best locate suggested interventions. However,
more stakeholder consultation will be required to fine-tune the strategy for final locations.
Figure 45: Current DCS and milk plant activity and capacity
Figure 46: Local milk surplus and deficit based on projected production and consumption
Some of the important types of spatial information need to target the dairy development
interventions will be the current locations and level of activity of DCSs and dairy
processing plants (Figure 45) and the current availability of surplus milk (Figure 46).
Detailed suggestions for targeting the interventions are presented at the end of this report.
68
Issue: Ensuring a client-oriented and needs-based action plan
A pre-condition for the successful implementation of the production-based points 2, 3 and
4, will be the participation of the cluster communities in the decision-making processes for
the design and the implementation of the plans to make more dairy cows available to the
communities and for improving the dairy management skills of each community. The
participation of the current and potential small-scale dairy producers in the design and
implementation of the schemes will ensure that the action plan is client-oriented and
needs-based.
Recommendation: In each identified cluster having good potential for pro-poor dairy
development the participation of the community will be integral to the planning and
implementation of the schemes to increase the availability of dairy cows and to improve
the capacity of individuals within the community to manage the cows to achieve and
sustain profitable performance.
Action: Implement a series of activities to build capacity for client-oriented dairy cluster
development.
Specific steps
1. Train the staff in the dairy and rural development departments, their NGO
counterparts and partners and the community leaders in the identified clusters in
the participatory processes and methods appropriate to pro-poor dairy
development.
2. The training will precede the engagement with the cluster communities and will
continue during the participatory design of the community-based development
plans.
3. Implement further training during the implementation of the plans to ensure the
capacity of all partners to recognize and act on the needs of each cluster
community and its members, particularly the poorer households.

69
Issue: Increasing the availability of dairy cross-bred cows
Given the current small population of dairy cross-bred cows and the constraints to their
adoption, the key intervention for successful pro-poor dairy production (where there is a
secure market with a reasonable farm-gate price for milk), will be increasing the
availability of dairy cross-bred cows.
Recommendation: Because local circumstances, needs, and resources will differ, several
alternative strategies for increasing availability of cross-bred cows will be required. Simple
crosses of dairy breeds (Jersey or Holstein-Friesian) with local desi cattle are
recommended, as opposed to more complex mixes involving a third breed, which has
sometimes been proposed. The organizational requirement for delivering in a sustained
manner 3-way cross breeds are high, and may be beyond the capacity of existing services.
Action: Provide target cluster communities with alternative means to increase access to
improved cows, and the required support services.
Cluster communities will be advised to consider and assisted in putting in place one or
more of three complementary pathways to increasing the availability of dairy cows:
1. Dairy bull breeding services through purchased or loaned bulls kept and managed
by a nominated “breeder” experienced in cattle-keeping or by a progressive dairy
farmer;
2. Artificial insemination (AI) as a component of an integrated veterinary service
provided by technicians employed by a large cluster or a group of neighbouring
smaller clusters or by an entrepreneur; the AI service fees and other fees for
veterinary treatments will represent a major part of the technicians’ income,
supplementing a low base salary;
3. Hand-on-the-Gift (HoG) schemes in which the cluster community identifies the
most-needy recipients of in-calf dairy heifers and cows to be donated to the
community by the programme. In the programme each recipient retains the cow or
heifer for their own market-oriented dairy production and its progeny is given
70
(handed on as a gift) to the next needy households on the list compiled by the
community.
Specific steps
1. Drawing on their training in participatory methods, staff in the dairy and rural
development departments, their NGO counterparts and partners and the
community leaders in the identified clusters, will consult with the community
about the options for making available more dairy cows;
2. Given the low rate of success of the majority of publicly-funded AI/breeding and
veterinary-service programs, a key part of the training will address how to involve
entrepreneurs in the development of profitable service-delivery businesses;
3. Specific training in dairy breeding for the technical staff and the community leaders
will be required. Options 1 and 2 (listed above in the second Recommendation)
apply to upgrading desi cows through mating with dairy bulls (F1, three-quarter bred
or pure-bred) or by AI (using three-quarter bred or pure-bred semen) and to the
mating of the current dairy cross-bred cows. For the latter, F1 or three-quarter bred
bulls or semen are recommended. Given the hot, humid climate in Assam, the use
of purebred dairy bulls and semen should be avoided and will not be supported by
the programme.
4. For successful implementation, training in HoG schemes and the continuing inputs
from NGOs experienced in this approach, will be required.
5. As the recipient families in the schemes will be poor households keeping dairy
cattle for the first time, and possibly keeping any cattle or buffalo for the first time,
it is particularly important that the technicians working with the communities to
implement the HoG schemes are trained in all aspects of dairy management. Care
of lactating cows and of calves will be especially important.
6. Support will need to be given to appropriate semen production, delivery services,
liquid nitrogen supply, and upgrading provided where required, with emphasis on
identifying and training private providers where possible.
These HoG schemes would also be the entry-point for participatory extension on
feeding and health management and for the linkages to the input markets for feed
supplements and veterinary supplies.
71
Issue: Equipping resource-poor producers to better manage their dairy animals.
Complementing the capacity building in community-based actions and service delivery for
increasing the availability of dairy cows will be training designed to equip resource-poor
milk producers to better manage the feeding and health of their dairy cows and progeny.
Recommendation: In each identified cluster with potential for pro-poor dairy development
the staff in the dairy and rural development departments, their NGO counterparts and
partners and the members of households interested in adopting dairy production, will work
together to describe, analyze and improve current feeding and health management
practices.
Specific steps
1. Drawing on the training in participatory methods, staff in the dairy and rural
development departments, their NGO counterparts and partners and the current
and potential dairy households in each cluster will carry out the participatory
description, analysis and improvement of current feeding and health management
practices.
2. For feeds, the aim will be to optimize the efficiency of use of local resources and of
family labour through combining and supplementing feeds to meet the
requirements for the profitable production of milk and of replacement stock,
particularly heifers.
3. A key element will be ensuring an adequate year-round supply of good quality
feed; integral to the process will be maximizing the utility of rice by-products and
increasing the availability of cost-effective protein-rich supplements, e.g. from
legume crops and forages.
4. Involving in the diagnostic process rice-millers, other processors of crop by-
products, current feed suppliers and cropping system specialists will be critical to
the success of increasing the quantity and quality of cost-effective feeds that are
available to dairy producers.

72
5. Parallel with the capacity building for improved feed management will be the
participatory description, analysis and improvement of current health management
practices.
6. Emphasis will be given to improving preventative medicine practices, including
vaccination against FMD and other endemic diseases, and implementing programs
to reduce the risk of, and to treat, manage diseases, especially mastitis. (The latter
will be run in conjunction with the milk hygiene programs described above).
7. Local private veterinary service providers and agro-vet drugs supplier will be
solicited to work with cluster groups to provide services on fee-paying basis, and
will be supported to provide additional extension services.
Implementing these recommendations will increase the availability of dairy cows,
improve the capacity of individuals within the community to manage the cows for
profitable milk production and increase the capacity of public and private sector
services to support Assam’s emerging dairy industry and specifically its small-scale
producers.
Issue: Supporting small-scale milk market development.
Many producers report that they have few problems marketing their milk. However, this
may be related to lack of significant marketable surplus of production. As production
increases, markets for milk will be critically important. The options for organizing milk
marketing are numerous, and are likely to depend on local circumstances, and the
preferences of communities. A key point is that because the formal processed milk market
is so small, for the medium term the largest opportunities are likely to occur in traditional
markets serving urban areas and even small rural market centres, both in the form of milk
and value added traditional products.
Within the producer clusters being developed, alternative market strategies can be
explored, which might include at organizational level:
• dairy cooperative societies or self-help groups
• dairy producer companies, or partnership firm
73
• individual producer sales to designated agents serving traditional or formal
markets.
The marketing strategy could be one or several of the following options:
• raw milk sales to local or distant market centres, targeting institutional or
individual customers, either directly by producer group or through selected
market agents
• milk sales to commissioned agents of formal processors, cooperative
processors
• sales to local traditional processors – sweet makers, channa makers, etc.
• Producer group value addition of their own milk output, in the form of
traditional products or simple new products such as yoghurt
Individual sales to individual market agents, with no form of producer collective action,
may be a lower priority given the risk of reduced bargaining position for smallholder
producers.
Recommendation: Given the numerous market development possibilities, each cluster
group should explore the best option for their own need.
Specific steps
1. Cluster groups to be provided with training and oriented in basics of market
opportunity analysis, and market organization and group governance, by lead
NGO.
2. With support of the lead NGO, cluster groups to explore local market options and
identify which strategies work best for their needs, with an emphasis on a)
simplicity of governance and financial management, b) lowest cost of organization
and delivery of milk and c) most reliability of payment and milk collection,
including possibility of scaling up milk output.
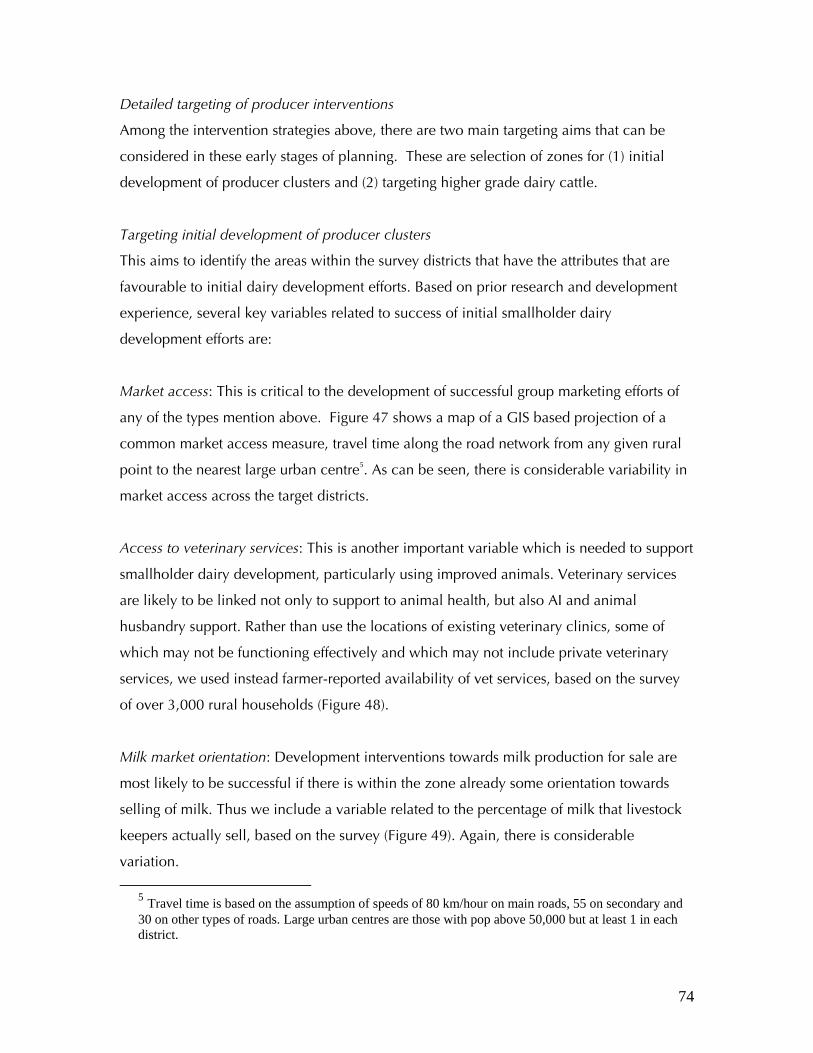
74
Detailed targeting of producer interventions
Among the intervention strategies above, there are two main targeting aims that can be
considered in these early stages of planning. These are selection of zones for (1) initial
development of producer clusters and (2) targeting higher grade dairy cattle.
Targeting initial development of producer clusters
This aims to identify the areas within the survey districts that have the attributes that are
favourable to initial dairy development efforts. Based on prior research and development
experience, several key variables related to success of initial smallholder dairy
development efforts are:
Market access: This is critical to the development of successful group marketing efforts of
any of the types mention above. Figure 47 shows a map of a GIS based projection of a
common market access measure, travel time along the road network from any given rural
point to the nearest large urban centre5. As can be seen, there is considerable variability in
market access across the target districts.
Access to veterinary services: This is another important variable which is needed to support
smallholder dairy development, particularly using improved animals. Veterinary services
are likely to be linked not only to support to animal health, but also AI and animal
husbandry support. Rather than use the locations of existing veterinary clinics, some of
which may not be functioning effectively and which may not include private veterinary
services, we used instead farmer-reported availability of vet services, based on the survey
of over 3,000 rural households (Figure 48).
Milk market orientation: Development interventions towards milk production for sale are
most likely to be successful if there is within the zone already some orientation towards
selling of milk. Thus we include a variable related to the percentage of milk that livestock
keepers actually sell, based on the survey (Figure 49). Again, there is considerable
variation.
5 Travel time is based on the assumption of speeds of 80 km/hour on main roads, 55 on secondary and 30 on other types of roads. Large urban centres are those with pop above 50,000 but at least 1 in each district.
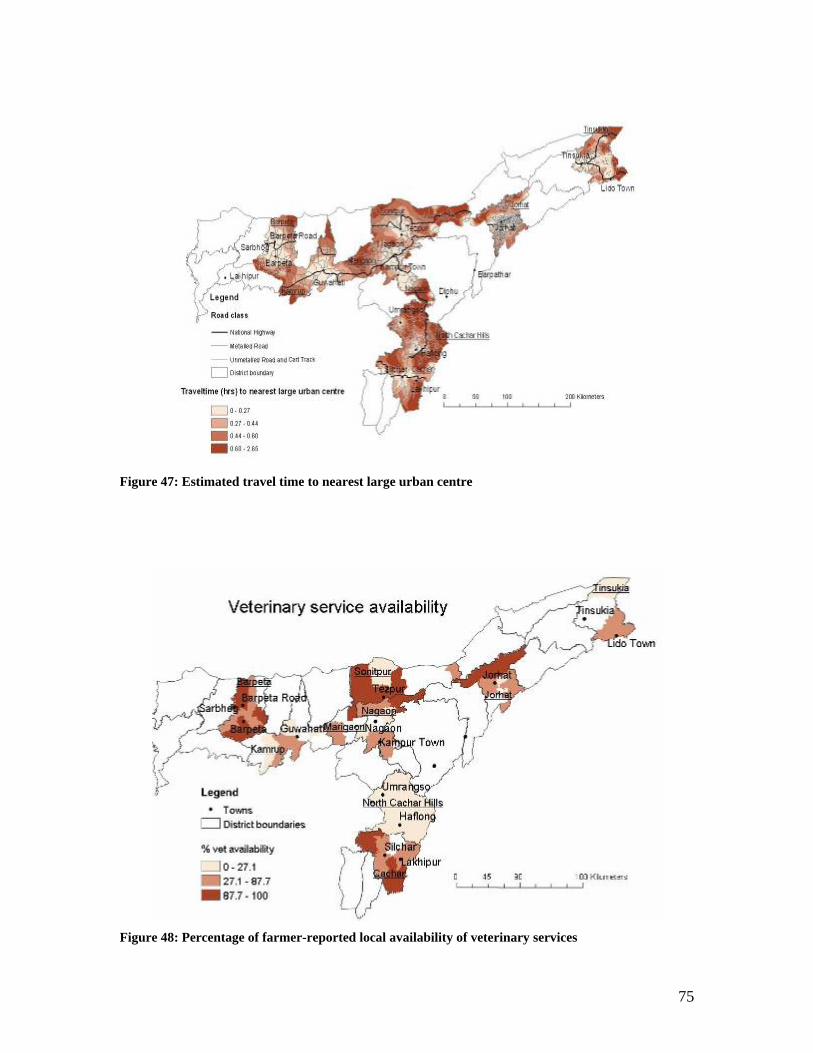
75
Figure 47: Estimated travel time to nearest large urban centre
Figure 48: Percentage of farmer-reported local availability of veterinary services

76
Figure 49: Percentage of milk sold by cattle and buffalo keepers
Integrated recommendation domains for initial cluster efforts
When we combine the three GIS domains for market access, veterinary services and milk
sales, we get a clear definition of the most likely zones for initial farmer cluster
development efforts. As seen in Figure 50, these include selected zones of Barpeta,
Kamrup, Marigoan, Sonitpur, Nagaon, Jorhat, Tinsukia and Cachar districts. All parts of
these districts are not included in the recommendation domains. The precise
recommended tahsils can be extracted from the GIS for consideration by stakeholders.
These form the zones for initial farmer cluster development, which would then be
extended into the other parts of each district following success in these initial zones.
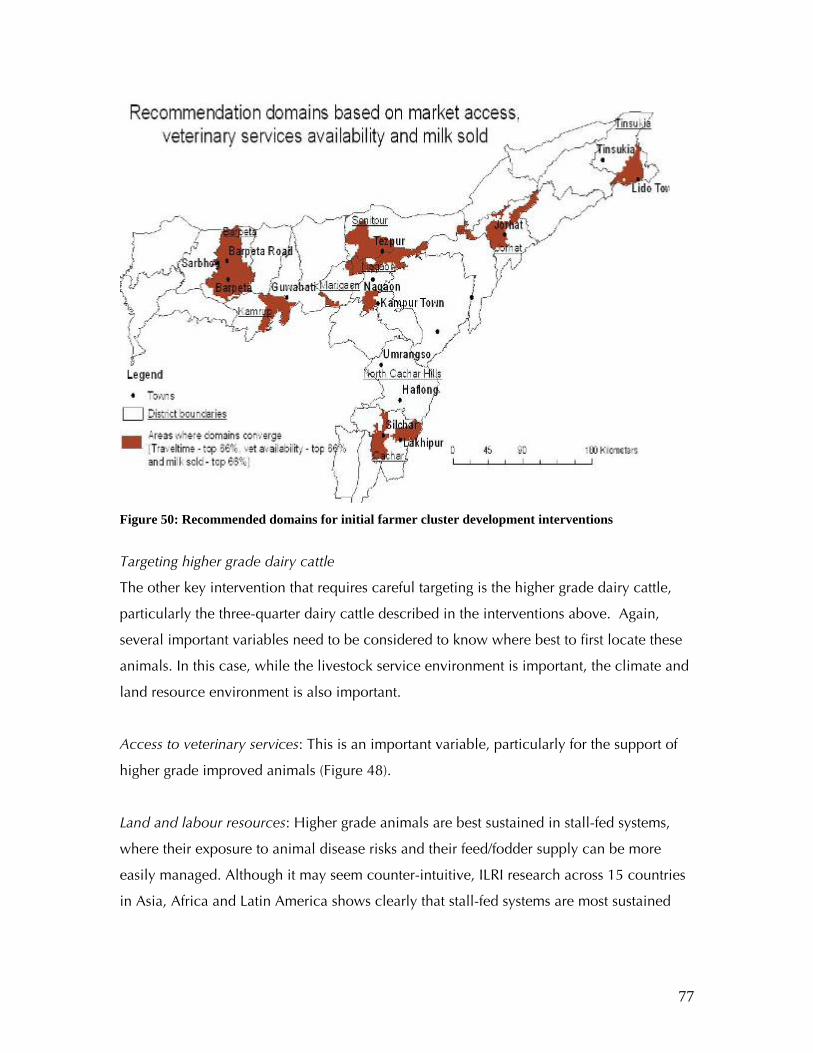
77
Figure 50: Recommended domains for initial farmer cluster development interventions
Targeting higher grade dairy cattle
The other key intervention that requires careful targeting is the higher grade dairy cattle,
particularly the three-quarter dairy cattle described in the interventions above. Again,
several important variables need to be considered to know where best to first locate these
animals. In this case, while the livestock service environment is important, the climate and
land resource environment is also important.
Access to veterinary services: This is an important variable, particularly for the support of
higher grade improved animals (Figure 48).
Land and labour resources: Higher grade animals are best sustained in stall-fed systems,
where their exposure to animal disease risks and their feed/fodder supply can be more
easily managed. Although it may seem counter-intuitive, ILRI research across 15 countries
in Asia, Africa and Latin America shows clearly that stall-fed systems are most sustained
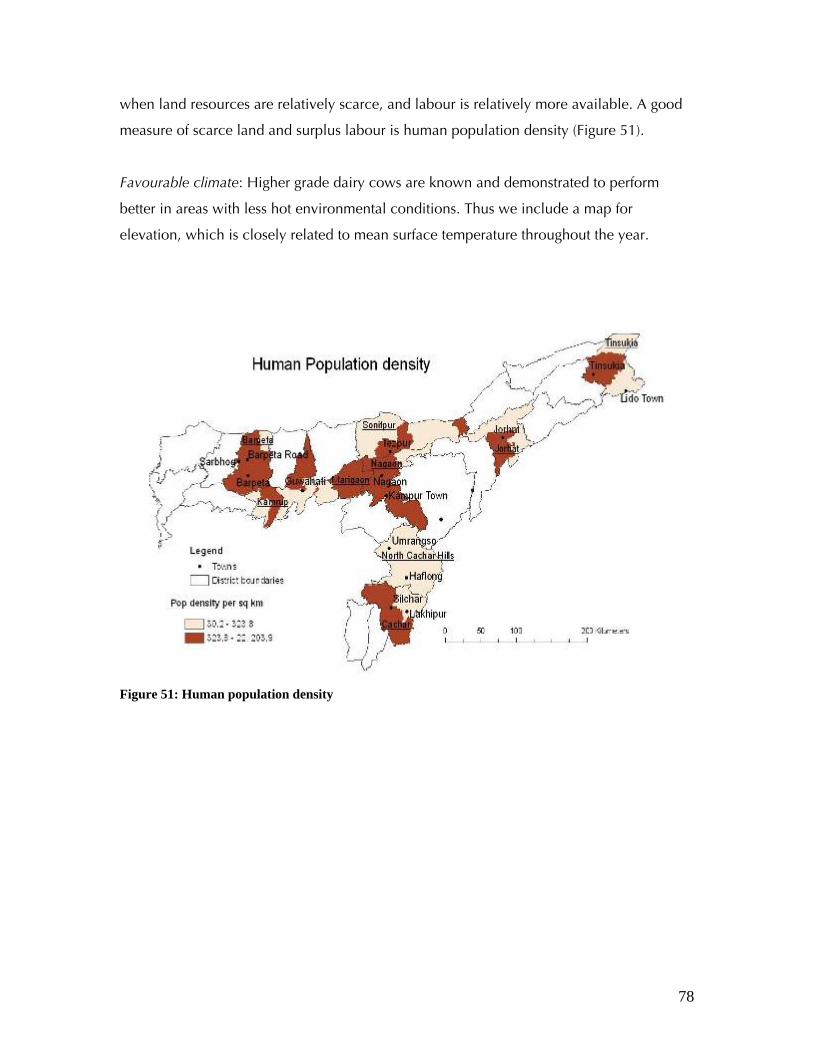
78
when land resources are relatively scarce, and labour is relatively more available. A good
measure of scarce land and surplus labour is human population density (Figure 51).
Favourable climate: Higher grade dairy cows are known and demonstrated to perform
better in areas with less hot environmental conditions. Thus we include a map for
elevation, which is closely related to mean surface temperature throughout the year.
Figure 51: Human population density

79
Figure 52: Elevation (metres above sea level)
Figure 53: Recommended domains for targeting of higher grade dairy cattle

80
Integrated recommendation domains for higher grade dairy cattle
When we combine the three GIS domains for veterinary services, human population
density and elevation, we get a clear definition of the most likely zones for initial higher
grade cattle targeting efforts. As seen in Figure 53, these include selected zones of Barpeta,
Kamrup, Marigoan, Sonitpur, Nagaon, Jorhat, Tinsukia and Cachar districts, and in some
cases they may overlap with target zones for cluster development. All parts of these
districts are not included in the recommendation domains. The precise recommended
tahsils can be extracted from the GIS for consideration by stakeholders. These form the
zones for higher grade cattle development. In other zones where conditions are less
favourable, the objective would be focused on F1 crosses.
Table 8 provides a summary of the tahsils and blocks for initial targeting of the farmer
cluster development interventions and higher grade cattle interventions. Consultations with
key stakeholders were conducted to ground-truth the selection of the target areas, as well
as ranking the blocks for interventions. Some blocks (e.g. Mandia in Barpeta district) are
selected for both interventions while other blocks (e.g. Jorhat in Jorhat district) were
selected for only one intervention (in this case cluster development). In Cachar and N.C.
Hills districts, no specific blocks were selected.
Table 8: List of target tahsils and blocks for farmer cluster development interventions and higher grade cattle interventions
District Tahsil Block Rank for cluster
development
Rank for grade
cattle
Barpeta Baghbor Mandia 1 1
Barpeta Baghbor Chenga 2 2
Barpeta Baghbor Gumafulbari 3 3
Barpeta Barnagar Gobardhana 1 1
Barpeta Barnagar Chakchaka 2 2
Barpeta Barpeta Bhabanipur 1 1
Barpeta Barpeta Pakabetbari 2 2
Barpeta Barpeta Changa 3 3
Barpeta Barpeta Gumafulbari 4 4
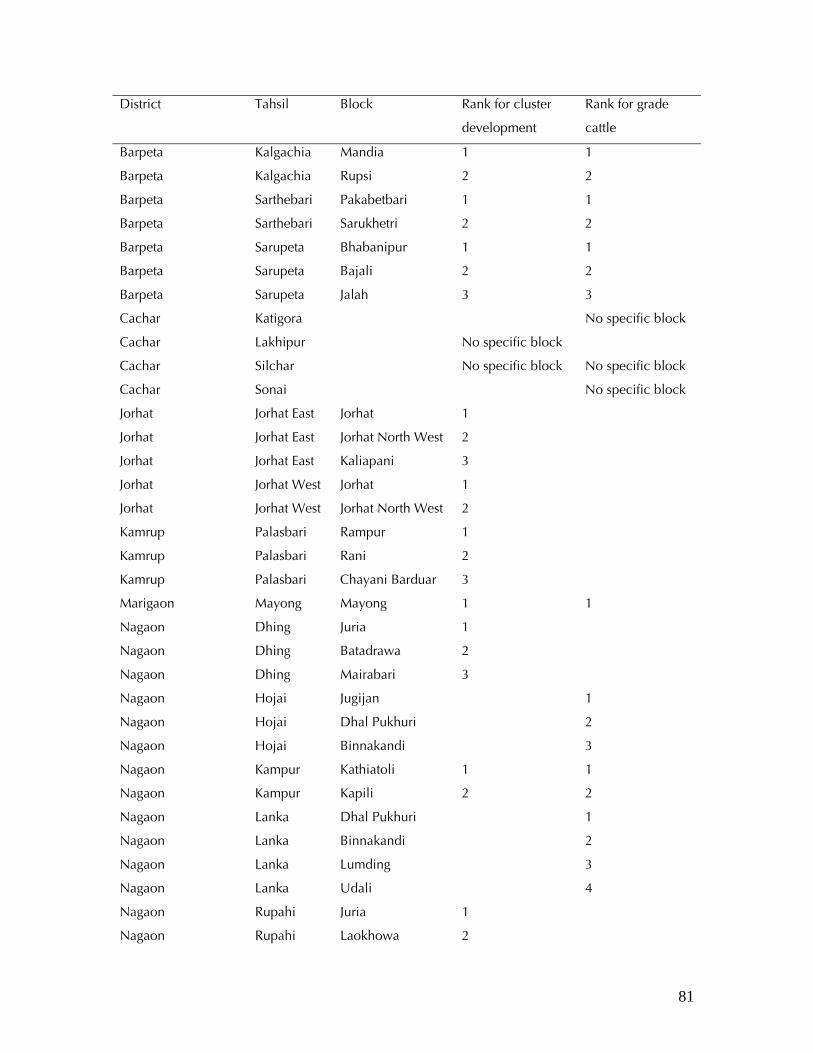
81
District Tahsil Block Rank for cluster
development
Rank for grade
cattle
Barpeta Kalgachia Mandia 1 1
Barpeta Kalgachia Rupsi 2 2
Barpeta Sarthebari Pakabetbari 1 1
Barpeta Sarthebari Sarukhetri 2 2
Barpeta Sarupeta Bhabanipur 1 1
Barpeta Sarupeta Bajali 2 2
Barpeta Sarupeta Jalah 3 3
Cachar Katigora No specific block
Cachar Lakhipur No specific block
Cachar Silchar No specific block No specific block
Cachar Sonai No specific block
Jorhat Jorhat East Jorhat 1
Jorhat Jorhat East Jorhat North West 2
Jorhat Jorhat East Kaliapani 3
Jorhat Jorhat West Jorhat 1
Jorhat Jorhat West Jorhat North West 2
Kamrup Palasbari Rampur 1
Kamrup Palasbari Rani 2
Kamrup Palasbari Chayani Barduar 3
Marigaon Mayong Mayong 1 1
Nagaon Dhing Juria 1
Nagaon Dhing Batadrawa 2
Nagaon Dhing Mairabari 3
Nagaon Hojai Jugijan 1
Nagaon Hojai Dhal Pukhuri 2
Nagaon Hojai Binnakandi 3
Nagaon Kampur Kathiatoli 1 1
Nagaon Kampur Kapili 2 2
Nagaon Lanka Dhal Pukhuri 1
Nagaon Lanka Binnakandi 2
Nagaon Lanka Lumding 3
Nagaon Lanka Udali 4
Nagaon Rupahi Juria 1
Nagaon Rupahi Laokhowa 2
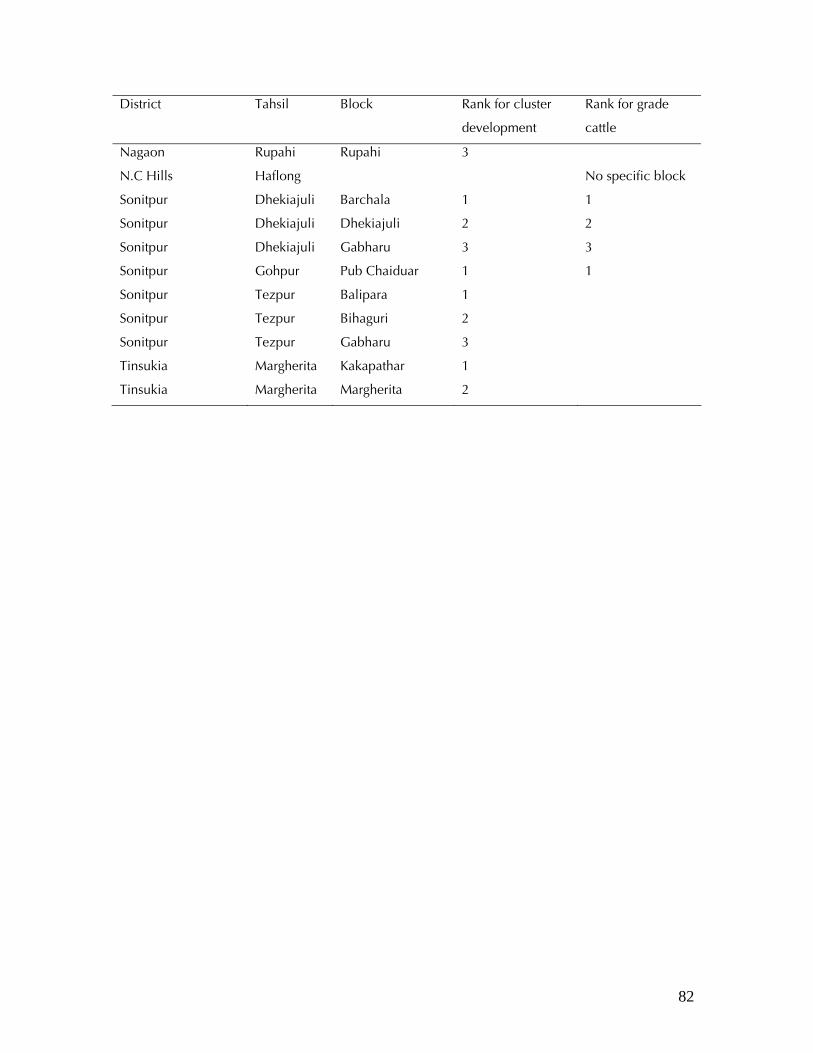
82
District Tahsil Block Rank for cluster
development
Rank for grade
cattle
Nagaon Rupahi Rupahi 3
N.C Hills Haflong No specific block
Sonitpur Dhekiajuli Barchala 1 1
Sonitpur Dhekiajuli Dhekiajuli 2 2
Sonitpur Dhekiajuli Gabharu 3 3
Sonitpur Gohpur Pub Chaiduar 1 1
Sonitpur Tezpur Balipara 1
Sonitpur Tezpur Bihaguri 2
Sonitpur Tezpur Gabharu 3
Tinsukia Margherita Kakapathar 1
Tinsukia Margherita Margherita 2

83
Indicative budget
This is a preliminary budget for implementing the action plan. Budget details are available from the Directorate of Dairy Development
Year 1 Year 2 Year 3 Year 4 Year 5
A. Generic promotion of milk consumption and quality awareness 9135000 7245000 2520000 2520000 2520000
B. Improving the performance of the milk market, both formal and
traditional.
Support to improving the milk quality and product mix in formal
milk processing.
6615000 14175000 3150000 3150000 3150000
Addressing low quality and performance of traditional small-scale
milk market agents.
10080000 6300000 4725000 4725000 1575000
Supporting improved traditional value addition (processing) 1890000 4095000 3150000 0 0
Establishing Facilitation Centre for Dairy Development 22648500 26523000 12978000 9828000 7308000
C. Supporting pro-poor smallholder dairy production systems
Developing capacity for a client-oriented and needs-based action
plan
12600000 3150000 3150000 12600000 3150000
Increasing the availability of dairy cross-bred cows 28350000 14175000 14175000 28350000 14175000
Equipping resource-poor producers to better manage their dairy
animals
12600000 5040000 5040000 12600000 5040000
Supporting small-scale milk market development. 12600000 5040000 5040000 12600000 5040000
Grand Total actions A, B and C 97933500 61173000 42903000 78498000 37233000
Grand total over 5-year period 31,7740500