Comprehensive Stroke Care Delivery Redesign Antonio Batiquin, ADN, RN1 • Aaron Bridges, MPH1...
98
Comprehensive Stroke Care Delivery Redesign South Carolina Heart and Stroke Care Alliance November 18, 2014
Transcript of Comprehensive Stroke Care Delivery Redesign Antonio Batiquin, ADN, RN1 • Aaron Bridges, MPH1...

Comprehensive Stroke Care Delivery Redesign
South Carolina Heart and Stroke Care Alliance
November 18, 2014

Disclosures
• This project was made possible by Grant Number 1C1CMS331043 from the Department of Health and Human Services, Centers for Medicare & Medicaid Services.
• The contents of this publication are solely the responsibility of the authors and do not necessarily represent the official views of the U.S. Department of Health and Human Services or any of its agencies.

CMS Innovations Grant Kenneth Gaines Disclosures
• Industry
– Lundbeck, REACH Health, In-Touch
• Government
– CDC
– CMS/CMMI
– NIH
– Louisiana Emergency Response Network Commissioner
CMS Innovations Grant

Acknowledgement
• Kenneth Gaines, MD, FAHA, MBA1
• Bethany Jennings, MN, FNP-C1
• Lynn Eckhardt, MSN, GNP-BC1
• Raymond Egger, BSN, RN, CNRN1
• Antonio Batiquin, ADN, RN1
• Aaron Bridges, MPH1
• Patricia Commiskey, DrPH, MA1
• Greg Dadlez, MHA1
• Michael Saucier, MS,MD, Fellow, AAPM&R1
• Ashley Wennerstrom, PhD, MPH2
1 Ochsner Medical Center, New Orleans, Louisiana
2 Tulane University School of Medicine, New Orleans, Louisiana
WHAT IS WRONG WITH STROKE CARE?
How do we fix it?
Improving Stroke Care
Adapt or perish, now as ever, is natures inexorable imperative.
HG Wells
CMS Innovations Grant
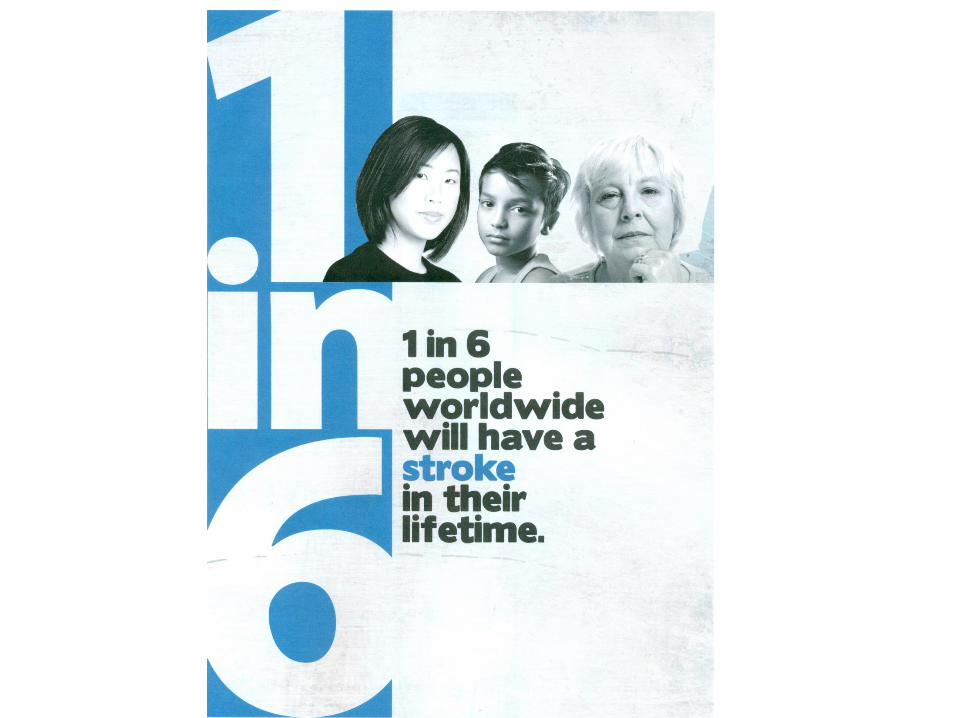

Epidemiology of Stroke Worldwide
• Every 6 seconds, stroke kills one person.
• Every other second, stroke attacks one person, regardless of age or gender.
• 15 million people experience stroke each year; 6 million of them do not survive.
• About 30 million people have had a stroke; most have residual disabilities.
• $36.5 Billion annually in cost for stroke in US.

Stroke
Stroke is a complex costly disease
Stroke is a time sensitive disease
Stroke is an acute then chronic disease
• The initial stroke is often devastating -- but can be minimized: – Urgent tPA + ASA treatment is effective
– Stroke units are effective.
• After the initial stroke risks are high for:
– Morbidity / Mortality / Complications
– Recurrent stroke / Hospital readmission
– Infection and cardiovascular disease including MI.
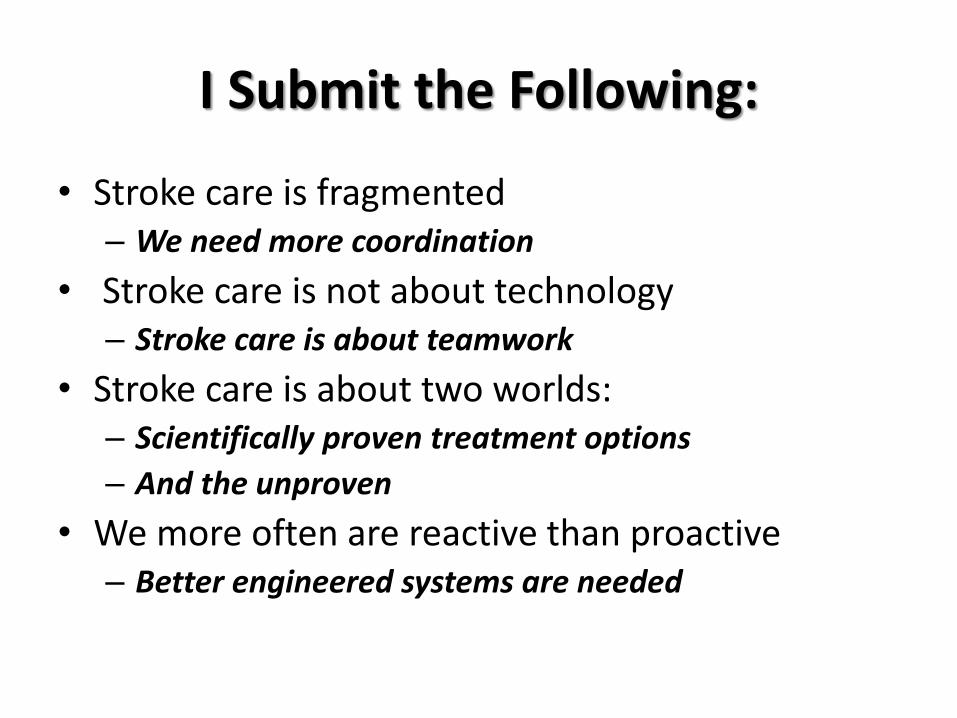
I Submit the Following:
• Stroke care is fragmented – We need more coordination
• Stroke care is not about technology – Stroke care is about teamwork
• Stroke care is about two worlds: – Scientifically proven treatment options
– And the unproven
• We more often are reactive than proactive – Better engineered systems are needed
Centers for Medicare Services Innovations Grants
Three legs of the stool:
Improve Outcomes
Decrease Cost
Train the Future Work Force

CMS Innovations Grant
Improving Stroke Care
What is wrong with stroke care?
What innovations can fix it?
Systems re-engineering
Telemedicine
Technology-enabled stroke care
Coordinated Care
CMS Grant
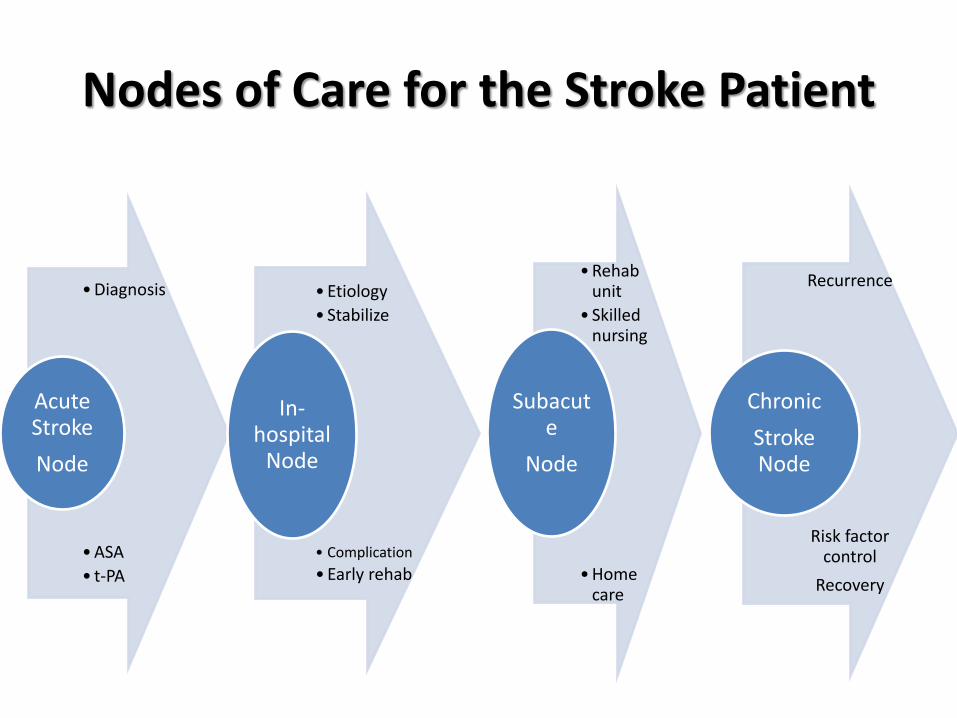
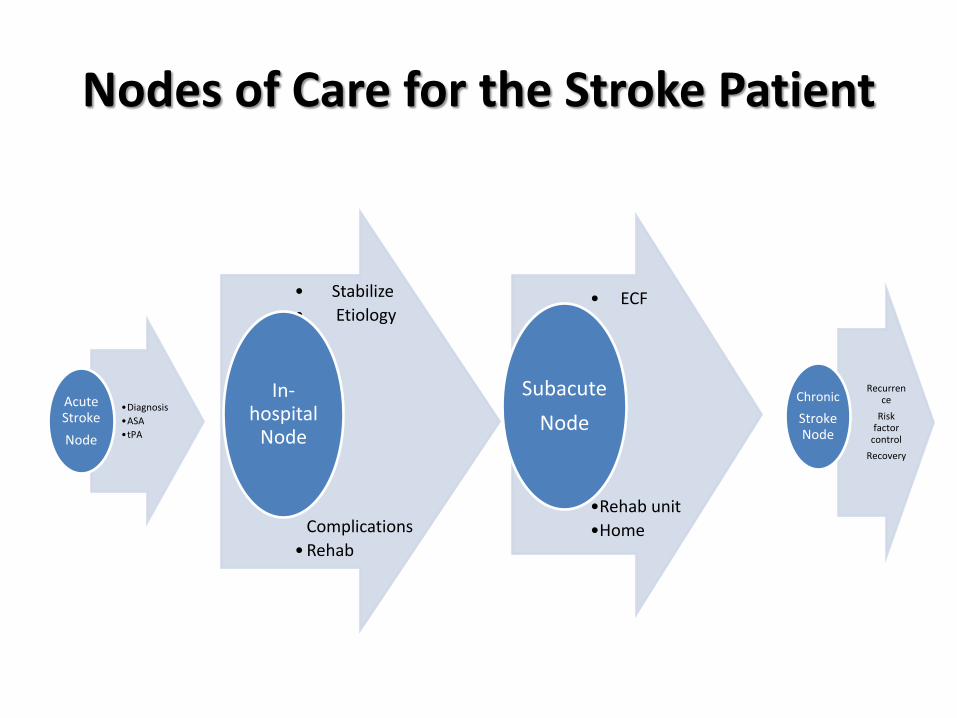
Nodes of Care for the Stroke Patient
• Diagnosis
• ASA
• t-PA
Acute Stroke
Node
• Etiology
• Stabilize
• Complication
• Early rehab
In-hospital
Node
• Rehab unit
• Skilled nursing
• Home care
Subacute
Node
Recurrence
Risk factor control
Recovery
Chronic
Stroke Node

Stroke Care
Acute Care Node

CMS Grant Stroke Care
Stroke Care Delivery
What is wrong with our acute stroke care delivery?
CMS Grant

Nodes of Care for the Stroke Patient
• Diagnosis
• BP mgt
• ASA
• tPA
Acute Stroke
Node
• Etiology
• Stabilize
• Early rehab
• Complications
In-hospital
Node
• Rehab unit
• Skilled nursing
• Home care
Subacute
Node
Recurrence
Risk factor control
Recovery
Chronic
Stroke Node

Cost Benefit Analysis Acute Stroke – What Works?
Risk Management RR Approximate
costs
Applicability Affordability
Lancet 1999;
354:1457-63
Per death or
dependency
avoided (AUS$)
Aspirin 15% $83 80% ALL
Stroke Unit 4-14% Depends on
hospital costs;
? nil
80% ++
Wardlow Lancet,
2012; Boudreau,
Stroke, 2014
mRS
= 0-2
Lifetime cost
savings
Applicability Affordability
Thrombolysis 53% +25,000 (tPA) 10% ++++
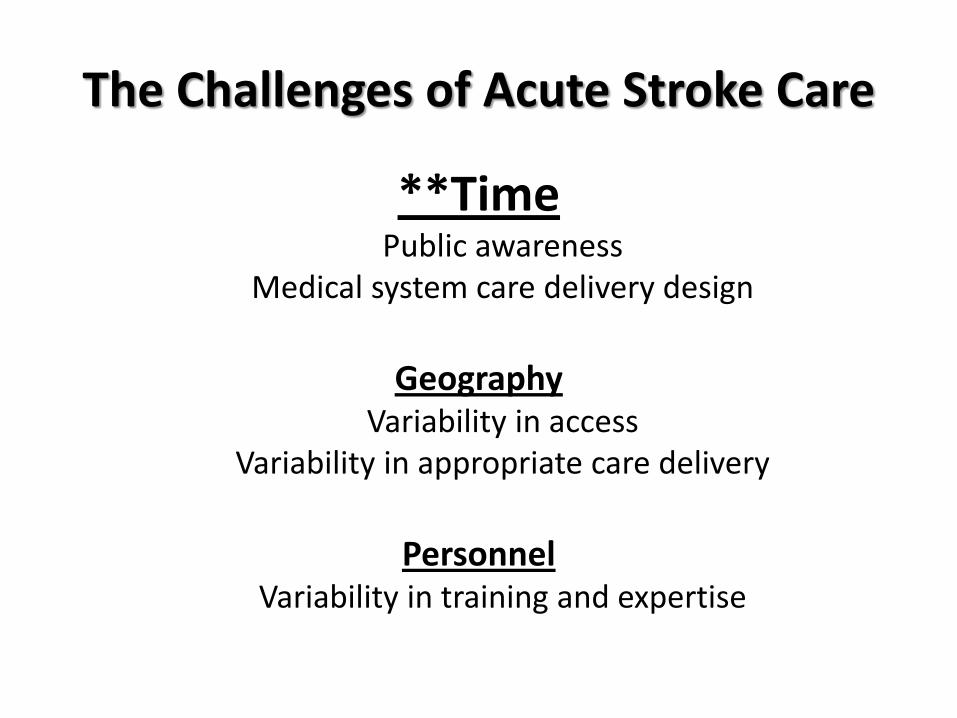
The Challenges of Acute Stroke Care
**Time Public awareness
Medical system care delivery design
Geography
Variability in access Variability in appropriate care delivery
Personnel
Variability in training and expertise
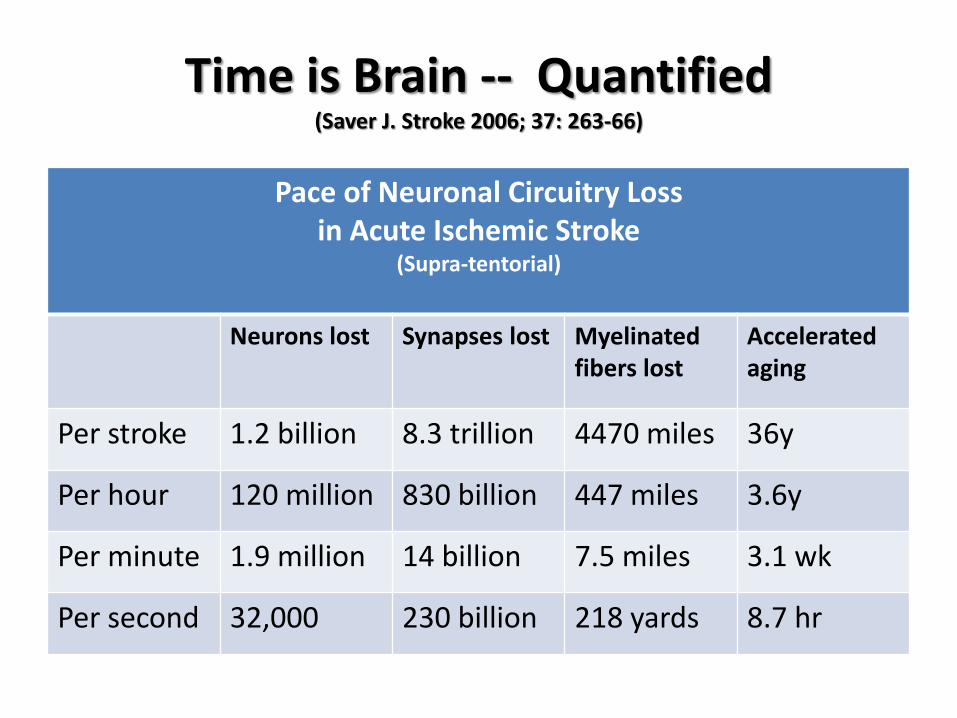
Time is Brain -- Quantified (Saver J. Stroke 2006; 37: 263-66)
Pace of Neuronal Circuitry Loss in Acute Ischemic Stroke
(Supra-tentorial)
Neurons lost Synapses lost Myelinated fibers lost
Accelerated aging
Per stroke 1.2 billion 8.3 trillion 4470 miles 36y
Per hour 120 million 830 billion 447 miles 3.6y
Per minute 1.9 million 14 billion 7.5 miles 3.1 wk
Per second 32,000 230 billion 218 yards 8.7 hr

Meta-analysis of Randomized Trials (Emberson J. Lancet August 2014)
• Stroke Thrombolysis Trialists’ Collaborative group • 6756 patients; 9 trials • Outcome: Good outcome with no significant disability at 3-6 months, mRS 0 or
1.
• For every 100 patients treated additional 10 have full recovery.
• Treatment within 3 hr. – Good outcome 32.9% VS 23.1%
– OR 1.75 95% CI 1.35-2.27
• Type 2 parenchymal hemorrhage, symptomatic – 6.8% VS 1.3%
– OR 5.55 95% CI 4.01-7.70 p<0.0001

TPA for Acute Stroke Report Card
• How are we doing in providing tPA to acute stroke cases?
Better in some centers
Overall poor 3-5% delivery

What is wrong with acute stroke care?
Time Public awareness
Medical system care delivery design
Geography ** Variability in access
Personnel
Variability in training and expertise

Stroke Care: Geographic Mal-distribution
• US Hospitals < 100 beds (AHA) – >50% are in rural areas
– Limited radiology and neurology
• 64% of US hospitals did not give tPA – Based on Medpar data over a 2 year period 2005-7.
• 40% of US population reside in counties without a hospital that administered tPA
• To at least 2.5% of its patients with stroke.
• Kleindorfer D. et al. Stroke 2009;40:3580-84.

Hospital Distribution VS Rt-PA Utilization by Hospital MEDPAR Database
(Stroke 2009; 40:3508=84)

Mal-distribution of US Stroke Centers

What is wrong with acute stroke care?
Time Public awareness
Medical system care delivery design
Geography
Variability in access Variability in delivery of appropriate care
Personnel** Variability in training and expertise
Variability in delivery of appropriate care

Stroke Care: Geographic Mal-distribution
• US Neurologists 10,038 in 2000 (AAN).
–83.7% adult
–42.3% involved in stroke care
–47% felt comfortable or promoted tPA for acute stroke cases
–20% of population have no neurological services.

Accuracy of Stroke Diagnosis (Hand, PJ. Stroke, 2006)
• Observational prospective study: urban teaching hospital. • 336 patients with 350 presentations.
• Final diagnosis: Stroke 69% Stroke mimic in 31% • Stroke mimic diagnoses included:
– Seizure 21.1% – Sepsis 12.8% – Toxic/metabolic 11.0% – Space occupying lesion 9.2% – Acute confusional state 6.4% – Acute mononeuropathy 5.5% – Functional/medically unexplained 5.5% – Dementia 3.7% – Migraine 2.8% – Spinal cord lesion 2.8% – Other 3.7%

Acute Stroke Care Report Card
It is not that we are doing nothing
It is that what we are doing is not working well enough
Thus the opportunity to innovate

TELEMEDICINE SOLUTION?
Acute Stroke Care Deficiencies

Science and Invention 1924 “Specialists Brought to Every Town”
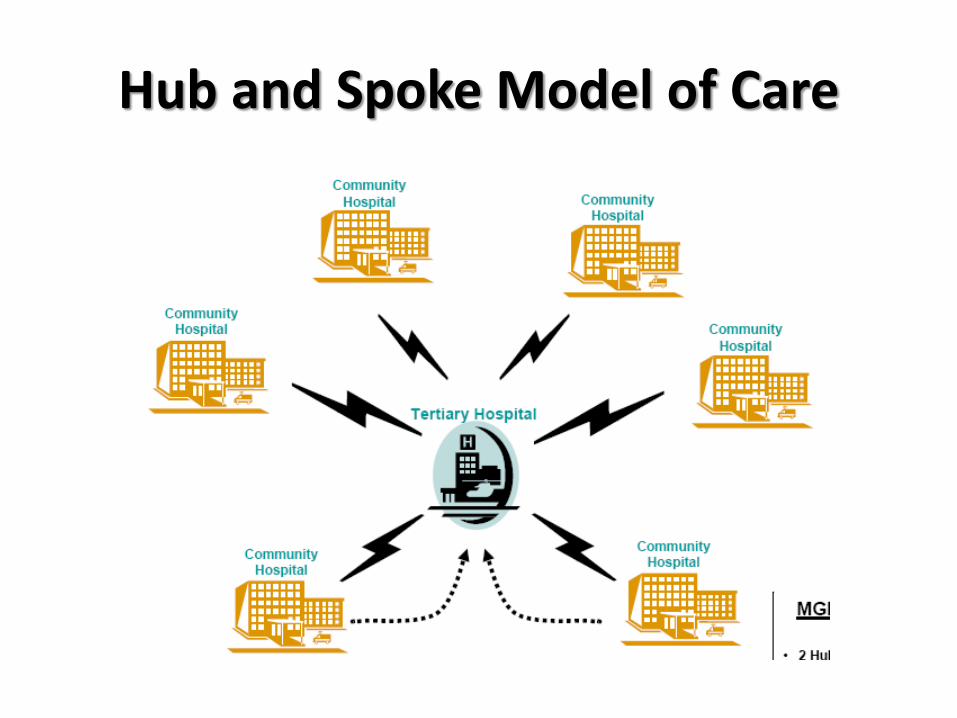
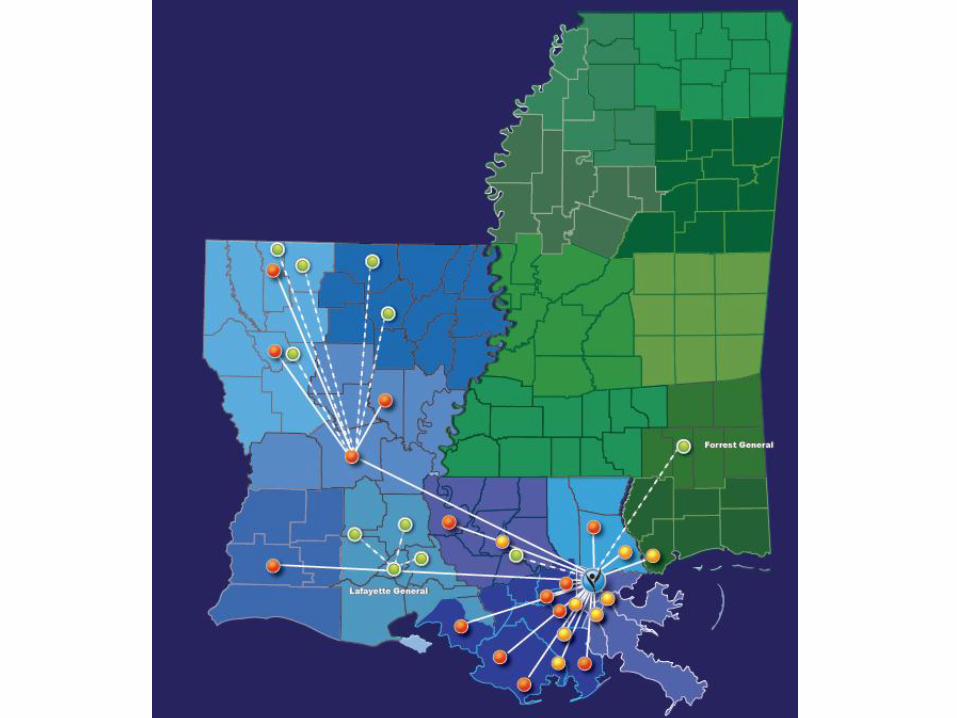
Hub and Spoke Model of Care
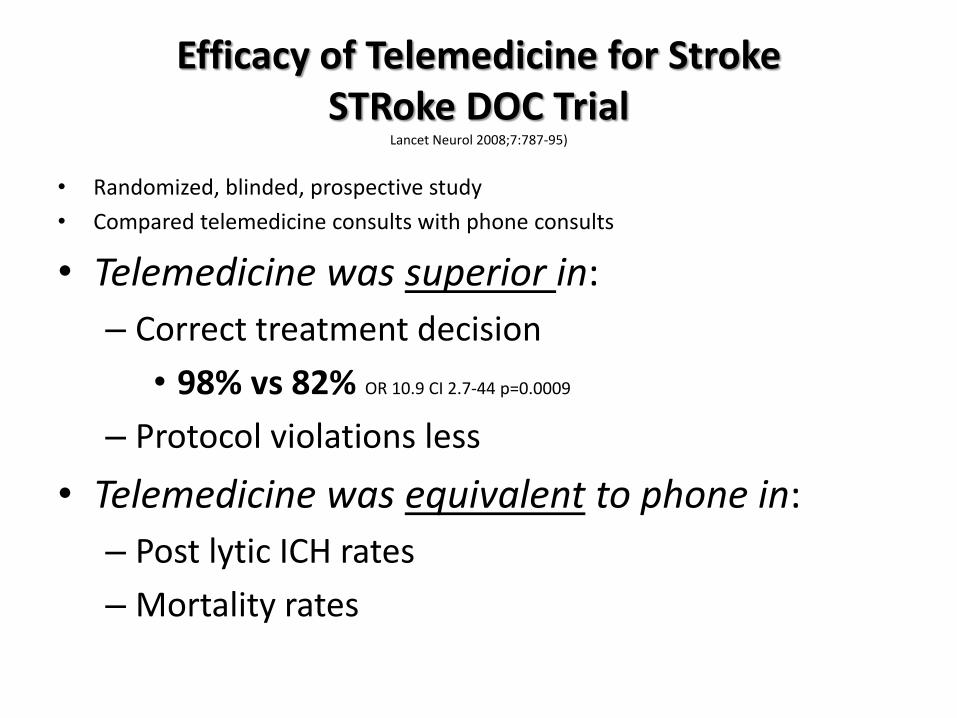
Efficacy of Telemedicine for Stroke STRoke DOC Trial
Lancet Neurol 2008;7:787-95)
• Randomized, blinded, prospective study
• Compared telemedicine consults with phone consults
• Telemedicine was superior in:
– Correct treatment decision
• 98% vs 82% OR 10.9 CI 2.7-44 p=0.0009
– Protocol violations less
• Telemedicine was equivalent to phone in:
– Post lytic ICH rates
– Mortality rates

Telestroke Cost Effectiveness
(Nelson RE. Neurol 2011; 77:1590-98)
• Decision-analytic model at 90-day and lifetime horizon
• Quality-adjusted life years (QUALYs) along with costs to generate incremental cost-effectiveness ratio (ICERs)+
• ICER/QUALY – 90-day $108,363
– Lifetime $2,449
• ICER/QUALY Ratio <$50,000/QUALY* – 90-day 37.5%
– Lifetime 99.7% • *Commonly accepted as cost effective in US
• + Monte Carlo simulations

69.50%
61%
56.20%
42.90%
13.30%
5.70%
0.0% 10.0% 20.0% 30.0% 40.0% 50.0% 60.0% 70.0% 80.0%
Credentialing
Inability to bill for services rendered
Physicians lack incentives to use it
Lack of Physician Understanding
Patient quality of care issues
Patients do not like it
Barriers to Telehealth Implementation Percentage of Physicians Identifying Statement as a Barrier n=106
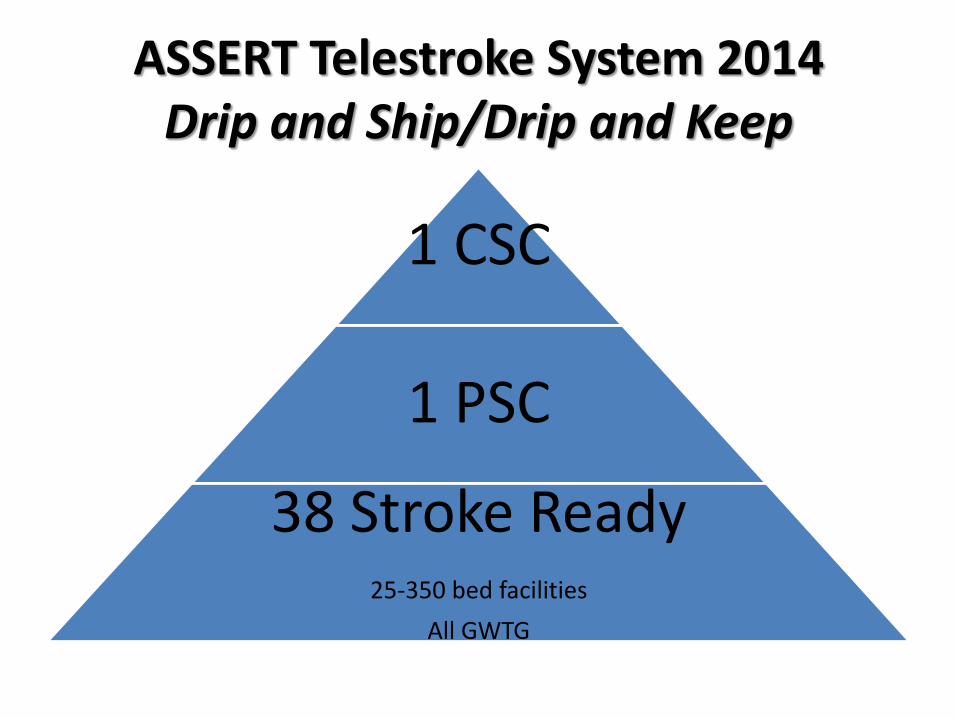
ASSERT Telestroke System 2014 Drip and Ship/Drip and Keep
1 CSC
1 PSC
38 Stroke Ready 25-350 bed facilities
All GWTG

Ischemic Stroke rtPA Administration Rates
(Pre- and Post-Telestroke)
Hub and spoke hospital ischemic stroke rtPA administration
rates: 6 months pre-telestroke compared to a recent 6 month
period post-telestroke

What does Telemedicine Offer?
• More accurate diagnosis
• Increased utilization of proven therapies
• Improved triage
• Encourage guideline based care
• Better utilization of vascular neurologists
• Opportunity to partner
• Opportunity to impact care quality
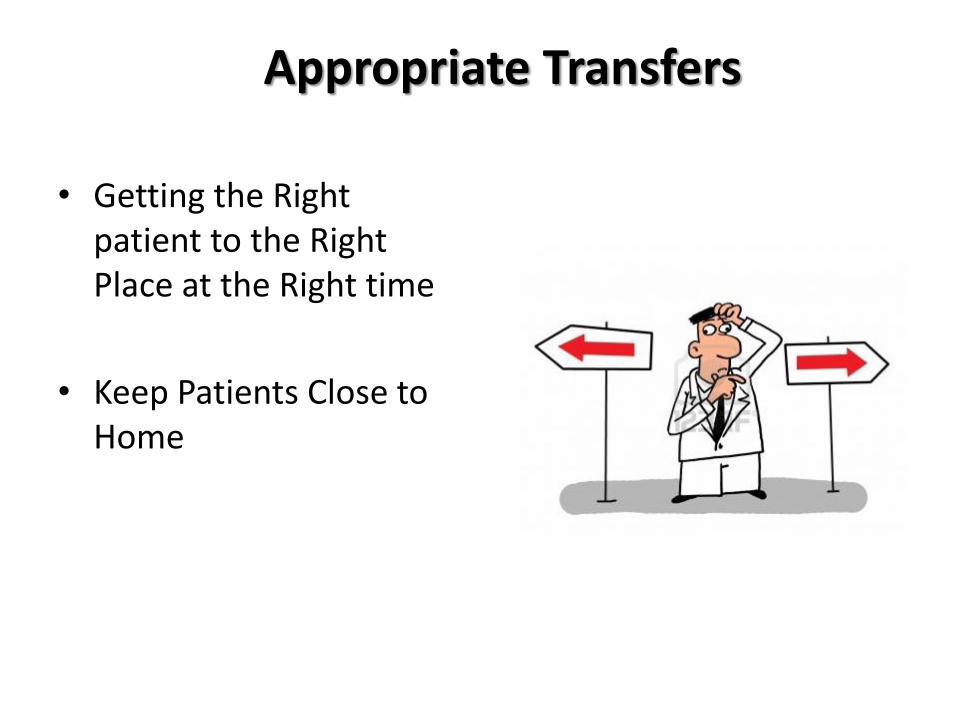
Appropriate Transfers
• Getting the Right patient to the Right Place at the Right time
• Keep Patients Close to Home
Stroke Care
In-Hospital Node
Nodes of Care for the Stroke Patient
•Diagnosis
•ASA
•tPA
Acute Stroke
Node
• Stabilize
• Etiology
•
•
•
• Complications
• Rehab
In-hospital
Node
• ECF
•
•Rehab unit
•Home
Subacute
Node
Recurrence
Risk factor
control
Recovery
Chronic
Stroke Node

ONGOING CARE POST STROKE IS IMPORTANT
Stroke patients remain at risk after their incident stroke

Inpatient Complications of Stroke Langhorne P. Stroke 2000;31:1223-29
Complications occurred in 85% of cases
Types of complications
– Neurological worsening
– Medical
– Morbidity-related

Complications within 7 days of onset
% Occurrence 1254 patients
Disability Adjusted life years Lost
Neurological 21.1%
Stroke progression 17.1%
Medical 24.2%
Pneumonia 12.0%
Multi-variant Predictor of poor outcome OR 95% CI
Neurological 5.47 (3.63-8.24)
2.15 (1.72-2.59)
Medical 3.47 (2.30-5.23)
1.99 (1.59-2.40
Stroke progression 7.48 (4.73-11.84)
Hemorrhagic transformation 3.57 (1.33-9.56)
Pneumonia 4.44 (2.20-8.99)
Extra-cranial bleeding 4.45 (1.88-10.53) Hong KS.
Eur J Neurol 2008;15:1324-31 Stroke 2010;41:1758-65
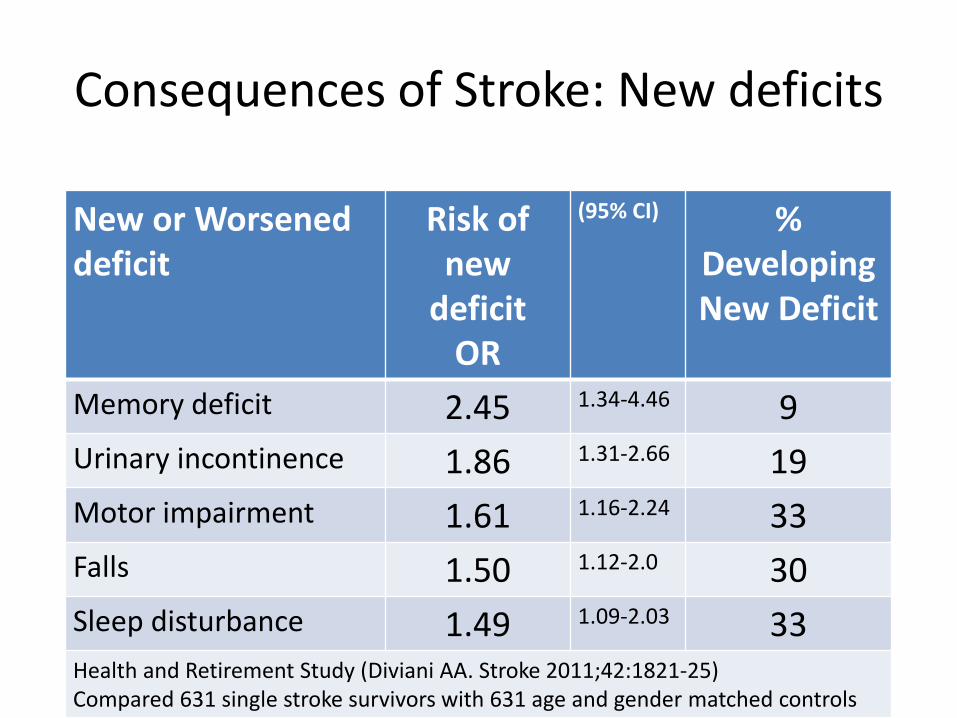
Consequences of Stroke: New deficits
New or Worsened deficit
Risk of new
deficit OR
(95% CI) % Developing New Deficit
Memory deficit 2.45 1.34-4.46 9
Urinary incontinence 1.86 1.31-2.66 19
Motor impairment 1.61 1.16-2.24 33
Falls 1.50 1.12-2.0 30
Sleep disturbance 1.49 1.09-2.03 33 Health and Retirement Study (Diviani AA. Stroke 2011;42:1821-25) Compared 631 single stroke survivors with 631 age and gender matched controls

In-Hospital Mortality for Stroke National Inpatient Database 2006-10
(Naderi N. AAN, 2013)
• 2,567,100 admitted with diagnosis of stroke – 82% ischemic 52% female – 70% White Mean age 71 years
• Co-mobidities: – Hypertension 77% Hyperlipidemia 41% – Diabetes 31% CAD 24% – A fib 21% Smoking 21%
• Mortality: –Overall 8.42% –5.43% ischemic –22.35% hemorrhagic
Solution to Lower Complications?
Stroke units
Stroke Central
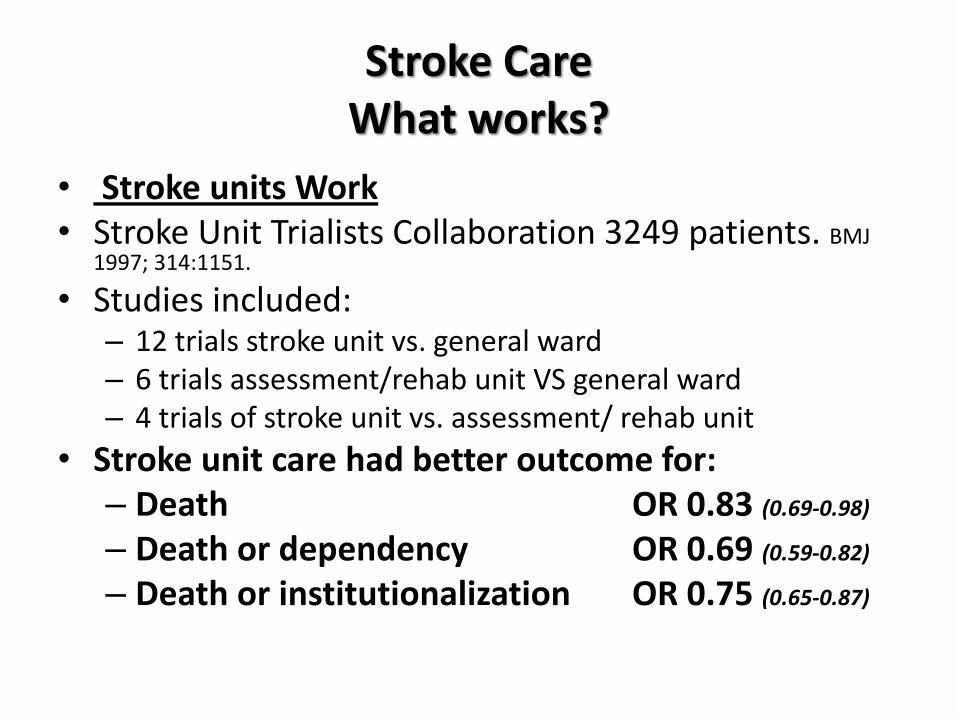
Stroke Care What works?
• Stroke units Work • Stroke Unit Trialists Collaboration 3249 patients. BMJ
1997; 314:1151.
• Studies included: – 12 trials stroke unit vs. general ward – 6 trials assessment/rehab unit VS general ward – 4 trials of stroke unit vs. assessment/ rehab unit
• Stroke unit care had better outcome for: – Death OR 0.83 (0.69-0.98)
– Death or dependency OR 0.69 (0.59-0.82)
– Death or institutionalization OR 0.75 (0.65-0.87)

Stroke Care Report Card
Are we implementing stroke unit care?
NO
• % of hospitals with stroke unit – UNDER USED – US 18% (Goldstein, L. Stroke 2000; 31:66-70).
– 23% Australia – 50% UK – 80% Scandinavian countries – 5% Japan
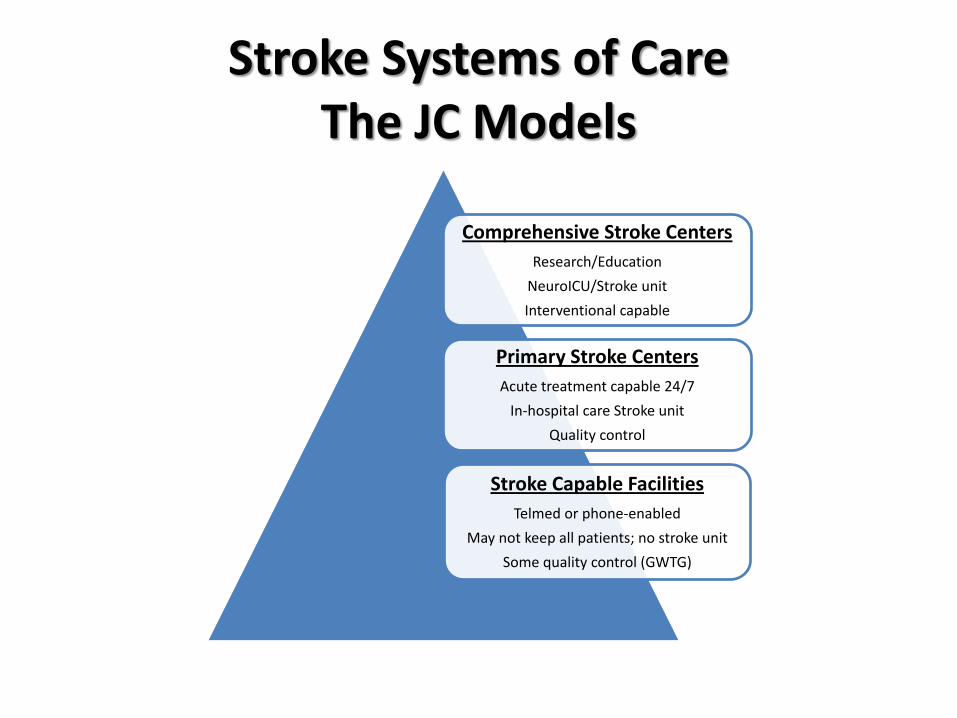
Stroke Systems of Care The JC Models
Comprehensive Stroke Centers
Research/Education
NeuroICU/Stroke unit
Interventional capable
Primary Stroke Centers
Acute treatment capable 24/7
In-hospital care Stroke unit
Quality control
Stroke Capable Facilities
Telmed or phone-enabled
May not keep all patients; no stroke unit
Some quality control (GWTG)
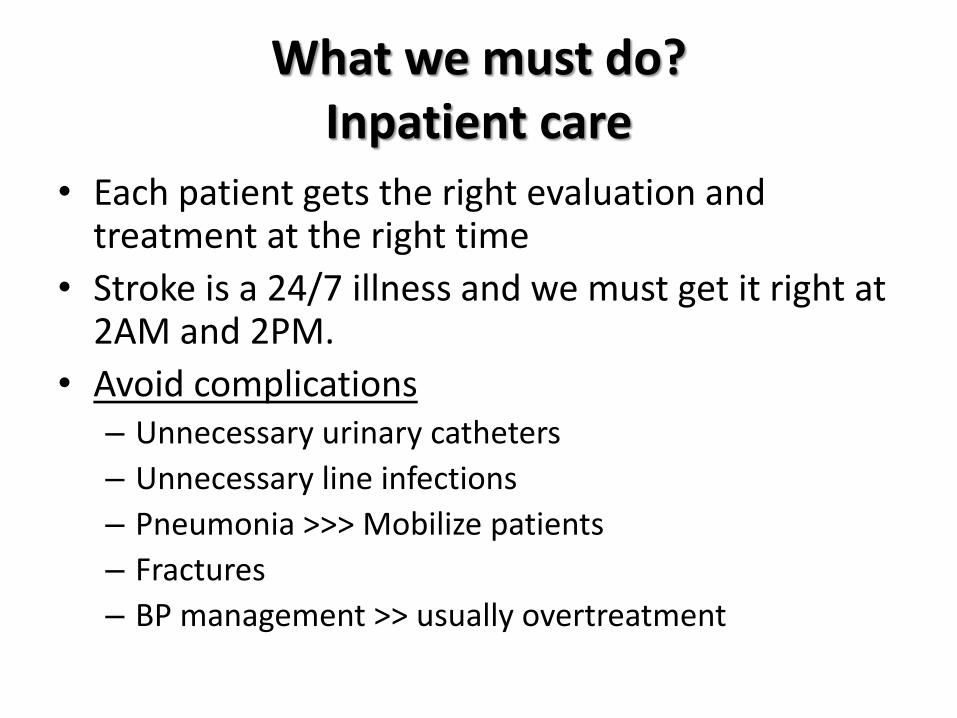
What we must do? Inpatient care
• Each patient gets the right evaluation and treatment at the right time
• Stroke is a 24/7 illness and we must get it right at 2AM and 2PM.
• Avoid complications – Unnecessary urinary catheters
– Unnecessary line infections
– Pneumonia >>> Mobilize patients
– Fractures
– BP management >> usually overtreatment
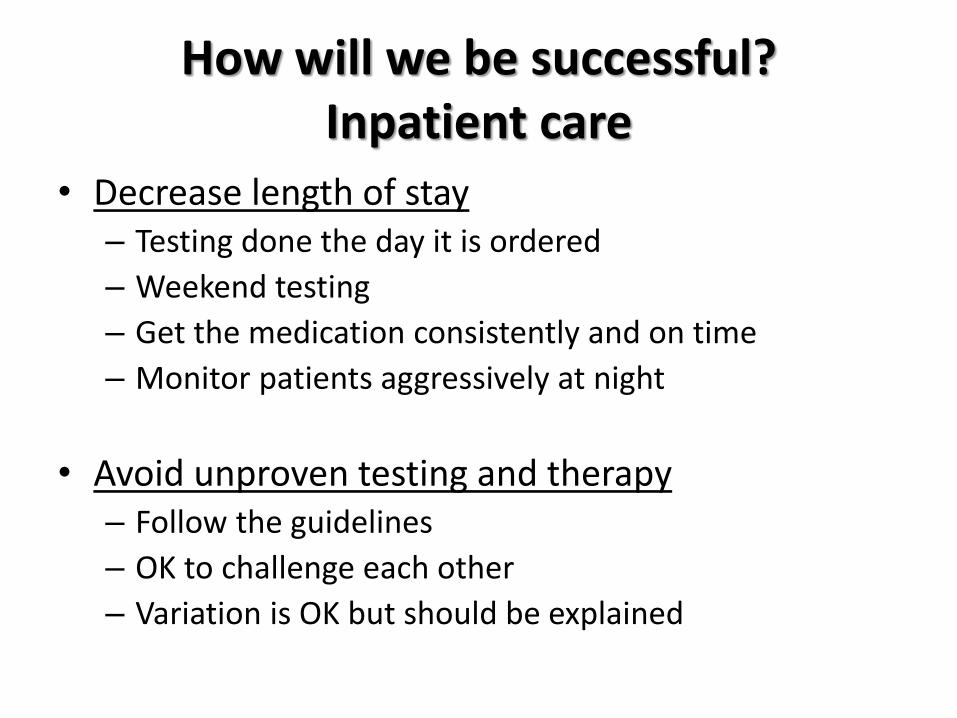
How will we be successful? Inpatient care
• Decrease length of stay – Testing done the day it is ordered
– Weekend testing
– Get the medication consistently and on time
– Monitor patients aggressively at night
• Avoid unproven testing and therapy – Follow the guidelines
– OK to challenge each other
– Variation is OK but should be explained
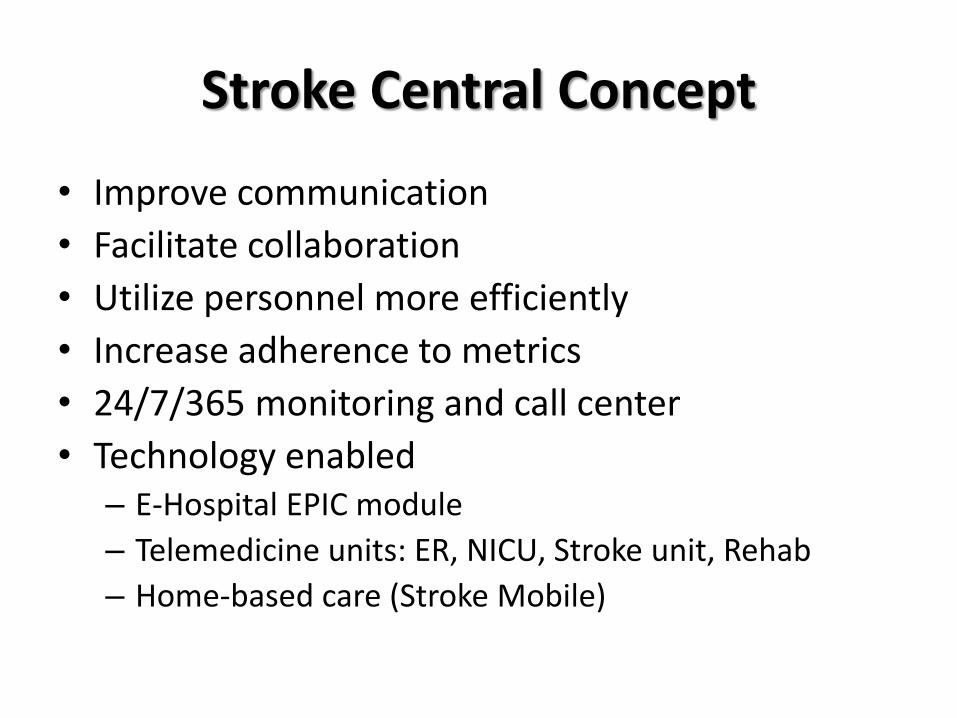
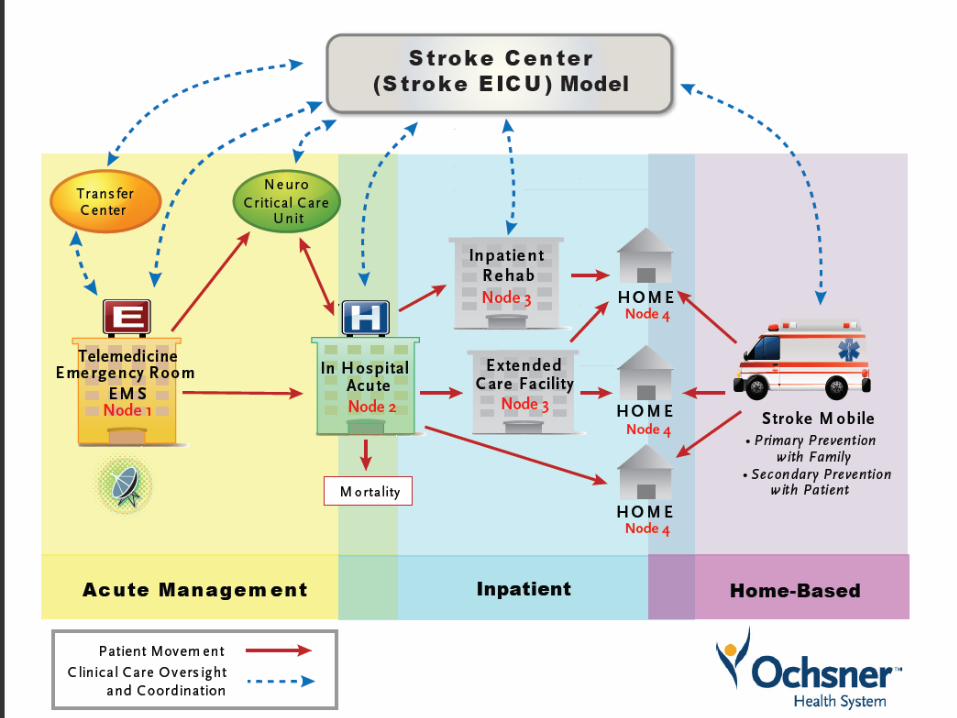
Stroke Central Concept
• Improve communication
• Facilitate collaboration
• Utilize personnel more efficiently
• Increase adherence to metrics
• 24/7/365 monitoring and call center
• Technology enabled – E-Hospital EPIC module
– Telemedicine units: ER, NICU, Stroke unit, Rehab
– Home-based care (Stroke Mobile)

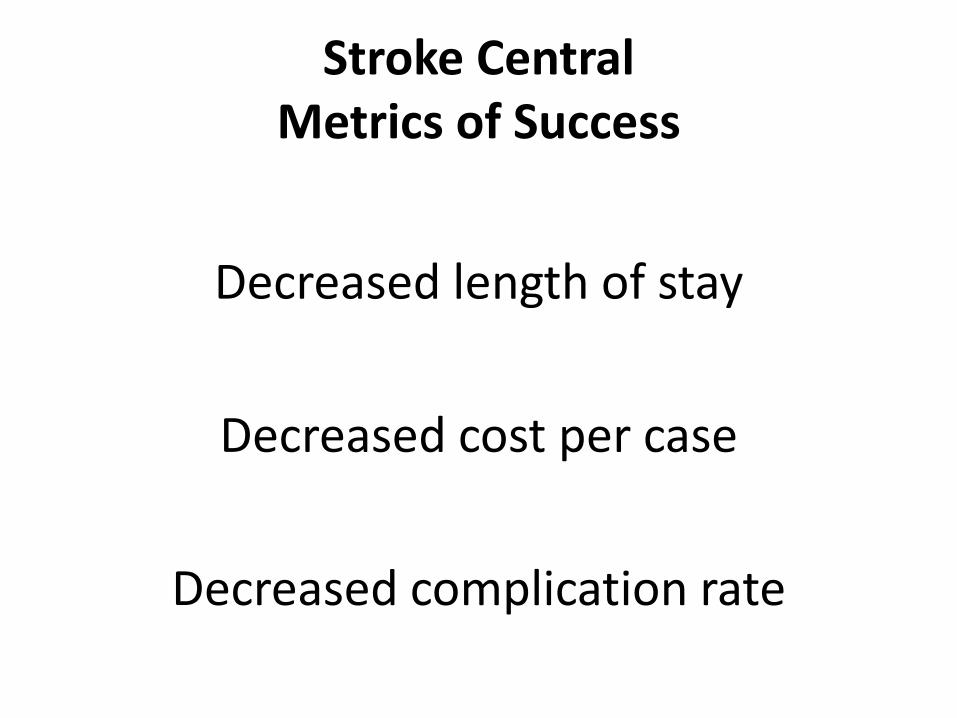
Stroke Central Metrics of Success
Decreased length of stay
Decreased cost per case
Decreased complication rate
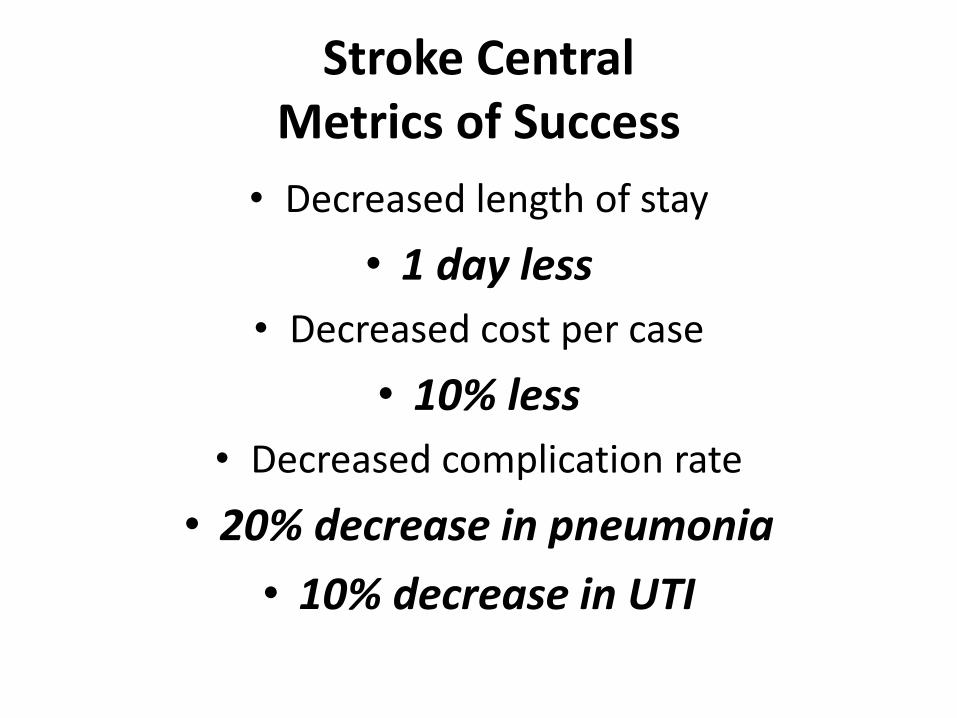
Stroke Central Metrics of Success
• Decreased length of stay
• 1 day less
• Decreased cost per case
• 10% less
• Decreased complication rate
• 20% decrease in pneumonia
• 10% decrease in UTI
Post Stroke Care Delivery
Recurrence
Readmission
Risk Factor Management

Nodes of Care for the Stroke Patient
• Diagnosis
• ASA
• tPA
Acute Stroke
Node
• Etiology
• Stabilize
• Early rehab
• Complications
In-hospital
Node
• Rehab unit
• Skilled nursing
• Home care
Subacute
Node
Recurrence
Risk factor control
Recovery
Chronic
Stroke Node

What happens after stroke? (Neuroepidemiology 1999; 18:75-84)
• Community-based study in Netherlands
– 25% die in the first month.
– Cumulative mortality rates
• 1st year 37%
• 2nd year 46%
• 3rd year 54%
– Risk of death 2x general population over 3 years
• 70% died from cardiovascular diseases, complications of stroke, or recurrent stroke
• Stroke severity, age, atrial fibrillation, and CHF predicted mortality
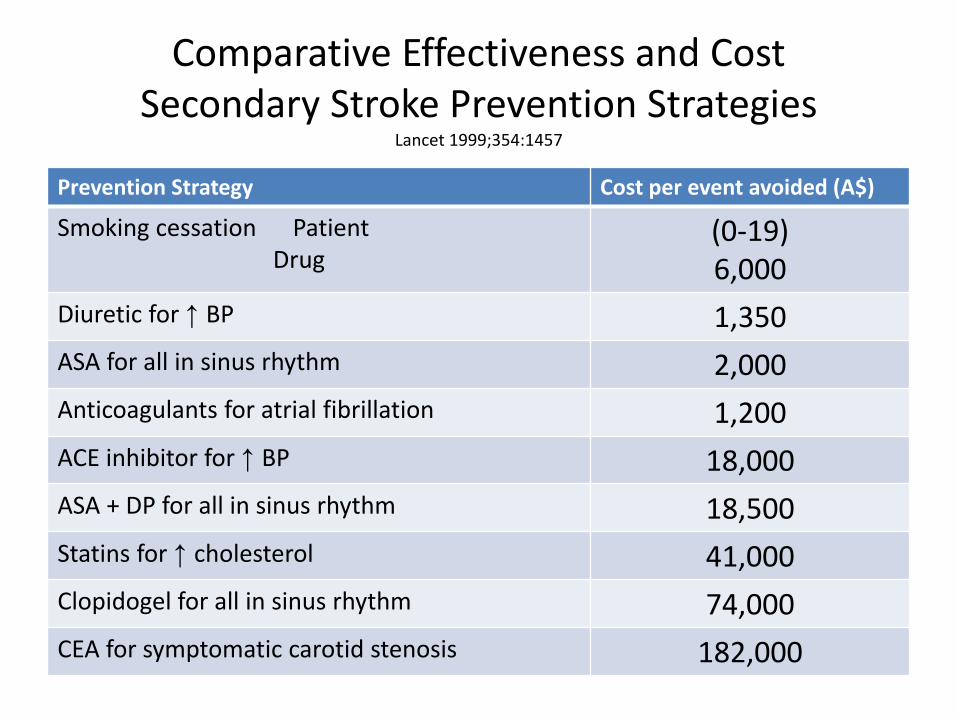
Comparative Effectiveness and Cost Secondary Stroke Prevention Strategies
Lancet 1999;354:1457
Prevention Strategy Cost per event avoided (A$)
Smoking cessation Patient Drug
(0-19) 6,000
Diuretic for ↑ BP 1,350
ASA for all in sinus rhythm 2,000
Anticoagulants for atrial fibrillation 1,200
ACE inhibitor for ↑ BP 18,000
ASA + DP for all in sinus rhythm 18,500
Statins for ↑ cholesterol 41,000
Clopidogel for all in sinus rhythm 74,000
CEA for symptomatic carotid stenosis 182,000

Effectiveness of Secondary Prevention Efforts Secondary
Prevention
Quality Indicator % Adherence in
Eligible Patients
Quality Issue
Hypertension On Treatment 80% Under use
Controlled 27-44%
Hyperlipidemia On treatment 47% Under use
Controlled 42%
Cigarette smoking Advised to quit 100% Appropriate
Advice
documented 67% Under use
% stopped 0% Ineffective; short
term studies
Diabetes mellitus On treatment 76% Under use
Controlled 30%
Mouradian. Stroke; 2002; 33:1656-1659. Kernan, W. Stroke 2000;31:415-419. Joseph,
LN. Stroke 1999;30:16-20. VISP, Neurol 2006.

NOT GOOD ENOUGH
How good are we at secondary stroke prevention?

Challenges in Chronic Stroke Care
• What is wrong with what we have? – Secondary stroke prevention
• Big dividend interventions are hard: – Smoking cessation
– Weight loss
– Dietary changes
• Big dividend interventions require intrinsic lifestyle changes
• Family is often not involved
• Episodic care in offices not effective
• Rehab units are expensive.

Stroke Risk Factors Targeted Interventions
• Inherited factors – Can’t change > Manage
– BP susceptibility – Diabetes susceptibility
• Lifestyle factors – Family interventions
– Smoking – Obesity – Adherence to medical regimen
• Environmental factor– Family interventions
– Socioeconomic – Cultural
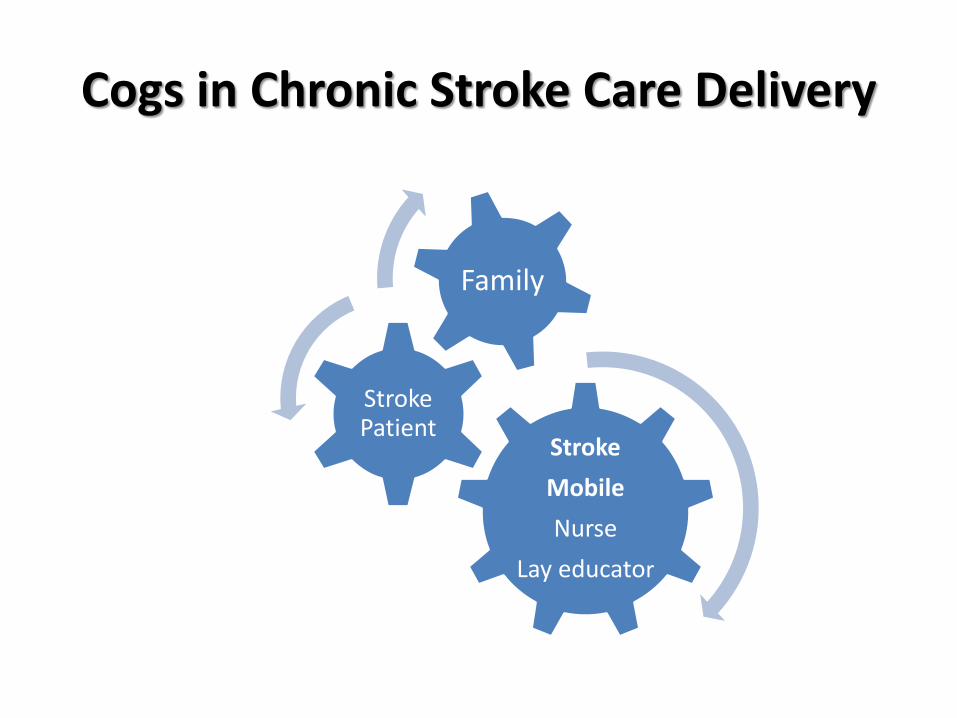
Cogs in Chronic Stroke Care Delivery
Stroke
Mobile
Nurse
Lay educator
Stroke Patient
Family
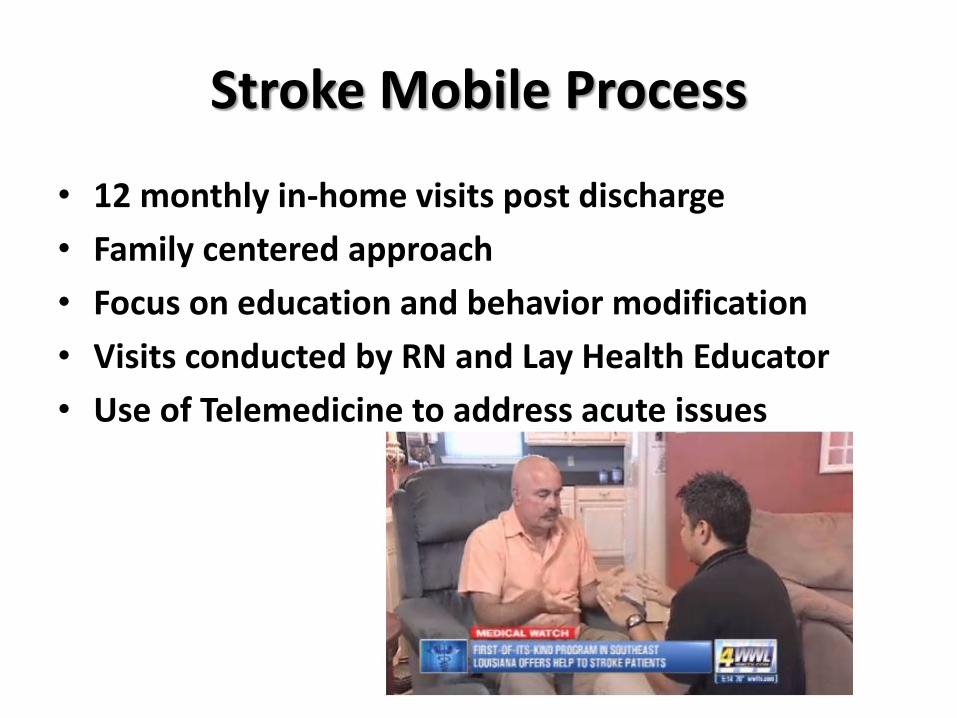
Stroke Mobile Process
• 12 monthly in-home visits post discharge
• Family centered approach
• Focus on education and behavior modification
• Visits conducted by RN and Lay Health Educator
• Use of Telemedicine to address acute issues
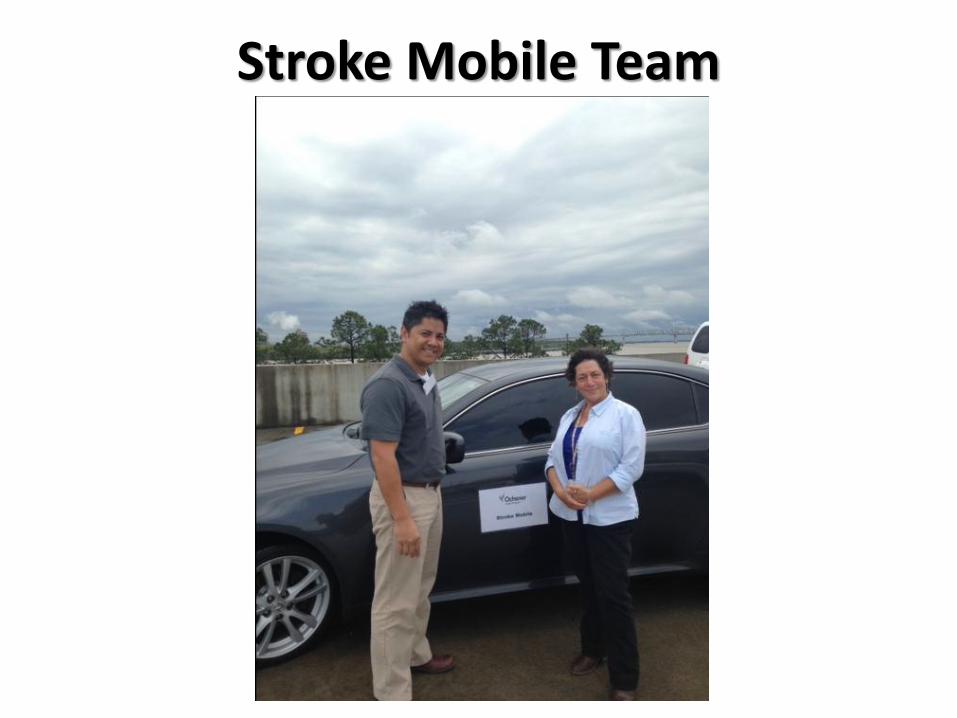
Stroke Mobile Team
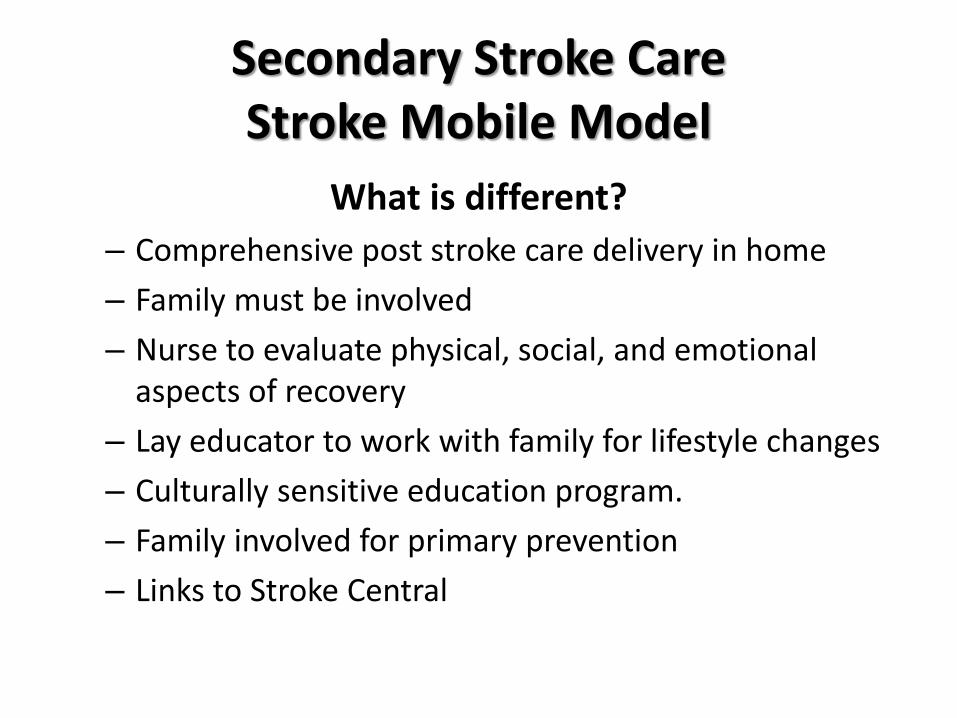
Secondary Stroke Care Stroke Mobile Model
What is different?
– Comprehensive post stroke care delivery in home
– Family must be involved
– Nurse to evaluate physical, social, and emotional aspects of recovery
– Lay educator to work with family for lifestyle changes
– Culturally sensitive education program.
– Family involved for primary prevention
– Links to Stroke Central

CMS Grant Outcomes
• ER/EMS > Telestroke – tPA delivery – Transport times
• Inpatient > Stroke Central – Mortality – Complications – Cost per case/ length of stay
• Outpatient > Stroke Mobile – 30-day mortality / 30-day mRankin – Readmission/ Recurrence rate
• Continuum of care – 1-year bundled cost per case

Stroke Central / Stroke Mobile Preliminary Results
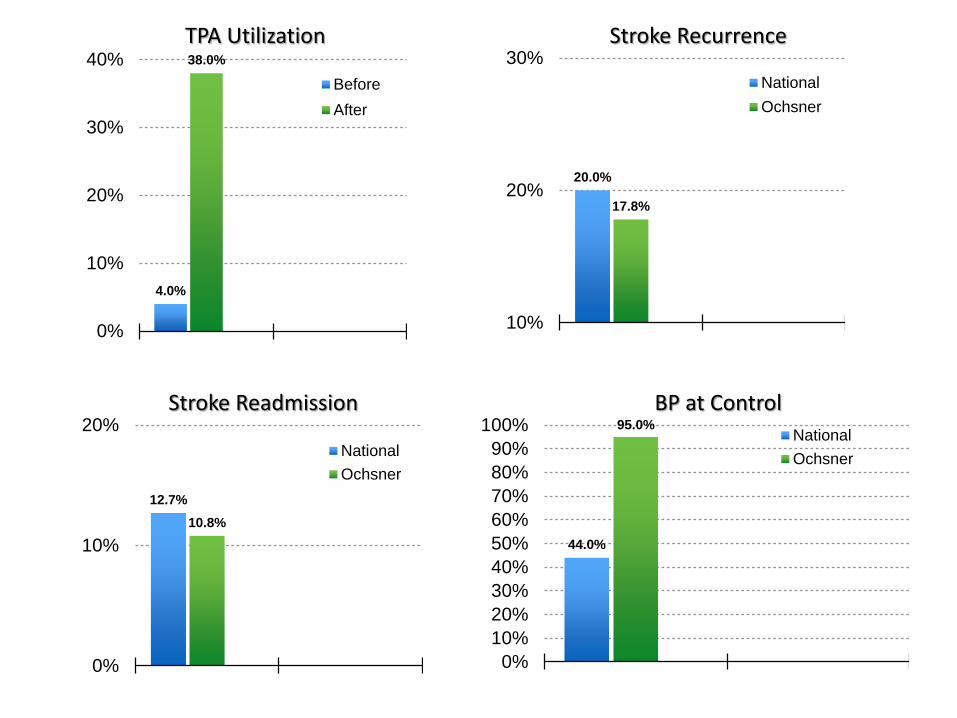
What is wrong with stroke care delivery? National data Stroke Central/Stroke Mobile Project
Complications occur in 85% of in-hospital strokes UTI ↓ by 19% (1 day)
Stroke recurrence occurs in 20% of cases in 90 days ↓ by 11%
Stroke readmission occurs in 12.7% of cases ↓ by 15%
tPA utilization in 5% of cases By 300%↑
Cost per case ↓Total direct cost 8%
On Treatment Controlled Controlled
BP management 80% 27-44% 95% Smoking cessation
67% 15% 57%
Statin 47% 42% 80% Diabetes 76% 30% 85%
4.0%
38.0%
0%
10%
20%
30%
40%
Before
After
20.0%
17.8%
10%
20%
30%
National
Ochsner
TPA Utilization Stroke Recurrence
12.7%
10.8%
0%
10%
20%
National
Ochsner
Stroke Readmission
44.0%
95.0%
0%
10%
20%
30%
40%
50%
60%
70%
80%
90%
100%National
Ochsner
BP at Control

Stroke Central Financials

What does the future ask of us? A lot but nothing we can’t do
• Get it right the first time – Diagnosis – Procedure – Medication
• Be proactive – Encourage your team to be proactive – Don’t react to problems>> prevent them
• Recognize and correct errors • Don’t be complacent • Ask for help >> This is a team effort • Be time conscious
– Tomorrow may not be as good as today
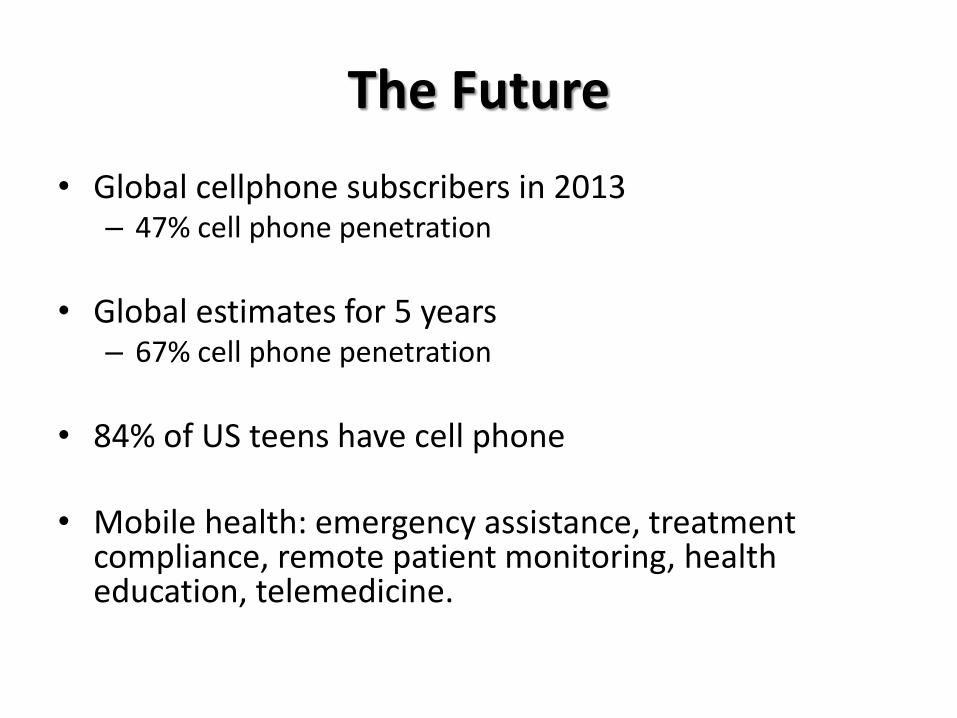
The Future
• Global cellphone subscribers in 2013 – 47% cell phone penetration
• Global estimates for 5 years
– 67% cell phone penetration
• 84% of US teens have cell phone
• Mobile health: emergency assistance, treatment
compliance, remote patient monitoring, health education, telemedicine.

Telehealth Goals
• Four primary targets
Improve clinical outcomes (ED visits, readmissions, health status)
Lower costs of care
Patient/family satisfaction
Improve access to care

Telehealth: Higher Quality of Life and Lower Cost Q
ual
ity
of
Life
Home Care
Residential Care
Acute Care
Estimated Cost of Care/Day
$10,000 $1,000 $100 $10 $1
Ageing in Place
Chronic Disease Management
Independent, Healthy Living
Skilled Nursing Facility
Assisted Living Rehabilitation
Community Hospital
Specialty Clinic
ICU

Multiple
Diseases
Chronically III
Single Diseases
Chronically III
(Stroke, CHF, DM)
Healthy Transiently III
(Flu, VTE, Ear Ache)
Population Medical Segments
Minimize readmission Minimize recurrence Primary care and Specialty based Intensive home monitoring Home based care
Improved outcome Reduce cost Minimize readmission & recurrence Risk factor management Hub and spoke consultation
ER, hospital Home care Specialty based
Base of access Disease prevention Transient disease care at lowest cost
Kiosk Home Workplace
Medical home-primary care based Direct to consumer American well

What is percent of primary care visits in Denmark
currently conducted via telemedicine?
Just the Facts
What is percent of primary care visits in Denmark
currently conducted via telemedicine?
80%
Just the Facts
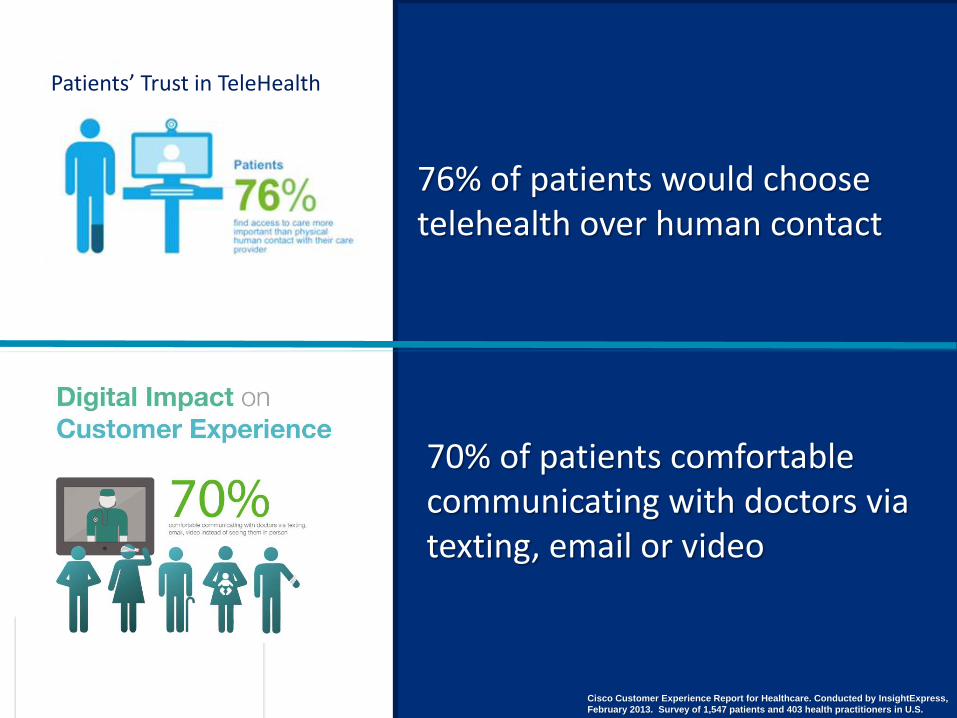
76% of patients would choose telehealth over human contact
Cisco Customer Experience Report for Healthcare. Conducted by InsightExpress,
February 2013. Survey of 1,547 patients and 403 health practitioners in U.S.
70% of patients comfortable communicating with doctors via texting, email or video
Patients’ Trust in TeleHealth

What is the percent of persons in the US who
prefer telehealth encounters over in-person
visits?
Just the Facts
What is the percent of persons in the US who prefer
telehealth encounters over in-person visits?
70%
Just the Facts

Blood Pressure
Weight
Blood glucose
Fitness/Activity/Sleep Baby monitor


Coordinated Telehealth for Population Management
Accountable Care
Med/Surg ED ISUs Clinics LTA SNF Specialists Home


Thanks for your Interest
Let’s Improve Stroke Care Together
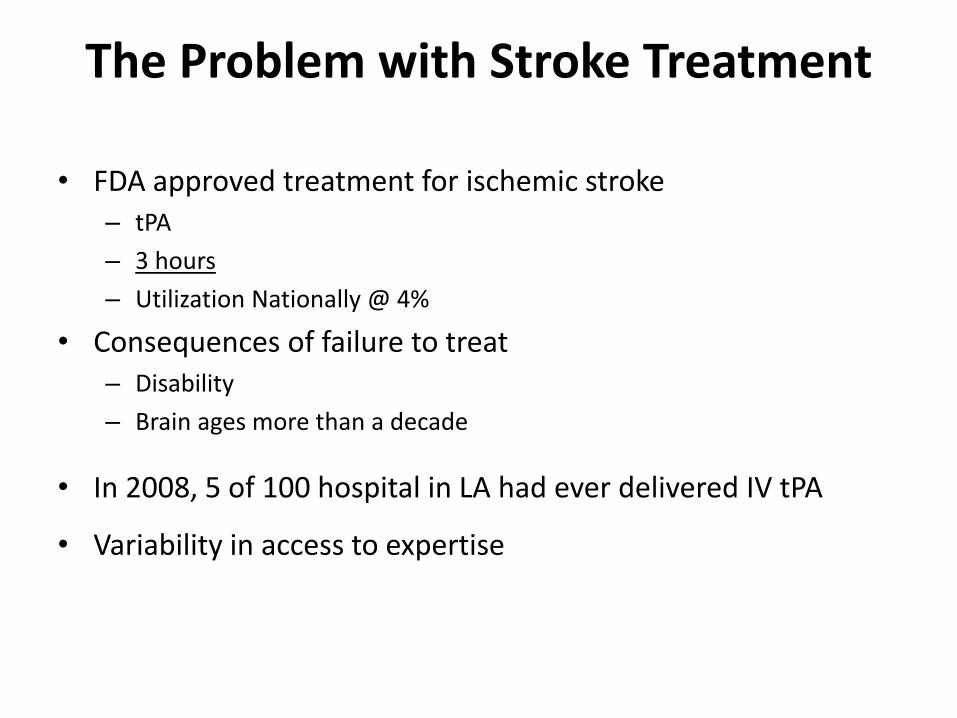
The Problem with Stroke Treatment
• FDA approved treatment for ischemic stroke – tPA
– 3 hours
– Utilization Nationally @ 4%
• Consequences of failure to treat – Disability
– Brain ages more than a decade
• In 2008, 5 of 100 hospital in LA had ever delivered IV tPA
• Variability in access to expertise

Background
• Direct & indirect cost of stroke in the U.S. – $36.5 Billion (2010)
• Projected costs by 2030 – $185 Billion
• Stroke patients are vulnerable to non-adherence to care in the critical first year
(Go, et al, 2013)
(Go, et al, 2013)
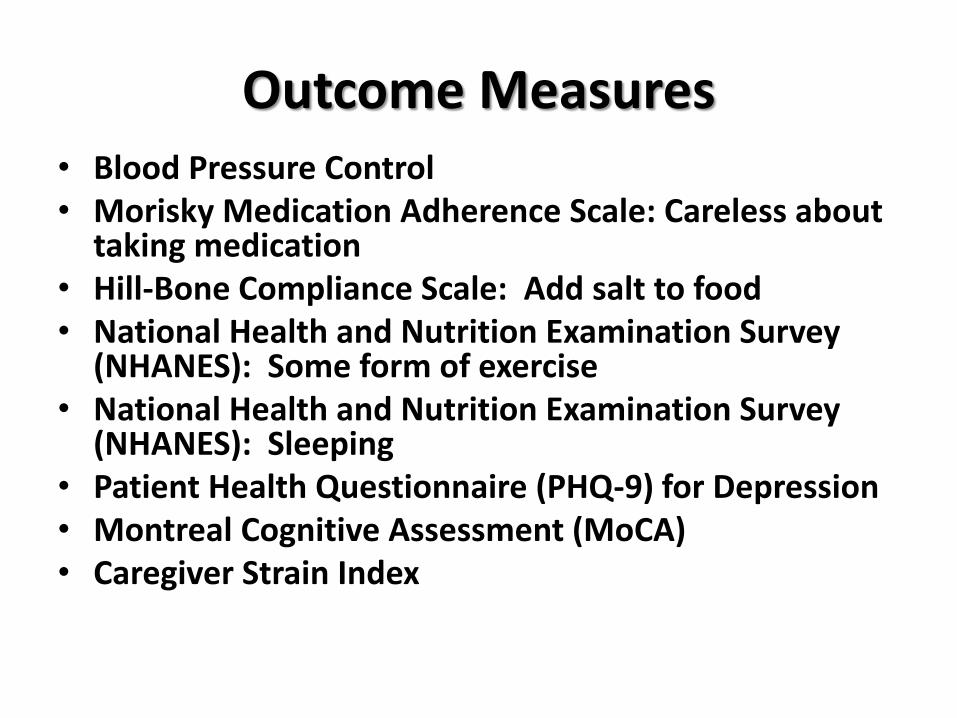
Outcome Measures • Blood Pressure Control • Morisky Medication Adherence Scale: Careless about
taking medication • Hill-Bone Compliance Scale: Add salt to food • National Health and Nutrition Examination Survey
(NHANES): Some form of exercise • National Health and Nutrition Examination Survey
(NHANES): Sleeping • Patient Health Questionnaire (PHQ-9) for Depression • Montreal Cognitive Assessment (MoCA) • Caregiver Strain Index

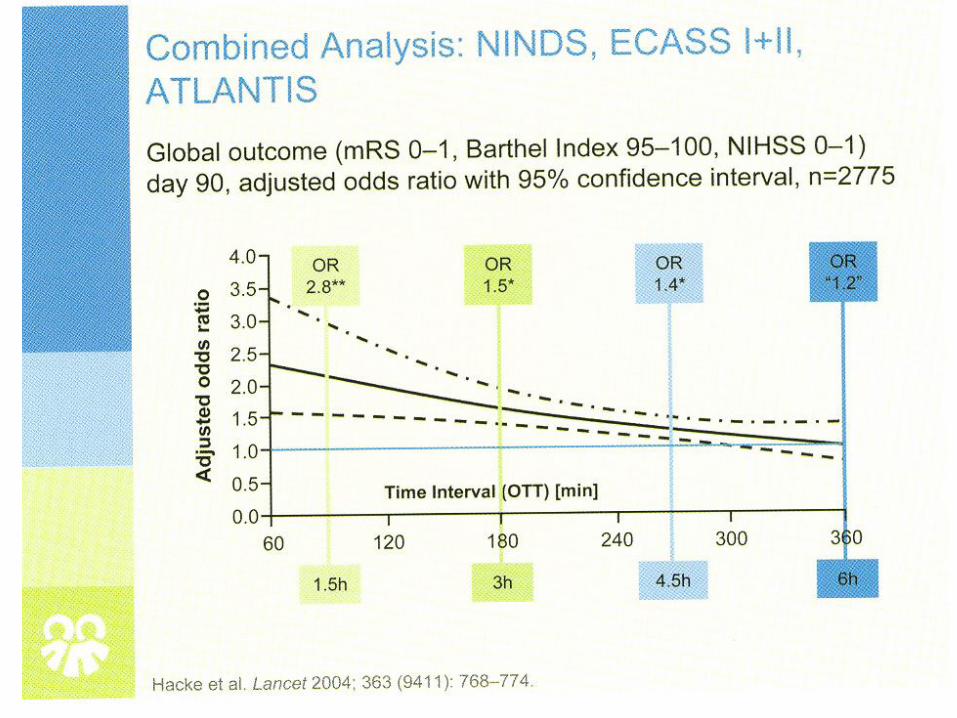
Good Outcome with Stroke Thrombolysis
Lancet 2014
Time to treatment
Alteplase (%)
Control (%)
OR good outcome
<3.0 hr 32.9 23.1 1.75 (1.35-2.27)
>3.0 to </=4.5 hr 35.3 30.1 1.26 (1.05-1.51)
>4.5 hr 32.6 30.6 1.15 (0.95-1.40)
Age <80 39.4 33.9 >80 17.6 13.2

Future for Rural Facilities
• Half of US hospitals <100 beds
• No available neurologist, psychiatrist, etc.
• Remote communities are underserved
• 90% or rural hospitals surveyed were receptive to telehealth solution
• E consults reduce costs
• Appropriate retention at hospital close to home
• Avoidance or risk and cost of patient transport.

Subacute and Chronic Nodes
What is wrong with our current post event chronic stroke care?

Stroke Central Personnel
• Stroke Central
– 4 Advanced Practice Nurses
– 1 Registered Nurse
– 1 Program Director
– 1 Vascular Neurologist
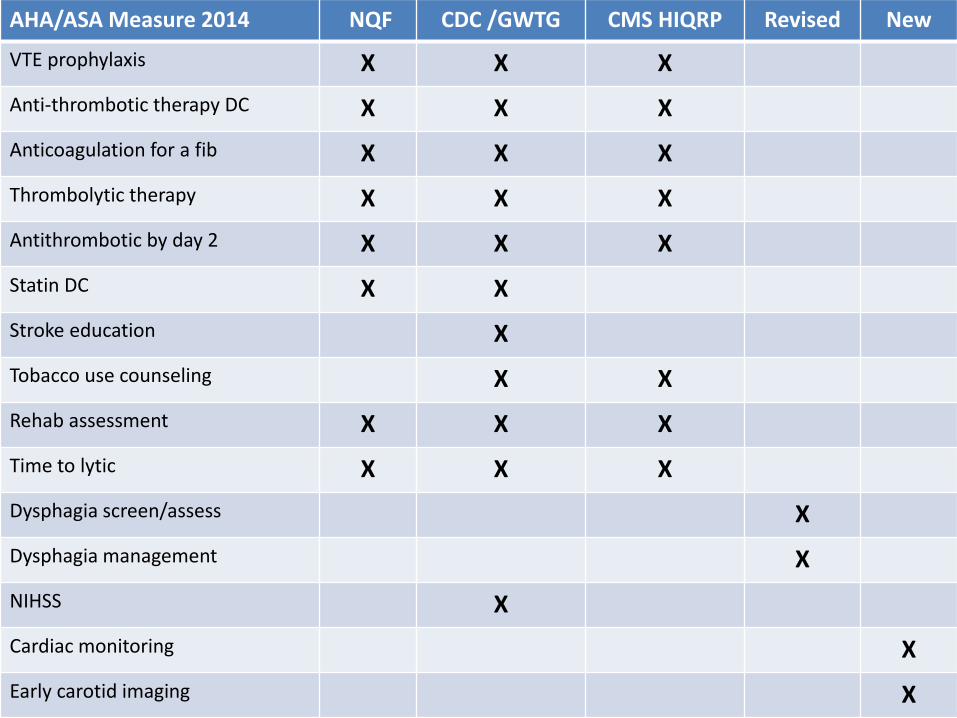
AHA/ASA Measure 2014 NQF CDC /GWTG CMS HIQRP Revised New
VTE prophylaxis X X X
Anti-thrombotic therapy DC X X X
Anticoagulation for a fib X X X
Thrombolytic therapy X X X
Antithrombotic by day 2 X X X
Statin DC X X
Stroke education X
Tobacco use counseling X X
Rehab assessment X X X
Time to lytic X X X
Dysphagia screen/assess X
Dysphagia management X
NIHSS X
Cardiac monitoring X
Early carotid imaging X