Comprehensive school-based intervention to control ...
13
Asia Pac J Clin Nutr 2017;26(6):1139-1151 1139 Original Article Comprehensive school-based intervention to control overweight and obesity in China: a cluster randomized controlled trial Haiquan Xu PhD 1,2 , Yanping Li PhD 1,3 , Qian Zhang PhD 1 , Xiaoqi Hu MD 1 , Ailing Liu PhD 1 , Songming Du PhD 1 , Tingyu Li MS 4 , Hongwei Guo MS 5 ,Ying Li PhD 6 , Guifa Xu BM 7 , Weijia Liu PhD 8 , Jun Ma PhD 9 , Guansheng Ma PhD 1,10 1 National Institute for Nutrition and Health, Chinese Center for Disease Control and Prevention, Beijing, China 2 Institute of Food and Nutrition Development, Ministry of Agriculture, Beijing, China 3 Department of Nutrition, Harvard T. H. Chan School of Public Health, Boston, MA, USA 4 Chongqing Children’s Hospital, Chongqing, China 5 School of Public Health, Fudan University, Shanghai, China 6 Harbin Medical University, Harbin, China 7 Department of Public Health, Shandong University, Jinan, China 8 Guangzhou Center for Disease Control and Prevention, Guangzhou, China 9 Institute of Child and Adolescent Health, School of Public Health, Peking University, Beijing, China 10 Department of Nutrition and Food Hygiene, School of Public Health, Peking University, Beijing, China Background and Objectives: With prevalence of childhood obesity increasing rapidly, developing of effective and sustainable intervention strategies is becoming more and more important for the prevention of childhood obe- sity in China. A trial was developed to evaluate the effect of comprehensive school-based intervention on child- hood obesity. Methods and Study Design: A multi-center cluster randomized controlled trial was conducted among urban children (n=9,867) aged 6-13 years in 38 primary schools from six large cities. Comprehensive in- tervention, nutrition education and physical activity interventions were carried out among children. Nutrition ed- ucation was also targeted towards teachers, parents and health workers in intervention schools. The program was implemented for 2 semesters from May 2009 to May 2010. Results: The combined prevalence of overweight and obesity increased by 1.5 percent (22.7% vs 24.2%, p<0.001) in control group while 0.2 percent in comprehensive intervention group (23.6% vs 23.8%, p=0.954) after intervention (p=0.067). The effect was significantly stronger among girls than boys (-1.4% vs -0.9%, p=0.028). A significant intervention effect was found on BMI for -0.3 kg/m 2 (95% confidence interval (CI): -0.4, -0.2; p<0.001), BMI z scores for -0.14 (95% CI: -0.18, -0.11; p<0.001),body fat for -0.8 percent (95% CI: -0.9, -0.6; p<0.001), waist circumference for -0.5 cm (95% CI: -0.6, -0.3; p<0.001), blood serum glucose for -0.20 mmol/L (95% CI: -0.24, -0.16; p<0.001) and cholesterol for -0.32 mmol/L (95% CI: -0.34, -0.30; p<0.001). Conclusions: We observed moderately significant effects on combined prevalence of overweight and obesity, BMI, BMI z scores, waist circumference, percentage body fat, glucose and lipid for a comprehensive school-based intervention of childhood obesity in China. Key Words: childhood obesity, comprehensive intervention, physical activity, nutrition, lipids INTRODUCTION With the changing of dietary practices and increasing of sedentary lifestyles, the prevalence of obesity-related non-communicable chronic diseases (NCD) has been rap- idly increasing in both developed and developing coun- tries. 1-9 The increasing trend of childhood obesity has ap- peared globally. 10-14 About 10% of 5-17 years old children have been overweight worldwide, and 2%-3% were obese. 15 The rapid increase in unhealthy body weight in school children has led to obese prevalence in some de- veloping countries as high as or even higher than that in developed countries. 15-17 The same increasing trend for childhood obesity has also happened in China, which has caused significant direct medical costs. As reported by Zhao et al, the estimated total medical costs of hyperten- sion, diabetes, coronary heart disease and strokes that Corresponding Author: Dr Guansheng Ma, Department of Nutrition and Food Hygiene, School of Public Health, Peking University, 38 Xue Yuan Road, Beijing, 100191, China Tel: +86-10-82801620; Fax: +86-10-82801620 Email: [email protected] Manuscript received 26 February 2016. Initial review completed 14 April 2016. Revision accepted 04 July 2016. doi: 10.6133/apjcn.112016.05
Transcript of Comprehensive school-based intervention to control ...

Asia Pac J Clin Nutr 2017;26(6):1139-1151 1139
Original Article Comprehensive school-based intervention to control overweight and obesity in China: a cluster randomized controlled trial Haiquan Xu PhD1,2, Yanping Li PhD1,3, Qian Zhang PhD1, Xiaoqi Hu MD1, Ailing Liu PhD1, Songming Du PhD1, Tingyu Li MS4, Hongwei Guo MS5,Ying Li PhD6, Guifa Xu BM7, Weijia Liu PhD8, Jun Ma PhD9, Guansheng Ma PhD1,10 1National Institute for Nutrition and Health, Chinese Center for Disease Control and Prevention, Beijing, China 2Institute of Food and Nutrition Development, Ministry of Agriculture, Beijing, China 3Department of Nutrition, Harvard T. H. Chan School of Public Health, Boston, MA, USA 4Chongqing Children’s Hospital, Chongqing, China 5School of Public Health, Fudan University, Shanghai, China 6Harbin Medical University, Harbin, China 7Department of Public Health, Shandong University, Jinan, China 8Guangzhou Center for Disease Control and Prevention, Guangzhou, China 9Institute of Child and Adolescent Health, School of Public Health, Peking University, Beijing, China 10Department of Nutrition and Food Hygiene, School of Public Health, Peking University, Beijing, China
Background and Objectives: With prevalence of childhood obesity increasing rapidly, developing of effective and sustainable intervention strategies is becoming more and more important for the prevention of childhood obe-sity in China. A trial was developed to evaluate the effect of comprehensive school-based intervention on child-hood obesity. Methods and Study Design: A multi-center cluster randomized controlled trial was conducted among urban children (n=9,867) aged 6-13 years in 38 primary schools from six large cities. Comprehensive in-tervention, nutrition education and physical activity interventions were carried out among children. Nutrition ed-ucation was also targeted towards teachers, parents and health workers in intervention schools. The program was implemented for 2 semesters from May 2009 to May 2010. Results: The combined prevalence of overweight and obesity increased by 1.5 percent (22.7% vs 24.2%, p<0.001) in control group while 0.2 percent in comprehensive intervention group (23.6% vs 23.8%, p=0.954) after intervention (p=0.067). The effect was significantly stronger among girls than boys (-1.4% vs -0.9%, p=0.028). A significant intervention effect was found on BMI for -0.3 kg/m2 (95% confidence interval (CI): -0.4, -0.2; p<0.001), BMI z scores for -0.14 (95% CI: -0.18, -0.11; p<0.001),body fat for -0.8 percent (95% CI: -0.9, -0.6; p<0.001), waist circumference for -0.5 cm (95% CI: -0.6, -0.3; p<0.001), blood serum glucose for -0.20 mmol/L (95% CI: -0.24, -0.16; p<0.001) and cholesterol for -0.32 mmol/L (95% CI: -0.34, -0.30; p<0.001). Conclusions: We observed moderately significant effects on combined prevalence of overweight and obesity, BMI, BMI z scores, waist circumference, percentage body fat, glucose and lipid for a comprehensive school-based intervention of childhood obesity in China.
Key Words: childhood obesity, comprehensive intervention, physical activity, nutrition, lipids INTRODUCTION With the changing of dietary practices and increasing of sedentary lifestyles, the prevalence of obesity-related non-communicable chronic diseases (NCD) has been rap-idly increasing in both developed and developing coun-tries.1-9 The increasing trend of childhood obesity has ap-peared globally.10-14 About 10% of 5-17 years old children have been overweight worldwide, and 2%-3% were obese.15 The rapid increase in unhealthy body weight in school children has led to obese prevalence in some de-veloping countries as high as or even higher than that in developed countries.15-17 The same increasing trend for
childhood obesity has also happened in China, which has caused significant direct medical costs. As reported by Zhao et al, the estimated total medical costs of hyperten-sion, diabetes, coronary heart disease and strokes that Corresponding Author: Dr Guansheng Ma, Department of Nutrition and Food Hygiene, School of Public Health, Peking University, 38 Xue Yuan Road, Beijing, 100191, China Tel: +86-10-82801620; Fax: +86-10-82801620 Email: [email protected] Manuscript received 26 February 2016. Initial review completed 14 April 2016. Revision accepted 04 July 2016. doi: 10.6133/apjcn.112016.05

1140 H Xu, Y Li, Q Zhang, X Hu, A Liu, S Du, T Li, H Guo, Y Li, G Xu, W Liu, J Ma and G Ma
could be attributed to overweight and obesity was 21.11 billion Yuan (RMB) in China in 2003, accounting for 25.5% of the total medical costs of these four primary chronic diseases, or 3.7% of the national total medical costs.18
Obese children are more likely to be obese adults19-21 and suffer from obesity-related NCD, psychosocial prob-lems, social stigmatization, and poor self-image.22 Pre-vention is of the most importance to curb the rise in obe-sity-related NCD, because treatment is expensive and it will drain the limited public health resources.23
Nutrition education and physical activity interventions have considerable potential to prevent weight gain in the general population. School-based intervention programs have emerged increasingly as an important strategy in obesity prevention. School provides an ideal opportunity in terms of both physical and social environment for pre-venting and treating obesity. Therefore, school-based obesity interventions have been applied worldwide as well as in China. Most of the available evidence, however, originates from studies conducted in developed countries and few in developing countries.24,25
We have previously developed a school-based physical activity intervention strategy for childhood obesity in China, and it showed a good effectiveness and sustaina-bility in an intervention study of 20 schools in Beijing.26 In China, a few studies indicated that school based com-prehensive intervention combined with nutrition and physical activity programs were effective.27,28 However, whether it would be successful when expanded to a larger scale (from more regions to nation-wide) still remains unclear. So we have designed a multi-center randomized controlled trial of comprehensive nutrition-based inter-vention study on childhood obesity in China (NISCOC),29 which combined nutrition education and physical activity interventions and was applied to 30 schools in 5 study sites. The analysis of cost-effectiveness based on NISCOC indicated that the school-based integrated inter-vention was cost-effective on childhood obesity preven-tion in urban China,30 but it is not clear if there are inter-vention effects on biochemical indicators. A study based on the selected study population (overweight and obese children, n=438) in one study site (Beijing) of NISCOC observed that the comprehensive program had superior positive effects on body fat percentage compared with the diet only or physical activity only intervention.31 Howev-er, it is not clear whether this is the same in the whole study population, by including other study sites and by including the normal weight and underweight children who were involved in the same intervention project.30,31
The objective of this study was to comprehensively evaluate the intervention effects of NISCOC on a national level. If it is effective, it will provide the basis for the development childhood obesity prevention policies. METHODS This study was a multi-center cluster randomized control trial. Six centers, including Shanghai, Chongqing, Guangzhou, Jinan, Harbin and Beijing, were recruited. Two-step cluster sampling method was used for subjects’ selection. Firstly, 8 schools from Beijing and 6 schools from each other city were randomly chosen into the trial.
The selected schools were randomly divided into three groups in Beijing (3 schools for nutrition education inter-vention, 3 schools for physical activity intervention and 2 schools for control) and two groups in each other city (3 schools for comprehensive intervention and 3 schools for control). In total, there were 15 comprehensive interven-tion schools, 3 nutrition education intervention schools, 3 physical activity intervention schools and 17 control schools. Secondly, 2 classes from each grade (1st to 5th) were selected randomly in every school. 390 classes were selected. All recruited students were from urban districts. This trial information was registered at Chinese Clinical Trial Register (number ChiCTR-PRC-09000402).
Inclusion criteria for selecting school: 1) non-boarding school; 2) the prevalence of obesity, based on the routine physical examination records, was above 10%; 3) Provid-ing school lunch feeding, and more than 50% students have lunch at school. All the students in the selected clas-ses were invited to participate in the study.
Exclusion criteria for subjects: 1) students who suf-fered from serious illnesses (such as congenital heart dis-ease, the body carried out fixation or joint replacement surgery, and so on) or couldn’t withstand severe physical activity or diet control were excluded. 2) Students who participated in the past one year or planned to participate in other similar intervention projects in the next year were excluded.
This study was approved by the Ethical Review Com-mittee of National Institute for Nutrition and Food Safety (renamed “National Institute for Nutrition and Health”), Chinese Center for Disease Control and Prevention. The informed consent voluntarily was signed by participants’ parents or their guardians.
Interventions Nutrition education intervention, physical activity inter-vention and the comprehensive intervention including nutrition education and physical activity intervention were designed for childhood obesity prevention. The pro-gram was implemented for 2 semesters from May 2009 to May 2010. Detailed information on the interventions can be found in a previous published article.29
Nutrition education intervention A nutrition handbook was developed.32 Cartoon pam-phlets were distributed to each student in the intervention schools. Courses on nutrition and health were given 6 times for the students, 2 times for the parents and 4 times for teachers and health workers. The contents included healthy eating proportions of three meals, how to choose the beverage and snacks, reducing eating out and West-ern-style fast food, and so on. Nutrition professionals gave the lectures to teachers, parents and workers firstly, and then the trained teachers were responsible for teach-ing students. Each lecture lasted a minimum of 40 min. Furthermore, “Dietary Pagoda for Chinese people” post-ers were displayed on the walls of all participating class-rooms. Cartoon handbooks containing all of this infor-mation were distributed to all participants in the nutrition education group to help clarify the concepts presented in the lectures. The school lunch cafeteria menu for students was evaluated periodically and specific nutrition sugges-

Childhood obesity intervention in China 1141
tions were provided accordingly.
Physical activity intervention A classroom-based physical activity program for elemen-tary students named “Happy 10” was used in physical activity (PA) intervention. The Happy 10 program was developed as a classroom-based intervention to promote physical activity among primary school students. The Happy 10 program has been implemented and promoted in urban Beijing since 2004 and is a useful strategy for increasing PA among school children. On each school day, students conducted Happy 10 organized by teachers to do a 10-mins segment of moderate intensity, age- and space-appropriate physical activity twice at school. The forms of PA includes game, dance or rhythmic gymnas-tics, such as “invisible rope skipping”, “imitating ani-mals”, and the “squat and multiplication table”, were linked with the core curriculum objectives and were con-ducted during breaks. The 10-minute sessions consisted of four parts: 1) the teacher or student selected the cards to determine the activities; 2) several children were cho-sen to model the exercises in the front of the classroom and the other students followed along (one to three activi-ties were performed at each session); 3) a cool-down pe-riod took place after the activities; and 4) the students were taught a health message. The average energy ex-penditure of 10-mins PA ranged from 25.0-35.1 kcal.33 Students were also encouraged to develop different forms of PA that they liked. Furthermore, education about PA was provided to students, parents, health workers and teachers.
In order to improve the home environment, we also in-volved the parents in our intervention study, including, but not limited to, sending them nutrition education bulle-tins. We also applied the supervising strategies to make sure the interventions would be fully implemented by frequent visiting without notice to intervention schools. There were also some competing activities and seminars held between centers and schools.
Assessment of intervention effects The physical examination was carried out in school. Height was measured to an accuracy of 1 mm with a free standing stadiometer mounted on a rigid tripod (GMCS-I, Xindong Huateng Sports Equipment Co. Ltd., Beijing, China). One overnight fasting body weight was measured to the nearest 0.1 kg on a digital scale (RGT-140, Wujin Hengqi Co. Ltd., Changzhou, China). Body mass index (BMI) was calculated as weight in kilograms divided by height in meters squared (kg/m2). The BMI z scores, based on age and sex, were calculated for each subject using World Health Organization growth references. Overweight was defined as BMI between the 85th and the 95th percentiles, whereas obesity was defined as BMI≥ 95th percentile, using age- and sex-specific BMI cutoff points developed by the Working Group for Obesity in China (WGOC).34 Children with malnutrition was de-fined as the China national standard for screening of mal-nutrition in children and adolescents.35
Waist circumference (WC) was measured mid-way be-tween the lower rib margin and the iliac crest with flexi-ble anthropometric tape (Myotape). The WC was meas-
ured twice to the nearest 0.1 cm. If the variation between these two measurements was greater than 0.5 cm, a third measurement was taken and the mean was calculated by using the two closest measurements.
After an overnight fast, body composition was meas-ured in the morning using a single frequency (50 Hz) hand to foot bioelectrical impendence device (ImpDF50, Impedimed Pty Ltd., Qld, Australia), with subjects in a calm state considering the effects of physical activity and meals. The bioimpedance measurement required careful placement of our electrodes on the hand and foot. Re-sistance (R) and reactance (Xc) were determined. Body impedance was calculated as the square root of (R2+Xc2). The body fat percentage was calculated using the predic-tion equations developed by Deurenberg.36
Fasting venous blood samples (5 mL) were drawn in the morning after 10-14 h of overnight fasting. Serum glucose was determined by the glucose-oxidase method (Daiichi Pharmaceutical Co., Ltd, Tokyo, Japan) within 4 h after the sample was obtained. Total cholesterol (Chol), triglycerides (TG), low-density lipoprotein cholesterol (LDL-C) and high-density lipoprotein cholesterol (HDL-C) were determined by enzymatic methods using com-mercial kits (Daiichi Pharmaceutical Co., Ltd, Tokyo, Japan).
Statistical analysis The variable used for the calculation of sample size was the BMI changes. To detect a difference of 0.7 kg/m2 of BMI changes between the intervention and control groups, the minimum number required would be 3 schools in each center with 250 students in each school.26 The interclass correlation is assumed to be 0.05. The sample size of 7500 students from 30 schools located in 5 centers has 90% power to detect a mean between-group difference in BMI of 0.7 units with an effect size of 0.64. Statisti-cal significance level was set at 0.05 (two-sided).
The continuous variables were expressed as mean and standard deviation. Linear Growth Model (LGM) adjust-ing for confounding factors was used for comparison of the means and the changes of continuous variables among intervention group and control group. Mixed Model was used for comparison of the means between post-intervention and baseline for each group. The percentage of overweight and obesity were compared with General-ized Linear Mixed Model (GLMM). Procedure GLMM was used with school as random effect variable. The fixed effect variables included sex, age, and intervention types. Daily energy intake was taken as adjusted variable. Statis-tical significance level was set at p<0.05. SAS software package version 9.1 (SAS Institute Inc, Cary, NC) was used for analysis. RESULTS Baseline characteristics We had collected baseline anthropometric measures from 9,867 children (2,150 in Beijing, 7,717 in five other cit-ies). Of whom, 8,573 children (4,205 girls) were re-measured one year later with a follow-up rate of 86.9% (Figure 1). At least 1 teacher in every class and 1 parent in every family participated in the program. Table 1 shows the characteristics of the subjects including age,

1142 H Xu, Y Li, Q Zhang, X Hu, A Liu, S Du, T Li, H Guo, Y Li, G Xu, W Liu, J Ma and G Ma
sex, mother’s educational level and family’s economic level. No significant difference was found between inter-vention and control groups. Except for the gender propor-tion of students in Beijing, there was no significant dif-ference between the retained students and the lost stu-dents for the basic characteristics. Changes of nutrition knowledge, attitude, practice and physical activity Participants’ nutrition knowledge in the comprehensive intervention group improved significantly as compared with the control group. The increased proportion of stu-dents with correct responses of nutrition knowledge in-cluded “Eating single food is not good for health in-creased” (comparing comprehensive intervention group to control group: 8.9% vs. 0.8%, p=0.001), “More nutrition for coarse grains than refined grains”(2.6% vs -1.6%, p=0.028), “Having more milk and soy products is benefi-cial to health” (3.1% vs 0.8%, p=0.013), “Moderate exer-cise could be good for learning” (21.0% vs 12.0%, p<0.001), “Exercising less could be prone to be obese” (5.6% vs 1.9%, p=0.003). We did not observe significant improvement for attitude and practice. The physical activ-ity time significantly increased from 815.9±420.6 mins/week to 855.1±405.6 minutes/week in the compre-hensive intervention group with no significant changes in the control group, with a significant intervention effect of 46.0 mins/week.
Weight-related outcomes Table 2 shows the main intervention effects on BMI, BMI z scores, body fat percentage, WC and prevalence of overweight & obesity. The changes of BMI, BMI z scores, body fat percentage and WC were all significantly differ-ent between control group and intervention group. Com-
pared with the control group, the comprehensive interven-tion effects could be found -0.3 kg/m2 (95% confidence interval (CI): -0.4, -0.2; p<0.001) for BMI, -0.14 (95% CI: -0.18, -0.11; p<0.001) for BMI z scores, -0.8% (95% CI: -0.9, -0.6; p<0.001) for percentage body fat and -0.5 cm (95% CI: -0.6, -0.3; p<0.001) for WC in the intervention group. The combined prevalence of overweight and obe-sity increased in control group by 1.5% (22.7% vs. 24.2%, p<0.001) but only 0.2% in the comprehensive interven-tion group (23.6% vs. 23.8%, p=0.954) after one school year. The odds ratio (OR) value of the comprehensive intervention group being overweight or obese was 0.9 (95% CI: 0.7, 1.0) compared with control group. There was almost no significant intervention effect in nutrition education group and physical activity group except the waist circumference (-0.40 cm, 95%CI: -0.77,-0.02, p=0.036) in nutrition education group.
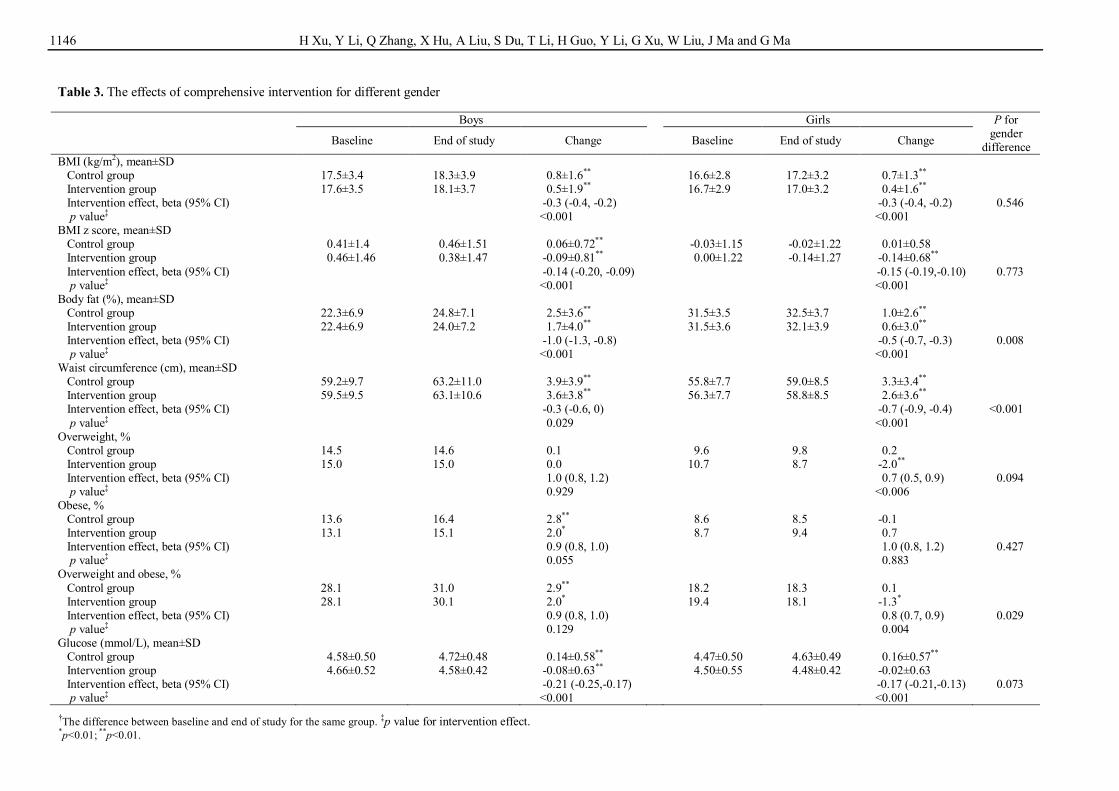
Table 3 presents the different intervention effects be-tween boys and girls. Although the positive effects on BMI, BMI z scores, body fat percentage and WC were found among both boys and girls, the boys decreased more body fat (-1.0%) and less WC (-0.3 cm) than girls (-0.5%, p=0.008; -0.7 cm, p<0.001). For the combined prevalence of overweight and obesity, the intervention effects were also significantly different. Compared with control group, the odds of being overweight or obese after intervention reduced 10% (OR=0.9; 95% CI: 0.8, 1.0) for boys and 20% for girls (OR=0.8; 95% CI: 0.7, 0.9).
The comprehensive intervention effect among different weight status children was also significantly different on BMI, BMI z scores, body fat percentage and WC. More obvious effects on BMI, BMI z scores, body fat percent-age and WC were found among overweight/obese chil-dren and normal weight children (p<0.001), but there were no significant effects for malnourished children
Figure 1. Trial profile for follow-up data

Childhood obesity intervention in China 1143
Table 1. Characteristics of the subjects at baseline Comprehensive intervention Nutrition education or physical activity intervention
Intervention group Control group Retained Lost
Nutrition education
group
Physical activity group Control Retained Lost
Total, N 3773 3944 6874 843 792 778 580 1699 451 Age (year), mean (SD) 9.0 (1.4) 9.0 (1.4) 9.0 (1.4) 9.0 (1.4) 9.2 (1.5) 9.2 (1.6) 9.3 (1.6) 9.1 (1.5) 9.4 (1.6) Sex, N (%) Boys 2006 (50.9) 1908 (50.6) 3476 (50.6) 438 (52.0) 417 (52.7) 425 (54.5) 343 (59.1) 892 (52.5) 293 (64.9)** † Girls 1938 (49.1) 1865 (49.4) 3398 (49.4) 405 (48.0) 375 (47.3) 353 (45.5) 237 (40.9) 807 (47.5) 158 (35.1) Mother’s educational level, (N (%)) Low (illiterate) 7 (0.2) 12 (0.4) 17 (0.3) 2 (0.4) 4 (0.7) 2 (0.3) 5 (1.1) 10 (0.8) 1 (0.3) Middle (Primary or junior middle school) 976 (33.1) 1113 (39.4) 1909 (36.5) 180 (33.5) 332 (56.0) 376 (63.5) 294 (66.2) 802 (60.8) 200 (64.7) High (Senior middle school or above) 1964 (66.6) 1699 (60.2) 3307 (63.2) 356 (66.2) 257 (43.3) 214 (36.1) 145 (32.7) 508 (38.5) 108 (35.0) Family’s economic level (Yuan/month/per family member), N (%)
≤1,500 1205 (41.0) 1266 (44.9) 2254 (43.1) 217 (40.6) 278 (47.4) 305 (52.0) 240 (54.8) 673 (51.4) 150 (49.5) 1,501-2,500 829 (28.2) 757 (26.8) 1439 (27.5) 147 (27.5) 161 (27.4) 158 (26.9) 107 (24.4) 344 (26.3) 82 (27.1) >2,500 904 (30.8) 798 (28.3) 1531 (29.3) 171 (32.0) 148 (25.2) 124 (21.1) 91 (20.8) 292 (22.3) 71 (23.4)
BMI (kg/m2), mean (SD) 17.1 (3.3) 17.0 (3.1) 17.1 (3.2) 17.1 (3.3) 16.6 (2.9) 16.9 (3.2) 16.4 (2.6) 16.6 (2.9) 16.8 (3.0)
†Comparison between students being retained and lost. **p<0.01.

1144 H Xu, Y Li, Q Zhang, X Hu, A Liu, S Du, T Li, H Guo, Y Li, G Xu, W Liu, J Ma and G Ma
Table 2. The overall outcomes for intervention
Baseline End of study Change‡‡ Intervention effect (Beta (95% CI), p)
BMI (kg/m2), mean±SD Control group† 17.1±3.2 17.9±3.6 0.8±1.5** Intervention group§ 17.0±3.3 17.6±3.5 0.6±1.7** -0.3 (-0.4, -0.2), <0.001 Control group‡ 16.4±2.7 17.1±2.6 0.7±2.2** Nutrition education group¶ 16.7±2.9 17.4±2.9 0.7±2.2** 0.00 (-0.26, 0.26), 0.990 Physical activity group†† 16.9±3.2 17.7±2.9 0.8±2.2** 0.07 (-0.19, 0.34), 0.584
BMI z score, mean±SD Control group† 0.19±1.30 0.22±1.39 0.03±0.66** Intervention group§ 0.23±1.37 0.12±1.40 -0.11±0.75** -0.15 (-0.18, -0.11), <0.001 Control group‡ -0.11±1.14 -0.04±1.11 0.08±0.91 Nutrition education group¶ -0.03±1.18 0.03±1.18 0.05±0.88 -0.02 (-0.13, 0.08), 0.678 Physical activity group†† 0.04±1.3 0.16±1.15 0.13±0.92** 0.05 (-0.06, 0.16), 0.377
Body Fat (%), mean±SD Control group† 26.8±7.2 28.6±6.8 1.8±3.2** Intervention group§ 26.9±7.1 28.0±7.0 1.1±3.6** -0.8 (-0.9, -0.6), <0.001 Control group‡ 25.7±7.2 27.3±6.7 1.7±3.7** Nutrition education group¶ 26.6±6.9 28.8±6.3 2.2±4.1** 0.56 (0.09, 1.04), 0.019 Physical activity group†† 27.0±7.0 28.4±6.4 1.4±3.8** -0.26 (-0.71, 0.20), 0.269
Waist circumference (cm), mean±SD Control group† 57.5±8.9 61.1±10.1 3.6±3.7** Intervention group§ 57.9±8.8 61.0±9.9 3.1±3.7** -0.5 (-0.6, -0.3), <0.001 Control group‡ 56.1±7.7 58.9±8.6 2.9±3.1** Nutrition education group¶ 57.0±8.7 59.4±9.5 2.5±3.1** -0.40 (-0.77, -0.02), 0.036 Physical activity group†† 57.4±9.1 60.1±9.9 2.7±3.5** -0.20 (-0.60, 0.21), 0.337
Overweight, % Control group† 11.8 12.0 0.2 Intervention group§ 12.7 11.5 -1.2 0.9 (0.8, 1.1), 0.198 Control group‡ 5.1 10.7 5.6 Nutrition education group¶ 8.5 10.8 2.4 0.59 (0.26, 1.36), 0.413 Physical activity group†† 6.7 13.0 6.4# 0.89 (0.54, 1.47), 0.517
Obese, % Control group† 10.9 12.2 1.3** Intervention group§ 10.9 12.3 1.4** 1.0 (0.9, 1.1), 0.972 Control group‡ 6.6 5.4 -1.3 Nutrition education group¶ 6.4 7.8 1.4 1.57 (0.74, 3.31), 0.151 Physical activity group†† 10.2 7.4 -2.8 0.86 (0.45, 1.65), 0.774
Overweight and obese, % Control group† 22.7 24.2 1.5* Intervention group§ 23.6 23.8 0.2 0.9 (0.7, 1.0), 0.061 Control group‡ 11.1 17.6 6.5 Nutrition education group¶ 14.3 19.8 5.5 0.93 (0.57, 1.51), 0.572 Physical activity group†† 16.1 21.9 5.8 0.89 (0.54, 1.47), 0.637
Glucose (mmol/L), mean±SD Control group† 4.53±0.51 4.68±0.49 0.15±0.58** Intervention group§ 4.58±0.54 4.53±0.43 -0.05±0.64** -0.20 (-0.24, -0.16), <0.001 Control group‡ 3.98±0.72 5.02±0.44 1.05±0.95** Nutrition education group¶ 4.32±0.54 5.04±0.36 0.72±0.61** -0.32 (-0.42, -0.22), <0.001 Physical activity group†† 4.49±0.55 4.95±0.44 0.46±0.58** -0.59 (-0.68, -0.49.), <0.001
Insulin (mU/mL), mean±SD Control group† 6.03±3.58 6.31±4.18 0.15±4.04* Intervention group§ 6.20±3.89 6.34±4.20 0.18±4.58 -0.06 (-0.30, 0.18), 0.620 Control group‡ 5.24±3.03 4.72±3.06 -0.47±3.52* Nutrition education group¶ 5.24±3.2 5.13±3.5 0.02±3.47 0.23 (0.00, -0.91), 0.051 Physical activity group†† 5.97±3.87 5.14±3.63 -0.79±4.07** -0.27 (-0.82, 0.28), 0.327
HDL-c (mmol/L), mean±SD Control group† 1.47±0.29 1.68±0.37 0.21±0.33** Intervention group§ 1.50±0.32 1.62±0.39 0.13±0.37** -0.09 (-0.11, -0.07), <0.001 Control group‡ 1.39±0.24 1.42±0.31 0.02±0.25 Nutrition education group¶ 1.42±0.29 1.69±0.32 0.27±0.32** 0.24 (0.21, 0.28), <0.001 Physical activity group†† 1.39±0.28 1.47±0.29 0.08±0.26** 0.054 (0.02, 0.09), 0.001
†The control group for comprehensive intervention. ‡The control group for only nutrition education intervention group or only physical activity intervention group. §The comprehensive intervention group. ¶The only nutrition education intervention group. ††The only physical activity intervention group. ‡‡The difference between baseline and end of study for the same group. *p<0·05; **p<0·01.

Childhood obesity intervention in China 1145
(Table 4).
Glucose, insulin and lipids For glucose level, there was a 0.05 units (mmol/L) de-crease in intervention group and 0.15 units (mmol/L) in-crease in control group after intervention (p<0.001), re-sulting in a significant intervention effect of -0.20 mmol/L in the comprehensive intervention group (Table 2). The significant comprehensive intervention effect on glucose was found in both boys (-0.17 mmol/L) and girls (-0.17 mmol/L) (Table 3). We did not observe a signifi-cant intervention effect on serum insulin. We observed significant intervention effect on comprehensive interven-tion on Chol level with an intervention effect of -0.32 mmol/L (0.14 mmol/L decrease in intervention group and 0.18 mmol/L increase in control group, p<0.001). Signifi-cant intervention effects on HDL-c and TG were only observed in nutrition education group with an interven-tion effect of 0.24 mmol/l for HDL-c and -0.09 mmol/L for TG (Table 2).
DISCUSSION In this large scale, multi-center, school-based randomised clinical trial, we observed significant intervention effects of the comprehensive nutrition education and physical activity intervention in China. This study was the largest multi-center comprehensive childhood obesity interven-tion study in primary schools in China. The large sample size provided sufficient power to detect a relatively small effect. Another strength of the study was the extensive and precise measurements of intervention effects, includ-ing not only broad anthropometric index of BMI, BMI z scores, body fat percentage, WC and the prevalence of overweight combined with obesity, but also biomarkers of glucose and lipids.
Our findings were consistent with previous studies. One meta-analysis based on 32 studies showed that
school-based prevention interventions could be effective in reducing BMI in children.37 Another meta-analysis, including 17 childhood obesity prevention programmes, found that childhood obesity prevention programmes had a significant desirable effect on blood lipids.38 A school-based intervention program in Netherlands found a signif-icant positive effect for overweight percent though no significant effect for BMI.39 After one school year inter-vention, the prevalence of overweight and obesity in-creased only 0.2% in the intervention group, but 1.5% in the control group. Compared with control group, the odds of being overweight or obese were reduced by 10% for the intervention group. Although BMI increased in both groups, a greater increment in the control group was ob-served. Some studies have indicated little effect in con-trolling obesity and overweight with short time interven-tions.15 We observed a significant effect which might be due to the fact that the interventions were comprehensive in combination with the effect of the knowledge, attitude and practice of nutrition and obesity intervention among children.
Significant gender differences of intervention effect were observed in the current study. Another similar inter-vention study found a greater effect in boys than girls;40 however, the opposite result occurred in this intervention, with more effect in preventing the combined prevalence of overweight and obesity among girls than that among boys. Plausible explanations for this difference could be as follows. Firstly, girls are basically less physically ac-tive; adding our exercise program into girls’ daily activi-ties might have produced a substantial effect on their en-ergy expenditure. Secondly, girls are more inactive than boys and easier to comply with their teachers or parents generally, so girls could do better than boys in conducting the interventions. Thirdly, the post-exercise eating behav-ior may have been different according to gender. Girls may need more body fat than boys after puberty and they
Table 2. The overall outcomes for intervention (cont.)
Baseline End of study Change‡‡ Intervention effect (Beta (95% CI), p)
LDL-C (mmol/L), mean±SD Control group† 2.23±0.63 2.34±0.67 0.11±0.51** Intervention group§ 2.25±0.61 2.33±0.70 0.08±0.60** -0.02 (-0.04, 0), 0.131 Control group‡ 1.73±0.46 1.79±0.44 0.06±0.30 Nutrition education group¶ 1.68±0.44 1.81±0.46 0.13±0.47** 0.07 (0.02, 0.12), 0.004 Physical activity group†† 1.68±0.42 1.8±0.46 0.12±0.31** 0.06 (0.02, 0.10), 0.002
Chol (mmol/L), mean±SD Control group† 4.00±0.82 4.18±0.74 0.18±0.61** Intervention group§ 4.24±0.77 4.10±0.79 -0.14±0.58** -0.32 (-0.34, -0.30), <0.001 Control group‡ 3.96±0.66 3.51±0.58 -0.45±0.44** Nutrition education group¶ 3.95±0.62 3.78±0.53 -0.17±0.68** 0.27 (0.20, 0.34), <0.001 Physical activity group†† 3.93±0.65 3.79±0.64 -0.15±0.48** 0.30 (0.24, 0.36), <0.001
TG (mmol/L), mean±SD Control group† 0.83±0.48 0.89±0.43 0.05±0.54** Intervention group§ 0.80±0.41 0.86±0.51 0.07±0.50** 0.01 (-0.01, 0.03), 0.329 Control group‡ 0.72±0.36 0.69±0.4 -0.03±0.38 Nutrition education group¶ 0.81±0.38 0.69±0.38 -0.12±0.41** -0.09 (-0.14, -0.03), 0.001 Physical activity group†† 0.72±0.35 0.7±0.47 -0.03±0.44 0.01 (-0.05, 0.06), 0.837
†The control group for comprehensive intervention. ‡The control group for only nutrition education intervention group or only physical activity intervention group. §The comprehensive intervention group. ¶The only nutrition education intervention group. ††The only physical activity intervention group. ‡‡The difference between baseline and end of study for the same group. *p<0·05; **p<0·01.
1146 H Xu, Y Li, Q Zhang, X Hu, A Liu, S Du, T Li, H Guo, Y Li, G Xu, W Liu, J Ma and G Ma
the intervention implementation, which at least in part, weakened the intervention effect.
Table 3. The effects of comprehensive intervention for different gender
Boys Girls P for gender
difference Baseline End of study Change Baseline End of study Change
BMI (kg/m2), mean±SD Control group 17.5±3.4 18.3±3.9 0.8±1.6** 16.6±2.8 17.2±3.2 0.7±1.3** Intervention group 17.6±3.5 18.1±3.7 0.5±1.9** 16.7±2.9 17.0±3.2 0.4±1.6** Intervention effect, beta (95% CI) -0.3 (-0.4, -0.2) -0.3 (-0.4, -0.2) 0.546 p value‡ <0.001 <0.001 BMI z score, mean±SD Control group 0.41±1.4 0.46±1.51 0.06±0.72** -0.03±1.15 -0.02±1.22 0.01±0.58 Intervention group 0.46±1.46 0.38±1.47 -0.09±0.81** 0.00±1.22 -0.14±1.27 -0.14±0.68** Intervention effect, beta (95% CI) -0.14 (-0.20, -0.09) -0.15 (-0.19,-0.10) 0.773 p value‡ <0.001 <0.001 Body fat (%), mean±SD Control group 22.3±6.9 24.8±7.1 2.5±3.6** 31.5±3.5 32.5±3.7 1.0±2.6** Intervention group 22.4±6.9 24.0±7.2 1.7±4.0** 31.5±3.6 32.1±3.9 0.6±3.0** Intervention effect, beta (95% CI) -1.0 (-1.3, -0.8) -0.5 (-0.7, -0.3) 0.008 p value‡ <0.001 <0.001 Waist circumference (cm), mean±SD Control group 59.2±9.7 63.2±11.0 3.9±3.9** 55.8±7.7 59.0±8.5 3.3±3.4** Intervention group 59.5±9.5 63.1±10.6 3.6±3.8** 56.3±7.7 58.8±8.5 2.6±3.6** Intervention effect, beta (95% CI) -0.3 (-0.6, 0) -0.7 (-0.9, -0.4) <0.001 p value‡ 0.029 <0.001 Overweight, % Control group 14.5 14.6 0.1 9.6 9.8 0.2 Intervention group 15.0 15.0 0.0 10.7 8.7 -2.0** Intervention effect, beta (95% CI) 1.0 (0.8, 1.2) 0.7 (0.5, 0.9) 0.094 p value‡ 0.929 <0.006 Obese, % Control group 13.6 16.4 2.8** 8.6 8.5 -0.1 Intervention group 13.1 15.1 2.0* 8.7 9.4 0.7 Intervention effect, beta (95% CI) 0.9 (0.8, 1.0) 1.0 (0.8, 1.2) 0.427 p value‡ 0.055 0.883 Overweight and obese, % Control group 28.1 31.0 2.9** 18.2 18.3 0.1 Intervention group 28.1 30.1 2.0* 19.4 18.1 -1.3* Intervention effect, beta (95% CI) 0.9 (0.8, 1.0) 0.8 (0.7, 0.9) 0.029 p value‡ 0.129 0.004 Glucose (mmol/L), mean±SD Control group 4.58±0.50 4.72±0.48 0.14±0.58** 4.47±0.50 4.63±0.49 0.16±0.57** Intervention group 4.66±0.52 4.58±0.42 -0.08±0.63** 4.50±0.55 4.48±0.42 -0.02±0.63 Intervention effect, beta (95% CI) -0.21 (-0.25,-0.17) -0.17 (-0.21,-0.13) 0.073 p value‡ <0.001 <0.001
†The difference between baseline and end of study for the same group. ‡p value for intervention effect. *p<0.01; **p<0.01.

Childhood obesity intervention in China 1147
Table 3. The effects of comprehensive intervention for different gender (cont.)
Boys Girls P for gender
difference Baseline End of study Change† Baseline End of study Change†
Insulin (mU/mL), mean±SD Control group 5.93±3.56 6.21±4.13 0.19±3.98 6.11±3.6 6.39±4.23 0.09±4.05 Intervention group 6.14±3.87 6.17±4.14 0.06±4.6 6.26±3.94 6.43±4.19 0.23±4.54 Intervention effect, beta (95% CI) -0.17 (-0.50,0.16) 0.02 (-0.31,0.35) 0.557 p value‡ 0.306 0.882 HDL-c (mmol/L), mean±SD Control group 1.48±0.30 1.70±0.38 0.22±0.35** 1.45±0.28 1.66±0.37 0.21±0.31** Intervention group 1.51±0.32 1.65±0.40 0.14±0.37** 1.48±0.31 1.61±0.38 0.13±0.38** Intervention effect, beta (95% CI) -0.08±0.01 (-0.10,-0.06) -0.08 (-0.10,-0.06) 0.702 p value‡ <0.001 <0.001 LDL-C (mmol/L), mean±SD Control group 2.20±0.60 2.31±0.64 0.12±0.49** 2.28±0.65 2.37±0.70 0.09±0.53** Intervention group 2.21±0.58 2.32±0.67 0.11±0.59** 2.30±0.64 2.38±0.73 0.09±0.62** Intervention effect, beta (95% CI) -0.01 (-0.05,0.03) -0.01 (-0.05,0.03) 0.367 p value‡ 0.516 0.553 CHO (mmol/L), mean±SD Control group 3.96±0.79 4.16±0.71 0.20±0.61** 4.04±0.85 4.20±0.76 0.16±0.61** Intervention group 4.23±0.74 4.10±0.75 -0.14±0.56** 4.27±0.80 4.13±0.82 -0.14±0.59** Intervention effect, beta (95% CI) -0.34 (-0.38,-0.30) -0.30 (-0.34,-0.26) 0.215 p value‡ <0.001 <0.001 TG (mmol/L), mean±SD Control group 0.82±0.49 0.86±0.44 0.04±0.56** 0.86±0.46 0.91±0.41 0.05±0.51** Intervention group 0.78±0.42 0.83±0.43 0.05±0.44** 0.81±0.39 0.88±0.55 0.07±0.54** Intervention effect, beta (95% CI) 0.01 (-0.03,0.05) 0.02 (-0.02,0.06) 0.577 p value‡ 0.534 0.291 †The difference between baseline and end of study for the same group. ‡p value for intervention effect. *p<0.01; **p<0.01.

1148 H Xu, Y Li, Q Zhang, X Hu, A Liu, S Du, T Li, H Guo, Y Li, G Xu, W Liu, J Ma and G Ma
Table 4. The effects of comprehensive intervention for different weight status children (mean±SD)
Malnutrition Normal weight Overweight/Obesity p for weight status
difference Baseline End of
study Change†
Baseline End of study Change† Baseline End of
study Change†
BMI (kg/m2) Control group 13.5±0.6 14.1±1.4 0.7±1.3** 16.0±1.4 16.7±2.1** 0.7±1.3** 21.5±3.0 22.5±3.3 1.0±2.0** Intervention group 13.4±0.7 14..2±1.9 0.8±1.6** 16.1±1.4 16.5±2.0 0.4±1.3** 21.5±3.3 22.0±3.2 0.5±2.6** Intervention effect, beta (95% CI) 0.1 (-0.2, 0.3) -0.3 (-0.3, -0.2) -0.6 (-0.8, -0.3) <0.001 p value‡ 0.521 <0.001 <0.001 BMI z score Control group -1.87±0.47 -1.66±0.88 0.21±0.87** -0.15±0.67 -0.11±0.93 0.04±0.62** 2.01±0.75 1.97±0.86 -0.04±0.64 Intervention group -1.94±0.57 -1.72±1.03 0.22±1.08** -0.10±0.67 -0.21±0.92 -0.12±0.64** 2.03±0.93 1.83±0.85 -0.20±0.81** Intervention effect, beta (95% CI) 0.01 (-0.16, 0.17) -0.16 (-0.20, -0.12) -0.16 (-0.24, -0.09) <0.001
p value‡ 0.922 <0.001 <0.001 Body fat (%) Control group 22.5±7.1 24.4±6.7 1.9±3.4** 25.2±6.6 27.2±6.3 2.1±3.2** 33.2±4.3 34.5±4.5 1.3±3.6** Intervention group 23.0±6.9 24.5±6.8 1.7±4.3** 25.1±6.6 26.3±6.5 1.4±3.5** 33.1±4.2 33.5±4.8 0.5±3.8**
Intervention effect, beta (95% CI) -0.2 (-0.8, 0.3) -0.8 (-1.0, -0.6) -0.9 (-1.3, -0.5) <0.001 p value‡ 0.442 <0.001 <0.001 Waist circumference (cm) Control group 49.5±3.2 52.3±4.3 2.7±2.6 54.7±5.0 58.0±6.3 3.3±3.4** 69.1±9.2 73.8±9.6 4.7±4.3** Intervention group 50.2±4.9 52.8±6.2 2.6±2.8 55.0±5.0 57.9±6.2 2.9±3.4** 69.0±8.7 73.0±9.3 3.9±4.7** Intervention effect, beta (95% CI) -0.1 (-0.6, 0.3) -0.4 (-0.6, 0.2) -0.8 (-1.3, -0.4) <0.001 p value‡ 0.510 <0.001 <0.001
†The difference between baseline and end of study for the same group. ‡p value for intervention effect. *p<0.01; **p<0.01.

Childhood obesity intervention in China 1149
may store more fat in their body (the girls had more body fat percentage than boys at baseline), which could make girls reduce less body fat than boys.
We found significant intervention effects on glucose and lipids. Although some school-based interventions have positive effects on overweight or obesity,41-43 most have not.44-46 Several short-term school-based programs altered glucose and/or insulin levels,47,48 even though they had no effect on the BMI. In our study, positive effects were found both on the BMI and also on the levels of glucose and lipids. The intervention effect sizes we ob-served were significant but small, which raise the con-cerns about clinical relevance. However, our intervention effect was population based. The slight improvement of the population distribution might result in a large decease of disease prevalence. Comparing the 2002 and 2012 China National Nutrition and Health Surveys, the mean level of glucose, Chol and TG increased by 0.75 mmol/L, 0.69 mmol/Land 0.28 mmol/L, respectively, in 10 years, which were paralleled by an increased prevalence of dia-betes from 2.0% in 2002 to 9.7% in 2012, dyslipidemia from 18.6% in 2002 to 40.4% in 2012.49 We observed an intervention effect of NISCOC of -0.2 mmoL/L glucose and -0.32 mmol/L total cholesterol with comprehensive intervention and -0.09 mmol/L TG by nutrition education intervention in one year; if these intervention effects were sustainable over 10 years, theoretically, the potential long term intervention effect would counter balance the in-creasing magnitude of the mean population increasing trend of glucose and dyslipidemia. A similar inference for childhood obesity was observed. From 2002 to 2012, the 10-year increased BMI ranged from 0.4 to 1.8 kg/m2,49 with a mean value of 0.14 kg/m2/year, among children aged 6-13 years, which was much less than our interven-tion effects of 0.3 kg/m2/year of comprehensive interven-tion.
One popular concern of childhood obesity intervention trials is that the intervention on preventing obesity may cause harmful effect for malnourished students. So we stratified our analysis of intervention effect by BMI status in this study. We didn’t observe any negative effect among stunting participants. Although there’s less body fat and waist circumference increase (not significantly), there was a greater BMI and BMI z scores increase among malnutrition students in intervention group than control group.
The limitations of our study included that the interven-tion was only in urban and not in rural areas, and the BMI z scores were slightly different between control and inter-vention group at baseline. Also, H1N1 spread in the sec-ond half year of 2009, just at the beginning of the inter-vention study. Many schools refused the staff members from our study group to enter the schools for supervising the intervention implementation, which at least in part, weakened the intervention effect. Another fact, which we have to consider, is that Happy 10 activity may not be added to the normal PA of the students, but somehow replaced some other kinds of activities, which also could weaken our intervention effect from the theoretical level. So we insisted that the Happy 10 program should be con-ducted twice a day instead of the sedentary activity to reduce the sedentary time. No long-term follow-up is
available, so it is not known whether these intervention effects will persist once the obligatory school-based PA stops.
In conclusion,we observed significantly moderate in-tervention effects on the prevalence of overweight and obesity, BMI, BMI z scores, waist circumference, body fat percentage, plasma glucose and lipid index. The school-based comprehensive intervention could be used for prevention of childhood obesity in China. ACKNOWLEDGEMENTS We would like to acknowledge the support from all the team members and the participating students, teachers, parents and local education and health staffs. AUTHOR DISCLOSURES We declare that the authors have no competing interests. This project was funded by China Ministry of Science & Technology as Key Projects in the National Science & Technology Pillar Program during the Eleventh Five-Year Plan Period. [2008BAI58B05]. REFERENCES 1. Wasir JS, Misra A. The metabolic syndrome in Asian
Indians: impact of nutritional and Socio-economic transition in India. Metab Syndr Relat Disord. 2004;2:14-23. doi: 10. 1089/met. 2004.2.14.
2. Misra A, Khurana L. Obesity and the metabolic syndrome in developing countries. J Clin Endocrinol Metab. 2008;93:S9-30. doi: 10.1210/jc.2008-1595.
3. Chadha DS, Gupta N, Goel K, Pandey RM, Kondal D, Ganjoo RK, Misra A. Impact of obesity on the left ventricular functions and morphology of healthy Asian Indians. Metab Syndr Relat Disord. 2009;7:151-8. doi: 10. 1089/met.2008.0054.
4. Goel K, Misra A, Vikram NK, Poddar P, Gupta N. Subcutaneous abdominal adipose tissue is associated with the metabolic syndrome in Asian Indians independent of intra-abdominal and total body fat. Heart. 2010;96:579-83. doi: 10.1136/hrt.2009.183236.
5. Freedman DS, Dietz WH, Srinivasan SR, Berenson GS. The relation of overweight to cardiovascular risk factors among children and adolescents: the Bogalusa heart study. Pediatrics. 1999;103:1175-82.
6. Must A. Morbidity and mortality associated with elevated body weight in children and adolescents. Am J Clin Nutr. 1996;63:445S-7S.
7. Virdis A, Ghiadoni L, Masi S, Versari D, DaghiniE, GiannarelliC, Salvetti A, Taddei S. Obesity in the childhood: a link to adult hypertension. Curr Pharm Des. 2009;15: 1063-71.
8. Biro FM, Wien M. Childhood obesity and adult morbidities. Am J Clin Nutr. 2010;91:1499S-505S. doi: 10.3945/ajcn. 2010.28701B.
9. Gupta N, Goel K, Shah P, Misra A. Childhood obesity in developing countries: epidemiology, determinants, and prevention. Endocr Rev. 2012;33:48-70. doi: 10.1210/er.20 10-0028.
10. Moraes SA, Beltra´n Rosas J, Mondini L, Freitas IC. Prevalence of overweight and obesity, and associated factors in school children from urban area in Chilpancingo, Guerrero, Mexico, 2004. Cad Saude Publica. 2006;22:1289-301. doi: /S0102-311X2006000600018.
11. de Assis MA, Rolland-Cachera MF, Grosseman S, de Vasconcelos FA, Luna ME, CalvoMC, Barros MV, Pires MM, Bellisle F. Obesity, overweight and thinness in school
1150 H Xu, Y Li, Q Zhang, X Hu, A Liu, S Du, T Li, H Guo, Y Li, G Xu, W Liu, J Ma and G Ma
children of the city of Florianopolis, Southern Brazil. Eur J Clin Nutr. 2005;59:1015-21. doi: 10.1038/sj.ejcn.1602206.
12. Wang Y, Monteiro C, Popkin BM. Trends of obesity and underweight in older children and adolescents in the United States, Brazil, China, and Russia. Am J Clin Nutr. 2002;75: 971-7.
13. Mo-suwan L, Junjana C, Puetpaiboon A. Increasing obesity in school children in a transitional society and the effect of the weight control program. Southeast Asian J Trop Med Public Health. 1993;24:590-4.
14. Bhardwaj S, Misra A, Khurana L, Gulati S, Shah P, Vikram NK. Childhood obesity in Asian Indians: a burgeoning cause of insulin resistance, diabetes and sub-clinical inflammation. Asia Pac J Clin Nutr. 2008;17:172-5.
15. Verstraeten R, Roberfroid D, Lachat C, Leroy JL, Holdsworth M, Maes L, Kolsteren PW. Effectiveness of preventive school-based obesity interventions in low- and middle-income countries: a systematic review. Am J Clin Nutr. 2012;96:415-38. doi: 10.3945/ajcn.112.035378.
16. Wang Y, Lobstein T. Worldwide trends in childhood overweight and obesity. Int J Pediatr Obes. 2006;1:11-25.
17. DeOnis M, Blossner M. Prevalence and trends of overweight among preschool children in developing countries. Am J Clin Nutr. 2000;72:1032-9.
18. Zhao W, Zhai Y, Hu J, Wang J, Yang Z, Kong L, Chen C. Economic burden of obesity related chronic disease in mainland China. Obes Rev. 2008;9(Suppl 1):62-7. doi: 10. 1111/ j.1467-789X.2007.00440.x.
19. Guo SS, Chumlea WC. Tracking of body mass index in children in relation to overweight in adulthood. Am J Clin Nutr. 1999;70:145S-8S.
20. Serdula MK, Ivery D, Coates RJ, Freedman DS, Williamson DF, Byers T. Do obese children become obese adults? A review of the literature. Prev Med. 1993;22:167-77. doi: 10. 1006/pmed.1993.1014.
21. Whitaker RC, Wright JA, Pepe MS, Seidel KD, Dietz WH. Predicting obesity in young adulthood from childhood and parental obesity. N Engl J Med. 1997;337:869-73. doi: 10. 1056/ NEJM199709253371301.
22. Must A, Strauss RS. Risks and consequences of childhood and adolescent obesity. Int J Obes Relat Metab Disord. 1999; 23:S2-11.
23. Swinburn B, Gill T, Kumanyika S. Obesity prevention: a proposed framework for translating evidence into action. Obes Rev. 2005;6:23-33. doi: 10.1111/j.1467-789X.2005.00 184.x.
24. Brown T, Summerbell C. Systematic review of school-based interventions that focus on changing dietary intake and physical activity levels to prevent childhood obesity: an update to the obesity guidance produced by the National Institute for Health and Clinical Excellence. Obes Rev. 2009; 10:110-41. doi: 10.1111/j.1467-789X.2008.00515.x.
25. Khambalia AZ, Dickinson S, Hardy LL, Gill T, Baur LA. A synthesis of existing systematic reviews and meta-analyses of school-based behavioural interventions for controlling and preventing obesity. Obes Rev. 2012;13:214-33. doi: 10. 1111/j.1467-789X.2011.00947.x.
26. Li YP, Hu XQ, Schouten EG, Liu AL, Du SM, Li LZ et al. Report on childhood obesity in China (8): effects and sustainability of physical activity intervention on body composition of Chinese youth. Biomed Environ Sci. 2010; 23:180-7. doi: 10.1016/S0895-3988(10)60050-5.
27. Gu D, He J, Duan X, Reynolds K, Wu X, Chen J, Huang G, Chen CS, Whelton PK. Body weight and mortality among men and women in China. JAMA. 2006;295:776-83. doi: 10. 1001/jama.295.7.776
28. Popkin BM, Kim S, Rusev ER, Du S, Zizza C. Measuring the full economic costs of diet, physical activity and obesity-related chronic diseases. Obes Rev. 2006,7:271-93. doi: 10. 1111/ j.1467-789X.2006.00230.x
29. Li Y, Hu X, Zhang Q, Liu A, Fang H, Hao L et al. The nutrition-based comprehensive intervention study on childhood obesity in China (NISCOC): a randomized cluster controlled trial. BMC Public Health. 2010;10:229. doi: 10. 1186/1471-2458-10-229.
30. Meng L, Xu H, Liu A, van Raaij J, Bemelmans W, Hu X et al. The costs and cost-effectiveness of a school-based comprehensive intervention study on childhood obesity in China. PLoS One. 2013;8:e77971. doi: 10.1371/journal. pone.0077971.
31. Wang JJ, Lau WC, Wang HJ, Ma J. Evaluation of a comprehensive intervention with a behavioural modification strategy for childhood obesity prevention: a nonrandomized cluster controlled trial. BMC Public Health. 2015;15:1206. doi: 10.1186/s12889-015-2535-2.
32. Ma G, Hu X. Healthy school. Beijing, China: Population Publisher; 2009.
33. Liu A, Hu X, Ma G, Cui Z, Pan Y, Chang S, Zhao W, Chen C. Evaluation of a classroom-based physical activity promoting programme. Obes Rev. 2008;9:130-4. doi: 10. 1111/j.1467-789X.2007. 00454.x.
34. Group of China Obesity Task Force. Body mass index reference norm for screening overweight and obesity in Chinese children and adolescents. Chin J Epidemiol. 2004; 25:97-102.
35. WS/T 456-2014 screening of malnutrition in children and adolescents. Beijing: China Standard Press; 2014.
36. Deurenberg P, Kooy K van der, LeenenR, Weststrate JA, Seidell JC. Sex and age specific prediction formulas for estimating body composition from bio-electrical impedance: a cross validation study. Int J Obes. 1991;15:17-25.
37. Sobol-Goldberg S, Rabinowitz J, Gross R. School-based obesity prevention programs: a meta-analysis of randomized controlled trials. Obesity (Silver Spring). 2013;21:2422-8. doi: 10.1002/oby.20515.
38. Cai L, Wu Y, Cheskin LJ, Wilson RF, Wang Y. Effect of childhood obesity prevention programmes on blood lipids: a systematic review and meta-analysis. Obes Rev. 2014;15: 933-44. doi: 10.1111/obr.12227.
39. Jansen W, Borsboom G, Meima A, Zwanenburg EJ, Mackenbach JP, Raat H, Brug J. Effectiveness of a primary school-based intervention to reduce overweight. Int J Pediatr Obes. 2011;6:e70-7. doi: 10.3109/17477166.2011.575151.
40. Kain J, Uauy R, Leyton B, Cerda R, Olivares S, Vio F. Effectiveness of a dietary and physical activity intervention to prevent obesity in school age children. Rev Med Chil. 2008;136:22-30. doi: /S0034-98872008000100003.
41. Gortmaker SL, Peterson K, Wiecha J, Sobol AM, Dixit S, Fox MK, Laird N. Reducing obesity via a school-based interdisciplinary intervention among youth: Planet Health. Arch Pediatr Adolesc Med. 1999;153:409-18.
42. James J, Thomas P, Cavan D, Kerr D. Preventing childhood obesity by reducing consumption of carbonated drinks: cluster randomised controlled trial. BMJ. 2004;328:1237. doi: 10.1136/bmj. 38077.458438.EE.
43. Foster GD, Sherman S, Borradaile KE, Grundy KM, Vander Veur SS, Nachmani J, Karpyn A, Kumanyika S, Shults J. A policy-based school intervention to prevent overweight and obesity. Pediatrics. 2008;121:e794-802. doi: 10.1542/peds. 2007-1365.
44. Luepker RV, Perry CL, McKinlay SM, Nader PR, Parcel GS, Stone EJ et al. Outcomes of a field trial to improve children’s dietary patterns and physical activity: the Child

Childhood obesity intervention in China 1151
and Adolescent Trial for Cardiovascular Health. JAMA. 1996;275:768-76.
45. Lohman T, Norman J, Story M, Stone EJ, Stephenson L, Stevens J; Pathways Study Research Group. Pathways: a school-based, randomized controlled trial for the prevention of obesity in American Indian school children. Am J Clin Nutr. 2003;78:1030-8.
46. Katz DL, O’Connell M, Njike VY, YehMC, Nawaz H. Strategies for the prevention and control of obesity in the school setting: systematic review and meta-analysis. Int J Obes (Lond). 2008;32:1780-9. doi: 10.1038/ijo.2008.158.
47. Trevino RP, Yin Z, Hernandez A, HaleDE, Garcia OA, Mobley C. Impact of the Bienestar school-based diabetes
mellitus prevention program on fasting capillary glucose levels: a randomized controlled trial. Arch Pediatr Adolesc Med. 2004;158:911-7. doi: 10.1001/archpedi.158.9.911.
48. Rosenbaum M, Nonas C, Weil R, Horlick M, Fennoy I, Vargas I, Kringas P; Camino Diabetes Prevention Group. School-based intervention acutely improves insulin sensitivity and decreases inflammatory markers and body fatness in junior high school students. J Clin Endocrinol Metab. 2007;92:504-8. doi: 10.1210/jc.2006-1516.
49. Bureau of Disease Prevention and Controlof National Health and Family Planning. Commission. China National Nutrition and Chronic Disease Status Report (2015). Beijing, China: People’s Medical Publishing House; 2015.