A SPONTANEOUS RAYLEIGH-BRILLOUIN SCATTERING EXPERIMENT FOR THE CHARACTERIZATION OF ATMOSPHERIC

Comprehensive model for studying noiseinduced by self-homodyne detection of
backward Rayleigh scattering in opticalfibers
Michael Fleyer,1,∗ James P. Cahill,2,3 Moshe Horowitz,1 Curtis R.Menyuk,2 and Olukayode Okusaga4
1Technion - Israel Institute of Technology, Haifa 3200, Israel2University of Maryland Baltimore County, Baltimore, Maryland 21250, USA
3United States Army Research Laboratory, Adelphi, Maryland, 20873, USA4The Johns Hopkins University Applied Physics Laboratory, 11100 Johns Hopkins Rd, Laurel,
MD 20723, USA∗[email protected]
Abstract: Backward Rayleigh scattering in optical fibers due to thefluctuations that are “frozen-in” to the fiber during the manufacturingprocess may limit the performance of optical sensors and bidirectionalcoherent optical communication systems. In this manuscript we describe acomprehensive model for studying intensity noise induced by spontaneousRayleigh backscattering in optical systems that are based on self-homodynedetection. Our model includes amplitude and frequency noise of the lasersource, random distribution of the scatterers along the fiber, and phasenoise induced in fibers due to thermal and mechanical fluctuations. Themodel shows that at frequencies above about 10 kHz the noise spectrum isdetermined by the laser white frequency noise. The laser flicker frequencynoise becomes the dominant effect at lower frequencies. The noise ampli-tude depends on the laser polarization. A very good agreement betweentheory and experiment is obtained for fibers with a length between 500 m to100 km and for a laser with a linewidth below 5 kHz.
© 2015 Optical Society of America
OCIS codes: (290.1350) Scattering; (290.5870) Rayleigh.
References and links1. C. K. Kirkendall and A. Dandridge, “Overview of high performance fibre-optic sensing,” J. Phys. (Paris) D:
Appl. Phys. 37(18), R197–R216 (2004).2. M. Froggatt and J. Moore, “High-spatial-resolution distributed strain measurement in optical fiber with Rayleigh
scatter,” Appl. Opt. 37(10), 5162–5164 (1998).3. E. Ip, A. P. T. Lau, D. J. F. Barros, and J. M. Kahn, “Coherent detection in optical fiber systems,” Opt. Express
16(2), 753–791 (2008).4. R. K. Staubli and P. Gysel, “Crosstalk penalties due to coherent Rayleigh noise in bidirectional optical commu-
nication systems,” J. Lightwave Technol. 9(3), 375–380 (1991).5. U. H. Hong, K. Y. Cho, Y. Takushima, and Y. C. Chung, “Effects of Rayleigh backscattering in long-reach
RSOA-based WDM PON,” in Optical Fiber Communication Conference, 2010 OSA NFOEC (Optical Societyof America, 2010), paper OThG1.
6. P. Gysel and R. K. Staubli, “Statistical properties of Rayleigh backscattering in single-mode fibers,” J. LightwaveTechnol. 8(4), 561–567 (1990).
#242975 Received 22 Jun 2015; revised 3 Sep 2015; accepted 4 Sep 2015; published 22 Sep 2015 (C) 2015 OSA 5 Oct 2015 | Vol. 23, No. 20 | DOI:10.1364/OE.23.025635 | OPTICS EXPRESS 25635

7. O. Okusaga, W. Zhou, J. Cahill, A. Docherty, C. R. Menyuk, “Optical scattering induced noise in RF-photonicsystems,” in Proceedings of IEEE Conference on Frequency Control (IEEE, 2011) pp. 1–6.
8. O. Okusaga, W. Zhou, J. Cahill, A. Docherty, C. R. Menyuk, “Fiber-induced degradation in RF-over-fiber links,”Proceedings of IEEE Conference on Frequency Control (IEEE, 2012) pp. 1–5.
9. J. P. Cahill, O. Okusaga, W. Zhou, C. R. Menyuk, and G. M. Carter, “Superlinear growth of Rayleigh scattering-induced intensity noise in single-mode fibers,” Opt. Express 23(5), 6400–6407 (2015).
10. S. A. Diddams, “The evolving optical frequency comb [Invited],” J. Opt. Soc. Am. B 27(11), B51–B62 (2010).11. N. L. Laberge, V. V. Vasilescu, C. J. Montrose, and P. B. Macedo, “Equilibrium compressibilities and density
fluctuations in K2O−SiO2 glasses,” J. of the American Ceramic Society 56(10), 506–509 (1973).12. J. Schroeder, R. Mohr, P. B. Macedo and C. J. Montrose, “Rayleigh and Brillouin scattering in K2O− SiO2
glasses,” J. American Ceramic Society 56(10), 510–514 (1973).13. T. Watanabe, K. Saito, and A. J. Ikushima, “Fictive temperature dependence of density fluctuation in SiO2 glass,”
J. Appl. Phys. 94(8), 4824–4827 (2003).14. R. Le Parc, B. Champagnon, C. Levelut, V. Martinez, L. David, A. Faivre, I. Flammer, J. L. Hazemann, and J.
P. Simon, “Density and concentration fluctuations in SiO2 −GeO2 optical fiber glass investigated by small anglex-ray scattering,” J. Appl. Phys. 103(9), 094917 (2008).
15. C. Levelut, A. Faivre, R. Le Parc, B. Champagnon, J.-L. Hazemann, and J.-P. Simon, “In situ measurements ofdensity fluctuations and compressibility in silica glasses as a function of temperature and thermal history,” Phys.Rev. B 72(22), 22421 (2005).
16. M. E. Froggatt and D. K. Gifford, “Rayleigh backscattering signatures of optical fibers - their properties andapplications,” in Optical Fiber Communication Conference, OSA Technical Digest (online) (Optical Society ofAmerica, 2013), paper OW1K.6.
17. S. T. Kreger, D. K. Gifford, M. E. Froggatt, B. J. Soller, and M. S. Wolfe, “High resolution distributed strain ortemperature measurements in single- and multi-mode fiber using swept-wavelength interferometry,” in OpticalFiber Sensors Conference, OSA Technical Digest (CD) (Optical Society of America, 2006), paper ThE42.
18. K. H. Wanser, “Fundamental phase noise limit in optical fibres due to temperature fluctuations,” Electron.Lett. 28(1), 53–54 (1992).
19. L. Z. Duan,“Intrinsic thermal noise of optical fibres due to mechanical dissipation,” Electron. Lett. 46(22), 1515–1516 (2010).
20. R. E. Bartolo, A. B. Tveten, and A. Dandridge, “Thermal phase noise measurements in optical fiber interferom-eters,” IEEE J. Quantum Electron. 48(5), 720–727 (2012).
21. J. Minar, H. de Riedmatten, C. Simon, H. Zbinden, and N. Gisin, “Phase-noise measurements in long-fiberinterferometers for quantum-repeater applications,” Phys. Rev. A 77(5), 052325 (2008).
22. R. M. Herman and M. A. Gray, “Theoretical prediction of the stimulated thermal Rayleigh scattering in liquids,”Phys. Rev. Lett. 19(15), 824–828 (1967).
23. T. Zhu, X. Bao, L. Chen, H. Liang, and Y. Dong, “Characteristics of stimulated Rayleigh scattering in opticalfibers,” Proc. SPIE 7753, 77532R (2011).
24. R. C. Jones, “A new calculus for the treatment of optical systems,” J. Opt. Soc. Am. 31(7), 488–493 (1941).25. M. O. Van Deventer, “Polarization properties of Rayleigh backscattering in single-mode fibers,” J. Lightwave
Technol. 11(12), 1895–1899 (1993).26. F. Corsi, A. Galtarossa, and L. Palmieri, “Polarization mode dispersion characterization of single-mode optical
fiber using backscattering technique,” J. Lightw. Technol. 16(10), 1832–1843 (1998).27. R. W. Boyd, Nonlinear Optics, 3rd ed. (Elsevier, 2008).28. Y. Yamamoto, “AM and FM quantum noise in semiconductor lasers - part I: theoretical analysis,” IEEE J.
Quantum Electron. 19(1), 34–46 (1983).29. K. Saito and A. J. Ikushima, “Reduction of light-scattering loss in silica glass by the structural relaxation of
frozen-in density fluctuations,” Appl. Phys. Lett. 70(26), 3504–3506 (1997).30. A. E. Alekseev and V. T. Potapov, “Noise power spectral density of a fibre scattered-light interferometer with a
semiconductor laser source,” Quantum Electron. 43(10), 968 – 973 (2013).31. P. Healey, “Statistics of Rayleigh backscatter from a single-mode fiber ,” IEEE Trans. Commun. Technol. 35(2),
210–214 (1987).32. O. Tosoni, S. B. Aksenov, E. V. Podivilov, and S. A. Babin, “Model of a fibreoptic phase-sensitive reflectometer
and its comparison with the experiment,” Quantum Electron. 40(10), 887–892 (2010).33. A. Docherty, C. R. Menyuk, J. P. Cahill, O. Okusaga, and W. Zhou, “Rayleigh-scattering-induced RIN and
amplitude-to-phase conversion as a source of length-dependent phase noise in OEOs,” IEEE Photonics J. 5(2),5500514 (2013).
34. P. K. A. Wai and C. R. Menyuk, “Polarization mode dispersion, decorrelation, and diffusion in optical fibers withrandomly varying birefringence,” J. Lightwave Technol. 14(2), 148–157 (1996).
35. I. Reed, “On a moment theorem for complex Gaussian processes,” IRE Trans. Inform. Theory 8(3), 194–195 (1962).
36. C. D. Poole and D. L. Favin, “Polarization-mode dispersion measurement based on transmission spectra througha polarizer,” J. Lightw. Technol. 12(6), 917–929 (1994).
#242975 Received 22 Jun 2015; revised 3 Sep 2015; accepted 4 Sep 2015; published 22 Sep 2015 (C) 2015 OSA 5 Oct 2015 | Vol. 23, No. 20 | DOI:10.1364/OE.23.025635 | OPTICS EXPRESS 25636

37. K. Kikuchi, “Effect of l/f-Type FM Noise on semiconductor-laser linewidth residual in high-power limit,” IEEEJ. Quantum Electron. 25(4), 684–688 (1989).
38. G. L. Abbas, V. W. S. Chan, and T. K. Yee, “Local-oscillator excess-noise suppression for homodyne and hetero-dyne detection,” Opt. Lett. 8(8), 419–421 (1983).
39. L. B. Mercer, “1/f frequency noise effects on self-heterodyne linewidth measurements,” J. Lightwave Tech-nol. 9(4), 485–493 (1991).
40. O. Llopis, P. H. Merrer, H. Brahimi, K. Saleh, and P. Lacroix, “Phase noise measurement of a narrow linewidthCW laser using delay line approaches,” Opt. Lett. 36(14), 2713–2715 (2011).
41. I. S. Gradshteyn and I. M. Ryzhik, Table of Integrals, Series, and Products, 7th ed. (Academic, 2007).42. Corning product information, “Corning single-mode optical fiber,” (Corning,
2002), http://www.corning.com.43. G. D. Domenico, S. Schilt, and P. Thomann, “Simple approach to the relation between laser frequency noise and
laser line shape,” Appl. Opt. 49(25), 4801–4807 (2010).44. Teraxion white paper, “Narrow-linewidth semiconductor lasers: one technique does not fit all,” (Teraxion, 2011),
http://www.teraxion.com.45. B. E. A. Saleh, M. C. Teich, Fundamentals of Photonics, 2nd ed. (Wiley, 2007).46. A. Galtarossa, L. Palmieri, M. Schiano, and T. Tambosso, “Measurement of birefringence correlation length in
long, single-mode fibers,” Opt. Lett. 26(13), 962–964 (2001).
1. Introduction
Optical fiber sensors and their applications have been intensively studied due to their advanta-geous attributes such as immunity to electromagnetic interference (EMI), light weight, smallsize, high sensitivity, and the ability to perform sensing over a very long distance [1]. Manyof these sensors are based on self-homodyne detection in which the signal interferes with theoutput of the optical source in order to detect small phase changes. Distributed fiber sensorsthat are based on Rayleigh backscattering have also been intensively studied [2].
Self-homodyne detection is also used in optical communication systems [3]. In such sys-tems, the noise that is induced by Rayleigh backscattering may deteriorate the performanceof bidirectional coherent communication systems [4, 5] since the backscattering adds signifi-cant low-frequency noise. The spectrum of backward Rayleigh scattering that is due to laserwhite frequency noise was calculated in [6]. For the case of self-homodyne detection, the noisespectrum was calculated in that work assuming that the coherence length of the laser, givenby the laser white frequency noise, is significantly shorter than the fiber length. Recently, noiseinduced by Rayleigh backscattering has been experimentally studied using a self-homodyne de-tection scheme [7–9]. In these recent works, the laser coherence length can be long comparedto the fiber length. Long coherence length sources have important applications to precise timeand frequency transfer over optical fibers [10]. Thus, there is a need for a comprehensive modelthat is not limited to sources with a short coherence length.
In this manuscript, we present a comprehensive model to describe the intensity noise spec-trum that is induced by Rayleigh backscattering in optical fiber systems that use self-homodynedetection. In these systems, noise is principally due to beating between the backward Rayleighscattered wave and the source. The main effects that lead to backscattered propagating wavesin optical fibers are Rayleigh and Brillouin scattering. When the incident optical power in thefiber is weaker than a few dBm, the dominant effect is the spontaneous Rayleigh scatteringcaused by inhomogeneities in the refractive index that are “frozen-in” during the transition ofthe liquid silica to the glassy state [11–14]. The presence of these small-scale density fluctua-tions has been validated by small-angle x-ray scattering measurements of the silica glass [15].The density fluctuations can be used as a unique fiber signature, since the scattering patterndoes not change over a long period of years [16], unless some external strain or temperature isapplied [17].
Our comprehensive model takes into account various effects that are required to accuratelymodel self-homodyne detection of backward Rayleigh scattering in optical fibers. In particular,
#242975 Received 22 Jun 2015; revised 3 Sep 2015; accepted 4 Sep 2015; published 22 Sep 2015 (C) 2015 OSA 5 Oct 2015 | Vol. 23, No. 20 | DOI:10.1364/OE.23.025635 | OPTICS EXPRESS 25637
we include in the model the flicker frequency noise of the laser. This noise source, which wasnot considered in previous models [4, 6], strongly affects the Rayleigh backscattered wave. Wealso include laser amplitude noise, phase noise that is due to mechanical dissipation and thermalfluctuations in the optical fibers [18–20], and the effect of random birefringence in fibers.
We show that the laser phase noise is converted into intensity noise due to beating of theRayleigh backscattered wave with the source. The generated noise spectrum has a complex de-pendence on the frequency and on the spectrum of the laser source. The laser flicker frequencynoise is the dominant effect at low frequencies, f < c/(2nL), where L is a fiber length, c isthe speed of light in the vacuum, and n is the fiber refractive index. When the laser coherencelength is longer than the fiber length, we find a complex dependence of the noise spectrum onthe fiber. When the fiber length is longer than the laser coherence length, the noise spectrumis approximately a Lorentzian-shaped with a flicker noise component at low frequencies. For alaser with a long coherence length, the noise spectrum is multiplied by a factor that depends onthe laser polarization and varies between 1/3 to 2/3.
The theoretical model was compared to experimental results that were obtained for a laserwith a narrow linewidth below 5 kHz. We find good quantitative agreement between theoryand experimental data at frequencies above 200 Hz for fiber lengths between 6 to 100 km. Forshorter fibers with lengths between 500 m to 6 km, we only obtained good agreement at higherfrequencies of more than about 500 Hz.
We also found that the phase noise that is due to mechanical dissipation and thermal fluctua-tions that is accumulated by waves propagating in the fiber [18–20] does not significantly affectthe noise spectrum of the self-homodyne detected Rayleigh backscattering. Such phase noise isimportant in interferometric sensors where the difference between the two interferometer armsis on the order of centimeters [20], so that the effect of laser phase noise is not significant.
Changes in the fiber that are due to fluctuations in environmental conditions will add a stronglow-frequency components to the noise spectrum [21]. This noise can be modeled by adding itto the fundamental noise due to mechanical dissipation and thermal fluctuations in fibers. How-ever, since environmental noise depends on the specific perturbation and fiber geometry [21],we do not include it in our model. We attribute the discrepancy between theory and experimentat low frequencies below 500 Hz to this noise source.
For sufficiently high incident power, stimulated Rayleigh scattering may occur [7, 22, 23].In our experiments, the Rayleigh backscattered power grew approximately linearly with theinput optical power when it was changed between 0 to 15 dBm. We conclude that stimulatedscattering was not an important factor in our experiments.
2. Rayleigh backscattering model
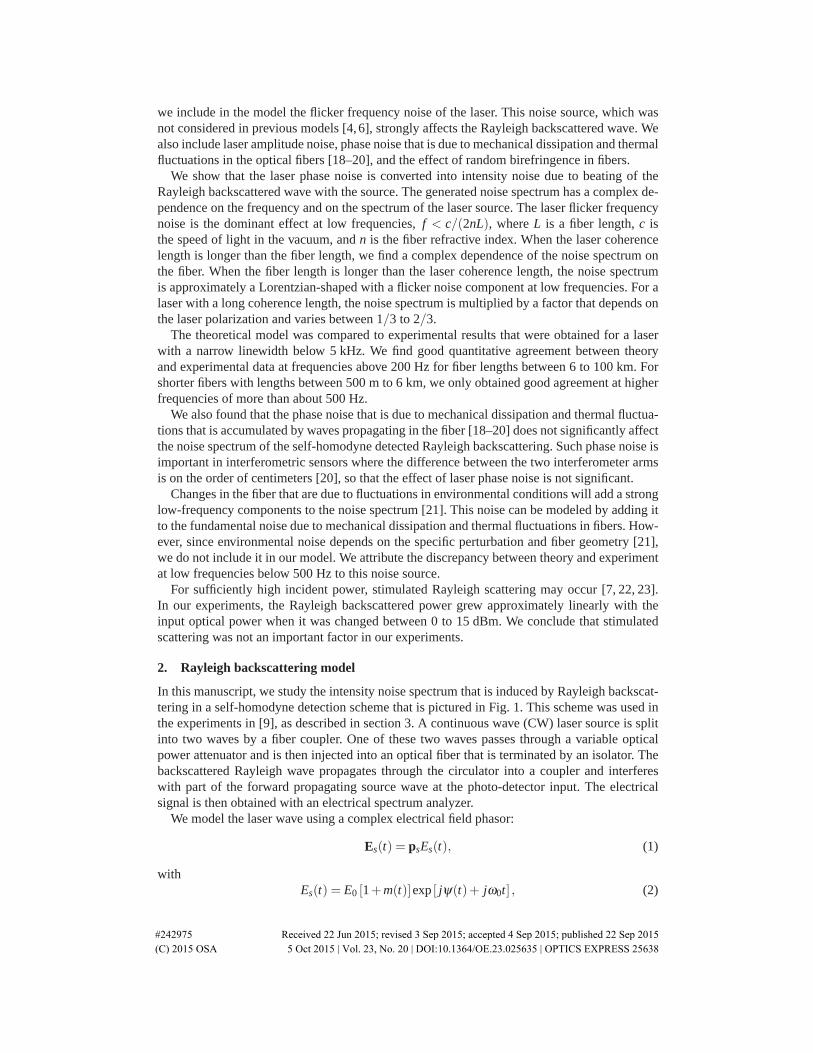
In this manuscript, we study the intensity noise spectrum that is induced by Rayleigh backscat-tering in a self-homodyne detection scheme that is pictured in Fig. 1. This scheme was used inthe experiments in [9], as described in section 3. A continuous wave (CW) laser source is splitinto two waves by a fiber coupler. One of these two waves passes through a variable opticalpower attenuator and is then injected into an optical fiber that is terminated by an isolator. Thebackscattered Rayleigh wave propagates through the circulator into a coupler and interfereswith part of the forward propagating source wave at the photo-detector input. The electricalsignal is then obtained with an electrical spectrum analyzer.
We model the laser wave using a complex electrical field phasor:
Es(t) = psEs(t), (1)
withEs(t) = E0 [1+m(t)]exp [ jψ(t)+ jω0t] , (2)
#242975 Received 22 Jun 2015; revised 3 Sep 2015; accepted 4 Sep 2015; published 22 Sep 2015 (C) 2015 OSA 5 Oct 2015 | Vol. 23, No. 20 | DOI:10.1364/OE.23.025635 | OPTICS EXPRESS 25638
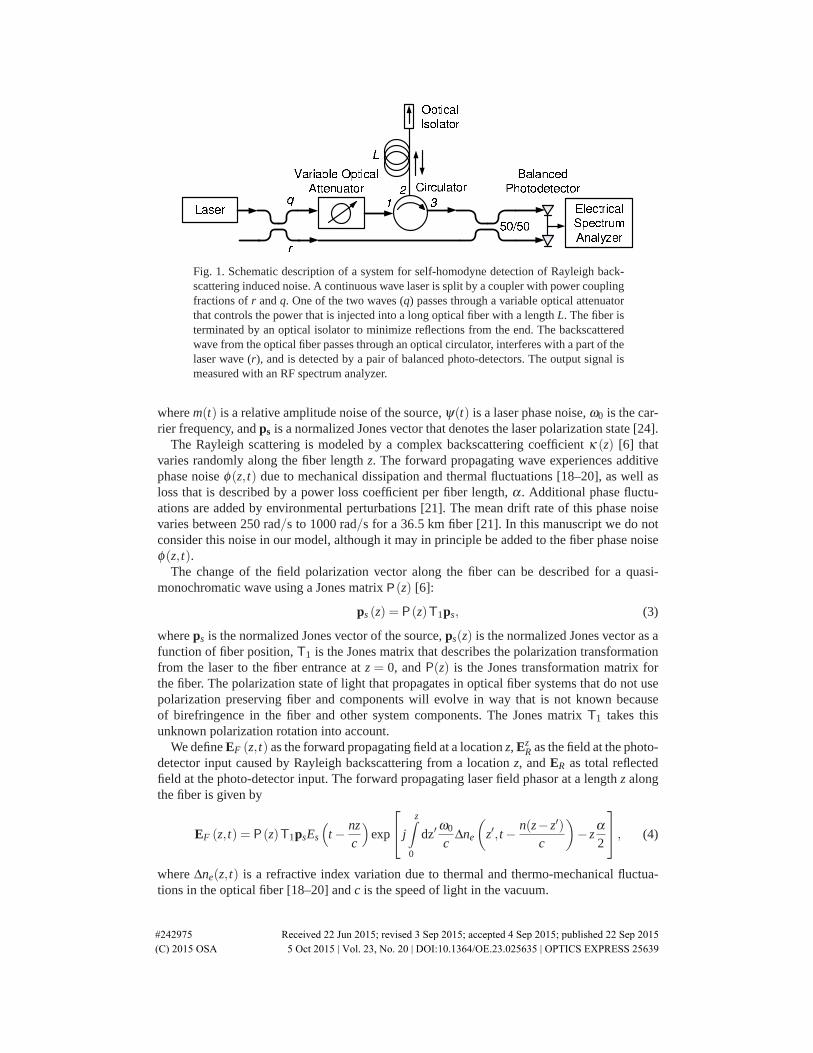
Fig. 1. Schematic description of a system for self-homodyne detection of Rayleigh back-scattering induced noise. A continuous wave laser is split by a coupler with power couplingfractions of r and q. One of the two waves (q) passes through a variable optical attenuatorthat controls the power that is injected into a long optical fiber with a length L. The fiber isterminated by an optical isolator to minimize reflections from the end. The backscatteredwave from the optical fiber passes through an optical circulator, interferes with a part of thelaser wave (r), and is detected by a pair of balanced photo-detectors. The output signal ismeasured with an RF spectrum analyzer.
where m(t) is a relative amplitude noise of the source, ψ(t) is a laser phase noise, ω0 is the car-rier frequency, and ps is a normalized Jones vector that denotes the laser polarization state [24].
The Rayleigh scattering is modeled by a complex backscattering coefficient κ (z) [6] thatvaries randomly along the fiber length z. The forward propagating wave experiences additivephase noise φ(z, t) due to mechanical dissipation and thermal fluctuations [18–20], as well asloss that is described by a power loss coefficient per fiber length, α . Additional phase fluctu-ations are added by environmental perturbations [21]. The mean drift rate of this phase noisevaries between 250 rad/s to 1000 rad/s for a 36.5 km fiber [21]. In this manuscript we do notconsider this noise in our model, although it may in principle be added to the fiber phase noiseφ(z, t).
The change of the field polarization vector along the fiber can be described for a quasi-monochromatic wave using a Jones matrix P(z) [6]:
ps (z) = P(z)T1ps, (3)
where ps is the normalized Jones vector of the source, ps(z) is the normalized Jones vector as afunction of fiber position, T1 is the Jones matrix that describes the polarization transformationfrom the laser to the fiber entrance at z = 0, and P(z) is the Jones transformation matrix forthe fiber. The polarization state of light that propagates in optical fiber systems that do not usepolarization preserving fiber and components will evolve in way that is not known becauseof birefringence in the fiber and other system components. The Jones matrix T1 takes thisunknown polarization rotation into account.
We define EF (z, t) as the forward propagating field at a location z, EzR as the field at the photo-
detector input caused by Rayleigh backscattering from a location z, and ER as total reflectedfield at the photo-detector input. The forward propagating laser field phasor at a length z alongthe fiber is given by
EF (z, t) = P(z)T1psEs
(t − nz
c
)exp
⎡⎣ j
z∫
0
dz′ω0
cΔne
(z′, t − n(z− z′)
c
)− z
α2
⎤⎦ , (4)
where Δne(z, t) is a refractive index variation due to thermal and thermo-mechanical fluctua-tions in the optical fiber [18–20] and c is the speed of light in the vacuum.
#242975 Received 22 Jun 2015; revised 3 Sep 2015; accepted 4 Sep 2015; published 22 Sep 2015 (C) 2015 OSA 5 Oct 2015 | Vol. 23, No. 20 | DOI:10.1364/OE.23.025635 | OPTICS EXPRESS 25639
Backward Rayleigh scattering in optical fibers is caused due to density fluctuations that are“frozen-in” during the manufacturing process. The field that is backscattered from a location zcreates a signal at the photo-detector,
EzR (t) = T2PT (z)EF
(z, t − nz
c
)κ (z)exp
⎡⎣− j
0∫
z
dz′ω0
cΔne
(z′, t − nz′
c
)− z
α2
⎤⎦ , (5)
where PT (z) is the transposed Jones matrix that describes the backward propagation of thescattered wave [25, 26], κ (z) is the local reflection due to Rayleigh backscattering, and T2 isthe Jones transformation matrix from the entrance to the fiber to the photo-detector.
The total reflected wave at the photo-detector is obtained by integrating the local reflectionsalong the fiber and then substituting Eq. (4) into Eq. (5) to yield
ER (t) =
L∫
0
dz T2PT (z)P(z)T1psEs
(t − 2nz
c
)κ (z)exp(−αz)exp [ jφ(z, t)] , (6)
where φ(z, t) denotes the total phase fluctuations induced by the fiber during the forward andbackward propagation,
φ(z, t) =z∫
0
dz′ω0
cΔne
(z′, t − n(2z− z′)
c
)−
0∫
z
dz′ω0
cΔne
(z′, t − nz′
c
). (7)
We assume that the phase noise φ(z, t) varies on a time scale that is significantly longer thanthe round-trip propagation time of the light in the fiber. Hence, the phase noise adds coherentlyduring backward and forward propagation and the two terms in Eq. (7) are approximately thesame.
The total electrical field E(t) at the photo-detector is given by
E(t) = exp( jγ0)rTrefEs(t)+qlER(t), (8)
where r and q are the complex coupling coefficients of the coupler that is connected to thelaser, so that |r|2 + |q|2 = 1, l is the fraction of the field that is transmitted by the variableattenuator, and γ0 is a constant phase offset. The matrix Tref is the Jones matrix that describesthe polarization transformation from the source to the photo-detector, and we define pref =Trefps.
A photo-detector converts the optical field into an electrical voltage [27],
VRF(t) =12
AeffRηε0nc|E(t)|2 ≡ b|E(t)|2, (9)
where |E(t)| denotes the amplitude of the field vector, Aeff is a fiber effective cross-sectionarea, η is photo-detector conversion efficiency, ε0 is the vacuum permittivity, and R is a photo-detector resistivity.
To analyze the RF spectrum of VRF(t), we first calculate the time–averaged autocorrelationfunction of Eq. (9),
r(τ) = 〈VRF(t)V∗RF(t − τ)〉= b2〈|E(t)|2|E(t − τ)|2〉. (10)
To calculate Eq. (10), we use several simplifying assumptions:
#242975 Received 22 Jun 2015; revised 3 Sep 2015; accepted 4 Sep 2015; published 22 Sep 2015 (C) 2015 OSA 5 Oct 2015 | Vol. 23, No. 20 | DOI:10.1364/OE.23.025635 | OPTICS EXPRESS 25640
1. The laser source is quasi-monochromatic with amplitude and frequency noise. The laserangular-frequency noise Δψ(t) is a zero mean Gaussian random process [28]. We denoteits power spectral density SΔψ(ω), and we note that the laser phase noise at time t may be
written ψ(t) =t∫
0dTΔψ(T ). We also assume that the relative laser amplitude noise m(t),
defined in Eq. (2) is a zero mean Gaussian process with a small amplitude [|m(t)| � 1],and we write its autocorrelation function as rm(τ) = 〈m(t)m∗(t − τ)〉.
2. During the light propagation through the fiber, phase noise φ is added to the optical signaldue to thermal and thermo-mechanical fluctuations in the optical fiber [18–20]. A modelof both effects gives a very good agreement with the experimental data at frequenciesas low as 30 Hz [20]. The amplitude of the frequency spectrum and hence the auto-correlation function of the phase noise depend linearly on the fiber length L, so that [20]
Sφ (L,ω) = 4L [α1F (ω)+α2/|ω|] . (11)
The variables α1 and α2 and the function F (ω) depend on the fiber properties, opticalwavelength, and the fiber temperature (See e.g. [20]). We assume that the phase noiseφ(z, t) varies on a time scale that is much longer than the round-trip propagation timeof the light in the fiber. Hence, the phase noise adds coherently during backward andforward propagation and the auto-correlation function is four times larger than it wouldbe with one way transmission.
Additional phase noise is added by environmental perturbations [21]. This noise is oftensignificantly higher than the fundamental noise due to thermal and thermo-mechanicalfluctuations in fibers, and it may also have a mean drift rate [21]. However, since thisnoise depends on the specific environmental perturbations and fiber geometry [21], wedo not include it in our model. In principle, it can be directly added to the fundamentalphase noise induced in fibers, denoted by φ in Eq. (7).
3. Rayleigh scattering in fibers is created by material density fluctuations that are “frozen-in” during the transition of the glass from liquid to solid state [11–15, 29]. It has beenshown that these fluctuations do not change over a period of years [16], except whenslowly varying external effects cause some shift in the scattering spectrum [17]. In asingle experiment only one fiber with a specific realization of the Rayleigh scatterers isused. However, slow additive phase noise due to environmental changes and slow fre-quency noise of the laser source cause temporal fluctuations of the Rayleigh backwardwave [30]. Assuming that the measurement duration is sufficiently long, the ensemble av-erage of the Rayleigh scattering coefficients can be replaced by its time average. Hence,we assume that backscattering coefficient per unit of length κ(z) are randomly distrib-uted along the fiber and can be modeled by a complex white Gaussian zero mean randomprocess, whose real and imaginary parts are statistically independent [6, 30–32],
〈κ(z1)κ∗(z2)〉 ≈ σ2κ δ (z1 − z2), (12)
where 〈〉 denotes time average on the order of a second that is longer than typical timeassociated with phase changes due to environmental perturbations.
4. We neglect amplitude to phase (AM-PM) and amplitude to amplitude (AM-AM) noiseconversion in the photo-detector. Recent measurements of the noise conversion co-efficients (see [33], Fig. 6) indicate that for sufficiently low incident optical powers(Pin < 1 mW) the AM-AM noise gain is very close to unity, and the AM-PM noise gain
#242975 Received 22 Jun 2015; revised 3 Sep 2015; accepted 4 Sep 2015; published 22 Sep 2015 (C) 2015 OSA 5 Oct 2015 | Vol. 23, No. 20 | DOI:10.1364/OE.23.025635 | OPTICS EXPRESS 25641

is negligible. The photo-detector shot noise was added to our numerical calculations asan independent noise that depends on the average power.
5. We assume that there is no polarization-dependent loss in the system [34], so that allthe Jones matrices, T1, T2, Tref, and P(z) are unitary [26]. It follows in particular thatP†(z)P(z) = P−1(z)P(z) = I, where I is the identity matrix. We also assume a low-birefringent fiber with length that is much longer than both the polarization beat length(LB) and the polarization correlation length (LC) as defined in [34].
6. We assume that the different noise sources (laser amplitude noise, laser phase noise, fiberphase noise, fiber scattering coefficients, and random fiber birefringence) are statisticallyindependent. We also assume that all the time-varying random processes are stationaryand ergodic. Hence time-average can be replaced by an ensemble average.
Substitution of Eq. (8) into Eq. (10) yields a sum of 16 terms; however, due to statisticalproperties of the backscattering coefficient κ , only six of them yield a non-zero results thatdepend on τ [35],
r (τ)/b2 =⟨|rEs(t)|2|rEs (t − τ)|2
⟩+⟨|lqER (t)|2|lqER (t − τ)|2
⟩+
⟨|rEs(t)|2|lqER (t − τ)|2
⟩+⟨|rEs (t − τ)|2|lqER (t)|2
⟩+
2|r|2|q|2l2 Re⟨
E†R (t)prefEs (t)Es
∗ (t − τ)p†refER (t − τ)
⟩.
(13)
The first term in Eq. (13),⟨|rEs (t)|2|rEs (t − τ)|2
⟩is due to a direct contribution of the laser
intensity noise, so that⟨|rEs (t)|2|rEs (t − τ)|2
⟩≈ 2|E0|4|r|4
[rm(τ)+O
(r2m
)], (14)
where the rm(τ) is the autocorrelation function of the laser amplitude noise that we previously
defined. The second term⟨|lqER (t)|2|lqER (t − τ)|2
⟩is caused by the Rayleigh backscattered
intensity noise and it is on the order of σ4κ . A detailed statistical analysis of this term is given
in [6]. Since the Rayleigh backscattering intensity is low, this term can be neglected with respectto the beating terms analyzed next that are on the order of σ2
κ . The third and fourth terms aredue to beating of the laser and the backscattered intensity noise,
⟨|rEs (t)|2|lqER (t − τ)|2
⟩+⟨|rEs (t − τ)|2|lqER (t)|2
⟩≈
2|r|2|q|2l2|E0|4σ2κ
L∫
0
dz[rm (2nz/c+ τ)+ rm (2nz/c− τ)+O
(r2m
)].
(15)
The last term in Eq. (13) results from the phase noise in the source signal and the Rayleighbackscattered signal that are converted into intensity noise due to the beating between the twowaves, ⟨
E†R (t)prefEs (t)Es
∗ (t − τ)p†refER (t − τ)
⟩=
l2|q|2|r|2σ2κ
L∫
0
dzexp(−2αz)Rfiber(z,τ)TP (z)×⟨
Es(t)E∗s (t − τ)E∗
s
(t − 2nz
c
)Es
(t − 2nz
c− τ
)⟩,
(16)
#242975 Received 22 Jun 2015; revised 3 Sep 2015; accepted 4 Sep 2015; published 22 Sep 2015 (C) 2015 OSA 5 Oct 2015 | Vol. 23, No. 20 | DOI:10.1364/OE.23.025635 | OPTICS EXPRESS 25642
whereRfiber(z,τ) = 〈exp [ jφ(z, t − τ)− jφ(z, t)]〉 (17)
is the auto-correlation function related to the phase noise induced in the fiber, and
TP (z) =∣∣∣p†
refT2PT (z)P(z)T1ps
∣∣∣2
(18)
is a random variable that describes the effect of the polarization change of the backwardRayleigh scattering due to the beating with the source wave. Equation (18) can be written usingthe Stokes unit vector s(z) of the reflected field from a location z [36],
TP(z) =12[1+ sref · s(z)] , (19)
where sref is a Stokes unit vector of the polarization of the source wave at the photo-detectorpref. The Stokes unit vector of the Rayleigh backscattered wave at the photo-detector is given bys(z) =M2Mrt(z)M1s0, where s0 is the Stokes vector that corresponds to the source polarizationJones vector ps. The matrices M1, M2 and Mrt(z) are 3 × 3 reduced Mueller matrices thatcorrespond respectively to the Jones matrices T1, T2, and the round-trip matrix PT (z)P(z).
Substitution of Eq. (2) into Eq. (16) gives⟨
Es (t)E∗s (t − τ)E∗
s
(t − 2nz
c
)Es
(t − 2nz
c− τ
)⟩=
|E0|4⟨[1+m(t)] [1+m∗ (t − τ)]
[1+m∗
(t − 2nz
c
)][1+m
(t − 2nz
c− τ
)]⟩×
RSΔψ(ω)(z,τ) ,
(20)
where
RSΔψ(ω)(z,τ) =
⟨exp
{j
[ψ (t)−ψ (t − τ)−ψ
(t − 2nz
c
)+ψ
(t − 2nz
c− τ
)]}⟩, (21)
is the autocorrelation function of the laser phase noise. We now use the definition of the powerspectral density of the angular-frequency noise
SΔψ(ω) =
∞∫
−∞
dτ 〈Δψ(t)Δψ(t + τ)〉exp(− jωτ) , (22)
where Δψ(t) = dψ(t)/dt. We also use our assumption that Δψ(t) is a zero-mean, er-godic Gaussian-distributed random process and recall the general relation 〈exp [ jx(t)]〉 =exp
[−(1/2)⟨x2(t)
⟩], where x(t) is any zero-mean, Gaussian-distributed real random pro-
cess [35]. We then find [37]
RSΔψ (ω)(z,τ) = exp
⎡⎣− 4
π
∞∫
−∞
dω sin2(ωτ
2
)sin2
(ωτz
2
) SΔψ(ω)
ω2
⎤⎦ , (23)
where
τz =2nzc
is the propagation delay from the reflection at z.
#242975 Received 22 Jun 2015; revised 3 Sep 2015; accepted 4 Sep 2015; published 22 Sep 2015 (C) 2015 OSA 5 Oct 2015 | Vol. 23, No. 20 | DOI:10.1364/OE.23.025635 | OPTICS EXPRESS 25643
Since the laser intensity noise m(t) is a zero mean Gaussian process with a small amplitude[|m(t)| � 1], Eq. (20) can be approximated using the properties of a Gaussian moments [35],
⟨Es(t)E
∗s (t − τ)E∗
s
(t − 2nz
c
)Es
(t − 2nz
c− τ
)⟩≈
|E0|4[1+2rm(τ)+2rm (τz)+O
(r2m
)]RSΔψ (ω)(z,τ).
(24)
Using the relation between the optical power and field P0 = 1/2Aeffcε0n|E0|2 and substitutingEqs. (14), (15), (16) and (24) into Eq. (13), the autocorrelation function of the detected electricalsignal becomes
r(τ) = 2|r|4P20 R2η2rm(τ)+2σ2
κ |r|2|P0PinR2η2×L∫
0
dzexp(−2αz)TP(z)Rfiber(z,τ)RSΔψ (ω)(z,τ) [1+2rm(τ)+2rm(2nz/c)]+
2σ2κ |r|2P0PinR2η2
L∫
0
dzexp(−2αz) [rm(2nz/c+ τ)+ rm(2nz/c− τ)]+O(σ4
κ),
(25)
where we have dropped O(r2m) terms, and Pin denotes the optical power at the entrance of the
fiber. The first term in (25) results in from the laser amplitude noise, the second term results infrom the beating between the laser and Rayleigh backscattered wave, and the last term from thebeating between the laser and Rayleigh intensities. The result of Eq. (25) does not depend onthe phase offset γ0.
For a balanced photo-detector, as depicted in Fig. 1, the intensity noise of the laser sourceand the Rayleigh backscattering will be partially canceled [38], and the significant term willcorrespond to the beating between the laser and the Rayleigh backscattered noise. Therefore,Eq. (13) will take the form
rBPD (τ)/b2 ≈ 2|r|2|q|2l2 Re⟨
E†R (t)prefEs (t)Es
∗ (t − τ)p†refER (t − τ)
⟩, (26)
and we then obtain
rBPD(τ)≈ 2σ2κ |r|2|P0PinR2η2×
L∫
0
dzexp(−2αz)TP(z)Rfiber(z,τ)RSΔψ (ω)(z,τ) [1+2rm(τ)+2rm(2nz/c)] .(27)
In a typical laser, the angular-frequency noise spectrum SΔψ(ω) is composed of white noisewith a spectral density S0 and flicker noise with a spectral density k/|ω| [37, 39, 40] :
SΔψ(ω) = S0 +k|ω| . (28)
Substitution of Eq. (28) into Eq. (23) yields
RSΔψ (ω)(z,τ) = RS0(z,τ)Rk/|ω|(z,τ), (29)
where
RS0(z,τ) = exp
⎡⎣− 4
π
∞∫
−∞
dω sin2(ωτ
2
)sin2
(ωτz
2
) S0
ω2
⎤⎦ ,
Rk/|ω|(z,τ) = exp
⎡⎣− 4
π
∞∫
−∞
dω sin2(ωτ
2
)sin2
(ωτz
2
) k|ω|3
⎤⎦ .
(30)
#242975 Received 22 Jun 2015; revised 3 Sep 2015; accepted 4 Sep 2015; published 22 Sep 2015 (C) 2015 OSA 5 Oct 2015 | Vol. 23, No. 20 | DOI:10.1364/OE.23.025635 | OPTICS EXPRESS 25644

Performing the integrations in Eq. (30), we obtain the autocorrelation function for the laserwhite and flicker frequency noise [41]:
RS0 (z,τ) ={
exp(−S0 |τ |) |τ | ≤ τz
exp(−S0τz) |τ |> τz,(31)
Rk/|ω| (z,τ) =
⎧⎪⎪⎪⎪⎪⎪⎪⎪⎨⎪⎪⎪⎪⎪⎪⎪⎪⎩
exp[− 1
2π τ2τ2z kv(τz, |τ |)
] |τ |< τz
exp[− 1
2π τ2τ2z kv(|τ | ,τz)
] |τ |> τz
exp[− 1
2π kτ2 log16] |τ |= τz
1 τ = 0,
(32)
where
v(χ ,χ0) =4tanh−1 (χ0/χ)
χχ0+
2tanh−1(1−2χ2
0/χ2)
χ2 +log
(1− χ2
0/χ2)
χ20
, χ0 ≤ χ . (33)
2.1. Computational results
We have calculated the noise spectrum that is induced by the backward Rayleigh scattering bysolving Eq. (27). The integration in Eq. (27) was performed with a fiber length resolution of100 m and a time resolution of 0.1 μs. We have verified that increasing the time and lengthresolution did not significantly affect the results. We assumed that a balanced photo-detector isused, and we therefore neglected the laser intensity noise that is directly added to the detectedspectrum.
Equations (25) and (27) contain a function TP(z) that varies along the fiber due to randombirefringence in fibers. In this paper, we study the noise spectrum that is caused by a laserwith a long coherence length, so that the function RSΔψ (ω)(z,τ) in Eqs. (25) and (27) does notchange significantly on a short length scale that corresponds to the polarization beat length LB
and the polarization correlation length LC of the fiber, as defined in [34]. This short length scaleis on the order of tens of meters [46] while the coherence length of the laser is on the order ofkilometers. Therefore, TP(z) can be approximated in Eqs. (25) and (27) by its spatially-averagedvalue TP0 , as shown in Appendix A. We find that TP0 varies between 1/3 to 2/3, dependingon the polarization of the source and on the details of the experimental configuration. We notehowever that if the measurement time is short compared to the time on which the relative phasesbetween the Rayleigh back-reflections change due to environmental effects, then we expect TP0
to vary between 0 and 1. In the remainder of this paper, we set TP(z) = 2/3 in Eqs. (25) and(27).
Figure 2 shows the calculated power spectral density from Eq. (27) (black curve) and theresult without adding the flicker noise of the laser (red curve) for a 2-km long optical fiberwith parameters that correspond to Corning SMF-28 fiber. We use a fiber loss coefficient α =0.19 dB/km and a Rayleigh backscatter coefficient at 1550 nm wavelength for a T = 1 ns pulsewidth that is equal to −82 dB [42]. Using Eq. (6) and assumption 3, the optical power that isreflected from a fiber section with a length cT/n equals PB =Pinσ2
κ cT/(2n). Hence, the varianceof the local reflection coefficient κ is given by σ2
κ = 2n(PB/Pin)/(cT ) = 6.1×10⁻⁸ m−1, wheren = 1.45 is the refractive index of the fiber.
The laser had a white angular-frequency noise parameter S0 = 3.9478× 10³ (rad/s)2 /Hzand a flicker angular-frequency noise parameter k = 1.3643 × 10⁸ (rad/s)3 /Hz. The corre-sponding laser linewidth for a 1-ms measurement duration approximately equals 3 kHz [43].The coupling fractions are |r|2 = 0.25, |q|2 = 0.75. The other parameters are the optical power
#242975 Received 22 Jun 2015; revised 3 Sep 2015; accepted 4 Sep 2015; published 22 Sep 2015 (C) 2015 OSA 5 Oct 2015 | Vol. 23, No. 20 | DOI:10.1364/OE.23.025635 | OPTICS EXPRESS 25645
101
102
103
104
105
106−140
−120
−100
−80
f (Hz)
dBc/
Hz
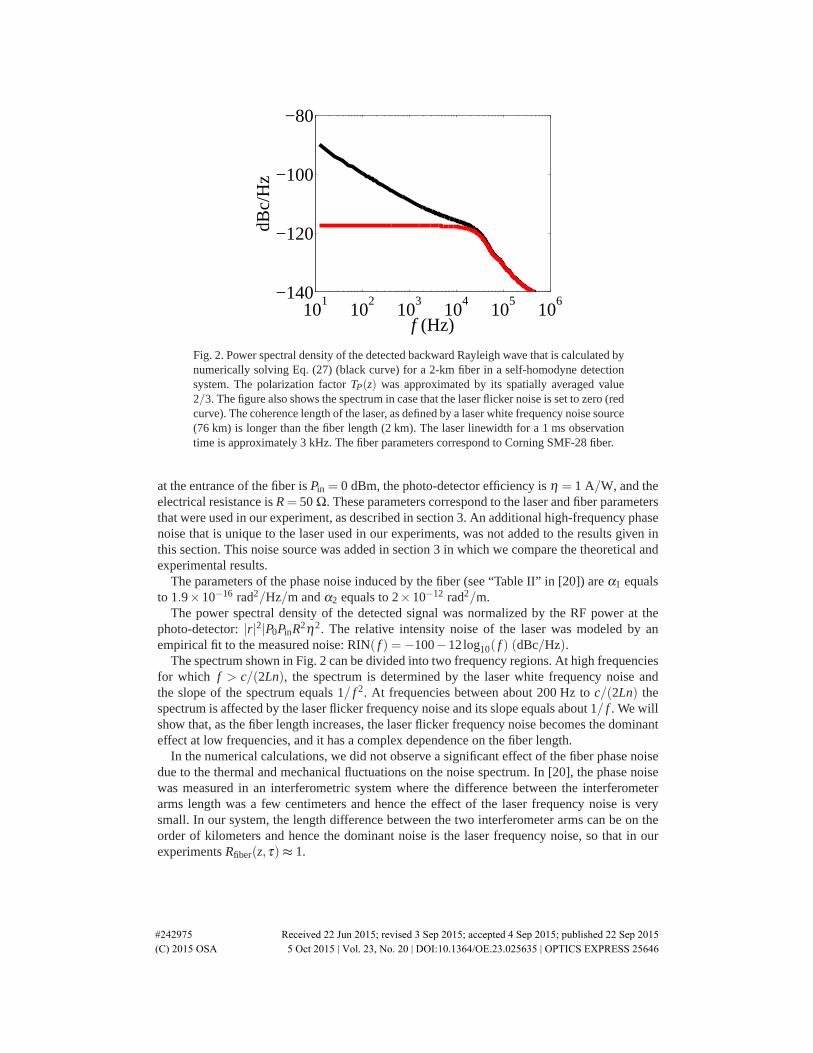
Fig. 2. Power spectral density of the detected backward Rayleigh wave that is calculated bynumerically solving Eq. (27) (black curve) for a 2-km fiber in a self-homodyne detectionsystem. The polarization factor TP(z) was approximated by its spatially averaged value2/3. The figure also shows the spectrum in case that the laser flicker noise is set to zero (redcurve). The coherence length of the laser, as defined by a laser white frequency noise source(76 km) is longer than the fiber length (2 km). The laser linewidth for a 1 ms observationtime is approximately 3 kHz. The fiber parameters correspond to Corning SMF-28 fiber.
at the entrance of the fiber is Pin = 0 dBm, the photo-detector efficiency is η = 1 A/W, and theelectrical resistance is R = 50 Ω. These parameters correspond to the laser and fiber parametersthat were used in our experiment, as described in section 3. An additional high-frequency phasenoise that is unique to the laser used in our experiments, was not added to the results given inthis section. This noise source was added in section 3 in which we compare the theoretical andexperimental results.
The parameters of the phase noise induced by the fiber (see “Table II” in [20]) are α1 equalsto 1.9×10⁻¹⁶ rad2/Hz/m and α2 equals to 2×10⁻¹² rad2/m.
The power spectral density of the detected signal was normalized by the RF power at thephoto-detector: |r|2|P0PinR2η2. The relative intensity noise of the laser was modeled by anempirical fit to the measured noise: RIN( f ) =−100−12log10( f ) (dBc/Hz).
The spectrum shown in Fig. 2 can be divided into two frequency regions. At high frequenciesfor which f > c/(2Ln), the spectrum is determined by the laser white frequency noise andthe slope of the spectrum equals 1/ f 2. At frequencies between about 200 Hz to c/(2Ln) thespectrum is affected by the laser flicker frequency noise and its slope equals about 1/ f . We willshow that, as the fiber length increases, the laser flicker frequency noise becomes the dominanteffect at low frequencies, and it has a complex dependence on the fiber length.
In the numerical calculations, we did not observe a significant effect of the fiber phase noisedue to the thermal and mechanical fluctuations on the noise spectrum. In [20], the phase noisewas measured in an interferometric system where the difference between the interferometerarms length was a few centimeters and hence the effect of the laser frequency noise is verysmall. In our system, the length difference between the two interferometer arms can be on theorder of kilometers and hence the dominant noise is the laser frequency noise, so that in ourexperiments Rfiber(z,τ)≈ 1.
#242975 Received 22 Jun 2015; revised 3 Sep 2015; accepted 4 Sep 2015; published 22 Sep 2015 (C) 2015 OSA 5 Oct 2015 | Vol. 23, No. 20 | DOI:10.1364/OE.23.025635 | OPTICS EXPRESS 25646
3. Comparison with the experiment results
We have validated the model by comparing its results to measurements conducted in experi-ments that are described in [9]. The experiment setup is shown in Fig. 1. The source in the ex-periments was a long coherence laser—“Teraxion-NLL” with a specified linewidth smaller than5 kHz [44]. The corresponding coherence length, as defined only by the laser white frequencynoise was about 76 km [45]. However, the laser linewidth is broadened by the laser flickerfrequency noise and it approximately equals 3 kHz for a 1 ms measurement duration [43].
In the experiments the fiber length was varied between 500 m to 173.4 km and the variableoptical attenuator was adjusted to provide an input power of 0 dBm. The coupling coefficients|r|2 and |q|2 were 0.25 and 0.75 respectively and the spectrum was measured by using anelectronic cross-spectrum analyzer.
In addition to a white and flicker frequency noise, our experiments had additional high-frequency noise [44]. We add this noise to our model in order to obtain a good comparisonbetween theory and experiments at frequencies above 100 kHz.
The laser angular-frequency noise was modeled by
SΔψ (ω) = S0 +k|ω| +SHF(ω), (34)
whereSHF(ω) = a |ω|3 , |ω| ≤ ω1. (35)
The parameters were chosen to obtain the best fit between theory and a direct measurement ofthe source [44]: S0 = 3.9478×10³ (rad/s)2 /Hz, k = 1.3643×10⁸ (rad/s)3 /Hz, a = 7.9577×10⁻¹⁵ (rad/s)−1 /Hz, and ω1 = 2π ×2 MHz.
To include the additional high frequency noise contribution, Eq. (30) is modified to
RSΔψ (ω)(z,τ) = RS0(z,τ)Rk/|ω|(z,τ)RHF(z,τ), (36)
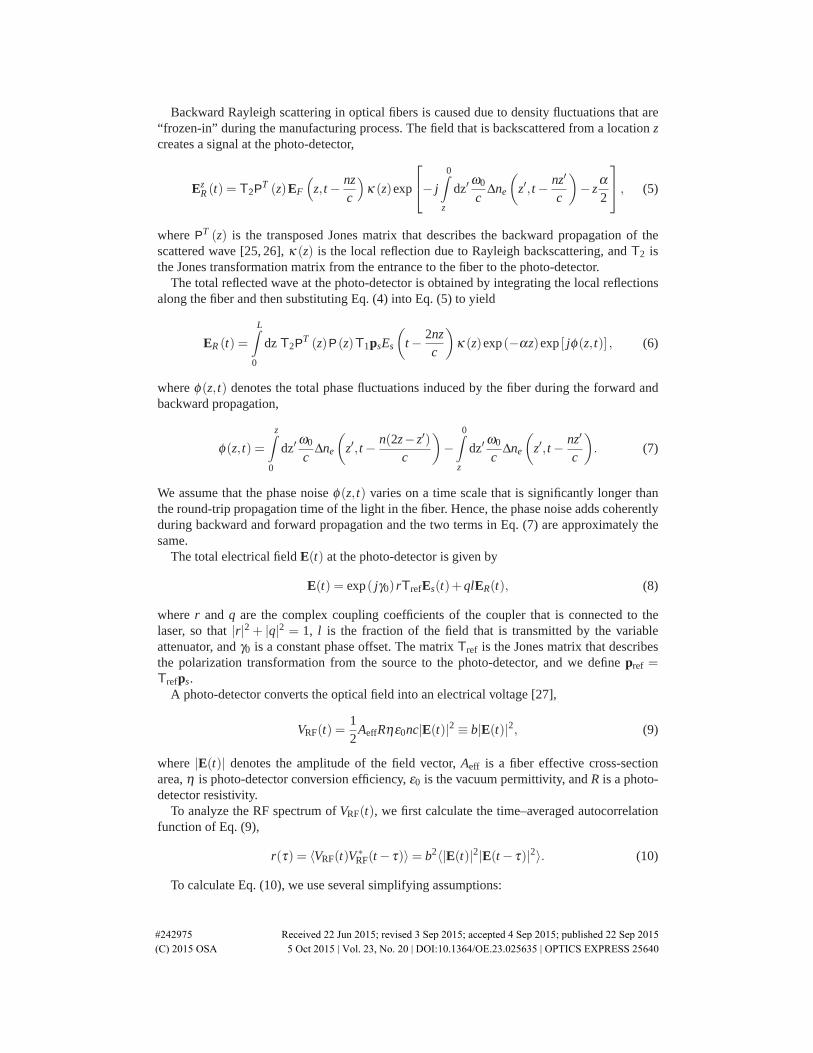
where RHF(z,τ) is calculated from Eq. (34) using Eq. (23).Figure 3 shows the self-homodyne-detected backward Rayleigh spectrum, measured for sev-
eral fiber lengths (solid blue curves). The experimental data is compared to the theoreticalresults (dashed green curves), calculated using Eq. (27) with TP(z) = 2/3. Good agreement be-tween theory and experimental data is obtained at frequencies above 200 Hz for fiber lengthsbetween 6 to 100 km. For shorter fibers with a length between 500 m to 6 km, a good agreementwas obtained only at frequencies that are higher than 500 Hz. The measurements indicate theexistence of a low-frequency noise source that is not included in our model. This noise sourcebecomes more important as the fiber length decreases. By analyzing the experimental results atvery low frequencies of about 10 Hz, we find that the power density of this noise source growslinearly by about 4 dB per kilometer when the fiber length is changed between 500 m to 3 km.For longer fibers (6−100 km), the power of this noise source is approximately constant. Also,the spectral shape of this low frequency noise does not change significantly as a function ofthe fiber length. This noise might be due to the receiver, due to excess low-frequency intensitynoise of the specific laser used in the experiment, or due to environmental noise. For fiberslonger than about 6 km, the noise induced by the laser flicker frequency noise becomes thedominant noise source at frequencies as low as 200 Hz.
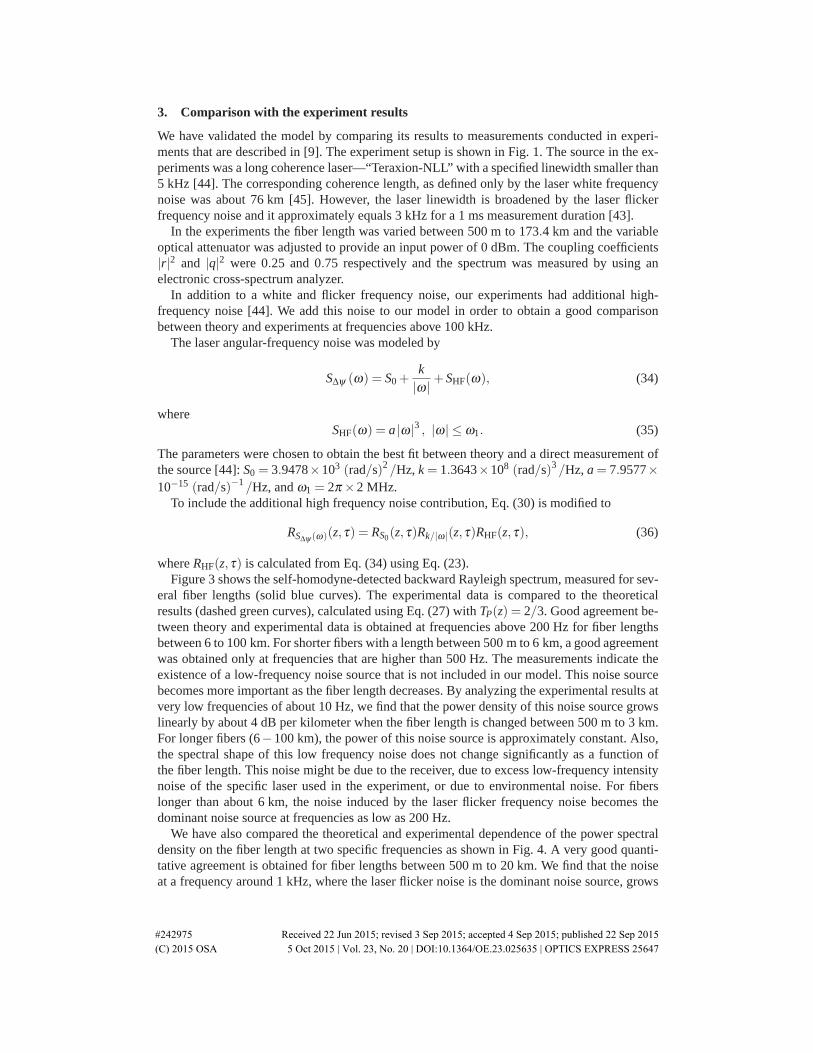
We have also compared the theoretical and experimental dependence of the power spectraldensity on the fiber length at two specific frequencies as shown in Fig. 4. A very good quanti-tative agreement is obtained for fiber lengths between 500 m to 20 km. We find that the noiseat a frequency around 1 kHz, where the laser flicker noise is the dominant noise source, grows
#242975 Received 22 Jun 2015; revised 3 Sep 2015; accepted 4 Sep 2015; published 22 Sep 2015 (C) 2015 OSA 5 Oct 2015 | Vol. 23, No. 20 | DOI:10.1364/OE.23.025635 | OPTICS EXPRESS 25647

as a function of the fiber length as L2.4±0.1. The power dependence on the fiber length varies asa function of the laser frequency flicker noise amplitude.
At higher frequency f = c/(2nL), where the laser white frequency noise is the dominantnoise source, the noise spectrum grows as a function of the fiber length as L3±0.2. This result isverified analytically using a simplified model that is given in the Appendix B.
#242975 Received 22 Jun 2015; revised 3 Sep 2015; accepted 4 Sep 2015; published 22 Sep 2015 (C) 2015 OSA 5 Oct 2015 | Vol. 23, No. 20 | DOI:10.1364/OE.23.025635 | OPTICS EXPRESS 25648

101
102
103
104
105
106−140
−120
−100
−80
−60
f (Hz)
dBc/
Hz
(a) 2 km
101
102
103
104
105
106−140
−120
−100
−80
−60
f (Hz)
dBc/
Hz
(b) 6 km
101
102
103
104
105
106−140
−120
−100
−80
−60
f (Hz)
dBc/
Hz
(c) 10 km
101
102
103
104
105
106−140
−120
−100
−80
−60
f (Hz)
dBc/
Hz
(d) 20 km
101
102
103
104
105
106−140
−120
−100
−80
−60
f (Hz)
dBc/
Hz
(e) 58 km
101
102
103
104
105
106−140
−120
−100
−80
−60
f (Hz)
dBc/
Hz
(f) 100 km
Fig. 3. Comparison between theory (dashed green curves) and experiment (solid bluecurves) for the noise power spectral density for various fiber lengths: (a) 2 km, (b) 6 km,(c) 10 km, (d) 20 km, (e) 58 km and (f) 100 km. The input optical power was 0 dBm. Theparameters of the fiber and coupling fractions that were used in the numerical calculationsare the same as given in section 2.1. A balanced photo-detector was used. The coherencelength of the laser that was used in the calculations is 76 km, assuming white frequencylaser noise and a total linewidth of 3 kHz for a 1-ms observation time. Good agreementbetween theory and experiments is obtained for fiber lengths greater than 6 km and all thefiber lengths at frequencies above 200 Hz.
#242975 Received 22 Jun 2015; revised 3 Sep 2015; accepted 4 Sep 2015; published 22 Sep 2015 (C) 2015 OSA 5 Oct 2015 | Vol. 23, No. 20 | DOI:10.1364/OE.23.025635 | OPTICS EXPRESS 25649
103
104−160
−140
−120
−100
−80
Fiber length (m)
dBc/
Hz
−160
−140
−120
−100
−80
Frequency (Hz)
105 104
Theoretical
L3 fitExperiment
(a) f = c/(2nL)
103
104−140
−120
−100
−80
Fiber length (m)
dBc/
Hz
Theoretical
L2.4 fitExperiment
(b) f = 1 kHz
Fig. 4. Power spectral density of the detected noise vs. fiber length (L). We compare theoret-ical results (blue curves), experimental results (red dots), and empirical fits (green curves).In (a), we allow the frequency to vary, so that f = c/(2nL). At L = 5 km, the frequency is21 kHz, at L = 20 km, the frequency is 5 kHz. The power spectral density is approximatelyproportional to L3. In (b), we set f = 1 kHz. The power spectral density is approximatelyproportional to L2.4.
4. Conclusions
We describe a comprehensive theoretical model for studying intensity noise induced in opticalfibers by spontaneous Rayleigh backscattering that is detected by a self-homodyne scheme. Themodel includes laser frequency noise, laser amplitude noise, random distribution of Rayleighscatterers along the fiber, phase noise that is induced in the optical fibers due to thermal andmechanical fluctuations, and fiber loss. The results indicate that the dominant noise source atfrequencies of about 500 Hz is the laser flicker frequency noise. At higher frequencies of about10 kHz, the noise is dominated by the white frequency noise of the laser. We compared thecalculated self-homodyne detected noise spectrum to experimental results for a laser with alinewidth of about 3 kHz. Although the noise spectrum due to Rayleigh backscattering has acomplex dependence on the fiber length, a good agreement between theory and experiment isobtained for fiber lengths between 6 to 100 km at frequencies above 200 Hz. For shorter fiberswith lengths between 500 m to 6 km, good agreement was obtained only at higher frequenciesof more than about 500 Hz.
5. Appendix A–calculation of the average polarization coefficient TP0 for a long coher-ence length laser
Equations (25) and (27) contain a function TP(z) that changes randomly due to the optical fiber’sbirefringence that varies randomly as a function of position. However, the fiber birefringencechanges on a time scale that is larger than a few minutes even for long fibers with a lengthon the order of tens of kilometers [21]. The polarization change of waves and in particularbackscattered waves in fibers with a random birefringence was modeled in [25, 26, 34]. In thecase of a polarization maintaining fiber, the polarization of the reflected wave will be equal tothe polarization of the incident wave as long as the input wave is linearly polarized along oneof the principal axes of the fiber, and therefore TP(z) = 1 for all z.
The integral in Eqs. (25) and (27) contains functions that change on different length scales.
#242975 Received 22 Jun 2015; revised 3 Sep 2015; accepted 4 Sep 2015; published 22 Sep 2015 (C) 2015 OSA 5 Oct 2015 | Vol. 23, No. 20 | DOI:10.1364/OE.23.025635 | OPTICS EXPRESS 25650

The short length scale, on the order of tens of meters, corresponds to the fiber beat length andthe fiber correlation length [46]. On the other hand, the laser coherence length for the laser usedin the experiments and the fiber attenuation length 1/α are on the order of kilometers. Hence,the function TP(z) varies on a short length scale, while other functions in the integral vary ona long length scale. Assuming that the fiber length is significantly longer than the short lengthscale, the rapidly varying function TP(z) can be replaced in calculating the integral by its spatialaverage. This result can be obtained by using the first mean value theorem (see [41], p. 1063).We calculate the integral by dividing the integration interval into sections, each with a length d,that is significantly longer than the short length scale and is shorter than the long length scale.Assuming that the section length d is sufficiently long, the function TP(z) can be approximatelyreplaced in each section by its spatial average while the variation of the other functions in thesection can be neglected. Therefore, the random process TP(z) in Eqs. (25) and (27) can beapproximately replaced by its spatial average TP0 that is calculated using Eq. (19), so that
TP0 =12
[1+ sref · 〈s(z)〉z
], (37)
where sref is the state of polarization (SOP) of the source wave at the photo-detector and
〈s(z)〉z =1d
z+d∫
z
dz′s(z′) (38)
denotes a spatial average of the Stokes vector of the backscattered wave at any section alongthe fiber.
To calculate TP0 , we need to determine the spatial average 〈s(z)〉z of the backscattered waveat the photo-detector. In [25], the time average of the DOP of the backscattered wave was cal-culated for a laser with a coherence length that is significantly shorter than the fiber length. Itwas assumed that different reflections along the fiber are incoherently added so that the corre-sponding Mueller matrices of their reflections can be added as well. The average polarizationof the backscattered wave was determined by the expectation value of the Mueller matrix. Itwas shown that the backscattered SOP is identical to the input SOP and the DOP reduces to 1/3of the source DOP. It was also shown experimentally that the fluctuation of the backscatteredwave decreases as the coherence length of the laser is decreased. In the experiments that are de-scribed in Sec. 3, the coherence length of the laser is longer than the fiber length. Nonetheless,the same result will hold as long as the measurement time is long compared to the time scalefor environmental changes. In this case, we find TP0 = (1/2) [1+ sref ·M2M1s0/3], which variesbetween 1/3 and 2/3, depending on the states of polarization of the reference and the reflectedwaves at the photo-detector. In the other limit where the detection time is short, we expect TP0
to vary between 0 and 1.In the calculated results given in this paper we set TP(z) = TP0 = 2/3.
6. Appendix B – Simplified model for a laser with only a white frequency noise
It is possible to obtain a closed-form analytical expression for the self-homodyne detectednoise spectrum of the Rayleigh backscattered noise. This approximation is accurate for highfrequency noise [ f > c/(2nL)]. The analytical model is valid for a laser with an arbitrary co-herence length. In the special case that the laser coherence length is significantly shorter thanthe fiber length, the spectrum approaches a Lorentzian shape as obtained in [6].
We observe in Fig. 2 that at high frequencies [ f > c/(2nL)] the main noise source contribut-ing to the Rayleigh backscattered noise is the white frequency noise of the laser. Therefore, toobtain insight into the properties of the backscattered Rayleigh noise spectrum at frequencies
#242975 Received 22 Jun 2015; revised 3 Sep 2015; accepted 4 Sep 2015; published 22 Sep 2015 (C) 2015 OSA 5 Oct 2015 | Vol. 23, No. 20 | DOI:10.1364/OE.23.025635 | OPTICS EXPRESS 25651

greater than c/(2nL), we present a simplified model in which it is assumed that the laser flickerand amplitude noise can be neglected. In this case, Eq. (27)–(39) can be solved analytically toobtain a solution even when that the coherence length of the laser is longer than the fiber length.
The one-sided spectrum of the Rayleigh backscattered noise is defined as
S(ω) = 2
∞∫
−∞
dτ r(τ)exp(− jωτ) , (39)
where r(τ) is given by Eq. (25).By ignoring the fiber losses (α = 0), fiber phase fluctuations [Rfiber(z,τ) = 1], laser amplitude
and flicker frequency noise, Eq. (39) simplifies to
S(ω)/u = TP0
πcδ (ω) [1− exp(−2LnS0/c)]nS0
+
TP0
S0
nω(S2
0 +ω2)2 ×
[2ω
(Ln
(S2
0 +ω2)− cS0)+ exp
(−2LnS0
c
)c(S2
0 −ω2)sin
(2Lnω
c
)]+
TP0
2S20
n(S2
0 +ω2)2 × exp
(−2LnS0
c
)ccos
(2Lnω
c
),
(40)where u= 4σ2
κ |r|2P0PinR2η2. A useful result is obtained by evaluating Eq. (40) at the frequencyωL = 2πc/(2Ln) in the limit that the coherence length of the laser is greater than the fiber length,i.e., 2LnS0/c � 1, so that
S (ωL)/u ≈ TP0
2L3n2S0
c2π2 (41)
andS(ω → 0)/S(ωL)≈ 2π2/3. (42)
In this limit, we find that ωL equals the noise bandwidth of the Rayleigh backscattered spectrumwhen the coherence length of the laser is greater than the fiber length. The noise amplitude atthis frequency is proportional to L3. This dependence occurs for a laser with a coherence lengththat is longer than the fiber since a reflection from a location z that interferes with the lasersource adds a noise power that is proportional to z2. Incoherent integration of the independentreflections along the fiber gives another factor of length resulting in a dependency of the noisepower that is proportional to L3. In another case when the fiber length is much longer than thecoherence length of the laser, Eq. (40) approaches a Lorentzian shape,
S (ω)/u ≈ TP0
2S0L
S20 +ω2
. (43)
This result was obtained in [6]. In this case, the noise bandwidth does not depend on the fiberlength, and the noise amplitude is proportional to L.
Acknowledgments
Work at the Technion was supported by the Israel Science Foundation (ISF) of the IsraeliAcademy of Sciences (grant No. 1092/10). Work at the UMBC was supported by the ArmyResearch Laboratory.
#242975 Received 22 Jun 2015; revised 3 Sep 2015; accepted 4 Sep 2015; published 22 Sep 2015 (C) 2015 OSA 5 Oct 2015 | Vol. 23, No. 20 | DOI:10.1364/OE.23.025635 | OPTICS EXPRESS 25652