Comprehensive Guidance & School...
46
Comprehensive Guidance & School Counseling Does the program work? Susan Perkins, Columbia Public Schools Elementary School Counseling Coordinator
Transcript of Comprehensive Guidance & School...

Comprehensive Guidance &
School Counseling
Does the program work?
Susan Perkins, Columbia Public Schools Elementary School Counseling Coordinator
Programs
Mission, Vision, Philosophy
Program Components or Structure
Procedures
Highly Qualified Personnel
Evaluation

Program Results
Program
+ Personnel
Results
Is the program working?
Norman C. Gysbers & Patricia Henderson, “Comprehensive Guidance & Program
Evaluation: Program + Personnel = Results, www.counseling.org
Evaluation
Evaluation
Evaluation

School Counseling History
Now: “How are students different because of the school
counseling program?”
Then: “What’s a School Counselor?”
From: ASCA, schoolcounselor.org, School Counselor Accountability Presentation: Ann F. Cole, Ph.D, Grant Facilitator, Safe and
Drug Free Schools, Lee County, FL; Geri McArdle, Ph.D, Associate Professor, Barry Univ.; Madelyn Issacs, Ph.D, Florida Gulf
Coast University.


CGSCP Works!
My gut feeling tells me so.
It’s what students need.
Kids are constantly knocking on my door.
We need more staff because our program is that good!
Helpful

It’s helpful to have a bit more information…

When I say the word “Data”…
Avoiding Death by Data…
Reasonable

Purposeful
Meaningful

Valid
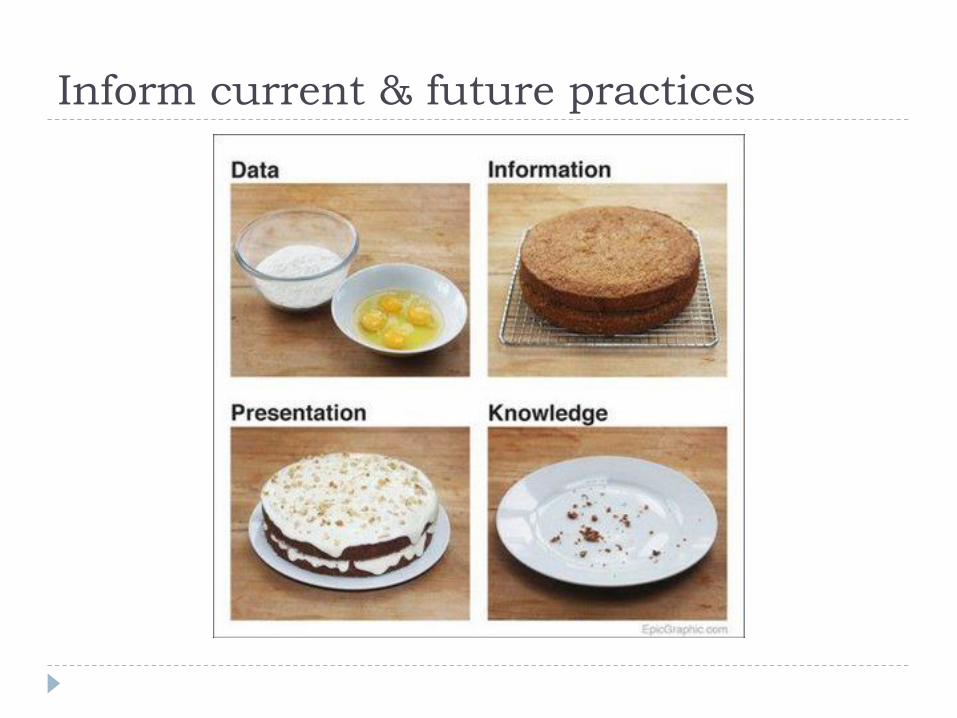
Inform current & future practices
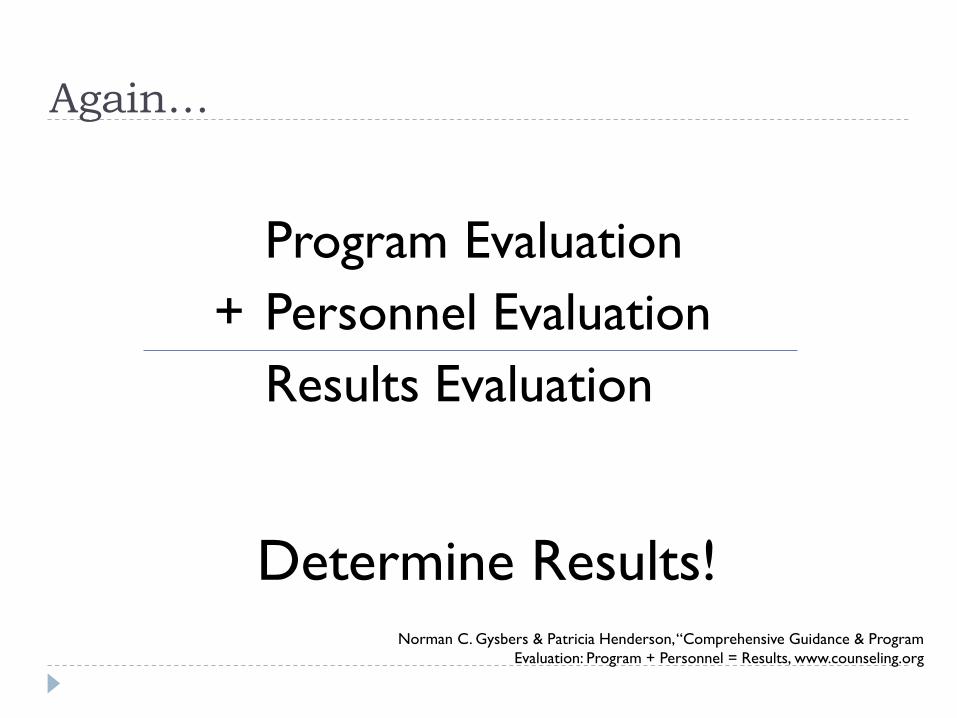
Again…
Program Evaluation
+ Personnel Evaluation
Results Evaluation
Norman C. Gysbers & Patricia Henderson, “Comprehensive Guidance & Program
Evaluation: Program + Personnel = Results, www.counseling.org
Determine Results!

An Example…
K-12 Comprehensive
School Counseling Program
Columbia Public Schools

Program Evaluation
Internal Improvement Review (IIR)
Time on Task Analysis
Responsive Services
Elements4-Full Implementation 3-Substantial Imp 2-Moderate Imp 1-Minimal/No Imp NBR Score
4A. Students who are
experiencing problems can
readily access PSCs.
All students who are
experiencing problems
can readily access PSCs.
Most students who are
experiencing problems can
readily access PSCs.
A few students who
are experiencing
problems can readily
access PSCs.
Students who are
experiencing problems
cannot readily access PSCs.4A
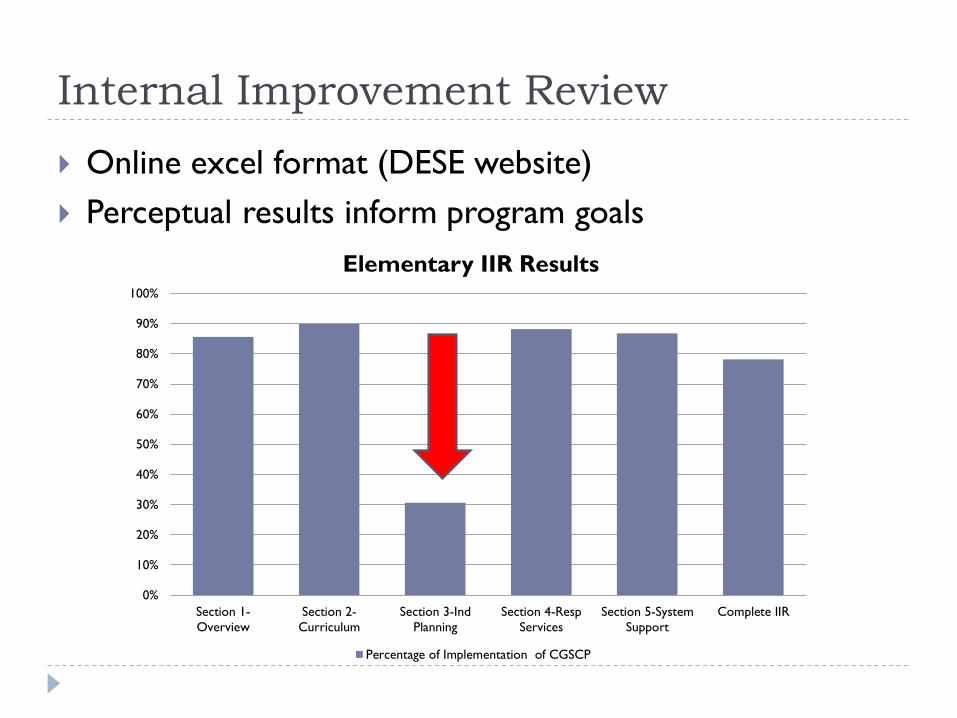
Internal Improvement Review
Online excel format (DESE website)
Perceptual results inform program goals
0%
10%
20%
30%
40%
50%
60%
70%
80%
90%
100%
Section 1-
Overview
Section 2-
Curriculum
Section 3-Ind
Planning
Section 4-Resp
Services
Section 5-System
Support
Complete IIR
Elementary IIR Results
Percentage of Implementation of CGSCP

Internal Improvement Review:
Further Analysis
1K. Student –Professional School counselor (PSC)
counselor ratios are consistent with nationally
recommended standards
4G. PSCs actively participate in activities involving
building/district critical incident plans.

Time on Task Analysis
Guidance
Curriculum
33%
Individual
Planning
0%
Responsive
Services
42%
Systems
Support
18%
Non-
Guidance
7%
2013-2014 TIME ON TASK
Guidance
Curriculum
26%
Individual
Planning
0%
Responsive
Services
51%
Systems
Support
16%
Non-
guidance
7%
2014-2015 TIME ON TASK
30-40%
10-15%
5-10%
35-45%10-15% 35-45%
30-40%

Personnel Evaluation
Performance Based School Counselor Evaluation (PBSCE)
New School Counselor Evaluation System
Revised standards
Growth model

Results Evaluation
Process Data
Perceptual Data
P.R.O.B.E. Data

Process Data
Compile numbers
# of incidents
# of students
# of hours
Show trends
Correlate
Demographics
County statistics

Process Data
Collection Methods
Planner Tally
Excel spreadsheet
SCUTA

Planner Tally

Excel Spreadsheet

SCUTASchool Counselor Use of Time Analysis

SCUTASchool Counselor Use of Time Analysis

Process Data
Examples of Data Collected
Classes
Students seen individually
Individual visits
Students seen in groups
Group visits
Crisis visits
Hotlines
Home visits
CD interviews
504 hours
Outside referrals
Agency contacts

Process Data
Analysis
Totals by district
Totals by building
Trend data
Correlate with district changes or county data
0%
5%
10%
15%
20%
25%
30%
35%
40%
45%
50%
7300
7400
7500
7600
7700
7800
7900
8000
8100
8200
07-08 08-09 09-10 10-11 11-12 12-13 13-14
Po
pu
lati
on
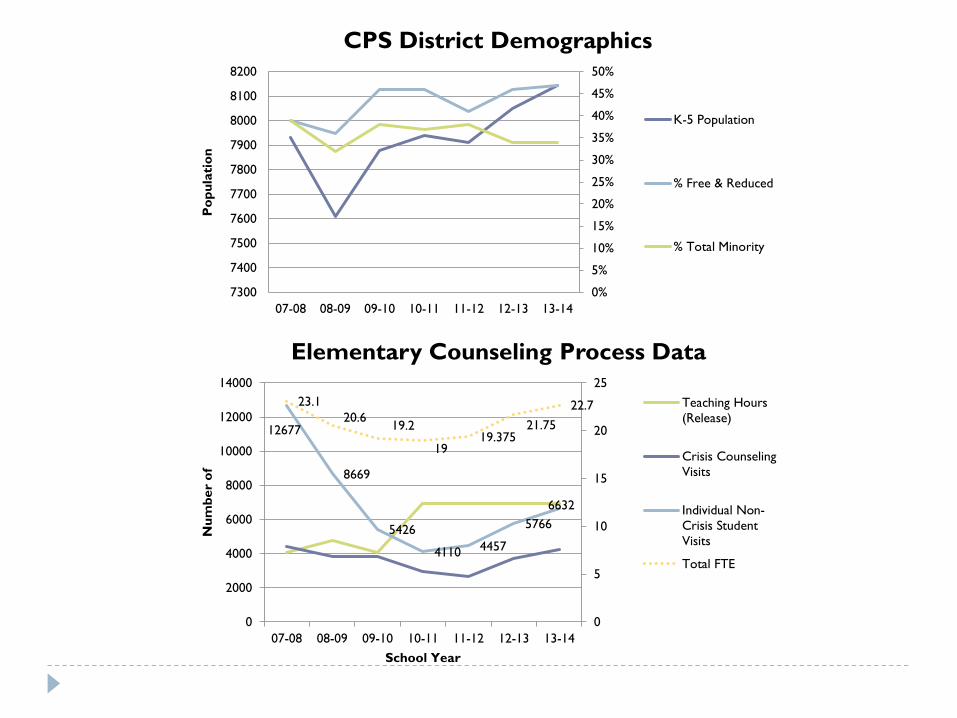
CPS District Demographics
K-5 Population
% Free & Reduced
% Total Minority
12677
8669
5426
4110 4457
5766
6632
23.1
20.619.2
1919.375
21.75
22.7
0
5
10
15
20
25
0
2000
4000
6000
8000
10000
12000
14000
07-08 08-09 09-10 10-11 11-12 12-13 13-14
Nu
mb
er
of
School Year
Elementary Counseling Process Data
Teaching Hours
(Release)
Crisis Counseling
Visits
Individual Non-
Crisis Student
Visits
Total FTE

665
239 233270
295
205
137175 165 146
244 258
0
100
200
300
400
500
600
700
07-08 08-09 09-10 10-11 11-12 12-13 13-14
Nu
mb
er
of
School Year
Elementary Counseling Process Data
Outside Referrals
Hotline Calls
960
760
9911008
12165298
6558 6122
0
1000
2000
3000
4000
5000
6000
7000
700
800
900
1000
1100
1200
1300
2007 2008 2009 2010 2011 2012 2013
Boone County Trend Data
Child
abuse/neglect
and family
assessments
Children in
poverty
Perceptual Data
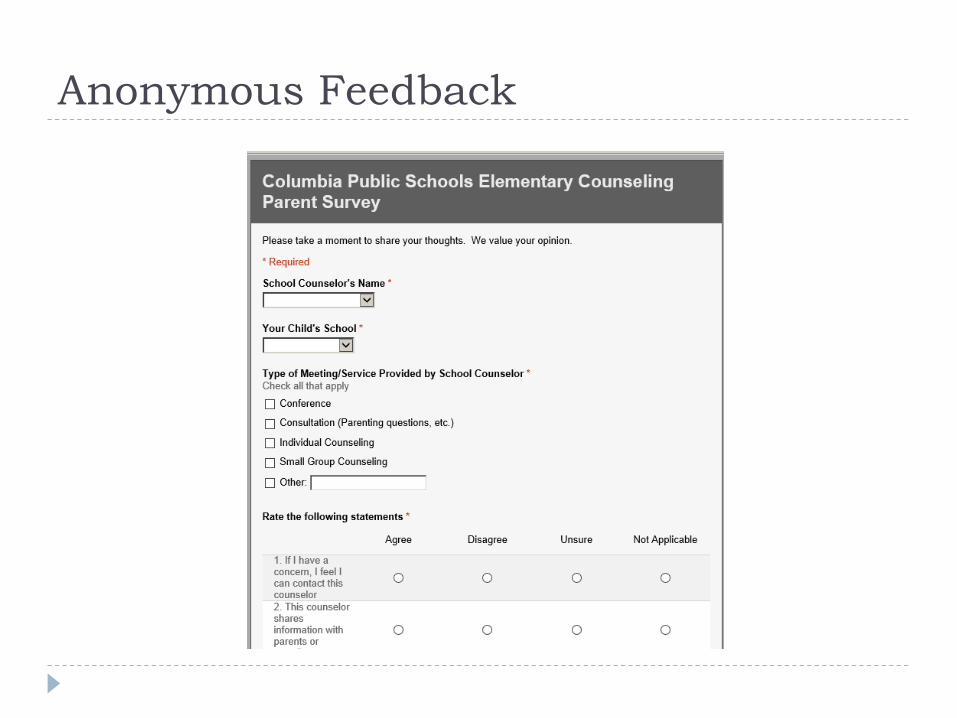
Anonymous Feedback

Parent Perceptions

Teacher Perceptions

Student Perceptions
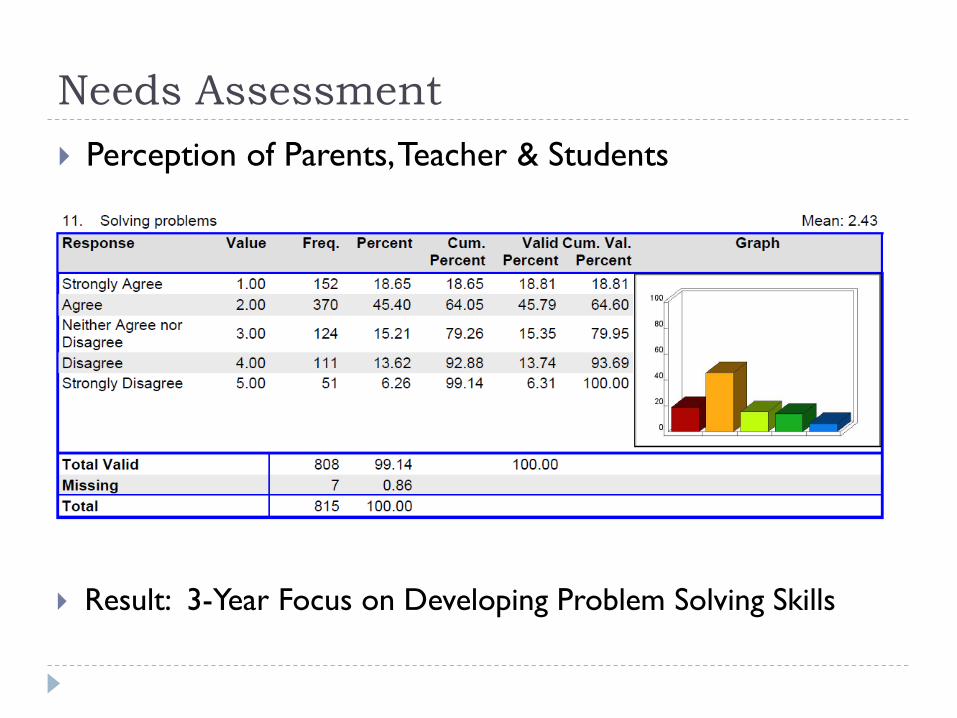
Needs Assessment
Perception of Parents, Teacher & Students
Result: 3-Year Focus on Developing Problem Solving Skills

P.R.O.B.E. Data
Case study
Choose individual or group
Identify goal
Gather baseline data
Implement intervention
Gather post-intervention data
Determine results

Case #1N
um
ber
of
min
or
/ m
ajor
refe
rral
s
Participating Students (First Initial)
1
3 3
1
5
16
2
0
1
0
2
6
0
2
4
6
8
10
12
14
16
18
K B D J J Total
March
April
2nd Grade Mentor Group

Case #2
0
10
20
30
40
50
60
Piers Harris-2 Results
Pre Post
Total Pre: 29
Total Post: 55
0
10
20
30
40
50
60
70
80
Before
Counseling
During &
After
Counseling
Discipline Referral Data
• 67 referrals before individual counseling
(September 2-January 16)
• 15 during and after individual counseling
(January 19-March 31)
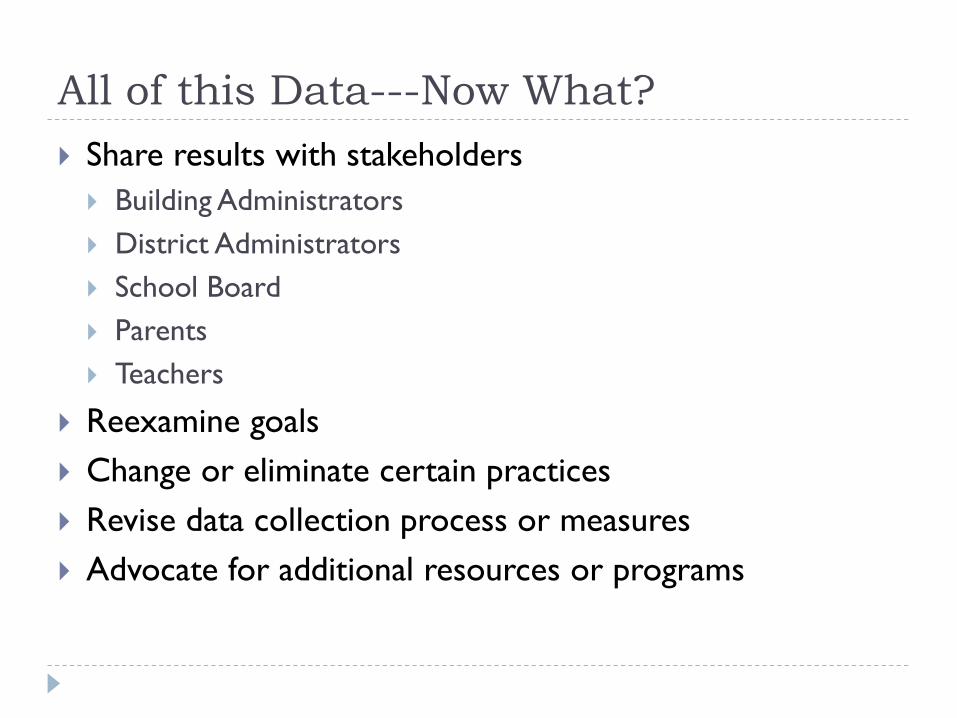
All of this Data---Now What?
Share results with stakeholders
Building Administrators
District Administrators
School Board
Parents
Teachers
Reexamine goals
Change or eliminate certain practices
Revise data collection process or measures
Advocate for additional resources or programs

Program Data Results
2007-2008
2.6 FTE increase supported by program data.
2011-2012
Full-time elementary school counselors in all 19 school buildings with addition of 1.375 FTE.
2012-2013
District moved to a specialist schedule that more than doubled the elementary school counselor’s time in the classroom. Data supported need for 1.0 increase in FTE.
2014-2015
Moved from a classroom lesson release-time model to a push-in model.

And the Results are in…
Comprehensive Guidance & School Counseling Works!
Our Process Data Results tell us so
Our Perceptual Data Results tell us so
Our P.R.O.B.E. Data Results tell us so
Program + Personnel = Results

Questions

Resources
Missouri Kids Count: http://missourikidscountdata.org/
CPS Guidance Website (Internal Use Only):
www.cpsschoolcounselors.weebly.com
SCUTA: http://counselorapp.com/
EZ Analyze: http://www.ezanalyze.com/