COMPREHENSIVE FACILITY ENERGY ASSESSMENT USING … · COMPREHENSIVE FACILITY ENERGY ASSESSMENT...
12
This PNL-SA-23975 COMPREHENSIVE FACILITY ENERGY ASSESSMENT USING FEDS D. L. Hadley J. M. Keller E. E. Richman R. Quinones(') December 1 994 Presented at the World Energy Engineering Congress Conference December 7-9, 1994 Atlanta, Georgia Prepared for the U.S. Department of Energy under Contract DE-AC06-76RLO 1830 Pacific North west Laboratory Richland, Washington 99352 (a) Energy & Demand Savings Opportunities, Fort Irwin, California DISCLAIMER DIS ~~~~~~~~~ OF THD report was prepared as an account of work sponsored by an agency of the United States Government. Neither the United States Government nor any agency thereof, nor any of their employees, makes any warranty, express or implied, or assumes any legal liability or responsi- bility for the accuracy, completeness, or usefulness of any information, apparatus, product, or process disclosed, or represents that its use would not infringe privately owned rights. Refer- ence herein to any specific commercial product, process, or service by trade name, trademark, manufacturer, or otherwise does not necessarily constitute or imply its endorsement, rwm- mendation, or favoring by the United States Government or any agency thereof. The views and opinions of authors expressed herein do not necessarily state or reflect those of the United States Government or any agency thereof. STER
Transcript of COMPREHENSIVE FACILITY ENERGY ASSESSMENT USING … · COMPREHENSIVE FACILITY ENERGY ASSESSMENT...

This
PNL-SA-23975
COMPREHENSIVE FACILITY ENERGY ASSESSMENT USING FEDS
D. L. Hadley J. M. Keller E. E. Richman R. Quinones(')
December 1 994
Presented at the World Energy Engineering Congress Conference December 7-9, 1994 Atlanta, Georgia
Prepared for the U.S. Department of Energy under Contract DE-AC06-76RLO 1830
Pacific North west Laboratory Richland, Washington 99352
(a) Energy & Demand Savings Opportunities, Fort Irwin, California
DISCLAIMER DIS ~~~~~~~~~ OF THD
report was prepared as an account of work sponsored by an agency of the United States Government. Neither the United States Government nor any agency thereof, nor any of their employees, makes any warranty, express or implied, or assumes any legal liability or responsi- bility for the accuracy, completeness, or usefulness of any information, apparatus, product, or process disclosed, or represents that its use would not infringe privately owned rights. Refer- ence herein to any specific commercial product, process, or service by trade name, trademark, manufacturer, or otherwise does not necessarily constitute or imply its endorsement, r w m - mendation, or favoring by the United States Government or any agency thereof. The views and opinions of authors expressed herein do not necessarily state or reflect those of the United States Government or any agency thereof.
STER

DISCLAIMER
Portions of this document may be illegible in electronic image products. images are produced from the best available original document.

COMPREHENSIVE FACILITY ENERGY ASSESSMENT USING FEDS
Donald L. Hadley John M. Keller Eric E. Richman
Pacific Northwest Laboratory
Rene Quinones Fort Irwin
ABSTRACT The energy savings and demand reduction opportunities at the Army's National Training Center at Fort Invin, California, were evaluated. The Fort Irwin analysis made use of the recently developed Facility Energy Decision Screening (FEDS) System Level-2 software tool FEDS is a systematic, technology-neutral, and fuel-neutral approach to evaluating energy savings opportunities at large facilities. FEDS analyze? most major building end uses (e.g., heating, cooling, lighting, ventilation. and service hot water), including interactive effects (e.g., the effect of a lighting technology on heating and cooling loads). FEDS output provides specific cost, energy (and demand) charges, and lifecycle cost (LCC) information, by cost-effective energy resource opportunities PROS). The remaining end uses common to large facilitiw (e.g., motors, transmission and distribution, vehicles) are analyzed using manual calculation methods.
The present value (FV) of the installed cost of all EROs constituting the minimum LCC efficiency resource (Le., cost-effective) at Fort Irwin is approximately $23.9 million in 1994 dollars (1994%). The PV of the energy and demand, operations and maintenance (O&M), and replacement savings associated with thii investment is approximately $87.3 million, for an overall NPV of $63.6 million.
This paper will d m n i the FEDS process and present detailed results of the comprehensive energy resource assessment conducted at Fort Irwin.
WHAT IS FEDS? The number of conceivable energy conservation measures, fuel-switching opportunities, and renewable energy projects at a federal site is very largc. The Pacific Northwest Laboratory (PNL) uses two methods to select, evaluate, and prioritize these energy resource opportunities (EROs). The first is the Facility Energy Decision Screening (FEDS) Model. FEDS is a multilevel software tool designed to provide a comprehensive approach to fuel-neutral, technology-independent, integrated (energy) resource planning and acquisition. FEDS currently has two levels-Level-1 and Level-2. Level-1 is a menu-driven DOS-based software program designed for facility energy managers as a screening tool. Level-1 assesses the likelihood of cost-effective energy projects based on high-level facility inputs and numerous assumptions. The output of Level-1 is used to assess an facility's overall energy consemation potential from the pcrqe&v ea of potentipl energy savings, potential cost aavings, and estimated investment requirement.
Level-2 is also a DOS-based software program that can be used by facility energy managers to identify, characterize, and assess individual energy projects. Howcvtr, Level-2 goes to the next level of detail, providing specific information on energy and cost savings, as well as the estimated investment requirement for specific technology retrofits. Level-2 is the appropriate analysis to follow positive Level-1 results; typically, a Level-;! input file can be initiated from a Level-1 input file. Level-2 allows the user to enter facility-specitlc data inputs to replace the inferred default values from Level-1. These inputs form "building sets," which are groups of buildings similar in use, age, construction type, fuel use, fuel availability, or other definable characteristics. By developing building sets based on detailed facility data, Level-2 tailors the analysis to the facility and provides more accurate and detailed economic &dings.
At thio point in the softwan development, Level-1 and Level-2 analyze most major building end uses (heating, cooling, lighting, ventilation, and service hot watcr) including their interactive effects (e.g., the effect of a lighting technology on heating and cooling
loads), providing specific cost, energy (and demand changes), and LCC information, by cost-effective technology.
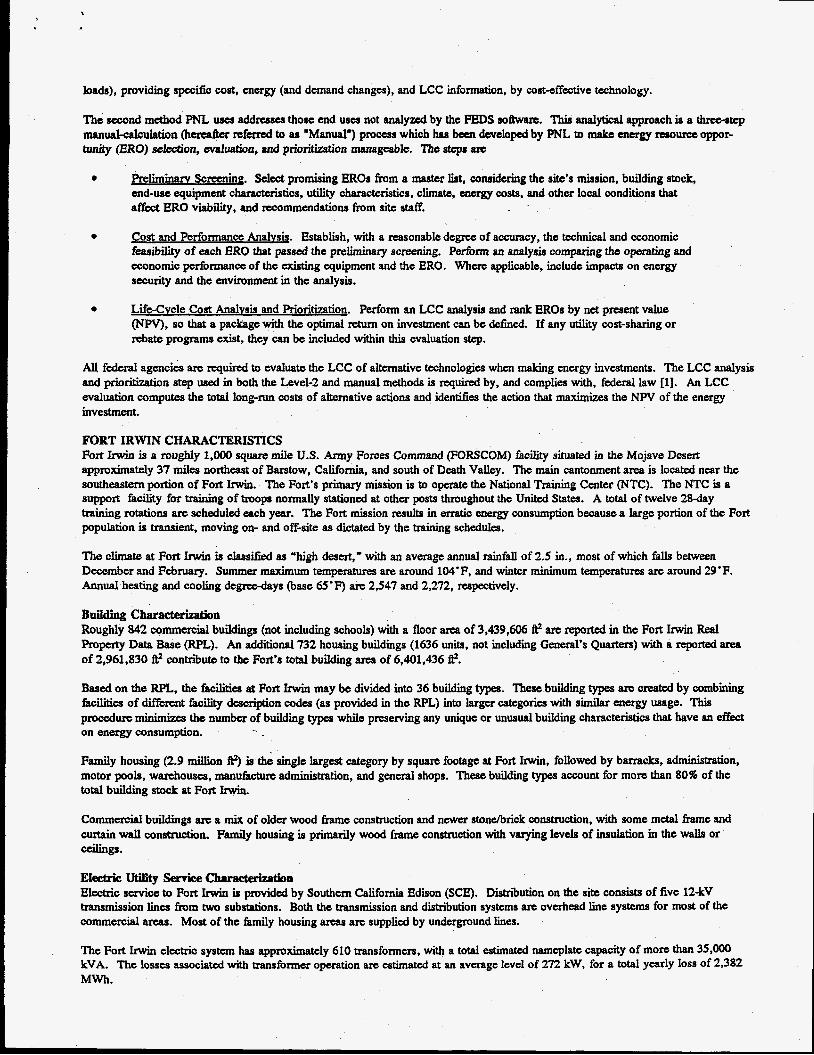
The sccond method PNL uses addresses those end uses not analyzed by the PEDS software. Thh analytical approach is a thrcc-stcp manual-calculation (herder referred to as "Manual") process which has been developed by PNL to make energy rcaourcc oppor- tunity (ERO) selection, waIUatian, and prioritbtion manageable. The steps are
Prelimmarv !Screening. Select promising EROs from a master list, considering the site's mission, building stock, end-use equipment characteristics, utility characteristics, climate, energy costs, and other local conditions that affect ERO v i a b i i , and recommendations from site staff.
Cost and Performance Analvsis. Establish, with a reasonable degree of accuracy, the technical and economic feasibility of each ERO that passed the preliminary screening. Perform an analysis comparing the operating and economic prforrnance of the existing equipment and the ERO. Where applicable, include impacts on energy security and the environment in the analysis.
LifsCvcle Cost Analvsis and Prioritization. Perform an LCC analysis and rank EROs by net present value (NPV), so that a package with the optimal return on investment can be dehed. If any utility cost-sharing or rebate programs exist, they can be included within thii evaluation step.
All federal agencies are required to evaluate the LCC of alternative technologies when making energy investments. The LCC analysis and prioritization step used in both the Level-2 and manual methods is required by, and complies with, federal law [l]. An LCC evaluation computes the total long-run costs of alternative actions and identifies the action that maximizes the NPV of the energy investment.
FORT IRWIN CHARACTERISTICS Fort Irwin is a roughly 1,OOO square mile U.S. Army Forces Command (FORSCOM) hcility situated in the Mojave Desert approximately 37 miles northeast of Barstow, California, and south of Death Valley. The main cantonment area is located near the southeastern portion of Fort Irwin. The Fort's primary mission is to operate the National Training Center (NTC). The NTC is a support facility for training of troops normally stationed at other posts throughout the United States. A total of twelve 28day training rotations are scheduled each year. The Fort mission results in erratic energy consumption because a large portion of the Fort population is transient, moving on- and off-site as dictated by the training schedules.
The climate at Fort Irwin is classSed as 'high desert," with an average annual rainfall of 2.5 in., most of which falls between December and February. Summer maximum temperatures are around 104.F. and winter minimum temperatures are around 29'F. Annual heating and cooling degredays (base 65.F) are 2,547 and 2,272, respectively.
Buiiding Characterization Roughly 842 commercial buildings (not including schools) with a floor area of 3,439,606 f are reported in the Fort Irwin Red Property Data Base (RPL). An addiional 732 housing buildings (1636 units, not including General's QuaaeR) with a reported area of 2,961,830 il? contribure to the Fort's total building area of 6,401,436 ll?.
Based on the RPL, the facilities at Fort Irwin may be divided into 36 building types. These building types arc created by combining facilities of different facility description codes (as provided in the RPL) into larger categories with similar energy usage. This procedure minimizes the number of building types while preserving any unique or unusual building characteristics that have an effect on energy consumption.
Family housing (2.9 million motor pools, warehouses, manufactun administration, and general shops. These building types account for more than 80% of the total building stock at Fort Irwin.
is the single largest category by squarc footage at Fort Irwin, followed by barracks, administration,
Commercial buildings arc a mix of older wood frame construction and newer stonelbrick construction, with some metal frame and curtain wall construction. Family housing M primarily wood fiame construction with varying levels of insulation in the walls or ceilings.
Electric Utility Sehcechpraeterap * tion Electric service to Fort Irwia is provided by Southern California Edison (SCE). Distri'bution on the site consists of five 12-kV transmission lines from two substations. Both the transmission and distribution systems arc overhead line systems for most of the commercial areas. Most of the M y housing areas are supplied by underground lines.
The Foa Irwin electric systcm has approximately 610 transformers, with a total estimated nameplate capacity of more than 35,000 kVA. The losses associated with transformer operation are estimated at an average level of 272 kW, for a total yearly loss of 2,382 Mwh.

Table 3 presents a breakdown and summary of both the energy and demand savings for the first ycar and full imphentation of the cost-effective energy resourcc at Fort Irwin.
For EROs analyzed by FEDS Level-2, lighting EROs repream the greatest efficiency resource, accounting for more than $17.3 million of the total $63.8 million NW and $4.4 million of the total $24.7 million installed cost. The remaining ERO categories have NWs ranging from $6.1 million to $0.9 million, except for cooling and b t i n g EROs, which are only marginally cost-effective with NWs of $108,500 and $32,400, respedively.
For non-bddmg EROs, vehicles represent the greatest efficiency resource, accounting for $10.1 million of the total $63.8 million NPV and more than $2 million of the total $24.7 million installed cost. The remaining non-building ERO categories have NFVs ranging from $9.4 million to $314,000.
For building EROs (analyzed by Level-2), the estimated annual electricity consumption at Fort Irwin is 89,100 MWh. Estimated electric demand is 30,100 kW. Full implementation of all electric EROs nsults in a reduction of 14,500 MWh and 3,600 kW. This represents a reduction of approximately 16% over total electricity consumption and 12% over sitewide demand. The estimated annual propane consumption at Fort Invin is 209,100 MBtu. Full implementation of all propane EROs results in net conservation of 71,000 MBtu, which represents a net conservation of 34% of total consumption. The end u e s of chilled water and district hot water were not broken out by fuel. The estimated annual chilled water use is 2 million ton-hours. Full implementation of all chilled water EROs results in a reduction of 331,000 ton-hours, or 16% of total consumption. The estimated annual district hot water use 9,200 MBtu. Full implementation of all district hot water EROs results in a reduction of 7,700 MBtu, or 83% of total consumption.
For non-buildmg EROs, the estimated annual electricity consumption at Fort Irwin is 79,800 MWh. Estimated electric demand is 399,000 kW-month (sum of the peak demands for each month). Full implementation of all electric EROs mults in a reduction of 12,200 MWh and 58,000 kW-month, representing a reduction of approximately 15% over total electricity consumption and 14% over sitewide demand. The estimated annual fossil fuel consumption (natural gas, No. 2 fuel oil, propane, gasoline, and diesel) at Fort Irwin is 823,800 MBtu. This total excludes any diesel and gasoline used for vehicles not addressed through EROs. Full implementation of all fossil fuel EROs results in conservation of 187,000 MBtu and a new load of 68,800 MBtu, for a net reduction of 118,600 MBtu. This represents conservation of 23% of total consumption, a new load of 896, for an overail decrease of 14% in fossil file1 usc.
ENERGY PROJECT IMPLEMENTATION AT FORT IRWIN To meet its target of reducing overall energy consumption by 30% by the year 2005 (1985 baseline), Fort Irwin has developed a five- year plan and is actively pursuing basewide energy conservation. Sources of funding for implementing thegc energy conservation project, include the Department of h y ’ s Energy and Conservation Investment Program (MILCON/ECP) and the Federal Energy Management Program (FEMP). Another potential sourcc of finds is the utility-sponsored demand-side management (DSM) programs. The FEDS Level-;! results are used to prioxitize the most cost-effective energy projects by evaluating the projects’ life- cycle costs, investment requirements, and the en- savings opportunities.
Five-Year En- Plan Fort Imin has developed an extended fiveyear energy plan that provides a timeline for implementation of energy conservation projects and identifies potential fimding mechanisms. Individual energy projects identified by the FEDS process have been folded into this plan. The five-year plan is extremely dynamic, responding to the annual cycle of available funds or changes in utility DSM programs-
The detailed spreadsheet format of the FEDS Level-2 output allows for a relatively easy identification of individual energy projects that can be implemented as timephased projects targeted to available funding sources. Specific projccts c8n be iden- by disaggregating the results either by building or end-use category or by a specific retrofit technology applied across multiple end uses.
As part of this proce.ss, the FEDS results were used to identify five energy projects that were submitted for FY95 FEMP funding. Thesc projects, shown in Table 4, met the program rcquiranents for simple payback and savings-to-investment ratio.
Residential W A C Evaluation The FEDS process was also used to evaluate alternative scenarios for heating and cooling of the existing family housing. There are 1,637 f d y housing units, all with basically the same propane furnace and central air conditioning systems. The options evaluated includcd airsource heat pump, ground-source hcat pump, LPG furnace and central air, natural gas furnace and central air, and gas- fired heat pump (still under development but included for comparison purposes).
Although natural gas is not currently available at Fort Irwin, W A C options are included to compare the operating cost of natural gas
4

and propane. The natural gar nrte ured in the analyah in an cstknate baaed on i n f o d o n provided by Fort personnel and rCprtSClltatiVC8 Of po88ibk fl&ld &ar piovlden.
This ERO WM analyzed msnually because the be l -2 coffware cannot y e fully analyze EROs involving hcat pump (either air- or &round-source) or fuel switching from LPG to natural p when natural gas u not available to the buildiig. Therefore, all tcsidential W A C options were analyzed manually, wing only the savings fiom the individual pieces of equipment.
The technical assumptions arc aa followa:
The existing LPG fumacg have an average size of 50 KBtu/h (input) and efficiency of 70.5% AFUE. The existing air wnditioners have an avcrage size of 2.5 tons and efficiency of 8.0 SEER.
The replacement equipment efficiencies are shown in Table 5.
Existing energy consumption was calculated using previously developed energy use intensities @UXs) PI: 2.91 kWh/ft*-yr for cooling and 26.37 kBtu/f-yr for heating. For an average house size of 1,800 f, the energy consumption is 5,238 kwh for cooling and 47.5 MBtu for heating per unit.
Retrofit energy consumption is based on the actual equipment size and estimated run hours of each replacement unit to meet the same load as the existing equipment. The replacement equipment sizes are different from the existing equipment size in almost all cases because actual equipment was chosen for the retrotit options. Equipment sizes are given in Table 6.
Operating hours for the existing equipment are based on the EUIs and equipment capacities as described above. Operating hours for the retrofit equipment are calculated from the existing equipment hours modified by the replacement equipment efficiencies and capacitia.
The cost assumptions are as follows:
The replacement equipment installed costs are shown in Table 7.
O&M costs are $75/yr for all air- and ground-source heat pump options, $85lyr for all furnace and air conditioner options (including the existing), and $105/yr for the gas-fired heat pump option.
The cost of natural gas is assumed to be $3.50/MBtu.
Of the five options, the gas-fired heat pump was the winning technology (Le., had the highest NPV) for this ERO. However, because natural gas is not now available at Fort Irwin (and it is unknown if the unit can be c o n v d to LPG), this option is not viable at the Fort. In addition, present or future air quality laws may restrict the use of individual natural gas engines at each housing unit, and the residential gas-fired heat pump technology is sti l l only in the testing stages and is therefore not available.
The runner-up W A C technology is the highefficiency ground-source heat pump. Full implementation of this ERO has an initial cost of $7,086,917, with a savings+investment ratio of 1.7 and discounted payback of 9.9 years.
It is estimated that the most cost-effective implementation of this ERO will result in an innearr in annual electric energy consumption of 299,851 kwh but an accompanying decrease in propane use of 77,702 MBtu, for a total annualized energy wst savings of $479,316 and electric demand savings of 15,226 kW-month at an annualized value of $234,468.
The gas-fired heat pump is the only option that would require significant additional maintenance; the oil, oil filter and spark plug must be replaced yearly at an estimated cost (materials and labor) of $105 per unit. Replacing the fumacc and air conditioner with a heat pump should rcsult in minor O W savings of approximately $16,37O/yr.
CONCLUSION Potential energy conservation measures, fuel-switching opportunities, and renewable energy projects at.fscilities the size of Fort Imin are innumerable. A practical method to systematically assess all possible combinations of energy resource oppoxtunXc~ is needed to make the selection, evaluation, and prioritization of individual energy projects a manageable task. The FEDS process and Level-2 software do just that.
A FEDS assessment of Fort Irwin was -tIy completed. Significant energy and energy-cost savings oppr t~n i t ie~ w c r ~ identitied that would reduce building electric encrgy consumption by 16% and propane consumption by 34%. For non-buitding EROS, dediic

energy conrumption would be reduced by 15%; fossil-fuel consumption would decline by 14%.
Individual energy projects identified using the FEDS process have been folded into a 5-yeat energy plan currently being implemented
sivcn implnnmtatio * n of some of the rrcommended projccta, wised energy oostr, and other changing c~ndirionr at Fort Imin.
REFEXENCES
at Fort In;vin. It ia anticipated that the FEDS assessment will be repeated in 1996 to rctvBIuBtc the ~lt3'gy oolucMLso * nopporhlnitier,
[I] 10 CFR 436. 1992. U.S. Department of Energy, "Federal Energy Management and Planning Programs." US. Code of Federal Reguhtions.
Richman, E.E., J.M. filler, A.L. Dittmer, and D.L. Hadlcy. 1994. Fort Znvin Integrated Resource Assessmmt Volume 2: Baseline Detail. PNL-9064 Vol. 2, Pacific Northwest Laboratory, Richland, Washington.
E]
[3] Means. 1992. MEQNS Building Consmction Cost Data: 1992 15th Annual Edition. R.S. Means Company, Inc. Kingston, Massachusetts.
.
6
=erscv?lypc
Electricity
propane
Gasoline
Diesel
JP4
JP-8
Totals
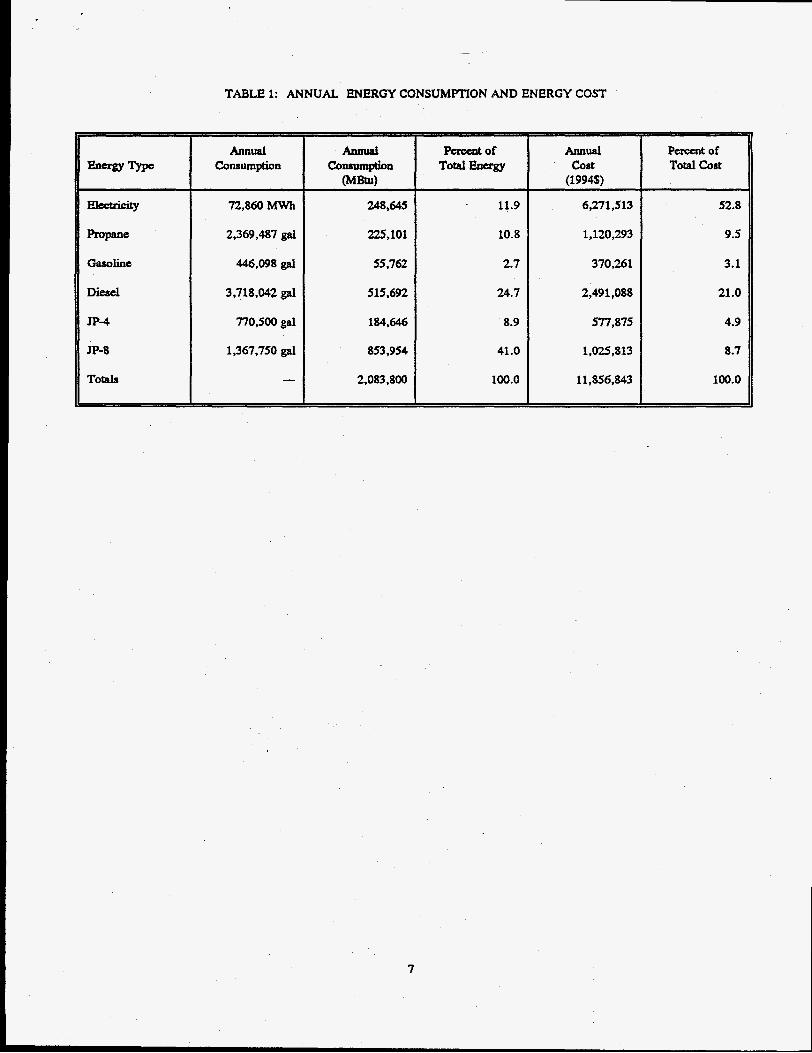
TABLE 1: ANNUAL ENERGY CONSUMFTION AND ENERGY COST
72,860 Mwh
2,369,487 gal
446.098 @
3,718,042 gal
770,500 gal
1,367,750 gal
-
248,645
225,101
55.762
515,692
184,646
853,954
2,083,800
11.9
10.8
2.7
24.7
8.9
41.0
100.0
Annual ecrccnt of cost Total Cost (1994s)
~~~
6,271,513
1,120,293
370,261
2,491,088
577,875
1,025,813
11,856,843
-- ~~
52.8
9.5
3.1
21 .o
4.9
8.7
100.0
7

ERO crtesoy Light# (Level-2) Vehicler Envciapo Roof (Level-2)
Lightingcontrolr Fan. Hag. W A C
Moton €WAC Tranr. & Dist. Hot Water (Level-2) Wall (Level-2) C e U Chillers DHW & AIC WeUs AIC Heating controtr cooling (Level-2) Heating (Level-2) Totals't)
TABLE 2: SUMMARY OF THE COST-EFPECTIVE EROS (1994s) W - T d Net prtrslr Value
17,255,714 1 10,091,649
9,429,302 6,125,922 5,244,863 3,051,116 2,180,059 2,159,155 1,845,890 1,554924 933,622 893,186 797222 554,481 537,789 487,944 314,125 108,496 32,352
63,625,347 Notes: (a) Data of this lev& of detail is not normally available from FEDS Level-2. AU values from the Level-2 software ate approxiamate, and an shown only to represent the magnitude of the savings from each end use. @) These totals are the sum of the manual EROs and the output from the Level-2 software. They will not necessarily be the sum of the numben above.
8

TABLE 3: SUMMARY OF ENERGY AND DEMAND SAVINGS FROM EROS
Fits Yeu Fvrt Year fvlerg)r s ~ i n p ~ FuIl ~illpiewnt -flurg)r
CMBhl) (kW-m) W-m) Savings (1994 $) EBO category &lcrgy!bvi i Dsmrnds.- -1 Demand Savinga d D c d
Lights (Level-2) NA NA 34,815 2,487 1,014,144
Fam. Hsg. HVAC 76,678 15,226 75678 15,226 713,785
m e l o p s 21.862 17,099 21,862 17,099 674,766
Roof (Level-2) NA NA 45,939 621 472,181
Vehiclea 14,638 -180 14,638 -180 328,840
9

TABLE 4 ENERGY PROJECTS IDENTIFIED FOR FEMP FUNDING
C~OSS-CQMCC~ chillers: Provide the capabili&y to cross-connect chiller equipment between two central energy plants. During periods of low loads, this would allow operation with only one chiller, improving overall plant efficiency.
Reset chitled/conccnser water temmture: Reset the chilled water and condemcr water temperatum 2-4' higher/lowcr. Large watercooied chiuerrs arc typically set for 45'F chilled water temperatun and 95'P concensor water temptratun. Most systems can operate at higherflower tempemtuns without impacting cooling performance.
Install .MC dewmerheatem: Install desuperheakrs on air-cooled air umditioncrs in selected commercial buildings. This would improve o v d A/C efficiency by about 15% and would supply the majority of the hot water needs during the cooling season.
Reulace existine residential domestic water heaters: Replace existing domeslic hot water heaters, wrap tanks and piping with insulation and lower tank tempezatlm.
Reulace mace heaters with LPG infa-red heaters: Replace conventional space heaters with LPG infra-red heaters in selected maintmancc shops and motor pool buildings.
Initial cost
$354,000
$1,000
$118,000
$270,000
$30,000
Savings+- Invesment Ratio
3.5
5975
7.8
6.4
6.3
4.9 years
0.0 years
2.2 years
1.6 years
2.8 years
.
10
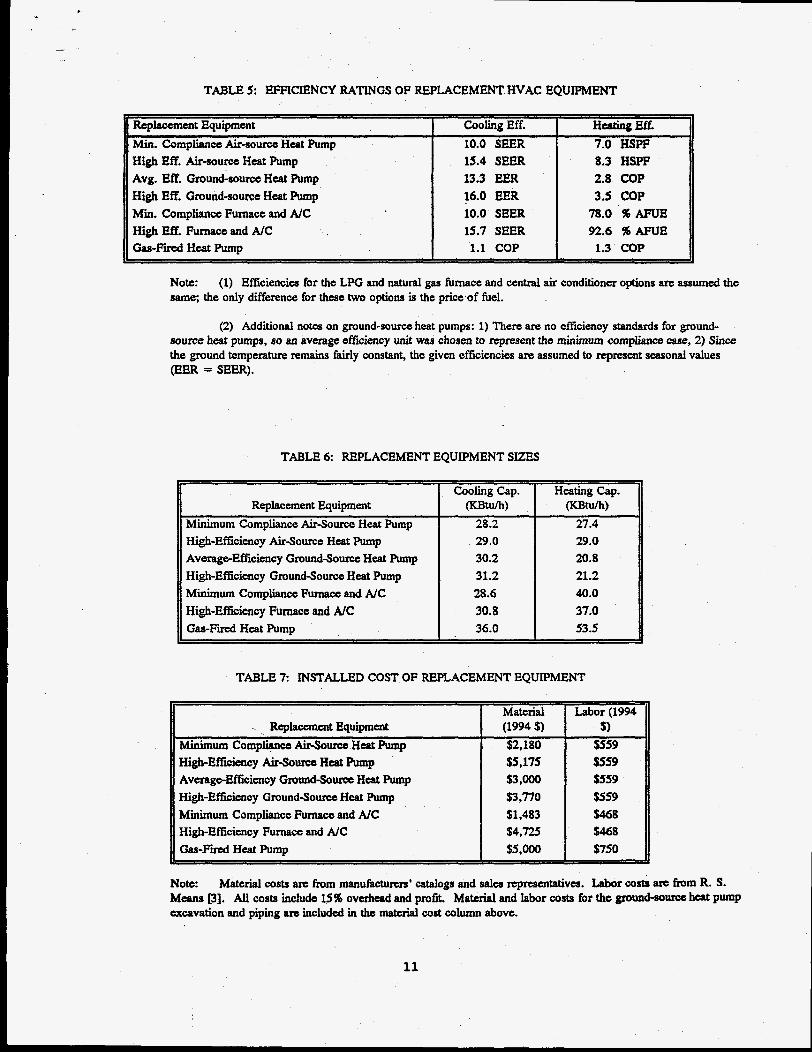
TABLE 5: EFFICIENCY RATINGS OF REPLACEMENT W A C EQUIPMENT
Replacanent Equipment Cooling Eff. HeatingEff. Min. Compliance Aitsource Heat Pump 10.0 SEER 7.0 HSPP High Eff. Air-source Heat Pump 15.4 SEER 8.3 HSPP Avg. Eff. Ground-source Heat Pump 13.3 EER 2.8 COP
Min. Compliance Furnace and MC 10.0 SEER 78.0 46 AFUE High Eff. Furnace and N C 15.7 SEER 92.6 96- G a s - F d Heat Pump 1.1 COP 1.3 COP
High Eff. Ground-soum Heat PWIP 16.0 EER 3.5 COP
Note: same; the only difference for these two options is the price of fuel.
(1) Efficiencies for the LPG and natural gas furnace and central air conditioner options arc assumed the
(2) Additional notes on ground-source heat pumps: 1) Then are no efficiency stan- for ground- source heat pumps, sa an average efficiency unit was chosen to represent the minimum compliance w e , 2) Since the ground temperature r e d s fairly constant, the given efficiencies arc assumed to represent seasonal values (EER = SEER).
TABLE 6 REPLACEMENT EQUIPMENT SIZES
Cooling Cap. Heating Cap. Replacement Equipment (KBtlw ( K B h w
Minimum Compliance Air-Source Heat Pump 28.2 27.4 High-Efficiency Airsource Heat Pump 29.0 AverageEfficiency Ground-Source Heat Pump 30.2 High-Efficiency Ground-Source Heat Pump 31.2 Minimum Compliance Furnace and M C 28.6 High-Efficiency Furnace and MC 30.8 Gas-Frred H a t Pump 36.0
29.0 20.8 21.2 40.0 37.0 53.5
TABLE 7: INSTALLED COST OF REPLACEMENT EQUIPMENT
- RcphcuncntEquipment Minimum Compliance Air-Sourcc Heat Pump High-Efficiency Airsource Heat Pump Average-Effi;cienoy GroundSourcc Heat Pump High-Eftlciency Ground-Sourcc Hcat Pump Minimum Compliance Furnace and N C High-Efficiency Furnace and N C Gas-Find Heat Pump
Material (1994 $)
$2,180 S5,175 $3 ,Ooo $3,770 $1,483 u,m s.OO0
Labor (1994
sss9
$468 $750
Note: Means PI. All costs include 1596 overhead and profit, Material and labor costs for the ground-source htat pump excavation and piping are included in the makrial cost column above.
Material costs arc h m manufacturtfi’ d o g s and salts representatives. Labor costs arc from R. S.
11