Comprehensive Evaluation of Transit Signal Priority … · Final Technical Report . Agreement...
96
Final Technical Report Agreement T2695, Task 60 SS-RTSP Evaluation Comprehensive Evaluation of Transit Signal Priority System Impacts Using Field Observed Traffic Data by Yinhai Wang Associate Professor of Civil and Environmental Engineering Mark Hallenbeck Director of Washington State Transportation Center and Jianyang Zheng Guohui Zhang Xiaolei Ma Jonathan Corey Research Assistant Research Assistant Research Assistant Research Assistant Department of Civil and Environmental Engineering University of Washington Seattle, Washington 98195-2700 Washington State Transportation Center (TRAC) University of Washington, Box 354802 1107 NE 45 th Street Seattle, Washington 98105-4631 Sponsored by Transportation Northwest (TransNow) University of Washington 129 More Hall, Box 352700 Seattle, Washington 98195-2700 Washington State Transportation Commission Department of Transportation Olympia, Washington 98504-7370 and in cooperation with U.S. Department of Transportation Federal Highway Administration June 2008
Transcript of Comprehensive Evaluation of Transit Signal Priority … · Final Technical Report . Agreement...
Final Technical Report Agreement T2695, Task 60
SS-RTSP Evaluation
Comprehensive Evaluation of Transit Signal Priority System Impacts Using Field Observed Traffic Data
by Yinhai Wang
Associate Professor of Civil and Environmental Engineering
Mark Hallenbeck Director of Washington State Transportation Center
and
Jianyang Zheng Guohui Zhang Xiaolei Ma Jonathan Corey
Research Assistant Research Assistant Research Assistant Research Assistant
Department of Civil and Environmental Engineering University of Washington
Seattle, Washington 98195-2700
Washington State Transportation Center (TRAC) University of Washington, Box 354802
1107 NE 45th Street Seattle, Washington 98105-4631
Sponsored by
Transportation Northwest (TransNow)
University of Washington 129 More Hall, Box 352700
Seattle, Washington 98195-2700
Washington State Transportation Commission
Department of Transportation Olympia, Washington 98504-7370
and in cooperation with
U.S. Department of Transportation Federal Highway Administration
June 2008
TECHNICAL REPORT STANDARD TITLE PAGE
1. REPORT NO.
WA-RD 699.1/ TNW2007-06
2. GOVERNMENT ACCESSION NO. 3. RECIPIENT’S CATALOG NO.
5. REPORT DATE
June 2008 4. TITLE AND SUBTITLE
Comprehensive Evaluation of Transit Signal Priority System Impacts Using Field Observed Traffic Data 6. PERFORMING ORGANIZATION CODE
7. AUTHOR(S)
Yinhai Wang, Mark Hallenbeck, Jianyang Zheng, Guohui Zhang, Jonathan Corey, and Xiaolei Ma
8. PERFORMING ORGANIZATION REPORT NO.
10. WORK UNIT NO. 9. PERFORMING ORGANIZATION NAME AND ADDRESS
Transportation Northwest Regional Center X (TransNow) Box 352700, 129 More Hall University of Washington Seattle, WA 98195-2700
11. CONTRACT GRANT NO.
Agreement T2695, Task 60 13. TYPE OF REPORT AND PERIOD COVERED
Final Technical Report 12. SPONSORING AGENCY NAME AND ADDRESS
Washington State Department of Transportation Transportation Building, MS 47372 Olympia, Washington 98504-7372 Kathy Lindquist, Project Manager, 360-705-7976
14. SPONSORING AGENCY CODE
15. SUPPLEMENTARY NOTES
This study was conducted in cooperation with the University of Washington and the US Department of Transportation 16. ABSTRACT
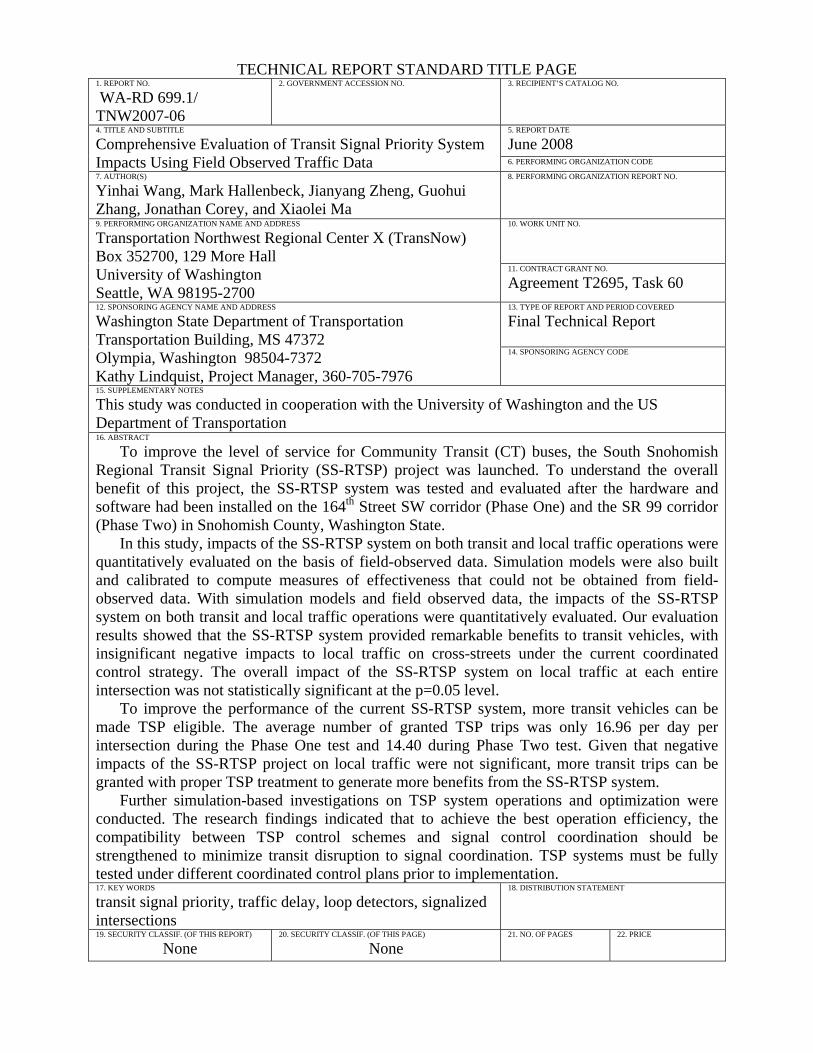
To improve the level of service for Community Transit (CT) buses, the South Snohomish Regional Transit Signal Priority (SS-RTSP) project was launched. To understand the overall benefit of this project, the SS-RTSP system was tested and evaluated after the hardware and software had been installed on the 164th Street SW corridor (Phase One) and the SR 99 corridor (Phase Two) in Snohomish County, Washington State.
In this study, impacts of the SS-RTSP system on both transit and local traffic operations were quantitatively evaluated on the basis of field-observed data. Simulation models were also built and calibrated to compute measures of effectiveness that could not be obtained from field-observed data. With simulation models and field observed data, the impacts of the SS-RTSP system on both transit and local traffic operations were quantitatively evaluated. Our evaluation results showed that the SS-RTSP system provided remarkable benefits to transit vehicles, with insignificant negative impacts to local traffic on cross-streets under the current coordinated control strategy. The overall impact of the SS-RTSP system on local traffic at each entire intersection was not statistically significant at the p=0.05 level.
To improve the performance of the current SS-RTSP system, more transit vehicles can be made TSP eligible. The average number of granted TSP trips was only 16.96 per day per intersection during the Phase One test and 14.40 during Phase Two test. Given that negative impacts of the SS-RTSP project on local traffic were not significant, more transit trips can be granted with proper TSP treatment to generate more benefits from the SS-RTSP system.
Further simulation-based investigations on TSP system operations and optimization were conducted. The research findings indicated that to achieve the best operation efficiency, the compatibility between TSP control schemes and signal control coordination should be strengthened to minimize transit disruption to signal coordination. TSP systems must be fully tested under different coordinated control plans prior to implementation. 17. KEY WORDS
transit signal priority, traffic delay, loop detectors, signalized intersections
18. DISTRIBUTION STATEMENT
19. SECURITY CLASSIF. (OF THIS REPORT)
None 20. SECURITY CLASSIF. (OF THIS PAGE)
None 21. NO. OF PAGES
22. PRICE
iii
DISCLAIMER
The contents of this report reflect the views of the authors, who are responsible for the
facts and accuracy of the data presented herein. This document is disseminated through
the Transportation Northwest (TransNow) Regional Center under the sponsorship of the
U.S. Department of Transportation UTC Grant Program and through the Washington
State Department of Transportation. The U.S. Government assumes no liability for the
contents or use thereof. Sponsorship for the local match portion of this research project
was provided by the Washington State Department of Transportation. The contents do
not necessarily reflect the views or policies of the U.S. Department of Transportation or
Washington State Department of Transportation. This report does not constitute a
standard, specification, or regulation.

iv
TABLE OF CONTENTS
EXECUTIVE SUMMARY ............................................................................................... xi CHAPTER 1 INTRODUCTION .........................................................................................1
1.1 Research Background ............................................................................................... 1 1.2 Problem Statement .................................................................................................... 2 1.3 Research Objective ................................................................................................... 3
CHAPTER 2 STATE OF THE ART...................................................................................4
CHAPTER 3 PROJECT OVERVIEW ................................................................................6
3.1 Major Components.................................................................................................... 6 3.2 Priority Strategies...................................................................................................... 7
CHAPTER 4 METHODS..................................................................................................10
4.1 Measures of Effectiveness ...................................................................................... 10 4.1.1 Primary Measures of Effectiveness ................................................................. 10
Transit Time Match............................................................................................... 10 Transit Travel Time .............................................................................................. 11 Traffic Queue Length............................................................................................ 11 Signal Cycle Failures ............................................................................................ 11 Frequency of TSP “Calls”..................................................................................... 12
4.1.2 Secondary Measures of Effectiveness ............................................................. 12 Average Person Delay........................................................................................... 12 Vehicle Delays and Stops ..................................................................................... 12
4.2 Database Design and Implementation .................................................................... 13 CHAPTER 5 PHASE ONE FIELD TEST.........................................................................16
5.1 Corridor................................................................................................................... 16 5.2 Transit Service ........................................................................................................ 17 5.3 Data Sources ........................................................................................................... 18
5.3.1 TSP Logs.......................................................................................................... 18 5.3.2 GPS Data.......................................................................................................... 19 5.3.3 Traffic Controller Logs .................................................................................... 20 5.3.4 Traffic Video Data ........................................................................................... 21 5.3.5 Other Data........................................................................................................ 22
CHAPTER 6 PHASE TWO FIELD TEST........................................................................24
6.1 Corridor................................................................................................................... 24 6.2 Transit Service ........................................................................................................ 24
v
6.3 Data Source............................................................................................................. 26 6.3.1 TSP Logs.......................................................................................................... 26 6.3.2 GPS Data.......................................................................................................... 26 6.3.3 Traffic Controller Logs .................................................................................... 26 6.3.4 Traffic Video Data ........................................................................................... 26 6.3.5 Other Data........................................................................................................ 27
CHAPTER 7 SIMULATION ANALYSIS........................................................................28
7.1 Simulation Tool ...................................................................................................... 28 7.2 Phase One Simulation Modeling and Experience................................................... 28
7.2.1 Modeling 164th Street SW............................................................................... 28 7.2.2 Simulation Model Configuration and Calibration ........................................... 29
7.3 Phase Two Simulation Modeling and Experience .................................................. 31 7.3.1 Modeling the SR 99 Corridor .......................................................................... 31 7.3.2 Simulation Model Configuration and Calibration ........................................... 32
CHAPTER 8 PHASE ONE RESULTS AND DISCUSSION...........................................35
8.1 Statistics for Granted TSP Trips ............................................................................. 35 8.2 Benefits ................................................................................................................... 36
8.2.1 Transit Time Match.......................................................................................... 36 8.2.2 Transit Travel Time ......................................................................................... 36 8.2.3 Average Person Delay...................................................................................... 40
8.3 Costs........................................................................................................................ 41 8.3.1 Vehicle Delays and Stops ................................................................................ 41 8.3.2 Traffic Queue Length....................................................................................... 43 8.3.3 Signal Cycle Failure......................................................................................... 44
8.4 Discussion on Possible Improvements for the SS-RTSP System........................... 45 8.4.1 Frequency of TSP Calls ................................................................................... 45 8.4.2 Near-Side Bus Stops ........................................................................................ 46
CHAPTER 9 PHASE TWO RESULTS AND DISCUSSION..........................................48
9.1 Statistics for Granted TSP Trips ............................................................................. 48 9.2 Benefits ................................................................................................................... 48
9.2.1 Transit Time Match.......................................................................................... 48 9.2.2 Transit Travel Time ......................................................................................... 49 9.2.3 Average Person Delay...................................................................................... 51
9.3 Costs........................................................................................................................ 53 9.3.1 Vehicle Delays and Stops ................................................................................ 53 9.3.2 Traffic Queue Length....................................................................................... 54 9.3.3 Signal Cycle Failure......................................................................................... 56
vi
CHAPTER 10 SIMULATION-BASED INVESTIGATION OF TSP SYSTEM OPERATION AND OPTIMIZATION..............................................................................58
10.1 Simulation Experimental Design .......................................................................... 58 10.2 Simulation Test ResultS and Discussion .............................................................. 61
10.2.1 Simulation Test under Scenario 1 .................................................................. 61 10.2.2 Simulation Test under Scenario 2 .................................................................. 66 10.2.3 Simulation Test under Scenario 3 .................................................................. 70 10.2.4 Simulation Test under Scenarios 4, 5, and 6.................................................. 71
10.3 Simulation-Based Research Findings ................................................................... 76 CHAPTER 11 CONCLUSIONS AND RECOMMENDATIONS....................................78
11.1 Conclusions........................................................................................................... 78 11.2 Recommendations................................................................................................. 79
ACKNOWLEDGMENTS .................................................................................................80
REFERENCES ..................................................................................................................81
vii
LIST OF FIGURES
Figure Page 3-1 Field Equipment for TSP System Operation .......................................................... 6 3-2 Priority Logic Flowchart......................................................................................... 9 4-1 E/R Diagram of Database .......................................................................................13 5-1 Phase One Test Corridor.........................................................................................17 5-2 Log Form for Bus Drivers.......................................................................................22 6-1 Phase Two Test Corridor ........................................................................................25 7-1 A Snapshot of the Phase One Simulation Model....................................................30 7-2 A Snapshot of the Phase Two Simulation Model ...................................................33 7-3 A Three-Dimensional Snapshot of the Phase Two Simulation Model ...................34 10-1 Transit Delay Comparisons with Various Early Green and Green Extension
Times under Different Signal Plans........................................................................75
viii
LIST OF TABLES
Table Page 5-1 TSP-Enabled Approaches of the Phase One Test ...................................................16 5-2 Number of Eligible TSP Trips on Phase One Test Routes .....................................18 5-3 Example of Traffic Controller Logs in the Phase One Test ...................................20 6-1 Number of Eligible TSP Trips on Phase Two Test Routes ....................................25 8-1 Number of Percentage of Granted TSP Trips in the Phase One Test .....................35 8-2 Time Match at Bus Stops in the Phsae One Test ....................................................36 8-3 Transit Corridor Travel Time in the Phase One Test..............................................37 8-4 Transit Intersection Travel Times in the Phase One Test.......................................39 8-5 Simulation Results for personal Delays in the Phase One Test ..............................40 8-6 Vehicle Delays in the Phase One Test ....................................................................41 8-7 Simulation Results for Average Vehicle Delays and Stops in the Phase One
Test..........................................................................................................................42 8-8 Traffic Queue Length on Cross-Streets in the Phase One Test ..............................43 8-9 Signal Cycle Failure Occurred in the Phase One Test............................................44 9-1 Number of Granted TSP Trips in the Phase Two Test ...........................................48 9-2 Time Match at Bus Stops in the Phase Two Test ...................................................49 9-3 Transit Corridor Travel Times in the Phase Two Test ...........................................50 9-4 Transit Intersection Travel Times in the Phase Two Test ......................................51 9-5 Simulation Results of Personal Delays in the Phase Two Test ..............................52 9-6 Traffic Delays and Stops from One Simulation Iteration in the Phase Two
Test..........................................................................................................................53 9-7 Traffic Delays and Stops from All Simulation Iterations in the Phase Two
Test..........................................................................................................................54 9-8 Traffic Queue Length on Cross-Streets in the Phase Two Test..............................55 9-9 Signal Cycle Failure in the Phase Two Test ...........................................................57 10-1 Simulation Results of Delays and Stops for Transits along the Corridor for
Test Scenario 1 from Ten Simulation Iterations.....................................................62 10-2 Simulation Results for General Traffic at Thirteen Intersections along the
Corridor for Test Scenario 1 from Ten Simulation Iterations ................................64 10-3 Compared Results for General Traffic along the Entire Corridor for Test
Scenario 1 from Ten Simulation Iterations.............................................................65 10-4 Simulation Results of Delays and Stops for Transits along the Corridor for
Test Scenario 2 from Ten Simulation Iterations.....................................................66 10-5 Simulation Results of Delays and Stops for Transits at Three Consecutive
Intersection for Test Scenario 2 from Ten Simulation Iterations ...........................68 10-6 Compared Results for General Traffic along the Entire Corridor for Test
Scenario 1 from Ten Simulation Iterations.............................................................69
ix

10-7 Simulation Results of Delays and Stops for Transit Vehicles along the Corridor for Test Scenario 3 from Ten Simulation Iterations ................................70
10-8 Compared Results for General Traffic along the Entire Corridor for Test Scenario 1 from Ten Simulation Iterations.............................................................73
10-9 Simulation Results of Delays for Transit and General Traffic with Various Early Green and Green Extension Times under the 120-Second-Cycle Signal Plan from Ten Simulation Iterations.......................................................................74
10-10 Simulation Results of Delays for Transit and General Traffic with Various Early Green and Green Extension Times under the 130-Second-Cycle Signal Plan from Ten Simulation Iterations.......................................................................74
10-11 Simulation Results of Delays for Transit and General Traffic with Various Early Green and Green Extension Times under the 150-Second-Cycle Signal Plan from Ten Simulation Iterations.......................................................................75
x
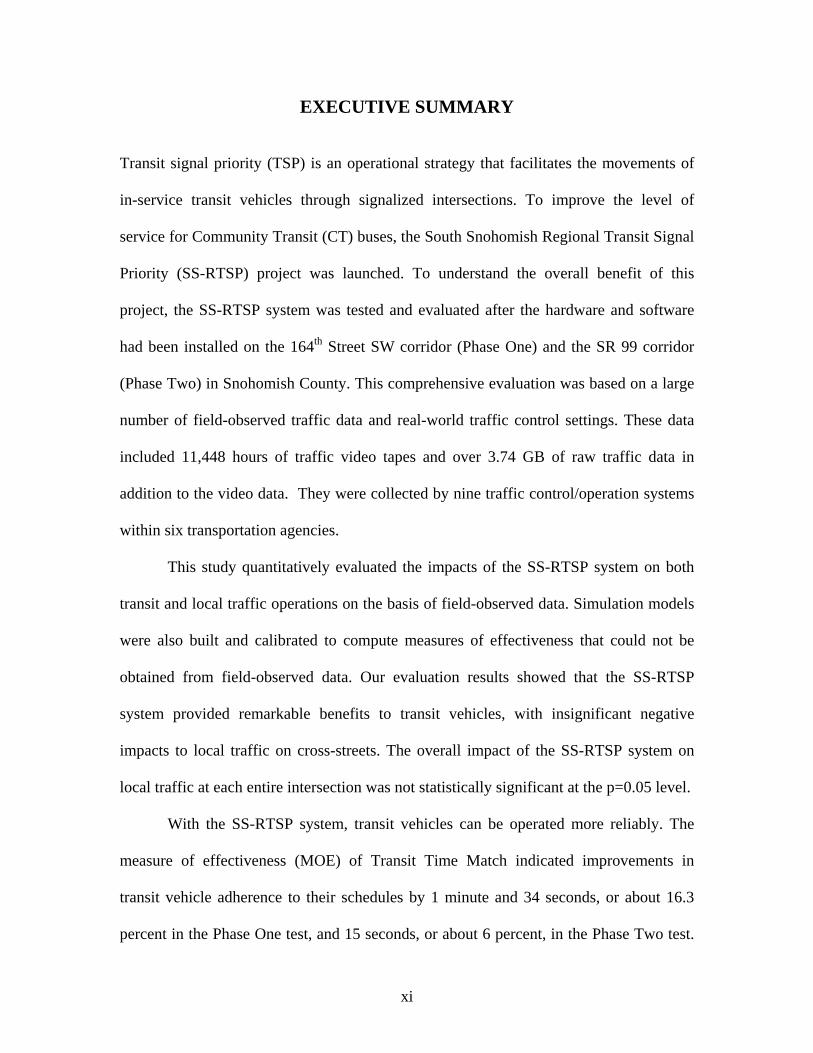
EXECUTIVE SUMMARY Transit signal priority (TSP) is an operational strategy that facilitates the movements of
in-service transit vehicles through signalized intersections. To improve the level of
service for Community Transit (CT) buses, the South Snohomish Regional Transit Signal
Priority (SS-RTSP) project was launched. To understand the overall benefit of this
project, the SS-RTSP system was tested and evaluated after the hardware and software
had been installed on the 164th Street SW corridor (Phase One) and the SR 99 corridor
(Phase Two) in Snohomish County. This comprehensive evaluation was based on a large
number of field-observed traffic data and real-world traffic control settings. These data
included 11,448 hours of traffic video tapes and over 3.74 GB of raw traffic data in
addition to the video data. They were collected by nine traffic control/operation systems
within six transportation agencies.
This study quantitatively evaluated the impacts of the SS-RTSP system on both
transit and local traffic operations on the basis of field-observed data. Simulation models
were also built and calibrated to compute measures of effectiveness that could not be
obtained from field-observed data. Our evaluation results showed that the SS-RTSP
system provided remarkable benefits to transit vehicles, with insignificant negative
impacts to local traffic on cross-streets. The overall impact of the SS-RTSP system on
local traffic at each entire intersection was not statistically significant at the p=0.05 level.
With the SS-RTSP system, transit vehicles can be operated more reliably. The
measure of effectiveness (MOE) of Transit Time Match indicated improvements in
transit vehicle adherence to their schedules by 1 minute and 34 seconds, or about 16.3
percent in the Phase One test, and 15 seconds, or about 6 percent, in the Phase Two test.
xi
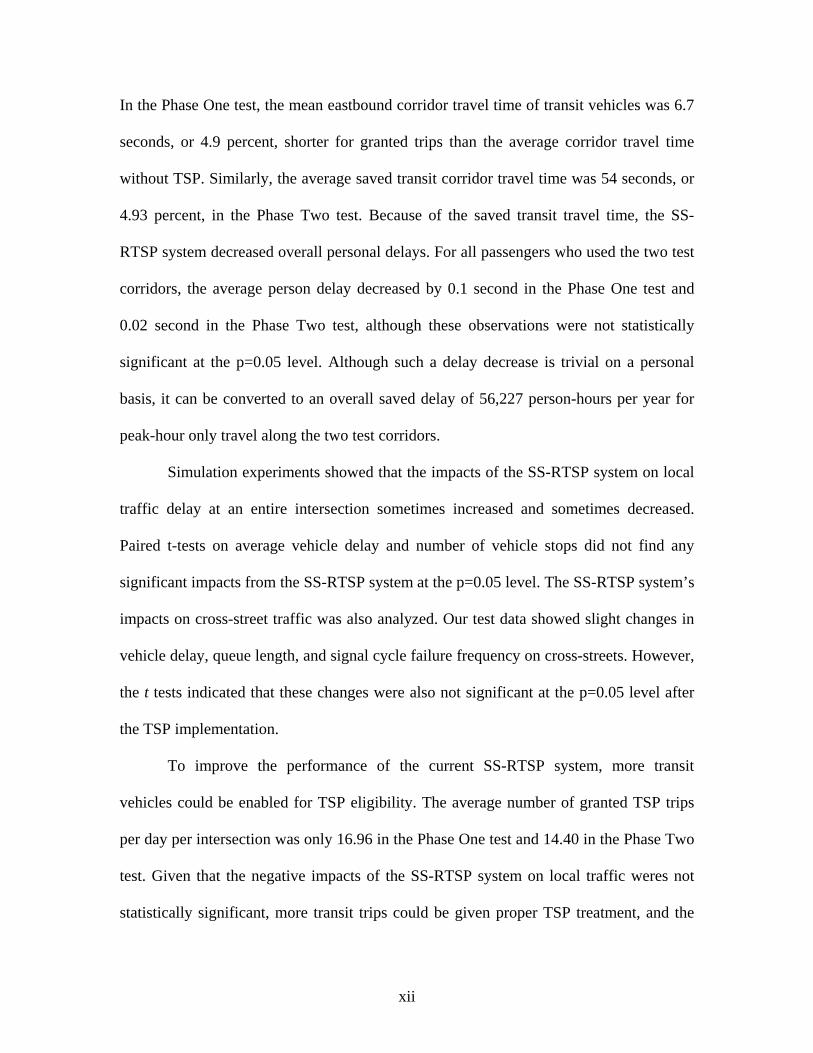
In the Phase One test, the mean eastbound corridor travel time of transit vehicles was 6.7
seconds, or 4.9 percent, shorter for granted trips than the average corridor travel time
without TSP. Similarly, the average saved transit corridor travel time was 54 seconds, or
4.93 percent, in the Phase Two test. Because of the saved transit travel time, the SS-
RTSP system decreased overall personal delays. For all passengers who used the two test
corridors, the average person delay decreased by 0.1 second in the Phase One test and
0.02 second in the Phase Two test, although these observations were not statistically
significant at the p=0.05 level. Although such a delay decrease is trivial on a personal
basis, it can be converted to an overall saved delay of 56,227 person-hours per year for
peak-hour only travel along the two test corridors.
Simulation experiments showed that the impacts of the SS-RTSP system on local
traffic delay at an entire intersection sometimes increased and sometimes decreased.
Paired t-tests on average vehicle delay and number of vehicle stops did not find any
significant impacts from the SS-RTSP system at the p=0.05 level. The SS-RTSP system’s
impacts on cross-street traffic was also analyzed. Our test data showed slight changes in
vehicle delay, queue length, and signal cycle failure frequency on cross-streets. However,
the t tests indicated that these changes were also not significant at the p=0.05 level after
the TSP implementation.
To improve the performance of the current SS-RTSP system, more transit
vehicles could be enabled for TSP eligibility. The average number of granted TSP trips
per day per intersection was only 16.96 in the Phase One test and 14.40 in the Phase Two
test. Given that the negative impacts of the SS-RTSP system on local traffic weres not
statistically significant, more transit trips could be given proper TSP treatment, and the
xii
frequency of TSP requests could be increased to generate more benefits from the SS-
RTSP system.
Simulation-based investigations of TSP system operations and optimization were
conducted. The SR 99 corridor was selected as the test site, and three practical semi-
actuated signal control plans were applied to examine TSP system performance. The
simulation-based research findings indicated that to achieve the best operation efficiency,
the compatibility between TSP control schemes and signal control coordination should be
strengthened to minimize transit disruption to signal coordination. TSP systems must be
fully tested under different coordinated control plans prior to implementation.
xiii

xiv
1
CHAPTER 1 INTRODUCTION
1.1 RESEARCH BACKGROUND
Transit signal priority (TSP) is an operational strategy that facilitates the movement of in-
service transit vehicles through signalized intersections. Because transit vehicle delays at
signalized intersections typically account for 10 to 20 percent of transit vehicle running
times, TSP promotes transit utilization by improving service reliability (Bakers 2002).
Through customer service enhancements, the transit agency could ultimately attract more
customers. As an important intelligent transportation systems (ITS) technology, TSP
systems use sensors to detect approaching transit vehicles and alter signal timings, if
necessary, to prioritize transit vehicle passage and improve their performance. For
example, a green signal can be extended for a late transit vehicle to avoid further delay at
the intersection. By reducing the waiting time of transit vehicles at intersections, TSP can
reduce transit delay and travel time, thereby increasing reliability and quality of service.
Implementation of TSP gives transit customers more dependable service through greater
schedule adherence and a more comfortable ride as a result of a decreased number of
stops and braking at signalized intersections. Transit riders who have experienced
smoother and more comfortable rides are more likely to continue using transit services.
Besides improving service, a second objective for using TSPs is to decrease costs
(Garrow and Machemehl 1997). Fewer stops can mean reductions in drivers’ workload,
travel time, fuel consumption, vehicle emissions, and maintenance costs. Reductions in
bus running times and number of stops may also lower vehicle wear and tear, and
consequently lead to deferred vehicle maintenance and new vehicle purchases (Garrow
and Machemehl 1997). Greater fuel economy and reduced maintenance costs can

increase the efficiency of transit operations. TSP can also help reduce transit operation
costs, as reductions in transit vehicle travel times may allow a given level of service to be
offered with fewer transit vehicles.
Local transportation agencies also can benefit from TSP strategies when improved
transit service encourages more auto users to switch to public transportation. Finally,
reduced demand for personal car travel will help improve roadway service level.
Because of the rapid population and economic growth in the greater Seattle area,
traffic congestion has become an increasingly important issue. Improving transit services
to reduce personal car travel demand is considered an effective countermeasure against
traffic congestion. The South Snohomish Regional Transit System Priority (SS-RTSP)
system was launched to improve the level of service of Community Transit (CT) buses
and, thus, to help solve traffic congestion problems in the greater Seattle area.
1.2 PROBLEM STATEMENT
In the past two decades, TSP systems have been deployed in many cities worldwide.
However, enthusiasm for TSP in North America has been tempered with concerns that
overall traffic performance may be unduly compromised when signal timing plans
intended to optimize traffic flow are overridden to provide a travel advantage to transit
vehicles (Chang and Ziliaskopoulos 2003). Several recent studies (see, for example,
Abdulhai et al. 2002, and Dion et al. 2002) have quantitatively evaluated the effects of
TSP. While these studies have generally agreed on the benefits for transit operations, the
overall impacts of TSP on local traffic networks remain unclear. Also, because the
performance of a signal control strategy is closely related to traffic conditions,
surrounding land use, traffic regulations, and roadway network geometry, the
2
comprehensive impacts of TSP systems on transit and other vehicles are case specific and
difficult to generalize. This suggests that the effects of TSP on a particular network need
to be evaluated on the basis of field-observed data. Therefore, a comprehensive
evaluation of the SS-RTSP system is of both academic interest and practical significance.
The SS-RTSP system installation and evaluation comprised two phases. Phase
One involved four intersections on SW 164th Street in south Snohomish County. Phase
Two covered 13 intersections on SR 99 in the City of Lynnwood. This report summarizes
both the Phase One and Phase Two evaluations.
1.3 RESEARCH OBJECTIVE
This study used field-observed data to quantitatively evaluate the impacts of the SS-
RTSP project on both transit and local traffic operations. We developed a series of
measures of effectiveness (MOE) to assess traffic performance. Specifically, this research
had three major objectives:
• quantitatively evaluate the TSP system benefits for transit operations
• calculate the overall impacts of the TSP system on local traffic networks
• understand how TSP effects changed with traffic conditions and signal control
strategies.
3

CHAPTER 2 STATE OF THE ART
Interests in TSP date back to the 1970s. Typical performance measures used for TSP
evaluation include changes in transit travel times, intersection delay, average vehicle
delay, average vehicle stops, average person delay, and average person stops. The work
of Ludwick (1975) was among the first TSP studies in the United States. Using a
microscopic simulation model, UTCS-1, it evaluated the initial Urban Traffic Control
System-Bus Priority System (UTCS-BPS) in Washington, D.C. With this model Ludwick
simulated a network with unconditional preemption for transit buses, applying the early
green or extended green logic. The early green logic shortens the green times of
conflicting phases so that a transit vehicle can receive green indication early. The
extended green logic holds the green signal for extra time so that a transit vehicle can
clear the intersection without stopping.
Sunkari et al. (1995) developed a model to evaluate a bus priority strategy for one
signalized intersection in a coordinated signal system. The model used the delay equation
employed by the Highway Capacity Manual (Transportation Research Board 2000) for
signalized intersections and adapted the equation to calculate person delays for cases with
and without priority strategies. Al-Sahili and Taylor (1996) used the NETSIM
microscopic model to analyze Washtenaw Avenue in Ann Arbor, Michigan. A decease of
6 percent in bus travel time was the maximum benefit found. The authors suggested that
the most suitable TSP plan for each intersection should be integrated and implemented as
a system to maximize the benefit. Garrow and Machemehl (1997) evaluated the 2.5-mile-
long Guadalupe N. Lamar arterial in Austin, Texas. The main objective of this study was
to evaluate performance of different TSP strategies under peak and off-peak traffic
4
conditions, as well as different saturation levels for side-street approaches (Chada and
Newland 2002).
Field evaluations reported by Chang et al. (1995) and Collura et al. (2003)
indicated that reductions in average intersection delays ranged from 6 to 42 percent, and
reductions in average bus travel times were from 0 to 38 percent. Some studies (for
example, Yand 2004) found that vehicles sharing the same signal phase with transit
vehicles also occasionally benefited from TSP treatments. While a number of
deployments produced no significant impacts on general traffic, others yielded stop and
delay increases as high as 23 percent (Baker et al. 2002).
The Transit Capacity and Quality of Service Manual (TCQSM) (TRB 2003)
provides guidance to practitioners seeking to evaluate the impacts of a TSP system. The
TCQSM recommends using person-delay as the unit of measurement for comparing the
benefits and costs of TSP implementation. The person-delay approach assumes that the
value of time for a bus passenger is the same as for an auto passenger. This assumption
allows use of the same scale to evaluate the benefits and costs of TSP and provides
flexibility to practitioners by allowing variable auto occupancy and bus occupancy rates.
According to the study by Casey (2002), the number of transit agencies with
operational TSP systems increased 87 percent from 1998 (16 agencies) to 2000 (30
agencies). New and rapid advances in traffic/bus detection and communication
technologies, as well as well-defined priority algorithms, have made TSP more appealing
or acceptable to more road users of all modes.
5
CHAPTER 3 PROJECT OVERVIEW
3.1 MAJOR COMPONENTS
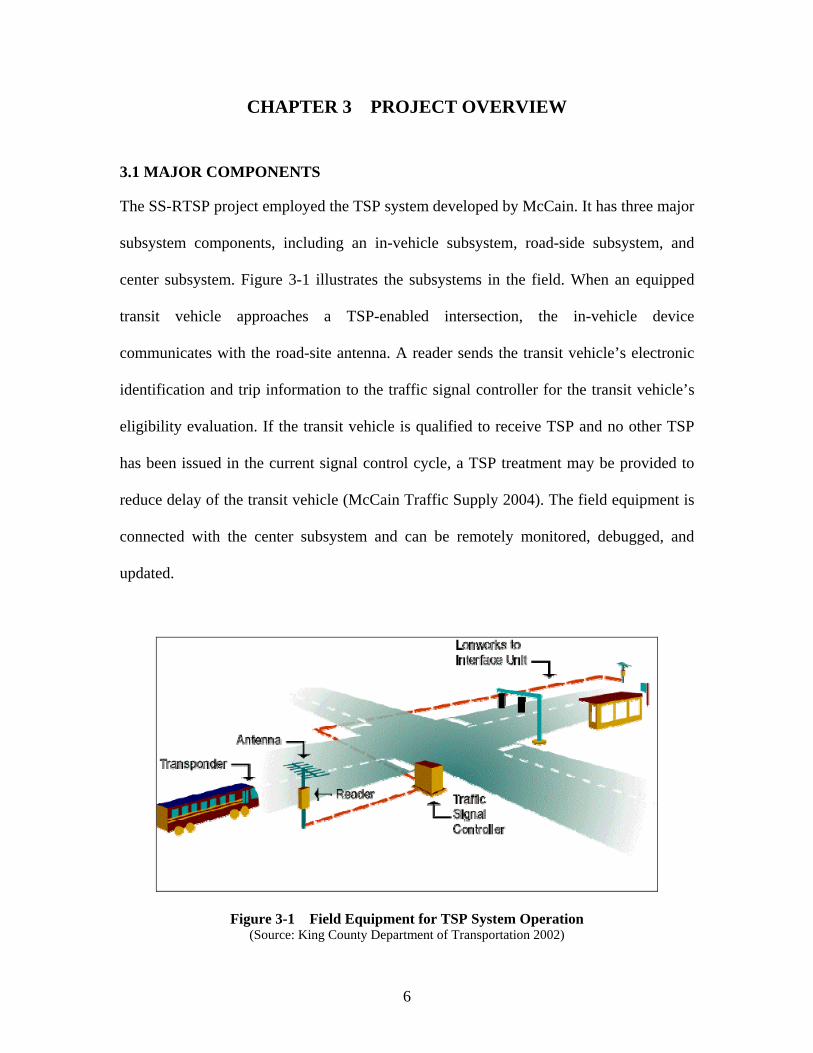
The SS-RTSP project employed the TSP system developed by McCain. It has three major
subsystem components, including an in-vehicle subsystem, road-side subsystem, and
center subsystem. Figure 3-1 illustrates the subsystems in the field. When an equipped
transit vehicle approaches a TSP-enabled intersection, the in-vehicle device
communicates with the road-site antenna. A reader sends the transit vehicle’s electronic
identification and trip information to the traffic signal controller for the transit vehicle’s
eligibility evaluation. If the transit vehicle is qualified to receive TSP and no other TSP
has been issued in the current signal control cycle, a TSP treatment may be provided to
reduce delay of the transit vehicle (McCain Traffic Supply 2004). The field equipment is
connected with the center subsystem and can be remotely monitored, debugged, and
updated.
Figure 3-1 Field Equipment for TSP System Operation (Source: King County Department of Transportation 2002)
6
A transponder installed on the front end of the transit vehicle provides the coach
number, route number, trip number, and transit system operator identification (such as
Community Transit or Metro). The road-side subsystem includes radio frequency (RF)
antennas mounted upstream of the traffic signals on mast arms, power sources for reader
units, and the Transit Priority Request Generator (TPRG). A TPRG contains a
microprocessor and a communication device connected with the traffic signal controller
via 24 VDC logic inputs.
3.2 PRIORITY STRATEGIES
The SS-RTSP system applies active priority strategies, which are dynamic signal timing
enhancements that modify the signal phases upon detection of a transit vehicle. These
strategies provide efficient operation of traffic signals by responding to a transit TSP call
and then returning to normal operation after the call has been serviced or has expired.
Although several active TSP strategies are available, such as phase insert and phase
suppression (Baker et al. 2002), only two active transit signal priority strategies are used
in the SS-RTSP system:
• early green (early start or red truncation of priority phase)
• extended green (or phase extension of priority phase).
Early green and extended green are the most common TSP treatments for transit
vehicles. The early green strategy indicates a green light before the normal start of a
priority movement phase. This process is implemented by shortening the green time of
the conflicting phase(s), without violating the minimum green time and clearance
intervals, so that the green time for the priority phase can start early.
7
The extended green strategy is typically used when a transit vehicle arrives near the
end of the green indication of a priority phase. When extended green is applied, the
traffic signal holds the green signal of the priority phase for additional seconds to allow
eligible vehicles to pass through the intersection without further delay. Depending on the
signal control policy, green times for conflicting phases may or may not be shortened to
compensate for the extended green for the priority phase. In the latter case, a constant
signal control cycle length is not enforced. Both the early green and extended green
strategies are intended to decrease transit vehicle delays at TSP-enabled intersections.
Depending upon the arrival time of a TSP-eligible transit vehicle, early green or extended
green may be used to provide an appropriate TSP treatment to the transit vehicle.
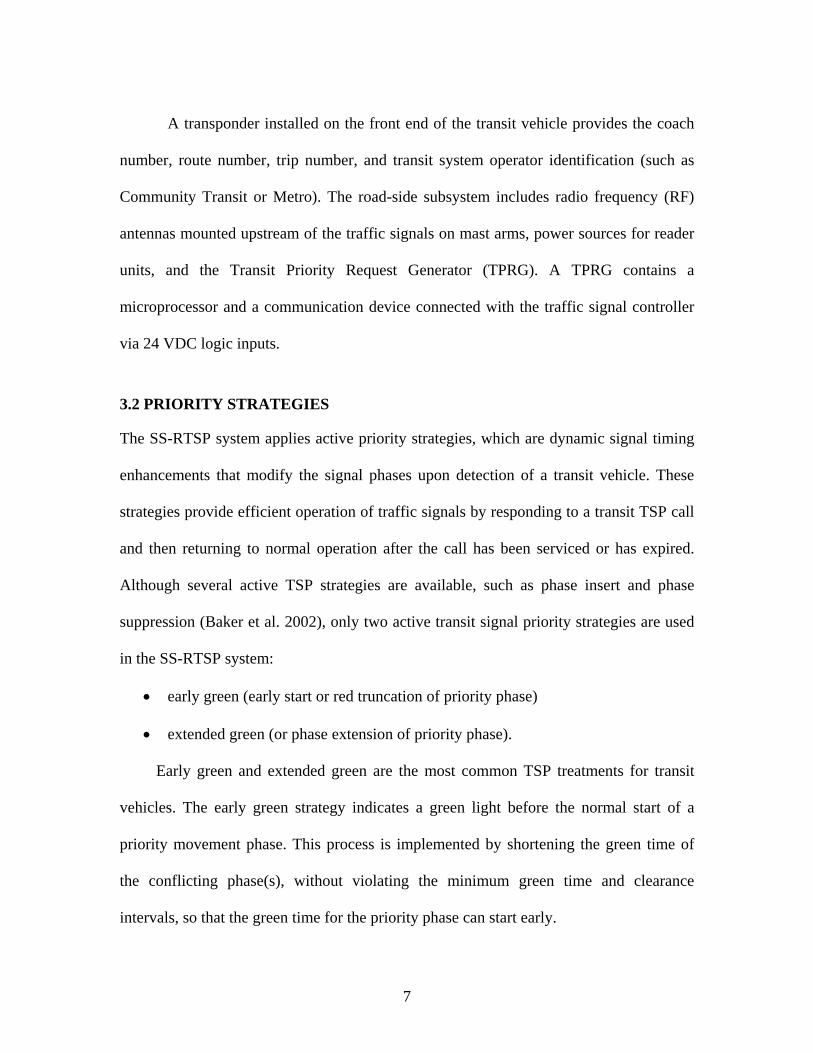
The basic priority logic flowchart of the TPRG is shown in Figure 3-2. Some
intersections may have additional logic or may conduct the eligibility tests in the readers.
For the SS-RTSP evaluation, the TPRG sent a transit priority request to the traffic
controller only for an eligible bus and only when the bus was
• operating on one of the three test routes (114, 115, and 116)
• equipped with Keypad
• 0 to 30 minutes behind its scheduled time.
Keypad is a device installed beside the bus driver’s seat to input the route number
and trip number data to the transponder.
8
9
Figure 3-2 Priority Logic Flowchart
CHAPTER 4 METHODS
4.1 MEASURES OF EFFECTIVENESS
To provide a comprehensive evaluation of TSP strategy impacts, we used several MOEs
to regularly assess impacts on traffic and transit operations. Each MOE reflected the
impact of the TSP system from a certain perspective, and they jointly provided a
relatively complete assessment on the SS-RTSP project. In this study, we separated the
chosen MOEs into two categories: primary MOEs and secondary ones. The primary
MOEs addressed our major concerns about the SS-RTSP project and could be calculated
by using field-observed data. The secondary MOEs were useful for an in-depth
understanding of TSP performance but could not be directly derived from field-observed
data. We relied on microscopic simulation models to calculate the secondary MOEs.
4.1.1 Primary Measures of Effectiveness
The primary MOEs chosen for this evaluation study were as follows:
Transit Time Match
TSP systems are designed to help transit vehicles adhere to their schedules. A
high on-schedule rate can result in increased ridership and reduced operation cost. In this
study, we defined the variable of Transit Time Match (TTM) as the absolute difference
between actual transit arrival time and scheduled arrival time at each timing point on the
test routes. If the mean of TTM was close to zero, then the transit vehicles adhered to
their schedules very well. The lower the TTM value, the higher the transit travel time
reliability. The actual arrival times were extracted from global positioning systems
(GPS).
10

Transit Travel Time
Transit travel time data were collected to evaluate whether the TSP system had
caused a significant change in travel time on the test routes. Decreases in transit vehicle
travel time could result in lower operation costs and emission levels. In-vehicle GPS data
loggers recorded vehicle locations periodically. These vehicle location data were used to
generate accurate transit travel time data.
Traffic Queue Length
A major concern about a TSP system is whether a TSP treatment will cause
excessive delay for other intersection movements. To address this concern, a key MOE is
the size of the traffic queue for each conflicting phase and the delays associated with
those queues. Before and after analysis of traffic queue lengths can help answer whether
queues significantly lengthen for movements not receiving the benefits of TSP treatments.
Also, it helps understand TSP impacts on streets crossing the TSP corridors. In this study
we manually collected sample traffic queue length data from recorded video images at
TSP-enabled intersections within the SS-RTSP project.
Signal Cycle Failures
Signal cycle failures refer to the specific delay condition in which vehicles must
sit through at least one complete signal cycle to pass through an intersection. This
condition leads to considerable public frustration, and an increased occurrence of such
failures is likely to result in more substantial “public resistance” to TSP than will a minor
increase in intersection delay. Thus, it is a key measure reported to public officials.
Signal cycle failures were extracted manually from recorded video data.
11
Frequency of TSP “Calls”
This MOE monitors how frequently (calls per hour) the TSP system requests
signal priority, and how often those calls result in a “denied” priority request (a priority
request may not be granted at a given condition because of TSP policy). The purpose of
this information, used along with the intersection delay information, is to determine the
need for any changes to TSP policy. If TSP calls are causing further intersection delay,
the number of allowable priority calls may need to be reduced. Conversely, if intersection
delays are not deteriorating and desirable priority calls are not resulting in changes in
signal timing, then additional priority calls should be allowed. The frequency of TSP
calls was calculated from the TPRG-logged TSP requests from transit vehicles.
4.1.2 Secondary Measures of Effectiveness
In addition to the above primary MOEs, the following secondary MOEs were also
important. Because these MOEs could not be calculated from field-observed data, a
microscopic traffic simulation model was built to derive them.
Average Person Delay
This MOE is commonly adopted to reflect the performance of a roadway system.
If the average person delay for the whole network was reduced by the SS-RTSP project,
then we would be able to conclude a net benefit from the TSP system.
Vehicle Delays and Stops
Average delay per vehicle is the MOE used for intersection level of service
evaluation in the HCM (Transportation Research Board 2000). In this study, we used
averaged vehicle delay and number of vehicle stops to reflect the time loss of vehicles at
intersections. Changes in this MOE set before and after implementation of the SS-RTSP
12
system would indicate the impacts of the TSP system on intersection performance.
Additionally, it could also be used to quantify the impacts of the SS-RTSP system on side
streets crossing the TSP corridors.
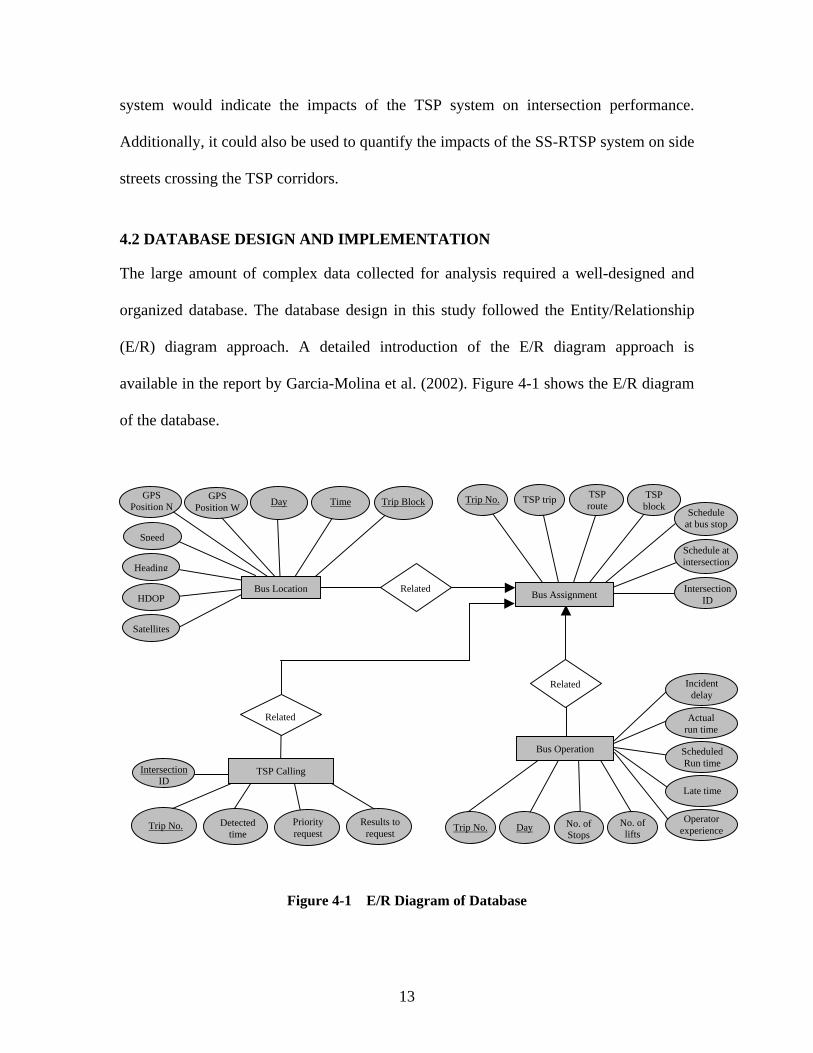
4.2 DATABASE DESIGN AND IMPLEMENTATION
The large amount of complex data collected for analysis required a well-designed and
organized database. The database design in this study followed the Entity/Relationship
(E/R) diagram approach. A detailed introduction of the E/R diagram approach is
available in the report by Garcia-Molina et al. (2002). Figure 4-1 shows the E/R diagram
of the database.
Figure 4-1 E/R Diagram of Database
Speed Heading HDOP
Satellites
Time Trip BlockDay
Bus Location Bus Assignment
Bus Operation
TSP Calling
Related
Trip No. Detected time
Intersection ID
Priority request Results to
request Trip No. Day No. of Stops No. of
lifts
Actual run time
Scheduled Run time
Late time
Incident delay
Operator experience
Schedule at bus stop
Schedule at intersection
Trip No. TSP route TSP trip TSP
blockGPS
Position W GPS Position N
IntersectionID
Related
Related
13
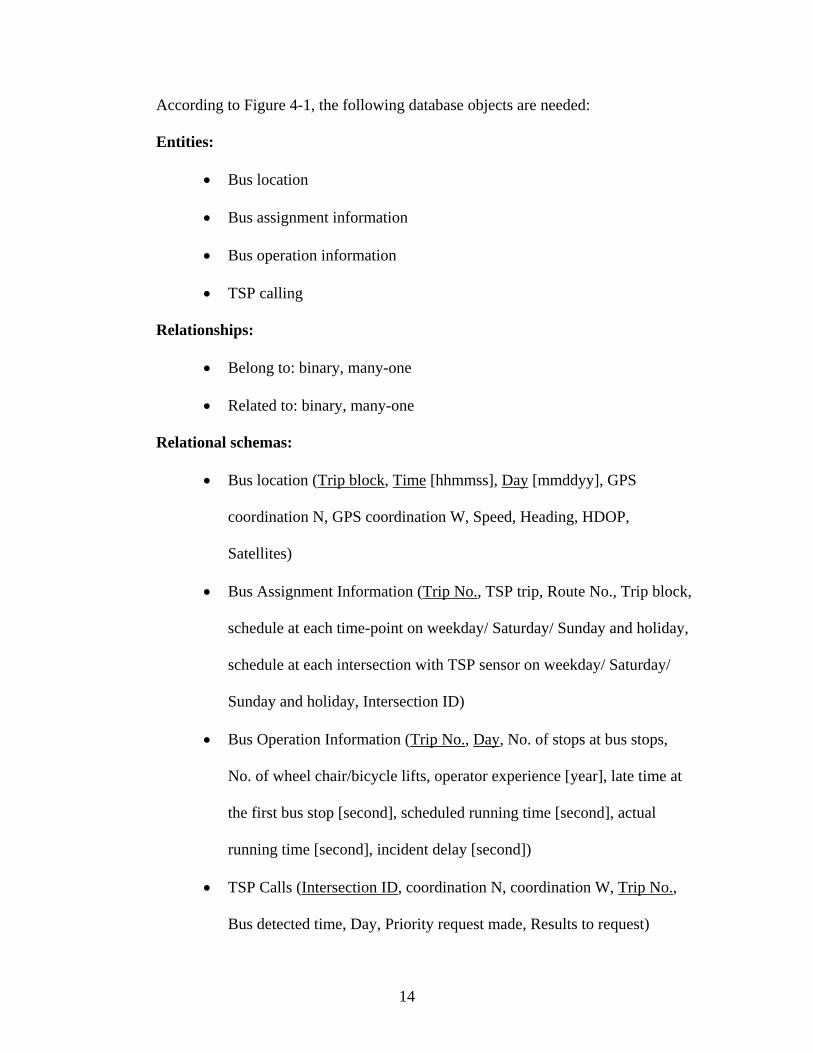
According to Figure 4-1, the following database objects are needed:
Entities:
• Bus location
• Bus assignment information
• Bus operation information
• TSP calling
Relationships:
• Belong to: binary, many-one
• Related to: binary, many-one
Relational schemas:
• Bus location (Trip block, Time [hhmmss], Day [mmddyy], GPS
coordination N, GPS coordination W, Speed, Heading, HDOP,
Satellites)
• Bus Assignment Information (Trip No., TSP trip, Route No., Trip block,
schedule at each time-point on weekday/ Saturday/ Sunday and holiday,
schedule at each intersection with TSP sensor on weekday/ Saturday/
Sunday and holiday, Intersection ID)
• Bus Operation Information (Trip No., Day, No. of stops at bus stops,
No. of wheel chair/bicycle lifts, operator experience [year], late time at
the first bus stop [second], scheduled running time [second], actual
running time [second], incident delay [second])
• TSP Calls (Intersection ID, coordination N, coordination W, Trip No.,
Bus detected time, Day, Priority request made, Results to request)
14
Foreign Keys:
• (Buslocation.Tripblock, Buslocation.Time, Buslocation.Day) references
BusAssignmentInformation.TripNo.
• (BusOperationInformation.TripNo, BusOperationInformation.Day)
references BusAssignmentInformation.TripNo.
• (TSPCalls.IntersectionID) references BusAssignmentInformation.TripNo..
In this study, we used the Structured Query Language (SQL) for data management.
This database was implemented in the Microsoft SQL Server 2000.
15
CHAPTER 5 PHASE ONE FIELD TEST
The Phase One test of the SS-RTSP project lasted two weeks, from April 4 to April 17,
2005. The TSP system was turned off in the first week and on in the second week. TSP
was turned on or off on Monday mornings between 1:00 AM and 4:00 AM, when no CT
vehicles were in operation. Although TSP was off in the first week, we still collected data
in order to conduct a before and after analysis for the SS-RTSP project.
5.1 CORRIDOR
The Phase One test was performed on the 164th Street SW corridor, between 36th
Avenue W and 25th Avenue W (or NorthPoint). Figure 5-1 shows the map of the test
corridor and its location.
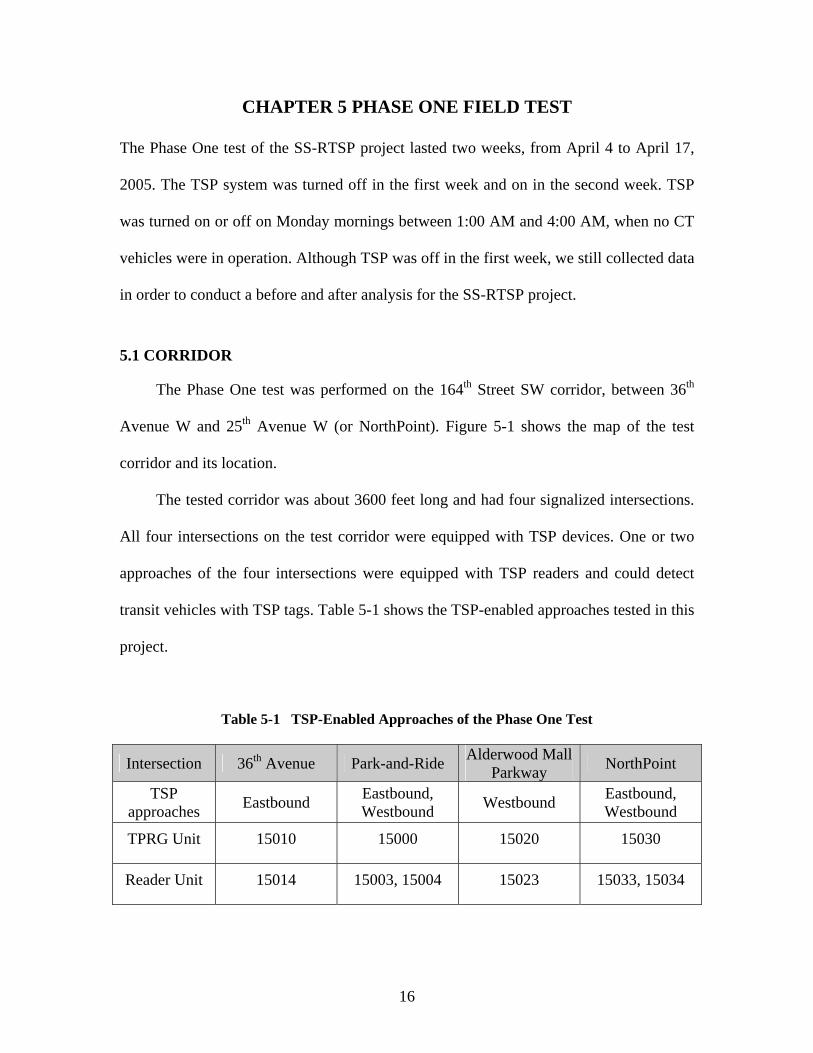
The tested corridor was about 3600 feet long and had four signalized intersections.
All four intersections on the test corridor were equipped with TSP devices. One or two
approaches of the four intersections were equipped with TSP readers and could detect
transit vehicles with TSP tags. Table 5-1 shows the TSP-enabled approaches tested in this
project.
Table 5-1 TSP-Enabled Approaches of the Phase One Test
Intersection 36th Avenue Park-and-Ride Alderwood Mall Parkway NorthPoint
TSP approaches Eastbound Eastbound,
Westbound Westbound Eastbound, Westbound
TPRG Unit 15010 15000 15020 15030
Reader Unit 15014 15003, 15004 15023 15033, 15034
16

Figure 5-1 Phase One Test Corridor
(Map and image source: http://maps.google.com/maps.)
5.2 TRANSIT SERVICE
The tested transit routes were CT 114, 115, and 116. All the test routes ran through
164th Street SW between NorthPoint and 36th Avenue, then turned on 36th Avenue, as
shown in Figure 5-1. This corridor had seven bus stops, including three near-side stops:
stop 616 (eastbound), stop 1573 (westbound), and stop 1575 (westbound). Most of
coaches on the test routes were equipped with Keypad and eligible to receive TSP. Table
5-2 summarizes the number of the eligible TSP trips on the test corridor in one week.
17
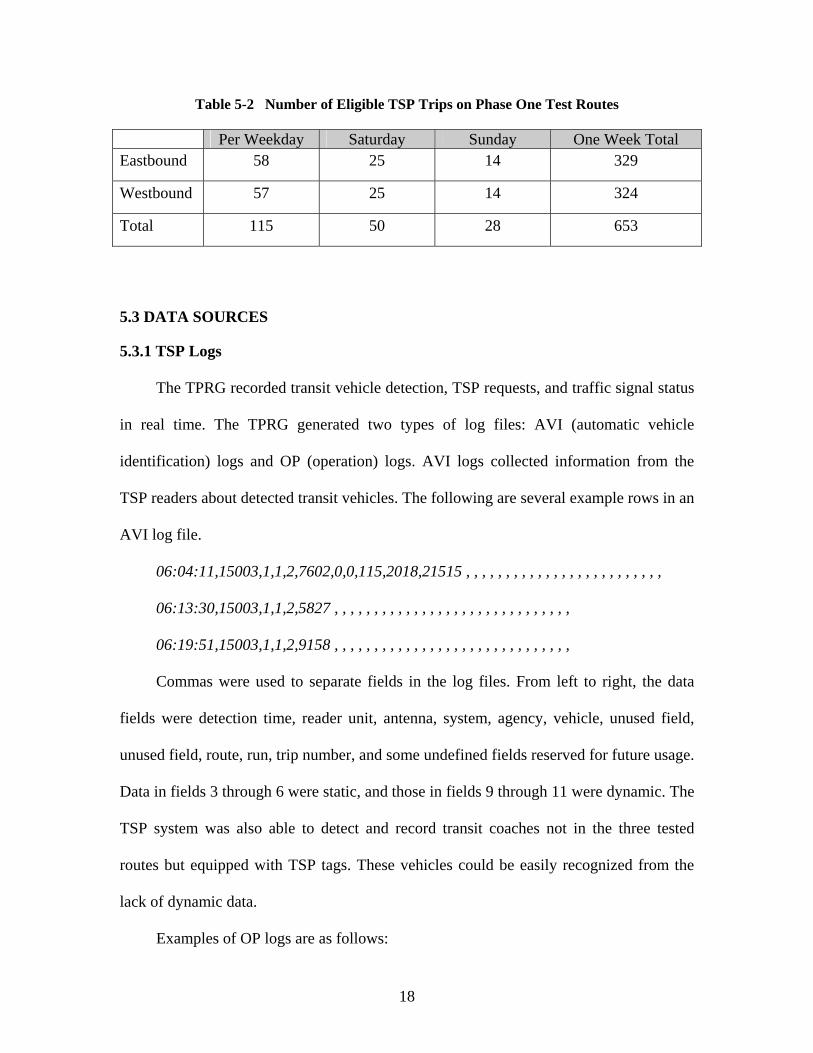
Table 5-2 Number of Eligible TSP Trips on Phase One Test Routes
Per Weekday Saturday Sunday One Week Total Eastbound 58 25 14 329
Westbound 57 25 14 324
Total 115 50 28 653
5.3 DATA SOURCES
5.3.1 TSP Logs
The TPRG recorded transit vehicle detection, TSP requests, and traffic signal status
in real time. The TPRG generated two types of log files: AVI (automatic vehicle
identification) logs and OP (operation) logs. AVI logs collected information from the
TSP readers about detected transit vehicles. The following are several example rows in an
AVI log file.
06:04:11,15003,1,1,2,7602,0,0,115,2018,21515 , , , , , , , , , , , , , , , , , , , , , , , , ,
06:13:30,15003,1,1,2,5827 , , , , , , , , , , , , , , , , , , , , , , , , , , , , , ,
06:19:51,15003,1,1,2,9158 , , , , , , , , , , , , , , , , , , , , , , , , , , , , , ,
Commas were used to separate fields in the log files. From left to right, the data
fields were detection time, reader unit, antenna, system, agency, vehicle, unused field,
unused field, route, run, trip number, and some undefined fields reserved for future usage.
Data in fields 3 through 6 were static, and those in fields 9 through 11 were dynamic. The
TSP system was also able to detect and record transit coaches not in the three tested
routes but equipped with TSP tags. These vehicles could be easily recognized from the
lack of dynamic data.
Examples of OP logs are as follows:
18
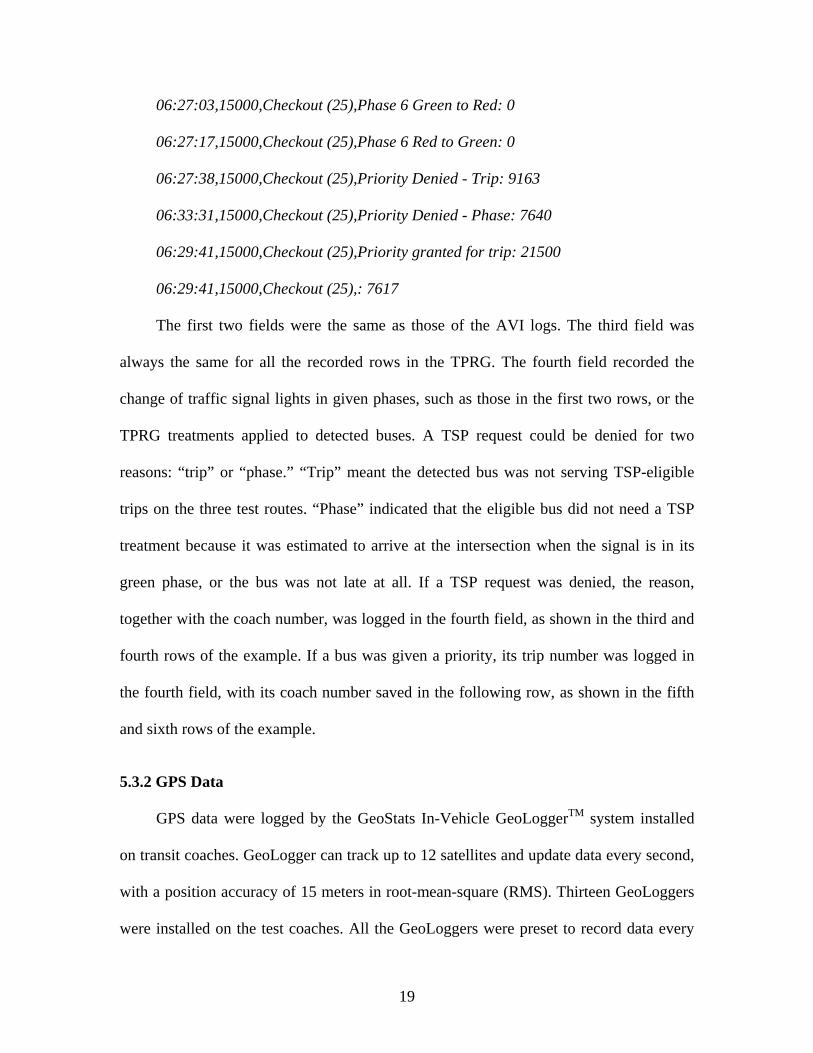
06:27:03,15000,Checkout (25),Phase 6 Green to Red: 0
06:27:17,15000,Checkout (25),Phase 6 Red to Green: 0
06:27:38,15000,Checkout (25),Priority Denied - Trip: 9163
06:33:31,15000,Checkout (25),Priority Denied - Phase: 7640
06:29:41,15000,Checkout (25),Priority granted for trip: 21500
06:29:41,15000,Checkout (25),: 7617
The first two fields were the same as those of the AVI logs. The third field was
always the same for all the recorded rows in the TPRG. The fourth field recorded the
change of traffic signal lights in given phases, such as those in the first two rows, or the
TPRG treatments applied to detected buses. A TSP request could be denied for two
reasons: “trip” or “phase.” “Trip” meant the detected bus was not serving TSP-eligible
trips on the three test routes. “Phase” indicated that the eligible bus did not need a TSP
treatment because it was estimated to arrive at the intersection when the signal is in its
green phase, or the bus was not late at all. If a TSP request was denied, the reason,
together with the coach number, was logged in the fourth field, as shown in the third and
fourth rows of the example. If a bus was given a priority, its trip number was logged in
the fourth field, with its coach number saved in the following row, as shown in the fifth
and sixth rows of the example.
5.3.2 GPS Data
GPS data were logged by the GeoStats In-Vehicle GeoLoggerTM system installed
on transit coaches. GeoLogger can track up to 12 satellites and update data every second,
with a position accuracy of 15 meters in root-mean-square (RMS). Thirteen GeoLoggers
were installed on the test coaches. All the GeoLoggers were preset to record data every
19
second when the vehicle speed exceeded 1.15 miles per hour. The following is an
example of logged GPS data:
A,47.81633,N,122.29803,W,133813,110405,004.7,317,,05.8,04
The first field showed the working status of GPS. If the status was okay, the
GeoLogger recorded an “A.” The next four fields were the coordinates of vehicle position
shown in longitude and latitude. The fifth field showed time in the “hhmmss” format. The
sixth field represented the date in the “ddmmyy” format. The seventh filed was the speed
in miles per hour. The eighth field was the heading of the vehicle in degrees. The last two
fields related to the satellite signal quality, showing Horizontal Dilution of Precision
(HDOP) and number of satellites, respectively. To analyze position data more
conveniently, we wrote a piece of MATLABTM code to transfer the positions from the
longitude and latitude coordinate system into the Carter coordinate system, defined for
North American Datum (NAD) 1927 State Plane Washington North FIPS 4601.
5.3.3 Traffic Controller Logs
A traffic controller monitors detector calls and makes signal timing decisions in
real-time. For approaches with advance detectors, traffic volume data can be collected
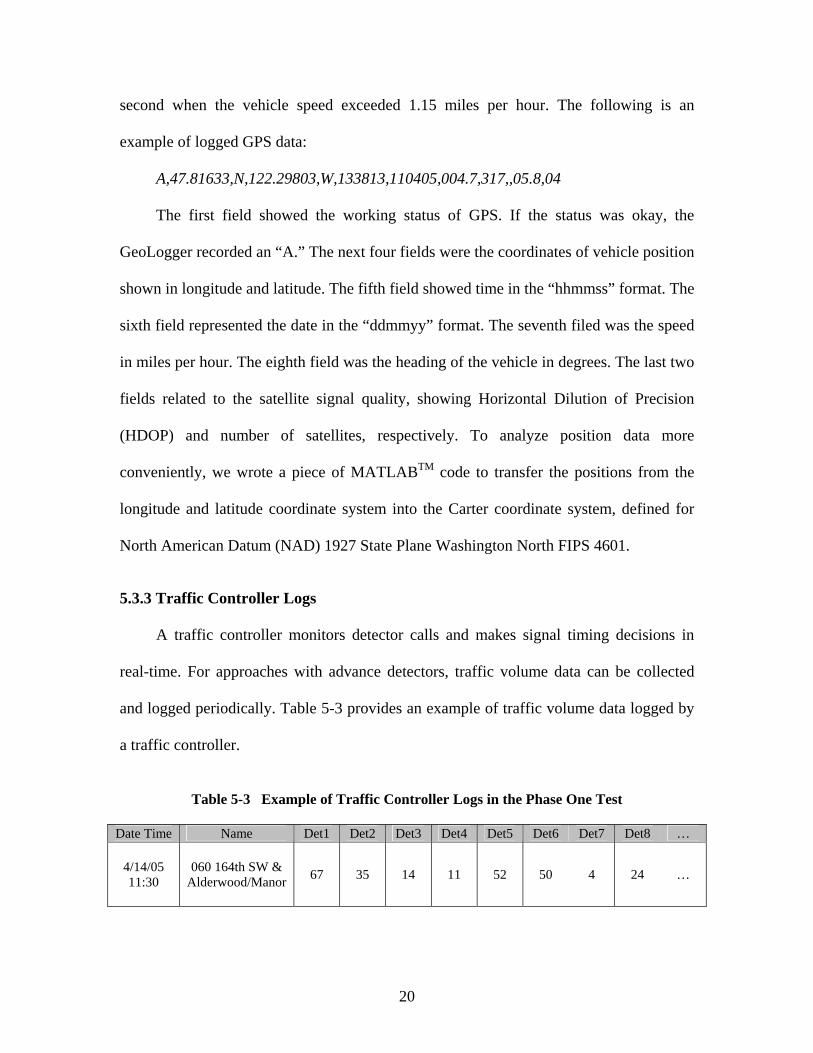
and logged periodically. Table 5-3 provides an example of traffic volume data logged by
a traffic controller.
Table 5-3 Example of Traffic Controller Logs in the Phase One Test
Date Time Name Det1 Det2 Det3 Det4 Det5 Det6 Det7 Det8 …
4/14/05 11:30
060 164th SW & Alderwood/Manor 67 35 14 11 52 50 4 24 …
20

Depending on controller type, model, and the operating traffic management system,
other event data such as changes in signal control phases and time-stamped traffic calls
may be recorded. Phase change times are very valuable data for understanding signal
controller decisions. However, such phase change data were not available for the Phase
One test because of constraints in the traffic management system used by Snohomish
County. Fortunately, some phase change information was logged by the TPRG. By
analyzing the TPRG logs, we were able to understand the time associated with each
priority phase change during the test period.
5.3.4 Traffic Video Data
All four intersections included in this study use video image processors (VIPs) for
traffic detection. These detection cameras are typically fixed to cover a designated area
for vehicle detection. For recording traffic video, we split the video channel from a
detection camera into two channels: one was to the VIP card and the other to our video
cassette recorder (VCR). Twelve VCRs were configured to record traffic images for the
36th Avenue intersection (all four approaches), the Alderwood Mall Parkway intersection
(all four approaches), the Park-and-Ride intersection (the eastbound and westbound
approaches), and the 25th Avenue intersection (the eastbound and westbound
approaches). Six hours of video data were collected for each recording approach every
day during the two weeks for the Phase One test. The six-hour video included two hours
during the morning peak (6:30–8:30 AM), two hours during the non-peak (12:30–2:30
PM), and two hours during the afternoon peak (4:30–6:30 PM). On Sundays, the six-hour
video was recorded in two time periods: 6:30–8:30 AM and 2:30–6:30 PM.
21
5.3.5 Other Data
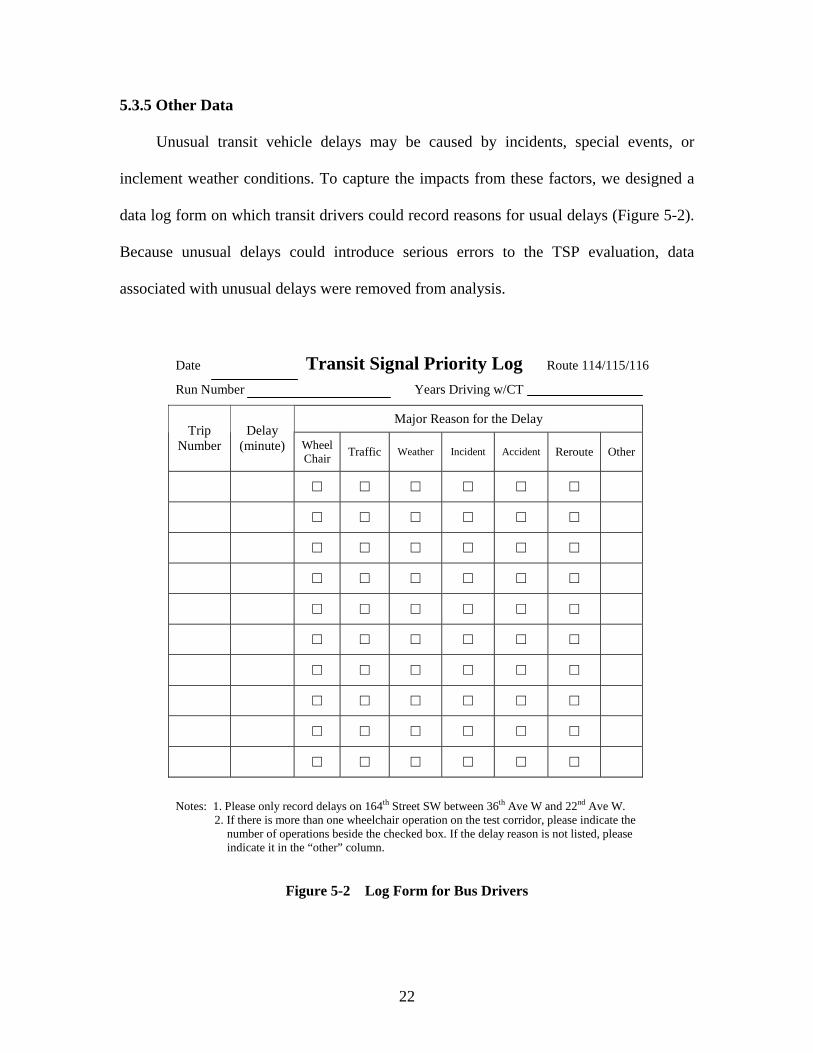
Unusual transit vehicle delays may be caused by incidents, special events, or
inclement weather conditions. To capture the impacts from these factors, we designed a
data log form on which transit drivers could record reasons for usual delays (Figure 5-2).
Because unusual delays could introduce serious errors to the TSP evaluation, data
associated with unusual delays were removed from analysis.
Date Transit Signal Priority Log Route 114/115/116
Run Number Years Driving w/CT
Notes: 1. Please only record delays on 164th Street SW between 36th Ave W and 22nd Ave W. 2. If there is more than one wheelchair operation on the test corridor, please indicate the
number of operations beside the checked box. If the delay reason is not listed, please indicate it in the “other” column.
Major Reason for the Delay Trip
Number Delay
(minute) Wheel Chair Traffic Weather Incident Accident Reroute Other
□ □ □ □ □ □
□ □ □ □ □ □
□ □ □ □ □ □
□ □ □ □ □ □
□ □ □ □ □ □
□ □ □ □ □ □
□ □ □ □ □ □
□ □ □ □ □ □
□ □ □ □ □ □
□ □ □ □ □ □
Figure 5-2 Log Form for Bus Drivers
22
Additionally, CT provided bus schedule data and trip assignment records, which
listed trip numbers assigned to each coach every day during the test period.
All the discussed data, except for the traffic video data, were stored in the designed
database described in Section 4.2 in a Microsoft SQL Server database. SQL was used to
query and analyze the data.
23
CHAPTER 6 PHASE TWO FIELD TEST
The Phase Two test of the SS-RTSP project lasted six weeks, from January 8 to February
18, 2007. However, only data collected in weeks three and four were used. A strong
snowstorm that occurred in the first week of the test severely affected traffic patterns
along the test corridor for the first two weeks. The last two weeks’ data also could not be
used because of a transit schedule change that made the data incomparable. Therefore,
only data from January 22nd to February 4th could be used for the Phase Two evaluation.
The TSP system stayed on during the week of January 22nd to 28th, and was turned off
during the week of January 29th to February 4th. The same data collection method used
for the Phase One test was also applied during this test.
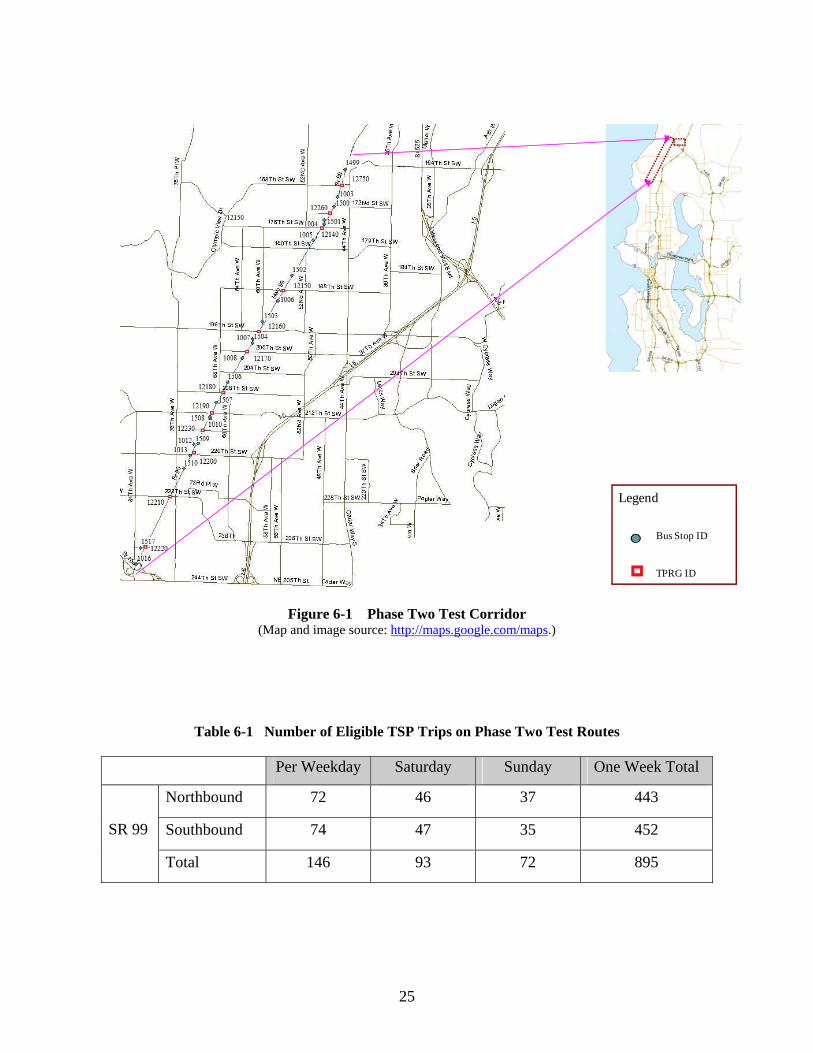
6.1 CORRIDOR
The Phase Two test was performed on the SR 99 corridor between 238th Street SW
and 164th Street SW. A map of this corridor is shown in Figure 6-1, with bus stops
marked with cyan circles and the TPRG boxes marked with red squares. This corridor
was about 5.3 miles long, with 13 signalized intersections. All the intersections were
equipped with TSP for both northbound and the southbound traffic.
6.2 TRANSIT SERVICE
On the SR 99 corridor, the tested transit routes were CT 100 and 101. Both test
routes ran south-north without turning. There were 33 bus stops along this corridor, and
none of them was a near-side bus stop. A summary of eligible TSP trips for each
direction is provided in Table 6-1.
24
Legend
Bus Stop ID
TPRG ID
Figure 6-1 Phase Two Test Corridor
(Map and image source: http://maps.google.com/maps.)
Table 6-1 Number of Eligible TSP Trips on Phase Two Test Routes
Per Weekday Saturday Sunday One Week Total
Northbound 72 46 37 443
Southbound 74 47 35 452 SR 99
Total 146 93 72 895
25
6.3 DATA SOURCE
6.3.1 TSP Logs
The TSP logs were generated by the same devices as used for the Phase One test.
Please refer to Section 5.3.1 for detailed information on those TSP logs and their data
formats.
6.3.2 GPS Data
The GPS logs were provided by the same devices and in the same way as in the
Phase One test. Please refer to section 5.3.2 for detailed information on TSP logs.
6.3.3 Traffic Controller Logs
The Phase Two test corridor was in the City of Lynnwood. The City of Lynnwood
uses the Naztec traffic control system for traffic management and control. With the
Naztec TMC (Traffic Management Center) software, many event data, such as the split
change and time-stamped traffic calls, can be monitored. The traffic detection systems on
the SR 99 corridor are Traficon’s video image processors (VIPs). Virtual loops are
deployed at mid-block to detect traffic volume. The TMC server archives and reports
traffic volume data periodically.
6.3.4 Traffic Video Data
All TSP-enabled intersections on the Phase Two test corridor used VIPs for traffic
detection. Video signals from these detection cameras were recorded as ground-truth data
for traffic queue length and cycle failure analysis. In addition to the VIPs, some
intersections also had a surveillance video camera that could be re-oriented to collect
extra video data at locations of interest.
26
Twenty-eight VCRs were employed to record traffic video data from the 13
intersections on the SR 99 test corridor. The intersections at 196th Street SW, 200th Street
SW, and 220th Street SW were very busy on all approaches. Hence, each approach of the
three intersections had a VCR dedicated to video data collection. For each of the other ten
intersections, video inputs from the four approaches were combined into a quad format.
and one VCR was used to record the quad video streams. Several surveillance cameras
were also used to provide video data at advanced positions. During each weekday, the
VCR recorded six hours of video data, including two hours of the morning peak (6:30-
8:30 AM), two hours of off-peak (3:00-4:00 PM and 6:00-7:00 PM), and two hours of the
afternoon peak (4:00-6:00 PM).
6.3.5 Other Data
Our analysis of the Phase One test data showed that the transit drivers’ logs were
not accurate and could not be applied. Therefore, we eliminated the drivers’ log in the
Phase Two test.
Bus schedule, bus stop location, and transit ridership data were provided by CT.
Trip assignment records were not collected in the Phase Two test because these data
could be extracted from the TSP logs generated by the TPRG.
All the discussed data, except for the traffic video data, were stored in the Phase
Two database created following the design described in Section 4.2 and implemented in
Microsoft SQL Server 2000.
27
CHAPTER 7 SIMULATION ANALYSIS
7.1 SIMULATION TOOL
Average person delays, vehicle delays, and stops were several important performance
measures for evaluating the system. As mentioned earlier, these MOEs were not directly
calculable from the field-observed data; hence, we developed simulation models to
compute them. The traffic simulation software VISSIM version 4.30 was utilized to
emulate traffic operations with or without the functions of the TSP system. VISSIM is a
microscopic, behavior-based traffic simulation tool that can model integrated roadway
networks and various modes, including general-purpose traffic, buses, high-occupancy
vehicles (HOV), light rail, trucks, bicyclists, and pedestrians. VISSIM can also
implement some advanced traffic systems and control strategies such as TSP systems,
provide effective measures to assess their benefits and costs, and then further optimize
system operations (VISSIM Users Manual 2004).
7.2 PHASE ONE SIMULATION MODELING AND EXPERIENCE
7.2.1 Modeling 164th Street SW
The section of 164th Street SW between 36th Avenue W and 25th Avenue W (or
NorthPoint) in the City of Lynnwood was modeled to simulate the corresponding
practical test sites. The simulation model was configured by using the actual layout of the
corridor and traffic control parameters. Field-observed traffic volumes, transit ridership
estimates, and vehicle occupancy data were used to calibrate the model. The details of
model setup and calibration are described below.
28

To model the Phase One test corridor, we obtained arterial geometric
characteristics and transit stop coordinates from construction designs and the GPS
systems used by Snohomish County, in addition to practical observations (Snohomish
County 2003). Traffic control and operational parameters at the test corridor were
collected from the Snohomish County Department of Transportation.
In accordance with the practical test situation, the TSP function was enabled in
the control strategies for the four intersections—164th Street and 36th Avenue, 164th Street
and Park-and-Ride, 164th Street and Alderwood Mall Parkway, and 164th Street and
NorthPoint—along the Phase One test corridor. The emulated NEMA controller in
VISSIM can be properly configured as a standard NEMA controller to satisfy the
requirements of fully actuated signal control and basic TSP operations. Thus, in this
study we applied the emulated NEMA controllers in the simulation model to implement
the real signal control plans in operation for each intersection. The basic TSP routine was
supported by the NEMA controller. A transit call detected by sensors could generate a
request for early green or extended green operation that would be consistent with the
logic in the SS-RTSP system.
7.2.2 Simulation Model Configuration and Calibration
We set traffic volumes for the approaches based on actual volumes observed by
traffic sensors. Some traffic volume data were double-checked by ground-truth video
tapes recorded at the test intersections to enhance the reliability of the model calibration
process. Traffic flows of intersection approaches generated by the simulation program
were reasonably distributed in the range of 50 vehicle-per-hour-per-lane (vphpl) to 1250
vphpl and matched field observed volumes very well.
29
We estimated the passenger ridership on buses on the basis of annual CT ridership
(National Transit Database 2004). In our model we selected 12 passengers per vehicle
(ppv) as the ridership. The average vehicle occupancy for general-purpose vehicles was
estimated to be 1.2 occupants per vehicle, as determined by King County Metro on the
basis of field observations (King County Department of Transportation 2002).
Additionally, the generation rate of passengers was set as 10 persons per hour (pph) on
the basis of the number of boardings at each stop (Community Transit 2005). Other
parameters, such as bus headways, locations of bus stops, and so on, were calibrated
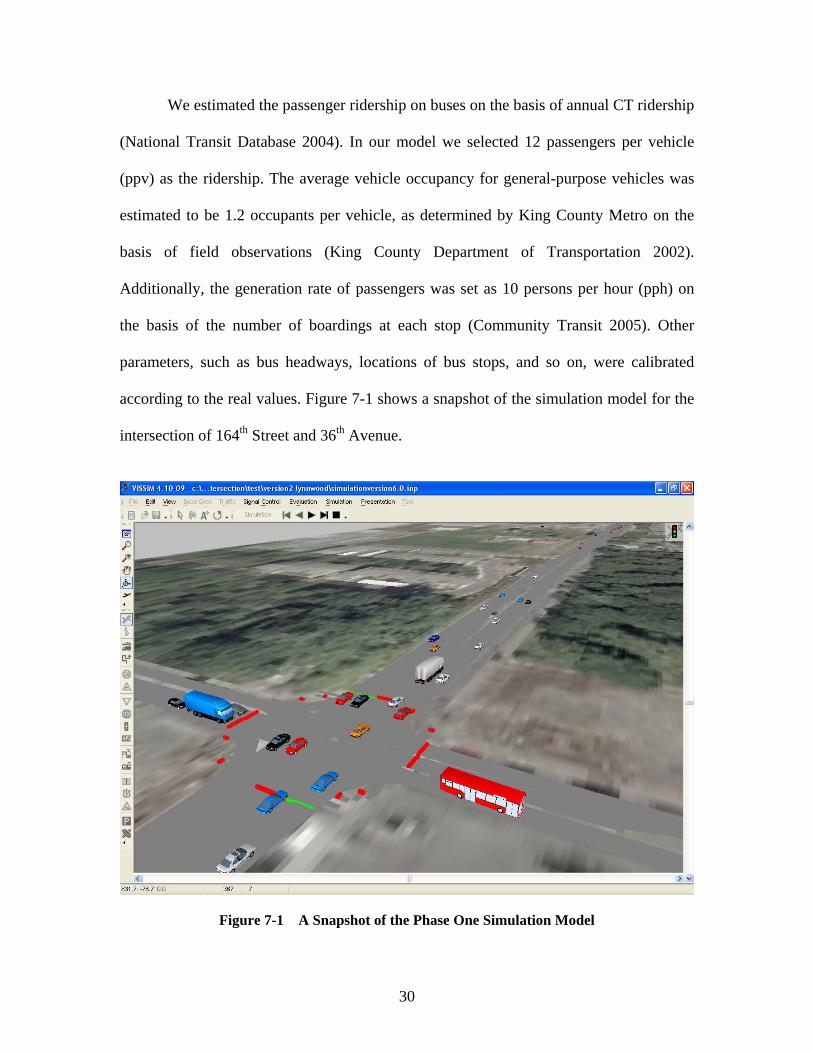
according to the real values. Figure 7-1 shows a snapshot of the simulation model for the
intersection of 164th Street and 36th Avenue.
Figure 7-1 A Snapshot of the Phase One Simulation Model
30

We also calibrated the traffic control settings of the simulation model by using
actual traffic operation parameters and control plans. Internal parameters for the
simulation model were properly adjusted to ensure the model’s appropriateness to the
corresponding application. After the simulation model was properly calibrated, we
conducted a six-hour simulation test: three hours for TSP on and the other three hours for
TSP off.
7.3 PHASE TWO SIMULATION MODELING AND EXPERIENCE
7.3.1 Modeling the SR 99 Corridor
The SR 99 section between 238th Street SW and 164th Street SW was modeled to
simulate the Phase Two test corridor. The VISSIM model was configured by using the
actual layout of the corridor and traffic control parameters. Field-observed traffic
volumes, transit ridership estimates, and vehicle occupancy data were used to calibrate
the model.
The simulation software VISSIM provides a flexible and powerful platform for
user-specific development. The emulated NEMA controller provided by VISSIM can
properly function as a standard NEMA controller to satisfy the requirements of actuated
signal control and basic TSP operations. However, the traffic controllers on this corridor
were Naztec, which provide some different TSP functions than those provided by the
NEMA controller. Therefore, an external controller was established for each intersection
by using the vehicle actuated programming (VAP) language. The control logic and transit
priority strategies of the Phase Two test intersections could be implemented by using the
VAP programming language. Thus, a total of 13 external VAP controllers were
31
developed, one for each intersection, for the SR 99 test corridor. Control parameters and
TSP strategies were extracted from the real control system settings and applied to the
calibration of the simulation models. The details of the calibration process are described
below.
7.3.2 Simulation Model Configuration and Calibration
Traffic volumes in each approach were collected from mid-block virtual loops by
using the VIPs. Directional volumes were manually extracted from video tapes recorded
at the test intersections on typical weekdays. These volume data were used to configure
the simulation model for traffic generation. Traffic volumes generated by our VISSIM
simulation model were reasonably distributed in the range of 30 vphpl to 980 vphpl,
which matched our field observations very well. The traffic control parameters used by
the VISSIM model were calibrated by using the actual control plans and timing
parameters.
We estimated the passenger ridership on buses on the basis of CT’s annual
ridership data (National Transit Database 2004). Consequently, we used 12 ppv as the
ridership for our simulation model. The average vehicle occupancy for general-purpose
vehicles was configured to be 1.2 occupants per vehicle on the basis of field observations
by King County Metro (King County Department of Transportation 2002). Additionally,
the generation rate of passengers was set at 20 pph in our simulation model according to
CT’s study on the number of boardings at each stop (Community Transit 2005). The
other parameters, such as bus headways, bus stop locations, and so on, were calibrated
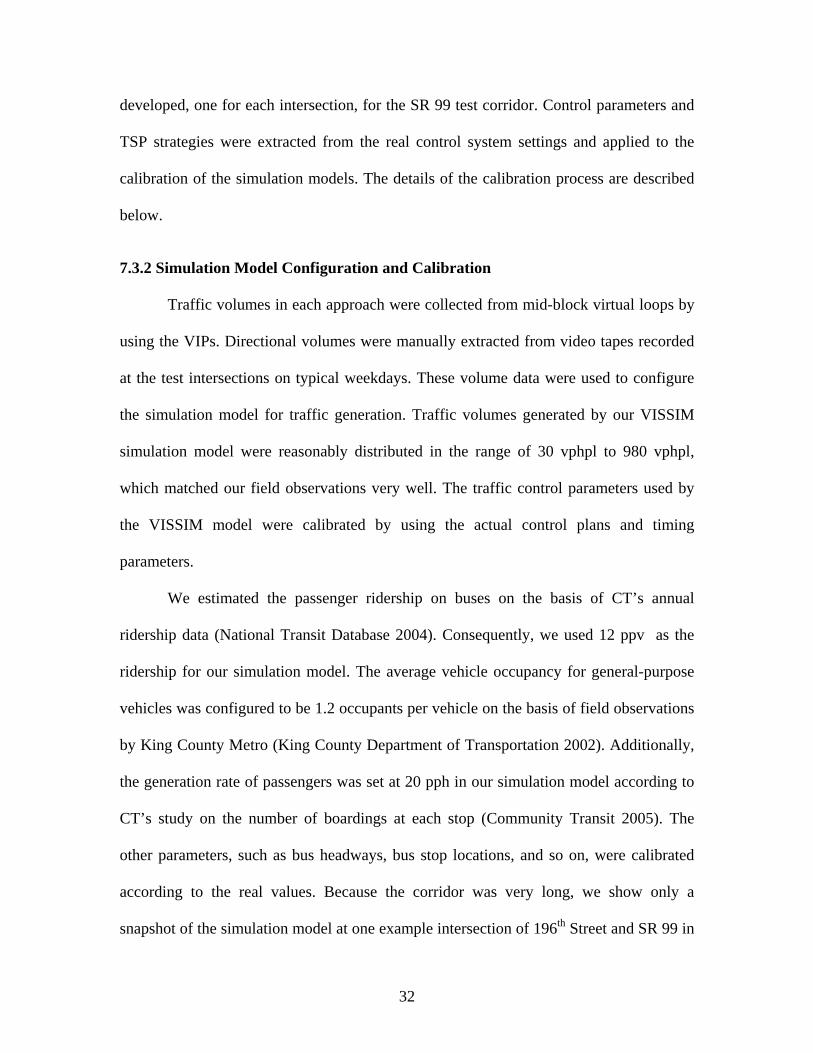
according to the real values. Because the corridor was very long, we show only a
snapshot of the simulation model at one example intersection of 196th Street and SR 99 in
32
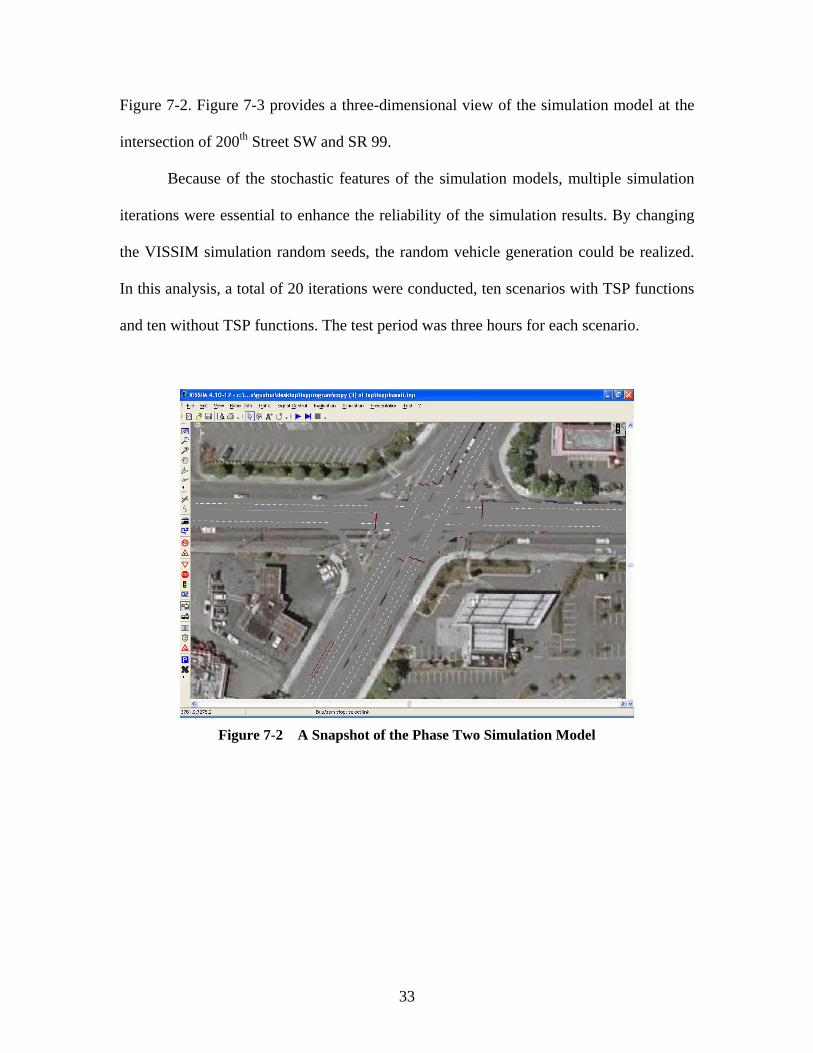
Figure 7-2. Figure 7-3 provides a three-dimensional view of the simulation model at the
intersection of 200th Street SW and SR 99.
Because of the stochastic features of the simulation models, multiple simulation
iterations were essential to enhance the reliability of the simulation results. By changing
the VISSIM simulation random seeds, the random vehicle generation could be realized.
In this analysis, a total of 20 iterations were conducted, ten scenarios with TSP functions
and ten without TSP functions. The test period was three hours for each scenario.
Figure 7-2 A Snapshot of the Phase Two Simulation Model
33
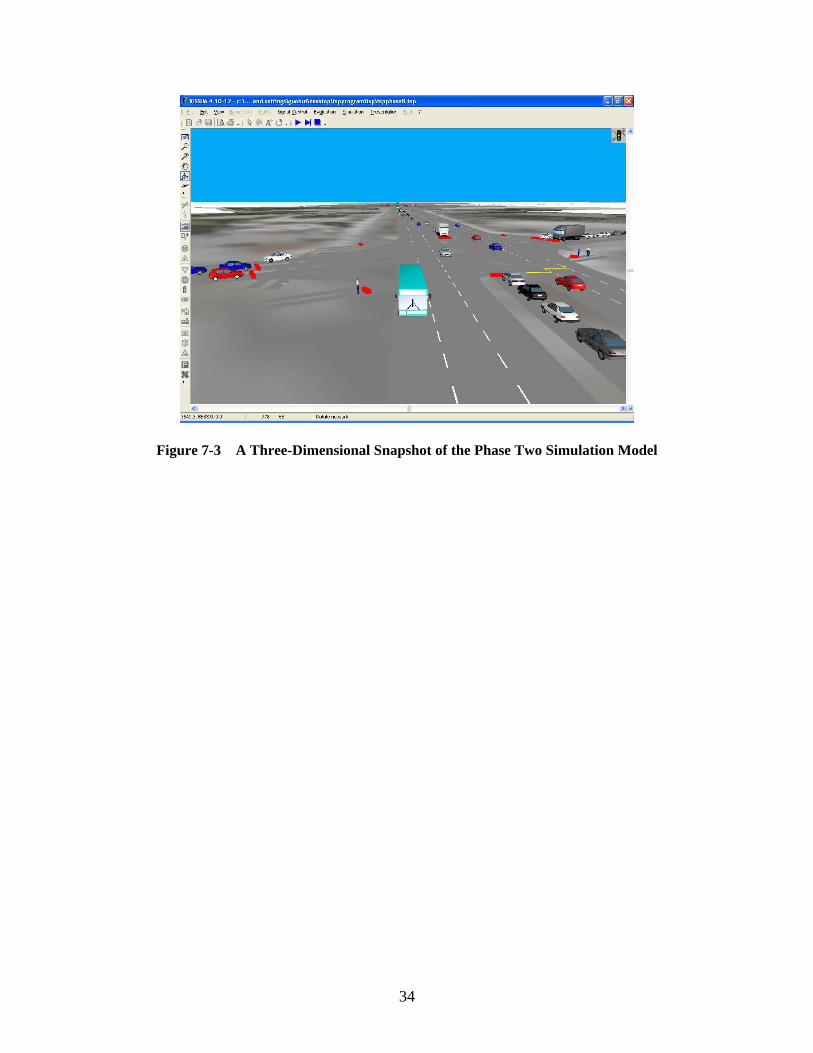
Figure 7-3 A Three-Dimensional Snapshot of the Phase Two Simulation Model
34
CHAPTER 8 PHASE ONE RESULTS AND DISCUSSION
8.1 STATISTICS FOR GRANTED TSP TRIPS
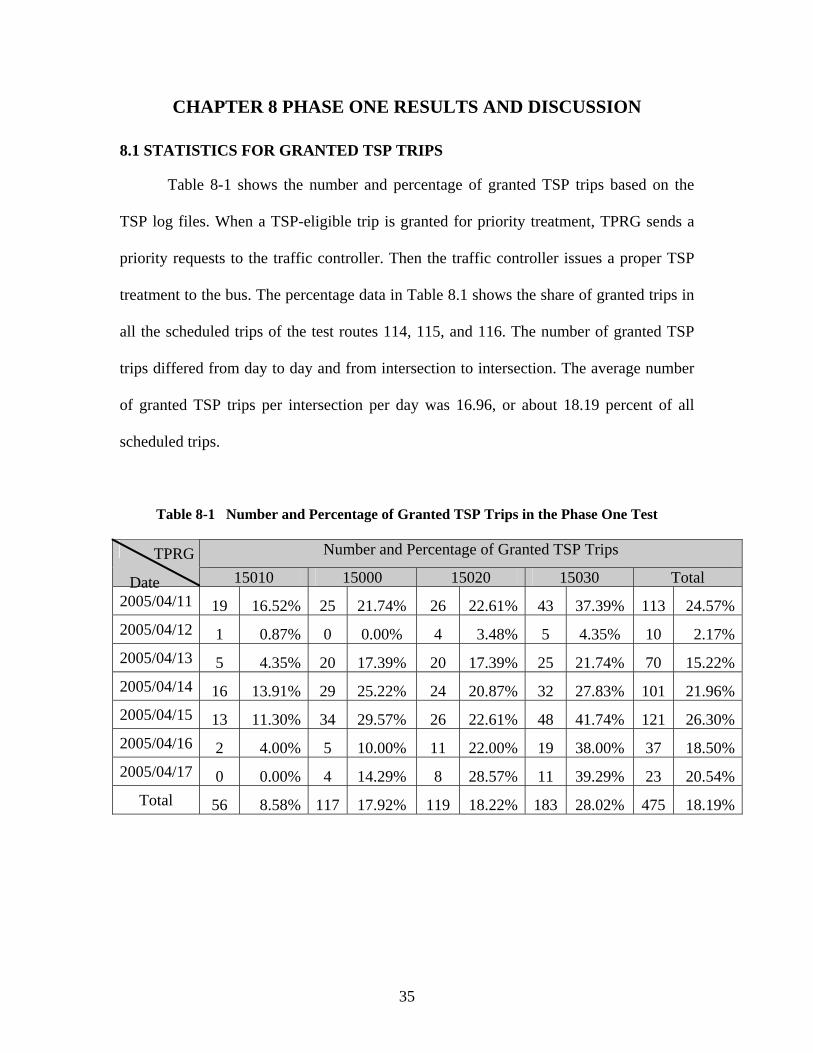
Table 8-1 shows the number and percentage of granted TSP trips based on the
TSP log files. When a TSP-eligible trip is granted for priority treatment, TPRG sends a
priority requests to the traffic controller. Then the traffic controller issues a proper TSP
treatment to the bus. The percentage data in Table 8.1 shows the share of granted trips in
all the scheduled trips of the test routes 114, 115, and 116. The number of granted TSP
trips differed from day to day and from intersection to intersection. The average number
of granted TSP trips per intersection per day was 16.96, or about 18.19 percent of all
scheduled trips.
Table 8-1 Number and Percentage of Granted TSP Trips in the Phase One Test
Number and Percentage of Granted TSP Trips
15010 15000 15020 15030 Total 2005/04/11 19 16.52% 25 21.74% 26 22.61% 43 37.39% 113 24.57%2005/04/12 1 0.87% 0 0.00% 4 3.48% 5 4.35% 10 2.17%2005/04/13 5 4.35% 20 17.39% 20 17.39% 25 21.74% 70 15.22%2005/04/14 16 13.91% 29 25.22% 24 20.87% 32 27.83% 101 21.96%2005/04/15 13 11.30% 34 29.57% 26 22.61% 48 41.74% 121 26.30%2005/04/16 2 4.00% 5 10.00% 11 22.00% 19 38.00% 37 18.50%2005/04/17 0 0.00% 4 14.29% 8 28.57% 11 39.29% 23 20.54%
Total 56 8.58% 117 17.92% 119 18.22% 183 28.02% 475 18.19%
Date
TPRG
35
8.2 BENEFITS
8.2.1 Transit Time Match
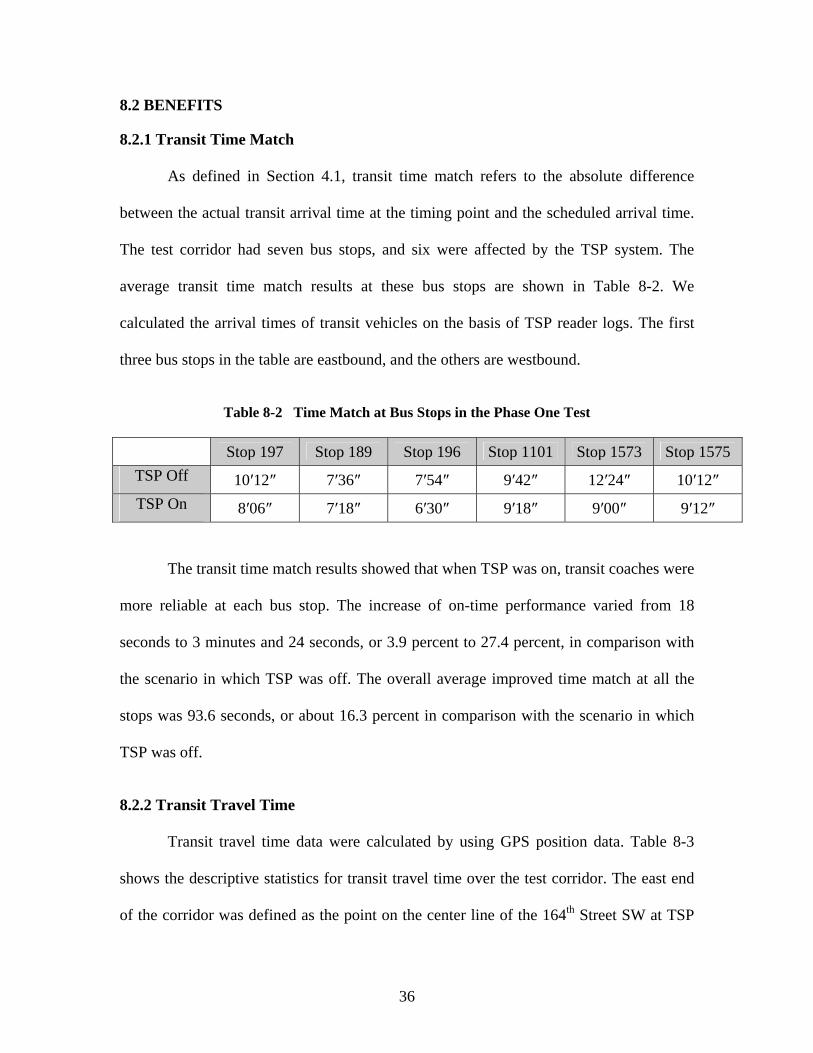
As defined in Section 4.1, transit time match refers to the absolute difference
between the actual transit arrival time at the timing point and the scheduled arrival time.
The test corridor had seven bus stops, and six were affected by the TSP system. The
average transit time match results at these bus stops are shown in Table 8-2. We
calculated the arrival times of transit vehicles on the basis of TSP reader logs. The first
three bus stops in the table are eastbound, and the others are westbound.
Table 8-2 Time Match at Bus Stops in the Phase One Test
Stop 197 Stop 189 Stop 196 Stop 1101 Stop 1573 Stop 1575 TSP Off 10′12″ 7′36″ 7′54″ 9′42″ 12′24″ 10′12″ TSP On 8′06″ 7′18″ 6′30″ 9′18″ 9′00″ 9′12″
The transit time match results showed that when TSP was on, transit coaches were
more reliable at each bus stop. The increase of on-time performance varied from 18
seconds to 3 minutes and 24 seconds, or 3.9 percent to 27.4 percent, in comparison with
the scenario in which TSP was off. The overall average improved time match at all the
stops was 93.6 seconds, or about 16.3 percent in comparison with the scenario in which
TSP was off.
8.2.2 Transit Travel Time
Transit travel time data were calculated by using GPS position data. Table 8-3
shows the descriptive statistics for transit travel time over the test corridor. The east end
of the corridor was defined as the point on the center line of the 164th Street SW at TSP
36
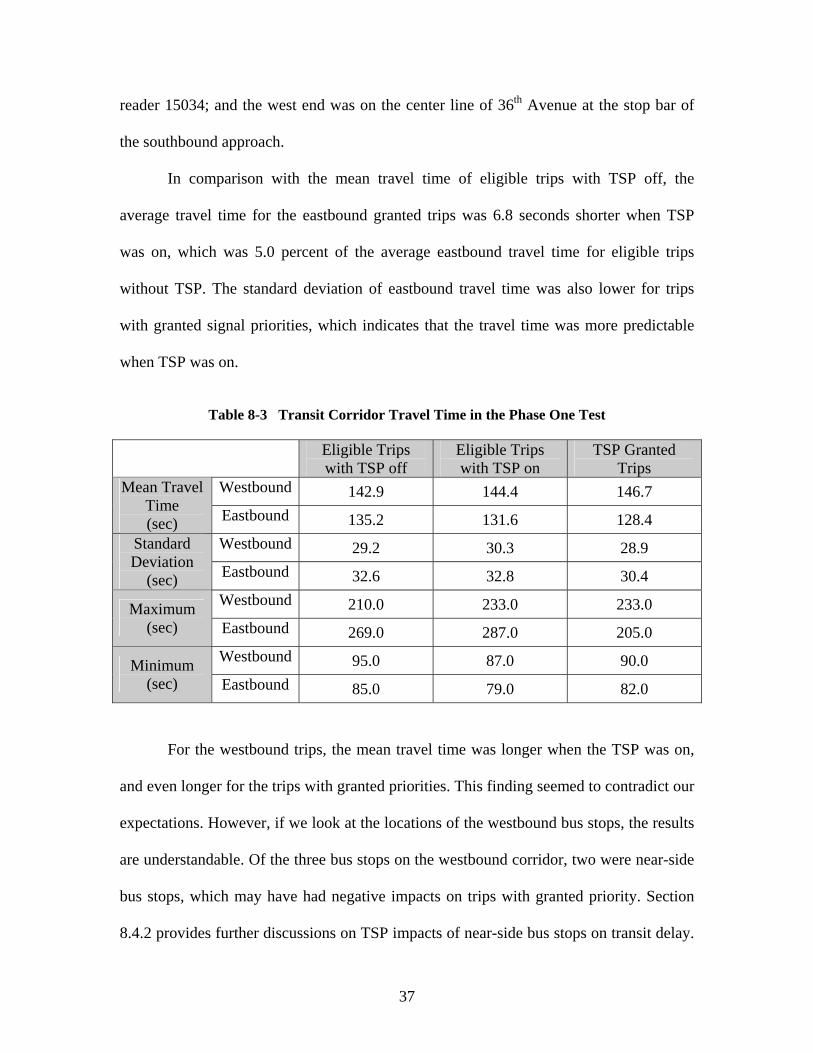
reader 15034; and the west end was on the center line of 36th Avenue at the stop bar of
the southbound approach.
In comparison with the mean travel time of eligible trips with TSP off, the
average travel time for the eastbound granted trips was 6.8 seconds shorter when TSP
was on, which was 5.0 percent of the average eastbound travel time for eligible trips
without TSP. The standard deviation of eastbound travel time was also lower for trips
with granted signal priorities, which indicates that the travel time was more predictable
when TSP was on.
Table 8-3 Transit Corridor Travel Time in the Phase One Test
Eligible Trips with TSP off
Eligible Trips with TSP on
TSP Granted Trips
Westbound 142.9 144.4 146.7 Mean Travel Time (sec) Eastbound 135.2 131.6 128.4
Westbound 29.2 30.3 28.9 Standard Deviation
(sec) Eastbound 32.6 32.8 30.4 Westbound 210.0 233.0 233.0 Maximum
(sec) Eastbound 269.0 287.0 205.0 Westbound 95.0 87.0 90.0 Minimum
(sec) Eastbound 85.0 79.0 82.0
For the westbound trips, the mean travel time was longer when the TSP was on,
and even longer for the trips with granted priorities. This finding seemed to contradict our
expectations. However, if we look at the locations of the westbound bus stops, the results
are understandable. Of the three bus stops on the westbound corridor, two were near-side
bus stops, which may have had negative impacts on trips with granted priority. Section
8.4.2 provides further discussions on TSP impacts of near-side bus stops on transit delay.
37
Although the eastbound corridor also had a near-side bus stop, it was located at a corner
of the intersection where transit vehicles turned right. Because right-turn movements may
be conducted even on a red signal, the negative impact on travel time from this near-side
bus stop was not as noticeable as the westbound ones. Therefore, the westbound average
travel time of TSP-granted trips exceeded the mean travel time of all TSP-eligible trips
collected when the TSP system was off, but the eastbound mean travel time did not have
this problem.
Table 8-4 shows the mean and standard deviation of transit travel times at four
intersections. The starting and ending points for intersection travel time calculation were
defined as the points 200 ft upstream and 200 ft downstream from the intersection’s
center point, respectively. However, for intersections with a near-side bus stop, the
starting point for the corresponding direction was re-defined as the mid-point of the bus
stop and the stop bar.
In general, the SS-RTSP system decreased the intersection travel times of transit
vehicles. The only exception was the eastbound direction for the intersection of Park-and-
Ride, where the mean travel time of TSP-eligible trips was 1.82 seconds higher with TSP
on than that with TSP off. This location had exceptionally good traffic conditions in the
TSP off week when the data were collected. This inference was based on the small
standard deviation of 1.74 seconds in comparison to that of 5.30 seconds when TSP was
on. The transit travel time savings from the SS-RTSP system varied from intersection to
intersection: at the intersections with 36th Avenue SW and with Alderwood Mall
Parkway, the savings were significant for westbound travel. At the other two
intersections, the savings were in the 1- to 2-second range.
38
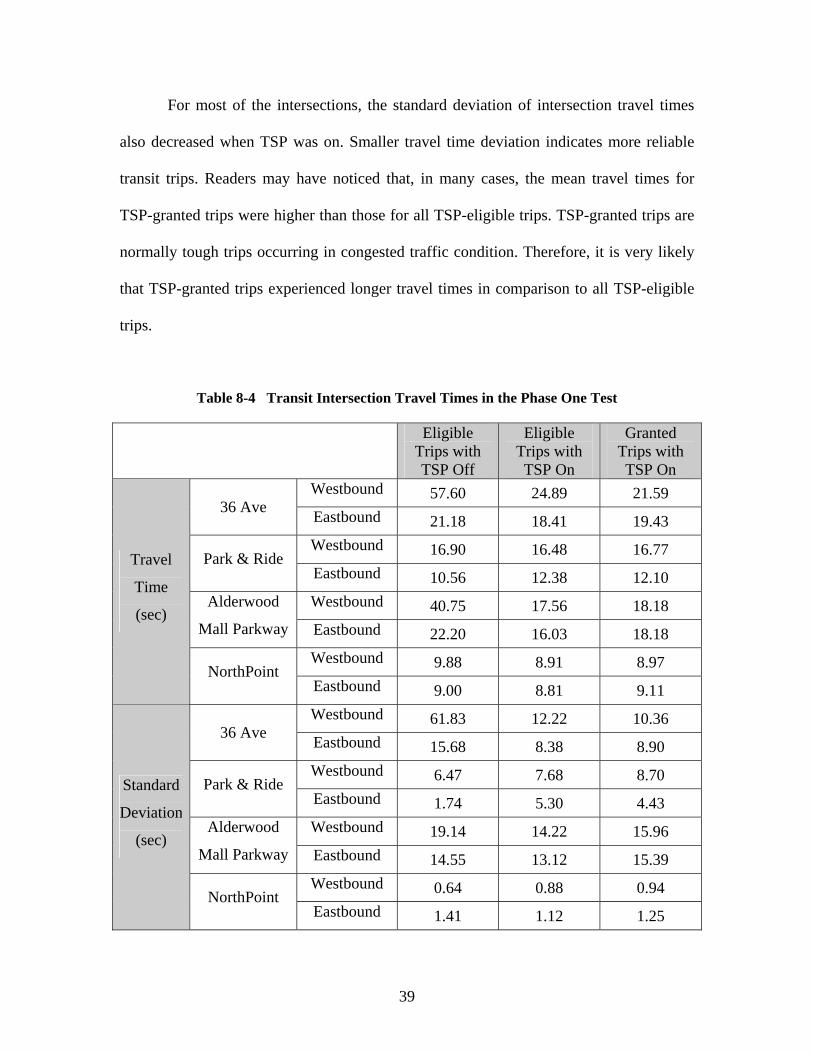
For most of the intersections, the standard deviation of intersection travel times
also decreased when TSP was on. Smaller travel time deviation indicates more reliable
transit trips. Readers may have noticed that, in many cases, the mean travel times for
TSP-granted trips were higher than those for all TSP-eligible trips. TSP-granted trips are
normally tough trips occurring in congested traffic condition. Therefore, it is very likely
that TSP-granted trips experienced longer travel times in comparison to all TSP-eligible
trips.
Table 8-4 Transit Intersection Travel Times in the Phase One Test
Eligible
Trips with TSP Off
Eligible Trips with TSP On
Granted Trips with TSP On
Westbound 57.60 24.89 21.59 36 Ave Eastbound 21.18 18.41 19.43
Westbound 16.90 16.48 16.77 Park & Ride Eastbound 10.56 12.38 12.10 Westbound 40.75 17.56 18.18 Alderwood
Mall Parkway Eastbound 22.20 16.03 18.18 Westbound 9.88 8.91 8.97
Travel
Time
(sec)
NorthPoint Eastbound 9.00 8.81 9.11 Westbound 61.83 12.22 10.36
36 Ave Eastbound 15.68 8.38 8.90 Westbound 6.47 7.68 8.70 Park & Ride Eastbound 1.74 5.30 4.43 Westbound 19.14 14.22 15.96 Alderwood
Mall Parkway Eastbound 14.55 13.12 15.39 Westbound 0.64 0.88 0.94
Standard
Deviation
(sec)
NorthPoint Eastbound 1.41 1.12 1.25
39
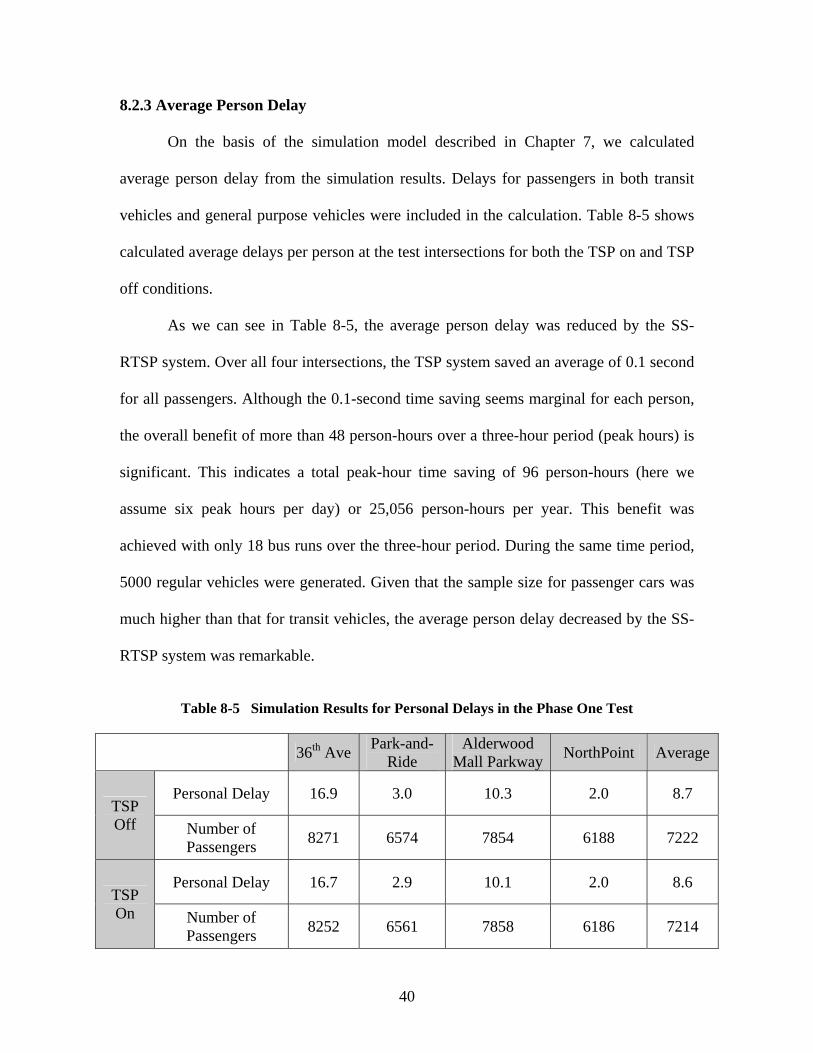
8.2.3 Average Person Delay
On the basis of the simulation model described in Chapter 7, we calculated
average person delay from the simulation results. Delays for passengers in both transit
vehicles and general purpose vehicles were included in the calculation. Table 8-5 shows
calculated average delays per person at the test intersections for both the TSP on and TSP
off conditions.
As we can see in Table 8-5, the average person delay was reduced by the SS-
RTSP system. Over all four intersections, the TSP system saved an average of 0.1 second
for all passengers. Although the 0.1-second time saving seems marginal for each person,
the overall benefit of more than 48 person-hours over a three-hour period (peak hours) is
significant. This indicates a total peak-hour time saving of 96 person-hours (here we
assume six peak hours per day) or 25,056 person-hours per year. This benefit was
achieved with only 18 bus runs over the three-hour period. During the same time period,
5000 regular vehicles were generated. Given that the sample size for passenger cars was
much higher than that for transit vehicles, the average person delay decreased by the SS-
RTSP system was remarkable.
Table 8-5 Simulation Results for Personal Delays in the Phase One Test
36th Ave Park-and-Ride
Alderwood Mall Parkway NorthPoint Average
Personal Delay 16.9 3.0 10.3 2.0 8.7 TSP Off Number of
Passengers 8271 6574 7854 6188 7222
Personal Delay 16.7 2.9 10.1 2.0 8.6 TSP On Number of
Passengers 8252 6561 7858 6186 7214
40

8.3 COSTS
8.3.1 Vehicle Delays and Stops
The control delay per vehicle is the only measurement representing the level of
service (LOS) at signalized intersections (Transportation Research Board 2000). Vehicle
delays at major cross streets were manually collected from traffic video images. Table 8-
6 shows the average vehicle delays calculated from the manually collected vehicle delay
data for April 4 and 11, 2006.
We used a paired t-test to compare the cross-street vehicle delays before and after
the SS-RTSP implementation. The t ratio was 1.799, which was smaller than the critical t
ratio of 1.962 at p=0.05 level. Therefore, the change of control delay for vehicles on side
streets was not significant at p=0.05 level after the SS-RTSP implementation.
Table 8-6 Vehicle Delays in the Phase One Test
Intersection Time Period Approach Intersection Delay (Second) Alderwood 7:30am - 8:00am North approach 25.09 Alderwood 2:00pm - 2:30pm North approach 41.84 Alderwood 4:30pm - 5:00pm North approach 42.50 Alderwood 7:30am - 8:00am South approach 26.47 Alderwood 2:00pm - 2:30pm South approach 37.30 Alderwood 4:30pm - 5:00pm South approach 35.94 36th Ave. 7:30am - 8:00am West approach 17.72 36th Ave. 2:00pm - 2:30pm West approach 18.12
TSP Off
36th Ave. 4:30pm - 5:00pm West approach 25.03 Alderwood 7:30am - 8:00am North approach 30.22 Alderwood 2:00pm - 2:30pm North approach 27.76 Alderwood 4:30pm - 5:00pm North approach 42.64 Alderwood 7:30am - 8:00am South approach 25.54 Alderwood 2:00pm - 2:30pm South approach 20.77 Alderwood 4:30pm - 5:00pm South approach 31.96 36th Ave. 7:30am - 8:00am West approach 11.83 36th Ave. 2:00pm - 2:30pm West approach 17.55
TSP On
36th Ave. 4:30pm - 5:00pm West approach 23.96
41
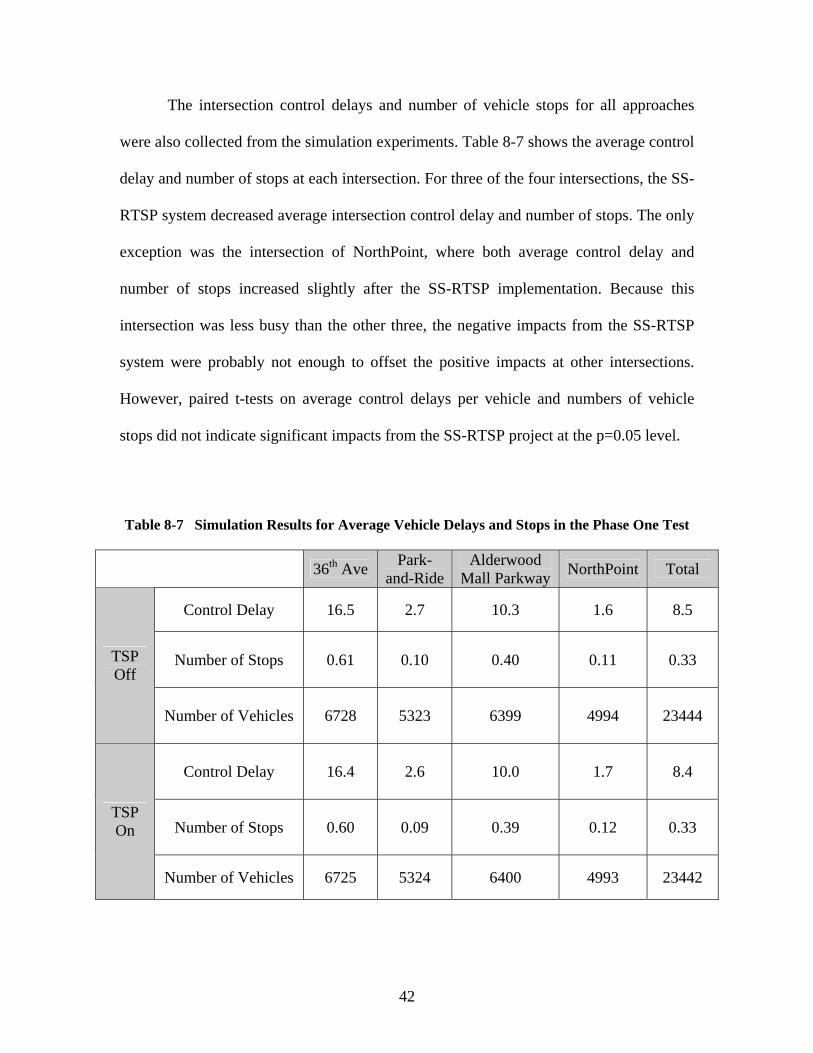
The intersection control delays and number of vehicle stops for all approaches
were also collected from the simulation experiments. Table 8-7 shows the average control
delay and number of stops at each intersection. For three of the four intersections, the SS-
RTSP system decreased average intersection control delay and number of stops. The only
exception was the intersection of NorthPoint, where both average control delay and
number of stops increased slightly after the SS-RTSP implementation. Because this
intersection was less busy than the other three, the negative impacts from the SS-RTSP
system were probably not enough to offset the positive impacts at other intersections.
However, paired t-tests on average control delays per vehicle and numbers of vehicle
stops did not indicate significant impacts from the SS-RTSP project at the p=0.05 level.
Table 8-7 Simulation Results for Average Vehicle Delays and Stops in the Phase One Test
36th Ave Park-and-Ride
Alderwood Mall Parkway NorthPoint Total
Control Delay 16.5 2.7 10.3 1.6 8.5
Number of Stops 0.61 0.10 0.40 0.11 0.33 TSP Off
Number of Vehicles 6728 5323 6399 4994 23444
Control Delay 16.4 2.6 10.0 1.7 8.4
Number of Stops 0.60 0.09 0.39 0.12 0.33 TSP On
Number of Vehicles 6725 5324 6400 4993 23442
42
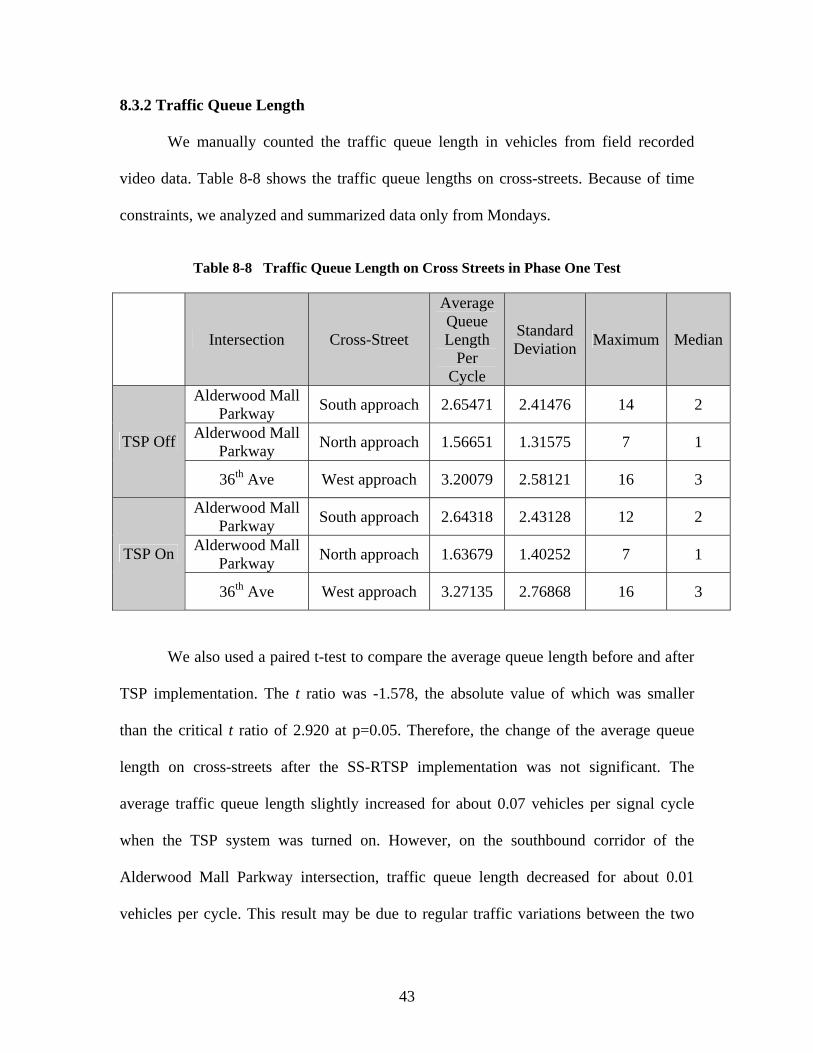
8.3.2 Traffic Queue Length
We manually counted the traffic queue length in vehicles from field recorded
video data. Table 8-8 shows the traffic queue lengths on cross-streets. Because of time
constraints, we analyzed and summarized data only from Mondays.
Table 8-8 Traffic Queue Length on Cross Streets in Phase One Test
Intersection Cross-Street
AverageQueue Length
Per Cycle
Standard Deviation Maximum Median
Alderwood Mall Parkway South approach 2.65471 2.41476 14 2
Alderwood Mall Parkway North approach 1.56651 1.31575 7 1 TSP Off
36th Ave West approach 3.20079 2.58121 16 3
Alderwood Mall Parkway South approach 2.64318 2.43128 12 2
Alderwood Mall Parkway North approach 1.63679 1.40252 7 1 TSP On
36th Ave West approach 3.27135 2.76868 16 3
We also used a paired t-test to compare the average queue length before and after
TSP implementation. The t ratio was -1.578, the absolute value of which was smaller
than the critical t ratio of 2.920 at p=0.05. Therefore, the change of the average queue
length on cross-streets after the SS-RTSP implementation was not significant. The
average traffic queue length slightly increased for about 0.07 vehicles per signal cycle
when the TSP system was turned on. However, on the southbound corridor of the
Alderwood Mall Parkway intersection, traffic queue length decreased for about 0.01
vehicles per cycle. This result may be due to regular traffic variations between the two
43
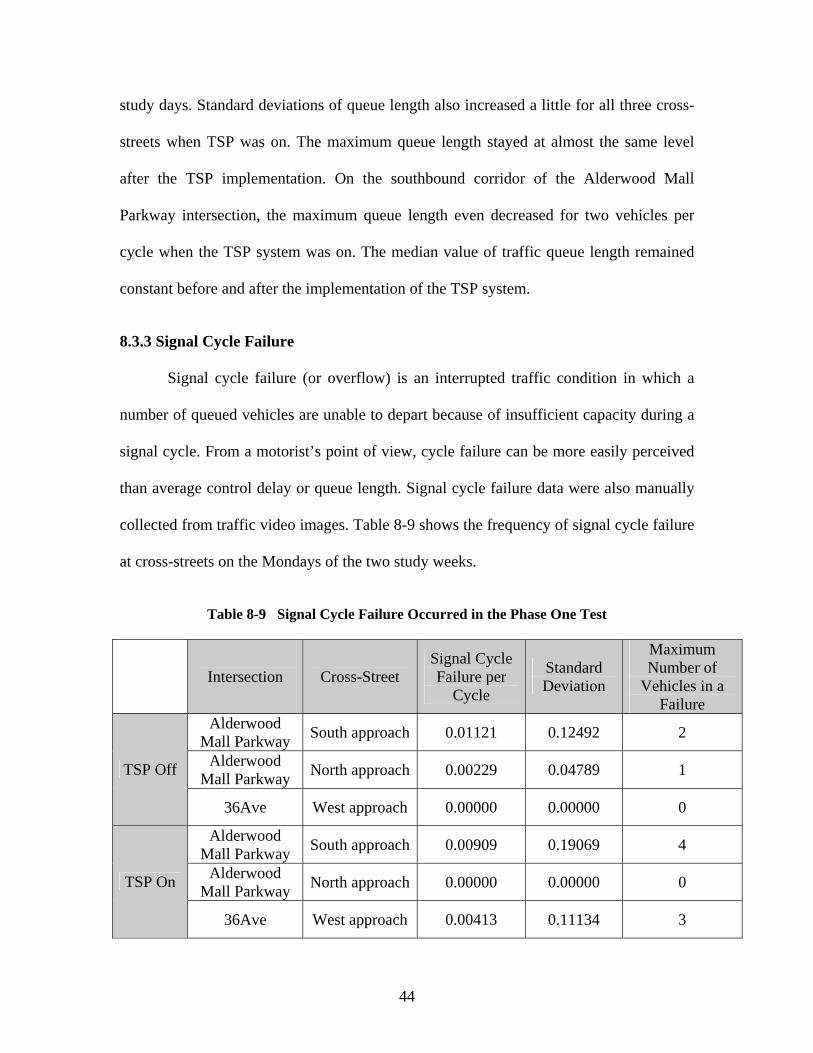
study days. Standard deviations of queue length also increased a little for all three cross-
streets when TSP was on. The maximum queue length stayed at almost the same level
after the TSP implementation. On the southbound corridor of the Alderwood Mall
Parkway intersection, the maximum queue length even decreased for two vehicles per
cycle when the TSP system was on. The median value of traffic queue length remained
constant before and after the implementation of the TSP system.
8.3.3 Signal Cycle Failure
Signal cycle failure (or overflow) is an interrupted traffic condition in which a
number of queued vehicles are unable to depart because of insufficient capacity during a
signal cycle. From a motorist’s point of view, cycle failure can be more easily perceived
than average control delay or queue length. Signal cycle failure data were also manually
collected from traffic video images. Table 8-9 shows the frequency of signal cycle failure
at cross-streets on the Mondays of the two study weeks.
Table 8-9 Signal Cycle Failure Occurred in the Phase One Test
Intersection Cross-Street Signal Cycle Failure per
Cycle
Standard Deviation
Maximum Number of
Vehicles in a Failure
Alderwood Mall Parkway South approach 0.01121 0.12492 2
Alderwood Mall Parkway North approach 0.00229 0.04789 1 TSP Off
36Ave West approach 0.00000 0.00000 0
Alderwood Mall Parkway South approach 0.00909 0.19069 4
Alderwood Mall Parkway North approach 0.00000 0.00000 0 TSP On
36Ave West approach 0.00413 0.11134 3
44
Again, we used the paired t-test to compare the average frequency of signal cycle
failures before and after the TSP implementation. The t ratio was 0.044, which was much
smaller than the critical value of 2.920 at p=0.05. Therefore, the change in the average
number of signal cycle failures after the TSP implementation was not significant at the
p=0.05 level. The frequency of signal cycle failures may have slightly increased or
decreased, depending on flow and signal control conditions after TSP was enabled. When
TSP was on, the standard deviation of signal cycle failures may also have increased or
decreased in a narrow range. The maximum number of vehicles caught in one cycle
failure may also have increased or decreased after TSP was turned on. This was
consistent with the cross-street queue length analysis described in Section 8.3.2.
8.4 DISCUSSION ON POSSIBLE IMPROVEMENTS FOR THE SS-RTSP SYSTEM
8.4.1 Frequency of TSP Calls
As shown in Table 8-4, the distribution of TSP-granted trips during the week, as
well as across the corridor, was not even. On average, the number of TSP-granted trips
per day per intersection was about 16.96. This value is relatively low, and the benefits
from TSP may have been limited because of the low number of TSP-granted trips. The
low number of TSP-granted trips does not necessarily reflect good traffic conditions.
Keypad was not installed on all transit vehicles that used the three test routes when the
test was conducted. Without a Keypad, a transit vehicle was not able to take advantage of
the SS-RTSP system. More Keypads could be installed on these coaches to enable them
to receive TSP when necessary. On the Phase One test corridor, only three transit routes
45
were made eligible for TSP treatment, and more transit routes could be included in the
TSP system.
8.4.2 Near-Side Bus Stops
Many researchers have found that at intersections with a near-side bus stop and
the transit detector upstream of the bus stop, the benefits from TSP decreases
significantly (Baker et al. 2002, Ngan 2003, and Rakha and Zhang 2004). The near-side
bus stop makes it very difficult to accurately predict the travel time from the upstream
transit vehicle detector to the stop bar. In addition to vehicle speed and the distance from
the transit vehicle detector to the stop bar, several other factors affect travel time, such as
the number of passengers to load and unload. These factors are typically random and are
not known when a TSP treatment decision is made. TSP treatments based on wrong
travel-time predictions will not only waste the valuable green time but also decrease the
expected transit benefits from TSP. Furthermore, extra delays to transit vehicles may be
introduced by TSP treatments in comparison with non-TSP intersections, under certain
conditions.
In this study, we proved that a near-side bus stop increases transit delays under
certain conditions at TSP-enabled intersections, which seems to contradict our intuition.
To evaluate the impacts of near-side bus stops on transit delay at intersections, Zheng et
al. (2006) developed a theoretical model. The conditions studied in this research included
an upstream check-in transit vehicle detector, two TSP treatments of green extension and
early green (also called red truncation), and a fixed-time and uncoordinated traffic signal
timing plan. Their approach compared bus movements with TSP on and off in time-space
diagrams. Four scenarios were possible when a transit vehicle arrived at the stop line of a
46
TSP-enabled direction: (1) the transit vehicle received a green extension and benefited
from the treatment because it skipped the near-side bus stop; (2) the transit vehicle
received a green extension but missed the treatment because of the dwell at the near-side
bus stop; (3) the transit vehicle received an early green and skipped the near-side bus
stop; (4) the transit vehicle received an early green and made a stop at the near-side bus
stop. Transit delays were analyzed for all four scenarios. Zheng found that all the
scenarios except number two benefited from TSP treatments. However, the expected
delay might still be a net increase because the cost for missing a green extension would
be high. Most of our theoretical results were backed up with simulation data. With this
model, the extra cost from the near-side bus stop could be calculated. (For details of the
model, please refer to Zheng et al. (2006).) However, Zheng assumed that the time of
green extension was not stolen from conflicting phases, which resulted in a longer signal
control cycle when the green extension treatment was provided. In practice, many signal
control systems maintain a fixed cycle length for pre-timed traffic lights. The findings
from Zheng et al. (2006) are not suitable for such TSP-enabled signals with a fixed cycle
length.
The research results point to recommendations for improving the performance of
the TSP system. Because scenario two has been shown to be the only source of extra
transit delays, green extension may not be a worthy treatment at intersections with near-
side bus stops and can be disabled. The near-side bus stop can also be moved to the far
side of the intersection if necessary.
47
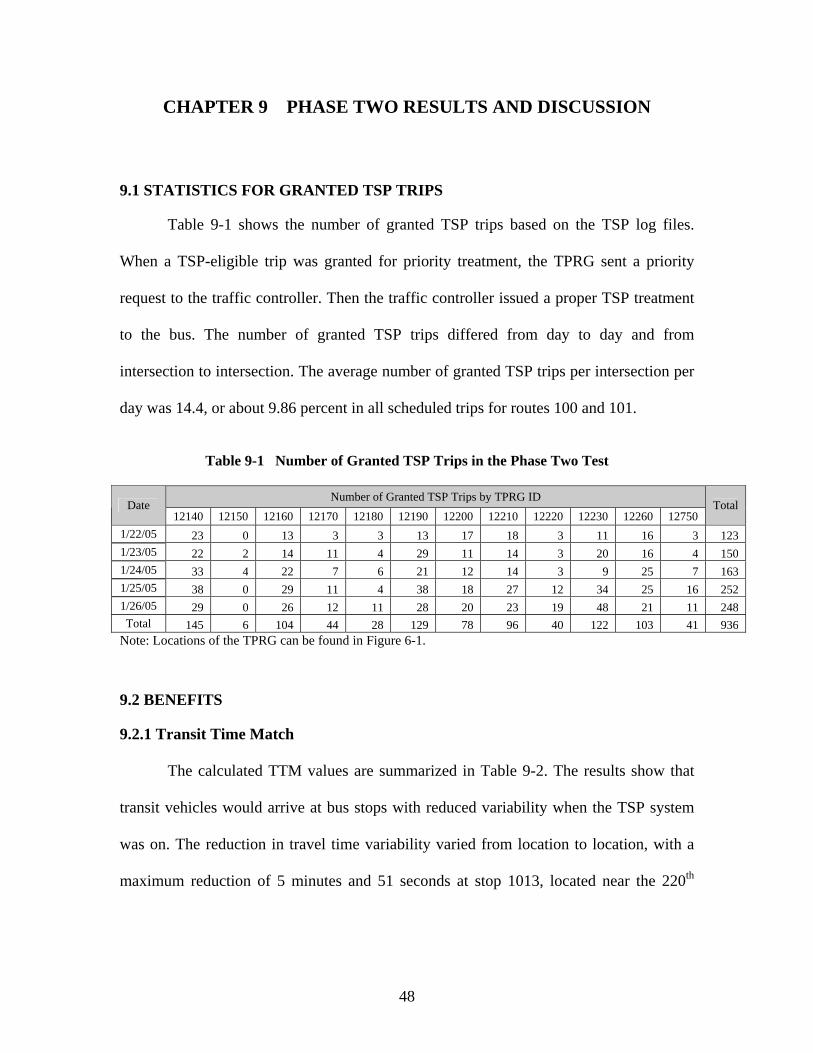
CHAPTER 9 PHASE TWO RESULTS AND DISCUSSION
9.1 STATISTICS FOR GRANTED TSP TRIPS
Table 9-1 shows the number of granted TSP trips based on the TSP log files.
When a TSP-eligible trip was granted for priority treatment, the TPRG sent a priority
request to the traffic controller. Then the traffic controller issued a proper TSP treatment
to the bus. The number of granted TSP trips differed from day to day and from
intersection to intersection. The average number of granted TSP trips per intersection per
day was 14.4, or about 9.86 percent in all scheduled trips for routes 100 and 101.
Table 9-1 Number of Granted TSP Trips in the Phase Two Test
Number of Granted TSP Trips by TPRG ID Date
12140 12150 12160 12170 12180 12190 12200 12210 12220 12230 12260 12750 Total
1/22/05 23 0 13 3 3 13 17 18 3 11 16 3 123 1/23/05 22 2 14 11 4 29 11 14 3 20 16 4 150 1/24/05 33 4 22 7 6 21 12 14 3 9 25 7 163 1/25/05 38 0 29 11 4 38 18 27 12 34 25 16 252 1/26/05 29 0 26 12 11 28 20 23 19 48 21 11 248 Total 145 6 104 44 28 129 78 96 40 122 103 41 936
Note: Locations of the TPRG can be found in Figure 6-1.
9.2 BENEFITS
9.2.1 Transit Time Match
The calculated TTM values are summarized in Table 9-2. The results show that
transit vehicles would arrive at bus stops with reduced variability when the TSP system
was on. The reduction in travel time variability varied from location to location, with a
maximum reduction of 5 minutes and 51 seconds at stop 1013, located near the 220th
48
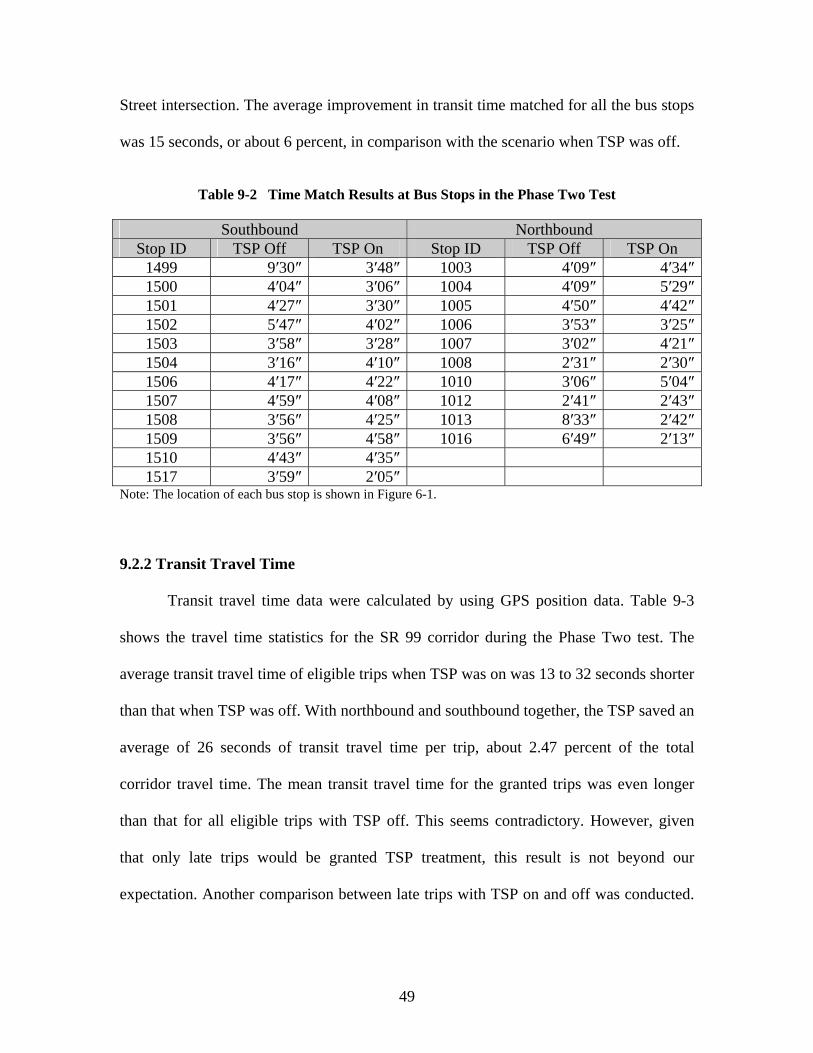
Street intersection. The average improvement in transit time matched for all the bus stops
was 15 seconds, or about 6 percent, in comparison with the scenario when TSP was off.
Table 9-2 Time Match Results at Bus Stops in the Phase Two Test
Southbound Northbound Stop ID TSP Off TSP On Stop ID TSP Off TSP On
1499 9′30″ 3′48″ 1003 4′09″ 4′34″1500 4′04″ 3′06″ 1004 4′09″ 5′29″1501 4′27″ 3′30″ 1005 4′50″ 4′42″1502 5′47″ 4′02″ 1006 3′53″ 3′25″1503 3′58″ 3′28″ 1007 3′02″ 4′21″1504 3′16″ 4′10″ 1008 2′31″ 2′30″1506 4′17″ 4′22″ 1010 3′06″ 5′04″1507 4′59″ 4′08″ 1012 2′41″ 2′43″1508 3′56″ 4′25″ 1013 8′33″ 2′42″1509 3′56″ 4′58″ 1016 6′49″ 2′13″1510 4′43″ 4′35″ 1517 3′59″ 2′05″
Note: The location of each bus stop is shown in Figure 6-1.
9.2.2 Transit Travel Time
Transit travel time data were calculated by using GPS position data. Table 9-3
shows the travel time statistics for the SR 99 corridor during the Phase Two test. The
average transit travel time of eligible trips when TSP was on was 13 to 32 seconds shorter
than that when TSP was off. With northbound and southbound together, the TSP saved an
average of 26 seconds of transit travel time per trip, about 2.47 percent of the total
corridor travel time. The mean transit travel time for the granted trips was even longer
than that for all eligible trips with TSP off. This seems contradictory. However, given
that only late trips would be granted TSP treatment, this result is not beyond our
expectation. Another comparison between late trips with TSP on and off was conducted.
49
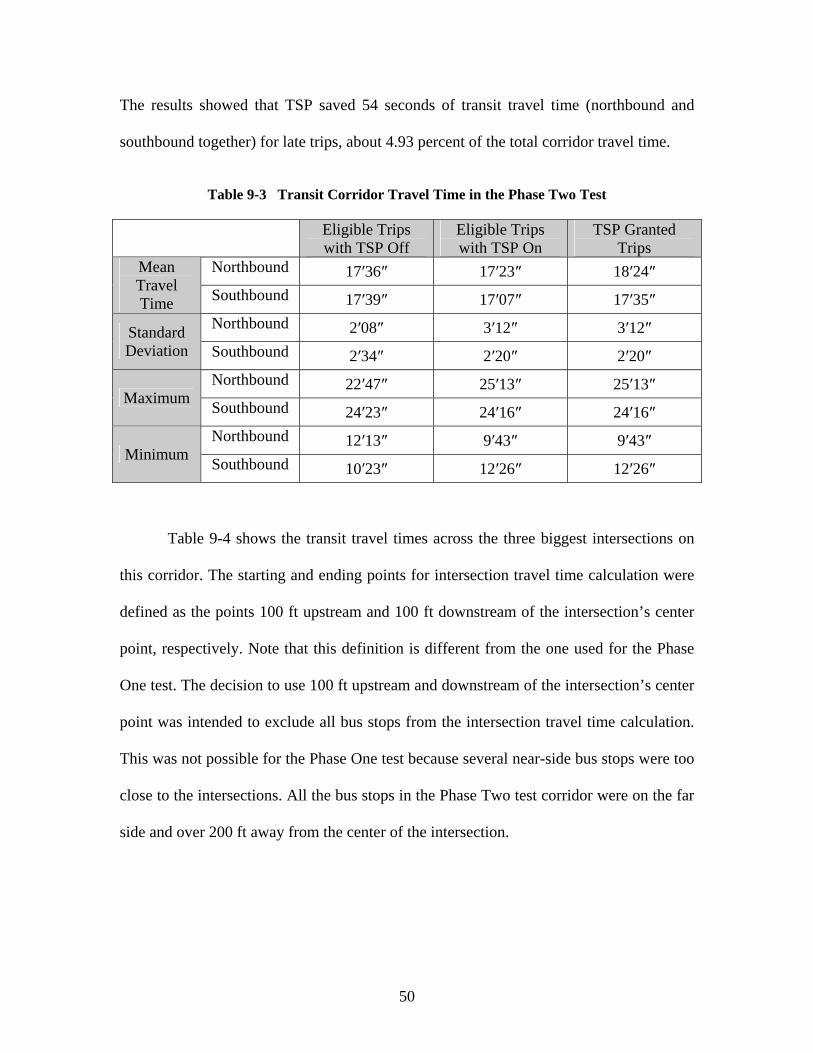
The results showed that TSP saved 54 seconds of transit travel time (northbound and
southbound together) for late trips, about 4.93 percent of the total corridor travel time.
Table 9-3 Transit Corridor Travel Time in the Phase Two Test
Eligible Trips with TSP Off
Eligible Trips with TSP On
TSP Granted Trips
Northbound 17′36″ 17′23″ 18′24″ Mean Travel Time Southbound 17′39″ 17′07″ 17′35″
Northbound 2′08″ 3′12″ 3′12″ Standard Deviation Southbound 2′34″ 2′20″ 2′20″
Northbound 22′47″ 25′13″ 25′13″ Maximum Southbound 24′23″ 24′16″ 24′16″
Northbound 12′13″ 9′43″ 9′43″ Minimum Southbound 10′23″ 12′26″ 12′26″
Table 9-4 shows the transit travel times across the three biggest intersections on
this corridor. The starting and ending points for intersection travel time calculation were
defined as the points 100 ft upstream and 100 ft downstream of the intersection’s center
point, respectively. Note that this definition is different from the one used for the Phase
One test. The decision to use 100 ft upstream and downstream of the intersection’s center
point was intended to exclude all bus stops from the intersection travel time calculation.
This was not possible for the Phase One test because several near-side bus stops were too
close to the intersections. All the bus stops in the Phase Two test corridor were on the far
side and over 200 ft away from the center of the intersection.
50
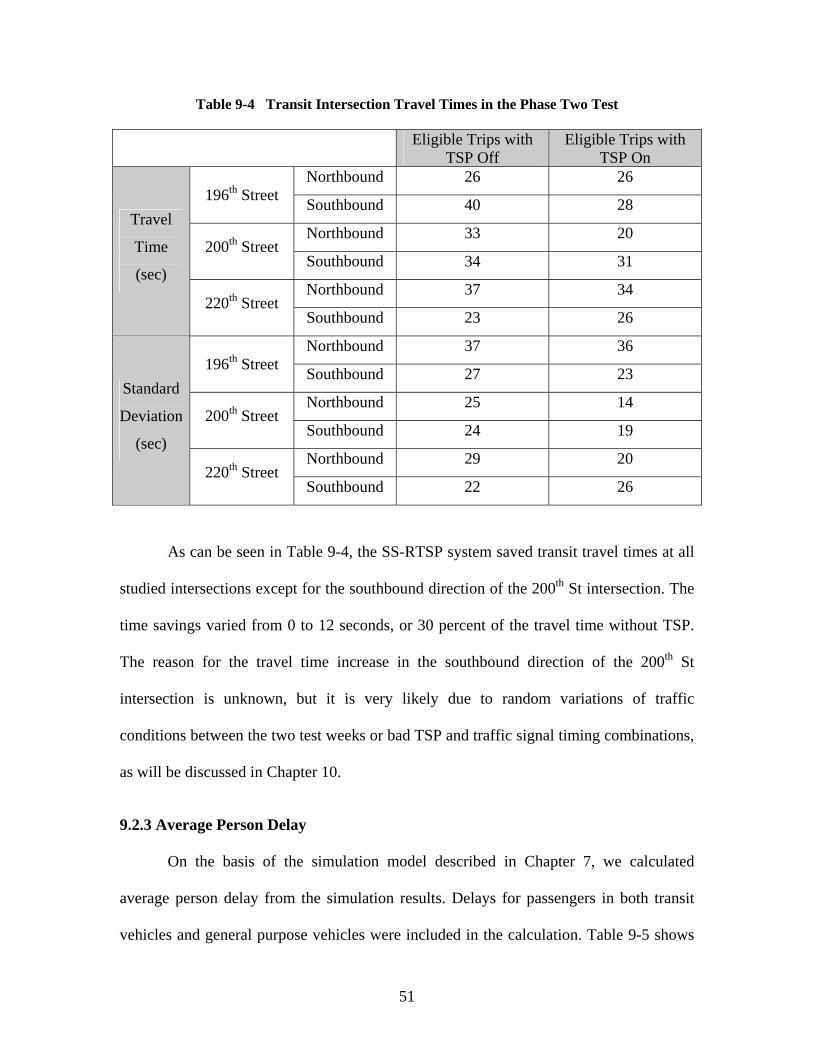
Table 9-4 Transit Intersection Travel Times in the Phase Two Test
Eligible Trips with TSP Off
Eligible Trips with TSP On
Northbound 26 26 196th Street Southbound 40 28
Northbound 33 20 200th Street
Southbound 34 31
Northbound 37 34
Travel
Time
(sec)
220th Street Southbound 23 26
Northbound 37 36 196th Street Southbound 27 23
Northbound 25 14 200th Street
Southbound 24 19
Northbound 29 20
Standard
Deviation
(sec)
220th Street Southbound 22 26
As can be seen in Table 9-4, the SS-RTSP system saved transit travel times at all
studied intersections except for the southbound direction of the 200th St intersection. The
time savings varied from 0 to 12 seconds, or 30 percent of the travel time without TSP.
The reason for the travel time increase in the southbound direction of the 200th St
intersection is unknown, but it is very likely due to random variations of traffic
conditions between the two test weeks or bad TSP and traffic signal timing combinations,
as will be discussed in Chapter 10.
9.2.3 Average Person Delay
On the basis of the simulation model described in Chapter 7, we calculated
average person delay from the simulation results. Delays for passengers in both transit
vehicles and general purpose vehicles were included in the calculation. Table 9-5 shows
51
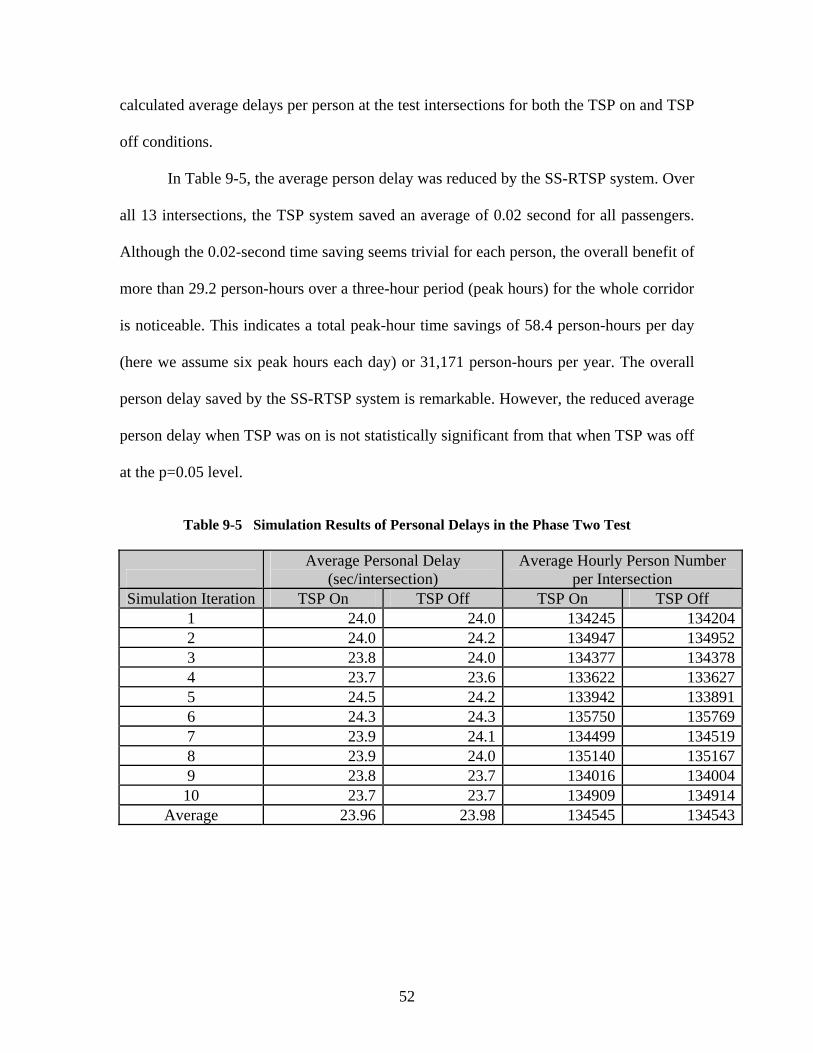
calculated average delays per person at the test intersections for both the TSP on and TSP
off conditions.
In Table 9-5, the average person delay was reduced by the SS-RTSP system. Over
all 13 intersections, the TSP system saved an average of 0.02 second for all passengers.
Although the 0.02-second time saving seems trivial for each person, the overall benefit of
more than 29.2 person-hours over a three-hour period (peak hours) for the whole corridor
is noticeable. This indicates a total peak-hour time savings of 58.4 person-hours per day
(here we assume six peak hours each day) or 31,171 person-hours per year. The overall
person delay saved by the SS-RTSP system is remarkable. However, the reduced average
person delay when TSP was on is not statistically significant from that when TSP was off
at the p=0.05 level.
Table 9-5 Simulation Results of Personal Delays in the Phase Two Test
Average Personal Delay
(sec/intersection) Average Hourly Person Number
per Intersection Simulation Iteration TSP On TSP Off TSP On TSP Off
1 24.0 24.0 134245 1342042 24.0 24.2 134947 1349523 23.8 24.0 134377 1343784 23.7 23.6 133622 1336275 24.5 24.2 133942 1338916 24.3 24.3 135750 1357697 23.9 24.1 134499 1345198 23.9 24.0 135140 1351679 23.8 23.7 134016 13400410 23.7 23.7 134909 134914
Average 23.96 23.98 134545 134543
52
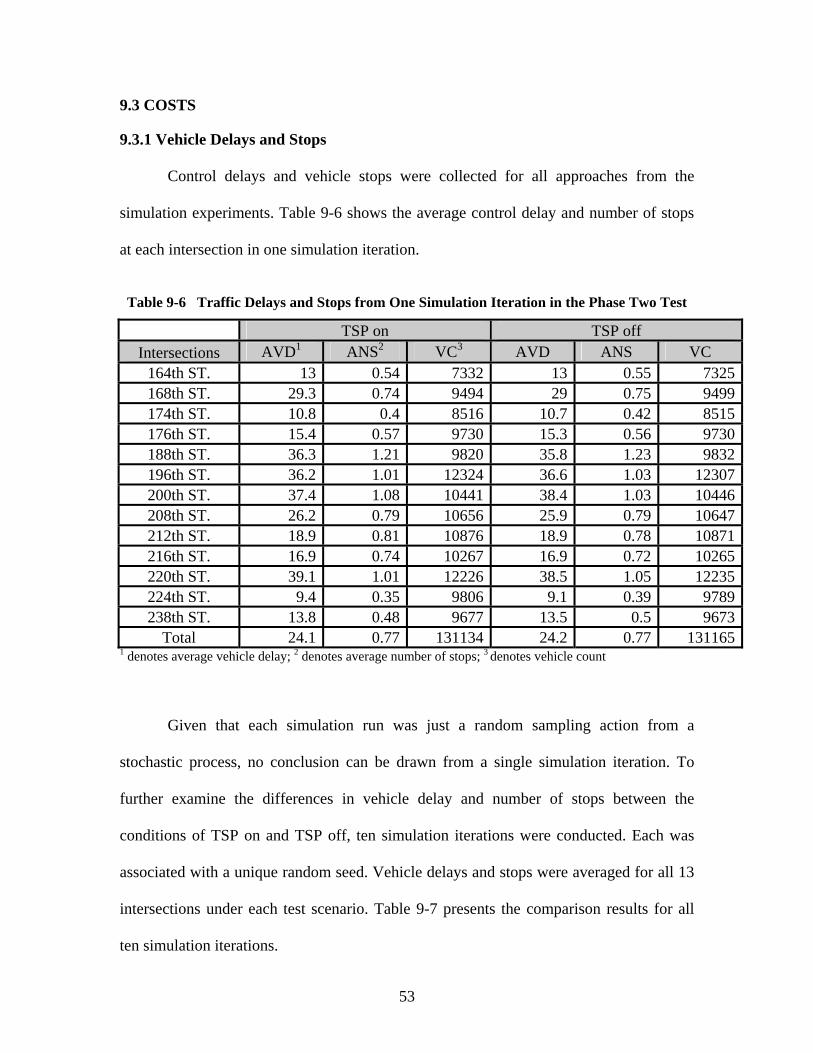
9.3 COSTS
9.3.1 Vehicle Delays and Stops
Control delays and vehicle stops were collected for all approaches from the
simulation experiments. Table 9-6 shows the average control delay and number of stops
at each intersection in one simulation iteration.
Table 9-6 Traffic Delays and Stops from One Simulation Iteration in the Phase Two Test
TSP on TSP off Intersections AVD1 ANS2 VC3 AVD ANS VC
164th ST. 13 0.54 7332 13 0.55 7325168th ST. 29.3 0.74 9494 29 0.75 9499174th ST. 10.8 0.4 8516 10.7 0.42 8515176th ST. 15.4 0.57 9730 15.3 0.56 9730188th ST. 36.3 1.21 9820 35.8 1.23 9832196th ST. 36.2 1.01 12324 36.6 1.03 12307200th ST. 37.4 1.08 10441 38.4 1.03 10446208th ST. 26.2 0.79 10656 25.9 0.79 10647212th ST. 18.9 0.81 10876 18.9 0.78 10871216th ST. 16.9 0.74 10267 16.9 0.72 10265220th ST. 39.1 1.01 12226 38.5 1.05 12235224th ST. 9.4 0.35 9806 9.1 0.39 9789238th ST. 13.8 0.48 9677 13.5 0.5 9673
Total 24.1 0.77 131134 24.2 0.77 1311651 denotes average vehicle delay; 2 denotes average number of stops; 3 denotes vehicle count
Given that each simulation run was just a random sampling action from a
stochastic process, no conclusion can be drawn from a single simulation iteration. To
further examine the differences in vehicle delay and number of stops between the
conditions of TSP on and TSP off, ten simulation iterations were conducted. Each was
associated with a unique random seed. Vehicle delays and stops were averaged for all 13
intersections under each test scenario. Table 9-7 presents the comparison results for all
ten simulation iterations.
53
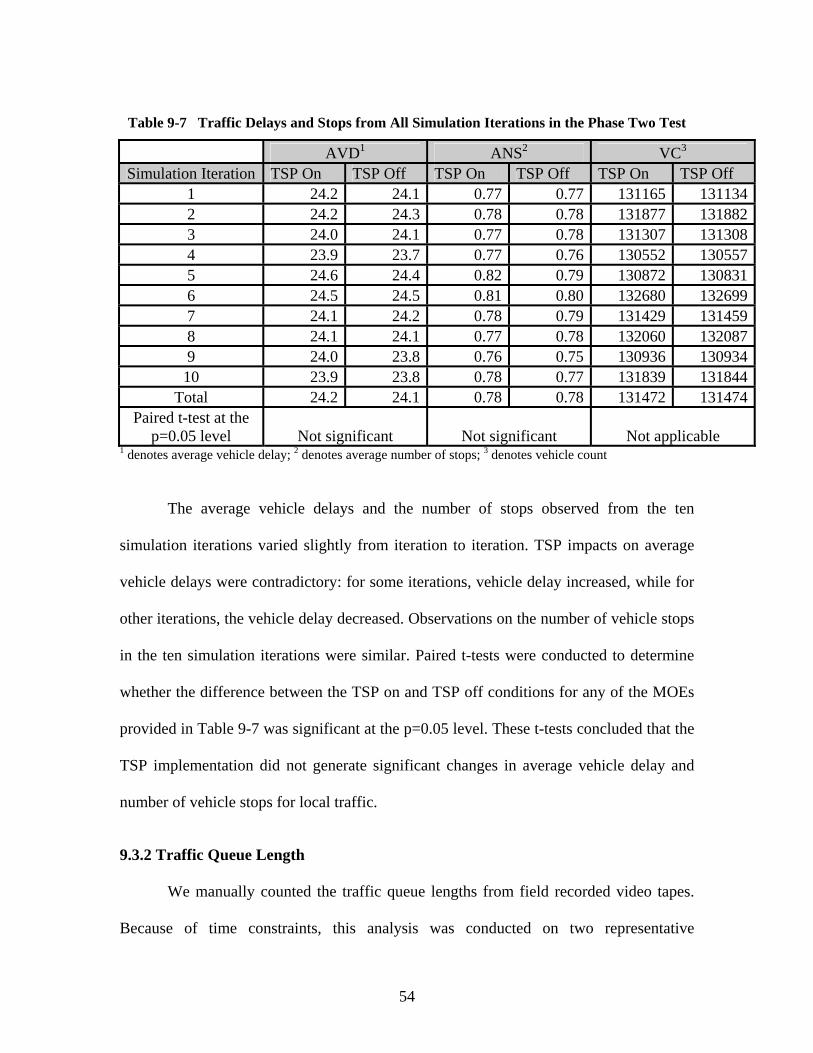
Table 9-7 Traffic Delays and Stops from All Simulation Iterations in the Phase Two Test
AVD1 ANS2 VC3 Simulation Iteration TSP On TSP Off TSP On TSP Off TSP On TSP Off
1 24.2 24.1 0.77 0.77 131165 1311342 24.2 24.3 0.78 0.78 131877 1318823 24.0 24.1 0.77 0.78 131307 1313084 23.9 23.7 0.77 0.76 130552 1305575 24.6 24.4 0.82 0.79 130872 1308316 24.5 24.5 0.81 0.80 132680 1326997 24.1 24.2 0.78 0.79 131429 1314598 24.1 24.1 0.77 0.78 132060 1320879 24.0 23.8 0.76 0.75 130936 13093410 23.9 23.8 0.78 0.77 131839 131844
Total 24.2 24.1 0.78 0.78 131472 131474Paired t-test at the
p=0.05 level Not significant Not significant Not applicable 1 denotes average vehicle delay; 2 denotes average number of stops; 3 denotes vehicle count
The average vehicle delays and the number of stops observed from the ten
simulation iterations varied slightly from iteration to iteration. TSP impacts on average
vehicle delays were contradictory: for some iterations, vehicle delay increased, while for
other iterations, the vehicle delay decreased. Observations on the number of vehicle stops
in the ten simulation iterations were similar. Paired t-tests were conducted to determine
whether the difference between the TSP on and TSP off conditions for any of the MOEs
provided in Table 9-7 was significant at the p=0.05 level. These t-tests concluded that the
TSP implementation did not generate significant changes in average vehicle delay and
number of vehicle stops for local traffic.
9.3.2 Traffic Queue Length
We manually counted the traffic queue lengths from field recorded video tapes.
Because of time constraints, this analysis was conducted on two representative
54
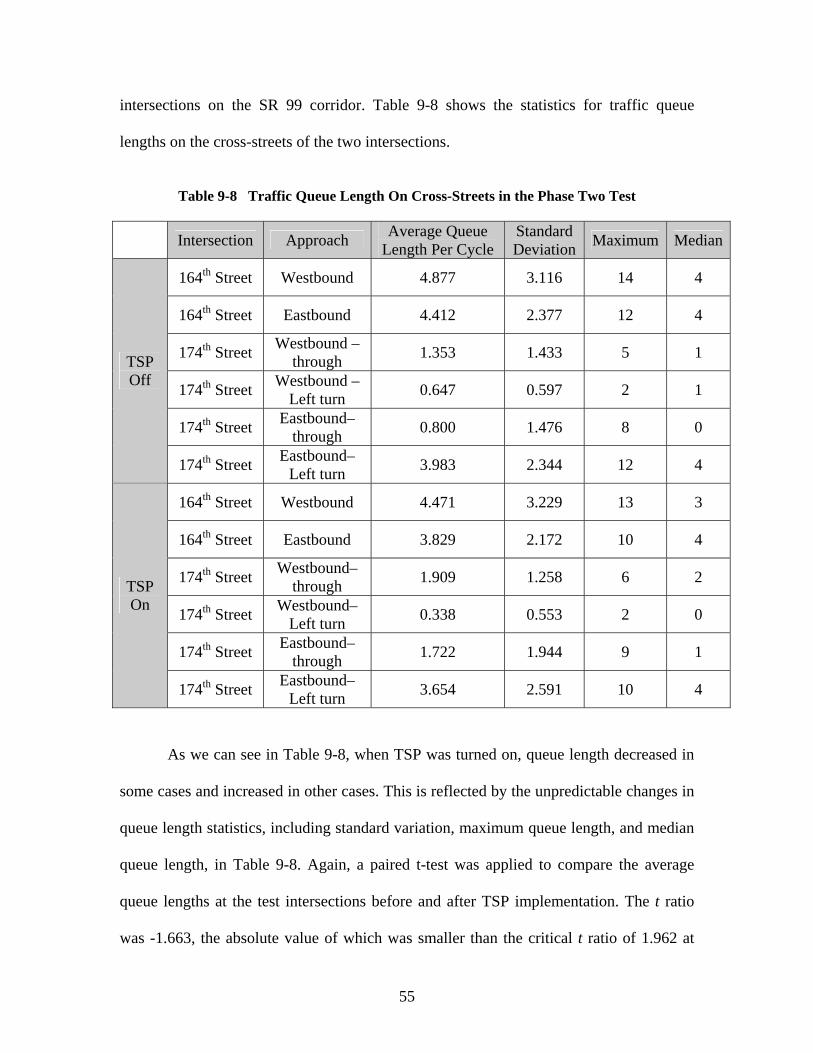
intersections on the SR 99 corridor. Table 9-8 shows the statistics for traffic queue
lengths on the cross-streets of the two intersections.
Table 9-8 Traffic Queue Length On Cross-Streets in the Phase Two Test
Intersection Approach Average Queue Length Per Cycle
Standard Deviation Maximum Median
164th Street Westbound 4.877 3.116 14 4
164th Street Eastbound 4.412 2.377 12 4
174th Street Westbound – through 1.353 1.433 5 1
174th Street Westbound – Left turn 0.647 0.597 2 1
174th Street Eastbound– through 0.800 1.476 8 0
TSP Off
174th Street Eastbound– Left turn 3.983 2.344 12 4
164th Street Westbound 4.471 3.229 13 3
164th Street Eastbound 3.829 2.172 10 4
174th Street Westbound– through 1.909 1.258 6 2
174th Street Westbound– Left turn 0.338 0.553 2 0
174th Street Eastbound– through 1.722 1.944 9 1
TSP On
174th Street Eastbound– Left turn 3.654 2.591 10 4
As we can see in Table 9-8, when TSP was turned on, queue length decreased in
some cases and increased in other cases. This is reflected by the unpredictable changes in
queue length statistics, including standard variation, maximum queue length, and median
queue length, in Table 9-8. Again, a paired t-test was applied to compare the average
queue lengths at the test intersections before and after TSP implementation. The t ratio
was -1.663, the absolute value of which was smaller than the critical t ratio of 1.962 at
55
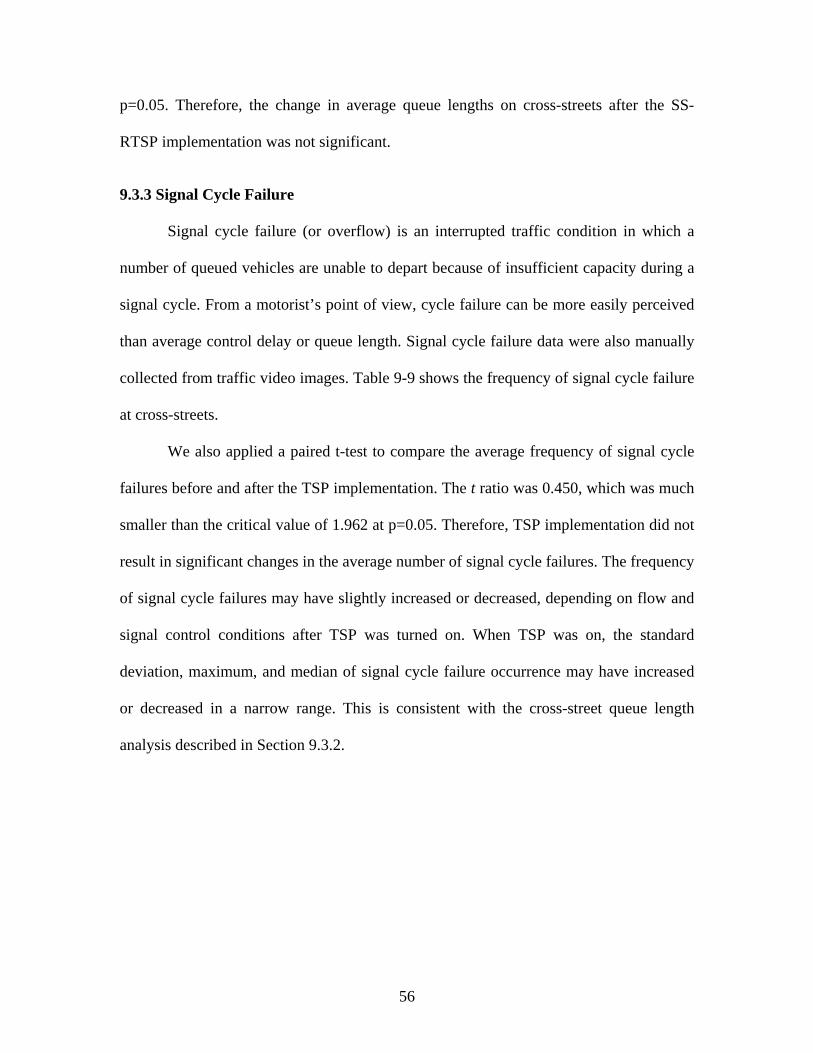
p=0.05. Therefore, the change in average queue lengths on cross-streets after the SS-
RTSP implementation was not significant.
9.3.3 Signal Cycle Failure
Signal cycle failure (or overflow) is an interrupted traffic condition in which a
number of queued vehicles are unable to depart because of insufficient capacity during a
signal cycle. From a motorist’s point of view, cycle failure can be more easily perceived
than average control delay or queue length. Signal cycle failure data were also manually
collected from traffic video images. Table 9-9 shows the frequency of signal cycle failure
at cross-streets.
We also applied a paired t-test to compare the average frequency of signal cycle
failures before and after the TSP implementation. The t ratio was 0.450, which was much
smaller than the critical value of 1.962 at p=0.05. Therefore, TSP implementation did not
result in significant changes in the average number of signal cycle failures. The frequency
of signal cycle failures may have slightly increased or decreased, depending on flow and
signal control conditions after TSP was turned on. When TSP was on, the standard
deviation, maximum, and median of signal cycle failure occurrence may have increased
or decreased in a narrow range. This is consistent with the cross-street queue length
analysis described in Section 9.3.2.
56
Table 9-9 Signal Cycle Failure in the Phase Two Test
Intersection Approach Signal Cycle Failure Per
Cycle
Standard Deviation Maximum
164th Street Westbound 0.0077 0.0877 1
164th Street Eastbound 0.0294 0.2706 3
174th Street Westbound – through 0 0 0
174th Street Westbound – Left turn 0.0588 0.2388 1
174th Street Eastbound– through 0 0 0
TSP Off
174th Street Eastbound– Left turn 0.5000 1.2702 7
164th Street Westbound 0.0643 0.3640 3
164th Street Eastbound 0.0286 0.2667 3
174th Street Westbound– through 0 0 0
174th Street Westbound– Left turn 0.0260 0.2279 2
174th Street Eastbound– through 0 0 0
TSP On
174th Street Eastbound– Left turn 0.5865 1.3034 8
57
CHAPTER 10 SIMULATION-BASED INVESTIGATION OF TSP SYSTEM OPERATION AND OPTIMIZATION
TSP systems have been implemented in many urban areas in the U.S. and are regarded as
one of the most applicable countermeasures against traffic congestion, particularly for
metropolitan areas. Most of the relevant research has concentrated on system
performance evaluations, with few studies emphasizing TSP operation strategies or
system control optimization. This report lays out a series of theoretical and practical
issues regarding TSP system control on the basis of observed field data and
comprehensive analysis. Further research is desirable to improve the current state of the
practice.
Traffic simulation is widely used in transportation engineering fields that include
transportation system design, traffic operations, and management alternative evaluations
because of its cost-effective and risk-free nature. VISSIM was developed to model urban
traffic and public transit operations, and it can simulate and analyze traffic operations
under various test scenarios. In this study, simulation-based investigations of TSP system
operations and control strategy optimization were conducted. By using the real timing
plans provided by the City of Lynnwood, a wide range of simulation scenarios were
designed and tested. Optimal control strategy and parameter settings were explored, and
potential problems were identified. These research findings are of practical importance
for traffic engineers to optimize TSP systems in transportation applications.
10.1 SIMULATION EXPERIMENTAL DESIGN
To fully investigate TSP system performance under various traffic conditions, the
Phase Two test corridor, i.e., the section of Washington SR 99 between 238th Street SW
58
and 164th Street SW in Lynnwood, was selected as the simulation test site because of its
large scale, complex traffic conditions, and diverse control strategies. There were 13
signalized intersections along this test corridor. Semi-actuated control strategies had been
executed to coordinate signal control at these intersections. In our study, three typical
signal plan groups were used to investigate TSP system operations. Each signal plan
group consisted of 13 individual timing plans for the corresponding intersections. These
signal plans included phase structures and timing parameters exported from the
corresponding controllers. An individual VISSIM model was configured for each plan,
including various field-observed traffic volumes, traffic control parameters, and so on.
Because of consistent cycle lengths for all the intersections under the coordinated control
mode, we were able to distinguish these signal groups by using their unique cycle length
as follows: the 120-second signal plan group, the 130-second signal plan group, and 150-
second signal plan group.
In TSP systems there are two important pre-specified control parameters, early
green time and green extension time. In the SS-RTSP system, the early green time and
green extension time were pre-set to 15 seconds. It is widely recognized that these two
parameters have significant impacts on system performance because they indicate the
extent of priority treatment for transit vehicles. Therefore, optimizing these two
parameter settings is important for improving TSP system operation efficiency.
Simulation experiments were conducted with different early green time and green
extension time settings under different time plans. Various MOEs were applied to
quantify their impacts on system performance, including delays, stops, and throughputs
59
for both transit and general vehicles. Six simulation scenarios were established as follows
to fully examine TSP system operations and explore the optimal control strategy settings:
Scenario 1: Fixed early green and green extension times of 15 seconds under 120-
second-cycle signal plan
Scenario 2: Fixed early green and green extension times of 15 seconds under 130-
second-cycle signal plan
Scenario 3: Fixed early green and green extension times of 15 seconds under 150-
second-cycle signal plan
Scenario 4: Various early green and green extension times ranging from 6 to 30 seconds
under 120-second-cycle signal plan
Scenario 5: Various early green and green extension times ranging from 6 to 30 seconds
under 130-second-cycle signal plan
Scenario 6: Various early green and green extension times ranging from 6 to 30 seconds
under 150-second-cycle signal plan.
In VISSIM, traffic generation is manipulated by a random seed number; by
employing different random seeds, simulation results can be changed correspondingly,
but within a certain range. To minimize the randomness of simulation results and enhance
the credibility of simulation models, multiple simulation runs should be conducted. In
this study, 20 simulation runs were conducted for each test scenario; among them were
ten iterations with TSP functions and ten without TSP functions, each with a different
random seed arbitrarily selected. The integrated results from these simulation runs were
considered statistically reliable and unbiased.
60
On the basis of actual traffic conditions and control plans, the VISSIM model was
configured and calibrated. Slight corrections were made to strengthen the model’s
appropriateness to the corresponding applications. Details of simulation model
configuration and calibration are described in Chapter 7. The test period was specified as
three hours. The outputs from the calibrated simulation models, including traffic volumes
and speeds, reasonably matched our field observations. We believe that the simulation
models were reasonably calibrated and did represent the real-world TSP system
operations. Simulation results and discussions are provided in the next section.
10.2 SIMULATION TEST RESULTS AND DISCUSSION
10.2.1 Simulation Test under Scenario 1
In Scenario 1, transit vehicles operated under the 120-second-cycle signal plan,
and 15-second early green and green extension times were used for TSP control
strategies. To facilitate results analysis, several secondary MOEs, including the average
person delay, intersection delays, and intersection stops, were collected for both transit
and general traffic. Table 10-1 shows the average delays and stops for both southbound
and northbound transit vehicles along the corridor. Comparisons between two systems,
one with TSP active and the other without TSP, are illustrated in the table. The same
random seeds were used for corresponding iterations of the two systems. Note that the
delay time for transit vehicles did not include dwell times at transit stops. However, the
acceleration and deceleration delays at a stop remained part of the delay time. From this
table, we can see that significant improvements were achieved in terms of the average
transit vehicle delays and numbers of transit stops at an intersection. The average transit
delay decreased by 15 seconds, and the number of transit stops decreased from 3.74 to
61
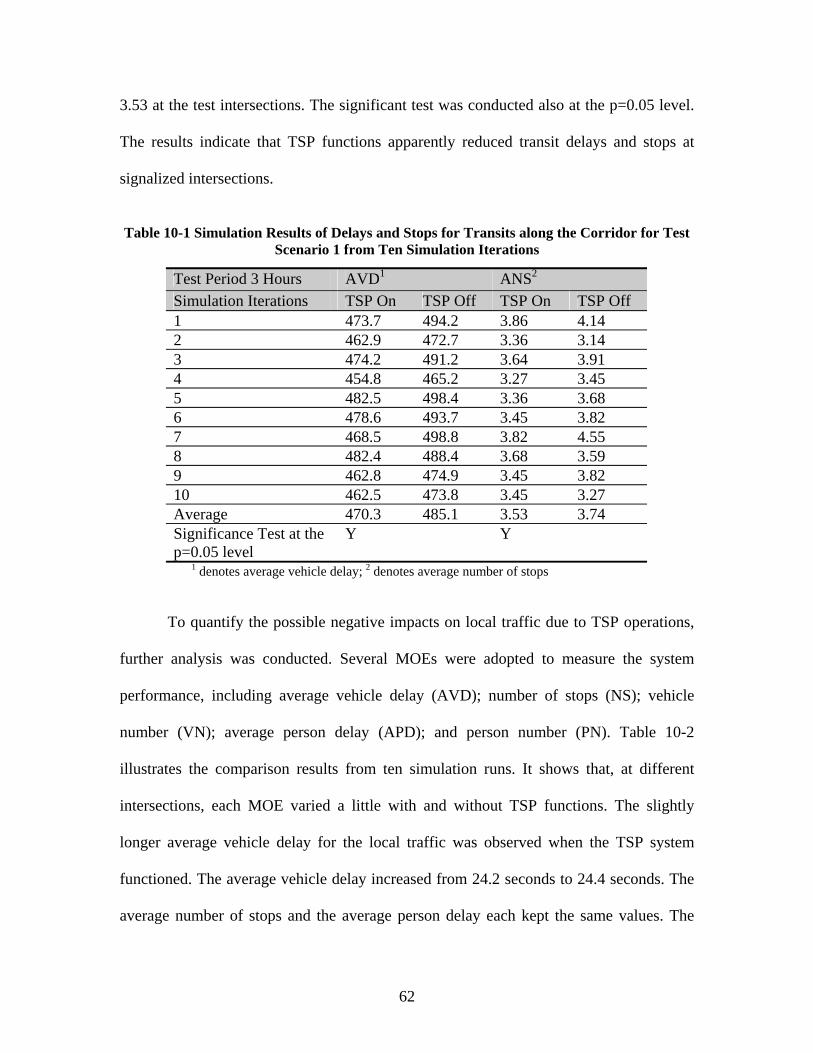
3.53 at the test intersections. The significant test was conducted also at the p=0.05 level.
The results indicate that TSP functions apparently reduced transit delays and stops at
signalized intersections.
Table 10-1 Simulation Results of Delays and Stops for Transits along the Corridor for Test
Scenario 1 from Ten Simulation Iterations
1 denotes average vehicle delay; 2 denotes average number of stops
Test Period 3 Hours AVD1 ANS2 Simulation Iterations TSP On TSP Off TSP On TSP Off 1 473.7 494.2 3.86 4.14 2 462.9 472.7 3.36 3.14 3 474.2 491.2 3.64 3.91 4 454.8 465.2 3.27 3.45 5 482.5 498.4 3.36 3.68 6 478.6 493.7 3.45 3.82 7 468.5 498.8 3.82 4.55 8 482.4 488.4 3.68 3.59 9 462.8 474.9 3.45 3.82 10 462.5 473.8 3.45 3.27 Average 470.3 485.1 3.53 3.74 Significance Test at the p=0.05 level
Y Y
To quantify the possible negative impacts on local traffic due to TSP operations,
further analysis was conducted. Several MOEs were adopted to measure the system
performance, including average vehicle delay (AVD); number of stops (NS); vehicle
number (VN); average person delay (APD); and person number (PN). Table 10-2
illustrates the comparison results from ten simulation runs. It shows that, at different
intersections, each MOE varied a little with and without TSP functions. The slightly
longer average vehicle delay for the local traffic was observed when the TSP system
functioned. The average vehicle delay increased from 24.2 seconds to 24.4 seconds. The
average number of stops and the average person delay each kept the same values. The
62
through-traffic and person number varied slightly by less than 0.02 percent. To further
verify the difference between TSP system on and off, the MOEs were calculated for all
13 intersections. Table 10-3 illustrates the compared results for the entire corridor.
Although the average vehicle delay and the number of stops fluctuated slightly,
they remained at the same level statistically, and there were no significant impacts on
local traffic from the TSP system. Paired t-tests were also conducted to examine the
MOE variations, and the results supported our conclusions: the TSP system does not have
significant impacts on local traffic at the p=0.05 level.
63
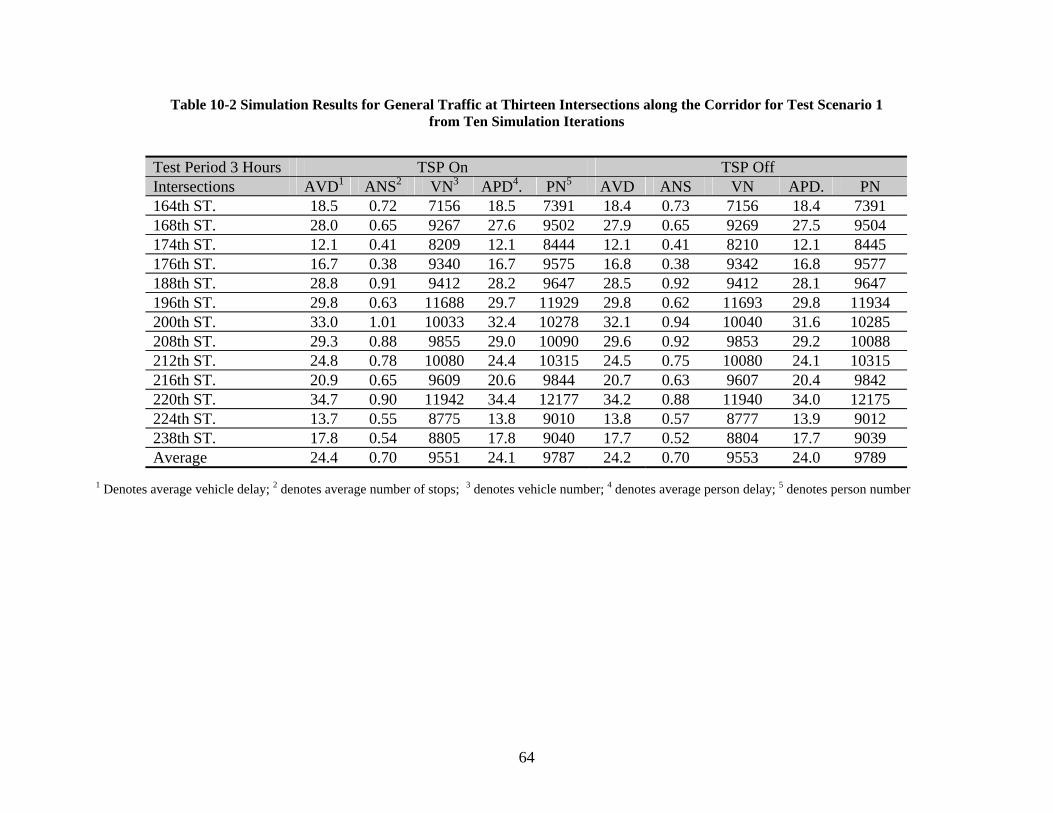
64
Table 10-2 Simulation Results for General Traffic at Thirteen Intersections along the Corridor for Test Scenario 1 from Ten Simulation Iterations
1 Denotes average vehicle delay; 2 denotes average number of stops; 3 denotes vehicle number; 4 denotes average person delay; 5 denotes person number
Test Period 3 Hours TSP On TSP Off Intersections AVD1 ANS2 VN3 APD4. PN5 AVD ANS VN APD. PN 164th ST. 18.5 0.72 7156 18.5 7391 18.4 0.73 7156 18.4 7391 168th ST. 28.0 0.65 9267 27.6 9502 27.9 0.65 9269 27.5 9504 174th ST. 12.1 0.41 8209 12.1 8444 12.1 0.41 8210 12.1 8445 176th ST. 16.7 0.38 9340 16.7 9575 16.8 0.38 9342 16.8 9577 188th ST. 28.8 0.91 9412 28.2 9647 28.5 0.92 9412 28.1 9647 196th ST. 29.8 0.63 11688 29.7 11929 29.8 0.62 11693 29.8 11934 200th ST. 33.0 1.01 10033 32.4 10278 32.1 0.94 10040 31.6 10285 208th ST. 29.3 0.88 9855 29.0 10090 29.6 0.92 9853 29.2 10088 212th ST. 24.8 0.78 10080 24.4 10315 24.5 0.75 10080 24.1 10315 216th ST. 20.9 0.65 9609 20.6 9844 20.7 0.63 9607 20.4 9842 220th ST. 34.7 0.90 11942 34.4 12177 34.2 0.88 11940 34.0 12175 224th ST. 13.7 0.55 8775 13.8 9010 13.8 0.57 8777 13.9 9012 238th ST. 17.8 0.54 8805 17.8 9040 17.7 0.52 8804 17.7 9039 Average 24.4 0.70 9551 24.1 9787 24.2 0.70 9553 24.0 9789

Table 10-3 Compared Results for General Traffic along the Entire Corridor for Test Scenario 1
from Ten Simulation Iterations Test Period 3 Hours AVD1 ANS2 VN3 APD4. PN5 Simulation Scenario
TSP On
TSP Off TSP On TSP Off TSP On TSP Off
TSP On
TSP Off TSP On TSP Off
1 24.5 24.3 0.70 0.69 123725 123697 24.3 24.1 126785 126757 2 24.3 24.0 0.69 0.69 123719 123756 24.0 23.8 126789 126826 3 24.5 24.2 0.71 0.70 124547 124568 24.3 24.0 127617 127638 4 24.4 24.3 0.70 0.70 124983 125070 24.1 24.0 128053 128140 5 24.3 24.2 0.69 0.70 123649 123634 24.1 24.0 126719 126704 6 24.6 24.4 0.71 0.69 123432 123445 24.4 24.2 126492 126505 7 24.3 24.2 0.70 0.70 124451 124462 24.1 24.0 127511 127522 8 24.2 24.1 0.70 0.70 124619 124603 24.0 23.9 127679 127663 9 24.4 24.3 0.70 0.70 123931 123934 24.2 24.1 127001 127004
10 24.1 24.1 0.69 0.69 124638 124656 23.9 23.9 127708 127726 Average 24.4 24.2 0.70 0.70 124169 124183 24.1 24.0 127235 127249
Significance Test at the p=0.05 level N N N N N
1 Denotes average vehicle delay; 2 denotes average number of stops; 3 denotes vehicle number; 4 denotes average person delay; 5 denotes person number
65
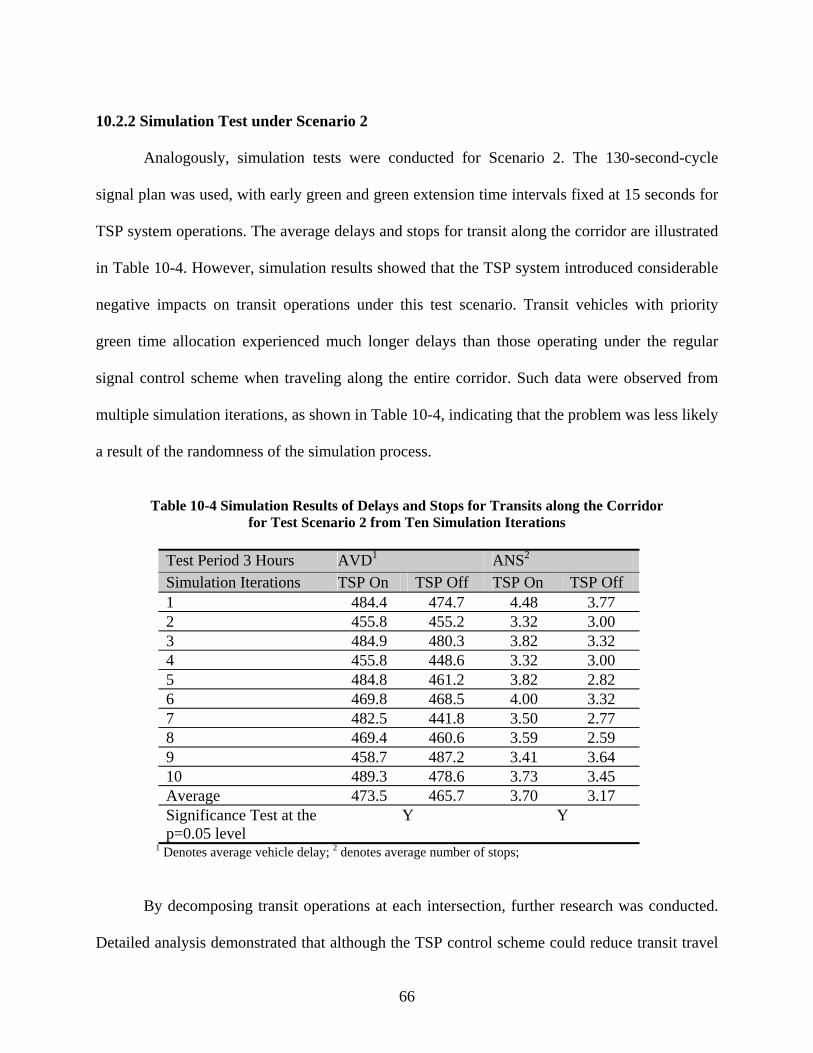
66
10.2.2 Simulation Test under Scenario 2
Analogously, simulation tests were conducted for Scenario 2. The 130-second-cycle
signal plan was used, with early green and green extension time intervals fixed at 15 seconds for
TSP system operations. The average delays and stops for transit along the corridor are illustrated
in Table 10-4. However, simulation results showed that the TSP system introduced considerable
negative impacts on transit operations under this test scenario. Transit vehicles with priority
green time allocation experienced much longer delays than those operating under the regular
signal control scheme when traveling along the entire corridor. Such data were observed from
multiple simulation iterations, as shown in Table 10-4, indicating that the problem was less likely
a result of the randomness of the simulation process.
Table 10-4 Simulation Results of Delays and Stops for Transits along the Corridor
for Test Scenario 2 from Ten Simulation Iterations
Test Period 3 Hours AVD1 ANS2 Simulation Iterations TSP On TSP Off TSP On TSP Off 1 484.4 474.7 4.48 3.77 2 455.8 455.2 3.32 3.00 3 484.9 480.3 3.82 3.32 4 455.8 448.6 3.32 3.00 5 484.8 461.2 3.82 2.82 6 469.8 468.5 4.00 3.32 7 482.5 441.8 3.50 2.77 8 469.4 460.6 3.59 2.59 9 458.7 487.2 3.41 3.64 10 489.3 478.6 3.73 3.45 Average 473.5 465.7 3.70 3.17 Significance Test at the p=0.05 level
Y Y
1 Denotes average vehicle delay; 2 denotes average number of stops;
By decomposing transit operations at each intersection, further research was conducted.
Detailed analysis demonstrated that although the TSP control scheme could reduce transit travel
delays at isolated intersections, it could also lengthen transit travel times along a corridor under
certain signal control conditions because of interrupted progression of traffic flow. For the entire
corridor, signal control plans could be coordinated at each intersection, and disruption to traffic
flow progression could be minimized by setting up a proper offset for each signalized
intersection. However, the TSP system could potentially disrupt signal control coordination by
allocating more green time to transit at upstream intersections, resulting in longer travel delays at
downstream intersections.
Three consecutive intersections were selected to further clarify this issue. Simulation data
including average travel delays and stops for transit were collected from ten simulation runs, as
shown in Table 10-5. Further observations of simulation operations were included for
verification. At the upstream intersection of SR 99 and 196th Street, the early green strategy was
executed, and transit vehicles experienced less delay by starting earlier when the TSP system
was on. When the TSP system was on, the average transit delay was 43.4 seconds, less than the
49.5 seconds of delay without the TSP system. Because of signal coordination, however, transit
arriving during a red signal would have to wait at the next intersection of SR 99 and 200th Street.
Conversely, a transit vehicle operating without the TSP system could pass through this
intersection smoothly by using the green band provided by coordinated signal settings. Thus,
longer delays were observed for transit vehicles when TSP was enabled. Simulation data showed
that the transit delay increased from 19.2 seconds to 22.1 seconds. A similar analysis was
conducted for the next intersection at SR 99 and 208th Street. Severe delays were observed for
transit when the TSP system was on. Although the TSP system could allocate more green time to
transit at some intersections, such time savings might not be sufficient to offset the delay
67
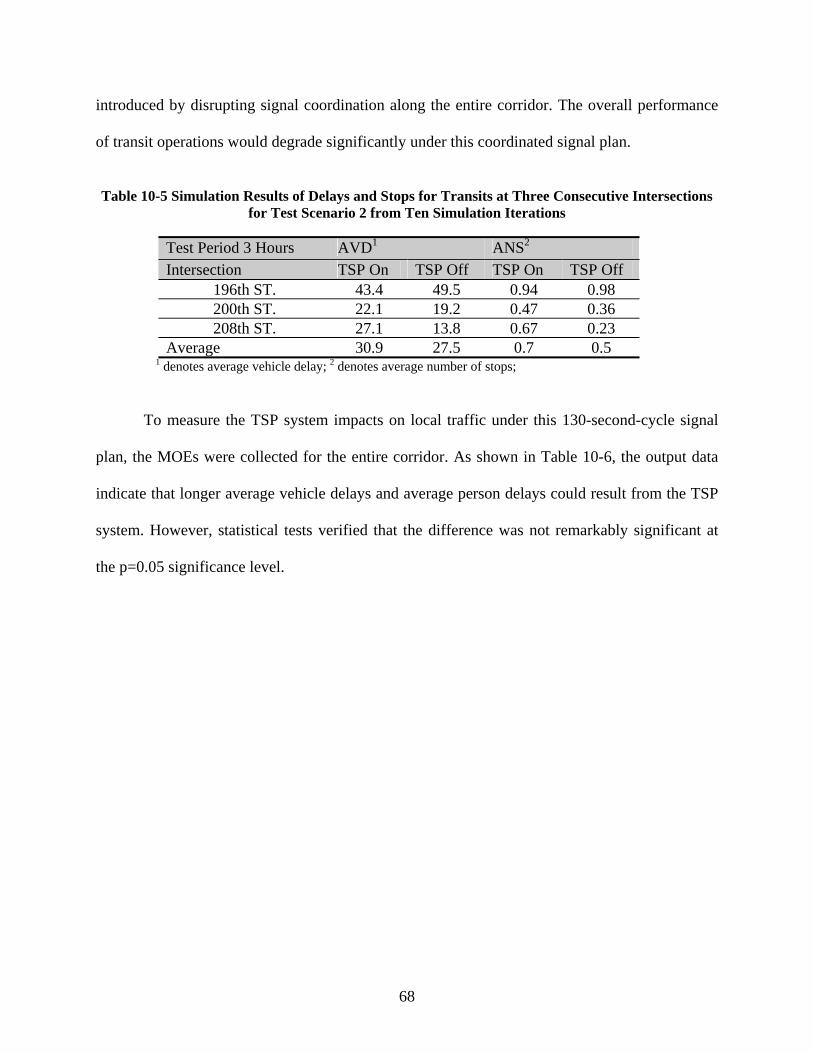
introduced by disrupting signal coordination along the entire corridor. The overall performance
of transit operations would degrade significantly under this coordinated signal plan.
Table 10-5 Simulation Results of Delays and Stops for Transits at Three Consecutive Intersections
for Test Scenario 2 from Ten Simulation Iterations
Test Period 3 Hours AVD1 ANS2 Intersection TSP On TSP Off TSP On TSP Off
196th ST. 43.4 49.5 0.94 0.98 200th ST. 22.1 19.2 0.47 0.36 208th ST. 27.1 13.8 0.67 0.23
Average 30.9 27.5 0.7 0.5 1 denotes average vehicle delay; 2 denotes average number of stops;
To measure the TSP system impacts on local traffic under this 130-second-cycle signal
plan, the MOEs were collected for the entire corridor. As shown in Table 10-6, the output data
indicate that longer average vehicle delays and average person delays could result from the TSP
system. However, statistical tests verified that the difference was not remarkably significant at
the p=0.05 significance level.
68
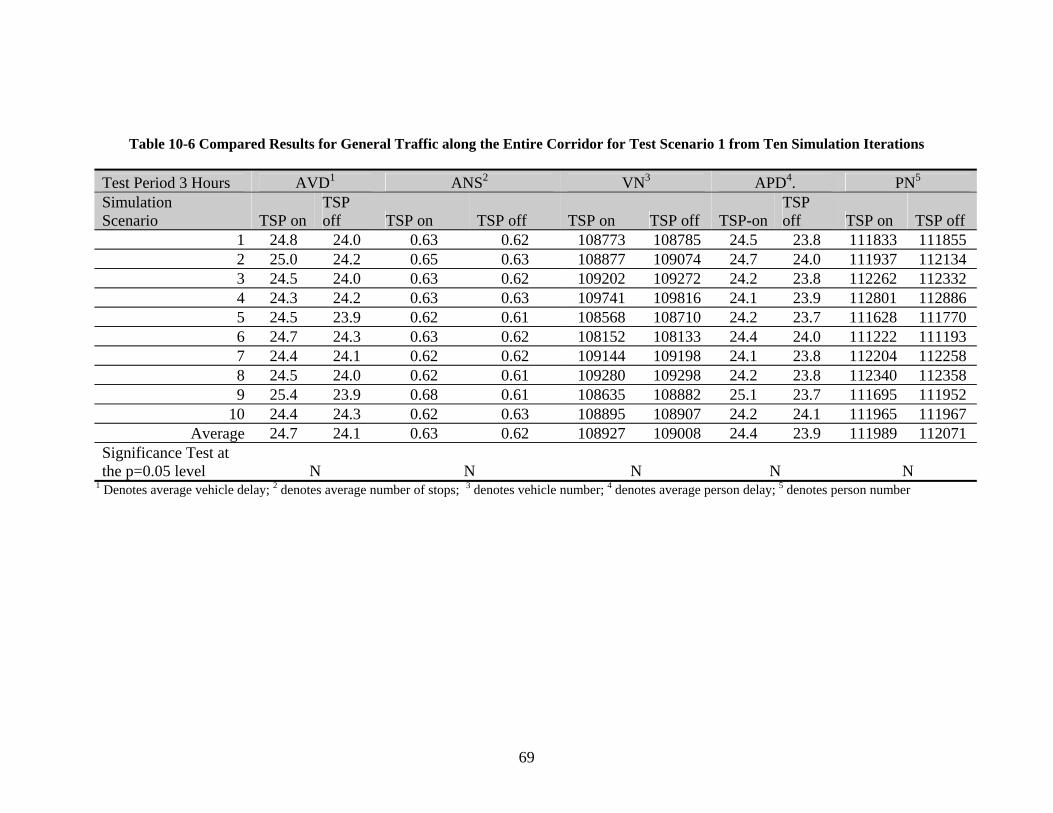
69
Table 10-6 Compared Results for General Traffic along the Entire Corridor for Test Scenario 1 from Ten Simulation Iterations
Test Period 3 Hours AVD1 ANS2 VN3 APD4. PN5 Simulation Scenario TSP on
TSP off TSP on TSP off TSP on TSP off TSP-on
TSP off TSP on TSP off
1 24.8 24.0 0.63 0.62 108773 108785 24.5 23.8 111833 111855 2 25.0 24.2 0.65 0.63 108877 109074 24.7 24.0 111937 112134 3 24.5 24.0 0.63 0.62 109202 109272 24.2 23.8 112262 112332 4 24.3 24.2 0.63 0.63 109741 109816 24.1 23.9 112801 112886 5 24.5 23.9 0.62 0.61 108568 108710 24.2 23.7 111628 111770 6 24.7 24.3 0.63 0.62 108152 108133 24.4 24.0 111222 111193 7 24.4 24.1 0.62 0.62 109144 109198 24.1 23.8 112204 112258 8 24.5 24.0 0.62 0.61 109280 109298 24.2 23.8 112340 112358 9 25.4 23.9 0.68 0.61 108635 108882 25.1 23.7 111695 111952
10 24.4 24.3 0.62 0.63 108895 108907 24.2 24.1 111965 111967 Average 24.7 24.1 0.63 0.62 108927 109008 24.4 23.9 111989 112071
Significance Test at the p=0.05 level N N N N N
1 Denotes average vehicle delay; 2 denotes average number of stops; 3 denotes vehicle number; 4 denotes average person delay; 5 denotes person number
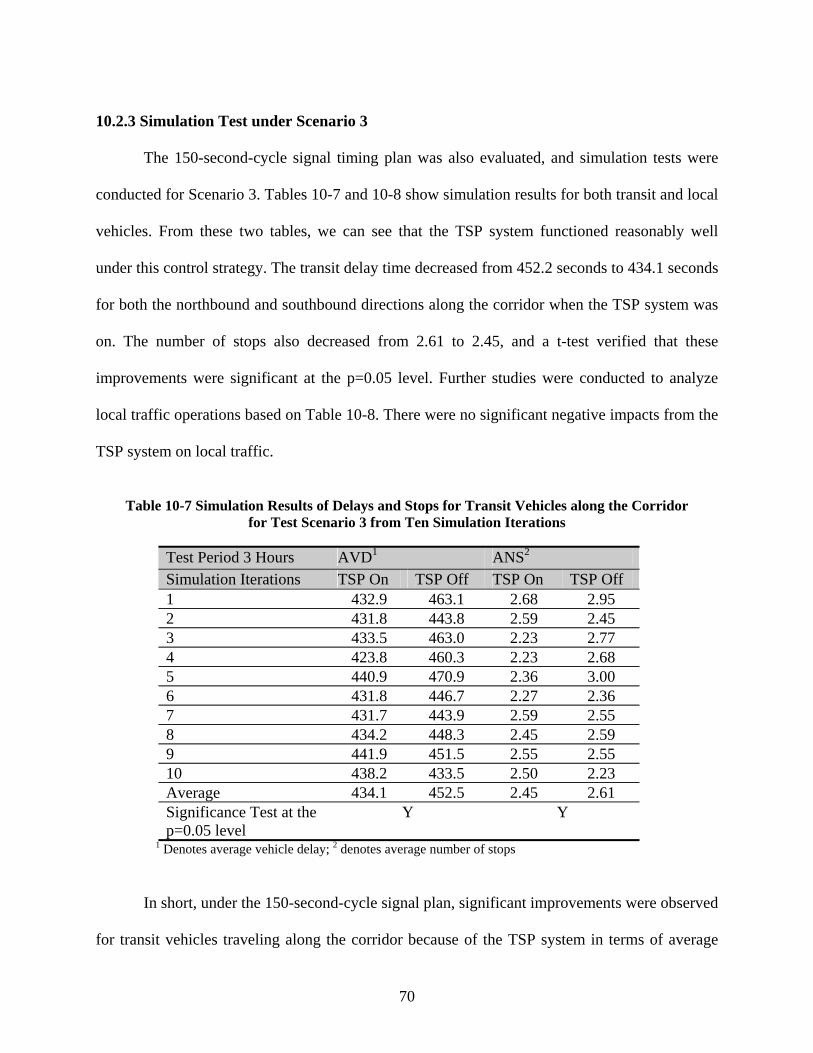
70
10.2.3 Simulation Test under Scenario 3
The 150-second-cycle signal timing plan was also evaluated, and simulation tests were
conducted for Scenario 3. Tables 10-7 and 10-8 show simulation results for both transit and local
vehicles. From these two tables, we can see that the TSP system functioned reasonably well
under this control strategy. The transit delay time decreased from 452.2 seconds to 434.1 seconds
for both the northbound and southbound directions along the corridor when the TSP system was
on. The number of stops also decreased from 2.61 to 2.45, and a t-test verified that these
improvements were significant at the p=0.05 level. Further studies were conducted to analyze
local traffic operations based on Table 10-8. There were no significant negative impacts from the
TSP system on local traffic.
Table 10-7 Simulation Results of Delays and Stops for Transit Vehicles along the Corridor
for Test Scenario 3 from Ten Simulation Iterations
Test Period 3 Hours AVD1 ANS2 Simulation Iterations TSP On TSP Off TSP On TSP Off 1 432.9 463.1 2.68 2.95 2 431.8 443.8 2.59 2.45 3 433.5 463.0 2.23 2.77 4 423.8 460.3 2.23 2.68 5 440.9 470.9 2.36 3.00 6 431.8 446.7 2.27 2.36 7 431.7 443.9 2.59 2.55 8 434.2 448.3 2.45 2.59 9 441.9 451.5 2.55 2.55 10 438.2 433.5 2.50 2.23 Average 434.1 452.5 2.45 2.61 Significance Test at the p=0.05 level
Y Y
1 Denotes average vehicle delay; 2 denotes average number of stops
In short, under the 150-second-cycle signal plan, significant improvements were observed
for transit vehicles traveling along the corridor because of the TSP system in terms of average
delays and stops. Meanwhile, there were no significant negative impacts on local traffic resulting
from the TSP system under this test scenario.
10.2.4 Simulation Test under Scenarios 4, 5, and 6
To quantify the impacts of early green and green extension times on transit and local
traffic operations, simulation experiments were conducted for test scenarios 4, 5, and 6. Various
early green and green extension times were applied to indicate the extent of priority treatment
given to transit vehicles and to further investigate their impacts on the entire system’s operation.
Because a standard NEMA control logic consisting of two rings and two barriers was used for
most signalized intersections along the corridor, and each ring had four sequential phases, an
increment of 3 seconds was specified for both early green and green extension time changes in
this simulation test. The increment time of 3 seconds could be evenly distributed among the other
three phases. Consequently, a wide range of early green and green extension times could be
chosen, from 6 seconds to 30 seconds. By combining these diverse times with the three typical
signal plan groups studied in the previous tests, new simulation tests were conducted.
Tables 10-9, 10-10, and 10-11 show the delays for both transit and general traffic when
the TSP system operated with various early green and green extension times under different
control plans. From Table 10-9 we can see that when more early green and green extension times
were allocated to transit under the 120-second-cycle signal plan, transit vehicles received
obvious benefits. The transit delays were reduced from 480.7 seconds to 448.2 seconds.
Meanwhile, no significantly longer delays were observed for minor street traffic. However,
under the 130-second-cycle signal plan, the transit delays fluctuated in a certain range when
more early green and green extension times were allocated to transit. No consistent patterns were
observed. Also, there were no considerable negative impacts on minor street traffic, although
71
more time was assigned to the major street directions. Similar results were recorded for the 150-
second-cycle signal plan.
To facilitate such comparisons, Figure 10-1 illustrates the delay curves for transit
vehicles under different signal control plans. This visualized curve supports the above analysis
that although more early green time and green extension times were allocated to transit, the time
savings that transit vehicles received were closely associated with the specific signal timing plan.
For example, under the 130-second-cycle and the 150-second-cycle signal control plans, transit
delays fluctuated when early green and green extension times increased. Although more green
time was arranged for transit vehicles, disruptions to flow progression introduced remarkable
delays for transit traveling along the corridor under such coordinated signal plans.
72

73
Table 10-8 Compared Results for General Traffic along the Entire Corridor for Test Scenario 3 from Ten Simulation Iterations
Test Period 3 Hours AVD1 ANS2 VN3 APD4. PN5 Simulation Scenario TSP on
TSP off TSP on TSP off TSP on TSP off TSP on
TSP off TSP on TSP off
1 24.6 24.2 0.55 0.54 97734 97811 24.3 23.9 100804 100871 2 24.5 24.3 0.55 0.55 97311 97340 24.1 24.0 100381 100410 3 24.3 24.1 0.54 0.54 98150 98156 24.0 23.8 101220 101236 4 24.2 24.0 0.55 0.54 98418 98453 23.9 23.7 101498 101533 5 24.6 24.3 0.56 0.55 96636 96663 24.2 24.0 99716 99743 6 24.6 24.4 0.55 0.54 96791 96777 24.2 24.0 99861 99847 7 24.3 24.2 0.55 0.54 97640 97634 23.9 23.9 100710 100704 8 24.5 24.3 0.55 0.54 97946 97998 24.1 23.9 101016 101068 9 24.2 24.0 0.54 0.53 97277 97266 23.8 23.6 100357 100346
10 24.5 24.2 0.55 0.54 97852 97849 24.1 23.9 100932 100929 Total 24.4 24.2 0.55 0.54 97576 97595 24.1 23.9 100650 100669
Significance Test at 95% Confidence N N N N N
1 Denotes average vehicle delay; 2 denotes average number of stops; 3 denotes vehicle number; 4 denotes average person delay; 5 denotes person number

74
Table 10-9 Simulation Results of Delays for Transit and General Traffic with Various Early Green and Green Extension Times under 120-Sec-Cycle Signal Plan from Ten Simulation Iterations
General Traffic (Average Intersection Delay) Test Period
3 Hours Transit (Average Corridor Delay) Minor Street Major Street
Early Green and Green Extension (Second)
TSP On TSP Off
TSP On TSP Off
TSP On TSP Off
6 480.7 485.1 47.8 47.4 17.3 17.4 9 477.8 485.1 48.1 47.4 17.2 17.4 12 472.9 485.1 48.2 47.4 17.2 17.4 15 470.3 485.1 48.3 47.4 17.3 17.4 18 469.8 485.1 48.6 47.4 17.2 17.4 21 464.5 485.1 48.9 47.4 17.3 17.4 24 460.0 485.1 49.0 47.4 17.3 17.4 27 453.7 485.1 49.2 47.4 17.3 17.4 30 448.2 485.1 49.4 47.4 17.4 17.4
Table 10-10 Simulation Results of Delays for Transit and General Traffic with Various Early Green and Green Extension Times under 130-Sec-Cycle Signal Plan
from Ten Simulation Iterations
General Traffic (Average Intersection Delay) Test Period
3 Hours Transit (Average Corridor Delay) Minor Street Major Street
Early Green and Green Extension (Second)
TSP On TSP Off
TSP On TSP Off
TSP On TSP Off
6 462.8 465.7 53.1 52.2 15.7 15.7 9 462.4 465.7 53.6 52.2 15.6 15.7 12 451.5 465.7 53.8 52.2 15.6 15.7 15 473.5 465.7 54.4 52.2 15.8 15.7 18 439.7 465.7 54.5 52.2 15.6 15.7 21 428.3 465.7 54.7 52.2 15.6 15.7 24 435.8 465.7 54.7 52.2 15.8 15.7 27 438.3 465.7 54.8 52.2 15.8 15.7 30 438.7 465.7 54.6 52.2 15.8 15.7
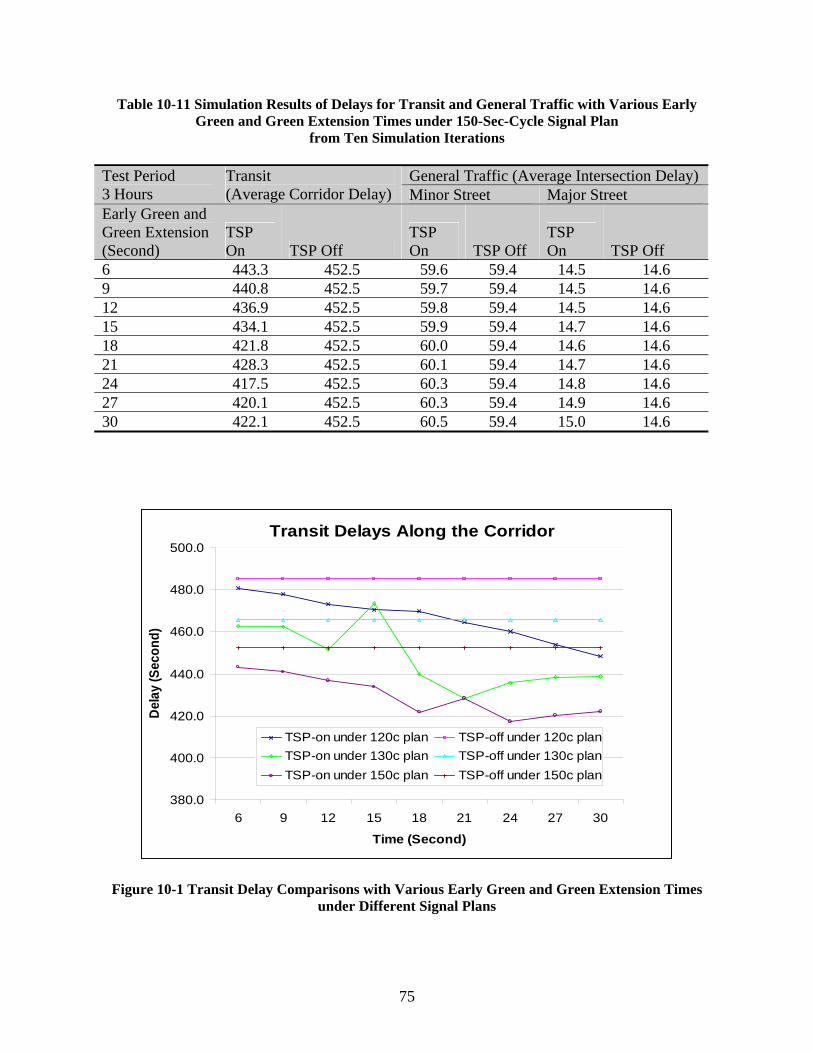
Table 10-11 Simulation Results of Delays for Transit and General Traffic with Various Early Green and Green Extension Times under 150-Sec-Cycle Signal Plan
from Ten Simulation Iterations
General Traffic (Average Intersection Delay) Test Period 3 Hours
Transit (Average Corridor Delay) Minor Street Major Street
Early Green and Green Extension (Second)
TSP On TSP Off
TSP On TSP Off
TSP On TSP Off
6 443.3 452.5 59.6 59.4 14.5 14.6 9 440.8 452.5 59.7 59.4 14.5 14.6 12 436.9 452.5 59.8 59.4 14.5 14.6 15 434.1 452.5 59.9 59.4 14.7 14.6 18 421.8 452.5 60.0 59.4 14.6 14.6 21 428.3 452.5 60.1 59.4 14.7 14.6 24 417.5 452.5 60.3 59.4 14.8 14.6 27 420.1 452.5 60.3 59.4 14.9 14.6 30 422.1 452.5 60.5 59.4 15.0 14.6
Transit Delays Along the Corridor
380.0
400.0
420.0
440.0
460.0
480.0
500.0
6 9 12 15 18 21 24 27 30
Time (Second)
Dela
y (S
econ
d)
TSP-on under 120c plan TSP-off under 120c planTSP-on under 130c plan TSP-off under 130c planTSP-on under 150c plan TSP-off under 150c plan
Figure 10-1 Transit Delay Comparisons with Various Early Green and Green Extension Times under Different Signal Plans
75
10.3 SIMULATION-BASED RESEARCH FINDINGS
In conclusion, to investigate TSP operations under different signal control plans and
diverse priority settings, multiple simulation tests were conducted on the basis of three real
signal plans provided by the City of Lynnwood, including the 120-second-cycle, 130-second-
cycle, and 150-second-cycle signal timing plans. Under the 120-second-cycle and 150-second-
cycle signal plans, remarkable time savings were observed for transit vehicles traveling along the
corridor when the TSP control strategy was implemented with early green and green extension
times of 15 seconds. Meanwhile, negative impacts on general traffic resulting from the TSP
control scheme were not statistically significant at the p=0.05 level.
However, TSP system operations were not beneficial for both transit and general traffic
under the 130-second-cycle signal plan. Although more green time was allocated to transit,
longer travel time was observed for transit traveling along the entire corridor because of severe
disruption of traffic progression. Negative impacts of the TSP system on local traffic were also
observed, although they were not statistically significant. Therefore, we can conclude that the
TSP system can shorten transit’s travel time at some isolated intersections, but it may introduce
interruptions to flow progression and hence cause longer travel time for a corridor with
coordinated signal control. In-depth research is needed to investigate the compatibility between
TSP control strategies and coordinated signal plans prior to implementation.
Further studies were conducted to investigate the impacts of two important parameters,
early green and green extension times, on TSP system operations. A broad range of early green
and green extension times, distributed from 6 seconds to 30 seconds, were tested under these
three typical signal plans. Simulation results indicated that under the 120-second-cycle signal
plan transit achieved noticeable benefits in terms of travel delay and stops with increasing early
green and green extension times. However, under the 130-second-cycle and the 150-second-
76
cycle signal timing plans, transit delays fluctuated to some extent when early green and green
extension times increased, and there was no consistent pattern indicating transit travel time
changes. These data further clarified that the TSP system control scheme must be tuned in
relation to the coordinated signal control plan to maximize overall system performance.
Although the negative impacts of the TSP system on general traffic increased when more early
green and green extension times were used, they were not statistically significant because a
larger number of general vehicles on major streets could benefit from the longer green times
allocated for TSP system operations than vehicles on minor streets.
77
CHAPTER 11 CONCLUSIONS AND RECOMMENDATIONS
11.1 CONCLUSIONS
In this study, the SS-RTSP system was evaluated with field-observed data. Simulation
models were also built and calibrated to compute MOEs that cannot be obtained from field-
observed data. With the simulation models and field observed data, the impacts of the SS-RTSP
system on both transit and local traffic operations were quantitatively evaluated.
Our evaluation results showed that the SS-RTSP system produced remarkable benefits
for transit vehicles, with insignificant negative impacts to local traffic on cross-streets. The
overall impact of the SS-RTSP system on the local traffic of an entire intersection was a minor
net benefit, though it was not statistically significant.
With the SS-RTSP system, transit vehicles can be operated more reliably. The MOE of
Transit Time Match indicated improvements of 1.56 minute, or about 16.3 percent in the Phase
One test, and 15 seconds, or about 6 percent, in the Phase Two test. In the Phase One test, the
mean eastbound corridor travel time of transit vehicles was 6.7 seconds, or 4.9 percent, shorter
for granted trips than the average corridor travel time without TSP. In the Phase Two test, the
average saved transit corridor travel time was 54 seconds, or 4.93 percent. Because of the saved
transit travel time, the SS-RTSP system decreased overall person delay. For all passengers who
used the TSP-enabled intersections, the average person delay was reduced by 0.1 second in the
Phase One test and 0.02 second in the Phase Two test. For Phase One and Phase Two together,
the overall saved personal delay was 56,227 person-hours per year, for peak-hour travel only.
The impact of the SS-RTSP system on local traffic for an entire intersection was to
sometimes increase and sometimes decrease delay, as observed from the simulation experiments.
Paired t-tests on average vehicle delay and number of vehicle stops did not find any significant
78

impacts from the SS-RTSP system at the p=0.05 level. The SS-RTSP system impact on cross-
street traffic was also analyzed. Our test data showed slight changes in vehicle delay, queue
length, and signal cycle failure frequency on cross streets. However, the t tests indicated that
these changes were also not significant at the p=0.05 level after SS-RTSP implementation.
11.2 RECOMMENDATIONS
To improve the performance of the current SS-RTSP system, more transit vehicles could
be enabled for TSP eligibility. The average number of granted TSP trips per day per intersection
was only 16.96 in the Phase One test and 14.40 in the Phase Two test. Given that the negative
impact of the SS-RTSP on local traffic was not significant, more transit trips could be granted
with TSP treatment, and the frequency of TSP requests could be increased to generate more
benefits from the SS-RTSP system.
Simulation-based investigations of TSP system operations and optimization were
conducted. Different coordinated signal control plans were utilized to examine TSP system
performance. The simulation results indicated that under particular coordinated signal control
plans, longer transit travel time along a corridor could be produced by the TSP treatment as a
result of severe disruption of traffic progression. Therefore, for new applications, TSP systems
should be fully evaluated to minimize the potential inconsistency between the TSP control
strategies and the existing signal control coordination along the corridor.
79
ACKNOWLEDGMENTS
The authors are grateful for the financial support to this project from Transportation Northwest
(TransNow), the USDOT University Transportation Center for Federal Region 10, and the
Washington State Department of Transportation (WSDOT). The authors also appreciate help
from Larry Senn from WSDOT; Zohreh Zandi, Marjean Penny, and Connie Allen from
Community Transit (CT); Kevin Tucker and John Tatum from Snohomish County; and Paul
Coffelt and Dick Adams from the City of Lynnwood. Students from the Smart Transportation
Applications and Research Laboratory (STAR Lab) at the University of Washington also
contributed considerably to the data collection, analysis, and report editing tasks for this research
project.
80
REFERENCES
Abdulhai, B., A. Shalaby, and J. Lee, and A. Georgi. ‘Microsimulation modeling and impact assessment of streetcar transit priority options: the Toronto experience’. Pre-print CD-Rom for the 81st Annual Meeting of the Transportation Research Board, Washington D.C. 2002
Al-Sahili, K.A., and Taylor, W.C. ‘Evaluation of bus priority signal strategies in Ann Arbor, Michigan’. Transportation Research Record 1554, Transportation Research Board, Washington, D.C., 74-49. 1996
Baker, R.J., Collura, J., Dale, J.J., Head, L., Hemily, B., Ivanovic, M., Jarzab, J.T., McCormick, D., Obenberger, J., Smith, L., and Stoppenhagen, G.R. ‘An overview of transit signal priority’. Intelligent Transportation Society of America, Washington, D.C., 2002.
Casey F. R. ‘Advanced Public Transportation Systems Deployment in the United States - Year 2000 Update’. Report FTA-MA-26-7007-02.1, DOT-VNTSC-FTA-02-06, Federal Transit Administration, U.S. Department of Transportation. 2002
Chada, S., and Newland, R. ‘Effectiveness of bus signal priority – final report’. Report NCTR-416-04, National Center for Transit Research, University of South Florida, FL. 2002
Chang, E., and A. Ziliaskopoulos. ‘Data challenges in the development of a regional assignment-simulation model to evaluate transit signal priority in Chicago’. Pre-print CD-Rom for the 82nd Annual Meeting of the Transportation Research Board, Washington D.C. 2003
Chang, G.-L., Vasudevan, M., and Su, C.C. ‘Bus preemption under adaptive control environments’. Transportation Research Record 1494, Transportation Research Board, Washington, D.C., 146-154. 1995
Collura, J., Rakha, H., and Guifford, J. ‘Guidelines for the planning and deployment of emergency vehicle preemption and transit priority strategies’. Research Report, Virginia Tech Transportation Institute. 2003
Community Transit. ‘Addendum to Results of Service Quality Monitor On-Board Survey Data: September 2004 – February 2005’. 2005
Dion, F., Rakha, H., and Zhang, Y. ‘Evaluation of potential transit signal priority benefits along a fixed-time signalized arterial’. Preprint CD-ROM, 81st Transportation Research Board Annual Meeting, Washington, D.C. 2002
Garcia-Molina, H., J.D. Ullman, and J. Widom. Database Systems: The Complete Book. Prentice-Hall, Inc. Upper Saddle River, New Jersey, 2002
Garrow, M., and Machemehl, R. ‘Development and evaluation of transit signal priority strategies.’ Research Report SWUTC/97/472840-00068-1, Southwest Region University Transportation Center, Center for Transportation Research, University of Texas, Austin, Texas. 1997
81
82
King County Department of Transportation. ‘An evaluation of transit signal priority on Aurora Avenue north’. King County Department of Transportation, Transit Speed and Reliability Program. 2002
Ludwick, John S. ‘Simulation of an unconditional preemption bus priority system.’ Transportation Research Record 536. Washington, D.C. 1975
McCain Traffic Supply. AVITSP System Operations Manual – Including System Enhancements. 2004
National Transit Database. 2003. ‘Transit profiles all reporting agencies’. Federal Transit Administration. 2004
Ngan, Vikki. ‘A comprehensive strategy for transit signal priority’. Institute of Transportation Engineers, ITE Journal, 73(11), pp. 28~32, 2003
Rakha, Hesham and Yihua Zhang. ‘Sensitivity analysis of transit signal priority impacts on operation of a signalized intersection’. Journal of Transportation Engineering. Vol. 130, no. 6, pp. 796~804, 2004
Snohomish County. 164th Street S.W. Phase 2, Spruce Wang to Ash Way. CRP# RC-1068. Snohomish County. 2003
Sunkari, Srinivasa R. Beasley, Phillip S. Urbanik II, Thomas, and Fambro, Daniel B. ‘Model to evaluate the impacts of bus priority on signalized intersections’. Transportation Research Record 1494. Washington, D.C. 1995
Transportation Research Board. Highway Capacity Manual. National Research Council, Washington D.C., 2000
Transportation Research Board. Transit Capacity and Quality of Serivce Manual (TCRP Report 100). In Transit Cooperative Research Program. Washington, D.C. 2003
VISSIM User’s Manual. Version 4.00. PTV Planung Transport Verkehr AG., Karlsruhe, Germany, June 2004
Yand, M.C. ‘Effective transit signal priority’. Proceedings of 2004 Annual Meeting and Exhibit, Institute of Transportation Engineers. 2004
Zheng, Jianyang, Yinhai Wang, Hongchao Liu, and Mark E. Hallenbeck. (submitted) ‘Modeling the Impact of Near-Side Bus Stop on Transit Delays at Transit Signal Priority Enabled Intersections’, Transportation Research Record. 2006