Comprehensive Annual Financial Report - Washington · State of Washington . Table of Contents ii ....
316
OCTOBER 2015 STATE OF WASHINGTON OFFICE OF FINANCIAL MANAGEMENT Financial Report Comprehensive Annual F OR THE F ISCAL Y EAR E NDED J UNE 30, 2015
Transcript of Comprehensive Annual Financial Report - Washington · State of Washington . Table of Contents ii ....
OCTOBER 2015
STATE OF WASHINGTON
OFFICE OF FINANCIAL MANAGEMENT
Financial ReportComprehensive Annual
FOR THE FISCAL YEAR ENDED JUNE 30, 2015

WASHINGTON STATE OFFICE OF FINANCIAL MANAGEMENT
INSURANCE BUILDING • PO BOX 43113OLYMPIA, WA 98504-3113 • (360) 902-0555 • FAX (360) 664-2832
OCTOBER 2015
Financial ReportComprehensive Annual
FOR THE FISCAL YEAR ENDED JUNE 30, 2015
STATE OF WASHINGTON
OFFICE OF FINANCIAL MANAGEMENT
S t a t e o f W a s h i n g t o n
Report Prepared by
Office of Financial Management David Schumacher, Director
Accounting Division
Wendy Jarrett, Assistant Director
Statewide Accounting Heidi Algiere
Bret Brodersen Don Charlton, CPA
Julie Chiapetta Suzanne Coit, CPA
Cheryl Hainje Lee A. Hall, CPA Sandy McGough
Steve Nielson Sara Rupe
Patricia Sanborn, CPA Michael Schaub
Kim Thompson, CPA Brian Tinney
Anwar Wilson
Additional assistance provided by Office of the State Treasurer Office of the State Actuary Office of the State Auditor
State Investment Board Department of Retirement Systems
Department of Transportation State Health Care Authority University of Washington All state fiscal personnel
S t a t e o f W a s h i n g t o n
Table of Contents
i
Comprehensive Annual Financial Report For the Fiscal Year Ended June 30, 2015
Table of Contents INTRODUCTORY SECTION
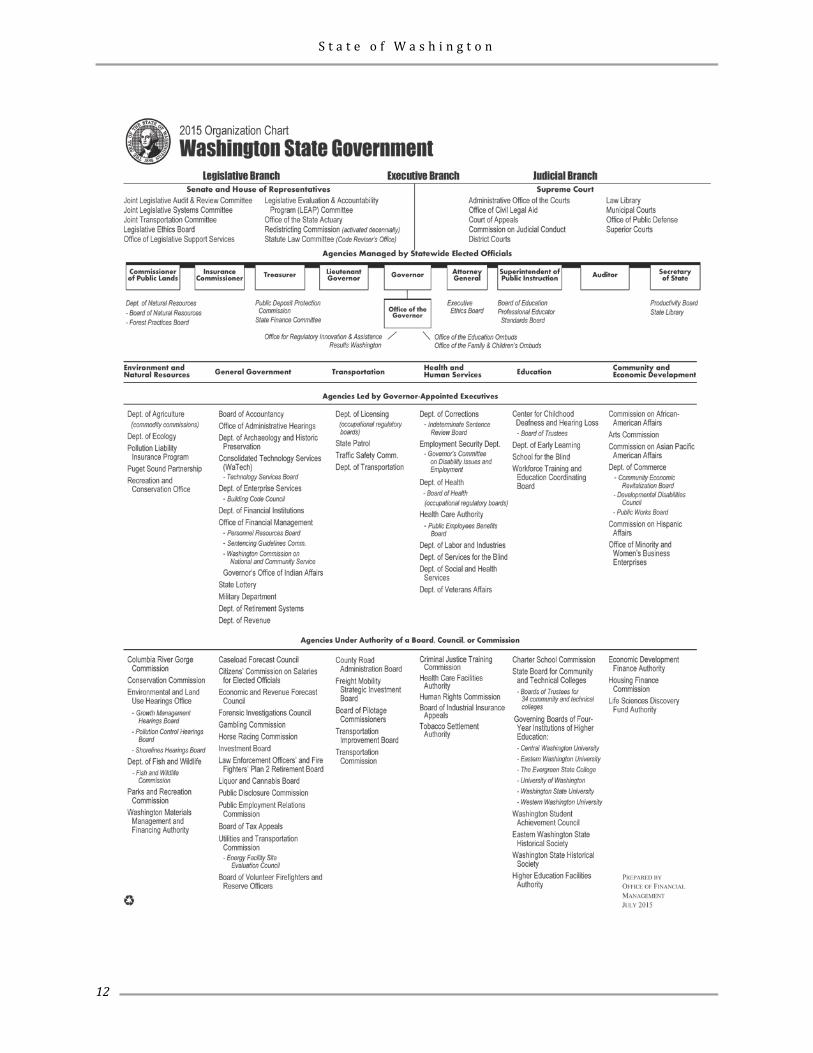
Letter of Transmittal .......................................................................................................................................................... 3 Certificate of Achievement for Excellence in Financial Reporting .......................................................................... 10 Statewide Elected Officials .............................................................................................................................................. 11 State Organization Chart ................................................................................................................................................. 12 FINANCIAL SECTION
Independent Auditor's Report ........................................................................................................................................ 15
Management’s Discussion and Analysis .................................................................................................... 21
Basic Financial Statements
Government-wide Financial Statements Statement of Net Position........................................................................................................................................ 36 Statement of Activities .............................................................................................................................................. 38
Governmental Fund Financial Statements Balance Sheet ............................................................................................................................................................. 42 Reconciliation of the Balance Sheet to the Statement of Net Position ............................................................ 43 Statement of Revenues, Expenditures, and Changes in Fund Balances ........................................................... 44 Reconciliation of the Statement of Revenues, Expenditures, and Changes in Fund Balances to the Statement of Activities ............................................................................................ 45
Proprietary Fund Financial Statements Statement of Net Position........................................................................................................................................ 46 Statement of Revenues, Expenses, and Changes in Net Position ..................................................................... 50 Statement of Cash Flows.......................................................................................................................................... 52
Fiduciary Fund Financial Statements Statement of Net Position........................................................................................................................................ 56 Statement of Changes in Net Position ................................................................................................................... 57
Component Unit Financial Statements Statement of Net Position........................................................................................................................................ 58 Statement of Revenues, Expenses, and Changes in Net Position ..................................................................... 62
Notes to the Financial Statements ................................................................................................................................. 65
S t a t e o f W a s h i n g t o n
Table of Contents
ii
Required Supplementary Information Budgetary Comparison Schedules and Information General Fund ........................................................................................................................................................... 167 General Fund - Budget to GAAP Reconciliation .............................................................................................. 168 Higher Education Special Revenue Fund ............................................................................................................ 169 Higher Education Special Revenue Fund - Budget to GAAP Reconciliation .............................................. 170 Notes to Required Supplementary Information ................................................................................................. 171
Pension Plan Information Single Employer Plans Schedules of Changes in Net Pension Liability and Related Ratios ........................................................... 173 Schedules of Contributions ............................................................................................................................... 176 Notes to Required Supplementary Information ............................................................................................ 178 Cost Sharing Employer Plans Schedules of the State’s Proportionate Share of Net Pension Liability .................................................... 179 Schedules of Contributions .............................................................................................................................. 183 Volunteer Fire Fighters’ and Reserve Officers’ Relief and Pension Fund Schedule of Change in Net Pension Liability ................................................................................................. 184 Schedule of Net Pension Liability .................................................................................................................... 185 Schedule of Contributions ................................................................................................................................. 185 Schedule of Investment Returns ...................................................................................................................... 186 Notes to Required Supplementary Information ............................................................................................ 186 Other Postemployment Benefits Information Schedule of Funding Progress ............................................................................................................................... 186
Infrastructure Assets Reported Using the Modified Approach Condition Assessment ............................................................................................................................................ 187
Other Supplementary Information Combining Financial Statements Governmental Funds Nonmajor Governmental Funds .................................................................................................................................. 193 Combining Balance Sheet - by Fund Type .......................................................................................................... 194 Combining Statement of Revenues, Expenditures, and Changes in Fund Balances - by Fund Type ............................................................................................................................................. 195
Nonmajor Special Revenue Funds ............................................................................................................................... 197 Combining Balance Sheet ...................................................................................................................................... 198 Combining Statement of Revenues, Expenditures, and Changes in Fund Balances .................................... 200 Combining Schedule of Revenues, Expenditures, and Other Financing Sources (Uses) - Budget and Actual ..................................................................................................................................... 202
Nonmajor Debt Service Funds ..................................................................................................................................... 207 Combining Balance Sheet ...................................................................................................................................... 208 Combining Statement of Revenues, Expenditures, and Changes in Fund Balances .................................... 209
S t a t e o f W a s h i n g t o n
Table of Contents
iii
Combining Schedule of Revenues, Expenditures, and Other Financing Sources (Uses) - Budget and Actual ..................................................................................................................................... 210
Nonmajor Capital Projects Funds ................................................................................................................................ 213 Combining Balance Sheet ...................................................................................................................................... 214 Combining Statement of Revenues, Expenditures, and Changes in Fund Balances .................................... 215 Combining Schedule of Revenues, Expenditures, and Other Financing Sources (Uses) - Budget and Actual ..................................................................................................................................... 216
Proprietary Funds Nonmajor Enterprise Funds ......................................................................................................................................... 219 Combining Statement of Net Position ................................................................................................................ 220 Combining Statement of Revenues, Expenses, and Changes in Net Position .............................................. 222 Combining Statement of Cash Flows .................................................................................................................. 223
Internal Service Funds ................................................................................................................................................... 225 Combining Statement of Net Position ................................................................................................................ 226 Combining Statement of Revenues, Expenses, and Changes in Net Position .............................................. 230 Combining Statement of Cash Flows .................................................................................................................. 232
Fiduciary Funds Pension Funds ................................................................................................................................................................. 235 Combining Statement of Plan Net Position ....................................................................................................... 237 Combining Statement of Changes in Plan Net Position ................................................................................... 241
Agency Funds .................................................................................................................................................................. 236 Combining Statement of Assets and Liabilities .................................................................................................. 245 Combining Statement of Changes in Assets and Liabilities ............................................................................. 246
Component Units Nonmajor Component Units ........................................................................................................................................ 249 Combining Statement of Net Position ................................................................................................................ 250 Combining Statement of Revenues, Expenses, and Changes in Net Position .............................................. 251
Individual Fund Schedules Combining Schedules for General Fund Accounts Balance Sheet ........................................................................................................................................................... 254 Schedule of Revenues, Expenditures, and Changes in Fund Balances ........................................................... 255 Schedule of Revenues, Expenditures, and Other Financing Sources (Uses)
- Budget and Actual ..................................................................................................................................... 256
STATISTICAL SECTION
Narrative ........................................................................................................................................................................... 261
Financial Trends Schedule 1 - Net Position by Component ........................................................................................................... 262 Schedule 2 - Changes in Net Position .................................................................................................................. 264 Schedule 3 - Fund Balances, Governmental Funds ........................................................................................... 268
S t a t e o f W a s h i n g t o n
Table of Contents
iv
Schedule 4 - Revenues, Expenditures, and Other Financing Sources (Uses), All Governmental Fund Types .................................................................................................................. 270 Schedule 5 - Revenues, Expenditures, and Other Financing Sources (Uses), General Fund ................................................................................................................................................ 272
Revenue Capacity Schedule 6 - Sales Subject to Retail Sales Tax by Industry ............................................................................... 274 Schedule 7 - Number of Retail Sales Taxpayers by Industry ........................................................................... 276 Schedule 8 - Number of Business and Occupation Taxpayers by Industry .................................................. 277 Schedule 9 - Taxable Sales by Business and Occupation Tax Classification ................................................. 278
Debt Capacity Schedule 10 - Ratios of Outstanding Debt by Type .......................................................................................... 280 Schedule 11 - Legal Debt Margin Information................................................................................................... 282 Schedule 12 - Revenue Bond Coverage ............................................................................................................... 284
Demographic Information Schedule 13 - Personal Income Comparison, Washington State vs. United States ...................................... 285 Schedule 14 - Population and Components of Change, Washington State vs. United States .................... 285 Schedule 15 - Annual Average Civilian Labor Force Unemployment Rates, Washington State vs. United States ................................................................................................................................................. 286 Schedule 16 - Annual Average Wage Rates by Industry ................................................................................... 288 Schedule 17 - Principal Employers by Industry ................................................................................................. 290 Schedule 18 - Fortune 500 Companies Headquartered in Washington ......................................................... 291 Schedule 19 - Principal Agricultural Commodities Value ................................................................................. 291 Schedule 20 - International Trade Facts (All Washington Ports) .................................................................... 292 Schedule 21 - Value of Trade with Major Export Trading Partners ............................................................... 292 Schedule 22 - Value of Trade with Major Import Trading Partners ............................................................... 292 Schedule 23 - Property Value and Construction ................................................................................................ 293 Schedule 24 - Residential Building Activity ......................................................................................................... 293
Operating Information Schedule 25 - Full-Time Equivalent Staff Comparison (Budgeted Funds) ................................................... 294 Schedule 26 - Full-Time Equivalent Staff Comparison (General Fund State) .............................................. 295 Schedule 27 - Operating and Capital Asset Indicators by Function - General Government ..................... 296 Schedule 28 - Operating and Capital Asset Indicators by Function - Human Services............................... 298 Schedule 29 - Operating and Capital Asset Indicators by Function - Transportation ................................. 300 Schedule 30 - Operating and Capital Asset Indicators by Function - Natural Resources and Recreation .............................................................................................................................................. 302 Schedule 31 - Operating and Capital Asset Indicators by Function – Education ........................................ 304

S t a t e o f W a s h i n g t o n
1
INTRODUCTORY SECTION

S t a t e o f W a s h i n g t o n
2
This page intentionally left blank.
3 Letter of Transmittal
STATE OF WASHINGTON
OFFICE OF FINANCIAL MANAGEMENT
Insurance Building, PO Box 43113 Olympia, Washington 98504-3113 (360) 902-0555
October 30, 2015 The Honorable Jay Inslee, Governor Honorable Members of the Legislature Citizens of the State State of Washington Olympia, WA 98504 In accordance with Revised Code of Washington 43.88.027, the Office of Financial Management has prepared this Comprehensive Annual Financial Report (CAFR) of the state of Washington for the fiscal year ended June 30, 2015. Full responsibility for the completeness and reliability of the information contained in this report, based upon a comprehensive framework of internal control established for this purpose, rests with the state. Because the cost of internal control should not exceed anticipated benefits, the objective is to provide reasonable, rather than absolute, assurance that the financial statements are free of any material misstatements. The State Auditor has issued an unmodified (“clean”) opinion on the Washington State financial statements for the fiscal year ended June 30, 2015. The independent auditor’s report is located at the front of the financial section of this report. Management’s Discussion and Analysis (MD&A) immediately follows the independent auditor’s report and provides a narrative introduction, overview and analysis of the basic financial statements. The MD&A complements this letter of transmittal and should be read in conjunction with it. Following the MD&A are the basic financial statements, including the government-wide financial statements, the fund financial statements and the notes to the financial statements. The required supplementary information, combining financial statements, individual fund schedules and the statistical section, complete the CAFR. Profile of Washington State Washington State was created in 1889 by an enabling act of Congress. The state is located on the Pacific Coast, in the northwestern corner of the continental United States, and comprises 71,303 square miles. Its current population is 7.1 million. Washington is famous for its breathtakingly beautiful scenery and sharp contrasts. On the west side of the state, high mountains rise above coastal waters. The forests of the Olympic Peninsula are among the world’s rainiest places. The state’s coastline has hundreds of bays and inlets that make excellent harbors, while in the eastern part, flat semi-desert land stretches for long distances without a single tree.
S t a t e o f W a s h i n g t o n
Letter of Transmittal
4
Washington’s location makes it a gateway for land, sea, and air travel to Alaska and Pacific Rim countries. Ships from all parts of the world dock at Washington ports. Costco Wholesale Corporation, headquartered in Issaquah, operates an international chain of membership warehouses. Microsoft, a global leader in the computer software industry, makes its home in Redmond. Major internet retailer, Amazon.com, and worldwide renowned coffee company, Starbucks, are both headquartered in Seattle. The Weyerhaeuser Company, a major producer of wood and related products, is headquartered in Federal Way. East of the Cascade Mountain range, farmers raise livestock and grow a variety of crops such as wheat, potatoes, and tree fruits. Washington leads the nation in apple and hops production, makes world-class wine, and produces large amounts of lumber, pulp, paper, and other wood products. Western Washington’s mild, moist climate makes that region excellent for dairy farming and the production of flower bulbs.
GOVERNMENTAL STRUCTURE
As established in the State Constitution, Washington State has Executive, Legislative, and Judicial branches of government. The Executive Branch has nine elected officials: the Governor, Lieutenant Governor, Secretary of State, State Treasurer, State Auditor, Attorney General, Superintendent of Public Instruction, Insurance Commissioner, and Commissioner of Public Lands. Thirty-nine agency heads are appointed by, and report to, the Governor. Seventy-eight agency heads report to boards appointed, in whole or in part, by the Governor. The Legislative Branch consists of the Senate (with forty-nine members) and the House of Representatives (with ninety-eight members). The Judicial Branch consists of the State Supreme Court, the highest court in the state, which has nine Justices. Every two years, three Justices are elected for six-year terms. A Chief Justice is chosen from among the most senior Justices. The Judicial Branch also includes the state’s superior courts, justices of the peace, and such inferior courts as the Legislature may provide.
TYPES OF SERVICES PROVIDED AND REPORTING ENTITY
The state provides a wide range of services that include education, transportation, environment and natural resource protection, and social and health services.
The accompanying report includes all funds and subsidiary accounts of the primary government, Washington State as legally defined, as well as its component units. Component units are legally separate entities for which the primary government is financially accountable or ones that have relationships with the state such that exclusion would cause the state’s financial statements to be misleading or incomplete. The determination of “financial accountability” is based on criteria established in Governmental Accounting Standards Board Statements No. 14 and No. 61. Note 1.A to the financial statements explains more fully component units that are included in the reporting entity.
THE BUDGET CYCLE
Washington enacts budgets for a two-year cycle, beginning on July 1 of each odd-numbered year. By law, the Governor must propose a biennial budget in December, the month before the Legislature convenes in regular session. The biennial budget enacted by the Legislature can be modified in any legislative session through changes to the original appropriations. Since the inception of annual legislative sessions in 1979, it has become common for the Legislature to enact
S t a t e o f W a s h i n g t o n
Letter of Transmittal
5
annual revisions to the state’s biennial budget. These revisions are referred to as supplemental budgets.
Operating appropriations are generally made at the fund/account and agency level; however, in a few cases, appropriations are made at the fund/account and agency/program level. Operating appropriations cover either the entire biennium or a single fiscal year within the biennium. Capital appropriations are biennial and are generally made at the fund/account, agency and project level. The legal level of budgetary control is at the fund/account, agency and appropriation level, with administrative controls established at lower levels of detail in certain instances.
Washington State’s Economy and Revenue Outlook Washington’s economy has been a step ahead of the nation’s during this period of recovery. Recent economic performance has narrowed that gap, but Washington should still maintain an advantage during the next biennium. Washington’s jobless rate remained lower than the national rate for much of the past two years. This was unusual: Washington’s rate has traditionally been above the national norm due to the state’s outsized share of seasonal industries. More recent figures show Washington’s jobless rate edging above the national average, likely the result of an increase in workforce participation. In fundamental ways, that is good news as it reflects an increase in workers’ confidence in finding gainful employment. By the end of the next biennium, Washington’s unemployment rate is projected to fall to 5.2 percent, down from the current 5.3 percent. Personal income in Washington is expected to make above-average gains over the next biennium. Real personal income should gain 3.9 percent in fiscal year 2016 and 3.6 percent in fiscal year 2017, slightly higher than projections for the nation. On a per-capita basis, Washington’s real personal income should reach $49,017 at the end of the biennium, more than $3,500 above the U.S. average. These gains in Washington’s personal income will occur notwithstanding declines in aerospace employment, which is expected to fall by 2.9 percent in fiscal year 2016 and 2.6 percent in fiscal year 2017. Though this places a drag on overall nonfarm employment growth, Washington will still net a 2.4 percent increase in total payroll jobs in fiscal year 2016 and a 1.6 percent increase in fiscal year 2017, again slightly better than projections for the nation. Construction activity in Washington is expected to increase at a healthy rate during the 2015–17 biennium. While multi-family construction growth was prompted by demand for rental units in the aftermath of the recession, income gains should renew demand for single-family housing. Building permits should surpass 36,900 in fiscal year 2016 and 41,200 in fiscal year 2017. As a result, construction employment should jump by 4.8 percent and 3.0 percent, respectively. That should boost construction jobs to 5.5 percent of total nonfarm employment, close to historic averages and reflective of a sound housing market. General Fund-State revenues are forecasted to grow at a 10.2 percent rate across the 2015-17 biennium compared to the 9.8 percent gain in the 2013-15 biennium. The expanding economy, accelerated gains in hiring, and recovering housing markets have had a positive effect on revenue growth. Further economic growth and a continued expansion in the housing and commercial building markets should keep revenues growing at a sound pace.
S t a t e o f W a s h i n g t o n
Letter of Transmittal
6
Major Initiatives
Heading into the 2015–17 budget cycle, Washington Governor Jay Inslee and the Legislature faced enormous fiscal challenges. After more than a half decade of cutting vital services, the Governor argued that it was time to start reinvesting in Washington. After spending a record 176 days in session — including three special sessions — the Legislature approved historic spending increases on several fronts. The state’s 2015–17 operating budget includes an additional $1.3 billion to meet the state’s K-12 basic education obligation; makes another large investment in early learning; cuts tuition and expands financial aid for students at public colleges and universities; adds child protective and child welfare service workers; and makes important investments in mental health services. The Legislature approved a $16 billion transportation investment package to address critical statewide maintenance and safety needs, relieve congestion, and improve freight mobility. Lawmakers also approved a $3.9 billion capital budget that will support 21,000 jobs and that includes more than $800 million for school construction and K-3 class-size reduction.
EDUCATION
Under the state Supreme Court’s 2012 McCleary v. State of Washington decision, the state is under court order to meet its constitutional obligation to adequately fund basic education. The state made progress in the 2013–15 budget toward meeting this obligation, but not enough progress to satisfy the court. In September 2014, the court found the state in contempt for failing to produce a long-term basic education funding plan, and threatened sanctions if such a plan was not in place by the end of the 2015 legislative session. To continue meeting the state’s obligations under the McCleary decision, the Governor and the Legislature increased funding for basic education by about $1.3 billion for the 2015–17 biennium. The state’s two-year budget:
• Increased funding to school districts for materials, supplies and operating costs by $741 million.
• Added $350 million to reduce class sizes in kindergarten through third grade, which will then add an estimated 5,000 teachers statewide.
• Included $180 million to fund full-day kindergarten for all students — offering 1,000 hours of instruction a year — one year ahead of schedule. In the 2014-15 school year, fewer than half the state’s kindergartners participate in a state-funded, full-day program.
In July 2015, shortly after the legislative session concluded, the Legislature submitted a progress report to the court. But, again, the court was not satisfied and on August 13, 2015, it imposed penalties totaling $100,000 per day until the Legislature adopts a complete plan for complying with the state’s constitutional obligation.

S t a t e o f W a s h i n g t o n
Letter of Transmittal
7
The 2015–17 biennial budget also invests $95 million in early learning, including $24 million to add 1,600 new spaces in the Early Childhood Education and Assistance Program, the state’s preschool program for children from low-income families. In addition, the budget includes $169 million to shrink tuition at the state’s colleges and universities. Tuition rates for the public colleges and universities have steadily increased since the early 1990s, spiking sharply from 2009 to 2013, the result of the state’s effort to balance the budget during the Great Recession. Tuition for resident undergraduate students at the public baccalaureate colleges and community and technical colleges is cut by 5 percent in the first year of the biennium. In the second year, tuition is reduced by an additional 10 percent at the research institutions, reduced 15 percent at the regional universities, and frozen at the community and technical colleges. HEALTH CARE
Access to health care has increased dramatically in Washington since the 2010 passage of the federal Patient Protection and Affordable Care Act (ACA), which gave Washingtonians the unprecedented opportunity to choose affordable, high-quality health insurance coverage. More than 170,000 people have been enrolled for private insurance through the state’s health insurance exchange, the Washington Healthplanfinder. Washington also opted to expand its Medicaid program under the ACA, providing coverage to more than 534,000 newly eligible adults. As a result, during a six-month span, the percentage of Washington residents without health insurance fell from 16 percent to 6 percent. Besides improving access to health care, the state has undertaken a number of initiatives to drive down costs and improve the health of its citizens. For example, the state’s Plan for a Healthier Washington will transform health care so people experience better health during their lives by receiving better care when they need it and finding care that is more affordable and accessible. As part of this effort, the state is integrating mental health and substance abuse treatment with primary medical care. And, under legislation passed in 2014, the state is implementing an all-payer claims database that will significantly improve the transparency of health care costs and quality, which will help purchasers and patients make more informed health care choices. The Governor also launched his Healthiest Next Generation initiative, a public-private partnership that will develop strategies to ensure healthy weight in children through such actions as promoting breastfeeding, supporting child care providers and schools by providing more nutritious meal and drink options, and encouraging children to be more active. The initiative also supports youth substance use prevention and education efforts such as regulating e-cigarettes. The Governor convened an Aging Summit to help the state prepare for the needs of an aging population. The summit generated a number of policy recommendations, such as the need for key investments in long-term care and nursing homes. The summit also resulted in a joint legislative and executive branch committee, as well as legislation to implement the Community First Choice Option and to develop an Alzheimer’s Disease Plan for Washington State.
S t a t e o f W a s h i n g t o n
Letter of Transmittal
8
TRANSPORTATION
The Governor and the Legislature this year adopted the largest transportation revenue package in state history to provide jobs, safety and critically needed traffic relief. It’s estimated that this $16 billion state investment, coupled with its $15 billion authorization for Sound Transit light rail expansion, will support more than 200,000 family-wage jobs across our state. More than $1.4 billion is provided for maintenance, operations and preservation to fix bridges and promote safety. And $1 billion is earmarked for clean transportation elements that help relieve traffic congestion and reduce emissions, including bicycle and pedestrian projects, vanpools, fish culverts and transit. Further funding is provided for important road projects; ferry operations, vessels and terminals; freight and rail projects; the Washington State Patrol; and local transportation improvements. The package also provides incentives for electric vehicle sales, use of alternative fuels in commercial vehicles and commute trip reduction credits.
RESULTS WASHINGTON
Washington is fast becoming a national leader in adapting proven private-sector principles to state government. Governor Inslee’s innovative Results Washington initiative, launched in 2013, brings together multi-agency teams around dozens of complex goals in education, the economy, the environment, health and safety and effective government. By focusing on measurable results, enterprise-wide strategies and grassroots innovation, state government and its partners are building a healthier, better-educated and more prosperous Washington. Lean is a management philosophy that has proven highly effective at driving customer-focused improvements in health care, aerospace, retail and other industry sectors. Lean principles are increasingly being put to use in the public sector. Lean stresses cycles of continuous improvement led by front-line staff closest to the work. Problem solving and solutions using Lean principles address root causes, rather than treatment of symptoms. A key tenet of this effort is transparency and accountability. Governor Inslee meets monthly with teams of state agency directors to discuss progress, challenges and next steps. These meetings are streamed live over the Internet and posted online. Goals, improvement strategies and metrics are also posted online at www.results.wa.gov. ENVIRONMENT AND ENERGY
Governor Inslee continues to engage lawmakers in a bipartisan discussion on how to tackle the issue of carbon pollution, a cornerstone of his agenda. In April 2014, he signed Executive Order 14-04 – “Washington Carbon Pollution Reduction and Clean Energy Action.” A key component of the executive order was the creation of the Carbon Emission Reduction Taskforce (CERT) to give recommendations on the design and implementation of a carbon emission limits and market mechanisms program for Washington. The CERT completed its work in November 2014. Governor Inslee introduced legislation in January 2015 that would have established a carbon market (cap and trade) program. Program revenue would have helped pay for education and transportation programs as well as to mitigate potential impacts to low-income communities and energy-intensive businesses. This legislation received several hearings but ultimately did not pass in the Legislature.
S t a t e o f W a s h i n g t o n
Letter of Transmittal
9
At the urging of the Governor, the budget included $40.4 million for programs to support research institutions, utilities and businesses as they develop, demonstrate and deploy new renewable, clean-energy and energy-efficiency programs. The sum of $25 million was provided for grants to state agencies, school districts, universities and local governments to improve the energy efficiency of public facilities and street lighting, and to install solar energy systems to cut energy demand and costs. Washington is experiencing rapid changes in how crude oil is moving through rail corridors and over its waters, which creates rising safety and environmental risks. As petroleum shipments from Alaska decline, transport of crude oil from the Bakken region via rail is increasing. To address these risks, Governor Inslee introduced legislation (House Bill 1449), later signed into law, that expands the state oil spill tax to oil transported by rail. The law also strengthens oil spill contingency planning requirements. Awards and Acknowledgements The Government Finance Officers Association (GFOA) awarded a Certificate of Achievement for Excellence in Financial Reporting to Washington State for its CAFR for the fiscal year ended June 30, 2014. The Certificate of Achievement is a prestigious national award, recognizing conformance with the highest standards for preparation of state and local government financial reports. To be awarded a Certificate of Achievement, a governmental unit must publish an easily readable and efficiently organized CAFR, with contents conforming to program standards. Such reports must satisfy both generally accepted accounting principles and applicable legal requirements. A Certificate of Achievement is valid for a period of one year only. Washington State has received a Certificate of Achievement for the past 28 years. The Office of Financial Management considers this report to be in conformity with the Certificate of Achievement Program requirements, and will submit it to the GFOA. The preparation of this report could not have been accomplished without the professionalism and dedication demonstrated by the financial and management personnel of each state agency and the Office of Financial Management. This CAFR reflects the Governor’s commitment to the Legislature, the citizens of Washington State, and the financial community to maintain financial statements in conformance with the highest standards of financial accountability. Sincerely,
David Schumacher Director
S t a t e o f W a s h i n g t o n
10

S t a t e o f W a s h i n g t o n
11
Statewide Elected Officials As of June 30, 2015
Governor Jay Inslee Lieutenant Governor
Brad Owen Secretary of State Kim Wyman
Treasurer Jim McIntire Acting State Auditor
Jan Jutte Attorney General Bob Ferguson
Superintendent of Public Instruction
Randy Dorn
Commissioner of Public Lands
Peter J. Goldmark
Insurance Commissioner
Mike Kreidler
S t a t e o f W a s h i n g t o n
12

S t a t e o f W a s h i n g t o n
13
FINANCIAL SECTION

S t a t e o f W a s h i n g t o n
14
This page intentionally left blank.
INDEPENDENT AUDITOR’S REPORT ON FINANCIAL STATEMENTS
October 30, 2015
The Honorable Jay Inslee
Governor, State of Washington
REPORT ON THE FINANCIAL STATEMENTS
We have audited the accompanying financial statements of the governmental activities, the business-type
activities, each major fund and the aggregate discretely presented component units and remaining fund
information of the State of Washington, as of and for the year ended June 30, 2015, and the related notes
to the financial statements, which collectively comprise the State’s basic financial statements as listed in
the table of contents.
Management’s Responsibility for the Financial Statements
Management is responsible for the preparation and fair presentation of these financial statements in
accordance with accounting principles generally accepted in the United States of America; this includes
the design, implementation, and maintenance of internal control relevant to the preparation and fair
presentation of financial statements that are free from material misstatement, whether due to fraud or
error.
Auditor’s Responsibility
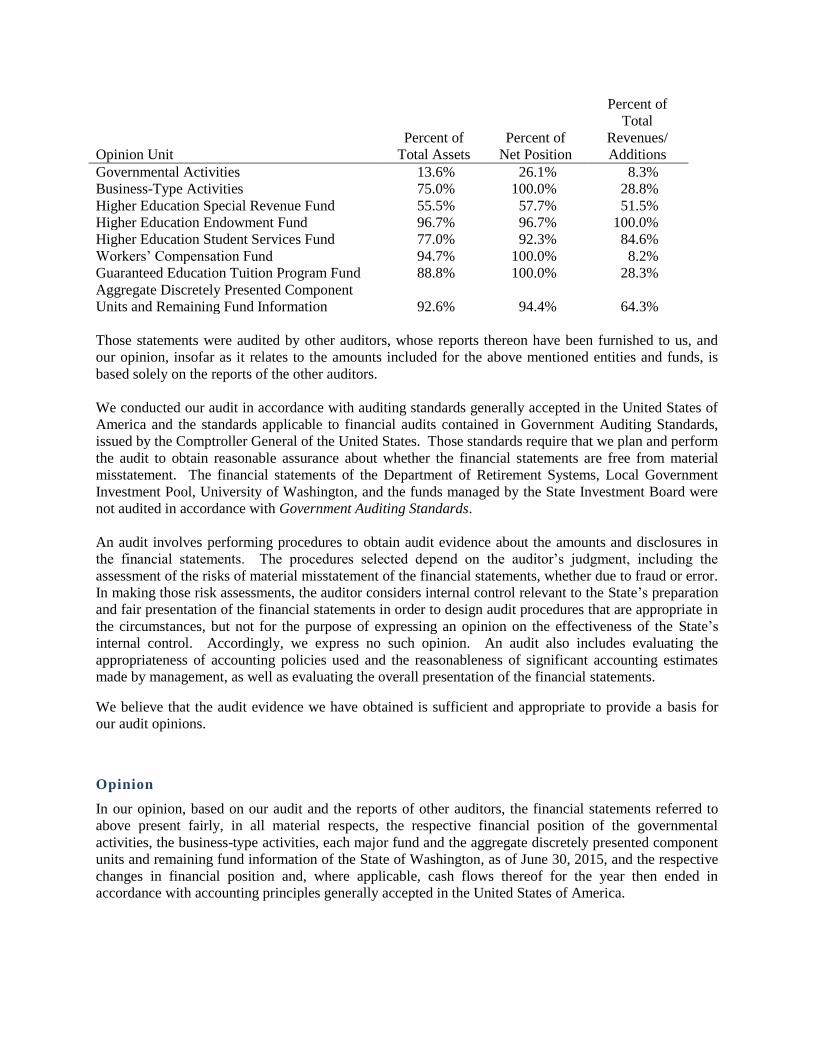
Our responsibility is to express opinions on these financial statements based on our audit. We did not
audit the financial statements of the Department of Retirement Systems, Local Government Investment
Pool, University of Washington, and the funds managed by the State Investment Board. Those financial
statements represent part or all of the total assets, net position, and revenues or additions of the
governmental activities, the business-type activities, each major fund, and the aggregate discretely
presented component units and remaining fund information as follows:
Washington State Auditor’s Office
Opinion Unit
Percent of
Total Assets
Percent of
Net Position
Percent of
Total
Revenues/
Additions
Governmental Activities 13.6% 26.1% 8.3%
Business-Type Activities 75.0% 100.0% 28.8%
Higher Education Special Revenue Fund 55.5% 57.7% 51.5%
Higher Education Endowment Fund 96.7% 96.7% 100.0%
Higher Education Student Services Fund 77.0% 92.3% 84.6%
Workers’ Compensation Fund
Guaranteed Education Tuition Program Fund
94.7%
88.8%
100.0%
100.0%
8.2%
28.3%
Aggregate Discretely Presented Component
Units and Remaining Fund Information 92.6% 94.4% 64.3%
Those statements were audited by other auditors, whose reports thereon have been furnished to us, and
our opinion, insofar as it relates to the amounts included for the above mentioned entities and funds, is
based solely on the reports of the other auditors.
We conducted our audit in accordance with auditing standards generally accepted in the United States of
America and the standards applicable to financial audits contained in Government Auditing Standards,
issued by the Comptroller General of the United States. Those standards require that we plan and perform
the audit to obtain reasonable assurance about whether the financial statements are free from material
misstatement. The financial statements of the Department of Retirement Systems, Local Government
Investment Pool, University of Washington, and the funds managed by the State Investment Board were
not audited in accordance with Government Auditing Standards.
An audit involves performing procedures to obtain audit evidence about the amounts and disclosures in
the financial statements. The procedures selected depend on the auditor’s judgment, including the
assessment of the risks of material misstatement of the financial statements, whether due to fraud or error.
In making those risk assessments, the auditor considers internal control relevant to the State’s preparation
and fair presentation of the financial statements in order to design audit procedures that are appropriate in
the circumstances, but not for the purpose of expressing an opinion on the effectiveness of the State’s
internal control. Accordingly, we express no such opinion. An audit also includes evaluating the
appropriateness of accounting policies used and the reasonableness of significant accounting estimates
made by management, as well as evaluating the overall presentation of the financial statements.
We believe that the audit evidence we have obtained is sufficient and appropriate to provide a basis for
our audit opinions.
Opinion
In our opinion, based on our audit and the reports of other auditors, the financial statements referred to
above present fairly, in all material respects, the respective financial position of the governmental
activities, the business-type activities, each major fund and the aggregate discretely presented component
units and remaining fund information of the State of Washington, as of June 30, 2015, and the respective
changes in financial position and, where applicable, cash flows thereof for the year then ended in
accordance with accounting principles generally accepted in the United States of America.
Matters of Emphasis
As explained in Note 1.D.1, the financial statements include pension trust fund investments valued at
$32.06 billion, which comprise 28.2 percent of total assets and 30.6 percent of net position of the
aggregate discretely presented component units and remaining fund information. The fair values of these
investments have been estimated by management in the absence of readily determinable fair values.
Management's estimates are based on information provided by the fund managers or, in the case of
investments in partnerships, the general partners. Our opinion was not modified with respect to this
matter.
As described in Note 2, during the year ended June 30, 2015, the State has implemented the
Governmental Accounting Standards Board Statement No. 68, Accounting and Financial Reporting for
Pensions – an amendment of GASB Statement No. 27. Our opinion is not modified with respect to this
matter.
Other Matters
Required Supplementary Information
Accounting principles generally accepted in the United States of America require that the management’s
discussion and analysis, budgetary comparison schedules and information, pension plan information,
other postemployment benefits information and infrastructure assets reported using the modified approach
be presented to supplement the basic financial statements. Such information, although not a part of the
basic financial statements, is required by the Governmental Accounting Standards Board who considers it
to be an essential part of financial reporting for placing the basic financial statements in an appropriate
operational, economic or historical context. We and the other auditors have applied certain limited
procedures to the required supplementary information in accordance with auditing standards generally
accepted in the United States of America, which consisted of inquiries of management about the methods
of preparing the information and comparing the information for consistency with management’s
responses to our inquiries, the basic financial statements, and other knowledge we obtained during our
audit of the basic financial statements. We do not express an opinion or provide any assurance on the
information because the limited procedures do not provide us with sufficient evidence to express an
opinion or provide any assurance.
Supplementary and Other Information
Our audit was conducted for the purpose of forming opinions on the financial statements that collectively
comprise the State’s basic financial statements. The accompanying information listed as combining
financial statements and individual fund schedules is presented for purposes of additional analysis and is
not a required part of the basic financial statements. Such information is the responsibility of
management and was derived from and relates directly to the underlying accounting and other records
used to prepare the financial statements. This information has been subjected to auditing procedures
applied in the audit of the basic financial statements and certain additional procedures, including
comparing and reconciling such information directly to the underlying accounting and other records used
to prepare the financial statements or to the financial statements themselves, and other additional
procedures in accordance with auditing standards generally accepted in the United States of America by
us and other auditors. In our opinion, based on our audit, the procedures performed as described above,
and the reports of other auditors, the information is fairly stated, in all material respects, in relation to the
basic financial statements taken as a whole.
The information identified in the table of contents as the introductory and statistical sections is presented
for purposes of additional analysis and is not a required part of the basic financial statements of the State.
Such information has not been subjected to the auditing procedures applied in the audit of the basic
financial statements and, accordingly, we do not express an opinion or provide any assurance on it.
OTHER REPORTING REQUIRED BY GOVERNMENT AUDITING STANDARDS
In accordance with Government Auditing Standards, we will also issue our report dated October 30, 2015,
on our consideration of the State’s internal control over financial reporting and on our tests of its
compliance with certain provisions of laws, regulations, contracts and grant agreements and other matters.
That report will be issued under separate cover in the State’s Single Audit Report. The purpose of that
report is to describe the scope of our testing of internal control over financial reporting and compliance
and the results of that testing, and not to provide an opinion on internal control over financial reporting or
on compliance. That report is an integral part of an audit performed in accordance with Government
Auditing Standards in considering the State’s internal control over financial reporting and compliance.
Sincerely,
JAN M. JUTTE, CPA, CGFM
ACTING STATE AUDITOR
OLYMPIA, WA
S t a t e o f W a s h i n g t o n
Management’s Discussion and Analysis
19
MD&A Management’s Discussion and Analysis

S t a t e o f W a s h i n g t o n
Management’s Discussion and Analysis
20
This page intentionally left blank.
S t a t e o f W a s h i n g t o n
Management’s Discussion and Analysis
21
MD&A Management’s Discussion & Analysis As managers of the state of Washington, we offer this narrative overview and analysis of the financial activities for the fiscal year ended June 30, 2015. We present this information in conjunction with the information included in our letter of transmittal, which can be found preceding this narrative, and with the state’s financial statements, which follow. All amounts, unless otherwise indicated, are expressed in thousands of dollars. Financial Highlights • Total assets and deferred outflows of the state of
Washington exceeded its liabilities and deferred inflows by $20.60 billion (reported as net position). Of this amount, $(12.89) billion was reported as "unrestricted net position." A negative balance indicates that no funds were available for discretionary purposes.
• The state of Washington’s governmental funds reported a combined ending fund balance of $14.70 billion, an increase of 2.4 percent compared with the prior year as restated.
• The state implemented Statement No. 68 of the Governmental Accounting Standards Board (GASB) Accounting and Financial Reporting for Pensions for fiscal year 2015 financial reporting which resulted in a decrease in the beginning balance of net position of $3.04 billion in Governmental Activities and a decrease of $474.2 million for Business-Type Activities.
• The state’s capital assets increased by $1.39 billion, total bond debt increased by $670.1 million, and the state’s net investment in capital assets is $20.93 billion.
Overview of the Financial Statements This discussion and analysis is intended to serve as an introduction to the state of Washington’s basic financial statements, which include three components: 1) government-wide financial statements, 2) fund financial statements, and 3) notes to the financial statements. The focus is on both the state as a whole (government-wide) and the major individual funds. The dual perspectives allow the reader to address relevant questions, broaden a basis for comparison (year-to-year or government-to-government), and enhance the state’s accountability.
GOVERNMENT-WIDE FINANCIAL STATEMENTS The government-wide financial statements are designed to provide readers with a broad overview of the state of Washington’s finances, in a manner similar to a private sector business. Statement of Net Position. The Statement of Net Position presents information on all of the state of Washington’s assets, deferred outflows of resources, liabilities, and deferred inflows of resources with the difference reported as net position. Over time, increases or decreases in net position may serve as a useful indicator of whether the financial position of the state of Washington is improving or deteriorating. Statement of Activities. The Statement of Activities presents information showing how the state’s net position changed during the most recent fiscal year. All changes in net position are reported as soon as the underlying event giving rise to the change occurs, regardless of the timing of related cash flows. Thus, revenues and expenses are reported in this statement for some items that will result in cash flows in future fiscal periods (e.g., uncollected taxes and earned but unused vacation leave). The Statement of Activities is focused on both the gross and net cost of various activities (including governmental, business-type, and component unit). This is intended to summarize and simplify the reader’s analysis of the revenues and costs of various state activities and the degree to which activities are subsidized by general revenues. Both of these government-wide financial statements distinguish functions of the state of Washington that are principally supported by taxes and intergovernmental revenues (governmental activities) from other functions that are intended to recover all or a significant portion of their costs through user fees and charges (business-type activities). The governmental activities of the state of Washington include education, human services, transportation, natural resources, adult corrections, and general government. The business-type activities of the state of Washington include the workers’ compensation and unemployment compensation programs, as well as Washington’s lottery, the Guaranteed Education Tuition Program (GET), and various higher education student services such as housing and dining. The government-wide financial statements can be found on pages 36-39 of this report.
S t a t e o f W a s h i n g t o n
Management’s Discussion and Analysis
22
FUND FINANCIAL STATEMENTS A fund is a group of related accounts used to maintain control over resources that are segregated for specific activities or objectives. The state of Washington, like other state and local governments, uses fund accounting to ensure and demonstrate compliance with finance-related legal requirements. All of the funds of the state can be divided into three categories: governmental funds, proprietary funds, and fiduciary funds. Governmental Funds. Governmental funds are used to account for essentially the same functions reported as governmental activities in the government-wide financial statements. However, unlike the government-wide financial statements, governmental fund financial statements focus on near-term inflows and outflows of spendable resources, as well as on fund balances at the end of the fiscal year. Such information may be useful in evaluating a government’s near-term financing requirements. In particular, unassigned fund balance may serve as a useful measure of a government’s net resources available for spending at the end of the fiscal year. Because the focus of governmental funds is narrower than that of the government-wide financial statements, it is useful to compare the information presented for governmental funds with similar information presented for governmental activities in the government-wide financial statements. By doing so, readers may better understand the long-term impact of the government’s near-term financing decisions. Both the governmental fund balance sheet and the governmental fund statement of revenues, expenditures, and changes in fund balances provide a reconciliation to facilitate this comparison between governmental funds and governmental activities. Information is presented separately in the governmental fund balance sheet and in the governmental fund statement of revenues, expenditures, and changes in fund balances for three major funds and an aggregate total for all nonmajor funds. The state’s major governmental funds are the General Fund, Higher Education Special Revenue Fund, and the Higher Education Endowment Fund. Individual fund data for the state’s nonmajor governmental funds are provided in the form of combining statements elsewhere in this report. The governmental fund financial statements can be found on pages 42-45 of this report. Proprietary Funds. The state of Washington maintains two different types of proprietary funds. Enterprise funds are used to report the same functions presented as business-type activities in the government-wide financial statements. Internal service funds represent an accounting device used to accumulate and allocate costs internally among the state of Washington’s various functions. The
state of Washington uses internal service funds to account for general services such as motor pool, central stores, data processing services, risk management, employee health insurance, and printing services. Because internal service funds predominately benefit governmental rather than business-type functions, they have been included within governmental activities in the government-wide financial statements. Proprietary fund financial statements provide the same type of information as the government-wide financial statements, but in greater detail. The proprietary fund financial statements provide separate information for the Workers’ Compensation Fund, Unemployment Compensation Fund, the Higher Education Student Services Fund, and the Guaranteed Education Tuition Program Fund, which are considered to be major funds, as well as an aggregated total for all nonmajor enterprise funds. The internal service funds are combined for presentation purposes. Individual fund data for the state’s nonmajor proprietary funds are provided in the form of combining statements elsewhere in this report. The proprietary fund financial statements can be found on pages 46-55 of this report. Fiduciary Funds. Fiduciary funds are used to account for resources held for the benefit of parties outside the government. Fiduciary funds are not reflected in the government-wide financial statements because the resources of those funds are not available to support the state of Washington’s own programs. Washington’s fiduciary funds include state administered pension plans. The accounting used for fiduciary funds is much like that used for proprietary funds. Individual fund data for the state’s fiduciary funds are provided in the form of combining statements elsewhere in this report. The fiduciary fund financial statements can be found on pages 56-57 of this report. Component Units. Component units that are legally separate from the state and primarily serve or benefit those outside the state are discretely presented. They are either financially accountable to the state, or have relationships with the state such that exclusion would cause the state’s financial statements to be misleading or incomplete. The state discretely reports four major component units, the Valley Medical Center, Northwest Hospital, the Washington State Public Stadium Authority and the Health Benefit Exchange, as well as four nonmajor component units. Refer to Note 1 on pages 67-68 for more detailed information. Individual fund data for the state’s nonmajor component units are provided in the form of combining statements elsewhere in this report. The component unit financial statements can be found on pages 58-63 of this report.
S t a t e o f W a s h i n g t o n
Management’s Discussion and Analysis
23
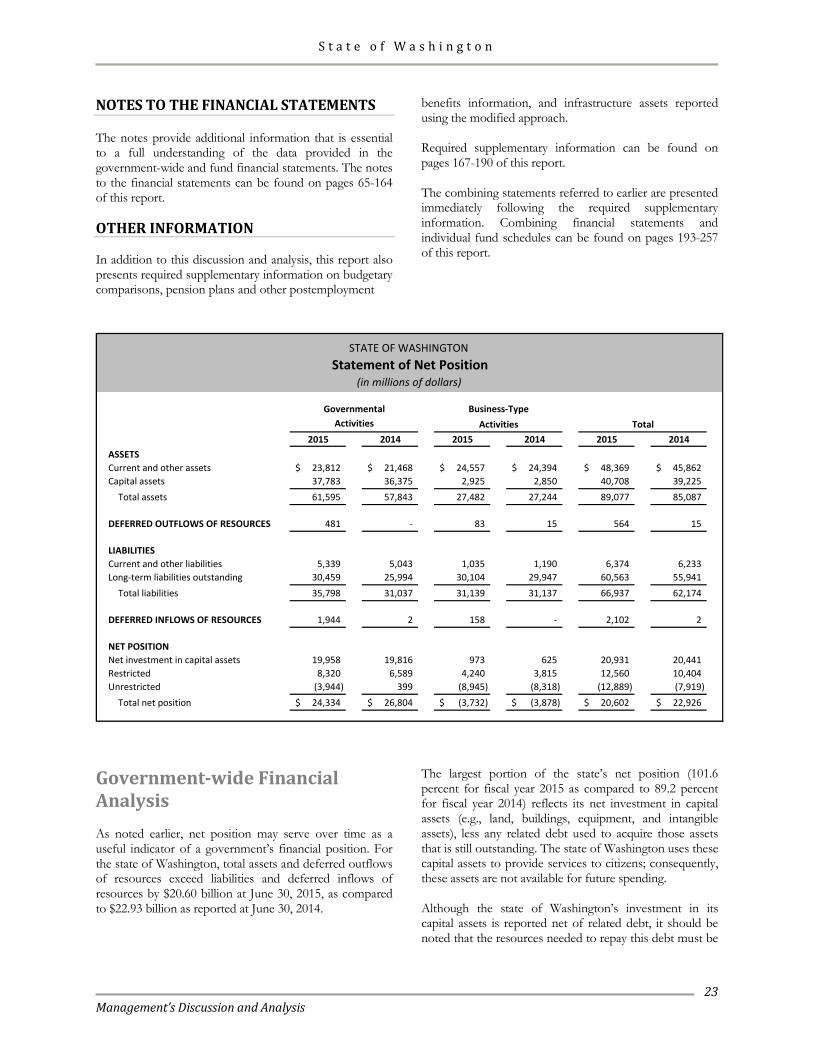
NOTES TO THE FINANCIAL STATEMENTS The notes provide additional information that is essential to a full understanding of the data provided in the government-wide and fund financial statements. The notes to the financial statements can be found on pages 65-164 of this report. OTHER INFORMATION In addition to this discussion and analysis, this report also presents required supplementary information on budgetary comparisons, pension plans and other postemployment
benefits information, and infrastructure assets reported using the modified approach. Required supplementary information can be found on pages 167-190 of this report. The combining statements referred to earlier are presented immediately following the required supplementary information. Combining financial statements and individual fund schedules can be found on pages 193-257 of this report.
Activities2015 2014 2015 2014 2015 2014
ASSETSCurrent and other assets 23,812$ 21,468$ 24,557$ 24,394$ 48,369$ 45,862$ Capital assets 37,783 36,375 2,925 2,850 40,708 39,225
Total assets 61,595 57,843 27,482 27,244 89,077 85,087
DEFERRED OUTFLOWS OF RESOURCES 481 - 83 15 564 15
LIABILITIESCurrent and other liabilities 5,339 5,043 1,035 1,190 6,374 6,233 Long-term liabilities outstanding 30,459 25,994 30,104 29,947 60,563 55,941
Total liabilities 35,798 31,037 31,139 31,137 66,937 62,174
DEFERRED INFLOWS OF RESOURCES 1,944 2 158 - 2,102 2
NET POSITIONNet investment in capital assets 19,958 19,816 973 625 20,931 20,441 Restricted 8,320 6,589 4,240 3,815 12,560 10,404 Unrestricted (3,944) 399 (8,945) (8,318) (12,889) (7,919)
Total net position 24,334$ 26,804$ (3,732)$ (3,878)$ 20,602$ 22,926$
STATE OF WASHINGTON Statement of Net Position
(in millions of dollars)
Activities TotalGovernmental Business-Type
Government-wide Financial Analysis As noted earlier, net position may serve over time as a useful indicator of a government’s financial position. For the state of Washington, total assets and deferred outflows of resources exceed liabilities and deferred inflows of resources by $20.60 billion at June 30, 2015, as compared to $22.93 billion as reported at June 30, 2014.
The largest portion of the state’s net position (101.6 percent for fiscal year 2015 as compared to 89.2 percent for fiscal year 2014) reflects its net investment in capital assets (e.g., land, buildings, equipment, and intangible assets), less any related debt used to acquire those assets that is still outstanding. The state of Washington uses these capital assets to provide services to citizens; consequently, these assets are not available for future spending. Although the state of Washington’s investment in its capital assets is reported net of related debt, it should be noted that the resources needed to repay this debt must be
S t a t e o f W a s h i n g t o n
Management’s Discussion and Analysis
24
provided from other sources, since the capital assets themselves cannot be used to liquidate these liabilities. A portion of the state of Washington’s net position (61.0 percent for fiscal year 2015 as compared to 45.4 percent for fiscal year 2014) represents resources that are subject to external restrictions on how they may be used. The remaining balance of $(12.89) billion represents unrestricted net position. The state’s overall negative balance in unrestricted net position is largely due to deficits in business-type activities. In governmental activities, net position decreased from $26.80 billion in fiscal year 2014 to $24.33 billion in fiscal year 2015. Beginning balance adjustments accounted for $2.14 billion of the decrease in net position. These include the implementation of GASB Statement No. 68 and offsetting adjustments to correct prior accounting practices. The remaining decrease of $327.9 million reflects increases in expenses that outpaced the increases in revenues.
In business-type activities, the deficit is caused by the workers’ compensation program that provides time-loss, medical, disability, and pension payments to qualifying individuals who sustain work-related injuries or develop occupational diseases as a result of their required work activities. The main benefit plans of the workers’ compensation program are funded on rates that will keep the plans solvent in accordance with recognized actuarial principles. The supplemental pension cost-of-living adjustments (COLAs) granted for time-loss and disability payments, however, are funded on a pay-as-you-go basis. By statute, the state is only allowed to collect enough revenue to fund the current COLA payments. As previously mentioned, the state’s activities are divided between governmental and business-type. The majority of support for governmental activities comes from taxes and intergovernmental grants, while business-type activities are supported primarily through user charges.
S t a t e o f W a s h i n g t o n
Management’s Discussion and Analysis
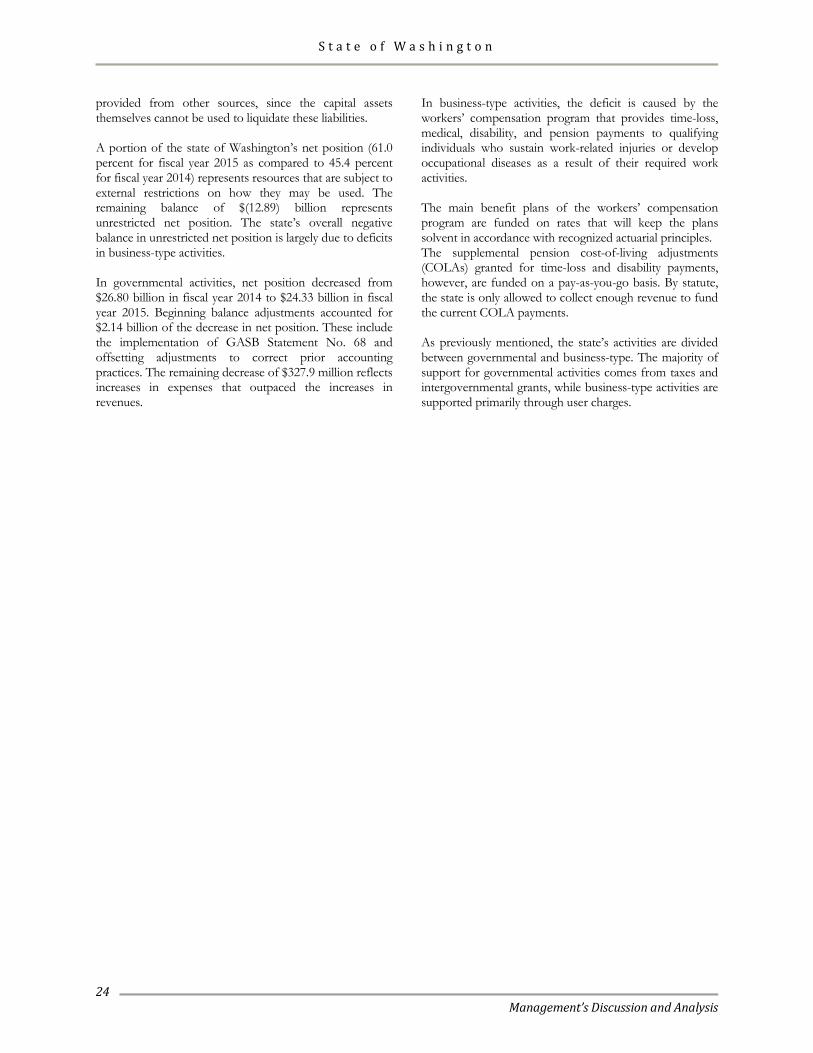
25
2015 2014 2015 2014 2015 2014REVENUESProgram revenues:
Charges for services 5,985$ 5,850$ 6,631$ 6,416$ 12,616$ 12,266$ Operating grants and contributions 15,158 13,240 77 326 15,235 13,566 Capital grants and contributions 867 1,066 - - 867 1,066
General revenues:Taxes 18,132 17,849 20 22 18,152 17,871 Interest and investment earnings (loss) 307 621 377 1,618 684 2,239 Total revenues 40,449 38,626 7,105 8,382 47,554 47,008
EXPENSESGeneral government (1,987) (1,607) - - (1,987) (1,607) Education - K-12 (9,426) (8,914) - - (9,426) (8,914) Education - Higher education (7,095) (6,910) - - (7,095) (6,910) Human services (16,890) (15,052) - - (16,890) (15,052) Adult corrections (956) (911) - - (956) (911) Natural resources and recreation (1,335) (1,137) - - (1,335) (1,137) Transportation (2,309) (2,400) - - (2,309) (2,400) Interest on long-term debt (981) (938) - - (981) (938) Workers' compensation - - (3,018) (3,142) (3,018) (3,142) Unemployment compensation - - (968) (1,380) (968) (1,380) Higher education student services - - (2,314) (2,080) (2,314) (2,080) Washington's lottery - - (466) (463) (466) (463) Guaranteed education tuition program - - 585 (185) 585 (185) Other business-type activities - - (158) (133) (158) (133)
Total expenses (40,979) (37,869) (6,339) (7,383) (47,318) (45,252)
Excess (deficiency) of revenues over expenses before contributionsto endowments and transfers (530) 757 766 999 236 1,756
Contributions to endowments 66 66 - - 66 66 Transfers 136 94 (136) (94) - - Increase (decrease) in net position (328) 917 630 905 302 1,822 Net position - July 1, as restated 24,662 25,887 (4,362) (4,783) 20,300 21,104 Net position - June 30 24,334$ 26,804$ (3,732)$ (3,878)$ 20,602$ 22,926$
STATE OF WASHINGTON Changes in Net Position
(in millions of dollars)
TotalGovernmental
ActivitiesBusiness-Type
Activities
S t a t e o f W a s h i n g t o n
Management’s Discussion and Analysis
26
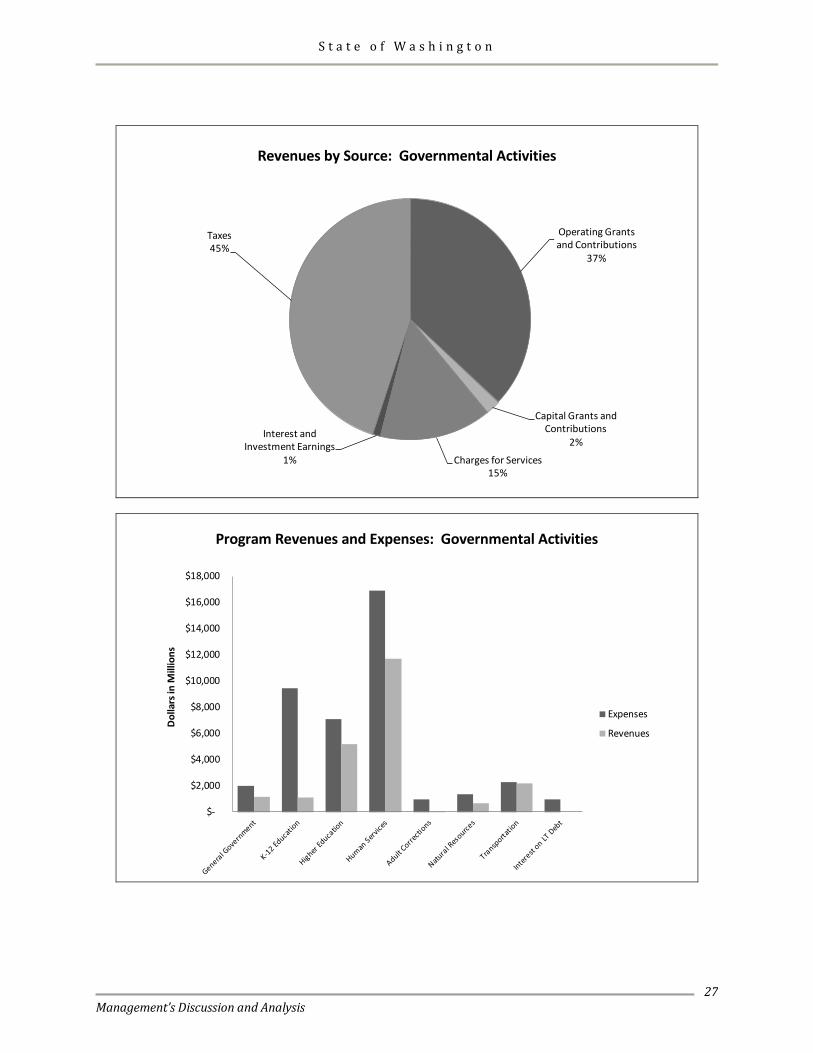
Governmental Activities. Governmental activities resulted in a decrease in the state of Washington’s net position of $327.9 million. A number of factors were in play including increases in both spending on K-12 education and tax revenues. • Expenses grew by $511.9 million for K-12 education in
2015 as compared to fiscal year 2014. The state is working to meet the requirements of the state Supreme Court’s 2012 McCleary ruling to meet its constitutional duty to fund basic education.
• Tax revenues increased by $282.7 million in fiscal year 2015 as compared to fiscal year 2014 reflecting positive growth in the economy. Sales and use taxes reported an increase of $636.1 million. Sales and use taxes are the main tax revenue for governmental activities. Real estate excise tax revenue increased by $209.9 million. Real estate excise taxes are levied on the sale of real estate. These tax revenue increases reflect the rebounding economy, recovering housing markets, and improving employment picture in Washington.
• Sales of recreational marijuana generated $64.9 million
in new excise tax in 2015. • Tuition and fee revenues at higher education
institutions held steady in fiscal year 2015 compared with fiscal year 2014.
• Operating grants and contributions grew by $1.92
billion in fiscal year 2015 compared with 2014 and was matched with an increase in human services expenses. The increases in both grant revenue and human services expenditures are largely due to the state expansion of its Medicaid program under the Affordable Care Act providing coverage to 534,000 newly eligible adults.
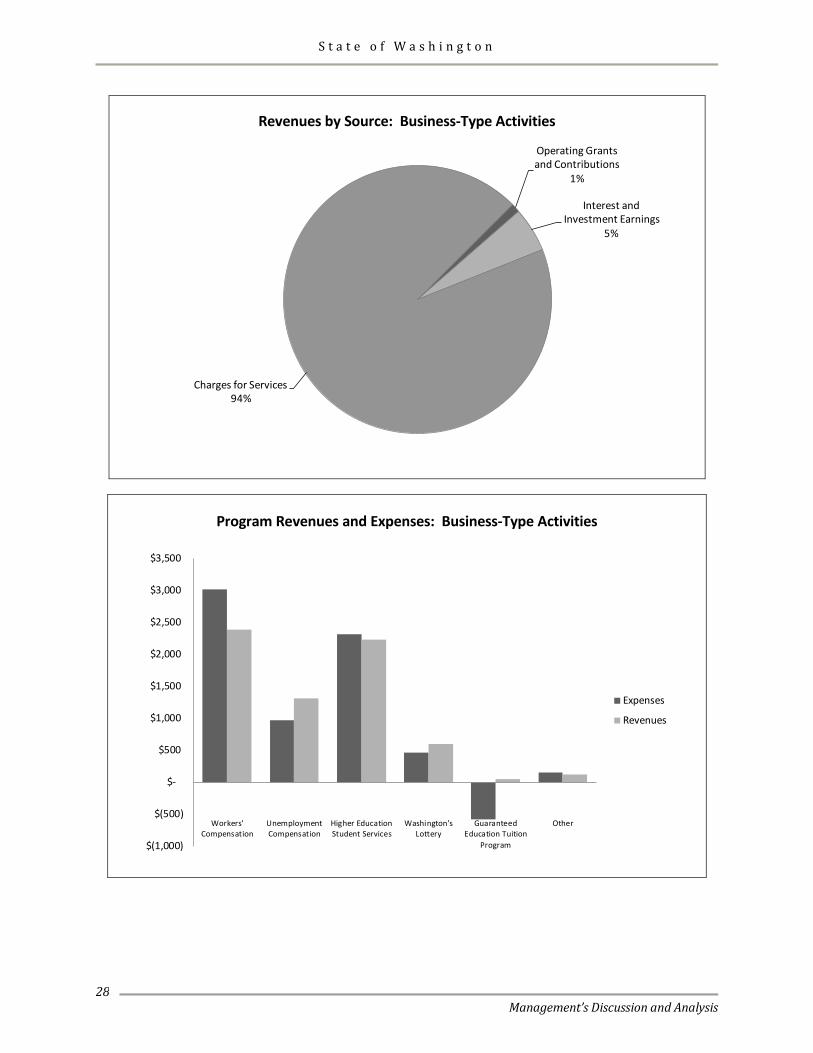
Business-Type Activities. Business-type activities increased the state of Washington’s net position by $629.6 million. Workers’ compensation, unemployment compensation, and guaranteed education tuition activities contributed to the increase. Key factors contributing to the operating results of business-type activities are: • The workers’ compensation activity decrease in net
position in fiscal year 2015 was $400.9 million compared to an increase of $240.4 million in fiscal year 2014. Premium revenue increased by $137.1 million as a result of an increase in the number of hours reported by employers, a mid-year premium rate increase, and an increase in the number of hours reported by businesses in higher rate classes. Claim costs decreased by $144.2 million in fiscal year 2015 compared with
fiscal year 2014 reflecting a reduction in the number of time-loss claims. Nonoperating investment income decreased by $902.6 million due predominately to a net decrease in realized and unrealized gains on debt securities. The workers’ compensation portfolio is 86.1 percent debt securities.
• The unemployment compensation activity reported an
operating income in fiscal year 2015 of $344.9 million, compared to $272.6 million in fiscal year 2014. Washington’s unemployment insurance program is an experience-based system with the largest part of an individual employer’s tax rate being based on the employer’s layoff experience over the past four years. The economic recovery in the state has stabilized employment and resulted in a decline in unemployment insurance benefits of $411.7 million in fiscal year 2015 over fiscal year 2014. The decrease in benefit costs was the result of a decline in both the number of claims and the duration of the claims. The unemployment rate for the state for June 2015 was 5.3 percent, down from 5.4 percent in June 2014, and the insured rate declined to 1.5 percent in fiscal year 2015 from 1.8 percent in fiscal year 2014. The state’s unemployment insurance premiums are experience based and the unemployment rate is declining, which resulted in premium revenue decreasing by 6.8 percent. The $247.0 million decline in federal aid also reflects the decrease in the unemployment rate.
• The Guaranteed Education Tuition (GET) Program reported an increase in net position of $658.7 million increasing its funded status to 140.1 percent, up from 105.8 percent the previous year, in spite of the fact that the number of tuition units sold dropped for the fourth straight year and investment returns were down.
Investment returns declined to 0.8 percent in fiscal year 2015 compared to 16.4 percent in fiscal year 2014. The GET investment portfolio was rebalanced during fiscal year 2015 to diversify the portfolio across various investment types as well as broadly within asset classes in order to reduce the aggregate volatility of the total portfolio.
While current year investment returns were down, the actuarial valuation of the obligation for future tuition benefits assumed a higher rate of investment return based on a recent experience study. The valuation also assumed a lower rate of tuition growth in response to recently enacted legislation. Overall the tuition benefit obligation decreased by 29.8 percent.
• The remaining business-type activities reported relatively proportional increases in both operating revenues and expenses when compared to the prior year.
S t a t e o f W a s h i n g t o n
Management’s Discussion and Analysis
27
Revenues by Source: Governmental Activities
Operating Grants and Contributions
37%
Capital Grants and Contributions
2%
Charges for Services15%
Interest and Investment Earnings
1%
Taxes45%
Program Revenues and Expenses: Governmental Activities
$-
$2,000
$4,000
$6,000
$8,000
$10,000
$12,000
$14,000
$16,000
$18,000
Dol
lars
in M
illio
ns
Expenses
Revenues
S t a t e o f W a s h i n g t o n
Management’s Discussion and Analysis
28
Revenues by Source: Business-Type Activities
Operating Grants and Contributions
1%
Interest and Investment Earnings
5%
Charges for Services94%
Program Revenues and Expenses: Business-Type Activities
$(1,000)
$(500)
$-
$500
$1,000
$1,500
$2,000
$2,500
$3,000
$3,500
Workers'Compensation
UnemploymentCompensation
Higher EducationStudent Services
Washington'sLottery
GuaranteedEducation Tuition
Program
Other
Expenses
Revenues

S t a t e o f W a s h i n g t o n
Management’s Discussion and Analysis
29
Financial Analysis of the State’s Funds As noted earlier, the state of Washington uses fund accounting to ensure and demonstrate compliance with finance-related legal requirements. Governmental Funds. As previously discussed, the focus of the state of Washington’s governmental funds is to provide information on near-term inflows, outflows, and fund balances. Such information is useful in assessing the state of Washington’s financing requirements. Adjustments to Beginning Fund Balances. As described in Note 2 to the financial statements on pages 79 and 80, beginning fund balances of governmental funds were adjusted to correct prior period activity. Fund Balances. At June 30, 2015, the state’s governmental funds reported combined ending fund balances of $14.70 billion. Of this amount, $2.53 billion or 17.3 percent is nonspendable, either due to its form or legal constraints, and $4.37 billion or 29.7 percent is
restricted for specific programs by external constraints, constitutional provisions or contractual obligations. An additional $5.97 billion or 40.6 percent of total fund balance has been committed to specific purposes. Committed amounts cannot be used for any other purpose unless approved by the Legislature. An additional $1.03 billion or 7.0 percent of total fund balance has been assigned to specific purposes by management. The General Fund is the chief operating fund of the state of Washington. As noted in the table below, fund balance improved as a result of operations by $854.3 million in fiscal year 2015, as compared to a $443.5 million gain in fiscal year 2014. Increased revenues from taxes and federal grants-in-aid and targeted spending increases in K-12 education and social and health services combined with a concerted effort to hold the line on other spending were the key contributing factors. Assigned fund balance of $1.01 billion is reported for fiscal year 2015 and relates to certain accrued and non-cash revenues which are not considered by management to be available for budgetary purposes.
DifferenceIncrease
2015 2014 (Decrease)REVENUESTaxes 17,025$ 16,008$ 1,017$ Federal grants 12,053 10,226 1,827 Investment revenue (loss) 8 7 1 Other 698 614 84
Total 29,784 26,855 2,929
EXPENDITURESHuman services 16,794 14,920 1,874 Education 10,177 9,754 423 Other 1,505 1,460 45
Total 28,476 26,134 2,342
Net transfers in (out) (653) (447) (206) Other financing sources 199 170 29 Net increase (decrease) in fund balance 854$ 444$ 410$
Fiscal Year
General Fund(in millions of dollars)
STATE OF WASHINGTON
S t a t e o f W a s h i n g t o n
Management’s Discussion and Analysis
30
General Fund expenditures continue to be concentrated in services and programs most vital to citizens – primarily human services and public education. In addition to the General Fund, the state reports the Higher Education Special Revenue and the Higher Education Endowment Funds as major governmental funds. Significant changes are as follows: • The change in net position of the Higher Education
Special Revenue Fund in fiscal year 2015 was $126.1 million compared to $140.6 million in fiscal year 2014. The decline in fiscal year 2015 was largely due to a 6.8 percent increase in expenditures outpacing revenue growth. Revenues showed only a slight gain of 2.7 percent reflecting the state’s decision to hold tuition steady.
• The fund balance for the Higher Education Endowment Fund increased by $80.8 million in fiscal year 2015. Fiscal year 2015 reported a decrease of $283.6 million in investment earnings due to a downturn in the market.
Proprietary Funds. The state of Washington’s proprietary funds provides the same type of information found in the government-wide financial statements, but in more detail. Significant changes are as follows: • The Workers’ Compensation Fund reported a decrease
in net position of $400.9 million in fiscal year 2015. Operating revenues increased by $138.1 million and operating expenses decreased by $123.5 million as compared to fiscal year 2014. As previously reported, operating revenues increased due to an increase in reported hours in higher rate classes and claims expense decreased due to a reduction in the number of time-loss claims. Investment income decreased $902.6 million over fiscal year 2014 due to a decrease in net realized and unrealized capital gains.
• Washington’s Unemployment Compensation Fund reported an increase in net position of $425.4 million. As reported previously, premium revenue increased reflecting a growing workforce and higher taxable wage base. Unemployment benefit claims expense decreased by $411.7 million in fiscal year 2015 as compared to 2014 and federal aid decreased by $247.0 million over the same period. The decreases in both benefit claims and federal aid are consistent with the decline in the state’s unemployment rate.
• The Guaranteed Education Tuition (GET) Program Fund reported an increase in net position of $658.7 million in fiscal year 2015. As previously reported, the increase is due primarily to a reduction in the assumed rate of tuition growth and a higher assumed rate of investment return.
• The Higher Education Student Services Fund and the nonmajor enterprise funds reported activity fairly consistent with the prior year.
General Fund Budgetary Highlights Differences between the original budget of the General Fund and the final amended budget reflect increases in mandatory costs driven by rising caseloads and school enrollment as well as other high priority needs. Changes to estimates are summarized as follows: • Estimated biennial resources increased by $2.63 billion
over the course of the biennium. The major increase in estimated resources is reported in federal grants-in-aid reflecting the state expansion of its Medicaid program under the Affordable Care Act.
• Appropriated expenditure authority increased by $1.97
billion over the biennium to address increases in mandatory and high priority programs. The major increases in appropriation authority were in human services. The availability of additional federal funding allowed the state to provide coverage to more than 534,000 newly eligible adults under the Affordable Care Act.
The state did not overspend its legal spending authority for the 2013-15 biennium. Actual General Fund revenues and expenditures were 97.8 and 97.0 percent of final budgeted resources and appropriations, respectively, for the 2013-15 biennium.
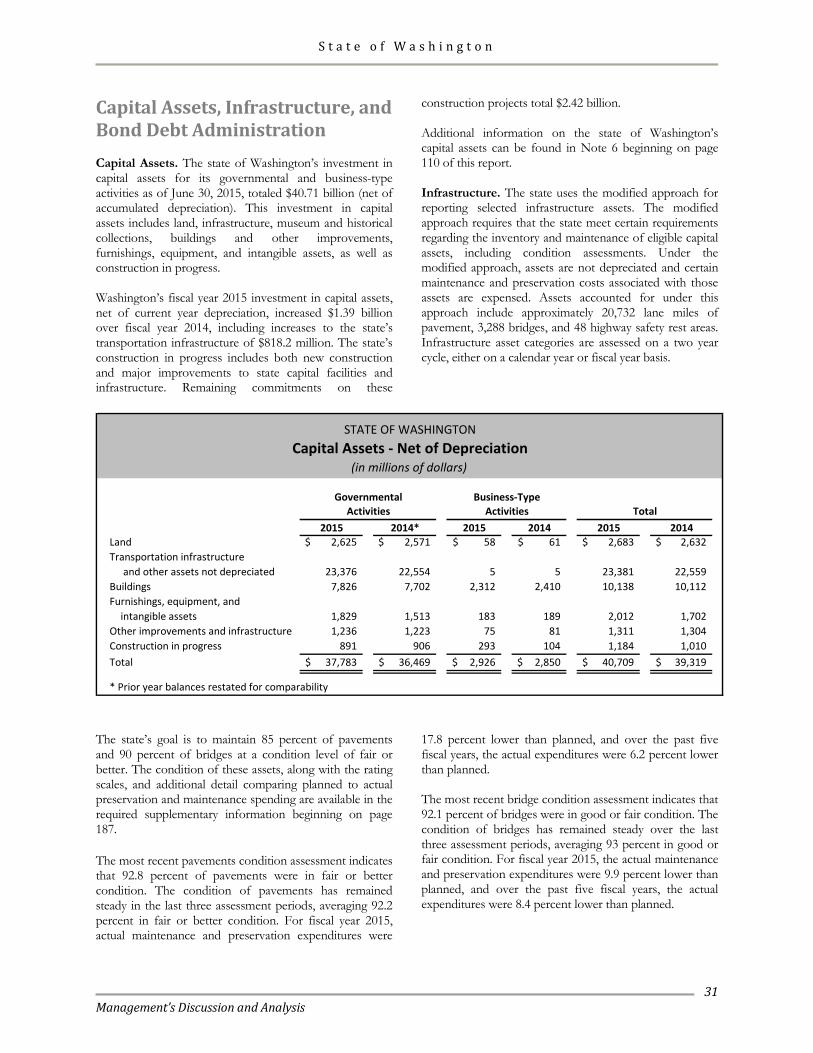
S t a t e o f W a s h i n g t o n
Management’s Discussion and Analysis
31
Capital Assets, Infrastructure, and Bond Debt Administration Capital Assets. The state of Washington’s investment in capital assets for its governmental and business-type activities as of June 30, 2015, totaled $40.71 billion (net of accumulated depreciation). This investment in capital assets includes land, infrastructure, museum and historical collections, buildings and other improvements, furnishings, equipment, and intangible assets, as well as construction in progress. Washington’s fiscal year 2015 investment in capital assets, net of current year depreciation, increased $1.39 billion over fiscal year 2014, including increases to the state’s transportation infrastructure of $818.2 million. The state’s construction in progress includes both new construction and major improvements to state capital facilities and infrastructure. Remaining commitments on these
construction projects total $2.42 billion. Additional information on the state of Washington’s capital assets can be found in Note 6 beginning on page 110 of this report. Infrastructure. The state uses the modified approach for reporting selected infrastructure assets. The modified approach requires that the state meet certain requirements regarding the inventory and maintenance of eligible capital assets, including condition assessments. Under the modified approach, assets are not depreciated and certain maintenance and preservation costs associated with those assets are expensed. Assets accounted for under this approach include approximately 20,732 lane miles of pavement, 3,288 bridges, and 48 highway safety rest areas. Infrastructure asset categories are assessed on a two year cycle, either on a calendar year or fiscal year basis.
2015 2014* 2015 2014 2015 2014Land 2,625$ 2,571$ 58$ 61$ 2,683$ 2,632$ Transportation infrastructure
and other assets not depreciated 23,376 22,554 5 5 23,381 22,559 Buildings 7,826 7,702 2,312 2,410 10,138 10,112 Furnishings, equipment, and
intangible assets 1,829 1,513 183 189 2,012 1,702 Other improvements and infrastructure 1,236 1,223 75 81 1,311 1,304 Construction in progress 891 906 293 104 1,184 1,010 Total 37,783$ 36,469$ 2,926$ 2,850$ 40,709$ 39,319$
* Prior year balances restated for comparability
STATE OF WASHINGTONCapital Assets - Net of Depreciation
(in millions of dollars)
Activities Activities TotalBusiness-TypeGovernmental
The state’s goal is to maintain 85 percent of pavements and 90 percent of bridges at a condition level of fair or better. The condition of these assets, along with the rating scales, and additional detail comparing planned to actual preservation and maintenance spending are available in the required supplementary information beginning on page 187. The most recent pavements condition assessment indicates that 92.8 percent of pavements were in fair or better condition. The condition of pavements has remained steady in the last three assessment periods, averaging 92.2 percent in fair or better condition. For fiscal year 2015, actual maintenance and preservation expenditures were
17.8 percent lower than planned, and over the past five fiscal years, the actual expenditures were 6.2 percent lower than planned. The most recent bridge condition assessment indicates that 92.1 percent of bridges were in good or fair condition. The condition of bridges has remained steady over the last three assessment periods, averaging 93 percent in good or fair condition. For fiscal year 2015, the actual maintenance and preservation expenditures were 9.9 percent lower than planned, and over the past five fiscal years, the actual expenditures were 8.4 percent lower than planned.
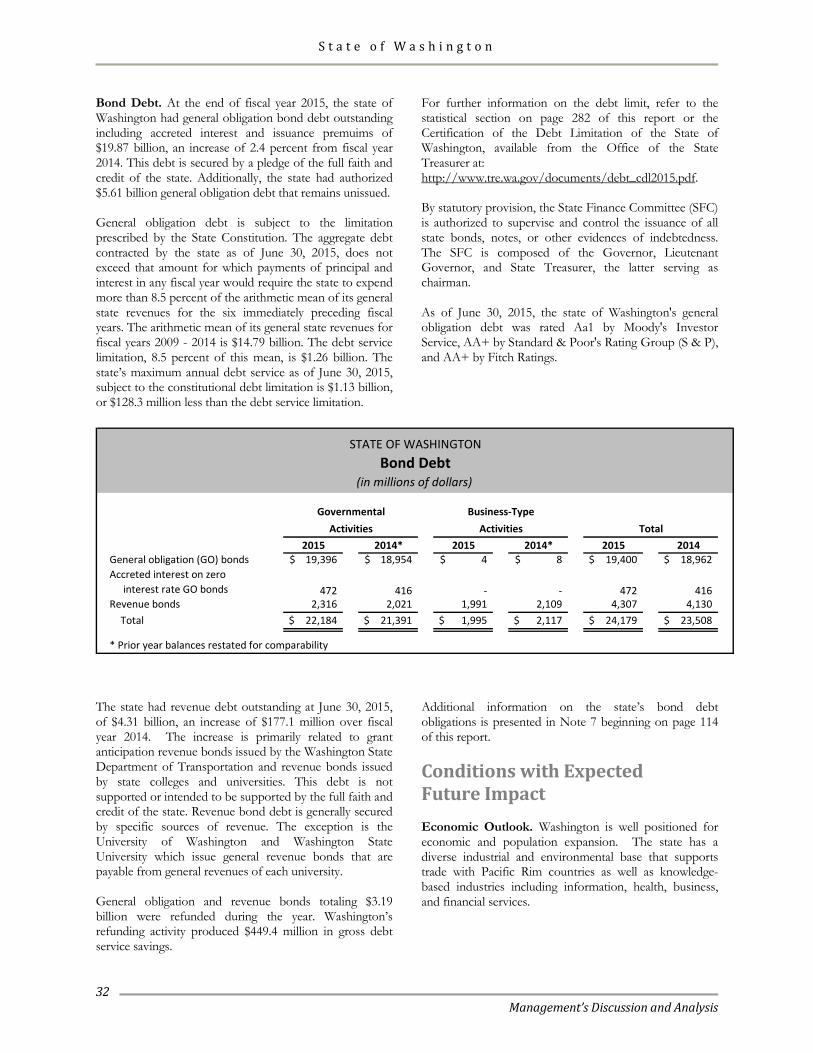
S t a t e o f W a s h i n g t o n
Management’s Discussion and Analysis
32
Bond Debt. At the end of fiscal year 2015, the state of Washington had general obligation bond debt outstanding including accreted interest and issuance premuims of $19.87 billion, an increase of 2.4 percent from fiscal year 2014. This debt is secured by a pledge of the full faith and credit of the state. Additionally, the state had authorized $5.61 billion general obligation debt that remains unissued. General obligation debt is subject to the limitation prescribed by the State Constitution. The aggregate debt contracted by the state as of June 30, 2015, does not exceed that amount for which payments of principal and interest in any fiscal year would require the state to expend more than 8.5 percent of the arithmetic mean of its general state revenues for the six immediately preceding fiscal years. The arithmetic mean of its general state revenues for fiscal years 2009 - 2014 is $14.79 billion. The debt service limitation, 8.5 percent of this mean, is $1.26 billion. The state’s maximum annual debt service as of June 30, 2015, subject to the constitutional debt limitation is $1.13 billion, or $128.3 million less than the debt service limitation.
For further information on the debt limit, refer to the statistical section on page 282 of this report or the Certification of the Debt Limitation of the State of Washington, available from the Office of the State Treasurer at: http://www.tre.wa.gov/documents/debt_cdl2015.pdf. By statutory provision, the State Finance Committee (SFC) is authorized to supervise and control the issuance of all state bonds, notes, or other evidences of indebtedness. The SFC is composed of the Governor, Lieutenant Governor, and State Treasurer, the latter serving as chairman. As of June 30, 2015, the state of Washington's general obligation debt was rated Aa1 by Moody's Investor Service, AA+ by Standard & Poor's Rating Group (S & P), and AA+ by Fitch Ratings.
2015 2014* 2015 2014* 2015 2014General obligation (GO) bonds 19,396$ 18,954$ 4$ 8$ 19,400$ 18,962$ Accreted interest on zero
interest rate GO bonds 472 416 - - 472 416 Revenue bonds 2,316 2,021 1,991 2,109 4,307 4,130
Total 22,184$ 21,391$ 1,995$ 2,117$ 24,179$ 23,508$
* Prior year balances restated for comparability
STATE OF WASHINGTONBond Debt
(in millions of dollars)
Activities Activities TotalGovernmental Business-Type
The state had revenue debt outstanding at June 30, 2015, of $4.31 billion, an increase of $177.1 million over fiscal year 2014. The increase is primarily related to grant anticipation revenue bonds issued by the Washington State Department of Transportation and revenue bonds issued by state colleges and universities. This debt is not supported or intended to be supported by the full faith and credit of the state. Revenue bond debt is generally secured by specific sources of revenue. The exception is the University of Washington and Washington State University which issue general revenue bonds that are payable from general revenues of each university. General obligation and revenue bonds totaling $3.19 billion were refunded during the year. Washington’s refunding activity produced $449.4 million in gross debt service savings.
Additional information on the state’s bond debt obligations is presented in Note 7 beginning on page 114 of this report.
Conditions with Expected Future Impact Economic Outlook. Washington is well positioned for economic and population expansion. The state has a diverse industrial and environmental base that supports trade with Pacific Rim countries as well as knowledge-based industries including information, health, business, and financial services.
S t a t e o f W a s h i n g t o n
Management’s Discussion and Analysis
33
Washington’s expanding economy, accelerated gains in hiring, and recovering housing markets have had a positive effect on revenue growth. Further economic growth and a continued expansion in the housing and commercial building markets should keep revenues growing at a sound pace. That said, in the coming year, legislative leaders and management will be facing a number of challenges including: • The slowing Chinese economy, the negative impact of
a stronger dollar on exports, and the volatility in the stock markets pose threats to the U.S. and Washington economies.
• Under legislation approved in 2012, and beginning with the 2013-15 biennium, Washington became the only state in the nation required to pass a budget that balances spending against anticipated revenue over a four year period.
• The courts have also made it clear that in addressing budget shortfalls the past six years, the state sometimes went too far in cutting services, such as for at-risk children and individuals with mental illness. Washington continues to address the requirements of the state Supreme Court 2012 McCleary ruling that found that the state has failed to meet its constitutional requirement to amply fund basic education. Although funding progress was made during the 2013-15 biennium, it was insufficient to satisfy the court.
General Election. There is a measure on the state’s November 3, 2015, general election ballot that addresses state taxes. This measure would reduce the state retail sales tax by 1 percent unless the Legislature refers to voters a constitutional amendment requiring two-thirds legislative approval or voter approval to raise taxes and legislative approval for fee increases. If passed, the measure could impact the state fiscally.
Election results are not final or official until certified. By law December 3, 2015, is the last day for the Office of the Secretary of State to certify General Election returns. Information is posted as available on the Secretary of State’s website at: http://www.sos.wa.gov. Rainy Day Account. In November 2007, Washington state voters ratified Engrossed Substitute Senate Joint Resolution 8206, amending the state’s Constitution and
establishing the Budget Stabilization Account (BSA). The Constitution details a limited number of circumstances under which funds can be appropriated from the BSA, one of which is a favorable vote of at least three-fifths of the members of each house of the Legislature. On June 30, 2015, $211.9 million was transferred to the BSA from the General Fund in accordance with the provisions of the Constitution. During fiscal year 2015, by three-fifths vote of each house, the Legislature appropriated $77.2 million from the BSA solely for emergency fire service mobilization, fire suppression, and fire damage recovery costs. Additionally, the Legislature, also by three-fifths vote of each house, authorized the transfer from the BSA to the General Fund the amount attributable to extraordinary revenue growth, not to exceed $50.0 million. The BSA had a fund balance of $513.1 million as of June 30, 2015. The Guaranteed Education Tuition (GET) Program. The funded status of the GET Program increased during fiscal year 2015 reflecting lower assumed tuition growth in response to Engrossed Second Substitute Bill (E2SSB) 5954 which was signed into law by the Governor on July 6, 2015. E2SSB 5954 reduces tuition at all public institutions of higher learning during the fiscal years 2016 and 2017 and limits tuition growth in future years. In response to E2SSB 5954, the GET Program Committee authorized refunds of approximately $75.0 million in amortization fees to account holders which was recognized as of June 30, 2015. The Committee also permitted account holders, upon request, to receive a refund of their contributions or a fixed payout value, whichever is greater, without the usual penalties, fees, or waiting period. The full extent of E2SSB 5954’s impact on the Program cannot reasonably be estimated as of the date of these financial statements.
Requests for Information This financial report is designed to provide a general overview of the state of Washington’s finances for all those with an interest in the government’s finances. Questions concerning any of the information provided in this report or requests for additional financial information should be addressed to the Office of Financial Management, Accounting Division, P.O. Box 43127, Olympia, WA 98504-3127.

S t a t e o f W a s h i n g t o n
Management’s Discussion and Analysis
34
This page intentionally left blank.
S t a t e o f W a s h i n g t o n
Basic Financial Statements
35
Basic Financial Statements Government-wide Financial Statements
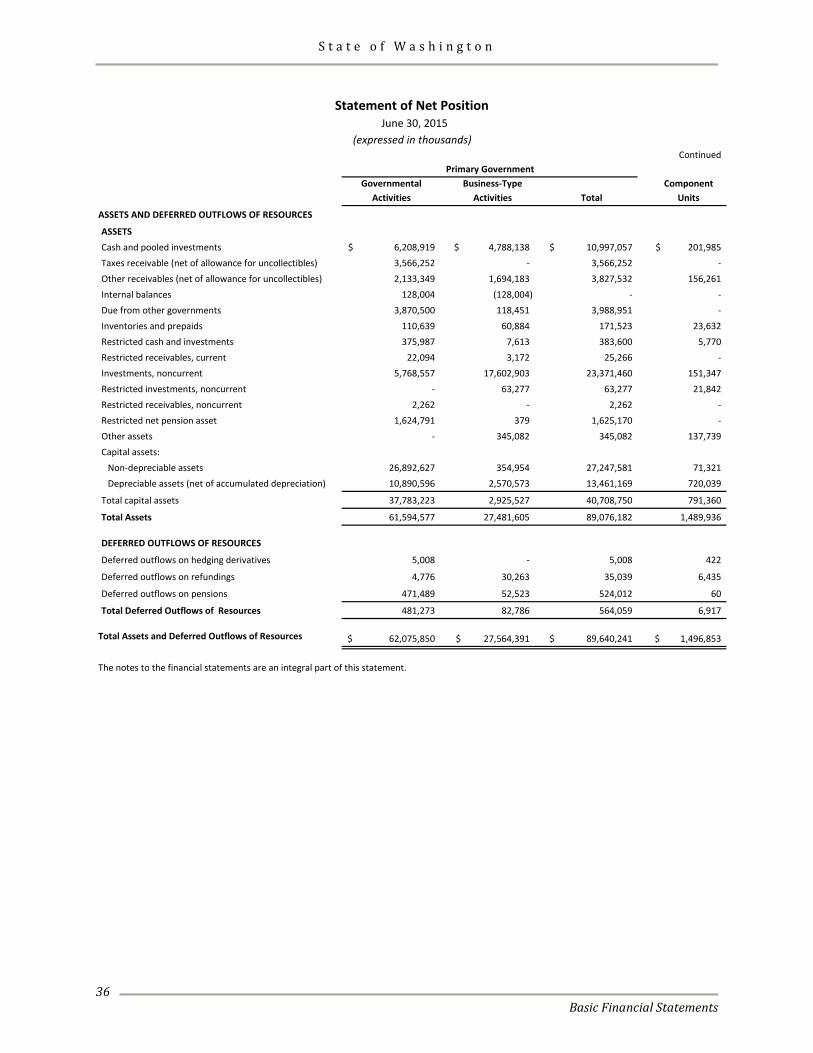
S t a t e o f W a s h i n g t o n
Basic Financial Statements
36
Continued
Governmental Business-Type ComponentActivities Activities Total Units
ASSETS AND DEFERRED OUTFLOWS OF RESOURCES
ASSETSCash and pooled investments 6,208,919$ 4,788,138$ 10,997,057$ 201,985$ Taxes receivable (net of allowance for uncollectibles) 3,566,252 - 3,566,252 - Other receivables (net of allowance for uncollectibles) 2,133,349 1,694,183 3,827,532 156,261 Internal balances 128,004 (128,004) - - Due from other governments 3,870,500 118,451 3,988,951 - Inventories and prepaids 110,639 60,884 171,523 23,632 Restricted cash and investments 375,987 7,613 383,600 5,770 Restricted receivables, current 22,094 3,172 25,266 - Investments, noncurrent 5,768,557 17,602,903 23,371,460 151,347 Restricted investments, noncurrent - 63,277 63,277 21,842 Restricted receivables, noncurrent 2,262 - 2,262 - Restricted net pension asset 1,624,791 379 1,625,170 - Other assets - 345,082 345,082 137,739 Capital assets:
Non-depreciable assets 26,892,627 354,954 27,247,581 71,321 Depreciable assets (net of accumulated depreciation) 10,890,596 2,570,573 13,461,169 720,039
Total capital assets 37,783,223 2,925,527 40,708,750 791,360
Total Assets 61,594,577 27,481,605 89,076,182 1,489,936
DEFERRED OUTFLOWS OF RESOURCES
Deferred outflows on hedging derivatives 5,008 - 5,008 422
Deferred outflows on refundings 4,776 30,263 35,039 6,435
Deferred outflows on pensions 471,489 52,523 524,012 60
Total Deferred Outflows of Resources 481,273 82,786 564,059 6,917
Total Assets and Deferred Outflows of Resources 62,075,850$ 27,564,391$ 89,640,241$ 1,496,853$
The notes to the financial statements are an integral part of this statement.
Statement of Net Position June 30, 2015
(expressed in thousands)
Primary Government
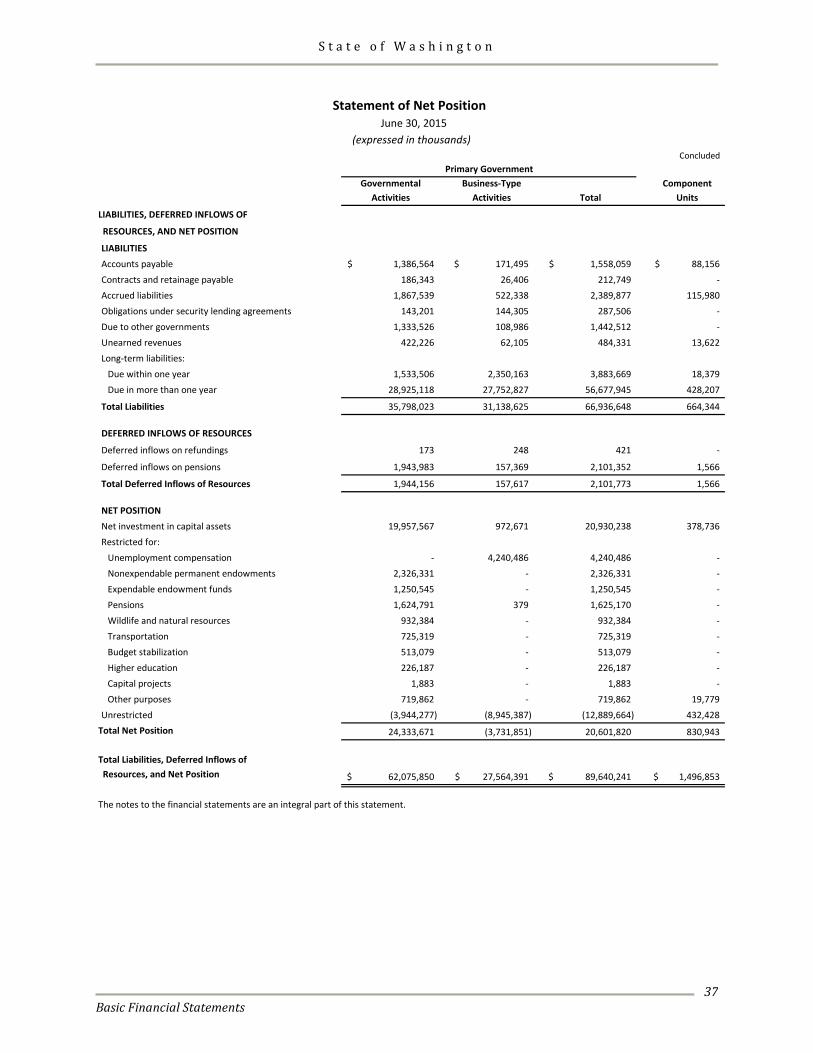
S t a t e o f W a s h i n g t o n
Basic Financial Statements
37
Concluded
Governmental Business-Type ComponentActivities Activities Total Units
LIABILITIES, DEFERRED INFLOWS OF
RESOURCES, AND NET POSITION
LIABILITIESAccounts payable 1,386,564$ 171,495$ 1,558,059$ 88,156$ Contracts and retainage payable 186,343 26,406 212,749 - Accrued liabilities 1,867,539 522,338 2,389,877 115,980 Obligations under security lending agreements 143,201 144,305 287,506 - Due to other governments 1,333,526 108,986 1,442,512 - Unearned revenues 422,226 62,105 484,331 13,622 Long-term liabilities:
Due within one year 1,533,506 2,350,163 3,883,669 18,379 Due in more than one year 28,925,118 27,752,827 56,677,945 428,207
Total Liabilities 35,798,023 31,138,625 66,936,648 664,344
DEFERRED INFLOWS OF RESOURCES
Deferred inflows on refundings 173 248 421 -
Deferred inflows on pensions 1,943,983 157,369 2,101,352 1,566
Total Deferred Inflows of Resources 1,944,156 157,617 2,101,773 1,566
NET POSITIONNet investment in capital assets 19,957,567 972,671 20,930,238 378,736 Restricted for:
Unemployment compensation - 4,240,486 4,240,486 - Nonexpendable permanent endowments 2,326,331 - 2,326,331 - Expendable endowment funds 1,250,545 - 1,250,545 - Pensions 1,624,791 379 1,625,170 - Wildlife and natural resources 932,384 - 932,384 - Transportation 725,319 - 725,319 - Budget stabilization 513,079 - 513,079 - Higher education 226,187 - 226,187 - Capital projects 1,883 - 1,883 - Other purposes 719,862 - 719,862 19,779
Unrestricted (3,944,277) (8,945,387) (12,889,664) 432,428 Total Net Position 24,333,671 (3,731,851) 20,601,820 830,943
Total Liabilities, Deferred Inflows of Resources, and Net Position 62,075,850$ 27,564,391$ 89,640,241$ 1,496,853$
The notes to the financial statements are an integral part of this statement.
Statement of Net Position June 30, 2015
(expressed in thousands)
Primary Government
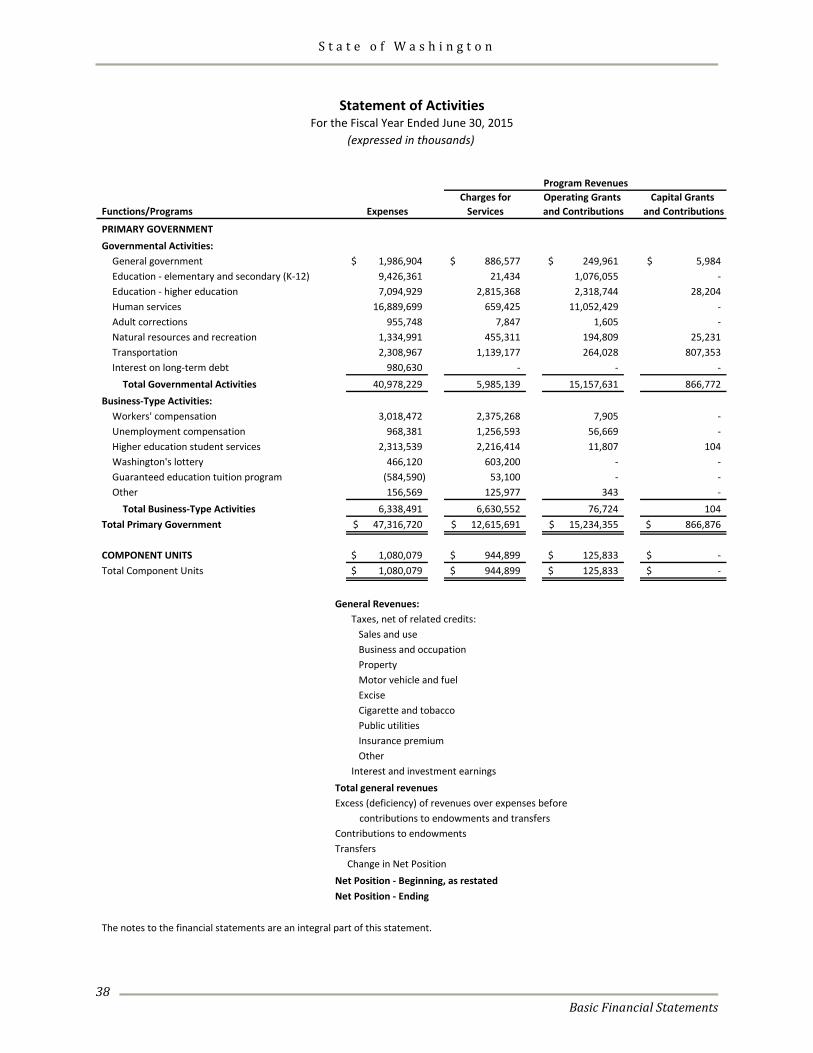
S t a t e o f W a s h i n g t o n
Basic Financial Statements
38
Charges for Operating Grants Capital Grants Functions/Programs Expenses Services and Contributions and Contributions
PRIMARY GOVERNMENTGovernmental Activities:
General government 1,986,904$ 886,577$ 249,961$ 5,984$ Education - elementary and secondary (K-12) 9,426,361 21,434 1,076,055 - Education - higher education 7,094,929 2,815,368 2,318,744 28,204 Human services 16,889,699 659,425 11,052,429 - Adult corrections 955,748 7,847 1,605 - Natural resources and recreation 1,334,991 455,311 194,809 25,231 Transportation 2,308,967 1,139,177 264,028 807,353 Interest on long-term debt 980,630 - - -
Total Governmental Activities 40,978,229 5,985,139 15,157,631 866,772 Business-Type Activities:
Workers' compensation 3,018,472 2,375,268 7,905 - Unemployment compensation 968,381 1,256,593 56,669 - Higher education student services 2,313,539 2,216,414 11,807 104 Washington's lottery 466,120 603,200 - - Guaranteed education tuition program (584,590) 53,100 - - Other 156,569 125,977 343 -
Total Business-Type Activities 6,338,491 6,630,552 76,724 104 Total Primary Government 47,316,720$ 12,615,691$ 15,234,355$ 866,876$
COMPONENT UNITS 1,080,079$ 944,899$ 125,833$ -$ Total Component Units 1,080,079$ 944,899$ 125,833$ -$
General Revenues:Taxes, net of related credits: Sales and use Business and occupation Property Motor vehicle and fuel Excise Cigarette and tobacco Public utilities Insurance premium OtherInterest and investment earnings
Total general revenuesExcess (deficiency) of revenues over expenses before contributions to endowments and transfers Contributions to endowmentsTransfers Change in Net PositionNet Position - Beginning, as restatedNet Position - Ending
The notes to the financial statements are an integral part of this statement.
Program Revenues
Statement of ActivitiesFor the Fiscal Year Ended June 30, 2015
(expressed in thousands)
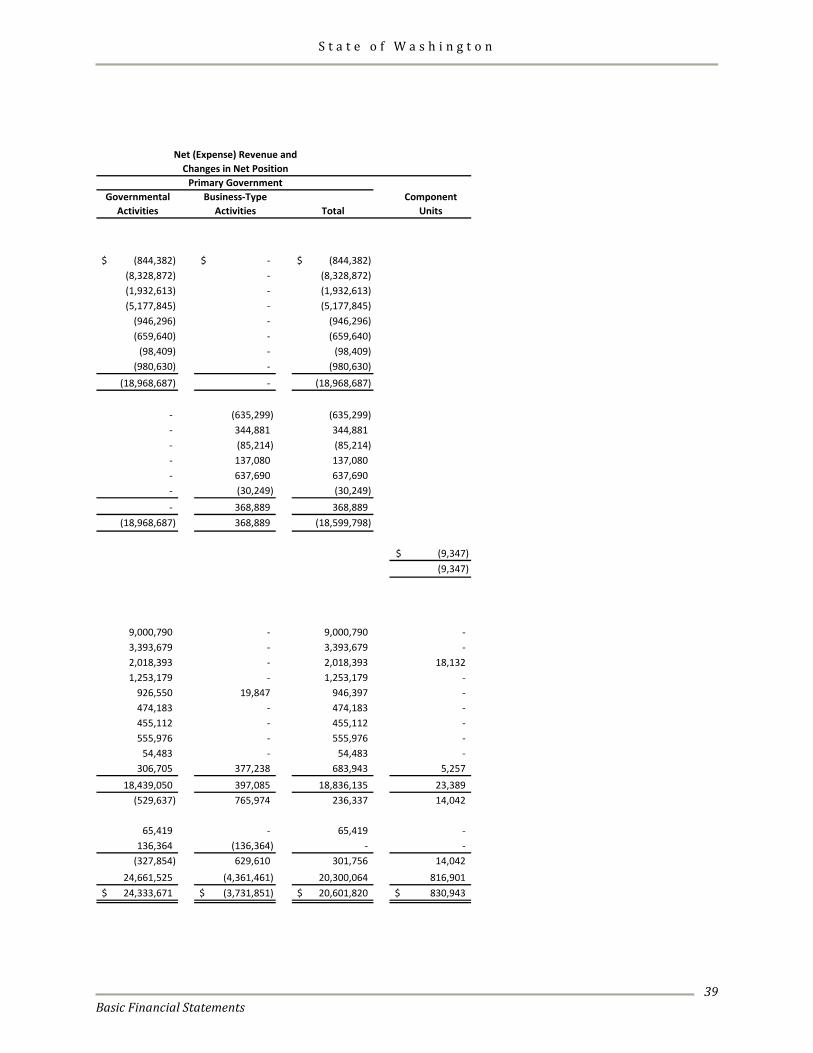
S t a t e o f W a s h i n g t o n
Basic Financial Statements
39
Changes in Net PositionPrimary Government
Governmental Business-Type ComponentActivities Activities Total Units
(844,382)$ -$ (844,382)$ (8,328,872) - (8,328,872) (1,932,613) - (1,932,613) (5,177,845) - (5,177,845)
(946,296) - (946,296) (659,640) - (659,640)
(98,409) - (98,409) (980,630) - (980,630)
(18,968,687) - (18,968,687)
- (635,299) (635,299) - 344,881 344,881 - (85,214) (85,214) - 137,080 137,080 - 637,690 637,690 - (30,249) (30,249) - 368,889 368,889
(18,968,687) 368,889 (18,599,798)
(9,347)$ (9,347)
9,000,790 - 9,000,790 - 3,393,679 - 3,393,679 - 2,018,393 - 2,018,393 18,132 1,253,179 - 1,253,179 -
926,550 19,847 946,397 - 474,183 - 474,183 - 455,112 - 455,112 - 555,976 - 555,976 -
54,483 - 54,483 - 306,705 377,238 683,943 5,257
18,439,050 397,085 18,836,135 23,389 (529,637) 765,974 236,337 14,042
65,419 - 65,419 - 136,364 (136,364) - -
(327,854) 629,610 301,756 14,042 24,661,525 (4,361,461) 20,300,064 816,901 24,333,671$ (3,731,851)$ 20,601,820$ 830,943$
Net (Expense) Revenue and

S t a t e o f W a s h i n g t o n
Basic Financial Statements
40
This page intentionally left blank.
S t a t e o f W a s h i n g t o n
Basic Financial Statements
41
Basic Financial Statements Fund Financial Statements
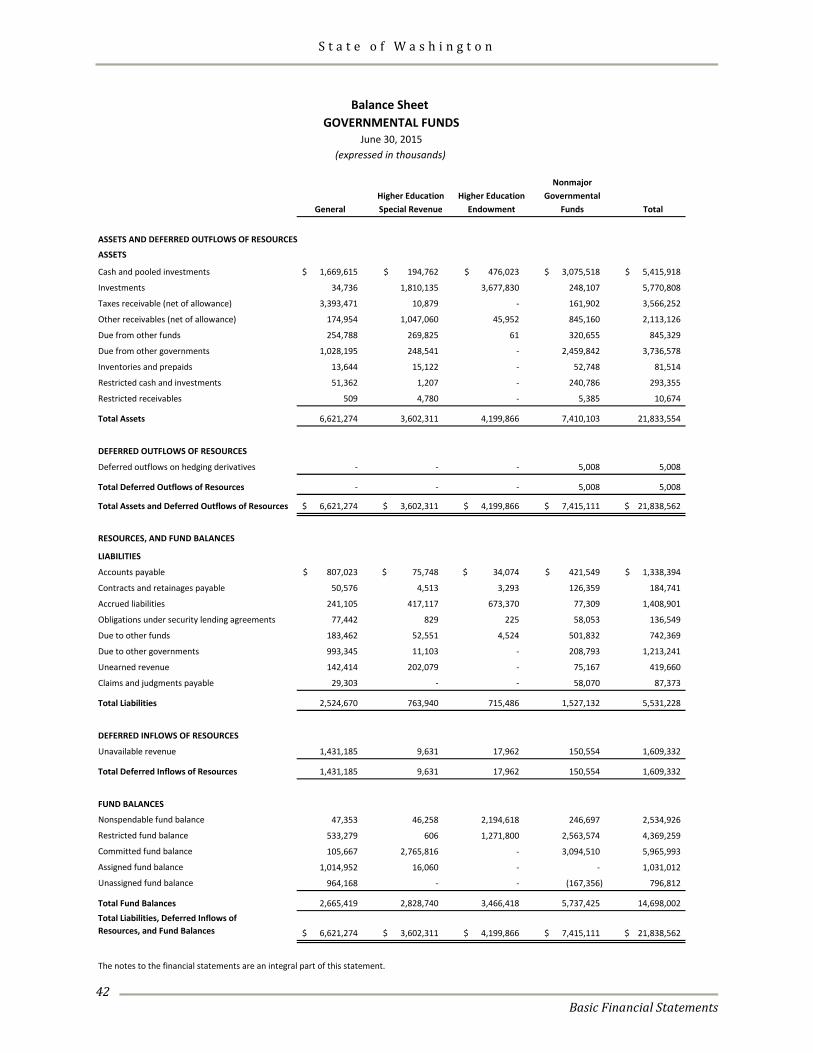
S t a t e o f W a s h i n g t o n
Basic Financial Statements
42
NonmajorHigher Education Higher Education Governmental
General Special Revenue Endowment Funds Total
ASSETS AND DEFERRED OUTFLOWS OF RESOURCES
ASSETS
Cash and pooled investments 1,669,615$ 194,762$ 476,023$ 3,075,518$ 5,415,918$
Investments 34,736 1,810,135 3,677,830 248,107 5,770,808
Taxes receivable (net of allowance) 3,393,471 10,879 - 161,902 3,566,252
Other receivables (net of allowance) 174,954 1,047,060 45,952 845,160 2,113,126
Due from other funds 254,788 269,825 61 320,655 845,329
Due from other governments 1,028,195 248,541 - 2,459,842 3,736,578
Inventories and prepaids 13,644 15,122 - 52,748 81,514
Restricted cash and investments 51,362 1,207 - 240,786 293,355
Restricted receivables 509 4,780 - 5,385 10,674
Total Assets 6,621,274 3,602,311 4,199,866 7,410,103 21,833,554
DEFERRED OUTFLOWS OF RESOURCES
Deferred outflows on hedging derivatives - - - 5,008 5,008
Total Deferred Outflows of Resources - - - 5,008 5,008
Total Assets and Deferred Outflows of Resources 6,621,274$ 3,602,311$ 4,199,866$ 7,415,111$ 21,838,562$
RESOURCES, AND FUND BALANCES
LIABILITIES
Accounts payable 807,023$ 75,748$ 34,074$ 421,549$ 1,338,394$
Contracts and retainages payable 50,576 4,513 3,293 126,359 184,741
Accrued liabilities 241,105 417,117 673,370 77,309 1,408,901
Obligations under security lending agreements 77,442 829 225 58,053 136,549
Due to other funds 183,462 52,551 4,524 501,832 742,369
Due to other governments 993,345 11,103 - 208,793 1,213,241
Unearned revenue 142,414 202,079 - 75,167 419,660
Claims and judgments payable 29,303 - - 58,070 87,373
Total Liabilities 2,524,670 763,940 715,486 1,527,132 5,531,228
DEFERRED INFLOWS OF RESOURCES
Unavailable revenue 1,431,185 9,631 17,962 150,554 1,609,332
Total Deferred Inflows of Resources 1,431,185 9,631 17,962 150,554 1,609,332
FUND BALANCES
Nonspendable fund balance 47,353 46,258 2,194,618 246,697 2,534,926
Restricted fund balance 533,279 606 1,271,800 2,563,574 4,369,259
Committed fund balance 105,667 2,765,816 - 3,094,510 5,965,993
Assigned fund balance 1,014,952 16,060 - - 1,031,012
Unassigned fund balance 964,168 - - (167,356) 796,812
Total Fund Balances 2,665,419 2,828,740 3,466,418 5,737,425 14,698,002 Total Liabilities, Deferred Inflows of Resources, and Fund Balances 6,621,274$ 3,602,311$ 4,199,866$ 7,415,111$ 21,838,562$
The notes to the financial statements are an integral part of this statement.
(expressed in thousands)June 30, 2015
GOVERNMENTAL FUNDSBalance Sheet
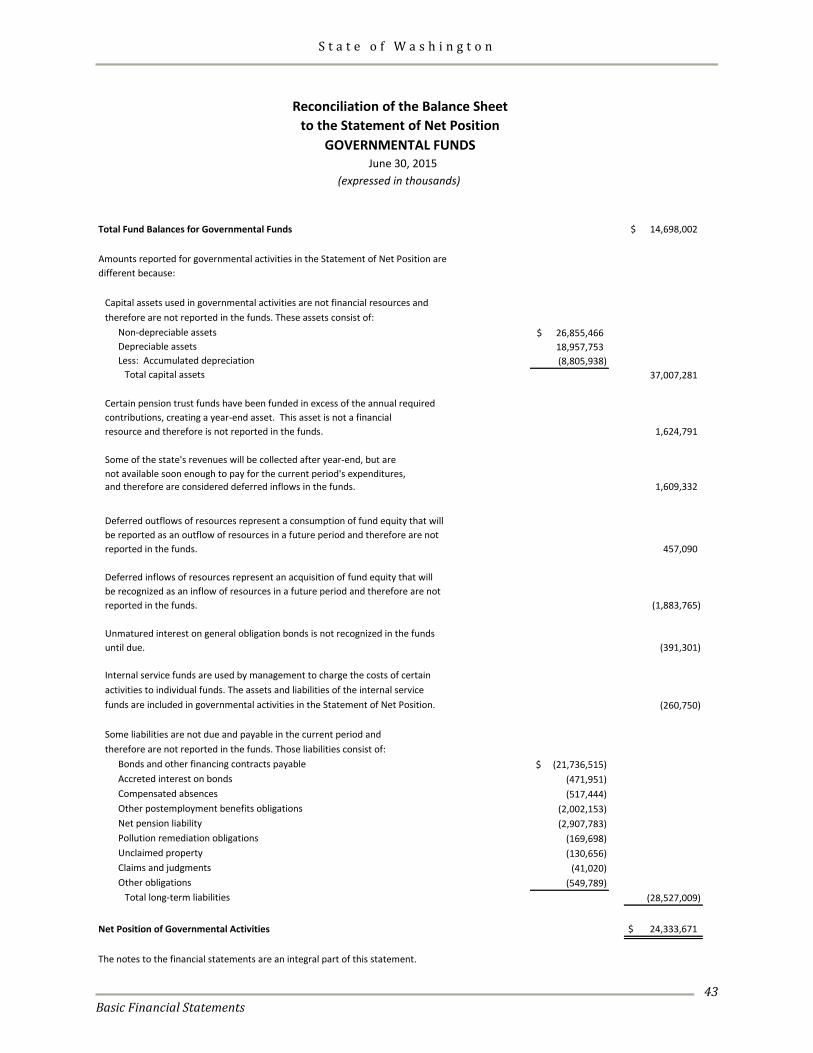
S t a t e o f W a s h i n g t o n
Basic Financial Statements
43
Total Fund Balances for Governmental Funds 14,698,002$
Amounts reported for governmental activities in the Statement of Net Position aredifferent because:
Capital assets used in governmental activities are not financial resources andtherefore are not reported in the funds. These assets consist of:
Non-depreciable assets 26,855,466$ Depreciable assets 18,957,753 Less: Accumulated depreciation (8,805,938)
Total capital assets 37,007,281
Certain pension trust funds have been funded in excess of the annual requiredcontributions, creating a year-end asset. This asset is not a financialresource and therefore is not reported in the funds. 1,624,791
Some of the state's revenues will be collected after year-end, but are not available soon enough to pay for the current period's expenditures,and therefore are considered deferred inflows in the funds. 1,609,332
Deferred outflows of resources represent a consumption of fund equity that willbe reported as an outflow of resources in a future period and therefore are not reported in the funds. 457,090
Deferred inflows of resources represent an acquisition of fund equity that willbe recognized as an inflow of resources in a future period and therefore are not reported in the funds. (1,883,765)
Unmatured interest on general obligation bonds is not recognized in the fundsuntil due. (391,301)
Internal service funds are used by management to charge the costs of certainactivities to individual funds. The assets and liabilities of the internal servicefunds are included in governmental activities in the Statement of Net Position. (260,750)
Some liabilities are not due and payable in the current period andtherefore are not reported in the funds. Those liabilities consist of:
Bonds and other financing contracts payable (21,736,515)$ Accreted interest on bonds (471,951) Compensated absences (517,444) Other postemployment benefits obligations (2,002,153) Net pension liability (2,907,783) Pollution remediation obligations (169,698) Unclaimed property (130,656)Claims and judgments (41,020) Other obligations (549,789)
Total long-term liabilities (28,527,009)
Net Position of Governmental Activities $ 24,333,671
The notes to the financial statements are an integral part of this statement.
Reconciliation of the Balance Sheetto the Statement of Net Position
GOVERNMENTAL FUNDS June 30, 2015
(expressed in thousands)
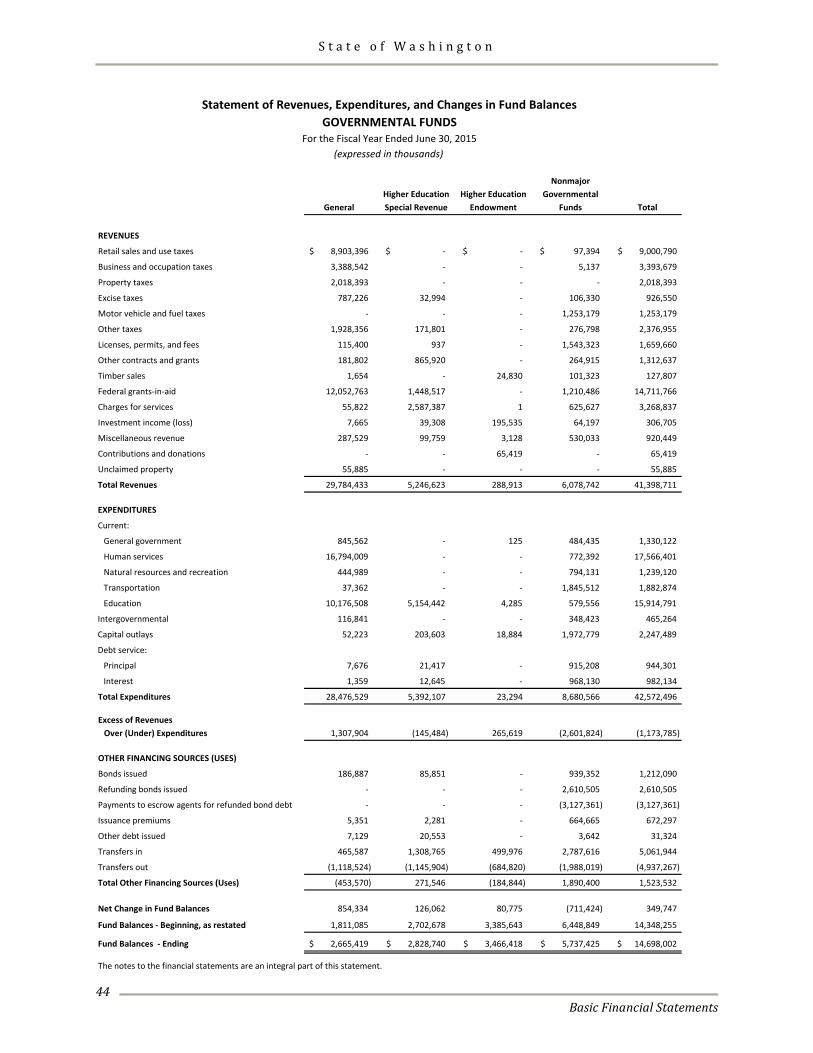
S t a t e o f W a s h i n g t o n
Basic Financial Statements
44
NonmajorHigher Education Higher Education Governmental
General Special Revenue Endowment Funds Total
REVENUES
Retail sales and use taxes 8,903,396$ -$ -$ 97,394$ 9,000,790$
Business and occupation taxes 3,388,542 - - 5,137 3,393,679
Property taxes 2,018,393 - - - 2,018,393
Excise taxes 787,226 32,994 - 106,330 926,550
Motor vehicle and fuel taxes - - - 1,253,179 1,253,179
Other taxes 1,928,356 171,801 - 276,798 2,376,955
Licenses, permits, and fees 115,400 937 - 1,543,323 1,659,660
Other contracts and grants 181,802 865,920 - 264,915 1,312,637
Timber sales 1,654 - 24,830 101,323 127,807
Federal grants-in-aid 12,052,763 1,448,517 - 1,210,486 14,711,766
Charges for services 55,822 2,587,387 1 625,627 3,268,837
Investment income (loss) 7,665 39,308 195,535 64,197 306,705
Miscellaneous revenue 287,529 99,759 3,128 530,033 920,449
Contributions and donations - - 65,419 - 65,419
Unclaimed property 55,885 - - - 55,885
Total Revenues 29,784,433 5,246,623 288,913 6,078,742 41,398,711
EXPENDITURES
Current:
General government 845,562 - 125 484,435 1,330,122
Human services 16,794,009 - - 772,392 17,566,401
Natural resources and recreation 444,989 - - 794,131 1,239,120
Transportation 37,362 - - 1,845,512 1,882,874
Education 10,176,508 5,154,442 4,285 579,556 15,914,791
Intergovernmental 116,841 - - 348,423 465,264
Capital outlays 52,223 203,603 18,884 1,972,779 2,247,489
Debt service:
Principal 7,676 21,417 - 915,208 944,301
Interest 1,359 12,645 - 968,130 982,134
Total Expenditures 28,476,529 5,392,107 23,294 8,680,566 42,572,496
Excess of RevenuesOver (Under) Expenditures 1,307,904 (145,484) 265,619 (2,601,824) (1,173,785)
OTHER FINANCING SOURCES (USES)
Bonds issued 186,887 85,851 - 939,352 1,212,090
Refunding bonds issued - - - 2,610,505 2,610,505
Payments to escrow agents for refunded bond debt - - - (3,127,361) (3,127,361)
Issuance premiums 5,351 2,281 - 664,665 672,297
Other debt issued 7,129 20,553 - 3,642 31,324
Transfers in 465,587 1,308,765 499,976 2,787,616 5,061,944
Transfers out (1,118,524) (1,145,904) (684,820) (1,988,019) (4,937,267)
Total Other Financing Sources (Uses) (453,570) 271,546 (184,844) 1,890,400 1,523,532
Net Change in Fund Balances 854,334 126,062 80,775 (711,424) 349,747
Fund Balances - Beginning, as restated 1,811,085 2,702,678 3,385,643 6,448,849 14,348,255
Fund Balances - Ending 2,665,419$ 2,828,740$ 3,466,418$ 5,737,425$ 14,698,002$
The notes to the financial statements are an integral part of this statement.
(expressed in thousands)For the Fiscal Year Ended June 30, 2015
GOVERNMENTAL FUNDSStatement of Revenues, Expenditures, and Changes in Fund Balances
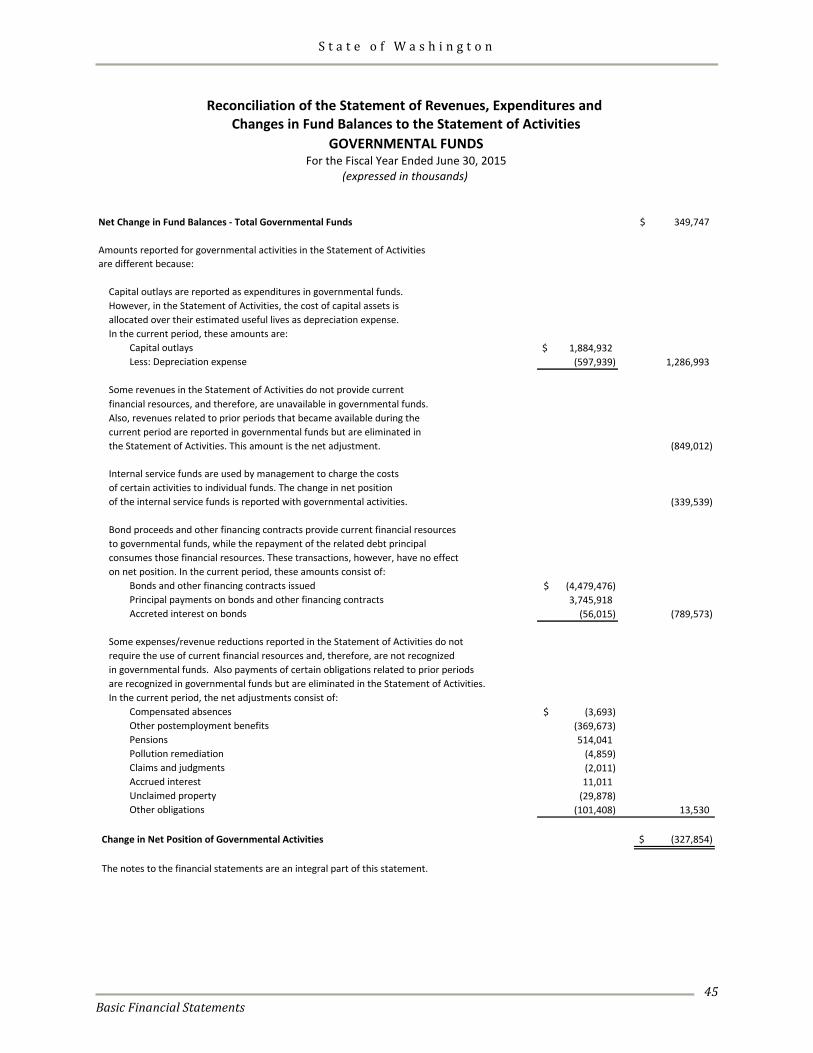
S t a t e o f W a s h i n g t o n
Basic Financial Statements
45
Net Change in Fund Balances - Total Governmental Funds 349,747$
Amounts reported for governmental activities in the Statement of Activitiesare different because:
Capital outlays are reported as expenditures in governmental funds.However, in the Statement of Activities, the cost of capital assets isallocated over their estimated useful lives as depreciation expense.In the current period, these amounts are:
Capital outlays 1,884,932$ Less: Depreciation expense (597,939) 1,286,993
Some revenues in the Statement of Activities do not provide currentfinancial resources, and therefore, are unavailable in governmental funds.Also, revenues related to prior periods that became available during thecurrent period are reported in governmental funds but are eliminated inthe Statement of Activities. This amount is the net adjustment. (849,012)
Internal service funds are used by management to charge the costsof certain activities to individual funds. The change in net position of the internal service funds is reported with governmental activities. (339,539)
Bond proceeds and other financing contracts provide current financial resourcesto governmental funds, while the repayment of the related debt principalconsumes those financial resources. These transactions, however, have no effecton net position. In the current period, these amounts consist of:
Bonds and other financing contracts issued (4,479,476)$ Principal payments on bonds and other financing contracts 3,745,918 Accreted interest on bonds (56,015) (789,573)
Some expenses/revenue reductions reported in the Statement of Activities do notrequire the use of current financial resources and, therefore, are not recognizedin governmental funds. Also payments of certain obligations related to prior periodsare recognized in governmental funds but are eliminated in the Statement of Activities.In the current period, the net adjustments consist of:
Compensated absences (3,693)$ Other postemployment benefits (369,673) Pensions 514,041 Pollution remediation (4,859) Claims and judgments (2,011) Accrued interest 11,011 Unclaimed property (29,878) Other obligations (101,408) 13,530
Change in Net Position of Governmental Activities (327,854)$
The notes to the financial statements are an integral part of this statement.
(expressed in thousands)For the Fiscal Year Ended June 30, 2015
Reconciliation of the Statement of Revenues, Expenditures and Changes in Fund Balances to the Statement of Activities
GOVERNMENTAL FUNDS
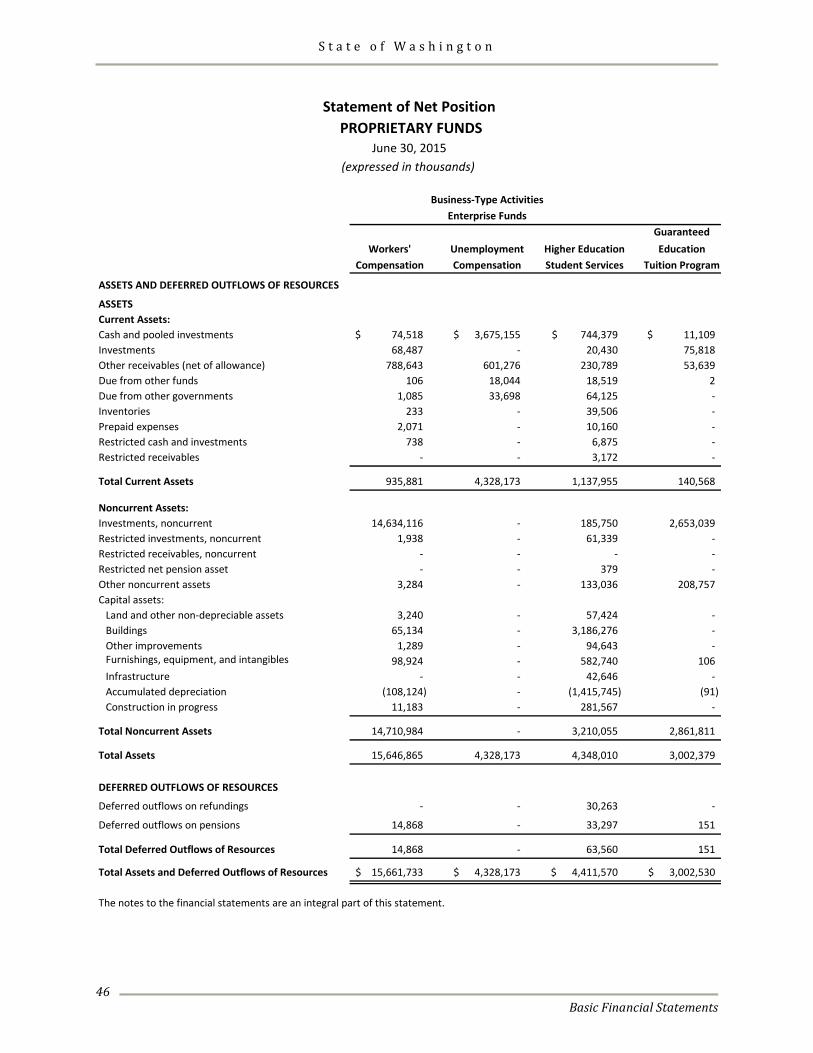
S t a t e o f W a s h i n g t o n
Basic Financial Statements
46
GuaranteedWorkers' Unemployment Higher Education Education
Compensation Compensation Student Services Tuition Program
ASSETS AND DEFERRED OUTFLOWS OF RESOURCES
ASSETSCurrent Assets:Cash and pooled investments 74,518$ 3,675,155$ 744,379$ 11,109$ Investments 68,487 - 20,430 75,818 Other receivables (net of allowance) 788,643 601,276 230,789 53,639 Due from other funds 106 18,044 18,519 2 Due from other governments 1,085 33,698 64,125 - Inventories 233 - 39,506 - Prepaid expenses 2,071 - 10,160 - Restricted cash and investments 738 - 6,875 - Restricted receivables - - 3,172 -
Total Current Assets 935,881 4,328,173 1,137,955 140,568
Noncurrent Assets:Investments, noncurrent 14,634,116 - 185,750 2,653,039 Restricted investments, noncurrent 1,938 - 61,339 - Restricted receivables, noncurrent - - - - Restricted net pension asset - - 379 - Other noncurrent assets 3,284 - 133,036 208,757 Capital assets:
Land and other non-depreciable assets 3,240 - 57,424 - Buildings 65,134 - 3,186,276 - Other improvements 1,289 - 94,643 - Furnishings, equipment, and intangibles 98,924 - 582,740 106 Infrastructure - - 42,646 - Accumulated depreciation (108,124) - (1,415,745) (91) Construction in progress 11,183 - 281,567 -
Total Noncurrent Assets 14,710,984 - 3,210,055 2,861,811
Total Assets 15,646,865 4,328,173 4,348,010 3,002,379
DEFERRED OUTFLOWS OF RESOURCES
Deferred outflows on refundings - - 30,263 -
Deferred outflows on pensions 14,868 - 33,297 151
Total Deferred Outflows of Resources 14,868 - 63,560 151
Total Assets and Deferred Outflows of Resources 15,661,733$ 4,328,173$ 4,411,570$ 3,002,530$
The notes to the financial statements are an integral part of this statement.
Business-Type ActivitiesEnterprise Funds
Statement of Net Position PROPRIETARY FUNDS
June 30, 2015(expressed in thousands)
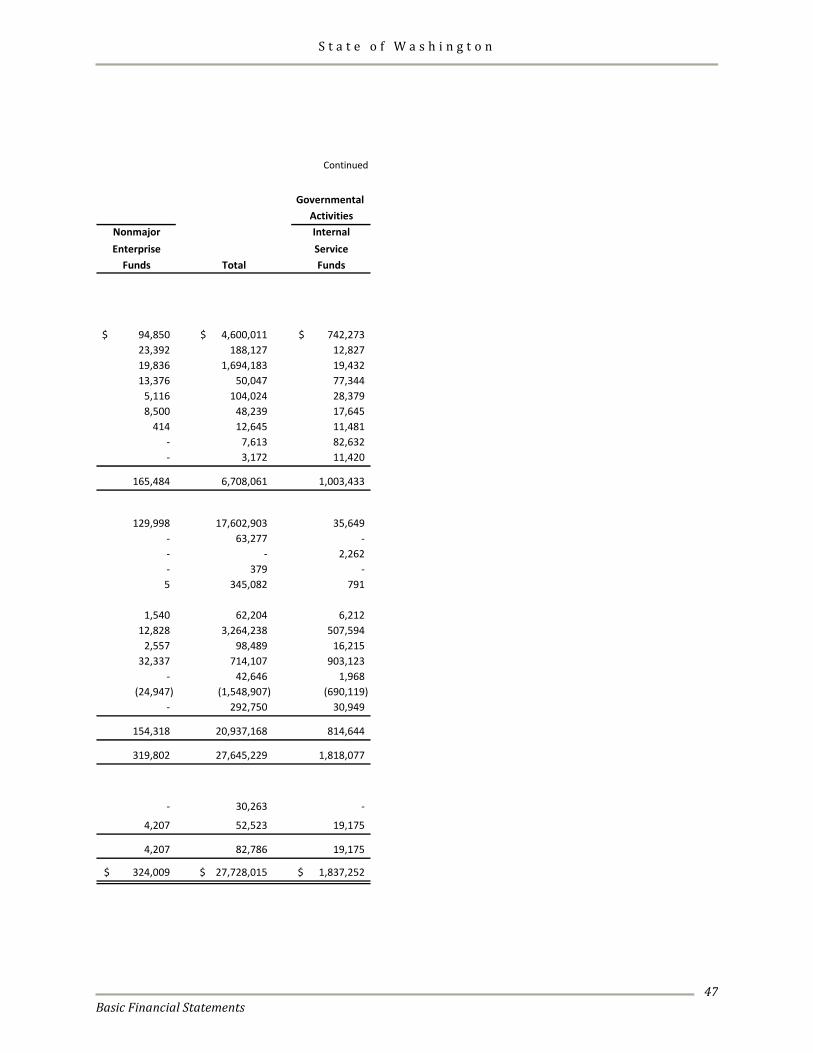
S t a t e o f W a s h i n g t o n
Basic Financial Statements
47
Continued
Governmental Activities
Nonmajor InternalEnterprise Service
Funds Total Funds
94,850$ 4,600,011$ 742,273$ 23,392 188,127 12,827 19,836 1,694,183 19,432 13,376 50,047 77,344
5,116 104,024 28,379 8,500 48,239 17,645
414 12,645 11,481 - 7,613 82,632 - 3,172 11,420
165,484 6,708,061 1,003,433
129,998 17,602,903 35,649 - 63,277 - - - 2,262 - 379 - 5 345,082 791
1,540 62,204 6,212 12,828 3,264,238 507,594
2,557 98,489 16,215 32,337 714,107 903,123
- 42,646 1,968 (24,947) (1,548,907) (690,119)
- 292,750 30,949
154,318 20,937,168 814,644
319,802 27,645,229 1,818,077
- 30,263 -
4,207 52,523 19,175
4,207 82,786 19,175
324,009$ 27,728,015$ 1,837,252$
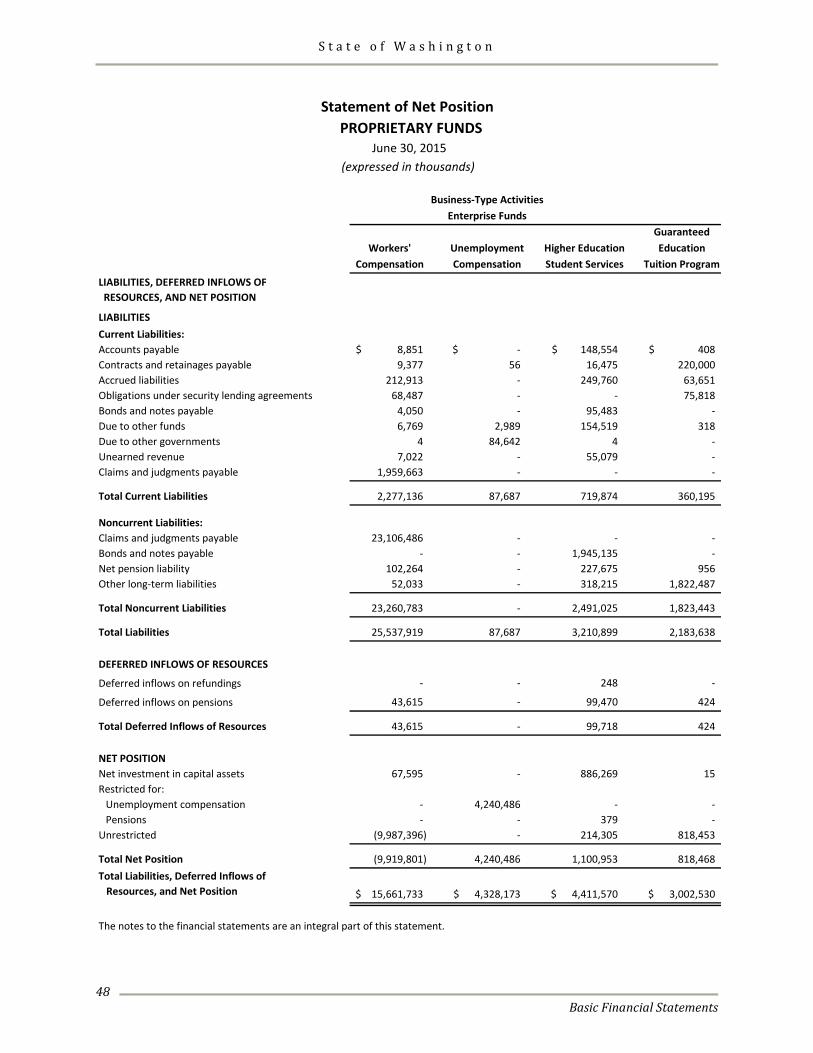
S t a t e o f W a s h i n g t o n
Basic Financial Statements
48
GuaranteedWorkers' Unemployment Higher Education Education
Compensation Compensation Student Services Tuition Program
LIABILITIES, DEFERRED INFLOWS OF RESOURCES, AND NET POSITION
LIABILITIESCurrent Liabilities:Accounts payable 8,851$ -$ 148,554$ 408$ Contracts and retainages payable 9,377 56 16,475 220,000 Accrued liabilities 212,913 - 249,760 63,651 Obligations under security lending agreements 68,487 - - 75,818 Bonds and notes payable 4,050 - 95,483 - Due to other funds 6,769 2,989 154,519 318 Due to other governments 4 84,642 4 - Unearned revenue 7,022 - 55,079 - Claims and judgments payable 1,959,663 - - -
Total Current Liabilities 2,277,136 87,687 719,874 360,195
Noncurrent Liabilities:Claims and judgments payable 23,106,486 - - - Bonds and notes payable - - 1,945,135 - Net pension liability 102,264 - 227,675 956 Other long-term liabilities 52,033 - 318,215 1,822,487
Total Noncurrent Liabilities 23,260,783 - 2,491,025 1,823,443
Total Liabilities 25,537,919 87,687 3,210,899 2,183,638
DEFERRED INFLOWS OF RESOURCES
Deferred inflows on refundings - - 248 -
Deferred inflows on pensions 43,615 - 99,470 424
Total Deferred Inflows of Resources 43,615 - 99,718 424
NET POSITIONNet investment in capital assets 67,595 - 886,269 15 Restricted for:
Unemployment compensation - 4,240,486 - - Pensions - - 379 -
Unrestricted (9,987,396) - 214,305 818,453
Total Net Position (9,919,801) 4,240,486 1,100,953 818,468 Total Liabilities, Deferred Inflows of Resources, and Net Position 15,661,733$ 4,328,173$ 4,411,570$ 3,002,530$
The notes to the financial statements are an integral part of this statement.
Enterprise FundsBusiness-Type Activities
Statement of Net Position PROPRIETARY FUNDS
June 30, 2015(expressed in thousands)
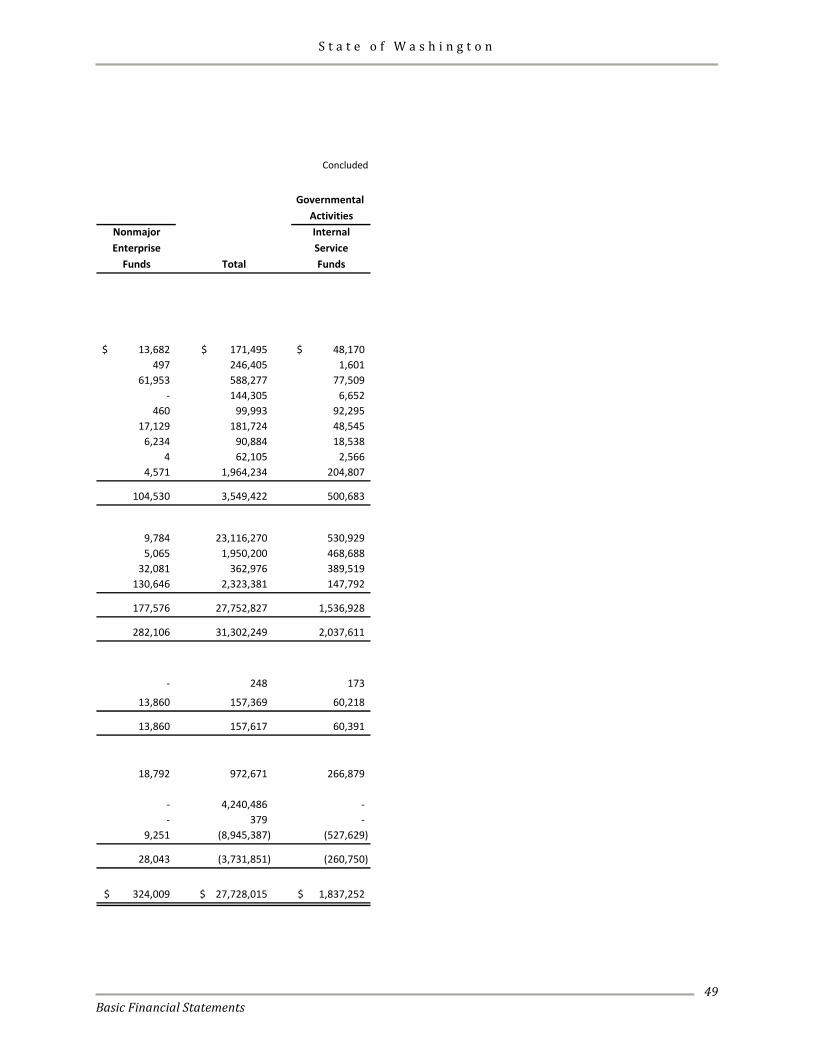
S t a t e o f W a s h i n g t o n
Basic Financial Statements
49
Concluded
Governmental Activities
Nonmajor InternalEnterprise Service
Funds Total Funds
13,682$ 171,495$ 48,170$ 497 246,405 1,601
61,953 588,277 77,509 - 144,305 6,652
460 99,993 92,295 17,129 181,724 48,545
6,234 90,884 18,538 4 62,105 2,566
4,571 1,964,234 204,807
104,530 3,549,422 500,683
9,784 23,116,270 530,929 5,065 1,950,200 468,688
32,081 362,976 389,519 130,646 2,323,381 147,792
177,576 27,752,827 1,536,928
282,106 31,302,249 2,037,611
- 248 173
13,860 157,369 60,218
13,860 157,617 60,391
18,792 972,671 266,879
- 4,240,486 - - 379 -
9,251 (8,945,387) (527,629)
28,043 (3,731,851) (260,750)
324,009$ 27,728,015$ 1,837,252$
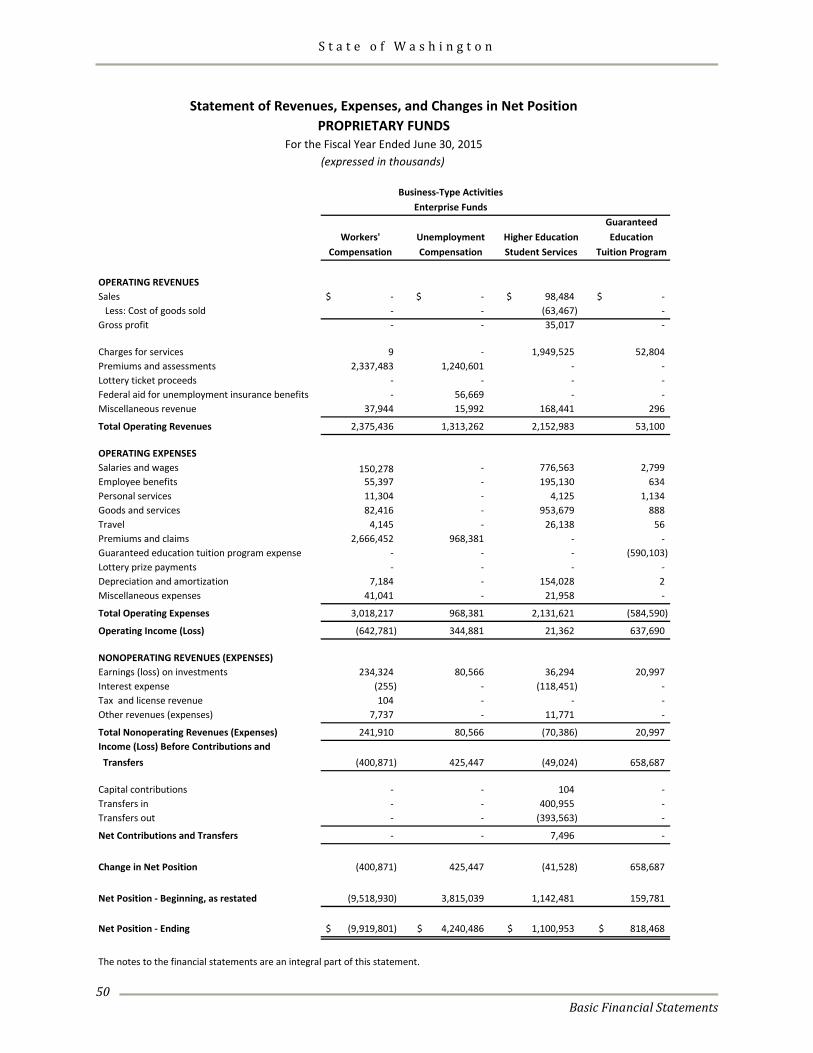
S t a t e o f W a s h i n g t o n
Basic Financial Statements
50
GuaranteedWorkers' Unemployment Higher Education Education
Compensation Compensation Student Services Tuition Program
OPERATING REVENUESSales -$ -$ 98,484$ -$
Less: Cost of goods sold - - (63,467) - Gross profit - - 35,017 -
Charges for services 9 - 1,949,525 52,804 Premiums and assessments 2,337,483 1,240,601 - - Lottery ticket proceeds - - - - Federal aid for unemployment insurance benefits - 56,669 - - Miscellaneous revenue 37,944 15,992 168,441 296
Total Operating Revenues 2,375,436 1,313,262 2,152,983 53,100
OPERATING EXPENSESSalaries and wages 150,278 - 776,563 2,799 Employee benefits 55,397 - 195,130 634 Personal services 11,304 - 4,125 1,134 Goods and services 82,416 - 953,679 888 Travel 4,145 - 26,138 56 Premiums and claims 2,666,452 968,381 - - Guaranteed education tuition program expense - - - (590,103) Lottery prize payments - - - - Depreciation and amortization 7,184 - 154,028 2 Miscellaneous expenses 41,041 - 21,958 -
Total Operating Expenses 3,018,217 968,381 2,131,621 (584,590)
Operating Income (Loss) (642,781) 344,881 21,362 637,690
NONOPERATING REVENUES (EXPENSES)Earnings (loss) on investments 234,324 80,566 36,294 20,997 Interest expense (255) - (118,451) - Tax and license revenue 104 - - - Other revenues (expenses) 7,737 - 11,771 -
Total Nonoperating Revenues (Expenses) 241,910 80,566 (70,386) 20,997 Income (Loss) Before Contributions and Transfers (400,871) 425,447 (49,024) 658,687
Capital contributions - - 104 - Transfers in - - 400,955 - Transfers out - - (393,563) -
Net Contributions and Transfers - - 7,496 -
Change in Net Position (400,871) 425,447 (41,528) 658,687
Net Position - Beginning, as restated (9,518,930) 3,815,039 1,142,481 159,781
Net Position - Ending (9,919,801)$ 4,240,486$ 1,100,953$ 818,468$
The notes to the financial statements are an integral part of this statement.
Business-Type ActivitiesEnterprise Funds
Statement of Revenues, Expenses, and Changes in Net PositionPROPRIETARY FUNDS
For the Fiscal Year Ended June 30, 2015(expressed in thousands)
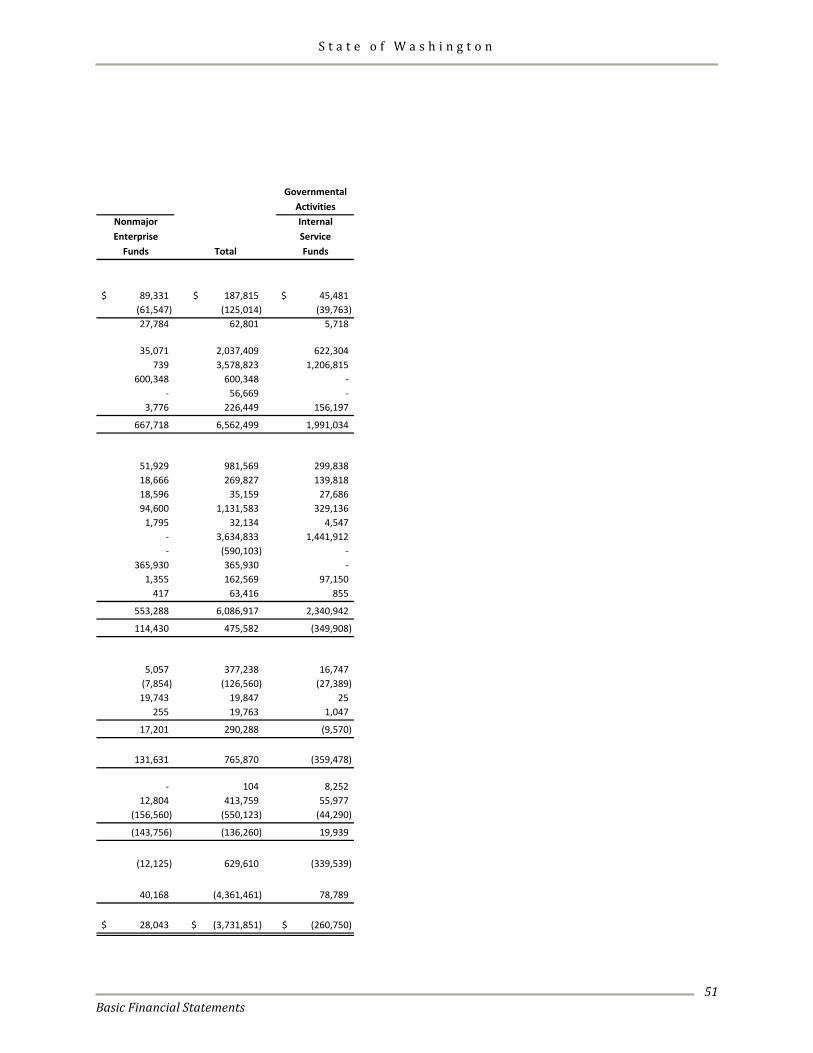
S t a t e o f W a s h i n g t o n
Basic Financial Statements
51
GovernmentalActivities
Nonmajor InternalEnterprise Service
Funds Total Funds
89,331$ 187,815$ 45,481$ (61,547) (125,014) (39,763) 27,784 62,801 5,718
35,071 2,037,409 622,304 739 3,578,823 1,206,815
600,348 600,348 - - 56,669 -
3,776 226,449 156,197
667,718 6,562,499 1,991,034
51,929 981,569 299,838 18,666 269,827 139,818 18,596 35,159 27,686 94,600 1,131,583 329,136
1,795 32,134 4,547 - 3,634,833 1,441,912 - (590,103) -
365,930 365,930 - 1,355 162,569 97,150
417 63,416 855
553,288 6,086,917 2,340,942
114,430 475,582 (349,908)
5,057 377,238 16,747 (7,854) (126,560) (27,389) 19,743 19,847 25
255 19,763 1,047
17,201 290,288 (9,570)
131,631 765,870 (359,478)
- 104 8,252 12,804 413,759 55,977
(156,560) (550,123) (44,290)
(143,756) (136,260) 19,939
(12,125) 629,610 (339,539)
40,168 (4,361,461) 78,789
28,043$ (3,731,851)$ (260,750)$
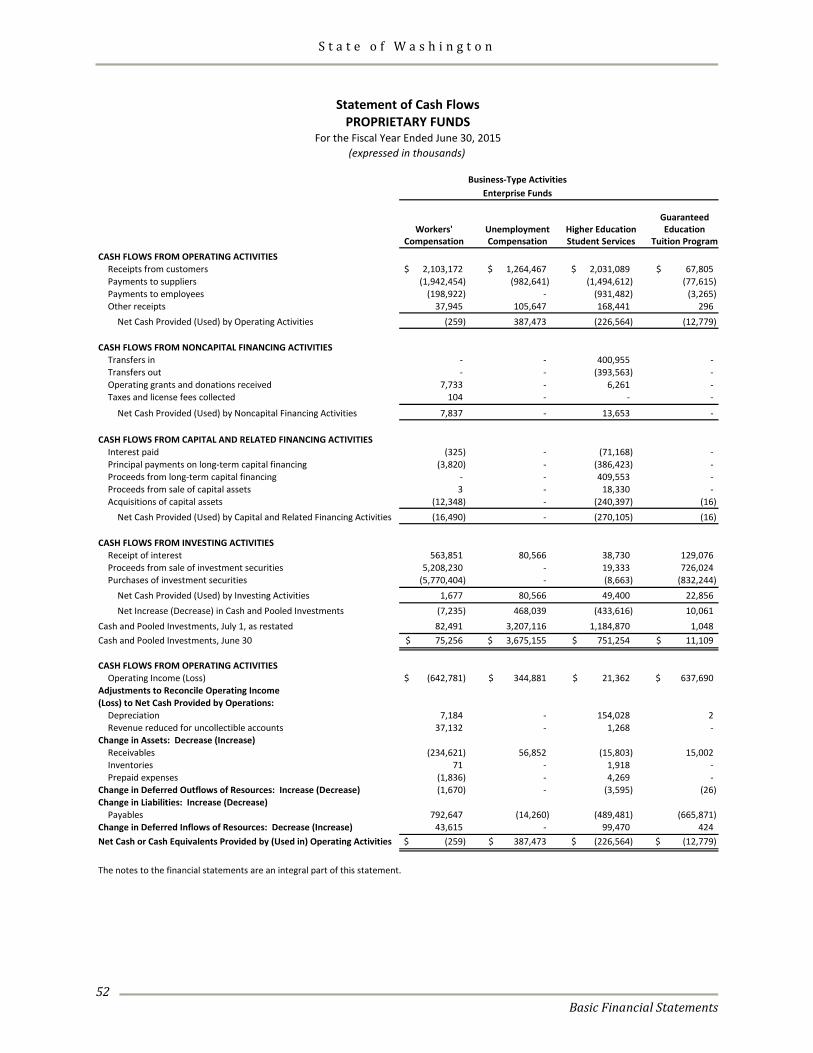
S t a t e o f W a s h i n g t o n
Basic Financial Statements
52
GuaranteedWorkers' Unemployment Higher Education Education
Compensation Compensation Student Services Tuition ProgramCASH FLOWS FROM OPERATING ACTIVITIES
Receipts from customers 2,103,172$ 1,264,467$ 2,031,089$ 67,805$ Payments to suppliers (1,942,454) (982,641) (1,494,612) (77,615) Payments to employees (198,922) - (931,482) (3,265) Other receipts 37,945 105,647 168,441 296
Net Cash Provided (Used) by Operating Activities (259) 387,473 (226,564) (12,779)
CASH FLOWS FROM NONCAPITAL FINANCING ACTIVITIESTransfers in - - 400,955 - Transfers out - - (393,563) - Operating grants and donations received 7,733 - 6,261 - Taxes and license fees collected 104 - - -
Net Cash Provided (Used) by Noncapital Financing Activities 7,837 - 13,653 -
CASH FLOWS FROM CAPITAL AND RELATED FINANCING ACTIVITIESInterest paid (325) - (71,168) - Principal payments on long-term capital financing (3,820) - (386,423) - Proceeds from long-term capital financing - - 409,553 - Proceeds from sale of capital assets 3 - 18,330 - Acquisitions of capital assets (12,348) - (240,397) (16)
Net Cash Provided (Used) by Capital and Related Financing Activities (16,490) - (270,105) (16)
CASH FLOWS FROM INVESTING ACTIVITIESReceipt of interest 563,851 80,566 38,730 129,076 Proceeds from sale of investment securities 5,208,230 - 19,333 726,024 Purchases of investment securities (5,770,404) - (8,663) (832,244)
Net Cash Provided (Used) by Investing Activities 1,677 80,566 49,400 22,856 Net Increase (Decrease) in Cash and Pooled Investments (7,235) 468,039 (433,616) 10,061
Cash and Pooled Investments, July 1, as restated 82,491 3,207,116 1,184,870 1,048 Cash and Pooled Investments, June 30 75,256$ 3,675,155$ 751,254$ 11,109$
CASH FLOWS FROM OPERATING ACTIVITIESOperating Income (Loss) (642,781)$ 344,881$ 21,362$ 637,690$
Adjustments to Reconcile Operating Income(Loss) to Net Cash Provided by Operations:
Depreciation 7,184 - 154,028 2 Revenue reduced for uncollectible accounts 37,132 - 1,268 -
Change in Assets: Decrease (Increase)Receivables (234,621) 56,852 (15,803) 15,002 Inventories 71 - 1,918 - Prepaid expenses (1,836) - 4,269 -
Change in Deferred Outflows of Resources: Increase (Decrease) (1,670) - (3,595) (26) Change in Liabilities: Increase (Decrease)
Payables 792,647 (14,260) (489,481) (665,871) Change in Deferred Inflows of Resources: Decrease (Increase) 43,615 - 99,470 424 Net Cash or Cash Equivalents Provided by (Used in) Operating Activities (259)$ 387,473$ (226,564)$ (12,779)$
The notes to the financial statements are an integral part of this statement.
Business-Type ActivitiesEnterprise Funds
Statement of Cash FlowsPROPRIETARY FUNDS
For the Fiscal Year Ended June 30, 2015(expressed in thousands)
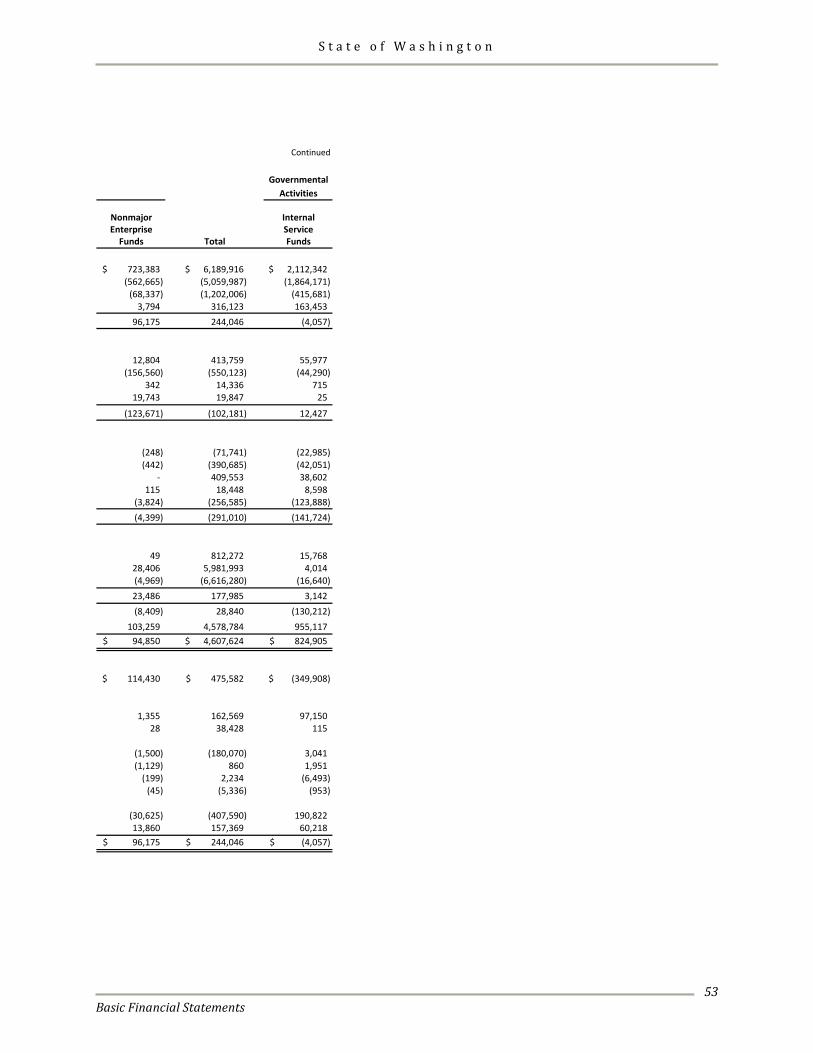
S t a t e o f W a s h i n g t o n
Basic Financial Statements
53
Continued
GovernmentalActivities
Nonmajor InternalEnterprise Service
Funds Total Funds
723,383$ 6,189,916$ 2,112,342$ (562,665) (5,059,987) (1,864,171)
(68,337) (1,202,006) (415,681) 3,794 316,123 163,453
96,175 244,046 (4,057)
12,804 413,759 55,977 (156,560) (550,123) (44,290)
342 14,336 715 19,743 19,847 25
(123,671) (102,181) 12,427
(248) (71,741) (22,985) (442) (390,685) (42,051)
- 409,553 38,602 115 18,448 8,598
(3,824) (256,585) (123,888) (4,399) (291,010) (141,724)
49 812,272 15,768 28,406 5,981,993 4,014 (4,969) (6,616,280) (16,640) 23,486 177,985 3,142 (8,409) 28,840 (130,212)
103,259 4,578,784 955,117 94,850$ 4,607,624$ 824,905$
114,430$ 475,582$ (349,908)$
1,355 162,569 97,150 28 38,428 115
(1,500) (180,070) 3,041 (1,129) 860 1,951
(199) 2,234 (6,493) (45) (5,336) (953)
(30,625) (407,590) 190,822 13,860 157,369 60,218 96,175$ 244,046$ (4,057)$
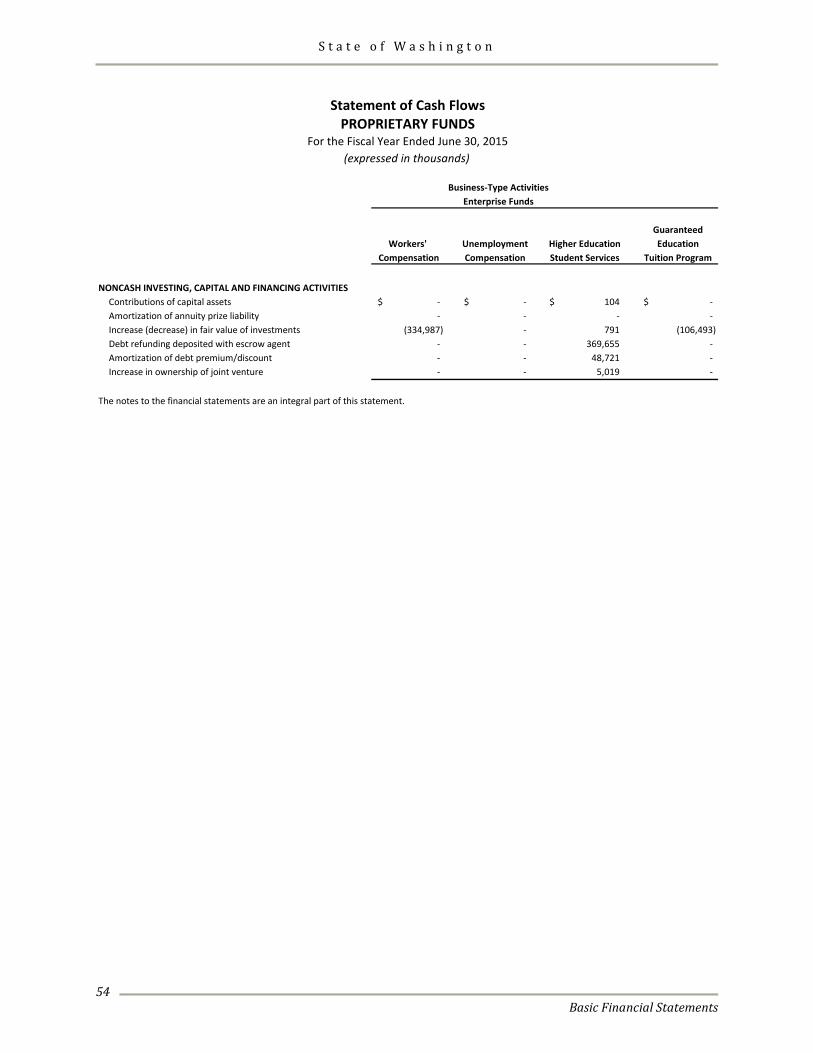
S t a t e o f W a s h i n g t o n
Basic Financial Statements
54
GuaranteedWorkers' Unemployment Higher Education Education
Compensation Compensation Student Services Tuition Program
NONCASH INVESTING, CAPITAL AND FINANCING ACTIVITIESContributions of capital assets -$ -$ 104$ -$ Amortization of annuity prize liability - - - - Increase (decrease) in fair value of investments (334,987) - 791 (106,493) Debt refunding deposited with escrow agent - - 369,655 - Amortization of debt premium/discount - - 48,721 - Increase in ownership of joint venture - - 5,019 -
The notes to the financial statements are an integral part of this statement.
Business-Type ActivitiesEnterprise Funds
Statement of Cash FlowsPROPRIETARY FUNDS
For the Fiscal Year Ended June 30, 2015(expressed in thousands)
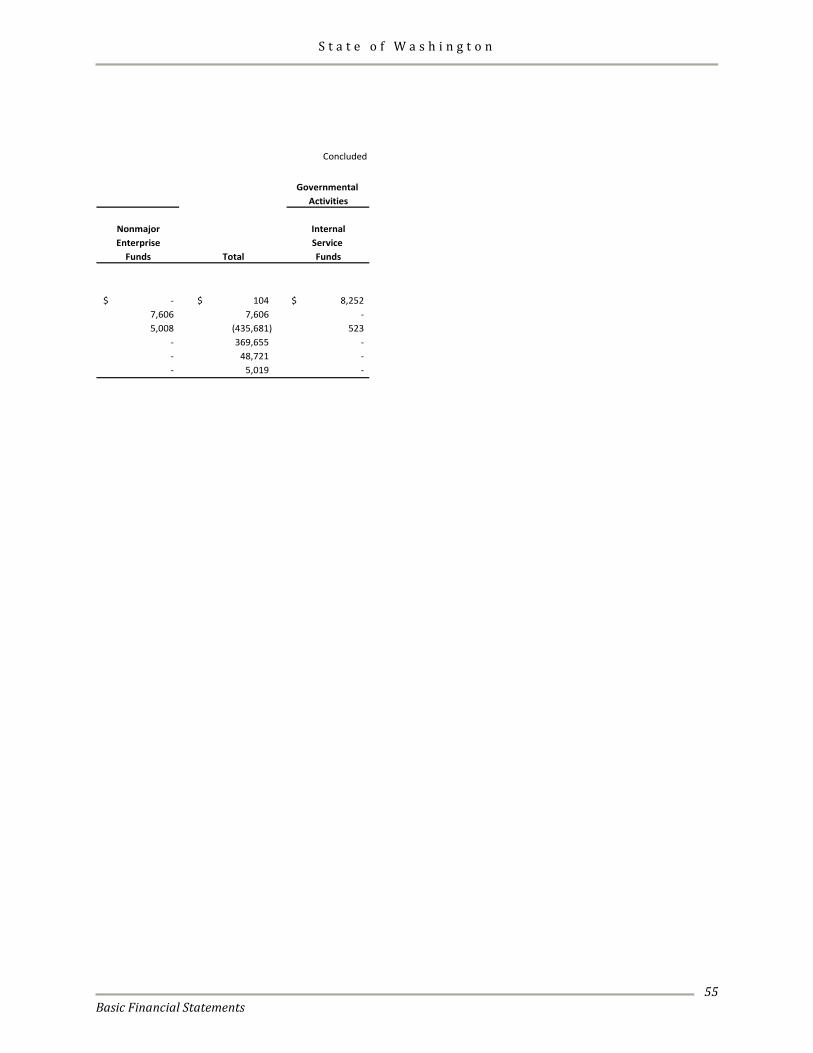
S t a t e o f W a s h i n g t o n
Basic Financial Statements
55
Concluded
Governmental Activities
Nonmajor InternalEnterprise Service
Funds Total Funds
-$ 104$ 8,252$ 7,606 7,606 - 5,008 (435,681) 523
- 369,655 - - 48,721 - - 5,019 -
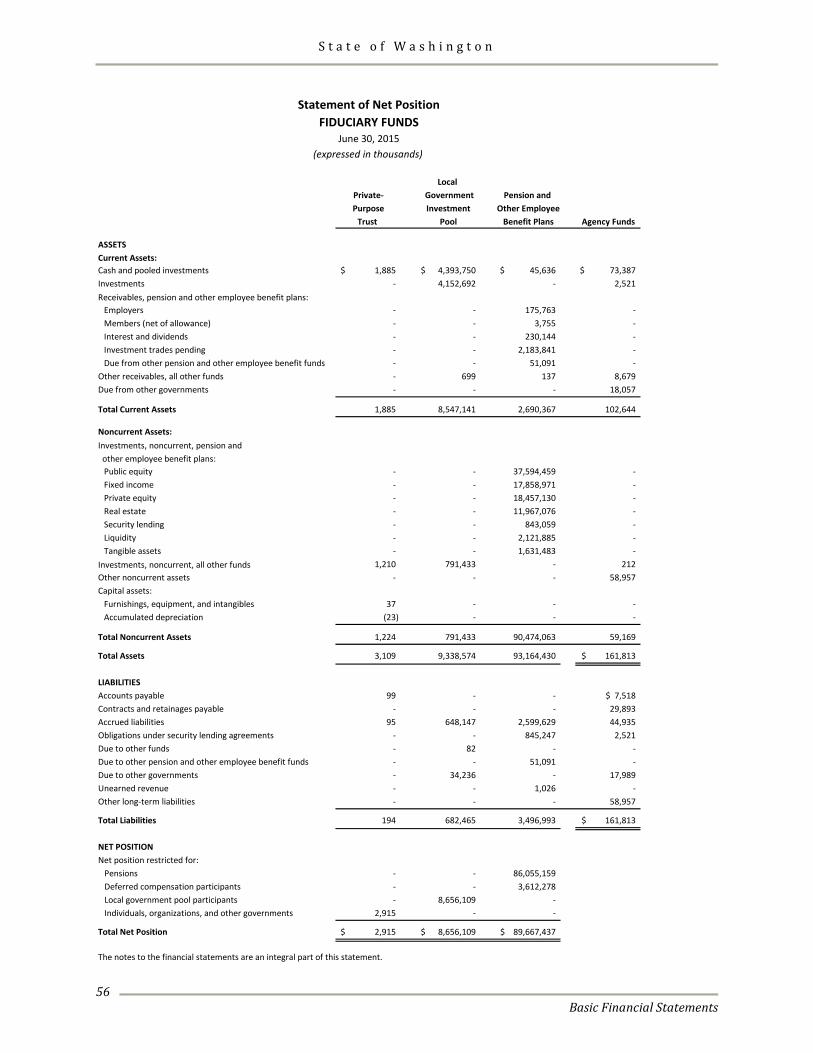
S t a t e o f W a s h i n g t o n
Basic Financial Statements
56
Local Private- Government Pension and Purpose Investment Other Employee
Trust Pool Benefit Plans Agency Funds
ASSETSCurrent Assets:Cash and pooled investments 1,885$ 4,393,750$ 45,636$ 73,387$ Investments - 4,152,692 - 2,521 Receivables, pension and other employee benefit plans:
Employers - - 175,763 - Members (net of allowance) - - 3,755 - Interest and dividends - - 230,144 - Investment trades pending - - 2,183,841 - Due from other pension and other employee benefit funds - - 51,091 -
Other receivables, all other funds - 699 137 8,679 Due from other governments - - - 18,057
Total Current Assets 1,885 8,547,141 2,690,367 102,644
Noncurrent Assets:Investments, noncurrent, pension and other employee benefit plans:
Public equity - - 37,594,459 - Fixed income - - 17,858,971 - Private equity - - 18,457,130 - Real estate - - 11,967,076 - Security lending - - 843,059 - Liquidity - - 2,121,885 - Tangible assets - - 1,631,483 -
Investments, noncurrent, all other funds 1,210 791,433 - 212 Other noncurrent assets - - - 58,957 Capital assets:
Furnishings, equipment, and intangibles 37 - - - Accumulated depreciation (23) - - -
Total Noncurrent Assets 1,224 791,433 90,474,063 59,169
Total Assets 3,109 9,338,574 93,164,430 161,813$
LIABILITIESAccounts payable 99 - - $ 7,518Contracts and retainages payable - - - 29,893 Accrued liabilities 95 648,147 2,599,629 44,935 Obligations under security lending agreements - - 845,247 2,521 Due to other funds - 82 - - Due to other pension and other employee benefit funds - - 51,091 - Due to other governments - 34,236 - 17,989 Unearned revenue - - 1,026 - Other long-term liabilities - - - 58,957
Total Liabilities 194 682,465 3,496,993 161,813$
NET POSITIONNet position restricted for: Pensions - - 86,055,159 Deferred compensation participants - - 3,612,278 Local government pool participants - 8,656,109 - Individuals, organizations, and other governments 2,915 - -
Total Net Position 2,915$ 8,656,109$ 89,667,437$
The notes to the financial statements are an integral part of this statement.
(expressed in thousands)
Statement of Net Position
June 30, 2015FIDUCIARY FUNDS
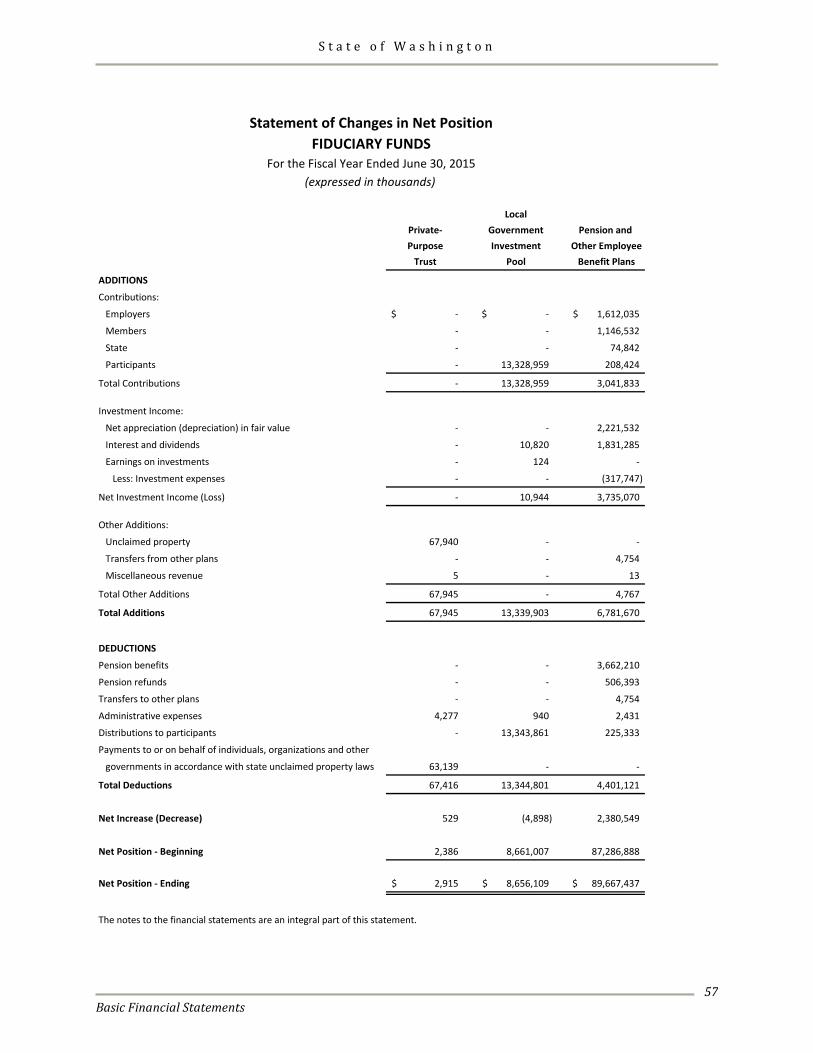
S t a t e o f W a s h i n g t o n
Basic Financial Statements
57
LocalPrivate- Government Pension and Purpose Investment Other Employee
Trust Pool Benefit Plans
ADDITIONS
Contributions:
Employers -$ -$ 1,612,035$
Members - - 1,146,532
State - - 74,842
Participants - 13,328,959 208,424
Total Contributions - 13,328,959 3,041,833
Investment Income:
Net appreciation (depreciation) in fair value - - 2,221,532
Interest and dividends - 10,820 1,831,285
Earnings on investments - 124 -
Less: Investment expenses - - (317,747)
Net Investment Income (Loss) - 10,944 3,735,070
Other Additions:
Unclaimed property 67,940 - -
Transfers from other plans - - 4,754
Miscellaneous revenue 5 - 13
Total Other Additions 67,945 - 4,767
Total Additions 67,945 13,339,903 6,781,670
DEDUCTIONS
Pension benefits - - 3,662,210
Pension refunds - - 506,393
Transfers to other plans - - 4,754
Administrative expenses 4,277 940 2,431
Distributions to participants - 13,343,861 225,333
Payments to or on behalf of individuals, organizations and other
governments in accordance with state unclaimed property laws 63,139 - -
Total Deductions 67,416 13,344,801 4,401,121
Net Increase (Decrease) 529 (4,898) 2,380,549
Net Position - Beginning 2,386 8,661,007 87,286,888
Net Position - Ending 2,915$ 8,656,109$ 89,667,437$
The notes to the financial statements are an integral part of this statement.
Statement of Changes in Net Position
(expressed in thousands)For the Fiscal Year Ended June 30, 2015
FIDUCIARY FUNDS
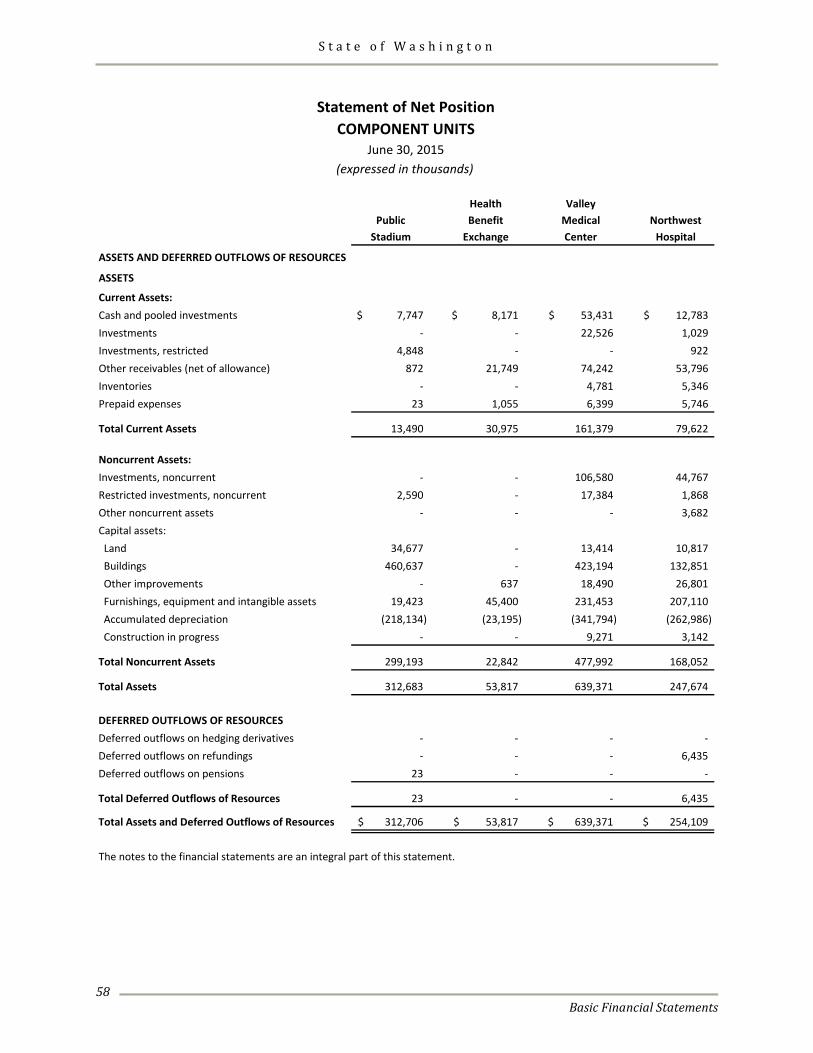
S t a t e o f W a s h i n g t o n
Basic Financial Statements
58
Health ValleyPublic Benefit Medical Northwest
Stadium Exchange Center Hospital
ASSETS AND DEFERRED OUTFLOWS OF RESOURCES
ASSETS
Current Assets:Cash and pooled investments 7,747$ 8,171$ 53,431$ 12,783$ Investments - - 22,526 1,029 Investments, restricted 4,848 - - 922 Other receivables (net of allowance) 872 21,749 74,242 53,796 Inventories - - 4,781 5,346 Prepaid expenses 23 1,055 6,399 5,746
Total Current Assets 13,490 30,975 161,379 79,622
Noncurrent Assets:Investments, noncurrent - - 106,580 44,767 Restricted investments, noncurrent 2,590 - 17,384 1,868 Other noncurrent assets - - - 3,682 Capital assets: Land 34,677 - 13,414 10,817 Buildings 460,637 - 423,194 132,851 Other improvements - 637 18,490 26,801 Furnishings, equipment and intangible assets 19,423 45,400 231,453 207,110 Accumulated depreciation (218,134) (23,195) (341,794) (262,986) Construction in progress - - 9,271 3,142
Total Noncurrent Assets 299,193 22,842 477,992 168,052
Total Assets 312,683 53,817 639,371 247,674
DEFERRED OUTFLOWS OF RESOURCESDeferred outflows on hedging derivatives - - - - Deferred outflows on refundings - - - 6,435 Deferred outflows on pensions 23 - - -
Total Deferred Outflows of Resources 23 - - 6,435
Total Assets and Deferred Outflows of Resources 312,706$ 53,817$ 639,371$ 254,109$
The notes to the financial statements are an integral part of this statement.
Statement of Net PositionCOMPONENT UNITS
June 30, 2015(expressed in thousands)
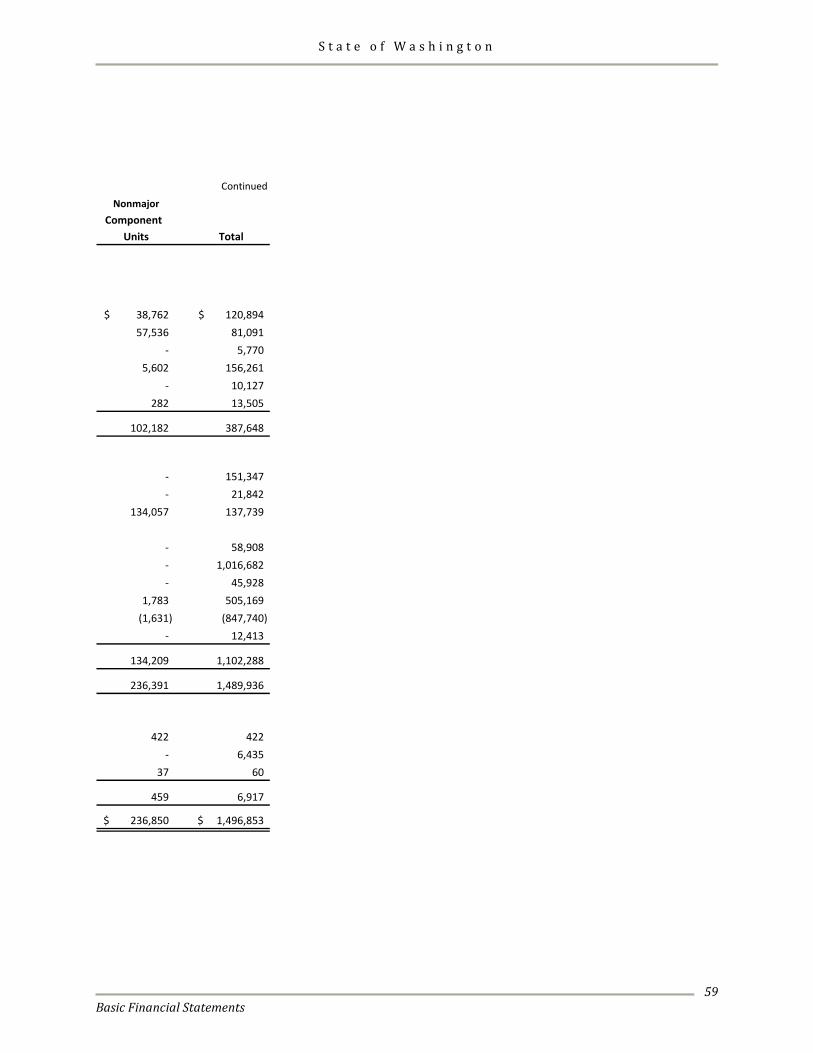
S t a t e o f W a s h i n g t o n
Basic Financial Statements
59
Continued
NonmajorComponent
Units Total
38,762$ 120,894$ 57,536 81,091
- 5,770 5,602 156,261
- 10,127 282 13,505
102,182 387,648
- 151,347 - 21,842
134,057 137,739
- 58,908 - 1,016,682 - 45,928
1,783 505,169 (1,631) (847,740)
- 12,413
134,209 1,102,288
236,391 1,489,936
422 422 - 6,435
37 60
459 6,917
236,850$ 1,496,853$
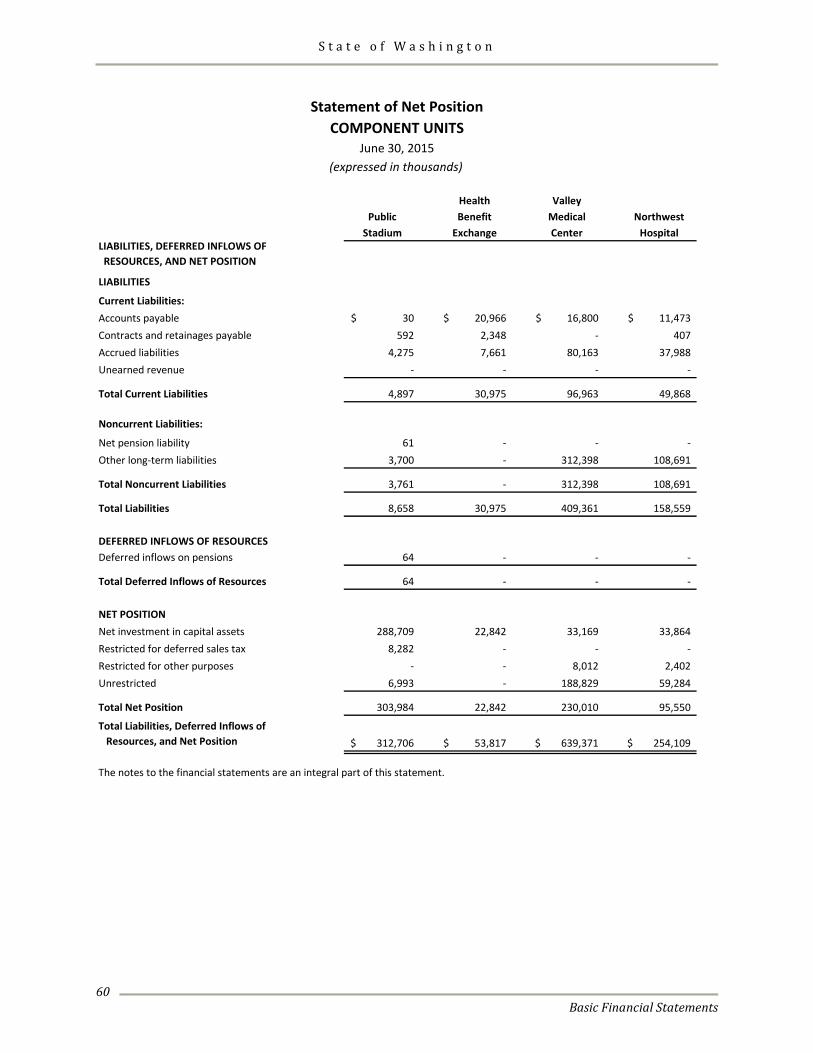
S t a t e o f W a s h i n g t o n
Basic Financial Statements
60
Health ValleyPublic Benefit Medical Northwest
Stadium Exchange Center HospitalLIABILITIES, DEFERRED INFLOWS OF RESOURCES, AND NET POSITION
LIABILITIES
Current Liabilities:Accounts payable 30$ 20,966$ 16,800$ 11,473$ Contracts and retainages payable 592 2,348 - 407 Accrued liabilities 4,275 7,661 80,163 37,988 Unearned revenue - - - -
Total Current Liabilities 4,897 30,975 96,963 49,868
Noncurrent Liabilities:
Net pension liability 61 - - - Other long-term liabilities 3,700 - 312,398 108,691
Total Noncurrent Liabilities 3,761 - 312,398 108,691
Total Liabilities 8,658 30,975 409,361 158,559
DEFERRED INFLOWS OF RESOURCESDeferred inflows on pensions 64 - - -
Total Deferred Inflows of Resources 64 - - -
NET POSITIONNet investment in capital assets 288,709 22,842 33,169 33,864 Restricted for deferred sales tax 8,282 - - - Restricted for other purposes - - 8,012 2,402 Unrestricted 6,993 - 188,829 59,284
Total Net Position 303,984 22,842 230,010 95,550
Total Liabilities, Deferred Inflows of Resources, and Net Position 312,706$ 53,817$ 639,371$ 254,109$
The notes to the financial statements are an integral part of this statement.
June 30, 2015(expressed in thousands)
COMPONENT UNITSStatement of Net Position
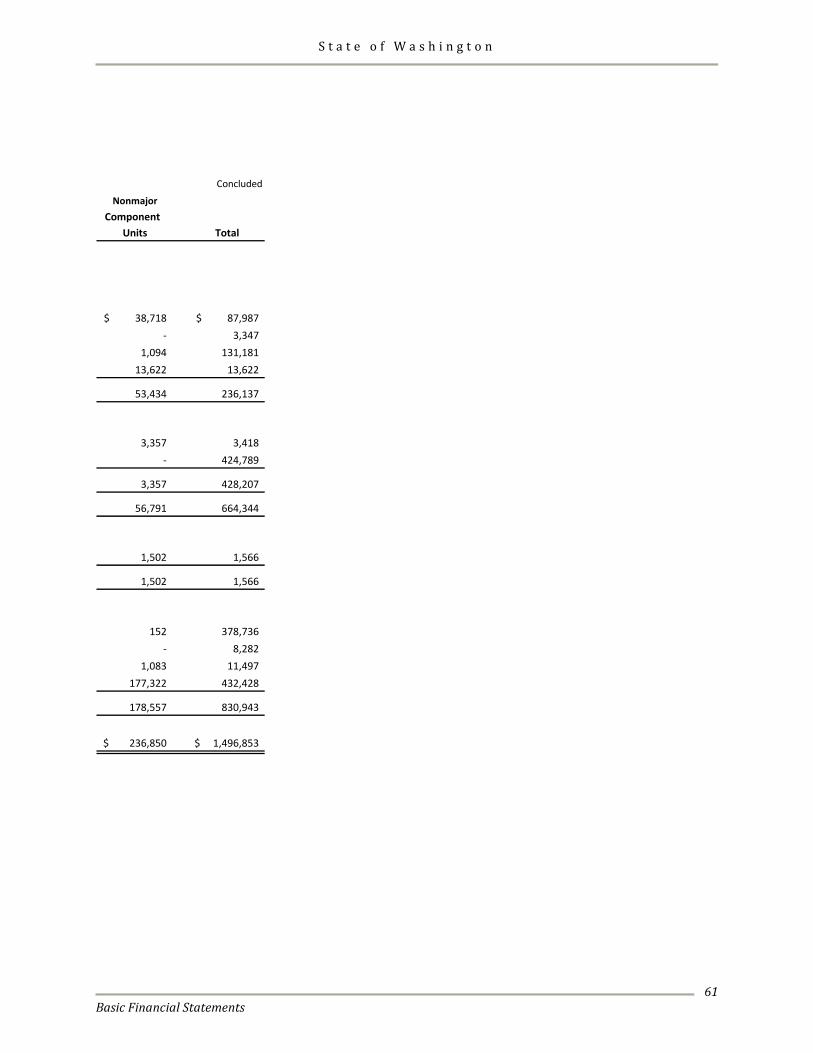
S t a t e o f W a s h i n g t o n
Basic Financial Statements
61
Concluded
NonmajorComponent
Units Total
38,718$ 87,987$ - 3,347
1,094 131,181 13,622 13,622
53,434 236,137
3,357 3,418 - 424,789
3,357 428,207
56,791 664,344
1,502 1,566
1,502 1,566
152 378,736 - 8,282
1,083 11,497 177,322 432,428
178,557 830,943
236,850$ 1,496,853$
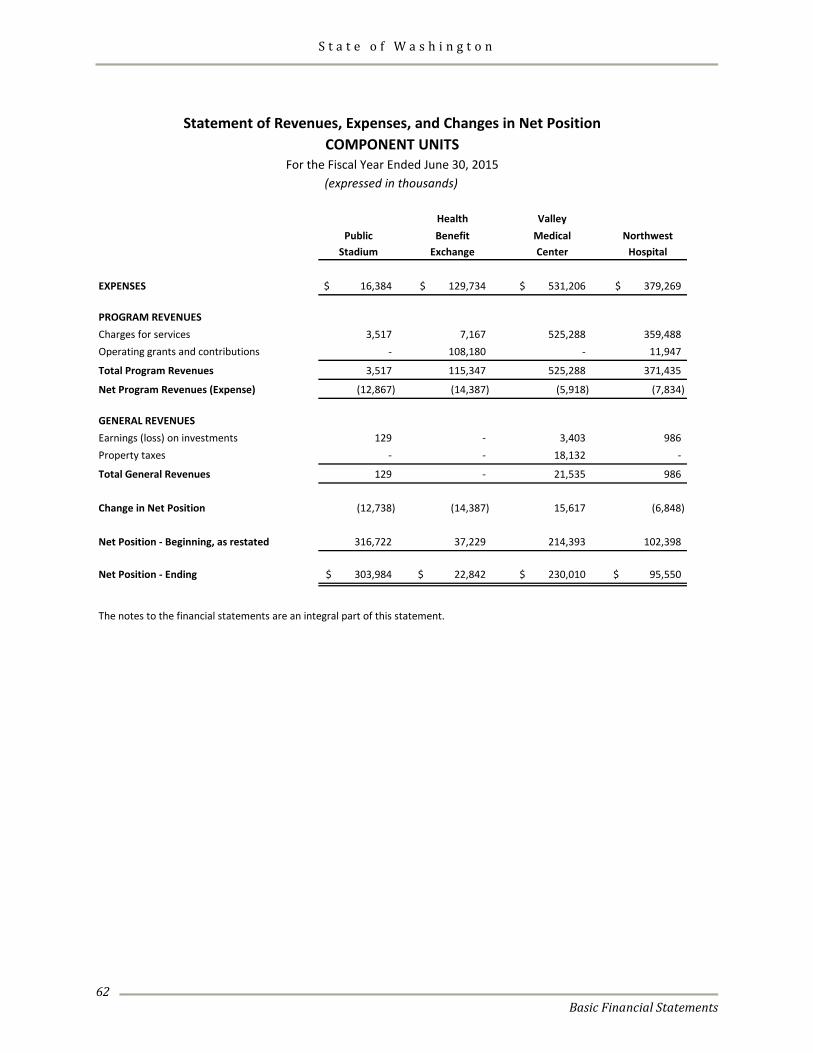
S t a t e o f W a s h i n g t o n
Basic Financial Statements
62
Health ValleyPublic Benefit Medical Northwest
Stadium Exchange Center Hospital
EXPENSES 16,384$ 129,734$ 531,206$ 379,269$
PROGRAM REVENUESCharges for services 3,517 7,167 525,288 359,488 Operating grants and contributions - 108,180 - 11,947
Total Program Revenues 3,517 115,347 525,288 371,435
Net Program Revenues (Expense) (12,867) (14,387) (5,918) (7,834)
GENERAL REVENUESEarnings (loss) on investments 129 - 3,403 986 Property taxes - - 18,132 -
Total General Revenues 129 - 21,535 986
Change in Net Position (12,738) (14,387) 15,617 (6,848)
Net Position - Beginning, as restated 316,722 37,229 214,393 102,398
Net Position - Ending 303,984$ 22,842$ 230,010$ 95,550$
The notes to the financial statements are an integral part of this statement.
Statement of Revenues, Expenses, and Changes in Net PositionCOMPONENT UNITS
For the Fiscal Year Ended June 30, 2015(expressed in thousands)
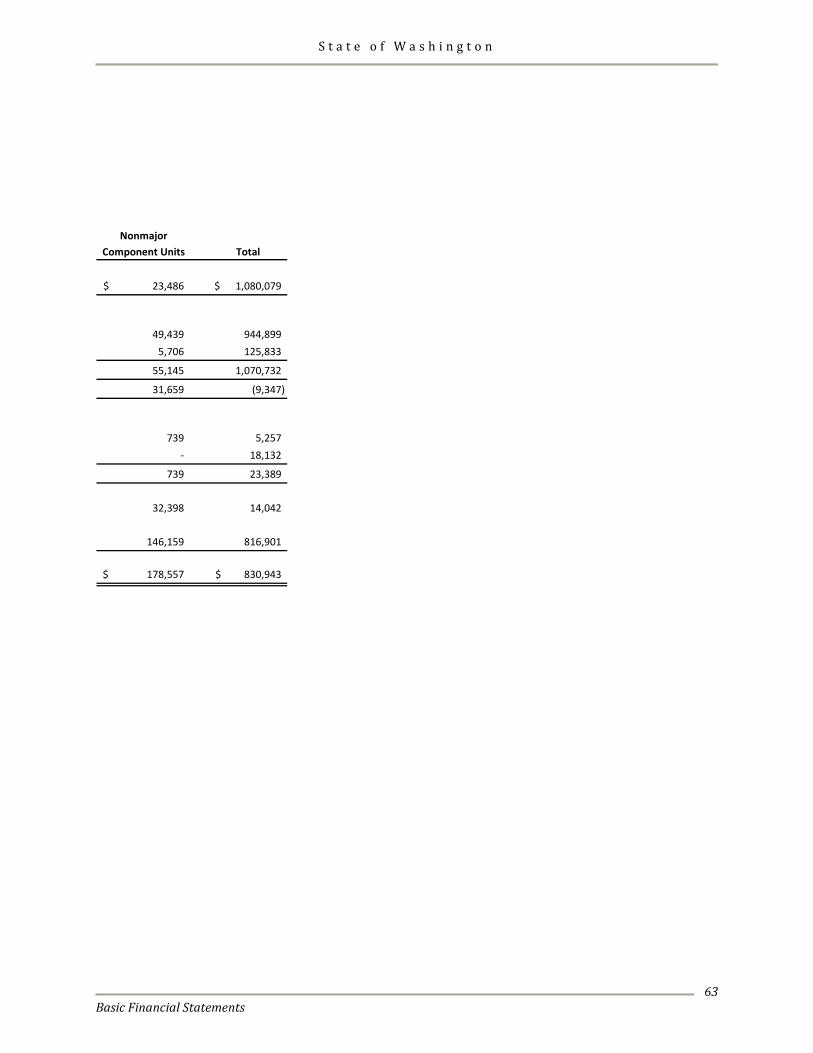
S t a t e o f W a s h i n g t o n
Basic Financial Statements
63
NonmajorComponent Units Total
23,486$ 1,080,079$
49,439 944,899 5,706 125,833
55,145 1,070,732
31,659 (9,347)
739 5,257 - 18,132
739 23,389
32,398 14,042
146,159 816,901
178,557$ 830,943$

S t a t e o f W a s h i n g t o n
Basic Financial Statements
64
This page intentionally left blank.
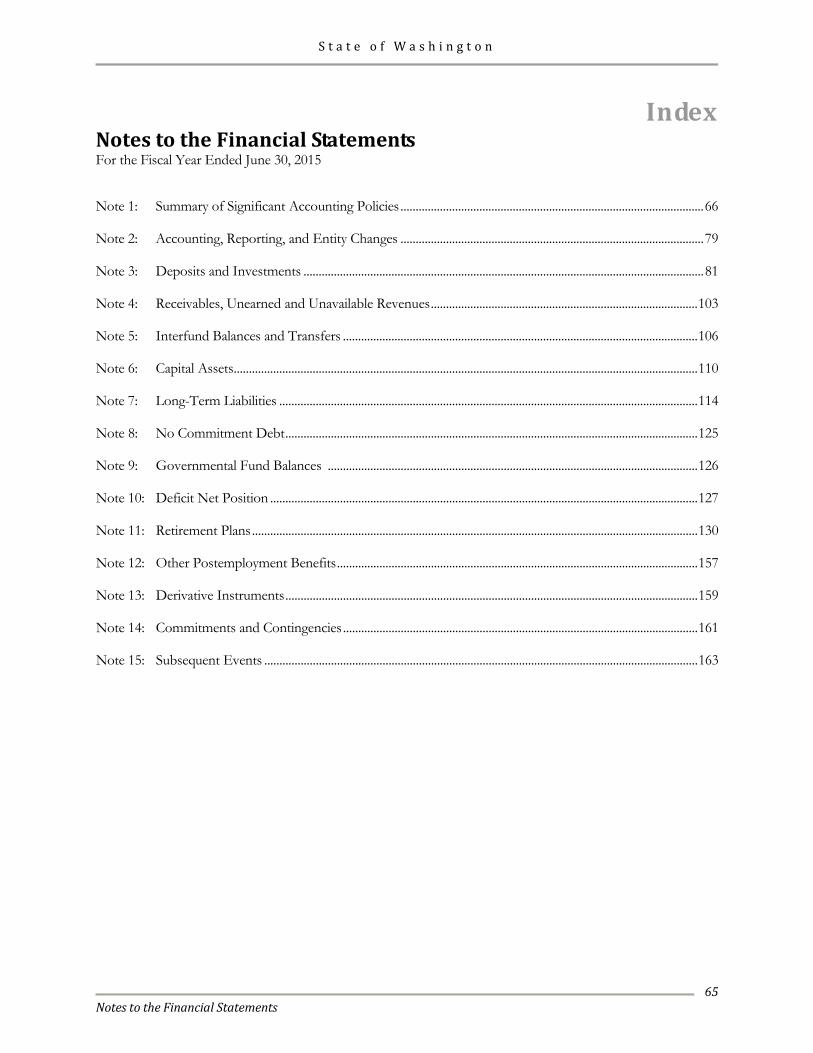
S t a t e o f W a s h i n g t o n
Notes to the Financial Statements
65
Index Notes to the Financial Statements For the Fiscal Year Ended June 30, 2015 Note 1: Summary of Significant Accounting Policies .................................................................................................... 66
Note 2: Accounting, Reporting, and Entity Changes .................................................................................................... 79
Note 3: Deposits and Investments .................................................................................................................................... 81
Note 4: Receivables, Unearned and Unavailable Revenues ........................................................................................ 103
Note 5: Interfund Balances and Transfers ..................................................................................................................... 106
Note 6: Capital Assets ......................................................................................................................................................... 110
Note 7: Long-Term Liabilities .......................................................................................................................................... 114
Note 8: No Commitment Debt ........................................................................................................................................ 125
Note 9: Governmental Fund Balances .......................................................................................................................... 126
Note 10: Deficit Net Position ............................................................................................................................................. 127
Note 11: Retirement Plans ................................................................................................................................................... 130
Note 12: Other Postemployment Benefits ....................................................................................................................... 157
Note 13: Derivative Instruments ........................................................................................................................................ 159
Note 14: Commitments and Contingencies ..................................................................................................................... 161
Note 15: Subsequent Events ............................................................................................................................................... 163
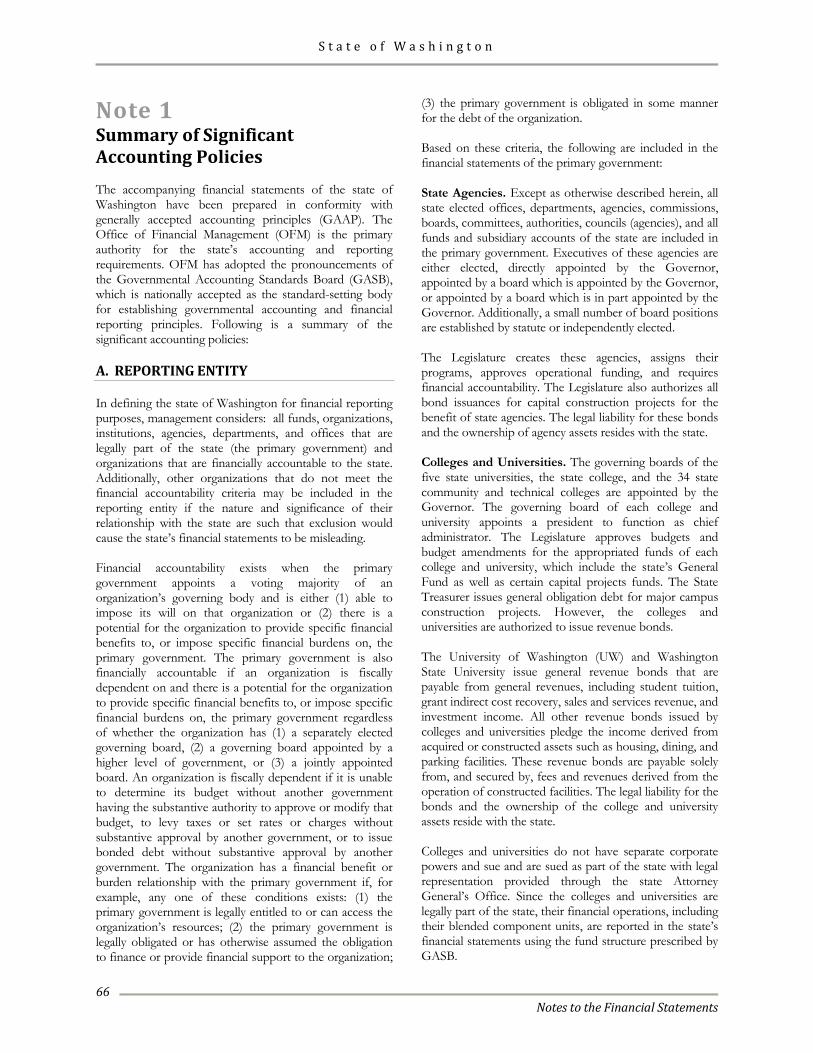
S t a t e o f W a s h i n g t o n
Notes to the Financial Statements
66
Note 1 Summary of Significant Accounting Policies The accompanying financial statements of the state of Washington have been prepared in conformity with generally accepted accounting principles (GAAP). The Office of Financial Management (OFM) is the primary authority for the state’s accounting and reporting requirements. OFM has adopted the pronouncements of the Governmental Accounting Standards Board (GASB), which is nationally accepted as the standard-setting body for establishing governmental accounting and financial reporting principles. Following is a summary of the significant accounting policies: A. REPORTING ENTITY In defining the state of Washington for financial reporting purposes, management considers: all funds, organizations, institutions, agencies, departments, and offices that are legally part of the state (the primary government) and organizations that are financially accountable to the state. Additionally, other organizations that do not meet the financial accountability criteria may be included in the reporting entity if the nature and significance of their relationship with the state are such that exclusion would cause the state’s financial statements to be misleading. Financial accountability exists when the primary government appoints a voting majority of an organization’s governing body and is either (1) able to impose its will on that organization or (2) there is a potential for the organization to provide specific financial benefits to, or impose specific financial burdens on, the primary government. The primary government is also financially accountable if an organization is fiscally dependent on and there is a potential for the organization to provide specific financial benefits to, or impose specific financial burdens on, the primary government regardless of whether the organization has (1) a separately elected governing board, (2) a governing board appointed by a higher level of government, or (3) a jointly appointed board. An organization is fiscally dependent if it is unable to determine its budget without another government having the substantive authority to approve or modify that budget, to levy taxes or set rates or charges without substantive approval by another government, or to issue bonded debt without substantive approval by another government. The organization has a financial benefit or burden relationship with the primary government if, for example, any one of these conditions exists: (1) the primary government is legally entitled to or can access the organization’s resources; (2) the primary government is legally obligated or has otherwise assumed the obligation to finance or provide financial support to the organization;
(3) the primary government is obligated in some manner for the debt of the organization. Based on these criteria, the following are included in the financial statements of the primary government: State Agencies. Except as otherwise described herein, all state elected offices, departments, agencies, commissions, boards, committees, authorities, councils (agencies), and all funds and subsidiary accounts of the state are included in the primary government. Executives of these agencies are either elected, directly appointed by the Governor, appointed by a board which is appointed by the Governor, or appointed by a board which is in part appointed by the Governor. Additionally, a small number of board positions are established by statute or independently elected. The Legislature creates these agencies, assigns their programs, approves operational funding, and requires financial accountability. The Legislature also authorizes all bond issuances for capital construction projects for the benefit of state agencies. The legal liability for these bonds and the ownership of agency assets resides with the state. Colleges and Universities. The governing boards of the five state universities, the state college, and the 34 state community and technical colleges are appointed by the Governor. The governing board of each college and university appoints a president to function as chief administrator. The Legislature approves budgets and budget amendments for the appropriated funds of each college and university, which include the state’s General Fund as well as certain capital projects funds. The State Treasurer issues general obligation debt for major campus construction projects. However, the colleges and universities are authorized to issue revenue bonds. The University of Washington (UW) and Washington State University issue general revenue bonds that are payable from general revenues, including student tuition, grant indirect cost recovery, sales and services revenue, and investment income. All other revenue bonds issued by colleges and universities pledge the income derived from acquired or constructed assets such as housing, dining, and parking facilities. These revenue bonds are payable solely from, and secured by, fees and revenues derived from the operation of constructed facilities. The legal liability for the bonds and the ownership of the college and university assets reside with the state. Colleges and universities do not have separate corporate powers and sue and are sued as part of the state with legal representation provided through the state Attorney General’s Office. Since the colleges and universities are legally part of the state, their financial operations, including their blended component units, are reported in the state’s financial statements using the fund structure prescribed by GASB.
S t a t e o f W a s h i n g t o n
Notes to the Financial Statements
67
Retirement Systems. The state of Washington, through the Department of Retirement Systems, administers eight retirement systems for public employees of the state and political subdivisions: the Public Employees’ Retirement System, the Teachers’ Retirement System, the School Employees’ Retirement System, the Law Enforcement Officers’ and Fire Fighters’ Retirement System, the Washington State Patrol Retirement System, the Public Safety Employees’ Retirement System, the Judicial Retirement System, and the Judges’ Retirement Fund. The director of the Department of Retirement Systems is appointed by the Governor. There are three additional retirement systems administered outside of the Department of Retirement Systems. The Volunteer Fire Fighters’ and Reserve Officers’ Relief and Pension Fund is administered through the State Board for Volunteer Fire Fighters and Reserve Officers, which is appointed by the Governor. The Judicial Retirement Account is administered through the Administrative Office of the Courts under the direction of the Board for Judicial Administration. The Higher Education Retirement Plan Supplemental Defined Benefit Plans are administered by the state’s colleges and universities. The Legislature establishes laws pertaining to the creation and administration of all public retirement systems. The participants of the public retirement systems, together with the state, provide funding for all costs of the systems based upon actuarial valuations. The state establishes benefit levels and approves the actuarial assumptions used in determining contribution levels. All of the aforementioned retirement systems are included in the primary government’s financial statements. Blended Component Units Blended component units, although legally separate entities, are part of the state’s operations in substance. Accordingly, they are reported as part of the state and blended into the appropriate funds. Financial information for the state’s blended component units may be obtained from the Office of Financial Management, Accounting Division, P.O. Box 43127, Olympia, WA, 98504-3127. The following entities are blended in the state’s financial statements: Tobacco Settlement Authority. The Tobacco Settlement Authority (TSA) was created by the Legislature in March 2002, as a public instrumentality separate and distinct from the state. It is governed by a five-member board appointed by the Governor. It was created solely for the purpose of issuing bonds to securitize a portion of the state’s future tobacco settlement revenue. Proceeds of the debt instrument were transferred to the state to help fund health care,
long-term care, and other programs of the state. Refer to Note 7.A for additional information. Association of University Physicians. The University of Washington Physicians (UWP) was established for the exclusive benefit of the University of Washington School of Medicine (UWSOM). UWP employs UWSOM faculty and bills and collects for their clinical services as an agent for UWSOM. UW Medicine Neighborhood Clinics. The UW Medicine Neighborhood Clinics (Neighborhood Clinics) were established for the exclusive benefit of the University’s School of Medicine, UWP and its affiliated medical centers, Harborview Medical Center, and the University of Washington Medical Center. The Neighborhood Clinics were organized to coordinate and develop patient care in a community clinical setting. They enhance the academic environment of UWSOM by providing additional sites of primary care practice and training for faculty, residents, and students. Washington Biomedical Research Properties I and II, and Washington Biomedical Research Facilities 3 were formed to acquire, construct, or renovate certain real properties for the benefit of the University of Washington in fulfilling its educational, medical, or scientific research missions. Tumwater Office Properties and FYI Properties were formed to design and construct office facilities to house state employees. The facilities were financed with tax-exempt obligations that meet the requirements of Revenue Ruling 63-20 and Revenue Procedure 82-26 issued by the Internal Revenue Service. Discrete Component Units Discretely presented component units are reported in a separate column in the government-wide financial statements. Discretely presented component units are legally separate from the state and primarily serve or benefit those outside of the state. They are financially accountable to the state, or have relationships with the state such that exclusion would cause the reporting entity’s financial statements to be misleading or incomplete. These entities are reported as discrete component units because state officials either serve on or appoint the members of the governing bodies of the authorities. The state also has the ability to influence the operations of the authorities through legislation. The state’s component units each have a year-end of June 30 with the exception of the Washington Economic Development Finance Authority and the Washington Health Benefit Exchange which have a December 31 year-end.
S t a t e o f W a s h i n g t o n
Notes to the Financial Statements
68
The following entities are discretely presented in the financial statements of the state in the component unit’s column: The Washington State Housing Finance Commission, the Washington Higher Education Facilities Authority, the Washington Health Care Facilities Authority, and the Washington Economic Development Finance Authority (financing authorities) were created by the Legislature in a way that specifically prevents them from causing the state to be liable or responsible for their acts and obligations, including, but not limited to, any obligation to pay principal and interest on financing authority bonds. The financing authorities cannot obligate the state, either legally or morally, and the state has not assumed any obligation of, or with respect to, the financing authorities. Financial reports of these financing authorities may be obtained from each authority at the following addresses:
Washington Health Care Facilities Authority 410 11th Avenue SE, Suite 201 PO Box 40935 Olympia, WA 98504-0935
Washington State Housing Finance Commission Washington Higher Education Facilities Authority Washington Economic Development Finance Authority 1000 Second Avenue, Suite 2700 Seattle, WA 98104-1046
The Washington State Public Stadium Authority (PSA) was created by the Legislature to acquire, construct, own, and operate a football/soccer stadium, exhibition center, and parking garage. Construction was completed in 2002. PSA capital assets, net of accumulated depreciation, total $296.6 million. The state issued general obligation bonds for a portion of the cost of the stadium construction. The total public share of the stadium and exhibition center cost did not exceed $300 million from all state and local government funding sources, as required in statute. Project costs in excess of $300 million were the responsibility of the project’s private partner, First & Goal, Inc. The bonds are being repaid through new state lottery games, a state sales tax credit, extension of the local hotel/motel tax, and parking and admissions taxes at the new facility. Financial reports of the PSA may be obtained at the following address:
Washington State Public Stadium Authority CenturyLink Field & Event Center 800 Occidental Avenue South, #700 Seattle, WA 98134
The Washington Health Benefit Exchange (Exchange) was created by the Legislature to implement a central marketplace for individuals, families, and small employers to shop for health insurance and access federal tax credits pursuant to the Patient Protection and Affordable Care Act of 2010. Federal grant funding financed the Exchange design, development, and implementation phases as well as the first full year of operation during 2014. Beginning in 2015, the Exchange is to be self-sustaining through Medicaid program cost reimbursements, premium tax assessments, and other assessments. Financial reports of the Exchange may be obtained at the following address:
Washington Health Benefit Exchange 810 Jefferson Street SE Olympia, WA 98501
Northwest Hospital was created January 1, 2010, under an affiliation agreement between UW Medicine and Northwest Hospital and Medical Center (Northwest Hospital). UW Medicine is an academic medical center comprised of UW School of Medicine, UW Neighborhood Clinics, UW Medical Center, Harborview Medical Center, Association of University Physicians, as well as the University’s membership in the Seattle Cancer Care Alliance and the Children’s University Medical Group. Northwest Hospital is a 281-bed full service acute care hospital. The University is the sole corporate member of Northwest Hospital. Financial reports of Northwest Hospital may be obtained at the following address:
Northwest Hospital 1550 N. 115th Street Seattle, WA 98133-9733
Valley Medical Center was created July 1, 2011, through a strategic alliance between UW Medicine and Public Hospital District No. 1 of King County. Valley Medical Center owns and operates a 321-bed full service acute care hospital and 45 clinics located throughout southeast King County. Financial reports of Valley Medical Center may be obtained at the following address:
Valley Medical Center 400 S. 43rd Street Renton, WA 98055
Joint Ventures In 1998, the University of Washington Medical Center (Medical Center) entered into an agreement with Seattle Children’s Hospital and Fred Hutchinson Cancer Research Center to establish the Seattle Cancer Care Alliance
S t a t e o f W a s h i n g t o n
Notes to the Financial Statements
69
(SCCA). Each member of the SCCA has a one-third interest. The mission of the SCCA is to eliminate cancer as a cause of human suffering and death and to become recognized as the premier cancer research and treatment center in the Pacific Northwest. The SCCA integrates the cancer research, teaching, and clinical cancer programs of all three institutions to provide state-of-the-art cancer care. Under the agreement, the Medical Center provides the patient care to all adult inpatients of the SCCA. Inpatient Services – The SCCA operates a 20-bed unit located within the Medical Center in which its adult inpatients receive care. The fiscal intermediary has determined that the 20-bed unit qualifies as a hospital within a hospital for Medicare reimbursement purposes. The SCCA provides medical oversight and management of the inpatient unit. Under agreements, the Medical Center provides inpatient care services to the SCCA including necessary personnel, equipment, and ancillary services. Outpatient Services – The SCCA operates an ambulatory cancer care service facility in Seattle. The Medical Center provides various services to the SCCA’s outpatient facility including certain pharmacy, laboratory, and pathology services as well as billing, purchasing, and other administrative services. The state accounts for the Medical Center’s interest in SCCA under the equity method of accounting. Income of $5.0 million was recorded in fiscal year 2015, bringing the total equity investment to $107.7 million which is recognized in the state’s financial statements in the Higher Education Student Services Fund. Separate financial statements for SCCA may be obtained from:
Seattle Cancer Care Alliance 825 Eastlake Avenue East PO Box 19023 Seattle, WA 98109-1023
The University of Washington and Seattle Children’s Hospital established Children’s University Medical Group (CUMG) to assist the organizations in carrying out their pediatric patient care, charitable, educational, and scientific missions. Separate financial statements for CUMG may be obtained from:
Children’s University Medical Group 4500 Sand Point Way NE, Suite 100 Seattle, WA 98105
B. GOVERNMENT-WIDE AND FUND FINANCIAL STATEMENTS Government-wide Financial Statements
The state presents two basic government-wide financial statements: the Statement of Net Position and the Statement of Activities. These government-wide financial statements report information on all non-fiduciary activities of the primary government and its component units. The financial information for the primary government is distinguished between governmental and business-type activities. Governmental activities generally are financed through taxes, intergovernmental revenues, and other non-exchange revenues. Business-type activities are financed in whole or in part by fees charged to external parties for goods and services. Statement of Net Position. The Statement of Net Position presents the state’s non-fiduciary assets, deferred outflows of resources, liabilities, deferred inflows of resources, and net position. As a general rule, balances between governmental and business-type activities are eliminated. Statement of Activities. The Statement of Activities reports the extent to which each major state program is supported by general state revenues or is self-financed through fees and intergovernmental aid. For governmental activities, a major program is defined as a function. For business-type activities, a major program is an identifiable activity. Program revenues offset the direct expenses of major programs. Direct expenses are those that are clearly identifiable within a specific function or activity. Program revenues are identified using the following criteria: • Charges to customers for goods and services of the
program. A customer is one who directly benefits from the goods or services or is otherwise directly affected by the program, such as a state citizen or taxpayer, or other governments or nongovernmental entities.
• Amounts received from outside entities that are
restricted to one or more specific programs. These amounts can be operating or capital in nature.
• Earnings on investments that are restricted to a specific
program are also considered program revenues. General revenues consist of taxes and other items not meeting the definition of program revenues.
S t a t e o f W a s h i n g t o n
Notes to the Financial Statements
70
Generally, the effect of internal activities is eliminated. Exceptions to this rule include charges between the workers’ compensation insurance programs and various other state programs and functions. Elimination of these charges would distort the direct costs and revenues reported for the various activities involved. Fund Financial Statements
The state uses 642 accounts that are combined into 51 rollup funds. The state presents separate financial statements for governmental funds, proprietary funds, and fiduciary funds. Major individual governmental funds and major individual proprietary funds are reported in separate columns in the fund financial statements, with nonmajor funds being combined into a single column regardless of fund type. Internal service and fiduciary funds are reported by fund type. Major funds include: Major Governmental Funds:
• General Fund is the state’s primary operating fund. This fund accounts for all financial resources and transactions not accounted for in other funds.
• Higher Education Special Revenue Fund primarily
accounts for tuition, student fees, and grants and contracts received for educational and research purposes.
• Higher Education Endowment Permanent Fund
accounts for gifts and bequests that the donors have specified must remain intact. Each gift is governed by various restrictions on the investment and use of the income earned on investments.
Major Enterprise Funds:
• Workers’ Compensation Fund accounts for the workers' compensation program that provides medical, time-loss, and disability benefit payments to qualifying individuals sustaining work-related injuries.
• Unemployment Compensation Fund accounts for
the unemployment compensation program. It accounts for the deposit of funds, requisitioned from the Federal Unemployment Trust Fund, to provide services to eligible participants within the state and to pay unemployment benefits.
• Higher Education Student Services Fund is used
by colleges and universities principally for bookstore, cafeteria, parking, student housing, food service, and hospital business enterprise activities.
• Guaranteed Education Tuition Program Fund accounts for Washington’s Guaranteed Education Tuition (GET) Program. GET is a qualified tuition program under Section 529 of the Internal Revenue Code.
The state includes the following governmental and proprietary fund types within nonmajor funds: Nonmajor Governmental Funds:
• Special Revenue Funds account for the proceeds of specific revenue sources (other than trusts for individuals, private organizations, or other governments, or for major capital projects) that are restricted or committed to expenditures for specific purposes. These include a variety of state programs including public safety and health assistance programs; natural resource and wildlife protection and management programs; the state’s transportation programs which include the operation of the state’s ferry system, and maintenance and preservation of interstate and non-interstate highway systems; driver licensing, highway and non-highway operations, and capital improvements; K-12 school construction; and construction and loan programs for local public works projects.
• Debt Service Funds account for the accumulation of
resources that are restricted or committed to expenditures for, and the payment of, principal and interest on the state’s bonds issued in support of governmental activities.
• Capital Projects Funds account for financial
resources that are restricted or committed to expenditures for the acquisition, construction, or improvement of major state-owned capital facilities (other than highway infrastructure or those financed by proprietary funds).
• Common School Permanent Fund accounts for the
principal derived from the sale of timber. Interest earned is used for the benefit of common schools.
Nonmajor Proprietary Funds:
• Enterprise Funds account for the state’s business type operations for which a fee is charged to external users for goods or services including: the state lottery, vocational/education programs at correctional institutions, and other activities.
S t a t e o f W a s h i n g t o n
Notes to the Financial Statements
71
• Internal Service Funds account for the provision of legal, motor pool, data processing, risk management, health insurance, and other services by one department or agency to other departments or agencies of the state on a cost-reimbursement basis.
The state reports the following fiduciary funds: • Pension (and other employee benefit) Trust Funds
are used to report resources that are required to be held in trust by the state for the members and beneficiaries of defined benefit pension plans, defined contribution pension plans, and other employee benefit plans.
• Investment Trust Fund accounts for the external
portion of the Local Government Investment Pool, which is reported by the state as the sponsoring government.
• Private-Purpose Trust Fund is used to report trust
arrangements, other than pension and investment trusts, under which principal and income benefit individuals, private organizations, or other governments such as the administration of unclaimed property.
• Agency Funds account for resources held by the state
in a custodial capacity for other governments, private organizations, or individuals.
Operating and Nonoperating Revenues and Expenses. The state’s proprietary funds make a distinction between operating and nonoperating revenues and expenses. Operating revenues and expenses generally result from providing goods and services directly related to the principal operations of the funds. For example, operating revenues for the state’s workers’ compensation and health insurance funds consist of premiums and assessments collected. Operating expenses consist of claims paid to covered individuals, claims adjustment expenses, costs of commercial insurance coverage, and administrative expenses. All revenues and expenses not meeting this definition are reported as nonoperating, including interest expense and investment gains and losses. C. MEASUREMENT FOCUS AND BASIS OF ACCOUNTING For government-wide reporting purposes, the state uses the economic resources measurement focus and the accrual basis of accounting. Revenues are recorded when earned and expenses are recorded when a liability is incurred, regardless of the timing of the related cash flows. Property taxes are recognized as revenue in the year for which they are levied. Grants and similar items are recognized as revenue as soon as all eligibility requirements imposed by the provider have been met.
For fund statement reporting purposes, the state uses the current financial resources measurement focus and modified accrual basis of accounting for governmental funds. With the current financial resources measurement focus, generally only current assets and current liabilities and deferred outflows of resources and deferred inflows of resources are included on the governmental funds balance sheet. Operating statements for these funds present inflows (i.e., revenues and other financing sources) and outflows (i.e., expenditures and other financing uses) of expendable financial resources. Under the modified accrual basis of accounting, revenues are recognized when susceptible to accrual (i.e., when they become both measurable and available). “Measurable” means the amount of the transaction can be reasonably estimated. “Available” means collectible within the current period or soon enough thereafter to be used to pay liabilities of the current period. Primary revenues that are determined to be susceptible to accrual include sales taxes, business and occupation taxes, motor fuel taxes, federal grants-in-aid, and charges for services. Revenues from property taxes are determined to be available if collectible within 60 days. Taxes imposed on exchange transactions are accrued when the underlying exchange transaction occurs if collectible within one year. Revenue for timber cutting contracts is accrued when the timber is harvested. Revenues from licenses, permits, and fees are recognized when received in cash. Revenues related to expenditure-driven grant agreements are recognized when the qualifying expenditures are made, provided that the availability criteria are met. Expenditure-driven grant revenue is considered available if it can be collected by the state at the same time cash is disbursed to cover the associated grant expenditure. Pledges are accrued when the eligibility requirements are met and resources are available. All other accrued revenue sources are determined to be available if collectible within 12 months. Property taxes are levied in December for the following calendar year. The first half-year collections are due by April 30, and the second half-year collections are due by October 31. Since the state is on a fiscal year ending June 30, the first half-year collections are recognized as revenue, if collectible within 60 days of the fiscal year end. The second half-year collections are recognized as receivables offset by unavailable revenue. The lien date on property taxes is January 1 of the tax levy year. Under modified accrual accounting, expenditures are generally recognized when the related liability is incurred. However, unmatured interest on general long-term obligations is recognized when due and certain liabilities including compensated absences, other postemployment benefits, and claims and judgments are recognized when the obligations are expected to be liquidated with available spendable financial resources.
S t a t e o f W a s h i n g t o n
Notes to the Financial Statements
72
The state reports both unavailable and unearned revenues on its governmental fund balance sheet. Unavailable revenues arise when a potential revenue does not meet both the “measurable” and the “available” criteria for revenue recognition in the current period. Unearned revenues arise when resources are received by the state before it has a legal claim to them, such as when grant monies are received prior to incurring qualifying expenditures/expenses. All proprietary and trust funds are accounted for using the economic resources measurement focus. With this measurement focus, all assets, liabilities, deferred outflows of resources, and deferred inflows of resources associated with the operations of these funds are included on their respective statements of net position. Operating statements present increases (i.e., revenues) and decreases (i.e., expenses) in total net position. All proprietary and trust funds are reported using the accrual basis of accounting. Under the accrual basis of accounting, revenues are recognized when earned and expenses are recognized when incurred. D. ASSETS, LIABILITIES, DEFERRED OUTFLOWS/INFLOWS OF RESOURCES AND NET POSITION/FUND BALANCE 1. Cash and Investments
Investments of surplus or pooled cash balances are reported on the accompanying Statements of Net Position, Balance Sheets, and Statements of Cash Flows as “Cash and Pooled Investments.” The Office of the State Treasurer invests state treasury cash surpluses where funds can be disbursed at any time without prior notice or penalty. For reporting purposes, pooled investments are stated at fair value or amortized cost, which approximates fair value. For purposes of reporting cash flows, the state considers cash and pooled investments to be cash equivalents. Pooled investments include short-term, highly-liquid investments that are both readily convertible to cash and are so near their maturity dates that they present insignificant risk of changes in value because of changes in interest rates. The method of accounting for noncurrent investments varies depending upon the fund classification. Investments in the state’s Local Government Investment Pool (LGIP), an external investment pool operated in a manner consistent with the Securities and Exchange Commission’s Rule 2a-7 of the Investment Company Act of 1940, are reported at amortized cost which approximates fair value. The Office of the State Treasurer prepares a stand-alone LGIP financial report. A copy of the report is available from the Office of the State Treasurer, PO Box 40200, Olympia, Washington 98504-0200, online at:
http://www.tre.wa.gov/documents/lgipCafr/lgipCafrFY15.pdf, or phone number (360) 902-9000. TTY users dial 711 to be connected to the state TTY operator. In the absence of readily ascertainable fair values, certain pension trust fund investments, including real estate and private equity, are reported at fair value based on the individual investment’s capital account balance at the closest available reporting period, adjusted for subsequent activity. At June 30, 2015, these alternative investments are valued at $32.06 billion. Because of the inherent uncertainties in the estimation of fair value, it is possible that the estimates will change. All other noncurrent investments are reported at fair value. Fair values are based on published market prices, quotations from national security exchanges and security pricing services, or by the respective fund managers for securities that are not actively traded. Privately held mortgages are valued at cost, which approximates fair value. Additional disclosure describing investments is provided in Note 3. 2. Receivables and Payables
Receivables in the state’s governmental fund type accounts consist primarily of taxes and federal revenues. Receivables in all other funds have arisen in the ordinary course of business. Receivables are recorded when either the asset or revenue recognition criteria (refer to Note 1.C) have been met. All receivables are reported net of an allowance for accounts estimated to be uncollectible. For government-wide reporting purposes, amounts recorded as interfund/interagency receivables and payables are eliminated in the governmental and business-type activities columns on the Statement of Net Position, except for the net residual balances due between the governmental and business-type activities, which are reported as internal balances. Amounts recorded in governmental and business-type activities as due to or from fiduciary funds have been reported as due to or from other governments. 3. Inventories and Prepaids
Consumable inventories, consisting of expendable materials and supplies held for consumption, are valued and reported in the state’s financial statements if the fiscal year-end balance on hand at an inventory control point is estimated to be $50,000 or more. Consumable inventories are valued at cost using either the first-in, first-out or weighted average methods. Donated consumable inventories are recorded at fair market value. All merchandise inventories are considered reportable for financial statement purposes. Merchandise inventories are valued at cost using the first-in, first-out method.
S t a t e o f W a s h i n g t o n
Notes to the Financial Statements
73
Inventories of governmental funds are valued at cost and recorded using the consumption method. Proprietary funds expense inventories when used or sold. For governmental fund financial reporting, inventory balances are also recorded as a reservation of fund balance indicating that they do not constitute “available spendable resources” except for $7.0 million in federally donated consumable inventories, which are offset by unearned revenue because they are not earned until they are distributed to clients. Prepaid items are those certain types of supplies and/or services (not inventory) that are acquired or purchased during an accounting period but not used or consumed during that accounting period. In governmental fund type accounts, prepaid items are generally accounted for using the purchases method. Under the purchases method, prepaid items are treated as expenditures when purchased and residual balances, if any, at year-end are not accounted for as assets. In proprietary and trust fund type accounts, prepaid items are accounted for using the consumption method. The portion of supplies or services consumed or used during a period is recorded as an expense. The balance that remains is reported as an asset until consumed or used. 4. Restricted Assets
Certain cash, investments, and other assets are classified as restricted assets on the Statement of Net Position and Balance Sheet because their use is limited by debt covenants, escrow arrangements, or other regulations. 5. Capital Assets
Capital assets are tangible and intangible assets held and used in state operations, which have a service life of more than one year and meet the state’s capitalization policy. It is the state’s policy to capitalize: • All land, including land use rights with indefinite lives
acquired with the purchase of the underlying land, and ancillary costs;
• The state highway system operated by the Department
of Transportation; • Infrastructure, other than the state highway system,
with a cost of $100,000 or more; • Buildings, building improvements, improvements other
than buildings, and leasehold improvements with a cost of $100,000 or more;
• Intangible assets, either purchased or internally developed, with a cost of $1 million or more that are identifiable by meeting one of the following conditions:
o The asset is capable of being separated or divided
and sold, transferred, licensed, rented, exchanged; o The asset arises from contractual or other legal
rights, regardless of whether those rights are transferable or separable;
• All capital assets acquired with Certificates of
Participation, a debt financing program administered by the Office of the State Treasurer; and
• All other capital assets with a unit cost (including
ancillary costs) of $5,000 or greater, or collections with a total cost of $5,000 or greater except for assets held by the University of Washington (UW). The capitalization threshold for all other capital assets held by the UW is $2,000.
Assets acquired by capital leases are capitalized if the assets’ fair market value meets the state’s capitalization thresholds described above. Purchased capital assets are valued at cost where historical records are available and at estimated historical cost where no historical records exist. Capital asset costs include the purchase price plus those costs necessary to place the asset in its intended location and condition for use (ancillary costs). Normal maintenance and repair costs that do not materially add to the value or extend the life of the state’s capital assets are not capitalized. Donated capital assets are valued at their estimated fair market value on the date of donation, plus all appropriate ancillary costs. When the fair market value is not practically determinable due to lack of sufficient records, estimated cost is used. Where necessary, estimates of original cost and fair market value are derived by factoring price levels from the current period to the time of acquisition. The value of assets constructed by agencies for their own use includes all direct construction costs and indirect costs that are related to the construction. In enterprise and trust funds, net interest costs (if material) incurred during the period of construction are capitalized. In fiscal year 2015, $86.9 million in interest costs were incurred, and $7.7 million net interest costs were capitalized. State agencies are not required to capitalize art collections, library reserve collections, and museum and historical collections that are considered inexhaustible, in that their value does not diminish over time, if all of the following conditions are met:
S t a t e o f W a s h i n g t o n
Notes to the Financial Statements
74
• The collection is held for public exhibition, education, or research in furtherance of public service, rather than financial gain.
• The collection is protected, kept unencumbered, cared
for, and preserved. • The collection is subject to policy requirements that the
proceeds from sales of collection items be used to acquire other items for the collection.
Depreciation/amortization is calculated using the straight-line method over the estimated useful lives of the assets. Generally, estimated useful lives are as follows:
Buildings & building components 5-50 years Furnishings, equipment & collections 3-50 years Other improvements 3-50 years Intangibles 3-50 years Infrastructure 20-50 years
The cost and related accumulated depreciation/ amortization of disposed capital assets are removed from the accounting records. The state capitalizes the state highway system as a network but does not depreciate it since the system is being preserved approximately at or above a condition level established by the state. That condition level is documented and disclosed. Additionally, the highway system is managed using an asset management system that includes: • Maintenance of an up-to-date inventory of system
assets;
• Performance of condition assessments of the assets at least every three years with summarization of the results using a measurement scale; and
• Annual estimation of the amount to maintain and
preserve the assets at the condition level established and disclosed.
All state highway system expenditures that preserve the useful life of the system are expensed in the period incurred. Additions and improvements that increase the capacity or efficiency of the system are capitalized. This approach of reporting condition instead of depreciating the highway system is called the modified approach. For government-wide financial reporting purposes, capital assets of the state are reported as assets in the applicable governmental or business-type activities column on the Statement of Net Position. Depreciation/amortization
expense related to capital assets is reported in the Statement of Activities. Capital assets and the related depreciation/amortization expense are also reported in the proprietary fund financial statements. In governmental funds, capital assets are not capitalized in the accounts that acquire or construct them. Instead, capital acquisitions and construction are reflected as expenditures in the year assets are acquired or construction costs are incurred. No depreciation/amortization is reported. 6. Deferred Outflows/Inflows of Resources
In addition to assets, the Balance Sheet and Statement of Net Position will sometimes report a separate section for deferred outflows of resources. This separate financial statement element represents a consumption of fund equity that applies to a future period(s) and so will not be recognized as an outflow of resources (expense/ expenditure) until then. The category of deferred outflow of resources reported in the government-wide and proprietary fund statements of net position relates to debt refunding, pensions, and hedging derivative instruments. Deferred outflows on debt refunding result when the net carrying value of refunded debt exceeds its reacquisition price. This amount is deferred and amortized over the shorter of the life of the refunded or refunding debt. Deferred outflows on pensions are recorded when actual earnings on pension plan investments exceed projected earnings and are amortized to pension expense using a systematic and rational method over a closed five-year period. Deferred outflows on pensions also include the difference between expected and actual experience with regard to economic or demographic factors; changes of assumptions about future economic, demographic, or other input factors; or changes in the state’s proportionate share of net pension liability. These are amortized over the average expected remaining service lives of all employees that are provided with pensions through each pension plan. State contributions to pension plans made subsequent to the measurement date are also deferred and reduce net pension liability in the subsequent year. Deferred outflows on hedging derivative instruments represent the unrealized loss in fair value of the contract at fiscal year end. In addition to liabilities, the Balance Sheet and Statement of Net Position will sometimes report a separate section for deferred inflows of resources. This separate financial statement element represents an acquisition of fund equity that applies to a future period(s) and so will not be recognized as an inflow of resources (revenue) until that
S t a t e o f W a s h i n g t o n
Notes to the Financial Statements
75
time. Deferred inflows of resources reported by the state relate to unavailable revenue, debt refunding, pensions, and hedging derivative instruments. Unavailable revenue arises only under the modified accrual basis of accounting, and so is reported only on the governmental funds balance sheet. Governmental funds report deferred inflows for unavailable revenues primarily from two sources: taxes and long-term receivables. These amounts are recognized as inflows of resources in the periods that the amounts become available. Deferred inflows on refunding result when the reacquisition price of the refunding debt exceeds the net carrying value of the refunded debt. This amount is deferred and amortized over the shorter of the life of the refunded or refunding debt. Deferred inflows on pensions are recorded when projected earnings on pension plan investments exceed actual earnings and are amortized to pension expense using a systematic and rational method over a closed five-year period. Deferred inflows on pensions also include the difference between expected and actual experience with regard to economic or demographic factors; changes of assumptions about future economic, demographic, or other input factors; or changes in the state’s proportionate share of net pension liability. These are amortized over the average expected remaining service lives of all employees that are provided with pensions through each pension plan. Deferred inflows on hedging derivative instruments represent the unrealized gain in fair value of the contract at fiscal year end. 7. Compensated Absences
State employees accrue vested vacation leave at a variable rate based on years of service. In general, accrued vacation leave cannot exceed 240 hours at the employee’s anniversary date. Employees accrue sick leave at the rate of one day per month without limitation on the amount that can be accumulated. Sick leave is not vested, i.e., the state does not pay employees for unused sick leave upon termination except upon employee death or retirement. At death or retirement, the state is liable for 25 percent of the employee’s accumulated sick leave. In addition, the state has a sick leave buyout option in which, each January, employees who accumulate sick leave in excess of 480 hours may redeem sick leave earned but not taken during the previous year at the rate of one day’s pay in exchange for each four days of sick leave.
It is the state’s policy to liquidate its compensated absences obligation with future resources rather than advance funding it with available spendable financial resources. For government-wide reporting purposes, the state reports compensated absences obligations as liabilities in the applicable governmental or business-type activities columns on the Statement of Net Position. For fund statement reporting purposes, governmental funds recognize an expenditure for annual and sick leave when it is payable, i.e., upon employee’s use, resignation, or retirement. Proprietary and trust funds recognize the expense and accrue a liability for annual leave and estimated sick leave buyout, including related payroll taxes and benefits, as applicable, as the leave is earned. 8. Long-Term Liabilities
In the government-wide and proprietary fund financial statements, long-term obligations of the state are reported as liabilities on the Statement of Net Position. Bonds payable are reported net of applicable original issuance premium or discount. When material, bond premiums and discounts are deferred and amortized over the life of the bonds. For governmental fund financial reporting, the face (par) amount of debt issued is reported as other financing sources. Premiums and discounts on original debt issuance are also reported as other financing sources and uses, respectively. Issue costs are reported as debt service expenditures. 9. Fund Equity
In governmental fund type accounts, fund equity is called “fund balance.” Fund balance is reported in classifications which reflect the extent to which the state is bound to honor constraints on the purposes for which the amounts can be spent. Classifications include: • Nonspendable fund balance represents amounts that
are either not in a spendable form or are legally or contractually required to remain intact.
• Restricted fund balance represents amounts for which
constraints are placed on their use by the state constitution, enabling legislation, or external resource providers such as creditors, grantors, or laws or regulations of other governments.
• Committed fund balance represents amounts that can only be used for specific purposes pursuant to constraints imposed by state law as adopted by the state Legislature. The commitment remains in place until the Legislature changes or eliminates the state law.
S t a t e o f W a s h i n g t o n
Notes to the Financial Statements
76
• Assigned fund balance represents amounts that are intended for a specific purpose by management, but are neither restricted nor committed. Generally, assignment is expressed by joint legislative and executive staff action.
• Unassigned fund balance represents the residual
amount for the General Fund that is not contained in the other classifications. Additionally, any deficit fund balance within the other governmental fund types is reported as unassigned.
When resources meeting more than one of the classifications (excluding nonspendable) are comingled in an account, assuming that the expenditure meets the constraints of the classification, the assumed order of spending is restricted first, committed second, and finally assigned. For government-wide reporting as well as in proprietary funds, fund equity is called net position. Net position is comprised of three components: net investment in capital assets; restricted; and unrestricted. • Net investment in capital assets consists of capital
assets, net of accumulated depreciation and reduced by outstanding balances of bonds, notes, and other debt that are attributed to the acquisition, construction, or improvement of those assets. Deferred outflows of resources and deferred inflows of resources that are attributable to the acquisition, construction, or improvement of those assets or related debt are included in this component of net position.
• Restricted net position consists of restricted assets
reduced by liabilities and deferred inflows of resources related to those assets. Assets are reported as restricted when constraints are placed on asset use either by external parties or by law through constitutional provision or enabling legislation.
• Unrestricted net position is the net amount of the
assets, deferred outflows of resources, liabilities, and deferred inflows of resources that does not meet the definition of the two preceding categories.
When both restricted and unrestricted resources are available for use, it is the state’s policy to use restricted resources first and then use unrestricted resources as they are needed. In fiduciary funds, net assets are held in trust for individuals and external organizations.
E. OTHER INFORMATION 1. Insurance Activities
Workers’ Compensation. Title 51 RCW establishes the state of Washington’s workers’ compensation program. The statute requires all employers to secure coverage for job-related injuries and diseases, with few exceptions, through the Workers’ Compensation Fund or through self-insurance. Direct private insurance is not authorized, although self-insurers are permitted to reinsure up to 80 percent of their obligations through private insurers. The Workers’ Compensation Fund, an enterprise fund, is used to account for the workers’ compensation program which provides time-loss, medical, vocational, disability, and pension benefits to qualifying individuals sustaining work-related injuries or illnesses. The main benefit plans of the workers’ compensation program are funded based on rates that will keep these plans solvent in accordance with recognized actuarial principles. The supplemental pension plan supports cost-of-living adjustments (COLA) granted for time-loss and disability payments; however, these are funded on a pay-as-you-go basis. By statute, the state is only allowed to collect enough revenue to fund the current COLA payments. Premiums are based on individual employers’ reported payroll hours and insurance rates based on each employer’s risk classification(s) and past experience, except for the Supplemental Pension Fund premiums which are based on a flat rate per hours worked independent of risk class or past experience. In addition to its regular premium plan which is required for all employers, the Workers’ Compensation Fund offers a voluntary retrospective premium-rating plan under which premiums are subject to three annual adjustments based on group and individual employers’ loss experience. Initial adjustments to the standard premiums are paid to or collected from the groups and individual employers approximately ten months after the end of each plan year. The Department of Labor and Industries, as administrator of the workers’ compensation program, establishes claims liabilities based on estimates of the ultimate cost of claims (including future claims adjustment expenses) that have already occurred. The length of time for which such costs must be estimated varies depending on the benefit involved. Because actual claims costs depend on such complex factors as inflation, changes in doctrines of legal liabilities, claims adjudication, and judgments, the process used in computing claims liabilities does not necessarily result in an exact amount.
S t a t e o f W a s h i n g t o n
Notes to the Financial Statements
77
Claims payable are recomputed quarterly using a variety of actuarial and statistical techniques. These techniques are used to produce current estimates that reflect recent settlements, claim frequency, expected inflation, and other economic, legal, and social factors. Adjustments to claims payable are charged or credited to claims expense in the periods in which they are made. The Department of Labor and Industries prepares a stand-alone financial report for its Workers’ Compensation Program. Copies of the report that include financial statements and required supplementary information may be obtained by writing to Washington State Department of Labor and Industries, PO Box 44833, Olympia, Washington 98504-4833 or by visiting their website at: http://www.lni.wa.gov/ClaimsIns/Insurance/Learn/StateFund/Reports/Default.asp. Risk Management. The state of Washington operates a self-insurance liability program pursuant to RCW 4.92.130. The state manages its tort claims as an insurance business activity rather than a general governmental activity. The state’s policy is generally not to purchase commercial insurance for the risk of losses to which it is exposed. Instead, the state’s management believes it is more economical to manage its risks internally and set aside assets for claims settlement in the Risk Management Fund, an internal service fund. A limited amount of commercial insurance is purchased for liabilities arising from the operations of the Washington state ferries, employee bonds, and to limit the exposure to catastrophic losses. Settled claims resulting from these risks have not exceeded commercial insurance coverage in any of the past ten fiscal years. Otherwise, the self-insurance liability program services all claims against the state for injuries and property damage to third parties. The majority of state funds and agencies participate in the self-insurance liability program in proportion to their anticipated exposure to liability losses. Health Insurance. The state of Washington administers and provides medical, dental, basic life, and basic long-term disability insurance coverage for eligible state employees. In addition, the state offers coverage to K-12 school districts, educational service districts, tribal governments, political subdivisions, and employee organizations representing state civil service workers. The state establishes eligibility requirements and approves plan benefits of all participating health care organizations. Because the state and its employees are the predominant participants in the employee health insurance program, it is accounted for in an internal service fund, the Employee Insurance Fund. The state’s share of the cost of coverage for state employees is based on a per capita amount determined annually by the Legislature and allocated to state agencies.
The Health Care Authority, as administrator of the health care benefits program, collects this monthly “premium” from agencies for each active employee enrolled in the program. State employees self pay for coverage beyond the state’s contribution. Cost of coverage for non-state employees is paid by their respective employers. Most coverage is available on a self-paid basis to former employees and employees who are temporarily not in pay status. Most coverage is also available on a self-paid basis to eligible retirees. In accordance with the provisions of GASB Statement No. 43, an agency fund, the Retiree Health Insurance Fund, is used to account for the retiree health insurance program. For additional information, refer to Note 12. The state secures commercial insurance for certain coverage offered, but self-insures the risk of loss for the Uniform Medical Plan. The Uniform Medical Plan enrolled 64 percent of the eligible subscribers in fiscal year 2015. Claims are paid from premiums collected, and claims adjudication is contracted through a third-party administrator. Considerations in calculating liabilities include frequency of claims, administrative costs, industry inflation trends, advances in medical technology, and other social and economic factors. Liabilities include an amount for claims incurred but not reported. 2. Postemployment Benefits
COBRA. In compliance with federal law, the Consolidated Omnibus Budget Reconciliation Act of 1985 (COBRA), the state offers health and dental benefits on a temporary basis to qualified beneficiaries whose benefit coverage would otherwise end because of a qualifying event such as loss of employment. COBRA coverage is available on a self-paid basis and is the same medical and dental coverage available to state employees. Medical Expense Plan. As disclosed in Note 1.D, at the time of separation from state service due to retirement or death, the state offers a 25 percent buyout of an employee’s accumulated sick leave. Individual state agencies may offer eligible employees a medical expense plan (MEP) that meets the requirements of the Internal Revenue Code. Agencies offering an MEP deposit the retiring employee’s sick leave buyout in the MEP for reimbursement of medical expenses. Retirement Benefits. Refer to Note 11 Retirement Plans and Note 12 Other Postemployment Benefits.
S t a t e o f W a s h i n g t o n
Notes to the Financial Statements
78
3. Interfund/Interagency Activities
The state engages in two major categories of interfund/ interagency activity: reciprocal and nonreciprocal. Reciprocal interfund/interagency activity is the internal counterpart to exchange and exchange-like transactions and includes both interfund loans and services provided and used. Nonreciprocal activity is nonexchange in nature and includes both transfers and reimbursements. 4. Donor-restricted Endowments
The state of Washington reports endowments in higher education endowment permanent accounts. These accounts are established outside of the state treasury for use by the higher education institutions. There is no state
law that governs endowment spending; rather, the policies of individual university and college boards govern the spending of net appreciation on investments. Under the current spending policy, distributions to programs approximate an annual percentage rate of 4 percent of a five-year rolling average of the endowment’s market valuation. The net appreciation available for authorization for expenditure by governing boards totaled $577.6 million. This amount is reported as restricted for expendable endowment funds on the government-wide Statement of Net Position.
S t a t e o f W a s h i n g t o n
Notes to the Financial Statements
79
Note 2 Accounting, Reporting, and Entity Changes Reporting Changes. Effective for fiscal year 2015 reporting, the state adopted the following new standards issued by the Governmental Accounting Standards Board (GASB): Statement No. 68 Accounting and Financial Reporting for Pensions. GASB Statement No. 68 requires governmental employers with employees participating in defined benefit pension plans that are administered through trusts or equivalent arrangements to report their proportionate share of the net pension liability (or net assets, if the plan net position exceeds the total pension liability) on the face of their accrual based financial statements. Statement No. 71 Pension Transition for Contributions Made subsequent to the Measurement Date. GASB Statement No. 71 addresses an issue regarding application of the transition provisions of Statement No. 68. The issue relates to amounts associated with contributions, if any, made by a state or local government employer to a defined benefit pension plan after the measurement date of the government’s beginning net pension liability. Fund Reclassification. During fiscal year 2015, it was determined that an account should be reclassified to a capital projects type fund because bond proceeds now comprise the majority of its resources. Accordingly, the beginning fund balance in the General Fund was reduced by $14.4 million and the beginning fund balance of the State Facilities Fund, a nonmajor capital projects fund, was increased by $14.4 million. Additionally an account was reclassified to a special revenue fund type as it now has a dedicated revenue source. This resulted in a beginning fund balance reduction of $672 thousand in the General Fund and an increase of $672 thousand in the Human Services Fund, a nonmajor special revenue fund. Also during fiscal year 2015, an agency was abolished and its accounts receivable were transferred to another agency that recorded the accounts receivables in a different fund. As a result the beginning fund balance of the Central Administrative and Regulatory Fund, a nonmajor special revenue fund, was reduced by $19 thousand, and fund balance of the Higher Education Facilities Fund, a nonmajor capital projects fund, was increased by $19 thousand. Prior Period Adjustment. The state recorded a reduction to the beginning net position balance in the following funds as a result of implementing GASB Statement No. 68:
• Major Proprietary Funds: Worker’s Compensation $134.5 million, Higher Education Student Services $295.5 million, and Guaranteed Education Tuition Program $1.2 million;
• Nonmajor Proprietary Funds: Lottery $7.0
million, Institutional $10.4 million, and Other Activities $25.6 million;
• Internal Service Funds: General Services $115.0
million, Data Processing Revolving $41.6 million, and Higher Education Revolving $31.7 million.
• Component Units: Public Stadium Authority, a
major component unit, $129 thousand; and the Washington State Housing Finance Commission and the Washington State Health Care Facilities Authority, both nonmajor component units, $3.7 million and $311 thousand, respectively.
The University of Washington (UW) posted a beginning balance adjustment to correct for both over accruing and incorrectly allocating employee benefits. The adjustment increased fund balance in the Higher Education Special Revenue Fund, a major governmental fund, by $74.4 million ($63.7 million to correct the over accrual and $10.7 million to correct the under allocation to other funds); decreased fund balance in the Higher Education Student Services Fund, a major proprietary fund, by $9.2 million, and decreased fund balance in the Higher Education Revolving Fund, an internal service fund, by $1.5 million. The Department of Commerce recorded a prior period adjustment in order to properly offset long-term loans receivables with non-spendable fund balance rather than unavailable revenue. This resulted in increases to fund balance in the following nonmajor special revenue funds: $82.7 million in the Central Administrative and Regulatory Fund, $517.1 million in the Human Services Fund, and $259.7 million in the Local Construction and Loan Fund. The Department of Natural Resources recorded a prior period adjustment to record three previously unrecorded local bank accounts which increased fund balance in the Central Administrative and Regulatory Fund, nonmajor special revenue fund, by $3.2 million. The beginning net position of Valley Medical Center, a major component unit, was increased by $2.5 million to record a component unit that was previously not reported. The beginning net position of Northwest Hospital, a major component unit, was increased by $2.7 million to record a component unit that was previously not reported.

S t a t e o f W a s h i n g t o n
Notes to the Financial Statements
80
Governmental Capital Assets and Long-term Obligations. The state recorded a beginning balance adjustment to long-term obligations associated with governmental funds of $2.85 billion as a result of the implementation of GASB Statement No. 68. The Department of Transportation recorded a prior period adjustment of $94.3 million to governmental capital assets, and $9.4 million to governmental long-term
obligations to record previously unrecorded capital assets and long-term obligations. The UW posted a beginning balance adjustment of $127.0 million to governmental long-term obligations to properly reflect outstanding debt.
Fund equity at July 1, 2014, has been restated as follows (expressed in thousands):
Fund equity (deficit) at Fund equity (deficit)June 30, 2014, as Fund Prior Period as restated,
previously reported Reclassification Adjustment July 1, 2014
Governmental Funds:General 1,826,141$ (15,056)$ -$ 1,811,085$ Higher Education Special Revenue 2,628,295 - 74,383 2,702,678 Higher Education Endowment 3,385,643 - - 3,385,643 Nonmajor Governmental 5,571,060 15,056 862,733 6,448,849
Proprietary Funds:Enterprise Funds:
Workers' Compensation (9,384,408) - (134,522) (9,518,930) Unemployment Compensation 3,815,039 - - 3,815,039 Higher Education Student Services 1,447,141 - (304,660) 1,142,481 Guaranteed Education Tuition Program 160,990 - (1,209) 159,781 Nonmajor Enterprise 83,235 - (43,067) 40,168
Internal Service Funds 268,649 - (189,860) 78,789
Fiduciary Funds:Private Purpose Trust 2,386 - - 2,386 Local Government Investment Pool 8,661,007 - - 8,661,007 Pension and Other Employee Benefit Plans 87,286,888 - - 87,286,888
Component Units:Public Stadium 316,851 - (129) 316,722 Health Benefit Exchange 37,229 - - 37,229 Valley Medical Center 211,893 - 2,500 214,393 Northwest Hospital 99,707 - 2,691 102,398 Nonmajor Component Units 150,177 - (4,018) 146,159
S t a t e o f W a s h i n g t o n
Notes to the Financial Statements
81
Note 3 Deposits and Investments A. DEPOSITS Custodial Credit Risk. Custodial credit risk is the risk associated with the failure of a depository financial institution. In the event of a depository financial institution’s failure, it is the risk that the state would not be able to recover its deposits or collateralized securities that are in the possession of the outside parties. The state minimizes custodial credit risk by restrictions set forth in state law. Statutes require state agencies to deposit funds in financial institutions that are physically located in Washington unless otherwise expressly permitted by statute and authorized by the Washington Public Deposit Protection Commission (PDPC). The PDPC, established under chapter 39.58 of the Revised Code of Washington (RCW), makes and enforces regulations and administers a collateral pool program to ensure public funds are protected if a financial institution becomes insolvent. Securities pledged are held by a trustee agent for the benefit of the collateral pool. At June 30, 2015, $1.21 billion of the state’s deposits with financial institutions were insured or collateralized, with the remaining $9.0 million uninsured/uncollateralized. B. INVESTMENTS – PENSION AND OTHER EMPLOYEE BENEFIT TRUST FUNDS (PENSION TRUST FUNDS) 1. Summary of Investment Policies
Under RCW 43.33A.030, trusteeship of the pension trust funds is vested within the voting members of the Washington State Investment Board (WSIB). The Legislature has established a standard of care for investment of these funds in RCW 43.33A.140. Additionally, the WSIB and its staff must comply with other state laws, such as the Ethics in Public Service Act, chapter 42.52 RCW, in making investment decisions and seeking to meet investment objectives. The pension trust funds consist of retirement contributions from employer and employee participants in the Washington State Retirement System and related earnings on those contributions. The Retirement System is administered by the Department of Retirement Systems. The WSIB has exclusive control of the investment of all money invested in the pension trust funds. In accordance with RCW 43.33A.110, the WSIB manages the pension fund portfolio to achieve maximum return at a prudent level of risk. The WSIB establishes asset allocation
targets that must be considered at all times when making investment decisions. The asset mix may deviate from the target. Deviations greater than predetermined acceptable levels require rebalancing back to the target. When an asset class exceeds its range, the goal of rebalancing is to meet the target allocation within consideration of the other remaining asset classes. Eligible Investments. The WSIB is authorized by statute as having investment management responsibility for pension trust funds. The WSIB is authorized to invest as provided by statute (chapter 43.33A RCW) and WSIB policy in the following: U.S. treasury bills; discount notes; repurchase agreements; reverse repurchase agreements; banker’s acceptances; commercial paper; guaranteed investment contracts; U.S. government and agency (government sponsored corporations eligible for collateral purposes at the Federal Reserve) securities; non-U.S. dollar bonds; investment grade corporate bonds; non-investment grade corporate bonds; publicly traded mortgage-backed securities; privately placed mortgages; private placements of corporate debt; U.S. and foreign common stock; U.S. preferred stock; convertible securities; private equity including but not limited to investment corporations, partnerships, and limited liability companies for venture capital, leveraged buy-outs, real estate, and other tangible assets, or other forms of private equity; asset-backed securities; and derivative securities including futures, options, options on futures, forward contracts, and swap transactions. There were no violations of these investment restrictions during fiscal year 2015. Commingled Trust Fund. Pension trust funds are invested in the Commingled Trust Fund (CTF). The CTF is a diversified pool of investments used as an investment vehicle for 14 separate retirement plans and one supplemental pension funding account. These plans hold shares in the CTF which represent a percentage ownership in the pool of investments. Plans are allowed to purchase or sell shares in the CTF, based on the fair value of the underlying assets, on the first business day of each month. In addition to share ownership in the CTF, each retirement plan holds short-term investments that are used to manage each plan’s cash needs. The CTF consists of the Public Employees’ Retirement System (PERS) Plans 1, 2, and 3, Teachers’ Retirement System (TRS) Plans 1, 2, and 3, School Employees’ Retirement System (SERS) Plans 2 and 3, Law Enforcement Officers’ and Fire Fighters’ Retirement Plans 1 and 2, Washington State Patrol Retirement System Plans 1 and 2, Public Safety Employees’ Retirement System Plan 2, Volunteer Fire Fighters’ and Reserve Officers’ Relief and Pension Fund, and the Higher Education Retirement Supplemental Benefit Fund. PERS Plan 3, TRS Plan 3, and SERS Plan 3 are hybrid defined benefit/defined contribution plans. The participants of those plans have
S t a t e o f W a s h i n g t o n
Notes to the Financial Statements
82
the option to direct their contributions to the CTF or invest their defined contributions in other external options not managed by the WSIB. CTF Investment Policies and Restrictions. The CTF is comprised of public markets equities, fixed income securities, private equity investments, tangible assets, real estate, and an innovation portfolio. The CTF’s performance objective is to exceed the return of two custom benchmarks, each consisting of public indices weighted according to asset allocation targets. The asset allocation for the CTF is formally reviewed at least every four years. The allocation policy is reviewed more frequently if there has been a fundamental change in the structure of the capital markets or in the underlying cash flow or liability structure of the pension trust funds. When market values fall outside policy ranges, assets are rebalanced first by using normal cash flows and then through reallocations of assets across asset classes. In cases of a major rebalancing, the pension trust funds can utilize futures, forward contracts, and options in order to maintain exposure within each asset class and reduce transaction costs. Major rebalancing can occur to bring asset classes within their target ranges or when the pension trust funds are transitioning managers. To achieve the performance and diversification objectives of the pension trust funds, the public markets equity program seeks to achieve the highest return possible consistent with prudent risk management and the desire for downside protection, with passive equity strategies as the default whenever strategies with better risk/return profiles cannot be identified; provide diversification to the pension trust funds’ overall investment program; maintain liquidity in public equity; and maintain transparency into all public equity strategies to the extent possible. The public markets equity portion of the pension trust funds invests in publicly traded equities globally, including equity securities in the U.S., developed non-U.S., and emerging markets. The program has a global benchmark, currently the Morgan Stanley Capital International All Country World Investable Market Index. A mix of external managers approved by the WSIB is used to manage the program. Passive management delivers broad diversified equity market exposure at low cost and is used when active managers cannot be identified and monitored appropriately. Passive management is also used when it is considered an appropriate alternative to active management, typically in more efficient markets. Active management is used when the pension trust funds can identify, access, and monitor successful managers in markets that are less efficient. Active management seeks to enhance the risk/return profile of the program.
The fixed income segment is managed to achieve the highest return possible consistent with the desire to control asset volatility, emphasize high yield to maturity opportunities to add value through active management, provide diversification to the overall investment program, and to meet or exceed the return of the Barclays Capital Universal Bond Index, with volatility similar to or less than the index. RCW 43.33A.140 prohibits a corporate fixed income issue cost from exceeding 3 percent of the CTF’s market value at the time of purchase, and 6 percent of its market value thereafter. However, the WSIB manages with a more restrictive concentration constraint, limiting exposure to any corporate issuer to 3 percent of the CTF fixed income portfolio’s market value at all times. The fixed income portfolio is constrained by policy from investing more than 1 percent of the portfolio’s par holdings in any single issuer with a quality rating below investment grade (as defined by Barclays Capital Global Family of Fixed Income Indices). Total market value of below investment grade credit bonds (as defined by Barclays Capital Global Family of Fixed Income Indices) shall not exceed 15 percent of the market value of the fixed income portfolio. Although below investment grade mortgage-backed, asset-backed, or commercial mortgage-backed securities may not be purchased, portfolio holdings that are downgraded to those levels or are no longer rated may continue to be held. The total market value of below investment grade mortgage-backed, asset-backed, and commercial mortgage-backed securities shall not exceed 5 percent of the market value of the fixed income portfolio. The duration of the portfolio (the sensitivity of the portfolio’s fair value to changes in the level of interest rates) is targeted to be within plus or minus 20 percent of the duration of the Barclays Capital Universal Index. The major sector allocations of the fixed income portfolio are limited to the following ranges: U.S. treasuries and government agencies – 10 percent to 45 percent, credit bonds – 10 percent to 80 percent, asset-backed securities – 0 percent to 10 percent, commercial mortgage-backed securities – 0 percent to 10 percent, and mortgage-backed securities – 5 percent to 45 percent. Pension trust funds can be invested in any appropriate private equity investment opportunity that has the potential for returns superior to traditional investment opportunities and which is not prohibited by the WSIB’s policies or by law. These investment types are generally divided into venture capital, corporate finance, growth equity, special situations, distressed, mezzanine, and other investments. Private equity investments are made through limited partnership or direct investment vehicles.
S t a t e o f W a s h i n g t o n
Notes to the Financial Statements
83
The private equity investment portfolio is managed to meet or exceed the returns of the Russell 3000 by 300 basis points in the long term. To meet the return and plan objectives, the private equity portfolio has diversified investments in companies in a variety of growth stages. The portfolio also includes a broad cross-section of opportunities in different industries and geographic regions. The primary goal of the tangible asset portfolio is to generate a long-term, high quality, stable income stream. The secondary goal is to generate appreciation approximately commensurate with inflation. The structure of the investments is primarily targeted to those funds, separate accounts, or tangible asset operating companies providing the WSIB with the most robust governance provisions related to acquisitions, dispositions, debt levels, and ongoing operational decisions for annual capital expenditures. The tangible asset portfolio invests in a number of sectors, but the primary focus is infrastructure, timber, and natural resource rights (oil and natural gas). The WSIB’s current return objective for tangible assets calls for a target benchmark of 4 percent above the U.S. Consumer Price Index over a long-term investment horizon defined as at least five years. The WSIB’s real estate program is an externally managed pool of selected partnership investments, intended to provide alternative portfolio characteristics when compared to traditional stock and bond investments. The majority of the WSIB’s partnerships invest in institutional-quality real estate assets that are leased to third parties. The income generated from bond-like lease payments coupled with the hard asset qualities of commercial real estate combine to generate returns that are expected to fall between the return expectations for fixed income and equities over the long term. The real estate portfolio is managed to deliver risk-adjusted returns that are consistent with the WSIB’s long-term return expectations for the asset class. The WSIB’s real estate partnerships typically invest in private real estate assets that are held for long-term income and appreciation. Many of the WSIB’s investment partnerships do not involve co-investment with other financial entities, thereby providing the WSIB with control provisions, related transactions, and ongoing operational decisions for annual capital expenditures. Volatility in the real estate portfolio is minimized through a combination of factors. First, the majority of the WSIB’s partners own real estate assets in a private investment form which are not subject to public market volatility. Second, real estate capital is diversified among a host of partners with varying investment styles. Third, partnership assets are invested in numerous economic regions, including foreign markets, and in various property types. Finally, the
WSIB’s partners invest at different points within the properties’ capital structure and life cycle. The WSIB’s real estate portfolio current benchmark seeks to earn an 8 percent annual investment return over a rolling 10-year period. The innovation portfolio investment strategy is to provide the WSIB with the ability to invest in assets that fall outside of traditional asset classes and to provide the WSIB with comfort and demonstrated success before committing large dollar amounts to the strategy. The overall benchmark for the innovation portfolio is the weighted average of the underlying benchmark for each asset in the portfolio. Currently, there are three investment strategies in the innovation portfolio, two involving private partnerships and one investing in public equities. 2. Unfunded Commitments
The WSIB has entered into a number of agreements that commit the pension trust funds, upon request, to make additional investment purchases up to predetermined amounts. As of June 30, 2015, the pension trust funds had unfunded commitments of $11.26 billion, $7.39 billion, $1.97 billion, and $22.0 million in private equity, real estate, tangible assets, and the innovation portfolio, respectively. 3. Securities Lending
State law and board policy permit the pension trust funds to participate in securities lending programs to augment investment income. The WSIB has entered into an agreement with State Street Corporation to act as agent for the pension trust funds in securities lending transactions. As State Street Corporation is the custodian bank for the pension trust funds, it is counterparty to securities lending transactions. The fair value of the securities on loan at June 30, 2015, was approximately $1.4 billion. The pension trust funds report securities on loan in their respective categories in the Statement of Net Position. At June 30, 2015, cash collateral received totaling $843.1 million is reported as securities lending obligation, and the fair value of the reinvested cash collateral totaling $843.1 million is reported as security lending collateral in the Statement of Net Position. Securities received as collateral for which the pension trust funds do not have the ability to pledge or sell unless the borrower defaults are not reported as assets and liabilities in the Statement of Net Position. Total securities received as collateral at June 30, 2015, was $638.4 million. During the fiscal year, debt and equity securities were loaned and collateralized by the pension trust funds’ agent with cash, U.S. government or U.S. agency securities
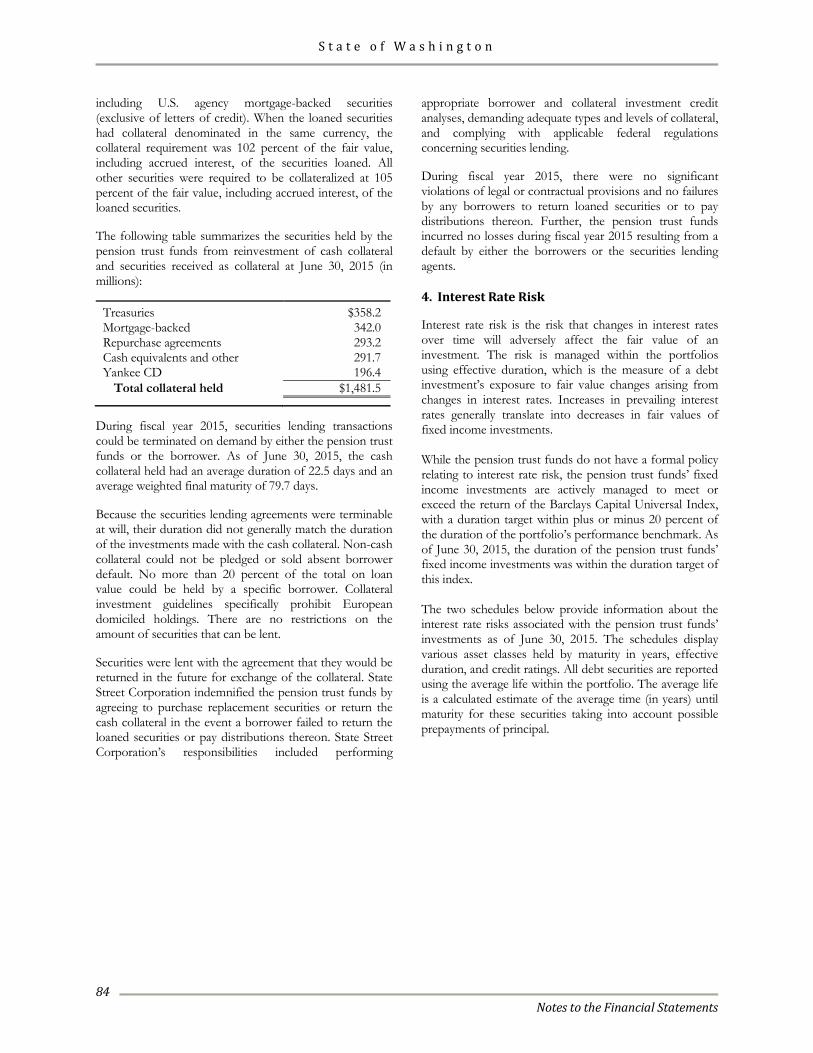
S t a t e o f W a s h i n g t o n
Notes to the Financial Statements
84
including U.S. agency mortgage-backed securities (exclusive of letters of credit). When the loaned securities had collateral denominated in the same currency, the collateral requirement was 102 percent of the fair value, including accrued interest, of the securities loaned. All other securities were required to be collateralized at 105 percent of the fair value, including accrued interest, of the loaned securities. The following table summarizes the securities held by the pension trust funds from reinvestment of cash collateral and securities received as collateral at June 30, 2015 (in millions):
Treasuries $358.2 Mortgage-backed 342.0 Repurchase agreements 293.2 Cash equivalents and other 291.7 Yankee CD 196.4
Total collateral held $1,481.5
During fiscal year 2015, securities lending transactions could be terminated on demand by either the pension trust funds or the borrower. As of June 30, 2015, the cash collateral held had an average duration of 22.5 days and an average weighted final maturity of 79.7 days. Because the securities lending agreements were terminable at will, their duration did not generally match the duration of the investments made with the cash collateral. Non-cash collateral could not be pledged or sold absent borrower default. No more than 20 percent of the total on loan value could be held by a specific borrower. Collateral investment guidelines specifically prohibit European domiciled holdings. There are no restrictions on the amount of securities that can be lent. Securities were lent with the agreement that they would be returned in the future for exchange of the collateral. State Street Corporation indemnified the pension trust funds by agreeing to purchase replacement securities or return the cash collateral in the event a borrower failed to return the loaned securities or pay distributions thereon. State Street Corporation’s responsibilities included performing
appropriate borrower and collateral investment credit analyses, demanding adequate types and levels of collateral, and complying with applicable federal regulations concerning securities lending. During fiscal year 2015, there were no significant violations of legal or contractual provisions and no failures by any borrowers to return loaned securities or to pay distributions thereon. Further, the pension trust funds incurred no losses during fiscal year 2015 resulting from a default by either the borrowers or the securities lending agents. 4. Interest Rate Risk
Interest rate risk is the risk that changes in interest rates over time will adversely affect the fair value of an investment. The risk is managed within the portfolios using effective duration, which is the measure of a debt investment’s exposure to fair value changes arising from changes in interest rates. Increases in prevailing interest rates generally translate into decreases in fair values of fixed income investments. While the pension trust funds do not have a formal policy relating to interest rate risk, the pension trust funds’ fixed income investments are actively managed to meet or exceed the return of the Barclays Capital Universal Index, with a duration target within plus or minus 20 percent of the duration of the portfolio’s performance benchmark. As of June 30, 2015, the duration of the pension trust funds’ fixed income investments was within the duration target of this index. The two schedules below provide information about the interest rate risks associated with the pension trust funds’ investments as of June 30, 2015. The schedules display various asset classes held by maturity in years, effective duration, and credit ratings. All debt securities are reported using the average life within the portfolio. The average life is a calculated estimate of the average time (in years) until maturity for these securities taking into account possible prepayments of principal.
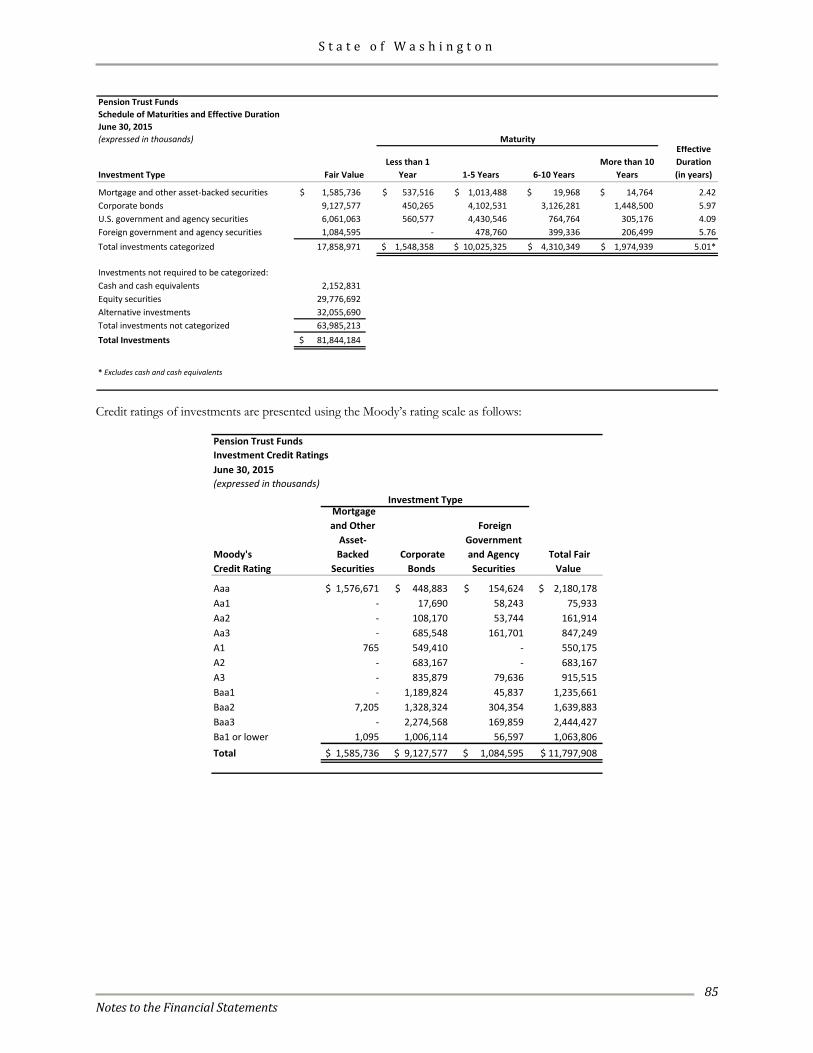
S t a t e o f W a s h i n g t o n
Notes to the Financial Statements
85
Pension Trust Funds Schedule of Maturities and Effective DurationJune 30, 2015(expressed in thousands)
Investment Type Fair ValueLess than 1
Year 1-5 Years 6-10 YearsMore than 10
Years
Effective Duration (in years)
Mortgage and other asset-backed securities 1,585,736$ 537,516$ 1,013,488$ 19,968$ 14,764$ 2.42Corporate bonds 9,127,577 450,265 4,102,531 3,126,281 1,448,500 5.97U.S. government and agency securities 6,061,063 560,577 4,430,546 764,764 305,176 4.09Foreign government and agency securities 1,084,595 - 478,760 399,336 206,499 5.76Total investments categorized 17,858,971 1,548,358$ 10,025,325$ 4,310,349$ 1,974,939$ 5.01*
Investments not required to be categorized:Cash and cash equivalents 2,152,831 Equity securities 29,776,692 Alternative investments 32,055,690 Total investments not categorized 63,985,213 Total Investments 81,844,184$
* Excludes cash and cash equivalents
Maturity
Credit ratings of investments are presented using the Moody’s rating scale as follows:
Pension Trust Funds Investment Credit RatingsJune 30, 2015(expressed in thousands)
Moody'sCredit Rating
Mortgage and Other
Asset-Backed
Securities Corporate
Bonds
Foreign Government and Agency Securities
Total Fair Value
Aaa 1,576,671$ 448,883$ 154,624$ 2,180,178$ Aa1 - 17,690 58,243 75,933 Aa2 - 108,170 53,744 161,914 Aa3 - 685,548 161,701 847,249 A1 765 549,410 - 550,175 A2 - 683,167 - 683,167 A3 - 835,879 79,636 915,515 Baa1 - 1,189,824 45,837 1,235,661 Baa2 7,205 1,328,324 304,354 1,639,883 Baa3 - 2,274,568 169,859 2,444,427 Ba1 or lower 1,095 1,006,114 56,597 1,063,806 Total 1,585,736$ 9,127,577$ 1,084,595$ 11,797,908$
Investment Type
S t a t e o f W a s h i n g t o n
Notes to the Financial Statements
86
5. Credit Risk
Credit risk is the risk that an issuer or other counterparty to an investment will not fulfill its obligations. The pension trust funds’ investment policies limit the fixed income securities to investment grade or higher at the time of purchase. Investment grade securities are those fixed income securities with a Moody’s rating of Aaa to Baa or a Standard and Poor’s rating of AAA to BBB. The rated debt investments of the pension trust funds as of June 30, 2015, were rated by Moody’s and/or an equivalent national rating organization. Concentration of Credit Risk. Concentration of credit risk is the risk of loss attributed to the magnitude of an investment in a single issuer. The policy of the pension trust funds states no corporate fixed income issue cost shall exceed 3 percent of cost at the time of purchase or 6 percent of fair value thereafter of the fund, and no high yield issues shall exceed 1 percent of cost or 2 percent of fair value of the fund. There was no concentration of credit risk exceeding these policy guidelines as of June 30, 2015. Custodial Credit Risk. Custodial credit risk is the risk that, in the event a depository institution or counterparty fails, the pension trust funds would not be able to recover the value of their deposits, investments, or collateral securities that are in the possession of an outside party. The pension trust funds do not have a policy relating to custodial credit risk. The WSIB mitigates custodial credit
risk by having its investment securities (excluding cash, cash equivalents, and repurchase agreements held as securities lending collateral) registered and held in the name of the WSIB for the benefit of the pension trust funds. 6. Foreign Currency Risk
Foreign currency risk is the risk that changes in exchange rates will adversely affect the fair value of an investment or a deposit. The pension trust funds do not have a formal policy to limit foreign currency risk. The WSIB manages their exposure to fair value loss by requiring their international securities investment managers to maintain diversified portfolios by sector and by issuer to limit foreign currency and security risk. The following schedule presents the exposure of the pension trust funds’ investments to foreign currency risk. The schedule provides information on deposits and investments held in various foreign currencies. Private equity and real estate are presented according to the financial reporting currency of the individual funds. This is not a presentation of currency exposure relating to the underlying holdings. The schedule is stated in U.S. dollars. In addition, the CTF has foreign currency exposure at June 30, 2015, of $822.6 million invested in various international commingled equity index funds.
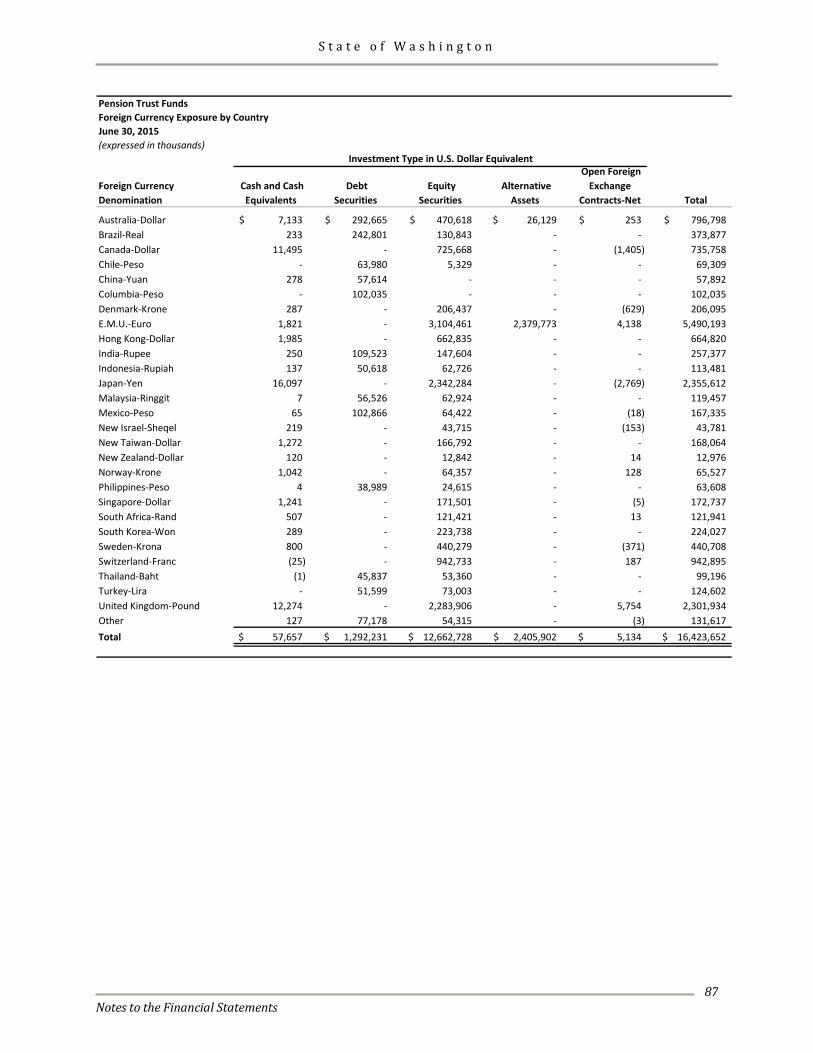
S t a t e o f W a s h i n g t o n
Notes to the Financial Statements
87
Pension Trust Funds Foreign Currency Exposure by CountryJune 30, 2015(expressed in thousands)
Foreign Currency Denomination
Cash and Cash Equivalents
DebtSecurities
Equity Securities
Alternative Assets
Open Foreign Exchange
Contracts-Net Total
Australia-Dollar 7,133$ 292,665$ 470,618$ 26,129$ 253$ 796,798$ Brazil-Real 233 242,801 130,843 - - 373,877 Canada-Dollar 11,495 - 725,668 - (1,405) 735,758 Chile-Peso - 63,980 5,329 - - 69,309 China-Yuan 278 57,614 - - - 57,892 Columbia-Peso - 102,035 - - - 102,035 Denmark-Krone 287 - 206,437 - (629) 206,095 E.M.U.-Euro 1,821 - 3,104,461 2,379,773 4,138 5,490,193 Hong Kong-Dollar 1,985 - 662,835 - - 664,820 India-Rupee 250 109,523 147,604 - - 257,377 Indonesia-Rupiah 137 50,618 62,726 - - 113,481 Japan-Yen 16,097 - 2,342,284 - (2,769) 2,355,612 Malaysia-Ringgit 7 56,526 62,924 - - 119,457 Mexico-Peso 65 102,866 64,422 - (18) 167,335 New Israel-Sheqel 219 - 43,715 - (153) 43,781 New Taiwan-Dollar 1,272 - 166,792 - - 168,064 New Zealand-Dollar 120 - 12,842 - 14 12,976 Norway-Krone 1,042 - 64,357 - 128 65,527 Philippines-Peso 4 38,989 24,615 - - 63,608 Singapore-Dollar 1,241 - 171,501 - (5) 172,737 South Africa-Rand 507 - 121,421 - 13 121,941 South Korea-Won 289 - 223,738 - - 224,027 Sweden-Krona 800 - 440,279 - (371) 440,708 Switzerland-Franc (25) - 942,733 - 187 942,895 Thailand-Baht (1) 45,837 53,360 - - 99,196 Turkey-Lira - 51,599 73,003 - - 124,602 United Kingdom-Pound 12,274 - 2,283,906 - 5,754 2,301,934 Other 127 77,178 54,315 - (3) 131,617 Total 57,657$ 1,292,231$ 12,662,728$ 2,405,902$ 5,134$ 16,423,652$
Investment Type in U.S. Dollar Equivalent
S t a t e o f W a s h i n g t o n
Notes to the Financial Statements
88
7. Derivatives
Pension trust funds are authorized to utilize various derivative financial instruments including financial futures, forward contracts, interest rate swaps, credit default swaps, equity swaps, and options. Derivative transactions involve, to varying degrees, market and credit risk. At June 30, 2015, the pension trust funds held investments in financial futures and forward currency contracts that are recorded at fair value with changes in value recognized in investment income in the Statement of Changes in Net Position in the period of change. The derivative instruments are considered investment derivatives and not hedging derivatives. Derivatives are generally used to achieve the desired market exposure of a security, index, or currency; adjust portfolio duration; or rebalance the total portfolio to the target asset allocation. Derivative contracts are instruments that derive their value from underlying assets, indices, reference interest rates, or a combination of these factors. A derivative instrument could be a contract negotiated on behalf of the pension trust funds and a specific counterparty. This would typically be referred to as an over the counter (OTC) contract, such as forward contracts. Alternatively, a derivative instrument, such as futures, could be listed and traded on an exchange and referred to as “exchange traded.” Inherent in the use of OTC derivatives, the pension trust funds are exposed to counterparty credit risk on all open OTC positions. Counterparty credit risk is the risk that a derivative counterparty may fail to meet its payment obligation under the derivative contract. As of June 30, 2015, the pension trust funds counterparty risk was not deemed to be significant. Futures contracts are standardized, exchange-traded contracts to purchase or sell a specific financial instrument at a predetermined price. Gains and losses on futures contracts are settled daily based on a notional (underlying)
principal value and do not involve an actual transfer of the specific instrument. The exchange assumes the risk that the counterparty will not pay and requires margin payments to minimize such risk. Futures are generally used to achieve the desired market exposure of a security or index or to rebalance the total portfolio. Forward currency contracts are agreements to exchange the currency of one country for the currency of another country at an agreed-upon price and settlement date. These forward commitments are not standardized and carry counterparty credit risk due to the possible nonperformance by a counterparty. The maximum potential loss is the aggregate face value in U.S. dollars at the time the contract was opened; however, the likelihood of such loss is remote. At June 30, 2015, the pension trust funds had outstanding forward currency contracts with a net unrealized gain of $5.1 million. The aggregate forward currency exchange contracts receivable and payable were $1.96 billion and $1.96 billion, respectively. The contracts have varying maturity dates ranging from August 12, 2015, to September 16, 2015. At June 30, 2015, the pension trust funds’ fixed income portfolio held derivative securities consisting of collateralized mortgage obligations with a fair value of $91.9 million. Domestic and foreign passive equity index fund managers may also utilize various derivative securities to manage exposure to risk and increase portfolio returns. Information on the extent of use and holdings of derivative securities by passive equity index fund managers is unavailable. Derivatives which are exchange traded are not subject to credit risk. The counterparty credit ratings for forward currency contracts that are subject to credit risk outstanding at June 30, 2015, had a credit rating of no less than A3 using Moody’s rating scale.
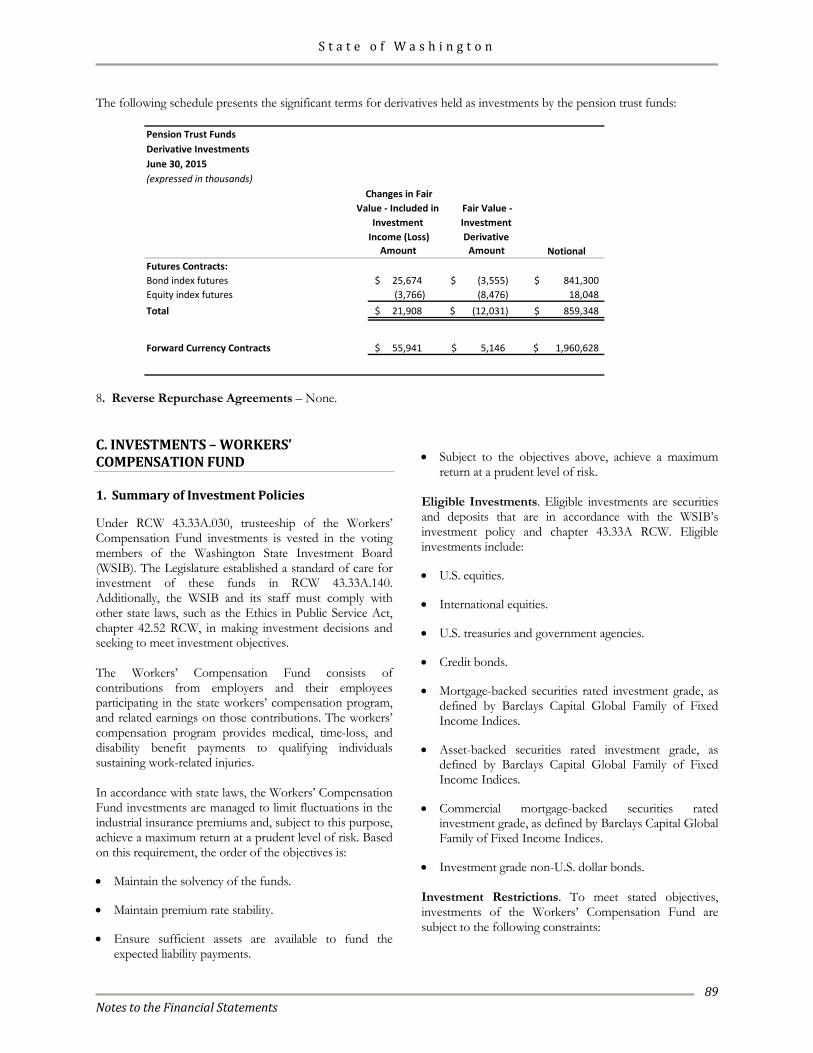
S t a t e o f W a s h i n g t o n
Notes to the Financial Statements
89
The following schedule presents the significant terms for derivatives held as investments by the pension trust funds:
Pension Trust Funds Derivative InvestmentsJune 30, 2015(expressed in thousands)
NotionalFutures Contracts:Bond index futures 25,674$ (3,555)$ 841,300$ Equity index futures (3,766) (8,476) 18,048 Total 21,908$ (12,031)$ 859,348$
Forward Currency Contracts 55,941$ 5,146$ 1,960,628$
Changes in Fair Value - Included in
Investment Income (Loss)
Amount
Fair Value - Investment Derivative
Amount
8. Reverse Repurchase Agreements – None. C. INVESTMENTS – WORKERS’ COMPENSATION FUND 1. Summary of Investment Policies
Under RCW 43.33A.030, trusteeship of the Workers’ Compensation Fund investments is vested in the voting members of the Washington State Investment Board (WSIB). The Legislature established a standard of care for investment of these funds in RCW 43.33A.140. Additionally, the WSIB and its staff must comply with other state laws, such as the Ethics in Public Service Act, chapter 42.52 RCW, in making investment decisions and seeking to meet investment objectives. The Workers’ Compensation Fund consists of contributions from employers and their employees participating in the state workers’ compensation program, and related earnings on those contributions. The workers’ compensation program provides medical, time-loss, and disability benefit payments to qualifying individuals sustaining work-related injuries. In accordance with state laws, the Workers’ Compensation Fund investments are managed to limit fluctuations in the industrial insurance premiums and, subject to this purpose, achieve a maximum return at a prudent level of risk. Based on this requirement, the order of the objectives is: • Maintain the solvency of the funds. • Maintain premium rate stability. • Ensure sufficient assets are available to fund the
expected liability payments.
• Subject to the objectives above, achieve a maximum
return at a prudent level of risk. Eligible Investments. Eligible investments are securities and deposits that are in accordance with the WSIB’s investment policy and chapter 43.33A RCW. Eligible investments include: • U.S. equities. • International equities. • U.S. treasuries and government agencies. • Credit bonds. • Mortgage-backed securities rated investment grade, as
defined by Barclays Capital Global Family of Fixed Income Indices.
• Asset-backed securities rated investment grade, as
defined by Barclays Capital Global Family of Fixed Income Indices.
• Commercial mortgage-backed securities rated
investment grade, as defined by Barclays Capital Global Family of Fixed Income Indices.
• Investment grade non-U.S. dollar bonds. Investment Restrictions. To meet stated objectives, investments of the Workers’ Compensation Fund are subject to the following constraints:
S t a t e o f W a s h i n g t o n
Notes to the Financial Statements
90
• All assets under the management of the WSIB are to be invested to maximize return at a prudent level of risk in accordance with RCW 43.33A.110 and RCW 43.33A.140.
• No corporate fixed income issue cost shall exceed 3
percent of the fund’s fair value at the time of purchase, nor shall its fair value exceed 6 percent of the fund’s fair value at any time.
• Asset allocations are to be reviewed every three to four
years or sooner if there are significant changes in funding levels or the liability durations.
• Assets are to be rebalanced across asset classes when
the fair value of the assets falls outside the policy ranges. The timing of any rebalancing will be based on market opportunities, cash flows, and the consideration of transaction costs; therefore, they need not occur immediately.
• Sector allocation for U.S. equities should be within a
range of 55 percent to 65 percent. Allocation for international equities should be within a range of 35 percent to 45 percent.
• The benchmark and structure for U.S. equities will be
the broad U.S. stock market as defined by the Morgan Stanley Capital International (MSCI) U.S. Investable Market Index. The benchmark and structure for international equities will be the MSCI All Country World Ex U.S. Investable Market Index. Both portfolios will be 100 percent passively managed in commingled index funds. The commingled funds may use futures for hedging or establishing a long position.
• Sector allocation of fixed income investments must be
managed within the following prescribed ranges: U.S. treasuries and government agencies – 5 percent to 25 percent, credit bonds – 20 percent to 80 percent, asset- backed securities – 0 percent to 10 percent, commercial mortgage-backed securities – 0 percent to 10 percent, and mortgage-backed securities – 0 percent to 25 percent. These targets are long-term in nature. Deviations may occur in the short term as a result of interim market conditions. However, if a range is exceeded, the portfolios must be rebalanced to the target allocations as soon as it is practical.
• Total market value of below investment grade credit
bonds (as defined by Barclays Capital Global Family of Fixed Income Indices) shall not exceed 5 percent of the total market value of the funds. Although below investment grade mortgage-backed, asset-backed, and commercial mortgage-backed securities may not be purchased, portfolio holdings that are downgraded to those levels or are no longer rated may continue to be
held. Total market value of below investment grade mortgage-backed, asset-backed, and commercial mortgage-backed securities shall not exceed 5 percent of total market value of the funds.
2. Securities Lending
State law and WSIB policy permit the Workers’ Compensation Fund to participate in securities lending programs to augment investment income. The WSIB has entered into an agreement with State Street Corporation to act as agent for the Workers’ Compensation Fund in securities lending transactions. As State Street Corporation is the custodian bank for the Workers’ Compensation Fund, it is counterparty to securities lending transactions. The fair value of the securities on loan at June 30, 2015, was approximately $102.6 million. The Workers’ Compensation Fund reports securities on loan in the Statement of Net Position in their respective categories. At June 30, 2015, cash collateral received totaling $68.2 million is reported as a securities lending obligation, and the fair value of the reinvested cash collateral totaling $68.2 million is reported as security lending collateral in the Statement of Net Position. Securities received as collateral for which the Workers’ Compensation Fund does not have the ability to pledge or sell unless the borrower defaults are not reported as assets and liabilities in the Statement of Net Position. Total securities received as collateral at June 30, 2015, was $38.3 million. During fiscal year 2015, debt securities were loaned and collateralized by the Workers’ Compensation Fund's agent with cash and U.S. government or U.S. agency securities including U.S. agency mortgage-backed securities (exclusive of letters of credit). When the loaned securities had collateral denominated in the same currency, the collateral requirement was 102 percent of the fair value, including accrued interest, of the securities loaned. All other securities were required to be collateralized at 105 percent of the fair value, including accrued interest, of the loaned securities. The following table summarizes the securities held from reinvestment of cash collateral and securities received as collateral at June 30, 2015 (in millions):
Mortgage-backed $38.3 Cash equivalents and other 28.6 Repurchase agreements 23.7 Yankee CD 15.9
Total collateral held $106.5
During fiscal year 2015, securities lending transactions could be terminated on demand by either the Workers’ Compensation Fund or the borrower. As of June 30, 2015, the cash collateral held had an average duration of 22.5
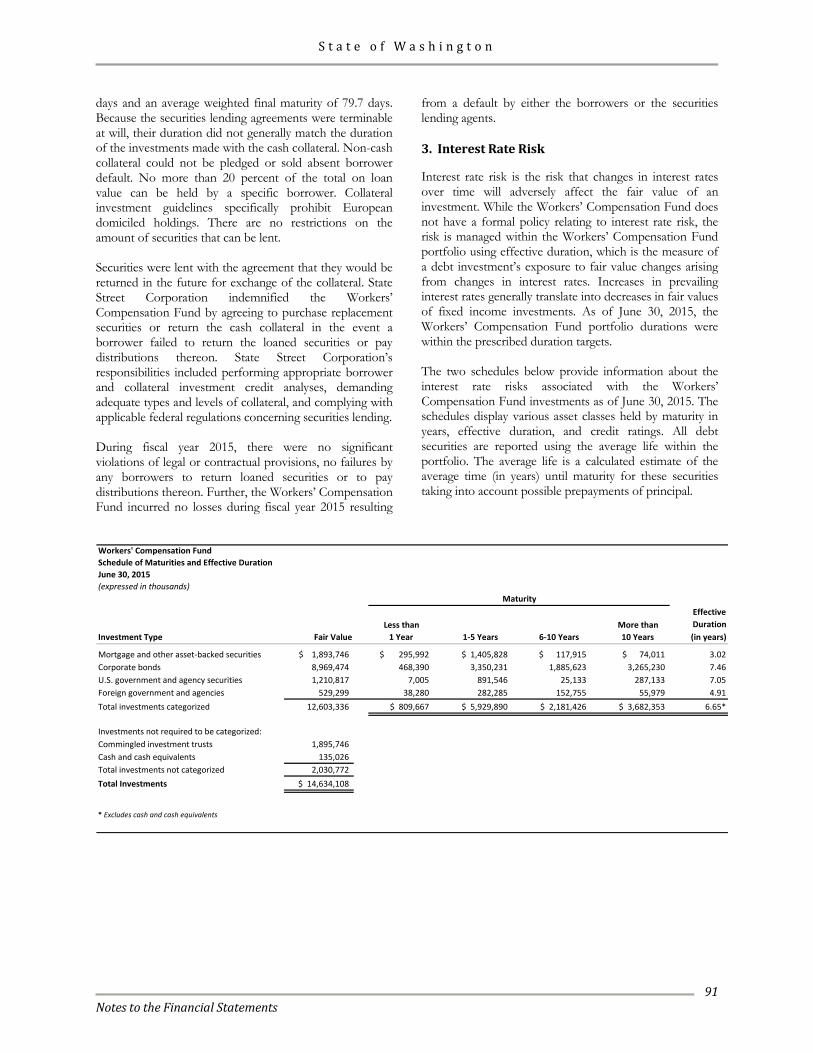
S t a t e o f W a s h i n g t o n
Notes to the Financial Statements
91
days and an average weighted final maturity of 79.7 days. Because the securities lending agreements were terminable at will, their duration did not generally match the duration of the investments made with the cash collateral. Non-cash collateral could not be pledged or sold absent borrower default. No more than 20 percent of the total on loan value can be held by a specific borrower. Collateral investment guidelines specifically prohibit European domiciled holdings. There are no restrictions on the amount of securities that can be lent. Securities were lent with the agreement that they would be returned in the future for exchange of the collateral. State Street Corporation indemnified the Workers’ Compensation Fund by agreeing to purchase replacement securities or return the cash collateral in the event a borrower failed to return the loaned securities or pay distributions thereon. State Street Corporation’s responsibilities included performing appropriate borrower and collateral investment credit analyses, demanding adequate types and levels of collateral, and complying with applicable federal regulations concerning securities lending. During fiscal year 2015, there were no significant violations of legal or contractual provisions, no failures by any borrowers to return loaned securities or to pay distributions thereon. Further, the Workers’ Compensation Fund incurred no losses during fiscal year 2015 resulting
from a default by either the borrowers or the securities lending agents. 3. Interest Rate Risk
Interest rate risk is the risk that changes in interest rates over time will adversely affect the fair value of an investment. While the Workers’ Compensation Fund does not have a formal policy relating to interest rate risk, the risk is managed within the Workers’ Compensation Fund portfolio using effective duration, which is the measure of a debt investment’s exposure to fair value changes arising from changes in interest rates. Increases in prevailing interest rates generally translate into decreases in fair values of fixed income investments. As of June 30, 2015, the Workers’ Compensation Fund portfolio durations were within the prescribed duration targets. The two schedules below provide information about the interest rate risks associated with the Workers’ Compensation Fund investments as of June 30, 2015. The schedules display various asset classes held by maturity in years, effective duration, and credit ratings. All debt securities are reported using the average life within the portfolio. The average life is a calculated estimate of the average time (in years) until maturity for these securities taking into account possible prepayments of principal.
Workers' Compensation Fund Schedule of Maturities and Effective DurationJune 30, 2015(expressed in thousands)
EffectiveLess than More than Duration
Investment Type Fair Value 1 Year 1-5 Years 6-10 Years 10 Years (in years)
Mortgage and other asset-backed securities $ 1,893,746 $ 295,992 $ 1,405,828 $ 117,915 $ 74,011 3.02Corporate bonds 8,969,474 468,390 3,350,231 1,885,623 3,265,230 7.46U.S. government and agency securities 1,210,817 7,005 891,546 25,133 287,133 7.05Foreign government and agencies 529,299 38,280 282,285 152,755 55,979 4.91Total investments categorized 12,603,336 $ 809,667 $ 5,929,890 $ 2,181,426 $ 3,682,353 6.65*
Investments not required to be categorized:Commingled investment trusts 1,895,746 Cash and cash equivalents 135,026 Total investments not categorized 2,030,772 Total Investments $ 14,634,108
* Excludes cash and cash equivalents
Maturity
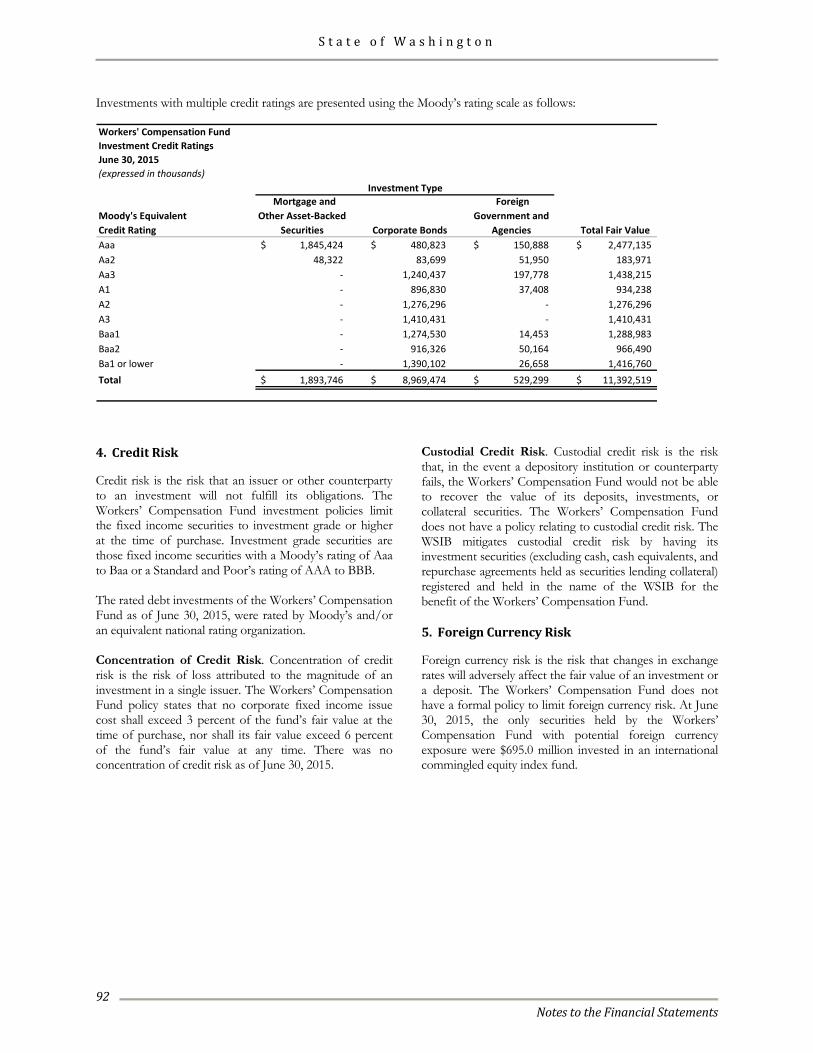
S t a t e o f W a s h i n g t o n
Notes to the Financial Statements
92
Investments with multiple credit ratings are presented using the Moody’s rating scale as follows: Workers' Compensation Fund Investment Credit RatingsJune 30, 2015(expressed in thousands)
Moody's EquivalentCredit Rating
Mortgage and Other Asset-Backed
Securities Corporate Bonds
Foreign Government and
Agencies Total Fair Value Aaa 1,845,424$ 480,823$ 150,888$ 2,477,135$ Aa2 48,322 83,699 51,950 183,971 Aa3 - 1,240,437 197,778 1,438,215 A1 - 896,830 37,408 934,238 A2 - 1,276,296 - 1,276,296 A3 - 1,410,431 - 1,410,431 Baa1 - 1,274,530 14,453 1,288,983 Baa2 - 916,326 50,164 966,490 Ba1 or lower - 1,390,102 26,658 1,416,760 Total 1,893,746$ 8,969,474$ 529,299$ 11,392,519$
Investment Type
4. Credit Risk
Credit risk is the risk that an issuer or other counterparty to an investment will not fulfill its obligations. The Workers’ Compensation Fund investment policies limit the fixed income securities to investment grade or higher at the time of purchase. Investment grade securities are those fixed income securities with a Moody’s rating of Aaa to Baa or a Standard and Poor’s rating of AAA to BBB. The rated debt investments of the Workers’ Compensation Fund as of June 30, 2015, were rated by Moody’s and/or an equivalent national rating organization. Concentration of Credit Risk. Concentration of credit risk is the risk of loss attributed to the magnitude of an investment in a single issuer. The Workers’ Compensation Fund policy states that no corporate fixed income issue cost shall exceed 3 percent of the fund’s fair value at the time of purchase, nor shall its fair value exceed 6 percent of the fund’s fair value at any time. There was no concentration of credit risk as of June 30, 2015.
Custodial Credit Risk. Custodial credit risk is the risk that, in the event a depository institution or counterparty fails, the Workers’ Compensation Fund would not be able to recover the value of its deposits, investments, or collateral securities. The Workers’ Compensation Fund does not have a policy relating to custodial credit risk. The WSIB mitigates custodial credit risk by having its investment securities (excluding cash, cash equivalents, and repurchase agreements held as securities lending collateral) registered and held in the name of the WSIB for the benefit of the Workers’ Compensation Fund. 5. Foreign Currency Risk
Foreign currency risk is the risk that changes in exchange rates will adversely affect the fair value of an investment or a deposit. The Workers’ Compensation Fund does not have a formal policy to limit foreign currency risk. At June 30, 2015, the only securities held by the Workers’ Compensation Fund with potential foreign currency exposure were $695.0 million invested in an international commingled equity index fund.
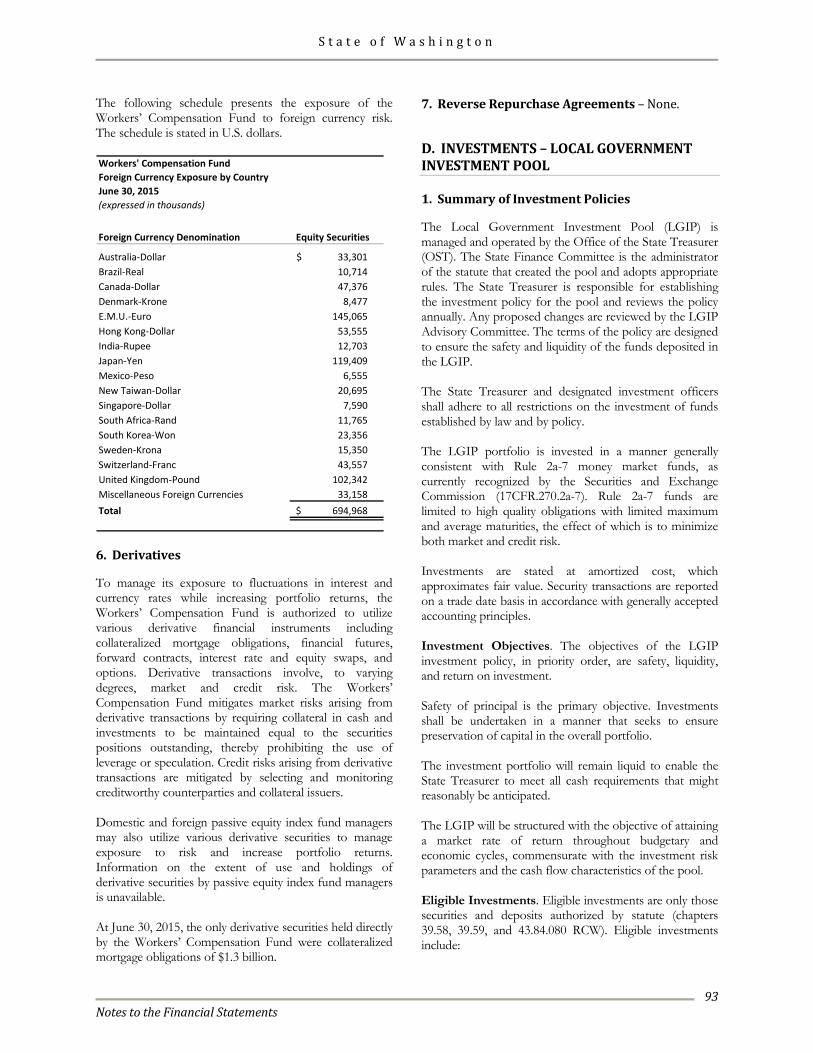
S t a t e o f W a s h i n g t o n
Notes to the Financial Statements
93
The following schedule presents the exposure of the Workers’ Compensation Fund to foreign currency risk. The schedule is stated in U.S. dollars. Workers' Compensation FundForeign Currency Exposure by CountryJune 30, 2015(expressed in thousands)
Foreign Currency Denomination Equity Securities
Australia-Dollar 33,301$ Brazil-Real 10,714 Canada-Dollar 47,376 Denmark-Krone 8,477 E.M.U.-Euro 145,065 Hong Kong-Dollar 53,555 India-Rupee 12,703 Japan-Yen 119,409 Mexico-Peso 6,555 New Taiwan-Dollar 20,695 Singapore-Dollar 7,590 South Africa-Rand 11,765 South Korea-Won 23,356 Sweden-Krona 15,350 Switzerland-Franc 43,557 United Kingdom-Pound 102,342 Miscellaneous Foreign Currencies 33,158 Total 694,968$
6. Derivatives
To manage its exposure to fluctuations in interest and currency rates while increasing portfolio returns, the Workers’ Compensation Fund is authorized to utilize various derivative financial instruments including collateralized mortgage obligations, financial futures, forward contracts, interest rate and equity swaps, and options. Derivative transactions involve, to varying degrees, market and credit risk. The Workers’ Compensation Fund mitigates market risks arising from derivative transactions by requiring collateral in cash and investments to be maintained equal to the securities positions outstanding, thereby prohibiting the use of leverage or speculation. Credit risks arising from derivative transactions are mitigated by selecting and monitoring creditworthy counterparties and collateral issuers. Domestic and foreign passive equity index fund managers may also utilize various derivative securities to manage exposure to risk and increase portfolio returns. Information on the extent of use and holdings of derivative securities by passive equity index fund managers is unavailable. At June 30, 2015, the only derivative securities held directly by the Workers’ Compensation Fund were collateralized mortgage obligations of $1.3 billion.
7. Reverse Repurchase Agreements – None.
D. INVESTMENTS – LOCAL GOVERNMENT INVESTMENT POOL 1. Summary of Investment Policies
The Local Government Investment Pool (LGIP) is managed and operated by the Office of the State Treasurer (OST). The State Finance Committee is the administrator of the statute that created the pool and adopts appropriate rules. The State Treasurer is responsible for establishing the investment policy for the pool and reviews the policy annually. Any proposed changes are reviewed by the LGIP Advisory Committee. The terms of the policy are designed to ensure the safety and liquidity of the funds deposited in the LGIP. The State Treasurer and designated investment officers shall adhere to all restrictions on the investment of funds established by law and by policy. The LGIP portfolio is invested in a manner generally consistent with Rule 2a-7 money market funds, as currently recognized by the Securities and Exchange Commission (17CFR.270.2a-7). Rule 2a-7 funds are limited to high quality obligations with limited maximum and average maturities, the effect of which is to minimize both market and credit risk. Investments are stated at amortized cost, which approximates fair value. Security transactions are reported on a trade date basis in accordance with generally accepted accounting principles. Investment Objectives. The objectives of the LGIP investment policy, in priority order, are safety, liquidity, and return on investment. Safety of principal is the primary objective. Investments shall be undertaken in a manner that seeks to ensure preservation of capital in the overall portfolio. The investment portfolio will remain liquid to enable the State Treasurer to meet all cash requirements that might reasonably be anticipated. The LGIP will be structured with the objective of attaining a market rate of return throughout budgetary and economic cycles, commensurate with the investment risk parameters and the cash flow characteristics of the pool. Eligible Investments. Eligible investments are only those securities and deposits authorized by statute (chapters 39.58, 39.59, and 43.84.080 RCW). Eligible investments include:
S t a t e o f W a s h i n g t o n
Notes to the Financial Statements
94
• Obligations of the U.S. government. • Obligations of U.S. government agencies or of
corporations wholly owned by the U.S. government. • Obligations of government-sponsored corporations
that are or may become eligible as collateral for advances to member banks as determined by the board of governors of the Federal Reserve.
• Banker’s acceptances purchased on the secondary
market rated with the highest short-term credit rating of any two designated Nationally Recognized Statistical Rating Organizations (NRSROs) at the time of purchase. If the banker’s acceptance is rated by more than two NRSROs, it must have the highest rating from all of the organizations.
• Commercial paper, provided that the OST adheres
with policies and procedures of the Washington State Investment Board regarding commercial paper (RCW 43.84.080(7)).
• Certificates of deposit or demand deposits with
financial institutions qualified by the Washington Public Deposit Protection Commission.
• Obligations of the state of Washington or its political
subdivisions. Investment Restrictions. To provide for safety and liquidity of funds, the LGIP policy places the following restrictions on the investment portfolio: • Investments are restricted to fixed rate securities that
mature in 397 days or less, except securities utilized in repurchase agreements and U.S. government floating or variable rate notes which may have a maximum maturity of 762 days, provided they have reset dates within one year and that on any reset date can reasonably be expected to have a market value that approximates their amortized cost.
• The weighted average maturity of the portfolio will not
exceed 60 days. • The weighted average life of the portfolio will not
exceed 120 days. • The purchase of investments in securities other than
those issued by the U.S. government or its agencies will be limited.
• Cash generated through securities lending or reverse
repurchase agreement transactions will not increase the dollar amount of specified investment types beyond stated limits.
2. Securities Lending
State statutes permit the LGIP to lend its securities to broker-dealers and other entities with a simultaneous agreement to return the collateral for the same securities in the future. The LGIP has contracted with Citibank, N.A. as a lending agent and receives a share of income earned from this activity. The lending agent lends securities and receives collateral, which can be in the form of cash or other securities. The collateral, which must be valued at 102 percent of the market value of the loaned securities, is priced daily and, if necessary, action is taken to maintain the collateralization level at 102 percent. Cash collateral received from the lending of non coupon-bearing securities shall not be valued at less than 102 percent of market value, not to exceed par. The cash is invested by the lending agent in accordance with investment guidelines approved by the LGIP. The securities held as collateral and the securities underlying the cash collateral are held by the LGIP’s custodian. One option available to the lending agent is to invest cash collateral with the LGIP. Maturities of investments made with cash collateral are generally matched to maturities of securities loaned. During fiscal year 2015, the LGIP lent U.S. agency and treasury securities. Cash collateral was reinvested in repurchase agreements and interest bearing bank deposits. At fiscal year end, there were no securities on loan. The LGIP investment policy requires that any securities on loan be made available by the lending agent for next day liquidity at the option of the LGIP. During fiscal year 2015, the LGIP had no credit risk exposure to borrowers because the amounts owed to the borrowers exceeded the amounts the borrowers owed the LGIP. Furthermore, contracts require the lending agent to indemnify the LGIP if the borrowers fail to return securities and if collateral is inadequate to replace the securities lent, or if the borrower fails to pay the LGIP for income distribution by the securities’ issuers while the securities are on loan. The LGIP cannot pledge or sell collateral securities received unless the borrower defaults. The LGIP investment policy limits the amount of reverse repurchase agreements and securities lending to 30 percent of the total portfolio. There were no violations of legal or contractual provisions and no losses resulting from a default of a borrower or lending agent during the fiscal year. 3. Interest Rate Risk
Interest rate risk is the risk that changes in interest rates of debt instruments will adversely affect the fair value of an investment. To mitigate the effect of interest rate risk, the LGIP portfolio is invested in high quality, highly liquid obligations with limited maximum and average maturities.
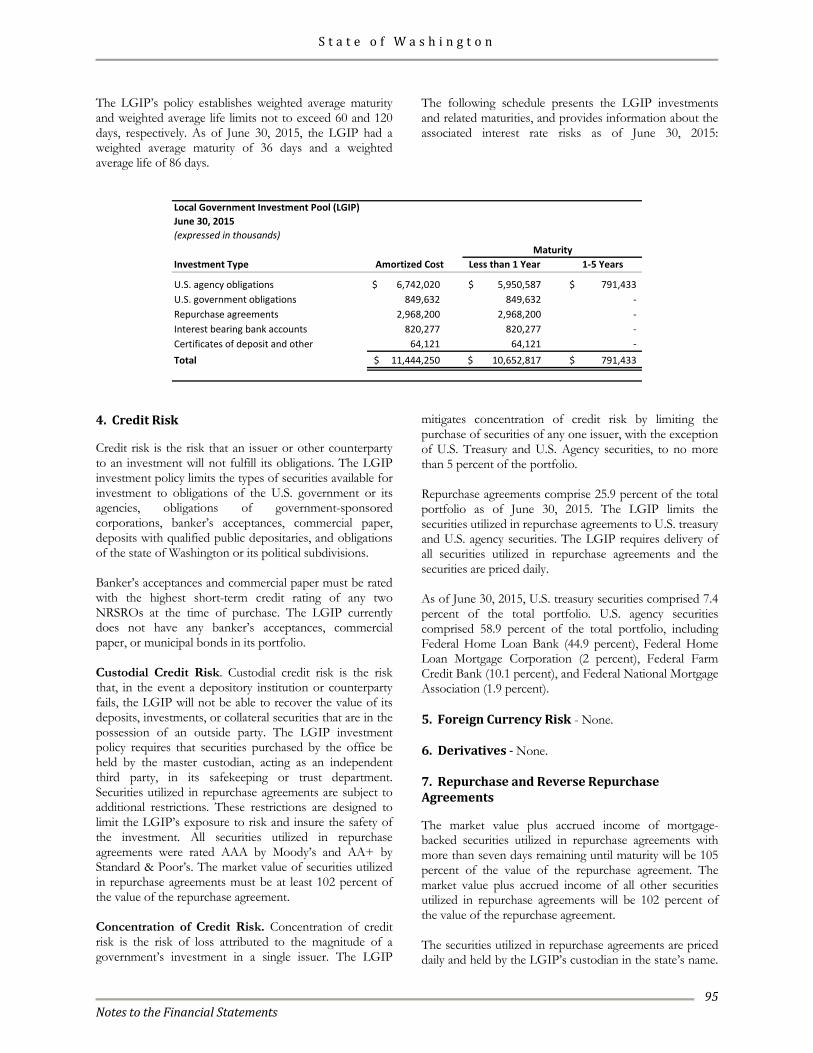
S t a t e o f W a s h i n g t o n
Notes to the Financial Statements
95
The LGIP’s policy establishes weighted average maturity and weighted average life limits not to exceed 60 and 120 days, respectively. As of June 30, 2015, the LGIP had a weighted average maturity of 36 days and a weighted average life of 86 days.
The following schedule presents the LGIP investments and related maturities, and provides information about the associated interest rate risks as of June 30, 2015:
Local Government Investment Pool (LGIP)June 30, 2015(expressed in thousands)
Investment Type Amortized Cost Less than 1 Year 1-5 Years
U.S. agency obligations 6,742,020$ 5,950,587$ 791,433$ U.S. government obligations 849,632 849,632 - Repurchase agreements 2,968,200 2,968,200 - Interest bearing bank accounts 820,277 820,277 - Certificates of deposit and other 64,121 64,121 - Total 11,444,250$ 10,652,817$ 791,433$
Maturity
4. Credit Risk
Credit risk is the risk that an issuer or other counterparty to an investment will not fulfill its obligations. The LGIP investment policy limits the types of securities available for investment to obligations of the U.S. government or its agencies, obligations of government-sponsored corporations, banker’s acceptances, commercial paper, deposits with qualified public depositaries, and obligations of the state of Washington or its political subdivisions. Banker’s acceptances and commercial paper must be rated with the highest short-term credit rating of any two NRSROs at the time of purchase. The LGIP currently does not have any banker’s acceptances, commercial paper, or municipal bonds in its portfolio. Custodial Credit Risk. Custodial credit risk is the risk that, in the event a depository institution or counterparty fails, the LGIP will not be able to recover the value of its deposits, investments, or collateral securities that are in the possession of an outside party. The LGIP investment policy requires that securities purchased by the office be held by the master custodian, acting as an independent third party, in its safekeeping or trust department. Securities utilized in repurchase agreements are subject to additional restrictions. These restrictions are designed to limit the LGIP’s exposure to risk and insure the safety of the investment. All securities utilized in repurchase agreements were rated AAA by Moody’s and AA+ by Standard & Poor’s. The market value of securities utilized in repurchase agreements must be at least 102 percent of the value of the repurchase agreement. Concentration of Credit Risk. Concentration of credit risk is the risk of loss attributed to the magnitude of a government’s investment in a single issuer. The LGIP
mitigates concentration of credit risk by limiting the purchase of securities of any one issuer, with the exception of U.S. Treasury and U.S. Agency securities, to no more than 5 percent of the portfolio. Repurchase agreements comprise 25.9 percent of the total portfolio as of June 30, 2015. The LGIP limits the securities utilized in repurchase agreements to U.S. treasury and U.S. agency securities. The LGIP requires delivery of all securities utilized in repurchase agreements and the securities are priced daily. As of June 30, 2015, U.S. treasury securities comprised 7.4 percent of the total portfolio. U.S. agency securities comprised 58.9 percent of the total portfolio, including Federal Home Loan Bank (44.9 percent), Federal Home Loan Mortgage Corporation (2 percent), Federal Farm Credit Bank (10.1 percent), and Federal National Mortgage Association (1.9 percent). 5. Foreign Currency Risk - None. 6. Derivatives - None. 7. Repurchase and Reverse Repurchase Agreements
The market value plus accrued income of mortgage-backed securities utilized in repurchase agreements with more than seven days remaining until maturity will be 105 percent of the value of the repurchase agreement. The market value plus accrued income of all other securities utilized in repurchase agreements will be 102 percent of the value of the repurchase agreement. The securities utilized in repurchase agreements are priced daily and held by the LGIP’s custodian in the state’s name.
S t a t e o f W a s h i n g t o n
Notes to the Financial Statements
96
Collateralized mortgage obligations utilized in repurchase agreements must pass the Federal Financial Institutions Examination Council test, or not exceed a volatility rating of V-5 by Fitch Investor Services, or a similar rating of a nationally recognized rating agency. As of June 30, 2015, repurchase agreements totaled $2.97 billion. State law also permits the LGIP to enter into reverse repurchase agreements which are, by contract, sales of securities with a simultaneous agreement to repurchase them in the future at the same price plus a contract rate of interest. The market value of the securities pledged as collateral by the LGIP underlying the reverse repurchase agreements normally exceeds the cash received, providing the dealers a margin against a decline in the value of the securities. If the dealers default on their obligations to resell these securities to the LGIP or to provide equal value in securities or cash, the LGIP would suffer an economic loss equal to the difference between the market value plus accrued interest of the underlying securities and the agreement obligation, including accrued interest. During fiscal year 2015, the LGIP did not enter into any reverse repurchase agreements. E. INVESTMENTS – HIGHER EDUCATION SPECIAL REVENUE, ENDOWMENT, AND STUDENT SERVICES FUNDS 1. Summary of Investment Policies
The investments of the University of Washington represent 74 percent of the total investments in Higher Education Special Revenue, Endowment, and Student Services Funds. The Board of Regents of the University of Washington is responsible for the management of the University’s investments. The Board establishes investment policy, which is carried out by the Chief Investment Officer. The University of Washington Investment Committee, comprised of board members and investment professionals, advises on matters relating to the management of the University’s investment portfolios. The majority of the University’s investments are insured, registered, and held by the University’s custodial bank as an agent for the University. Investments not held by the custodian include venture capital, private equity, opportunistic investments, marketable alternatives, mortgages, real assets, and miscellaneous investments. The University combines most short-term cash balances in the Invested Funds Pool. At June 30, 2015, the Invested Funds Pool totaled $1.53 billion. The fund also owns units
in the Consolidated Endowment Fund valued at $806.2 million on June 30, 2015. By University policy, departments with qualifying funds in the Invested Funds Pool receive distributions based on their average balances and on the type of balance. Campus depositors received 2 percent in fiscal year 2015. Endowment operating and gift accounts received 3 percent in fiscal year 2015 with the distributions directed to the University. The difference between the actual earnings of the Invested Funds Pool and the calculated distributions is used to support activities benefiting all University departments. The majority of the endowed funds are invested in a pooled fund called the Consolidated Endowment Fund (CEF). Individual endowments purchase units in the pool on the basis of a per unit valuation of the CEF at fair value on the last business day of the calendar quarter. Income is distributed based on the number of units held. Chapter 24.55 RCW and the Uniform Prudent Management of Institutional Funds Act allow for total return expenditure in the CEF under comprehensive prudent standards. Under the CEF spending policy approved by the Board of Regents, quarterly distributions to programs are based on an annual percentage rate of 4 percent applied to the five-year rolling average of the CEF’s market valuation. Additionally, the policy allows for an administrative fee of 1 percent supporting campus-wide fundraising and stewardship activities and offsetting the internal cost of managing endowment assets. The University records its permanent endowments at the lower of original gift value or current market value in the Restricted Nonexpendable Net Position category. Of the endowments that are recorded at current market value, the net deficiency from the original gift value is $3.0 million at June 30, 2015. Funds in irrevocable trusts managed by trustees other than the University are not reported in the financial statements. The fair value of these funds was $111.4 million at June 30, 2015. Income received from these trusts, which is included in investment income, was $6.2 million for the year ended June 30, 2015. Net appreciation (depreciation) in the fair value of investments includes both realized and unrealized gains and losses on investments. The University realized net gains of $71.5 million in fiscal year 2015 from the sale of investments. The calculation of realized gains and losses is independent of the net appreciation of the fair value of investments. Realized gains and losses on investments that have been held in more than one fiscal year and are sold in the current year include the net appreciation of these
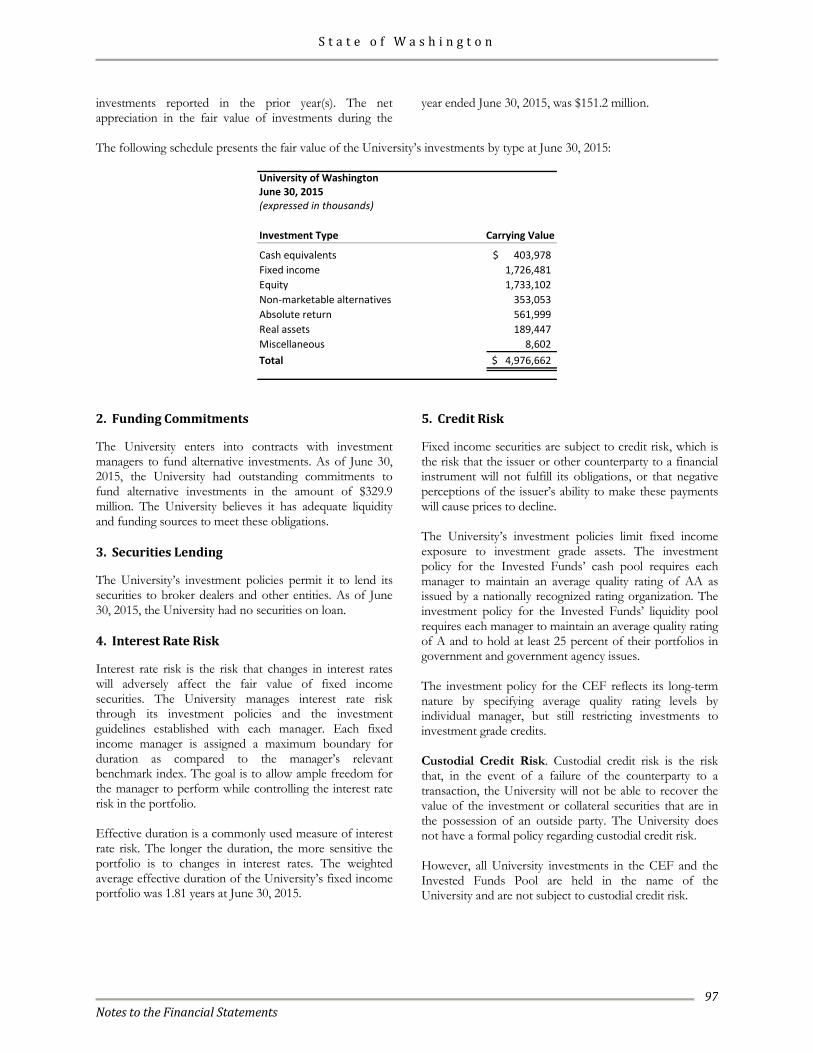
S t a t e o f W a s h i n g t o n
Notes to the Financial Statements
97
investments reported in the prior year(s). The net appreciation in the fair value of investments during the
year ended June 30, 2015, was $151.2 million.
The following schedule presents the fair value of the University’s investments by type at June 30, 2015:
June 30, 2015
Investment Type Carrying Value
Cash equivalents 403,978$ Fixed income 1,726,481 Equity 1,733,102 Non-marketable alternatives 353,053 Absolute return 561,999 Real assets 189,447 Miscellaneous 8,602 Total 4,976,662$
(expressed in thousands)
University of Washington
2. Funding Commitments
The University enters into contracts with investment managers to fund alternative investments. As of June 30, 2015, the University had outstanding commitments to fund alternative investments in the amount of $329.9 million. The University believes it has adequate liquidity and funding sources to meet these obligations. 3. Securities Lending
The University’s investment policies permit it to lend its securities to broker dealers and other entities. As of June 30, 2015, the University had no securities on loan. 4. Interest Rate Risk
Interest rate risk is the risk that changes in interest rates will adversely affect the fair value of fixed income securities. The University manages interest rate risk through its investment policies and the investment guidelines established with each manager. Each fixed income manager is assigned a maximum boundary for duration as compared to the manager’s relevant benchmark index. The goal is to allow ample freedom for the manager to perform while controlling the interest rate risk in the portfolio. Effective duration is a commonly used measure of interest rate risk. The longer the duration, the more sensitive the portfolio is to changes in interest rates. The weighted average effective duration of the University’s fixed income portfolio was 1.81 years at June 30, 2015.
5. Credit Risk
Fixed income securities are subject to credit risk, which is the risk that the issuer or other counterparty to a financial instrument will not fulfill its obligations, or that negative perceptions of the issuer’s ability to make these payments will cause prices to decline. The University’s investment policies limit fixed income exposure to investment grade assets. The investment policy for the Invested Funds’ cash pool requires each manager to maintain an average quality rating of AA as issued by a nationally recognized rating organization. The investment policy for the Invested Funds’ liquidity pool requires each manager to maintain an average quality rating of A and to hold at least 25 percent of their portfolios in government and government agency issues. The investment policy for the CEF reflects its long-term nature by specifying average quality rating levels by individual manager, but still restricting investments to investment grade credits. Custodial Credit Risk. Custodial credit risk is the risk that, in the event of a failure of the counterparty to a transaction, the University will not be able to recover the value of the investment or collateral securities that are in the possession of an outside party. The University does not have a formal policy regarding custodial credit risk. However, all University investments in the CEF and the Invested Funds Pool are held in the name of the University and are not subject to custodial credit risk.
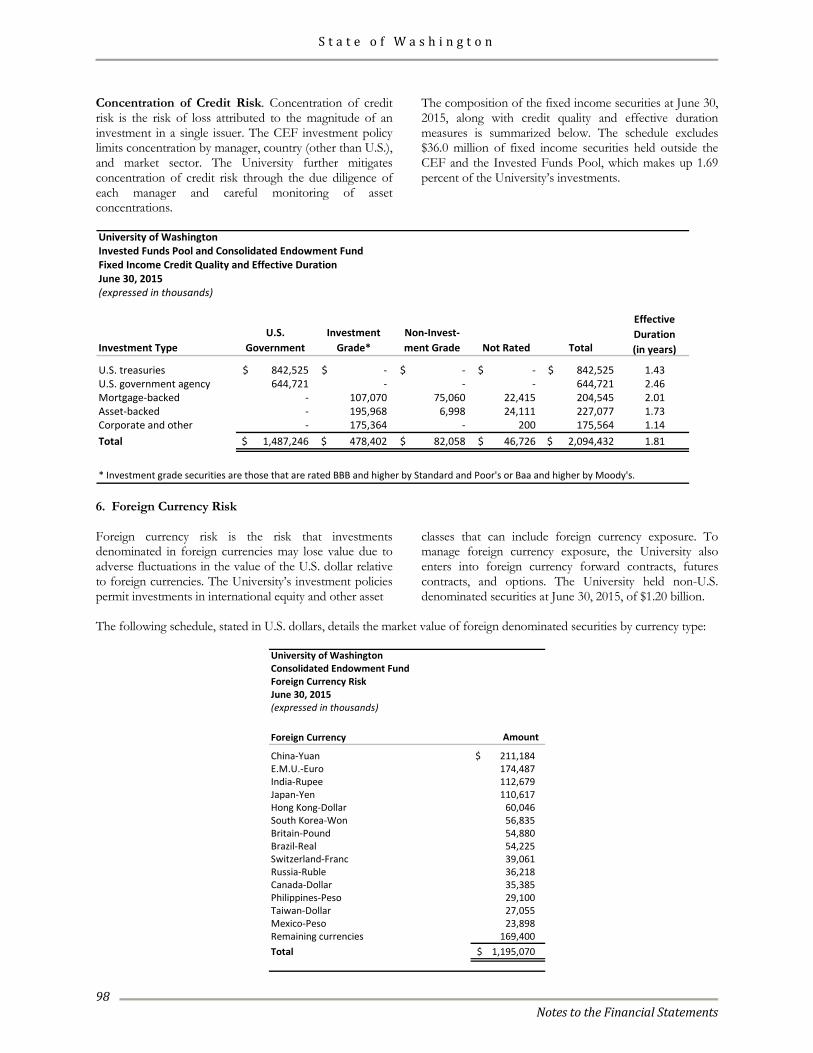
S t a t e o f W a s h i n g t o n
Notes to the Financial Statements
98
Concentration of Credit Risk. Concentration of credit risk is the risk of loss attributed to the magnitude of an investment in a single issuer. The CEF investment policy limits concentration by manager, country (other than U.S.), and market sector. The University further mitigates concentration of credit risk through the due diligence of each manager and careful monitoring of asset concentrations.
The composition of the fixed income securities at June 30, 2015, along with credit quality and effective duration measures is summarized below. The schedule excludes $36.0 million of fixed income securities held outside the CEF and the Invested Funds Pool, which makes up 1.69 percent of the University’s investments.
University of Washington Invested Funds Pool and Consolidated Endowment FundFixed Income Credit Quality and Effective DurationJune 30, 2015(expressed in thousands)
Investment TypeU.S.
GovernmentInvestment
Grade*Non-Invest- ment Grade Not Rated Total
EffectiveDuration(in years)
U.S. treasuries 842,525$ -$ -$ -$ 842,525$ 1.43U.S. government agency 644,721 - - - 644,721 2.46Mortgage-backed - 107,070 75,060 22,415 204,545 2.01Asset-backed - 195,968 6,998 24,111 227,077 1.73Corporate and other - 175,364 - 200 175,564 1.14Total 1,487,246$ 478,402$ 82,058$ 46,726$ 2,094,432$ 1.81
* Investment grade securities are those that are rated BBB and higher by Standard and Poor's or Baa and higher by Moody's. 6. Foreign Currency Risk Foreign currency risk is the risk that investments denominated in foreign currencies may lose value due to adverse fluctuations in the value of the U.S. dollar relative to foreign currencies. The University’s investment policies permit investments in international equity and other asset
classes that can include foreign currency exposure. To manage foreign currency exposure, the University also enters into foreign currency forward contracts, futures contracts, and options. The University held non-U.S. denominated securities at June 30, 2015, of $1.20 billion.
The following schedule, stated in U.S. dollars, details the market value of foreign denominated securities by currency type:
Consolidated Endowment FundForeign Currency RiskJune 30, 2015
Foreign Currency Amount
China-Yuan 211,184$ E.M.U.-Euro 174,487 India-Rupee 112,679 Japan-Yen 110,617 Hong Kong-Dollar 60,046 South Korea-Won 56,835 Britain-Pound 54,880 Brazil-Real 54,225 Switzerland-Franc 39,061 Russia-Ruble 36,218 Canada-Dollar 35,385 Philippines-Peso 29,100 Taiwan-Dollar 27,055 Mexico-Peso 23,898 Remaining currencies 169,400 Total 1,195,070$
University of Washington
(expressed in thousands)
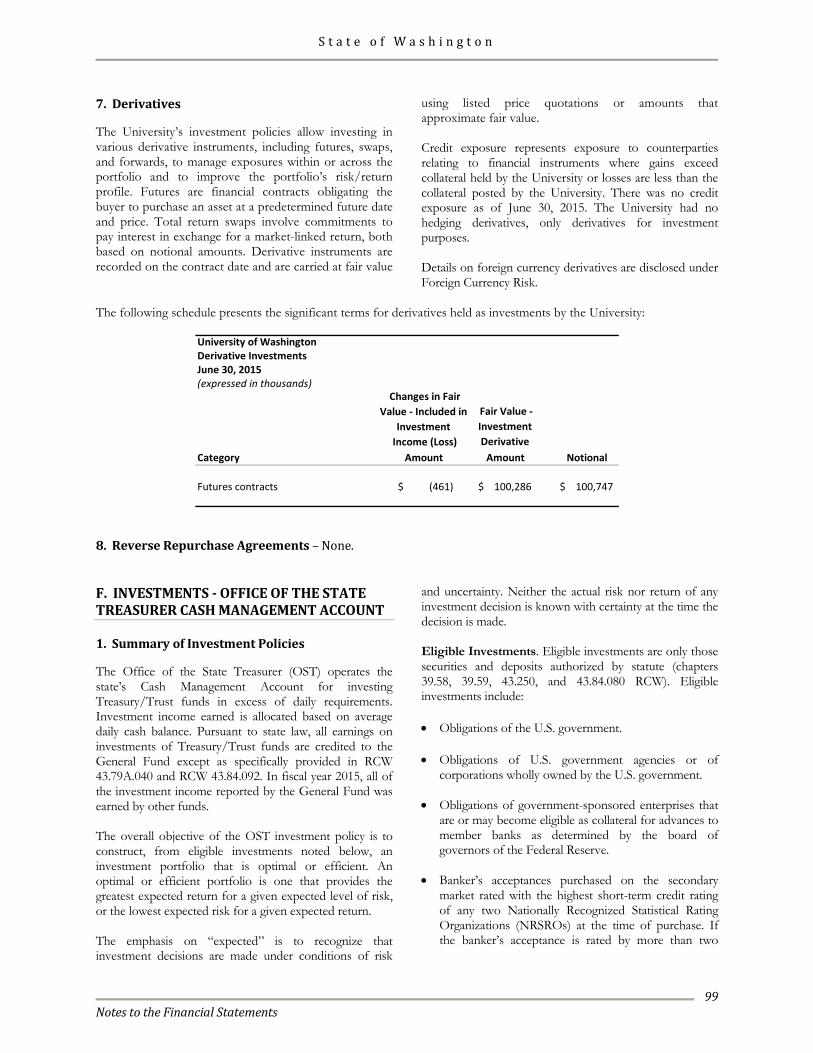
S t a t e o f W a s h i n g t o n
Notes to the Financial Statements
99
7. Derivatives
The University’s investment policies allow investing in various derivative instruments, including futures, swaps, and forwards, to manage exposures within or across the portfolio and to improve the portfolio’s risk/return profile. Futures are financial contracts obligating the buyer to purchase an asset at a predetermined future date and price. Total return swaps involve commitments to pay interest in exchange for a market-linked return, both based on notional amounts. Derivative instruments are recorded on the contract date and are carried at fair value
using listed price quotations or amounts that approximate fair value. Credit exposure represents exposure to counterparties relating to financial instruments where gains exceed collateral held by the University or losses are less than the collateral posted by the University. There was no credit exposure as of June 30, 2015. The University had no hedging derivatives, only derivatives for investment purposes. Details on foreign currency derivatives are disclosed under Foreign Currency Risk.
The following schedule presents the significant terms for derivatives held as investments by the University:
University of WashingtonDerivative InvestmentsJune 30, 2015(expressed in thousands)
Fair Value - Investment Derivative
Category Amount Amount Notional
Futures contracts (461)$ 100,286$ 100,747$
Changes in Fair Value - Included in
Investment Income (Loss)
8. Reverse Repurchase Agreements – None. F. INVESTMENTS - OFFICE OF THE STATE TREASURER CASH MANAGEMENT ACCOUNT 1. Summary of Investment Policies
The Office of the State Treasurer (OST) operates the state’s Cash Management Account for investing Treasury/Trust funds in excess of daily requirements. Investment income earned is allocated based on average daily cash balance. Pursuant to state law, all earnings on investments of Treasury/Trust funds are credited to the General Fund except as specifically provided in RCW 43.79A.040 and RCW 43.84.092. In fiscal year 2015, all of the investment income reported by the General Fund was earned by other funds. The overall objective of the OST investment policy is to construct, from eligible investments noted below, an investment portfolio that is optimal or efficient. An optimal or efficient portfolio is one that provides the greatest expected return for a given expected level of risk, or the lowest expected risk for a given expected return. The emphasis on “expected” is to recognize that investment decisions are made under conditions of risk
and uncertainty. Neither the actual risk nor return of any investment decision is known with certainty at the time the decision is made. Eligible Investments. Eligible investments are only those securities and deposits authorized by statute (chapters 39.58, 39.59, 43.250, and 43.84.080 RCW). Eligible investments include: • Obligations of the U.S. government. • Obligations of U.S. government agencies or of
corporations wholly owned by the U.S. government. • Obligations of government-sponsored enterprises that
are or may become eligible as collateral for advances to member banks as determined by the board of governors of the Federal Reserve.
• Banker’s acceptances purchased on the secondary
market rated with the highest short-term credit rating of any two Nationally Recognized Statistical Rating Organizations (NRSROs) at the time of purchase. If the banker’s acceptance is rated by more than two
S t a t e o f W a s h i n g t o n
Notes to the Financial Statements
100
NRSROs, it must have the highest rating from all of the organizations.
• Commercial paper, provided that the OST adheres to
policies and procedures of the Washington State Investment Board regarding commercial paper (RCW 43.84.080(7)).
• Certificates of deposit with financial institutions
qualified by the Washington Public Deposit Protection Commission.
• Local Government Investment Pool (LGIP). • Obligations of the state of Washington or its political
subdivisions. Investment Restrictions. To provide for the safety and liquidity of Treasury/Trust funds, the Cash Management Account investment portfolio is subject to the following restrictions: • The final maturity of any security will not exceed ten
years. • Purchase of collateralized mortgage obligations is not
allowed. • The allocation to investments subject to high price
sensitivity or reduced marketability will not exceed 15 percent of the daily balance of the portfolio.
Additionally, investments in non-government securities, excluding collateral of repurchase agreements, must fall within prescribed limits. 2. Securities Lending
State statutes permit the OST to lend its securities to broker-dealers and other entities with a simultaneous agreement to return the collateral for the same securities in the future. The OST has contracted with Citibank, N.A. as a lending agent and receives a share of income earned from this activity. The lending agent lends securities and receives collateral, which can be in the form of cash or other securities. The collateral, which must be valued at 102 percent of the market value of the loaned securities, is
priced daily and, if necessary, action is taken to maintain the collateralization level at 102 percent. The cash is invested by the lending agent in accordance with investment guidelines approved by the OST. The securities held as collateral and the securities underlying the cash collateral are held by the custodian. One option available to the lending agent is to invest cash collateral into an OST account in the LGIP. At June 30, 2015, cash collateral totaled $148.3 million, all of which was invested in the LGIP. Contracts require the lending agent to indemnify the OST if the borrowers fail to return securities and if the collateral is inadequate to replace the securities lent, or if the borrower fails to pay the OST for income distribution by the securities’ issuers while the securities are on loan. The OST cannot pledge or sell collateral securities received unless the borrower defaults. At June 30, 2015, the fair value of securities on loan totaled $144.8 million. The OST investment policy requires that any securities on loan be made available by the lending agent for next day liquidity at the option of the OST. During fiscal year 2015, the OST had no credit risk exposure to borrowers because the amounts owed to the borrowers exceeded the amounts the borrowers owed the OST. There were no violations of legal or contractual provisions or any losses resulting from a default of a borrower or lending agent during the fiscal year. 3. Interest Rate Risk
Interest rate risk is the risk that changes in interest rates of debt instruments will adversely affect the fair value of an investment. The Treasury/Trust investments are separated into portfolios with objectives based primarily on liquidity needs. The OST’s investment policy limits the weighted average maturity of its investments based on cash flow expectations. Policy also directs due diligence to be exercised with timely reporting of material deviation from expectations and actions taken to control adverse developments as may be possible.
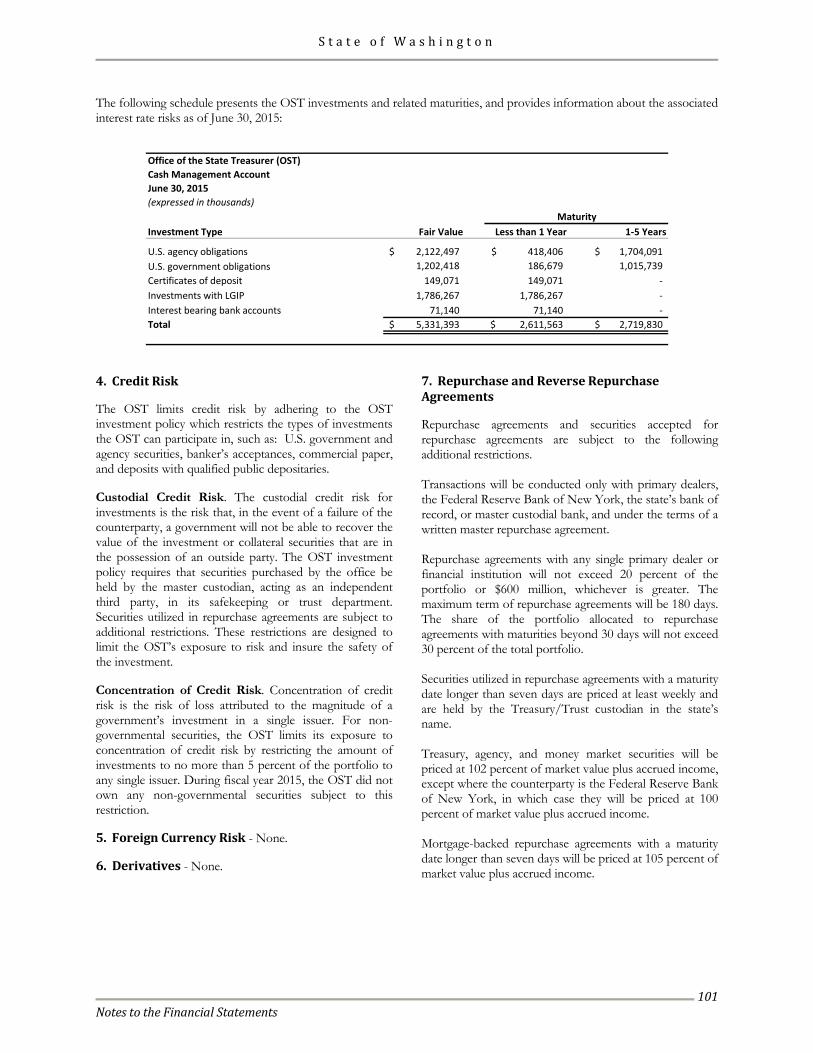
S t a t e o f W a s h i n g t o n
Notes to the Financial Statements
101
The following schedule presents the OST investments and related maturities, and provides information about the associated interest rate risks as of June 30, 2015:
Office of the State Treasurer (OST) Cash Management AccountJune 30, 2015(expressed in thousands)
Investment Type Fair Value Less than 1 Year 1-5 Years
U.S. agency obligations 2,122,497$ 418,406$ 1,704,091$ U.S. government obligations 1,202,418 186,679 1,015,739 Certificates of deposit 149,071 149,071 - Investments with LGIP 1,786,267 1,786,267 - Interest bearing bank accounts 71,140 71,140 - Total 5,331,393$ 2,611,563$ 2,719,830$
Maturity
4. Credit Risk
The OST limits credit risk by adhering to the OST investment policy which restricts the types of investments the OST can participate in, such as: U.S. government and agency securities, banker’s acceptances, commercial paper, and deposits with qualified public depositaries. Custodial Credit Risk. The custodial credit risk for investments is the risk that, in the event of a failure of the counterparty, a government will not be able to recover the value of the investment or collateral securities that are in the possession of an outside party. The OST investment policy requires that securities purchased by the office be held by the master custodian, acting as an independent third party, in its safekeeping or trust department. Securities utilized in repurchase agreements are subject to additional restrictions. These restrictions are designed to limit the OST’s exposure to risk and insure the safety of the investment. Concentration of Credit Risk. Concentration of credit risk is the risk of loss attributed to the magnitude of a government’s investment in a single issuer. For non-governmental securities, the OST limits its exposure to concentration of credit risk by restricting the amount of investments to no more than 5 percent of the portfolio to any single issuer. During fiscal year 2015, the OST did not own any non-governmental securities subject to this restriction. 5. Foreign Currency Risk - None. 6. Derivatives - None.
7. Repurchase and Reverse Repurchase Agreements
Repurchase agreements and securities accepted for repurchase agreements are subject to the following additional restrictions. Transactions will be conducted only with primary dealers, the Federal Reserve Bank of New York, the state’s bank of record, or master custodial bank, and under the terms of a written master repurchase agreement. Repurchase agreements with any single primary dealer or financial institution will not exceed 20 percent of the portfolio or $600 million, whichever is greater. The maximum term of repurchase agreements will be 180 days. The share of the portfolio allocated to repurchase agreements with maturities beyond 30 days will not exceed 30 percent of the total portfolio. Securities utilized in repurchase agreements with a maturity date longer than seven days are priced at least weekly and are held by the Treasury/Trust custodian in the state’s name. Treasury, agency, and money market securities will be priced at 102 percent of market value plus accrued income, except where the counterparty is the Federal Reserve Bank of New York, in which case they will be priced at 100 percent of market value plus accrued income. Mortgage-backed repurchase agreements with a maturity date longer than seven days will be priced at 105 percent of market value plus accrued income.
S t a t e o f W a s h i n g t o n
Notes to the Financial Statements
102
Collateralized mortgage obligation securities utilized in repurchase agreements must pass the Federal Financial Institutions Examination Council test or not exceed a volatility rating of V-5 by Fitch Investor Services, or a similar rating of a nationally recognized rating agency. Only securities authorized in statute for the investment of public funds are utilized in repurchase agreements. There were no repurchase agreements as of June 30, 2015. State law also permits the OST to enter into reverse repurchase agreements, which are, by contract, sales of securities with a simultaneous agreement to repurchase them in the future at the same price plus a contract rate of interest. The market value of the securities pledged as collateral by the OST underlying the reverse repurchase agreements normally exceeds the cash received, providing
the dealers a margin against a decline in the market value of the securities. If the dealers default on their obligations to resell these securities to the OST or to provide equal value in securities or cash, the OST would suffer an economic loss equal to the differences between the market value plus accrued interest of the underlying securities and the agreement obligation, including accrued interest. The OST investment policy limits the amount of reverse repurchase agreements to 30 percent of the total portfolio. There were no reverse repurchase agreements during fiscal year 2015.
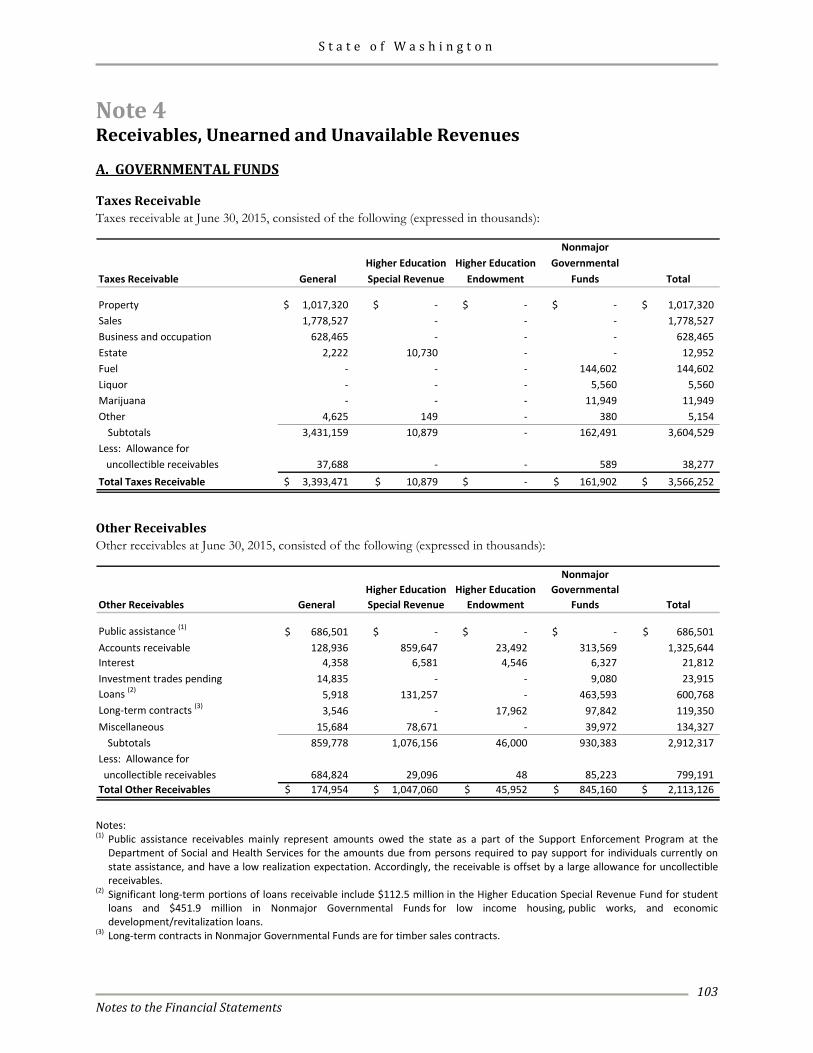
S t a t e o f W a s h i n g t o n
Notes to the Financial Statements
103
Note 4 Receivables, Unearned and Unavailable Revenues A. GOVERNMENTAL FUNDS Taxes Receivable Taxes receivable at June 30, 2015, consisted of the following (expressed in thousands):
NonmajorHigher Education Higher Education Governmental
Taxes Receivable General Special Revenue Endowment Funds Total
Property 1,017,320$ -$ -$ -$ 1,017,320$ Sales 1,778,527 - - - 1,778,527 Business and occupation 628,465 - - - 628,465 Estate 2,222 10,730 - - 12,952 Fuel - - - 144,602 144,602 Liquor - - - 5,560 5,560 Marijuana - - - 11,949 11,949 Other 4,625 149 - 380 5,154
Subtotals 3,431,159 10,879 - 162,491 3,604,529 Less: Allowance for uncollectible receivables 37,688 - - 589 38,277 Total Taxes Receivable 3,393,471$ 10,879$ -$ 161,902$ 3,566,252$
Other Receivables Other receivables at June 30, 2015, consisted of the following (expressed in thousands):
NonmajorHigher Education Higher Education Governmental
Other Receivables General Special Revenue Endowment Funds Total
Public assistance (1) 686,501$ -$ -$ -$ 686,501$ Accounts receivable 128,936 859,647 23,492 313,569 1,325,644 Interest 4,358 6,581 4,546 6,327 21,812 Investment trades pending 14,835 - - 9,080 23,915 Loans (2) 5,918 131,257 - 463,593 600,768 Long-term contracts (3) 3,546 - 17,962 97,842 119,350 Miscellaneous 15,684 78,671 - 39,972 134,327
Subtotals 859,778 1,076,156 46,000 930,383 2,912,317 Less: Allowance for uncollectible receivables 684,824 29,096 48 85,223 799,191 Total Other Receivables 174,954$ 1,047,060$ 45,952$ 845,160$ 2,113,126$
Notes: (1) Public assistance receivables mainly represent amounts owed the state as a part of the Support Enforcement Program at the
Department of Social and Health Services for the amounts due from persons required to pay support for individuals currently on state assistance, and have a low realization expectation. Accordingly, the receivable is offset by a large allowance for uncollectible receivables.
(2) Significant long-term portions of loans receivable include $112.5 million in the Higher Education Special Revenue Fund for student loans and $451.9 million in Nonmajor Governmental Funds for low income housing, public works, and economic development/revitalization loans.
(3) Long-term contracts in Nonmajor Governmental Funds are for timber sales contracts.
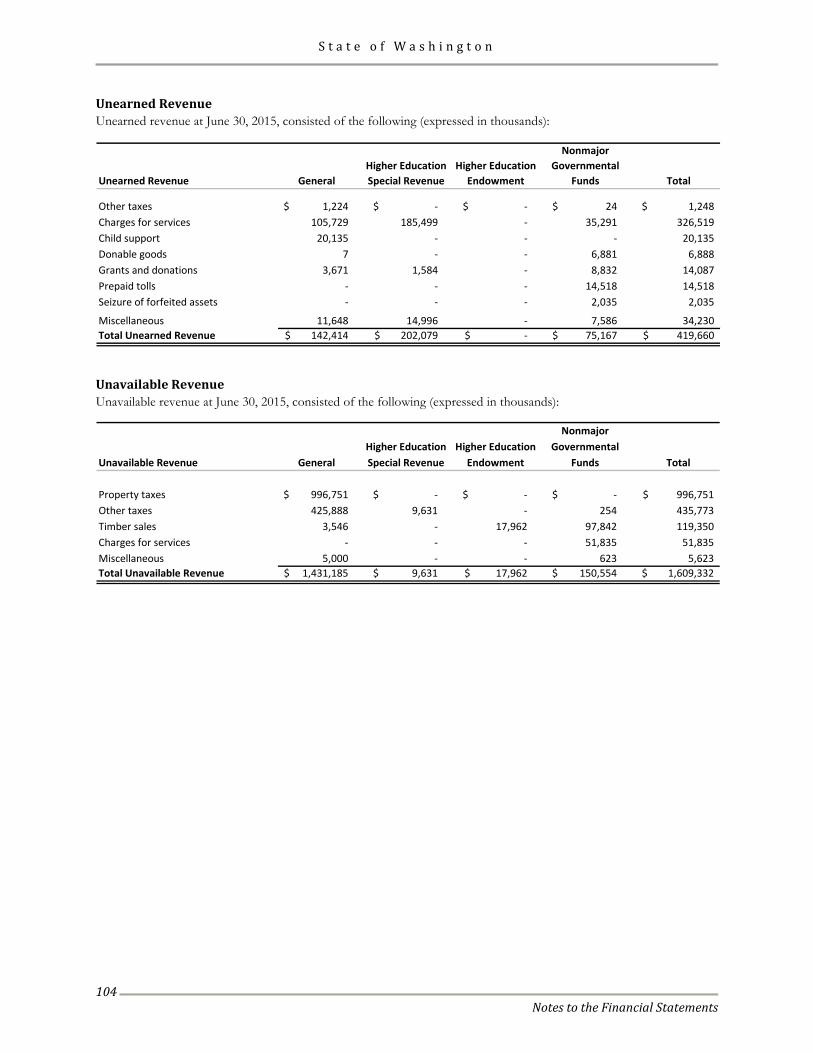
S t a t e o f W a s h i n g t o n
Notes to the Financial Statements
104
Unearned Revenue Unearned revenue at June 30, 2015, consisted of the following (expressed in thousands):
NonmajorHigher Education Higher Education Governmental
Unearned Revenue General Special Revenue Endowment Funds Total
Other taxes 1,224$ -$ -$ 24$ 1,248$ Charges for services 105,729 185,499 - 35,291 326,519 Child support 20,135 - - - 20,135 Donable goods 7 - - 6,881 6,888 Grants and donations 3,671 1,584 - 8,832 14,087 Prepaid tolls - - - 14,518 14,518 Seizure of forfeited assets - - - 2,035 2,035
Miscellaneous 11,648 14,996 - 7,586 34,230 Total Unearned Revenue 142,414$ 202,079$ -$ 75,167$ 419,660$
Unavailable Revenue Unavailable revenue at June 30, 2015, consisted of the following (expressed in thousands):
NonmajorHigher Education Higher Education Governmental
Unavailable Revenue General Special Revenue Endowment Funds Total
Property taxes 996,751$ -$ -$ -$ 996,751$ Other taxes 425,888 9,631 - 254 435,773 Timber sales 3,546 - 17,962 97,842 119,350 Charges for services - - - 51,835 51,835 Miscellaneous 5,000 - - 623 5,623 Total Unavailable Revenue 1,431,185$ 9,631$ 17,962$ 150,554$ 1,609,332$
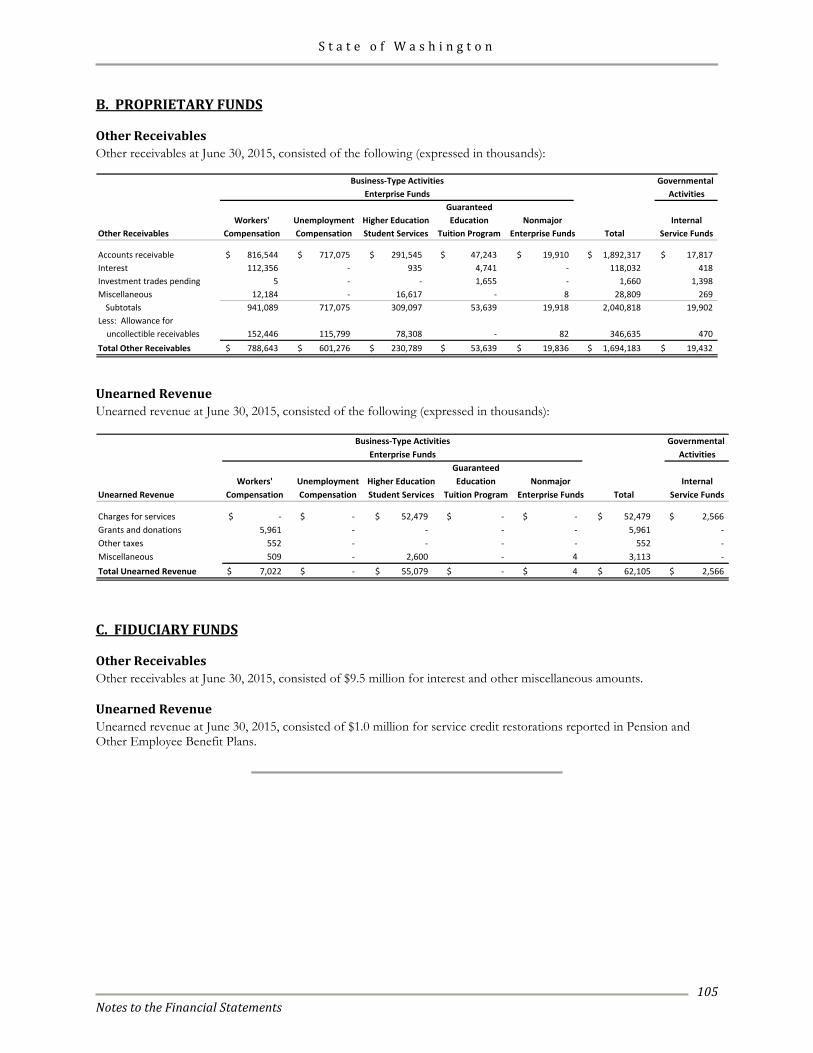
S t a t e o f W a s h i n g t o n
Notes to the Financial Statements
105
B. PROPRIETARY FUNDS Other Receivables Other receivables at June 30, 2015, consisted of the following (expressed in thousands):
Governmental Activities
GuaranteedWorkers' Unemployment Higher Education Education Nonmajor Internal
Other Receivables Compensation Compensation Student Services Tuition Program Enterprise Funds Total Service Funds
Accounts receivable 816,544$ 717,075$ 291,545$ 47,243$ 19,910$ 1,892,317$ 17,817$ Interest 112,356 - 935 4,741 - 118,032 418 Investment trades pending 5 - - 1,655 - 1,660 1,398 Miscellaneous 12,184 - 16,617 - 8 28,809 269
Subtotals 941,089 717,075 309,097 53,639 19,918 2,040,818 19,902 Less: Allowance for uncollectible receivables 152,446 115,799 78,308 - 82 346,635 470 Total Other Receivables 788,643$ 601,276$ 230,789$ 53,639$ 19,836$ 1,694,183$ 19,432$
Business-Type ActivitiesEnterprise Funds
Unearned Revenue Unearned revenue at June 30, 2015, consisted of the following (expressed in thousands):
Governmental Activities
GuaranteedWorkers' Unemployment Higher Education Education Nonmajor Internal
Unearned Revenue Compensation Compensation Student Services Tuition Program Enterprise Funds Total Service Funds
Charges for services -$ -$ 52,479$ -$ -$ 52,479$ 2,566$ Grants and donations 5,961 - - - - 5,961 - Other taxes 552 - - - - 552 - Miscellaneous 509 - 2,600 - 4 3,113 - Total Unearned Revenue 7,022$ -$ 55,079$ -$ 4$ 62,105$ 2,566$
Business-Type ActivitiesEnterprise Funds
C. FIDUCIARY FUNDS Other Receivables Other receivables at June 30, 2015, consisted of $9.5 million for interest and other miscellaneous amounts. Unearned Revenue Unearned revenue at June 30, 2015, consisted of $1.0 million for service credit restorations reported in Pension and Other Employee Benefit Plans.
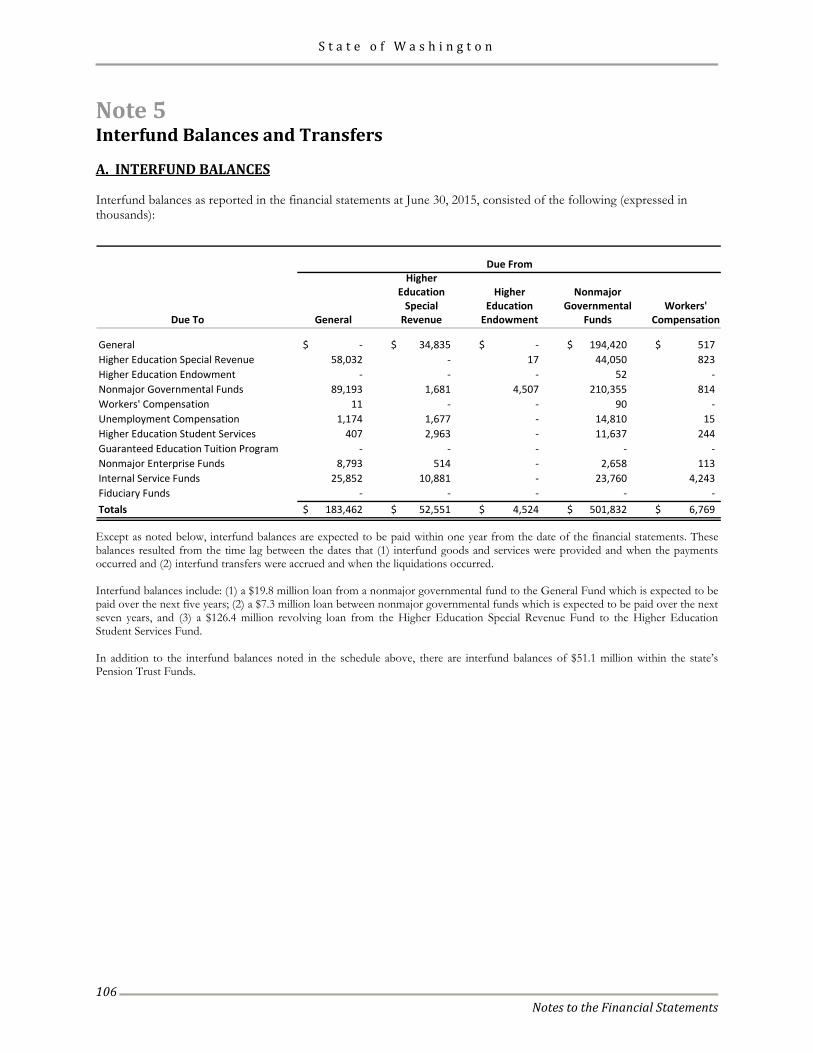
S t a t e o f W a s h i n g t o n
Notes to the Financial Statements
106
Note 5 Interfund Balances and Transfers A. INTERFUND BALANCES Interfund balances as reported in the financial statements at June 30, 2015, consisted of the following (expressed in thousands):
HigherEducation Higher Nonmajor
Special Education Governmental Workers'Due To General Revenue Endowment Funds Compensation
General -$ 34,835$ -$ 194,420$ 517$ Higher Education Special Revenue 58,032 - 17 44,050 823 Higher Education Endowment - - - 52 - Nonmajor Governmental Funds 89,193 1,681 4,507 210,355 814 Workers' Compensation 11 - - 90 - Unemployment Compensation 1,174 1,677 - 14,810 15 Higher Education Student Services 407 2,963 - 11,637 244 Guaranteed Education Tuition Program - - - - - Nonmajor Enterprise Funds 8,793 514 - 2,658 113 Internal Service Funds 25,852 10,881 - 23,760 4,243 Fiduciary Funds - - - - - Totals 183,462$ 52,551$ 4,524$ 501,832$ 6,769$
Due From
Except as noted below, interfund balances are expected to be paid within one year from the date of the financial statements. These balances resulted from the time lag between the dates that (1) interfund goods and services were provided and when the payments occurred and (2) interfund transfers were accrued and when the liquidations occurred. Interfund balances include: (1) a $19.8 million loan from a nonmajor governmental fund to the General Fund which is expected to be paid over the next five years; (2) a $7.3 million loan between nonmajor governmental funds which is expected to be paid over the next seven years, and (3) a $126.4 million revolving loan from the Higher Education Special Revenue Fund to the Higher Education Student Services Fund. In addition to the interfund balances noted in the schedule above, there are interfund balances of $51.1 million within the state’s Pension Trust Funds.
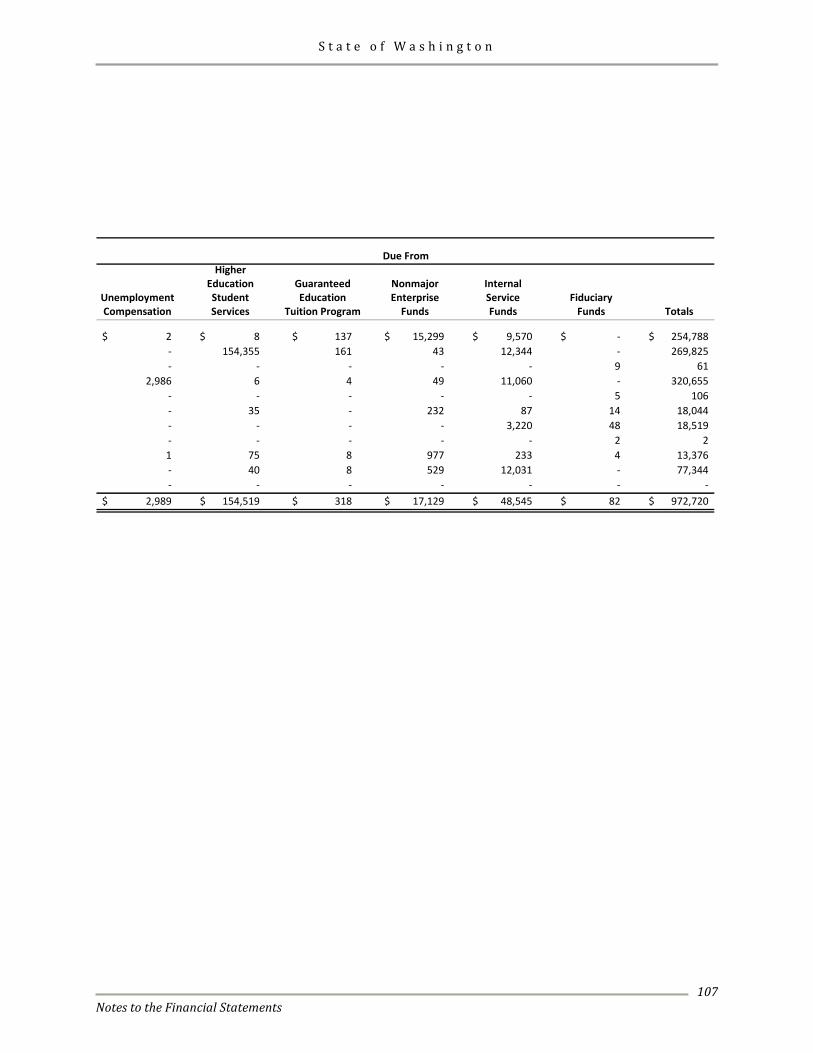
S t a t e o f W a s h i n g t o n
Notes to the Financial Statements
107
HigherEducation Guaranteed Nonmajor Internal
Unemployment Student Education Enterprise Service FiduciaryCompensation Services Tuition Program Funds Funds Funds Totals
2$ 8$ 137$ 15,299$ 9,570$ -$ 254,788$ - 154,355 161 43 12,344 - 269,825 - - - - - 9 61
2,986 6 4 49 11,060 - 320,655 - - - - - 5 106 - 35 - 232 87 14 18,044 - - - - 3,220 48 18,519 - - - - - 2 2 1 75 8 977 233 4 13,376 - 40 8 529 12,031 - 77,344 - - - - - - -
2,989$ 154,519$ 318$ 17,129$ 48,545$ 82$ 972,720$
Due From
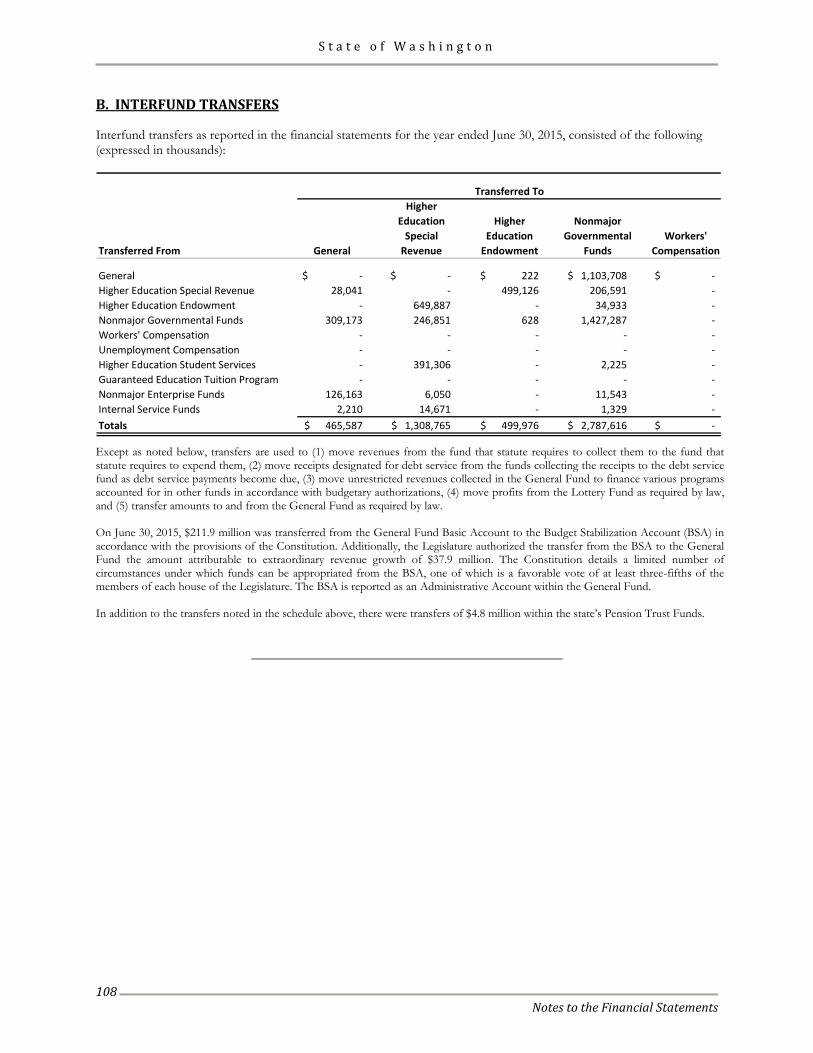
S t a t e o f W a s h i n g t o n
Notes to the Financial Statements
108
B. INTERFUND TRANSFERS Interfund transfers as reported in the financial statements for the year ended June 30, 2015, consisted of the following (expressed in thousands):
HigherEducation Higher Nonmajor
Special Education Governmental Workers'Transferred From General Revenue Endowment Funds Compensation
General -$ -$ 222$ 1,103,708$ -$ Higher Education Special Revenue 28,041 - 499,126 206,591 - Higher Education Endowment - 649,887 - 34,933 - Nonmajor Governmental Funds 309,173 246,851 628 1,427,287 - Workers' Compensation - - - - - Unemployment Compensation - - - - - Higher Education Student Services - 391,306 - 2,225 - Guaranteed Education Tuition Program - - - - - Nonmajor Enterprise Funds 126,163 6,050 - 11,543 - Internal Service Funds 2,210 14,671 - 1,329 - Totals 465,587$ 1,308,765$ 499,976$ 2,787,616$ -$
Transferred To
Except as noted below, transfers are used to (1) move revenues from the fund that statute requires to collect them to the fund that statute requires to expend them, (2) move receipts designated for debt service from the funds collecting the receipts to the debt service fund as debt service payments become due, (3) move unrestricted revenues collected in the General Fund to finance various programs accounted for in other funds in accordance with budgetary authorizations, (4) move profits from the Lottery Fund as required by law, and (5) transfer amounts to and from the General Fund as required by law. On June 30, 2015, $211.9 million was transferred from the General Fund Basic Account to the Budget Stabilization Account (BSA) in accordance with the provisions of the Constitution. Additionally, the Legislature authorized the transfer from the BSA to the General Fund the amount attributable to extraordinary revenue growth of $37.9 million. The Constitution details a limited number of circumstances under which funds can be appropriated from the BSA, one of which is a favorable vote of at least three-fifths of the members of each house of the Legislature. The BSA is reported as an Administrative Account within the General Fund. In addition to the transfers noted in the schedule above, there were transfers of $4.8 million within the state’s Pension Trust Funds.
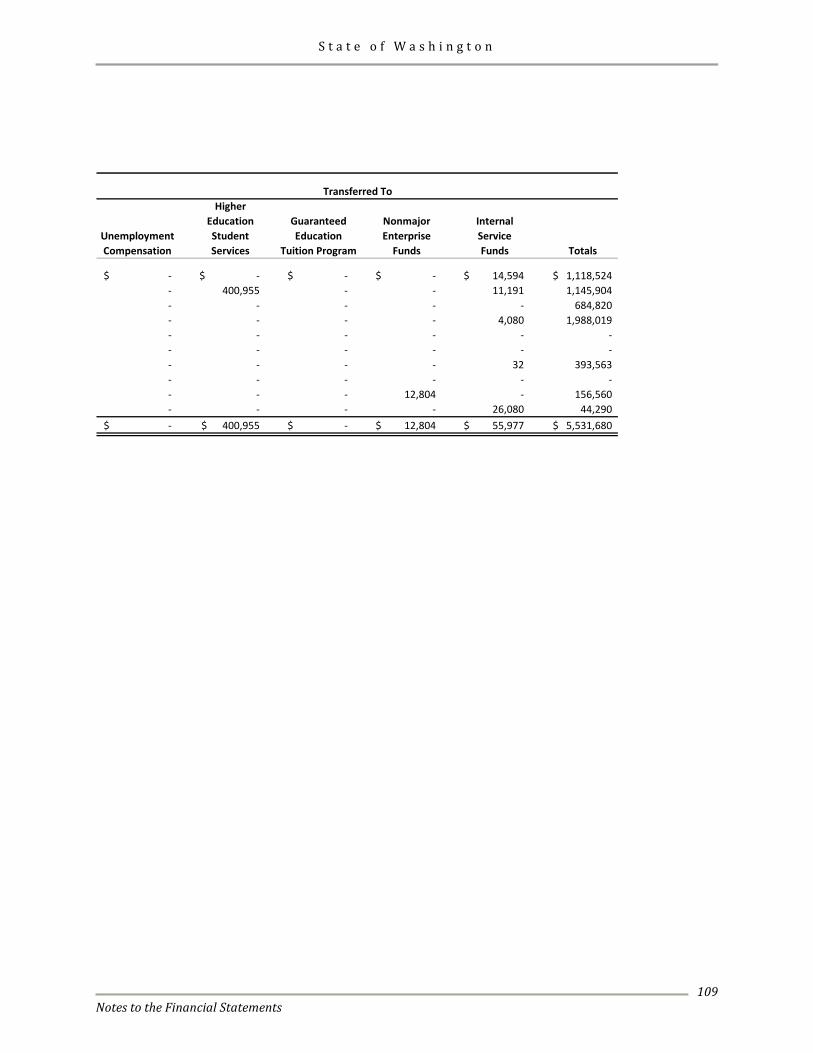
S t a t e o f W a s h i n g t o n
Notes to the Financial Statements
109
HigherEducation Guaranteed Nonmajor Internal
Unemployment Student Education Enterprise ServiceCompensation Services Tuition Program Funds Funds Totals
-$ -$ -$ -$ 14,594$ 1,118,524$ - 400,955 - - 11,191 1,145,904 - - - - - 684,820 - - - - 4,080 1,988,019 - - - - - - - - - - - - - - - - 32 393,563 - - - - - - - - - 12,804 - 156,560 - - - - 26,080 44,290 -$ 400,955$ -$ 12,804$ 55,977$ 5,531,680$
Transferred To
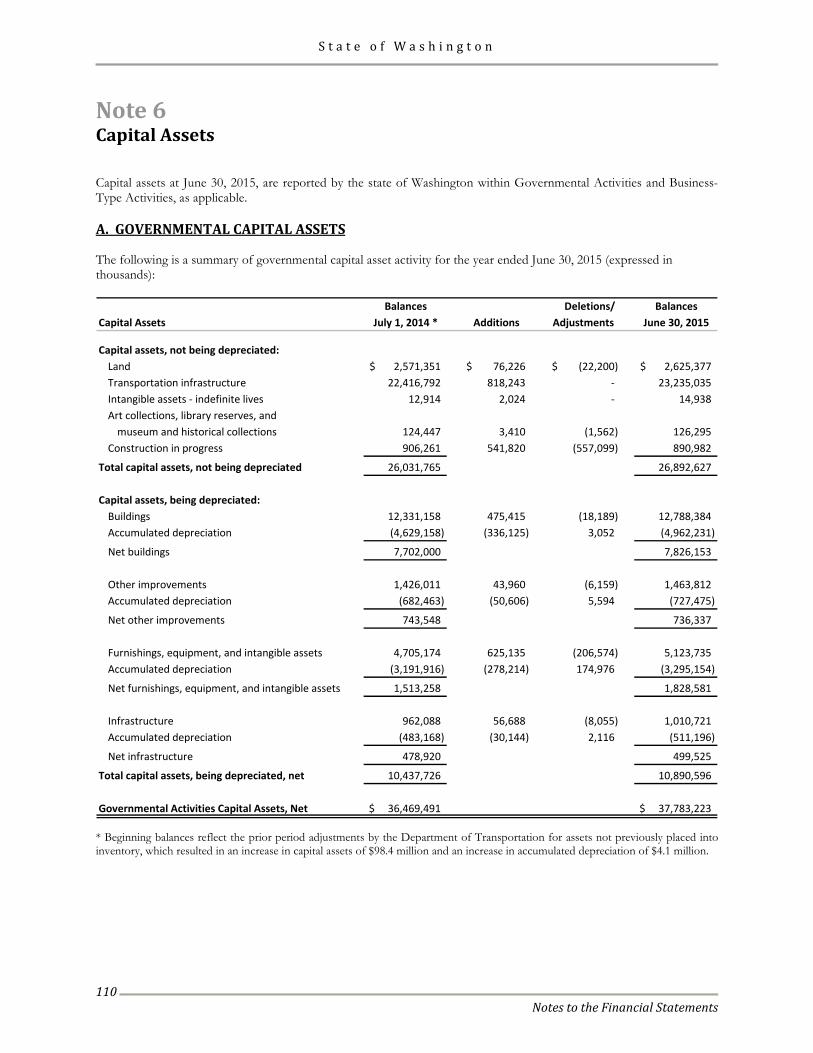
S t a t e o f W a s h i n g t o n
Notes to the Financial Statements
110
Note 6 Capital Assets Capital assets at June 30, 2015, are reported by the state of Washington within Governmental Activities and Business-Type Activities, as applicable. A. GOVERNMENTAL CAPITAL ASSETS The following is a summary of governmental capital asset activity for the year ended June 30, 2015 (expressed in thousands):
Balances Deletions/ BalancesCapital Assets July 1, 2014 * Additions Adjustments June 30, 2015
Capital assets, not being depreciated:Land 2,571,351$ 76,226$ (22,200)$ 2,625,377$ Transportation infrastructure 22,416,792 818,243 - 23,235,035 Intangible assets - indefinite lives 12,914 2,024 - 14,938 Art collections, library reserves, and
museum and historical collections 124,447 3,410 (1,562) 126,295 Construction in progress 906,261 541,820 (557,099) 890,982
Total capital assets, not being depreciated 26,031,765 26,892,627
Capital assets, being depreciated:Buildings 12,331,158 475,415 (18,189) 12,788,384 Accumulated depreciation (4,629,158) (336,125) 3,052 (4,962,231)
Net buildings 7,702,000 7,826,153
Other improvements 1,426,011 43,960 (6,159) 1,463,812 Accumulated depreciation (682,463) (50,606) 5,594 (727,475)
Net other improvements 743,548 736,337
Furnishings, equipment, and intangible assets 4,705,174 625,135 (206,574) 5,123,735 Accumulated depreciation (3,191,916) (278,214) 174,976 (3,295,154)
Net furnishings, equipment, and intangible assets 1,513,258 1,828,581
Infrastructure 962,088 56,688 (8,055) 1,010,721 Accumulated depreciation (483,168) (30,144) 2,116 (511,196)
Net infrastructure 478,920 499,525
Total capital assets, being depreciated, net 10,437,726 10,890,596
Governmental Activities Capital Assets, Net 36,469,491$ 37,783,223$
* Beginning balances reflect the prior period adjustments by the Department of Transportation for assets not previously placed into inventory, which resulted in an increase in capital assets of $98.4 million and an increase in accumulated depreciation of $4.1 million.
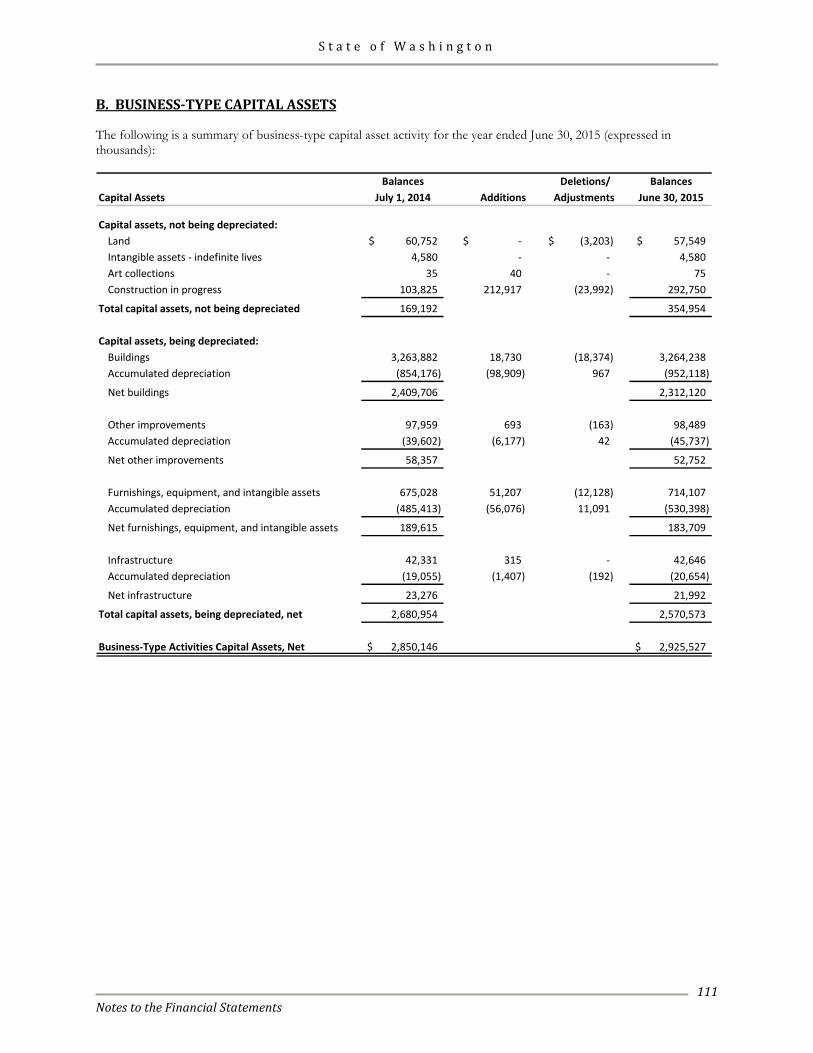
S t a t e o f W a s h i n g t o n
Notes to the Financial Statements
111
B. BUSINESS-TYPE CAPITAL ASSETS The following is a summary of business-type capital asset activity for the year ended June 30, 2015 (expressed in thousands):
Balances Deletions/ BalancesCapital Assets July 1, 2014 Additions Adjustments June 30, 2015
Capital assets, not being depreciated:Land 60,752$ -$ (3,203)$ 57,549$ Intangible assets - indefinite lives 4,580 - - 4,580 Art collections 35 40 - 75 Construction in progress 103,825 212,917 (23,992) 292,750
Total capital assets, not being depreciated 169,192 354,954
Capital assets, being depreciated:Buildings 3,263,882 18,730 (18,374) 3,264,238 Accumulated depreciation (854,176) (98,909) 967 (952,118)
Net buildings 2,409,706 2,312,120
Other improvements 97,959 693 (163) 98,489 Accumulated depreciation (39,602) (6,177) 42 (45,737)
Net other improvements 58,357 52,752
Furnishings, equipment, and intangible assets 675,028 51,207 (12,128) 714,107 Accumulated depreciation (485,413) (56,076) 11,091 (530,398)
Net furnishings, equipment, and intangible assets 189,615 183,709
Infrastructure 42,331 315 - 42,646 Accumulated depreciation (19,055) (1,407) (192) (20,654)
Net infrastructure 23,276 21,992
Total capital assets, being depreciated, net 2,680,954 2,570,573
Business-Type Activities Capital Assets, Net 2,850,146$ 2,925,527$
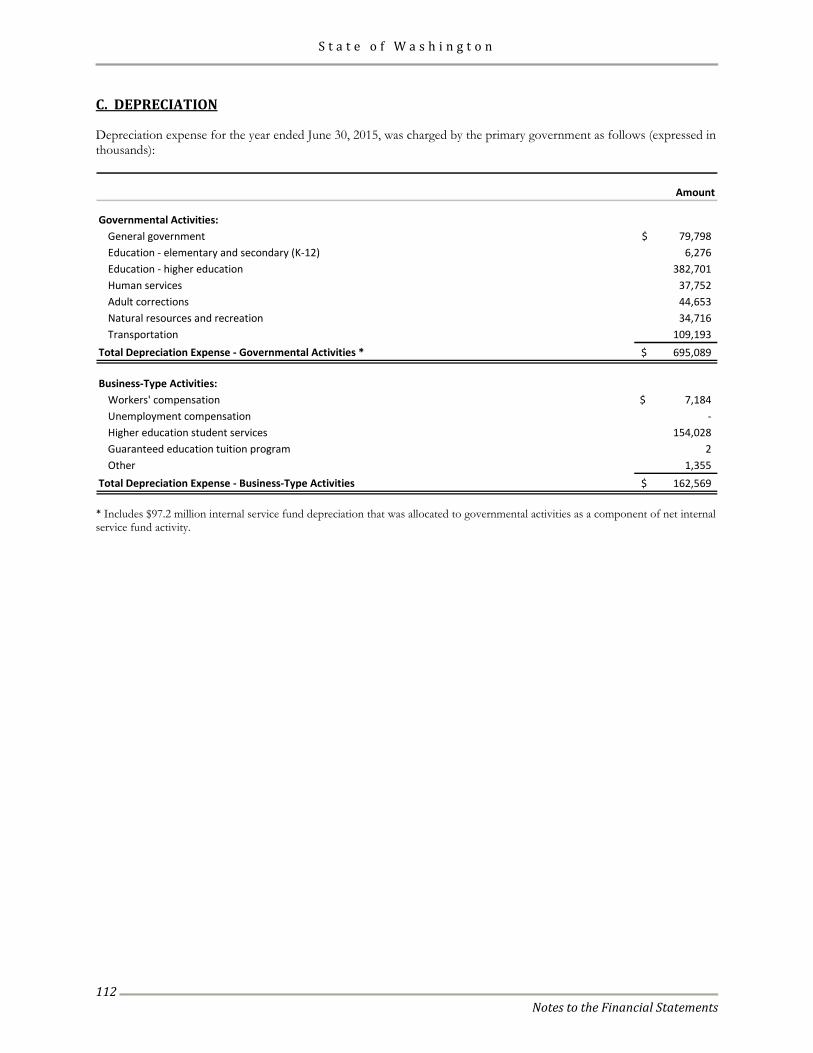
S t a t e o f W a s h i n g t o n
Notes to the Financial Statements
112
C. DEPRECIATION Depreciation expense for the year ended June 30, 2015, was charged by the primary government as follows (expressed in thousands):
Amount
Governmental Activities:General government 79,798$ Education - elementary and secondary (K-12) 6,276 Education - higher education 382,701 Human services 37,752 Adult corrections 44,653 Natural resources and recreation 34,716 Transportation 109,193
Total Depreciation Expense - Governmental Activities * 695,089$
Business-Type Activities:Workers' compensation 7,184$ Unemployment compensation - Higher education student services 154,028 Guaranteed education tuition program 2 Other 1,355
Total Depreciation Expense - Business-Type Activities 162,569$
* Includes $97.2 million internal service fund depreciation that was allocated to governmental activities as a component of net internal service fund activity.
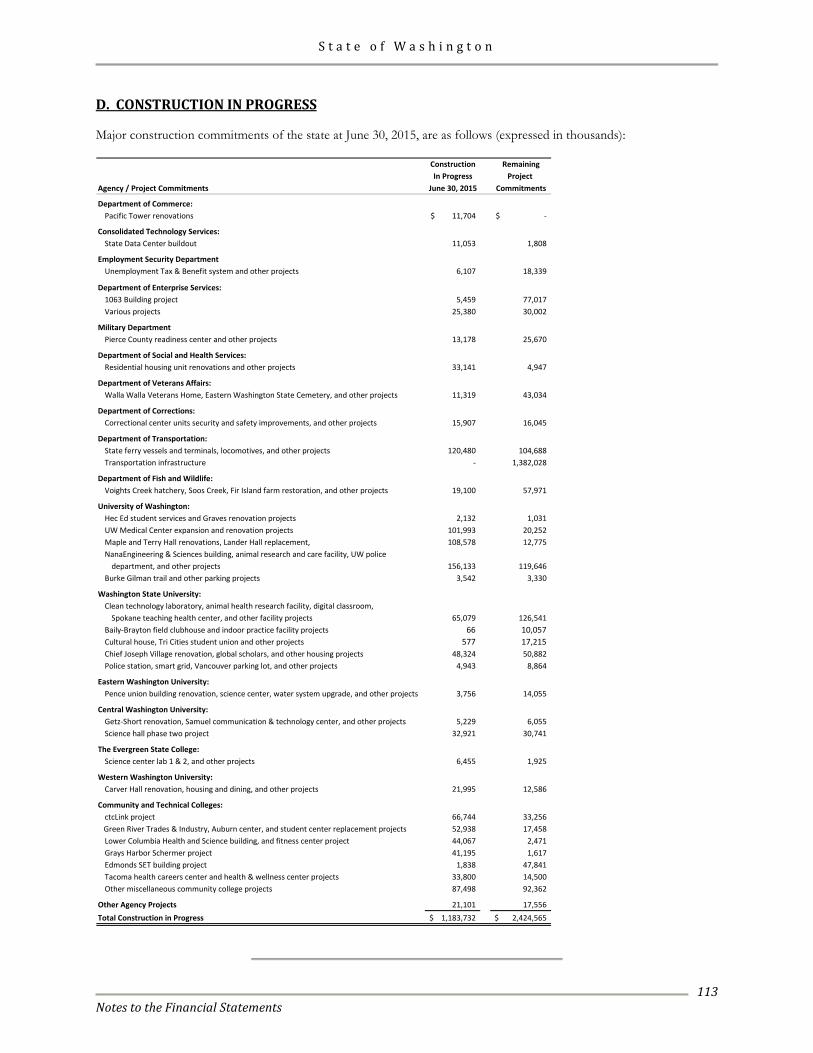
S t a t e o f W a s h i n g t o n
Notes to the Financial Statements
113
D. CONSTRUCTION IN PROGRESS Major construction commitments of the state at June 30, 2015, are as follows (expressed in thousands):
Construction RemainingIn Progress Project
Agency / Project Commitments June 30, 2015 Commitments
Department of Commerce:Pacific Tower renovations 11,704$ -$
Consolidated Technology Services:State Data Center buildout 11,053 1,808
Employment Security DepartmentUnemployment Tax & Benefit system and other projects 6,107 18,339
Department of Enterprise Services:1063 Building project 5,459 77,017 Various projects 25,380 30,002
Military Department Pierce County readiness center and other projects 13,178 25,670
Department of Social and Health Services:Residential housing unit renovations and other projects 33,141 4,947
Department of Veterans Affairs:Walla Walla Veterans Home, Eastern Washington State Cemetery, and other projects 11,319 43,034
Department of Corrections:Correctional center units security and safety improvements, and other projects 15,907 16,045
Department of Transportation:State ferry vessels and terminals, locomotives, and other projects 120,480 104,688 Transportation infrastructure - 1,382,028
Department of Fish and Wildlife:Voights Creek hatchery, Soos Creek, Fir Island farm restoration, and other projects 19,100 57,971
University of Washington:Hec Ed student services and Graves renovation projects 2,132 1,031 UW Medical Center expansion and renovation projects 101,993 20,252 Maple and Terry Hall renovations, Lander Hall replacement, 108,578 12,775 NanaEngineering & Sciences building, animal research and care facility, UW police
department, and other projects 156,133 119,646 Burke Gilman trail and other parking projects 3,542 3,330
Washington State University:Clean technology laboratory, animal health research facility, digital classroom,
Spokane teaching health center, and other facility projects 65,079 126,541 Baily-Brayton field clubhouse and indoor practice facility projects 66 10,057Cultural house, Tri Cities student union and other projects 577 17,215Chief Joseph Village renovation, global scholars, and other housing projects 48,324 50,882 Police station, smart grid, Vancouver parking lot, and other projects 4,943 8,864
Eastern Washington University:Pence union building renovation, science center, water system upgrade, and other projects 3,756 14,055
Central Washington University:Getz-Short renovation, Samuel communication & technology center, and other projects 5,229 6,055 Science hall phase two project 32,921 30,741
The Evergreen State College:Science center lab 1 & 2, and other projects 6,455 1,925
Western Washington University:Carver Hall renovation, housing and dining, and other projects 21,995 12,586
Community and Technical Colleges:ctcLink project 66,744 33,256
Green River Trades & Industry, Auburn center, and student center replacement projects 52,938 17,458 Lower Columbia Health and Science building, and fitness center project 44,067 2,471 Grays Harbor Schermer project 41,195 1,617 Edmonds SET building project 1,838 47,841 Tacoma health careers center and health & wellness center projects 33,800 14,500 Other miscellaneous community college projects 87,498 92,362
Other Agency Projects 21,101 17,556 Total Construction in Progress $ 1,183,732 2,424,565$
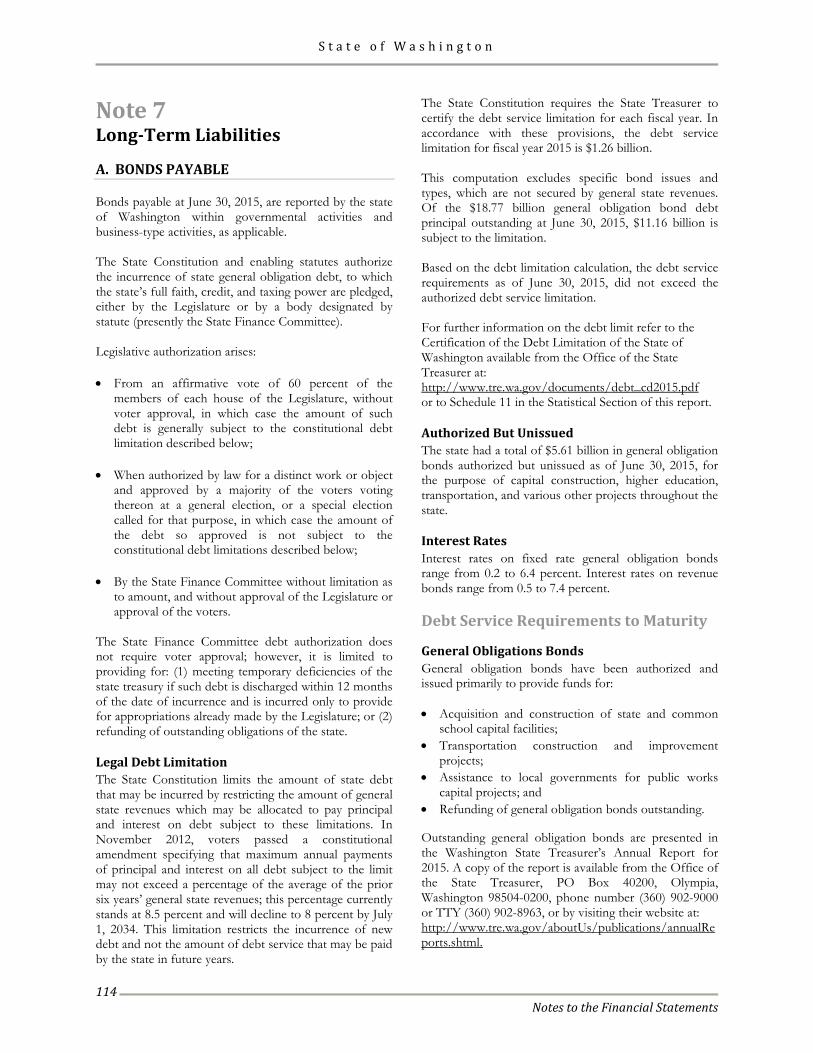
S t a t e o f W a s h i n g t o n
Notes to the Financial Statements
114
Note 7 Long-Term Liabilities A. BONDS PAYABLE Bonds payable at June 30, 2015, are reported by the state of Washington within governmental activities and business-type activities, as applicable. The State Constitution and enabling statutes authorize the incurrence of state general obligation debt, to which the state’s full faith, credit, and taxing power are pledged, either by the Legislature or by a body designated by statute (presently the State Finance Committee). Legislative authorization arises: • From an affirmative vote of 60 percent of the
members of each house of the Legislature, without voter approval, in which case the amount of such debt is generally subject to the constitutional debt limitation described below;
• When authorized by law for a distinct work or object
and approved by a majority of the voters voting thereon at a general election, or a special election called for that purpose, in which case the amount of the debt so approved is not subject to the constitutional debt limitations described below;
• By the State Finance Committee without limitation as
to amount, and without approval of the Legislature or approval of the voters.
The State Finance Committee debt authorization does not require voter approval; however, it is limited to providing for: (1) meeting temporary deficiencies of the state treasury if such debt is discharged within 12 months of the date of incurrence and is incurred only to provide for appropriations already made by the Legislature; or (2) refunding of outstanding obligations of the state. Legal Debt Limitation The State Constitution limits the amount of state debt that may be incurred by restricting the amount of general state revenues which may be allocated to pay principal and interest on debt subject to these limitations. In November 2012, voters passed a constitutional amendment specifying that maximum annual payments of principal and interest on all debt subject to the limit may not exceed a percentage of the average of the prior six years’ general state revenues; this percentage currently stands at 8.5 percent and will decline to 8 percent by July 1, 2034. This limitation restricts the incurrence of new debt and not the amount of debt service that may be paid by the state in future years.
The State Constitution requires the State Treasurer to certify the debt service limitation for each fiscal year. In accordance with these provisions, the debt service limitation for fiscal year 2015 is $1.26 billion. This computation excludes specific bond issues and types, which are not secured by general state revenues. Of the $18.77 billion general obligation bond debt principal outstanding at June 30, 2015, $11.16 billion is subject to the limitation. Based on the debt limitation calculation, the debt service requirements as of June 30, 2015, did not exceed the authorized debt service limitation. For further information on the debt limit refer to the Certification of the Debt Limitation of the State of Washington available from the Office of the State Treasurer at: http://www.tre.wa.gov/documents/debt_cd2015.pdf or to Schedule 11 in the Statistical Section of this report. Authorized But Unissued The state had a total of $5.61 billion in general obligation bonds authorized but unissued as of June 30, 2015, for the purpose of capital construction, higher education, transportation, and various other projects throughout the state. Interest Rates Interest rates on fixed rate general obligation bonds range from 0.2 to 6.4 percent. Interest rates on revenue bonds range from 0.5 to 7.4 percent. Debt Service Requirements to Maturity
General Obligations Bonds General obligation bonds have been authorized and issued primarily to provide funds for: • Acquisition and construction of state and common
school capital facilities; • Transportation construction and improvement
projects; • Assistance to local governments for public works
capital projects; and • Refunding of general obligation bonds outstanding. Outstanding general obligation bonds are presented in the Washington State Treasurer’s Annual Report for 2015. A copy of the report is available from the Office of the State Treasurer, PO Box 40200, Olympia, Washington 98504-0200, phone number (360) 902-9000 or TTY (360) 902-8963, or by visiting their website at: http://www.tre.wa.gov/aboutUs/publications/annualReports.shtml.
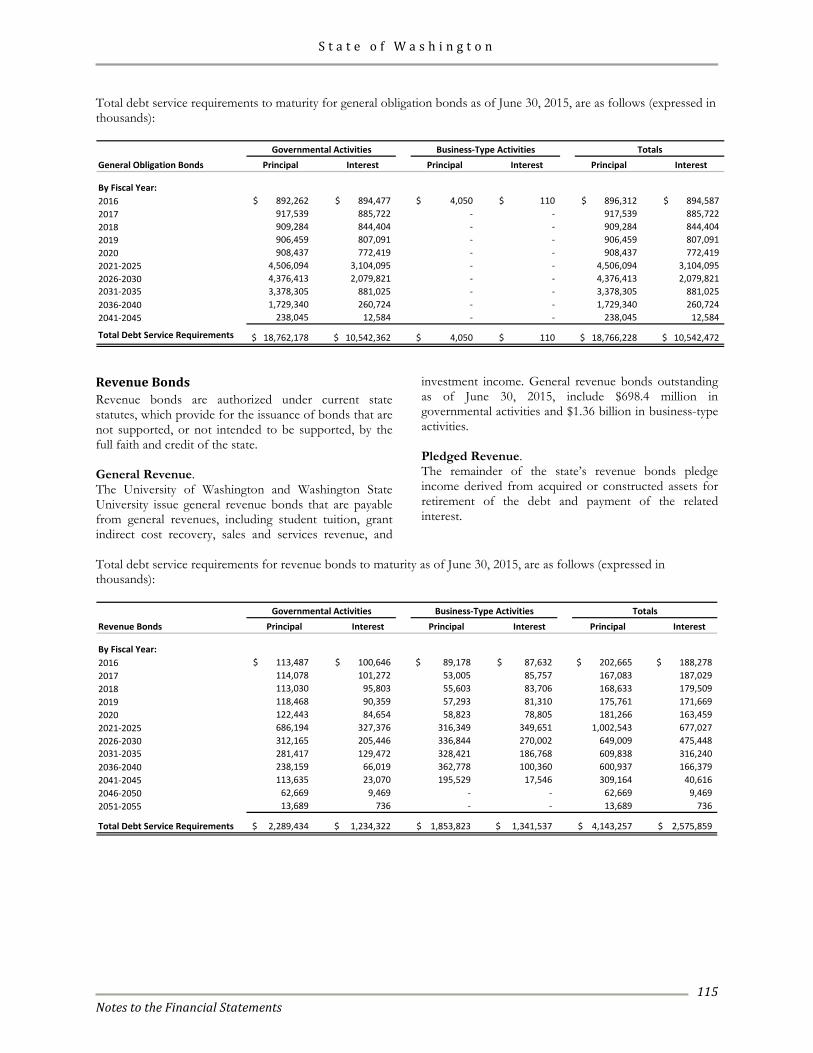
S t a t e o f W a s h i n g t o n
Notes to the Financial Statements
115
Total debt service requirements to maturity for general obligation bonds as of June 30, 2015, are as follows (expressed in thousands):
General Obligation Bonds Principal Interest Principal Interest Principal Interest
By Fiscal Year:2016 892,262$ 894,477$ 4,050$ 110$ 896,312$ 894,587$ 2017 917,539 885,722 - - 917,539 885,722 2018 909,284 844,404 - - 909,284 844,404 2019 906,459 807,091 - - 906,459 807,091 2020 908,437 772,419 - - 908,437 772,419 2021-2025 4,506,094 3,104,095 - - 4,506,094 3,104,095 2026-2030 4,376,413 2,079,821 - - 4,376,413 2,079,821 2031-2035 3,378,305 881,025 - - 3,378,305 881,025 2036-2040 1,729,340 260,724 - - 1,729,340 260,724 2041-2045 238,045 12,584 - - 238,045 12,584
Total Debt Service Requirements 18,762,178$ 10,542,362$ 4,050$ 110$ 18,766,228$ 10,542,472$
Governmental Activities Business-Type Activities Totals
Revenue Bonds Revenue bonds are authorized under current state statutes, which provide for the issuance of bonds that are not supported, or not intended to be supported, by the full faith and credit of the state. General Revenue. The University of Washington and Washington State University issue general revenue bonds that are payable from general revenues, including student tuition, grant indirect cost recovery, sales and services revenue, and
investment income. General revenue bonds outstanding as of June 30, 2015, include $698.4 million in governmental activities and $1.36 billion in business-type activities. Pledged Revenue. The remainder of the state’s revenue bonds pledge income derived from acquired or constructed assets for retirement of the debt and payment of the related interest.
Total debt service requirements for revenue bonds to maturity as of June 30, 2015, are as follows (expressed in thousands):
Revenue Bonds Principal Interest Principal Interest Principal Interest
By Fiscal Year:2016 113,487$ 100,646$ 89,178$ 87,632$ 202,665$ 188,278$ 2017 114,078 101,272 53,005 85,757 167,083 187,029 2018 113,030 95,803 55,603 83,706 168,633 179,509 2019 118,468 90,359 57,293 81,310 175,761 171,669 2020 122,443 84,654 58,823 78,805 181,266 163,459 2021-2025 686,194 327,376 316,349 349,651 1,002,543 677,027 2026-2030 312,165 205,446 336,844 270,002 649,009 475,448 2031-2035 281,417 129,472 328,421 186,768 609,838 316,240 2036-2040 238,159 66,019 362,778 100,360 600,937 166,379 2041-2045 113,635 23,070 195,529 17,546 309,164 40,616 2046-2050 62,669 9,469 - - 62,669 9,469 2051-2055 13,689 736 - - 13,689 736
Total Debt Service Requirements 2,289,434$ 1,234,322$ 1,853,823$ 1,341,537$ 4,143,257$ 2,575,859$
Governmental Activities Business-Type Activities Totals
S t a t e o f W a s h i n g t o n
Notes to the Financial Statements
116
Governmental activities include revenue bonds outstanding at June 30, 2015, of $273.2 million issued by the Tobacco Settlement Authority (TSA), which is a blended component unit of the state. In November 2002, the TSA issued $517.9 million in bonds and transferred $450.0 million to the state to be used for increased health care, long-term care, and other programs. These bonds do not constitute either a legal or moral obligation of the state, nor does the state pledge its full faith, credit, or taxing power for payment of these bonds. The bonds are obligations of the TSA and are secured solely by the TSA’s right to receive 29.2 percent of the state’s tobacco settlement revenues, restricted investments of the TSA, undistributed TSA bond proceeds, and the earnings thereon held under the indenture authorizing the bonds. Total principal and interest remaining on the bonds is $407.2 million, payable through 2033. For the current year, both pledged revenue and debt service were $47.4 million. Governmental activities include grant anticipation revenue bonds outstanding at June 30, 2015, of $786.3 million issued for the Washington State Department of Transportation. The bonds were issued to finance a portion of the costs of constructing the State Route 520 Floating Bridge and Eastside Project. These bonds do not constitute either a legal or moral obligation of the state, nor does the state pledge its full faith, credit, or taxing power for payment of these bonds. The bonds are payable solely from Federal-Aid Highway Program funds, including federal reimbursements of debt service on the bonds and federal reimbursements to the state for projects or portions of projects not financed with bond proceeds. Total principal and interest remaining on the bonds is $997.5 million, payable through 2024. For the current year both pledged revenue and debt service were $39.1 million. Governmental activities include the Transportation Infrastructure Finance and Innovation Act Bond (TIFIA Bond) outstanding at June 30, 2015, of $195.2 million. The bonds were issued to finance a portion of the State Route 520 Corridor Program. The TIFIA Bond is payable solely from toll revenues and does not constitute either a legal or moral obligation of the state, nor does the state pledge its full faith, credit, or taxing power for payment of this bond. Total principal and interest remaining on the bond is $347.2 million, payable through 2051. Governmental activities include revenue bonds outstanding at June 30, 2015, of $43.4 million issued by the Tumwater Office Properties (TOP), which is a blended component unit of the state. The bonds, issued
in 2004, are payable solely from the trust estate pledged under the indenture, including rental payments. The bonds were used to construct an office building in Tumwater, Washington which the state occupied beginning in fiscal year 2006. The bonds are not a general obligation of the state, nor does the state pledge its full faith, credit, or taxing power for payment of these bonds. Total principal and interest remaining on the bonds is $59.7 million, payable through 2029. For the current year, both pledged revenue and debt service were $999 thousand. Governmental activities include revenue bonds outstanding at June 30, 2015, of $286.8 million issued by FYI Properties, a blended component unit of the state. The bonds, issued in 2009, are payable solely from the trust estate pledged under the indenture, including rental payments. The bonds were used to construct an office building in Olympia, Washington which the state occupied beginning in fiscal year 2012. The bonds are not a general obligation of the state, nor does the state pledge its full faith, credit, or taxing power for payment of these bonds. Total principal and interest remaining on the bonds is $517.5 million, payable through 2039. For the current year, both pledged revenue and debt service were $21.6 million. Additionally, governmental activities include revenue bonds outstanding at June 30, 2015, of $6.1 million issued by the City of Aberdeen. The bonds were used to extend utilities to the state Department of Corrections Stafford Creek Corrections Center (SCCC). The Department of Corrections entered into an agreement with the City of Aberdeen to pay a system development fee sufficient to pay the debt service on the bonds. The bonds were issued in 1998 and 2002, and refunded by the city in 2010, and are payable solely from current operating appropriations. The bonds are not a general obligation of the state, nor does the state pledge its full faith, credit, or taxing power for payment of these bonds. Total principal and interest remaining on these bonds is $7.0 million, payable through 2022. For the current year, both pledged revenue and debt service were $1.6 million. The state’s colleges and universities may also issue bonds for the purpose of housing, dining, parking, and student facilities construction. These bonds are reported within business-type activities and are secured by a pledge of specific revenues. These bonds are not a general obligation of the state, nor does the state pledge its full faith, credit, or taxing power for payment of these bonds.
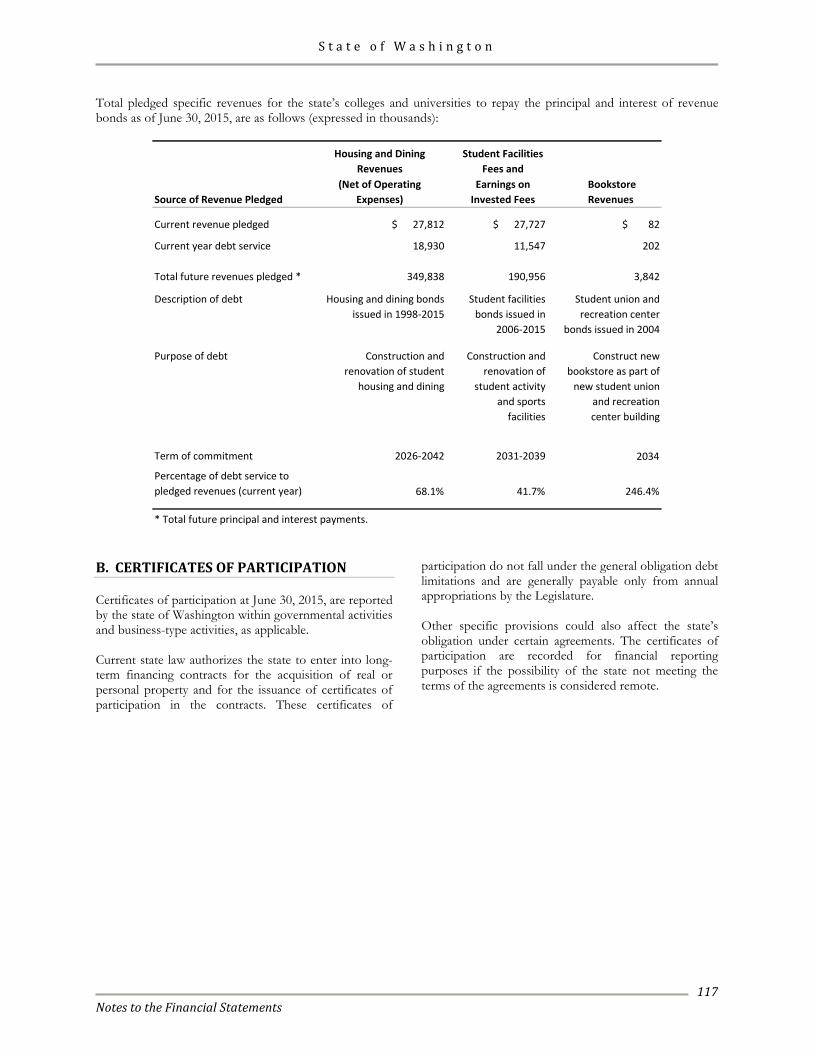
S t a t e o f W a s h i n g t o n
Notes to the Financial Statements
117
Total pledged specific revenues for the state’s colleges and universities to repay the principal and interest of revenue bonds as of June 30, 2015, are as follows (expressed in thousands):
Housing and Dining Revenues
Student Facilities Fees and
Source of Revenue Pledged(Net of Operating
Expenses)Earnings on
Invested Fees Bookstore Revenues
Current revenue pledged $ 27,812 $ 27,727 $ 82
Current year debt service 18,930 11,547 202
Total future revenues pledged * 349,838 190,956 3,842
Description of debt Housing and dining bonds issued in 1998-2015
Student facilities bonds issued in
2006-2015
Student union and recreation center
bonds issued in 2004
Purpose of debt Construction and renovation of student
housing and dining
Construction and renovation of
student activity and sports
facilities
Construct new bookstore as part of
new student union and recreation center building
Term of commitment 2026-2042 2031-2039 2034
Percentage of debt service to pledged revenues (current year) 68.1% 41.7% 246.4%
* Total future principal and interest payments. B. CERTIFICATES OF PARTICIPATION Certificates of participation at June 30, 2015, are reported by the state of Washington within governmental activities and business-type activities, as applicable. Current state law authorizes the state to enter into long-term financing contracts for the acquisition of real or personal property and for the issuance of certificates of participation in the contracts. These certificates of
participation do not fall under the general obligation debt limitations and are generally payable only from annual appropriations by the Legislature. Other specific provisions could also affect the state’s obligation under certain agreements. The certificates of participation are recorded for financial reporting purposes if the possibility of the state not meeting the terms of the agreements is considered remote.
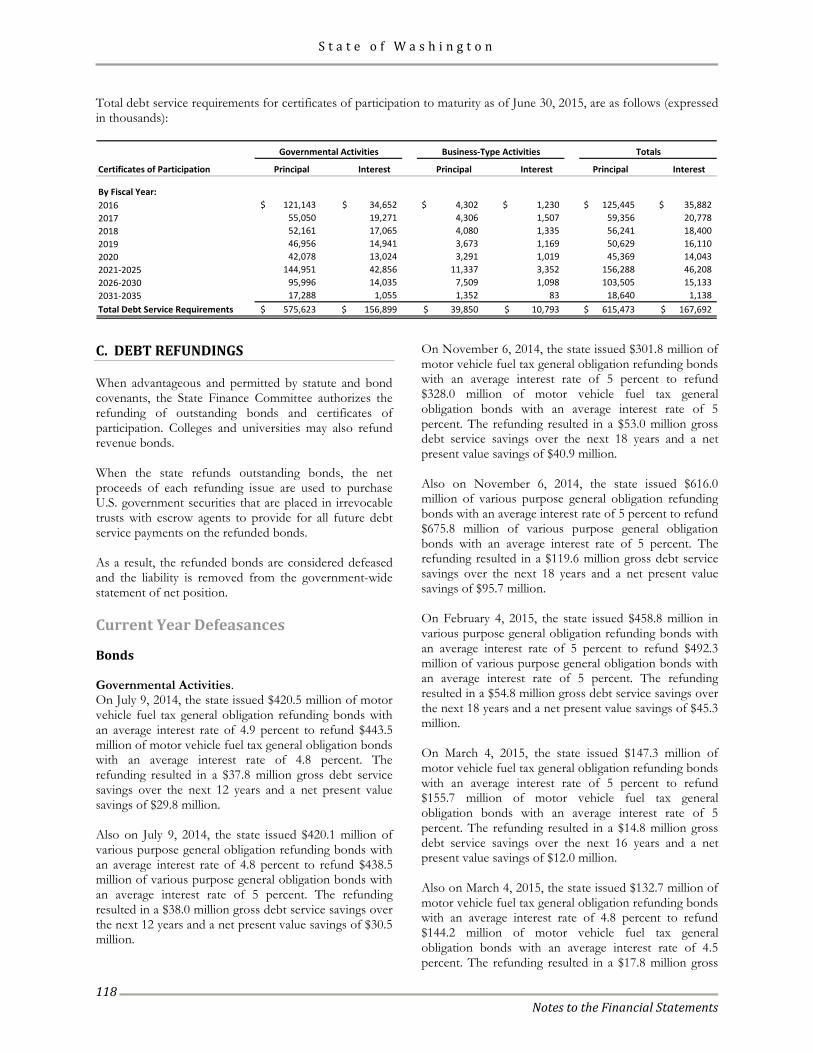
S t a t e o f W a s h i n g t o n
Notes to the Financial Statements
118
Total debt service requirements for certificates of participation to maturity as of June 30, 2015, are as follows (expressed in thousands):
Certificates of Participation Principal Interest Principal Interest Principal Interest
By Fiscal Year:2016 121,143$ 34,652$ 4,302$ 1,230$ 125,445$ 35,882$ 2017 55,050 19,271 4,306 1,507 59,356 20,778 2018 52,161 17,065 4,080 1,335 56,241 18,400 2019 46,956 14,941 3,673 1,169 50,629 16,110 2020 42,078 13,024 3,291 1,019 45,369 14,043 2021-2025 144,951 42,856 11,337 3,352 156,288 46,208 2026-2030 95,996 14,035 7,509 1,098 103,505 15,133 2031-2035 17,288 1,055 1,352 83 18,640 1,138 Total Debt Service Requirements 575,623$ 156,899$ 39,850$ 10,793$ 615,473$ 167,692$
Governmental Activities Business-Type Activities Totals
C. DEBT REFUNDINGS When advantageous and permitted by statute and bond covenants, the State Finance Committee authorizes the refunding of outstanding bonds and certificates of participation. Colleges and universities may also refund revenue bonds. When the state refunds outstanding bonds, the net proceeds of each refunding issue are used to purchase U.S. government securities that are placed in irrevocable trusts with escrow agents to provide for all future debt service payments on the refunded bonds. As a result, the refunded bonds are considered defeased and the liability is removed from the government-wide statement of net position. Current Year Defeasances
Bonds Governmental Activities. On July 9, 2014, the state issued $420.5 million of motor vehicle fuel tax general obligation refunding bonds with an average interest rate of 4.9 percent to refund $443.5 million of motor vehicle fuel tax general obligation bonds with an average interest rate of 4.8 percent. The refunding resulted in a $37.8 million gross debt service savings over the next 12 years and a net present value savings of $29.8 million. Also on July 9, 2014, the state issued $420.1 million of various purpose general obligation refunding bonds with an average interest rate of 4.8 percent to refund $438.5 million of various purpose general obligation bonds with an average interest rate of 5 percent. The refunding resulted in a $38.0 million gross debt service savings over the next 12 years and a net present value savings of $30.5 million.
On November 6, 2014, the state issued $301.8 million of motor vehicle fuel tax general obligation refunding bonds with an average interest rate of 5 percent to refund $328.0 million of motor vehicle fuel tax general obligation bonds with an average interest rate of 5 percent. The refunding resulted in a $53.0 million gross debt service savings over the next 18 years and a net present value savings of $40.9 million. Also on November 6, 2014, the state issued $616.0 million of various purpose general obligation refunding bonds with an average interest rate of 5 percent to refund $675.8 million of various purpose general obligation bonds with an average interest rate of 5 percent. The refunding resulted in a $119.6 million gross debt service savings over the next 18 years and a net present value savings of $95.7 million. On February 4, 2015, the state issued $458.8 million in various purpose general obligation refunding bonds with an average interest rate of 5 percent to refund $492.3 million of various purpose general obligation bonds with an average interest rate of 5 percent. The refunding resulted in a $54.8 million gross debt service savings over the next 18 years and a net present value savings of $45.3 million. On March 4, 2015, the state issued $147.3 million of motor vehicle fuel tax general obligation refunding bonds with an average interest rate of 5 percent to refund $155.7 million of motor vehicle fuel tax general obligation bonds with an average interest rate of 5 percent. The refunding resulted in a $14.8 million gross debt service savings over the next 16 years and a net present value savings of $12.0 million. Also on March 4, 2015, the state issued $132.7 million of motor vehicle fuel tax general obligation refunding bonds with an average interest rate of 4.8 percent to refund $144.2 million of motor vehicle fuel tax general obligation bonds with an average interest rate of 4.5 percent. The refunding resulted in a $17.8 million gross
S t a t e o f W a s h i n g t o n
Notes to the Financial Statements
119
debt service savings over the next 16 years and a net present value savings of $11.4 million. Also on March 4, 2015, the state issued $113.3 million of various purpose general obligation refunding bonds with an average interest rate of 4.6 percent to refund $120.6 million of various purpose general obligation bonds with an average interest rate of 4.5 percent. The refunding resulted in a $10.7 million gross debt service savings over the next 13 years and a net present value savings of $9.1 million. Business-Type Activities. On August 21, 2014, the Washington Biomedical Research Properties II, a blended component unit of the University of Washington, issued $115.7 million in lease revenue refunding bonds with an average interest rate of 4.5 percent to refund $118.9 million of lease revenue bonds with an average interest rate of 5 percent. The refunding resulted in a $15.0 million gross debt service savings over the next 12 years and an economic gain of $12.6 million. On March 4, 2015, the University of Washington issued $176.1 million in general revenue refunding bonds with an average interest rate of 4.4 percent to refund $190.2 million of business-type activity lease revenue bonds with an average interest rate of 5 percent. The refunding resulted in a $75.0 million gross debt service savings over the next 15 years and an economic gain of $38.1 million. On March 4, 2015, Western Washington University issued $13.4 million in housing and dining refunding bonds with an average interest rate of 4 percent to refund $15.2 million of housing and dining revenue bonds with an average interest rate of 6 percent. The refunding resulted in a $1.9 million gross debt service savings over the next 12 years and an economic gain of $1.6 million. On March 11, 2015, Washington State University issued $64.5 million in general revenue refunding bonds with an average interest rate of 5% to refund $13.0 million in housing and dining revenue bonds with an average interest rate of 4.3%, $5.7 million in parking revenue bonds with an average interest rate of 4.3%, and $53.4 million in student fees revenue bonds with an average interest rate of 5%. The refunding resulted in an $11.0 million gross debt service savings over the next 9 to 24 years and an economic gain of $8.5 million.
Prior Year Defeasances
In prior years, the state defeased certain general obligation bonds, revenue bonds, and certificates of participation by placing the proceeds of new bonds and certificates in an irrevocable trust to provide for all future debt service payments on the prior bonds and certificates. Accordingly, the trust account assets and the liability for the defeased bonds and certificates are not included in the state’s financial statements. General Obligation Bond Debt On June 30, 2015, $3.82 billion of general obligation bonded debt outstanding is considered defeased. Revenue Bond Debt On June 30, 2015, $306.4 million of revenue bonded debt outstanding is considered defeased. Certificates of Participation Debt On June 30, 2015, $44.8 million of certificates of participation debt outstanding is considered defeased. D. LEASES Leases at June 30, 2015, are reported by the state of Washington within governmental activities and business-type activities, as applicable. The state leases land, office facilities, office and computer equipment, and other assets under a variety of agreements. Although lease terms vary, most leases are subject to appropriation from the Legislature to continue the obligation. If the possibility of receiving no funding from the Legislature is remote, leases are considered noncancelable for financial reporting purposes. Leases that represent acquisitions are classified as capital leases, and the related assets and liabilities are recorded in the financial records at the inception of the lease. Other leases are classified as operating leases with the lease payments recorded as expenditures or expenses during the life of the lease. Certain operating leases are renewable for specified periods. In most cases, management expects that the leases will be renewed or replaced by other leases.
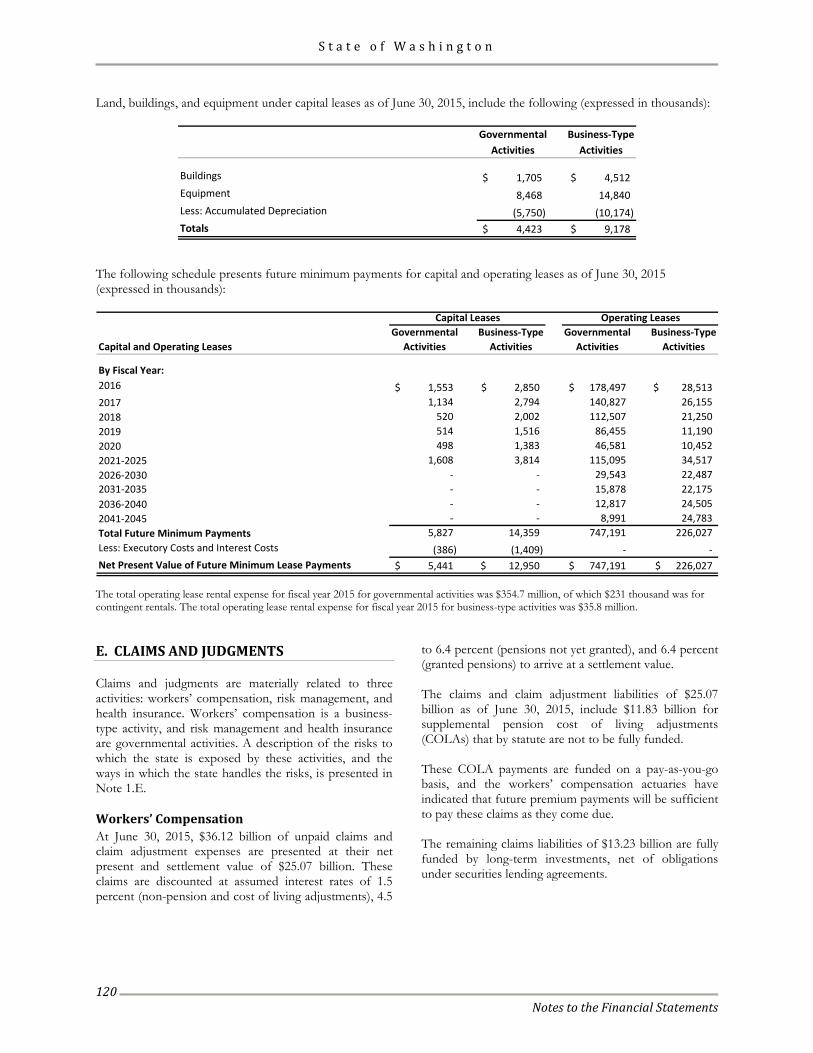
S t a t e o f W a s h i n g t o n
Notes to the Financial Statements
120
Land, buildings, and equipment under capital leases as of June 30, 2015, include the following (expressed in thousands):
Governmental Business-TypeActivities Activities
Buildings 1,705$ 4,512$ Equipment 8,468 14,840 Less: Accumulated Depreciation (5,750) (10,174) Totals 4,423$ 9,178$
The following schedule presents future minimum payments for capital and operating leases as of June 30, 2015 (expressed in thousands):
Governmental Business-Type Governmental Business-TypeCapital and Operating Leases Activities Activities Activities Activities
By Fiscal Year:2016 1,553$ 2,850$ 178,497$ 28,513$ 2017 1,134 2,794 140,827 26,155 2018 520 2,002 112,507 21,250 2019 514 1,516 86,455 11,190 2020 498 1,383 46,581 10,452 2021-2025 1,608 3,814 115,095 34,517 2026-2030 - - 29,543 22,487 2031-2035 - - 15,878 22,175 2036-2040 - - 12,817 24,505 2041-2045 - - 8,991 24,783 Total Future Minimum Payments 5,827 14,359 747,191 226,027 Less: Executory Costs and Interest Costs (386) (1,409) - - Net Present Value of Future Minimum Lease Payments 5,441$ 12,950$ 747,191$ 226,027$
Capital Leases Operating Leases
The total operating lease rental expense for fiscal year 2015 for governmental activities was $354.7 million, of which $231 thousand was for contingent rentals. The total operating lease rental expense for fiscal year 2015 for business-type activities was $35.8 million. E. CLAIMS AND JUDGMENTS Claims and judgments are materially related to three activities: workers’ compensation, risk management, and health insurance. Workers’ compensation is a business-type activity, and risk management and health insurance are governmental activities. A description of the risks to which the state is exposed by these activities, and the ways in which the state handles the risks, is presented in Note 1.E. Workers’ Compensation At June 30, 2015, $36.12 billion of unpaid claims and claim adjustment expenses are presented at their net present and settlement value of $25.07 billion. These claims are discounted at assumed interest rates of 1.5 percent (non-pension and cost of living adjustments), 4.5
to 6.4 percent (pensions not yet granted), and 6.4 percent (granted pensions) to arrive at a settlement value. The claims and claim adjustment liabilities of $25.07 billion as of June 30, 2015, include $11.83 billion for supplemental pension cost of living adjustments (COLAs) that by statute are not to be fully funded. These COLA payments are funded on a pay-as-you-go basis, and the workers’ compensation actuaries have indicated that future premium payments will be sufficient to pay these claims as they come due. The remaining claims liabilities of $13.23 billion are fully funded by long-term investments, net of obligations under securities lending agreements.
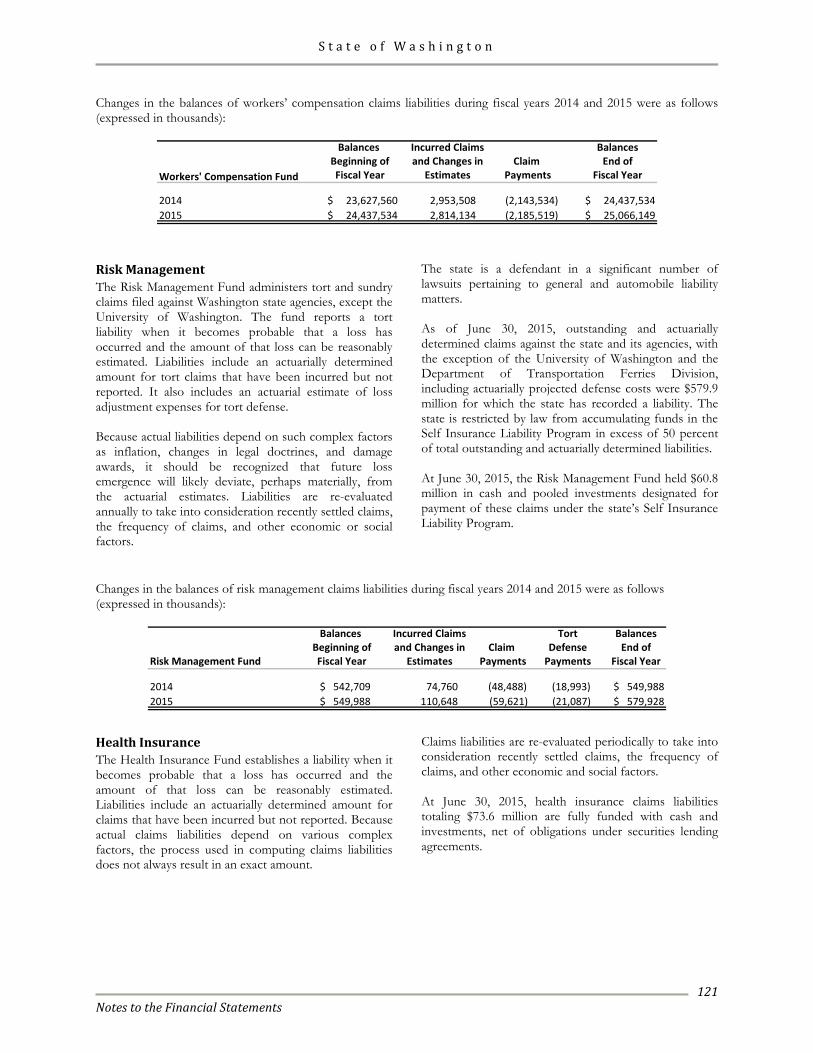
S t a t e o f W a s h i n g t o n
Notes to the Financial Statements
121
Changes in the balances of workers’ compensation claims liabilities during fiscal years 2014 and 2015 were as follows (expressed in thousands):
Balances Incurred Claims BalancesBeginning of and Changes in Claim End of
Workers' Compensation Fund Fiscal Year Estimates Payments Fiscal Year
2014 $ 23,627,560 2,953,508 (2,143,534) $ 24,437,534 2015 $ 24,437,534 2,814,134 (2,185,519) $ 25,066,149
Risk Management The Risk Management Fund administers tort and sundry claims filed against Washington state agencies, except the University of Washington. The fund reports a tort liability when it becomes probable that a loss has occurred and the amount of that loss can be reasonably estimated. Liabilities include an actuarially determined amount for tort claims that have been incurred but not reported. It also includes an actuarial estimate of loss adjustment expenses for tort defense. Because actual liabilities depend on such complex factors as inflation, changes in legal doctrines, and damage awards, it should be recognized that future loss emergence will likely deviate, perhaps materially, from the actuarial estimates. Liabilities are re-evaluated annually to take into consideration recently settled claims, the frequency of claims, and other economic or social factors.
The state is a defendant in a significant number of lawsuits pertaining to general and automobile liability matters. As of June 30, 2015, outstanding and actuarially determined claims against the state and its agencies, with the exception of the University of Washington and the Department of Transportation Ferries Division, including actuarially projected defense costs were $579.9 million for which the state has recorded a liability. The state is restricted by law from accumulating funds in the Self Insurance Liability Program in excess of 50 percent of total outstanding and actuarially determined liabilities. At June 30, 2015, the Risk Management Fund held $60.8 million in cash and pooled investments designated for payment of these claims under the state’s Self Insurance Liability Program.
Changes in the balances of risk management claims liabilities during fiscal years 2014 and 2015 were as follows (expressed in thousands):
Balances Incurred Claims Tort BalancesBeginning of and Changes in Claim Defense End of
Risk Management Fund Fiscal Year Estimates Payments Payments Fiscal Year
2014 $ 542,709 74,760 (48,488) (18,993) $ 549,988 2015 $ 549,988 110,648 (59,621) (21,087) $ 579,928
Health Insurance The Health Insurance Fund establishes a liability when it becomes probable that a loss has occurred and the amount of that loss can be reasonably estimated. Liabilities include an actuarially determined amount for claims that have been incurred but not reported. Because actual claims liabilities depend on various complex factors, the process used in computing claims liabilities does not always result in an exact amount.
Claims liabilities are re-evaluated periodically to take into consideration recently settled claims, the frequency of claims, and other economic and social factors. At June 30, 2015, health insurance claims liabilities totaling $73.6 million are fully funded with cash and investments, net of obligations under securities lending agreements.
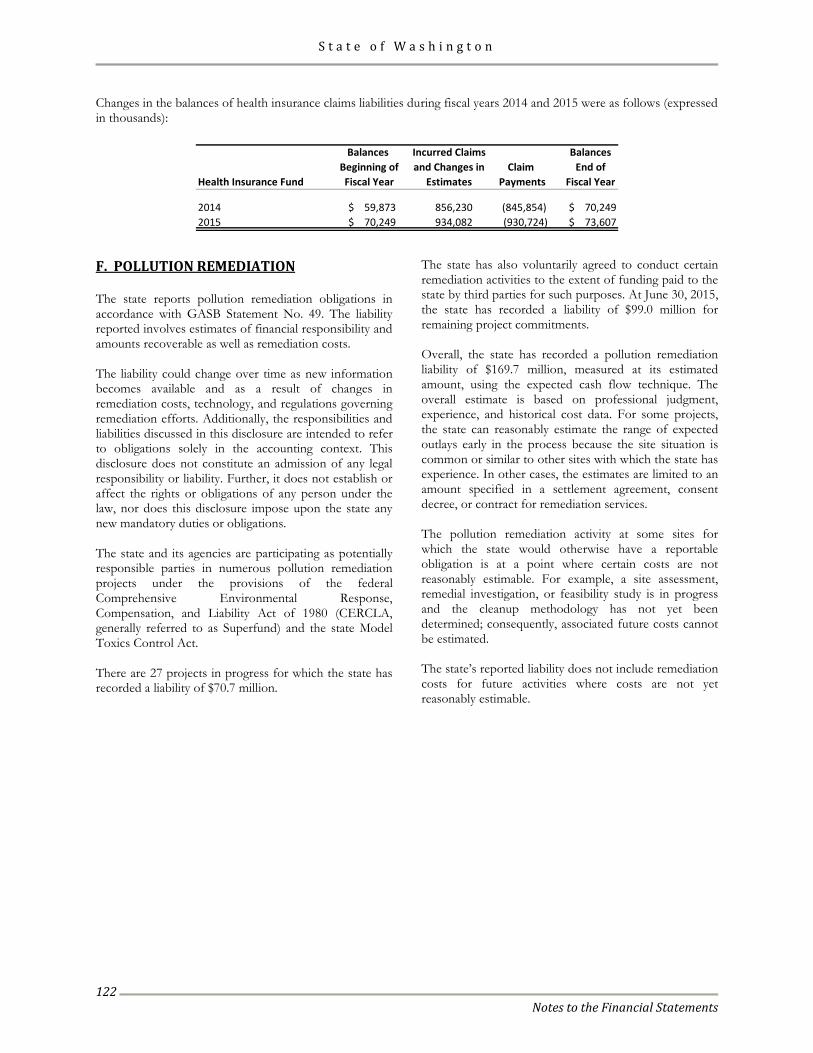
S t a t e o f W a s h i n g t o n
Notes to the Financial Statements
122
Changes in the balances of health insurance claims liabilities during fiscal years 2014 and 2015 were as follows (expressed in thousands):
Balances Incurred Claims BalancesBeginning of and Changes in Claim End of
Health Insurance Fund Fiscal Year Estimates Payments Fiscal Year
2014 $ 59,873 856,230 (845,854) $ 70,249 2015 $ 70,249 934,082 (930,724) $ 73,607
F. POLLUTION REMEDIATION The state reports pollution remediation obligations in accordance with GASB Statement No. 49. The liability reported involves estimates of financial responsibility and amounts recoverable as well as remediation costs. The liability could change over time as new information becomes available and as a result of changes in remediation costs, technology, and regulations governing remediation efforts. Additionally, the responsibilities and liabilities discussed in this disclosure are intended to refer to obligations solely in the accounting context. This disclosure does not constitute an admission of any legal responsibility or liability. Further, it does not establish or affect the rights or obligations of any person under the law, nor does this disclosure impose upon the state any new mandatory duties or obligations. The state and its agencies are participating as potentially responsible parties in numerous pollution remediation projects under the provisions of the federal Comprehensive Environmental Response, Compensation, and Liability Act of 1980 (CERCLA, generally referred to as Superfund) and the state Model Toxics Control Act. There are 27 projects in progress for which the state has recorded a liability of $70.7 million.
The state has also voluntarily agreed to conduct certain remediation activities to the extent of funding paid to the state by third parties for such purposes. At June 30, 2015, the state has recorded a liability of $99.0 million for remaining project commitments. Overall, the state has recorded a pollution remediation liability of $169.7 million, measured at its estimated amount, using the expected cash flow technique. The overall estimate is based on professional judgment, experience, and historical cost data. For some projects, the state can reasonably estimate the range of expected outlays early in the process because the site situation is common or similar to other sites with which the state has experience. In other cases, the estimates are limited to an amount specified in a settlement agreement, consent decree, or contract for remediation services. The pollution remediation activity at some sites for which the state would otherwise have a reportable obligation is at a point where certain costs are not reasonably estimable. For example, a site assessment, remedial investigation, or feasibility study is in progress and the cleanup methodology has not yet been determined; consequently, associated future costs cannot be estimated. The state’s reported liability does not include remediation costs for future activities where costs are not yet reasonably estimable.
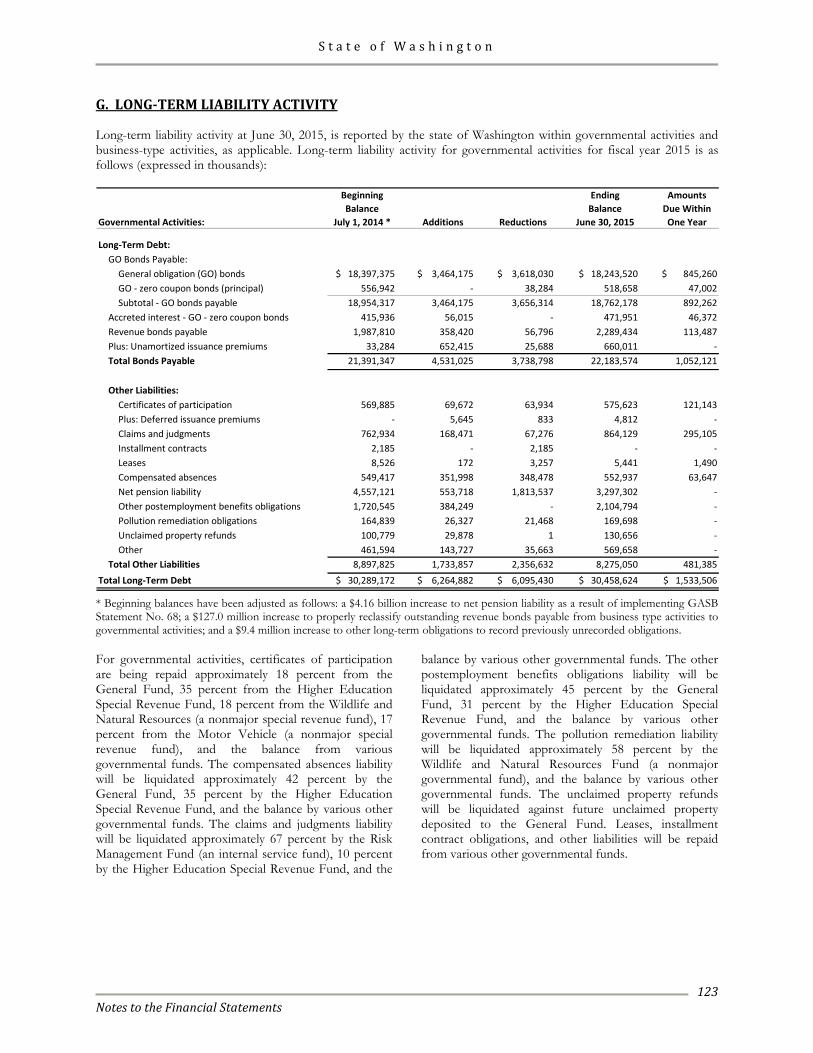
S t a t e o f W a s h i n g t o n
Notes to the Financial Statements
123
G. LONG-TERM LIABILITY ACTIVITY Long-term liability activity at June 30, 2015, is reported by the state of Washington within governmental activities and business-type activities, as applicable. Long-term liability activity for governmental activities for fiscal year 2015 is as follows (expressed in thousands):
Beginning Ending AmountsBalance Balance Due Within
Governmental Activities: July 1, 2014 * Additions Reductions June 30, 2015 One Year
Long-Term Debt:GO Bonds Payable:
General obligation (GO) bonds $ 18,397,375 $ 3,464,175 $ 3,618,030 $ 18,243,520 $ 845,260 GO - zero coupon bonds (principal) 556,942 - 38,284 518,658 47,002 Subtotal - GO bonds payable 18,954,317 3,464,175 3,656,314 18,762,178 892,262
Accreted interest - GO - zero coupon bonds 415,936 56,015 - 471,951 46,372 Revenue bonds payable 1,987,810 358,420 56,796 2,289,434 113,487 Plus: Unamortized issuance premiums 33,284 652,415 25,688 660,011 - Total Bonds Payable 21,391,347 4,531,025 3,738,798 22,183,574 1,052,121
Other Liabilities:Certificates of participation 569,885 69,672 63,934 575,623 121,143 Plus: Deferred issuance premiums - 5,645 833 4,812 - Claims and judgments 762,934 168,471 67,276 864,129 295,105 Installment contracts 2,185 - 2,185 - - Leases 8,526 172 3,257 5,441 1,490 Compensated absences 549,417 351,998 348,478 552,937 63,647 Net pension liability 4,557,121 553,718 1,813,537 3,297,302 - Other postemployment benefits obligations 1,720,545 384,249 - 2,104,794 - Pollution remediation obligations 164,839 26,327 21,468 169,698 - Unclaimed property refunds 100,779 29,878 1 130,656 - Other 461,594 143,727 35,663 569,658 -
Total Other Liabilities 8,897,825 1,733,857 2,356,632 8,275,050 481,385 Total Long-Term Debt $ 30,289,172 $ 6,264,882 $ 6,095,430 $ 30,458,624 $ 1,533,506
* Beginning balances have been adjusted as follows: a $4.16 billion increase to net pension liability as a result of implementing GASB Statement No. 68; a $127.0 million increase to properly reclassify outstanding revenue bonds payable from business type activities to governmental activities; and a $9.4 million increase to other long-term obligations to record previously unrecorded obligations. For governmental activities, certificates of participation are being repaid approximately 18 percent from the General Fund, 35 percent from the Higher Education Special Revenue Fund, 18 percent from the Wildlife and Natural Resources (a nonmajor special revenue fund), 17 percent from the Motor Vehicle (a nonmajor special revenue fund), and the balance from various governmental funds. The compensated absences liability will be liquidated approximately 42 percent by the General Fund, 35 percent by the Higher Education Special Revenue Fund, and the balance by various other governmental funds. The claims and judgments liability will be liquidated approximately 67 percent by the Risk Management Fund (an internal service fund), 10 percent by the Higher Education Special Revenue Fund, and the
balance by various other governmental funds. The other postemployment benefits obligations liability will be liquidated approximately 45 percent by the General Fund, 31 percent by the Higher Education Special Revenue Fund, and the balance by various other governmental funds. The pollution remediation liability will be liquidated approximately 58 percent by the Wildlife and Natural Resources Fund (a nonmajor governmental fund), and the balance by various other governmental funds. The unclaimed property refunds will be liquidated against future unclaimed property deposited to the General Fund. Leases, installment contract obligations, and other liabilities will be repaid from various other governmental funds.
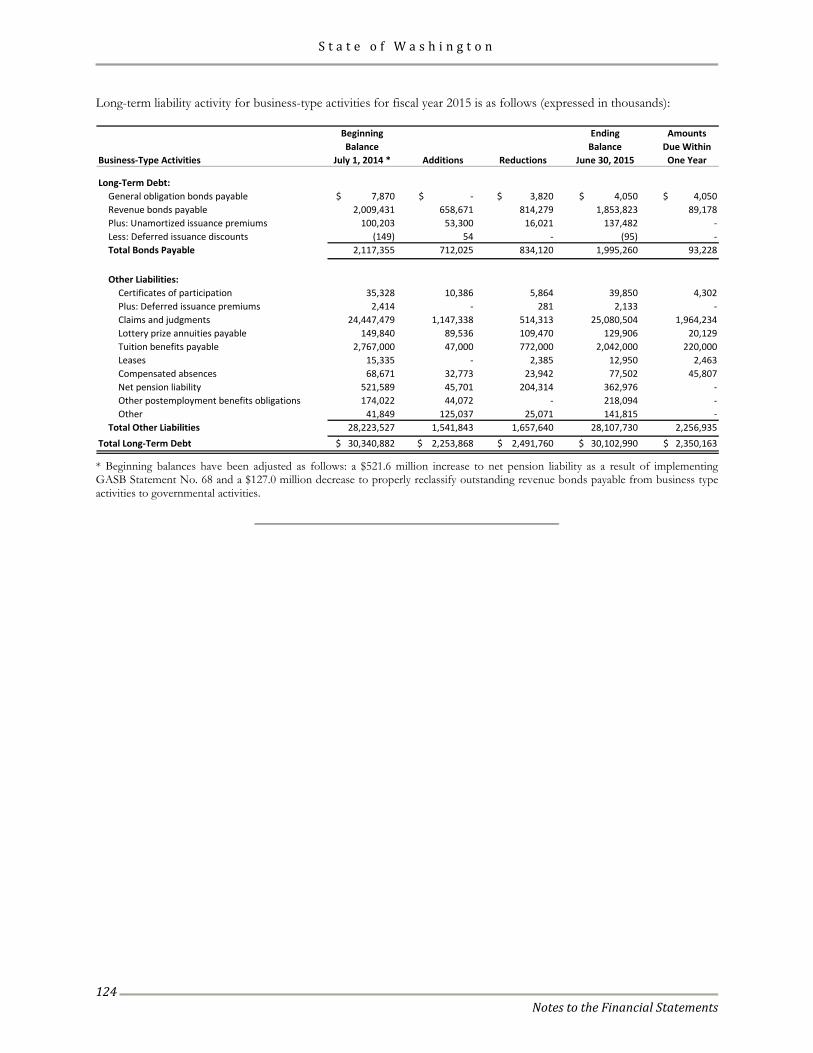
S t a t e o f W a s h i n g t o n
Notes to the Financial Statements
124
Long-term liability activity for business-type activities for fiscal year 2015 is as follows (expressed in thousands):
Beginning Ending AmountsBalance Balance Due Within
Business-Type Activities July 1, 2014 * Additions Reductions June 30, 2015 One Year
Long-Term Debt:General obligation bonds payable $ 7,870 $ - $ 3,820 $ 4,050 $ 4,050 Revenue bonds payable 2,009,431 658,671 814,279 1,853,823 89,178 Plus: Unamortized issuance premiums 100,203 53,300 16,021 137,482 - Less: Deferred issuance discounts (149) 54 - (95) - Total Bonds Payable 2,117,355 712,025 834,120 1,995,260 93,228
Other Liabilities:Certificates of participation 35,328 10,386 5,864 39,850 4,302 Plus: Deferred issuance premiums 2,414 - 281 2,133 - Claims and judgments 24,447,479 1,147,338 514,313 25,080,504 1,964,234 Lottery prize annuities payable 149,840 89,536 109,470 129,906 20,129 Tuition benefits payable 2,767,000 47,000 772,000 2,042,000 220,000 Leases 15,335 - 2,385 12,950 2,463 Compensated absences 68,671 32,773 23,942 77,502 45,807 Net pension liability 521,589 45,701 204,314 362,976 - Other postemployment benefits obligations 174,022 44,072 - 218,094 - Other 41,849 125,037 25,071 141,815 -
Total Other Liabilities 28,223,527 1,541,843 1,657,640 28,107,730 2,256,935 Total Long-Term Debt $ 30,340,882 $ 2,253,868 $ 2,491,760 $ 30,102,990 $ 2,350,163
* Beginning balances have been adjusted as follows: a $521.6 million increase to net pension liability as a result of implementing GASB Statement No. 68 and a $127.0 million decrease to properly reclassify outstanding revenue bonds payable from business type activities to governmental activities.
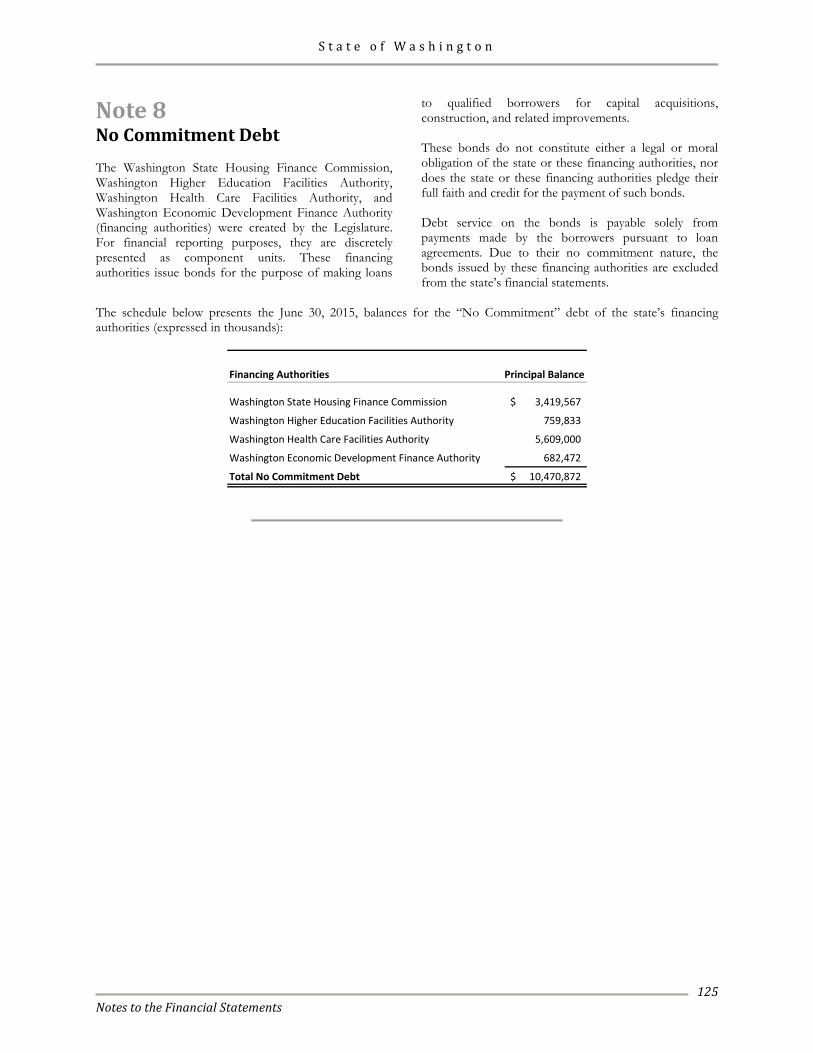
S t a t e o f W a s h i n g t o n
Notes to the Financial Statements
125
Note 8 No Commitment Debt The Washington State Housing Finance Commission, Washington Higher Education Facilities Authority, Washington Health Care Facilities Authority, and Washington Economic Development Finance Authority (financing authorities) were created by the Legislature. For financial reporting purposes, they are discretely presented as component units. These financing authorities issue bonds for the purpose of making loans
to qualified borrowers for capital acquisitions, construction, and related improvements. These bonds do not constitute either a legal or moral obligation of the state or these financing authorities, nor does the state or these financing authorities pledge their full faith and credit for the payment of such bonds. Debt service on the bonds is payable solely from payments made by the borrowers pursuant to loan agreements. Due to their no commitment nature, the bonds issued by these financing authorities are excluded from the state’s financial statements.
The schedule below presents the June 30, 2015, balances for the “No Commitment” debt of the state’s financing authorities (expressed in thousands):
Financing Authorities Principal Balance
Washington State Housing Finance Commission 3,419,567$
Washington Higher Education Facilities Authority 759,833
Washington Health Care Facilities Authority 5,609,000
Washington Economic Development Finance Authority 682,472
Total No Commitment Debt 10,470,872$
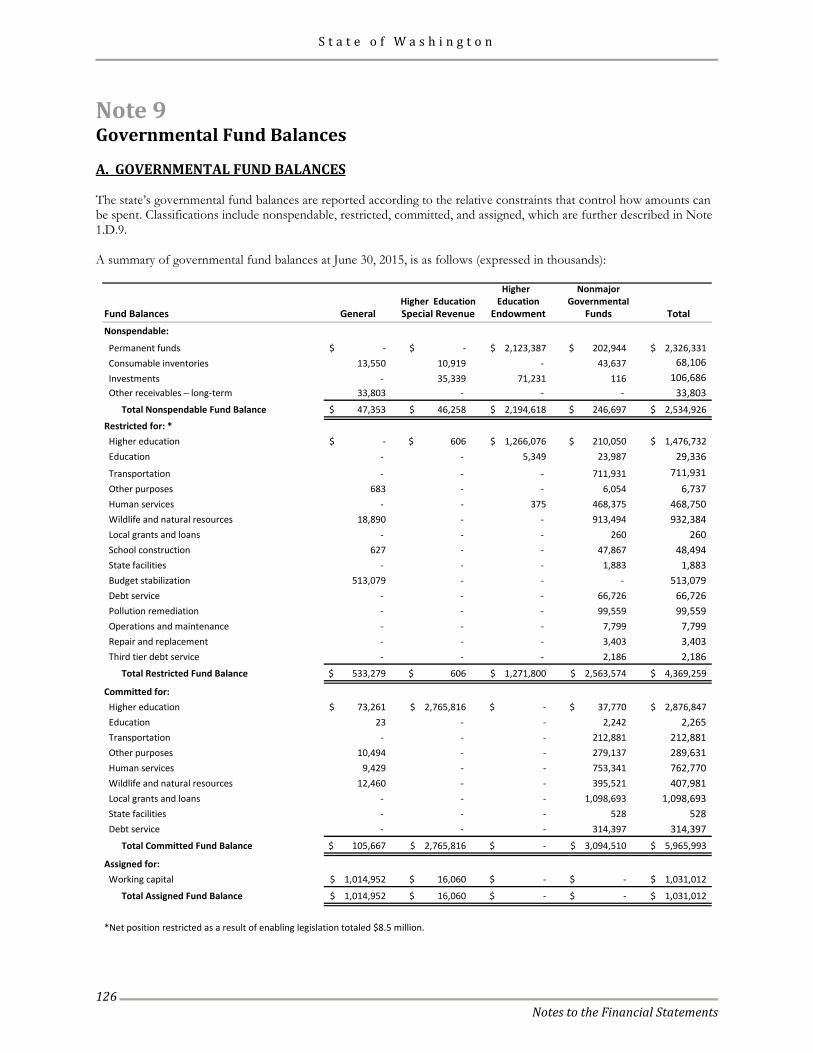
S t a t e o f W a s h i n g t o n
Notes to the Financial Statements
126
Note 9 Governmental Fund Balances A. GOVERNMENTAL FUND BALANCES The state’s governmental fund balances are reported according to the relative constraints that control how amounts can be spent. Classifications include nonspendable, restricted, committed, and assigned, which are further described in Note 1.D.9. A summary of governmental fund balances at June 30, 2015, is as follows (expressed in thousands):
Higher NonmajorHigher Education Education Governmental
Fund Balances General Special Revenue Endowment Funds TotalNonspendable:
Permanent funds -$ -$ 2,123,387$ 202,944$ 2,326,331$ Consumable inventories 13,550 10,919 - 43,637 68,106 Investments - 35,339 71,231 116 106,686 Other receivables – long-term 33,803 - - - 33,803
Total Nonspendable Fund Balance 47,353$ 46,258$ 2,194,618$ 246,697$ 2,534,926$
Restricted for: * Higher education -$ 606$ 1,266,076$ 210,050$ 1,476,732$ Education - - 5,349 23,987 29,336 Transportation - - - 711,931 711,931 Other purposes 683 - - 6,054 6,737 Human services - - 375 468,375 468,750 Wildlife and natural resources 18,890 - - 913,494 932,384 Local grants and loans - - - 260 260 School construction 627 - - 47,867 48,494 State facilities - - - 1,883 1,883 Budget stabilization 513,079 - - - 513,079 Debt service - - - 66,726 66,726 Pollution remediation - - - 99,559 99,559 Operations and maintenance - - - 7,799 7,799 Repair and replacement - - - 3,403 3,403 Third tier debt service - - - 2,186 2,186
Total Restricted Fund Balance 533,279$ 606$ 1,271,800$ 2,563,574$ 4,369,259$
Committed for: Higher education 73,261$ 2,765,816$ -$ 37,770$ 2,876,847$ Education 23 - - 2,242 2,265 Transportation - - - 212,881 212,881 Other purposes 10,494 - - 279,137 289,631 Human services 9,429 - - 753,341 762,770 Wildlife and natural resources 12,460 - - 395,521 407,981 Local grants and loans - - - 1,098,693 1,098,693 State facilities - - - 528 528 Debt service - - - 314,397 314,397
Total Committed Fund Balance 105,667$ 2,765,816$ -$ 3,094,510$ 5,965,993$
Assigned for: Working capital 1,014,952$ 16,060$ -$ -$ 1,031,012$
Total Assigned Fund Balance 1,014,952$ 16,060$ -$ -$ 1,031,012$
*Net position restricted as a result of enabling legislation totaled $8.5 million.
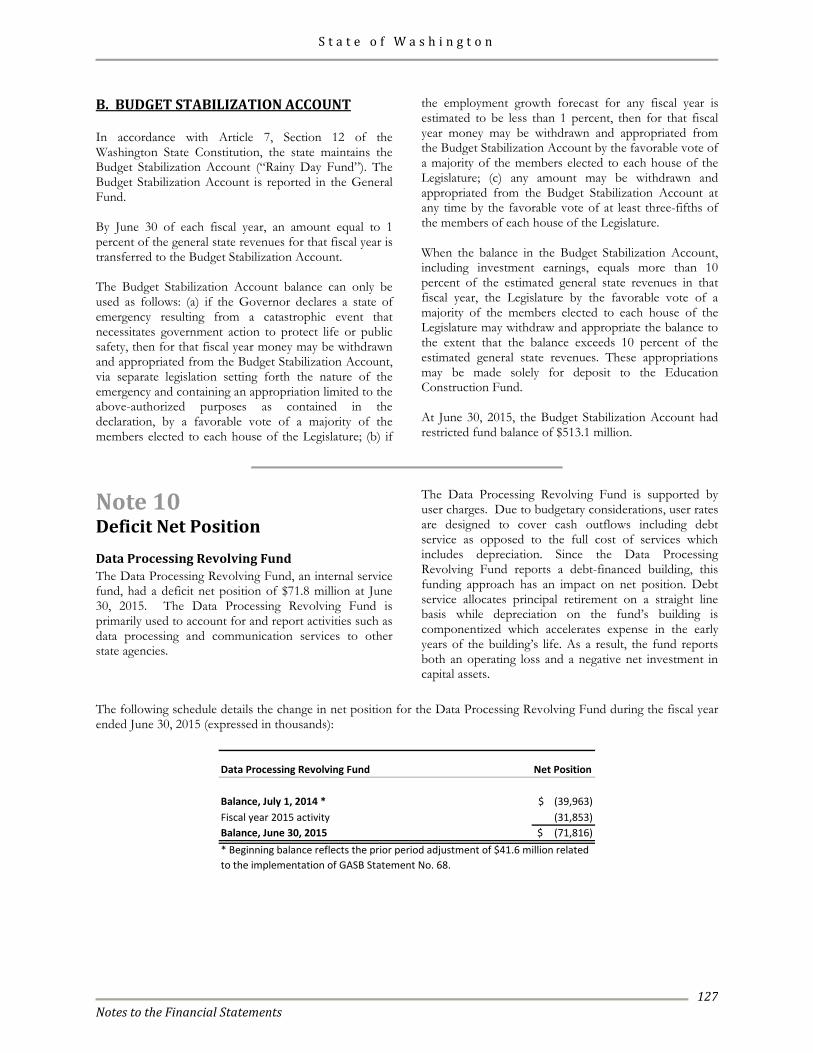
S t a t e o f W a s h i n g t o n
Notes to the Financial Statements
127
B. BUDGET STABILIZATION ACCOUNT In accordance with Article 7, Section 12 of the Washington State Constitution, the state maintains the Budget Stabilization Account (“Rainy Day Fund”). The Budget Stabilization Account is reported in the General Fund. By June 30 of each fiscal year, an amount equal to 1 percent of the general state revenues for that fiscal year is transferred to the Budget Stabilization Account. The Budget Stabilization Account balance can only be used as follows: (a) if the Governor declares a state of emergency resulting from a catastrophic event that necessitates government action to protect life or public safety, then for that fiscal year money may be withdrawn and appropriated from the Budget Stabilization Account, via separate legislation setting forth the nature of the emergency and containing an appropriation limited to the above-authorized purposes as contained in the declaration, by a favorable vote of a majority of the members elected to each house of the Legislature; (b) if
the employment growth forecast for any fiscal year is estimated to be less than 1 percent, then for that fiscal year money may be withdrawn and appropriated from the Budget Stabilization Account by the favorable vote of a majority of the members elected to each house of the Legislature; (c) any amount may be withdrawn and appropriated from the Budget Stabilization Account at any time by the favorable vote of at least three-fifths of the members of each house of the Legislature. When the balance in the Budget Stabilization Account, including investment earnings, equals more than 10 percent of the estimated general state revenues in that fiscal year, the Legislature by the favorable vote of a majority of the members elected to each house of the Legislature may withdraw and appropriate the balance to the extent that the balance exceeds 10 percent of the estimated general state revenues. These appropriations may be made solely for deposit to the Education Construction Fund. At June 30, 2015, the Budget Stabilization Account had restricted fund balance of $513.1 million.
Note 10 Deficit Net Position Data Processing Revolving Fund The Data Processing Revolving Fund, an internal service fund, had a deficit net position of $71.8 million at June 30, 2015. The Data Processing Revolving Fund is primarily used to account for and report activities such as data processing and communication services to other state agencies.
The Data Processing Revolving Fund is supported by user charges. Due to budgetary considerations, user rates are designed to cover cash outflows including debt service as opposed to the full cost of services which includes depreciation. Since the Data Processing Revolving Fund reports a debt-financed building, this funding approach has an impact on net position. Debt service allocates principal retirement on a straight line basis while depreciation on the fund’s building is componentized which accelerates expense in the early years of the building’s life. As a result, the fund reports both an operating loss and a negative net investment in capital assets.
The following schedule details the change in net position for the Data Processing Revolving Fund during the fiscal year ended June 30, 2015 (expressed in thousands):
Data Processing Revolving Fund Net Position
Balance, July 1, 2014 * (39,963)$ Fiscal year 2015 activity (31,853) Balance, June 30, 2015 (71,816)$ * Beginning balance reflects the prior period adjustment of $41.6 million related to the implementation of GASB Statement No. 68.
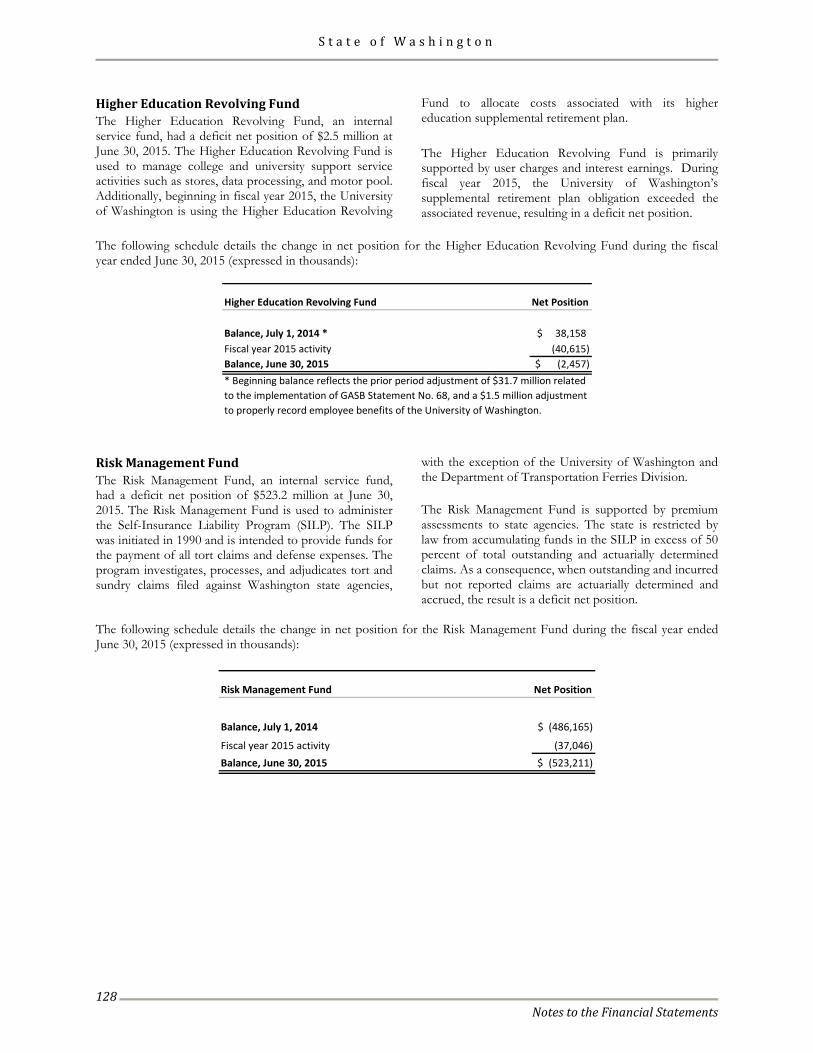
S t a t e o f W a s h i n g t o n
Notes to the Financial Statements
128
Higher Education Revolving Fund The Higher Education Revolving Fund, an internal service fund, had a deficit net position of $2.5 million at June 30, 2015. The Higher Education Revolving Fund is used to manage college and university support service activities such as stores, data processing, and motor pool. Additionally, beginning in fiscal year 2015, the University of Washington is using the Higher Education Revolving
Fund to allocate costs associated with its higher education supplemental retirement plan. The Higher Education Revolving Fund is primarily supported by user charges and interest earnings. During fiscal year 2015, the University of Washington’s supplemental retirement plan obligation exceeded the associated revenue, resulting in a deficit net position.
The following schedule details the change in net position for the Higher Education Revolving Fund during the fiscal year ended June 30, 2015 (expressed in thousands):
Higher Education Revolving Fund Net Position
Balance, July 1, 2014 * 38,158$ Fiscal year 2015 activity (40,615) Balance, June 30, 2015 (2,457)$ * Beginning balance reflects the prior period adjustment of $31.7 million related to the implementation of GASB Statement No. 68, and a $1.5 million adjustment to properly record employee benefits of the University of Washington.
Risk Management Fund The Risk Management Fund, an internal service fund, had a deficit net position of $523.2 million at June 30, 2015. The Risk Management Fund is used to administer the Self-Insurance Liability Program (SILP). The SILP was initiated in 1990 and is intended to provide funds for the payment of all tort claims and defense expenses. The program investigates, processes, and adjudicates tort and sundry claims filed against Washington state agencies,
with the exception of the University of Washington and the Department of Transportation Ferries Division. The Risk Management Fund is supported by premium assessments to state agencies. The state is restricted by law from accumulating funds in the SILP in excess of 50 percent of total outstanding and actuarially determined claims. As a consequence, when outstanding and incurred but not reported claims are actuarially determined and accrued, the result is a deficit net position.
The following schedule details the change in net position for the Risk Management Fund during the fiscal year ended June 30, 2015 (expressed in thousands):
Risk Management Fund Net Position
Balance, July 1, 2014 (486,165)$
Fiscal year 2015 activity (37,046) Balance, June 30, 2015 (523,211)$
S t a t e o f W a s h i n g t o n
Notes to the Financial Statements
129
State Facilities Fund The State Facilities Fund, a capital projects fund, had a deficit fund balance of $165.5 million at June 30, 2015. The State Facilities Fund is used to pay for various capital projects throughout the state.
The State Facilities Fund is primarily supported by bond proceeds, income from property, and sales of property. Costs were incurred during fiscal year 2015 but the bonds to support these projects were not issued until after June 30, 2015, resulting in a deficit fund balance.
The following schedule details the change in fund balance for the State Facilities Fund during the fiscal year ended June 30, 2015 (expressed in thousands):
State Facilities Fund Net Position
Balance, July 1, 2014 * 210,592$ Fiscal year 2015 activity (376,065) Balance, June 30, 2015 (165,473)$ * Beginning balance reflects the prior period adjustment of $14.4 million due to a fund reclassification.
S t a t e o f W a s h i n g t o n
Notes to the Financial Statements
130
Note 11 Retirement Plans A. GENERAL The state implemented Statement No. 68 of the Governmental Accounting Standards Board (GASB) Accounting and Financial Reporting for Pensions for the fiscal year 2015 financial reporting. Washington’s pension plans were created by statutes rather than through trust documents. With the exception of the supplemental defined benefit component of the higher education retirement plan, they are administered in a way equivalent to pension trust arrangements as defined by the GASB. In accordance with Statement No. 68, the state has elected to use the prior fiscal year end as the measurement date for reporting net pension liabilities. The state Legislature establishes and amends laws pertaining to the creation and administration of all state public retirement systems. Additionally the state Legislature authorizes state agency participation in plans other than those administered by the state. Basis of Accounting. Pension plans administered by the state are accounted for using the accrual basis of accounting. Under the accrual basis of accounting, employee and employer contributions are recognized in the period in which employee services are performed; investment gains and losses are recognized as incurred; and benefits and refunds are recognized when due and payable in accordance with the terms of the applicable plan. For purposes of measuring the net pension liability, deferred outflows of resources and deferred inflows of resources related to pensions, and pension expense, information about the fiduciary net position of all plans and additions to/deductions from all plan fiduciary net position have been determined in all material respects on the same basis as they are reported by the plans. The following table represents the aggregate pension amounts for all plans subject to the requirements of GASB Statement No. 68 for the state as an employer, for fiscal year 2015, expressed in thousands:
Pension liabilities 3,252,383$ Pension assets (1,625,168)$ Deferred outflows of resources related to pensions 524,011$ Deferred inflows of resources related to pensions 2,101,352$ Pension expense/expenditures 143,218$
Aggregate Pension Amounts - All Plans
Investments. The Washington State Investment Board (WSIB) has been authorized by statute as having investment management responsibility for the pension funds. The WSIB manages retirement fund assets to maximize return at a prudent level of risk. Retirement funds are invested in the Commingled Trust Fund (CTF). Established on July 1, 1992, the CTF is a diversified pool of investments that invests in fixed income, public equity, private equity, real estate, and tangible assets. Investment decisions are made within the framework of a Strategic Asset Allocation Policy and a series of written WSIB-adopted investment policies for the various asset classes in which the WSIB invests. Further information about the investment of pension funds by the WSIB, their valuation, classifications, concentrations, and maturities can be found in Note 3B. Department of Retirement Systems. As established in chapter 41.50 of the Revised Code of Washington (RCW), the Department of Retirement Systems (DRS) administers eight retirement systems covering eligible employees of the state and local governments. The Governor appoints the director of the DRS. The DRS administered systems are comprised of 12 defined benefit pension plans and three defined benefit/defined contribution plans as follows: • Public Employees’ Retirement System (PERS)
Plan 1 - defined benefit Plan 2 - defined benefit Plan 3 - defined benefit/defined contribution
• Teachers’ Retirement System (TRS) Plan 1 - defined benefit Plan 2 - defined benefit Plan 3 - defined benefit/defined contribution
S t a t e o f W a s h i n g t o n
Notes to the Financial Statements
131
• School Employees’ Retirement System (SERS) Plan 2 - defined benefit Plan 3 - defined benefit/defined contribution
• Law Enforcement Officers’ and Fire Fighters’
Retirement System (LEOFF) Plan 1 - defined benefit Plan 2 - defined benefit
• Public Safety Employees’ Retirement System (PSERS)
Plan 2 - defined benefit
• Washington State Patrol Retirement System (WSPRS) Plan 1 - defined benefit Plan 2 - defined benefit
• Judicial Retirement System (JRS) Defined benefit plan
• Judges’ Retirement Fund (Judges)
Defined benefit plan
Although some assets of the plans are commingled for investment purposes, each plan’s assets may be used only for the payment of benefits to the members of that plan in accordance with the terms of the plan. Administration of the PERS, TRS, SERS, LEOFF, PSERS, and WSPRS, systems and plans was funded by an employer rate of 0.18 percent of employee salaries. Administration of the JRS and Judges plans is funded by means of legislative appropriations. Pursuant to RCW 41.50.770, the state offers its employees and employees of those political subdivisions that elect to participate, a deferred compensation program in accordance with Internal Revenue Code Section 457. The deferred compensation is not available to employees until termination, retirement, disability, death, or unforeseeable financial emergency. This deferred compensation plan is administered by the DRS. The DRS prepares a stand-alone financial report that is compliant with the requirements of Statement 67 of the GASB. Copies of the report may be obtained by contacting the Washington State Department of Retirement Systems, PO Box 48380, Olympia, Washington 98504-8380 or online at http://www.drs.wa.gov/administration/annual-report/. State Board for Volunteer Fire Fighters and Reserve Officers. As established in chapter 41.24 RCW, the State Board for Volunteer Fire Fighters and Reserve Officers administers the Volunteer Fire
Fighters’ and Reserve Officers’ Relief and Pension Fund (VFFRPF), a defined benefit plan. Administration of VFFRPF is funded through legislative appropriation. Administrative Office of the Courts. As established in chapter 2.14 RCW, the Administrative Office of the Courts administers the Judicial Retirement Account (JRA), a defined contribution plan. Administration of JRA is funded through member fees. Higher Education. As established in chapter 28B.10 RCW, eligible higher education state employees may participate in higher education retirement plans. These plans include a defined contribution plan administered by a third party with a supplemental defined benefit component (on a pay as you go basis) which is administered by the state. B. STATE PARTICIPATION IN PLANS ADMINISTERED BY DRS
1. DRS Plans – Employer Disclosures
The state is not an employer in SERS Plan 2/3 nor LEOFF Plan 1. Public Employees’ Retirement System Plan Description. The Legislature established the Public Employees’ Retirement System (PERS) in 1947. PERS retirement benefit provisions are established in chapters 41.34 and 41.40 RCW and may be amended only by the Legislature. Membership in the system includes: elected officials; state employees; employees of the Supreme, Appeals, and Superior Courts (other than judges currently in a judicial retirement system); employees of legislative committees; community and technical colleges, college and university employees not in national higher education retirement programs; judges of district and municipal courts; and employees of local governments. PERS is a cost-sharing, multiple-employer retirement system comprised of three separate plans for membership purposes: Plans 1 and 2 are defined benefit plans and Plan 3 is a combination defined benefit/defined contribution plan. Although members can only be a member of either Plan 2 or Plan 3, the defined benefit portions of Plan 2 and Plan 3 are accounted for in the same pension trust fund. All assets of this Plan 2/3 defined benefit plan may legally be used to pay the defined benefits of any of the Plan 2 or Plan 3 members or beneficiaries, as defined by the terms of the plan. Therefore, Plan 2/3 is considered a single defined benefit plan for reporting purposes. Plan
S t a t e o f W a s h i n g t o n
Notes to the Financial Statements
132
3 accounts for the defined contribution portion of benefits for Plan 3 members. PERS members who joined the system by September 30, 1977, are Plan 1 members. Plan 1 is closed to new entrants. Those who joined on or after October 1, 1977, and by either, February 28, 2002, for state and higher education employees, or August 31, 2002, for local government employees, are Plan 2 members unless they exercised an option to transfer their membership to PERS Plan 3. PERS participants joining the system on or after March 1, 2002, for state and higher education employees, or September 1, 2002, for local government employees, have the irrevocable option of choosing membership in either PERS Plan 2 or PERS Plan 3. The option must be exercised within 90 days of employment. Employees who fail to choose within 90 days default to PERS Plan 3. Refer to section E of this note for a description of the defined contribution component of PERS Plan 3. Benefits Provided. PERS plans provide retirement, disability, and death benefits to eligible members. PERS Plan 1 members are vested after the completion of five years of eligible service. Plan 1 members are eligible for retirement after 30 years of service, or at the age of 60 with five years of service, or at the age of 55 with 25 years of service. The monthly benefit is 2 percent of the average final compensation (AFC) per year of service, capped at 60 percent. The AFC is the average of the member’s 24 highest consecutive service months. PERS Plan 1 members retiring from inactive status prior to the age of 65 may receive actuarially reduced benefits. Plan 1 members may elect to receive an optional cost of living allowance (COLA) that provides an automatic annual adjustment based on the Consumer Price Index. The adjustment is capped at 3 percent annually. To offset the cost of this annual adjustment, the benefit is reduced. A member with five years of covered employment is eligible for non-duty disability retirement. Prior to the age of 55, the benefit amount is 2 percent of the AFC for each year of service. This is reduced by 2 percent for each year that the member’s age is less than 55. The total benefit is limited to 60 percent of the AFC. Plan 1 members may elect to receive an optional COLA amount based on the Consumer Price Index, capped at 3 percent annually. To offset the cost of this annual adjustment, the benefit is reduced.
PERS Plan 2 members are vested after completing five years of eligible service. Plan 2 members are eligible for normal retirement at the age of 65 with five years of service. The monthly benefit is 2 percent of the AFC per year of service. There is no cap on years of service credit and a COLA is granted based on the Consumer Price Index, capped at 3 percent annually. The AFC is the average of the member’s 60 highest paid consecutive months. PERS Plan 2 members have the option to retire early with reduced benefits. The defined benefit portion of PERS Plan 3 provides members a monthly benefit that is 1 percent of the AFC per year of service. There is no cap on years of service credit. Plan 3 provides the same COLA as Plan 2. The AFC is the average of the member’s 60 highest paid consecutive months. Effective June 7, 2006, PERS Plan 3 members are vested in the defined benefit portion of their plan after 10 years of service; or after five years of service, if 12 months of that service are earned after age 44; or after five service credit years earned in PERS Plan 2 by June 1, 2003. Plan 3 members are immediately vested in the defined contribution portion of their plan. PERS Plan 3 members have the option to retire early with reduced benefits. PERS members meeting specific eligibility requirements have options available to enhance their retirement benefits. Some of these options are available to their survivors, with reduced benefits. The Judicial Benefit Multiplier (JBM) Program began January 1, 2007. This program gave eligible justices and judges an option to increase the benefit multiplier used in their retirement benefit calculation for their judicial service periods of employement. Beginning January 1, 2007, any justice or judge who was in a judicial position at that time could chose to join JBM. Any justice or judge elected or appointed to office on or after January 1, 2007, who elects to join DRS membership will also be mandated into JBM. If they have already established memebership in PERS or TRS Plan 1 they will rejoin that plan, but if they have never had membership they will be enrolled as a member of both PERS Plan 2 and JBM. Contributions. PERS defined benefit retirement benefits are financed from a combination of investment earnings and employer and employee contributions.
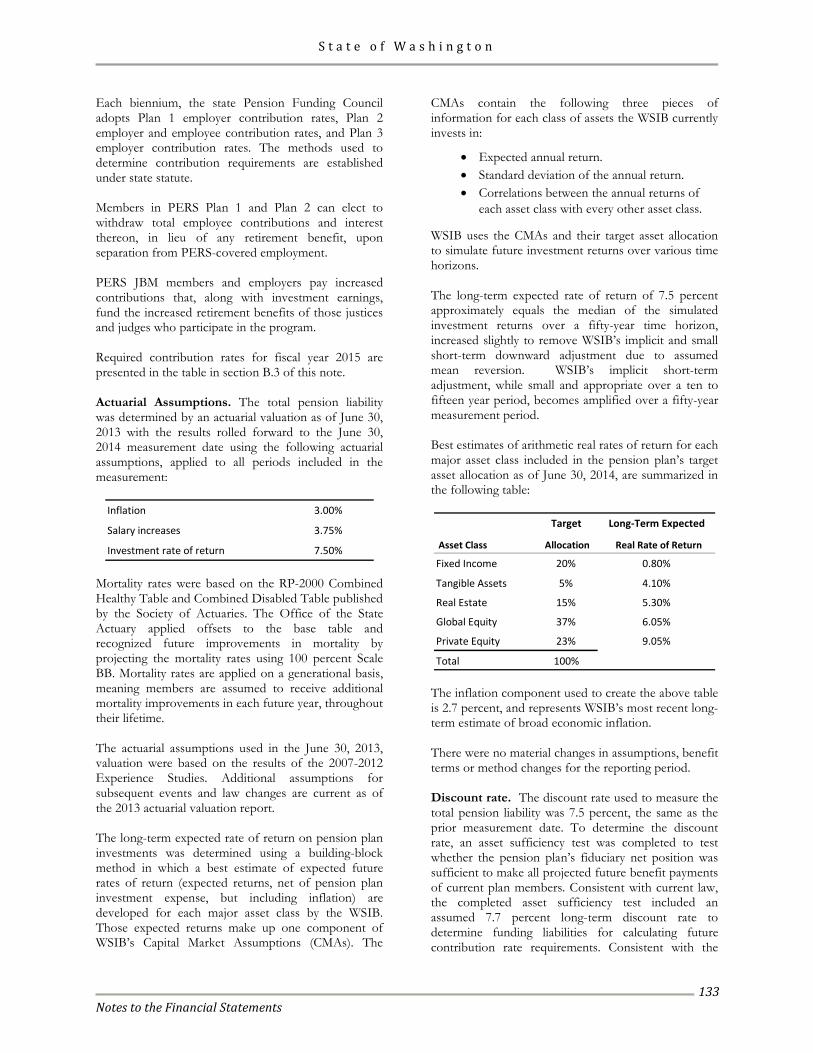
S t a t e o f W a s h i n g t o n
Notes to the Financial Statements
133
Each biennium, the state Pension Funding Council adopts Plan 1 employer contribution rates, Plan 2 employer and employee contribution rates, and Plan 3 employer contribution rates. The methods used to determine contribution requirements are established under state statute. Members in PERS Plan 1 and Plan 2 can elect to withdraw total employee contributions and interest thereon, in lieu of any retirement benefit, upon separation from PERS-covered employment. PERS JBM members and employers pay increased contributions that, along with investment earnings, fund the increased retirement benefits of those justices and judges who participate in the program. Required contribution rates for fiscal year 2015 are presented in the table in section B.3 of this note. Actuarial Assumptions. The total pension liability was determined by an actuarial valuation as of June 30, 2013 with the results rolled forward to the June 30, 2014 measurement date using the following actuarial assumptions, applied to all periods included in the measurement:
Inflation 3.00%
Salary increases 3.75%
Investment rate of return 7.50% Mortality rates were based on the RP-2000 Combined Healthy Table and Combined Disabled Table published by the Society of Actuaries. The Office of the State Actuary applied offsets to the base table and recognized future improvements in mortality by projecting the mortality rates using 100 percent Scale BB. Mortality rates are applied on a generational basis, meaning members are assumed to receive additional mortality improvements in each future year, throughout their lifetime. The actuarial assumptions used in the June 30, 2013, valuation were based on the results of the 2007-2012 Experience Studies. Additional assumptions for subsequent events and law changes are current as of the 2013 actuarial valuation report. The long-term expected rate of return on pension plan investments was determined using a building-block method in which a best estimate of expected future rates of return (expected returns, net of pension plan investment expense, but including inflation) are developed for each major asset class by the WSIB. Those expected returns make up one component of WSIB’s Capital Market Assumptions (CMAs). The
CMAs contain the following three pieces of information for each class of assets the WSIB currently invests in:
• Expected annual return. • Standard deviation of the annual return. • Correlations between the annual returns of
each asset class with every other asset class.
WSIB uses the CMAs and their target asset allocation to simulate future investment returns over various time horizons. The long-term expected rate of return of 7.5 percent approximately equals the median of the simulated investment returns over a fifty-year time horizon, increased slightly to remove WSIB’s implicit and small short-term downward adjustment due to assumed mean reversion. WSIB’s implicit short-term adjustment, while small and appropriate over a ten to fifteen year period, becomes amplified over a fifty-year measurement period. Best estimates of arithmetic real rates of return for each major asset class included in the pension plan’s target asset allocation as of June 30, 2014, are summarized in the following table:
Target Long-Term Expected
Asset Class Allocation Real Rate of Return
Fixed Income 20% 0.80%
Tangible Assets 5% 4.10%
Real Estate 15% 5.30%
Global Equity 37% 6.05%
Private Equity 23% 9.05%
Total 100% The inflation component used to create the above table is 2.7 percent, and represents WSIB’s most recent long-term estimate of broad economic inflation. There were no material changes in assumptions, benefit terms or method changes for the reporting period. Discount rate. The discount rate used to measure the total pension liability was 7.5 percent, the same as the prior measurement date. To determine the discount rate, an asset sufficiency test was completed to test whether the pension plan’s fiduciary net position was sufficient to make all projected future benefit payments of current plan members. Consistent with current law, the completed asset sufficiency test included an assumed 7.7 percent long-term discount rate to determine funding liabilities for calculating future contribution rate requirements. Consistent with the
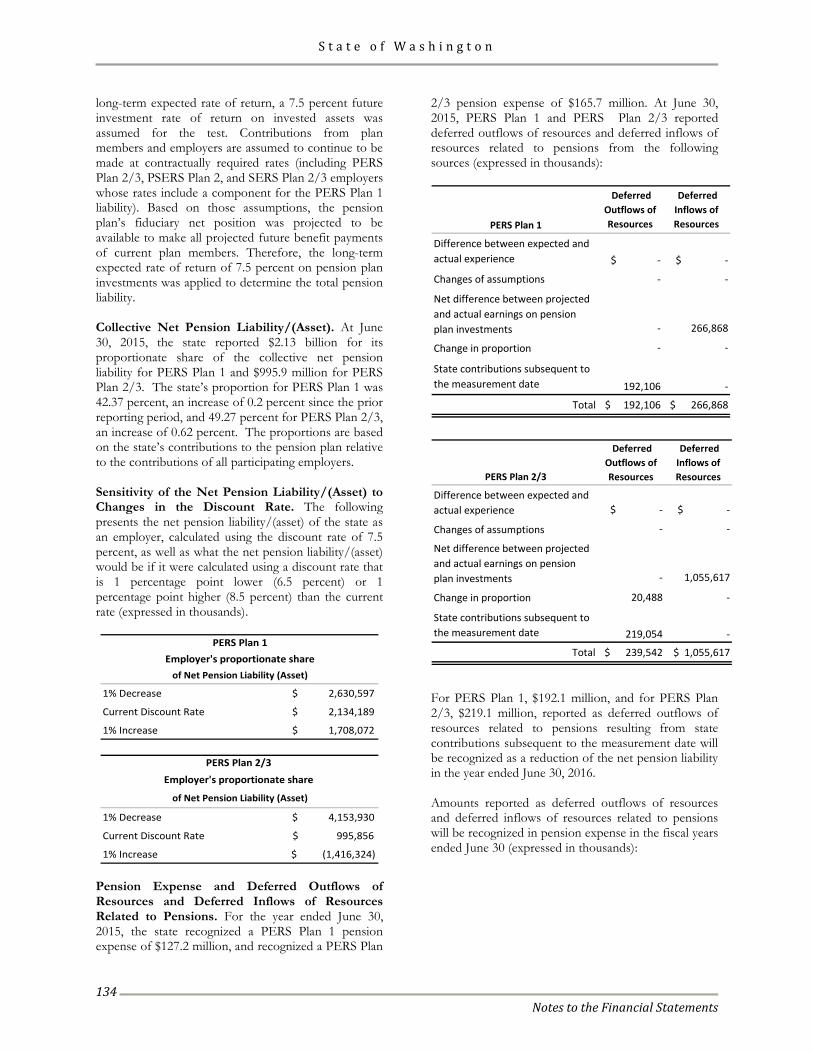
S t a t e o f W a s h i n g t o n
Notes to the Financial Statements
134
long-term expected rate of return, a 7.5 percent future investment rate of return on invested assets was assumed for the test. Contributions from plan members and employers are assumed to continue to be made at contractually required rates (including PERS Plan 2/3, PSERS Plan 2, and SERS Plan 2/3 employers whose rates include a component for the PERS Plan 1 liability). Based on those assumptions, the pension plan’s fiduciary net position was projected to be available to make all projected future benefit payments of current plan members. Therefore, the long-term expected rate of return of 7.5 percent on pension plan investments was applied to determine the total pension liability. Collective Net Pension Liability/(Asset). At June 30, 2015, the state reported $2.13 billion for its proportionate share of the collective net pension liability for PERS Plan 1 and $995.9 million for PERS Plan 2/3. The state’s proportion for PERS Plan 1 was 42.37 percent, an increase of 0.2 percent since the prior reporting period, and 49.27 percent for PERS Plan 2/3, an increase of 0.62 percent. The proportions are based on the state’s contributions to the pension plan relative to the contributions of all participating employers. Sensitivity of the Net Pension Liability/(Asset) to Changes in the Discount Rate. The following presents the net pension liability/(asset) of the state as an employer, calculated using the discount rate of 7.5 percent, as well as what the net pension liability/(asset) would be if it were calculated using a discount rate that is 1 percentage point lower (6.5 percent) or 1 percentage point higher (8.5 percent) than the current rate (expressed in thousands).
1% Decrease $ 2,630,597
Current Discount Rate $ 2,134,189
1% Increase $ 1,708,072
of Net Pension Liability (Asset)
PERS Plan 1Employer's proportionate share
1% Decrease $ 4,153,930
Current Discount Rate $ 995,856
1% Increase $ (1,416,324)
of Net Pension Liability (Asset)
Employer's proportionate share PERS Plan 2/3
Pension Expense and Deferred Outflows of Resources and Deferred Inflows of Resources Related to Pensions. For the year ended June 30, 2015, the state recognized a PERS Plan 1 pension expense of $127.2 million, and recognized a PERS Plan
2/3 pension expense of $165.7 million. At June 30, 2015, PERS Plan 1 and PERS Plan 2/3 reported deferred outflows of resources and deferred inflows of resources related to pensions from the following sources (expressed in thousands):
PERS Plan 1
Deferred Outflows of Resources
Deferred Inflows of Resources
Difference between expected and actual experience $ - $ -
Changes of assumptions - -
Net difference between projected and actual earnings on pension plan investments - 266,868
Change in proportion - -
State contributions subsequent to the measurement date 192,106 -
Total $ 192,106 $ 266,868
PERS Plan 2/3
Deferred Outflows of Resources
Deferred Inflows of Resources
Difference between expected and actual experience $ - $ -
Changes of assumptions - -
Net difference between projected and actual earnings on pension plan investments - 1,055,617
Change in proportion 20,488 -
State contributions subsequent to the measurement date 219,054 -
Total $ 239,542 $ 1,055,617
For PERS Plan 1, $192.1 million, and for PERS Plan 2/3, $219.1 million, reported as deferred outflows of resources related to pensions resulting from state contributions subsequent to the measurement date will be recognized as a reduction of the net pension liability in the year ended June 30, 2016. Amounts reported as deferred outflows of resources and deferred inflows of resources related to pensions will be recognized in pension expense in the fiscal years ended June 30 (expressed in thousands):
S t a t e o f W a s h i n g t o n
Notes to the Financial Statements
135
2016 (66,717)$
2017 (66,717)$
2018 (66,717)$
2019 (66,717)$
2020 -$
Thereafter -$
PERS Plan 1
2016 (258,050)$
2017 (258,050)$
2018 (258,050)$
2019 (260,979)$
2020 -$
Thereafter -$
PERS Plan 2/3
Teachers’ Retirement System Plan Description. The Legislature established the Teachers’ Retirement System (TRS) in 1938. TRS retirement benefit provisions are established in chapters 41.32 and 41.34 RCW and may be amended only by the Legislature. Eligibility for membership requires service as a certificated public school employee working in an instructional, administrative, or supervisory capacity. TRS is comprised principally of non-state agency employees. TRS is a cost-sharing, multiple-employer retirement system comprised of three separate plans for membership purposes: Plans 1 and 2 are defined benefit plans and Plan 3 is a defined benefit plan with a defined contribution component. Although members can only be a member of either Plan 2 or Plan 3, the defined benefit portions of Plan 2 and Plan 3 are accounted for in the same pension trust fund. All assets of this Plan 2/3 defined benefit plan may legally be used to pay the defined benefits of any of the Plan 2 or Plan 3 members or beneficiaries, as defined by the terms of the plan. Therefore, Plan 2/3 is considered a single defined benefit plan for reporting purposes. Plan 3 accounts for the defined contribution portion of benefits for Plan 3 members. TRS members who joined the system by September 30, 1977, are a Plan 1 member. Plan 1 is closed to new entrants. Those who joined on or after October 1, 1977, and by June 30, 1996, are Plan 2 members unless they exercised an option to transfer their membership to Plan 3. TRS members joining the system on or after July 1, 1996, are members of TRS Plan 3. Legislation passed in 2007 gives TRS members hired on or after July 1, 2007, 90 days to make an irrevocable
choice to become a member of TRS Plan 2 or Plan 3. At the end of 90 days, any member who has not made a choice becomes a member of Plan 3. Refer to section E of this note for a description of the defined contribution component of TRS Plan 3. Benefits Provided. TRS plans provide retirement, disability, and death benefits to eligible members. TRS Plan 1 members are vested after the completion of five years of eligible service. Plan 1 members are eligible for retirement at any age after 30 years of service, or at the age of 60 with five years of service, or at the age of 55 with 25 years of service. The monthly benefit is 2 percent of the average final compensation (AFC) for each year of service credit, up to a maximum of 60 percent. The AFC is the total earnable compensation for the two consecutive highest-paid fiscal years, divided by two. TRS Plan 1 members may elect to receive an optional cost of living allowance (COLA) amount based on the Consumer Price Index, capped at 3 percent annually. To offset the cost of this annual adjustment, the benefit is reduced. TRS Plan 2 retirement benefits are vested after completing five years of eligible service. Plan 2 members are eligible for normal retirement at the age of 65 with five years of service. The monthly benefit is 2 percent of the AFC per year of service. A COLA is granted based on the Consumer Price Index, capped at 3 percent annually. The AFC is the average of the member’s 60 highest paid consecutive months. TRS Plan 2 members have the option to retire early with reduced benefits. The defined benefit portion of TRS Plan 3 provides members a monthly benefit that is 1 percent of the AFC per year of service. Plan 3 provides the same COLA as Plan 2. The AFC is the average of the member’s 60 highest paid consecutive months. TRS Plan 3 members are vested in the defined benefit portion of their plan after 10 years of service; or after five years of service, if 12 months of that service are earned after age 44; or after five service credit years earned in TRS Plan 2 by July 1, 1996. Plan 3 members are immediately vested in the defined contribution portion of their plan. TRS Plan 3 members have the option to retire early with reduced benefits.
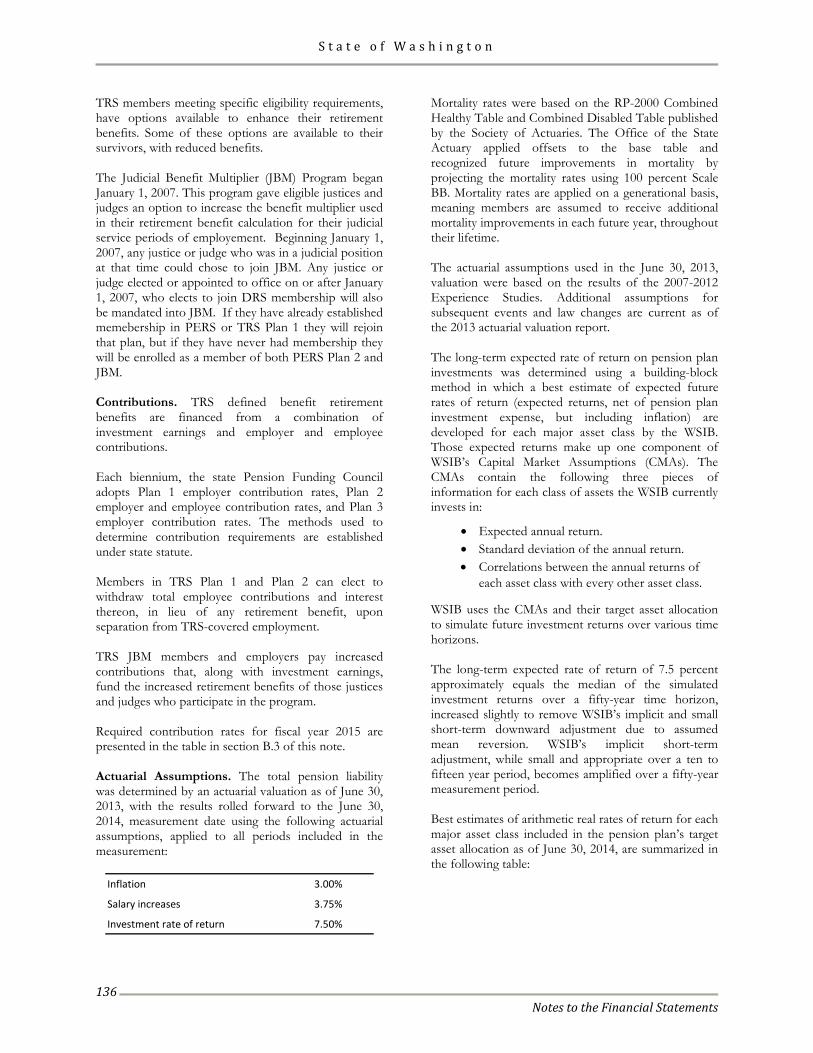
S t a t e o f W a s h i n g t o n
Notes to the Financial Statements
136
TRS members meeting specific eligibility requirements, have options available to enhance their retirement benefits. Some of these options are available to their survivors, with reduced benefits. The Judicial Benefit Multiplier (JBM) Program began January 1, 2007. This program gave eligible justices and judges an option to increase the benefit multiplier used in their retirement benefit calculation for their judicial service periods of employement. Beginning January 1, 2007, any justice or judge who was in a judicial position at that time could chose to join JBM. Any justice or judge elected or appointed to office on or after January 1, 2007, who elects to join DRS membership will also be mandated into JBM. If they have already established memebership in PERS or TRS Plan 1 they will rejoin that plan, but if they have never had membership they will be enrolled as a member of both PERS Plan 2 and JBM. Contributions. TRS defined benefit retirement benefits are financed from a combination of investment earnings and employer and employee contributions. Each biennium, the state Pension Funding Council adopts Plan 1 employer contribution rates, Plan 2 employer and employee contribution rates, and Plan 3 employer contribution rates. The methods used to determine contribution requirements are established under state statute. Members in TRS Plan 1 and Plan 2 can elect to withdraw total employee contributions and interest thereon, in lieu of any retirement benefit, upon separation from TRS-covered employment. TRS JBM members and employers pay increased contributions that, along with investment earnings, fund the increased retirement benefits of those justices and judges who participate in the program. Required contribution rates for fiscal year 2015 are presented in the table in section B.3 of this note. Actuarial Assumptions. The total pension liability was determined by an actuarial valuation as of June 30, 2013, with the results rolled forward to the June 30, 2014, measurement date using the following actuarial assumptions, applied to all periods included in the measurement:
Inflation 3.00%
Salary increases 3.75%
Investment rate of return 7.50%
Mortality rates were based on the RP-2000 Combined Healthy Table and Combined Disabled Table published by the Society of Actuaries. The Office of the State Actuary applied offsets to the base table and recognized future improvements in mortality by projecting the mortality rates using 100 percent Scale BB. Mortality rates are applied on a generational basis, meaning members are assumed to receive additional mortality improvements in each future year, throughout their lifetime. The actuarial assumptions used in the June 30, 2013, valuation were based on the results of the 2007-2012 Experience Studies. Additional assumptions for subsequent events and law changes are current as of the 2013 actuarial valuation report. The long-term expected rate of return on pension plan investments was determined using a building-block method in which a best estimate of expected future rates of return (expected returns, net of pension plan investment expense, but including inflation) are developed for each major asset class by the WSIB. Those expected returns make up one component of WSIB’s Capital Market Assumptions (CMAs). The CMAs contain the following three pieces of information for each class of assets the WSIB currently invests in:
• Expected annual return. • Standard deviation of the annual return. • Correlations between the annual returns of
each asset class with every other asset class.
WSIB uses the CMAs and their target asset allocation to simulate future investment returns over various time horizons. The long-term expected rate of return of 7.5 percent approximately equals the median of the simulated investment returns over a fifty-year time horizon, increased slightly to remove WSIB’s implicit and small short-term downward adjustment due to assumed mean reversion. WSIB’s implicit short-term adjustment, while small and appropriate over a ten to fifteen year period, becomes amplified over a fifty-year measurement period. Best estimates of arithmetic real rates of return for each major asset class included in the pension plan’s target asset allocation as of June 30, 2014, are summarized in the following table:
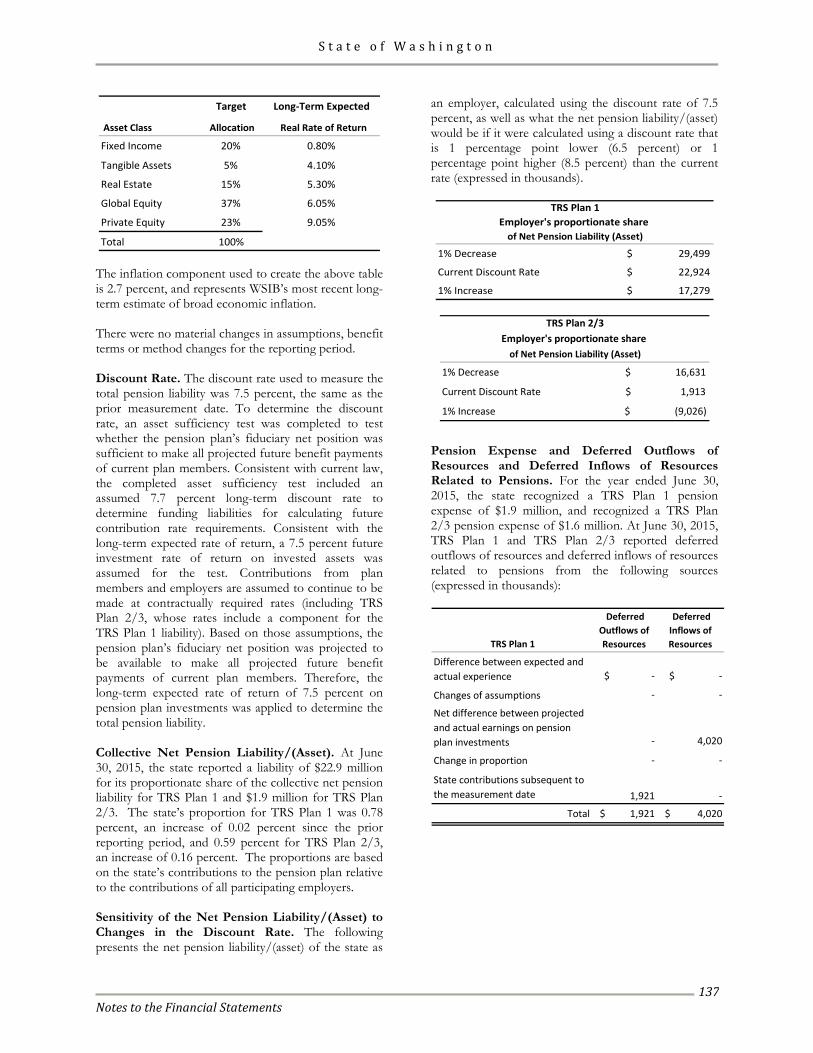
S t a t e o f W a s h i n g t o n
Notes to the Financial Statements
137
Target Long-Term Expected
Asset Class Allocation Real Rate of Return
Fixed Income 20% 0.80%
Tangible Assets 5% 4.10%
Real Estate 15% 5.30%
Global Equity 37% 6.05%
Private Equity 23% 9.05%
Total 100% The inflation component used to create the above table is 2.7 percent, and represents WSIB’s most recent long-term estimate of broad economic inflation. There were no material changes in assumptions, benefit terms or method changes for the reporting period. Discount Rate. The discount rate used to measure the total pension liability was 7.5 percent, the same as the prior measurement date. To determine the discount rate, an asset sufficiency test was completed to test whether the pension plan’s fiduciary net position was sufficient to make all projected future benefit payments of current plan members. Consistent with current law, the completed asset sufficiency test included an assumed 7.7 percent long-term discount rate to determine funding liabilities for calculating future contribution rate requirements. Consistent with the long-term expected rate of return, a 7.5 percent future investment rate of return on invested assets was assumed for the test. Contributions from plan members and employers are assumed to continue to be made at contractually required rates (including TRS Plan 2/3, whose rates include a component for the TRS Plan 1 liability). Based on those assumptions, the pension plan’s fiduciary net position was projected to be available to make all projected future benefit payments of current plan members. Therefore, the long-term expected rate of return of 7.5 percent on pension plan investments was applied to determine the total pension liability. Collective Net Pension Liability/(Asset). At June 30, 2015, the state reported a liability of $22.9 million for its proportionate share of the collective net pension liability for TRS Plan 1 and $1.9 million for TRS Plan 2/3. The state’s proportion for TRS Plan 1 was 0.78 percent, an increase of 0.02 percent since the prior reporting period, and 0.59 percent for TRS Plan 2/3, an increase of 0.16 percent. The proportions are based on the state’s contributions to the pension plan relative to the contributions of all participating employers. Sensitivity of the Net Pension Liability/(Asset) to Changes in the Discount Rate. The following presents the net pension liability/(asset) of the state as
an employer, calculated using the discount rate of 7.5 percent, as well as what the net pension liability/(asset) would be if it were calculated using a discount rate that is 1 percentage point lower (6.5 percent) or 1 percentage point higher (8.5 percent) than the current rate (expressed in thousands).
1% Decrease $ 29,499
Current Discount Rate $ 22,924
1% Increase $ 17,279
Employer's proportionate share of Net Pension Liability (Asset)
TRS Plan 1
1% Decrease $ 16,631
Current Discount Rate $ 1,913
1% Increase $ (9,026)
TRS Plan 2/3Employer's proportionate share
of Net Pension Liability (Asset)
Pension Expense and Deferred Outflows of Resources and Deferred Inflows of Resources Related to Pensions. For the year ended June 30, 2015, the state recognized a TRS Plan 1 pension expense of $1.9 million, and recognized a TRS Plan 2/3 pension expense of $1.6 million. At June 30, 2015, TRS Plan 1 and TRS Plan 2/3 reported deferred outflows of resources and deferred inflows of resources related to pensions from the following sources (expressed in thousands):
TRS Plan 1
Deferred Outflows of Resources
Deferred Inflows of Resources
Difference between expected and actual experience $ - $ -
Changes of assumptions - -
Net difference between projected and actual earnings on pension plan investments - 4,020
Change in proportion - -
State contributions subsequent to the measurement date 1,921 -
Total $ 1,921 $ 4,020
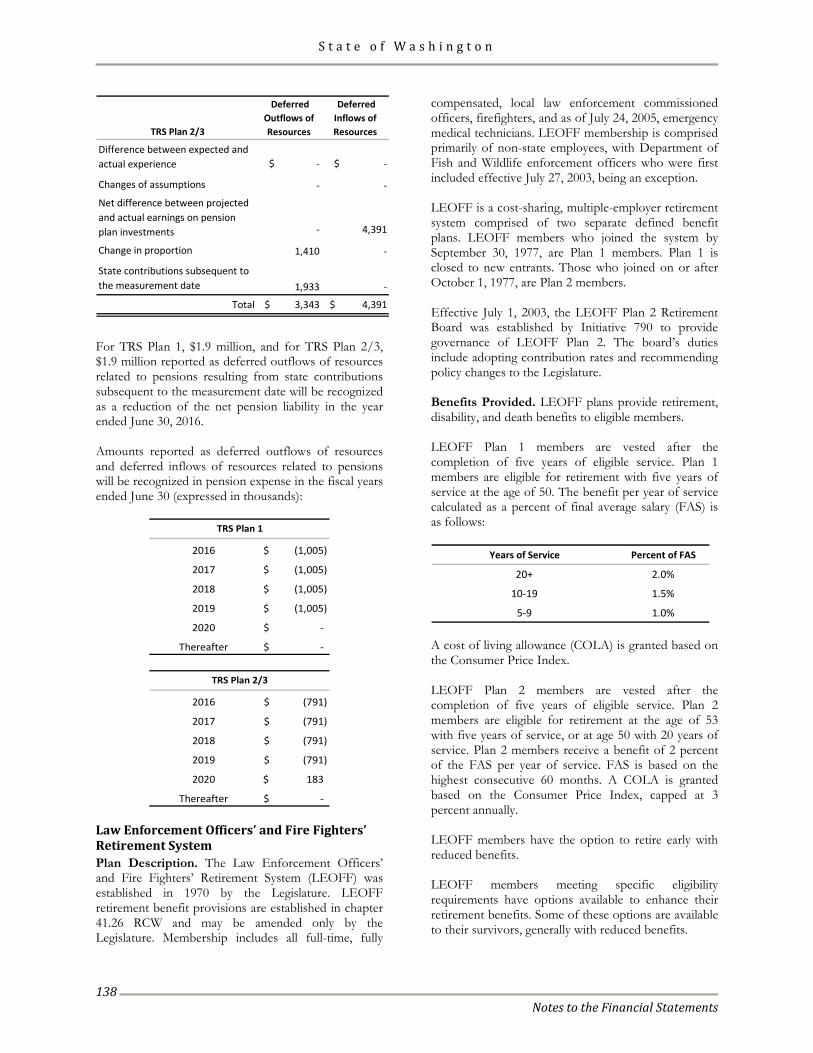
S t a t e o f W a s h i n g t o n
Notes to the Financial Statements
138
TRS Plan 2/3
Deferred Outflows of Resources
Deferred Inflows of Resources
Difference between expected and actual experience $ - $ -
Changes of assumptions - -
Net difference between projected and actual earnings on pension plan investments - 4,391
Change in proportion 1,410 -
State contributions subsequent to the measurement date 1,933 -
Total $ 3,343 $ 4,391
For TRS Plan 1, $1.9 million, and for TRS Plan 2/3, $1.9 million reported as deferred outflows of resources related to pensions resulting from state contributions subsequent to the measurement date will be recognized as a reduction of the net pension liability in the year ended June 30, 2016. Amounts reported as deferred outflows of resources and deferred inflows of resources related to pensions will be recognized in pension expense in the fiscal years ended June 30 (expressed in thousands):
2016 (1,005)$
2017 (1,005)$
2018 (1,005)$
2019 (1,005)$
2020 -$
Thereafter -$
TRS Plan 1
2016 (791)$
2017 (791)$
2018 (791)$
2019 (791)$
2020 183$
Thereafter -$
TRS Plan 2/3
Law Enforcement Officers’ and Fire Fighters’ Retirement System Plan Description. The Law Enforcement Officers’ and Fire Fighters’ Retirement System (LEOFF) was established in 1970 by the Legislature. LEOFF retirement benefit provisions are established in chapter 41.26 RCW and may be amended only by the Legislature. Membership includes all full-time, fully
compensated, local law enforcement commissioned officers, firefighters, and as of July 24, 2005, emergency medical technicians. LEOFF membership is comprised primarily of non-state employees, with Department of Fish and Wildlife enforcement officers who were first included effective July 27, 2003, being an exception. LEOFF is a cost-sharing, multiple-employer retirement system comprised of two separate defined benefit plans. LEOFF members who joined the system by September 30, 1977, are Plan 1 members. Plan 1 is closed to new entrants. Those who joined on or after October 1, 1977, are Plan 2 members. Effective July 1, 2003, the LEOFF Plan 2 Retirement Board was established by Initiative 790 to provide governance of LEOFF Plan 2. The board’s duties include adopting contribution rates and recommending policy changes to the Legislature. Benefits Provided. LEOFF plans provide retirement, disability, and death benefits to eligible members. LEOFF Plan 1 members are vested after the completion of five years of eligible service. Plan 1 members are eligible for retirement with five years of service at the age of 50. The benefit per year of service calculated as a percent of final average salary (FAS) is as follows:
Years of Service Percent of FAS
20+ 2.0%
10-19 1.5%
5-9 1.0% A cost of living allowance (COLA) is granted based on the Consumer Price Index. LEOFF Plan 2 members are vested after the completion of five years of eligible service. Plan 2 members are eligible for retirement at the age of 53 with five years of service, or at age 50 with 20 years of service. Plan 2 members receive a benefit of 2 percent of the FAS per year of service. FAS is based on the highest consecutive 60 months. A COLA is granted based on the Consumer Price Index, capped at 3 percent annually. LEOFF members have the option to retire early with reduced benefits. LEOFF members meeting specific eligibility requirements have options available to enhance their retirement benefits. Some of these options are available to their survivors, generally with reduced benefits.
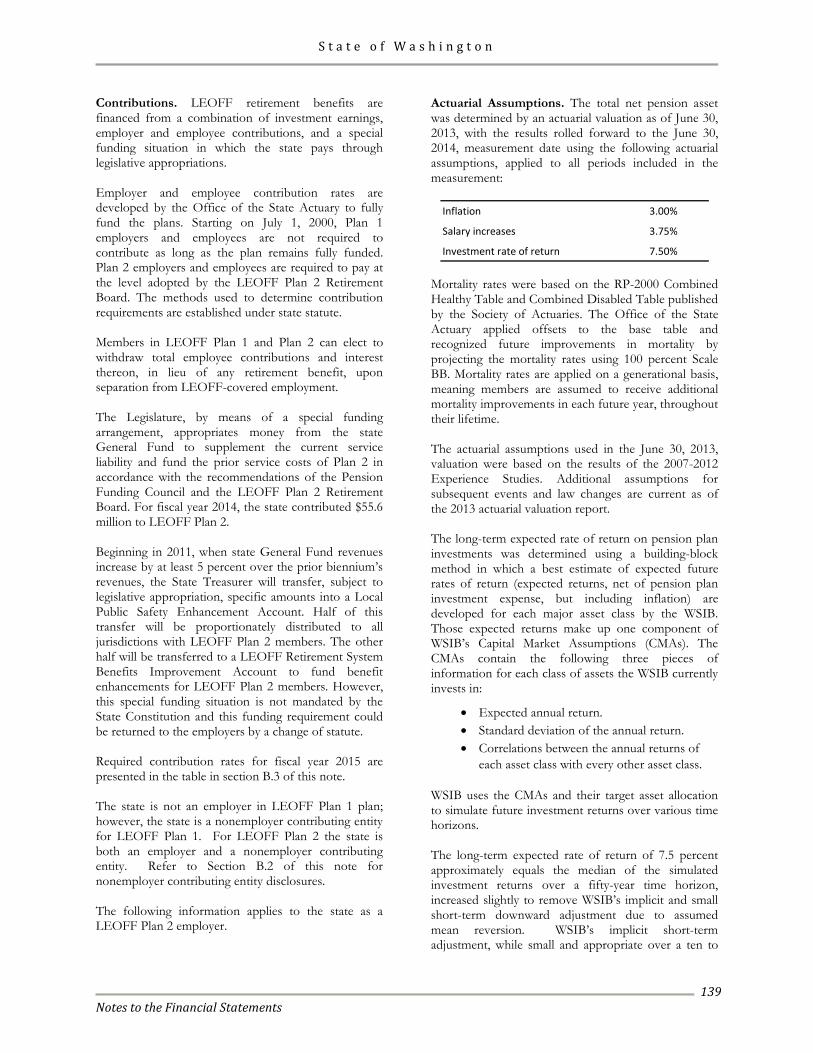
S t a t e o f W a s h i n g t o n
Notes to the Financial Statements
139
Contributions. LEOFF retirement benefits are financed from a combination of investment earnings, employer and employee contributions, and a special funding situation in which the state pays through legislative appropriations. Employer and employee contribution rates are developed by the Office of the State Actuary to fully fund the plans. Starting on July 1, 2000, Plan 1 employers and employees are not required to contribute as long as the plan remains fully funded. Plan 2 employers and employees are required to pay at the level adopted by the LEOFF Plan 2 Retirement Board. The methods used to determine contribution requirements are established under state statute. Members in LEOFF Plan 1 and Plan 2 can elect to withdraw total employee contributions and interest thereon, in lieu of any retirement benefit, upon separation from LEOFF-covered employment. The Legislature, by means of a special funding arrangement, appropriates money from the state General Fund to supplement the current service liability and fund the prior service costs of Plan 2 in accordance with the recommendations of the Pension Funding Council and the LEOFF Plan 2 Retirement Board. For fiscal year 2014, the state contributed $55.6 million to LEOFF Plan 2. Beginning in 2011, when state General Fund revenues increase by at least 5 percent over the prior biennium’s revenues, the State Treasurer will transfer, subject to legislative appropriation, specific amounts into a Local Public Safety Enhancement Account. Half of this transfer will be proportionately distributed to all jurisdictions with LEOFF Plan 2 members. The other half will be transferred to a LEOFF Retirement System Benefits Improvement Account to fund benefit enhancements for LEOFF Plan 2 members. However, this special funding situation is not mandated by the State Constitution and this funding requirement could be returned to the employers by a change of statute. Required contribution rates for fiscal year 2015 are presented in the table in section B.3 of this note. The state is not an employer in LEOFF Plan 1 plan; however, the state is a nonemployer contributing entity for LEOFF Plan 1. For LEOFF Plan 2 the state is both an employer and a nonemployer contributing entity. Refer to Section B.2 of this note for nonemployer contributing entity disclosures. The following information applies to the state as a LEOFF Plan 2 employer.
Actuarial Assumptions. The total net pension asset was determined by an actuarial valuation as of June 30, 2013, with the results rolled forward to the June 30, 2014, measurement date using the following actuarial assumptions, applied to all periods included in the measurement:
Inflation 3.00%
Salary increases 3.75%
Investment rate of return 7.50% Mortality rates were based on the RP-2000 Combined Healthy Table and Combined Disabled Table published by the Society of Actuaries. The Office of the State Actuary applied offsets to the base table and recognized future improvements in mortality by projecting the mortality rates using 100 percent Scale BB. Mortality rates are applied on a generational basis, meaning members are assumed to receive additional mortality improvements in each future year, throughout their lifetime. The actuarial assumptions used in the June 30, 2013, valuation were based on the results of the 2007-2012 Experience Studies. Additional assumptions for subsequent events and law changes are current as of the 2013 actuarial valuation report. The long-term expected rate of return on pension plan investments was determined using a building-block method in which a best estimate of expected future rates of return (expected returns, net of pension plan investment expense, but including inflation) are developed for each major asset class by the WSIB. Those expected returns make up one component of WSIB’s Capital Market Assumptions (CMAs). The CMAs contain the following three pieces of information for each class of assets the WSIB currently invests in:
• Expected annual return. • Standard deviation of the annual return. • Correlations between the annual returns of
each asset class with every other asset class. WSIB uses the CMAs and their target asset allocation to simulate future investment returns over various time horizons. The long-term expected rate of return of 7.5 percent approximately equals the median of the simulated investment returns over a fifty-year time horizon, increased slightly to remove WSIB’s implicit and small short-term downward adjustment due to assumed mean reversion. WSIB’s implicit short-term adjustment, while small and appropriate over a ten to
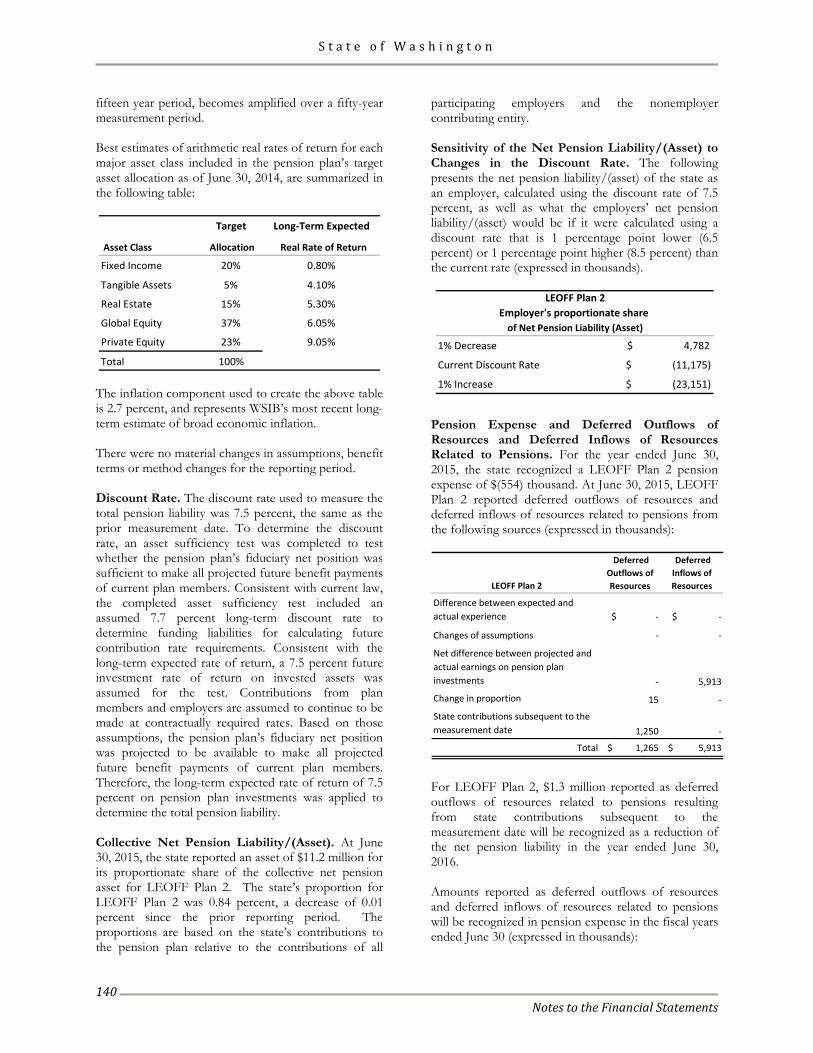
S t a t e o f W a s h i n g t o n
Notes to the Financial Statements
140
fifteen year period, becomes amplified over a fifty-year measurement period. Best estimates of arithmetic real rates of return for each major asset class included in the pension plan’s target asset allocation as of June 30, 2014, are summarized in the following table:
Target Long-Term Expected
Asset Class Allocation Real Rate of Return
Fixed Income 20% 0.80%
Tangible Assets 5% 4.10%
Real Estate 15% 5.30%
Global Equity 37% 6.05%
Private Equity 23% 9.05%
Total 100% The inflation component used to create the above table is 2.7 percent, and represents WSIB’s most recent long-term estimate of broad economic inflation. There were no material changes in assumptions, benefit terms or method changes for the reporting period. Discount Rate. The discount rate used to measure the total pension liability was 7.5 percent, the same as the prior measurement date. To determine the discount rate, an asset sufficiency test was completed to test whether the pension plan’s fiduciary net position was sufficient to make all projected future benefit payments of current plan members. Consistent with current law, the completed asset sufficiency test included an assumed 7.7 percent long-term discount rate to determine funding liabilities for calculating future contribution rate requirements. Consistent with the long-term expected rate of return, a 7.5 percent future investment rate of return on invested assets was assumed for the test. Contributions from plan members and employers are assumed to continue to be made at contractually required rates. Based on those assumptions, the pension plan’s fiduciary net position was projected to be available to make all projected future benefit payments of current plan members. Therefore, the long-term expected rate of return of 7.5 percent on pension plan investments was applied to determine the total pension liability. Collective Net Pension Liability/(Asset). At June 30, 2015, the state reported an asset of $11.2 million for its proportionate share of the collective net pension asset for LEOFF Plan 2. The state’s proportion for LEOFF Plan 2 was 0.84 percent, a decrease of 0.01 percent since the prior reporting period. The proportions are based on the state’s contributions to the pension plan relative to the contributions of all
participating employers and the nonemployer contributing entity. Sensitivity of the Net Pension Liability/(Asset) to Changes in the Discount Rate. The following presents the net pension liability/(asset) of the state as an employer, calculated using the discount rate of 7.5 percent, as well as what the employers’ net pension liability/(asset) would be if it were calculated using a discount rate that is 1 percentage point lower (6.5 percent) or 1 percentage point higher (8.5 percent) than the current rate (expressed in thousands).
1% Decrease $ 4,782
Current Discount Rate $ (11,175)
1% Increase $ (23,151)
LEOFF Plan 2Employer's proportionate share
of Net Pension Liability (Asset)
Pension Expense and Deferred Outflows of Resources and Deferred Inflows of Resources Related to Pensions. For the year ended June 30, 2015, the state recognized a LEOFF Plan 2 pension expense of $(554) thousand. At June 30, 2015, LEOFF Plan 2 reported deferred outflows of resources and deferred inflows of resources related to pensions from the following sources (expressed in thousands):
LEOFF Plan 2
Deferred Outflows of Resources
Deferred Inflows of Resources
Difference between expected and actual experience $ - $ -
Changes of assumptions - -
Net difference between projected and actual earnings on pension plan investments - 5,913
Change in proportion 15 -
State contributions subsequent to the measurement date 1,250 -
Total $ 1,265 $ 5,913
For LEOFF Plan 2, $1.3 million reported as deferred outflows of resources related to pensions resulting from state contributions subsequent to the measurement date will be recognized as a reduction of the net pension liability in the year ended June 30, 2016. Amounts reported as deferred outflows of resources and deferred inflows of resources related to pensions will be recognized in pension expense in the fiscal years ended June 30 (expressed in thousands):
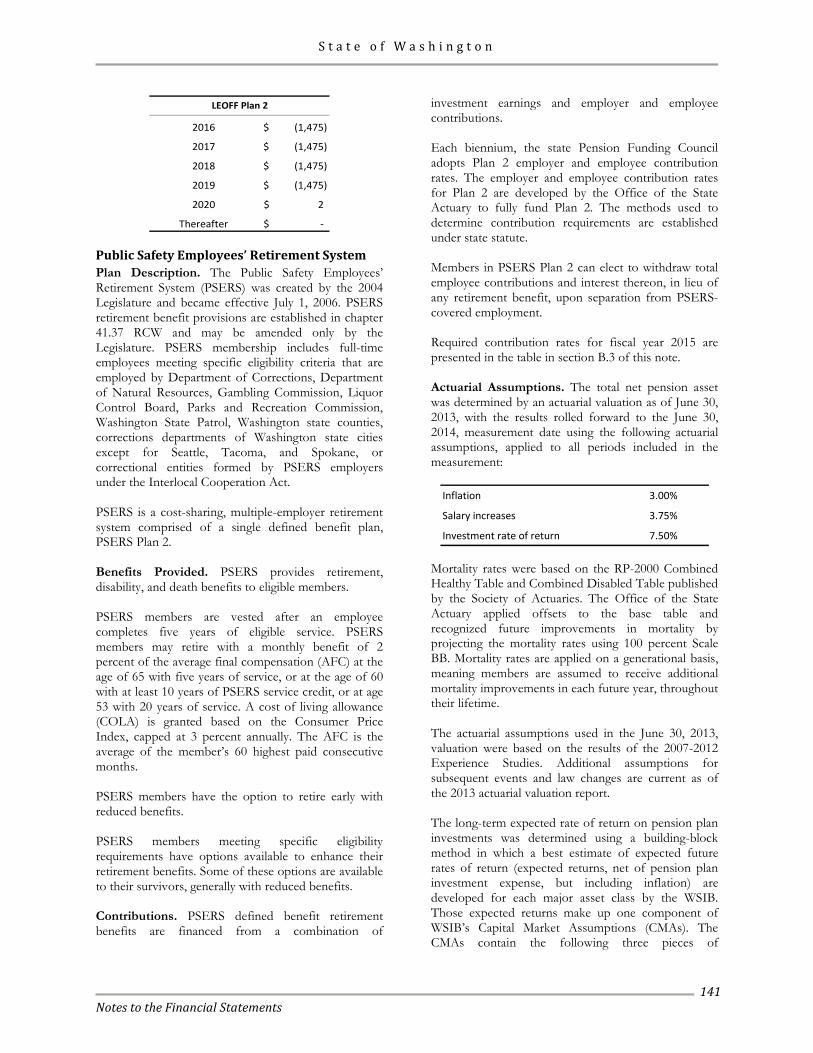
S t a t e o f W a s h i n g t o n
Notes to the Financial Statements
141
2016 (1,475)$
2017 (1,475)$
2018 (1,475)$
2019 (1,475)$
2020 2$
Thereafter -$
LEOFF Plan 2
Public Safety Employees’ Retirement System Plan Description. The Public Safety Employees’ Retirement System (PSERS) was created by the 2004 Legislature and became effective July 1, 2006. PSERS retirement benefit provisions are established in chapter 41.37 RCW and may be amended only by the Legislature. PSERS membership includes full-time employees meeting specific eligibility criteria that are employed by Department of Corrections, Department of Natural Resources, Gambling Commission, Liquor Control Board, Parks and Recreation Commission, Washington State Patrol, Washington state counties, corrections departments of Washington state cities except for Seattle, Tacoma, and Spokane, or correctional entities formed by PSERS employers under the Interlocal Cooperation Act. PSERS is a cost-sharing, multiple-employer retirement system comprised of a single defined benefit plan, PSERS Plan 2. Benefits Provided. PSERS provides retirement, disability, and death benefits to eligible members. PSERS members are vested after an employee completes five years of eligible service. PSERS members may retire with a monthly benefit of 2 percent of the average final compensation (AFC) at the age of 65 with five years of service, or at the age of 60 with at least 10 years of PSERS service credit, or at age 53 with 20 years of service. A cost of living allowance (COLA) is granted based on the Consumer Price Index, capped at 3 percent annually. The AFC is the average of the member’s 60 highest paid consecutive months. PSERS members have the option to retire early with reduced benefits. PSERS members meeting specific eligibility requirements have options available to enhance their retirement benefits. Some of these options are available to their survivors, generally with reduced benefits. Contributions. PSERS defined benefit retirement benefits are financed from a combination of
investment earnings and employer and employee contributions. Each biennium, the state Pension Funding Council adopts Plan 2 employer and employee contribution rates. The employer and employee contribution rates for Plan 2 are developed by the Office of the State Actuary to fully fund Plan 2. The methods used to determine contribution requirements are established under state statute. Members in PSERS Plan 2 can elect to withdraw total employee contributions and interest thereon, in lieu of any retirement benefit, upon separation from PSERS-covered employment. Required contribution rates for fiscal year 2015 are presented in the table in section B.3 of this note. Actuarial Assumptions. The total net pension asset was determined by an actuarial valuation as of June 30, 2013, with the results rolled forward to the June 30, 2014, measurement date using the following actuarial assumptions, applied to all periods included in the measurement:
Inflation 3.00%
Salary increases 3.75%
Investment rate of return 7.50% Mortality rates were based on the RP-2000 Combined Healthy Table and Combined Disabled Table published by the Society of Actuaries. The Office of the State Actuary applied offsets to the base table and recognized future improvements in mortality by projecting the mortality rates using 100 percent Scale BB. Mortality rates are applied on a generational basis, meaning members are assumed to receive additional mortality improvements in each future year, throughout their lifetime. The actuarial assumptions used in the June 30, 2013, valuation were based on the results of the 2007-2012 Experience Studies. Additional assumptions for subsequent events and law changes are current as of the 2013 actuarial valuation report. The long-term expected rate of return on pension plan investments was determined using a building-block method in which a best estimate of expected future rates of return (expected returns, net of pension plan investment expense, but including inflation) are developed for each major asset class by the WSIB. Those expected returns make up one component of WSIB’s Capital Market Assumptions (CMAs). The CMAs contain the following three pieces of
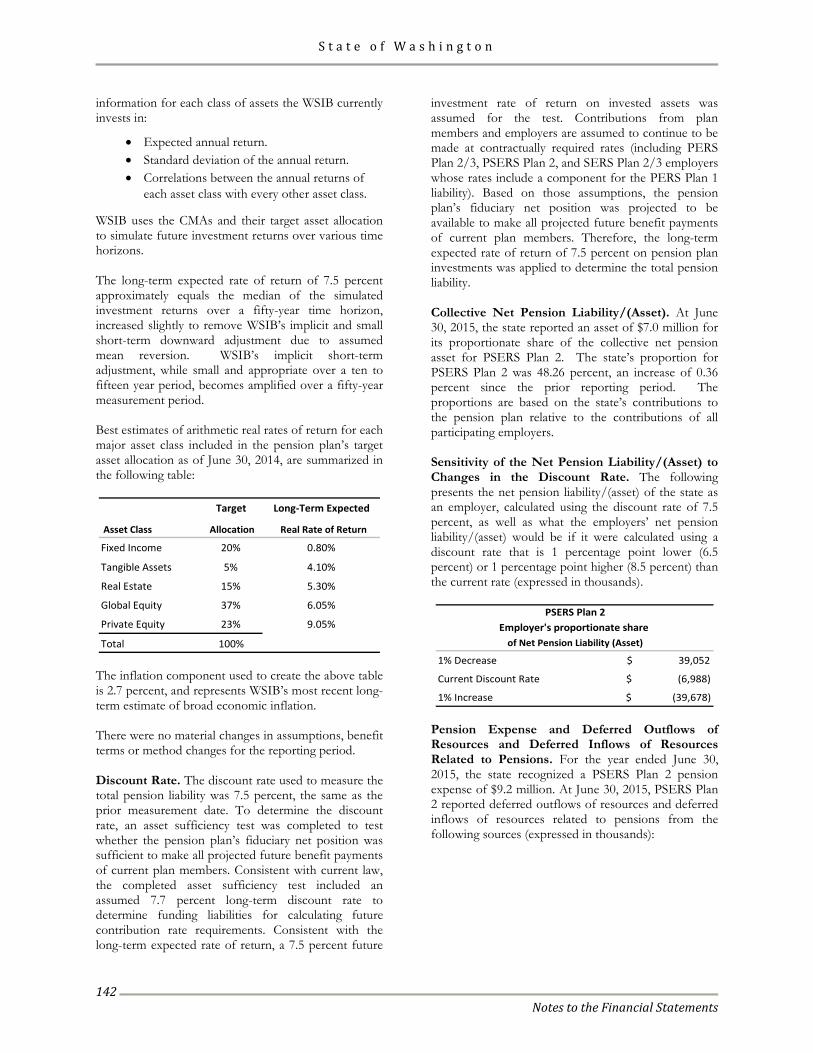
S t a t e o f W a s h i n g t o n
Notes to the Financial Statements
142
information for each class of assets the WSIB currently invests in:
• Expected annual return. • Standard deviation of the annual return. • Correlations between the annual returns of
each asset class with every other asset class.
WSIB uses the CMAs and their target asset allocation to simulate future investment returns over various time horizons. The long-term expected rate of return of 7.5 percent approximately equals the median of the simulated investment returns over a fifty-year time horizon, increased slightly to remove WSIB’s implicit and small short-term downward adjustment due to assumed mean reversion. WSIB’s implicit short-term adjustment, while small and appropriate over a ten to fifteen year period, becomes amplified over a fifty-year measurement period. Best estimates of arithmetic real rates of return for each major asset class included in the pension plan’s target asset allocation as of June 30, 2014, are summarized in the following table:
Target Long-Term Expected
Asset Class Allocation Real Rate of Return
Fixed Income 20% 0.80%
Tangible Assets 5% 4.10%
Real Estate 15% 5.30%
Global Equity 37% 6.05%
Private Equity 23% 9.05%
Total 100% The inflation component used to create the above table is 2.7 percent, and represents WSIB’s most recent long-term estimate of broad economic inflation. There were no material changes in assumptions, benefit terms or method changes for the reporting period. Discount Rate. The discount rate used to measure the total pension liability was 7.5 percent, the same as the prior measurement date. To determine the discount rate, an asset sufficiency test was completed to test whether the pension plan’s fiduciary net position was sufficient to make all projected future benefit payments of current plan members. Consistent with current law, the completed asset sufficiency test included an assumed 7.7 percent long-term discount rate to determine funding liabilities for calculating future contribution rate requirements. Consistent with the long-term expected rate of return, a 7.5 percent future
investment rate of return on invested assets was assumed for the test. Contributions from plan members and employers are assumed to continue to be made at contractually required rates (including PERS Plan 2/3, PSERS Plan 2, and SERS Plan 2/3 employers whose rates include a component for the PERS Plan 1 liability). Based on those assumptions, the pension plan’s fiduciary net position was projected to be available to make all projected future benefit payments of current plan members. Therefore, the long-term expected rate of return of 7.5 percent on pension plan investments was applied to determine the total pension liability. Collective Net Pension Liability/(Asset). At June 30, 2015, the state reported an asset of $7.0 million for its proportionate share of the collective net pension asset for PSERS Plan 2. The state’s proportion for PSERS Plan 2 was 48.26 percent, an increase of 0.36 percent since the prior reporting period. The proportions are based on the state’s contributions to the pension plan relative to the contributions of all participating employers. Sensitivity of the Net Pension Liability/(Asset) to Changes in the Discount Rate. The following presents the net pension liability/(asset) of the state as an employer, calculated using the discount rate of 7.5 percent, as well as what the employers’ net pension liability/(asset) would be if it were calculated using a discount rate that is 1 percentage point lower (6.5 percent) or 1 percentage point higher (8.5 percent) than the current rate (expressed in thousands).
1% Decrease $ 39,052
Current Discount Rate $ (6,988)
1% Increase $ (39,678)
PSERS Plan 2
of Net Pension Liability (Asset)Employer's proportionate share
Pension Expense and Deferred Outflows of Resources and Deferred Inflows of Resources Related to Pensions. For the year ended June 30, 2015, the state recognized a PSERS Plan 2 pension expense of $9.2 million. At June 30, 2015, PSERS Plan 2 reported deferred outflows of resources and deferred inflows of resources related to pensions from the following sources (expressed in thousands):
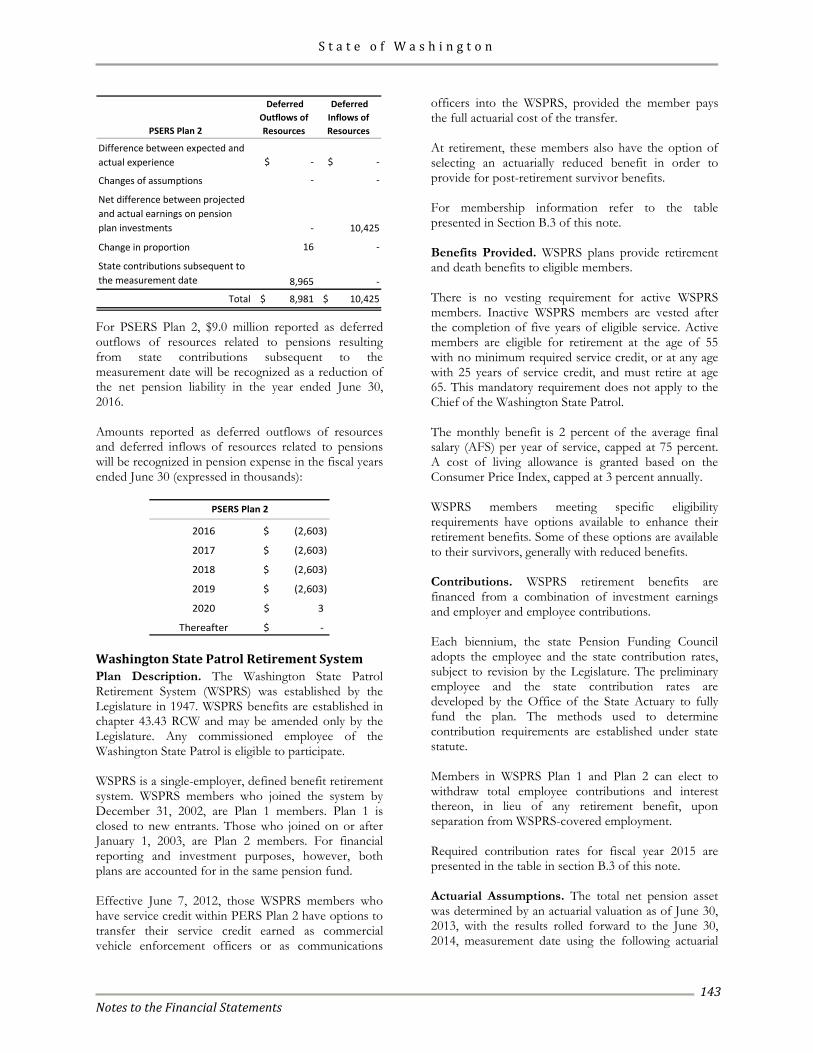
S t a t e o f W a s h i n g t o n
Notes to the Financial Statements
143
PSERS Plan 2
Deferred Outflows of Resources
Deferred Inflows of Resources
Difference between expected and actual experience $ - $ -
Changes of assumptions - -
Net difference between projected and actual earnings on pension plan investments - 10,425
Change in proportion 16 -
State contributions subsequent to the measurement date 8,965 -
Total $ 8,981 $ 10,425
For PSERS Plan 2, $9.0 million reported as deferred outflows of resources related to pensions resulting from state contributions subsequent to the measurement date will be recognized as a reduction of the net pension liability in the year ended June 30, 2016. Amounts reported as deferred outflows of resources and deferred inflows of resources related to pensions will be recognized in pension expense in the fiscal years ended June 30 (expressed in thousands):
2016 (2,603)$
2017 (2,603)$
2018 (2,603)$
2019 (2,603)$
2020 3$
Thereafter -$
PSERS Plan 2
Washington State Patrol Retirement System Plan Description. The Washington State Patrol Retirement System (WSPRS) was established by the Legislature in 1947. WSPRS benefits are established in chapter 43.43 RCW and may be amended only by the Legislature. Any commissioned employee of the Washington State Patrol is eligible to participate. WSPRS is a single-employer, defined benefit retirement system. WSPRS members who joined the system by December 31, 2002, are Plan 1 members. Plan 1 is closed to new entrants. Those who joined on or after January 1, 2003, are Plan 2 members. For financial reporting and investment purposes, however, both plans are accounted for in the same pension fund. Effective June 7, 2012, those WSPRS members who have service credit within PERS Plan 2 have options to transfer their service credit earned as commercial vehicle enforcement officers or as communications
officers into the WSPRS, provided the member pays the full actuarial cost of the transfer. At retirement, these members also have the option of selecting an actuarially reduced benefit in order to provide for post-retirement survivor benefits. For membership information refer to the table presented in Section B.3 of this note. Benefits Provided. WSPRS plans provide retirement and death benefits to eligible members. There is no vesting requirement for active WSPRS members. Inactive WSPRS members are vested after the completion of five years of eligible service. Active members are eligible for retirement at the age of 55 with no minimum required service credit, or at any age with 25 years of service credit, and must retire at age 65. This mandatory requirement does not apply to the Chief of the Washington State Patrol. The monthly benefit is 2 percent of the average final salary (AFS) per year of service, capped at 75 percent. A cost of living allowance is granted based on the Consumer Price Index, capped at 3 percent annually. WSPRS members meeting specific eligibility requirements have options available to enhance their retirement benefits. Some of these options are available to their survivors, generally with reduced benefits. Contributions. WSPRS retirement benefits are financed from a combination of investment earnings and employer and employee contributions. Each biennium, the state Pension Funding Council adopts the employee and the state contribution rates, subject to revision by the Legislature. The preliminary employee and the state contribution rates are developed by the Office of the State Actuary to fully fund the plan. The methods used to determine contribution requirements are established under state statute. Members in WSPRS Plan 1 and Plan 2 can elect to withdraw total employee contributions and interest thereon, in lieu of any retirement benefit, upon separation from WSPRS-covered employment. Required contribution rates for fiscal year 2015 are presented in the table in section B.3 of this note. Actuarial Assumptions. The total net pension asset was determined by an actuarial valuation as of June 30, 2013, with the results rolled forward to the June 30, 2014, measurement date using the following actuarial
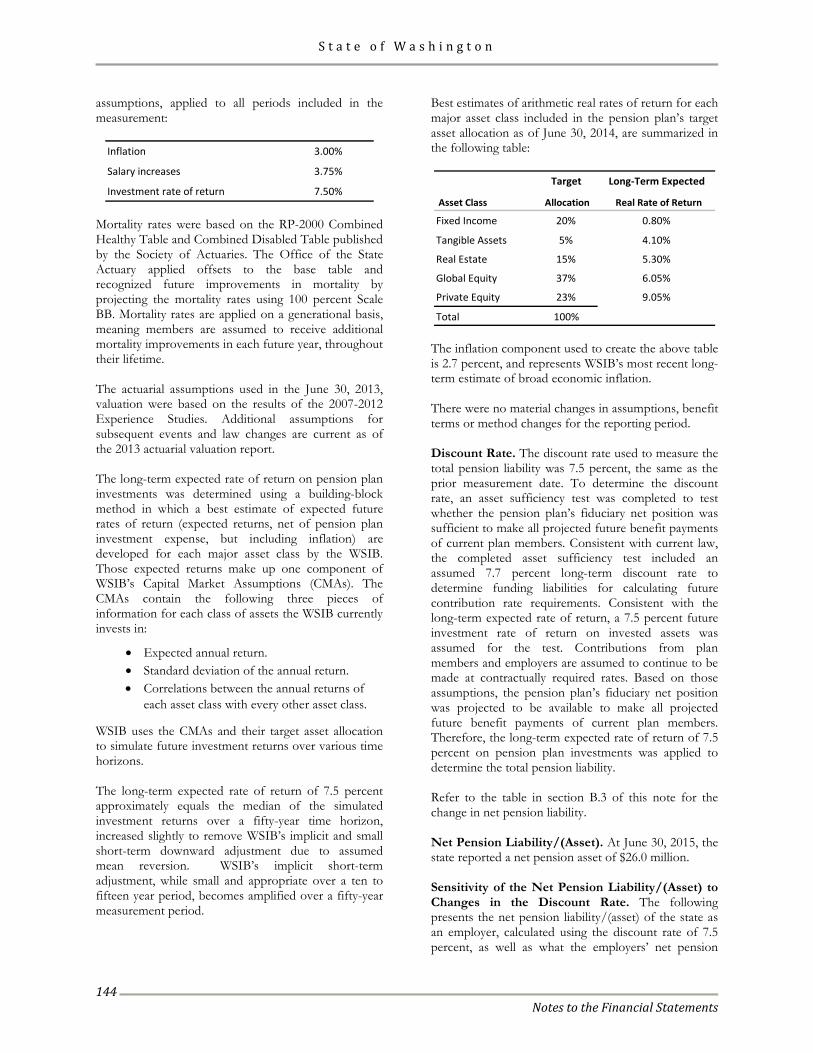
S t a t e o f W a s h i n g t o n
Notes to the Financial Statements
144
assumptions, applied to all periods included in the measurement:
Inflation 3.00%
Salary increases 3.75%
Investment rate of return 7.50% Mortality rates were based on the RP-2000 Combined Healthy Table and Combined Disabled Table published by the Society of Actuaries. The Office of the State Actuary applied offsets to the base table and recognized future improvements in mortality by projecting the mortality rates using 100 percent Scale BB. Mortality rates are applied on a generational basis, meaning members are assumed to receive additional mortality improvements in each future year, throughout their lifetime. The actuarial assumptions used in the June 30, 2013, valuation were based on the results of the 2007-2012 Experience Studies. Additional assumptions for subsequent events and law changes are current as of the 2013 actuarial valuation report. The long-term expected rate of return on pension plan investments was determined using a building-block method in which a best estimate of expected future rates of return (expected returns, net of pension plan investment expense, but including inflation) are developed for each major asset class by the WSIB. Those expected returns make up one component of WSIB’s Capital Market Assumptions (CMAs). The CMAs contain the following three pieces of information for each class of assets the WSIB currently invests in:
• Expected annual return. • Standard deviation of the annual return. • Correlations between the annual returns of
each asset class with every other asset class.
WSIB uses the CMAs and their target asset allocation to simulate future investment returns over various time horizons. The long-term expected rate of return of 7.5 percent approximately equals the median of the simulated investment returns over a fifty-year time horizon, increased slightly to remove WSIB’s implicit and small short-term downward adjustment due to assumed mean reversion. WSIB’s implicit short-term adjustment, while small and appropriate over a ten to fifteen year period, becomes amplified over a fifty-year measurement period.
Best estimates of arithmetic real rates of return for each major asset class included in the pension plan’s target asset allocation as of June 30, 2014, are summarized in the following table:
Target Long-Term Expected
Asset Class Allocation Real Rate of Return
Fixed Income 20% 0.80%
Tangible Assets 5% 4.10%
Real Estate 15% 5.30%
Global Equity 37% 6.05%
Private Equity 23% 9.05%
Total 100% The inflation component used to create the above table is 2.7 percent, and represents WSIB’s most recent long-term estimate of broad economic inflation. There were no material changes in assumptions, benefit terms or method changes for the reporting period. Discount Rate. The discount rate used to measure the total pension liability was 7.5 percent, the same as the prior measurement date. To determine the discount rate, an asset sufficiency test was completed to test whether the pension plan’s fiduciary net position was sufficient to make all projected future benefit payments of current plan members. Consistent with current law, the completed asset sufficiency test included an assumed 7.7 percent long-term discount rate to determine funding liabilities for calculating future contribution rate requirements. Consistent with the long-term expected rate of return, a 7.5 percent future investment rate of return on invested assets was assumed for the test. Contributions from plan members and employers are assumed to continue to be made at contractually required rates. Based on those assumptions, the pension plan’s fiduciary net position was projected to be available to make all projected future benefit payments of current plan members. Therefore, the long-term expected rate of return of 7.5 percent on pension plan investments was applied to determine the total pension liability. Refer to the table in section B.3 of this note for the change in net pension liability. Net Pension Liability/(Asset). At June 30, 2015, the state reported a net pension asset of $26.0 million. Sensitivity of the Net Pension Liability/(Asset) to Changes in the Discount Rate. The following presents the net pension liability/(asset) of the state as an employer, calculated using the discount rate of 7.5 percent, as well as what the employers’ net pension
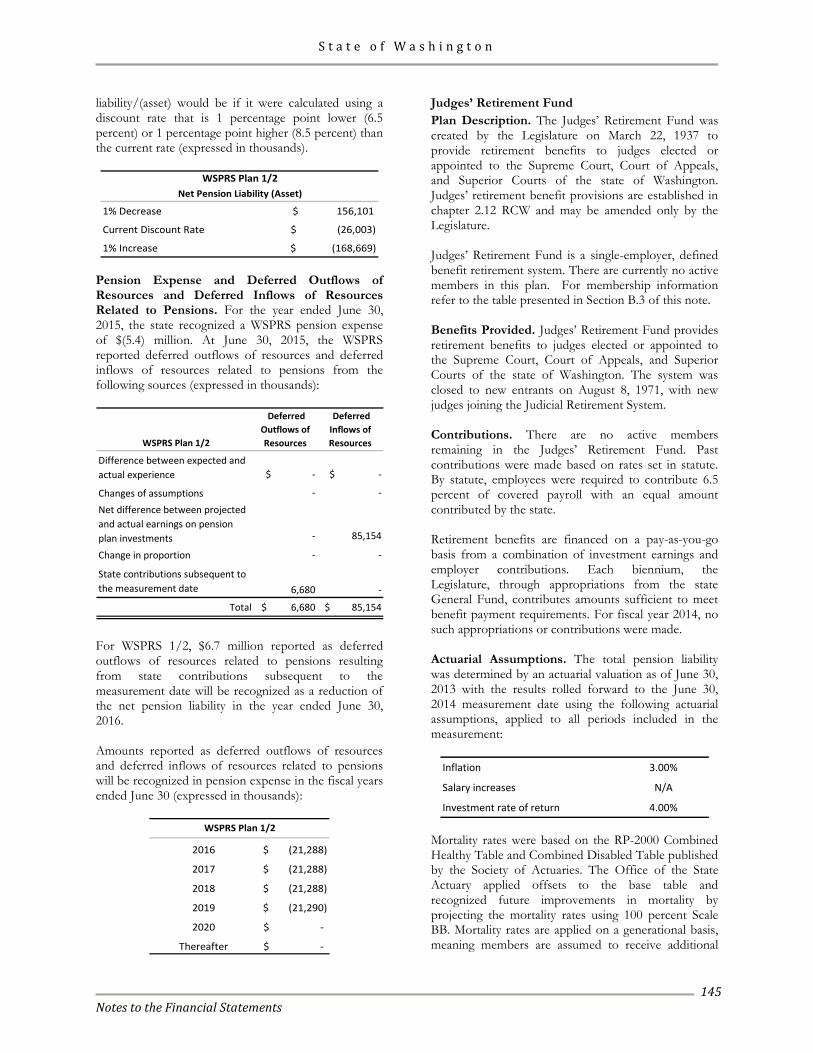
S t a t e o f W a s h i n g t o n
Notes to the Financial Statements
145
liability/(asset) would be if it were calculated using a discount rate that is 1 percentage point lower (6.5 percent) or 1 percentage point higher (8.5 percent) than the current rate (expressed in thousands).
1% Decrease $ 156,101
Current Discount Rate $ (26,003)
1% Increase $ (168,669)
WSPRS Plan 1/2Net Pension Liability (Asset)
Pension Expense and Deferred Outflows of Resources and Deferred Inflows of Resources Related to Pensions. For the year ended June 30, 2015, the state recognized a WSPRS pension expense of $(5.4) million. At June 30, 2015, the WSPRS reported deferred outflows of resources and deferred inflows of resources related to pensions from the following sources (expressed in thousands):
WSPRS Plan 1/2
Deferred Outflows of Resources
Deferred Inflows of Resources
Difference between expected and actual experience $ - $ -
Changes of assumptions - -
Net difference between projected and actual earnings on pension plan investments - 85,154
Change in proportion - -
State contributions subsequent to the measurement date 6,680 -
Total $ 6,680 $ 85,154
For WSPRS 1/2, $6.7 million reported as deferred outflows of resources related to pensions resulting from state contributions subsequent to the measurement date will be recognized as a reduction of the net pension liability in the year ended June 30, 2016. Amounts reported as deferred outflows of resources and deferred inflows of resources related to pensions will be recognized in pension expense in the fiscal years ended June 30 (expressed in thousands):
2016 (21,288)$
2017 (21,288)$
2018 (21,288)$
2019 (21,290)$
2020 -$
Thereafter -$
WSPRS Plan 1/2
Judges’ Retirement Fund Plan Description. The Judges’ Retirement Fund was created by the Legislature on March 22, 1937 to provide retirement benefits to judges elected or appointed to the Supreme Court, Court of Appeals, and Superior Courts of the state of Washington. Judges’ retirement benefit provisions are established in chapter 2.12 RCW and may be amended only by the Legislature. Judges’ Retirement Fund is a single-employer, defined benefit retirement system. There are currently no active members in this plan. For membership information refer to the table presented in Section B.3 of this note. Benefits Provided. Judges’ Retirement Fund provides retirement benefits to judges elected or appointed to the Supreme Court, Court of Appeals, and Superior Courts of the state of Washington. The system was closed to new entrants on August 8, 1971, with new judges joining the Judicial Retirement System. Contributions. There are no active members remaining in the Judges’ Retirement Fund. Past contributions were made based on rates set in statute. By statute, employees were required to contribute 6.5 percent of covered payroll with an equal amount contributed by the state. Retirement benefits are financed on a pay-as-you-go basis from a combination of investment earnings and employer contributions. Each biennium, the Legislature, through appropriations from the state General Fund, contributes amounts sufficient to meet benefit payment requirements. For fiscal year 2014, no such appropriations or contributions were made. Actuarial Assumptions. The total pension liability was determined by an actuarial valuation as of June 30, 2013 with the results rolled forward to the June 30, 2014 measurement date using the following actuarial assumptions, applied to all periods included in the measurement:
Inflation 3.00%
Salary increases N/A
Investment rate of return 4.00% Mortality rates were based on the RP-2000 Combined Healthy Table and Combined Disabled Table published by the Society of Actuaries. The Office of the State Actuary applied offsets to the base table and recognized future improvements in mortality by projecting the mortality rates using 100 percent Scale BB. Mortality rates are applied on a generational basis, meaning members are assumed to receive additional
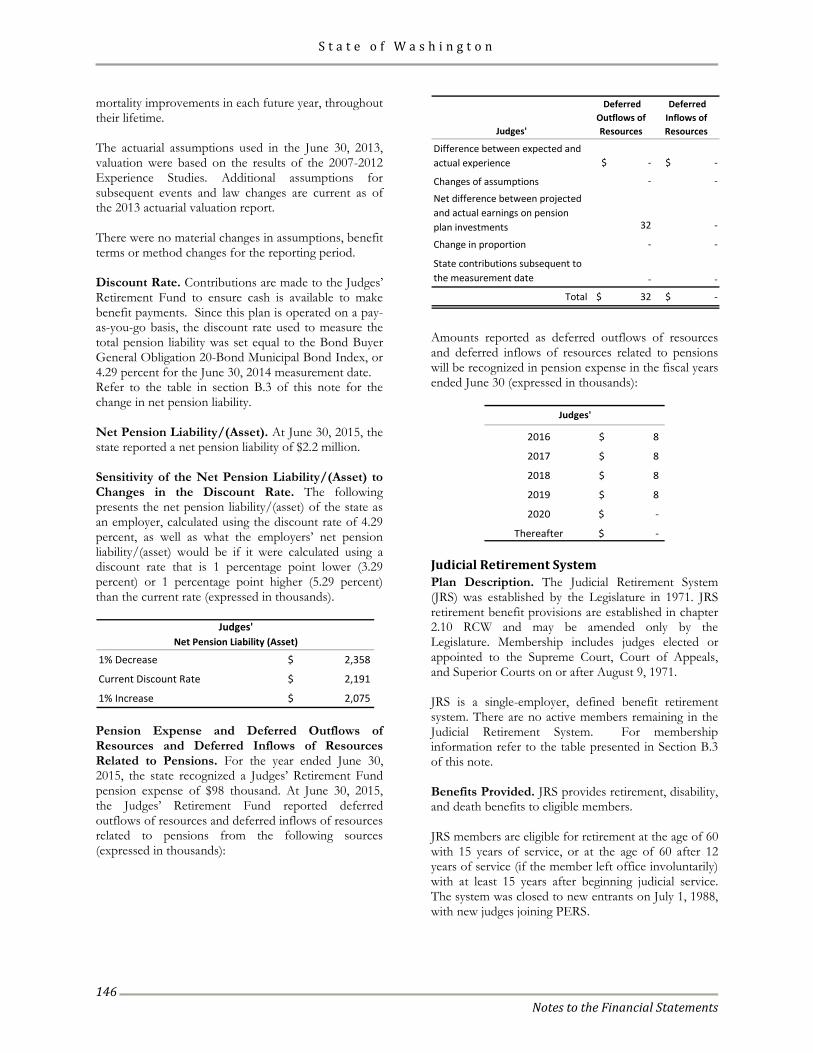
S t a t e o f W a s h i n g t o n
Notes to the Financial Statements
146
mortality improvements in each future year, throughout their lifetime. The actuarial assumptions used in the June 30, 2013, valuation were based on the results of the 2007-2012 Experience Studies. Additional assumptions for subsequent events and law changes are current as of the 2013 actuarial valuation report. There were no material changes in assumptions, benefit terms or method changes for the reporting period. Discount Rate. Contributions are made to the Judges’ Retirement Fund to ensure cash is available to make benefit payments. Since this plan is operated on a pay-as-you-go basis, the discount rate used to measure the total pension liability was set equal to the Bond Buyer General Obligation 20-Bond Municipal Bond Index, or 4.29 percent for the June 30, 2014 measurement date. Refer to the table in section B.3 of this note for the change in net pension liability. Net Pension Liability/(Asset). At June 30, 2015, the state reported a net pension liability of $2.2 million. Sensitivity of the Net Pension Liability/(Asset) to Changes in the Discount Rate. The following presents the net pension liability/(asset) of the state as an employer, calculated using the discount rate of 4.29 percent, as well as what the employers’ net pension liability/(asset) would be if it were calculated using a discount rate that is 1 percentage point lower (3.29 percent) or 1 percentage point higher (5.29 percent) than the current rate (expressed in thousands).
1% Decrease $ 2,358
Current Discount Rate $ 2,191
1% Increase $ 2,075
Judges'Net Pension Liability (Asset)
Pension Expense and Deferred Outflows of Resources and Deferred Inflows of Resources Related to Pensions. For the year ended June 30, 2015, the state recognized a Judges’ Retirement Fund pension expense of $98 thousand. At June 30, 2015, the Judges’ Retirement Fund reported deferred outflows of resources and deferred inflows of resources related to pensions from the following sources (expressed in thousands):
Judges'
Deferred Outflows of Resources
Deferred Inflows of Resources
Difference between expected and actual experience $ - $ -
Changes of assumptions - -
Net difference between projected and actual earnings on pension plan investments 32 -
Change in proportion - -
State contributions subsequent to the measurement date - -
Total $ 32 $ -
Amounts reported as deferred outflows of resources and deferred inflows of resources related to pensions will be recognized in pension expense in the fiscal years ended June 30 (expressed in thousands):
2016 8$
2017 8$
2018 8$
2019 8$
2020 -$
Thereafter -$
Judges'
Judicial Retirement System Plan Description. The Judicial Retirement System (JRS) was established by the Legislature in 1971. JRS retirement benefit provisions are established in chapter 2.10 RCW and may be amended only by the Legislature. Membership includes judges elected or appointed to the Supreme Court, Court of Appeals, and Superior Courts on or after August 9, 1971. JRS is a single-employer, defined benefit retirement system. There are no active members remaining in the Judicial Retirement System. For membership information refer to the table presented in Section B.3 of this note. Benefits Provided. JRS provides retirement, disability, and death benefits to eligible members. JRS members are eligible for retirement at the age of 60 with 15 years of service, or at the age of 60 after 12 years of service (if the member left office involuntarily) with at least 15 years after beginning judicial service. The system was closed to new entrants on July 1, 1988, with new judges joining PERS.
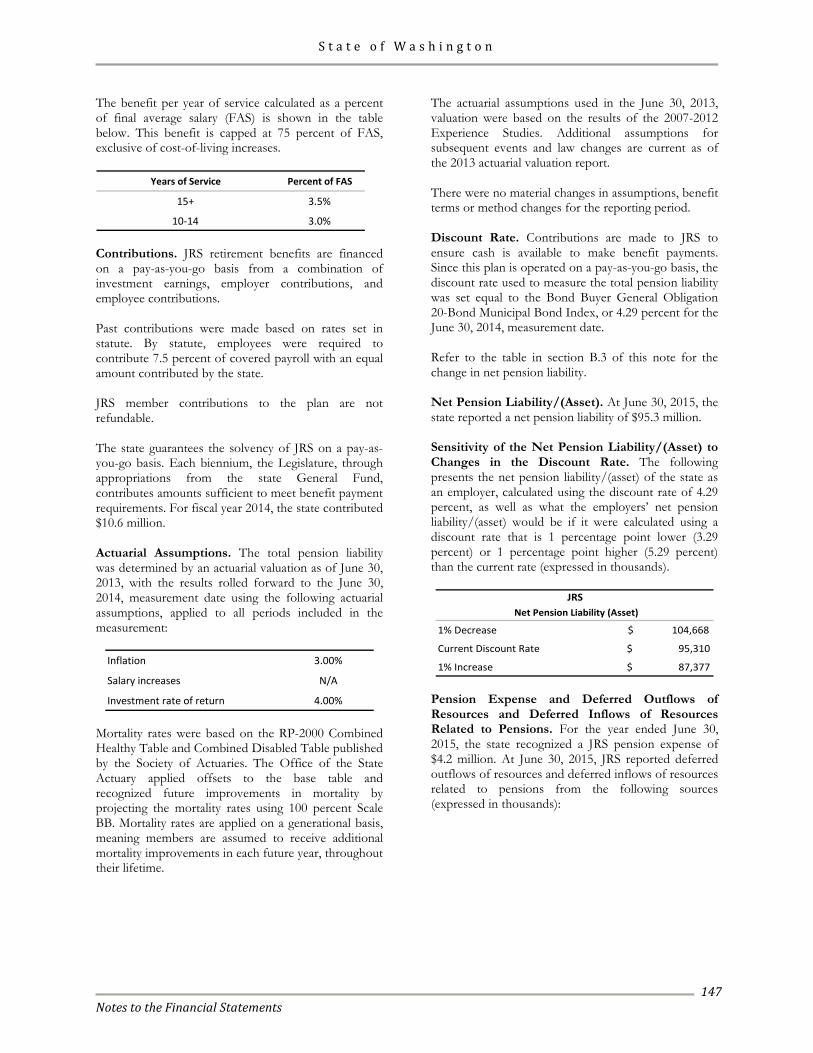
S t a t e o f W a s h i n g t o n
Notes to the Financial Statements
147
The benefit per year of service calculated as a percent of final average salary (FAS) is shown in the table below. This benefit is capped at 75 percent of FAS, exclusive of cost-of-living increases.
Years of Service Percent of FAS
15+ 3.5%
10-14 3.0% Contributions. JRS retirement benefits are financed on a pay-as-you-go basis from a combination of investment earnings, employer contributions, and employee contributions. Past contributions were made based on rates set in statute. By statute, employees were required to contribute 7.5 percent of covered payroll with an equal amount contributed by the state. JRS member contributions to the plan are not refundable. The state guarantees the solvency of JRS on a pay-as-you-go basis. Each biennium, the Legislature, through appropriations from the state General Fund, contributes amounts sufficient to meet benefit payment requirements. For fiscal year 2014, the state contributed $10.6 million. Actuarial Assumptions. The total pension liability was determined by an actuarial valuation as of June 30, 2013, with the results rolled forward to the June 30, 2014, measurement date using the following actuarial assumptions, applied to all periods included in the measurement:
Inflation 3.00%
Salary increases N/A
Investment rate of return 4.00% Mortality rates were based on the RP-2000 Combined Healthy Table and Combined Disabled Table published by the Society of Actuaries. The Office of the State Actuary applied offsets to the base table and recognized future improvements in mortality by projecting the mortality rates using 100 percent Scale BB. Mortality rates are applied on a generational basis, meaning members are assumed to receive additional mortality improvements in each future year, throughout their lifetime.
The actuarial assumptions used in the June 30, 2013, valuation were based on the results of the 2007-2012 Experience Studies. Additional assumptions for subsequent events and law changes are current as of the 2013 actuarial valuation report. There were no material changes in assumptions, benefit terms or method changes for the reporting period. Discount Rate. Contributions are made to JRS to ensure cash is available to make benefit payments. Since this plan is operated on a pay-as-you-go basis, the discount rate used to measure the total pension liability was set equal to the Bond Buyer General Obligation 20-Bond Municipal Bond Index, or 4.29 percent for the June 30, 2014, measurement date. Refer to the table in section B.3 of this note for the change in net pension liability. Net Pension Liability/(Asset). At June 30, 2015, the state reported a net pension liability of $95.3 million. Sensitivity of the Net Pension Liability/(Asset) to Changes in the Discount Rate. The following presents the net pension liability/(asset) of the state as an employer, calculated using the discount rate of 4.29 percent, as well as what the employers’ net pension liability/(asset) would be if it were calculated using a discount rate that is 1 percentage point lower (3.29 percent) or 1 percentage point higher (5.29 percent) than the current rate (expressed in thousands).
1% Decrease $ 104,668
Current Discount Rate $ 95,310
1% Increase $ 87,377
JRS Net Pension Liability (Asset)
Pension Expense and Deferred Outflows of Resources and Deferred Inflows of Resources Related to Pensions. For the year ended June 30, 2015, the state recognized a JRS pension expense of $4.2 million. At June 30, 2015, JRS reported deferred outflows of resources and deferred inflows of resources related to pensions from the following sources (expressed in thousands):
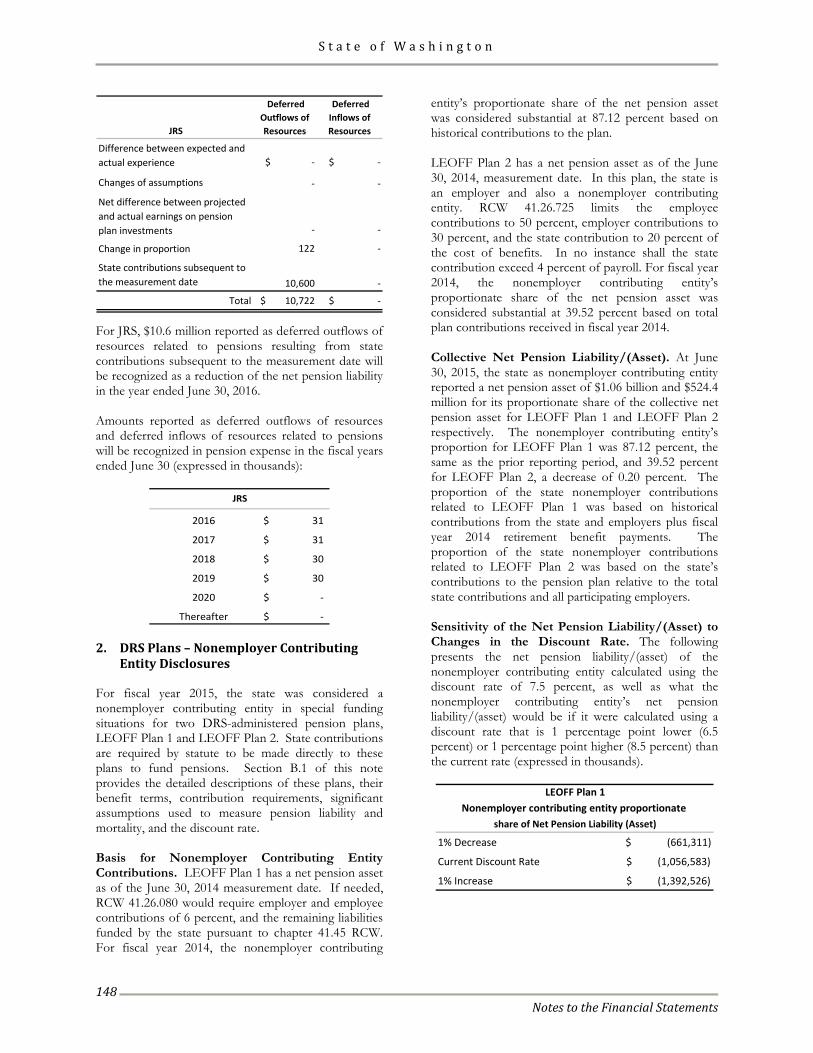
S t a t e o f W a s h i n g t o n
Notes to the Financial Statements
148
JRS
Deferred Outflows of Resources
Deferred Inflows of Resources
Difference between expected and actual experience $ - $ -
Changes of assumptions - -
Net difference between projected and actual earnings on pension plan investments - -
Change in proportion 122 -
State contributions subsequent to the measurement date 10,600 -
Total $ 10,722 $ -
For JRS, $10.6 million reported as deferred outflows of resources related to pensions resulting from state contributions subsequent to the measurement date will be recognized as a reduction of the net pension liability in the year ended June 30, 2016. Amounts reported as deferred outflows of resources and deferred inflows of resources related to pensions will be recognized in pension expense in the fiscal years ended June 30 (expressed in thousands):
2016 31$
2017 31$
2018 30$
2019 30$
2020 -$
Thereafter -$
JRS
2. DRS Plans – Nonemployer Contributing Entity Disclosures
For fiscal year 2015, the state was considered a nonemployer contributing entity in special funding situations for two DRS-administered pension plans, LEOFF Plan 1 and LEOFF Plan 2. State contributions are required by statute to be made directly to these plans to fund pensions. Section B.1 of this note provides the detailed descriptions of these plans, their benefit terms, contribution requirements, significant assumptions used to measure pension liability and mortality, and the discount rate. Basis for Nonemployer Contributing Entity Contributions. LEOFF Plan 1 has a net pension asset as of the June 30, 2014 measurement date. If needed, RCW 41.26.080 would require employer and employee contributions of 6 percent, and the remaining liabilities funded by the state pursuant to chapter 41.45 RCW. For fiscal year 2014, the nonemployer contributing
entity’s proportionate share of the net pension asset was considered substantial at 87.12 percent based on historical contributions to the plan. LEOFF Plan 2 has a net pension asset as of the June 30, 2014, measurement date. In this plan, the state is an employer and also a nonemployer contributing entity. RCW 41.26.725 limits the employee contributions to 50 percent, employer contributions to 30 percent, and the state contribution to 20 percent of the cost of benefits. In no instance shall the state contribution exceed 4 percent of payroll. For fiscal year 2014, the nonemployer contributing entity’s proportionate share of the net pension asset was considered substantial at 39.52 percent based on total plan contributions received in fiscal year 2014. Collective Net Pension Liability/(Asset). At June 30, 2015, the state as nonemployer contributing entity reported a net pension asset of $1.06 billion and $524.4 million for its proportionate share of the collective net pension asset for LEOFF Plan 1 and LEOFF Plan 2 respectively. The nonemployer contributing entity’s proportion for LEOFF Plan 1 was 87.12 percent, the same as the prior reporting period, and 39.52 percent for LEOFF Plan 2, a decrease of 0.20 percent. The proportion of the state nonemployer contributions related to LEOFF Plan 1 was based on historical contributions from the state and employers plus fiscal year 2014 retirement benefit payments. The proportion of the state nonemployer contributions related to LEOFF Plan 2 was based on the state’s contributions to the pension plan relative to the total state contributions and all participating employers. Sensitivity of the Net Pension Liability/(Asset) to Changes in the Discount Rate. The following presents the net pension liability/(asset) of the nonemployer contributing entity calculated using the discount rate of 7.5 percent, as well as what the nonemployer contributing entity’s net pension liability/(asset) would be if it were calculated using a discount rate that is 1 percentage point lower (6.5 percent) or 1 percentage point higher (8.5 percent) than the current rate (expressed in thousands).
1% Decrease $ (661,311)
Current Discount Rate $ (1,056,583)
1% Increase $ (1,392,526)
LEOFF Plan 1
share of Net Pension Liability (Asset)Nonemployer contributing entity proportionate
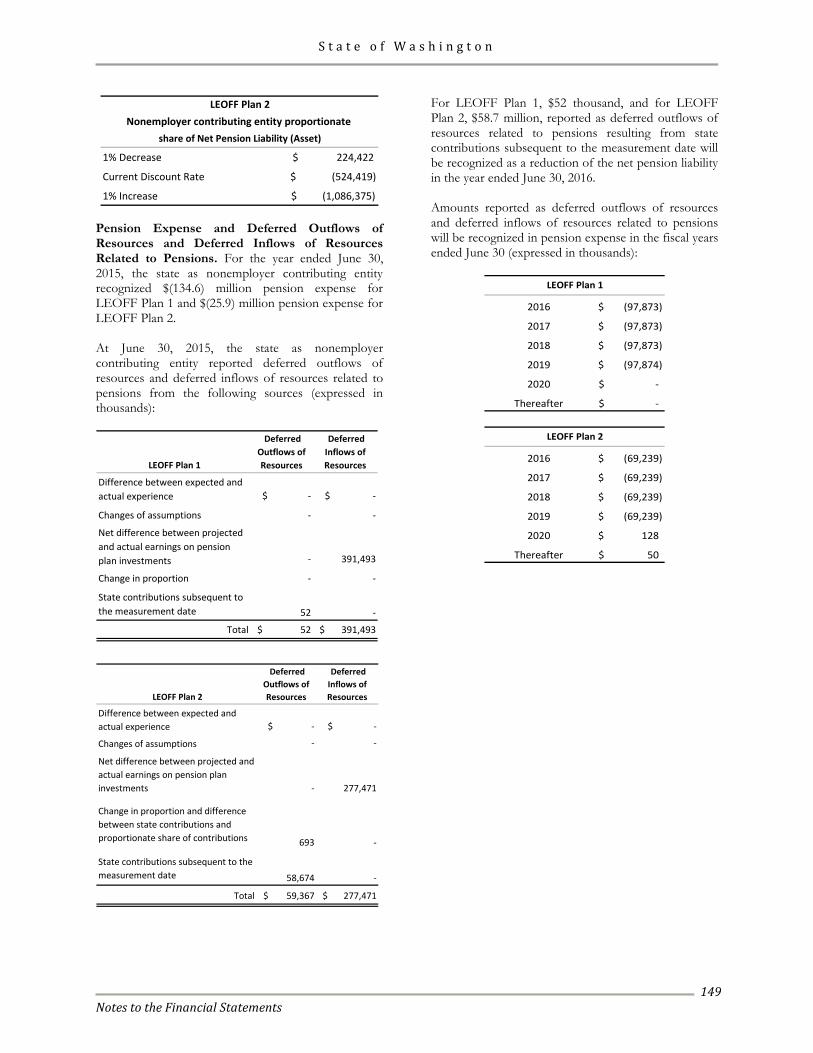
S t a t e o f W a s h i n g t o n
Notes to the Financial Statements
149
1% Decrease $ 224,422
Current Discount Rate $ (524,419)
1% Increase $ (1,086,375)
LEOFF Plan 2Nonemployer contributing entity proportionate
share of Net Pension Liability (Asset)
Pension Expense and Deferred Outflows of Resources and Deferred Inflows of Resources Related to Pensions. For the year ended June 30, 2015, the state as nonemployer contributing entity recognized $(134.6) million pension expense for LEOFF Plan 1 and $(25.9) million pension expense for LEOFF Plan 2. At June 30, 2015, the state as nonemployer contributing entity reported deferred outflows of resources and deferred inflows of resources related to pensions from the following sources (expressed in thousands):
LEOFF Plan 1
Deferred Outflows of Resources
Deferred Inflows of Resources
Difference between expected and actual experience $ - $ -
Changes of assumptions - -
Net difference between projected and actual earnings on pension plan investments - 391,493
Change in proportion - -
State contributions subsequent to the measurement date 52 -
Total $ 52 $ 391,493
LEOFF Plan 2
Deferred Outflows of Resources
Deferred Inflows of Resources
Difference between expected and actual experience $ - $ -
Changes of assumptions - -
Net difference between projected and actual earnings on pension plan investments - 277,471
Change in proportion and difference between state contributions and proportionate share of contributions 693 -
State contributions subsequent to the measurement date 58,674 -
Total $ 59,367 $ 277,471
For LEOFF Plan 1, $52 thousand, and for LEOFF Plan 2, $58.7 million, reported as deferred outflows of resources related to pensions resulting from state contributions subsequent to the measurement date will be recognized as a reduction of the net pension liability in the year ended June 30, 2016. Amounts reported as deferred outflows of resources and deferred inflows of resources related to pensions will be recognized in pension expense in the fiscal years ended June 30 (expressed in thousands):
2016 (97,873)$
2017 (97,873)$
2018 (97,873)$
2019 (97,874)$
2020 -$
Thereafter -$
LEOFF Plan 1
2016 (69,239)$
2017 (69,239)$
2018 (69,239)$
2019 (69,239)$
2020 128$
Thereafter 50$
LEOFF Plan 2
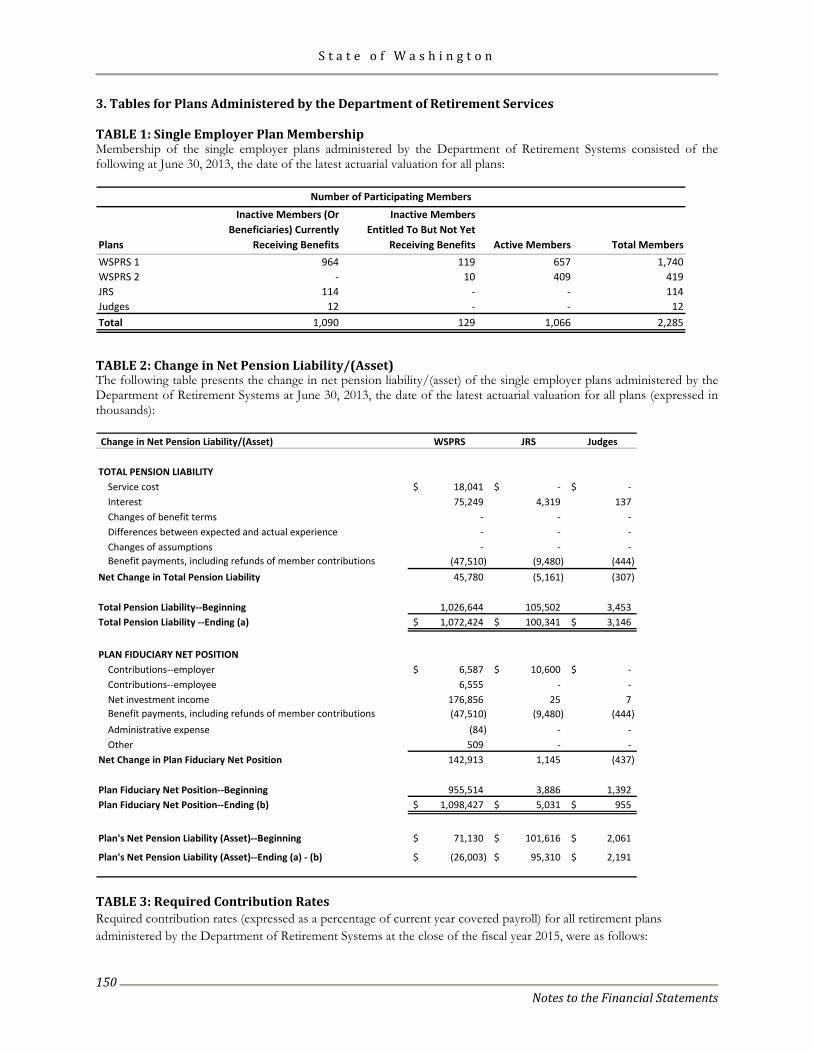
S t a t e o f W a s h i n g t o n
Notes to the Financial Statements
150
3. Tables for Plans Administered by the Department of Retirement Services TABLE 1: Single Employer Plan Membership Membership of the single employer plans administered by the Department of Retirement Systems consisted of the following at June 30, 2013, the date of the latest actuarial valuation for all plans:
Plans
Inactive Members (Or Beneficiaries) Currently
Receiving Benefits
Inactive Members Entitled To But Not Yet
Receiving Benefits Active Members Total MembersWSPRS 1 964 119 657 1,740 WSPRS 2 - 10 409 419 JRS 114 - - 114 Judges 12 - - 12 Total 1,090 129 1,066 2,285
Number of Participating Members
TABLE 2: Change in Net Pension Liability/(Asset) The following table presents the change in net pension liability/(asset) of the single employer plans administered by the Department of Retirement Systems at June 30, 2013, the date of the latest actuarial valuation for all plans (expressed in thousands): Change in Net Pension Liability/(Asset) WSPRS JRS Judges
TOTAL PENSION LIABILITYService cost 18,041$ -$ -$ Interest 75,249 4,319 137 Changes of benefit terms - - - Differences between expected and actual experience - - - Changes of assumptions - - - Benefit payments, including refunds of member contributions (47,510) (9,480) (444)
Net Change in Total Pension Liability 45,780 (5,161) (307)
Total Pension Liability--Beginning 1,026,644 105,502 3,453 Total Pension Liability --Ending (a) 1,072,424$ 100,341$ 3,146$
PLAN FIDUCIARY NET POSITIONContributions--employer 6,587$ 10,600$ -$ Contributions--employee 6,555 - - Net investment income 176,856 25 7 Benefit payments, including refunds of member contributions (47,510) (9,480) (444) Administrative expense (84) - - Other 509 - -
Net Change in Plan Fiduciary Net Position 142,913 1,145 (437)
Plan Fiduciary Net Position--Beginning 955,514 3,886 1,392 Plan Fiduciary Net Position--Ending (b) 1,098,427$ 5,031$ 955$
Plan's Net Pension Liability (Asset)--Beginning 71,130$ 101,616$ 2,061$
Plan's Net Pension Liability (Asset)--Ending (a) - (b) (26,003)$ 95,310$ 2,191$
TABLE 3: Required Contribution Rates Required contribution rates (expressed as a percentage of current year covered payroll) for all retirement plans administered by the Department of Retirement Systems at the close of the fiscal year 2015, were as follows:
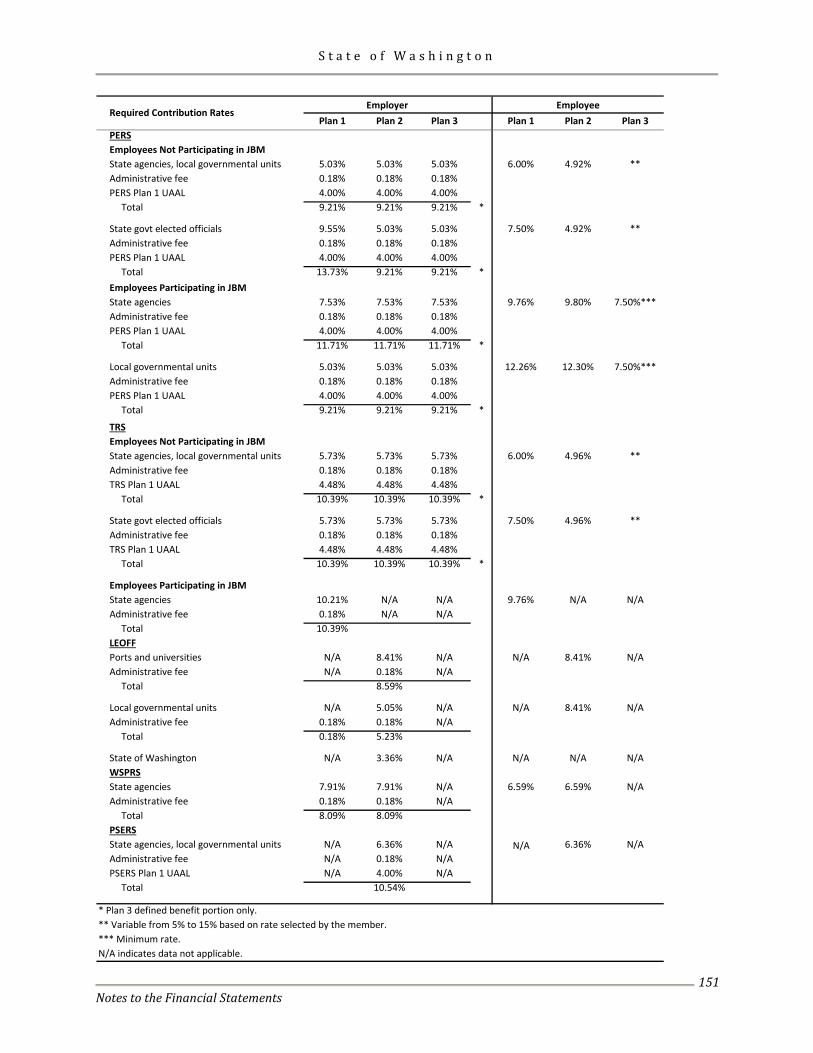
S t a t e o f W a s h i n g t o n
Notes to the Financial Statements
151
Plan 1 Plan 2 Plan 3 Plan 1 Plan 2 Plan 3PERSEmployees Not Participating in JBMState agencies, local governmental units 5.03% 5.03% 5.03% 6.00% 4.92% **Administrative fee 0.18% 0.18% 0.18%PERS Plan 1 UAAL 4.00% 4.00% 4.00% Total 9.21% 9.21% 9.21% *
State govt elected officials 9.55% 5.03% 5.03% 7.50% 4.92% **Administrative fee 0.18% 0.18% 0.18%PERS Plan 1 UAAL 4.00% 4.00% 4.00% Total 13.73% 9.21% 9.21% *Employees Participating in JBMState agencies 7.53% 7.53% 7.53% 9.76% 9.80% 7.50%***Administrative fee 0.18% 0.18% 0.18%PERS Plan 1 UAAL 4.00% 4.00% 4.00% Total 11.71% 11.71% 11.71% *
Local governmental units 5.03% 5.03% 5.03% 12.26% 12.30% 7.50%***Administrative fee 0.18% 0.18% 0.18%PERS Plan 1 UAAL 4.00% 4.00% 4.00% Total 9.21% 9.21% 9.21% *
TRSEmployees Not Participating in JBMState agencies, local governmental units 5.73% 5.73% 5.73% 6.00% 4.96% **Administrative fee 0.18% 0.18% 0.18%TRS Plan 1 UAAL 4.48% 4.48% 4.48% Total 10.39% 10.39% 10.39% *
State govt elected officials 5.73% 5.73% 5.73% 7.50% 4.96% **Administrative fee 0.18% 0.18% 0.18%TRS Plan 1 UAAL 4.48% 4.48% 4.48% Total 10.39% 10.39% 10.39% *
Employees Participating in JBMState agencies 10.21% N/A N/A 9.76% N/A N/AAdministrative fee 0.18% N/A N/A Total 10.39% LEOFFPorts and universities N/A 8.41% N/A N/A 8.41% N/AAdministrative fee N/A 0.18% N/A Total 8.59%
Local governmental units N/A 5.05% N/A N/A 8.41% N/AAdministrative fee 0.18% 0.18% N/A Total 0.18% 5.23%
State of Washington N/A 3.36% N/A N/A N/A N/AWSPRSState agencies 7.91% 7.91% N/A 6.59% 6.59% N/AAdministrative fee 0.18% 0.18% N/A Total 8.09% 8.09%PSERSState agencies, local governmental units N/A 6.36% N/A N/A 6.36% N/AAdministrative fee N/A 0.18% N/APSERS Plan 1 UAAL N/A 4.00% N/A Total 10.54%
*** Minimum rate.N/A indicates data not applicable.
Required Contribution RatesEmployer Employee
* Plan 3 defined benefit portion only.** Variable from 5% to 15% based on rate selected by the member.
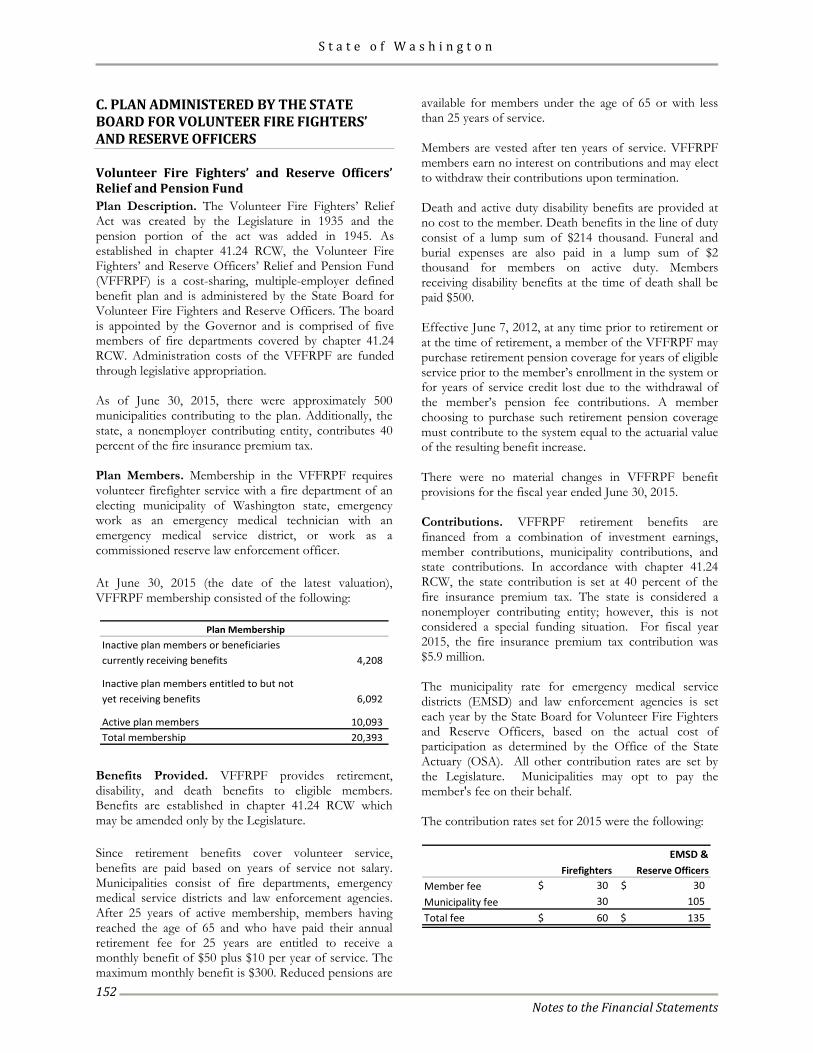
S t a t e o f W a s h i n g t o n
Notes to the Financial Statements
152
C. PLAN ADMINISTERED BY THE STATE BOARD FOR VOLUNTEER FIRE FIGHTERS’ AND RESERVE OFFICERS Volunteer Fire Fighters’ and Reserve Officers’ Relief and Pension Fund Plan Description. The Volunteer Fire Fighters’ Relief Act was created by the Legislature in 1935 and the pension portion of the act was added in 1945. As established in chapter 41.24 RCW, the Volunteer Fire Fighters’ and Reserve Officers’ Relief and Pension Fund (VFFRPF) is a cost-sharing, multiple-employer defined benefit plan and is administered by the State Board for Volunteer Fire Fighters and Reserve Officers. The board is appointed by the Governor and is comprised of five members of fire departments covered by chapter 41.24 RCW. Administration costs of the VFFRPF are funded through legislative appropriation. As of June 30, 2015, there were approximately 500 municipalities contributing to the plan. Additionally, the state, a nonemployer contributing entity, contributes 40 percent of the fire insurance premium tax. Plan Members. Membership in the VFFRPF requires volunteer firefighter service with a fire department of an electing municipality of Washington state, emergency work as an emergency medical technician with an emergency medical service district, or work as a commissioned reserve law enforcement officer. At June 30, 2015 (the date of the latest valuation), VFFRPF membership consisted of the following:
Inactive plan members or beneficiaries currently receiving benefits 4,208
Inactive plan members entitled to but not yet receiving benefits 6,092
Active plan members 10,093 Total membership 20,393
Plan Membership
Benefits Provided. VFFRPF provides retirement, disability, and death benefits to eligible members. Benefits are established in chapter 41.24 RCW which may be amended only by the Legislature. Since retirement benefits cover volunteer service, benefits are paid based on years of service not salary. Municipalities consist of fire departments, emergency medical service districts and law enforcement agencies. After 25 years of active membership, members having reached the age of 65 and who have paid their annual retirement fee for 25 years are entitled to receive a monthly benefit of $50 plus $10 per year of service. The maximum monthly benefit is $300. Reduced pensions are
available for members under the age of 65 or with less than 25 years of service. Members are vested after ten years of service. VFFRPF members earn no interest on contributions and may elect to withdraw their contributions upon termination. Death and active duty disability benefits are provided at no cost to the member. Death benefits in the line of duty consist of a lump sum of $214 thousand. Funeral and burial expenses are also paid in a lump sum of $2 thousand for members on active duty. Members receiving disability benefits at the time of death shall be paid $500. Effective June 7, 2012, at any time prior to retirement or at the time of retirement, a member of the VFFRPF may purchase retirement pension coverage for years of eligible service prior to the member’s enrollment in the system or for years of service credit lost due to the withdrawal of the member’s pension fee contributions. A member choosing to purchase such retirement pension coverage must contribute to the system equal to the actuarial value of the resulting benefit increase. There were no material changes in VFFRPF benefit provisions for the fiscal year ended June 30, 2015. Contributions. VFFRPF retirement benefits are financed from a combination of investment earnings, member contributions, municipality contributions, and state contributions. In accordance with chapter 41.24 RCW, the state contribution is set at 40 percent of the fire insurance premium tax. The state is considered a nonemployer contributing entity; however, this is not considered a special funding situation. For fiscal year 2015, the fire insurance premium tax contribution was $5.9 million. The municipality rate for emergency medical service districts (EMSD) and law enforcement agencies is set each year by the State Board for Volunteer Fire Fighters and Reserve Officers, based on the actual cost of participation as determined by the Office of the State Actuary (OSA). All other contribution rates are set by the Legislature. Municipalities may opt to pay the member's fee on their behalf. The contribution rates set for 2015 were the following:
EMSD & Firefighters Reserve Officers
Member fee 30$ 30$ Municipality fee 30 105 Total fee 60$ 135$
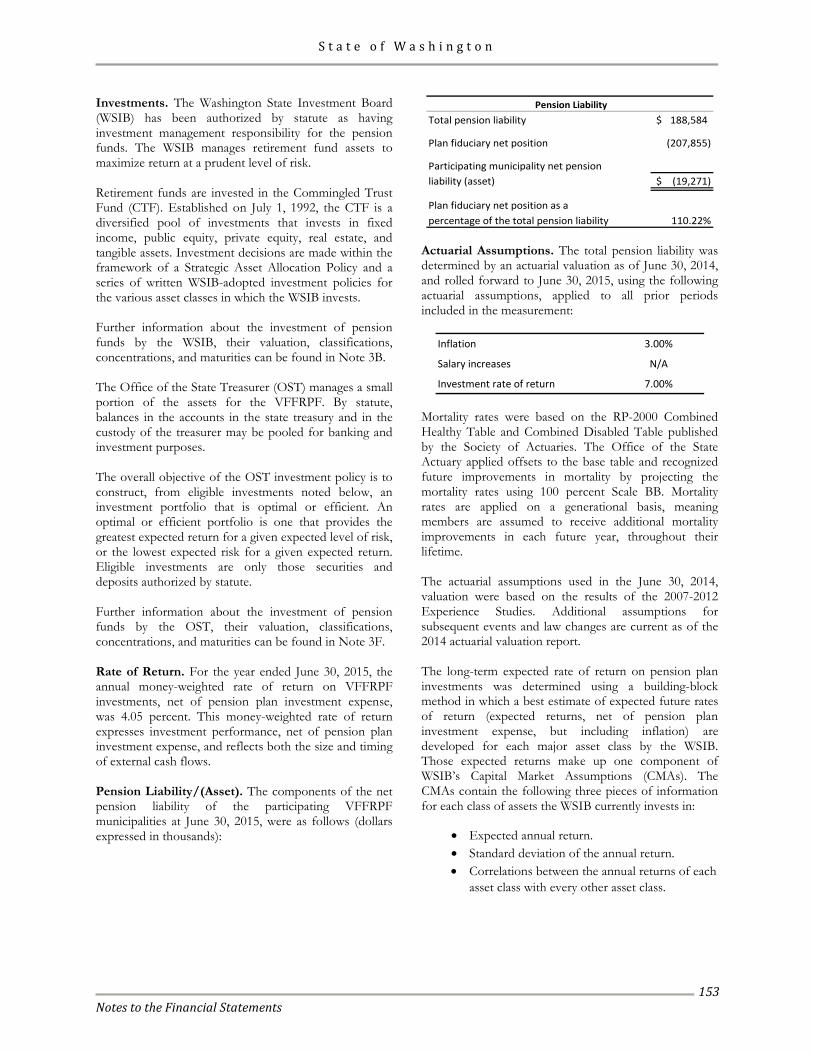
S t a t e o f W a s h i n g t o n
Notes to the Financial Statements
153
Investments. The Washington State Investment Board (WSIB) has been authorized by statute as having investment management responsibility for the pension funds. The WSIB manages retirement fund assets to maximize return at a prudent level of risk. Retirement funds are invested in the Commingled Trust Fund (CTF). Established on July 1, 1992, the CTF is a diversified pool of investments that invests in fixed income, public equity, private equity, real estate, and tangible assets. Investment decisions are made within the framework of a Strategic Asset Allocation Policy and a series of written WSIB-adopted investment policies for the various asset classes in which the WSIB invests. Further information about the investment of pension funds by the WSIB, their valuation, classifications, concentrations, and maturities can be found in Note 3B. The Office of the State Treasurer (OST) manages a small portion of the assets for the VFFRPF. By statute, balances in the accounts in the state treasury and in the custody of the treasurer may be pooled for banking and investment purposes. The overall objective of the OST investment policy is to construct, from eligible investments noted below, an investment portfolio that is optimal or efficient. An optimal or efficient portfolio is one that provides the greatest expected return for a given expected level of risk, or the lowest expected risk for a given expected return. Eligible investments are only those securities and deposits authorized by statute. Further information about the investment of pension funds by the OST, their valuation, classifications, concentrations, and maturities can be found in Note 3F. Rate of Return. For the year ended June 30, 2015, the annual money-weighted rate of return on VFFRPF investments, net of pension plan investment expense, was 4.05 percent. This money-weighted rate of return expresses investment performance, net of pension plan investment expense, and reflects both the size and timing of external cash flows. Pension Liability/(Asset). The components of the net pension liability of the participating VFFRPF municipalities at June 30, 2015, were as follows (dollars expressed in thousands):
Total pension liability 188,584$
Plan fiduciary net position (207,855)
Participating municipality net pensionliability (asset) (19,271)$
Plan fiduciary net position as a percentage of the total pension liability 110.22%
Pension Liability
Actuarial Assumptions. The total pension liability was determined by an actuarial valuation as of June 30, 2014, and rolled forward to June 30, 2015, using the following actuarial assumptions, applied to all prior periods included in the measurement:
Inflation 3.00%
Salary increases N/A
Investment rate of return 7.00% Mortality rates were based on the RP-2000 Combined Healthy Table and Combined Disabled Table published by the Society of Actuaries. The Office of the State Actuary applied offsets to the base table and recognized future improvements in mortality by projecting the mortality rates using 100 percent Scale BB. Mortality rates are applied on a generational basis, meaning members are assumed to receive additional mortality improvements in each future year, throughout their lifetime. The actuarial assumptions used in the June 30, 2014, valuation were based on the results of the 2007-2012 Experience Studies. Additional assumptions for subsequent events and law changes are current as of the 2014 actuarial valuation report. The long-term expected rate of return on pension plan investments was determined using a building-block method in which a best estimate of expected future rates of return (expected returns, net of pension plan investment expense, but including inflation) are developed for each major asset class by the WSIB. Those expected returns make up one component of WSIB’s Capital Market Assumptions (CMAs). The CMAs contain the following three pieces of information for each class of assets the WSIB currently invests in:
• Expected annual return. • Standard deviation of the annual return. • Correlations between the annual returns of each
asset class with every other asset class.
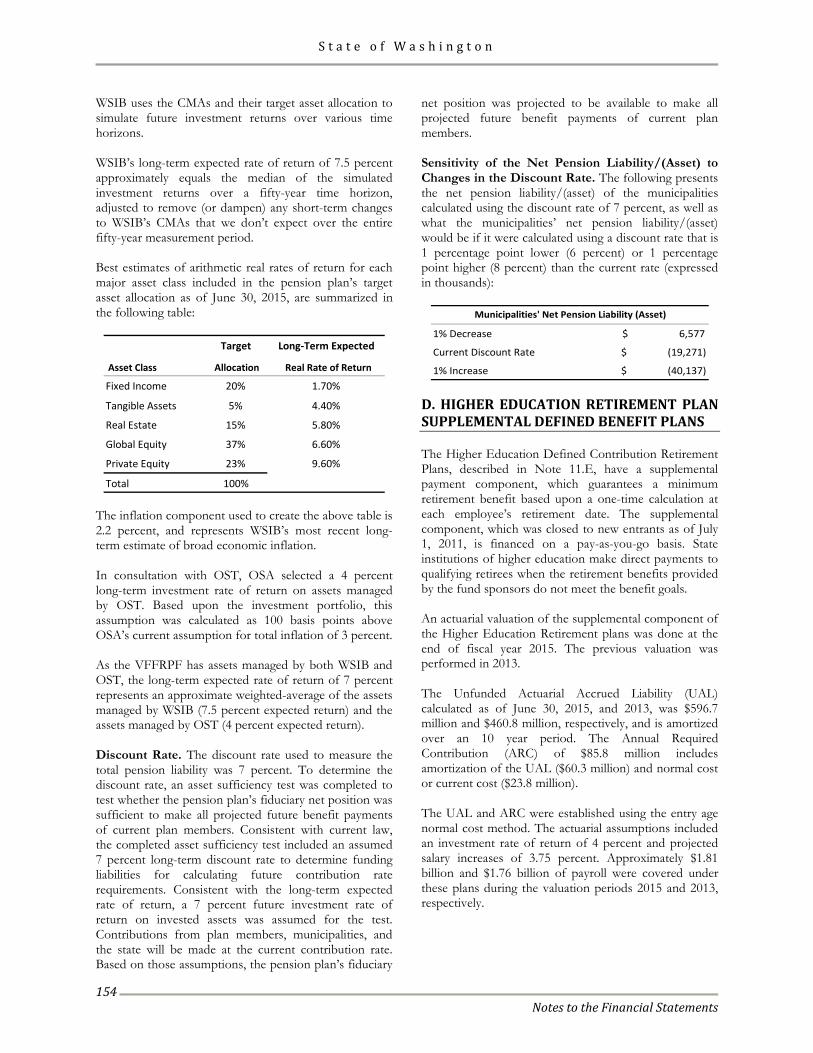
S t a t e o f W a s h i n g t o n
Notes to the Financial Statements
154
WSIB uses the CMAs and their target asset allocation to simulate future investment returns over various time horizons. WSIB’s long-term expected rate of return of 7.5 percent approximately equals the median of the simulated investment returns over a fifty-year time horizon, adjusted to remove (or dampen) any short-term changes to WSIB’s CMAs that we don’t expect over the entire fifty-year measurement period. Best estimates of arithmetic real rates of return for each major asset class included in the pension plan’s target asset allocation as of June 30, 2015, are summarized in the following table:
Target Long-Term Expected
Asset Class Allocation Real Rate of Return
Fixed Income 20% 1.70%
Tangible Assets 5% 4.40%
Real Estate 15% 5.80%
Global Equity 37% 6.60%
Private Equity 23% 9.60%
Total 100% The inflation component used to create the above table is 2.2 percent, and represents WSIB’s most recent long-term estimate of broad economic inflation. In consultation with OST, OSA selected a 4 percent long-term investment rate of return on assets managed by OST. Based upon the investment portfolio, this assumption was calculated as 100 basis points above OSA’s current assumption for total inflation of 3 percent. As the VFFRPF has assets managed by both WSIB and OST, the long-term expected rate of return of 7 percent represents an approximate weighted-average of the assets managed by WSIB (7.5 percent expected return) and the assets managed by OST (4 percent expected return). Discount Rate. The discount rate used to measure the total pension liability was 7 percent. To determine the discount rate, an asset sufficiency test was completed to test whether the pension plan’s fiduciary net position was sufficient to make all projected future benefit payments of current plan members. Consistent with current law, the completed asset sufficiency test included an assumed 7 percent long-term discount rate to determine funding liabilities for calculating future contribution rate requirements. Consistent with the long-term expected rate of return, a 7 percent future investment rate of return on invested assets was assumed for the test. Contributions from plan members, municipalities, and the state will be made at the current contribution rate. Based on those assumptions, the pension plan’s fiduciary
net position was projected to be available to make all projected future benefit payments of current plan members. Sensitivity of the Net Pension Liability/(Asset) to Changes in the Discount Rate. The following presents the net pension liability/(asset) of the municipalities calculated using the discount rate of 7 percent, as well as what the municipalities’ net pension liability/(asset) would be if it were calculated using a discount rate that is 1 percentage point lower (6 percent) or 1 percentage point higher (8 percent) than the current rate (expressed in thousands):
1% Decrease $ 6,577
Current Discount Rate $ (19,271)
1% Increase $ (40,137)
Municipalities' Net Pension Liability (Asset)
D. HIGHER EDUCATION RETIREMENT PLAN SUPPLEMENTAL DEFINED BENEFIT PLANS The Higher Education Defined Contribution Retirement Plans, described in Note 11.E, have a supplemental payment component, which guarantees a minimum retirement benefit based upon a one-time calculation at each employee’s retirement date. The supplemental component, which was closed to new entrants as of July 1, 2011, is financed on a pay-as-you-go basis. State institutions of higher education make direct payments to qualifying retirees when the retirement benefits provided by the fund sponsors do not meet the benefit goals. An actuarial valuation of the supplemental component of the Higher Education Retirement plans was done at the end of fiscal year 2015. The previous valuation was performed in 2013. The Unfunded Actuarial Accrued Liability (UAL) calculated as of June 30, 2015, and 2013, was $596.7 million and $460.8 million, respectively, and is amortized over an 10 year period. The Annual Required Contribution (ARC) of $85.8 million includes amortization of the UAL ($60.3 million) and normal cost or current cost ($23.8 million). The UAL and ARC were established using the entry age normal cost method. The actuarial assumptions included an investment rate of return of 4 percent and projected salary increases of 3.75 percent. Approximately $1.81 billion and $1.76 billion of payroll were covered under these plans during the valuation periods 2015 and 2013, respectively.
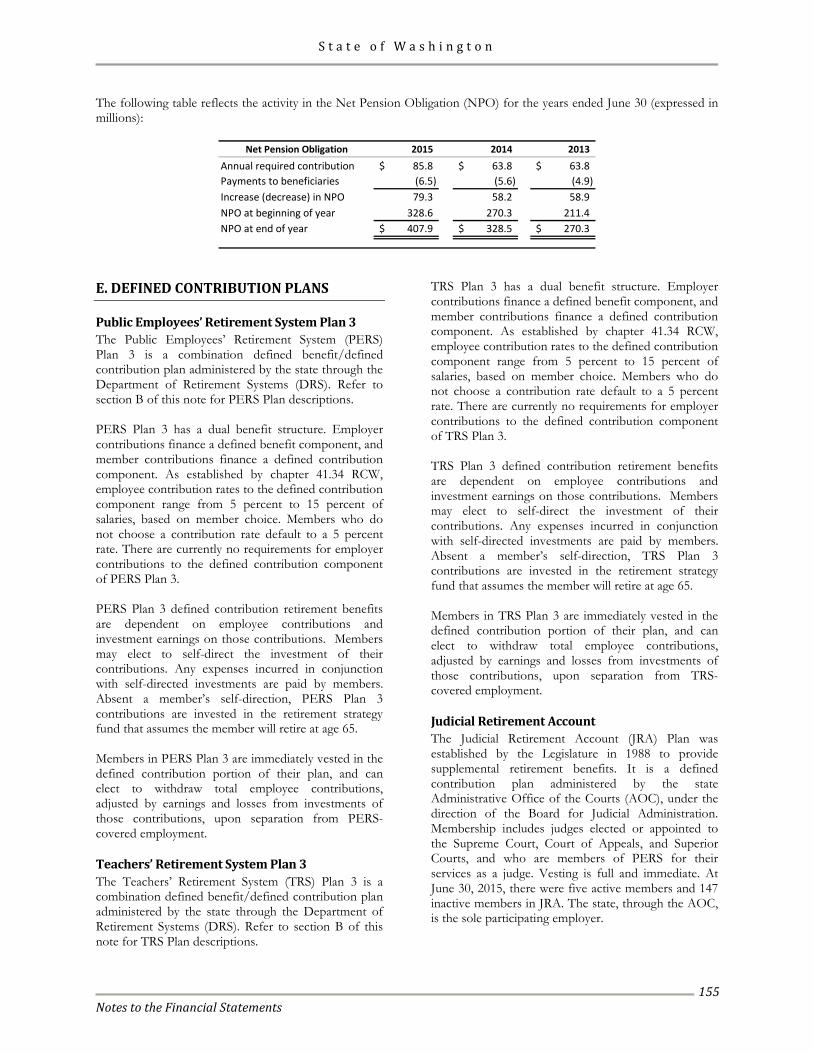
S t a t e o f W a s h i n g t o n
Notes to the Financial Statements
155
The following table reflects the activity in the Net Pension Obligation (NPO) for the years ended June 30 (expressed in millions):
Net Pension Obligation 2015 2014 2013
Annual required contribution 85.8$ 63.8$ 63.8$ Payments to beneficiaries (6.5) (5.6) (4.9) Increase (decrease) in NPO 79.3 58.2 58.9 NPO at beginning of year 328.6 270.3 211.4 NPO at end of year 407.9$ 328.5$ 270.3$
E. DEFINED CONTRIBUTION PLANS
Public Employees’ Retirement System Plan 3 The Public Employees’ Retirement System (PERS) Plan 3 is a combination defined benefit/defined contribution plan administered by the state through the Department of Retirement Systems (DRS). Refer to section B of this note for PERS Plan descriptions. PERS Plan 3 has a dual benefit structure. Employer contributions finance a defined benefit component, and member contributions finance a defined contribution component. As established by chapter 41.34 RCW, employee contribution rates to the defined contribution component range from 5 percent to 15 percent of salaries, based on member choice. Members who do not choose a contribution rate default to a 5 percent rate. There are currently no requirements for employer contributions to the defined contribution component of PERS Plan 3. PERS Plan 3 defined contribution retirement benefits are dependent on employee contributions and investment earnings on those contributions. Members may elect to self-direct the investment of their contributions. Any expenses incurred in conjunction with self-directed investments are paid by members. Absent a member’s self-direction, PERS Plan 3 contributions are invested in the retirement strategy fund that assumes the member will retire at age 65. Members in PERS Plan 3 are immediately vested in the defined contribution portion of their plan, and can elect to withdraw total employee contributions, adjusted by earnings and losses from investments of those contributions, upon separation from PERS-covered employment. Teachers’ Retirement System Plan 3 The Teachers’ Retirement System (TRS) Plan 3 is a combination defined benefit/defined contribution plan administered by the state through the Department of Retirement Systems (DRS). Refer to section B of this note for TRS Plan descriptions.
TRS Plan 3 has a dual benefit structure. Employer contributions finance a defined benefit component, and member contributions finance a defined contribution component. As established by chapter 41.34 RCW, employee contribution rates to the defined contribution component range from 5 percent to 15 percent of salaries, based on member choice. Members who do not choose a contribution rate default to a 5 percent rate. There are currently no requirements for employer contributions to the defined contribution component of TRS Plan 3. TRS Plan 3 defined contribution retirement benefits are dependent on employee contributions and investment earnings on those contributions. Members may elect to self-direct the investment of their contributions. Any expenses incurred in conjunction with self-directed investments are paid by members. Absent a member’s self-direction, TRS Plan 3 contributions are invested in the retirement strategy fund that assumes the member will retire at age 65. Members in TRS Plan 3 are immediately vested in the defined contribution portion of their plan, and can elect to withdraw total employee contributions, adjusted by earnings and losses from investments of those contributions, upon separation from TRS-covered employment. Judicial Retirement Account The Judicial Retirement Account (JRA) Plan was established by the Legislature in 1988 to provide supplemental retirement benefits. It is a defined contribution plan administered by the state Administrative Office of the Courts (AOC), under the direction of the Board for Judicial Administration. Membership includes judges elected or appointed to the Supreme Court, Court of Appeals, and Superior Courts, and who are members of PERS for their services as a judge. Vesting is full and immediate. At June 30, 2015, there were five active members and 147 inactive members in JRA. The state, through the AOC, is the sole participating employer.
S t a t e o f W a s h i n g t o n
Notes to the Financial Statements
156
Beginning January 1, 2007, any justice or judge who was in a judicial position at that time and who chose to join the Judicial Benefit Multiplier (JBM) Program could no longer participate in JRA. Any justice or judge elected or appointed to office on or after January 1, 2007 who elects to join DRS membership will also be mandated into JBM. If they have already established membership in PERS or TRS Plan 1 they will rejoin that plan, but if they have never had membership, they will be enrolled as a member of both PERS Plan 2 and JBM. JRA Plan members are required to contribute 2.5 percent of covered salary. The state, as employer, contributes an equal amount on a monthly basis. The employer and employee obligations to contribute are established per chapter 2.14 RCW. Plan provisions and contribution requirements are established in state statute and may be amended only by the Legislature. A JRA member who separates from judicial service for any reason is entitled to receive a lump-sum distribution of the accumulated contributions. The Administrator of JRA may adopt rules establishing other payment options. If a member dies, the amount of accumulated contributions standing to the member’s credit at the time of the member’s death is to be paid to the member’s estate, or such person or persons, trust or organization, as the member has nominated by written designation. For fiscal year 2015 the state recognized pension expense for contributions of $20 thousand made to employee accounts. No plan refunds were made. The Administrator of JRA has entered an agreement with DRS for accounting and reporting services, and the Washington State Investment Board (WSIB) for investment services. Under this agreement, DRS is responsible for all record keeping, accounting, and reporting of member accounts and the WSIB is granted the full power to establish investment policy, develop participant investment options and manage the investment funds for the JRA Plan, consistent with the provisions of RCW 2.14.080 and 43.84.150.
Higher Education Retirement Plans The Higher Education Retirement Plans are privately administered defined contribution plans with a supplemental defined benefit plan component. The state and regional universities, the state college, the state community and technical colleges, and the Student Achievement Council each participate in a plan. As authorized by chapter 28B.10 RCW, the plans cover faculty and other positions as designated by each participating employer. Contributions to the plans are invested in annuity contracts or mutual fund accounts offered by one or more fund sponsors. Benefits from fund sponsors are available upon separation or retirement at the member’s option. Employees have, at all times, a 100 percent vested interest in their accumulations. RCW 28B.10.400, et. seq. assigns the authority to establish and amend benefit provisions to the board of regents of the state universities, the boards of trustees of the regional universities and the state college, the state board for community colleges, and the Student Achievement Council. Employee contribution rates, based on age, range from 5 percent to 10 percent of salary. The employers match the employee contributions. The employer and employee obligations to contribute are established per chapter 28B.10 RCW. For fiscal year 2015 employer and employee contributions were $194.0 and $193.8 million respectively, for a total of $387.8 million.
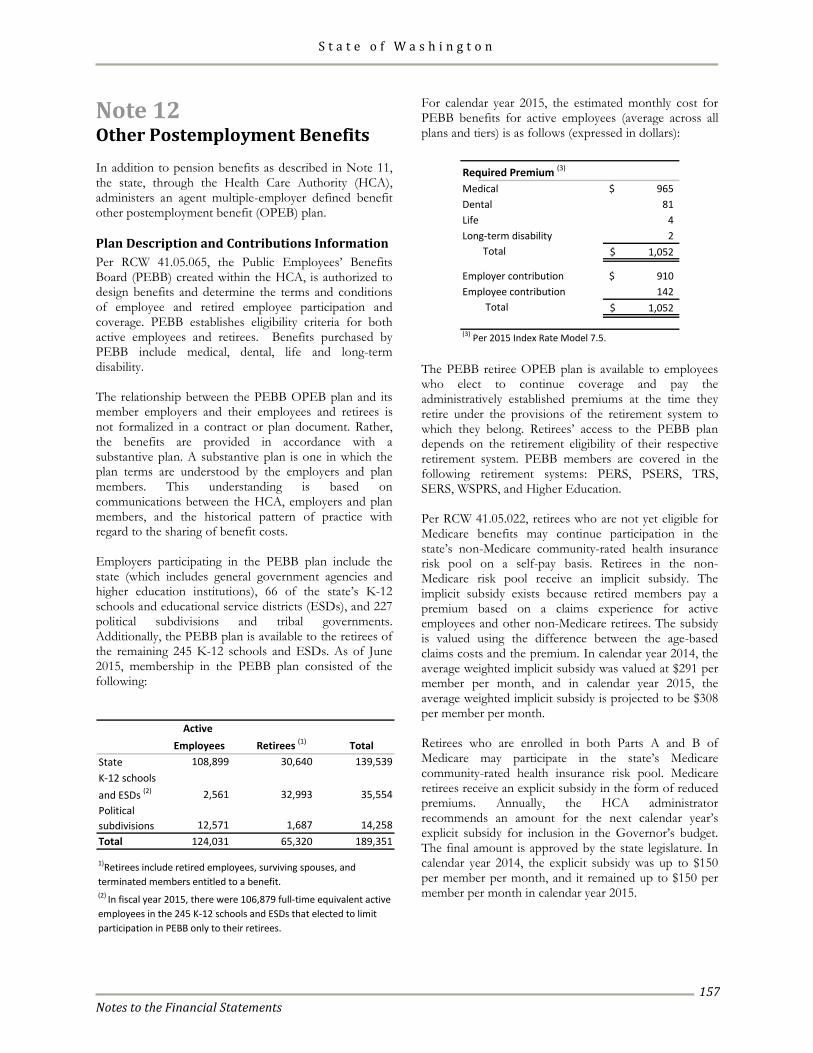
S t a t e o f W a s h i n g t o n
Notes to the Financial Statements
157
Note 12 Other Postemployment Benefits In addition to pension benefits as described in Note 11, the state, through the Health Care Authority (HCA), administers an agent multiple-employer defined benefit other postemployment benefit (OPEB) plan. Plan Description and Contributions Information Per RCW 41.05.065, the Public Employees’ Benefits Board (PEBB) created within the HCA, is authorized to design benefits and determine the terms and conditions of employee and retired employee participation and coverage. PEBB establishes eligibility criteria for both active employees and retirees. Benefits purchased by PEBB include medical, dental, life and long-term disability. The relationship between the PEBB OPEB plan and its member employers and their employees and retirees is not formalized in a contract or plan document. Rather, the benefits are provided in accordance with a substantive plan. A substantive plan is one in which the plan terms are understood by the employers and plan members. This understanding is based on communications between the HCA, employers and plan members, and the historical pattern of practice with regard to the sharing of benefit costs. Employers participating in the PEBB plan include the state (which includes general government agencies and higher education institutions), 66 of the state’s K-12 schools and educational service districts (ESDs), and 227 political subdivisions and tribal governments. Additionally, the PEBB plan is available to the retirees of the remaining 245 K-12 schools and ESDs. As of June 2015, membership in the PEBB plan consisted of the following:
Active Employees Retirees (1) Total
State 108,899 30,640 139,539 K-12 schools and ESDs (2) 2,561 32,993 35,554 Political subdivisions 12,571 1,687 14,258 Total 124,031 65,320 189,351
1)Retirees include retired employees, surviving spouses, and terminated members entitled to a benefit.(2) In fiscal year 2015, there were 106,879 full-time equivalent active employees in the 245 K-12 schools and ESDs that elected to limit participation in PEBB only to their retirees.
For calendar year 2015, the estimated monthly cost for PEBB benefits for active employees (average across all plans and tiers) is as follows (expressed in dollars):
Required Premium (3)
Medical 965$ Dental 81 Life 4 Long-term disability 2
Total 1,052$
Employer contribution 910$ Employee contribution 142
Total 1,052$
(3) Per 2015 Index Rate Model 7.5. The PEBB retiree OPEB plan is available to employees who elect to continue coverage and pay the administratively established premiums at the time they retire under the provisions of the retirement system to which they belong. Retirees’ access to the PEBB plan depends on the retirement eligibility of their respective retirement system. PEBB members are covered in the following retirement systems: PERS, PSERS, TRS, SERS, WSPRS, and Higher Education. Per RCW 41.05.022, retirees who are not yet eligible for Medicare benefits may continue participation in the state’s non-Medicare community-rated health insurance risk pool on a self-pay basis. Retirees in the non-Medicare risk pool receive an implicit subsidy. The implicit subsidy exists because retired members pay a premium based on a claims experience for active employees and other non-Medicare retirees. The subsidy is valued using the difference between the age-based claims costs and the premium. In calendar year 2014, the average weighted implicit subsidy was valued at $291 per member per month, and in calendar year 2015, the average weighted implicit subsidy is projected to be $308 per member per month. Retirees who are enrolled in both Parts A and B of Medicare may participate in the state’s Medicare community-rated health insurance risk pool. Medicare retirees receive an explicit subsidy in the form of reduced premiums. Annually, the HCA administrator recommends an amount for the next calendar year’s explicit subsidy for inclusion in the Governor’s budget. The final amount is approved by the state legislature. In calendar year 2014, the explicit subsidy was up to $150 per member per month, and it remained up to $150 per member per month in calendar year 2015.
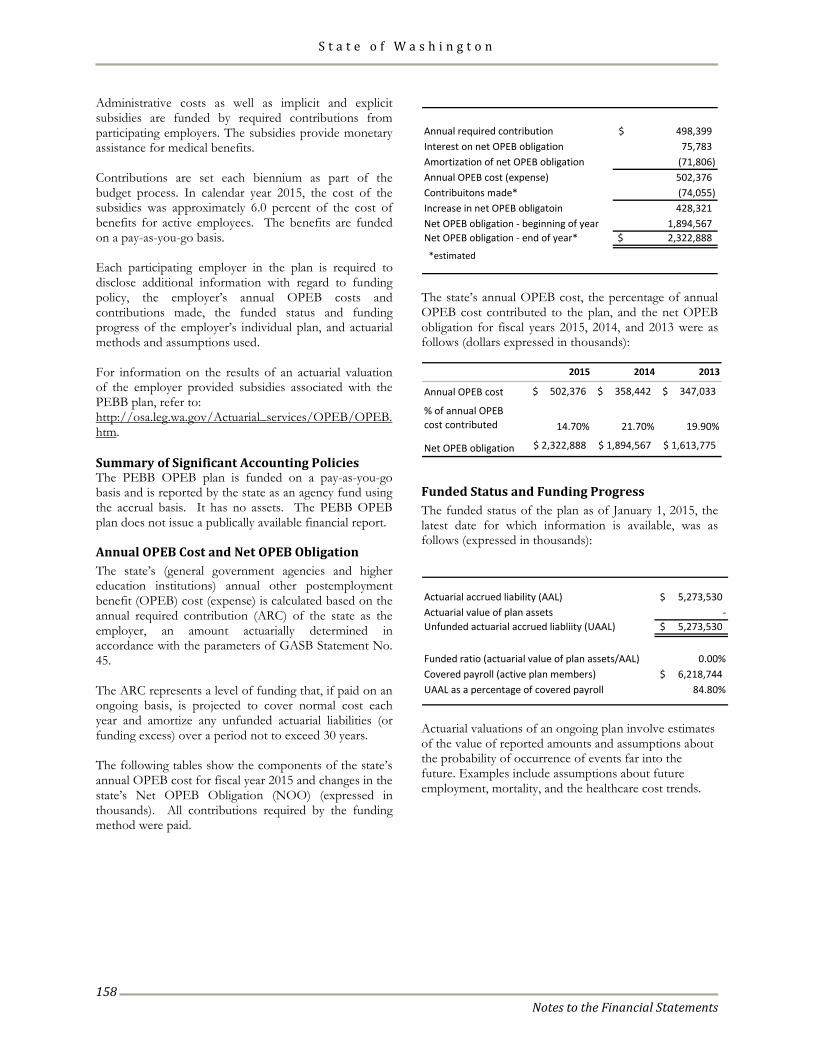
S t a t e o f W a s h i n g t o n
Notes to the Financial Statements
158
Administrative costs as well as implicit and explicit subsidies are funded by required contributions from participating employers. The subsidies provide monetary assistance for medical benefits. Contributions are set each biennium as part of the budget process. In calendar year 2015, the cost of the subsidies was approximately 6.0 percent of the cost of benefits for active employees. The benefits are funded on a pay-as-you-go basis. Each participating employer in the plan is required to disclose additional information with regard to funding policy, the employer’s annual OPEB costs and contributions made, the funded status and funding progress of the employer’s individual plan, and actuarial methods and assumptions used. For information on the results of an actuarial valuation of the employer provided subsidies associated with the PEBB plan, refer to: http://osa.leg.wa.gov/Actuarial_services/OPEB/OPEB.htm. Summary of Significant Accounting Policies The PEBB OPEB plan is funded on a pay-as-you-go basis and is reported by the state as an agency fund using the accrual basis. It has no assets. The PEBB OPEB plan does not issue a publically available financial report. Annual OPEB Cost and Net OPEB Obligation The state’s (general government agencies and higher education institutions) annual other postemployment benefit (OPEB) cost (expense) is calculated based on the annual required contribution (ARC) of the state as the employer, an amount actuarially determined in accordance with the parameters of GASB Statement No. 45. The ARC represents a level of funding that, if paid on an ongoing basis, is projected to cover normal cost each year and amortize any unfunded actuarial liabilities (or funding excess) over a period not to exceed 30 years. The following tables show the components of the state’s annual OPEB cost for fiscal year 2015 and changes in the state’s Net OPEB Obligation (NOO) (expressed in thousands). All contributions required by the funding method were paid.
Annual required contribution 498,399$ Interest on net OPEB obligation 75,783 Amortization of net OPEB obligation (71,806) Annual OPEB cost (expense) 502,376 Contribuitons made* (74,055) Increase in net OPEB obligatoin 428,321 Net OPEB obligation - beginning of year 1,894,567 Net OPEB obligation - end of year* 2,322,888$
*estimated
The state’s annual OPEB cost, the percentage of annual OPEB cost contributed to the plan, and the net OPEB obligation for fiscal years 2015, 2014, and 2013 were as follows (dollars expressed in thousands):
2015 2014 2013
Annual OPEB cost 502,376$ 358,442$ 347,033$
% of annual OPEBcost contributed 14.70% 21.70% 19.90%
Net OPEB obligation 2,322,888$ 1,894,567$ 1,613,775$
Funded Status and Funding Progress The funded status of the plan as of January 1, 2015, the latest date for which information is available, was as follows (expressed in thousands):
Actuarial accrued liability (AAL) 5,273,530$ Actuarial value of plan assets - Unfunded actuarial accrued liabliity (UAAL) 5,273,530$
Funded ratio (actuarial value of plan assets/AAL) 0.00%Covered payroll (active plan members) 6,218,744$ UAAL as a percentage of covered payroll 84.80%
Actuarial valuations of an ongoing plan involve estimates of the value of reported amounts and assumptions about the probability of occurrence of events far into the future. Examples include assumptions about future employment, mortality, and the healthcare cost trends.
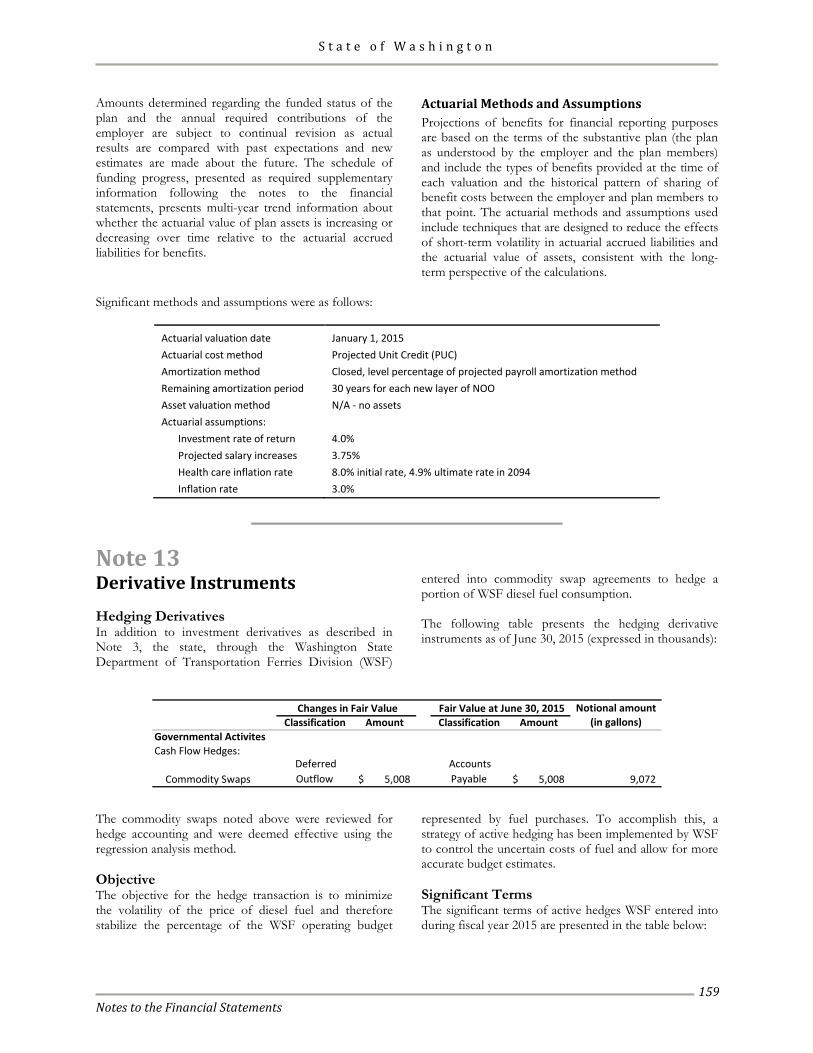
S t a t e o f W a s h i n g t o n
Notes to the Financial Statements
159
Amounts determined regarding the funded status of the plan and the annual required contributions of the employer are subject to continual revision as actual results are compared with past expectations and new estimates are made about the future. The schedule of funding progress, presented as required supplementary information following the notes to the financial statements, presents multi-year trend information about whether the actuarial value of plan assets is increasing or decreasing over time relative to the actuarial accrued liabilities for benefits.
Actuarial Methods and Assumptions Projections of benefits for financial reporting purposes are based on the terms of the substantive plan (the plan as understood by the employer and the plan members) and include the types of benefits provided at the time of each valuation and the historical pattern of sharing of benefit costs between the employer and plan members to that point. The actuarial methods and assumptions used include techniques that are designed to reduce the effects of short-term volatility in actuarial accrued liabilities and the actuarial value of assets, consistent with the long-term perspective of the calculations.
Significant methods and assumptions were as follows:
Actuarial valuation date January 1, 2015 Actuarial cost method Projected Unit Credit (PUC) Amortization method Closed, level percentage of projected payroll amortization method Remaining amortization period 30 years for each new layer of NOO Asset valuation method N/A - no assets Actuarial assumptions:
Investment rate of return 4.0% Projected salary increases 3.75% Health care inflation rate 8.0% initial rate, 4.9% ultimate rate in 2094 Inflation rate 3.0%
Note 13 Derivative Instruments Hedging Derivatives In addition to investment derivatives as described in Note 3, the state, through the Washington State Department of Transportation Ferries Division (WSF)
entered into commodity swap agreements to hedge a portion of WSF diesel fuel consumption. The following table presents the hedging derivative instruments as of June 30, 2015 (expressed in thousands):
Notional amount Classification Amount Classification Amount (in gallons)
Governmental ActivitesCash Flow Hedges:
Commodity Swaps Deferred Outflow 5,008$
Accounts Payable 5,008$ 9,072
Changes in Fair Value Fair Value at June 30, 2015
The commodity swaps noted above were reviewed for hedge accounting and were deemed effective using the regression analysis method. Objective The objective for the hedge transaction is to minimize the volatility of the price of diesel fuel and therefore stabilize the percentage of the WSF operating budget
represented by fuel purchases. To accomplish this, a strategy of active hedging has been implemented by WSF to control the uncertain costs of fuel and allow for more accurate budget estimates. Significant Terms The significant terms of active hedges WSF entered into during fiscal year 2015 are presented in the table below:
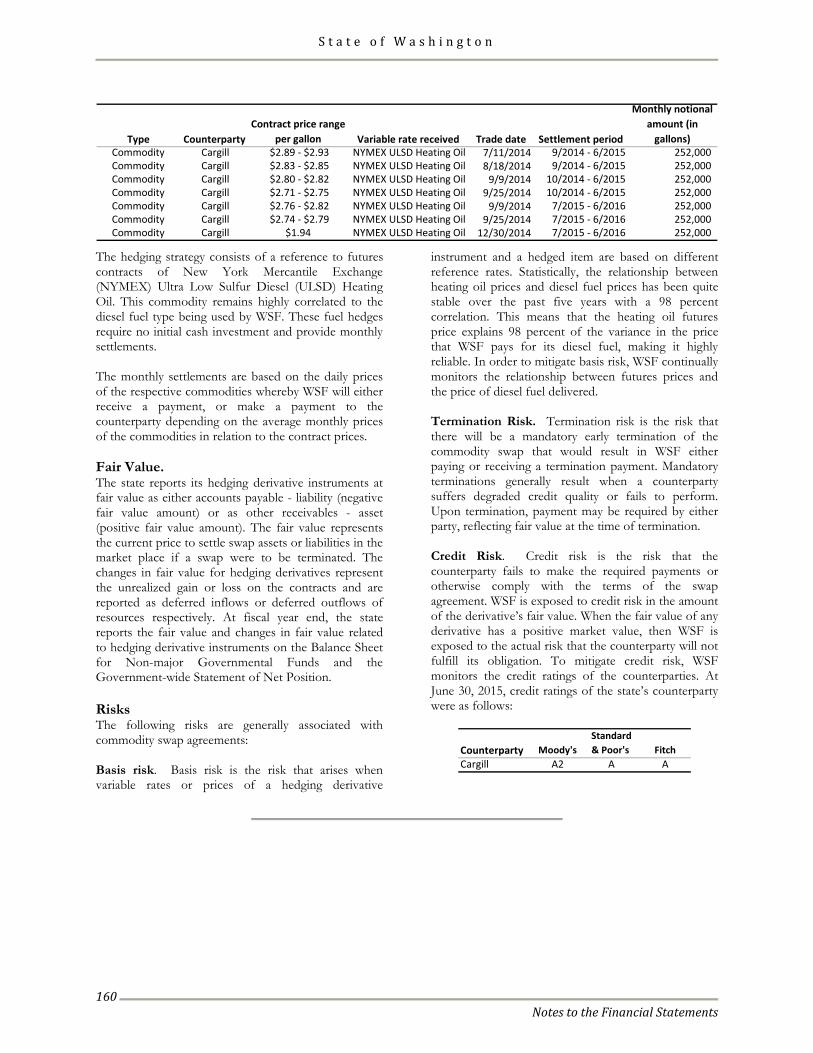
S t a t e o f W a s h i n g t o n
Notes to the Financial Statements
160
Type CounterpartyContract price range
per gallon Variable rate received Trade date Settlement period
Monthly notional amount (in
gallons)Commodity Cargill $2.89 - $2.93 NYMEX ULSD Heating Oil 7/11/2014 9/2014 - 6/2015 252,000 Commodity Cargill $2.83 - $2.85 NYMEX ULSD Heating Oil 8/18/2014 9/2014 - 6/2015 252,000 Commodity Cargill $2.80 - $2.82 NYMEX ULSD Heating Oil 9/9/2014 10/2014 - 6/2015 252,000 Commodity Cargill $2.71 - $2.75 NYMEX ULSD Heating Oil 9/25/2014 10/2014 - 6/2015 252,000 Commodity Cargill $2.76 - $2.82 NYMEX ULSD Heating Oil 9/9/2014 7/2015 - 6/2016 252,000 Commodity Cargill $2.74 - $2.79 NYMEX ULSD Heating Oil 9/25/2014 7/2015 - 6/2016 252,000 Commodity Cargill $1.94 NYMEX ULSD Heating Oil 12/30/2014 7/2015 - 6/2016 252,000
The hedging strategy consists of a reference to futures contracts of New York Mercantile Exchange (NYMEX) Ultra Low Sulfur Diesel (ULSD) Heating Oil. This commodity remains highly correlated to the diesel fuel type being used by WSF. These fuel hedges require no initial cash investment and provide monthly settlements. The monthly settlements are based on the daily prices of the respective commodities whereby WSF will either receive a payment, or make a payment to the counterparty depending on the average monthly prices of the commodities in relation to the contract prices. Fair Value. The state reports its hedging derivative instruments at fair value as either accounts payable - liability (negative fair value amount) or as other receivables - asset (positive fair value amount). The fair value represents the current price to settle swap assets or liabilities in the market place if a swap were to be terminated. The changes in fair value for hedging derivatives represent the unrealized gain or loss on the contracts and are reported as deferred inflows or deferred outflows of resources respectively. At fiscal year end, the state reports the fair value and changes in fair value related to hedging derivative instruments on the Balance Sheet for Non-major Governmental Funds and the Government-wide Statement of Net Position. Risks The following risks are generally associated with commodity swap agreements: Basis risk. Basis risk is the risk that arises when variable rates or prices of a hedging derivative
instrument and a hedged item are based on different reference rates. Statistically, the relationship between heating oil prices and diesel fuel prices has been quite stable over the past five years with a 98 percent correlation. This means that the heating oil futures price explains 98 percent of the variance in the price that WSF pays for its diesel fuel, making it highly reliable. In order to mitigate basis risk, WSF continually monitors the relationship between futures prices and the price of diesel fuel delivered. Termination Risk. Termination risk is the risk that there will be a mandatory early termination of the commodity swap that would result in WSF either paying or receiving a termination payment. Mandatory terminations generally result when a counterparty suffers degraded credit quality or fails to perform. Upon termination, payment may be required by either party, reflecting fair value at the time of termination. Credit Risk. Credit risk is the risk that the counterparty fails to make the required payments or otherwise comply with the terms of the swap agreement. WSF is exposed to credit risk in the amount of the derivative’s fair value. When the fair value of any derivative has a positive market value, then WSF is exposed to the actual risk that the counterparty will not fulfill its obligation. To mitigate credit risk, WSF monitors the credit ratings of the counterparties. At June 30, 2015, credit ratings of the state’s counterparty were as follows:
Counterparty Moody's Standard & Poor's Fitch
Cargill A2 A A
S t a t e o f W a s h i n g t o n
Notes to the Financial Statements
161
Note 14 Commitments and Contingencies A. CAPITAL COMMITMENTS Outstanding commitments related to state infrastructure and facility construction, improvement, and/or renovation totaled $2.42 billion at June 30, 2015. B. ENCUMBRANCES Encumbrances, which represent commitments related to unperformed contracts for goods or services, are included in restricted, committed or assigned fund balance, as appropriate. Operating encumbrances lapse at the end of the applicable appropriation. Capital outlay encumbrances lapse at the end of the biennium unless reappropriated by the Legislature in the ensuing biennium. Encumbrances outstanding against continuing appropriations at the end of fiscal year 2015 are (expressed in thousands):
General Fund $ 29,750
Higher Education Special Revenue Fund 169
Nonmajor Governmental Funds 530,924
C. SUMMARY OF SIGNIFICANT LITIGATION Pending Litigation The state and its agencies are parties to numerous routine legal proceedings that normally occur in governmental operations. In addition, at any given point, there may be numerous lawsuits involving the implementation, reduction, or elimination of specific state programs that could significantly impact expenditures, revenues, and potentially have future budgetary impact. This summary considers significant litigation not covered by tort insurance. Tort case liabilities are disclosed in Note 7.E, Claims and Judgments, Risk Management. The state is the defendant in a number of cases alleging inadequate funding of state programs or services. Claims include: funding inadequacies and inequities in basic education; inadequate funding for care of the disabled, and elderly; and inadequate funding for the provision of, daily personal care, medical and mental health services to children, the elderly, and the disabled. Collective claims in these programmatic and service cases exceed $35 million exclusive of the basic education case, which will be substantial but is difficult to quantify at this juncture. In addition, adverse rulings in some of these cases could result in significant future costs.
The state is also a defendant in a number of cases contesting: the denial of health care benefits to seasonal and part-time state employees, the methodologies used to calculate reimbursement rates to certain health care providers, and the scope of covered care. Claims in this category exceed $150 million. The Department of Revenue routinely has claims for refunds or exemptions in various stages of administrative and legal review. Cases involving such claims currently total approximately $50 million, though an adverse ruling could result in additional claims being brought by similarly situated taxpayers. The state is a defendant in a number of lawsuits related to: habitat restoration and environmental remediation arising out of highway/roadway construction and maintenance. While estimates are not available for all lawsuits, claims for damages equate to approximately $155 million per annum. The state is a defendant in a number of lawsuits by employees and other entities alleging various infractions of law or contract. These suits claim back pay, damages, or future entitlements valued at approximately $150 million. The state is contesting these lawsuits and the outcomes are uncertain at this time. Tobacco Settlement In November 1998, Washington joined 45 other states in a Master Settlement Agreement (MSA) with the nation’s largest tobacco manufacturers to provide restitution for monies spent under health care programs for the treatment of smoking-related illnesses. Washington’s annual payment under the settlement was approximately $109.2 million in fiscal year 2015. Beginning in 2008, Washington received the first of ten “strategic contribution payments” under the MSA. This payment is subject to the same offsets, reductions, and adjustments as are applicable to the annual base payment. The fiscal year 2015 strategic contribution payment was approximately $37 million. In 2006, 2007, 2008, and 2009, determinations were made that disadvantages experienced by manufacturers as a result of participating in the MSA were a “significant factor” contributing to market share losses by those manufacturers. These determinations related to sales data for the years 2003, 2004, 2005, and 2006. With respect to 2003 sales data, Washington and a number of other states participated in a single national arbitration of the nonparticipating manufacturer (NPM) adjustment dispute. In late 2013, the arbitration panel issued a decision in Washington’s favor, unanimously concluding that Washington proved that
S t a t e o f W a s h i n g t o n
Notes to the Financial Statements
162
it diligently enforced the qualifying statute during calendar year 2003 and, therefore, for that calendar year is not subject to an NPM adjustment under the MSA. Of the 15 states that went to an arbitration hearing, only nine were found to have diligently enforced. As a result of that decision, in fiscal year 2014, Washington received approximately $14 million more than it would have otherwise received due to the release of amounts placed in the MSA Disputed Payment Account (DPA) related to the 2003 calendar year. More importantly, if Washington had not prevailed in the arbitration, its fiscal year 2014 payment would have been reduced by approximately $100 million due to the application of the NPM adjustment. The panel’s decision addressed only the 2003 calendar year. Washington and other states are engaged in negotiations with participating manufacturers regarding potential arbitration proceedings involving the 2004 calendar year. Washington faces a potential “nonparticipating manufacturer (NPM) adjustment” in its share of between $0 and $137 million for the year 2004, $0 and $131 million for the year 2005, and $0 and $119 million for the year 2006. In addition, the states and the participating manufacturers have entered into an agreement under which the states will not contest that the disadvantages experienced by manufacturers as a result of participating in the MSA were a significant factor contributing to market share losses for the years 2007 through 2013. Washington faces potential NPM adjustments that put at risk Washington’s entire MSA payment. For example, the potential NPM adjustment for the year 2007 is between $0 and $123 million, and for the year 2008, it is between $0 and $173 million. D. FEDERAL ASSISTANCE The state has received federal financial assistance for specific purposes that are generally subject to review or audit by the grantor agencies. Entitlement to this assistance is generally conditional upon compliance with the terms and conditions of grant agreements and applicable federal regulations, including the expenditure of assistance for allowable purposes. Any disallowance resulting from a review or audit may become a liability of the state. The state estimates and recognizes claims and judgments liabilities for disallowances when determined by the grantor agency or for probable disallowances based on experience pertaining to these grants; however, these recognized liabilities and any unrecognized disallowances are considered immaterial to the state’s overall financial condition.
E. ARBITRAGE REBATE Rebatable arbitrage is defined by the Internal Revenue Service Code Section 148 as earnings on investments purchased from the gross proceeds of a bond issue that are in excess of the amount that would have been earned if the investments were invested at a yield equal to the yield on the bond issue. The rebatable arbitrage must be paid to the federal government. The state estimates that rebatable arbitrage liability, if any, will be immaterial to its overall financial condition. F. FINANCIAL GUARANTEES School District Credit Enhancement Program In accordance with Chapter 39.98 RCW (School District Credit Enhancement Program), the state has guaranteed outstanding voter-approved general obligation bonds of school districts within the state in the amount of $9.33 billion at June 30, 2015. The guarantees extend through the life of the bonds, with a final maturity date of the longest series in 2043. In the event that a school district has insufficient funds to make a required debt service payment on a guaranteed bond, the state is required to transfer sufficient funds to make the payment. School districts for which the state has made all or part of a debt service payment shall reimburse the state treasurer for all money drawn on their behalf, as well as interest and penalties. The state has not paid debt service on any school debt since the inception of the program in 2000. G. GUARANTEED EDUCATION TUITION (GET) LOSS CONTINGENCY Engrossed Second Substitute Senate Bill (E2SSB) 5954 was signed into law by the Governor on July 6, 2015, establishing the College Affordability Program. It reduces tuition at all public institutions of higher education during the next two years and limits tuition growth in future years. Subsequent to the passage of E2SSB 5954, the State Guaranteed Education Tuition (GET) Program Committee authorized account holders, upon request, to receive a refund of their contributions or a fixed payout value, whichever is greater. Account holders have until December 15, 2016, to request a refund. The financial impact of this action cannot reasonably be estimated as of the date of these financial statements.
S t a t e o f W a s h i n g t o n
Notes to the Financial Statements
163
H. OTHER COMMITMENTS AND CONTINGENCIES Local Option Capital Asset Lending Program On September 1, 1998, the state lease-purchase program was extended to local governments seeking low cost financing of essential equipment and in the year 2000 for real estate. The Local Option Capital Assets Lending (LOCAL) program allows local governments to pool their financing requests together with Washington state agencies in Certificates of Participation (COPs). Refer to Note 7.B for the state’s COP disclosure. These COPs do not constitute a debt or pledge of the full faith and credit of the state; rather, local governments pledge their full faith and credit in a general obligation pledge. In the event that any local government fails to make any payment, the state is obligated to withhold an
amount sufficient to make such payment from the local government’s share, if any, of state revenues or other amounts authorized or required by law to be distributed by the state to such local government, if otherwise legally permissible. Upon failure of any local government to make a payment, the state is further obligated, to the extent of legally available appropriated funds to make such payment on behalf of such local government. The local government remains obligated to make all COP payments and reimburse the state for any conditional payments. As of June 30, 2015, outstanding certificates of participation notes totaled $81.2 million for 150 local governments participating in LOCAL. The state estimates that the LOCAL program liability, if any, will be immaterial to its overall financial condition.
Note 15 Subsequent Events A. BOND ISSUES In September 2015, the state issued: • $188.0 million in motor vehicle fuel tax general
obligation bonds for funding various transportation projects.
• $188.3 million in general obligation refunding bonds for the purpose of refunding certain various purpose general obligation bonds of the state.
• $443.8 million in general obligation bonds for
various state capital projects.
• $51.1 million in general obligation (green bonds) to fund certain projects which have been identified as environmentally beneficial.
• $60.6 million in taxable general obligation bonds for capital projects and loan programs for low-income housing and various energy efficiency and renewable energy projects.
In September 2015, the University of Washington issued $159.2 million in general revenue and refunding bonds and $36.4 million in general revenue and
refunding taxable bonds to refund Northwest Hospital commercial papers, fund Denny Hall, animal care and research facilities, SW campus central utility plant, and other internal lending program projects. Also in September 2015, the University of Washington through Washington Biomedical Research Properties 3.2, a blended component unit, issued $132.1 million in lease revenue bonds to fund the design, construction, and equipping of a new biomedical research facility.
In September 2015, The Evergreen State College issued $4.1 million in revenue refunding bonds to refund housing revenue bonds.
Later in the 2015 calendar year, Washington State University is planning to issue approximately $40.0 million in general revenue bonds to construct a Student Union Building on the Tri-Cities campus and renovate the bookstore building. B. CERTIFICATES OF PARTICIPATION In September 2015, the state issued $57.6 million in Certificates of Participation. In October 2015, the state issued $134.6 million in Certificates of Participation and $23.4 million in refunding Certificates of Participation.
S t a t e o f W a s h i n g t o n
Notes to the Financial Statements
164
C. GENERAL ELECTION There is an initiative on the state’s November 3, 2015, general election ballot that addresses state taxes. This measure would reduce the state retail sales tax by 1 percent unless the Legislature refers to voters a constitutional amendment requiring two-thirds legislative approval or voter approval to raise taxes and legislative approval for fee increases. If passed, the measure could impact the state fiscally. Election results are not final or official until certified. By law December 3, 2015, is the last day for the Office of the Secretary of State to certify General Election returns. Information is posted on the Secretary of State’s website at http://www.sos.wa.gov. D. LEGISLATION ENACTED SUBSEQUENT TO YEAR END Engrossed Second Substitute Senate Bill (E2SSB) 5954 was signed into law by the Governor on July 6, 2015, establishing the College Affordability Program. It reduces tuition at all public institutions of higher education during the next two years and limits tuition growth in future years. E2SSB 5954 and subsequent decisions of the State Guaranteed Education Tuition (GET) Program Committee are significantly impacting the state’s GET Program. Subsequent to June 30, 2015, the GET Committee directed the Program to: • Refund approximately $75.0 million in
amortization fees to account holders. The liability for these refunds is recognized as of June 30, 2015.
• Beginning September 2, 2015, through December 15, 2016, allow permit account holders, upon request, to receive a refund of their contributions or a fixed payout value, whichever is greater, without the usual penalties, fees, and minimum holding period. The financial impact of this action cannot reasonably be estimated as of the date of these financial statements.
Information about the State Guaranteed Education Tuition Program can be found at http://www.get.wa.gov. E. STATE SUPREME COURT ORDER Washington continues to face the requirements of the state Supreme Court 2012 McCleary ruling that found that the state has failed to meet its constitutional requirement to amply fund basic education. Although funding progress was made through the 2013-15 biennial budget, it was insufficient to satisfy the court. In September 2014, the court found the state in contempt and threatened sanctions if an acceptable funding plan was not in place by the end of the 2015 legislative session. On August 13, 2015, shortly after the conclusion of the 2015 legislative session, the Washington State Supreme Court issued an order imposing daily penalties of $100 thousand until the legislature fully funds basic education as ordered in prior court rulings. .
S t a t e o f W a s h i n g t o n
Required Supplementary Information
165
RSI Required Supplementary Information

S t a t e o f W a s h i n g t o n
Required Supplementary Information
166
This page intentionally left blank.
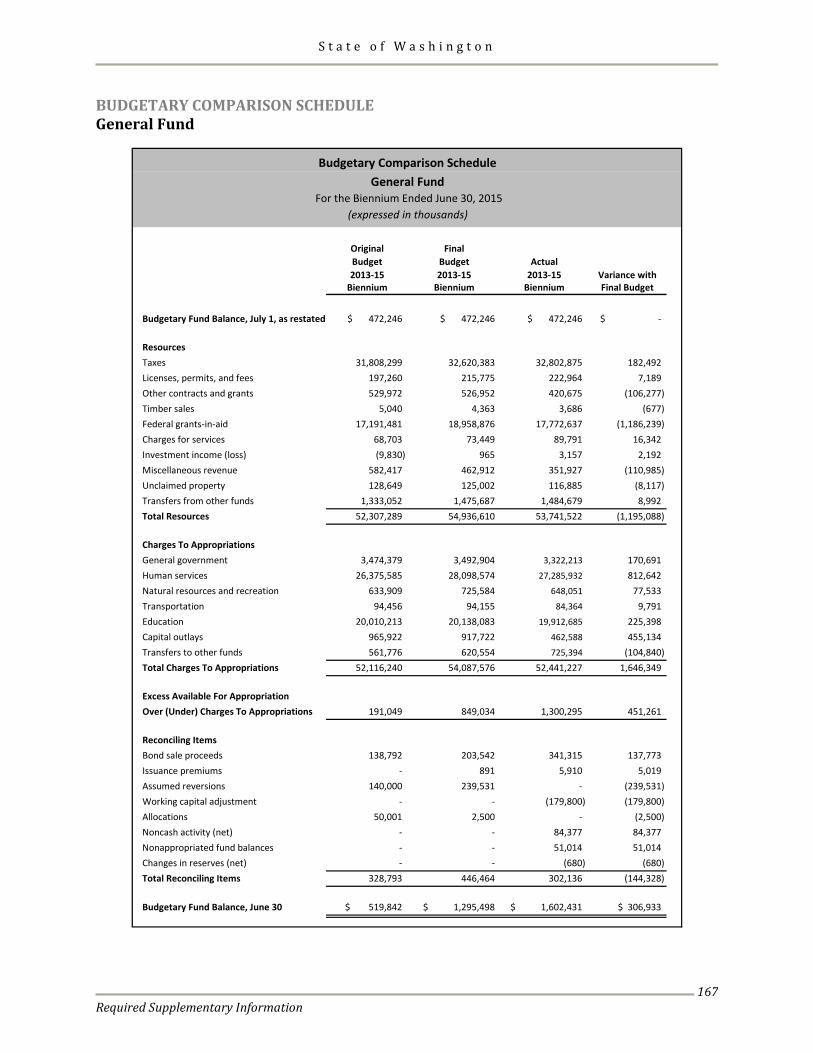
S t a t e o f W a s h i n g t o n
Required Supplementary Information
167
BUDGETARY COMPARISON SCHEDULE General Fund
Original FinalBudget Budget Actual2013-15 2013-15 2013-15 Variance with
Biennium Biennium Biennium Final Budget
Budgetary Fund Balance, July 1, as restated $ 472,246 $ 472,246 $ 472,246 $ -
ResourcesTaxes 31,808,299 32,620,383 32,802,875 182,492 Licenses, permits, and fees 197,260 215,775 222,964 7,189 Other contracts and grants 529,972 526,952 420,675 (106,277) Timber sales 5,040 4,363 3,686 (677) Federal grants-in-aid 17,191,481 18,958,876 17,772,637 (1,186,239) Charges for services 68,703 73,449 89,791 16,342 Investment income (loss) (9,830) 965 3,157 2,192 Miscellaneous revenue 582,417 462,912 351,927 (110,985) Unclaimed property 128,649 125,002 116,885 (8,117) Transfers from other funds 1,333,052 1,475,687 1,484,679 8,992 Total Resources 52,307,289 54,936,610 53,741,522 (1,195,088)
Charges To AppropriationsGeneral government 3,474,379 3,492,904 3,322,213 170,691 Human services 26,375,585 28,098,574 27,285,932 812,642 Natural resources and recreation 633,909 725,584 648,051 77,533 Transportation 94,456 94,155 84,364 9,791 Education 20,010,213 20,138,083 19,912,685 225,398 Capital outlays 965,922 917,722 462,588 455,134 Transfers to other funds 561,776 620,554 725,394 (104,840) Total Charges To Appropriations 52,116,240 54,087,576 52,441,227 1,646,349
Excess Available For Appropriation Over (Under) Charges To Appropriations 191,049 849,034 1,300,295 451,261
Reconciling ItemsBond sale proceeds 138,792 203,542 341,315 137,773 Issuance premiums - 891 5,910 5,019 Assumed reversions 140,000 239,531 - (239,531) Working capital adjustment - - (179,800) (179,800) Allocations 50,001 2,500 - (2,500) Noncash activity (net) - - 84,377 84,377 Nonappropriated fund balances - - 51,014 51,014 Changes in reserves (net) - - (680) (680) Total Reconciling Items 328,793 446,464 302,136 (144,328)
Budgetary Fund Balance, June 30 $ 519,842 $ 1,295,498 $ 1,602,431 $ 306,933
General Fund For the Biennium Ended June 30, 2015
(expressed in thousands)
Budgetary Comparison Schedule
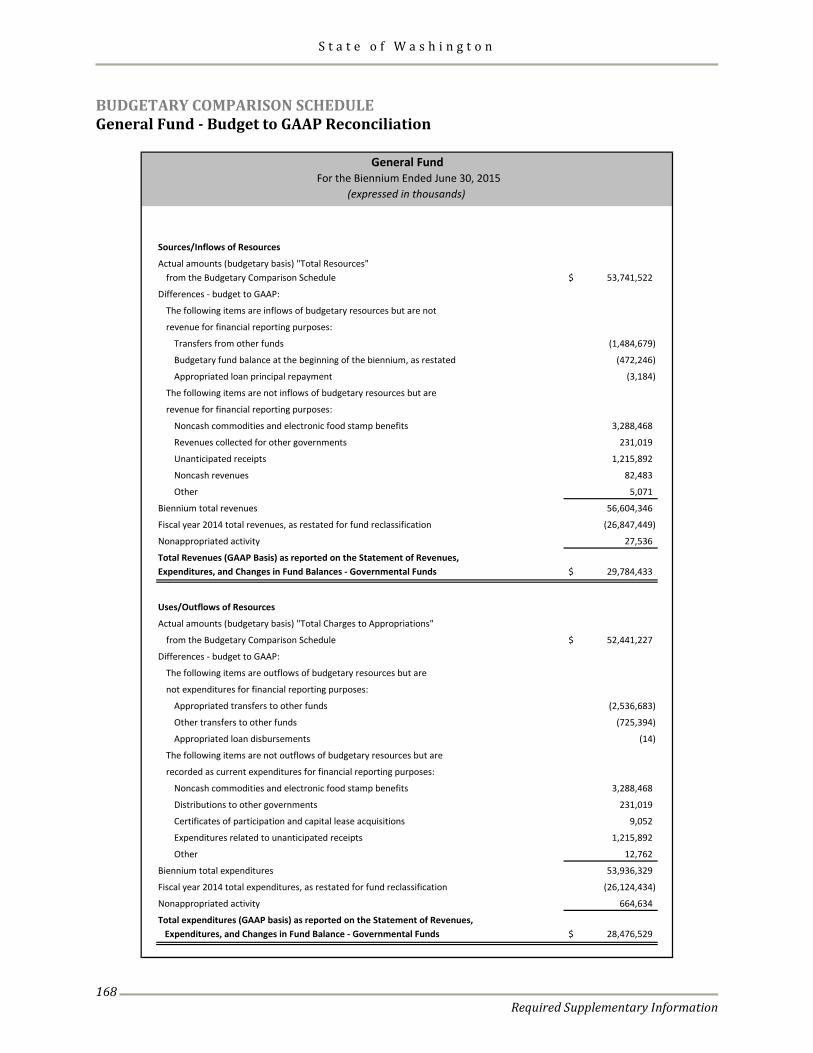
S t a t e o f W a s h i n g t o n
Required Supplementary Information
168
BUDGETARY COMPARISON SCHEDULE General Fund - Budget to GAAP Reconciliation
Sources/Inflows of Resources
Actual amounts (budgetary basis) "Total Resources"from the Budgetary Comparison Schedule 53,741,522$
Differences - budget to GAAP:
The following items are inflows of budgetary resources but are not
revenue for financial reporting purposes:
Transfers from other funds (1,484,679)
Budgetary fund balance at the beginning of the biennium, as restated (472,246)
Appropriated loan principal repayment (3,184)
The following items are not inflows of budgetary resources but are
revenue for financial reporting purposes:
Noncash commodities and electronic food stamp benefits 3,288,468
Revenues collected for other governments 231,019
Unanticipated receipts 1,215,892
Noncash revenues 82,483
Other 5,071
Biennium total revenues 56,604,346
Fiscal year 2014 total revenues, as restated for fund reclassification (26,847,449)
Nonappropriated activity 27,536
Total Revenues (GAAP Basis) as reported on the Statement of Revenues,Expenditures, and Changes in Fund Balances - Governmental Funds 29,784,433$
Uses/Outflows of Resources
Actual amounts (budgetary basis) "Total Charges to Appropriations"
from the Budgetary Comparison Schedule 52,441,227$
Differences - budget to GAAP:
The following items are outflows of budgetary resources but are
not expenditures for financial reporting purposes:
Appropriated transfers to other funds (2,536,683)
Other transfers to other funds (725,394)
Appropriated loan disbursements (14)
The following items are not outflows of budgetary resources but are
recorded as current expenditures for financial reporting purposes:
Noncash commodities and electronic food stamp benefits 3,288,468
Distributions to other governments 231,019
Certificates of participation and capital lease acquisitions 9,052
Expenditures related to unanticipated receipts 1,215,892
Other 12,762
Biennium total expenditures 53,936,329
Fiscal year 2014 total expenditures, as restated for fund reclassification (26,124,434)
Nonappropriated activity 664,634
Total expenditures (GAAP basis) as reported on the Statement of Revenues, Expenditures, and Changes in Fund Balance - Governmental Funds 28,476,529$
(expressed in thousands)
General Fund For the Biennium Ended June 30, 2015
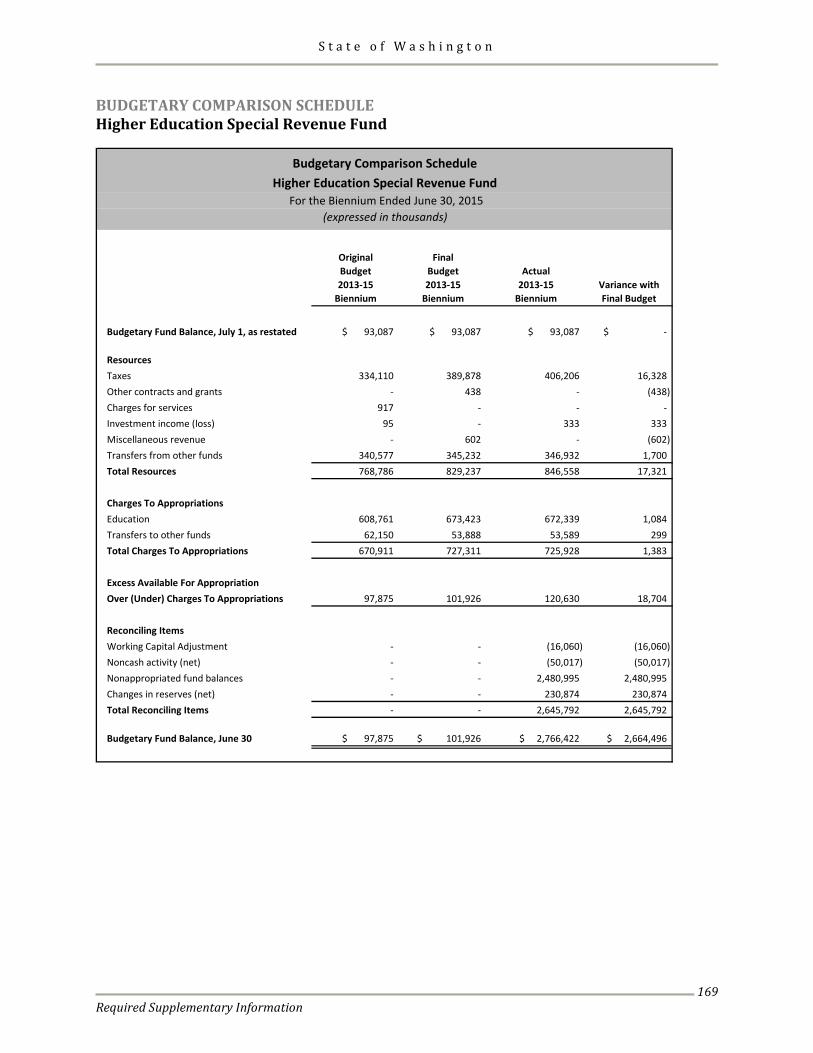
S t a t e o f W a s h i n g t o n
Required Supplementary Information
169
BUDGETARY COMPARISON SCHEDULE Higher Education Special Revenue Fund
Original FinalBudget Budget Actual2013-15 2013-15 2013-15 Variance with
Biennium Biennium Biennium Final Budget
Budgetary Fund Balance, July 1, as restated $ 93,087 $ 93,087 $ 93,087 $ -
ResourcesTaxes 334,110 389,878 406,206 16,328 Other contracts and grants - 438 - (438) Charges for services 917 - - - Investment income (loss) 95 - 333 333 Miscellaneous revenue - 602 - (602) Transfers from other funds 340,577 345,232 346,932 1,700 Total Resources 768,786 829,237 846,558 17,321
Charges To AppropriationsEducation 608,761 673,423 672,339 1,084 Transfers to other funds 62,150 53,888 53,589 299 Total Charges To Appropriations 670,911 727,311 725,928 1,383
Excess Available For Appropriation Over (Under) Charges To Appropriations 97,875 101,926 120,630 18,704
Reconciling ItemsWorking Capital Adjustment - - (16,060) (16,060) Noncash activity (net) - - (50,017) (50,017) Nonappropriated fund balances - - 2,480,995 2,480,995 Changes in reserves (net) - - 230,874 230,874 Total Reconciling Items - - 2,645,792 2,645,792
Budgetary Fund Balance, June 30 $ 97,875 $ 101,926 $ 2,766,422 $ 2,664,496
For the Biennium Ended June 30, 2015 (expressed in thousands)
Budgetary Comparison ScheduleHigher Education Special Revenue Fund
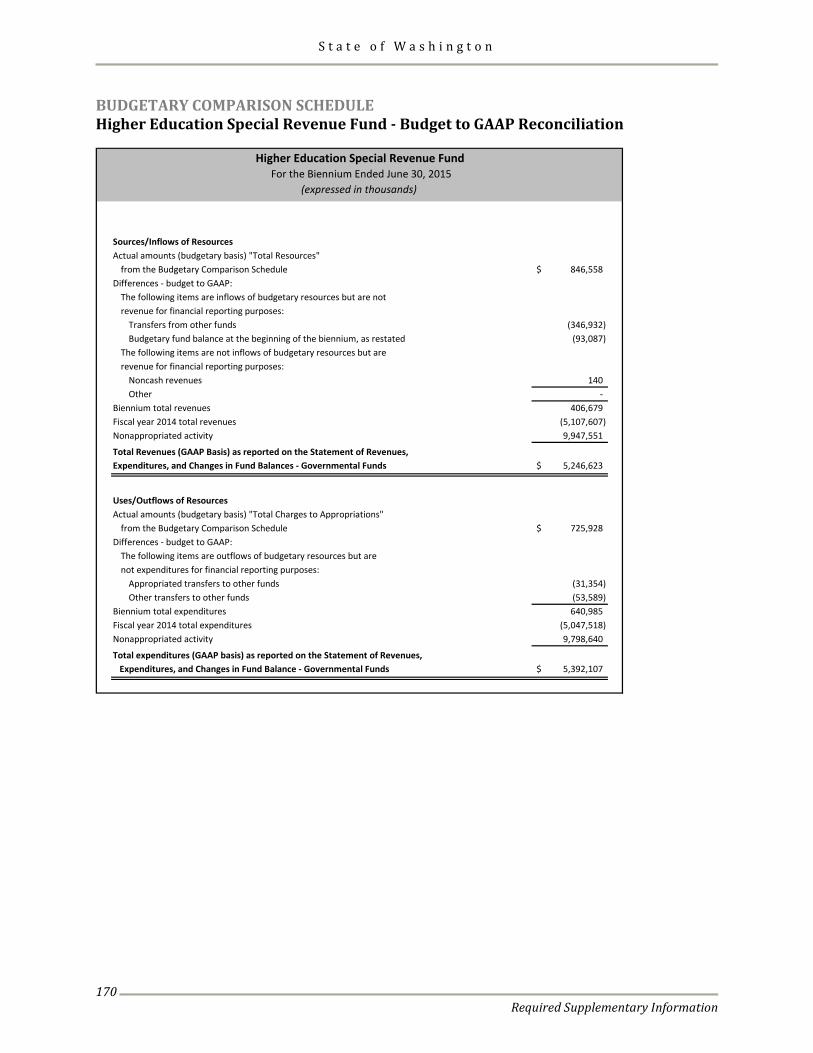
S t a t e o f W a s h i n g t o n
Required Supplementary Information
170
BUDGETARY COMPARISON SCHEDULE Higher Education Special Revenue Fund - Budget to GAAP Reconciliation
Sources/Inflows of ResourcesActual amounts (budgetary basis) "Total Resources"
from the Budgetary Comparison Schedule 846,558$ Differences - budget to GAAP:
The following items are inflows of budgetary resources but are notrevenue for financial reporting purposes:
Transfers from other funds (346,932) Budgetary fund balance at the beginning of the biennium, as restated (93,087)
The following items are not inflows of budgetary resources but arerevenue for financial reporting purposes:
Noncash revenues 140Other -
Biennium total revenues 406,679Fiscal year 2014 total revenues (5,107,607) Nonappropriated activity 9,947,551
Total Revenues (GAAP Basis) as reported on the Statement of Revenues,Expenditures, and Changes in Fund Balances - Governmental Funds 5,246,623$
Uses/Outflows of ResourcesActual amounts (budgetary basis) "Total Charges to Appropriations"
from the Budgetary Comparison Schedule 725,928$ Differences - budget to GAAP:
The following items are outflows of budgetary resources but arenot expenditures for financial reporting purposes:
Appropriated transfers to other funds (31,354) Other transfers to other funds (53,589)
Biennium total expenditures 640,985 Fiscal year 2014 total expenditures (5,047,518) Nonappropriated activity 9,798,640
Total expenditures (GAAP basis) as reported on the Statement of Revenues, Expenditures, and Changes in Fund Balance - Governmental Funds 5,392,107$
Higher Education Special Revenue Fund For the Biennium Ended June 30, 2015
(expressed in thousands)
S t a t e o f W a s h i n g t o n
Required Supplementary Information
171
BUDGETARY INFORMATION Notes to Required Supplementary Information GENERAL BUDGETARY POLICIES AND PROCEDURES The Governor is required to submit a budget to the Legislature no later than December 20 of the year preceding odd-numbered year sessions of the Legislature. The budget is a proposal for expenditures in the ensuing biennial period based upon anticipated revenues from the sources and rates existing by law at the time of submission of the budget. The Governor may additionally submit, as an appendix to the budget, a proposal for expenditures in the ensuing biennium from revenue sources derived from proposed changes in existing statutes. The appropriated budget and any necessary supplemental budgets are legally required to be adopted through the passage of appropriation bills by the Legislature and approved by the Governor. Operating appropriations are generally made at the fund/account and agency level; however, in a few cases, appropriations are made at the fund/account and agency/program level. Operating appropriations cover either the entire biennium or a single fiscal year within the biennium. Capital appropriations are biennial and are generally made at the fund/account, agency, and project level. The legal level of budgetary control is at the fund/account, agency, and appropriation level, with administrative controls established at lower levels of detail in certain instances. The accompanying budgetary schedule is not presented at the legal level of budgetary control. This is due to the large number of appropriations within individual agencies that would make such a presentation in the accompanying financial schedule extremely cumbersome. Section 2400.121 of the Governmental Accounting Standards Board Codification of Governmental Accounting and Financial Reporting Standards provides for the preparation of a separate report in these extreme cases. For the state of Washington, a separate report has been prepared for the 2013-15 biennium to illustrate legal budgetary compliance. Appropriated budget versus actual expenditures, and estimated versus actual revenues and other financing sources (uses) for appropriated funds/accounts at agency and appropriation level are presented in the Budget-to-Actual Detail Report for governmental funds. The report is available on line at http://www.ofm.wa.gov/cafr/2015/default.asp.
Legislative appropriations are strict legal limits on expenditures, and over-expenditures are prohibited. All appropriated and certain nonappropriated funds/accounts are further controlled by the executive branch through the allotment process. This process allocates the expenditure plan into monthly allotments by program, source of funds, and object of expenditure. State law does not preclude the over-expenditure of allotments. Proprietary funds/accounts can earn revenues and incur expenses (i.e., depreciation or cost of goods sold) not covered by the allotment process. Budget estimates are generally made outside the allotment process according to prepared business plans. These proprietary fund/account business plan estimates are adjusted only at the beginning of each fiscal year. Additional fiscal control is exercised through various means. OFM is authorized to estimate revenue and make expenditure allotments based on availability of unanticipated receipts, mainly federal government grant increases made during a fiscal year. Operating encumbrances lapse at the end of the applicable appropriation. Capital outlay encumbrances lapse at the end of the biennium unless reappropriated by the Legislature in the ensuing biennium. Encumbrances outstanding against continuing appropriations at fiscal year-end are reported as restricted, committed, or assigned fund balance. Budgetary Reporting vs. GAAP Reporting Governmental funds are budgeted materially in conformance with generally accepted accounting principles. However, the presentation in the accompanying budgetary schedules is different in certain respects from the corresponding Statements of Revenues, Expenditures, and Changes in Fund Balance (governmental operating statement). In the accompanying budgetary schedules, budget and actual expenditures are reported only for appropriated activities. Expenditures are classified based on whether the appropriation is from the operating or capital budget. Expenditures funded by operating budget appropriations are reported as current expenditures classified by the function of the agency receiving the appropriation. Expenditures funded by capital budget appropriations are reported as capital outlays.
S t a t e o f W a s h i n g t o n
Required Supplementary Information
172
However, in the governmental operating statements, all governmental funds are included and expenditures are classified according to what was actually purchased. Capital outlays are capital asset acquisitions such as land, buildings, and equipment. Debt service expenditures are principal and interest payments. Current expenditures are all other governmental fund expenditures classified based on the function of the agency making the expenditures. Certain governmental activities are excluded from the budgetary schedules because they are not appropriated. These activities include activities designated as nonappropriated by the Legislature. Nonappropriated activities can represent a portion of a fund such as the Higher Education Special Revenue Fund or all of a fund such as the Higher Education Endowment and Tobacco Settlement Securitization Bond Debt Service Funds. Additionally, certain items including federal surplus food commodities, electronic food stamp benefits, and resources collected and distributed to other governments are also excluded because they are not appropriated.
Further, certain expenditures are appropriated as operating transfers. These transfers are reported as operating transfers on the budgetary schedules and as expenditures on the governmental operating statements. In the General Fund, Budgetary Fund Balance equals restricted fund balance reduced by a portion that is not available for budgeting, committed, and unassigned fund balances as reported on the Governmental Funds Balance Sheet. In the Higher Education Special Revenue Fund, Budgetary Fund Balance equals the sum of restricted and committed fund balance as reported on the Governmental Funds Balance Sheet. In all other funds except Wildlife and Natural Resources, Budgetary Fund Balance equals total fund balance less nonspendable fund balance as reported on the Governmental Funds Balance Sheet. The Budgetary Fund Balance in the Wildlife and Natural Resources fund is further reduced by a portion of restricted fund balance that is not available for budgeting.
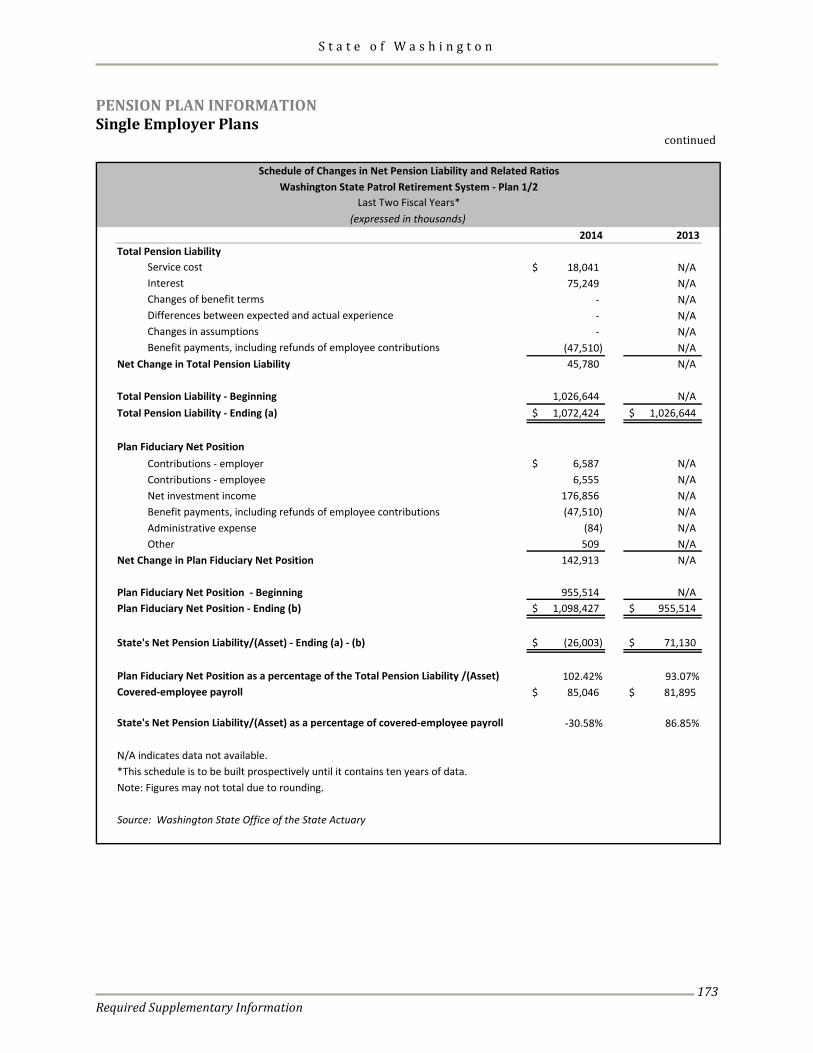
S t a t e o f W a s h i n g t o n
Required Supplementary Information
173
PENSION PLAN INFORMATION Single Employer Plans continued
2014 2013Total Pension Liability
Service cost 18,041$ N/AInterest 75,249 N/AChanges of benefit terms - N/ADifferences between expected and actual experience - N/AChanges in assumptions - N/ABenefit payments, including refunds of employee contributions (47,510) N/A
Net Change in Total Pension Liability 45,780 N/A
Total Pension Liability - Beginning 1,026,644 N/ATotal Pension Liability - Ending (a) 1,072,424$ 1,026,644$
Plan Fiduciary Net PositionContributions - employer 6,587$ N/AContributions - employee 6,555 N/ANet investment income 176,856 N/ABenefit payments, including refunds of employee contributions (47,510) N/AAdministrative expense (84) N/AOther 509 N/A
Net Change in Plan Fiduciary Net Position 142,913 N/A
Plan Fiduciary Net Position - Beginning 955,514 N/APlan Fiduciary Net Position - Ending (b) 1,098,427$ 955,514$
State's Net Pension Liability/(Asset) - Ending (a) - (b) (26,003)$ 71,130$
Plan Fiduciary Net Position as a percentage of the Total Pension Liability /(Asset) 102.42% 93.07%Covered-employee payroll 85,046$ 81,895$
State's Net Pension Liability/(Asset) as a percentage of covered-employee payroll -30.58% 86.85%
N/A indicates data not available.*This schedule is to be built prospectively until it contains ten years of data.
Source: Washington State Office of the State Actuary
Schedule of Changes in Net Pension Liability and Related RatiosWashington State Patrol Retirement System - Plan 1/2
Last Two Fiscal Years*(expressed in thousands)
Note: Figures may not total due to rounding.
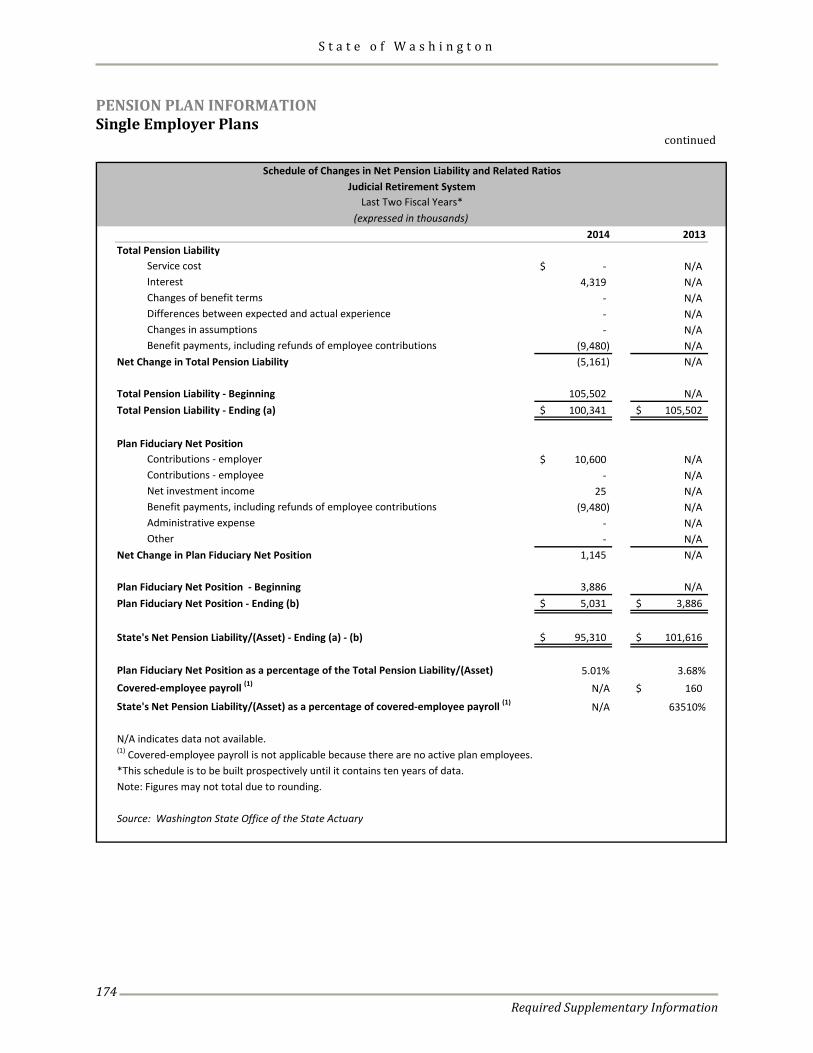
S t a t e o f W a s h i n g t o n
Required Supplementary Information
174
PENSION PLAN INFORMATION Single Employer Plans continued
2014 2013Total Pension Liability
Service cost -$ N/AInterest 4,319 N/AChanges of benefit terms - N/ADifferences between expected and actual experience - N/AChanges in assumptions - N/ABenefit payments, including refunds of employee contributions (9,480) N/A
Net Change in Total Pension Liability (5,161) N/A
Total Pension Liability - Beginning 105,502 N/ATotal Pension Liability - Ending (a) 100,341$ 105,502$
Plan Fiduciary Net PositionContributions - employer 10,600$ N/AContributions - employee - N/ANet investment income 25 N/ABenefit payments, including refunds of employee contributions (9,480) N/AAdministrative expense - N/AOther - N/A
Net Change in Plan Fiduciary Net Position 1,145 N/A
Plan Fiduciary Net Position - Beginning 3,886 N/APlan Fiduciary Net Position - Ending (b) 5,031$ 3,886$
State's Net Pension Liability/(Asset) - Ending (a) - (b) 95,310$ 101,616$
Plan Fiduciary Net Position as a percentage of the Total Pension Liability/(Asset) 5.01% 3.68%Covered-employee payroll (1) N/A 160$
State's Net Pension Liability/(Asset) as a percentage of covered-employee payroll (1) N/A 63510%
N/A indicates data not available.
*This schedule is to be built prospectively until it contains ten years of data.
Source: Washington State Office of the State Actuary
Note: Figures may not total due to rounding.
Schedule of Changes in Net Pension Liability and Related RatiosJudicial Retirement System
Last Two Fiscal Years*(expressed in thousands)
(1) Covered-employee payroll is not applicable because there are no active plan employees.
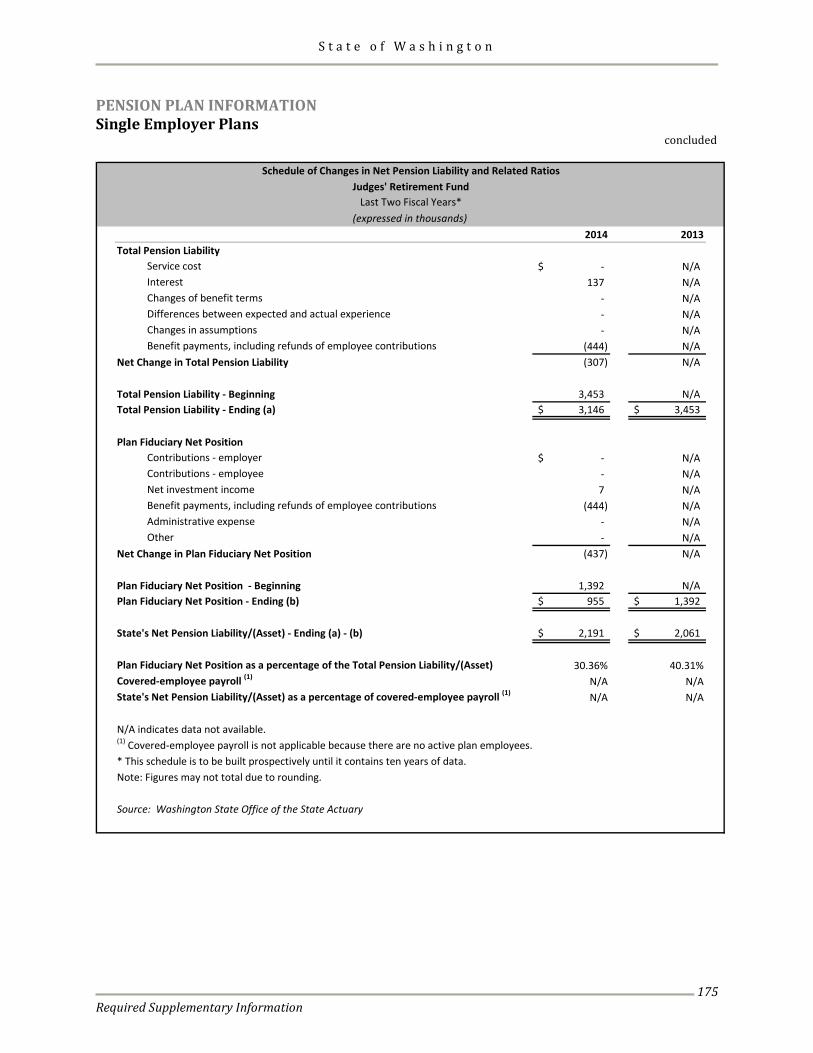
S t a t e o f W a s h i n g t o n
Required Supplementary Information
175
PENSION PLAN INFORMATION Single Employer Plans concluded
2014 2013Total Pension Liability
Service cost -$ N/AInterest 137 N/AChanges of benefit terms - N/ADifferences between expected and actual experience - N/AChanges in assumptions - N/ABenefit payments, including refunds of employee contributions (444) N/A
Net Change in Total Pension Liability (307) N/A
Total Pension Liability - Beginning 3,453 N/ATotal Pension Liability - Ending (a) 3,146$ 3,453$
Plan Fiduciary Net PositionContributions - employer -$ N/AContributions - employee - N/ANet investment income 7 N/ABenefit payments, including refunds of employee contributions (444) N/AAdministrative expense - N/AOther - N/A
Net Change in Plan Fiduciary Net Position (437) N/A
Plan Fiduciary Net Position - Beginning 1,392 N/APlan Fiduciary Net Position - Ending (b) 955$ 1,392$
State's Net Pension Liability/(Asset) - Ending (a) - (b) 2,191$ 2,061$
Plan Fiduciary Net Position as a percentage of the Total Pension Liability/(Asset) 30.36% 40.31%Covered-employee payroll (1) N/A N/AState's Net Pension Liability/(Asset) as a percentage of covered-employee payroll (1) N/A N/A
N/A indicates data not available.
* This schedule is to be built prospectively until it contains ten years of data.
Source: Washington State Office of the State Actuary
Note: Figures may not total due to rounding.
Schedule of Changes in Net Pension Liability and Related RatiosJudges' Retirement Fund
Last Two Fiscal Years*(expressed in thousands)
(1) Covered-employee payroll is not applicable because there are no active plan employees.
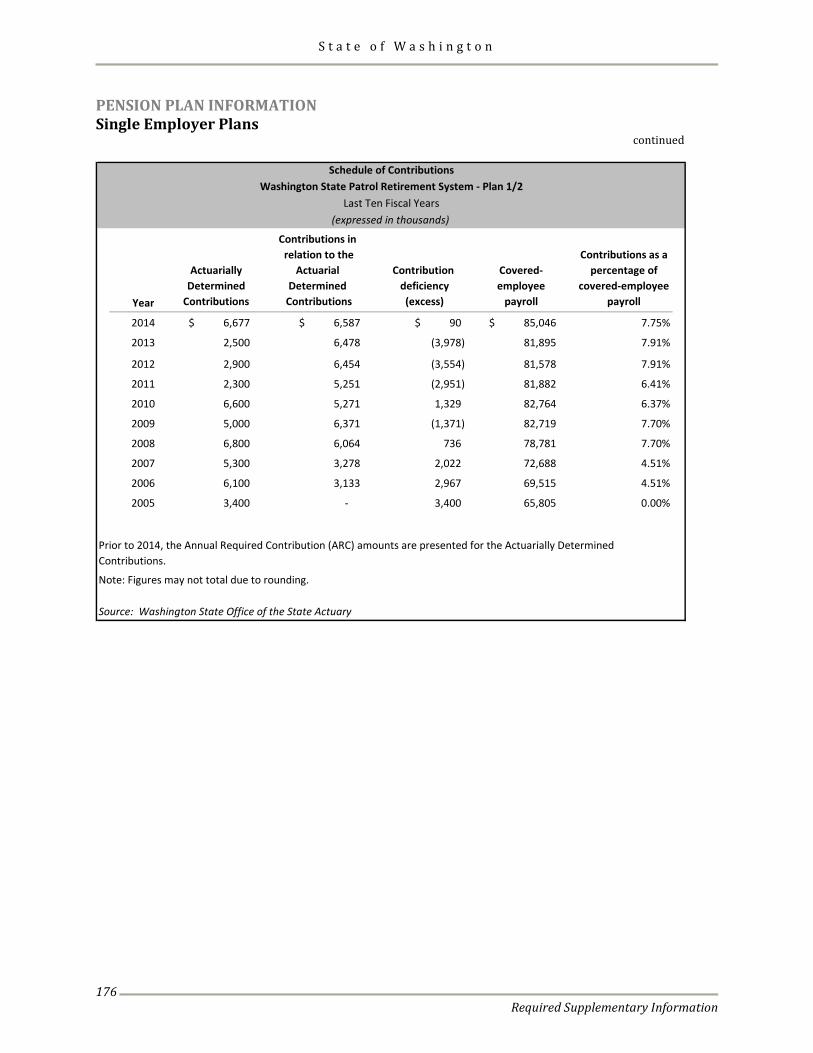
S t a t e o f W a s h i n g t o n
Required Supplementary Information
176
PENSION PLAN INFORMATION Single Employer Plans continued
Year
Actuarially Determined
Contributions
Contributions in relation to the
Actuarial Determined
Contributions
Contribution deficiency (excess)
Covered-employee
payroll
Contributions as a percentage of
covered-employee payroll
2014 $ 6,677 $ 6,587 $ 90 $ 85,046 7.75%
2013 2,500 6,478 (3,978) 81,895 7.91%
2012 2,900 6,454 (3,554) 81,578 7.91%
2011 2,300 5,251 (2,951) 81,882 6.41%
2010 6,600 5,271 1,329 82,764 6.37%
2009 5,000 6,371 (1,371) 82,719 7.70%
2008 6,800 6,064 736 78,781 7.70%
2007 5,300 3,278 2,022 72,688 4.51%
2006 6,100 3,133 2,967 69,515 4.51%
2005 3,400 - 3,400 65,805 0.00%
Source: Washington State Office of the State Actuary
Washington State Patrol Retirement System - Plan 1/2Schedule of Contributions
Last Ten Fiscal Years(expressed in thousands)
Prior to 2014, the Annual Required Contribution (ARC) amounts are presented for the Actuarially Determined Contributions.
Note: Figures may not total due to rounding.
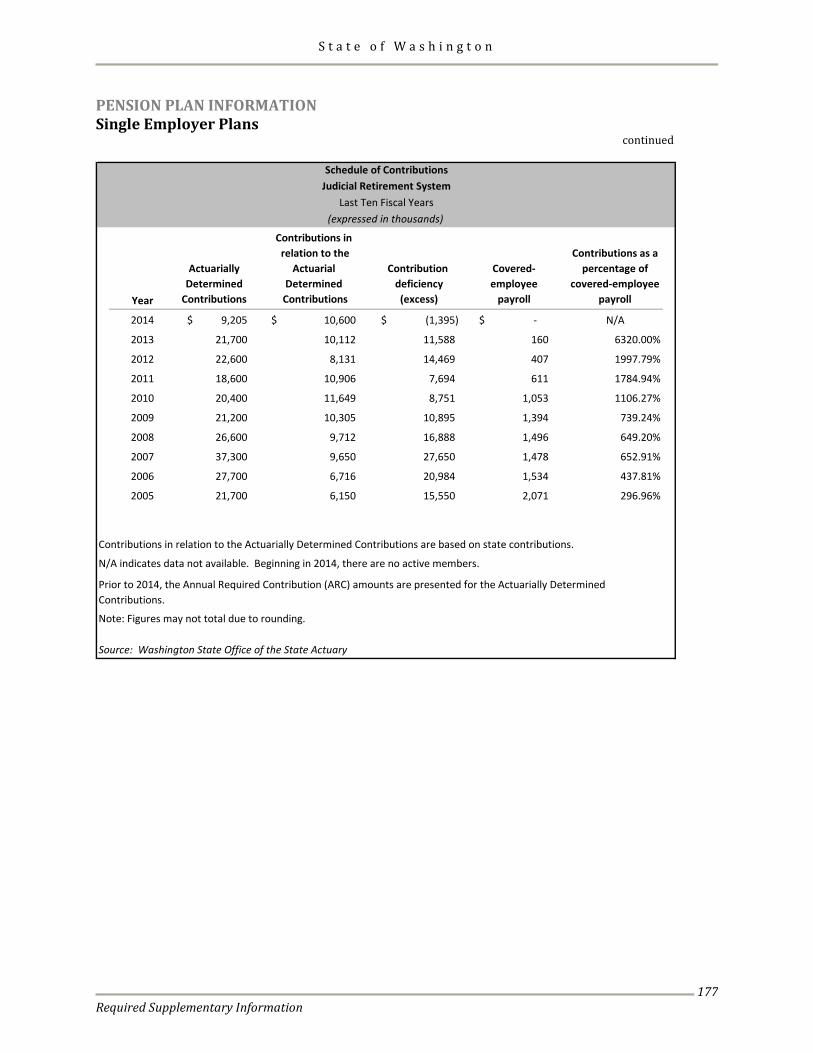
S t a t e o f W a s h i n g t o n
Required Supplementary Information
177
PENSION PLAN INFORMATION Single Employer Plans continued
Year
Actuarially Determined
Contributions
Contributions in relation to the
Actuarial Determined
Contributions
Contribution deficiency (excess)
Covered-employee
payroll
Contributions as a percentage of
covered-employee payroll
2014 $ 9,205 10,600$ $ (1,395) -$ N/A
2013 21,700 10,112 11,588 160 6320.00%
2012 22,600 8,131 14,469 407 1997.79%
2011 18,600 10,906 7,694 611 1784.94%
2010 20,400 11,649 8,751 1,053 1106.27%
2009 21,200 10,305 10,895 1,394 739.24%
2008 26,600 9,712 16,888 1,496 649.20%
2007 37,300 9,650 27,650 1,478 652.91%
2006 27,700 6,716 20,984 1,534 437.81%
2005 21,700 6,150 15,550 2,071 296.96%
N/A indicates data not available. Beginning in 2014, there are no active members.
Note: Figures may not total due to rounding.
Source: Washington State Office of the State Actuary
Schedule of ContributionsJudicial Retirement System
Last Ten Fiscal Years(expressed in thousands)
Contributions in relation to the Actuarially Determined Contributions are based on state contributions.
Prior to 2014, the Annual Required Contribution (ARC) amounts are presented for the Actuarially Determined Contributions.
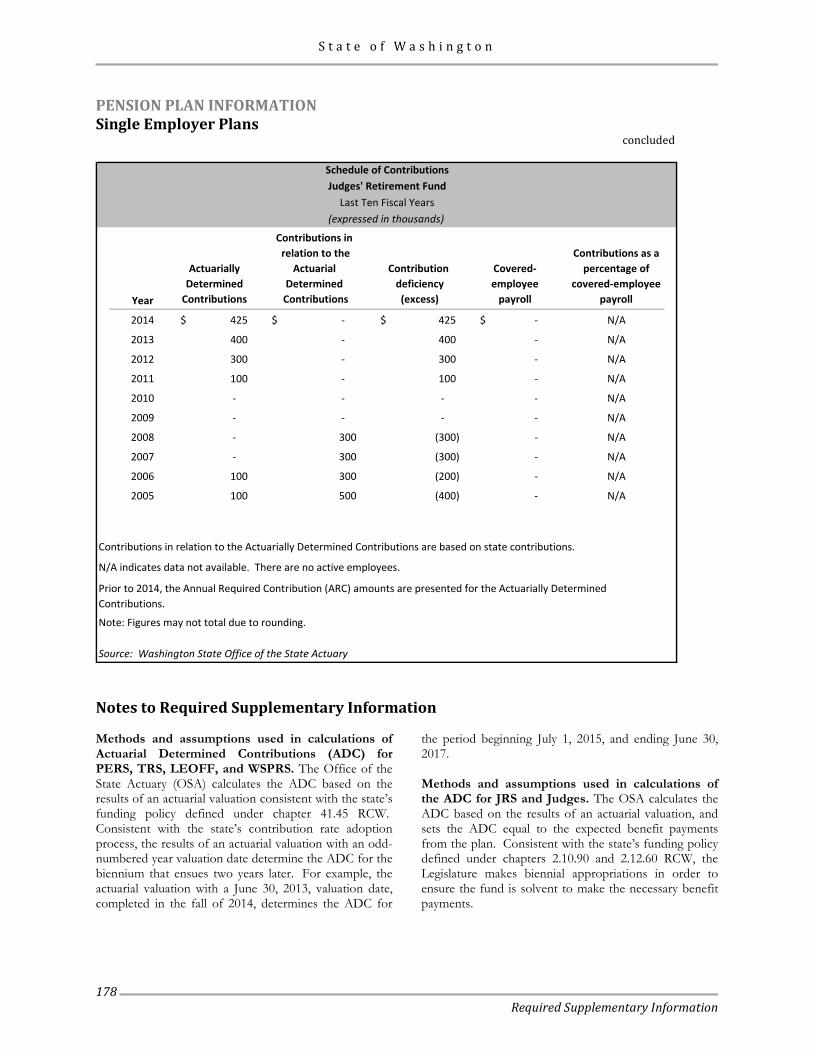
S t a t e o f W a s h i n g t o n
Required Supplementary Information
178
PENSION PLAN INFORMATION Single Employer Plans concluded
Year
Actuarially Determined
Contributions
Contributions in relation to the
Actuarial Determined
Contributions
Contribution deficiency (excess)
Covered-employee
payroll
Contributions as a percentage of
covered-employee payroll
2014 425$ -$ 425$ -$ N/A
2013 400 - 400 - N/A
2012 300 - 300 - N/A
2011 100 - 100 - N/A
2010 - - - - N/A
2009 - - - - N/A
2008 - 300 (300) - N/A
2007 - 300 (300) - N/A
2006 100 300 (200) - N/A
2005 100 500 (400) - N/A
N/A indicates data not available. There are no active employees.
Note: Figures may not total due to rounding.
Source: Washington State Office of the State Actuary
Schedule of ContributionsJudges' Retirement Fund
Last Ten Fiscal Years(expressed in thousands)
Contributions in relation to the Actuarially Determined Contributions are based on state contributions.
Prior to 2014, the Annual Required Contribution (ARC) amounts are presented for the Actuarially Determined Contributions.
Notes to Required Supplementary Information Methods and assumptions used in calculations of Actuarial Determined Contributions (ADC) for PERS, TRS, LEOFF, and WSPRS. The Office of the State Actuary (OSA) calculates the ADC based on the results of an actuarial valuation consistent with the state’s funding policy defined under chapter 41.45 RCW. Consistent with the state’s contribution rate adoption process, the results of an actuarial valuation with an odd-numbered year valuation date determine the ADC for the biennium that ensues two years later. For example, the actuarial valuation with a June 30, 2013, valuation date, completed in the fall of 2014, determines the ADC for
the period beginning July 1, 2015, and ending June 30, 2017. Methods and assumptions used in calculations of the ADC for JRS and Judges. The OSA calculates the ADC based on the results of an actuarial valuation, and sets the ADC equal to the expected benefit payments from the plan. Consistent with the state’s funding policy defined under chapters 2.10.90 and 2.12.60 RCW, the Legislature makes biennial appropriations in order to ensure the fund is solvent to make the necessary benefit payments.
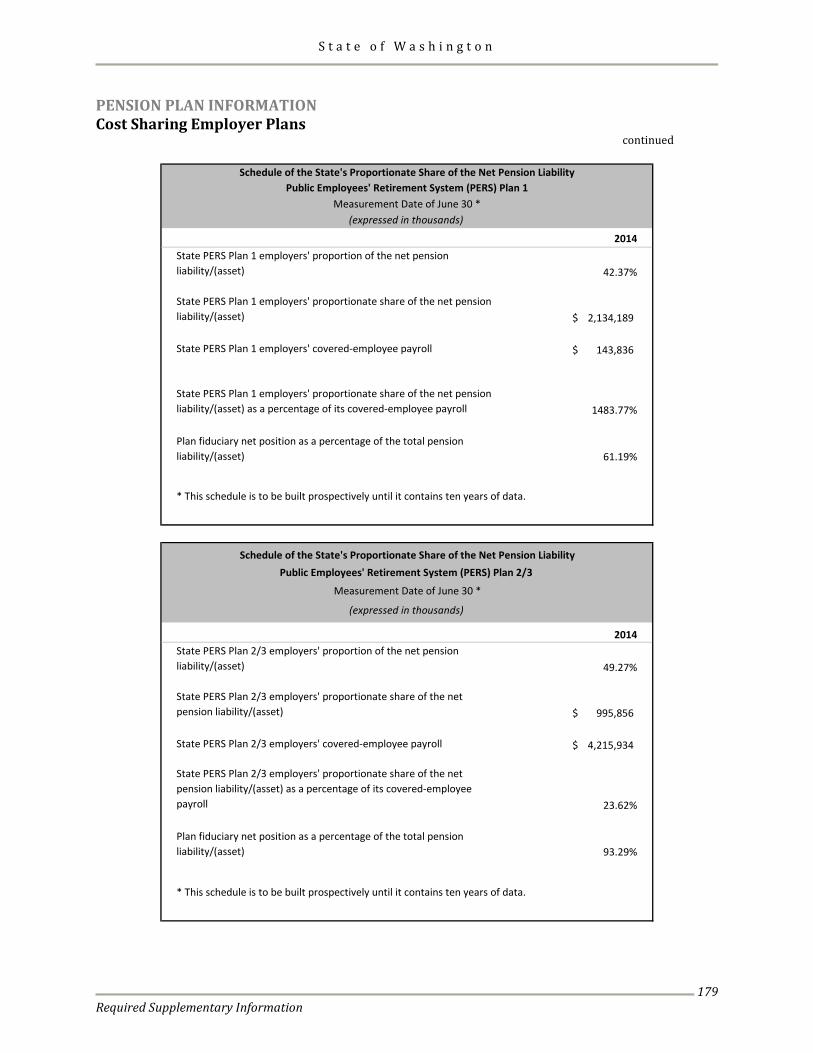
S t a t e o f W a s h i n g t o n
Required Supplementary Information
179
PENSION PLAN INFORMATION Cost Sharing Employer Plans continued
2014 State PERS Plan 1 employers' proportion of the net pension liability/(asset) 42.37%
State PERS Plan 1 employers' proportionate share of the net pension liability/(asset) 2,134,189$
State PERS Plan 1 employers' covered-employee payroll 143,836$
State PERS Plan 1 employers' proportionate share of the net pension liability/(asset) as a percentage of its covered-employee payroll 1483.77%
Plan fiduciary net position as a percentage of the total pension liability/(asset) 61.19%
* This schedule is to be built prospectively until it contains ten years of data.
Schedule of the State's Proportionate Share of the Net Pension LiabilityPublic Employees' Retirement System (PERS) Plan 1
Measurement Date of June 30 *(expressed in thousands)
2014 State PERS Plan 2/3 employers' proportion of the net pension liability/(asset) 49.27%
State PERS Plan 2/3 employers' proportionate share of the net pension liability/(asset) 995,856$
State PERS Plan 2/3 employers' covered-employee payroll 4,215,934$
State PERS Plan 2/3 employers' proportionate share of the net pension liability/(asset) as a percentage of its covered-employee payroll 23.62%
Plan fiduciary net position as a percentage of the total pension liability/(asset) 93.29%
* This schedule is to be built prospectively until it contains ten years of data.
Schedule of the State's Proportionate Share of the Net Pension LiabilityPublic Employees' Retirement System (PERS) Plan 2/3
Measurement Date of June 30 *
(expressed in thousands)
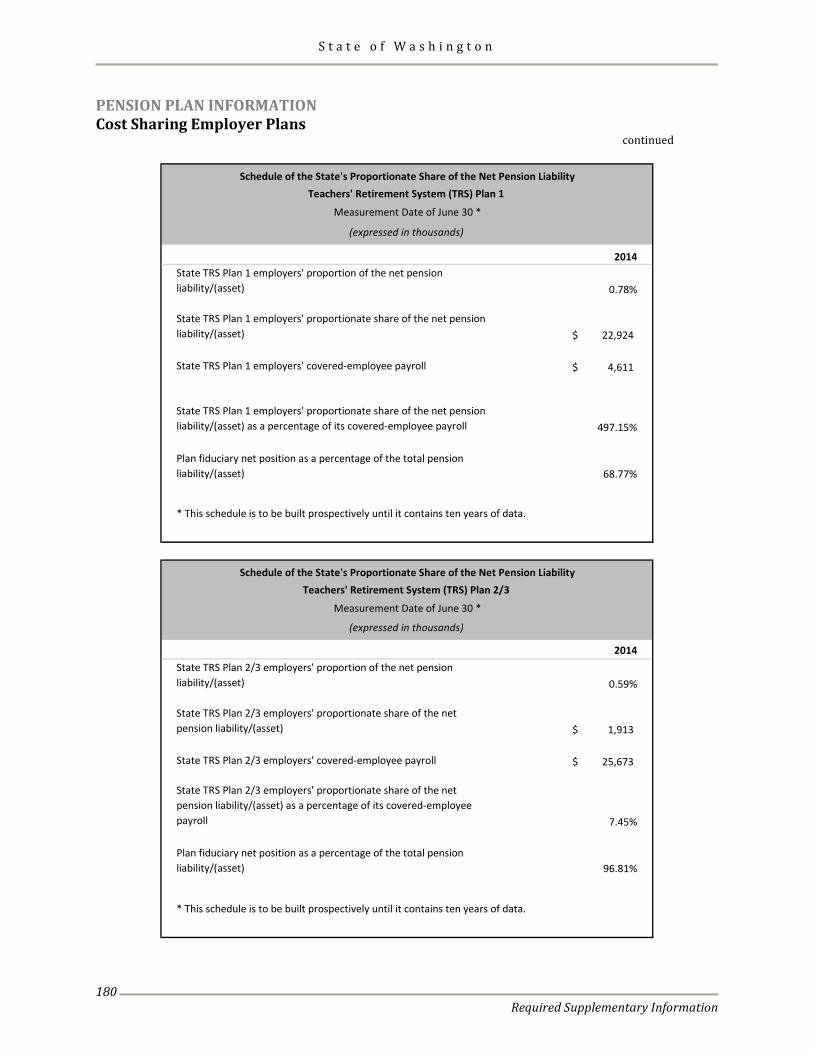
S t a t e o f W a s h i n g t o n
Required Supplementary Information
180
PENSION PLAN INFORMATION Cost Sharing Employer Plans continued
2014 State TRS Plan 1 employers' proportion of the net pension liability/(asset) 0.78%
State TRS Plan 1 employers' proportionate share of the net pension liability/(asset) 22,924$
State TRS Plan 1 employers' covered-employee payroll 4,611$
State TRS Plan 1 employers' proportionate share of the net pension liability/(asset) as a percentage of its covered-employee payroll 497.15%
Plan fiduciary net position as a percentage of the total pension liability/(asset) 68.77%
* This schedule is to be built prospectively until it contains ten years of data.
Schedule of the State's Proportionate Share of the Net Pension LiabilityTeachers' Retirement System (TRS) Plan 1
Measurement Date of June 30 *
(expressed in thousands)
2014 State TRS Plan 2/3 employers' proportion of the net pension liability/(asset) 0.59%
State TRS Plan 2/3 employers' proportionate share of the net pension liability/(asset) 1,913$
State TRS Plan 2/3 employers' covered-employee payroll 25,673$
State TRS Plan 2/3 employers' proportionate share of the net pension liability/(asset) as a percentage of its covered-employee payroll 7.45%
Plan fiduciary net position as a percentage of the total pension liability/(asset) 96.81%
* This schedule is to be built prospectively until it contains ten years of data.
Schedule of the State's Proportionate Share of the Net Pension LiabilityTeachers' Retirement System (TRS) Plan 2/3
Measurement Date of June 30 *
(expressed in thousands)
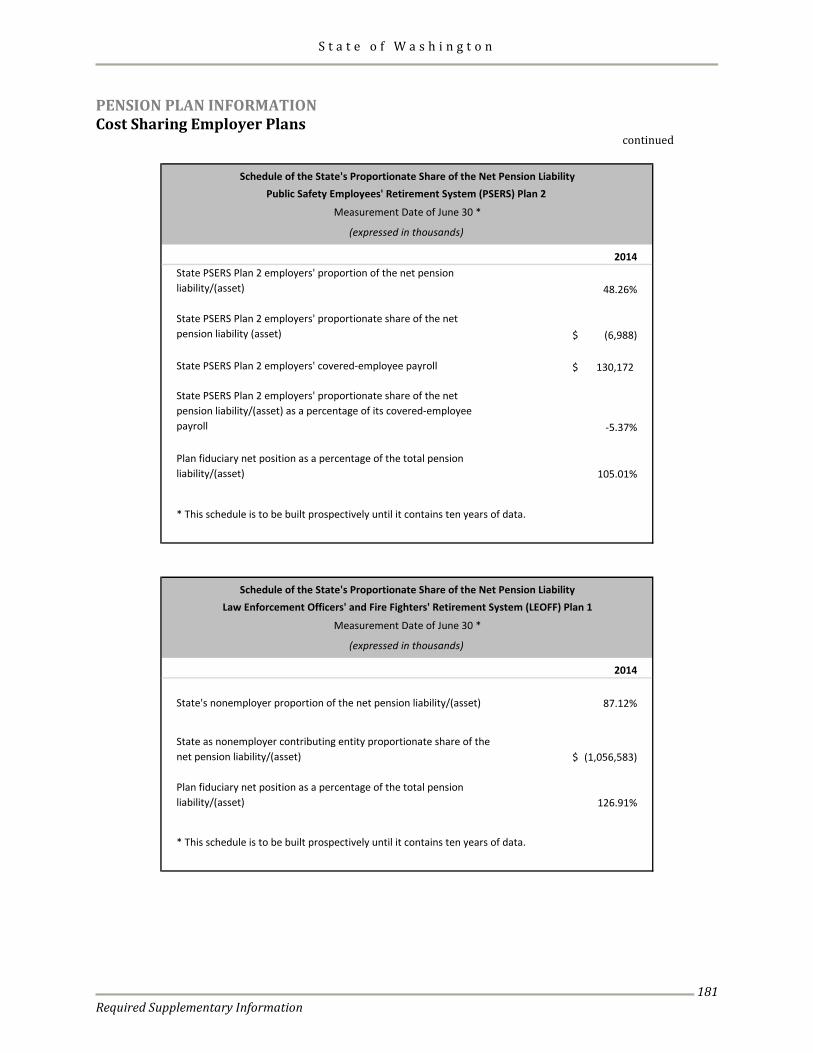
S t a t e o f W a s h i n g t o n
Required Supplementary Information
181
PENSION PLAN INFORMATION Cost Sharing Employer Plans continued
2014 State PSERS Plan 2 employers' proportion of the net pension liability/(asset) 48.26%
State PSERS Plan 2 employers' proportionate share of the net pension liability (asset) (6,988)$
State PSERS Plan 2 employers' covered-employee payroll 130,172$
State PSERS Plan 2 employers' proportionate share of the net pension liability/(asset) as a percentage of its covered-employee payroll -5.37%
Plan fiduciary net position as a percentage of the total pension liability/(asset) 105.01%
* This schedule is to be built prospectively until it contains ten years of data.
Schedule of the State's Proportionate Share of the Net Pension LiabilityPublic Safety Employees' Retirement System (PSERS) Plan 2
Measurement Date of June 30 *
(expressed in thousands)
2014
State's nonemployer proportion of the net pension liability/(asset) 87.12%
State as nonemployer contributing entity proportionate share of the net pension liability/(asset) (1,056,583)$
Plan fiduciary net position as a percentage of the total pension liability/(asset) 126.91%
* This schedule is to be built prospectively until it contains ten years of data.
Schedule of the State's Proportionate Share of the Net Pension LiabilityLaw Enforcement Officers' and Fire Fighters' Retirement System (LEOFF) Plan 1
Measurement Date of June 30 *
(expressed in thousands)
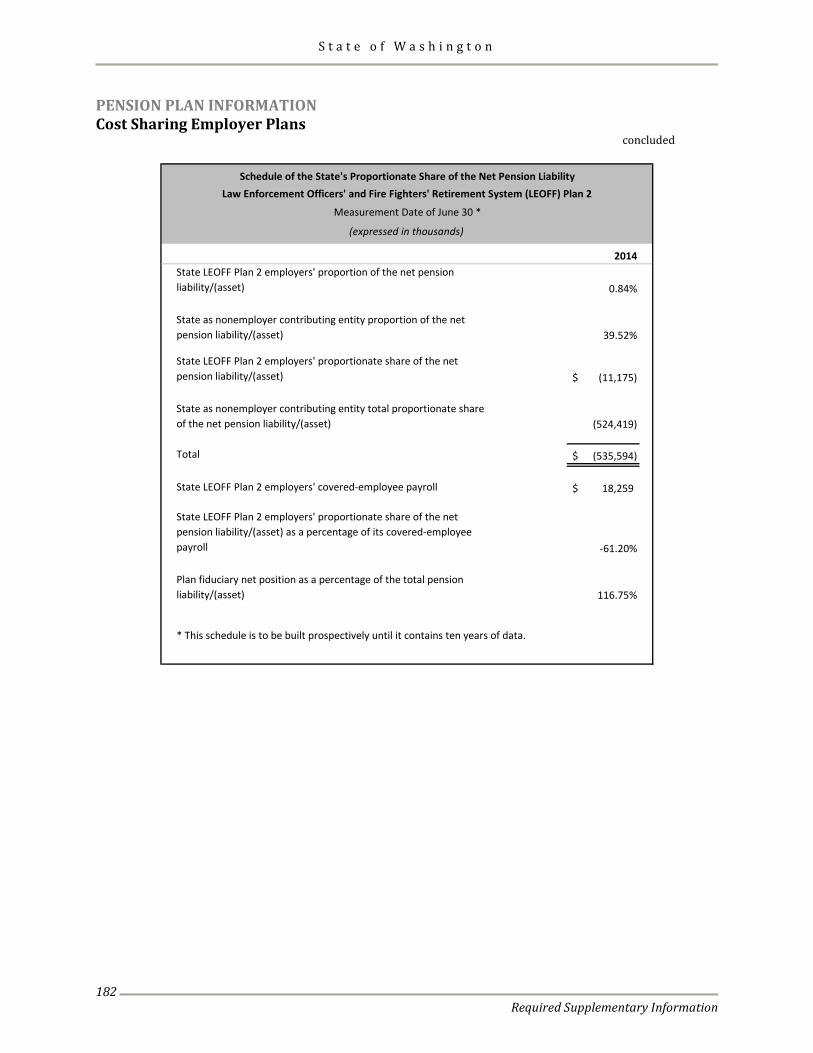
S t a t e o f W a s h i n g t o n
Required Supplementary Information
182
PENSION PLAN INFORMATION Cost Sharing Employer Plans concluded
2014 State LEOFF Plan 2 employers' proportion of the net pension liability/(asset) 0.84%
State as nonemployer contributing entity proportion of the net pension liability/(asset) 39.52%
State LEOFF Plan 2 employers' proportionate share of the net pension liability/(asset) (11,175)$
State as nonemployer contributing entity total proportionate share of the net pension liability/(asset) (524,419)
Total (535,594)$
State LEOFF Plan 2 employers' covered-employee payroll 18,259$
State LEOFF Plan 2 employers' proportionate share of the net pension liability/(asset) as a percentage of its covered-employee payroll -61.20%
Plan fiduciary net position as a percentage of the total pension liability/(asset) 116.75%
* This schedule is to be built prospectively until it contains ten years of data.
Schedule of the State's Proportionate Share of the Net Pension LiabilityLaw Enforcement Officers' and Fire Fighters' Retirement System (LEOFF) Plan 2
Measurement Date of June 30 *
(expressed in thousands)
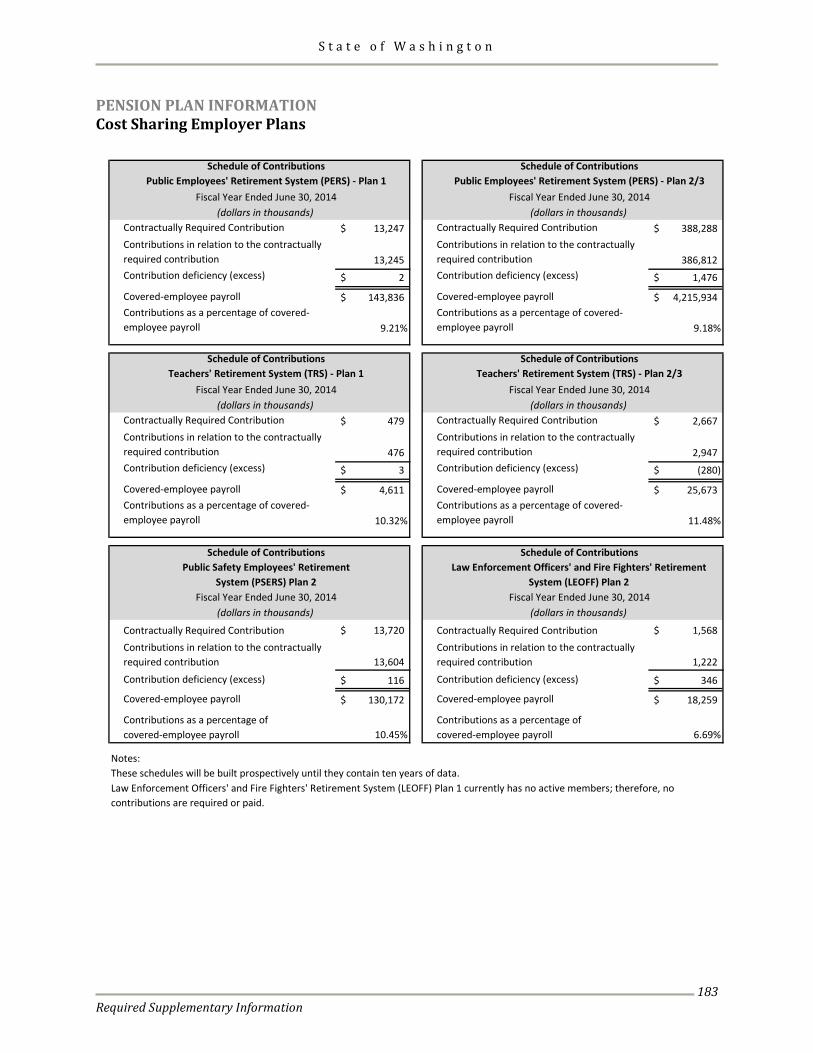
S t a t e o f W a s h i n g t o n
Required Supplementary Information
183
PENSION PLAN INFORMATION Cost Sharing Employer Plans
13,247$ 388,288$
13,245 386,812
2$ 1,476$
143,836$ 4,215,934$
9.21% 9.18%
479$ 2,667$
476 2,947
3$ (280)$
4,611$ 25,673$
10.32% 11.48%
13,720$ 1,568$
13,604 1,222
116$ 346$
130,172$ 18,259$
10.45% 6.69%
Notes: These schedules will be built prospectively until they contain ten years of data.
Public Employees' Retirement System (PERS) - Plan 1Schedule of Contributions
Fiscal Year Ended June 30, 2014
Schedule of ContributionsPublic Employees' Retirement System (PERS) - Plan 2/3
Fiscal Year Ended June 30, 2014
Contributions as a percentage of covered-employee payroll
(dollars in thousands)Contractually Required ContributionContributions in relation to the contractually required contributionContribution deficiency (excess)
Covered-employee payrollContributions as a percentage of covered-employee payroll
(dollars in thousands)Contractually Required ContributionContributions in relation to the contractually required contributionContribution deficiency (excess)
Covered-employee payroll
Schedule of Contributions Schedule of ContributionsTeachers' Retirement System (TRS) - Plan 1 Teachers' Retirement System (TRS) - Plan 2/3
Fiscal Year Ended June 30, 2014 Fiscal Year Ended June 30, 2014(dollars in thousands) (dollars in thousands)
Contractually Required Contribution Contractually Required ContributionContributions in relation to the contractually required contribution
Contributions in relation to the contractually required contribution
Contribution deficiency (excess) Contribution deficiency (excess)
Covered-employee payroll Covered-employee payrollContributions as a percentage of covered-employee payroll
Contributions as a percentage of covered-employee payroll
Schedule of Contributions
Contributions as a percentage of
Covered-employee payroll
Contribution deficiency (excess)
Public Safety Employees' RetirementSystem (PSERS) Plan 2
Fiscal Year Ended June 30, 2014
Schedule of ContributionsLaw Enforcement Officers' and Fire Fighters' Retirement
(dollars in thousands)Fiscal Year Ended June 30, 2014
Contractually Required ContributionContributions in relation to the contractually required contribution
Covered-employee payroll
Contributions as a percentage of covered-employee payroll
Law Enforcement Officers' and Fire Fighters' Retirement System (LEOFF) Plan 1 currently has no active members; therefore, no contributions are required or paid.
covered-employee payroll
System (LEOFF) Plan 2
(dollars in thousands)
Contractually Required ContributionContributions in relation to the contractually required contributionContribution deficiency (excess)
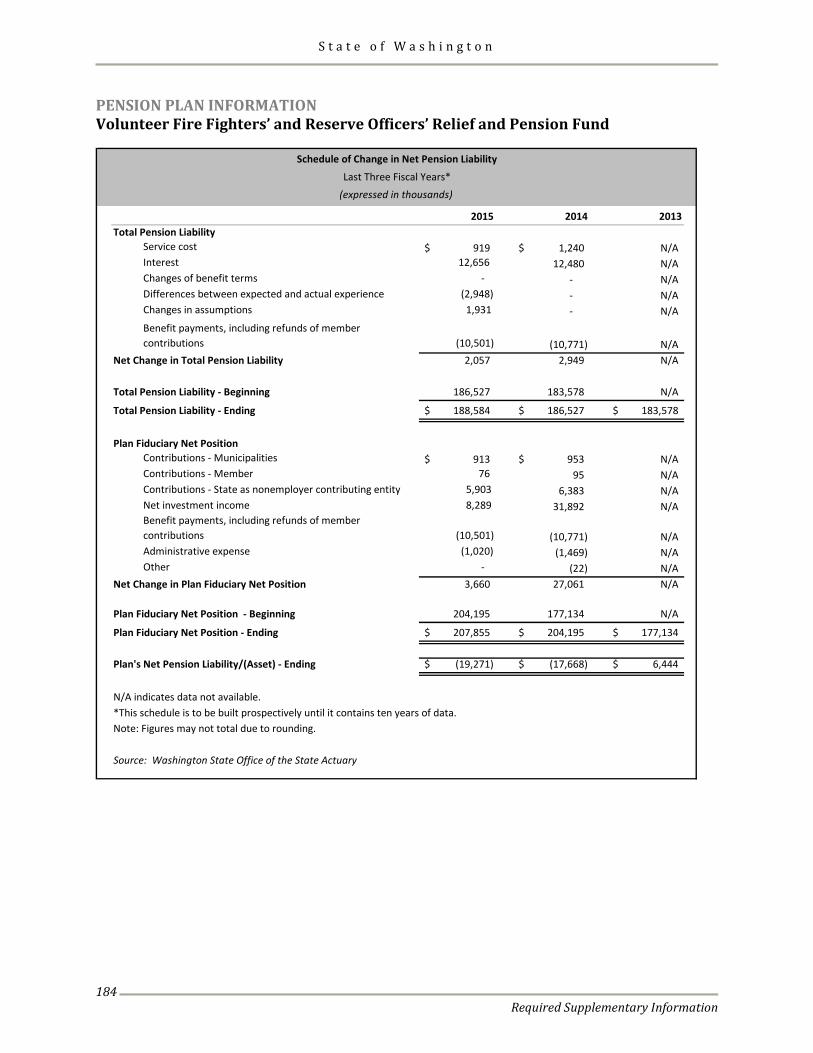
S t a t e o f W a s h i n g t o n
Required Supplementary Information
184
PENSION PLAN INFORMATION Volunteer Fire Fighters’ and Reserve Officers’ Relief and Pension Fund
2015 2014 2013Total Pension Liability
Service cost 919$ 1,240$ N/AInterest 12,656 12,480 N/AChanges of benefit terms - - N/ADifferences between expected and actual experience (2,948) - N/AChanges in assumptions 1,931 - N/ABenefit payments, including refunds of member contributions (10,501) (10,771) N/A
Net Change in Total Pension Liability 2,057 2,949 N/A
Total Pension Liability - Beginning 186,527 183,578 N/A
Total Pension Liability - Ending 188,584$ 186,527$ 183,578$
Plan Fiduciary Net PositionContributions - Municipalities 913$ 953$ N/AContributions - Member 76 95 N/AContributions - State as nonemployer contributing entity 5,903 6,383 N/ANet investment income 8,289 31,892 N/ABenefit payments, including refunds of member contributions (10,501) (10,771) N/AAdministrative expense (1,020) (1,469) N/AOther - (22) N/A
Net Change in Plan Fiduciary Net Position 3,660 27,061 N/A
Plan Fiduciary Net Position - Beginning 204,195 177,134 N/A
Plan Fiduciary Net Position - Ending 207,855$ 204,195$ 177,134$
Plan's Net Pension Liability/(Asset) - Ending (19,271)$ (17,668)$ 6,444$
N/A indicates data not available.*This schedule is to be built prospectively until it contains ten years of data.
Source: Washington State Office of the State Actuary
Schedule of Change in Net Pension Liability
Last Three Fiscal Years*(expressed in thousands)
Note: Figures may not total due to rounding.
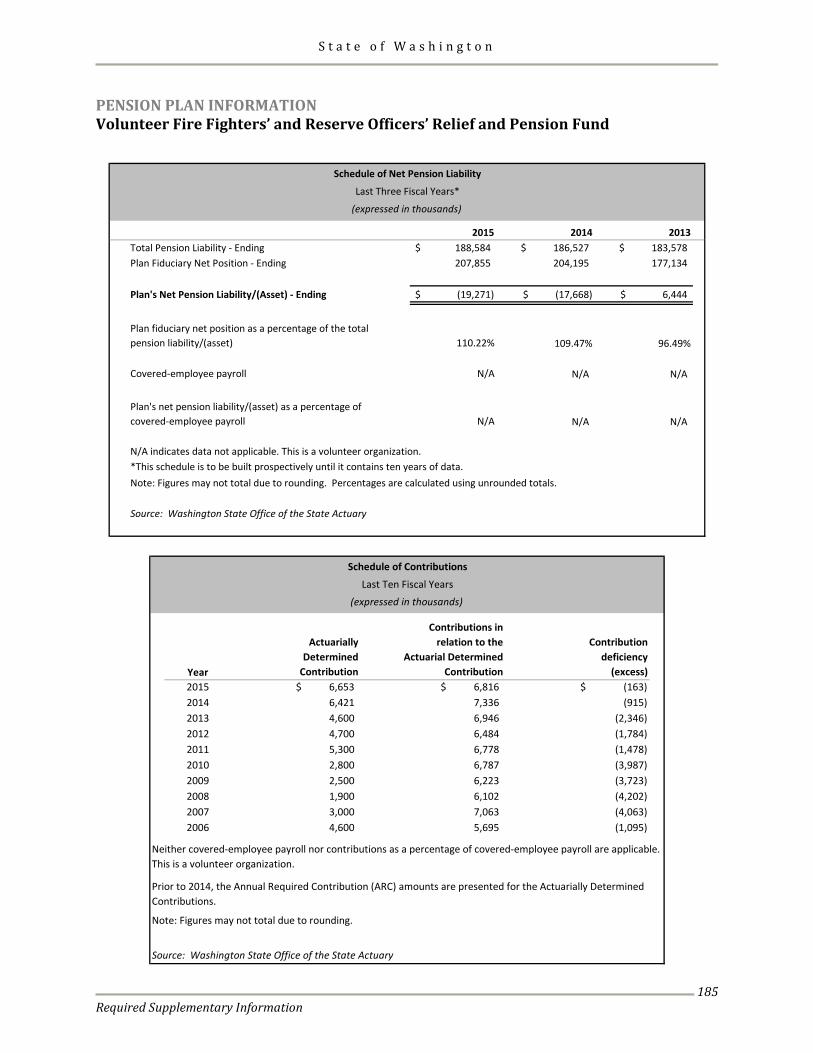
S t a t e o f W a s h i n g t o n
Required Supplementary Information
185
PENSION PLAN INFORMATION Volunteer Fire Fighters’ and Reserve Officers’ Relief and Pension Fund
2015 2014 2013Total Pension Liability - Ending 188,584$ $ 186,527 $ 183,578Plan Fiduciary Net Position - Ending 207,855 204,195 177,134
Plan's Net Pension Liability/(Asset) - Ending (19,271)$ $ (17,668) $ 6,444
Plan fiduciary net position as a percentage of the total pension liability/(asset) 110.22% 109.47% 96.49%
Covered-employee payroll N/A N/A N/A
Plan's net pension liability/(asset) as a percentage of covered-employee payroll N/A N/A N/A
N/A indicates data not applicable. This is a volunteer organization.*This schedule is to be built prospectively until it contains ten years of data.
Source: Washington State Office of the State Actuary
Schedule of Net Pension Liability
Last Three Fiscal Years*
(expressed in thousands)
Note: Figures may not total due to rounding. Percentages are calculated using unrounded totals.
Year
Actuarially Determined
Contribution
Contributions in relation to the
Actuarial Determined Contribution
Contribution deficiency
(excess)2015 $ 6,653 $ 6,816 $ (163)2014 6,421 7,336 (915) 2013 4,600 6,946 (2,346) 2012 4,700 6,484 (1,784) 2011 5,300 6,778 (1,478) 2010 2,800 6,787 (3,987) 2009 2,500 6,223 (3,723) 2008 1,900 6,102 (4,202) 2007 3,000 7,063 (4,063) 2006 4,600 5,695 (1,095)
Source: Washington State Office of the State Actuary
Schedule of Contributions
Last Ten Fiscal Years(expressed in thousands)
Neither covered-employee payroll nor contributions as a percentage of covered-employee payroll are applicable. This is a volunteer organization.
Prior to 2014, the Annual Required Contribution (ARC) amounts are presented for the Actuarially Determined Contributions.
Note: Figures may not total due to rounding.

S t a t e o f W a s h i n g t o n
Required Supplementary Information
186
PENSION PLAN INFORMATION Volunteer Fire Fighters’ and Reserve Officers’ Relief and Pension Fund
2015 2014
Annual money-weighted rate of return, net of investment expense 4.05% 18.50%
*This schedule is to be built prospectively until it contains ten years of data.
Source: Washington State Office of the State Actuary
Schedule of Investment Returns
Last Two Fiscal Years*
Volunteer Fire Fighters’ and Reserve Officers’ Relief and Pension Fund Notes to Required Supplementary Information The Office of the State Actuary (OSA) calculates the Actuarially Determined Contributions (ADC) based on the results of an actuarial valuation consistent with funding policy defined under chapter 41.24 RCW and adopted policies made by the State Board for Volunteer Fire Fighters and Reserve Officers. Consistent with the
Board’s contribution rate adoption process, the results of an actuarial valuation determine the ADC two years after the valuation date. For example, the actuarial valuation with a June 30, 2013, valuation date, completed in the fall of 2014, determines the ADC for the period ending June 30, 2015.
OTHER POSTEMPLOYMENT BENEFITS INFORMATION
2015 2013 2011
Actuarial valuation date 1/1/2015 1/1/2013 1/1/2011
Actuarial value of plan assets $ - $ - $ -
Actuarial accrued liability (AAL)* 5,274 3,707 3,492
Unfunded actuarial accrued liability (UAAL) 5,274 3,707 3,492
Funded ratio 0% 0% 0%
Covered payroll 6,219 5,787 5,937
UAAL as a percentage of covered payroll 85% 64% 59%
* Based on projected unit credit actuarial cost method.
Source: Washington State Office of the State Actuary
(expressed in millions)
Schedule of Funding ProgressOther Postemployment Benefits
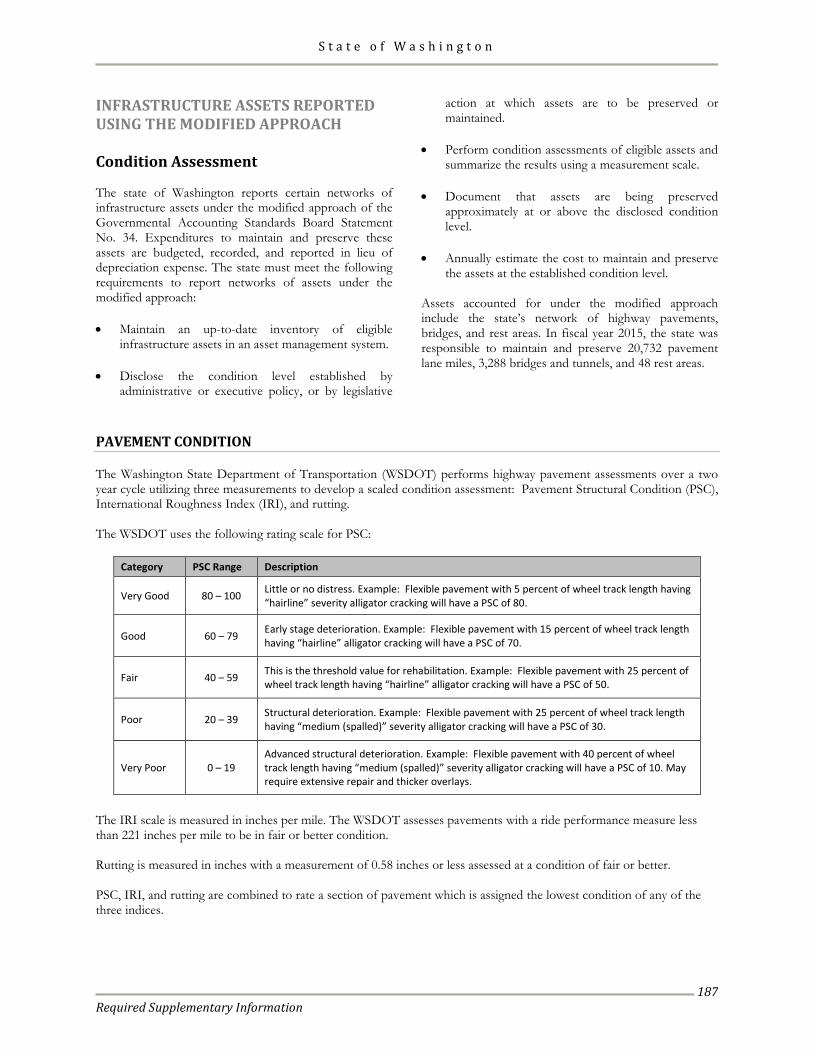
S t a t e o f W a s h i n g t o n
Required Supplementary Information
187
INFRASTRUCTURE ASSETS REPORTED USING THE MODIFIED APPROACH Condition Assessment The state of Washington reports certain networks of infrastructure assets under the modified approach of the Governmental Accounting Standards Board Statement No. 34. Expenditures to maintain and preserve these assets are budgeted, recorded, and reported in lieu of depreciation expense. The state must meet the following requirements to report networks of assets under the modified approach: • Maintain an up-to-date inventory of eligible
infrastructure assets in an asset management system.
• Disclose the condition level established by administrative or executive policy, or by legislative
action at which assets are to be preserved or maintained.
• Perform condition assessments of eligible assets and
summarize the results using a measurement scale. • Document that assets are being preserved
approximately at or above the disclosed condition level.
• Annually estimate the cost to maintain and preserve the assets at the established condition level.
Assets accounted for under the modified approach include the state’s network of highway pavements, bridges, and rest areas. In fiscal year 2015, the state was responsible to maintain and preserve 20,732 pavement lane miles, 3,288 bridges and tunnels, and 48 rest areas.
PAVEMENT CONDITION The Washington State Department of Transportation (WSDOT) performs highway pavement assessments over a two year cycle utilizing three measurements to develop a scaled condition assessment: Pavement Structural Condition (PSC), International Roughness Index (IRI), and rutting. The WSDOT uses the following rating scale for PSC:
Category PSC Range Description
Very Good 80 – 100 Little or no distress. Example: Flexible pavement with 5 percent of wheel track length having “hairline” severity alligator cracking will have a PSC of 80.
Good 60 – 79 Early stage deterioration. Example: Flexible pavement with 15 percent of wheel track length having “hairline” alligator cracking will have a PSC of 70.
Fair 40 – 59 This is the threshold value for rehabilitation. Example: Flexible pavement with 25 percent of wheel track length having “hairline” alligator cracking will have a PSC of 50.
Poor 20 – 39 Structural deterioration. Example: Flexible pavement with 25 percent of wheel track length having “medium (spalled)” severity alligator cracking will have a PSC of 30.
Very Poor 0 – 19 Advanced structural deterioration. Example: Flexible pavement with 40 percent of wheel track length having “medium (spalled)” severity alligator cracking will have a PSC of 10. May require extensive repair and thicker overlays.
The IRI scale is measured in inches per mile. The WSDOT assesses pavements with a ride performance measure less than 221 inches per mile to be in fair or better condition. Rutting is measured in inches with a measurement of 0.58 inches or less assessed at a condition of fair or better. PSC, IRI, and rutting are combined to rate a section of pavement which is assigned the lowest condition of any of the three indices.
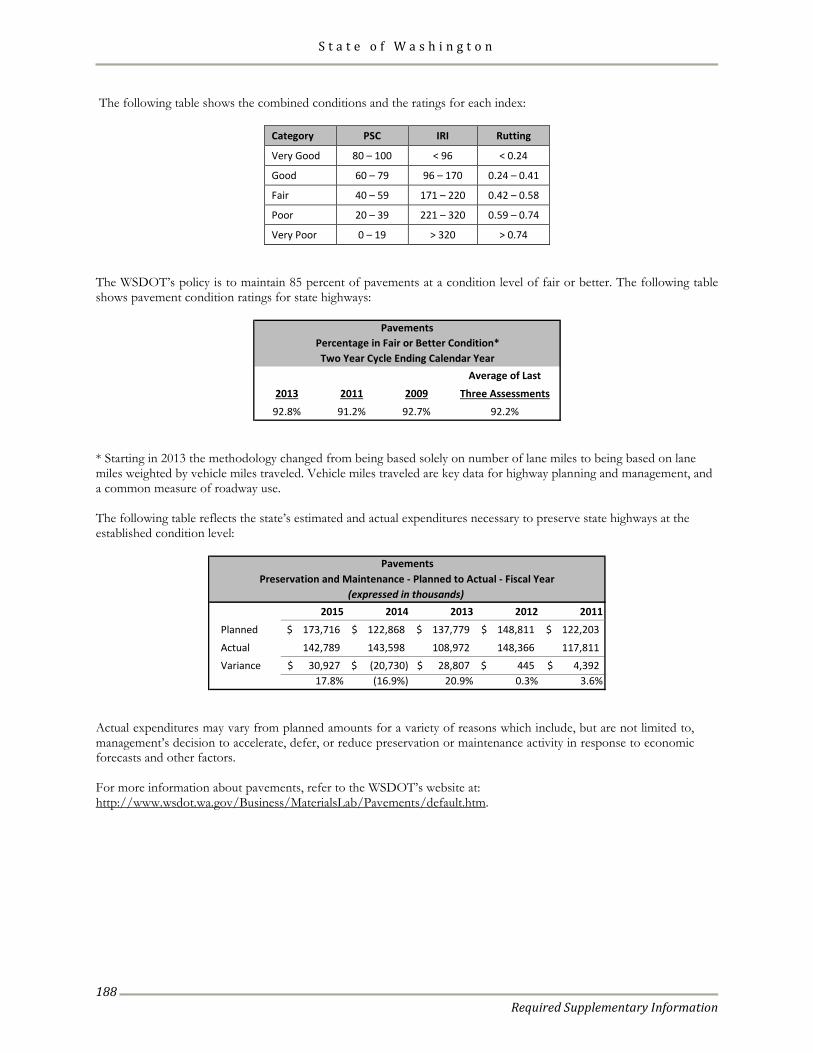
S t a t e o f W a s h i n g t o n
Required Supplementary Information
188
The following table shows the combined conditions and the ratings for each index:
Category PSC IRI Rutting
Very Good 80 – 100 < 96 < 0.24
Good 60 – 79 96 – 170 0.24 – 0.41
Fair 40 – 59 171 – 220 0.42 – 0.58
Poor 20 – 39 221 – 320 0.59 – 0.74
Very Poor 0 – 19 > 320 > 0.74 The WSDOT’s policy is to maintain 85 percent of pavements at a condition level of fair or better. The following table shows pavement condition ratings for state highways:
Average of Last
2013 2011 2009 Three Assessments
92.8% 91.2% 92.7% 92.2%
PavementsPercentage in Fair or Better Condition*Two Year Cycle Ending Calendar Year
* Starting in 2013 the methodology changed from being based solely on number of lane miles to being based on lane miles weighted by vehicle miles traveled. Vehicle miles traveled are key data for highway planning and management, and a common measure of roadway use. The following table reflects the state’s estimated and actual expenditures necessary to preserve state highways at the established condition level:
2015 2014 2013 2012 2011
Planned 173,716$ 122,868$ 137,779$ 148,811$ 122,203$
Actual 142,789 143,598 108,972 148,366 117,811Variance 30,927$ (20,730)$ 28,807$ 445$ 4,392$
17.8% (16.9%) 20.9% 0.3% 3.6%
(expressed in thousands)Preservation and Maintenance - Planned to Actual - Fiscal Year
Pavements
Actual expenditures may vary from planned amounts for a variety of reasons which include, but are not limited to, management’s decision to accelerate, defer, or reduce preservation or maintenance activity in response to economic forecasts and other factors. For more information about pavements, refer to the WSDOT’s website at: http://www.wsdot.wa.gov/Business/MaterialsLab/Pavements/default.htm.
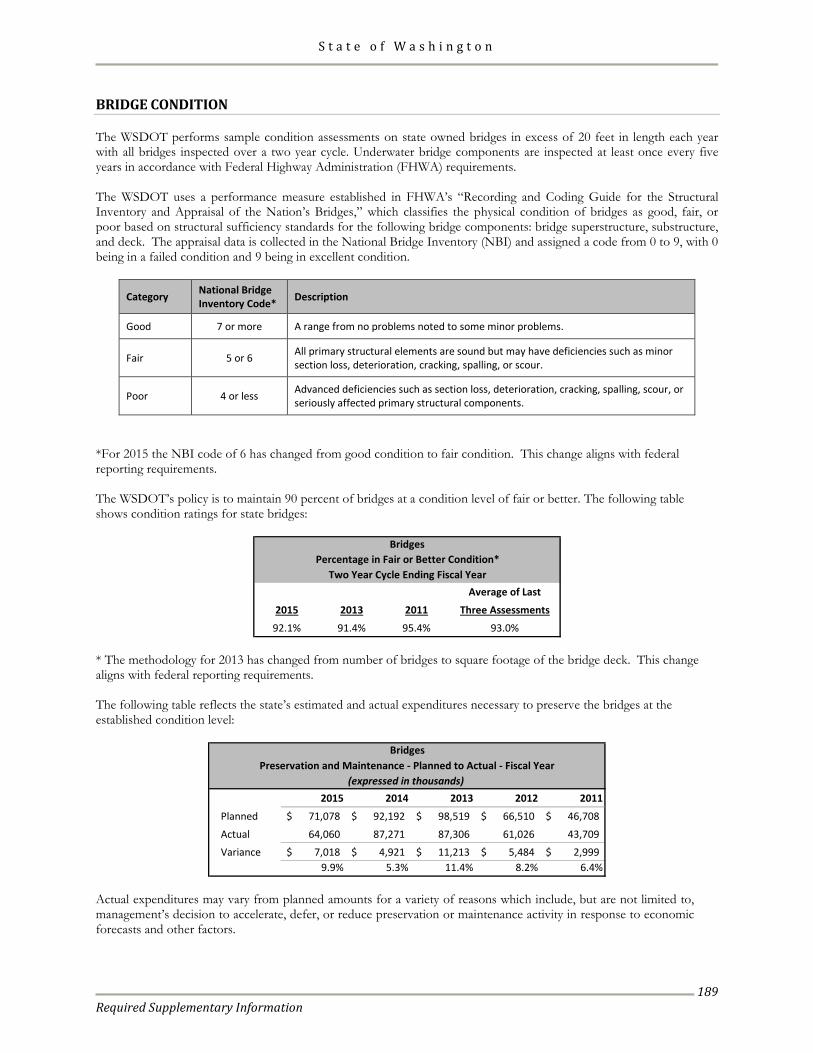
S t a t e o f W a s h i n g t o n
Required Supplementary Information
189
BRIDGE CONDITION The WSDOT performs sample condition assessments on state owned bridges in excess of 20 feet in length each year with all bridges inspected over a two year cycle. Underwater bridge components are inspected at least once every five years in accordance with Federal Highway Administration (FHWA) requirements. The WSDOT uses a performance measure established in FHWA’s “Recording and Coding Guide for the Structural Inventory and Appraisal of the Nation’s Bridges,” which classifies the physical condition of bridges as good, fair, or poor based on structural sufficiency standards for the following bridge components: bridge superstructure, substructure, and deck. The appraisal data is collected in the National Bridge Inventory (NBI) and assigned a code from 0 to 9, with 0 being in a failed condition and 9 being in excellent condition.
Category National Bridge Inventory Code* Description
Good 7 or more A range from no problems noted to some minor problems.
Fair 5 or 6 All primary structural elements are sound but may have deficiencies such as minor section loss, deterioration, cracking, spalling, or scour.
Poor 4 or less Advanced deficiencies such as section loss, deterioration, cracking, spalling, scour, or seriously affected primary structural components.
*For 2015 the NBI code of 6 has changed from good condition to fair condition. This change aligns with federal reporting requirements. The WSDOT’s policy is to maintain 90 percent of bridges at a condition level of fair or better. The following table shows condition ratings for state bridges:
Average of Last
2015 2013 2011 Three Assessments
92.1% 91.4% 95.4% 93.0%
BridgesPercentage in Fair or Better Condition*
Two Year Cycle Ending Fiscal Year
* The methodology for 2013 has changed from number of bridges to square footage of the bridge deck. This change aligns with federal reporting requirements. The following table reflects the state’s estimated and actual expenditures necessary to preserve the bridges at the established condition level:
2015 2014 2013 2012 2011
Planned 71,078$ 92,192$ 98,519$ 66,510$ 46,708$
Actual 64,060 87,271 87,306 61,026 43,709Variance 7,018$ 4,921$ 11,213$ 5,484$ 2,999$
9.9% 5.3% 11.4% 8.2% 6.4%
(expressed in thousands)Preservation and Maintenance - Planned to Actual - Fiscal Year
Bridges
Actual expenditures may vary from planned amounts for a variety of reasons which include, but are not limited to, management’s decision to accelerate, defer, or reduce preservation or maintenance activity in response to economic forecasts and other factors.
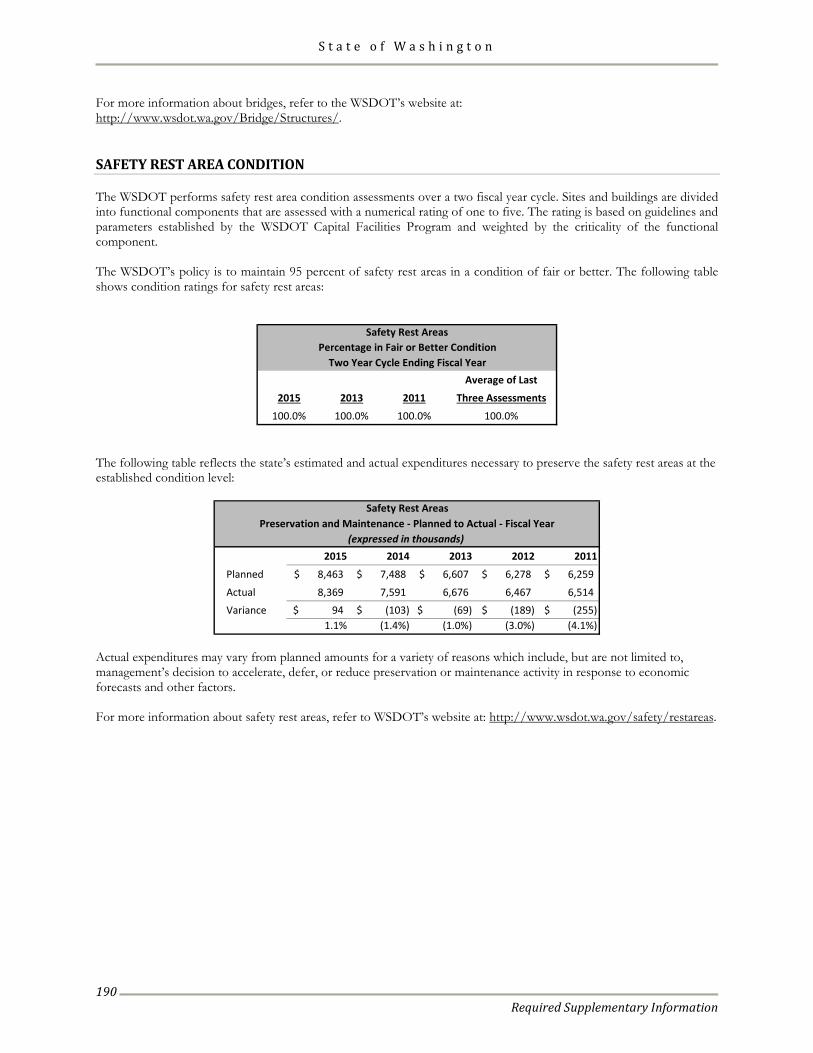
S t a t e o f W a s h i n g t o n
Required Supplementary Information
190
For more information about bridges, refer to the WSDOT’s website at: http://www.wsdot.wa.gov/Bridge/Structures/. SAFETY REST AREA CONDITION The WSDOT performs safety rest area condition assessments over a two fiscal year cycle. Sites and buildings are divided into functional components that are assessed with a numerical rating of one to five. The rating is based on guidelines and parameters established by the WSDOT Capital Facilities Program and weighted by the criticality of the functional component. The WSDOT’s policy is to maintain 95 percent of safety rest areas in a condition of fair or better. The following table shows condition ratings for safety rest areas:
Average of Last
2015 2013 2011 Three Assessments
100.0% 100.0% 100.0% 100.0%
Safety Rest AreasPercentage in Fair or Better Condition
Two Year Cycle Ending Fiscal Year
The following table reflects the state’s estimated and actual expenditures necessary to preserve the safety rest areas at the established condition level:
2015 2014 2013 2012 2011
Planned 8,463$ 7,488$ 6,607$ 6,278$ 6,259$
Actual 8,369 7,591 6,676 6,467 6,514Variance 94$ (103)$ (69)$ (189)$ (255)$
1.1% (1.4%) (1.0%) (3.0%) (4.1%)
(expressed in thousands)Preservation and Maintenance - Planned to Actual - Fiscal Year
Safety Rest Areas
Actual expenditures may vary from planned amounts for a variety of reasons which include, but are not limited to, management’s decision to accelerate, defer, or reduce preservation or maintenance activity in response to economic forecasts and other factors. For more information about safety rest areas, refer to WSDOT’s website at: http://www.wsdot.wa.gov/safety/restareas.
S t a t e o f W a s h i n g t o n
Combining and Individual Fund Financial Statements
191
OTHER SUPPLEMENTARY INFORMATION
S t a t e o f W a s h i n g t o n
Combining and Individual Fund Financial Statements
192
Nonmajor Funds Combining Financial Statements
S t a t e o f W a s h i n g t o n
Combining and Individual Fund Financial Statements
193
Nonmajor Governmental Funds The Nonmajor Governmental Funds fall into the four categories as described below: Special Revenue Funds Special Revenue Funds account for the proceeds of specific revenue sources (other than trusts for individuals, private organizations, or other governments, or for major capital projects) that are restricted or committed to expenditures for specified purposes. Debt Service Funds Debt Service Funds account for the accumulation of resources that are restricted or committed to expenditures for, and the payment of, principal and interest on the state's bonds issued in support of governmental activities.
Capital Projects Funds Capital Projects Funds account for financial resources that are restricted or committed to expenditures for the acquisition, construction, or improvement of major state-owned capital facilities (other than highway infrastructure or those financed by proprietary funds). Permanent Funds Permanent Funds account for resources that are legally restricted to the extent that only earnings, and not principal, may be used for the benefit of the state or its citizenry. The Common School Permanent Fund, the state’s only Nonmajor Permanent Fund, accounts for the principal derived from the sale of timber. Interest earned is used for the benefit of common schools.
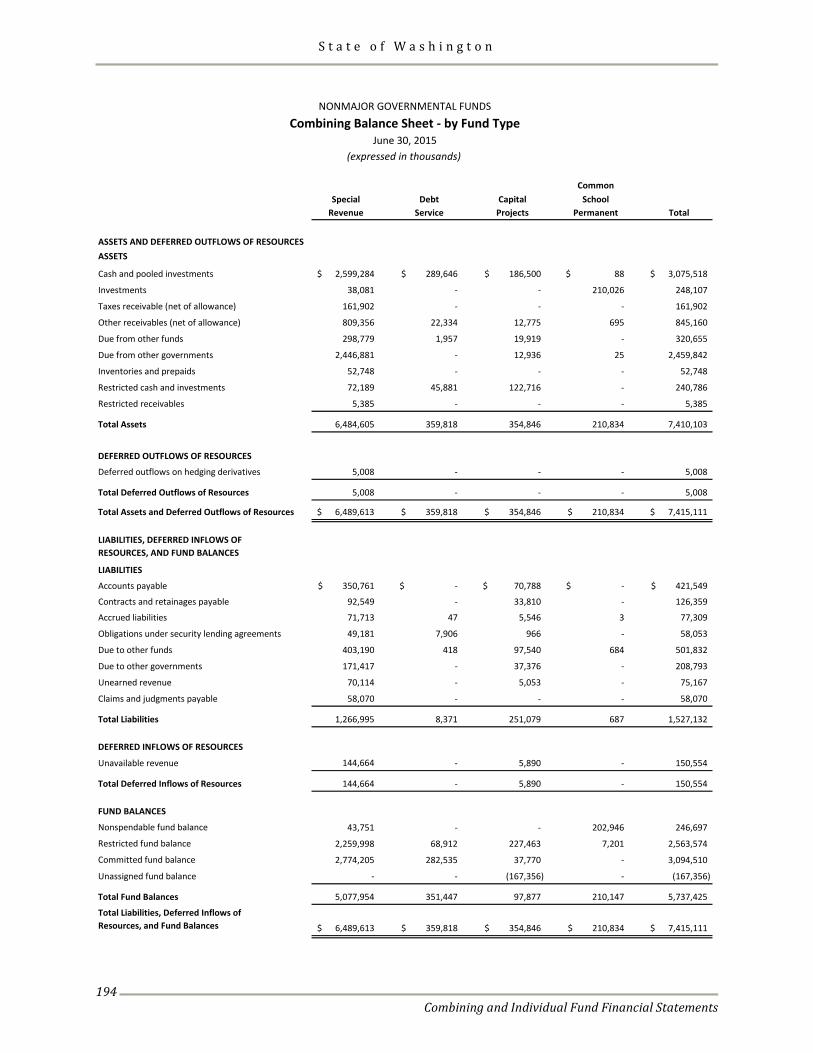
S t a t e o f W a s h i n g t o n
Combining and Individual Fund Financial Statements
194
CommonSpecial Debt Capital School
Revenue Service Projects Permanent Total
ASSETS AND DEFERRED OUTFLOWS OF RESOURCESASSETS
Cash and pooled investments 2,599,284$ 289,646$ 186,500$ 88$ 3,075,518$
Investments 38,081 - - 210,026 248,107
Taxes receivable (net of allowance) 161,902 - - - 161,902
Other receivables (net of allowance) 809,356 22,334 12,775 695 845,160
Due from other funds 298,779 1,957 19,919 - 320,655
Due from other governments 2,446,881 - 12,936 25 2,459,842
Inventories and prepaids 52,748 - - - 52,748
Restricted cash and investments 72,189 45,881 122,716 - 240,786
Restricted receivables 5,385 - - - 5,385
Total Assets 6,484,605 359,818 354,846 210,834 7,410,103
DEFERRED OUTFLOWS OF RESOURCES
Deferred outflows on hedging derivatives 5,008 - - - 5,008
Total Deferred Outflows of Resources 5,008 - - - 5,008
Total Assets and Deferred Outflows of Resources 6,489,613$ 359,818$ 354,846$ 210,834$ 7,415,111$
LIABILITIES, DEFERRED INFLOWS OFRESOURCES, AND FUND BALANCES
LIABILITIES
Accounts payable 350,761$ -$ 70,788$ -$ 421,549$
Contracts and retainages payable 92,549 - 33,810 - 126,359
Accrued liabilities 71,713 47 5,546 3 77,309
Obligations under security lending agreements 49,181 7,906 966 - 58,053
Due to other funds 403,190 418 97,540 684 501,832
Due to other governments 171,417 - 37,376 - 208,793
Unearned revenue 70,114 - 5,053 - 75,167
Claims and judgments payable 58,070 - - - 58,070
Total Liabilities 1,266,995 8,371 251,079 687 1,527,132
DEFERRED INFLOWS OF RESOURCES
Unavailable revenue 144,664 - 5,890 - 150,554
Total Deferred Inflows of Resources 144,664 - 5,890 - 150,554
FUND BALANCES
Nonspendable fund balance 43,751 - - 202,946 246,697
Restricted fund balance 2,259,998 68,912 227,463 7,201 2,563,574
Committed fund balance 2,774,205 282,535 37,770 - 3,094,510
Unassigned fund balance - - (167,356) - (167,356)
Total Fund Balances 5,077,954 351,447 97,877 210,147 5,737,425
Total Liabilities, Deferred Inflows of Resources, and Fund Balances 6,489,613$ 359,818$ 354,846$ 210,834$ 7,415,111$
NONMAJOR GOVERNMENTAL FUNDSCombining Balance Sheet - by Fund Type
June 30, 2015(expressed in thousands)
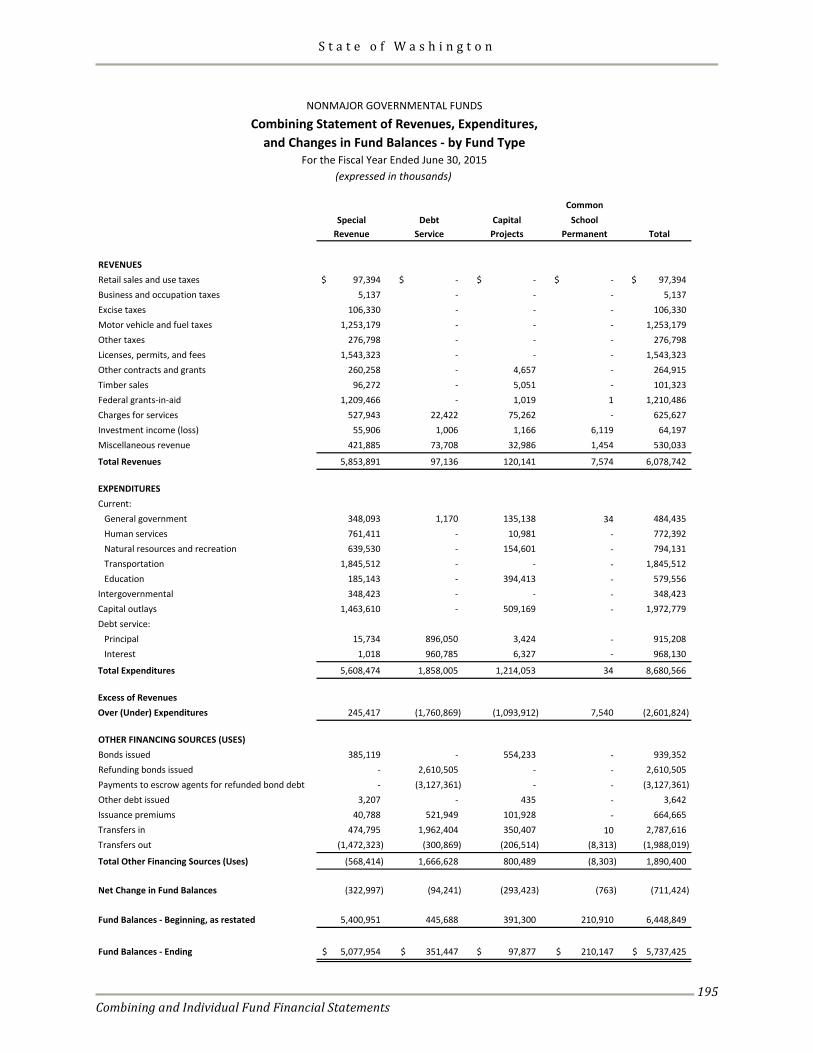
S t a t e o f W a s h i n g t o n
Combining and Individual Fund Financial Statements
195
CommonSpecial Debt Capital School
Revenue Service Projects Permanent Total
REVENUESRetail sales and use taxes 97,394$ -$ -$ -$ 97,394$ Business and occupation taxes 5,137 - - - 5,137 Excise taxes 106,330 - - - 106,330 Motor vehicle and fuel taxes 1,253,179 - - - 1,253,179 Other taxes 276,798 - - - 276,798 Licenses, permits, and fees 1,543,323 - - - 1,543,323 Other contracts and grants 260,258 - 4,657 - 264,915 Timber sales 96,272 - 5,051 - 101,323 Federal grants-in-aid 1,209,466 - 1,019 1 1,210,486 Charges for services 527,943 22,422 75,262 - 625,627 Investment income (loss) 55,906 1,006 1,166 6,119 64,197 Miscellaneous revenue 421,885 73,708 32,986 1,454 530,033
Total Revenues 5,853,891 97,136 120,141 7,574 6,078,742
EXPENDITURESCurrent:
General government 348,093 1,170 135,138 34 484,435 Human services 761,411 - 10,981 - 772,392 Natural resources and recreation 639,530 - 154,601 - 794,131 Transportation 1,845,512 - - - 1,845,512 Education 185,143 - 394,413 - 579,556
Intergovernmental 348,423 - - - 348,423 Capital outlays 1,463,610 - 509,169 - 1,972,779 Debt service:
Principal 15,734 896,050 3,424 - 915,208 Interest 1,018 960,785 6,327 - 968,130
Total Expenditures 5,608,474 1,858,005 1,214,053 34 8,680,566
Excess of RevenuesOver (Under) Expenditures 245,417 (1,760,869) (1,093,912) 7,540 (2,601,824)
OTHER FINANCING SOURCES (USES)Bonds issued 385,119 - 554,233 - 939,352 Refunding bonds issued - 2,610,505 - - 2,610,505 Payments to escrow agents for refunded bond debt - (3,127,361) - - (3,127,361) Other debt issued 3,207 - 435 - 3,642 Issuance premiums 40,788 521,949 101,928 - 664,665 Transfers in 474,795 1,962,404 350,407 10 2,787,616 Transfers out (1,472,323) (300,869) (206,514) (8,313) (1,988,019)
Total Other Financing Sources (Uses) (568,414) 1,666,628 800,489 (8,303) 1,890,400
Net Change in Fund Balances (322,997) (94,241) (293,423) (763) (711,424)
Fund Balances - Beginning, as restated 5,400,951 445,688 391,300 210,910 6,448,849
Fund Balances - Ending 5,077,954$ 351,447$ 97,877$ 210,147$ 5,737,425$
(expressed in thousands)
NONMAJOR GOVERNMENTAL FUNDS
Combining Statement of Revenues, Expenditures,and Changes in Fund Balances - by Fund Type
For the Fiscal Year Ended June 30, 2015

S t a t e o f W a s h i n g t o n
Combining and Individual Fund Financial Statements
196
This page intentionally left blank.
S t a t e o f W a s h i n g t o n
Combining and Individual Fund Financial Statements
197
Nonmajor Special Revenue Funds Special Revenue Funds account for the proceeds of specific revenue sources (other than trusts for individuals, private organizations, or other governments, or for major capital projects) that are restricted or committed to expenditures for specified purposes. The Nonmajor Special Revenue Funds are described below: Motor Vehicle Fund The Motor Vehicle Fund accounts for highway activities of the Washington State Patrol; operations of the state ferry system; completion and preservation of the interstate system; other transportation improvements; and maintenance of non-interstate highways and bridges. Multimodal Transportation Fund The Multimodal Transportation Fund accounts for activities relating to drivers' licensing; driver improvement and financial responsibility; maintenance of driving records, charges for transportation services; and other highway and non-highway operations and capital improvements.
Central Administrative & Regulatory Fund The Central Administrative and Regulatory Fund accounts for the operating expenditures of certain administrative and regulatory agencies. Human Services Fund The Human Services Fund accounts for activities related to safe and reliable drinking water; life sciences research; housing for persons and families with special housing needs; community awareness and support, and the collection of tobacco settlement monies. Wildlife and Natural Resources Fund The Wildlife and Natural Resources Fund accounts for the protection, management and remediation programs of the state's wildlife, habitats, and natural resources, including forests, water, and parks. Local Construction & Loan Fund The Local Construction and Loan Fund accounts for construction and loan programs for local public works projects.
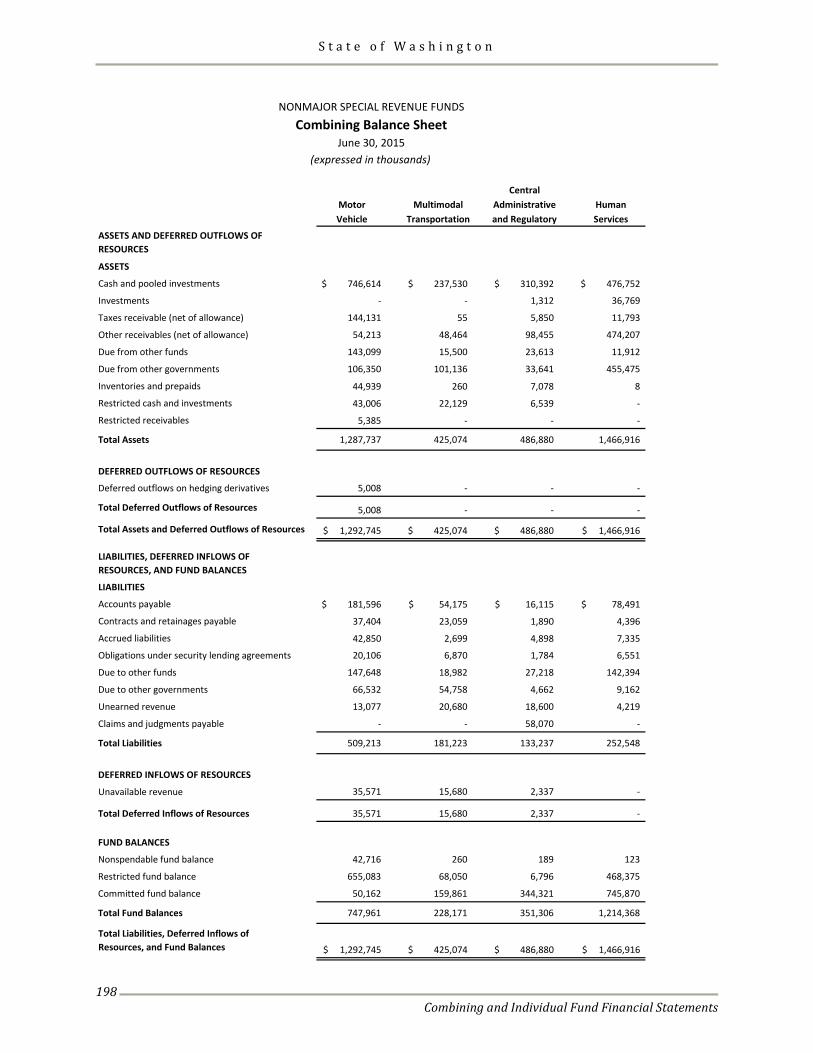
S t a t e o f W a s h i n g t o n
Combining and Individual Fund Financial Statements
198
CentralMotor Multimodal Administrative HumanVehicle Transportation and Regulatory Services
ASSETS AND DEFERRED OUTFLOWS OF RESOURCES
ASSETS
Cash and pooled investments 746,614$ 237,530$ 310,392$ 476,752$
Investments - - 1,312 36,769
Taxes receivable (net of allowance) 144,131 55 5,850 11,793
Other receivables (net of allowance) 54,213 48,464 98,455 474,207
Due from other funds 143,099 15,500 23,613 11,912
Due from other governments 106,350 101,136 33,641 455,475
Inventories and prepaids 44,939 260 7,078 8
Restricted cash and investments 43,006 22,129 6,539 -
Restricted receivables 5,385 - - -
Total Assets 1,287,737 425,074 486,880 1,466,916
DEFERRED OUTFLOWS OF RESOURCES
Deferred outflows on hedging derivatives 5,008 - - -
Total Deferred Outflows of Resources 5,008 - - -
Total Assets and Deferred Outflows of Resources 1,292,745$ 425,074$ 486,880$ 1,466,916$
LIABILITIES, DEFERRED INFLOWS OFRESOURCES, AND FUND BALANCES
LIABILITIES
Accounts payable 181,596$ 54,175$ 16,115$ 78,491$
Contracts and retainages payable 37,404 23,059 1,890 4,396
Accrued liabilities 42,850 2,699 4,898 7,335
Obligations under security lending agreements 20,106 6,870 1,784 6,551
Due to other funds 147,648 18,982 27,218 142,394
Due to other governments 66,532 54,758 4,662 9,162
Unearned revenue 13,077 20,680 18,600 4,219
Claims and judgments payable - - 58,070 -
Total Liabilities 509,213 181,223 133,237 252,548
DEFERRED INFLOWS OF RESOURCES
Unavailable revenue 35,571 15,680 2,337 -
Total Deferred Inflows of Resources 35,571 15,680 2,337 -
FUND BALANCES
Nonspendable fund balance 42,716 260 189 123
Restricted fund balance 655,083 68,050 6,796 468,375
Committed fund balance 50,162 159,861 344,321 745,870
Total Fund Balances 747,961 228,171 351,306 1,214,368
Total Liabilities, Deferred Inflows of Resources, and Fund Balances 1,292,745$ 425,074$ 486,880$ 1,466,916$
NONMAJOR SPECIAL REVENUE FUNDSCombining Balance Sheet
June 30, 2015(expressed in thousands)
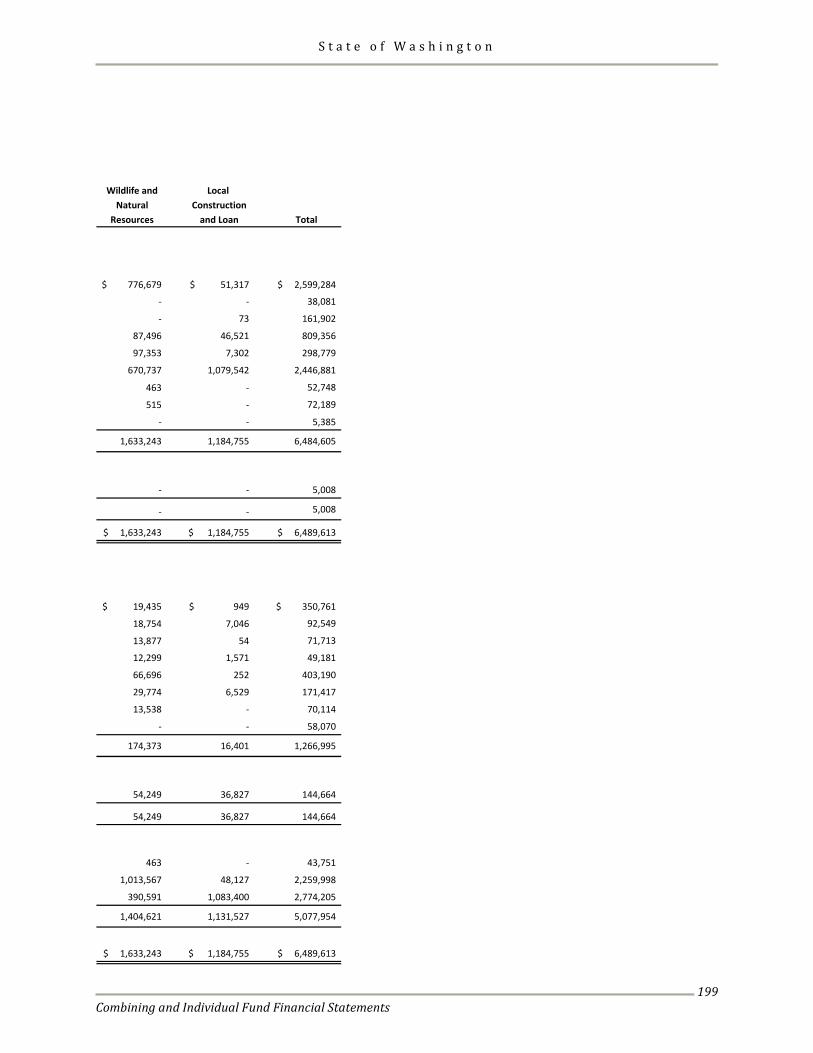
S t a t e o f W a s h i n g t o n
Combining and Individual Fund Financial Statements
199
Wildlife and Local Natural Construction
Resources and Loan Total
776,679$ 51,317$ 2,599,284$
- - 38,081
- 73 161,902
87,496 46,521 809,356
97,353 7,302 298,779
670,737 1,079,542 2,446,881
463 - 52,748
515 - 72,189
- - 5,385
1,633,243 1,184,755 6,484,605
- - 5,008
- - 5,008
1,633,243$ 1,184,755$ 6,489,613$
19,435$ 949$ 350,761$
18,754 7,046 92,549
13,877 54 71,713
12,299 1,571 49,181
66,696 252 403,190
29,774 6,529 171,417
13,538 - 70,114
- - 58,070
174,373 16,401 1,266,995
54,249 36,827 144,664
54,249 36,827 144,664
463 - 43,751
1,013,567 48,127 2,259,998
390,591 1,083,400 2,774,205
1,404,621 1,131,527 5,077,954
1,633,243$ 1,184,755$ 6,489,613$
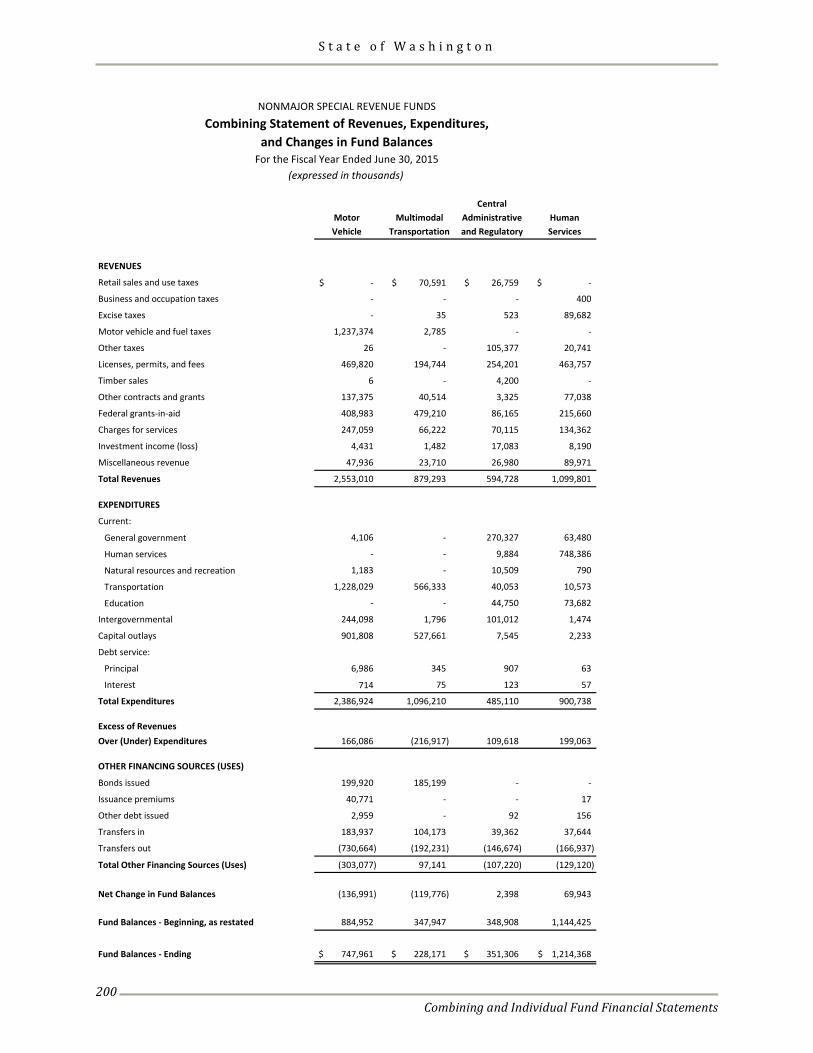
S t a t e o f W a s h i n g t o n
Combining and Individual Fund Financial Statements
200
CentralMotor Multimodal Administrative HumanVehicle Transportation and Regulatory Services
REVENUES
Retail sales and use taxes -$ 70,591$ 26,759$ -$
Business and occupation taxes - - - 400
Excise taxes - 35 523 89,682
Motor vehicle and fuel taxes 1,237,374 2,785 - -
Other taxes 26 - 105,377 20,741
Licenses, permits, and fees 469,820 194,744 254,201 463,757
Timber sales 6 - 4,200 -
Other contracts and grants 137,375 40,514 3,325 77,038
Federal grants-in-aid 408,983 479,210 86,165 215,660
Charges for services 247,059 66,222 70,115 134,362
Investment income (loss) 4,431 1,482 17,083 8,190
Miscellaneous revenue 47,936 23,710 26,980 89,971
Total Revenues 2,553,010 879,293 594,728 1,099,801
EXPENDITURES
Current:
General government 4,106 - 270,327 63,480
Human services - - 9,884 748,386
Natural resources and recreation 1,183 - 10,509 790
Transportation 1,228,029 566,333 40,053 10,573
Education - - 44,750 73,682
Intergovernmental 244,098 1,796 101,012 1,474
Capital outlays 901,808 527,661 7,545 2,233
Debt service:
Principal 6,986 345 907 63
Interest 714 75 123 57
Total Expenditures 2,386,924 1,096,210 485,110 900,738
Excess of RevenuesOver (Under) Expenditures 166,086 (216,917) 109,618 199,063
OTHER FINANCING SOURCES (USES)
Bonds issued 199,920 185,199 - -
Issuance premiums 40,771 - - 17
Other debt issued 2,959 - 92 156
Transfers in 183,937 104,173 39,362 37,644
Transfers out (730,664) (192,231) (146,674) (166,937)
Total Other Financing Sources (Uses) (303,077) 97,141 (107,220) (129,120)
Net Change in Fund Balances (136,991) (119,776) 2,398 69,943
Fund Balances - Beginning, as restated 884,952 347,947 348,908 1,144,425
Fund Balances - Ending 747,961$ 228,171$ 351,306$ 1,214,368$
(expressed in thousands)For the Fiscal Year Ended June 30, 2015and Changes in Fund Balances
Combining Statement of Revenues, Expenditures,NONMAJOR SPECIAL REVENUE FUNDS
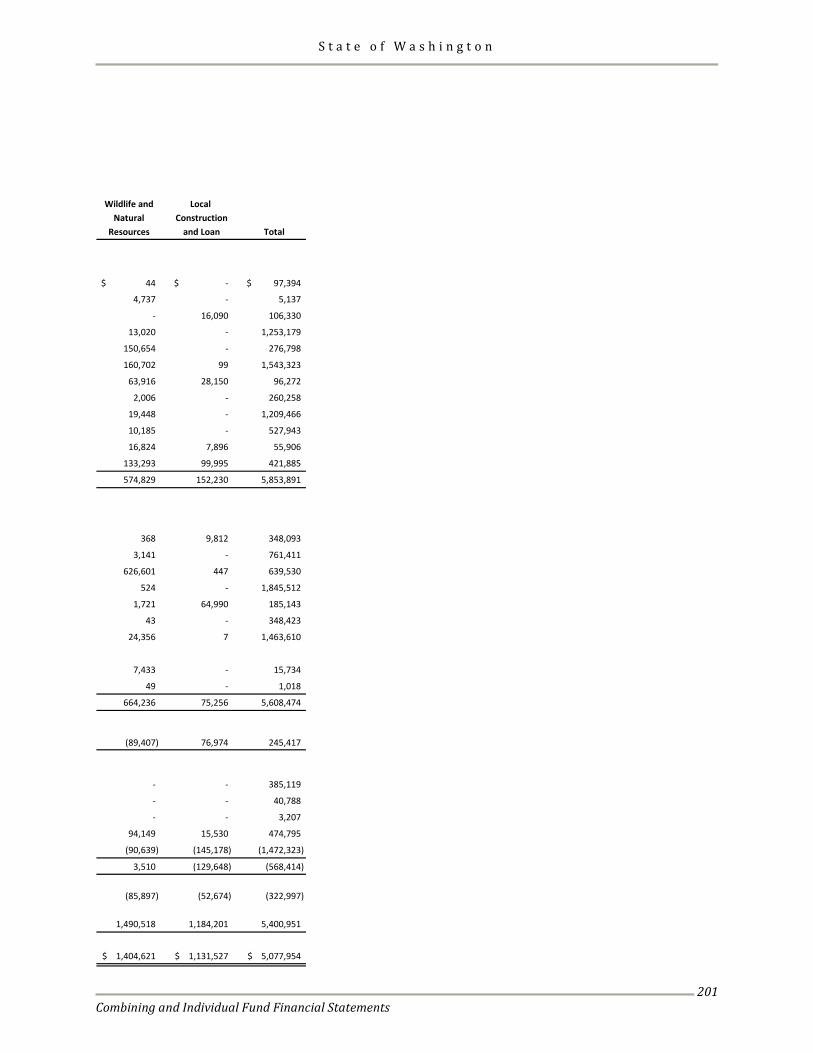
S t a t e o f W a s h i n g t o n
Combining and Individual Fund Financial Statements
201
Wildlife and Local Natural Construction
Resources and Loan Total
44$ -$ 97,394$
4,737 - 5,137
- 16,090 106,330
13,020 - 1,253,179
150,654 - 276,798
160,702 99 1,543,323
63,916 28,150 96,272
2,006 - 260,258
19,448 - 1,209,466
10,185 - 527,943
16,824 7,896 55,906
133,293 99,995 421,885
574,829 152,230 5,853,891
368 9,812 348,093
3,141 - 761,411
626,601 447 639,530
524 - 1,845,512
1,721 64,990 185,143
43 - 348,423
24,356 7 1,463,610
7,433 - 15,734
49 - 1,018
664,236 75,256 5,608,474
(89,407) 76,974 245,417
- - 385,119
- - 40,788
- - 3,207
94,149 15,530 474,795
(90,639) (145,178) (1,472,323)
3,510 (129,648) (568,414)
(85,897) (52,674) (322,997)
1,490,518 1,184,201 5,400,951
1,404,621$ 1,131,527$ 5,077,954$
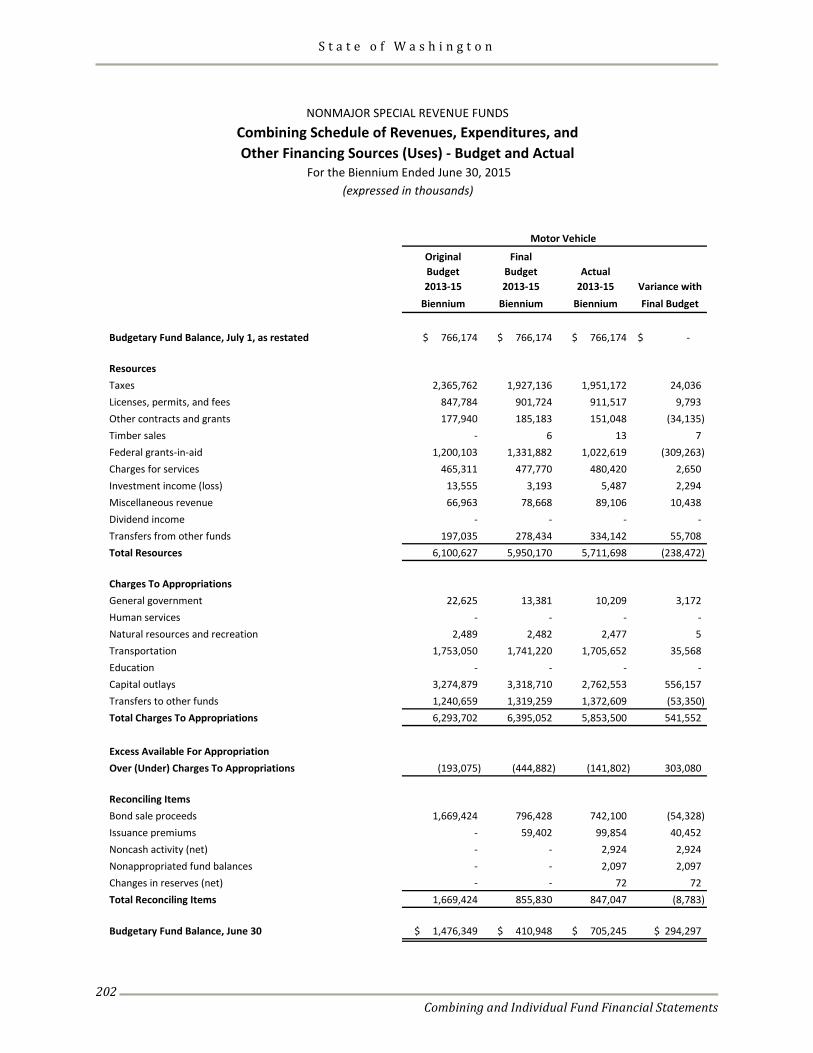
S t a t e o f W a s h i n g t o n
Combining and Individual Fund Financial Statements
202
Motor Vehicle
Original FinalBudget Budget Actual2013-15 2013-15 2013-15 Variance with
Biennium Biennium Biennium Final Budget
Budgetary Fund Balance, July 1, as restated $ 766,174 $ 766,174 $ 766,174 -$
ResourcesTaxes 2,365,762 1,927,136 1,951,172 24,036 Licenses, permits, and fees 847,784 901,724 911,517 9,793 Other contracts and grants 177,940 185,183 151,048 (34,135) Timber sales - 6 13 7 Federal grants-in-aid 1,200,103 1,331,882 1,022,619 (309,263) Charges for services 465,311 477,770 480,420 2,650 Investment income (loss) 13,555 3,193 5,487 2,294 Miscellaneous revenue 66,963 78,668 89,106 10,438 Dividend income - - - - Transfers from other funds 197,035 278,434 334,142 55,708 Total Resources 6,100,627 5,950,170 5,711,698 (238,472)
Charges To Appropriations General government 22,625 13,381 10,209 3,172 Human services - - - - Natural resources and recreation 2,489 2,482 2,477 5 Transportation 1,753,050 1,741,220 1,705,652 35,568 Education - - - - Capital outlays 3,274,879 3,318,710 2,762,553 556,157 Transfers to other funds 1,240,659 1,319,259 1,372,609 (53,350) Total Charges To Appropriations 6,293,702 6,395,052 5,853,500 541,552
Excess Available For Appropriation Over (Under) Charges To Appropriations (193,075) (444,882) (141,802) 303,080
Reconciling ItemsBond sale proceeds 1,669,424 796,428 742,100 (54,328) Issuance premiums - 59,402 99,854 40,452 Noncash activity (net) - - 2,924 2,924 Nonappropriated fund balances - - 2,097 2,097 Changes in reserves (net) - - 72 72 Total Reconciling Items 1,669,424 855,830 847,047 (8,783)
Budgetary Fund Balance, June 30 $ 1,476,349 $ 410,948 $ 705,245 $ 294,297
NONMAJOR SPECIAL REVENUE FUNDSCombining Schedule of Revenues, Expenditures, andOther Financing Sources (Uses) - Budget and Actual
For the Biennium Ended June 30, 2015 (expressed in thousands)
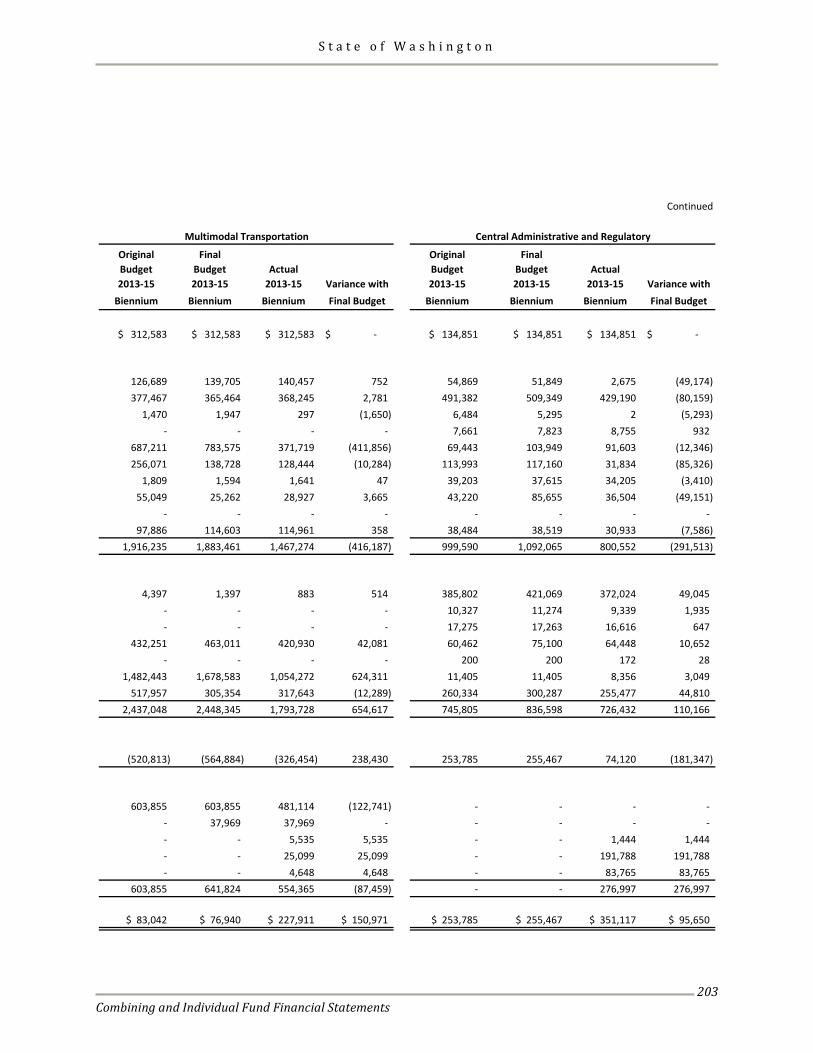
S t a t e o f W a s h i n g t o n
Combining and Individual Fund Financial Statements
203
Continued
Multimodal Transportation Central Administrative and Regulatory
Original Final Original FinalBudget Budget Actual Budget Budget Actual2013-15 2013-15 2013-15 Variance with 2013-15 2013-15 2013-15 Variance with
Biennium Biennium Biennium Final Budget Biennium Biennium Biennium Final Budget
$ 312,583 $ 312,583 $ 312,583 -$ $ 134,851 $ 134,851 $ 134,851 -$
126,689 139,705 140,457 752 54,869 51,849 2,675 (49,174) 377,467 365,464 368,245 2,781 491,382 509,349 429,190 (80,159)
1,470 1,947 297 (1,650) 6,484 5,295 2 (5,293) - - - - 7,661 7,823 8,755 932
687,211 783,575 371,719 (411,856) 69,443 103,949 91,603 (12,346) 256,071 138,728 128,444 (10,284) 113,993 117,160 31,834 (85,326)
1,809 1,594 1,641 47 39,203 37,615 34,205 (3,410) 55,049 25,262 28,927 3,665 43,220 85,655 36,504 (49,151)
- - - - - - - - 97,886 114,603 114,961 358 38,484 38,519 30,933 (7,586)
1,916,235 1,883,461 1,467,274 (416,187) 999,590 1,092,065 800,552 (291,513)
4,397 1,397 883 514 385,802 421,069 372,024 49,045
- - - - 10,327 11,274 9,339 1,935 - - - - 17,275 17,263 16,616 647
432,251 463,011 420,930 42,081 60,462 75,100 64,448 10,652 - - - - 200 200 172 28
1,482,443 1,678,583 1,054,272 624,311 11,405 11,405 8,356 3,049 517,957 305,354 317,643 (12,289) 260,334 300,287 255,477 44,810
2,437,048 2,448,345 1,793,728 654,617 745,805 836,598 726,432 110,166
(520,813) (564,884) (326,454) 238,430 253,785 255,467 74,120 (181,347)
603,855 603,855 481,114 (122,741) - - - - - 37,969 37,969 - - - - - - - 5,535 5,535 - - 1,444 1,444 - - 25,099 25,099 - - 191,788 191,788 - - 4,648 4,648 - - 83,765 83,765
603,855 641,824 554,365 (87,459) - - 276,997 276,997
$ 83,042 $ 76,940 $ 227,911 $ 150,971 $ 253,785 $ 255,467 $ 351,117 $ 95,650
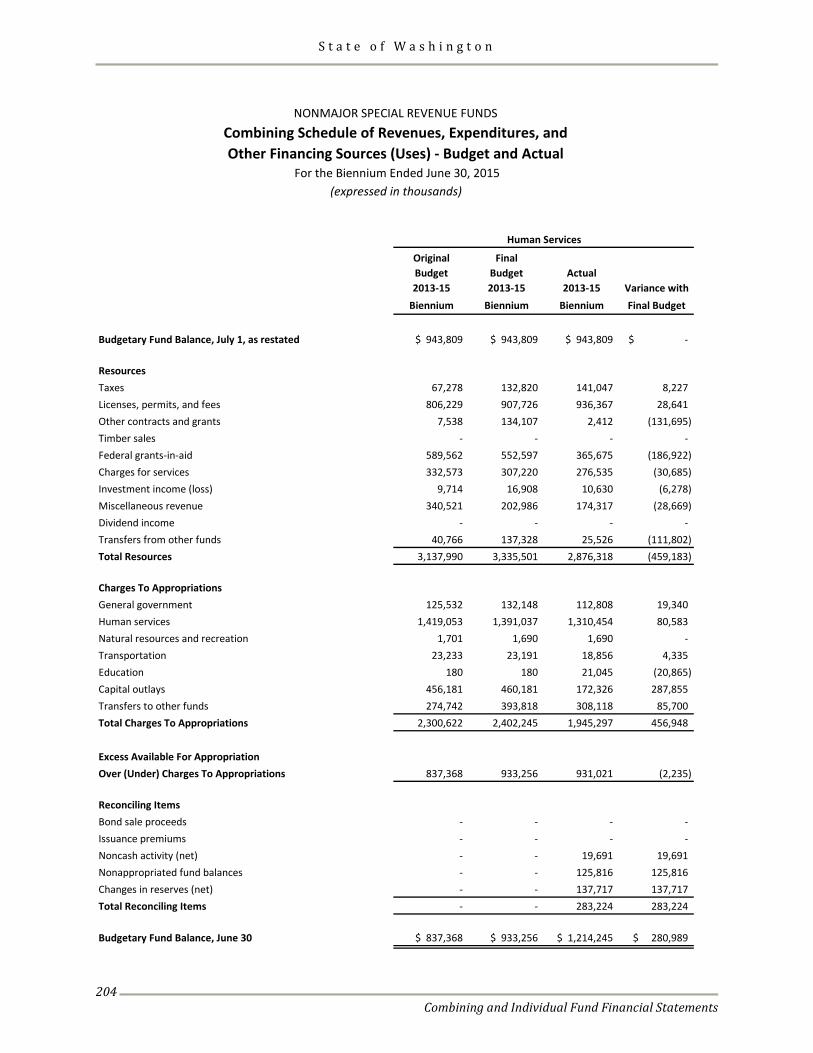
S t a t e o f W a s h i n g t o n
Combining and Individual Fund Financial Statements
204
Human Services
Original FinalBudget Budget Actual2013-15 2013-15 2013-15 Variance with
Biennium Biennium Biennium Final Budget
Budgetary Fund Balance, July 1, as restated $ 943,809 $ 943,809 $ 943,809 $ -
ResourcesTaxes 67,278 132,820 141,047 8,227 Licenses, permits, and fees 806,229 907,726 936,367 28,641 Other contracts and grants 7,538 134,107 2,412 (131,695) Timber sales - - - - Federal grants-in-aid 589,562 552,597 365,675 (186,922) Charges for services 332,573 307,220 276,535 (30,685) Investment income (loss) 9,714 16,908 10,630 (6,278) Miscellaneous revenue 340,521 202,986 174,317 (28,669) Dividend income - - - - Transfers from other funds 40,766 137,328 25,526 (111,802) Total Resources 3,137,990 3,335,501 2,876,318 (459,183)
Charges To Appropriations General government 125,532 132,148 112,808 19,340 Human services 1,419,053 1,391,037 1,310,454 80,583 Natural resources and recreation 1,701 1,690 1,690 - Transportation 23,233 23,191 18,856 4,335 Education 180 180 21,045 (20,865) Capital outlays 456,181 460,181 172,326 287,855 Transfers to other funds 274,742 393,818 308,118 85,700 Total Charges To Appropriations 2,300,622 2,402,245 1,945,297 456,948
Excess Available For Appropriation Over (Under) Charges To Appropriations 837,368 933,256 931,021 (2,235)
Reconciling ItemsBond sale proceeds - - - - Issuance premiums - - - - Noncash activity (net) - - 19,691 19,691 Nonappropriated fund balances - - 125,816 125,816 Changes in reserves (net) - - 137,717 137,717 Total Reconciling Items - - 283,224 283,224
Budgetary Fund Balance, June 30 $ 837,368 $ 933,256 $ 1,214,245 $ 280,989
NONMAJOR SPECIAL REVENUE FUNDSCombining Schedule of Revenues, Expenditures, andOther Financing Sources (Uses) - Budget and Actual
For the Biennium Ended June 30, 2015 (expressed in thousands)
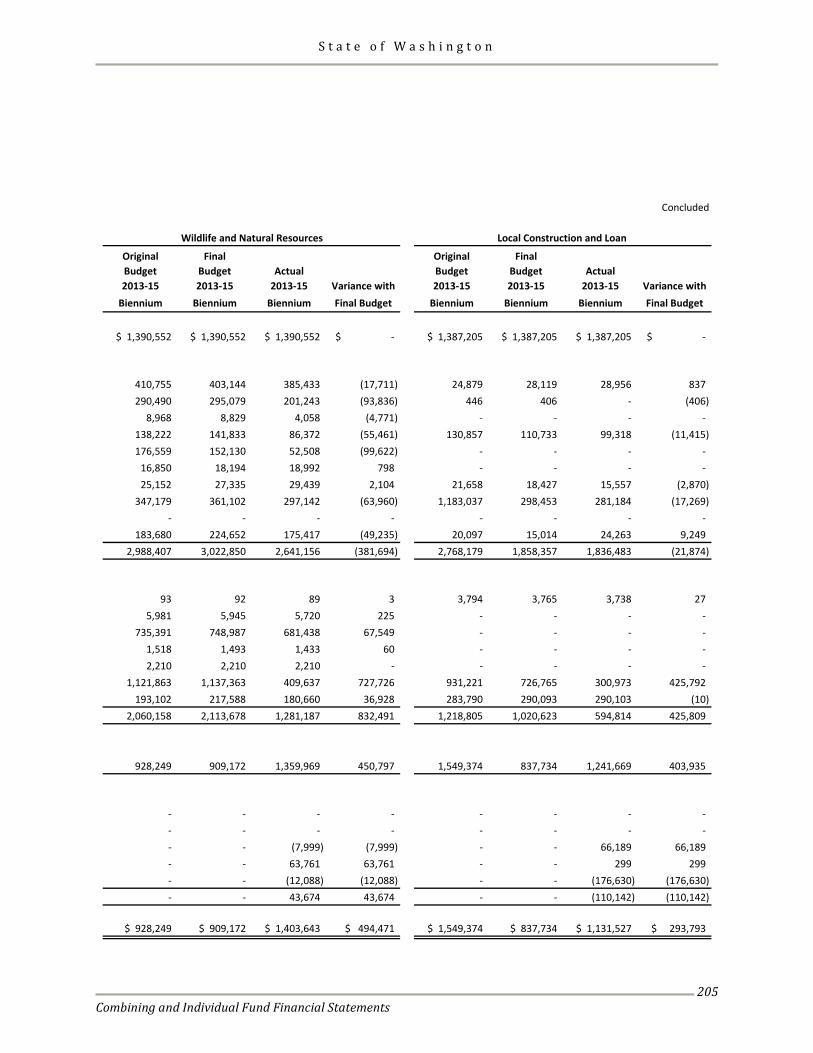
S t a t e o f W a s h i n g t o n
Combining and Individual Fund Financial Statements
205
Concluded
Wildlife and Natural Resources Local Construction and Loan
Original Final Original FinalBudget Budget Actual Budget Budget Actual2013-15 2013-15 2013-15 Variance with 2013-15 2013-15 2013-15 Variance with
Biennium Biennium Biennium Final Budget Biennium Biennium Biennium Final Budget
$ 1,390,552 $ 1,390,552 $ 1,390,552 $ - $ 1,387,205 $ 1,387,205 $ 1,387,205 $ -
410,755 403,144 385,433 (17,711) 24,879 28,119 28,956 837 290,490 295,079 201,243 (93,836) 446 406 - (406)
8,968 8,829 4,058 (4,771) - - - - 138,222 141,833 86,372 (55,461) 130,857 110,733 99,318 (11,415) 176,559 152,130 52,508 (99,622) - - - -
16,850 18,194 18,992 798 - - - - 25,152 27,335 29,439 2,104 21,658 18,427 15,557 (2,870)
347,179 361,102 297,142 (63,960) 1,183,037 298,453 281,184 (17,269) - - - - - - - -
183,680 224,652 175,417 (49,235) 20,097 15,014 24,263 9,249 2,988,407 3,022,850 2,641,156 (381,694) 2,768,179 1,858,357 1,836,483 (21,874)
93 92 89 3 3,794 3,765 3,738 27
5,981 5,945 5,720 225 - - - - 735,391 748,987 681,438 67,549 - - - -
1,518 1,493 1,433 60 - - - - 2,210 2,210 2,210 - - - - -
1,121,863 1,137,363 409,637 727,726 931,221 726,765 300,973 425,792 193,102 217,588 180,660 36,928 283,790 290,093 290,103 (10)
2,060,158 2,113,678 1,281,187 832,491 1,218,805 1,020,623 594,814 425,809
928,249 909,172 1,359,969 450,797 1,549,374 837,734 1,241,669 403,935
- - - - - - - - - - - - - - - - - - (7,999) (7,999) - - 66,189 66,189 - - 63,761 63,761 - - 299 299 - - (12,088) (12,088) - - (176,630) (176,630) - - 43,674 43,674 - - (110,142) (110,142)
$ 928,249 $ 909,172 $ 1,403,643 $ 494,471 $ 1,549,374 $ 837,734 $ 1,131,527 $ 293,793

S t a t e o f W a s h i n g t o n
Combining and Individual Fund Financial Statements
206
This page intentionally left blank.
S t a t e o f W a s h i n g t o n
Combining and Individual Fund Financial Statements
207
Nonmajor Debt Service Funds Debt Service Funds account for the accumulation of resources that are restricted or committed to expenditures for, and the payment of, principal and interest on the state's bonds issued in support of governmental activities. Debt Service Funds are described below: General Obligation Bond Fund The General Obligation Bond Fund accounts for the accumulation of resources for, and the payment of, non-transportation related general obligation bond principal and interest. Transportation General Obligation Bond Fund The Transportation General Obligation Bond Fund accounts for the accumulation of resources for, and
the payment of, transportation general obligation bond principal and interest. Tobacco Settlement Securitization Bond Fund The Tobacco Settlement Securitization Bond Fund accounts for the accumulation of resources for, and the payment of, principal and interest on revenue bonds issued by the Tobacco Settlement Authority, a blended component unit of the state. Transportation Revenue Bond Fund The Transportation Revenue Bond Fund accounts for the accumulation of resources for, and the payment of, transportation revenue bond principal and interest.
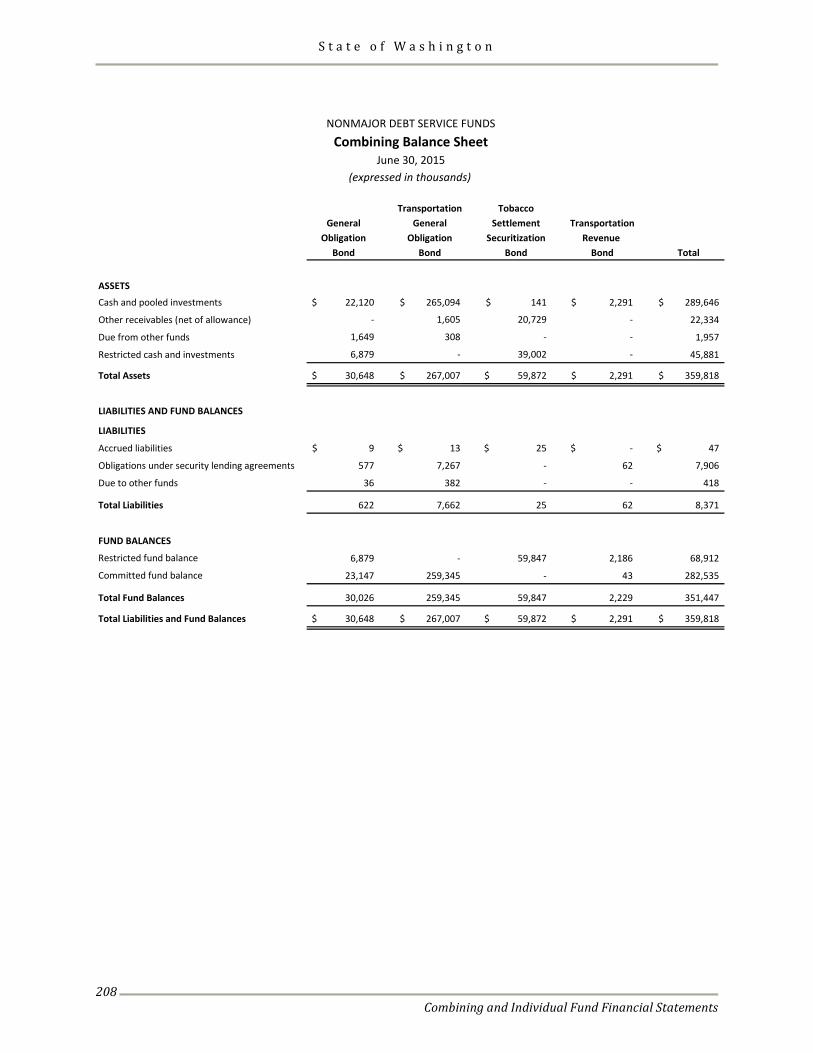
S t a t e o f W a s h i n g t o n
Combining and Individual Fund Financial Statements
208
Transportation TobaccoGeneral General Settlement Transportation
Obligation Obligation Securitization Revenue Bond Bond Bond Bond Total
ASSETS
Cash and pooled investments 22,120$ 265,094$ 141$ 2,291$ 289,646$
Other receivables (net of allowance) - 1,605 20,729 - 22,334
Due from other funds 1,649 308 - - 1,957
Restricted cash and investments 6,879 - 39,002 - 45,881
Total Assets 30,648$ 267,007$ 59,872$ 2,291$ 359,818$
LIABILITIES AND FUND BALANCES
LIABILITIES
Accrued liabilities 9$ 13$ 25$ -$ 47$
Obligations under security lending agreements 577 7,267 - 62 7,906
Due to other funds 36 382 - - 418
Total Liabilities 622 7,662 25 62 8,371
FUND BALANCES
Restricted fund balance 6,879 - 59,847 2,186 68,912
Committed fund balance 23,147 259,345 - 43 282,535
Total Fund Balances 30,026 259,345 59,847 2,229 351,447
Total Liabilities and Fund Balances 30,648$ 267,007$ 59,872$ 2,291$ 359,818$
NONMAJOR DEBT SERVICE FUNDSCombining Balance Sheet
June 30, 2015(expressed in thousands)
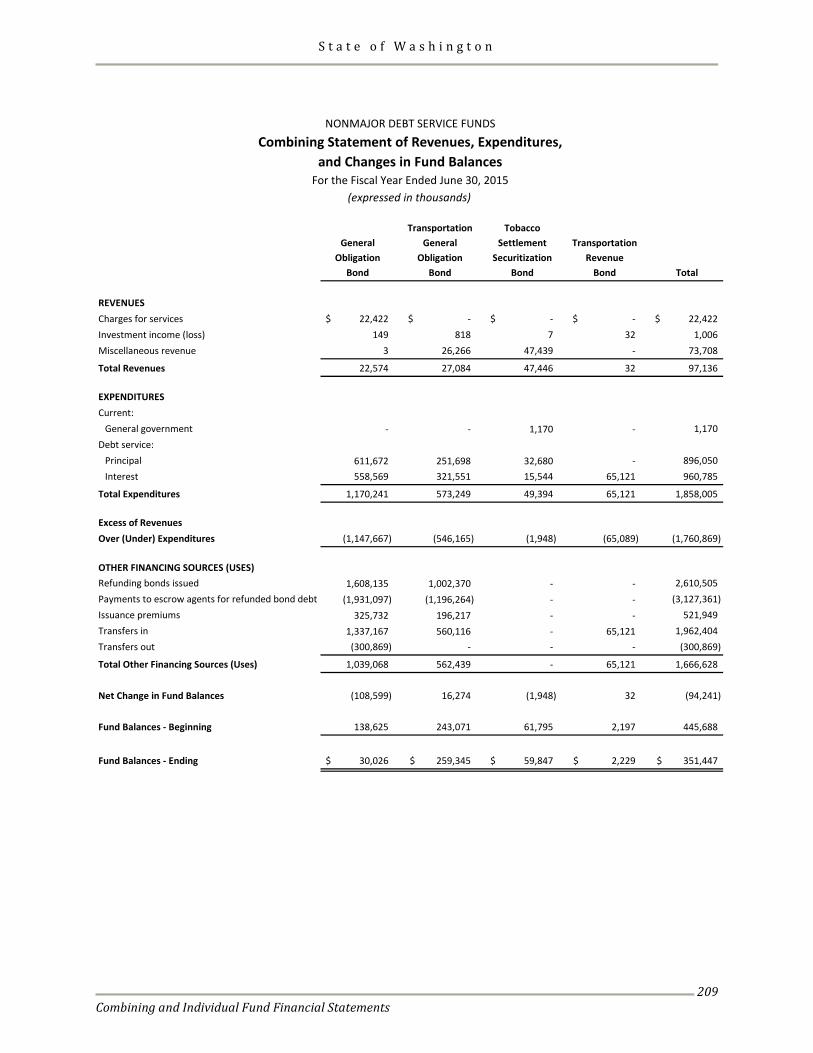
S t a t e o f W a s h i n g t o n
Combining and Individual Fund Financial Statements
209
Transportation TobaccoGeneral General Settlement Transportation
Obligation Obligation Securitization RevenueBond Bond Bond Bond Total
REVENUESCharges for services 22,422$ -$ -$ -$ 22,422$ Investment income (loss) 149 818 7 32 1,006 Miscellaneous revenue 3 26,266 47,439 - 73,708
Total Revenues 22,574 27,084 47,446 32 97,136 EXPENDITURESCurrent:
General government - - 1,170 - 1,170 Debt service:
Principal 611,672 251,698 32,680 - 896,050 Interest 558,569 321,551 15,544 65,121 960,785
Total Expenditures 1,170,241 573,249 49,394 65,121 1,858,005
Excess of RevenuesOver (Under) Expenditures (1,147,667) (546,165) (1,948) (65,089) (1,760,869)
OTHER FINANCING SOURCES (USES)Refunding bonds issued 1,608,135 1,002,370 - - 2,610,505 Payments to escrow agents for refunded bond debt (1,931,097) (1,196,264) - - (3,127,361) Issuance premiums 325,732 196,217 - - 521,949 Transfers in 1,337,167 560,116 - 65,121 1,962,404 Transfers out (300,869) - - - (300,869)
Total Other Financing Sources (Uses) 1,039,068 562,439 - 65,121 1,666,628
Net Change in Fund Balances (108,599) 16,274 (1,948) 32 (94,241)
Fund Balances - Beginning 138,625 243,071 61,795 2,197 445,688
Fund Balances - Ending 30,026$ 259,345$ 59,847$ 2,229$ 351,447$
(expressed in thousands)
NONMAJOR DEBT SERVICE FUNDSCombining Statement of Revenues, Expenditures,
and Changes in Fund BalancesFor the Fiscal Year Ended June 30, 2015
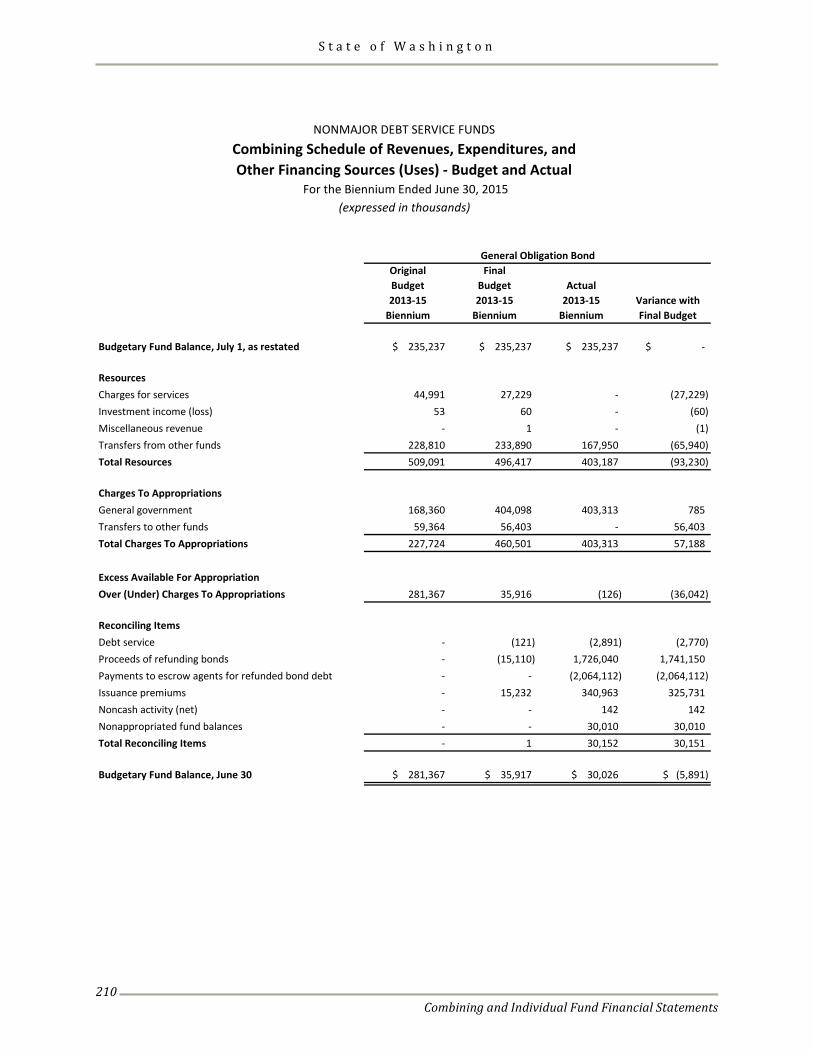
S t a t e o f W a s h i n g t o n
Combining and Individual Fund Financial Statements
210
General Obligation Bond Original FinalBudget Budget Actual2013-15 2013-15 2013-15 Variance with
Biennium Biennium Biennium Final Budget
Budgetary Fund Balance, July 1, as restated $ 235,237 $ 235,237 $ 235,237 $ -
ResourcesCharges for services 44,991 27,229 - (27,229) Investment income (loss) 53 60 - (60) Miscellaneous revenue - 1 - (1) Transfers from other funds 228,810 233,890 167,950 (65,940) Total Resources 509,091 496,417 403,187 (93,230)
Charges To Appropriations General government 168,360 404,098 403,313 785 Transfers to other funds 59,364 56,403 - 56,403 Total Charges To Appropriations 227,724 460,501 403,313 57,188
Excess Available For Appropriation Over (Under) Charges To Appropriations 281,367 35,916 (126) (36,042)
Reconciling ItemsDebt service - (121) (2,891) (2,770) Proceeds of refunding bonds - (15,110) 1,726,040 1,741,150 Payments to escrow agents for refunded bond debt - - (2,064,112) (2,064,112) Issuance premiums - 15,232 340,963 325,731 Noncash activity (net) - - 142 142 Nonappropriated fund balances - - 30,010 30,010 Total Reconciling Items - 1 30,152 30,151
Budgetary Fund Balance, June 30 $ 281,367 $ 35,917 $ 30,026 $ (5,891)
For the Biennium Ended June 30, 2015 (expressed in thousands)
NONMAJOR DEBT SERVICE FUNDSCombining Schedule of Revenues, Expenditures, andOther Financing Sources (Uses) - Budget and Actual
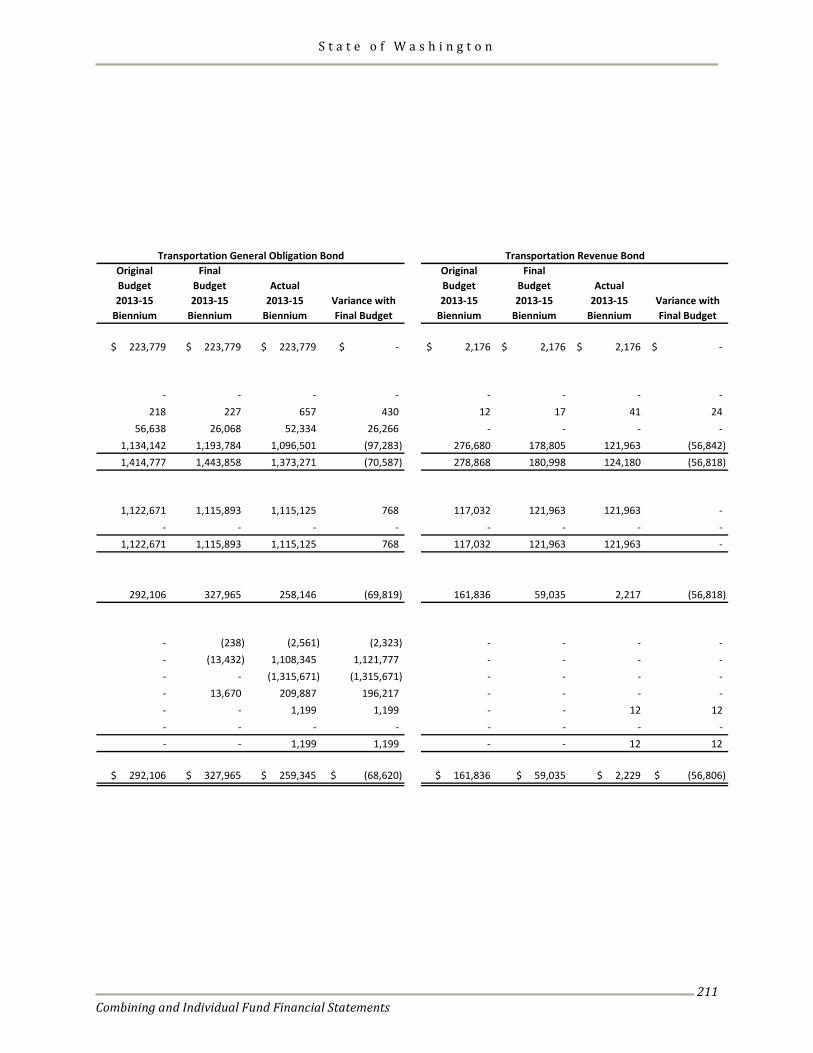
S t a t e o f W a s h i n g t o n
Combining and Individual Fund Financial Statements
211
Transportation General Obligation Bond Transportation Revenue BondOriginal Final Original FinalBudget Budget Actual Budget Budget Actual2013-15 2013-15 2013-15 Variance with 2013-15 2013-15 2013-15 Variance with
Biennium Biennium Biennium Final Budget Biennium Biennium Biennium Final Budget
$ 223,779 $ 223,779 $ 223,779 $ - 2,176$ 2,176$ 2,176$ -$
- - - - - - - - 218 227 657 430 12 17 41 24
56,638 26,068 52,334 26,266 - - - - 1,134,142 1,193,784 1,096,501 (97,283) 276,680 178,805 121,963 (56,842) 1,414,777 1,443,858 1,373,271 (70,587) 278,868 180,998 124,180 (56,818)
1,122,671 1,115,893 1,115,125 768 117,032 121,963 121,963 -
- - - - - - - - 1,122,671 1,115,893 1,115,125 768 117,032 121,963 121,963 -
292,106 327,965 258,146 (69,819) 161,836 59,035 2,217 (56,818)
- (238) (2,561) (2,323) - - - - - (13,432) 1,108,345 1,121,777 - - - - - - (1,315,671) (1,315,671) - - - - - 13,670 209,887 196,217 - - - - - - 1,199 1,199 - - 12 12 - - - - - - - - - - 1,199 1,199 - - 12 12
$ 292,106 $ 327,965 $ 259,345 $ (68,620) $ 161,836 $ 59,035 $ 2,229 $ (56,806)

S t a t e o f W a s h i n g t o n
Combining and Individual Fund Financial Statements
212
This page intentionally left blank.
S t a t e o f W a s h i n g t o n
Combining and Individual Fund Financial Statements
213
Nonmajor Capital Projects Funds Capital Projects Funds account for financial resources that are restricted or committed to expenditures for the acquisition, construction, or improvement of major state-owned capital facilities (other than highway infrastructure or those financed by proprietary funds). The Capital Projects Funds are as follows:
State Facilities Fund The State Facilities Fund accounts for the acquisition, construction, and remodeling of state buildings. Higher Education Facilities Fund The Higher Education Facilities Fund accounts for the acquisition, construction, and remodeling of higher education facilities.
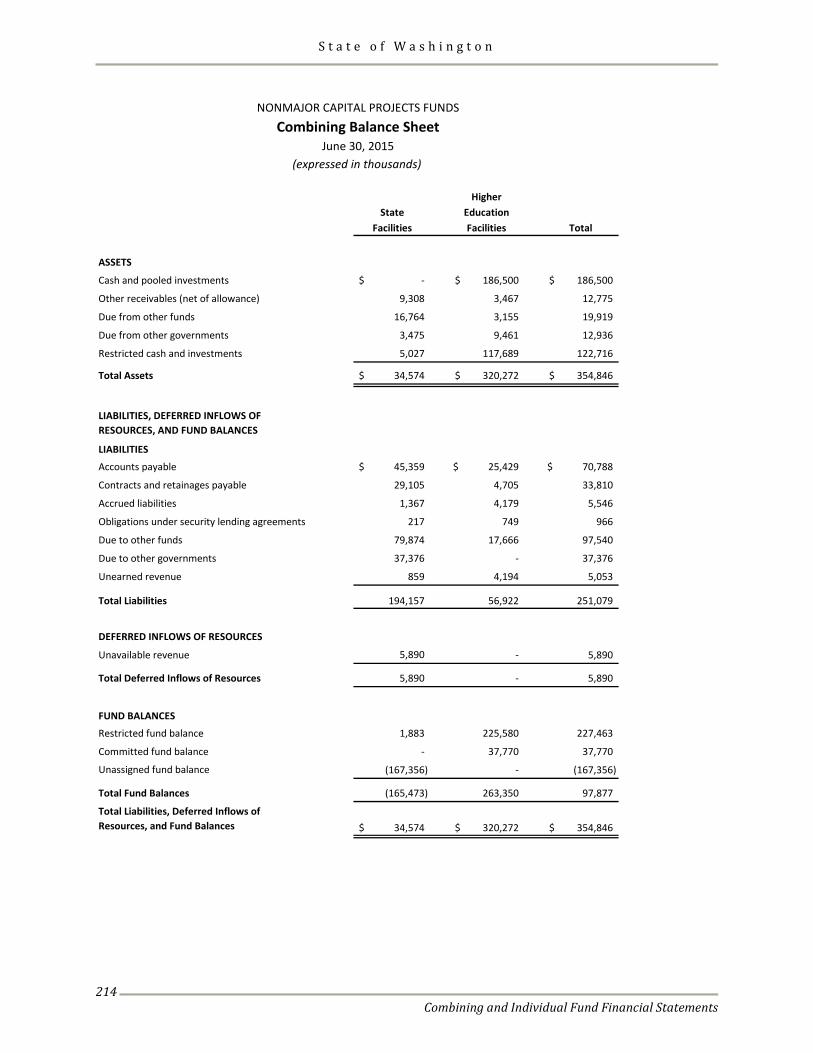
S t a t e o f W a s h i n g t o n
Combining and Individual Fund Financial Statements
214
HigherState Education
Facilities Facilities Total
ASSETS
Cash and pooled investments -$ 186,500$ 186,500$
Other receivables (net of allowance) 9,308 3,467 12,775
Due from other funds 16,764 3,155 19,919
Due from other governments 3,475 9,461 12,936
Restricted cash and investments 5,027 117,689 122,716
Total Assets 34,574$ 320,272$ 354,846$
LIABILITIES, DEFERRED INFLOWS OFRESOURCES, AND FUND BALANCES
LIABILITIES
Accounts payable 45,359$ 25,429$ 70,788$
Contracts and retainages payable 29,105 4,705 33,810
Accrued liabilities 1,367 4,179 5,546
Obligations under security lending agreements 217 749 966
Due to other funds 79,874 17,666 97,540
Due to other governments 37,376 - 37,376
Unearned revenue 859 4,194 5,053
Total Liabilities 194,157 56,922 251,079
DEFERRED INFLOWS OF RESOURCES
Unavailable revenue 5,890 - 5,890
Total Deferred Inflows of Resources 5,890 - 5,890
FUND BALANCES
Restricted fund balance 1,883 225,580 227,463
Committed fund balance - 37,770 37,770
Unassigned fund balance (167,356) - (167,356)
Total Fund Balances (165,473) 263,350 97,877
Total Liabilities, Deferred Inflows of Resources, and Fund Balances 34,574$ 320,272$ 354,846$
NONMAJOR CAPITAL PROJECTS FUNDSCombining Balance Sheet
June 30, 2015(expressed in thousands)
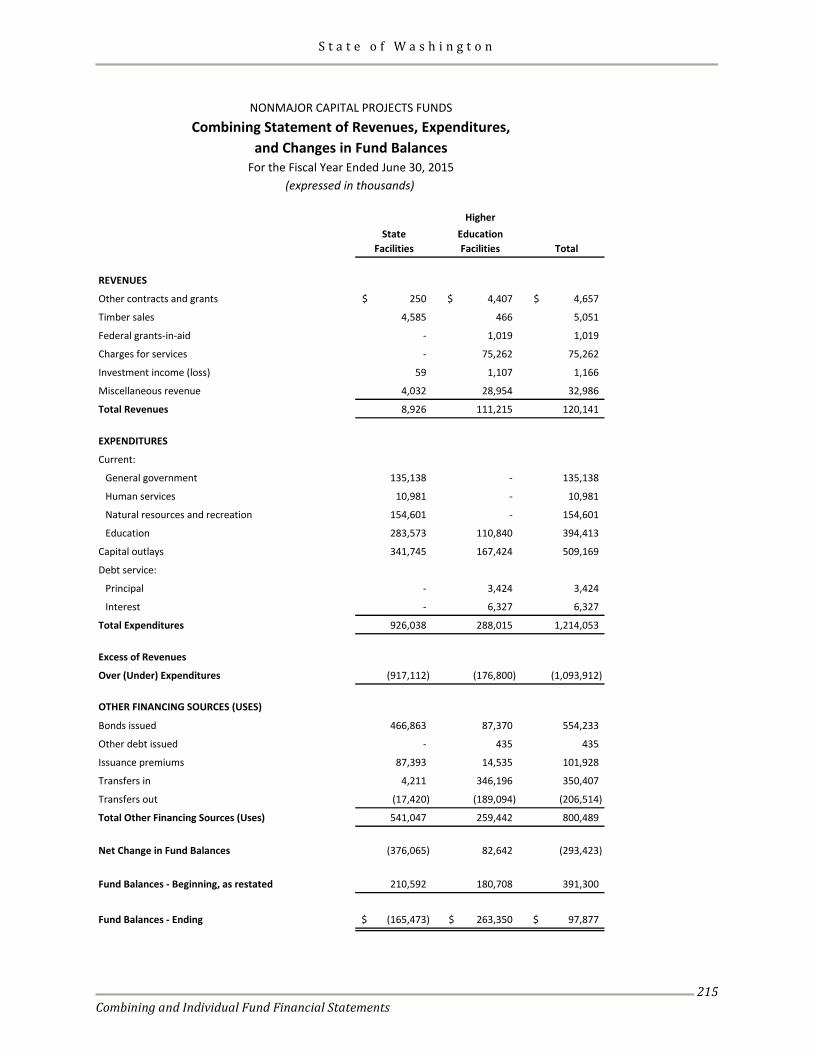
S t a t e o f W a s h i n g t o n
Combining and Individual Fund Financial Statements
215
HigherState Education
Facilities Facilities Total
REVENUES
Other contracts and grants 250$ 4,407$ 4,657$
Timber sales 4,585 466 5,051
Federal grants-in-aid - 1,019 1,019
Charges for services - 75,262 75,262
Investment income (loss) 59 1,107 1,166
Miscellaneous revenue 4,032 28,954 32,986
Total Revenues 8,926 111,215 120,141
EXPENDITURES
Current:
General government 135,138 - 135,138
Human services 10,981 - 10,981
Natural resources and recreation 154,601 - 154,601
Education 283,573 110,840 394,413
Capital outlays 341,745 167,424 509,169
Debt service:
Principal - 3,424 3,424
Interest - 6,327 6,327
Total Expenditures 926,038 288,015 1,214,053
Excess of Revenues
Over (Under) Expenditures (917,112) (176,800) (1,093,912)
OTHER FINANCING SOURCES (USES)
Bonds issued 466,863 87,370 554,233
Other debt issued - 435 435
Issuance premiums 87,393 14,535 101,928
Transfers in 4,211 346,196 350,407
Transfers out (17,420) (189,094) (206,514)
Total Other Financing Sources (Uses) 541,047 259,442 800,489
Net Change in Fund Balances (376,065) 82,642 (293,423)
Fund Balances - Beginning, as restated 210,592 180,708 391,300
Fund Balances - Ending (165,473)$ 263,350$ 97,877$
For the Fiscal Year Ended June 30, 2015(expressed in thousands)
NONMAJOR CAPITAL PROJECTS FUNDSCombining Statement of Revenues, Expenditures,
and Changes in Fund Balances
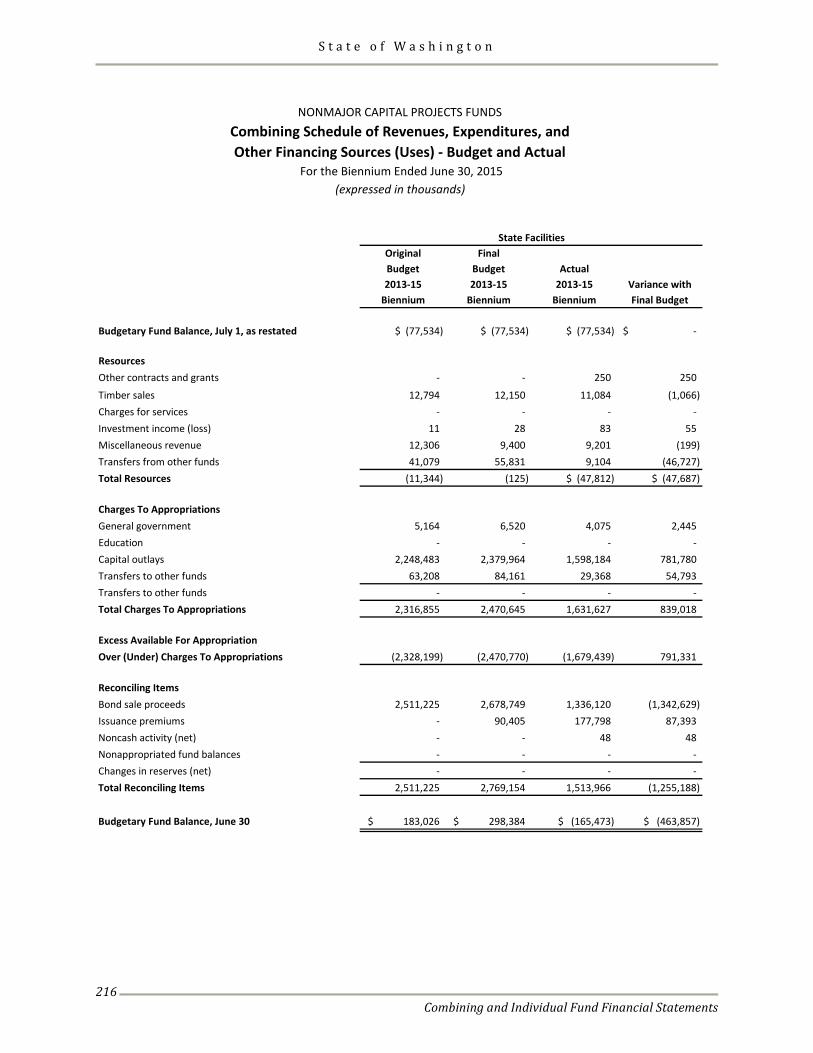
S t a t e o f W a s h i n g t o n
Combining and Individual Fund Financial Statements
216
Original FinalBudget Budget Actual2013-15 2013-15 2013-15 Variance with
Biennium Biennium Biennium Final Budget
Budgetary Fund Balance, July 1, as restated $ (77,534) $ (77,534) $ (77,534) $ -
ResourcesOther contracts and grants - - 250 250
Timber sales 12,794 12,150 11,084 (1,066) Charges for services - - - - Investment income (loss) 11 28 83 55 Miscellaneous revenue 12,306 9,400 9,201 (199) Transfers from other funds 41,079 55,831 9,104 (46,727) Total Resources (11,344) (125) $ (47,812) $ (47,687)
Charges To Appropriations General government 5,164 6,520 4,075 2,445 Education - - - - Capital outlays 2,248,483 2,379,964 1,598,184 781,780 Transfers to other funds 63,208 84,161 29,368 54,793 Transfers to other funds - - - - Total Charges To Appropriations 2,316,855 2,470,645 1,631,627 839,018
Excess Available For Appropriation Over (Under) Charges To Appropriations (2,328,199) (2,470,770) (1,679,439) 791,331
Reconciling ItemsBond sale proceeds 2,511,225 2,678,749 1,336,120 (1,342,629) Issuance premiums - 90,405 177,798 87,393 Noncash activity (net) - - 48 48 Nonappropriated fund balances - - - - Changes in reserves (net) - - - - Total Reconciling Items 2,511,225 2,769,154 1,513,966 (1,255,188)
Budgetary Fund Balance, June 30 $ 183,026 $ 298,384 $ (165,473) $ (463,857)
State Facilities
NONMAJOR CAPITAL PROJECTS FUNDSCombining Schedule of Revenues, Expenditures, andOther Financing Sources (Uses) - Budget and Actual
For the Biennium Ended June 30, 2015 (expressed in thousands)
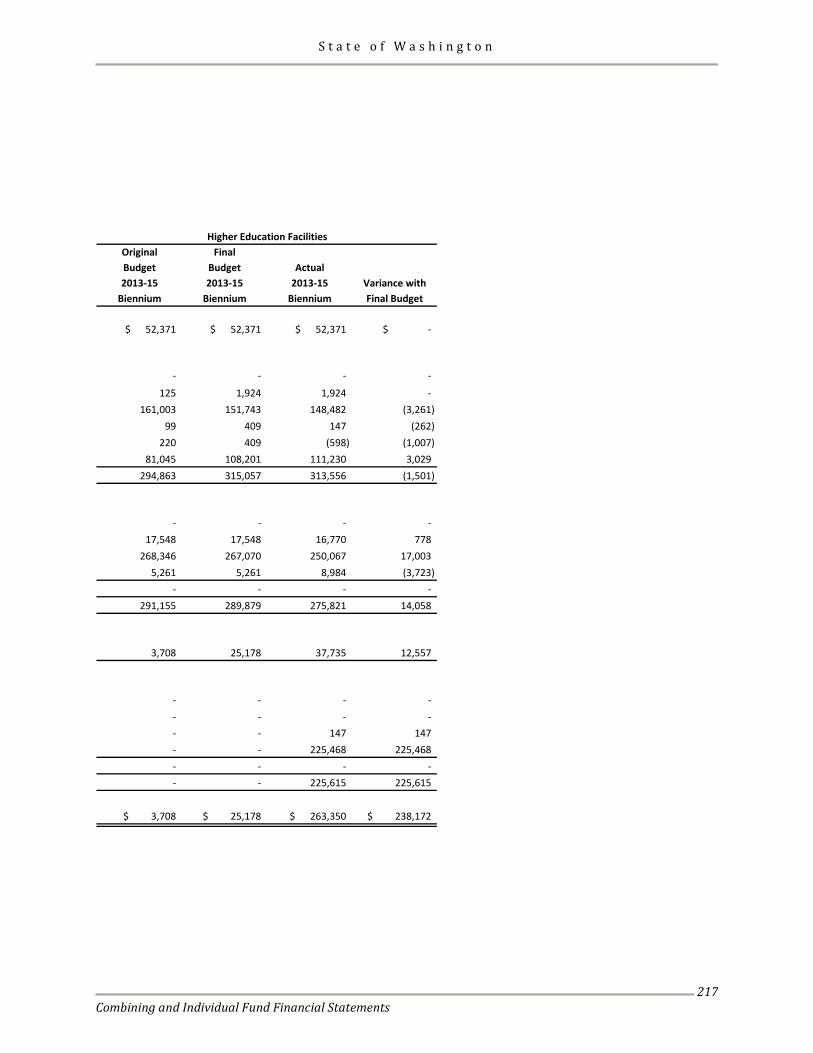
S t a t e o f W a s h i n g t o n
Combining and Individual Fund Financial Statements
217
Higher Education FacilitiesOriginal FinalBudget Budget Actual2013-15 2013-15 2013-15 Variance with
Biennium Biennium Biennium Final Budget
$ 52,371 $ 52,371 $ 52,371 $ -
- - - -
125 1,924 1,924 - 161,003 151,743 148,482 (3,261)
99 409 147 (262) 220 409 (598) (1,007)
81,045 108,201 111,230 3,029 294,863 315,057 313,556 (1,501)
- - - -
17,548 17,548 16,770 778 268,346 267,070 250,067 17,003
5,261 5,261 8,984 (3,723) - - - -
291,155 289,879 275,821 14,058
3,708 25,178 37,735 12,557
- - - - - - - - - - 147 147 - - 225,468 225,468 - - - - - - 225,615 225,615
$ 3,708 $ 25,178 $ 263,350 $ 238,172

S t a t e o f W a s h i n g t o n
Combining and Individual Fund Financial Statements
218
This page intentionally left blank.
S t a t e o f W a s h i n g t o n
Combining and Individual Fund Financial Statements
219
Nonmajor Enterprise Funds Enterprise Funds account for any activity for which a fee is charged to external users for goods or services. If an activity's principal revenue source meets any one of the following criteria, it is required to be reported as an enterprise fund: (1) an activity financed with debt that is secured solely by pledge of the net revenues from fees and charges for the activity; (2) laws or regulations which require that the activity's costs of providing services, including capital costs, be recovered with fees and charges, rather than with taxes or similar revenues; or (3) pricing policies which establish fees and charges designed to recover the activity’s costs, including capital costs. The Nonmajor Enterprise Funds are as follows:
Lottery Fund The Lottery Fund accounts for lottery ticket revenues, administrative and operating expenses of the Lottery Commission, and the distribution of revenue. Institutional Fund The Institutional Fund accounts for the enterprise activities carried out through vocational/education programs at state institutions. Other Activities The Other Activities Fund accounts for the operation of the pollution liability insurance program, the judicial information system, the local Certificate of Participation (COP) financing program, the local government audit program, and the Secretary of State’s corporate public records program.
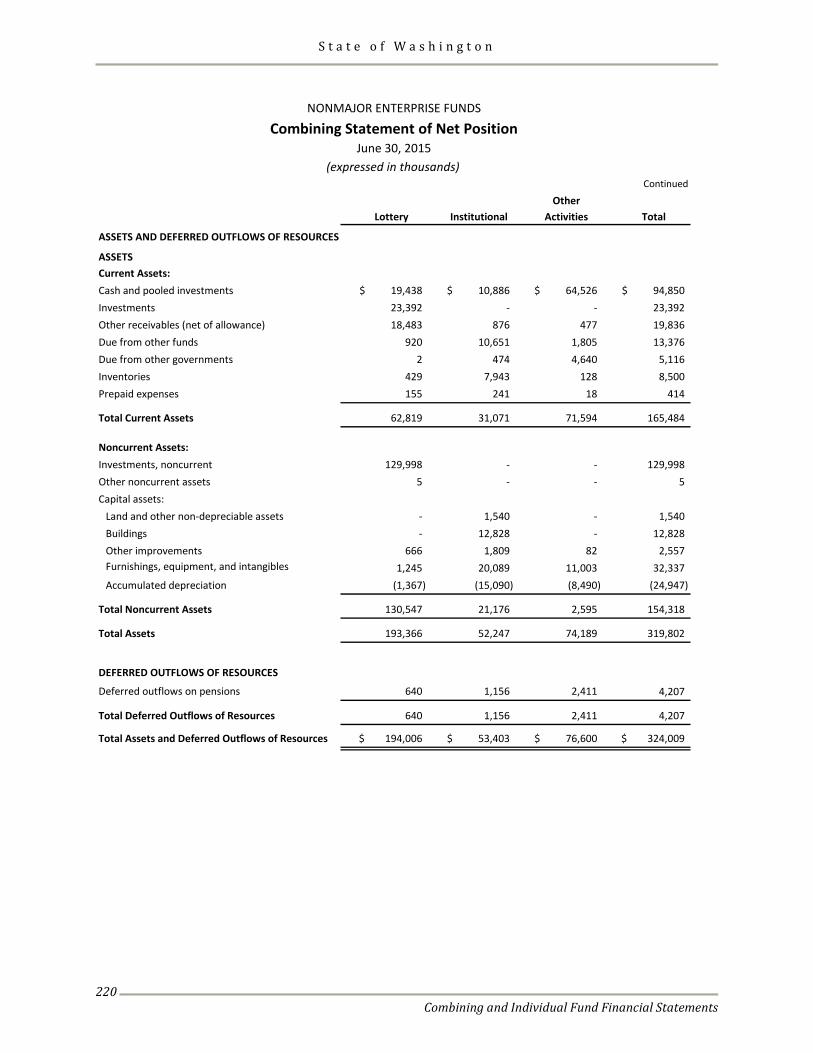
S t a t e o f W a s h i n g t o n
Combining and Individual Fund Financial Statements
220
Continued
OtherLottery Institutional Activities Total
ASSETS AND DEFERRED OUTFLOWS OF RESOURCES
ASSETSCurrent Assets:Cash and pooled investments 19,438$ 10,886$ 64,526$ 94,850$ Investments 23,392 - - 23,392 Other receivables (net of allowance) 18,483 876 477 19,836 Due from other funds 920 10,651 1,805 13,376 Due from other governments 2 474 4,640 5,116 Inventories 429 7,943 128 8,500 Prepaid expenses 155 241 18 414
Total Current Assets 62,819 31,071 71,594 165,484
Noncurrent Assets:Investments, noncurrent 129,998 - - 129,998 Other noncurrent assets 5 - - 5 Capital assets:
Land and other non-depreciable assets - 1,540 - 1,540 Buildings - 12,828 - 12,828 Other improvements 666 1,809 82 2,557 Furnishings, equipment, and intangibles 1,245 20,089 11,003 32,337 Accumulated depreciation (1,367) (15,090) (8,490) (24,947)
Total Noncurrent Assets 130,547 21,176 2,595 154,318
Total Assets 193,366 52,247 74,189 319,802
DEFERRED OUTFLOWS OF RESOURCES
Deferred outflows on pensions 640 1,156 2,411 4,207
Total Deferred Outflows of Resources 640 1,156 2,411 4,207
Total Assets and Deferred Outflows of Resources 194,006$ 53,403$ 76,600$ 324,009$
NONMAJOR ENTERPRISE FUNDS
Combining Statement of Net PositionJune 30, 2015
(expressed in thousands)
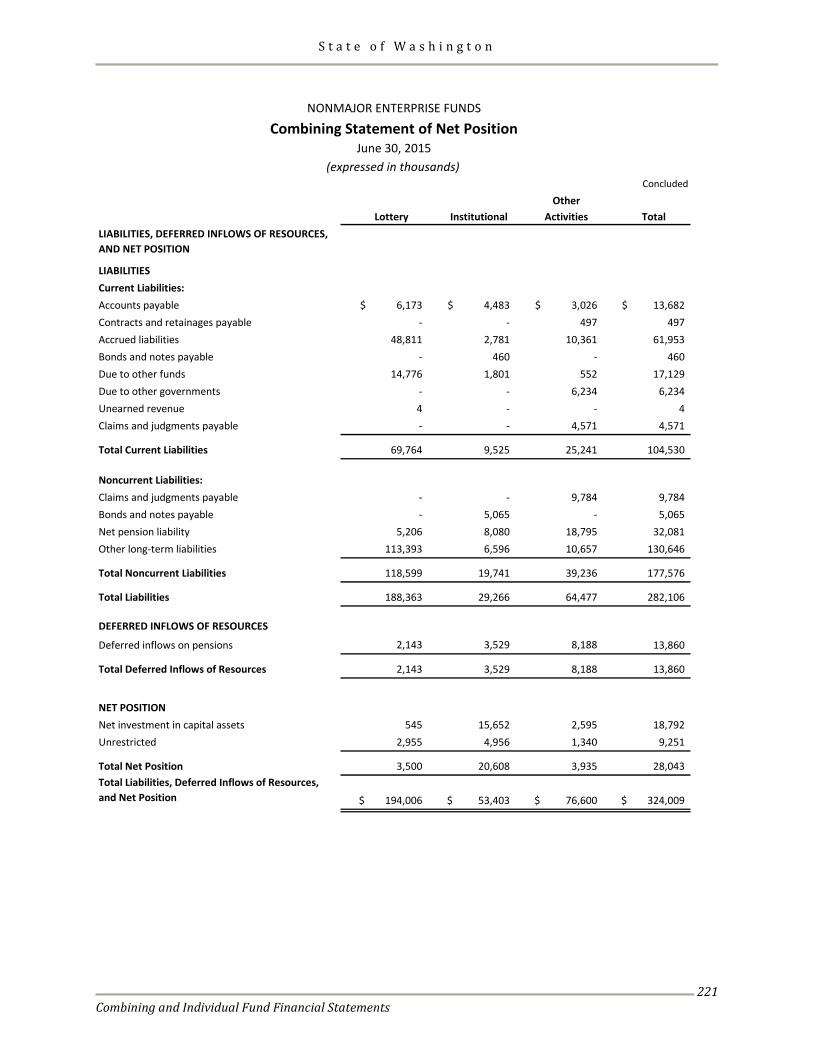
S t a t e o f W a s h i n g t o n
Combining and Individual Fund Financial Statements
221
Concluded
OtherLottery Institutional Activities Total
LIABILITIES, DEFERRED INFLOWS OF RESOURCES, AND NET POSITION
LIABILITIESCurrent Liabilities:Accounts payable 6,173$ 4,483$ 3,026$ 13,682$ Contracts and retainages payable - - 497 497 Accrued liabilities 48,811 2,781 10,361 61,953 Bonds and notes payable - 460 - 460 Due to other funds 14,776 1,801 552 17,129 Due to other governments - - 6,234 6,234 Unearned revenue 4 - - 4 Claims and judgments payable - - 4,571 4,571
Total Current Liabilities 69,764 9,525 25,241 104,530
Noncurrent Liabilities:Claims and judgments payable - - 9,784 9,784 Bonds and notes payable - 5,065 - 5,065 Net pension liability 5,206 8,080 18,795 32,081 Other long-term liabilities 113,393 6,596 10,657 130,646
Total Noncurrent Liabilities 118,599 19,741 39,236 177,576
Total Liabilities 188,363 29,266 64,477 282,106
DEFERRED INFLOWS OF RESOURCES
Deferred inflows on pensions 2,143 3,529 8,188 13,860
Total Deferred Inflows of Resources 2,143 3,529 8,188 13,860
NET POSITIONNet investment in capital assets 545 15,652 2,595 18,792 Unrestricted 2,955 4,956 1,340 9,251
Total Net Position 3,500 20,608 3,935 28,043 Total Liabilities, Deferred Inflows of Resources, and Net Position 194,006$ 53,403$ 76,600$ 324,009$
June 30, 2015(expressed in thousands)
NONMAJOR ENTERPRISE FUNDS
Combining Statement of Net Position
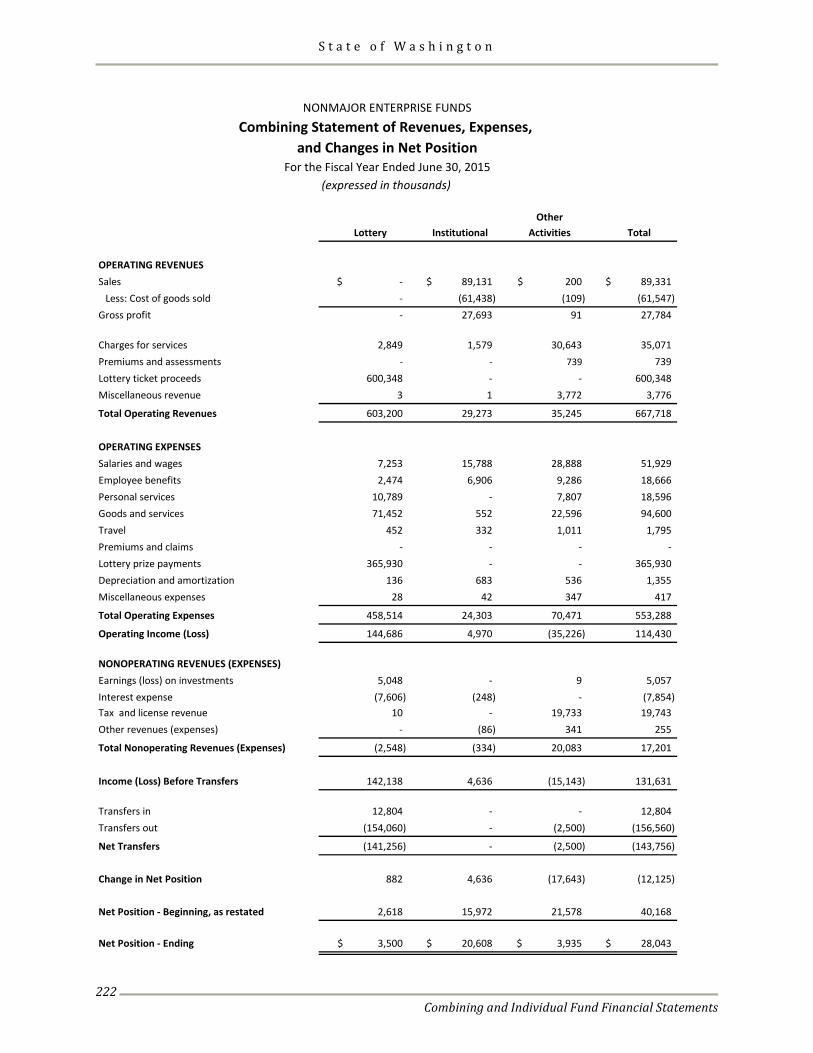
S t a t e o f W a s h i n g t o n
Combining and Individual Fund Financial Statements
222
OtherLottery Institutional Activities Total
OPERATING REVENUESSales -$ 89,131$ 200$ 89,331$
Less: Cost of goods sold - (61,438) (109) (61,547) Gross profit - 27,693 91 27,784
Charges for services 2,849 1,579 30,643 35,071 Premiums and assessments - - 739 739 Lottery ticket proceeds 600,348 - - 600,348 Miscellaneous revenue 3 1 3,772 3,776
Total Operating Revenues 603,200 29,273 35,245 667,718
OPERATING EXPENSESSalaries and wages 7,253 15,788 28,888 51,929 Employee benefits 2,474 6,906 9,286 18,666 Personal services 10,789 - 7,807 18,596 Goods and services 71,452 552 22,596 94,600 Travel 452 332 1,011 1,795 Premiums and claims - - - - Lottery prize payments 365,930 - - 365,930 Depreciation and amortization 136 683 536 1,355 Miscellaneous expenses 28 42 347 417
Total Operating Expenses 458,514 24,303 70,471 553,288
Operating Income (Loss) 144,686 4,970 (35,226) 114,430
NONOPERATING REVENUES (EXPENSES)Earnings (loss) on investments 5,048 - 9 5,057 Interest expense (7,606) (248) - (7,854) Tax and license revenue 10 - 19,733 19,743 Other revenues (expenses) - (86) 341 255
Total Nonoperating Revenues (Expenses) (2,548) (334) 20,083 17,201
Income (Loss) Before Transfers 142,138 4,636 (15,143) 131,631
Transfers in 12,804 - - 12,804 Transfers out (154,060) - (2,500) (156,560)
Net Transfers (141,256) - (2,500) (143,756)
Change in Net Position 882 4,636 (17,643) (12,125)
Net Position - Beginning, as restated 2,618 15,972 21,578 40,168
Net Position - Ending 3,500$ 20,608$ 3,935$ 28,043$
NONMAJOR ENTERPRISE FUNDSCombining Statement of Revenues, Expenses,
and Changes in Net PositionFor the Fiscal Year Ended June 30, 2015
(expressed in thousands)
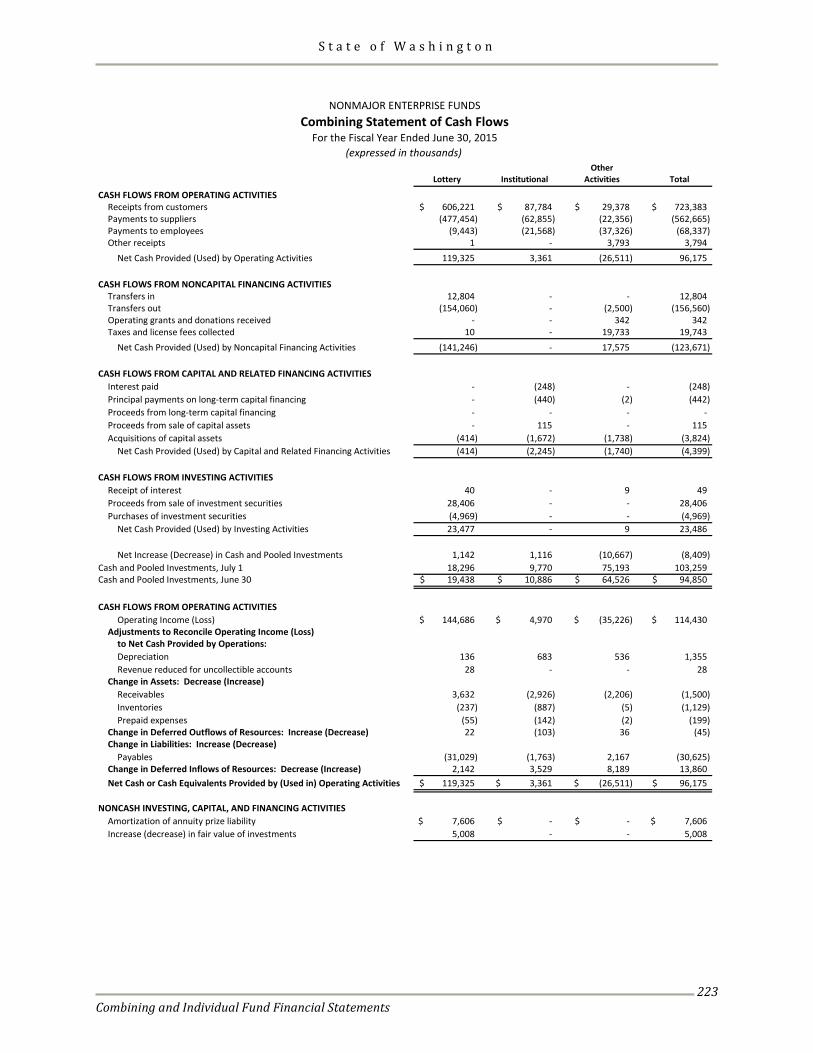
S t a t e o f W a s h i n g t o n
Combining and Individual Fund Financial Statements
223
OtherLottery Institutional Activities Total
CASH FLOWS FROM OPERATING ACTIVITIESReceipts from customers 606,221$ 87,784$ 29,378$ 723,383$ Payments to suppliers (477,454) (62,855) (22,356) (562,665) Payments to employees (9,443) (21,568) (37,326) (68,337) Other receipts 1 - 3,793 3,794
Net Cash Provided (Used) by Operating Activities 119,325 3,361 (26,511) 96,175
CASH FLOWS FROM NONCAPITAL FINANCING ACTIVITIESTransfers in 12,804 - - 12,804 Transfers out (154,060) - (2,500) (156,560) Operating grants and donations received - - 342 342 Taxes and license fees collected 10 - 19,733 19,743
Net Cash Provided (Used) by Noncapital Financing Activities (141,246) - 17,575 (123,671)
CASH FLOWS FROM CAPITAL AND RELATED FINANCING ACTIVITIESInterest paid - (248) - (248) Principal payments on long-term capital financing - (440) (2) (442) Proceeds from long-term capital financing - - - - Proceeds from sale of capital assets - 115 - 115 Acquisitions of capital assets (414) (1,672) (1,738) (3,824)
Net Cash Provided (Used) by Capital and Related Financing Activities (414) (2,245) (1,740) (4,399)
CASH FLOWS FROM INVESTING ACTIVITIESReceipt of interest 40 - 9 49 Proceeds from sale of investment securities 28,406 - - 28,406 Purchases of investment securities (4,969) - - (4,969)
Net Cash Provided (Used) by Investing Activities 23,477 - 9 23,486
Net Increase (Decrease) in Cash and Pooled Investments 1,142 1,116 (10,667) (8,409) Cash and Pooled Investments, July 1 18,296 9,770 75,193 103,259 Cash and Pooled Investments, June 30 19,438$ 10,886$ 64,526$ 94,850$
CASH FLOWS FROM OPERATING ACTIVITIESOperating Income (Loss) 144,686$ 4,970$ (35,226)$ 114,430$
Adjustments to Reconcile Operating Income (Loss)to Net Cash Provided by Operations:Depreciation 136 683 536 1,355 Revenue reduced for uncollectible accounts 28 - - 28
Change in Assets: Decrease (Increase)Receivables 3,632 (2,926) (2,206) (1,500) Inventories (237) (887) (5) (1,129) Prepaid expenses (55) (142) (2) (199)
Change in Deferred Outflows of Resources: Increase (Decrease) 22 (103) 36 (45) Change in Liabilities: Increase (Decrease)
Payables (31,029) (1,763) 2,167 (30,625) Change in Deferred Inflows of Resources: Decrease (Increase) 2,142 3,529 8,189 13,860 Net Cash or Cash Equivalents Provided by (Used in) Operating Activities 119,325$ 3,361$ (26,511)$ 96,175$
NONCASH INVESTING, CAPITAL, AND FINANCING ACTIVITIESAmortization of annuity prize liability 7,606$ -$ -$ 7,606$ Increase (decrease) in fair value of investments 5,008 - - 5,008
NONMAJOR ENTERPRISE FUNDSCombining Statement of Cash Flows
For the Fiscal Year Ended June 30, 2015(expressed in thousands)

S t a t e o f W a s h i n g t o n
Combining and Individual Fund Financial Statements
224
This page intentionally left blank.
S t a t e o f W a s h i n g t o n
Combining and Individual Fund Financial Statements
225
Internal Service Funds Internal Service Funds account for state activities that provide goods and services to other state departments or agencies on a cost-reimbursement basis. The Internal Service Funds are described below: General Services Fund The General Services Fund accounts for the cost of providing the following services to state agencies: (1) legal services; (2) state Certificate of Participation (COP) financing program; (3) facilities, equipment and related services; (4) printing; (5) audits of state agencies; (6) administration of the state civil service law and labor relations; (7) administrative hearings; and (8) archives and records management. Data Processing Revolving Fund The Data Processing Revolving Fund accounts for the distribution of the full cost of data processing and data communication services to other state agencies, and for the payment of other costs
incidental to the acquisition, operation, and administration of acquired data processing services, supplies, and equipment. Higher Education Revolving Fund The Higher Education Revolving Fund accounts for stores, data processing, and other support service activities at colleges and universities. Risk Management Fund The Risk Management Fund administers tort and sundry claims filed against Washington state agencies, except for the University of Washington and the Washington State Department of Transportation Ferries Division. Health Insurance Fund The Health Insurance Fund accounts for premiums collected and payments for employees’ insurance benefits.
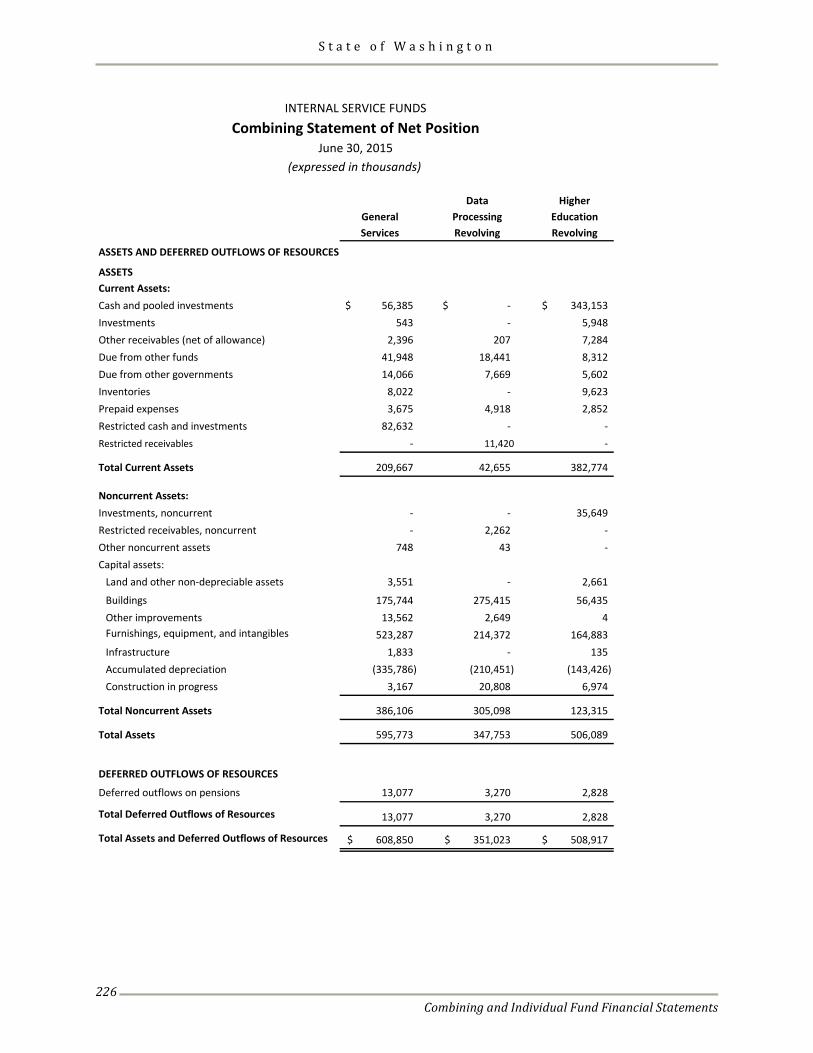
S t a t e o f W a s h i n g t o n
Combining and Individual Fund Financial Statements
226
Data HigherGeneral Processing EducationServices Revolving Revolving
ASSETS AND DEFERRED OUTFLOWS OF RESOURCES
ASSETSCurrent Assets:Cash and pooled investments 56,385$ -$ 343,153$ Investments 543 - 5,948 Other receivables (net of allowance) 2,396 207 7,284 Due from other funds 41,948 18,441 8,312 Due from other governments 14,066 7,669 5,602 Inventories 8,022 - 9,623 Prepaid expenses 3,675 4,918 2,852 Restricted cash and investments 82,632 - - Restricted receivables - 11,420 -
Total Current Assets 209,667 42,655 382,774
Noncurrent Assets:Investments, noncurrent - - 35,649 Restricted receivables, noncurrent - 2,262 - Other noncurrent assets 748 43 - Capital assets:
Land and other non-depreciable assets 3,551 - 2,661
Buildings 175,744 275,415 56,435 Other improvements 13,562 2,649 4 Furnishings, equipment, and intangibles 523,287 214,372 164,883 Infrastructure 1,833 - 135 Accumulated depreciation (335,786) (210,451) (143,426) Construction in progress 3,167 20,808 6,974
Total Noncurrent Assets 386,106 305,098 123,315
Total Assets 595,773 347,753 506,089
DEFERRED OUTFLOWS OF RESOURCES
Deferred outflows on pensions 13,077 3,270 2,828
Total Deferred Outflows of Resources 13,077 3,270 2,828
Total Assets and Deferred Outflows of Resources 608,850$ 351,023$ 508,917$
INTERNAL SERVICE FUNDSCombining Statement of Net Position
June 30, 2015(expressed in thousands)
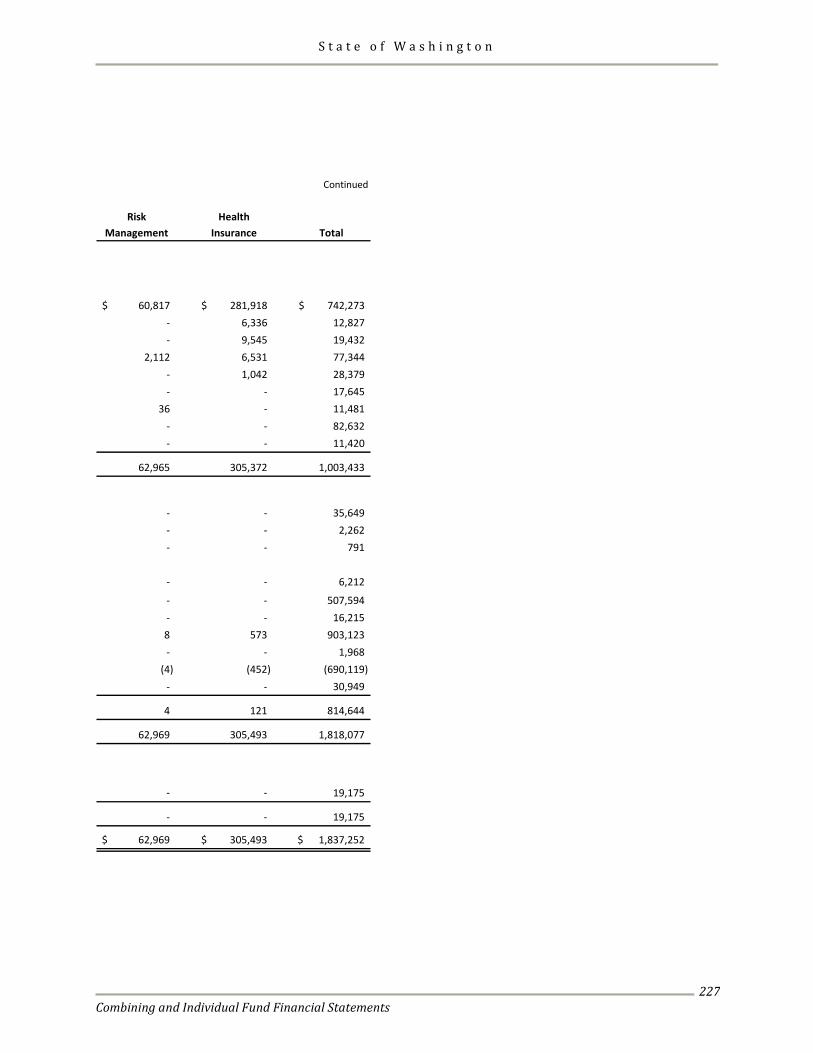
S t a t e o f W a s h i n g t o n
Combining and Individual Fund Financial Statements
227
Continued
Risk HealthManagement Insurance Total
60,817$ 281,918$ 742,273$ - 6,336 12,827 - 9,545 19,432
2,112 6,531 77,344 - 1,042 28,379 - - 17,645
36 - 11,481 - - 82,632 - - 11,420
62,965 305,372 1,003,433
- - 35,649 - - 2,262 - - 791
- - 6,212
- - 507,594 - - 16,215 8 573 903,123 - - 1,968
(4) (452) (690,119) - - 30,949
4 121 814,644
62,969 305,493 1,818,077
- - 19,175
- - 19,175
62,969$ 305,493$ 1,837,252$
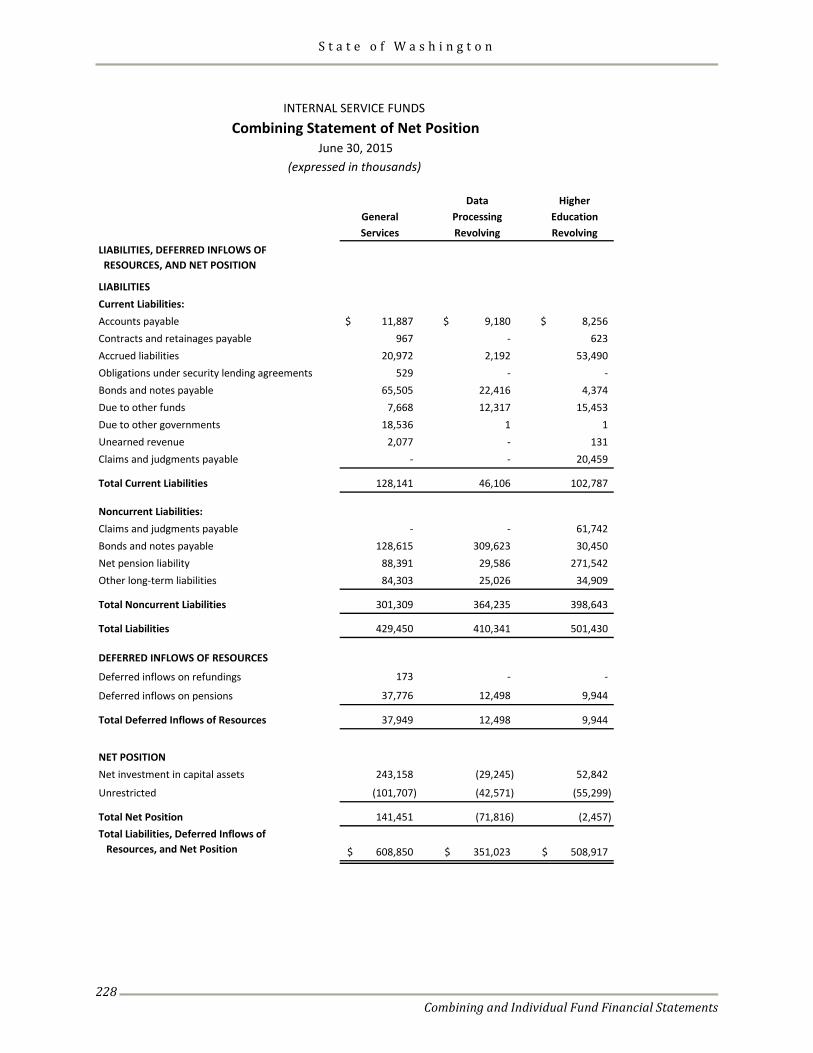
S t a t e o f W a s h i n g t o n
Combining and Individual Fund Financial Statements
228
Data HigherGeneral Processing EducationServices Revolving Revolving
LIABILITIES, DEFERRED INFLOWS OF RESOURCES, AND NET POSITION
LIABILITIESCurrent Liabilities:Accounts payable 11,887$ 9,180$ 8,256$ Contracts and retainages payable 967 - 623 Accrued liabilities 20,972 2,192 53,490 Obligations under security lending agreements 529 - - Bonds and notes payable 65,505 22,416 4,374 Due to other funds 7,668 12,317 15,453 Due to other governments 18,536 1 1 Unearned revenue 2,077 - 131 Claims and judgments payable - - 20,459
Total Current Liabilities 128,141 46,106 102,787
Noncurrent Liabilities:Claims and judgments payable - - 61,742 Bonds and notes payable 128,615 309,623 30,450 Net pension liability 88,391 29,586 271,542 Other long-term liabilities 84,303 25,026 34,909
Total Noncurrent Liabilities 301,309 364,235 398,643
Total Liabilities 429,450 410,341 501,430
DEFERRED INFLOWS OF RESOURCES
Deferred inflows on refundings 173 - -
Deferred inflows on pensions 37,776 12,498 9,944
Total Deferred Inflows of Resources 37,949 12,498 9,944
NET POSITIONNet investment in capital assets 243,158 (29,245) 52,842
Unrestricted (101,707) (42,571) (55,299)
Total Net Position 141,451 (71,816) (2,457) Total Liabilities, Deferred Inflows of Resources, and Net Position 608,850$ 351,023$ 508,917$
Combining Statement of Net PositionJune 30, 2015
(expressed in thousands)
INTERNAL SERVICE FUNDS
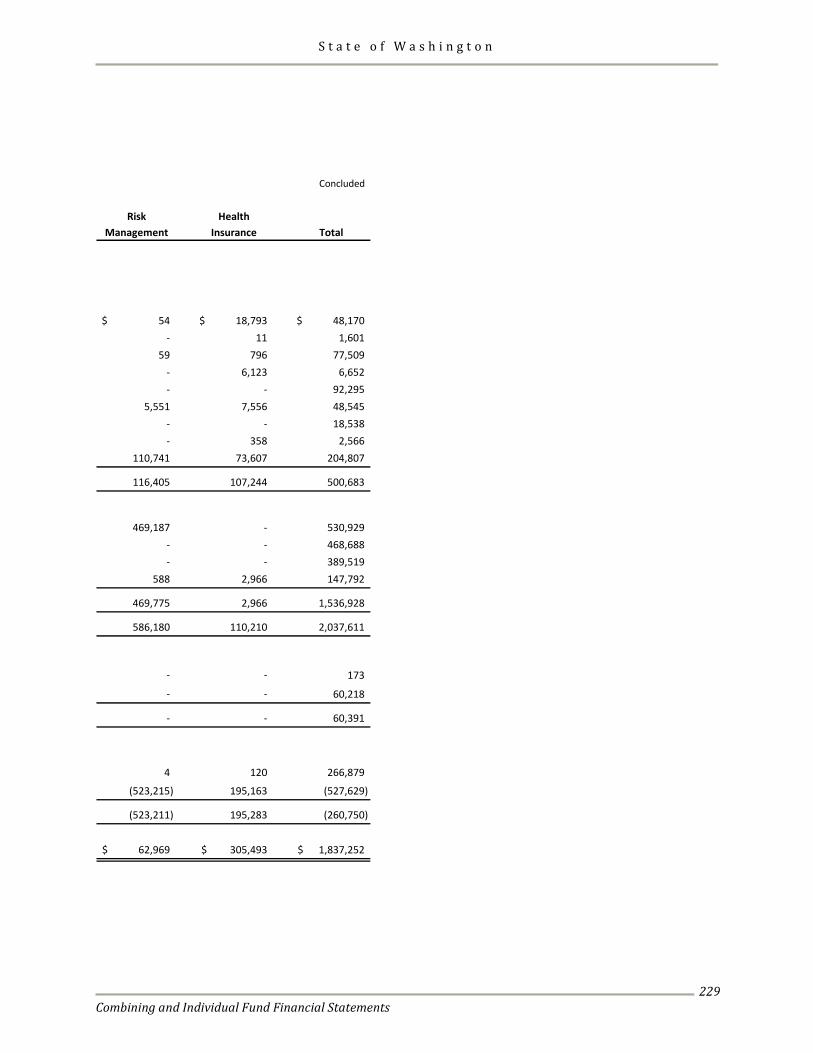
S t a t e o f W a s h i n g t o n
Combining and Individual Fund Financial Statements
229
Concluded
Risk HealthManagement Insurance Total
54$ 18,793$ 48,170$ - 11 1,601
59 796 77,509 - 6,123 6,652 - - 92,295
5,551 7,556 48,545 - - 18,538 - 358 2,566
110,741 73,607 204,807
116,405 107,244 500,683
469,187 - 530,929 - - 468,688 - - 389,519
588 2,966 147,792
469,775 2,966 1,536,928
586,180 110,210 2,037,611
- - 173
- - 60,218
- - 60,391
4 120 266,879
(523,215) 195,163 (527,629)
(523,211) 195,283 (260,750)
62,969$ 305,493$ 1,837,252$
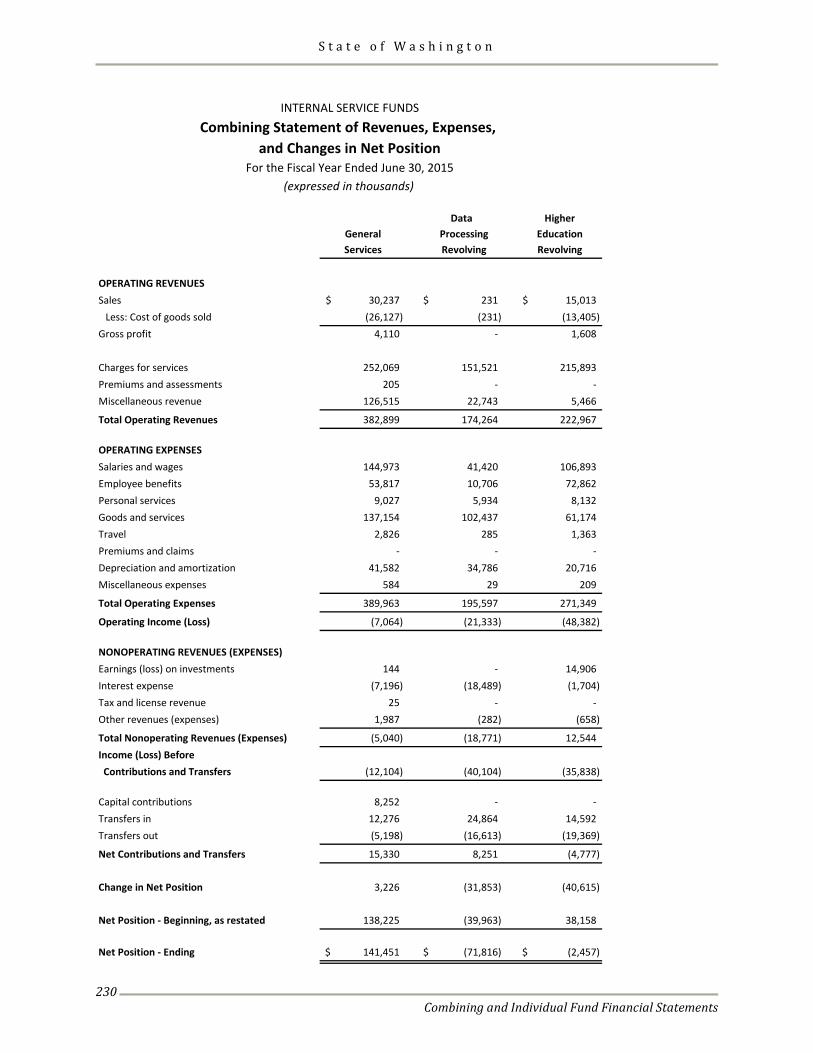
S t a t e o f W a s h i n g t o n
Combining and Individual Fund Financial Statements
230
HigherGeneral EducationServices Revolving
OPERATING REVENUESSales 30,237$ 231$ 15,013$
Less: Cost of goods sold (26,127) (231) (13,405) Gross profit 4,110 - 1,608
Charges for services 252,069 151,521 215,893 Premiums and assessments 205 - - Miscellaneous revenue 126,515 22,743 5,466
Total Operating Revenues 382,899 174,264 222,967
OPERATING EXPENSESSalaries and wages 144,973 41,420 106,893 Employee benefits 53,817 10,706 72,862 Personal services 9,027 5,934 8,132 Goods and services 137,154 102,437 61,174 Travel 2,826 285 1,363 Premiums and claims - - - Depreciation and amortization 41,582 34,786 20,716 Miscellaneous expenses 584 29 209
Total Operating Expenses 389,963 195,597 271,349
Operating Income (Loss) (7,064) (21,333) (48,382)
NONOPERATING REVENUES (EXPENSES)Earnings (loss) on investments 144 - 14,906 Interest expense (7,196) (18,489) (1,704) Tax and license revenue 25 - - Other revenues (expenses) 1,987 (282) (658)
Total Nonoperating Revenues (Expenses) (5,040) (18,771) 12,544 Income (Loss) Before Contributions and Transfers (12,104) (40,104) (35,838)
Capital contributions 8,252 - - Transfers in 12,276 24,864 14,592 Transfers out (5,198) (16,613) (19,369)
Net Contributions and Transfers 15,330 8,251 (4,777)
Change in Net Position 3,226 (31,853) (40,615)
Net Position - Beginning, as restated 138,225 (39,963) 38,158
Net Position - Ending 141,451$ (71,816)$ (2,457)$
Data Processing Revolving
(expressed in thousands)
INTERNAL SERVICE FUNDSCombining Statement of Revenues, Expenses,
and Changes in Net PositionFor the Fiscal Year Ended June 30, 2015
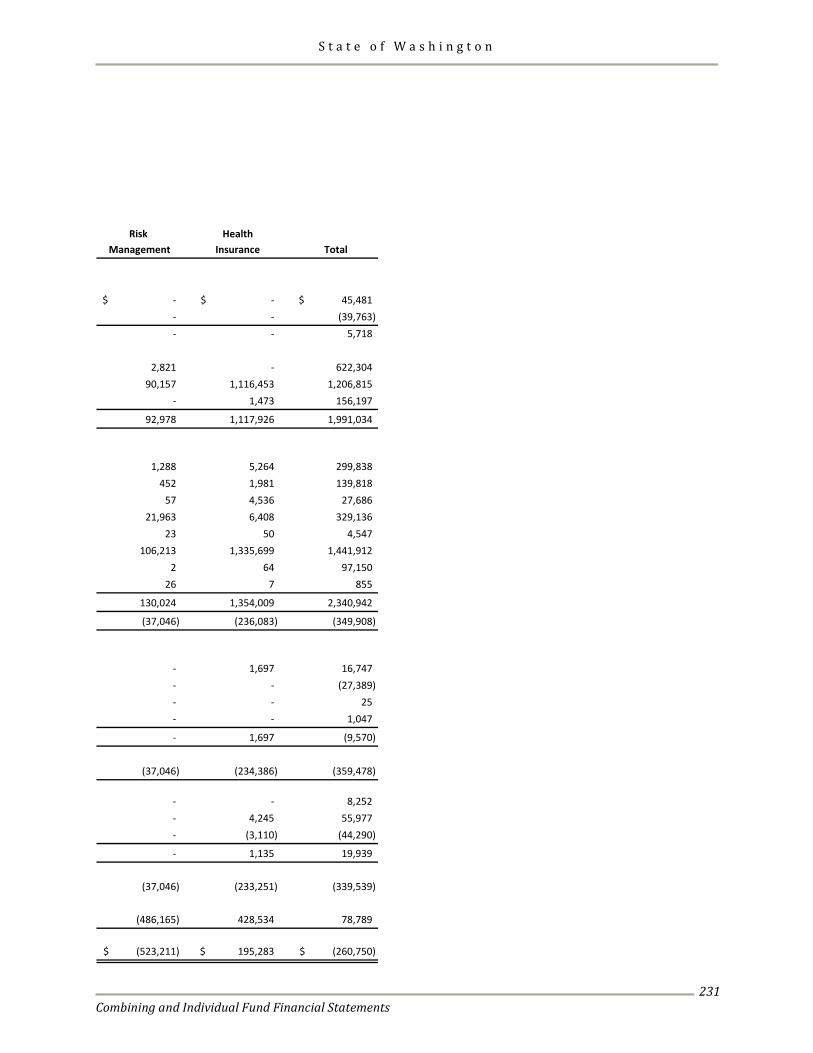
S t a t e o f W a s h i n g t o n
Combining and Individual Fund Financial Statements
231
Risk HealthManagement Insurance Total
-$ -$ 45,481$ - - (39,763) - - 5,718
2,821 - 622,304 90,157 1,116,453 1,206,815
- 1,473 156,197
92,978 1,117,926 1,991,034
1,288 5,264 299,838 452 1,981 139,818
57 4,536 27,686 21,963 6,408 329,136
23 50 4,547 106,213 1,335,699 1,441,912
2 64 97,150 26 7 855
130,024 1,354,009 2,340,942
(37,046) (236,083) (349,908)
- 1,697 16,747 - - (27,389) - - 25 - - 1,047
- 1,697 (9,570)
(37,046) (234,386) (359,478)
- - 8,252 - 4,245 55,977 - (3,110) (44,290)
- 1,135 19,939
(37,046) (233,251) (339,539)
(486,165) 428,534 78,789
(523,211)$ 195,283$ (260,750)$
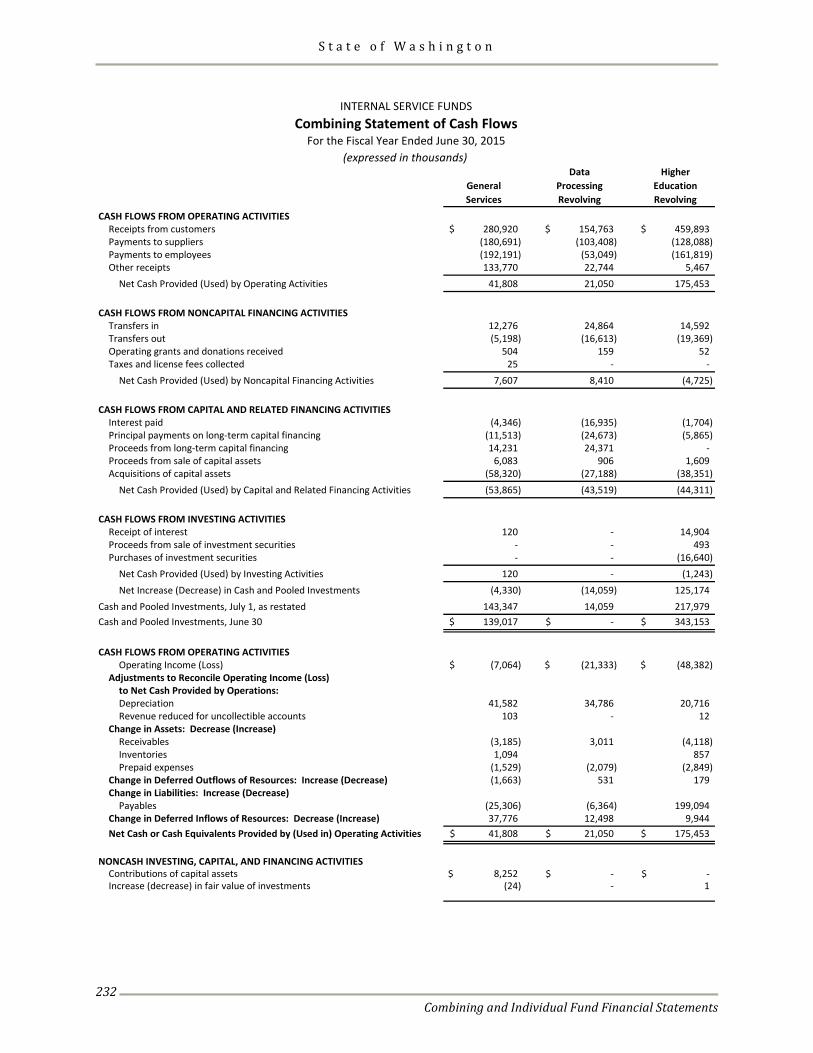
S t a t e o f W a s h i n g t o n
Combining and Individual Fund Financial Statements
232
Data HigherGeneral Processing EducationServices Revolving Revolving
CASH FLOWS FROM OPERATING ACTIVITIESReceipts from customers 280,920$ 154,763$ 459,893$ Payments to suppliers (180,691) (103,408) (128,088) Payments to employees (192,191) (53,049) (161,819) Other receipts 133,770 22,744 5,467
Net Cash Provided (Used) by Operating Activities 41,808 21,050 175,453
CASH FLOWS FROM NONCAPITAL FINANCING ACTIVITIESTransfers in 12,276 24,864 14,592 Transfers out (5,198) (16,613) (19,369) Operating grants and donations received 504 159 52 Taxes and license fees collected 25 - -
Net Cash Provided (Used) by Noncapital Financing Activities 7,607 8,410 (4,725)
CASH FLOWS FROM CAPITAL AND RELATED FINANCING ACTIVITIESInterest paid (4,346) (16,935) (1,704) Principal payments on long-term capital financing (11,513) (24,673) (5,865) Proceeds from long-term capital financing 14,231 24,371 - Proceeds from sale of capital assets 6,083 906 1,609 Acquisitions of capital assets (58,320) (27,188) (38,351)
Net Cash Provided (Used) by Capital and Related Financing Activities (53,865) (43,519) (44,311)
CASH FLOWS FROM INVESTING ACTIVITIESReceipt of interest 120 - 14,904 Proceeds from sale of investment securities - - 493 Purchases of investment securities - - (16,640)
Net Cash Provided (Used) by Investing Activities 120 - (1,243) Net Increase (Decrease) in Cash and Pooled Investments (4,330) (14,059) 125,174
Cash and Pooled Investments, July 1, as restated 143,347 14,059 217,979 Cash and Pooled Investments, June 30 139,017$ -$ 343,153$
CASH FLOWS FROM OPERATING ACTIVITIESOperating Income (Loss) (7,064)$ (21,333)$ (48,382)$
Adjustments to Reconcile Operating Income (Loss)to Net Cash Provided by Operations:Depreciation 41,582 34,786 20,716 Revenue reduced for uncollectible accounts 103 - 12
Change in Assets: Decrease (Increase)Receivables (3,185) 3,011 (4,118) Inventories 1,094 857 Prepaid expenses (1,529) (2,079) (2,849)
Change in Deferred Outflows of Resources: Increase (Decrease) (1,663) 531 179 Change in Liabilities: Increase (Decrease)
Payables (25,306) (6,364) 199,094 Change in Deferred Inflows of Resources: Decrease (Increase) 37,776 12,498 9,944 Net Cash or Cash Equivalents Provided by (Used in) Operating Activities 41,808$ 21,050$ 175,453$
NONCASH INVESTING, CAPITAL, AND FINANCING ACTIVITIESContributions of capital assets 8,252$ -$ -$ Increase (decrease) in fair value of investments (24) - 1
Combining Statement of Cash FlowsFor the Fiscal Year Ended June 30, 2015
(expressed in thousands)
INTERNAL SERVICE FUNDS
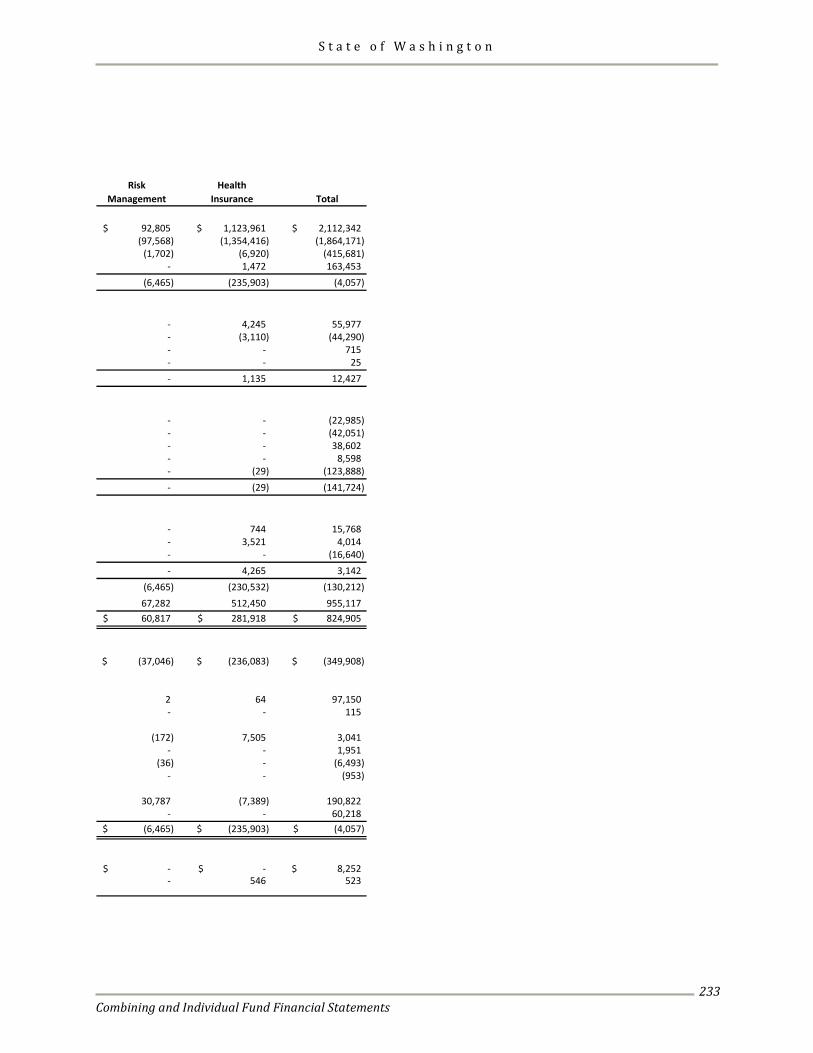
S t a t e o f W a s h i n g t o n
Combining and Individual Fund Financial Statements
233
Risk HealthManagement Insurance Total
92,805$ 1,123,961$ 2,112,342$ (97,568) (1,354,416) (1,864,171)
(1,702) (6,920) (415,681) - 1,472 163,453
(6,465) (235,903) (4,057)
- 4,245 55,977 - (3,110) (44,290) - - 715 - - 25 - 1,135 12,427
- - (22,985) - - (42,051) - - 38,602 - - 8,598 - (29) (123,888) - (29) (141,724)
- 744 15,768 - 3,521 4,014 - - (16,640) - 4,265 3,142
(6,465) (230,532) (130,212) 67,282 512,450 955,117 60,817$ 281,918$ 824,905$
(37,046)$ (236,083)$ (349,908)$
2 64 97,150 - - 115
(172) 7,505 3,041 - - 1,951
(36) - (6,493) - - (953)
30,787 (7,389) 190,822 - - 60,218
(6,465)$ (235,903)$ (4,057)$
-$ -$ 8,252$ - 546 523

S t a t e o f W a s h i n g t o n
Combining and Individual Fund Financial Statements
234
This page intentionally left blank.
S t a t e o f W a s h i n g t o n
Combining and Individual Fund Financial Statements
235
Fiduciary Funds Fiduciary Funds account for assets held in a trustee or agent capacity for outside parties, including individuals, private organizations, and other governments. PENSION FUNDS Pension Trust Funds account for transactions, assets, liabilities, and plan net assets available for plan benefits of the various state public employee retirement systems. Refer to Note 11, Retirement Plans, for a description of the individual pension plans. Public Employees’ Retirement System Plan 1 Fund The Public Employees’ Retirement System Plan 1 Fund provides benefits for state and local government employees who are members of this closed cost-sharing, multiple-employer defined benefit pension plan. Public Employees’ Retirement System Plan 2/3 Fund The Public Employees’ Retirement System Plan 2/3 Fund provides the defined benefit portion of benefits for state and local government employees who are members of Plan 2, a cost-sharing, multiple-employer defined benefit pension plan, and Plan 3, a combination defined benefit/defined contribution plan. Public Employees’ Retirement System Plan 3 Fund The Public Employees’ Retirement System Plan 3 fund provides the defined contribution portion of benefits for state and local government employees who are members of this combination defined benefit/defined contribution plan.
Teachers’ Retirement System Plan 1 Fund The Teachers’ Retirement System Plan 1 Fund provides benefits for certificated public school instructors, administrators, or supervisors who are members of this closed cost-sharing, multiple-employer defined benefit pension plan. Teachers’ Retirement System Plan 2/3 Fund The Teachers’ Retirement System Plan 2/3 Fund provides the defined benefit portion of benefits for certificated public school instructors, administrators, or supervisors who are members of Plan 2, a cost-sharing, multiple-employer defined benefit pension plan, and Plan 3, a combination defined benefit/defined contribution plan. Teachers’ Retirement System Plan 3 Fund The Teachers’ Retirement System Plan 3 fund provides the defined contribution portion of benefits for certificated public school instructors, administrators, or supervisors who are members of this combination defined benefit/defined contribution plan. School Employees' Retirement System Plan 2/3 Fund The School Employees' Retirement System Plan 2/3 Fund provides the defined benefit portion of benefits for classified employees of public school districts and educational service districts who are members of Plan 2, a cost-sharing, multiple-employer defined benefit pension plan, or Plan 3, a combination defined benefit/defined contribution plan.
S t a t e o f W a s h i n g t o n
Combining and Individual Fund Financial Statements
236
School Employees' Retirement System Plan 3 Fund The School Employees' Retirement System Plan 3 Fund provides the defined contribution portion of benefits for classified employees of public school districts and educational service districts who are members of this combination defined benefit/defined contribution plan. Law Enforcement Officers’ and Fire Fighters’ Retirement System Plan 1 Fund The Law Enforcement Officers’ and Fire Fighters’ Retirement System Plan 1 Fund provides benefits for full-time, fully compensated local law enforcement officers and firefighters who are members of this closed cost-sharing, defined benefit pension plan. Law Enforcement Officers’ and Fire Fighters’ Retirement System Plan 2 Fund The Law Enforcement Officers’ and Fire Fighters’ Retirement System Plan 2 Fund provides benefits for full-time, fully compensated local law enforcement officers and firefighters who are members of this cost-sharing, defined benefit pension plan. Washington State Patrol Retirement System Plan 1/2 Fund The Washington State Patrol Retirement System Plan 1/2 Fund provides benefits for commissioned officers of the Washington State Patrol who are members of this single-employer, defined benefit pension plan. Judicial Retirement System Fund The Judicial Retirement System Fund provides benefits for judges of the state Supreme Court, Court of Appeals, and Superior Courts who are members of this closed single-employer, defined-benefit pension plan. Judicial Retirement Account Fund The Judicial Retirement Account Fund provides benefits for judges of the state Supreme Court, Court of Appeals, and Superior Courts who are members of this defined contribution pension plan.
Judges' Retirement Fund The Judges' Retirement Fund provides benefits for judges of the state Supreme Court, Court of Appeals, and Superior Courts who are members of this closed single-employer, defined-benefit pension plan. Volunteer Fire Fighters’ Retirement System Fund The Volunteer Fire Fighters’ Retirement System Fund provides benefits to volunteer fire fighters of electing municipalities of the state who are members of this cost-sharing, multiple-employer defined benefit pension plan. AGENCY FUNDS Agency Funds account for resources held by the state in a custodial capacity for other governments, private organizations, or individuals. The Agency Funds are described below: Local Government Distributions Fund The Local Government Distributions Fund accounts for the receipt and allocation of taxes and fees imposed by local governments. Pooled Investments Fund The Pooled Investments Fund is used to administer the pooling and investing of surplus state funds, and the accumulation and allocation of interest earned among the various accounts and funds from which such investments and investment deposits were made. These balances are distributed to the owner funds at June 30. Retiree Health Insurance Fund The Retiree Health Insurance Fund accounts for premiums collected and payments for retiree insurance benefits. Other Agency Fund The Other Agency Fund accounts for (1) assets held for employees, foster children, inmates, patients, and residents of state institutions; (2) the local government share of contracted timber sales; and (3) monies held under other custodial responsibilities of the state.
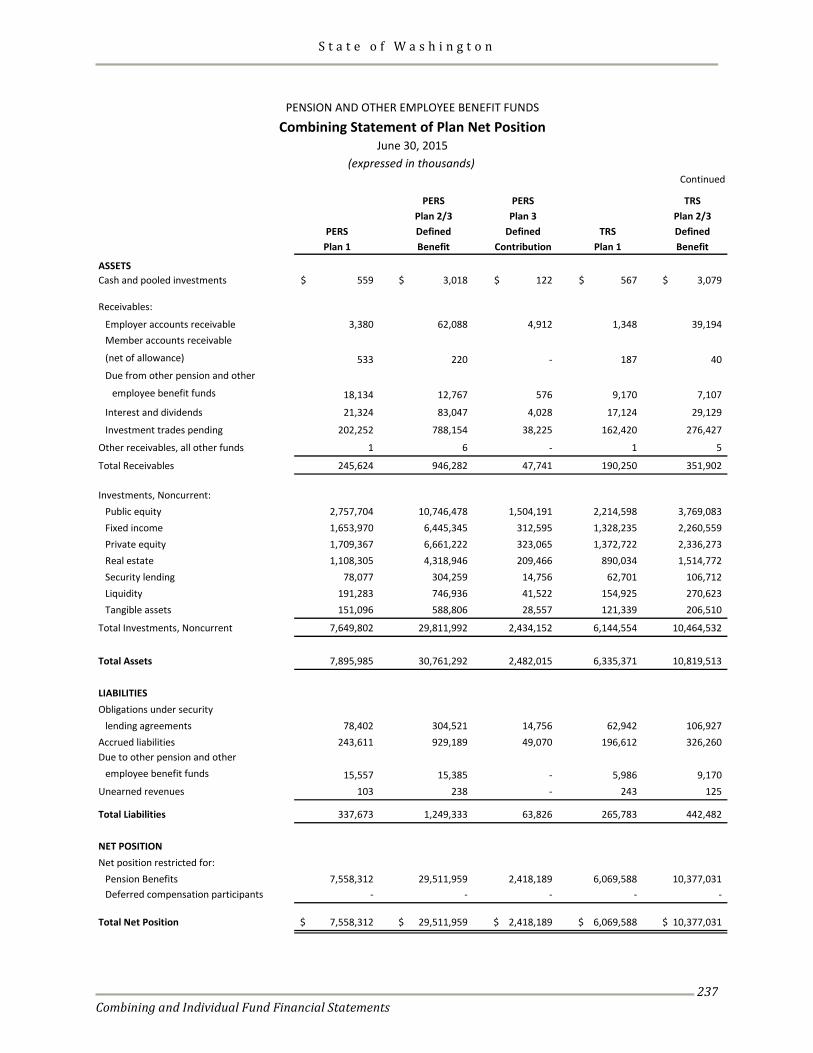
S t a t e o f W a s h i n g t o n
Combining and Individual Fund Financial Statements
237
Continued
PERS PERS TRSPlan 2/3 Plan 3 Plan 2/3
PERS Defined Defined TRS DefinedPlan 1 Benefit Contribution Plan 1 Benefit
ASSETSCash and pooled investments 559$ 3,018$ 122$ 567$ 3,079$
Receivables:
Employer accounts receivable 3,380 62,088 4,912 1,348 39,194 Member accounts receivable
(net of allowance) 533 220 - 187 40 Due from other pension and other
employee benefit funds 18,134 12,767 576 9,170 7,107
Interest and dividends 21,324 83,047 4,028 17,124 29,129
Investment trades pending 202,252 788,154 38,225 162,420 276,427
Other receivables, all other funds 1 6 - 1 5
Total Receivables 245,624 946,282 47,741 190,250 351,902
Investments, Noncurrent:Public equity 2,757,704 10,746,478 1,504,191 2,214,598 3,769,083 Fixed income 1,653,970 6,445,345 312,595 1,328,235 2,260,559 Private equity 1,709,367 6,661,222 323,065 1,372,722 2,336,273 Real estate 1,108,305 4,318,946 209,466 890,034 1,514,772 Security lending 78,077 304,259 14,756 62,701 106,712 Liquidity 191,283 746,936 41,522 154,925 270,623 Tangible assets 151,096 588,806 28,557 121,339 206,510
Total Investments, Noncurrent 7,649,802 29,811,992 2,434,152 6,144,554 10,464,532
Total Assets 7,895,985 30,761,292 2,482,015 6,335,371 10,819,513
LIABILITIESObligations under security
lending agreements 78,402 304,521 14,756 62,942 106,927 Accrued liabilities 243,611 929,189 49,070 196,612 326,260 Due to other pension and other
employee benefit funds 15,557 15,385 - 5,986 9,170 Unearned revenues 103 238 - 243 125
Total Liabilities 337,673 1,249,333 63,826 265,783 442,482
NET POSITIONNet position restricted for:
Pension Benefits 7,558,312 29,511,959 2,418,189 6,069,588 10,377,031 Deferred compensation participants - - - - -
Total Net Position 7,558,312$ 29,511,959$ 2,418,189$ 6,069,588$ 10,377,031$
PENSION AND OTHER EMPLOYEE BENEFIT FUNDS
Combining Statement of Plan Net PositionJune 30, 2015
(expressed in thousands)
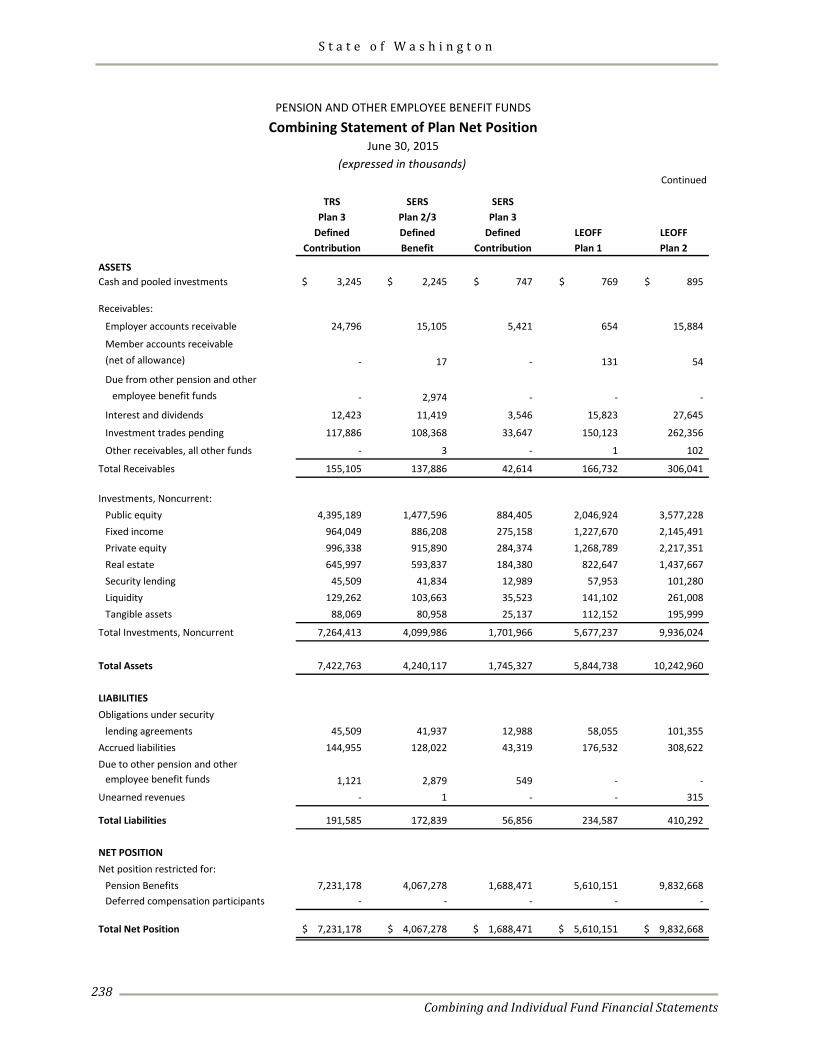
S t a t e o f W a s h i n g t o n
Combining and Individual Fund Financial Statements
238
Continued
TRS SERS SERSPlan 3 Plan 2/3 Plan 3
Defined Defined Defined LEOFF LEOFFContribution Benefit Contribution Plan 1 Plan 2
ASSETSCash and pooled investments 3,245$ 2,245$ 747$ 769$ 895$
Receivables:
Employer accounts receivable 24,796 15,105 5,421 654 15,884
Member accounts receivable(net of allowance) - 17 - 131 54
Due from other pension and otheremployee benefit funds - 2,974 - - -
Interest and dividends 12,423 11,419 3,546 15,823 27,645
Investment trades pending 117,886 108,368 33,647 150,123 262,356
Other receivables, all other funds - 3 - 1 102
Total Receivables 155,105 137,886 42,614 166,732 306,041
Investments, Noncurrent:Public equity 4,395,189 1,477,596 884,405 2,046,924 3,577,228 Fixed income 964,049 886,208 275,158 1,227,670 2,145,491 Private equity 996,338 915,890 284,374 1,268,789 2,217,351 Real estate 645,997 593,837 184,380 822,647 1,437,667 Security lending 45,509 41,834 12,989 57,953 101,280 Liquidity 129,262 103,663 35,523 141,102 261,008 Tangible assets 88,069 80,958 25,137 112,152 195,999
Total Investments, Noncurrent 7,264,413 4,099,986 1,701,966 5,677,237 9,936,024
Total Assets 7,422,763 4,240,117 1,745,327 5,844,738 10,242,960
LIABILITIESObligations under security
lending agreements 45,509 41,937 12,988 58,055 101,355 Accrued liabilities 144,955 128,022 43,319 176,532 308,622 Due to other pension and other
employee benefit funds 1,121 2,879 549 - - Unearned revenues - 1 - - 315
Total Liabilities 191,585 172,839 56,856 234,587 410,292
NET POSITIONNet position restricted for:
Pension Benefits 7,231,178 4,067,278 1,688,471 5,610,151 9,832,668 Deferred compensation participants - - - - -
Total Net Position 7,231,178$ 4,067,278$ 1,688,471$ 5,610,151$ 9,832,668$
PENSION AND OTHER EMPLOYEE BENEFIT FUNDS
Combining Statement of Plan Net PositionJune 30, 2015
(expressed in thousands)
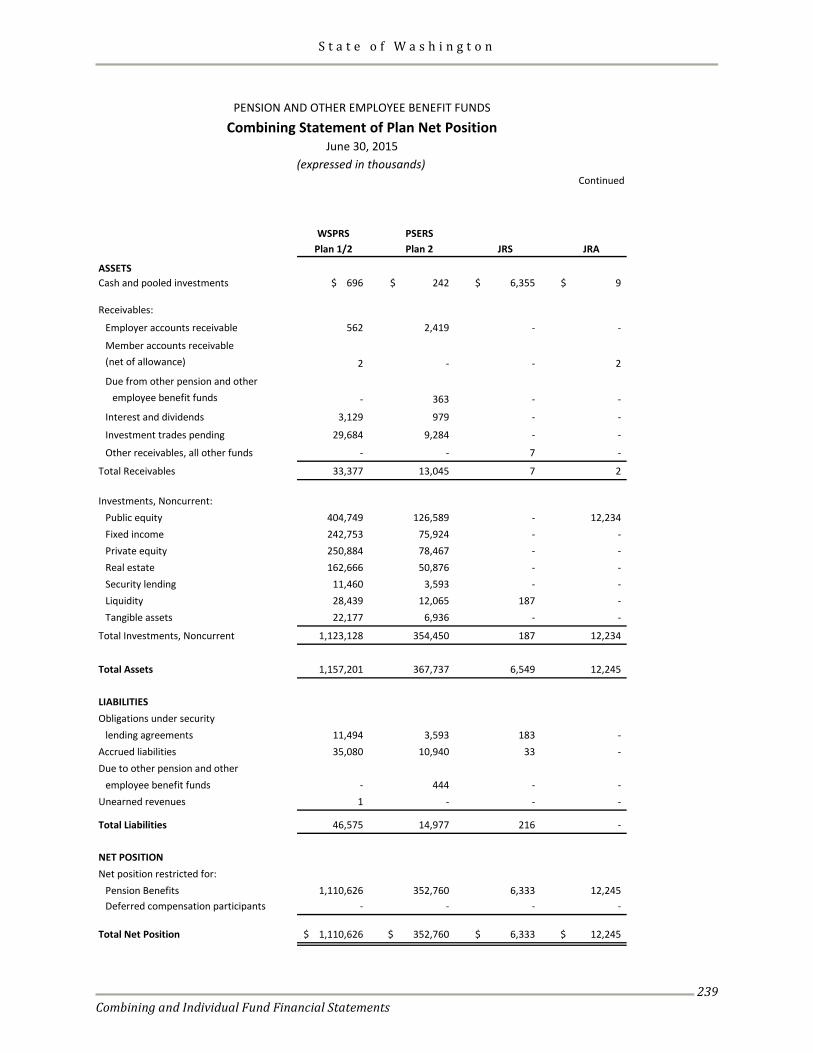
S t a t e o f W a s h i n g t o n
Combining and Individual Fund Financial Statements
239
Continued
WSPRS PSERSPlan 1/2 Plan 2 JRS JRA
ASSETSCash and pooled investments $ 696 242$ 6,355$ 9$
Receivables:
Employer accounts receivable 562 2,419 - -
Member accounts receivable(net of allowance) 2 - - 2
Due from other pension and otheremployee benefit funds - 363 - -
Interest and dividends 3,129 979 - -
Investment trades pending 29,684 9,284 - -
Other receivables, all other funds - - 7 -
Total Receivables 33,377 13,045 7 2
Investments, Noncurrent:Public equity 404,749 126,589 - 12,234 Fixed income 242,753 75,924 - - Private equity 250,884 78,467 - - Real estate 162,666 50,876 - - Security lending 11,460 3,593 - - Liquidity 28,439 12,065 187 - Tangible assets 22,177 6,936 - -
Total Investments, Noncurrent 1,123,128 354,450 187 12,234
Total Assets 1,157,201 367,737 6,549 12,245
LIABILITIESObligations under security
lending agreements 11,494 3,593 183 - Accrued liabilities 35,080 10,940 33 - Due to other pension and other
employee benefit funds - 444 - - Unearned revenues 1 - - -
Total Liabilities 46,575 14,977 216 -
NET POSITIONNet position restricted for:
Pension Benefits 1,110,626 352,760 6,333 12,245 Deferred compensation participants - - - -
Total Net Position 1,110,626$ 352,760$ 6,333$ 12,245$
PENSION AND OTHER EMPLOYEE BENEFIT FUNDS
Combining Statement of Plan Net PositionJune 30, 2015
(expressed in thousands)
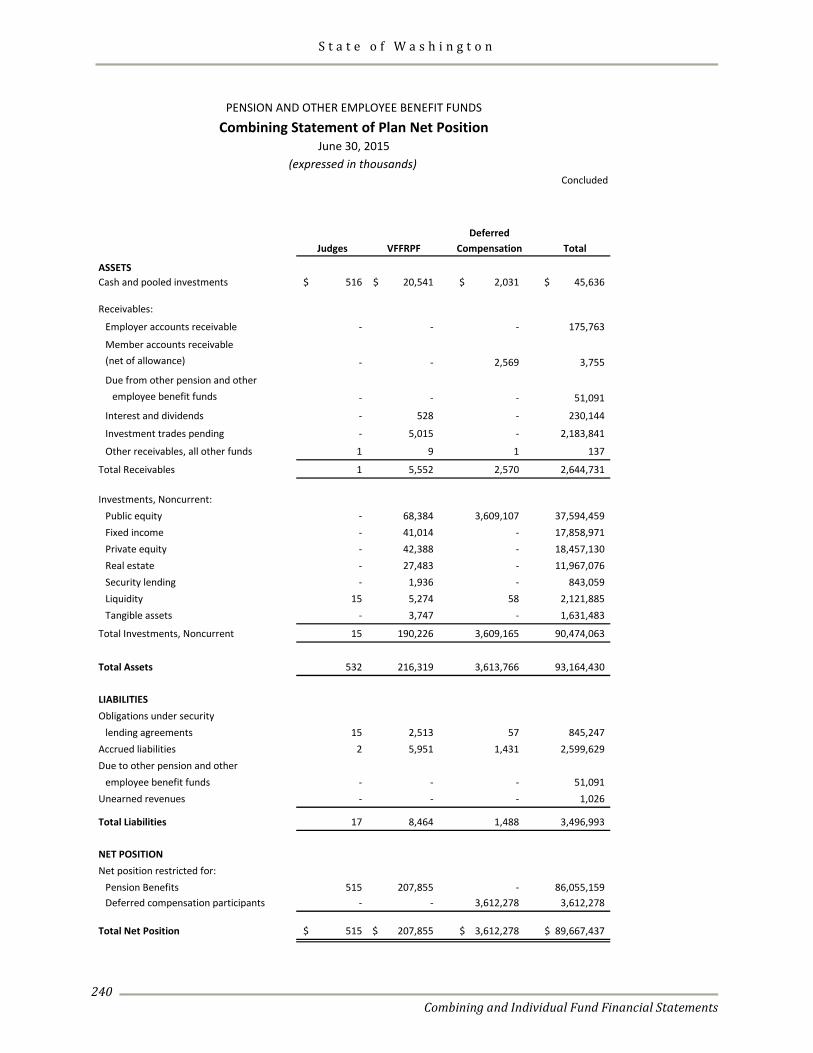
S t a t e o f W a s h i n g t o n
Combining and Individual Fund Financial Statements
240
Concluded
DeferredJudges VFFRPF Compensation Total
ASSETSCash and pooled investments 516$ 20,541$ 2,031$ 45,636$
Receivables:
Employer accounts receivable - - - 175,763
Member accounts receivable(net of allowance) - - 2,569 3,755
Due from other pension and otheremployee benefit funds - - - 51,091
Interest and dividends - 528 - 230,144
Investment trades pending - 5,015 - 2,183,841
Other receivables, all other funds 1 9 1 137
Total Receivables 1 5,552 2,570 2,644,731
Investments, Noncurrent:Public equity - 68,384 3,609,107 37,594,459 Fixed income - 41,014 - 17,858,971 Private equity - 42,388 - 18,457,130 Real estate - 27,483 - 11,967,076 Security lending - 1,936 - 843,059 Liquidity 15 5,274 58 2,121,885 Tangible assets - 3,747 - 1,631,483
Total Investments, Noncurrent 15 190,226 3,609,165 90,474,063
Total Assets 532 216,319 3,613,766 93,164,430
LIABILITIESObligations under security
lending agreements 15 2,513 57 845,247 Accrued liabilities 2 5,951 1,431 2,599,629 Due to other pension and other
employee benefit funds - - - 51,091 Unearned revenues - - - 1,026
Total Liabilities 17 8,464 1,488 3,496,993
NET POSITIONNet position restricted for:
Pension Benefits 515 207,855 - 86,055,159 Deferred compensation participants - - 3,612,278 3,612,278
Total Net Position 515$ 207,855$ 3,612,278$ 89,667,437$
PENSION AND OTHER EMPLOYEE BENEFIT FUNDS
Combining Statement of Plan Net PositionJune 30, 2015
(expressed in thousands)
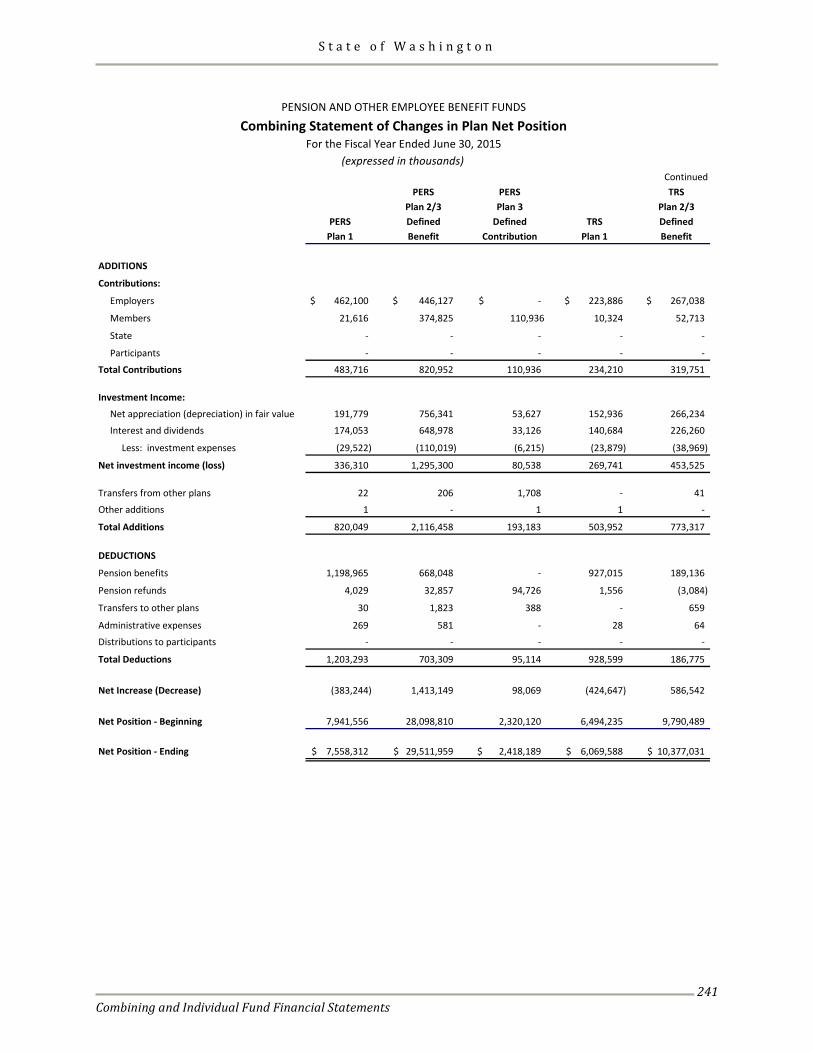
S t a t e o f W a s h i n g t o n
Combining and Individual Fund Financial Statements
241
ContinuedPERS PERS TRS
Plan 2/3 Plan 3 Plan 2/3PERS Defined Defined TRS Defined
Plan 1 Benefit Contribution Plan 1 Benefit
ADDITIONS
Contributions:
Employers 462,100$ 446,127$ -$ 223,886$ 267,038$
Members 21,616 374,825 110,936 10,324 52,713
State - - - - -
Participants - - - - -
Total Contributions 483,716 820,952 110,936 234,210 319,751
Investment Income:
Net appreciation (depreciation) in fair value 191,779 756,341 53,627 152,936 266,234
Interest and dividends 174,053 648,978 33,126 140,684 226,260
Less: investment expenses (29,522) (110,019) (6,215) (23,879) (38,969)
Net investment income (loss) 336,310 1,295,300 80,538 269,741 453,525
Transfers from other plans 22 206 1,708 - 41
Other additions 1 - 1 1 -
Total Additions 820,049 2,116,458 193,183 503,952 773,317
DEDUCTIONS
Pension benefits 1,198,965 668,048 - 927,015 189,136
Pension refunds 4,029 32,857 94,726 1,556 (3,084)
Transfers to other plans 30 1,823 388 - 659
Administrative expenses 269 581 - 28 64
Distributions to participants - - - - -
Total Deductions 1,203,293 703,309 95,114 928,599 186,775
Net Increase (Decrease) (383,244) 1,413,149 98,069 (424,647) 586,542
Net Position - Beginning 7,941,556 28,098,810 2,320,120 6,494,235 9,790,489
Net Position - Ending 7,558,312$ 29,511,959$ 2,418,189$ 6,069,588$ 10,377,031$
PENSION AND OTHER EMPLOYEE BENEFIT FUNDS
Combining Statement of Changes in Plan Net PositionFor the Fiscal Year Ended June 30, 2015
(expressed in thousands)
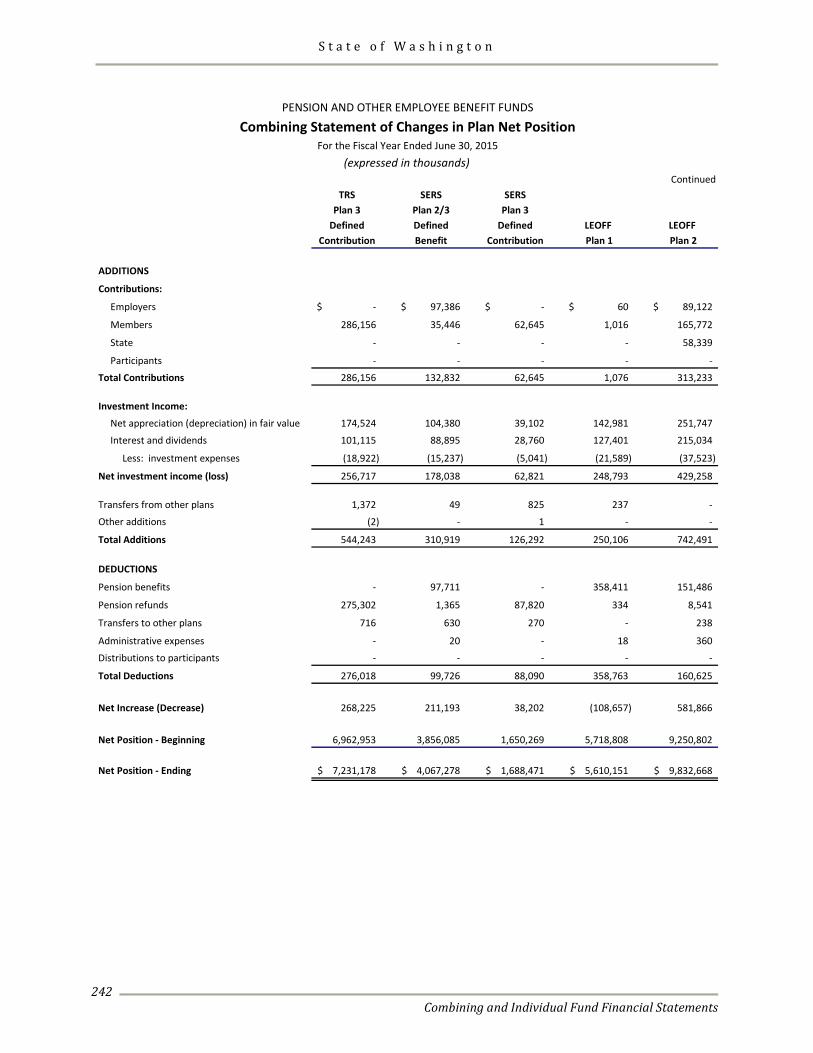
S t a t e o f W a s h i n g t o n
Combining and Individual Fund Financial Statements
242
ContinuedTRS SERS SERS
Plan 3 Plan 2/3 Plan 3Defined Defined Defined LEOFF LEOFF
Contribution Benefit Contribution Plan 1 Plan 2
ADDITIONS
Contributions:
Employers -$ 97,386$ -$ 60$ 89,122$
Members 286,156 35,446 62,645 1,016 165,772
State - - - - 58,339
Participants - - - - -
Total Contributions 286,156 132,832 62,645 1,076 313,233
Investment Income:
Net appreciation (depreciation) in fair value 174,524 104,380 39,102 142,981 251,747
Interest and dividends 101,115 88,895 28,760 127,401 215,034
Less: investment expenses (18,922) (15,237) (5,041) (21,589) (37,523)
Net investment income (loss) 256,717 178,038 62,821 248,793 429,258
Transfers from other plans 1,372 49 825 237 -
Other additions (2) - 1 - -
Total Additions 544,243 310,919 126,292 250,106 742,491
DEDUCTIONS
Pension benefits - 97,711 - 358,411 151,486
Pension refunds 275,302 1,365 87,820 334 8,541
Transfers to other plans 716 630 270 - 238
Administrative expenses - 20 - 18 360
Distributions to participants - - - - -
Total Deductions 276,018 99,726 88,090 358,763 160,625
Net Increase (Decrease) 268,225 211,193 38,202 (108,657) 581,866
Net Position - Beginning 6,962,953 3,856,085 1,650,269 5,718,808 9,250,802
Net Position - Ending 7,231,178$ 4,067,278$ 1,688,471$ 5,610,151$ 9,832,668$
PENSION AND OTHER EMPLOYEE BENEFIT FUNDS
Combining Statement of Changes in Plan Net Position
(expressed in thousands)For the Fiscal Year Ended June 30, 2015
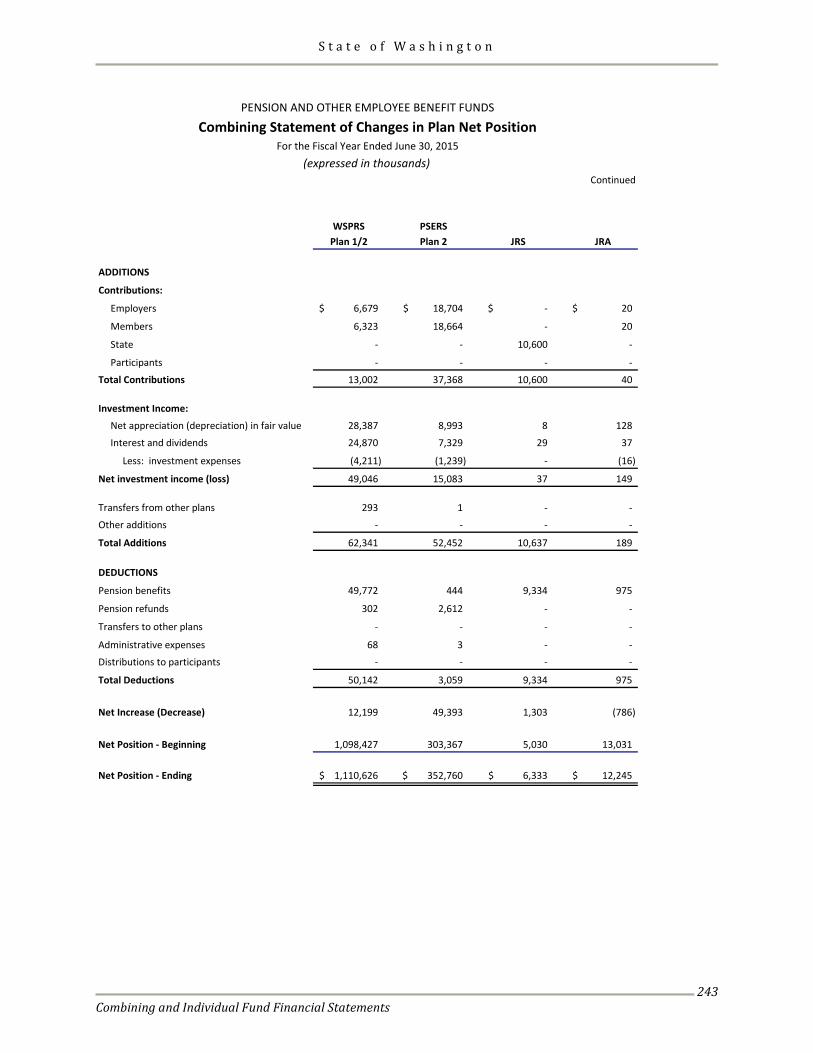
S t a t e o f W a s h i n g t o n
Combining and Individual Fund Financial Statements
243
Continued
WSPRS PSERSPlan 1/2 Plan 2 JRS JRA
ADDITIONS
Contributions:
Employers 6,679$ 18,704$ -$ 20$
Members 6,323 18,664 - 20
State - - 10,600 -
Participants - - - -
Total Contributions 13,002 37,368 10,600 40
Investment Income:
Net appreciation (depreciation) in fair value 28,387 8,993 8 128
Interest and dividends 24,870 7,329 29 37
Less: investment expenses (4,211) (1,239) - (16)
Net investment income (loss) 49,046 15,083 37 149
Transfers from other plans 293 1 - -
Other additions - - - -
Total Additions 62,341 52,452 10,637 189
DEDUCTIONS
Pension benefits 49,772 444 9,334 975
Pension refunds 302 2,612 - -
Transfers to other plans - - - -
Administrative expenses 68 3 - -
Distributions to participants - - - -
Total Deductions 50,142 3,059 9,334 975
Net Increase (Decrease) 12,199 49,393 1,303 (786)
Net Position - Beginning 1,098,427 303,367 5,030 13,031
Net Position - Ending 1,110,626$ 352,760$ 6,333$ 12,245$
For the Fiscal Year Ended June 30, 2015
PENSION AND OTHER EMPLOYEE BENEFIT FUNDS
Combining Statement of Changes in Plan Net Position
(expressed in thousands)
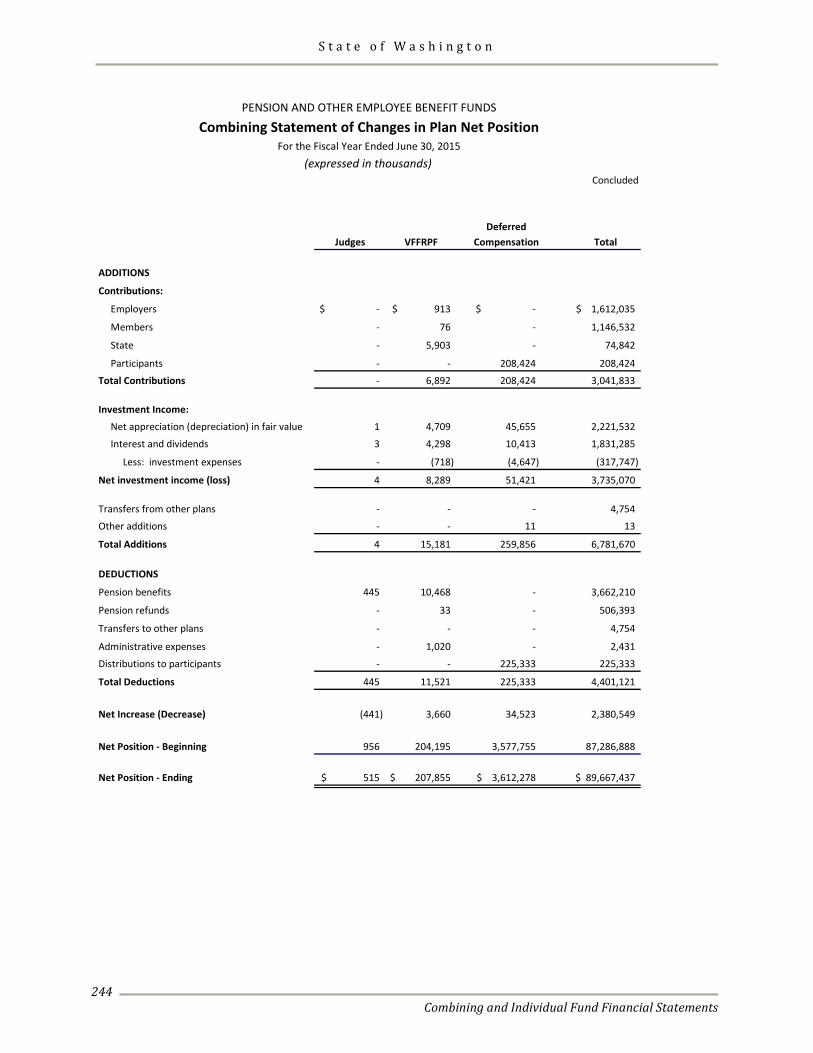
S t a t e o f W a s h i n g t o n
Combining and Individual Fund Financial Statements
244
Concluded
DeferredJudges VFFRPF Compensation Total
ADDITIONS
Contributions:
Employers -$ 913$ -$ 1,612,035$
Members - 76 - 1,146,532
State - 5,903 - 74,842
Participants - - 208,424 208,424
Total Contributions - 6,892 208,424 3,041,833
Investment Income:
Net appreciation (depreciation) in fair value 1 4,709 45,655 2,221,532
Interest and dividends 3 4,298 10,413 1,831,285
Less: investment expenses - (718) (4,647) (317,747)
Net investment income (loss) 4 8,289 51,421 3,735,070
Transfers from other plans - - - 4,754
Other additions - - 11 13
Total Additions 4 15,181 259,856 6,781,670
DEDUCTIONS
Pension benefits 445 10,468 - 3,662,210
Pension refunds - 33 - 506,393
Transfers to other plans - - - 4,754
Administrative expenses - 1,020 - 2,431
Distributions to participants - - 225,333 225,333
Total Deductions 445 11,521 225,333 4,401,121
Net Increase (Decrease) (441) 3,660 34,523 2,380,549
Net Position - Beginning 956 204,195 3,577,755 87,286,888
Net Position - Ending 515$ 207,855$ 3,612,278$ 89,667,437$
PENSION AND OTHER EMPLOYEE BENEFIT FUNDS
Combining Statement of Changes in Plan Net PositionFor the Fiscal Year Ended June 30, 2015
(expressed in thousands)
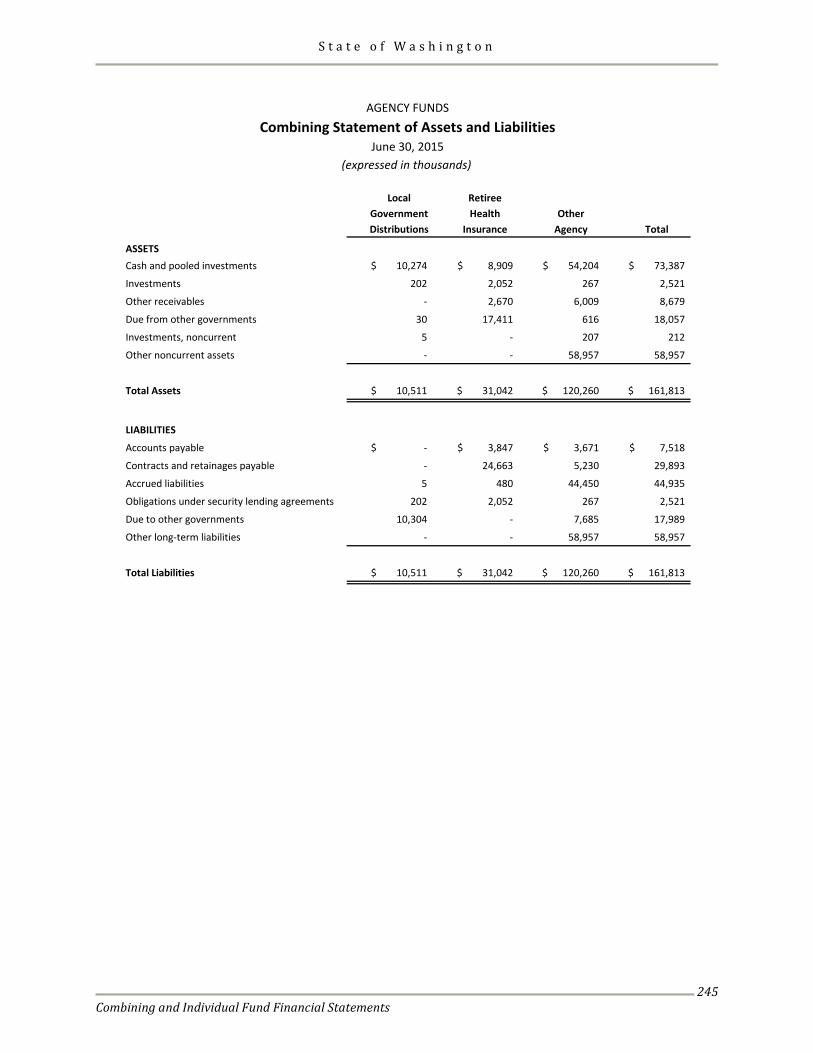
S t a t e o f W a s h i n g t o n
Combining and Individual Fund Financial Statements
245
Local RetireeGovernment Health OtherDistributions Insurance Agency Total
ASSETSCash and pooled investments 10,274$ 8,909$ 54,204$ 73,387$
Investments 202 2,052 267 2,521
Other receivables - 2,670 6,009 8,679
Due from other governments 30 17,411 616 18,057
Investments, noncurrent 5 - 207 212
Other noncurrent assets - - 58,957 58,957
Total Assets 10,511$ 31,042$ 120,260$ 161,813$
LIABILITIES
Accounts payable -$ 3,847$ 3,671$ 7,518$
Contracts and retainages payable - 24,663 5,230 29,893
Accrued liabilities 5 480 44,450 44,935
Obligations under security lending agreements 202 2,052 267 2,521
Due to other governments 10,304 - 7,685 17,989
Other long-term liabilities - - 58,957 58,957
Total Liabilities 10,511$ 31,042$ 120,260$ 161,813$
AGENCY FUNDSCombining Statement of Assets and Liabilities
June 30, 2015(expressed in thousands)
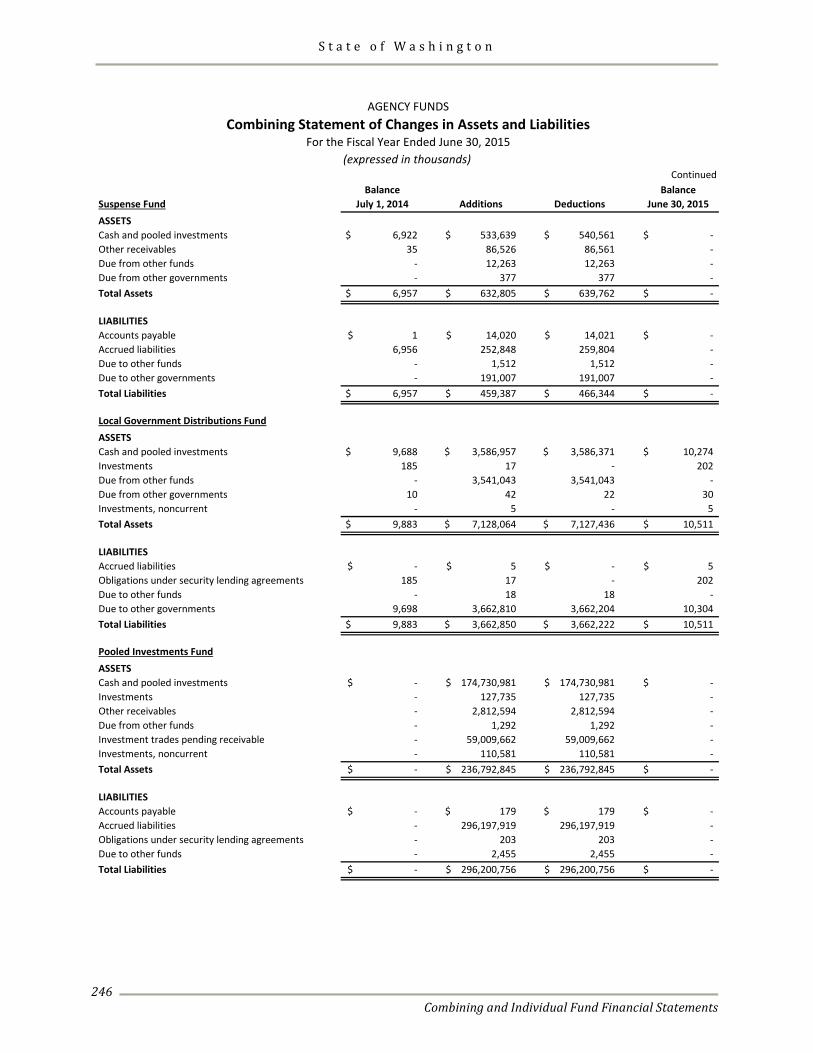
S t a t e o f W a s h i n g t o n
Combining and Individual Fund Financial Statements
246
ContinuedBalance Balance
Suspense Fund July 1, 2014 Additions Deductions June 30, 2015ASSETSCash and pooled investments 6,922$ 533,639$ 540,561$ -$ Other receivables 35 86,526 86,561 - Due from other funds - 12,263 12,263 - Due from other governments - 377 377 -Total Assets 6,957$ 632,805$ 639,762$ -$
LIABILITIESAccounts payable 1$ 14,020$ 14,021$ -$ Accrued liabilities 6,956 252,848 259,804 - Due to other funds - 1,512 1,512 - Due to other governments - 191,007 191,007 - Total Liabilities 6,957$ 459,387$ 466,344$ -$
Local Government Distributions FundASSETSCash and pooled investments 9,688$ 3,586,957$ 3,586,371$ 10,274$ Investments 185 17 - 202 Due from other funds - 3,541,043 3,541,043 - Due from other governments 10 42 22 30 Investments, noncurrent - 5 - 5 Total Assets 9,883$ 7,128,064$ 7,127,436$ 10,511$
LIABILITIESAccrued liabilities -$ 5$ -$ 5$ Obligations under security lending agreements 185 17 - 202 Due to other funds - 18 18 - Due to other governments 9,698 3,662,810 3,662,204 10,304 Total Liabilities 9,883$ 3,662,850$ 3,662,222$ 10,511$
Pooled Investments FundASSETSCash and pooled investments -$ 174,730,981$ 174,730,981$ -$ Investments - 127,735 127,735 - Other receivables - 2,812,594 2,812,594 - Due from other funds - 1,292 1,292 - Investment trades pending receivable - 59,009,662 59,009,662 - Investments, noncurrent - 110,581 110,581 - Total Assets -$ 236,792,845$ 236,792,845$ -$
LIABILITIESAccounts payable -$ 179$ 179$ -$ Accrued liabilities - 296,197,919 296,197,919 - Obligations under security lending agreements - 203 203 - Due to other funds - 2,455 2,455 - Total Liabilities -$ 296,200,756$ 296,200,756$ -$
AGENCY FUNDSCombining Statement of Changes in Assets and Liabilities
For the Fiscal Year Ended June 30, 2015(expressed in thousands)
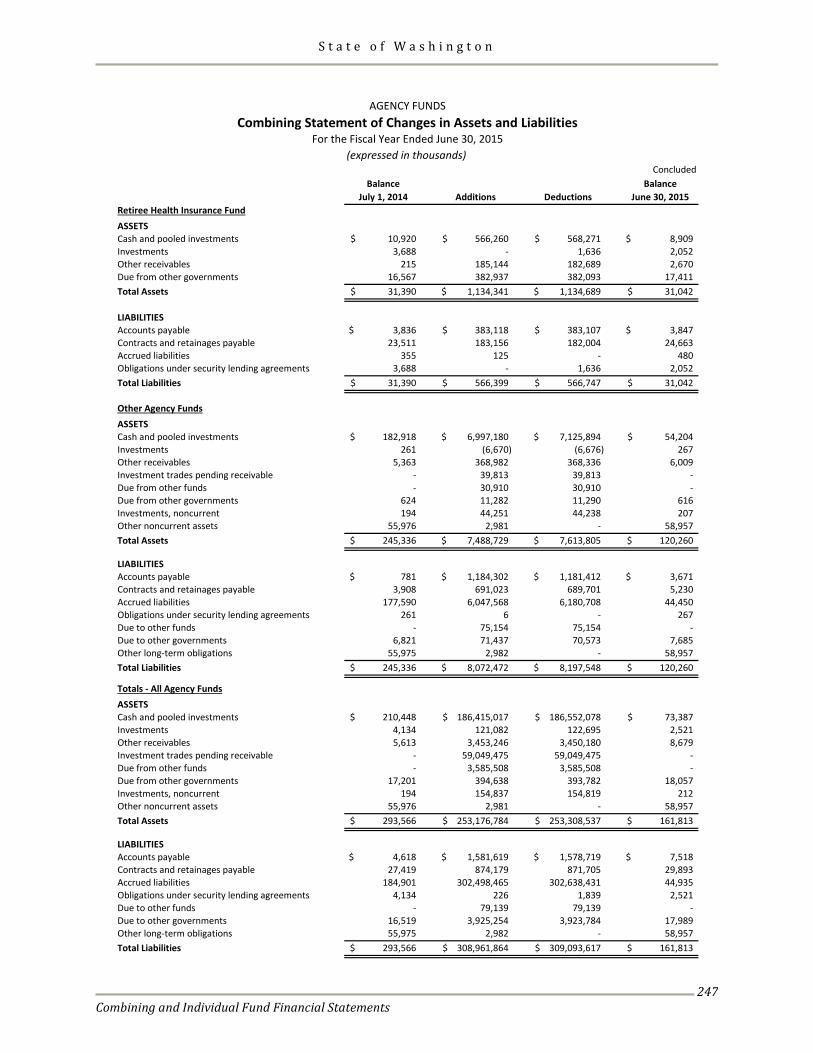
S t a t e o f W a s h i n g t o n
Combining and Individual Fund Financial Statements
247
ConcludedBalance Balance
July 1, 2014 Additions Deductions June 30, 2015Retiree Health Insurance FundASSETSCash and pooled investments 10,920$ 566,260$ 568,271$ 8,909$ Investments 3,688 - 1,636 2,052 Other receivables 215 185,144 182,689 2,670 Due from other governments 16,567 382,937 382,093 17,411 Total Assets 31,390$ 1,134,341$ 1,134,689$ 31,042$
LIABILITIESAccounts payable 3,836$ 383,118$ 383,107$ 3,847$ Contracts and retainages payable 23,511 183,156 182,004 24,663 Accrued liabilities 355 125 - 480 Obligations under security lending agreements 3,688 - 1,636 2,052 Total Liabilities 31,390$ 566,399$ 566,747$ 31,042$
Other Agency FundsASSETSCash and pooled investments 182,918$ 6,997,180$ 7,125,894$ 54,204$ Investments 261 (6,670) (6,676) 267 Other receivables 5,363 368,982 368,336 6,009 Investment trades pending receivable - 39,813 39,813 - Due from other funds - 30,910 30,910 - Due from other governments 624 11,282 11,290 616 Investments, noncurrent 194 44,251 44,238 207 Other noncurrent assets 55,976 2,981 - 58,957 Total Assets 245,336$ 7,488,729$ 7,613,805$ 120,260$
LIABILITIESAccounts payable 781$ 1,184,302$ 1,181,412$ 3,671$ Contracts and retainages payable 3,908 691,023 689,701 5,230 Accrued liabilities 177,590 6,047,568 6,180,708 44,450 Obligations under security lending agreements 261 6 - 267 Due to other funds - 75,154 75,154 - Due to other governments 6,821 71,437 70,573 7,685 Other long-term obligations 55,975 2,982 - 58,957 Total Liabilities 245,336$ 8,072,472$ 8,197,548$ 120,260$
Totals - All Agency FundsASSETSCash and pooled investments 210,448$ 186,415,017$ 186,552,078$ 73,387$ Investments 4,134 121,082 122,695 2,521 Other receivables 5,613 3,453,246 3,450,180 8,679 Investment trades pending receivable - 59,049,475 59,049,475 - Due from other funds - 3,585,508 3,585,508 - Due from other governments 17,201 394,638 393,782 18,057 Investments, noncurrent 194 154,837 154,819 212 Other noncurrent assets 55,976 2,981 - 58,957 Total Assets 293,566$ 253,176,784$ 253,308,537$ 161,813$
LIABILITIESAccounts payable 4,618$ 1,581,619$ 1,578,719$ 7,518$ Contracts and retainages payable 27,419 874,179 871,705 29,893 Accrued liabilities 184,901 302,498,465 302,638,431 44,935 Obligations under security lending agreements 4,134 226 1,839 2,521 Due to other funds - 79,139 79,139 - Due to other governments 16,519 3,925,254 3,923,784 17,989 Other long-term obligations 55,975 2,982 - 58,957 Total Liabilities 293,566$ 308,961,864$ 309,093,617$ 161,813$
For the Fiscal Year Ended June 30, 2015(expressed in thousands)
AGENCY FUNDSCombining Statement of Changes in Assets and Liabilities

S t a t e o f W a s h i n g t o n
Combining and Individual Fund Financial Statements
248
This page intentionally left blank.
S t a t e o f W a s h i n g t o n
Combining and Individual Fund Financial Statements
249
Nonmajor Component Units Discrete component units are entities which are legally separate from the state but which are financially accountable to the state. The nonmajor component units are described below: Washington State Housing Finance Commission The Washington State Housing Finance Commission makes funds available to help provide housing throughout the state, and to finance or refinance nursing homes and capital facilities owned and operated by nonprofit corporations. Washington Health Care Facilities Authority The Washington Health Care Facilities Authority makes funds available to qualified, nonprofit health care facilities in the state.
Washington Higher Education Facilities Authority The Washington Higher Education Facilities Authority provides funding to qualified, nonprofit higher education institutions in the state. Washington Economic Development Finance Authority The Washington Economic Development Finance Authority makes funds available to qualified, small and medium-sized businesses in the state for qualifying manufacturing and processing facilities and projects.
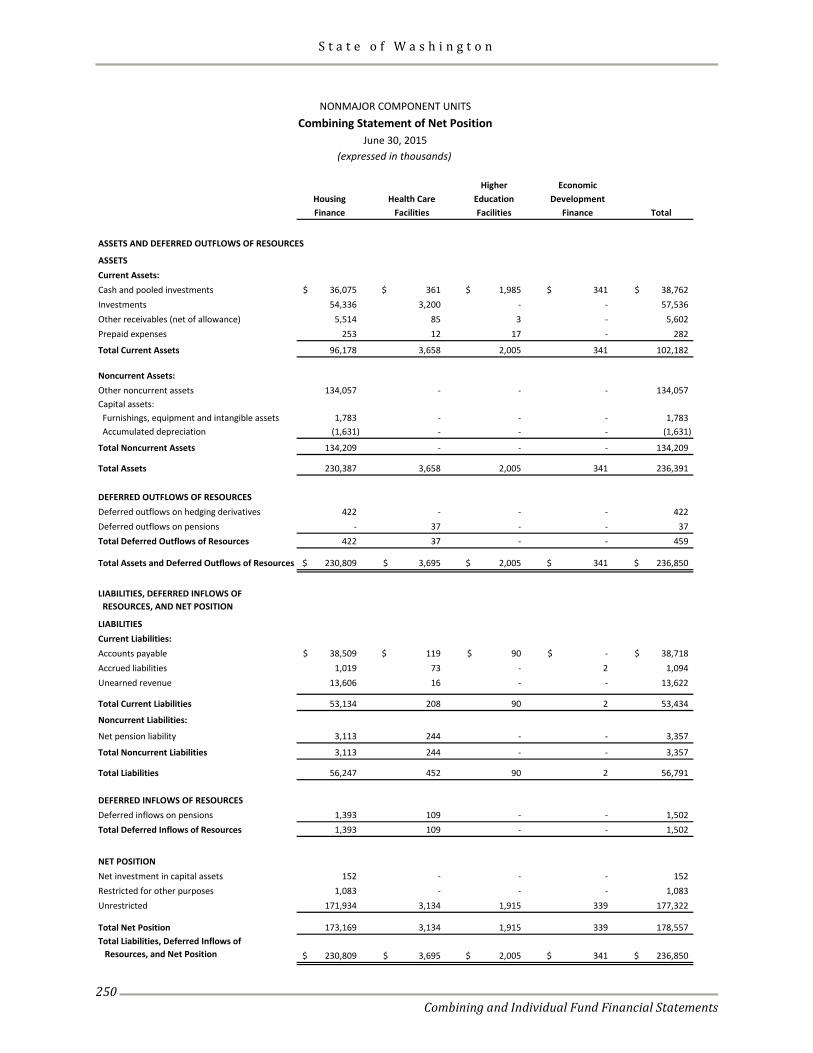
S t a t e o f W a s h i n g t o n
Combining and Individual Fund Financial Statements
250
Higher EconomicHousing Health Care Education DevelopmentFinance Facilities Facilities Finance Total
ASSETS AND DEFERRED OUTFLOWS OF RESOURCES
ASSETSCurrent Assets:Cash and pooled investments 36,075$ 361$ 1,985$ 341$ 38,762$ Investments 54,336 3,200 - - 57,536 Other receivables (net of allowance) 5,514 85 3 - 5,602 Prepaid expenses 253 12 17 - 282
Total Current Assets 96,178 3,658 2,005 341 102,182
Noncurrent Assets:Other noncurrent assets 134,057 - - - 134,057 Capital assets: Furnishings, equipment and intangible assets 1,783 - - - 1,783 Accumulated depreciation (1,631) - - - (1,631)
Total Noncurrent Assets 134,209 - - - 134,209
Total Assets 230,387 3,658 2,005 341 236,391
DEFERRED OUTFLOWS OF RESOURCESDeferred outflows on hedging derivatives 422 - - - 422 Deferred outflows on pensions - 37 - - 37 Total Deferred Outflows of Resources 422 37 - - 459
Total Assets and Deferred Outflows of Resources 230,809$ 3,695$ 2,005$ 341$ 236,850$
LIABILITIES, DEFERRED INFLOWS OF RESOURCES, AND NET POSITION
LIABILITIESCurrent Liabilities:Accounts payable 38,509$ 119$ 90$ -$ 38,718$ Accrued liabilities 1,019 73 - 2 1,094 Unearned revenue 13,606 16 - - 13,622
Total Current Liabilities 53,134 208 90 2 53,434
Noncurrent Liabilities:
Net pension liability 3,113 244 - - 3,357
Total Noncurrent Liabilities 3,113 244 - - 3,357
Total Liabilities 56,247 452 90 2 56,791
DEFERRED INFLOWS OF RESOURCESDeferred inflows on pensions 1,393 109 - - 1,502 Total Deferred Inflows of Resources 1,393 109 - - 1,502
NET POSITIONNet investment in capital assets 152 - - - 152 Restricted for other purposes 1,083 - - - 1,083 Unrestricted 171,934 3,134 1,915 339 177,322
Total Net Position 173,169 3,134 1,915 339 178,557 Total Liabilities, Deferred Inflows of Resources, and Net Position 230,809$ 3,695$ 2,005$ 341$ 236,850$
NONMAJOR COMPONENT UNITSCombining Statement of Net Position
June 30, 2015(expressed in thousands)
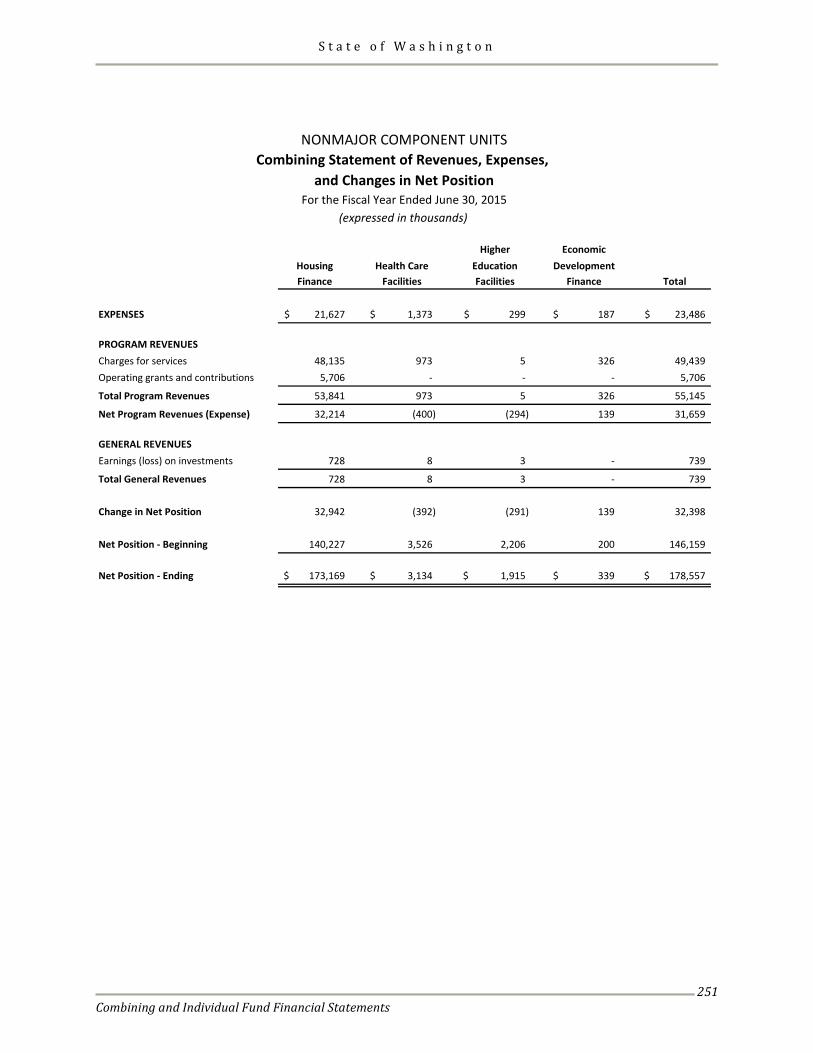
S t a t e o f W a s h i n g t o n
Combining and Individual Fund Financial Statements
251
Higher EconomicHousing Health Care Education DevelopmentFinance Facilities Facilities Finance Total
EXPENSES 21,627$ 1,373$ 299$ 187$ 23,486$
PROGRAM REVENUESCharges for services 48,135 973 5 326 49,439 Operating grants and contributions 5,706 - - - 5,706
Total Program Revenues 53,841 973 5 326 55,145
Net Program Revenues (Expense) 32,214 (400) (294) 139 31,659
GENERAL REVENUESEarnings (loss) on investments 728 8 3 - 739
Total General Revenues 728 8 3 - 739
Change in Net Position 32,942 (392) (291) 139 32,398
Net Position - Beginning 140,227 3,526 2,206 200 146,159
Net Position - Ending 173,169$ 3,134$ 1,915$ 339$ 178,557$
Combining Statement of Revenues, Expenses, and Changes in Net Position
For the Fiscal Year Ended June 30, 2015(expressed in thousands)
NONMAJOR COMPONENT UNITS

S t a t e o f W a s h i n g t o n
Combining and Individual Fund Financial Statements
252
This page intentionally left blank.
S t a t e o f W a s h i n g t o n
Schedules
253
Individual Fund Schedules
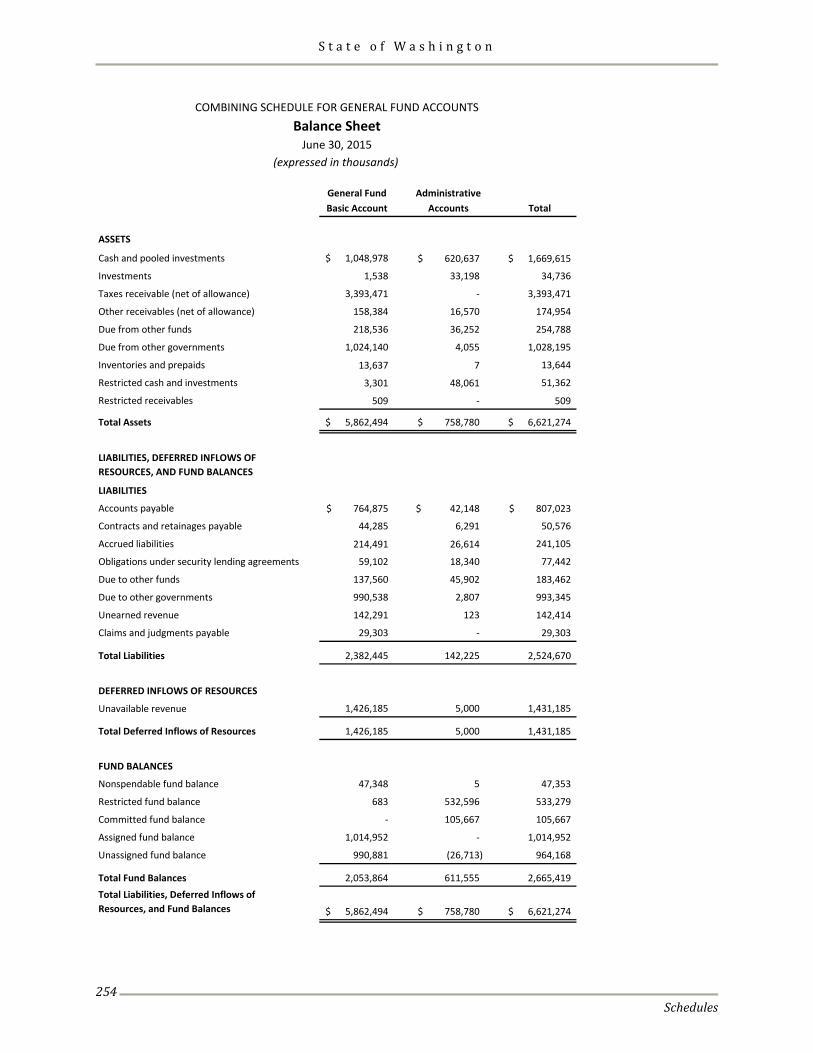
S t a t e o f W a s h i n g t o n
Schedules
254
General Fund AdministrativeBasic Account Accounts Total
ASSETS
Cash and pooled investments 1,048,978$ 620,637$ 1,669,615$
Investments 1,538 33,198 34,736
Taxes receivable (net of allowance) 3,393,471 - 3,393,471
Other receivables (net of allowance) 158,384 16,570 174,954
Due from other funds 218,536 36,252 254,788
Due from other governments 1,024,140 4,055 1,028,195
Inventories and prepaids 13,637 7 13,644
Restricted cash and investments 3,301 48,061 51,362
Restricted receivables 509 - 509
Total Assets 5,862,494$ 758,780$ 6,621,274$
LIABILITIES, DEFERRED INFLOWS OFRESOURCES, AND FUND BALANCES
LIABILITIES
Accounts payable 764,875$ 42,148$ 807,023$
Contracts and retainages payable 44,285 6,291 50,576
Accrued liabilities 214,491 26,614 241,105
Obligations under security lending agreements 59,102 18,340 77,442
Due to other funds 137,560 45,902 183,462
Due to other governments 990,538 2,807 993,345
Unearned revenue 142,291 123 142,414
Claims and judgments payable 29,303 - 29,303
Total Liabilities 2,382,445 142,225 2,524,670
DEFERRED INFLOWS OF RESOURCES
Unavailable revenue 1,426,185 5,000 1,431,185
Total Deferred Inflows of Resources 1,426,185 5,000 1,431,185
FUND BALANCES
Nonspendable fund balance 47,348 5 47,353
Restricted fund balance 683 532,596 533,279
Committed fund balance - 105,667 105,667
Assigned fund balance 1,014,952 - 1,014,952
Unassigned fund balance 990,881 (26,713) 964,168
Total Fund Balances 2,053,864 611,555 2,665,419 Total Liabilities, Deferred Inflows of Resources, and Fund Balances 5,862,494$ 758,780$ 6,621,274$
COMBINING SCHEDULE FOR GENERAL FUND ACCOUNTSBalance Sheet
June 30, 2015(expressed in thousands)
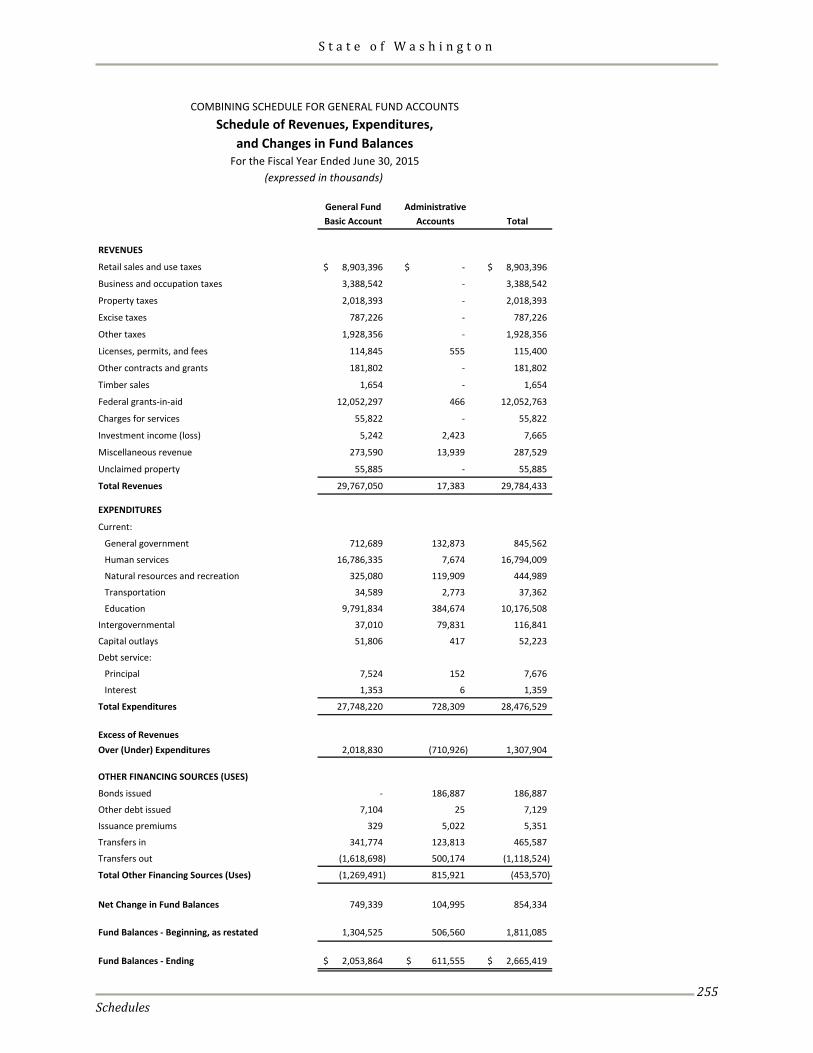
S t a t e o f W a s h i n g t o n
Schedules
255
General Fund AdministrativeBasic Account Accounts Total
REVENUES
Retail sales and use taxes 8,903,396$ -$ 8,903,396$
Business and occupation taxes 3,388,542 - 3,388,542
Property taxes 2,018,393 - 2,018,393
Excise taxes 787,226 - 787,226
Other taxes 1,928,356 - 1,928,356
Licenses, permits, and fees 114,845 555 115,400
Other contracts and grants 181,802 - 181,802
Timber sales 1,654 - 1,654
Federal grants-in-aid 12,052,297 466 12,052,763
Charges for services 55,822 - 55,822
Investment income (loss) 5,242 2,423 7,665
Miscellaneous revenue 273,590 13,939 287,529
Unclaimed property 55,885 - 55,885
Total Revenues 29,767,050 17,383 29,784,433
EXPENDITURES
Current:
General government 712,689 132,873 845,562
Human services 16,786,335 7,674 16,794,009
Natural resources and recreation 325,080 119,909 444,989
Transportation 34,589 2,773 37,362
Education 9,791,834 384,674 10,176,508
Intergovernmental 37,010 79,831 116,841
Capital outlays 51,806 417 52,223
Debt service:
Principal 7,524 152 7,676
Interest 1,353 6 1,359
Total Expenditures 27,748,220 728,309 28,476,529
Excess of RevenuesOver (Under) Expenditures 2,018,830 (710,926) 1,307,904
OTHER FINANCING SOURCES (USES)
Bonds issued - 186,887 186,887
Other debt issued 7,104 25 7,129
Issuance premiums 329 5,022 5,351
Transfers in 341,774 123,813 465,587
Transfers out (1,618,698) 500,174 (1,118,524)
Total Other Financing Sources (Uses) (1,269,491) 815,921 (453,570)
Net Change in Fund Balances 749,339 104,995 854,334
Fund Balances - Beginning, as restated 1,304,525 506,560 1,811,085
Fund Balances - Ending 2,053,864$ 611,555$ 2,665,419$
(expressed in thousands)
COMBINING SCHEDULE FOR GENERAL FUND ACCOUNTSSchedule of Revenues, Expenditures,
and Changes in Fund BalancesFor the Fiscal Year Ended June 30, 2015
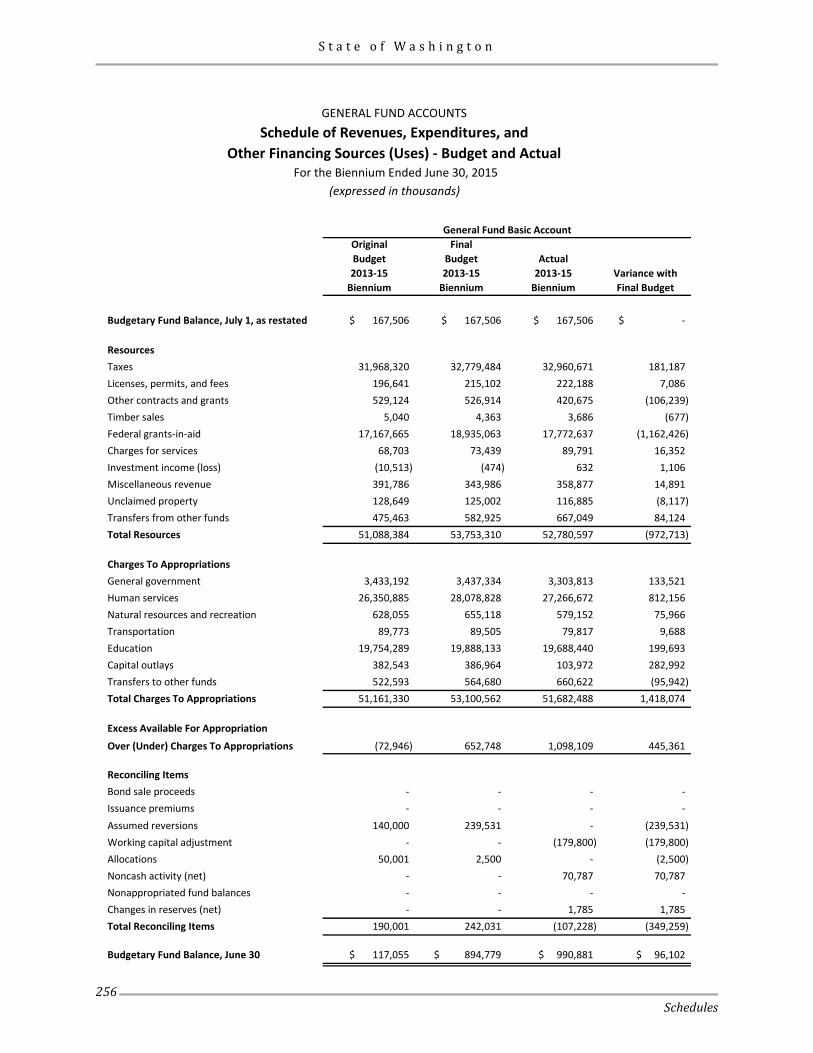
S t a t e o f W a s h i n g t o n
Schedules
256
Original FinalBudget Budget Actual2013-15 2013-15 2013-15 Variance with
Biennium Biennium Biennium Final Budget
Budgetary Fund Balance, July 1, as restated $ 167,506 $ 167,506 $ 167,506 $ -
ResourcesTaxes 31,968,320 32,779,484 32,960,671 181,187 Licenses, permits, and fees 196,641 215,102 222,188 7,086 Other contracts and grants 529,124 526,914 420,675 (106,239) Timber sales 5,040 4,363 3,686 (677) Federal grants-in-aid 17,167,665 18,935,063 17,772,637 (1,162,426) Charges for services 68,703 73,439 89,791 16,352 Investment income (loss) (10,513) (474) 632 1,106 Miscellaneous revenue 391,786 343,986 358,877 14,891 Unclaimed property 128,649 125,002 116,885 (8,117) Transfers from other funds 475,463 582,925 667,049 84,124 Total Resources 51,088,384 53,753,310 52,780,597 (972,713)
Charges To AppropriationsGeneral government 3,433,192 3,437,334 3,303,813 133,521 Human services 26,350,885 28,078,828 27,266,672 812,156 Natural resources and recreation 628,055 655,118 579,152 75,966 Transportation 89,773 89,505 79,817 9,688 Education 19,754,289 19,888,133 19,688,440 199,693 Capital outlays 382,543 386,964 103,972 282,992 Transfers to other funds 522,593 564,680 660,622 (95,942) Total Charges To Appropriations 51,161,330 53,100,562 51,682,488 1,418,074
Excess Available For Appropriation
Over (Under) Charges To Appropriations (72,946) 652,748 1,098,109 445,361
Reconciling ItemsBond sale proceeds - - - - Issuance premiums - - - - Assumed reversions 140,000 239,531 - (239,531) Working capital adjustment - - (179,800) (179,800) Allocations 50,001 2,500 - (2,500) Noncash activity (net) - - 70,787 70,787 Nonappropriated fund balances - - - - Changes in reserves (net) - - 1,785 1,785 Total Reconciling Items 190,001 242,031 (107,228) (349,259)
Budgetary Fund Balance, June 30 $ 117,055 $ 894,779 $ 990,881 $ 96,102
General Fund Basic Account
GENERAL FUND ACCOUNTSSchedule of Revenues, Expenditures, and
Other Financing Sources (Uses) - Budget and Actual For the Biennium Ended June 30, 2015
(expressed in thousands)
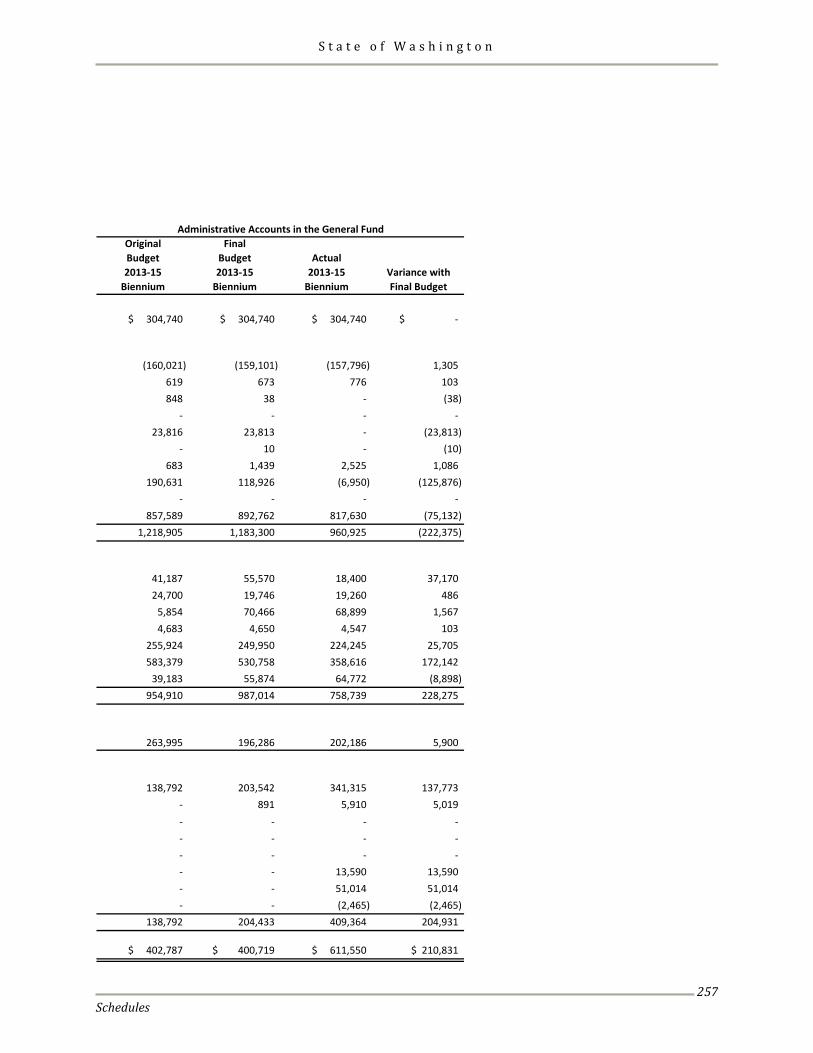
S t a t e o f W a s h i n g t o n
Schedules
257
Original FinalBudget Budget Actual2013-15 2013-15 2013-15 Variance with
Biennium Biennium Biennium Final Budget
$ 304,740 $ 304,740 $ 304,740 $ -
(160,021) (159,101) (157,796) 1,305 619 673 776 103 848 38 - (38)
- - - - 23,816 23,813 - (23,813)
- 10 - (10) 683 1,439 2,525 1,086
190,631 118,926 (6,950) (125,876) - - - -
857,589 892,762 817,630 (75,132) 1,218,905 1,183,300 960,925 (222,375)
41,187 55,570 18,400 37,170 24,700 19,746 19,260 486
5,854 70,466 68,899 1,567 4,683 4,650 4,547 103
255,924 249,950 224,245 25,705 583,379 530,758 358,616 172,142
39,183 55,874 64,772 (8,898) 954,910 987,014 758,739 228,275
263,995 196,286 202,186 5,900
138,792 203,542 341,315 137,773 - 891 5,910 5,019 - - - - - - - - - - - - - - 13,590 13,590 - - 51,014 51,014 - - (2,465) (2,465)
138,792 204,433 409,364 204,931
$ 402,787 $ 400,719 $ 611,550 $ 210,831
Administrative Accounts in the General Fund

S t a t e o f W a s h i n g t o n
Schedules
258
This page intentionally left blank.
S t a t e o f W a s h i n g t o n
Statistical Section
259
STATISTICAL SECTION

S t a t e o f W a s h i n g t o n
Statistical Section
260
This page intentionally left blank.
S t a t e o f W a s h i n g t o n
Statistical Section
261
Statistical Section This section of the state of Washington’s comprehensive annual financial report presents detailed information as a context for understanding what the information in the financial statements, note disclosures, and required supplementary information says about the state’s overall financial health. Financial Trends ............................................................................................................................................. 262-273 These schedules contain trend information to help the reader understand how the state’s financial performance and fiscal health has changed over time. Revenue Capacity ........................................................................................................................................... 274-279 These schedules contain information to help the reader assess the state’s most significant revenue sources: Retail sales tax and business and occupation tax. Debt Capacity .................................................................................................................................................... 280-284 These schedules present information to help the reader assess the affordability of the state’s current levels of outstanding debt, and the state’s ability to issue additional debt in the future. Demographic Information ........................................................................................................................ 285-293 These schedules offer demographic and economic indicators to help the reader understand the environment in which the state’s financial activities take place. Operating Information ............................................................................................................................... 294-305 These schedules offer operating data to help the reader understand how the information in the state’s financial report relates to the services it provides and the activities it performs.
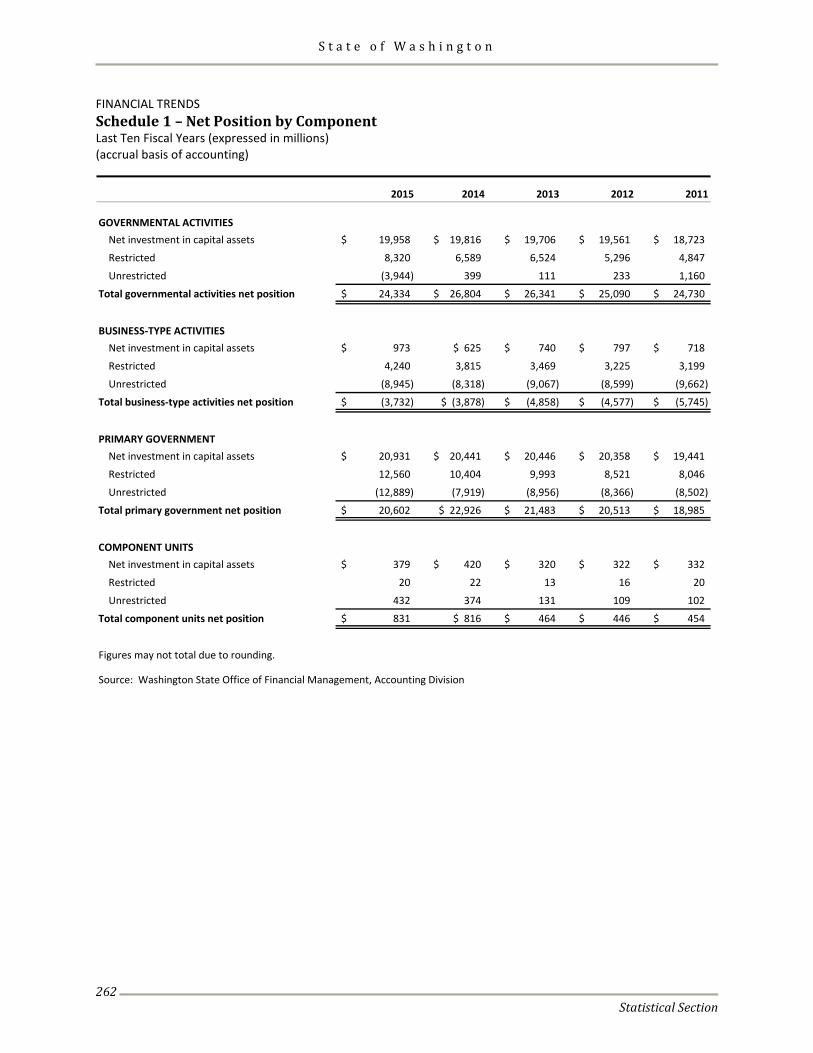
S t a t e o f W a s h i n g t o n
Statistical Section
262
FINANCIAL TRENDS Schedule 1 – Net Position by Component Last Ten Fiscal Years (expressed in millions) (accrual basis of accounting)
2015 2014 2013 2012 2011
GOVERNMENTAL ACTIVITIESNet investment in capital assets 19,958$ 19,816$ 19,706$ 19,561$ 18,723$
Restricted 8,320 6,589 6,524 5,296 4,847
Unrestricted (3,944) 399 111 233 1,160
Total governmental activities net position 24,334$ 26,804$ 26,341$ 25,090$ 24,730$
BUSINESS-TYPE ACTIVITIESNet investment in capital assets 973$ $ 625 740$ 797$ 718$
Restricted 4,240 3,815 3,469 3,225 3,199
Unrestricted (8,945) (8,318) (9,067) (8,599) (9,662)
Total business-type activities net position (3,732)$ $ (3,878) (4,858)$ (4,577)$ (5,745)$
PRIMARY GOVERNMENTNet investment in capital assets 20,931$ 20,441$ 20,446$ 20,358$ 19,441$
Restricted 12,560 10,404 9,993 8,521 8,046
Unrestricted (12,889) (7,919) (8,956) (8,366) (8,502)
Total primary government net position 20,602$ $ 22,926 21,483$ 20,513$ 18,985$
COMPONENT UNITSNet investment in capital assets 379$ 420$ 320$ 322$ 332$
Restricted 20 22 13 16 20
Unrestricted 432 374 131 109 102
Total component units net position 831$ $ 816 464$ 446$ 454$
Figures may not total due to rounding.
Source: Washington State Office of Financial Management, Accounting Division
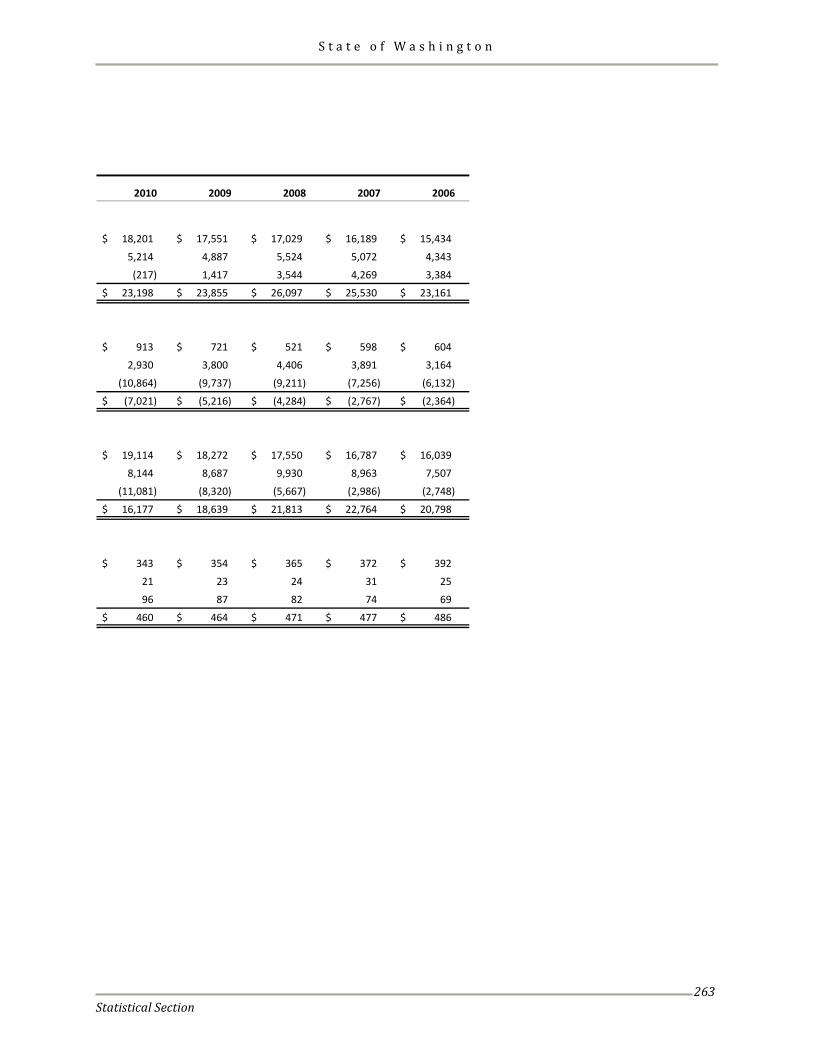
S t a t e o f W a s h i n g t o n
Statistical Section
263
2010 2009 2008 2007 2006
18,201$ 17,551$ 17,029$ 16,189$ 15,434$
5,214 4,887 5,524 5,072 4,343
(217) 1,417 3,544 4,269 3,384
23,198$ 23,855$ 26,097$ 25,530$ 23,161$
913$ 721$ 521$ 598$ 604$
2,930 3,800 4,406 3,891 3,164
(10,864) (9,737) (9,211) (7,256) (6,132)
(7,021)$ (5,216)$ (4,284)$ (2,767)$ (2,364)$
19,114$ 18,272$ 17,550$ 16,787$ 16,039$
8,144 8,687 9,930 8,963 7,507
(11,081) (8,320) (5,667) (2,986) (2,748)
16,177$ 18,639$ 21,813$ 22,764$ 20,798$
343$ 354$ 365$ 372$ 392$
21 23 24 31 25
96 87 82 74 69
460$ 464$ 471$ 477$ 486$
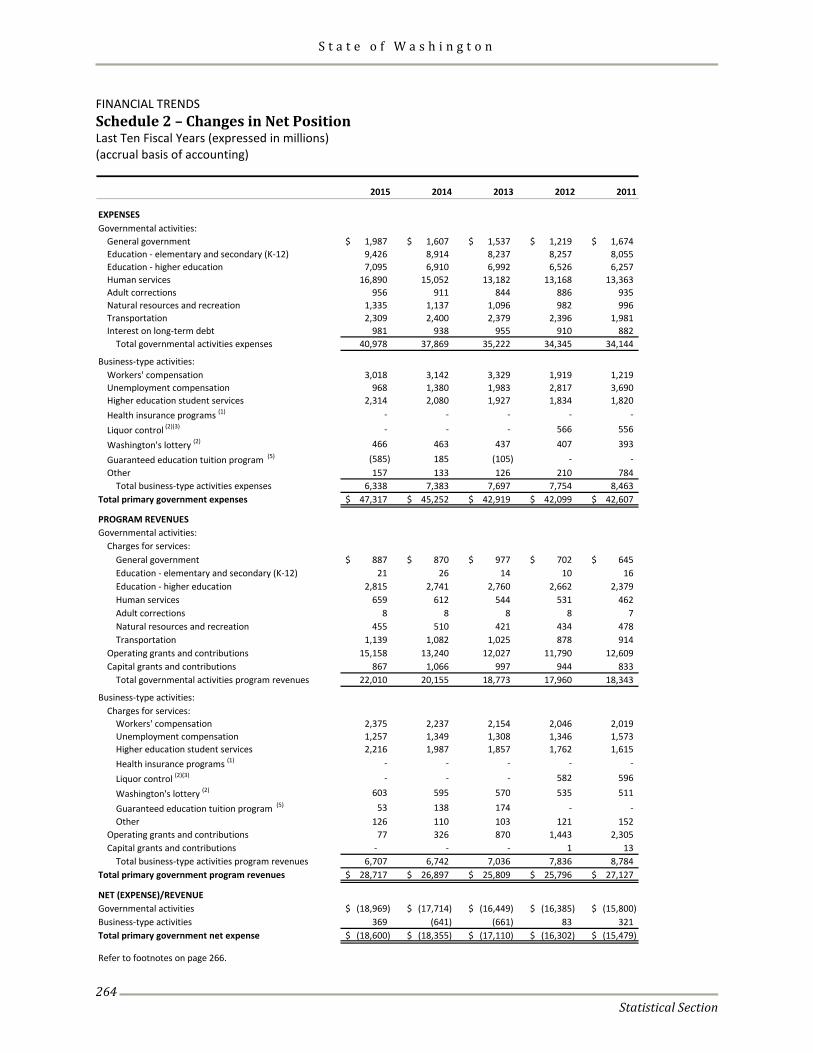
S t a t e o f W a s h i n g t o n
Statistical Section
264
FINANCIAL TRENDS Schedule 2 – Changes in Net Position Last Ten Fiscal Years (expressed in millions) (accrual basis of accounting)
2015 2014 2013 2012 2011
EXPENSESGovernmental activities:
General government 1,987$ 1,607$ 1,537$ 1,219$ 1,674$ Education - elementary and secondary (K-12) 9,426 8,914 8,237 8,257 8,055 Education - higher education 7,095 6,910 6,992 6,526 6,257 Human services 16,890 15,052 13,182 13,168 13,363 Adult corrections 956 911 844 886 935 Natural resources and recreation 1,335 1,137 1,096 982 996 Transportation 2,309 2,400 2,379 2,396 1,981 Interest on long-term debt 981 938 955 910 882
Total governmental activities expenses 40,978 37,869 35,222 34,345 34,144
Business-type activities:Workers' compensation 3,018 3,142 3,329 1,919 1,219 Unemployment compensation 968 1,380 1,983 2,817 3,690 Higher education student services 2,314 2,080 1,927 1,834 1,820 Health insurance programs (1) - - - - -
Liquor control (2)(3) - - - 566 556
Washington's lottery (2) 466 463 437 407 393
Guaranteed education tuition program (5) (585) 185 (105) - - Other 157 133 126 210 784
Total business-type activities expenses 6,338 7,383 7,697 7,754 8,463 Total primary government expenses 47,317$ 45,252$ 42,919$ 42,099$ 42,607$
PROGRAM REVENUESGovernmental activities:
Charges for services:General government 887$ 870$ 977$ 702$ 645$ Education - elementary and secondary (K-12) 21 26 14 10 16 Education - higher education 2,815 2,741 2,760 2,662 2,379 Human services 659 612 544 531 462 Adult corrections 8 8 8 8 7 Natural resources and recreation 455 510 421 434 478 Transportation 1,139 1,082 1,025 878 914
Operating grants and contributions 15,158 13,240 12,027 11,790 12,609 Capital grants and contributions 867 1,066 997 944 833
Total governmental activities program revenues 22,010 20,155 18,773 17,960 18,343
Business-type activities:Charges for services:
Workers' compensation 2,375 2,237 2,154 2,046 2,019 Unemployment compensation 1,257 1,349 1,308 1,346 1,573 Higher education student services 2,216 1,987 1,857 1,762 1,615 Health insurance programs (1) - - - - -
Liquor control (2)(3) - - - 582 596
Washington's lottery (2) 603 595 570 535 511
Guaranteed education tuition program (5) 53 138 174 - - Other 126 110 103 121 152
Operating grants and contributions 77 326 870 1,443 2,305 Capital grants and contributions - - - 1 13
Total business-type activities program revenues 6,707 6,742 7,036 7,836 8,784 Total primary government program revenues 28,717$ 26,897$ 25,809$ 25,796$ 27,127$
NET (EXPENSE)/REVENUEGovernmental activities (18,969)$ (17,714)$ (16,449)$ (16,385)$ (15,800)$ Business-type activities 369 (641) (661) 83 321 Total primary government net expense (18,600)$ (18,355)$ (17,110)$ (16,302)$ (15,479)$
Refer to footnotes on page 266.
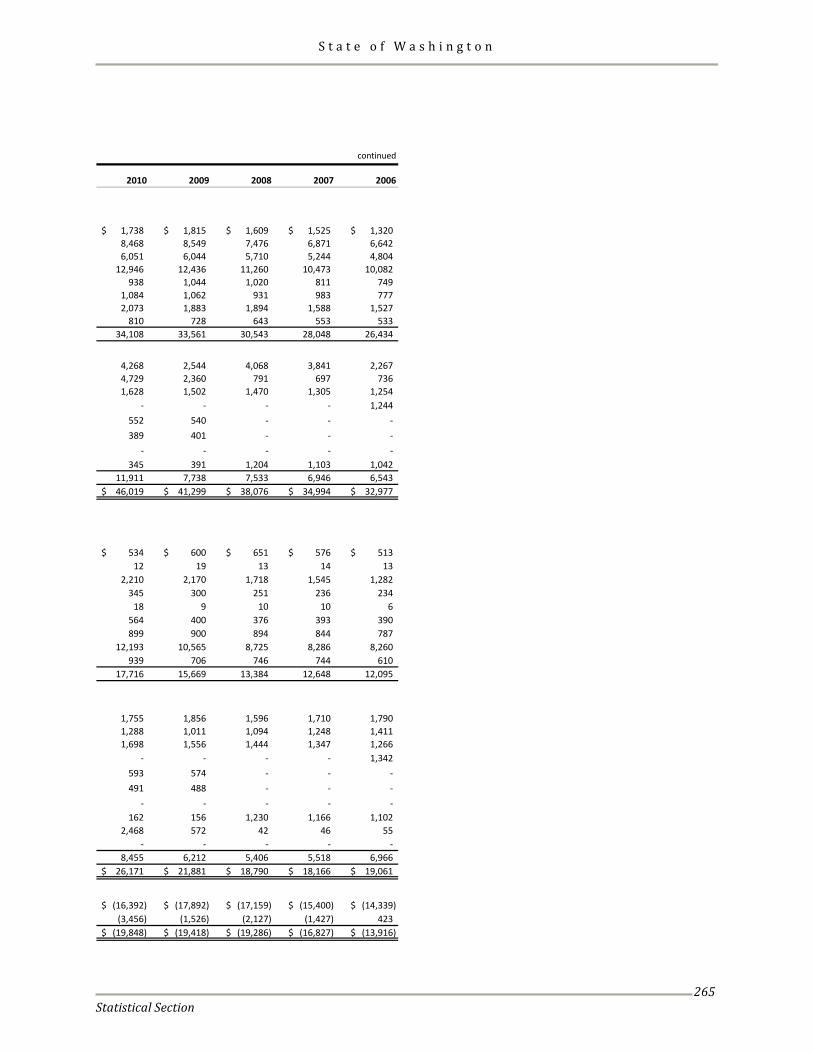
S t a t e o f W a s h i n g t o n
Statistical Section
265
continued
2010 2009 2008 2007 2006
1,738$ 1,815$ 1,609$ 1,525$ 1,320$ 8,468 8,549 7,476 6,871 6,642 6,051 6,044 5,710 5,244 4,804
12,946 12,436 11,260 10,473 10,082 938 1,044 1,020 811 749
1,084 1,062 931 983 777 2,073 1,883 1,894 1,588 1,527
810 728 643 553 533 34,108 33,561 30,543 28,048 26,434
4,268 2,544 4,068 3,841 2,267 4,729 2,360 791 697 736 1,628 1,502 1,470 1,305 1,254
- - - - 1,244 552 540 - - - 389 401 - - -
- - - - - 345 391 1,204 1,103 1,042
11,911 7,738 7,533 6,946 6,543 46,019$ 41,299$ 38,076$ 34,994$ 32,977$
534$ 600$ 651$ 576$ 513$ 12 19 13 14 13
2,210 2,170 1,718 1,545 1,282 345 300 251 236 234
18 9 10 10 6 564 400 376 393 390 899 900 894 844 787
12,193 10,565 8,725 8,286 8,260 939 706 746 744 610
17,716 15,669 13,384 12,648 12,095
1,755 1,856 1,596 1,710 1,790 1,288 1,011 1,094 1,248 1,411 1,698 1,556 1,444 1,347 1,266
- - - - 1,342 593 574 - - - 491 488 - - -
- - - - - 162 156 1,230 1,166 1,102
2,468 572 42 46 55 - - - - -
8,455 6,212 5,406 5,518 6,966 26,171$ 21,881$ 18,790$ 18,166$ 19,061$
(16,392)$ (17,892)$ (17,159)$ (15,400)$ (14,339)$ (3,456) (1,526) (2,127) (1,427) 423
(19,848)$ (19,418)$ (19,286)$ (16,827)$ (13,916)$
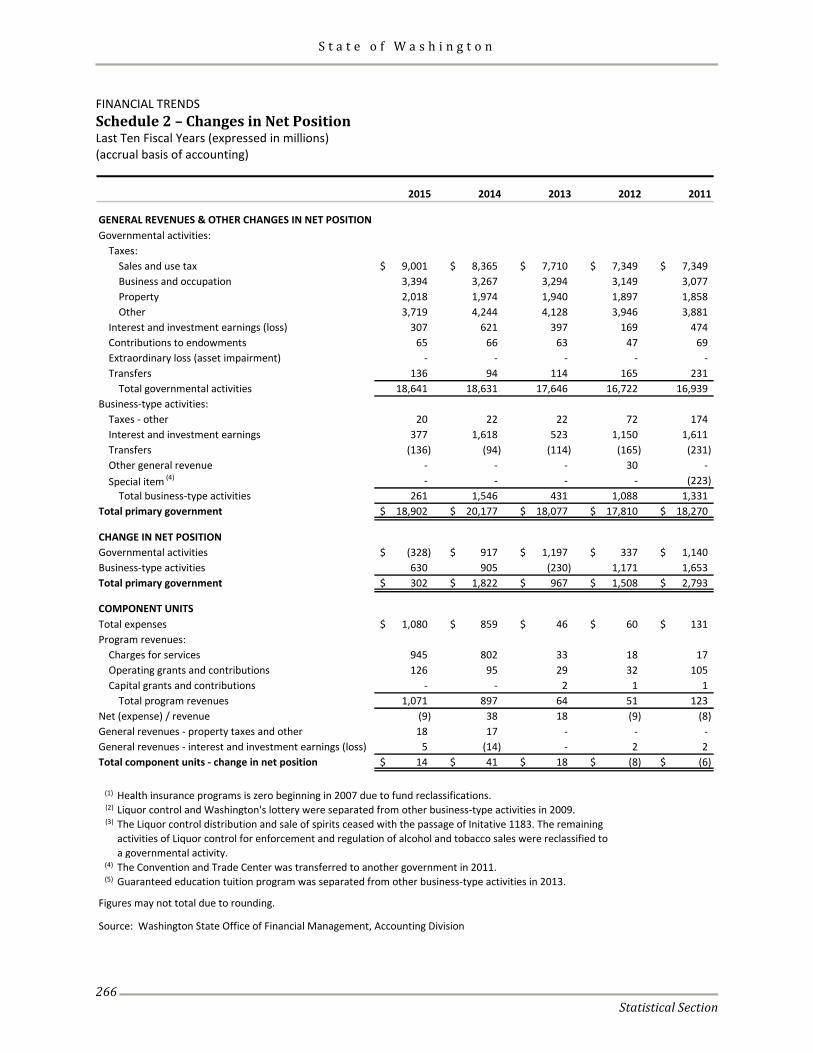
S t a t e o f W a s h i n g t o n
Statistical Section
266
FINANCIAL TRENDS Schedule 2 – Changes in Net Position Last Ten Fiscal Years (expressed in millions) (accrual basis of accounting)
2015 2014 2013 2012 2011
GENERAL REVENUES & OTHER CHANGES IN NET POSITIONGovernmental activities:
Taxes:Sales and use tax 9,001$ 8,365$ 7,710$ 7,349$ 7,349$ Business and occupation 3,394 3,267 3,294 3,149 3,077 Property 2,018 1,974 1,940 1,897 1,858 Other 3,719 4,244 4,128 3,946 3,881
Interest and investment earnings (loss) 307 621 397 169 474 Contributions to endowments 65 66 63 47 69 Extraordinary loss (asset impairment) - - - - - Transfers 136 94 114 165 231
Total governmental activities 18,641 18,631 17,646 16,722 16,939 Business-type activities:
Taxes - other 20 22 22 72 174 Interest and investment earnings 377 1,618 523 1,150 1,611 Transfers (136) (94) (114) (165) (231) Other general revenue - - - 30 - Special item (4) - - - - (223)
Total business-type activities 261 1,546 431 1,088 1,331 Total primary government 18,902$ 20,177$ 18,077$ 17,810$ 18,270$
CHANGE IN NET POSITIONGovernmental activities (328)$ 917$ 1,197$ 337$ 1,140$ Business-type activities 630 905 (230) 1,171 1,653 Total primary government 302$ 1,822$ 967$ 1,508$ 2,793$
COMPONENT UNITSTotal expenses 1,080$ 859$ 46$ 60$ 131$ Program revenues:
Charges for services 945 802 33 18 17 Operating grants and contributions 126 95 29 32 105 Capital grants and contributions - - 2 1 1
Total program revenues 1,071 897 64 51 123 Net (expense) / revenue (9) 38 18 (9) (8) General revenues - property taxes and other 18 17 - - - General revenues - interest and investment earnings (loss) 5 (14) - 2 2 Total component units - change in net position 14$ 41$ 18$ (8)$ (6)$
(1) Health insurance programs is zero beginning in 2007 due to fund reclassifications.(2) Liquor control and Washington's lottery were separated from other business-type activities in 2009.(3) The Liquor control distribution and sale of spirits ceased with the passage of Initative 1183. The remaining
activities of Liquor control for enforcement and regulation of alcohol and tobacco sales were reclassified to a governmental activity.
(4) The Convention and Trade Center was transferred to another government in 2011.(5) Guaranteed education tuition program was separated from other business-type activities in 2013.
Figures may not total due to rounding.
Source: Washington State Office of Financial Management, Accounting Division
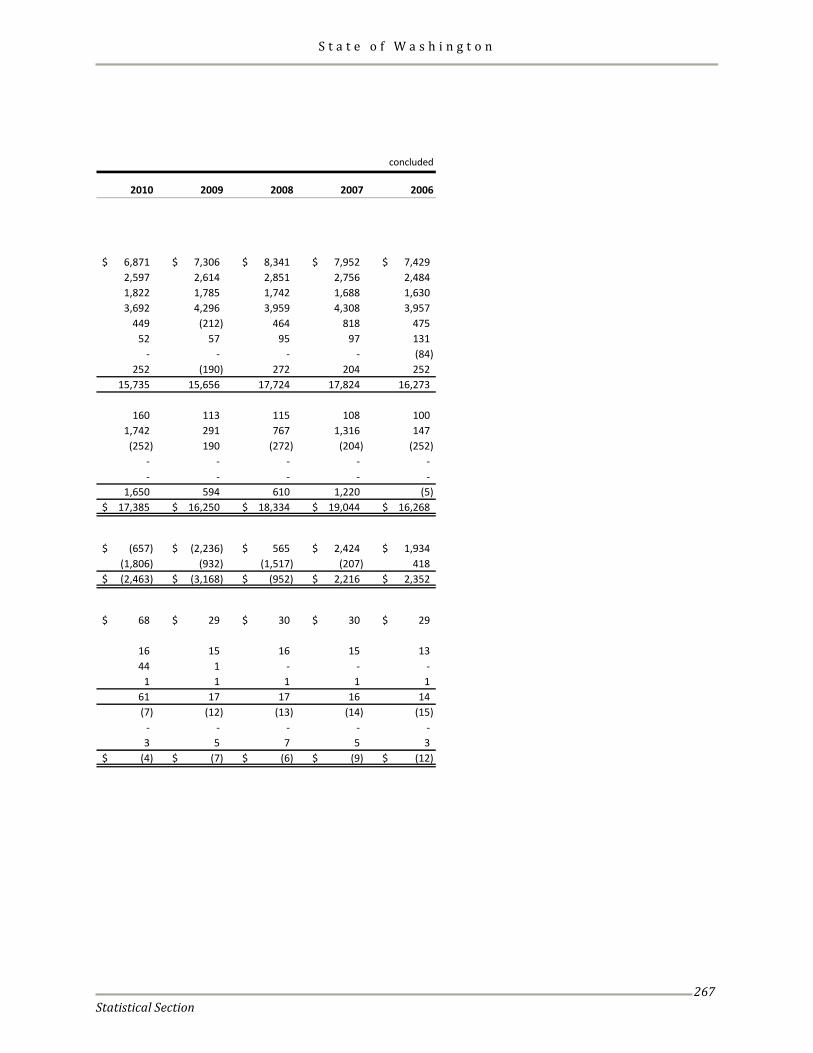
S t a t e o f W a s h i n g t o n
Statistical Section
267
concluded
2010 2009 2008 2007 2006
6,871$ 7,306$ 8,341$ 7,952$ 7,429$ 2,597 2,614 2,851 2,756 2,484 1,822 1,785 1,742 1,688 1,630 3,692 4,296 3,959 4,308 3,957
449 (212) 464 818 475 52 57 95 97 131
- - - - (84) 252 (190) 272 204 252
15,735 15,656 17,724 17,824 16,273
160 113 115 108 100 1,742 291 767 1,316 147 (252) 190 (272) (204) (252)
- - - - - - - - - -
1,650 594 610 1,220 (5) 17,385$ 16,250$ 18,334$ 19,044$ 16,268$
(657)$ (2,236)$ 565$ 2,424$ 1,934$ (1,806) (932) (1,517) (207) 418 (2,463)$ (3,168)$ (952)$ 2,216$ 2,352$
68$ 29$ 30$ 30$ 29$
16 15 16 15 13 44 1 - - -
1 1 1 1 1 61 17 17 16 14 (7) (12) (13) (14) (15)
- - - - - 3 5 7 5 3
(4)$ (7)$ (6)$ (9)$ (12)$
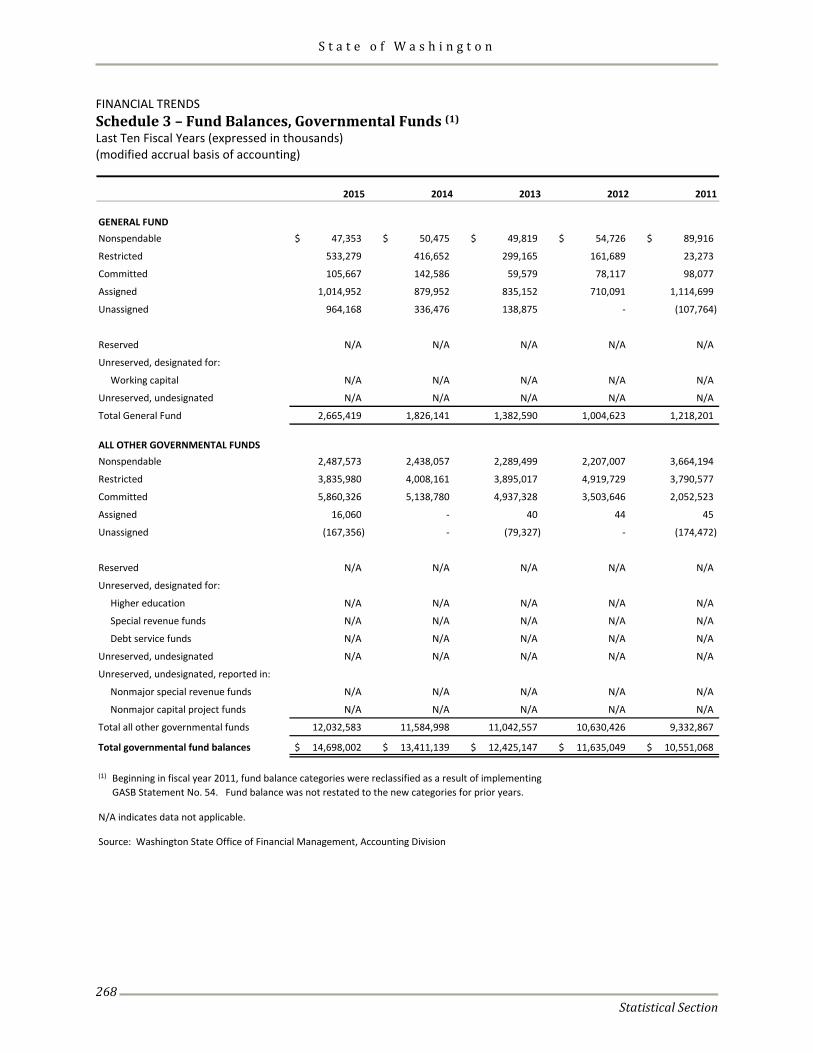
S t a t e o f W a s h i n g t o n
Statistical Section
268
FINANCIAL TRENDS Schedule 3 – Fund Balances, Governmental Funds (1) Last Ten Fiscal Years (expressed in thousands) (modified accrual basis of accounting)
2015 2014 2013 2012 2011
GENERAL FUNDNonspendable 47,353$ 50,475$ 49,819$ 54,726$ 89,916$
Restricted 533,279 416,652 299,165 161,689 23,273
Committed 105,667 142,586 59,579 78,117 98,077
Assigned 1,014,952 879,952 835,152 710,091 1,114,699
Unassigned 964,168 336,476 138,875 - (107,764)
Reserved N/A N/A N/A N/A N/A
Unreserved, designated for:
Working capital N/A N/A N/A N/A N/A
Unreserved, undesignated N/A N/A N/A N/A N/A
Total General Fund 2,665,419 1,826,141 1,382,590 1,004,623 1,218,201
ALL OTHER GOVERNMENTAL FUNDSNonspendable 2,487,573 2,438,057 2,289,499 2,207,007 3,664,194
Restricted 3,835,980 4,008,161 3,895,017 4,919,729 3,790,577
Committed 5,860,326 5,138,780 4,937,328 3,503,646 2,052,523
Assigned 16,060 - 40 44 45
Unassigned (167,356) - (79,327) - (174,472)
Reserved N/A N/A N/A N/A N/A
Unreserved, designated for:
Higher education N/A N/A N/A N/A N/A
Special revenue funds N/A N/A N/A N/A N/A
Debt service funds N/A N/A N/A N/A N/A
Unreserved, undesignated N/A N/A N/A N/A N/A
Unreserved, undesignated, reported in:
Nonmajor special revenue funds N/A N/A N/A N/A N/A
Nonmajor capital project funds N/A N/A N/A N/A N/A
Total all other governmental funds 12,032,583 11,584,998 11,042,557 10,630,426 9,332,867
Total governmental fund balances 14,698,002$ 13,411,139$ 12,425,147$ 11,635,049$ 10,551,068$
(1) Beginning in fiscal year 2011, fund balance categories were reclassified as a result of implementingGASB Statement No. 54. Fund balance was not restated to the new categories for prior years.
N/A indicates data not applicable.
Source: Washington State Office of Financial Management, Accounting Division
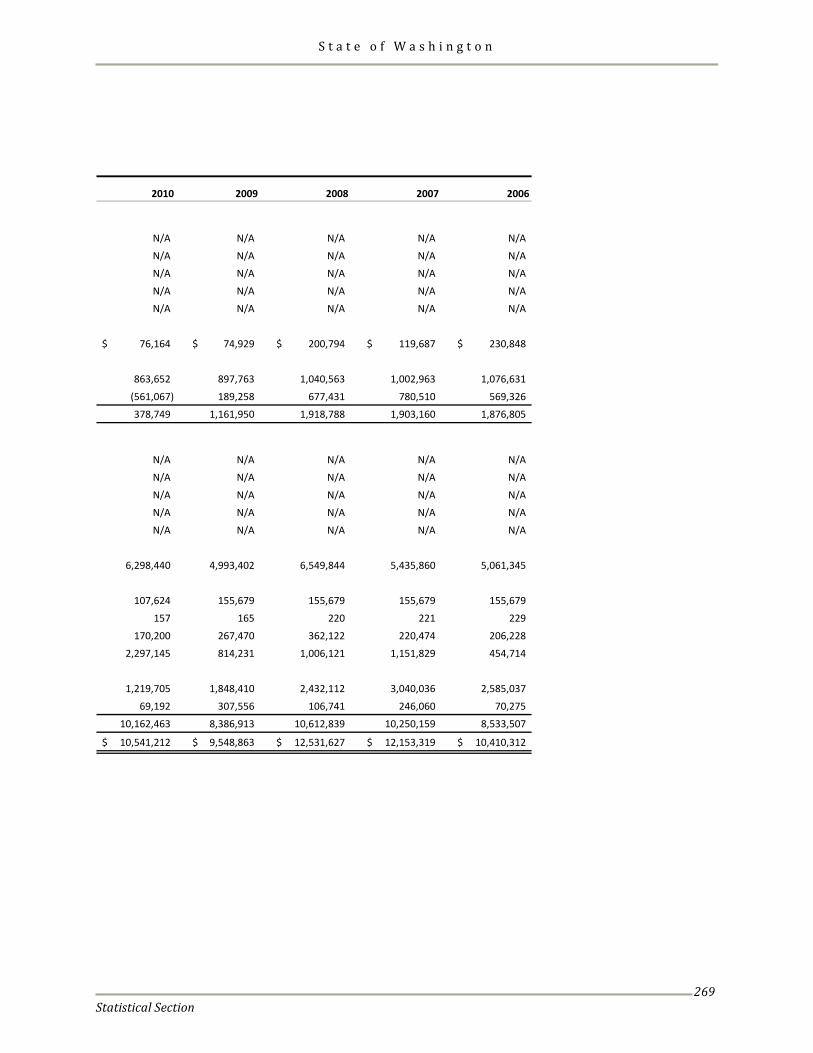
S t a t e o f W a s h i n g t o n
Statistical Section
269
2010 2009 2008 2007 2006
N/A N/A N/A N/A N/A
N/A N/A N/A N/A N/A
N/A N/A N/A N/A N/A
N/A N/A N/A N/A N/A
N/A N/A N/A N/A N/A
76,164$ 74,929$ 200,794$ 119,687$ 230,848$
863,652 897,763 1,040,563 1,002,963 1,076,631
(561,067) 189,258 677,431 780,510 569,326
378,749 1,161,950 1,918,788 1,903,160 1,876,805
N/A N/A N/A N/A N/A
N/A N/A N/A N/A N/A
N/A N/A N/A N/A N/A
N/A N/A N/A N/A N/A
N/A N/A N/A N/A N/A
6,298,440 4,993,402 6,549,844 5,435,860 5,061,345
107,624 155,679 155,679 155,679 155,679
157 165 220 221 229
170,200 267,470 362,122 220,474 206,228
2,297,145 814,231 1,006,121 1,151,829 454,714
1,219,705 1,848,410 2,432,112 3,040,036 2,585,037
69,192 307,556 106,741 246,060 70,275
10,162,463 8,386,913 10,612,839 10,250,159 8,533,507
10,541,212$ 9,548,863$ 12,531,627$ 12,153,319$ 10,410,312$
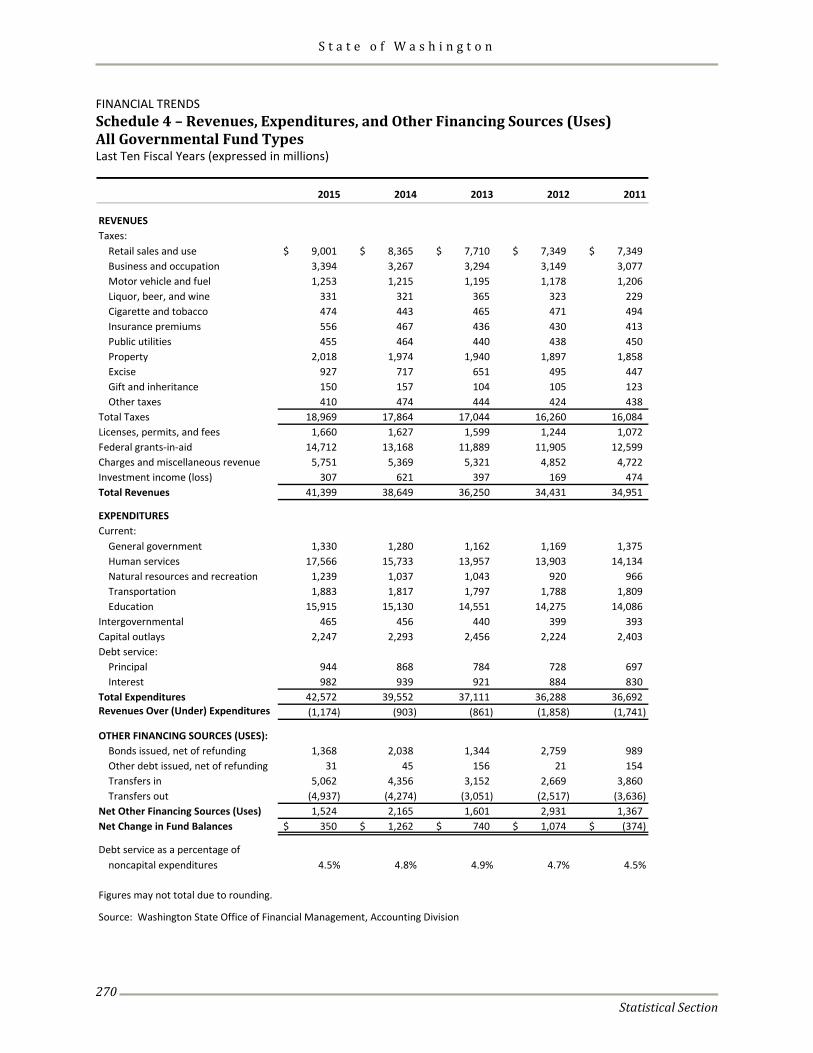
S t a t e o f W a s h i n g t o n
Statistical Section
270
FINANCIAL TRENDS Schedule 4 – Revenues, Expenditures, and Other Financing Sources (Uses) All Governmental Fund Types Last Ten Fiscal Years (expressed in millions)
2015 2014 2013 2012 2011
REVENUESTaxes:
Retail sales and use 9,001$ 8,365$ 7,710$ 7,349$ 7,349$ Business and occupation 3,394 3,267 3,294 3,149 3,077 Motor vehicle and fuel 1,253 1,215 1,195 1,178 1,206 Liquor, beer, and wine 331 321 365 323 229 Cigarette and tobacco 474 443 465 471 494 Insurance premiums 556 467 436 430 413 Public utilities 455 464 440 438 450 Property 2,018 1,974 1,940 1,897 1,858 Excise 927 717 651 495 447 Gift and inheritance 150 157 104 105 123 Other taxes 410 474 444 424 438
Total Taxes 18,969 17,864 17,044 16,260 16,084 Licenses, permits, and fees 1,660 1,627 1,599 1,244 1,072 Federal grants-in-aid 14,712 13,168 11,889 11,905 12,599 Charges and miscellaneous revenue 5,751 5,369 5,321 4,852 4,722 Investment income (loss) 307 621 397 169 474 Total Revenues 41,399 38,649 36,250 34,431 34,951
EXPENDITURESCurrent:
General government 1,330 1,280 1,162 1,169 1,375 Human services 17,566 15,733 13,957 13,903 14,134 Natural resources and recreation 1,239 1,037 1,043 920 966 Transportation 1,883 1,817 1,797 1,788 1,809 Education 15,915 15,130 14,551 14,275 14,086
Intergovernmental 465 456 440 399 393 Capital outlays 2,247 2,293 2,456 2,224 2,403 Debt service:
Principal 944 868 784 728 697 Interest 982 939 921 884 830
Total Expenditures 42,572 39,552 37,111 36,288 36,692 Revenues Over (Under) Expenditures (1,174) (903) (861) (1,858) (1,741)
OTHER FINANCING SOURCES (USES):Bonds issued, net of refunding 1,368 2,038 1,344 2,759 989 Other debt issued, net of refunding 31 45 156 21 154 Transfers in 5,062 4,356 3,152 2,669 3,860 Transfers out (4,937) (4,274) (3,051) (2,517) (3,636)
Net Other Financing Sources (Uses) 1,524 2,165 1,601 2,931 1,367 Net Change in Fund Balances 350$ 1,262$ 740$ 1,074$ (374)$
Debt service as a percentage ofnoncapital expenditures 4.5% 4.8% 4.9% 4.7% 4.5%
Figures may not total due to rounding.
Source: Washington State Office of Financial Management, Accounting Division
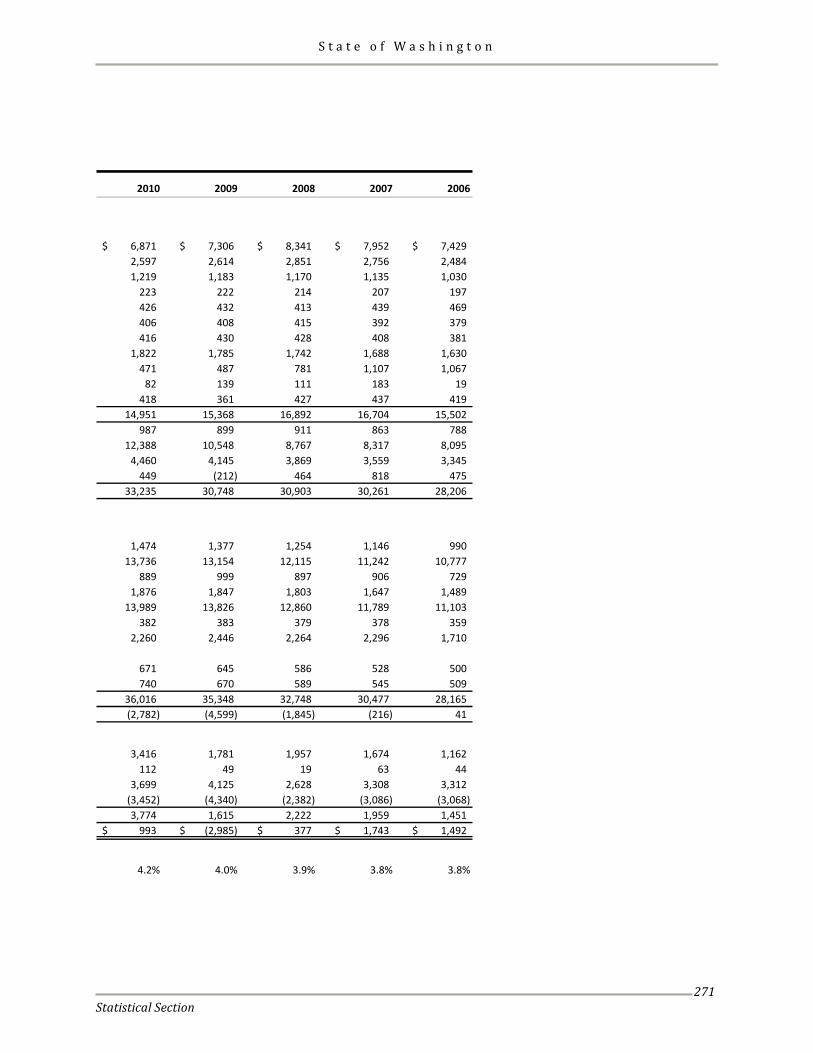
S t a t e o f W a s h i n g t o n
Statistical Section
271
2010 2009 2008 2007 2006
6,871$ 7,306$ 8,341$ 7,952$ 7,429$ 2,597 2,614 2,851 2,756 2,484 1,219 1,183 1,170 1,135 1,030
223 222 214 207 197 426 432 413 439 469 406 408 415 392 379 416 430 428 408 381
1,822 1,785 1,742 1,688 1,630 471 487 781 1,107 1,067
82 139 111 183 19 418 361 427 437 419
14,951 15,368 16,892 16,704 15,502 987 899 911 863 788
12,388 10,548 8,767 8,317 8,095 4,460 4,145 3,869 3,559 3,345
449 (212) 464 818 475 33,235 30,748 30,903 30,261 28,206
1,474 1,377 1,254 1,146 990 13,736 13,154 12,115 11,242 10,777
889 999 897 906 729 1,876 1,847 1,803 1,647 1,489
13,989 13,826 12,860 11,789 11,103 382 383 379 378 359
2,260 2,446 2,264 2,296 1,710
671 645 586 528 500 740 670 589 545 509
36,016 35,348 32,748 30,477 28,165 (2,782) (4,599) (1,845) (216) 41
3,416 1,781 1,957 1,674 1,162 112 49 19 63 44
3,699 4,125 2,628 3,308 3,312 (3,452) (4,340) (2,382) (3,086) (3,068) 3,774 1,615 2,222 1,959 1,451
993$ (2,985)$ 377$ 1,743$ 1,492$
4.2% 4.0% 3.9% 3.8% 3.8%
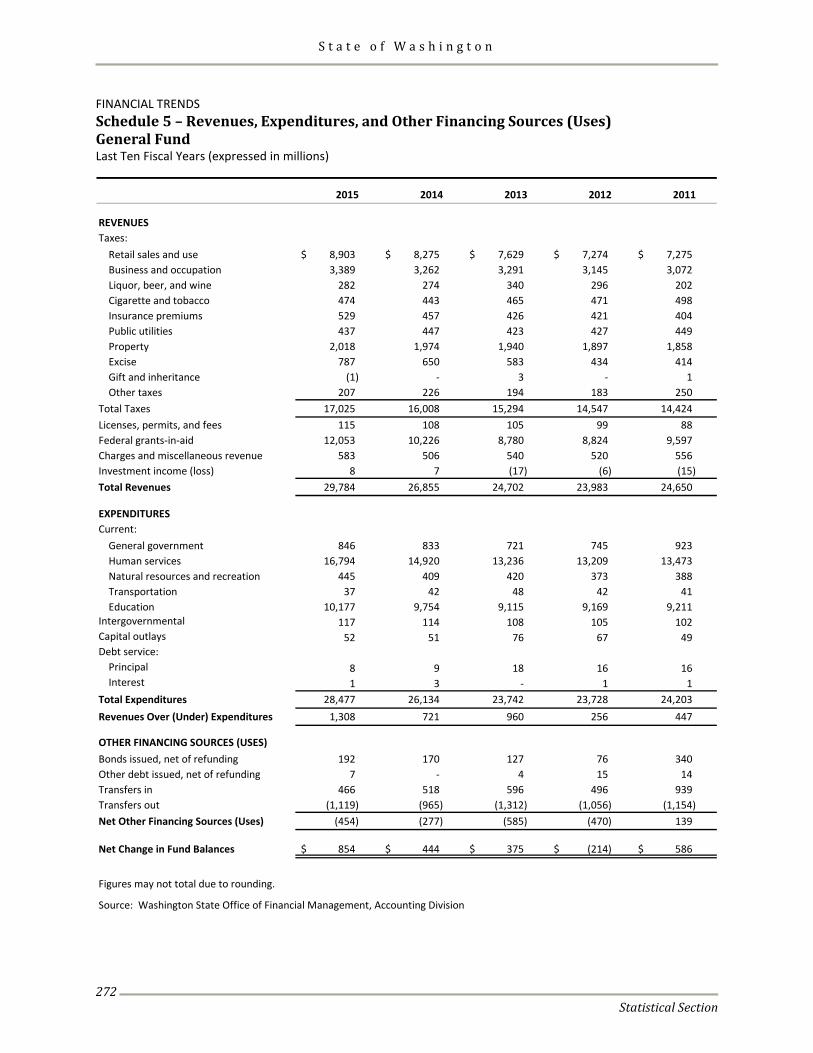
S t a t e o f W a s h i n g t o n
Statistical Section
272
FINANCIAL TRENDS Schedule 5 – Revenues, Expenditures, and Other Financing Sources (Uses) General Fund Last Ten Fiscal Years (expressed in millions)
2015 2014 2013 2012 2011
REVENUESTaxes:
Retail sales and use 8,903$ 8,275$ 7,629$ 7,274$ 7,275$ Business and occupation 3,389 3,262 3,291 3,145 3,072 Liquor, beer, and wine 282 274 340 296 202 Cigarette and tobacco 474 443 465 471 498 Insurance premiums 529 457 426 421 404 Public utilities 437 447 423 427 449 Property 2,018 1,974 1,940 1,897 1,858 Excise 787 650 583 434 414 Gift and inheritance (1) - 3 - 1 Other taxes 207 226 194 183 250
Total Taxes 17,025 16,008 15,294 14,547 14,424 Licenses, permits, and fees 115 108 105 99 88 Federal grants-in-aid 12,053 10,226 8,780 8,824 9,597 Charges and miscellaneous revenue 583 506 540 520 556 Investment income (loss) 8 7 (17) (6) (15) Total Revenues 29,784 26,855 24,702 23,983 24,650
EXPENDITURESCurrent:
General government 846 833 721 745 923 Human services 16,794 14,920 13,236 13,209 13,473 Natural resources and recreation 445 409 420 373 388 Transportation 37 42 48 42 41 Education 10,177 9,754 9,115 9,169 9,211
Intergovernmental 117 114 108 105 102 Capital outlays 52 51 76 67 49 Debt service:
Principal 8 9 18 16 16 Interest 1 3 - 1 1
Total Expenditures 28,477 26,134 23,742 23,728 24,203 Revenues Over (Under) Expenditures 1,308 721 960 256 447
OTHER FINANCING SOURCES (USES)Bonds issued, net of refunding 192 170 127 76 340 Other debt issued, net of refunding 7 - 4 15 14 Transfers in 466 518 596 496 939 Transfers out (1,119) (965) (1,312) (1,056) (1,154) Net Other Financing Sources (Uses) (454) (277) (585) (470) 139
Net Change in Fund Balances 854$ 444$ 375$ (214)$ 586$
Figures may not total due to rounding.
Source: Washington State Office of Financial Management, Accounting Division
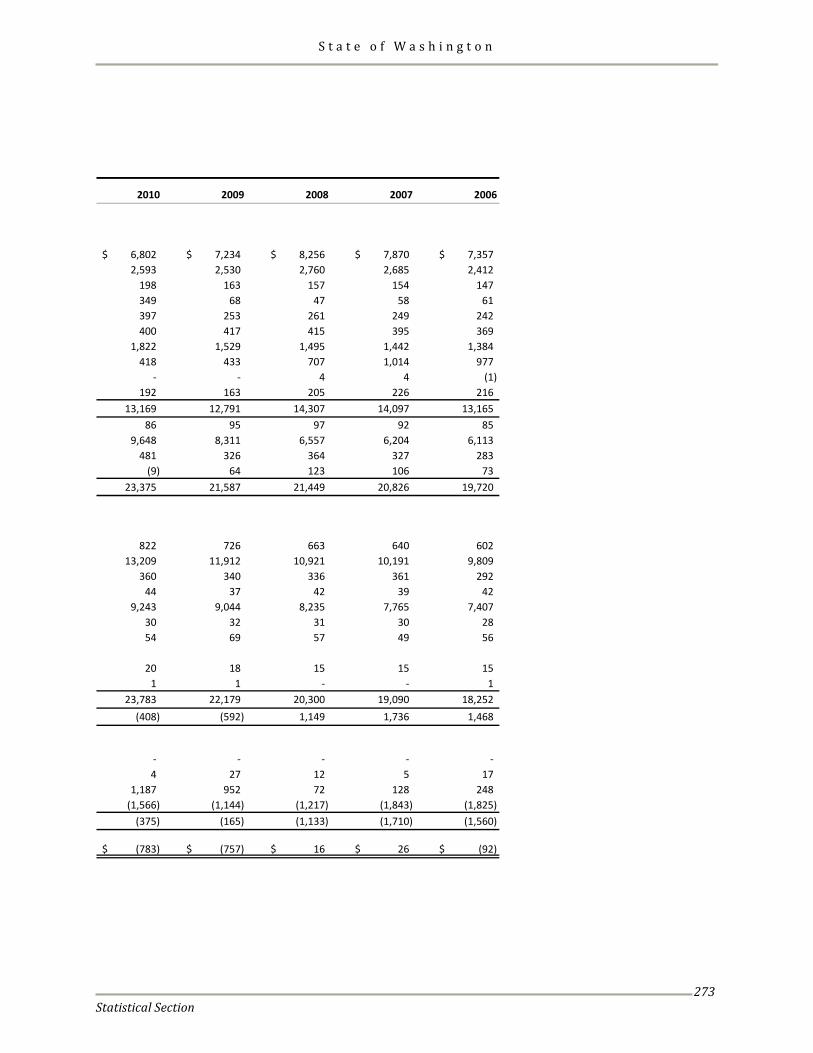
S t a t e o f W a s h i n g t o n
Statistical Section
273
2010 2009 2008 2007 2006
6,802$ 7,234$ 8,256$ 7,870$ 7,357$ 2,593 2,530 2,760 2,685 2,412
198 163 157 154 147 349 68 47 58 61 397 253 261 249 242 400 417 415 395 369
1,822 1,529 1,495 1,442 1,384 418 433 707 1,014 977
- - 4 4 (1) 192 163 205 226 216
13,169 12,791 14,307 14,097 13,165 86 95 97 92 85
9,648 8,311 6,557 6,204 6,113 481 326 364 327 283
(9) 64 123 106 73 23,375 21,587 21,449 20,826 19,720
822 726 663 640 602 13,209 11,912 10,921 10,191 9,809
360 340 336 361 292 44 37 42 39 42
9,243 9,044 8,235 7,765 7,407 30 32 31 30 28 54 69 57 49 56
20 18 15 15 15 1 1 - - 1
23,783 22,179 20,300 19,090 18,252 (408) (592) 1,149 1,736 1,468
- - - - - 4 27 12 5 17
1,187 952 72 128 248 (1,566) (1,144) (1,217) (1,843) (1,825)
(375) (165) (1,133) (1,710) (1,560)
(783)$ (757)$ 16$ 26$ (92)$
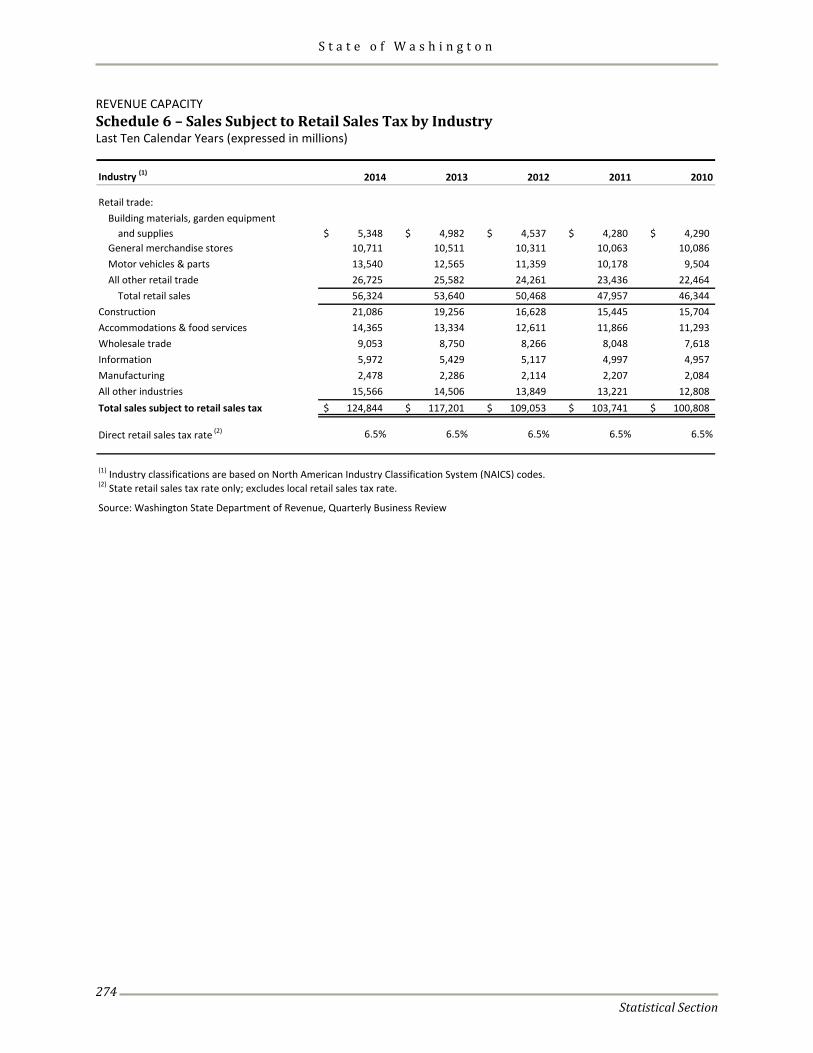
S t a t e o f W a s h i n g t o n
Statistical Section
274
REVENUE CAPACITY Schedule 6 – Sales Subject to Retail Sales Tax by Industry Last Ten Calendar Years (expressed in millions)
Industry (1) 2014 2013 2012 2011 2010
Retail trade:Building materials, garden equipment
and supplies 5,348$ 4,982$ 4,537$ 4,280$ 4,290$ General merchandise stores 10,711 10,511 10,311 10,063 10,086 Motor vehicles & parts 13,540 12,565 11,359 10,178 9,504 All other retail trade 26,725 25,582 24,261 23,436 22,464
Total retail sales 56,324 53,640 50,468 47,957 46,344 Construction 21,086 19,256 16,628 15,445 15,704 Accommodations & food services 14,365 13,334 12,611 11,866 11,293 Wholesale trade 9,053 8,750 8,266 8,048 7,618 Information 5,972 5,429 5,117 4,997 4,957 Manufacturing 2,478 2,286 2,114 2,207 2,084 All other industries 15,566 14,506 13,849 13,221 12,808 Total sales subject to retail sales tax 124,844$ 117,201$ 109,053$ 103,741$ 100,808$
Direct retail sales tax rate (2) 6.5% 6.5% 6.5% 6.5% 6.5%
(1) Industry classifications are based on North American Industry Classification System (NAICS) codes.(2) State retail sales tax rate only; excludes local retail sales tax rate.
Source: Washington State Department of Revenue, Quarterly Business Review
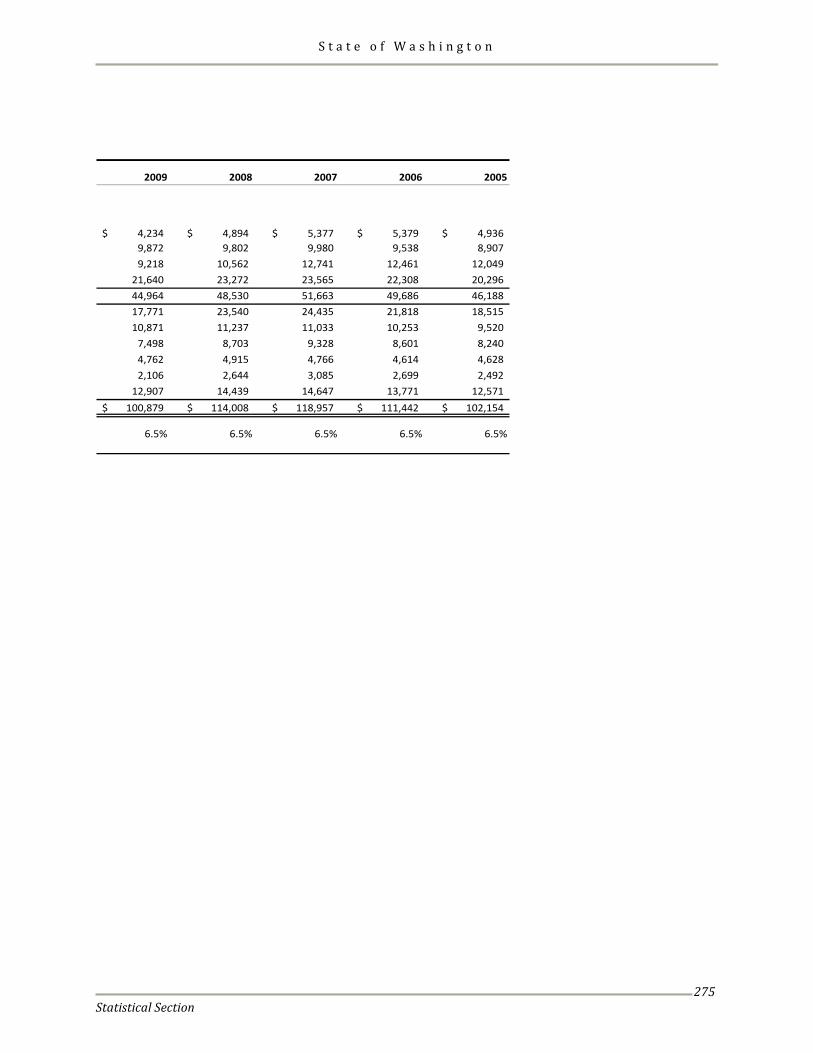
S t a t e o f W a s h i n g t o n
Statistical Section
275
2009 2008 2007 2006 2005
4,234$ 4,894$ 5,377$ 5,379$ 4,936$ 9,872 9,802 9,980 9,538 8,907 9,218 10,562 12,741 12,461 12,049
21,640 23,272 23,565 22,308 20,296 44,964 48,530 51,663 49,686 46,188 17,771 23,540 24,435 21,818 18,515 10,871 11,237 11,033 10,253 9,520
7,498 8,703 9,328 8,601 8,240 4,762 4,915 4,766 4,614 4,628 2,106 2,644 3,085 2,699 2,492
12,907 14,439 14,647 13,771 12,571 100,879$ 114,008$ 118,957$ 111,442$ 102,154$
6.5% 6.5% 6.5% 6.5% 6.5%
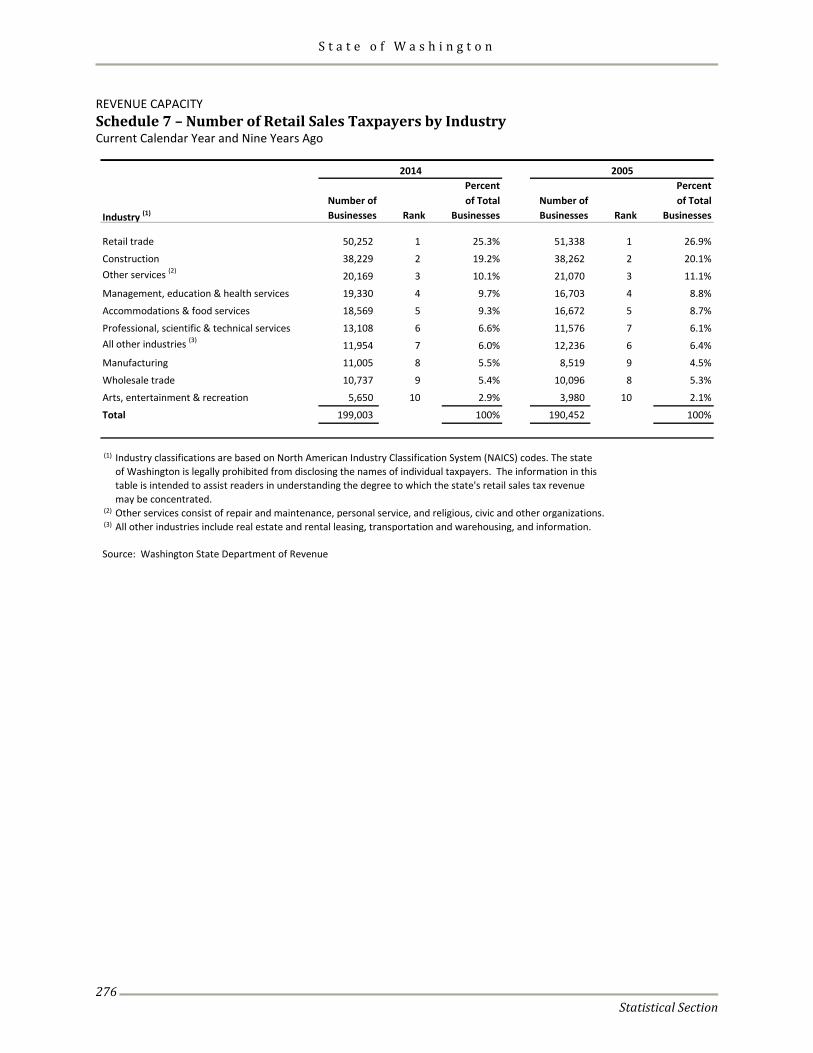
S t a t e o f W a s h i n g t o n
Statistical Section
276
REVENUE CAPACITY Schedule 7 – Number of Retail Sales Taxpayers by Industry Current Calendar Year and Nine Years Ago
Percent PercentNumber of of Total Number of of Total
Industry (1) Businesses Rank Businesses Businesses Rank Businesses
Retail trade 50,252 1 25.3% 51,338 1 26.9%
Construction 38,229 2 19.2% 38,262 2 20.1%Other services (2) 20,169 3 10.1% 21,070 3 11.1%
Management, education & health services 19,330 4 9.7% 16,703 4 8.8%
Accommodations & food services 18,569 5 9.3% 16,672 5 8.7%
Professional, scientific & technical services 13,108 6 6.6% 11,576 7 6.1%All other industries (3) 11,954 7 6.0% 12,236 6 6.4%
Manufacturing 11,005 8 5.5% 8,519 9 4.5%
Wholesale trade 10,737 9 5.4% 10,096 8 5.3%
Arts, entertainment & recreation 5,650 10 2.9% 3,980 10 2.1%
Total 199,003 100% 190,452 100%
(1)
of Washington is legally prohibited from disclosing the names of individual taxpayers. The information in this table is intended to assist readers in understanding the degree to which the state's retail sales tax revenuemay be concentrated.
(2) Other services consist of repair and maintenance, personal service, and religious, civic and other organizations.(3) All other industries include real estate and rental leasing, transportation and warehousing, and information.
Source: Washington State Department of Revenue
2005
Industry classifications are based on North American Industry Classification System (NAICS) codes. The state
2014
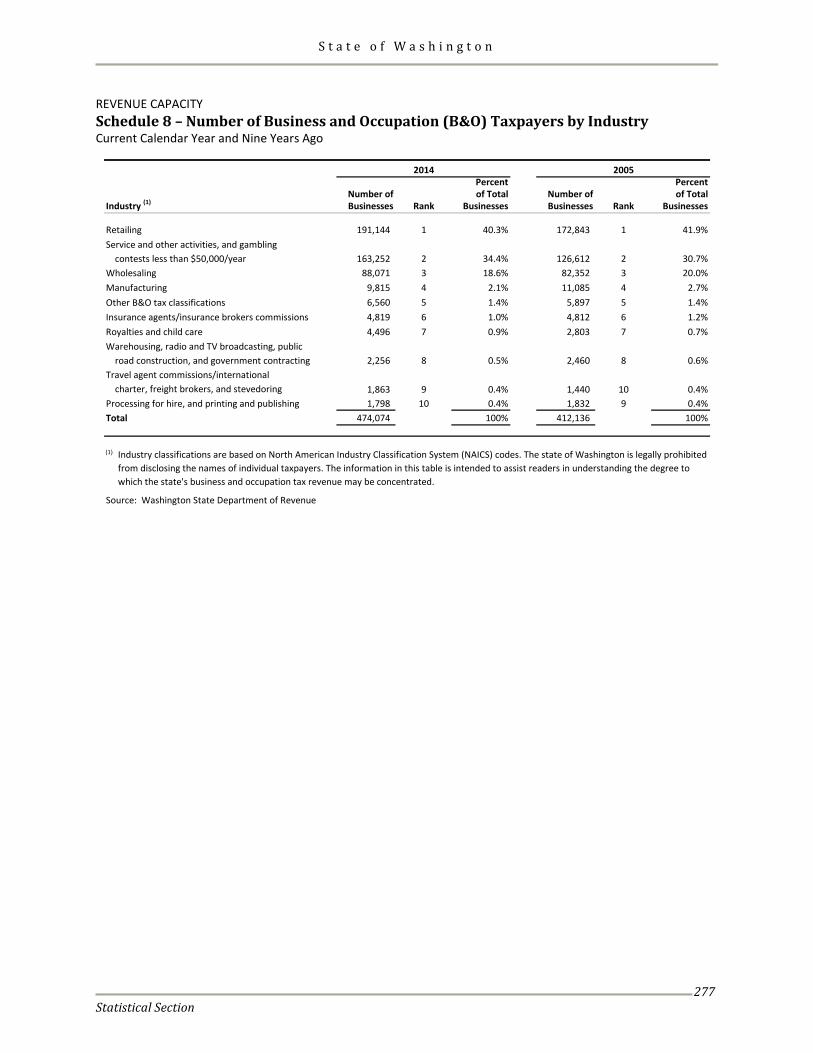
S t a t e o f W a s h i n g t o n
Statistical Section
277
REVENUE CAPACITY Schedule 8 – Number of Business and Occupation (B&O) Taxpayers by Industry Current Calendar Year and Nine Years Ago
Percent PercentNumber of of Total Number of of TotalBusinesses Rank Businesses Businesses Rank Businesses
Retailing 191,144 1 40.3% 172,843 1 41.9%Service and other activities, and gambling
contests less than $50,000/year 163,252 2 34.4% 126,612 2 30.7%Wholesaling 88,071 3 18.6% 82,352 3 20.0%Manufacturing 9,815 4 2.1% 11,085 4 2.7%Other B&O tax classifications 6,560 5 1.4% 5,897 5 1.4%Insurance agents/insurance brokers commissions 4,819 6 1.0% 4,812 6 1.2%Royalties and child care 4,496 7 0.9% 2,803 7 0.7%Warehousing, radio and TV broadcasting, public
road construction, and government contracting 2,256 8 0.5% 2,460 8 0.6%Travel agent commissions/international
charter, freight brokers, and stevedoring 1,863 9 0.4% 1,440 10 0.4%Processing for hire, and printing and publishing 1,798 10 0.4% 1,832 9 0.4%Total 474,074 100% 412,136 100%
(1)
Source: Washington State Department of Revenue
2005
Industry classifications are based on North American Industry Classification System (NAICS) codes. The state of Washington is legally prohibited from disclosing the names of individual taxpayers. The information in this table is intended to assist readers in understanding the degree to which the state's business and occupation tax revenue may be concentrated.
Industry (1)
2014
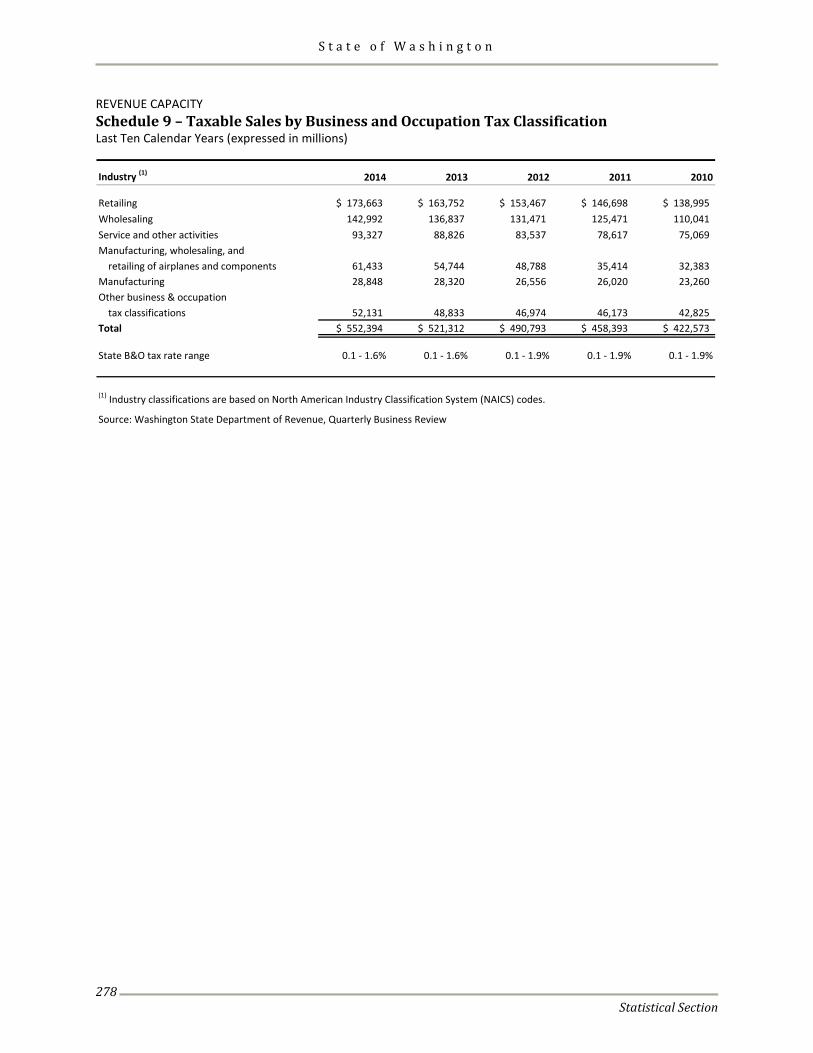
S t a t e o f W a s h i n g t o n
Statistical Section
278
REVENUE CAPACITY Schedule 9 – Taxable Sales by Business and Occupation Tax Classification Last Ten Calendar Years (expressed in millions)
Industry (1) 2014 2013 2012 2011 2010
Retailing $ 173,663 $ 163,752 $ 153,467 $ 146,698 $ 138,995Wholesaling 142,992 136,837 131,471 125,471 110,041 Service and other activities 93,327 88,826 83,537 78,617 75,069 Manufacturing, wholesaling, and
retailing of airplanes and components 61,433 54,744 48,788 35,414 32,383 Manufacturing 28,848 28,320 26,556 26,020 23,260 Other business & occupation
tax classifications 52,131 48,833 46,974 46,173 42,825 Total $ 552,394 $ 521,312 $ 490,793 $ 458,393 $ 422,573
State B&O tax rate range 0.1 - 1.6% 0.1 - 1.6% 0.1 - 1.9% 0.1 - 1.9% 0.1 - 1.9%
(1) Industry classifications are based on North American Industry Classification System (NAICS) codes.
Source: Washington State Department of Revenue, Quarterly Business Review
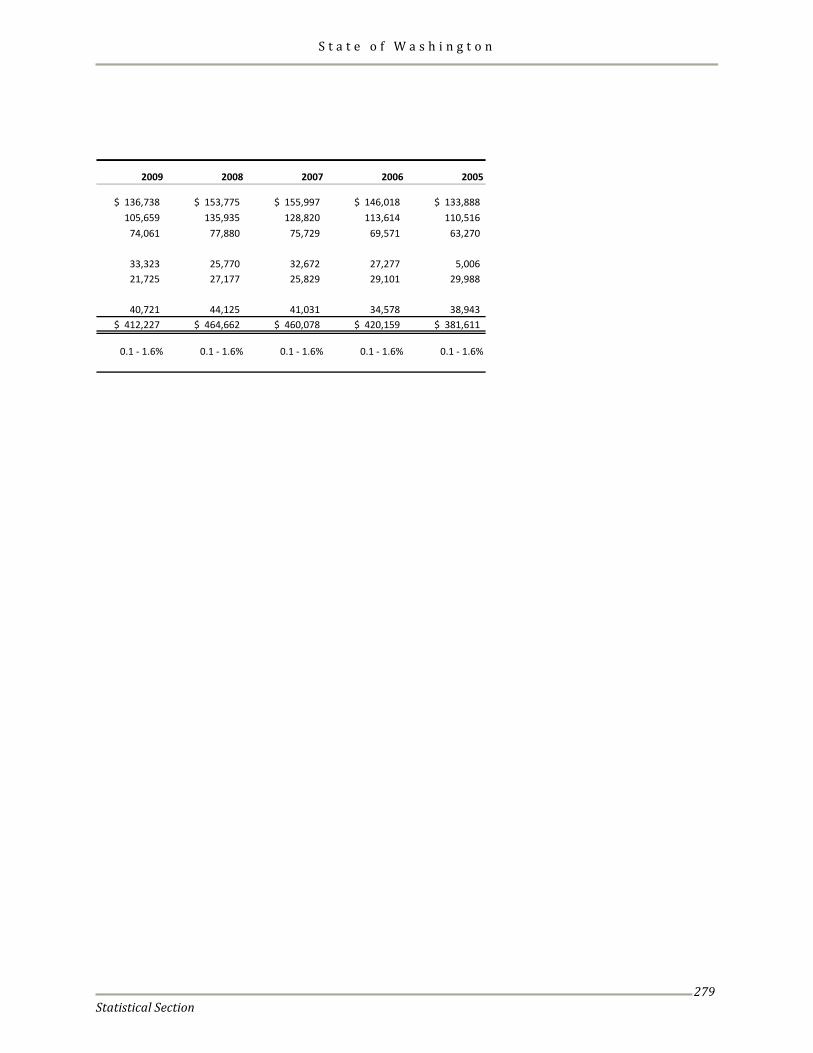
S t a t e o f W a s h i n g t o n
Statistical Section
279
2009 2008 2007 2006 2005
$ 136,738 $ 153,775 $ 155,997 $ 146,018 $ 133,888105,659 135,935 128,820 113,614 110,516
74,061 77,880 75,729 69,571 63,270
33,323 25,770 32,672 27,277 5,006 21,725 27,177 25,829 29,101 29,988
40,721 44,125 41,031 34,578 38,943 $ 412,227 $ 464,662 $ 460,078 $ 420,159 $ 381,611
0.1 - 1.6% 0.1 - 1.6% 0.1 - 1.6% 0.1 - 1.6% 0.1 - 1.6%
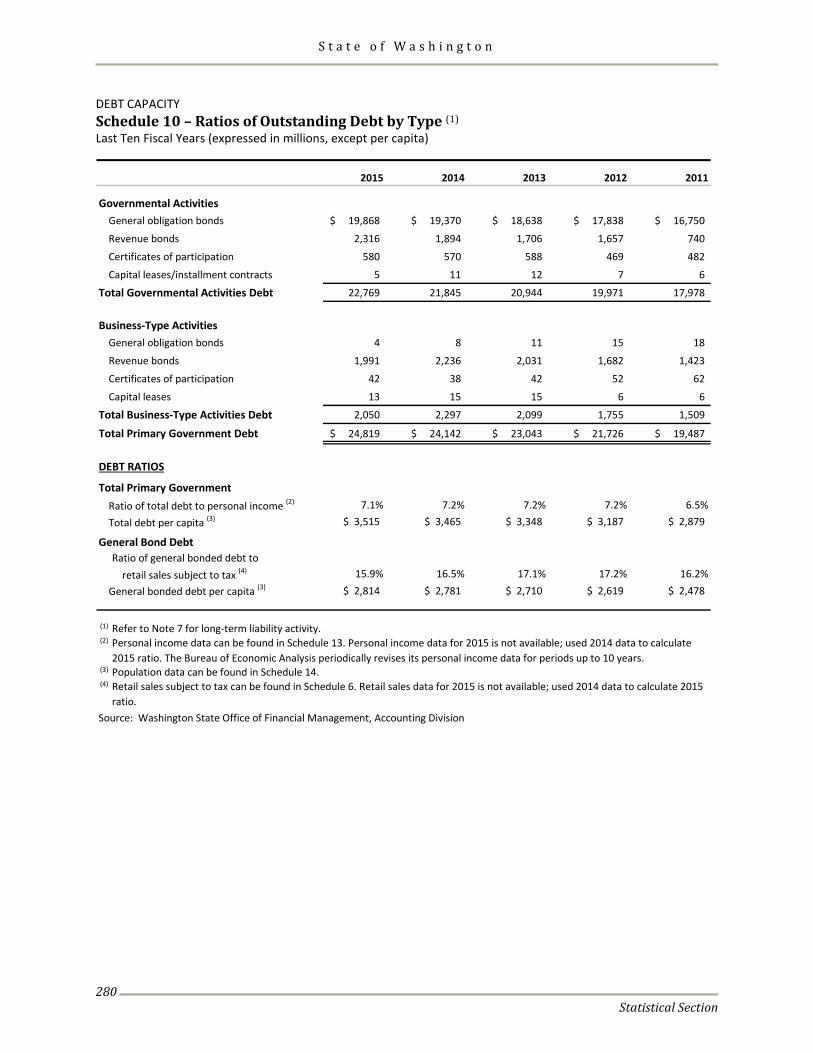
S t a t e o f W a s h i n g t o n
Statistical Section
280
DEBT CAPACITY Schedule 10 – Ratios of Outstanding Debt by Type (1) Last Ten Fiscal Years (expressed in millions, except per capita)
2015 2014 2013 2012 2011
Governmental ActivitiesGeneral obligation bonds 19,868$ 19,370$ 18,638$ 17,838$ 16,750$
Revenue bonds 2,316 1,894 1,706 1,657 740
Certificates of participation 580 570 588 469 482
Capital leases/installment contracts 5 11 12 7 6
Total Governmental Activities Debt 22,769 21,845 20,944 19,971 17,978
Business-Type ActivitiesGeneral obligation bonds 4 8 11 15 18
Revenue bonds 1,991 2,236 2,031 1,682 1,423
Certificates of participation 42 38 42 52 62
Capital leases 13 15 15 6 6
Total Business-Type Activities Debt 2,050 2,297 2,099 1,755 1,509
Total Primary Government Debt 24,819$ 24,142$ 23,043$ 21,726$ 19,487$
DEBT RATIOS
Total Primary GovernmentRatio of total debt to personal income (2) 7.1% 7.2% 7.2% 7.2% 6.5%Total debt per capita (3) $ 3,515 $ 3,465 $ 3,348 $ 3,187 $ 2,879
General Bond DebtRatio of general bonded debt to retail sales subject to tax (4) 15.9% 16.5% 17.1% 17.2% 16.2%
General bonded debt per capita (3) $ 2,814 $ 2,781 $ 2,710 $ 2,619 $ 2,478
(1)
(2)
(3)
(4)
Source: Washington State Office of Financial Management, Accounting Division
Refer to Note 7 for long-term liability activity.Personal income data can be found in Schedule 13. Personal income data for 2015 is not available; used 2014 data to calculate 2015 ratio. The Bureau of Economic Analysis periodically revises its personal income data for periods up to 10 years.Population data can be found in Schedule 14. Retail sales subject to tax can be found in Schedule 6. Retail sales data for 2015 is not available; used 2014 data to calculate 2015 ratio.
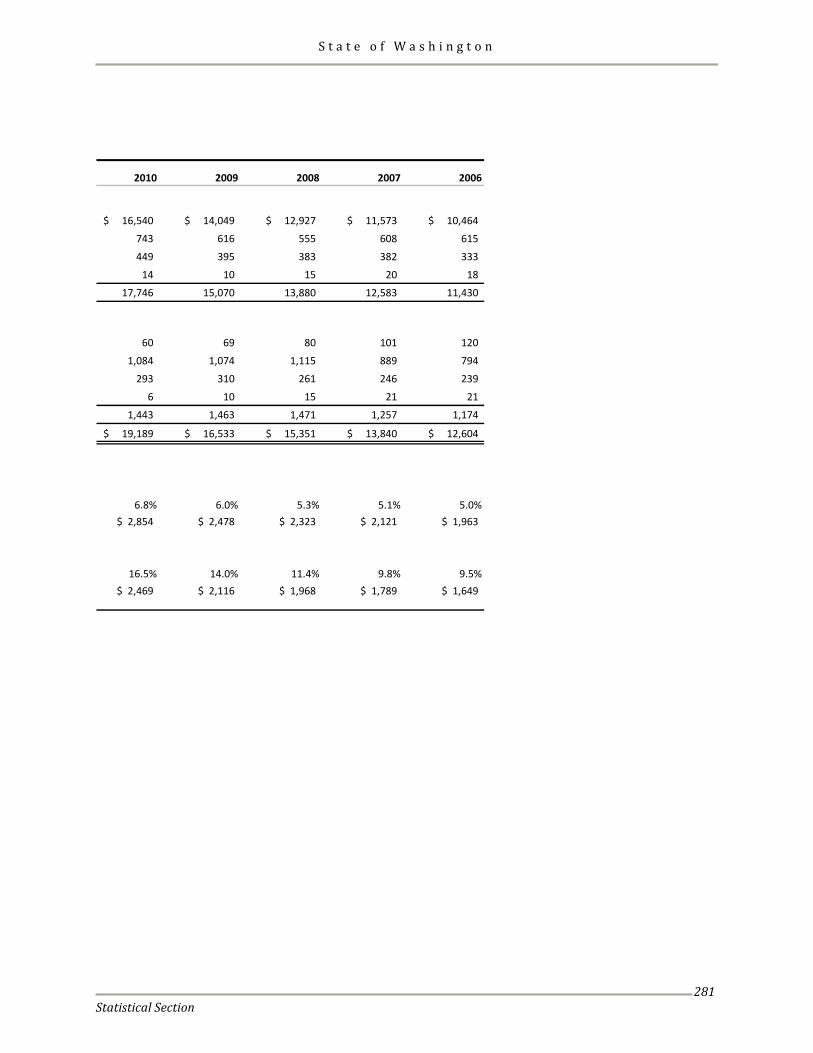
S t a t e o f W a s h i n g t o n
Statistical Section
281
2010 2009 2008 2007 2006
16,540$ 14,049$ 12,927$ 11,573$ 10,464$
743 616 555 608 615
449 395 383 382 333
14 10 15 20 18
17,746 15,070 13,880 12,583 11,430
60 69 80 101 120
1,084 1,074 1,115 889 794
293 310 261 246 239
6 10 15 21 21
1,443 1,463 1,471 1,257 1,174
19,189$ 16,533$ 15,351$ 13,840$ 12,604$
6.8% 6.0% 5.3% 5.1% 5.0%$ 2,854 $ 2,478 $ 2,323 $ 2,121 $ 1,963
16.5% 14.0% 11.4% 9.8% 9.5%$ 2,469 $ 2,116 $ 1,968 $ 1,789 $ 1,649
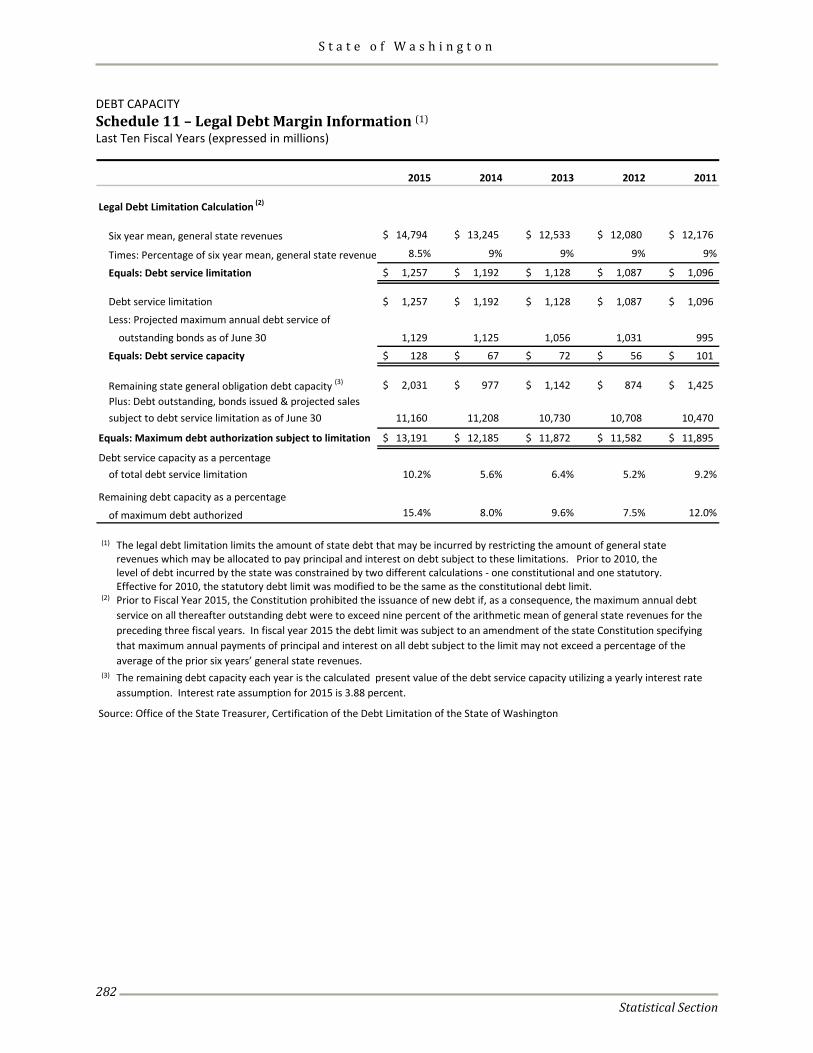
S t a t e o f W a s h i n g t o n
Statistical Section
282
DEBT CAPACITY Schedule 11 – Legal Debt Margin Information (1) Last Ten Fiscal Years (expressed in millions)
2015 2014 2013 2012 2011
Legal Debt Limitation Calculation (2)
Six year mean, general state revenues 14,794$ 13,245$ 12,533$ 12,080$ 12,176$
Times: Percentage of six year mean, general state revenue 8.5% 9% 9% 9% 9%
Equals: Debt service limitation 1,257$ 1,192$ 1,128$ 1,087$ 1,096$
Debt service limitation 1,257$ 1,192$ 1,128$ 1,087$ 1,096$
Less: Projected maximum annual debt service of
outstanding bonds as of June 30 1,129 1,125 1,056 1,031 995
Equals: Debt service capacity 128$ 67$ 72$ 56$ 101$
Remaining state general obligation debt capacity (3) 2,031$ 977$ 1,142$ 874$ 1,425$ Plus: Debt outstanding, bonds issued & projected sales subject to debt service limitation as of June 30 11,160 11,208 10,730 10,708 10,470
Equals: Maximum debt authorization subject to limitation 13,191$ 12,185$ 11,872$ 11,582$ 11,895$
Debt service capacity as a percentage of total debt service limitation 10.2% 5.6% 6.4% 5.2% 9.2%
Remaining debt capacity as a percentage
of maximum debt authorized 15.4% 8.0% 9.6% 7.5% 12.0%
(1)
(2)
(3)
Source: Office of the State Treasurer, Certification of the Debt Limitation of the State of Washington
The legal debt limitation limits the amount of state debt that may be incurred by restricting the amount of general state
Prior to Fiscal Year 2015, the Constitution prohibited the issuance of new debt if, as a consequence, the maximum annual debt service on all thereafter outstanding debt were to exceed nine percent of the arithmetic mean of general state revenues for the preceding three fiscal years. In fiscal year 2015 the debt limit was subject to an amendment of the state Constitution specifying that maximum annual payments of principal and interest on all debt subject to the limit may not exceed a percentage of the average of the prior six years’ general state revenues.The remaining debt capacity each year is the calculated present value of the debt service capacity utilizing a yearly interest rate assumption. Interest rate assumption for 2015 is 3.88 percent.
Effective for 2010, the statutory debt limit was modified to be the same as the constitutional debt limit.
revenues which may be allocated to pay principal and interest on debt subject to these limitations. Prior to 2010, the level of debt incurred by the state was constrained by two different calculations - one constitutional and one statutory.
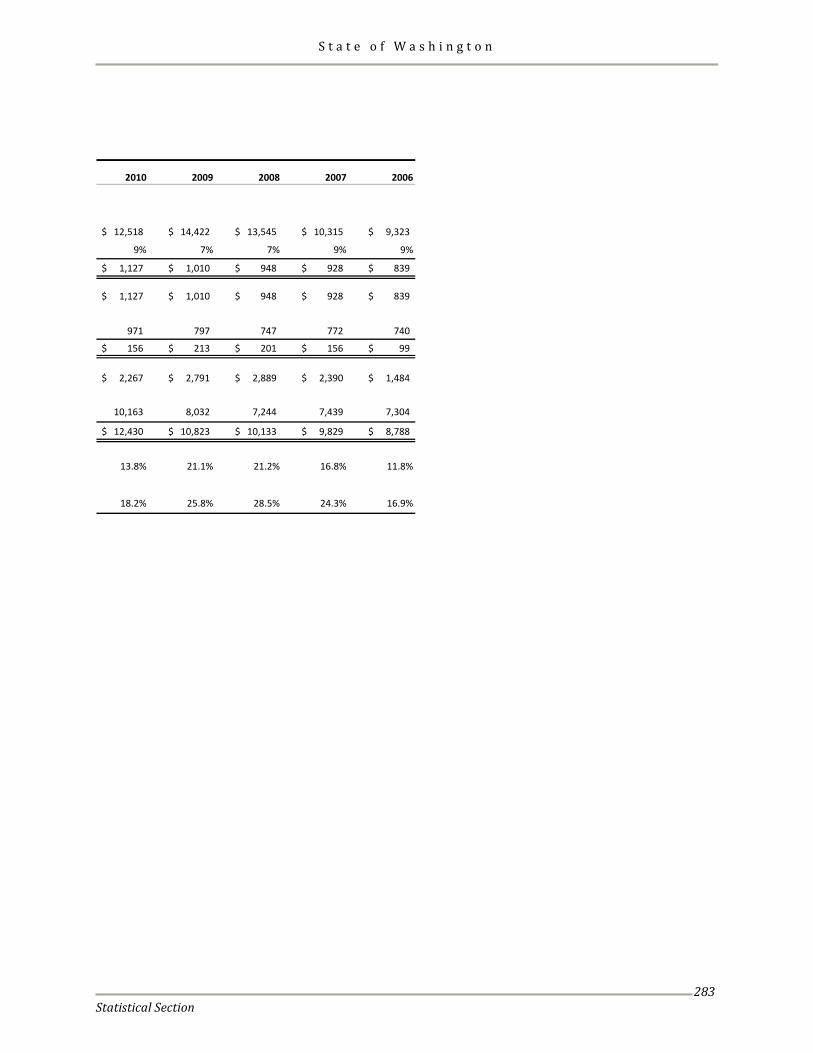
S t a t e o f W a s h i n g t o n
Statistical Section
283
2010 2009 2008 2007 2006
12,518$ 14,422$ 13,545$ 10,315$ 9,323$
9% 7% 7% 9% 9%
1,127$ 1,010$ 948$ 928$ 839$
1,127$ 1,010$ 948$ 928$ 839$
971 797 747 772 740
156$ 213$ 201$ 156$ 99$
2,267$ 2,791$ 2,889$ 2,390$ 1,484$
10,163 8,032 7,244 7,439 7,304
12,430$ 10,823$ 10,133$ 9,829$ 8,788$
13.8% 21.1% 21.2% 16.8% 11.8%
18.2% 25.8% 28.5% 24.3% 16.9%
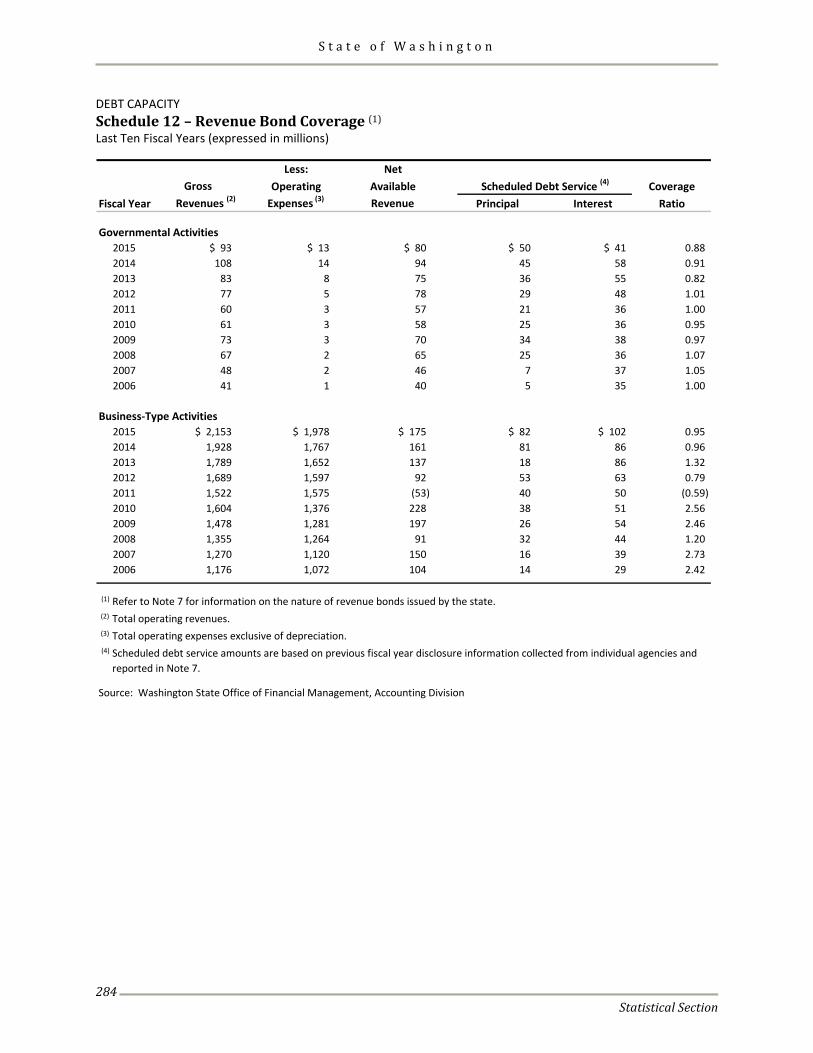
S t a t e o f W a s h i n g t o n
Statistical Section
284
DEBT CAPACITY Schedule 12 – Revenue Bond Coverage (1) Last Ten Fiscal Years (expressed in millions)
Less: NetGross Operating Available Coverage
Fiscal Year Revenues (2) Expenses (3) Revenue Principal Interest Ratio
Governmental Activities2015 $ 93 $ 13 $ 80 $ 50 $ 41 0.88 2014 108 14 94 45 58 0.91 2013 83 8 75 36 55 0.82 2012 77 5 78 29 48 1.01 2011 60 3 57 21 36 1.00 2010 61 3 58 25 36 0.95 2009 73 3 70 34 38 0.97 2008 67 2 65 25 36 1.07 2007 48 2 46 7 37 1.05 2006 41 1 40 5 35 1.00
Business-Type Activities2015 $ 2,153 $ 1,978 $ 175 $ 82 $ 102 0.95 2014 1,928 1,767 161 81 86 0.96 2013 1,789 1,652 137 18 86 1.32 2012 1,689 1,597 92 53 63 0.79 2011 1,522 1,575 (53) 40 50 (0.59) 2010 1,604 1,376 228 38 51 2.56 2009 1,478 1,281 197 26 54 2.46 2008 1,355 1,264 91 32 44 1.20 2007 1,270 1,120 150 16 39 2.73 2006 1,176 1,072 104 14 29 2.42
(1)
(2)
(3)
(4)
Source: Washington State Office of Financial Management, Accounting Division
Scheduled Debt Service (4)
Refer to Note 7 for information on the nature of revenue bonds issued by the state.
Scheduled debt service amounts are based on previous fiscal year disclosure information collected from individual agencies and reported in Note 7.
Total operating revenues.Total operating expenses exclusive of depreciation.
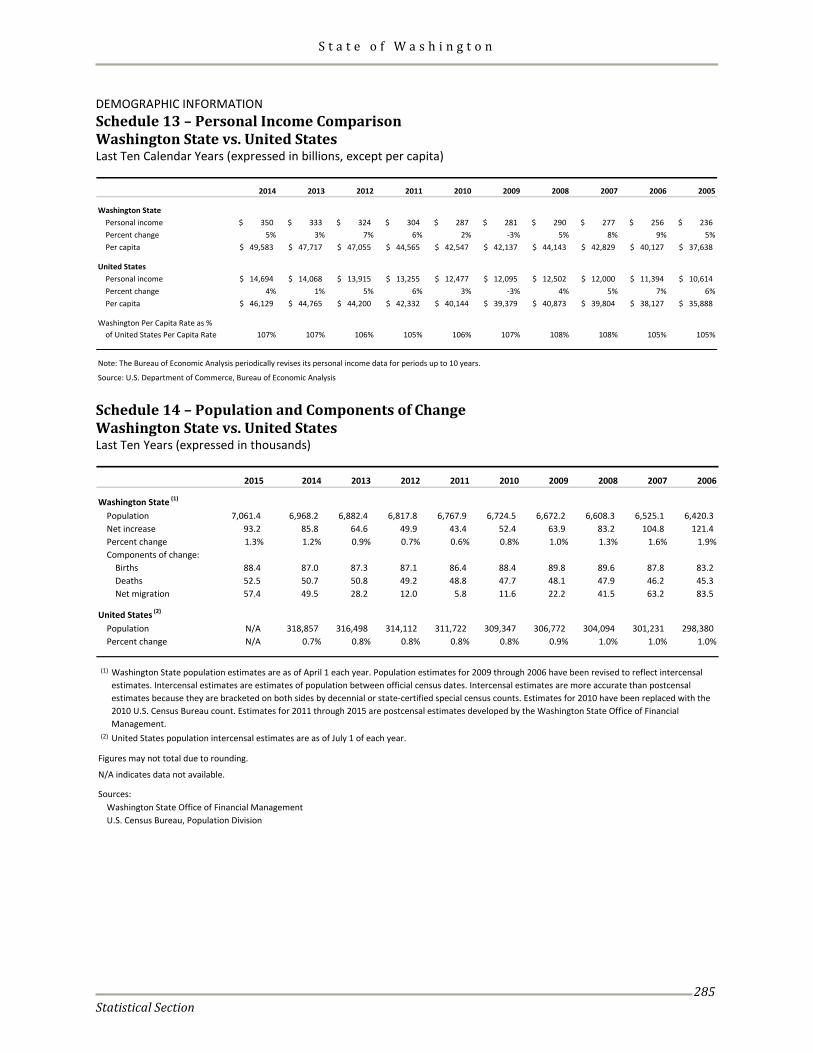
S t a t e o f W a s h i n g t o n
Statistical Section
285
DEMOGRAPHIC INFORMATION Schedule 13 – Personal Income Comparison Washington State vs. United States Last Ten Calendar Years (expressed in billions, except per capita)
2014 2013 2012 2011 2010 2009 2008 2007 2006 2005
Washington State Personal income 350$ 333$ 324$ 304$ 287$ 281$ 290$ 277$ 256$ 236$ Percent change 5% 3% 7% 6% 2% -3% 5% 8% 9% 5% Per capita 49,583$ 47,717$ 47,055$ 44,565$ 42,547$ 42,137$ 44,143$ 42,829$ 40,127$ 37,638$
United States Personal income 14,694$ 14,068$ 13,915$ 13,255$ 12,477$ 12,095$ 12,502$ 12,000$ 11,394$ 10,614$ Percent change 4% 1% 5% 6% 3% -3% 4% 5% 7% 6% Per capita 46,129$ 44,765$ 44,200$ 42,332$ 40,144$ 39,379$ 40,873$ 39,804$ 38,127$ 35,888$
Washington Per Capita Rate as %of United States Per Capita Rate 107% 107% 106% 105% 106% 107% 108% 108% 105% 105%
Note: The Bureau of Economic Analysis periodically revises its personal income data for periods up to 10 years.
Source: U.S. Department of Commerce, Bureau of Economic Analysis Schedule 14 – Population and Components of Change Washington State vs. United States Last Ten Years (expressed in thousands)
2015 2014 2013 2012 2011 2010 2009 2008 2007 2006
Washington State (1)
Population 7,061.4 6,968.2 6,882.4 6,817.8 6,767.9 6,724.5 6,672.2 6,608.3 6,525.1 6,420.3 Net increase 93.2 85.8 64.6 49.9 43.4 52.4 63.9 83.2 104.8 121.4 Percent change 1.3% 1.2% 0.9% 0.7% 0.6% 0.8% 1.0% 1.3% 1.6% 1.9%Components of change:
Births 88.4 87.0 87.3 87.1 86.4 88.4 89.8 89.6 87.8 83.2 Deaths 52.5 50.7 50.8 49.2 48.8 47.7 48.1 47.9 46.2 45.3 Net migration 57.4 49.5 28.2 12.0 5.8 11.6 22.2 41.5 63.2 83.5
United States (2)
Population N/A 318,857 316,498 314,112 311,722 309,347 306,772 304,094 301,231 298,380 Percent change N/A 0.7% 0.8% 0.8% 0.8% 0.8% 0.9% 1.0% 1.0% 1.0%
(1)
(2) United States population intercensal estimates are as of July 1 of each year.
Figures may not total due to rounding.
N/A indicates data not available.
Sources: Washington State Office of Financial ManagementU.S. Census Bureau, Population Division
Washington State population estimates are as of April 1 each year. Population estimates for 2009 through 2006 have been revised to reflect intercensal estimates. Intercensal estimates are estimates of population between official census dates. Intercensal estimates are more accurate than postcensal estimates because they are bracketed on both sides by decennial or state-certified special census counts. Estimates for 2010 have been replaced with the 2010 U.S. Census Bureau count. Estimates for 2011 through 2015 are postcensal estimates developed by the Washington State Office of Financial Management.
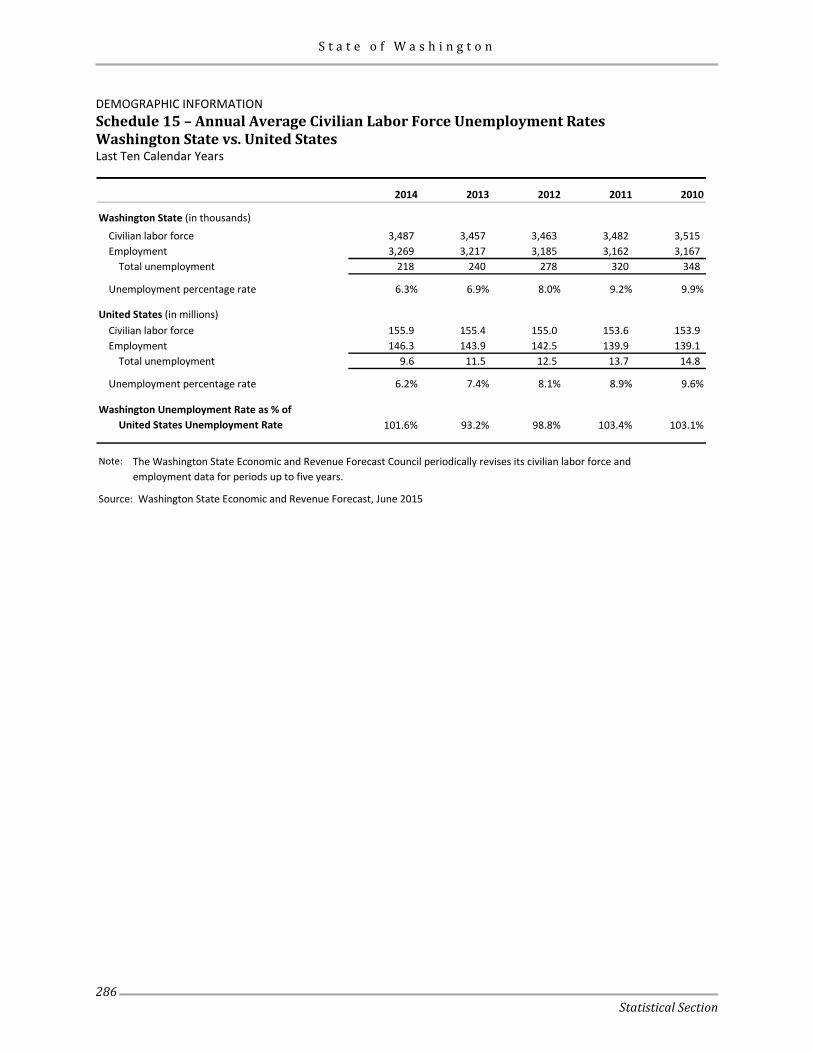
S t a t e o f W a s h i n g t o n
Statistical Section
286
DEMOGRAPHIC INFORMATION Schedule 15 – Annual Average Civilian Labor Force Unemployment Rates Washington State vs. United States Last Ten Calendar Years
2014 2013 2012 2011 2010
Washington State (in thousands)
Civilian labor force 3,487 3,457 3,463 3,482 3,515 Employment 3,269 3,217 3,185 3,162 3,167
Total unemployment 218 240 278 320 348
Unemployment percentage rate 6.3% 6.9% 8.0% 9.2% 9.9%
United States (in millions)Civilian labor force 155.9 155.4 155.0 153.6 153.9 Employment 146.3 143.9 142.5 139.9 139.1
Total unemployment 9.6 11.5 12.5 13.7 14.8
Unemployment percentage rate 6.2% 7.4% 8.1% 8.9% 9.6%
Washington Unemployment Rate as % ofUnited States Unemployment Rate 101.6% 93.2% 98.8% 103.4% 103.1%
Note:
Source: Washington State Economic and Revenue Forecast, June 2015
The Washington State Economic and Revenue Forecast Council periodically revises its civilian labor force and employment data for periods up to five years.
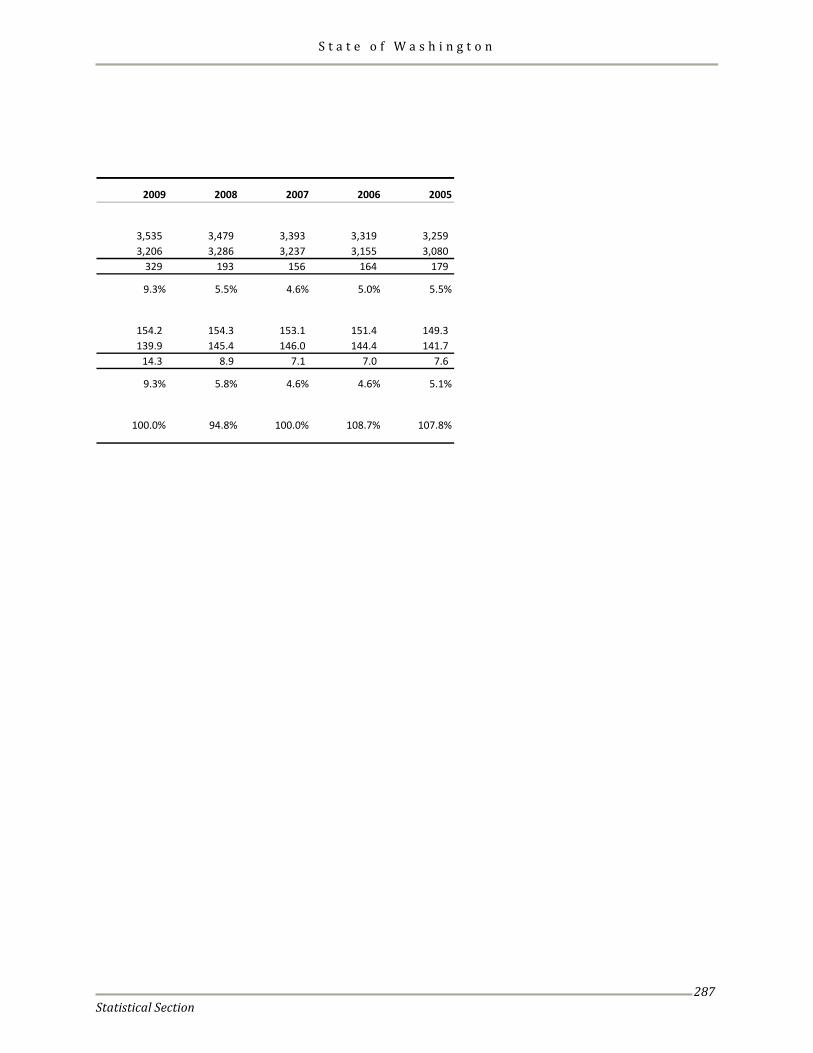
S t a t e o f W a s h i n g t o n
Statistical Section
287
2009 2008 2007 2006 2005
3,535 3,479 3,393 3,319 3,259 3,206 3,286 3,237 3,155 3,080
329 193 156 164 179
9.3% 5.5% 4.6% 5.0% 5.5%
154.2 154.3 153.1 151.4 149.3 139.9 145.4 146.0 144.4 141.7
14.3 8.9 7.1 7.0 7.6
9.3% 5.8% 4.6% 4.6% 5.1%
100.0% 94.8% 100.0% 108.7% 107.8%
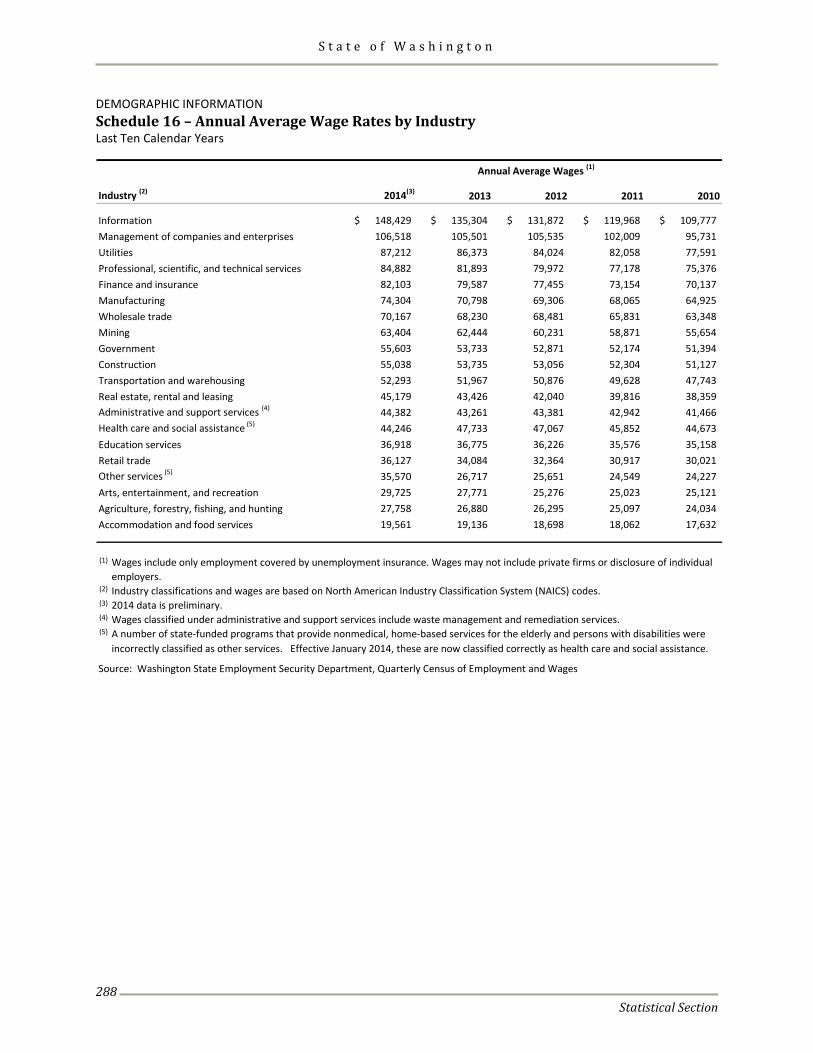
S t a t e o f W a s h i n g t o n
Statistical Section
288
DEMOGRAPHIC INFORMATION Schedule 16 – Annual Average Wage Rates by Industry Last Ten Calendar Years
Industry (2) 2014(3) 2013 2012 2011 2010
Information 148,429$ 135,304$ 131,872$ 119,968$ 109,777$ Management of companies and enterprises 106,518 105,501 105,535 102,009 95,731 Utilities 87,212 86,373 84,024 82,058 77,591 Professional, scientific, and technical services 84,882 81,893 79,972 77,178 75,376 Finance and insurance 82,103 79,587 77,455 73,154 70,137 Manufacturing 74,304 70,798 69,306 68,065 64,925 Wholesale trade 70,167 68,230 68,481 65,831 63,348 Mining 63,404 62,444 60,231 58,871 55,654 Government 55,603 53,733 52,871 52,174 51,394 Construction 55,038 53,735 53,056 52,304 51,127 Transportation and warehousing 52,293 51,967 50,876 49,628 47,743 Real estate, rental and leasing 45,179 43,426 42,040 39,816 38,359 Administrative and support services (4) 44,382 43,261 43,381 42,942 41,466 Health care and social assistance (5) 44,246 47,733 47,067 45,852 44,673 Education services 36,918 36,775 36,226 35,576 35,158 Retail trade 36,127 34,084 32,364 30,917 30,021 Other services (5) 35,570 26,717 25,651 24,549 24,227 Arts, entertainment, and recreation 29,725 27,771 25,276 25,023 25,121 Agriculture, forestry, fishing, and hunting 27,758 26,880 26,295 25,097 24,034 Accommodation and food services 19,561 19,136 18,698 18,062 17,632
(1)
employers.(2)
(3)
(4)
(5)
Source: Washington State Employment Security Department, Quarterly Census of Employment and Wages
A number of state-funded programs that provide nonmedical, home-based services for the elderly and persons with disabilities were incorrectly classified as other services. Effective January 2014, these are now classified correctly as health care and social assistance.
Annual Average Wages (1)
2014 data is preliminary.
Wages include only employment covered by unemployment insurance. Wages may not include private firms or disclosure of individual
Industry classifications and wages are based on North American Industry Classification System (NAICS) codes.
Wages classified under administrative and support services include waste management and remediation services.
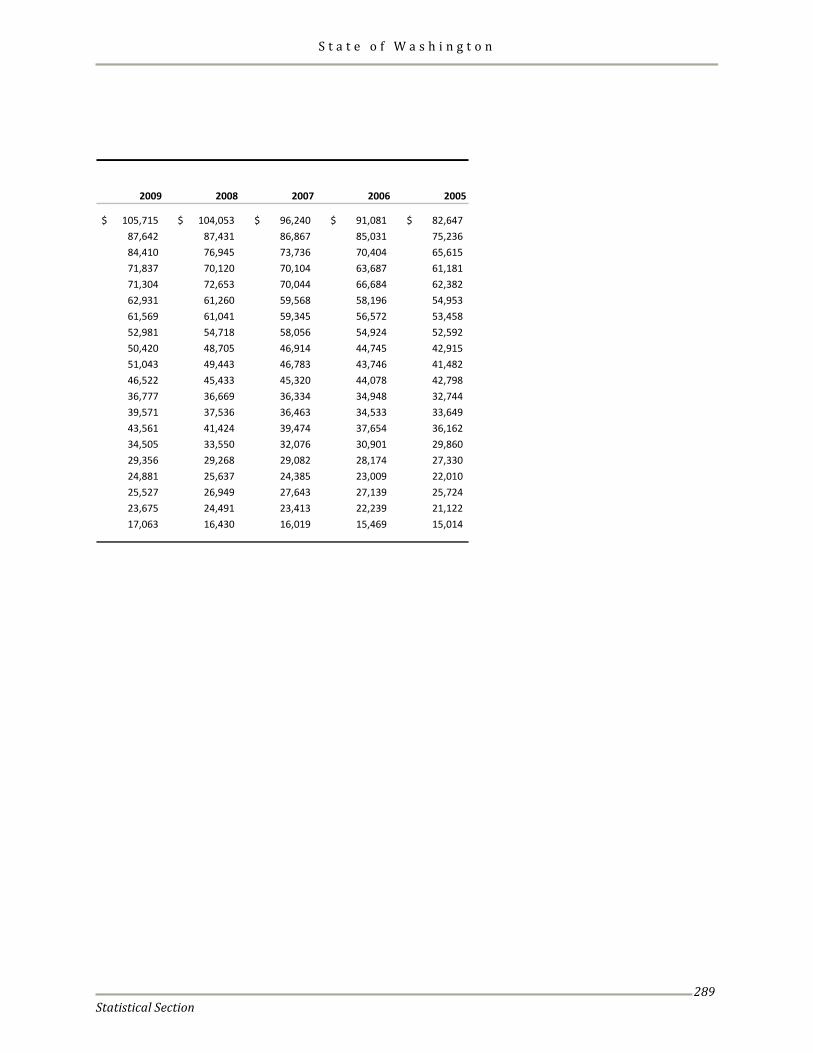
S t a t e o f W a s h i n g t o n
Statistical Section
289
2009 2008 2007 2006 2005
105,715$ 104,053$ 96,240$ 91,081$ 82,647$ 87,642 87,431 86,867 85,031 75,236 84,410 76,945 73,736 70,404 65,615 71,837 70,120 70,104 63,687 61,181 71,304 72,653 70,044 66,684 62,382 62,931 61,260 59,568 58,196 54,953 61,569 61,041 59,345 56,572 53,458 52,981 54,718 58,056 54,924 52,592 50,420 48,705 46,914 44,745 42,915 51,043 49,443 46,783 43,746 41,482 46,522 45,433 45,320 44,078 42,798 36,777 36,669 36,334 34,948 32,744 39,571 37,536 36,463 34,533 33,649 43,561 41,424 39,474 37,654 36,162 34,505 33,550 32,076 30,901 29,860 29,356 29,268 29,082 28,174 27,330 24,881 25,637 24,385 23,009 22,010 25,527 26,949 27,643 27,139 25,724 23,675 24,491 23,413 22,239 21,122 17,063 16,430 16,019 15,469 15,014
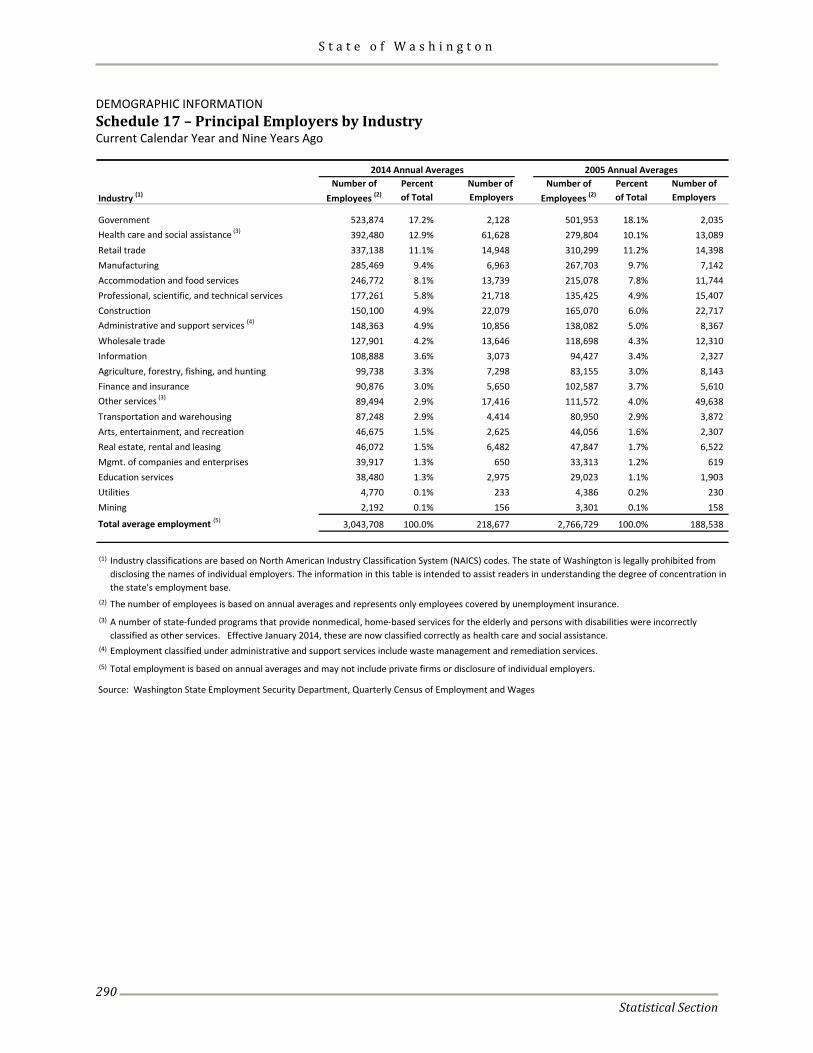
S t a t e o f W a s h i n g t o n
Statistical Section
290
DEMOGRAPHIC INFORMATION Schedule 17 – Principal Employers by Industry Current Calendar Year and Nine Years Ago
Number of Percent Number of Number of Percent Number ofIndustry (1) Employees (2) of Total Employers Employees (2) of Total Employers
Government 523,874 17.2% 2,128 501,953 18.1% 2,035 Health care and social assistance (3) 392,480 12.9% 61,628 279,804 10.1% 13,089 Retail trade 337,138 11.1% 14,948 310,299 11.2% 14,398 Manufacturing 285,469 9.4% 6,963 267,703 9.7% 7,142 Accommodation and food services 246,772 8.1% 13,739 215,078 7.8% 11,744 Professional, scientific, and technical services 177,261 5.8% 21,718 135,425 4.9% 15,407 Construction 150,100 4.9% 22,079 165,070 6.0% 22,717 Administrative and support services (4) 148,363 4.9% 10,856 138,082 5.0% 8,367 Wholesale trade 127,901 4.2% 13,646 118,698 4.3% 12,310 Information 108,888 3.6% 3,073 94,427 3.4% 2,327 Agriculture, forestry, fishing, and hunting 99,738 3.3% 7,298 83,155 3.0% 8,143 Finance and insurance 90,876 3.0% 5,650 102,587 3.7% 5,610 Other services (3) 89,494 2.9% 17,416 111,572 4.0% 49,638 Transportation and warehousing 87,248 2.9% 4,414 80,950 2.9% 3,872 Arts, entertainment, and recreation 46,675 1.5% 2,625 44,056 1.6% 2,307 Real estate, rental and leasing 46,072 1.5% 6,482 47,847 1.7% 6,522 Mgmt. of companies and enterprises 39,917 1.3% 650 33,313 1.2% 619 Education services 38,480 1.3% 2,975 29,023 1.1% 1,903 Utilities 4,770 0.1% 233 4,386 0.2% 230 Mining 2,192 0.1% 156 3,301 0.1% 158
Total average employment (5) 3,043,708 100.0% 218,677 2,766,729 100.0% 188,538
(1)
(2)
(3)
(4)
(5)
2005 Annual Averages
Source: Washington State Employment Security Department, Quarterly Census of Employment and Wages
Industry classifications are based on North American Industry Classification System (NAICS) codes. The state of Washington is legally prohibited from disclosing the names of individual employers. The information in this table is intended to assist readers in understanding the degree of concentration in the state's employment base.
The number of employees is based on annual averages and represents only employees covered by unemployment insurance.
Total employment is based on annual averages and may not include private firms or disclosure of individual employers.
2014 Annual Averages
Employment classified under administrative and support services include waste management and remediation services.
A number of state-funded programs that provide nonmedical, home-based services for the elderly and persons with disabilities were incorrectly classified as other services. Effective January 2014, these are now classified correctly as health care and social assistance.
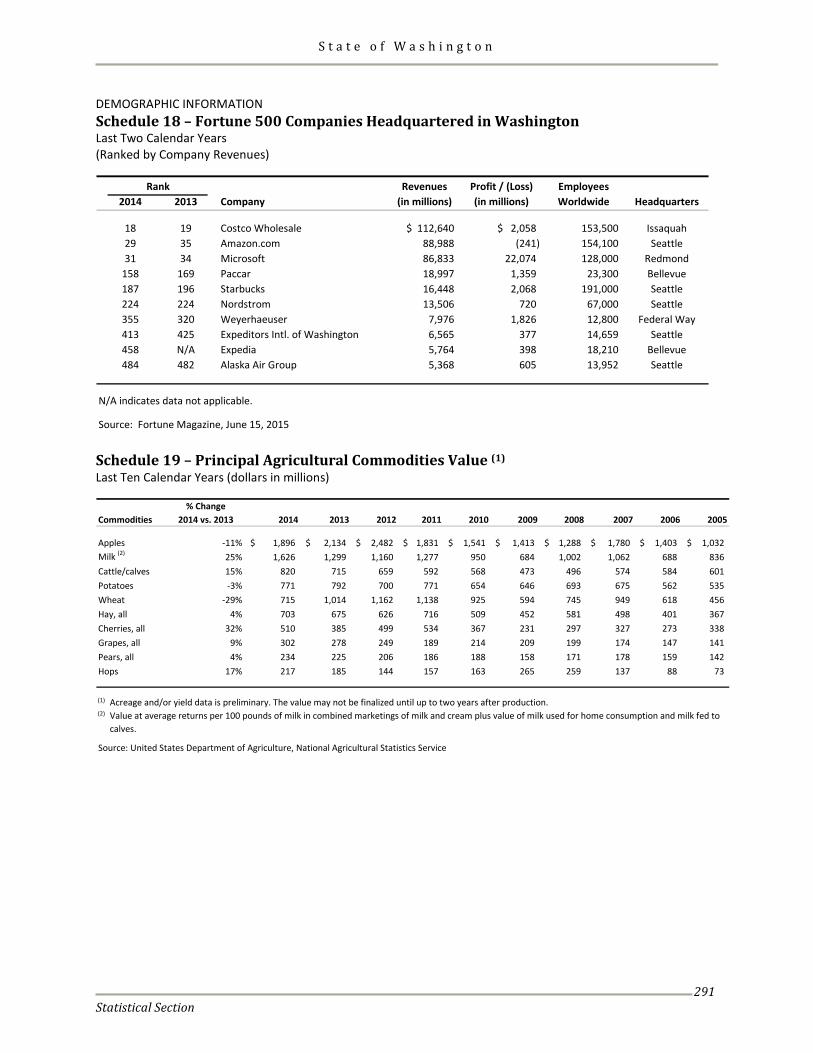
S t a t e o f W a s h i n g t o n
Statistical Section
291
DEMOGRAPHIC INFORMATION Schedule 18 – Fortune 500 Companies Headquartered in Washington Last Two Calendar Years (Ranked by Company Revenues)
Revenues Profit / (Loss) Employees2014 2013 Company (in millions) (in millions) Worldwide Headquarters
18 19 Costco Wholesale $ 112,640 $ 2,058 153,500 Issaquah29 35 Amazon.com 88,988 (241) 154,100 Seattle31 34 Microsoft 86,833 22,074 128,000 Redmond
158 169 Paccar 18,997 1,359 23,300 Bellevue187 196 Starbucks 16,448 2,068 191,000 Seattle224 224 Nordstrom 13,506 720 67,000 Seattle355 320 Weyerhaeuser 7,976 1,826 12,800 Federal Way413 425 Expeditors Intl. of Washington 6,565 377 14,659 Seattle458 N/A Expedia 5,764 398 18,210 Bellevue484 482 Alaska Air Group 5,368 605 13,952 Seattle
N/A indicates data not applicable.
Source: Fortune Magazine, June 15, 2015
Rank
Schedule 19 – Principal Agricultural Commodities Value (1) Last Ten Calendar Years (dollars in millions)
% ChangeCommodities 2014 vs. 2013 2014 2013 2012 2011 2010 2009 2008 2007 2006 2005
Apples -11% 1,896$ 2,134$ 2,482$ 1,831$ 1,541$ 1,413$ 1,288$ 1,780$ 1,403$ 1,032$ Milk (2) 25% 1,626 1,299 1,160 1,277 950 684 1,002 1,062 688 836 Cattle/calves 15% 820 715 659 592 568 473 496 574 584 601 Potatoes -3% 771 792 700 771 654 646 693 675 562 535 Wheat -29% 715 1,014 1,162 1,138 925 594 745 949 618 456 Hay, all 4% 703 675 626 716 509 452 581 498 401 367 Cherries, all 32% 510 385 499 534 367 231 297 327 273 338 Grapes, all 9% 302 278 249 189 214 209 199 174 147 141 Pears, all 4% 234 225 206 186 188 158 171 178 159 142Hops 17% 217 185 144 157 163 265 259 137 88 73
(1) Acreage and/or yield data is preliminary. The value may not be finalized until up to two years after production.(2)
Source: United States Department of Agriculture, National Agricultural Statistics Service
Value at average returns per 100 pounds of milk in combined marketings of milk and cream plus value of milk used for home consumption and milk fed to calves.
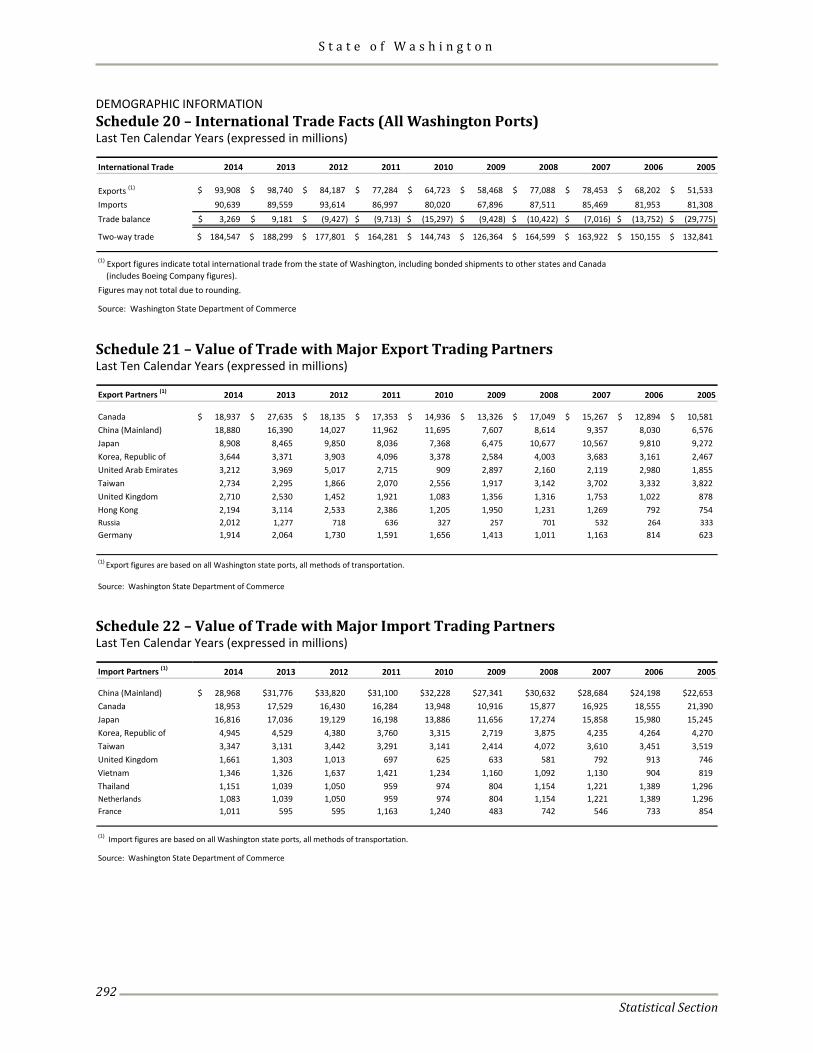
S t a t e o f W a s h i n g t o n
Statistical Section
292
DEMOGRAPHIC INFORMATION Schedule 20 – International Trade Facts (All Washington Ports) Last Ten Calendar Years (expressed in millions)
International Trade 2014 2013 2012 2011 2010 2009 2008 2007 2006 2005
Exports (1) 93,908$ 98,740$ 84,187$ 77,284$ 64,723$ 58,468$ 77,088$ 78,453$ 68,202$ 51,533$ Imports 90,639 89,559 93,614 86,997 80,020 67,896 87,511 85,469 81,953 81,308 Trade balance 3,269$ 9,181$ (9,427)$ (9,713)$ (15,297)$ (9,428)$ (10,422)$ (7,016)$ (13,752)$ (29,775)$
Two-way trade 184,547$ 188,299$ 177,801$ 164,281$ 144,743$ 126,364$ 164,599$ 163,922$ 150,155$ 132,841$
Source: Washington State Department of Commerce
(1) Export figures indicate total international trade from the state of Washington, including bonded shipments to other states and Canada
Figures may not total due to rounding. (includes Boeing Company figures).
Schedule 21 – Value of Trade with Major Export Trading Partners Last Ten Calendar Years (expressed in millions)
Export Partners (1) 2014 2013 2012 2011 2010 2009 2008 2007 2006 2005
Canada 18,937$ 27,635$ 18,135$ 17,353$ 14,936$ 13,326$ 17,049$ 15,267$ 12,894$ 10,581$ China (Mainland) 18,880 16,390 14,027 11,962 11,695 7,607 8,614 9,357 8,030 6,576 Japan 8,908 8,465 9,850 8,036 7,368 6,475 10,677 10,567 9,810 9,272 Korea, Republic of 3,644 3,371 3,903 4,096 3,378 2,584 4,003 3,683 3,161 2,467 United Arab Emirates 3,212 3,969 5,017 2,715 909 2,897 2,160 2,119 2,980 1,855 Taiwan 2,734 2,295 1,866 2,070 2,556 1,917 3,142 3,702 3,332 3,822 United Kingdom 2,710 2,530 1,452 1,921 1,083 1,356 1,316 1,753 1,022 878 Hong Kong 2,194 3,114 2,533 2,386 1,205 1,950 1,231 1,269 792 754 Russia 2,012 1,277 718 636 327 257 701 532 264 333 Germany 1,914 2,064 1,730 1,591 1,656 1,413 1,011 1,163 814 623
(1) Export figures are based on all Washington state ports, all methods of transportation.
Source: Washington State Department of Commerce Schedule 22 – Value of Trade with Major Import Trading Partners Last Ten Calendar Years (expressed in millions)
Import Partners (1) 2014 2013 2012 2011 2010 2009 2008 2007 2006 2005
China (Mainland) 28,968$ $31,776 $33,820 $31,100 $32,228 $27,341 $30,632 $28,684 $24,198 $22,653Canada 18,953 17,529 16,430 16,284 13,948 10,916 15,877 16,925 18,555 21,390 Japan 16,816 17,036 19,129 16,198 13,886 11,656 17,274 15,858 15,980 15,245 Korea, Republic of 4,945 4,529 4,380 3,760 3,315 2,719 3,875 4,235 4,264 4,270 Taiwan 3,347 3,131 3,442 3,291 3,141 2,414 4,072 3,610 3,451 3,519 United Kingdom 1,661 1,303 1,013 697 625 633 581 792 913 746 Vietnam 1,346 1,326 1,637 1,421 1,234 1,160 1,092 1,130 904 819 Thailand 1,151 1,039 1,050 959 974 804 1,154 1,221 1,389 1,296 Netherlands 1,083 1,039 1,050 959 974 804 1,154 1,221 1,389 1,296 France 1,011 595 595 1,163 1,240 483 742 546 733 854
(1) Import figures are based on all Washington state ports, all methods of transportation.
Source: Washington State Department of Commerce
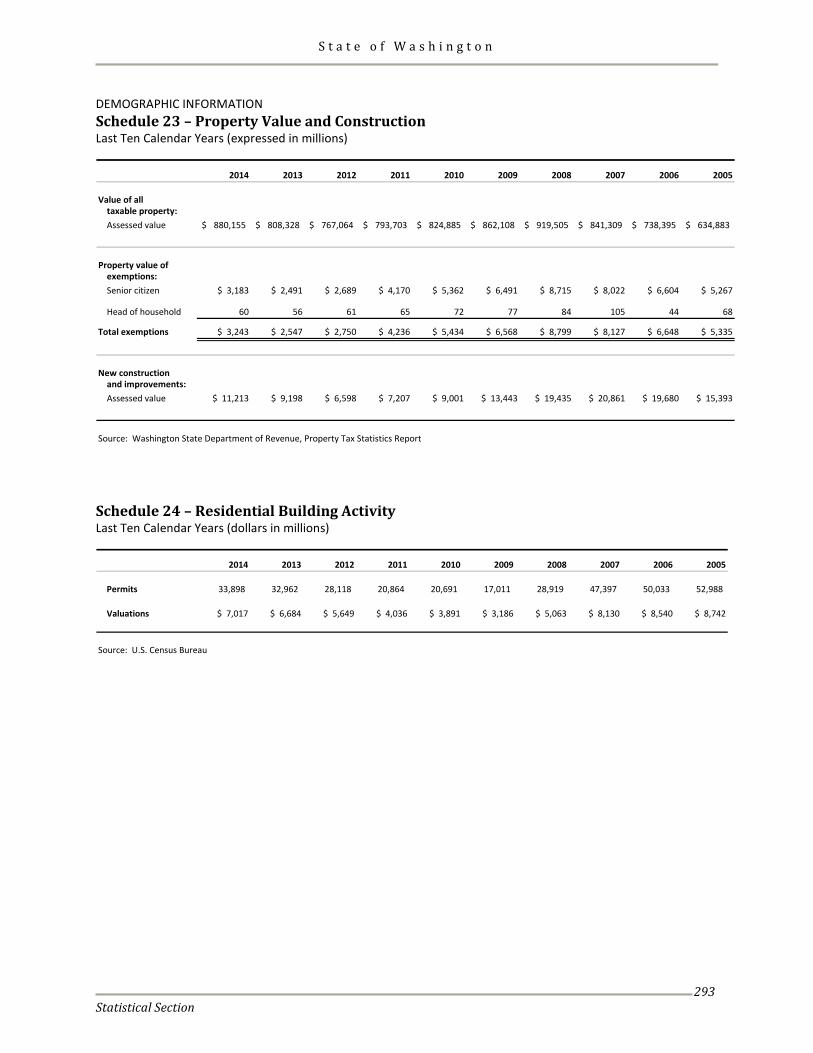
S t a t e o f W a s h i n g t o n
Statistical Section
293
DEMOGRAPHIC INFORMATION Schedule 23 – Property Value and Construction Last Ten Calendar Years (expressed in millions)
2014 2013 2012 2011 2010 2009 2008 2007 2006 2005
Value of all taxable property:Assessed value 880,155$ 808,328$ 767,064$ 793,703$ 824,885$ 862,108$ 919,505$ 841,309$ 738,395$ 634,883$
Property value ofexemptions:Senior citizen $ 3,183 $ 2,491 $ 2,689 $ 4,170 $ 5,362 $ 6,491 $ 8,715 $ 8,022 $ 6,604 $ 5,267
Head of household 60 56 61 65 72 77 84 105 44 68
Total exemptions $ 3,243 $ 2,547 $ 2,750 $ 4,236 $ 5,434 $ 6,568 $ 8,799 $ 8,127 $ 6,648 $ 5,335
New constructionand improvements:Assessed value $ 11,213 $ 9,198 $ 6,598 $ 7,207 $ 9,001 $ 13,443 $ 19,435 $ 20,861 $ 19,680 $ 15,393
Source: Washington State Department of Revenue, Property Tax Statistics Report
Schedule 24 – Residential Building Activity Last Ten Calendar Years (dollars in millions)
2014 2013 2012 2011 2010 2009 2008 2007 2006 2005
Permits 33,898 32,962 28,118 20,864 20,691 17,011 28,919 47,397 50,033 52,988
Valuations $ 7,017 $ 6,684 $ 5,649 $ 4,036 $ 3,891 $ 3,186 $ 5,063 $ 8,130 $ 8,540 $ 8,742
Source: U.S. Census Bureau
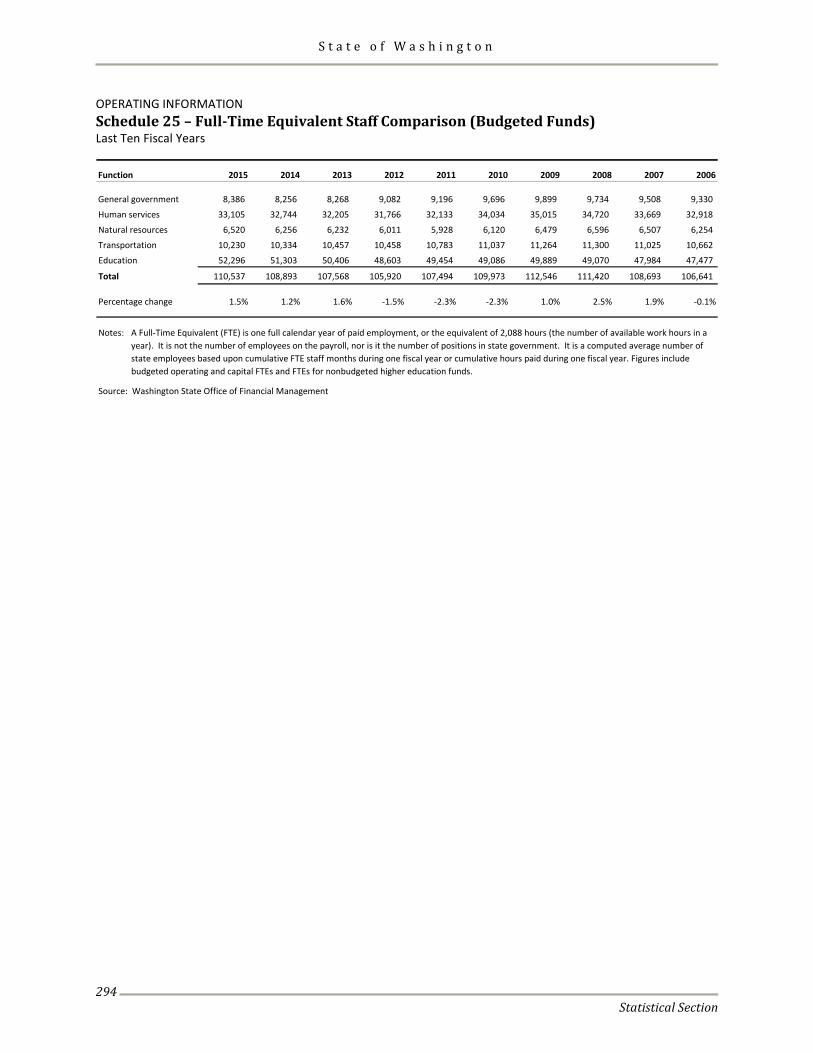
S t a t e o f W a s h i n g t o n
Statistical Section
294
OPERATING INFORMATION Schedule 25 – Full-Time Equivalent Staff Comparison (Budgeted Funds) Last Ten Fiscal Years
2015 2014 2013 2012 2011 2010 2009 2008 2007 2006
General government 8,386 8,256 8,268 9,082 9,196 9,696 9,899 9,734 9,508 9,330
Human services 33,105 32,744 32,205 31,766 32,133 34,034 35,015 34,720 33,669 32,918
Natural resources 6,520 6,256 6,232 6,011 5,928 6,120 6,479 6,596 6,507 6,254
Transportation 10,230 10,334 10,457 10,458 10,783 11,037 11,264 11,300 11,025 10,662
Education 52,296 51,303 50,406 48,603 49,454 49,086 49,889 49,070 47,984 47,477
Total 110,537 108,893 107,568 105,920 107,494 109,973 112,546 111,420 108,693 106,641
Percentage change 1.5% 1.2% 1.6% -1.5% -2.3% -2.3% 1.0% 2.5% 1.9% -0.1%
Notes:
Source: Washington State Office of Financial Management
Function
A Full-Time Equivalent (FTE) is one full calendar year of paid employment, or the equivalent of 2,088 hours (the number of available work hours in a year). It is not the number of employees on the payroll, nor is it the number of positions in state government. It is a computed average number of state employees based upon cumulative FTE staff months during one fiscal year or cumulative hours paid during one fiscal year. Figures include budgeted operating and capital FTEs and FTEs for nonbudgeted higher education funds.
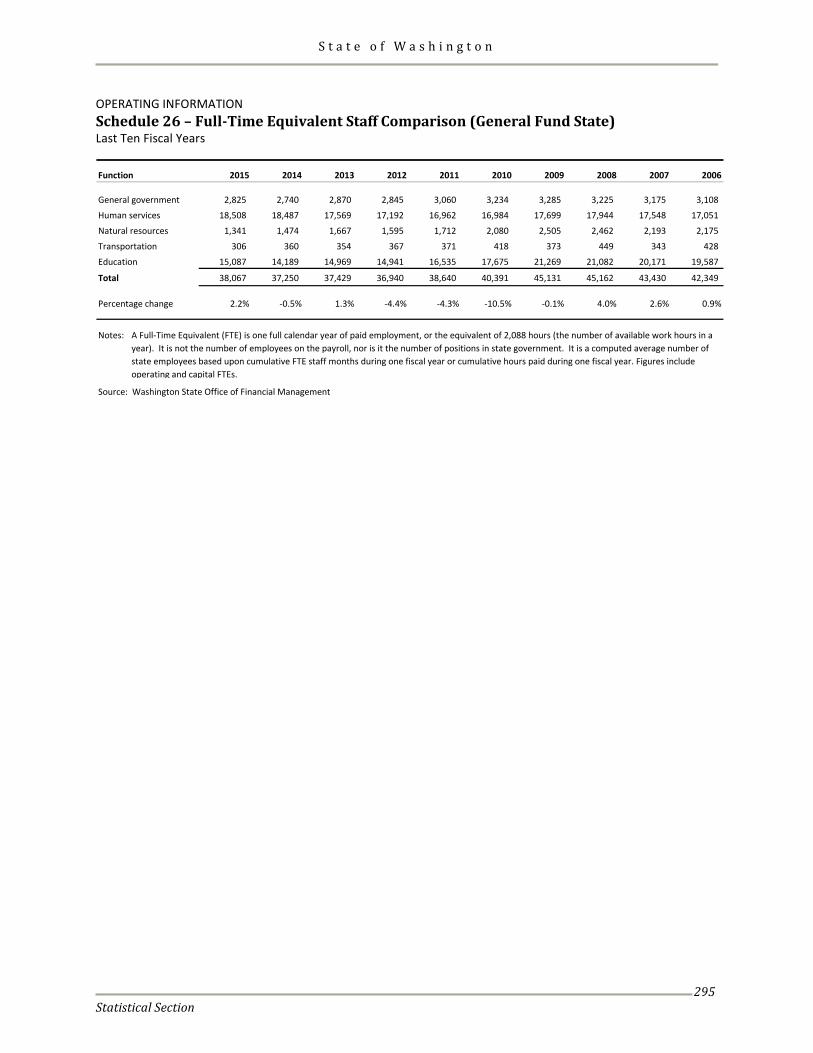
S t a t e o f W a s h i n g t o n
Statistical Section
295
OPERATING INFORMATION Schedule 26 – Full-Time Equivalent Staff Comparison (General Fund State) Last Ten Fiscal Years
2015 2014 2013 2012 2011 2010 2009 2008 2007 2006
General government 2,825 2,740 2,870 2,845 3,060 3,234 3,285 3,225 3,175 3,108
Human services 18,508 18,487 17,569 17,192 16,962 16,984 17,699 17,944 17,548 17,051
Natural resources 1,341 1,474 1,667 1,595 1,712 2,080 2,505 2,462 2,193 2,175
Transportation 306 360 354 367 371 418 373 449 343 428
Education 15,087 14,189 14,969 14,941 16,535 17,675 21,269 21,082 20,171 19,587
Total 38,067 37,250 37,429 36,940 38,640 40,391 45,131 45,162 43,430 42,349
Percentage change 2.2% -0.5% 1.3% -4.4% -4.3% -10.5% -0.1% 4.0% 2.6% 0.9%
Notes:
Source: Washington State Office of Financial Management
A Full-Time Equivalent (FTE) is one full calendar year of paid employment, or the equivalent of 2,088 hours (the number of available work hours in a year). It is not the number of employees on the payroll, nor is it the number of positions in state government. It is a computed average number of state employees based upon cumulative FTE staff months during one fiscal year or cumulative hours paid during one fiscal year. Figures include operating and capital FTEs.
Function
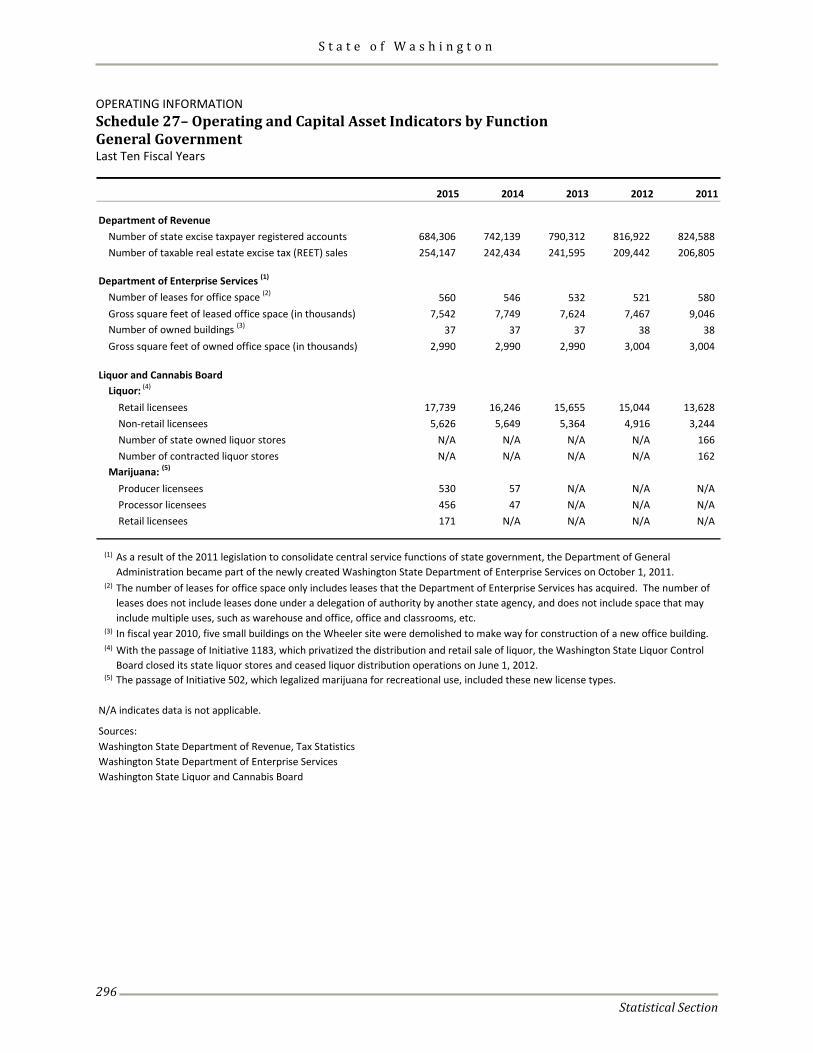
S t a t e o f W a s h i n g t o n
Statistical Section
296
OPERATING INFORMATION Schedule 27– Operating and Capital Asset Indicators by Function General Government Last Ten Fiscal Years
2015 2014 2013 2012 2011
Department of RevenueNumber of state excise taxpayer registered accounts 684,306 742,139 790,312 816,922 824,588 Number of taxable real estate excise tax (REET) sales 254,147 242,434 241,595 209,442 206,805
Department of Enterprise Services (1)
Number of leases for office space (2) 560 546 532 521 580 Gross square feet of leased office space (in thousands) 7,542 7,749 7,624 7,467 9,046 Number of owned buildings (3) 37 37 37 38 38 Gross square feet of owned office space (in thousands) 2,990 2,990 2,990 3,004 3,004
Liquor and Cannabis BoardLiquor: (4)
Retail licensees 17,739 16,246 15,655 15,044 13,628 Non-retail licensees 5,626 5,649 5,364 4,916 3,244 Number of state owned liquor stores N/A N/A N/A N/A 166 Number of contracted liquor stores N/A N/A N/A N/A 162
Marijuana: (5)
Producer licensees 530 57 N/A N/A N/AProcessor licensees 456 47 N/A N/A N/ARetail licensees 171 N/A N/A N/A N/A
(1)
(2)
(3)
(4)
(5)
N/A indicates data is not applicable.
Sources:Washington State Department of Revenue, Tax StatisticsWashington State Department of Enterprise ServicesWashington State Liquor and Cannabis Board
The passage of Initiative 502, which legalized marijuana for recreational use, included these new license types.
As a result of the 2011 legislation to consolidate central service functions of state government, the Department of General Administration became part of the newly created Washington State Department of Enterprise Services on October 1, 2011.The number of leases for office space only includes leases that the Department of Enterprise Services has acquired. The number of leases does not include leases done under a delegation of authority by another state agency, and does not include space that may include multiple uses, such as warehouse and office, office and classrooms, etc.In fiscal year 2010, five small buildings on the Wheeler site were demolished to make way for construction of a new office building.With the passage of Initiative 1183, which privatized the distribution and retail sale of liquor, the Washington State Liquor Control Board closed its state liquor stores and ceased liquor distribution operations on June 1, 2012.
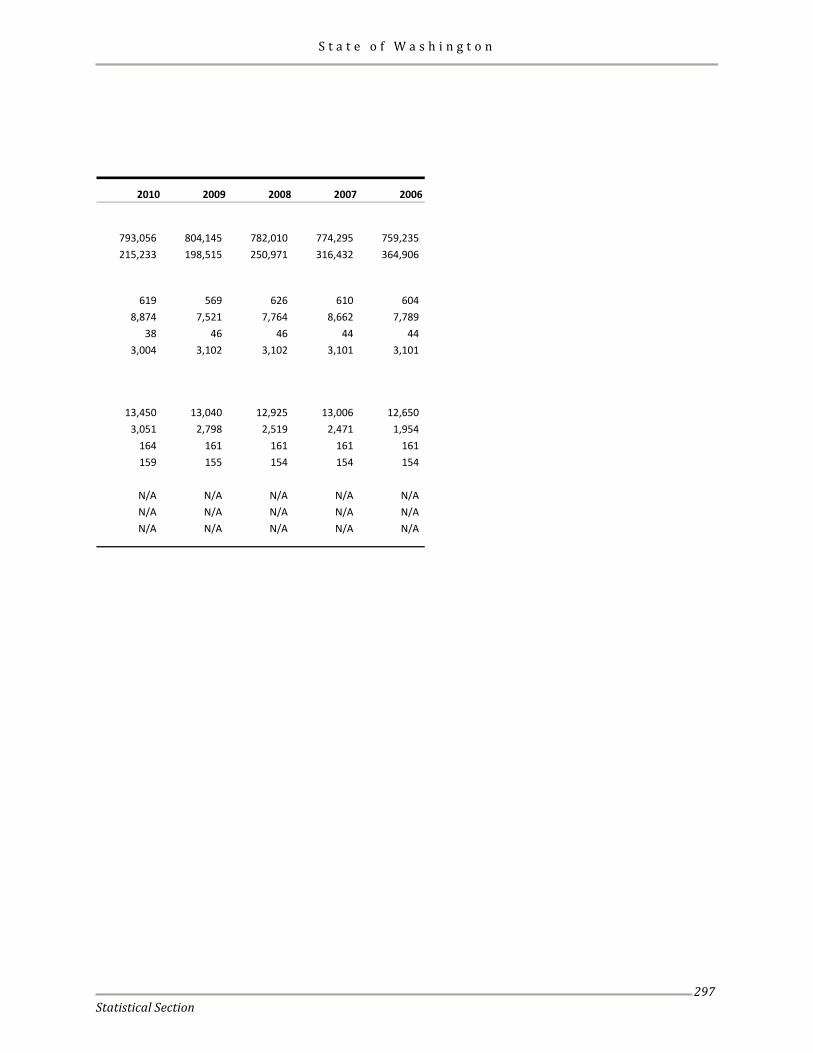
S t a t e o f W a s h i n g t o n
Statistical Section
297
2010 2009 2008 2007 2006
793,056 804,145 782,010 774,295 759,235 215,233 198,515 250,971 316,432 364,906
619 569 626 610 604 8,874 7,521 7,764 8,662 7,789
38 46 46 44 44 3,004 3,102 3,102 3,101 3,101
13,450 13,040 12,925 13,006 12,650 3,051 2,798 2,519 2,471 1,954
164 161 161 161 161 159 155 154 154 154
N/A N/A N/A N/A N/AN/A N/A N/A N/A N/AN/A N/A N/A N/A N/A
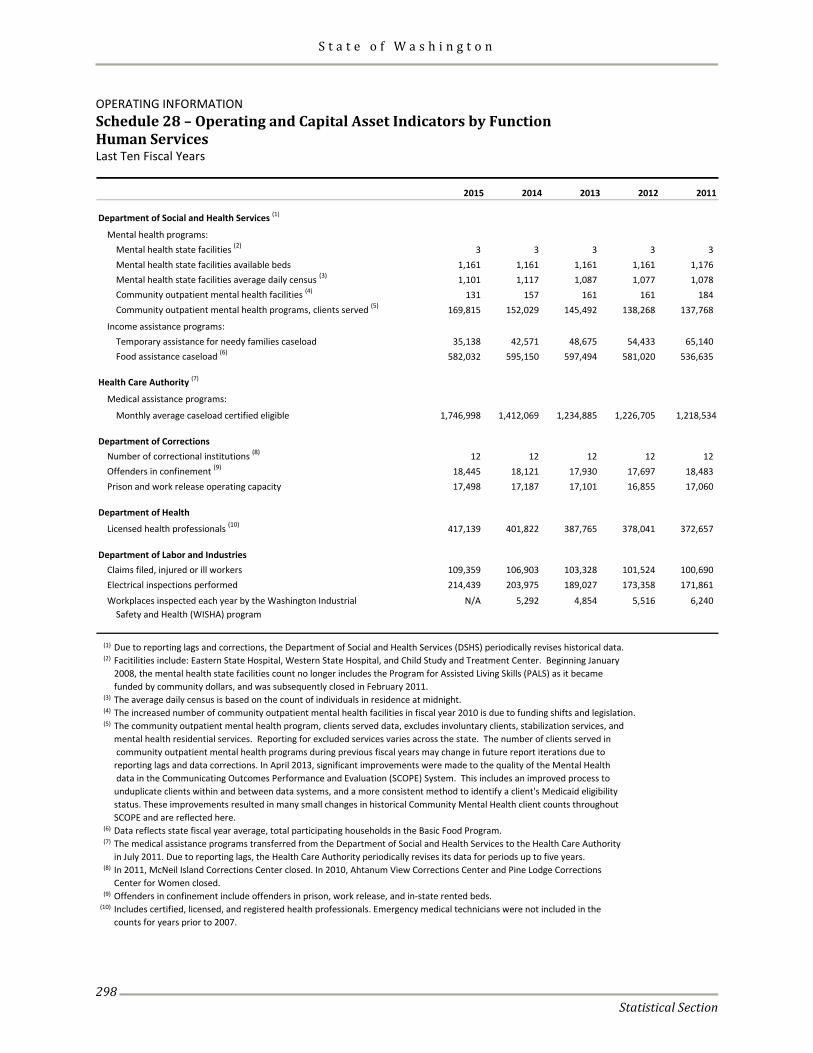
S t a t e o f W a s h i n g t o n
Statistical Section
298
OPERATING INFORMATION Schedule 28 – Operating and Capital Asset Indicators by Function Human Services Last Ten Fiscal Years
2015 2014 2013 2012 2011
Department of Social and Health Services (1)
Mental health programs:Mental health state facilities (2) 3 3 3 3 3 Mental health state facilities available beds 1,161 1,161 1,161 1,161 1,176 Mental health state facilities average daily census (3) 1,101 1,117 1,087 1,077 1,078 Community outpatient mental health facilities (4) 131 157 161 161 184 Community outpatient mental health programs, clients served (5) 169,815 152,029 145,492 138,268 137,768
Income assistance programs:Temporary assistance for needy families caseload 35,138 42,571 48,675 54,433 65,140 Food assistance caseload (6) 582,032 595,150 597,494 581,020 536,635
Health Care Authority (7)
Medical assistance programs:
Monthly average caseload certified eligible 1,746,998 1,412,069 1,234,885 1,226,705 1,218,534
Department of CorrectionsNumber of correctional institutions (8) 12 12 12 12 12 Offenders in confinement (9) 18,445 18,121 17,930 17,697 18,483 Prison and work release operating capacity 17,498 17,187 17,101 16,855 17,060
Department of Health
Licensed health professionals (10) 417,139 401,822 387,765 378,041 372,657
Department of Labor and IndustriesClaims filed, injured or ill workers 109,359 106,903 103,328 101,524 100,690 Electrical inspections performed 214,439 203,975 189,027 173,358 171,861 Workplaces inspected each year by the Washington Industrial N/A 5,292 4,854 5,516 6,240
Safety and Health (WISHA) program
(1) Due to reporting lags and corrections, the Department of Social and Health Services (DSHS) periodically revises historical data.(2) Facitilities include: Eastern State Hospital, Western State Hospital, and Child Study and Treatment Center. Beginning January
2008, the mental health state facilities count no longer includes the Program for Assisted Living Skills (PALS) as it becamefunded by community dollars, and was subsequently closed in February 2011.
(3) The average daily census is based on the count of individuals in residence at midnight.(4) The increased number of community outpatient mental health facilities in fiscal year 2010 is due to funding shifts and legislation.(5) The community outpatient mental health program, clients served data, excludes involuntary clients, stabilization services, and
mental health residential services. Reporting for excluded services varies across the state. The number of clients served in community outpatient mental health programs during previous fiscal years may change in future report iterations due toreporting lags and data corrections. In April 2013, significant improvements were made to the quality of the Mental Health data in the Communicating Outcomes Performance and Evaluation (SCOPE) System. This includes an improved process tounduplicate clients within and between data systems, and a more consistent method to identify a client's Medicaid eligibilitystatus. These improvements resulted in many small changes in historical Community Mental Health client counts throughoutSCOPE and are reflected here.
(6) Data reflects state fiscal year average, total participating households in the Basic Food Program.(7) The medical assistance programs transferred from the Department of Social and Health Services to the Health Care Authority
in July 2011. Due to reporting lags, the Health Care Authority periodically revises its data for periods up to five years.(8) In 2011, McNeil Island Corrections Center closed. In 2010, Ahtanum View Corrections Center and Pine Lodge Corrections
Center for Women closed.(9) Offenders in confinement include offenders in prison, work release, and in-state rented beds.
(10) Includes certified, licensed, and registered health professionals. Emergency medical technicians were not included in thecounts for years prior to 2007.
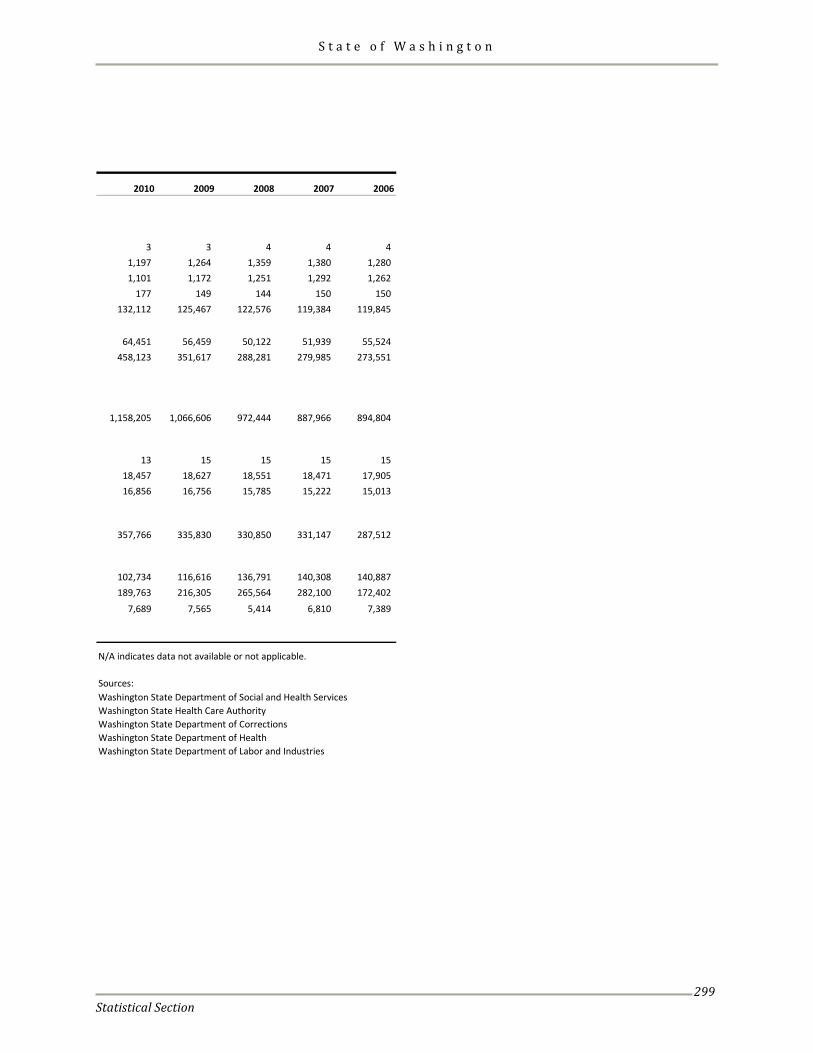
S t a t e o f W a s h i n g t o n
Statistical Section
299
2010 2009 2008 2007 2006
3 3 4 4 4 1,197 1,264 1,359 1,380 1,280 1,101 1,172 1,251 1,292 1,262
177 149 144 150 150 132,112 125,467 122,576 119,384 119,845
64,451 56,459 50,122 51,939 55,524 458,123 351,617 288,281 279,985 273,551
1,158,205 1,066,606 972,444 887,966 894,804
13 15 15 15 15 18,457 18,627 18,551 18,471 17,905 16,856 16,756 15,785 15,222 15,013
357,766 335,830 330,850 331,147 287,512
102,734 116,616 136,791 140,308 140,887 189,763 216,305 265,564 282,100 172,402
7,689 7,565 5,414 6,810 7,389
N/A indicates data not available or not applicable.
Sources:Washington State Department of Social and Health ServicesWashington State Health Care AuthorityWashington State Department of CorrectionsWashington State Department of HealthWashington State Department of Labor and Industries
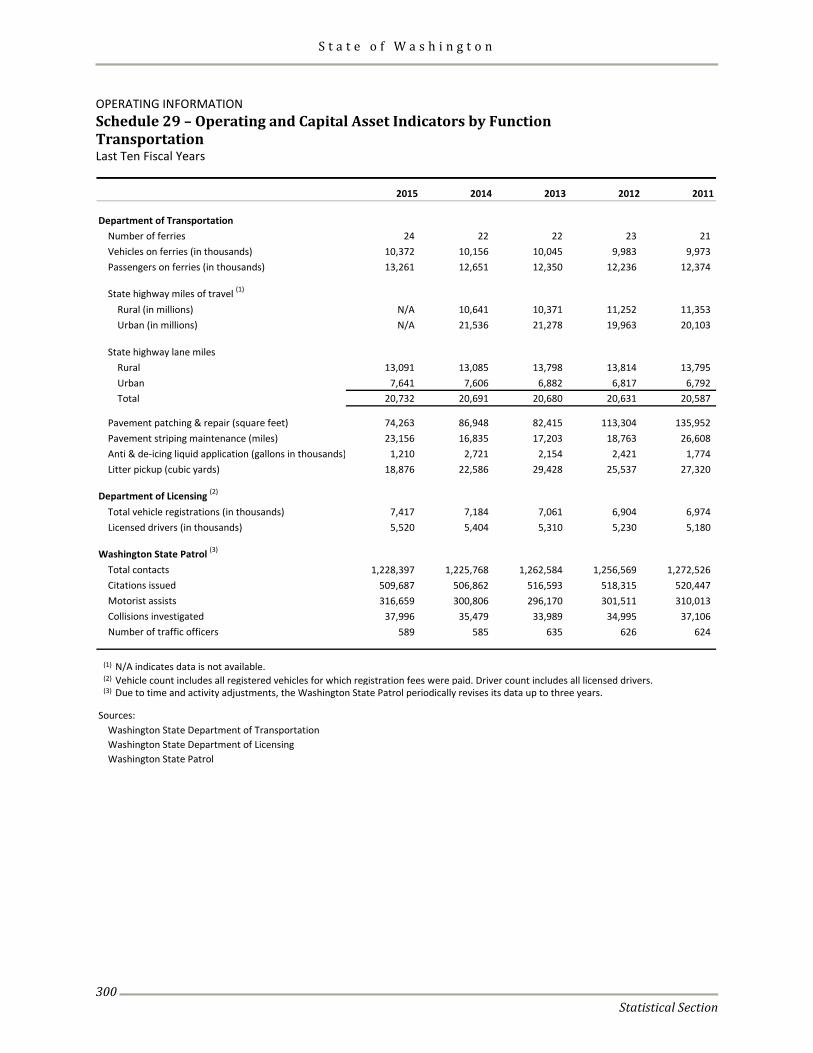
S t a t e o f W a s h i n g t o n
Statistical Section
300
OPERATING INFORMATION Schedule 29 – Operating and Capital Asset Indicators by Function Transportation Last Ten Fiscal Years
2015 2014 2013 2012 2011
Department of TransportationNumber of ferries 24 22 22 23 21 Vehicles on ferries (in thousands) 10,372 10,156 10,045 9,983 9,973 Passengers on ferries (in thousands) 13,261 12,651 12,350 12,236 12,374
State highway miles of travel (1)
Rural (in millions) N/A 10,641 10,371 11,252 11,353 Urban (in millions) N/A 21,536 21,278 19,963 20,103
State highway lane milesRural 13,091 13,085 13,798 13,814 13,795 Urban 7,641 7,606 6,882 6,817 6,792 Total 20,732 20,691 20,680 20,631 20,587
Pavement patching & repair (square feet) 74,263 86,948 82,415 113,304 135,952 Pavement striping maintenance (miles) 23,156 16,835 17,203 18,763 26,608 Anti & de-icing liquid application (gallons in thousands) 1,210 2,721 2,154 2,421 1,774 Litter pickup (cubic yards) 18,876 22,586 29,428 25,537 27,320
Department of Licensing (2)
Total vehicle registrations (in thousands) 7,417 7,184 7,061 6,904 6,974 Licensed drivers (in thousands) 5,520 5,404 5,310 5,230 5,180
Washington State Patrol (3)
Total contacts 1,228,397 1,225,768 1,262,584 1,256,569 1,272,526 Citations issued 509,687 506,862 516,593 518,315 520,447 Motorist assists 316,659 300,806 296,170 301,511 310,013 Collisions investigated 37,996 35,479 33,989 34,995 37,106 Number of traffic officers 589 585 635 626 624
(1) N/A indicates data is not available.(2)
(3)
Sources: Washington State Department of TransportationWashington State Department of LicensingWashington State Patrol
Vehicle count includes all registered vehicles for which registration fees were paid. Driver count includes all licensed drivers.Due to time and activity adjustments, the Washington State Patrol periodically revises its data up to three years.
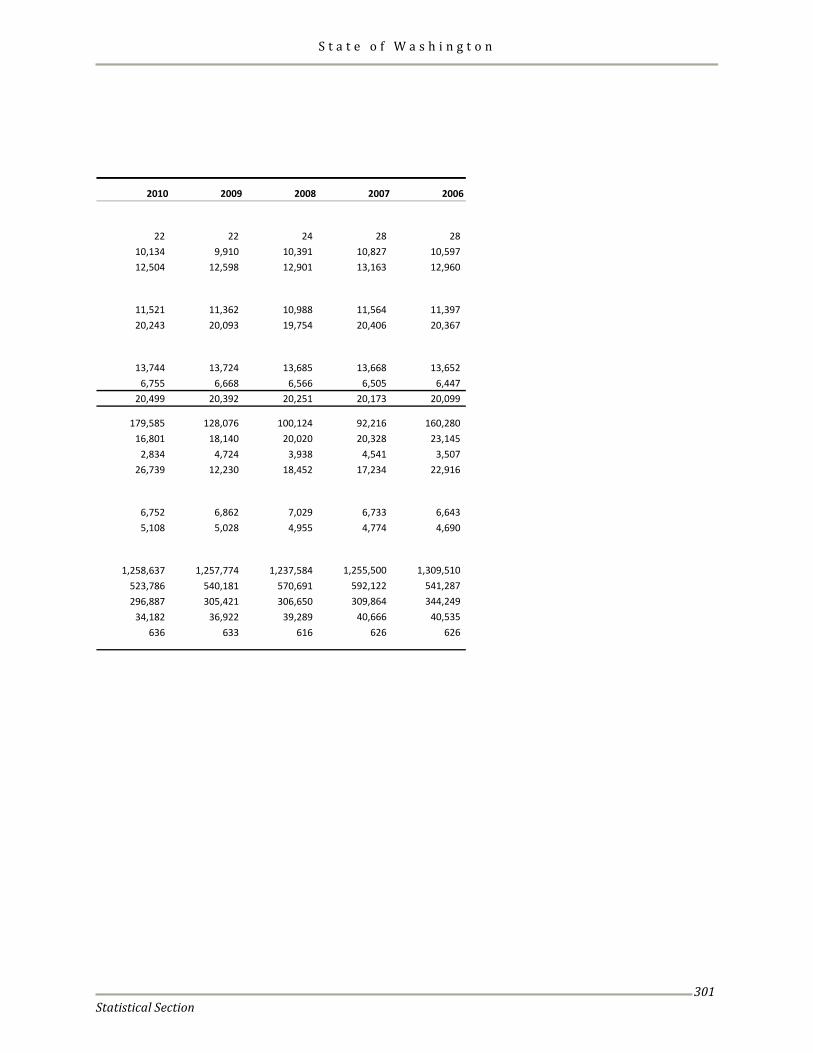
S t a t e o f W a s h i n g t o n
Statistical Section
301
2010 2009 2008 2007 2006
22 22 24 28 28 10,134 9,910 10,391 10,827 10,597 12,504 12,598 12,901 13,163 12,960
11,521 11,362 10,988 11,564 11,397 20,243 20,093 19,754 20,406 20,367
13,744 13,724 13,685 13,668 13,652 6,755 6,668 6,566 6,505 6,447
20,499 20,392 20,251 20,173 20,099
179,585 128,076 100,124 92,216 160,280 16,801 18,140 20,020 20,328 23,145
2,834 4,724 3,938 4,541 3,507 26,739 12,230 18,452 17,234 22,916
6,752 6,862 7,029 6,733 6,643 5,108 5,028 4,955 4,774 4,690
1,258,637 1,257,774 1,237,584 1,255,500 1,309,510 523,786 540,181 570,691 592,122 541,287 296,887 305,421 306,650 309,864 344,249
34,182 36,922 39,289 40,666 40,535 636 633 616 626 626
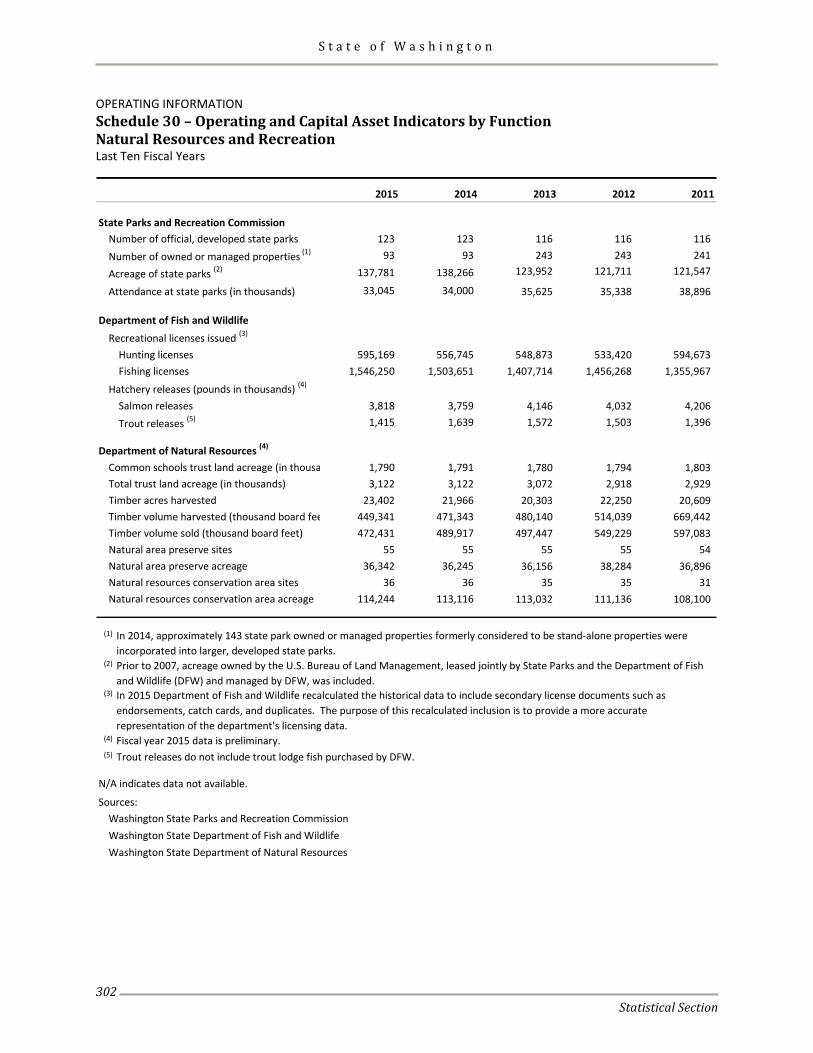
S t a t e o f W a s h i n g t o n
Statistical Section
302
OPERATING INFORMATION Schedule 30 – Operating and Capital Asset Indicators by Function Natural Resources and Recreation Last Ten Fiscal Years
2015 2014 2013 2012 2011
State Parks and Recreation CommissionNumber of official, developed state parks 123 123 116 116 116 Number of owned or managed properties (1) 93 93 243 243 241
Acreage of state parks (2) 137,781 138,266 123,952 121,711 121,547
Attendance at state parks (in thousands) 33,045 34,000 35,625 35,338 38,896
Department of Fish and WildlifeRecreational licenses issued (3)
Hunting licenses 595,169 556,745 548,873 533,420 594,673 Fishing licenses 1,546,250 1,503,651 1,407,714 1,456,268 1,355,967
Hatchery releases (pounds in thousands) (4)
Salmon releases 3,818 3,759 4,146 4,032 4,206 Trout releases (5) 1,415 1,639 1,572 1,503 1,396
Department of Natural Resources (4)
Common schools trust land acreage (in thousa 1,790 1,791 1,780 1,794 1,803 Total trust land acreage (in thousands) 3,122 3,122 3,072 2,918 2,929 Timber acres harvested 23,402 21,966 20,303 22,250 20,609 Timber volume harvested (thousand board fee 449,341 471,343 480,140 514,039 669,442 Timber volume sold (thousand board feet) 472,431 489,917 497,447 549,229 597,083 Natural area preserve sites 55 55 55 55 54 Natural area preserve acreage 36,342 36,245 36,156 38,284 36,896 Natural resources conservation area sites 36 36 35 35 31 Natural resources conservation area acreage 114,244 113,116 113,032 111,136 108,100
(1)
(2)
(3)
(4)
(5)
N/A indicates data not available.
Sources: Washington State Parks and Recreation CommissionWashington State Department of Fish and Wildlife Washington State Department of Natural Resources
Prior to 2007, acreage owned by the U.S. Bureau of Land Management, leased jointly by State Parks and the Department of Fish and Wildlife (DFW) and managed by DFW, was included.
Fiscal year 2015 data is preliminary. Trout releases do not include trout lodge fish purchased by DFW.
In 2014, approximately 143 state park owned or managed properties formerly considered to be stand-alone properties were incorporated into larger, developed state parks.
In 2015 Department of Fish and Wildlife recalculated the historical data to include secondary license documents such as endorsements, catch cards, and duplicates. The purpose of this recalculated inclusion is to provide a more accurate representation of the department's licensing data.
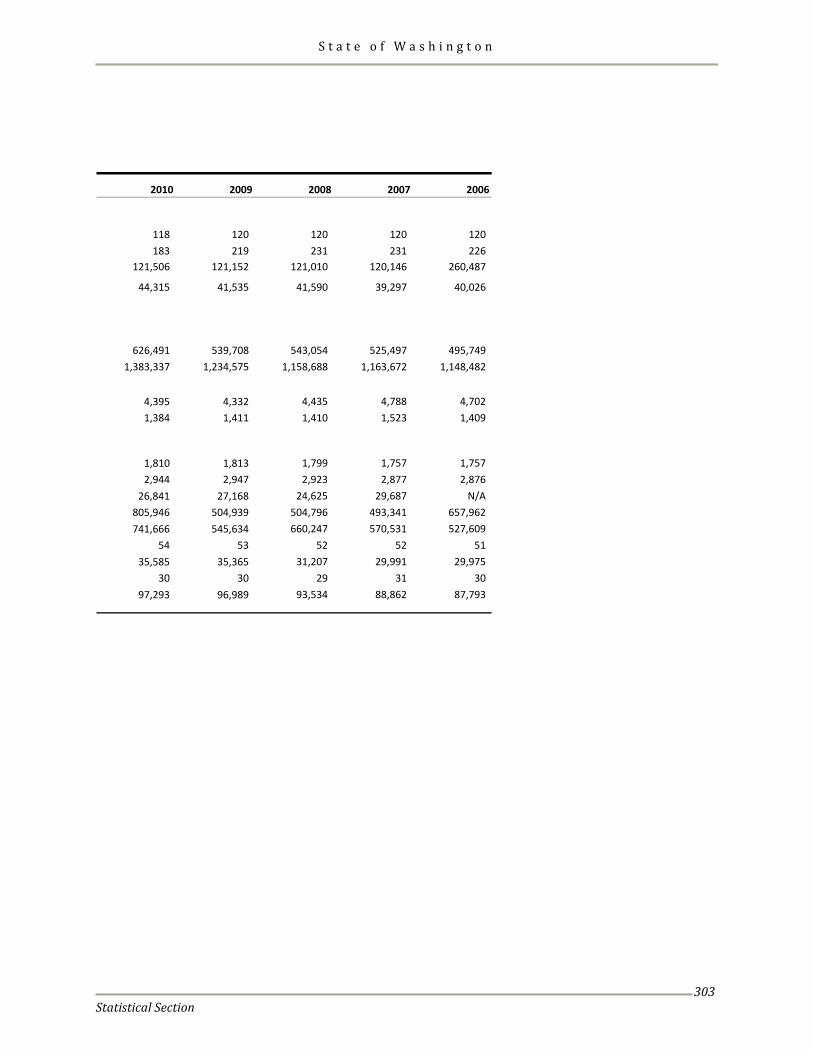
S t a t e o f W a s h i n g t o n
Statistical Section
303
2010 2009 2008 2007 2006
118 120 120 120 120 183 219 231 231 226
121,506 121,152 121,010 120,146 260,487
44,315 41,535 41,590 39,297 40,026
626,491 539,708 543,054 525,497 495,749 1,383,337 1,234,575 1,158,688 1,163,672 1,148,482
4,395 4,332 4,435 4,788 4,702 1,384 1,411 1,410 1,523 1,409
1,810 1,813 1,799 1,757 1,757 2,944 2,947 2,923 2,877 2,876
26,841 27,168 24,625 29,687 N/A805,946 504,939 504,796 493,341 657,962 741,666 545,634 660,247 570,531 527,609
54 53 52 52 51 35,585 35,365 31,207 29,991 29,975
30 30 29 31 30 97,293 96,989 93,534 88,862 87,793
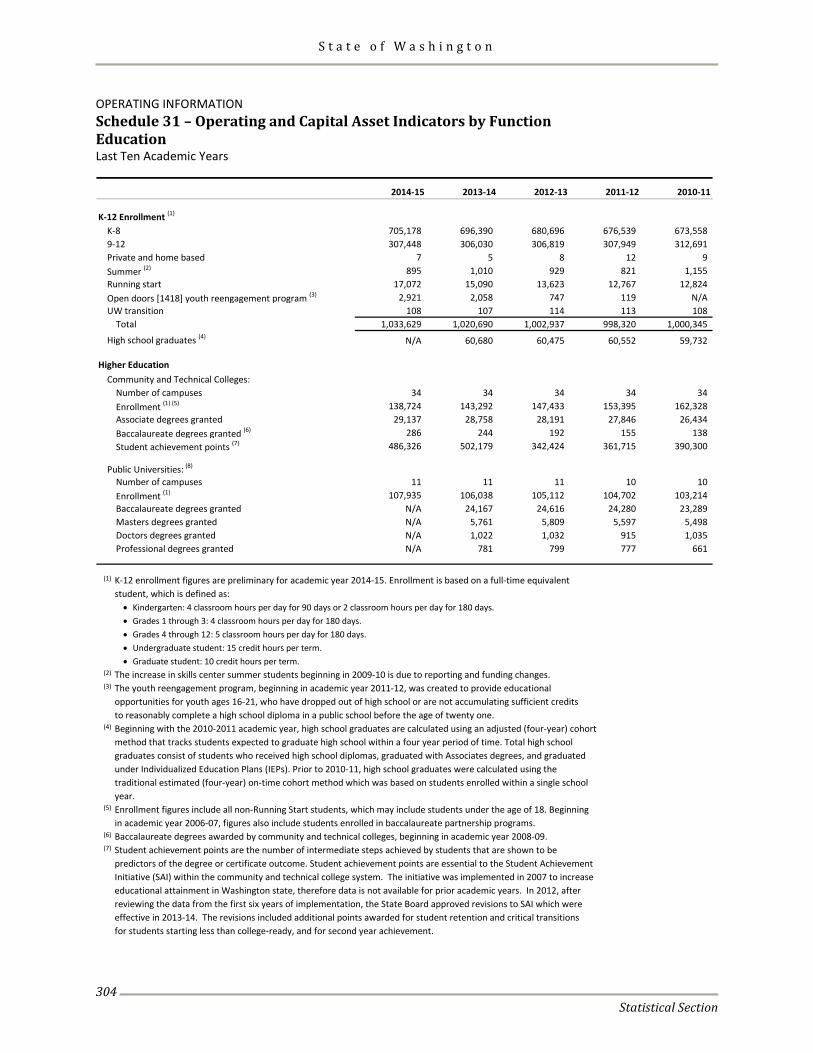
S t a t e o f W a s h i n g t o n
Statistical Section
304
OPERATING INFORMATION Schedule 31 – Operating and Capital Asset Indicators by Function Education Last Ten Academic Years
2014-15 2013-14 2012-13 2011-12 2010-11
K-12 Enrollment (1)
K-8 705,178 696,390 680,696 676,539 673,558 9-12 307,448 306,030 306,819 307,949 312,691 Private and home based 7 5 8 12 9 Summer (2) 895 1,010 929 821 1,155 Running start 17,072 15,090 13,623 12,767 12,824 Open doors [1418] youth reengagement program (3) 2,921 2,058 747 119 N/AUW transition 108 107 114 113 108
Total 1,033,629 1,020,690 1,002,937 998,320 1,000,345
High school graduates (4) N/A 60,680 60,475 60,552 59,732
Higher EducationCommunity and Technical Colleges:
Number of campuses 34 34 34 34 34 Enrollment (1) (5) 138,724 143,292 147,433 153,395 162,328 Associate degrees granted 29,137 28,758 28,191 27,846 26,434 Baccalaureate degrees granted (6) 286 244 192 155 138 Student achievement points (7) 486,326 502,179 342,424 361,715 390,300
Public Universities: (8)
Number of campuses 11 11 11 10 10 Enrollment (1) 107,935 106,038 105,112 104,702 103,214 Baccalaureate degrees granted N/A 24,167 24,616 24,280 23,289 Masters degrees granted N/A 5,761 5,809 5,597 5,498 Doctors degrees granted N/A 1,022 1,032 915 1,035 Professional degrees granted N/A 781 799 777 661
(1) K-12 enrollment figures are preliminary for academic year 2014-15. Enrollment is based on a full-time equivalent student, which is defined as:
• Kindergarten: 4 classroom hours per day for 90 days or 2 classroom hours per day for 180 days.• Grades 1 through 3: 4 classroom hours per day for 180 days.• Grades 4 through 12: 5 classroom hours per day for 180 days.• Undergraduate student: 15 credit hours per term.• Graduate student: 10 credit hours per term.
(2) The increase in skills center summer students beginning in 2009-10 is due to reporting and funding changes.(3) The youth reengagement program, beginning in academic year 2011-12, was created to provide educational
opportunities for youth ages 16-21, who have dropped out of high school or are not accumulating sufficient creditsto reasonably complete a high school diploma in a public school before the age of twenty one.
(4) Beginning with the 2010-2011 academic year, high school graduates are calculated using an adjusted (four-year) cohort method that tracks students expected to graduate high school within a four year period of time. Total high school graduates consist of students who received high school diplomas, graduated with Associates degrees, and graduated under Individualized Education Plans (IEPs). Prior to 2010-11, high school graduates were calculated using thetraditional estimated (four-year) on-time cohort method which was based on students enrolled within a single school year.
(5) Enrollment figures include all non-Running Start students, which may include students under the age of 18. Beginning in academic year 2006-07, figures also include students enrolled in baccalaureate partnership programs.
(6) Baccalaureate degrees awarded by community and technical colleges, beginning in academic year 2008-09.(7) Student achievement points are the number of intermediate steps achieved by students that are shown to be
predictors of the degree or certificate outcome. Student achievement points are essential to the Student Achievement Initiative (SAI) within the community and technical college system. The initiative was implemented in 2007 to increaseeducational attainment in Washington state, therefore data is not available for prior academic years. In 2012, afterreviewing the data from the first six years of implementation, the State Board approved revisions to SAI which wereeffective in 2013-14. The revisions included additional points awarded for student retention and critical transitionsfor students starting less than college-ready, and for second year achievement.
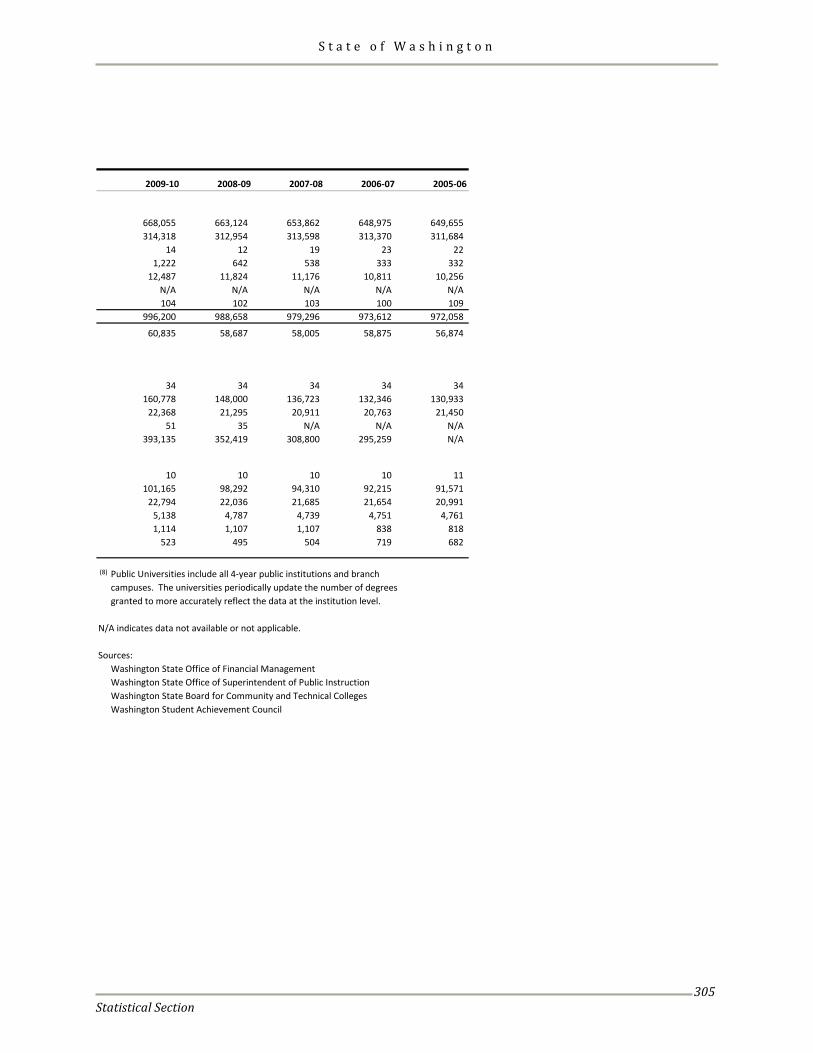
S t a t e o f W a s h i n g t o n
Statistical Section
305
2009-10 2008-09 2007-08 2006-07 2005-06
668,055 663,124 653,862 648,975 649,655 314,318 312,954 313,598 313,370 311,684
14 12 19 23 22 1,222 642 538 333 332
12,487 11,824 11,176 10,811 10,256 N/A N/A N/A N/A N/A104 102 103 100 109
996,200 988,658 979,296 973,612 972,058
60,835 58,687 58,005 58,875 56,874
34 34 34 34 34 160,778 148,000 136,723 132,346 130,933
22,368 21,295 20,911 20,763 21,450 51 35 N/A N/A N/A
393,135 352,419 308,800 295,259 N/A
10 10 10 10 11 101,165 98,292 94,310 92,215 91,571
22,794 22,036 21,685 21,654 20,991 5,138 4,787 4,739 4,751 4,761 1,114 1,107 1,107 838 818
523 495 504 719 682
(8) Public Universities include all 4-year public institutions and branch campuses. The universities periodically update the number of degreesgranted to more accurately reflect the data at the institution level.
N/A indicates data not available or not applicable.
Sources:Washington State Office of Financial ManagementWashington State Office of Superintendent of Public InstructionWashington State Board for Community and Technical CollegesWashington Student Achievement Council

S t a t e o f W a s h i n g t o n
Statistical Section
306
This page intentionally left blank.


WASHINGTON STATE OFFICE OF FINANCIAL MANAGEMENT
INSURANCE BUILDING • PO BOX 43113OLYMPIA, WA 98504-3113 • (360) 902-0555 • FAX (360) 664-2832