Comprehensive Annual Financial Report - Port of … of Oakland Oakland, California (A Component Unit...
98
Comprehensive Annual Financial Report For the Years Ended June 30, 2010 and 2009 Oakland, California (A Component Unit of the City of Oakland)
Transcript of Comprehensive Annual Financial Report - Port of … of Oakland Oakland, California (A Component Unit...
Comprehensive Annual Financial
Report
For the Years Ended June 30, 2010 and 2009
Oakland, California(A Component Unit of the City of Oakland)


Port of Oakland Oakland, California
(A Component Unit of the City of Oakland)
Comprehensive Annual Financial Report For the Years Ended June 30, 2010 and 2009
Prepared by the Financial Services Division
Oliviér Flewellen
Director of Finance/Controller


PORT OF OAKLAND (A Component Unit of the City of Oakland)
COMPREHENSIVE ANNUAL FINANCIAL REPORT
Fiscal Years Ended June 30, 2010 and 2009
Table of Contents
Pages INTRODUCTORY SECTION
Letter of Transmittal ................................................................................................................ i GFOA Certificate of Achievement for Excellence in Financial Reporting ............................. v Organization Chart ................................................................................................................. vi Appointed Officials, Senior Staff and Project Team ............................................................ vii
FINANCIAL SECTION Independent Auditors’ Report ................................................................................................... 1-2 Management’s Discussion and Analysis (Unaudited) ............................................................ 3-17 Basic Financial Statements:
Statements of Net Assets .................................................................................................. 18-19 Statements of Revenues, Expenses and Changes in Net Assets ....................................... 20-21 Statements of Cash Flows ................................................................................................. 22-23 Notes to Financial Statements ........................................................................................... 24-56
Required Supplementary Information (Unaudited): Schedule of Funding Progress - Other Postemployment Benefits…………………………..57 STATISTICAL SECTION (Unaudited)
Index to Statistical Section .................................................................................................... 59 Net Assets by Components .................................................................................................... 60 Statements of Revenues, Expenses and Changes in Net Assets ............................................ 61 Principal Revenue Sources and Airline Revenue per Enplaned Passenger ........................... 62 Aviation Statistics – South Airport ........................................................................................ 63 Top Ten Individual Sources of Aviation Revenue by Alphabetical Order ............................ 64 Schedule of Airline Rates and Changes ................................................................................. 65 Principal Revenue Sources, Revenue per Container .............................................................. 66 Maritime Division – Container Trends .................................................................................. 67 Top Ten Individual Sources of Maritime Revenue by Alphabetical Order ........................... 68 Net Revenue Calculation For Debt Service Coverage ........................................................... 69 Debt Service Coverage .......................................................................................................... 70 Ratios of Debt Service ........................................................................................................... 71 Demographic and Economic Statistics for the City of Oakland ............................................ 72 Principal Employers – FY 2010 vs. FY 2006 ........................................................................ 73 Employee Count by Division ................................................................................................. 74 Capital Assets Statistics by Function/Program ...................................................................... 75

This page left intentionally blank.

INTRODUCTORY SECTION
Letter of Transmittal
GFOA Certificate of Achievement for Excellence in Financial Reporting
Organization Chart
Appointed Officials, Senior Staff and Project Team


PORT OF OAKLAND
December 8, 2010
Board of Port Commissioners of the City of OaklandOakland, California
The annual independent auditors' report and financial statements for the Port of Oakland (Port), aComponent Unit of the City of Oakland (City), for the fiscal years ended June 30, 2010 and 2009are included in this Comprehensive Annual Financial Report. Responsibility for the accuracy ofthe data, and the completeness and reliability of the information contained in this report rests withPort management. The framework of internal controls provides reasonable, rather than absolute,assurance that the financial statements are free of any material misstatements. We believe,therefore, the data as presented are accurate in all material aspects and presented in a mannerdesigned to fairly set forth the financial position and changes in fmancial position of the Port.
Management's discussion and analysis (MD&A), which appears on pages 3-17 of this report,provides a narrative overview and analysis of the basic financial statements. The MD&A shouldbe read in conjunction with this letter of transmittal.
Profile of the Port of OaklandThe Port is an independent department of the City. The City has operated a public harbor to servewaterborne commerce since its incorporation in 1852. The City has operated an airport since1927. Exclusive control and management of the Port area, which includes the harbor and airport,were delegated to a seven-member Board of Port Commissioners (Board) in 1927 by anamendment to the City Charter.
The Board has exclusive control of all of the Port's facilities and property, real and personal, allincome and revenues of the Port, and proceeds of all bond sales initiated by it for harbor orairport improvements, or for any other purpose. The Board has the power under the charter to fix,alter, change or modify the rates, tolls, fees, rentals and charges for the use of the Port's facilitiesand any services provided in connection with the Port's facilities. The Port has three majorbusiness lines - Aviation, Maritime and Commercial Real Estate.
The Aviation Division operates Oakland International Airport (OAK), a passenger, cargo andgeneral aviation airport which offers 152 commercial passenger non-stop flights daily to 32domestic and international destinations and 49 all-cargo flights as of June 2010. Enplanements infiscal year 2010 were 4.8 million passengers. The airport occupies approximately 2,600 acresand is divided into North and South Field. North Field is dedicated to corporate and generalaviation along with some cargo activity. South Field houses commercial airport operations.
The Maritime Division manages the fifth busiest cargo container port in North America based onthe number of twenty-foot equivalent units (TEUs) handled annually. More than 2 million TEUsin calendar year 2009 were moved. The Port's maritime area consists of approximately 1,110acres, 786 of which are developed container terminal areas. The remaining space contains rail
530 Water Street _ Jack London Square _ P.O. Box 2064Telephone: (510) 627-1100 _ Facsimile: (510) 627-1826 _
i
_ Oakland, California 94604-2064Web Page: www.portofoakland.com

intennodal tenninal facilities and areas for truck staging, container storage and maritime supportservices, and the fonner Oakland Anny Base. The Port currently has 8 marine tenninals and 36container cranes (30 post-Panamax cranes of which 15 are super post-Panamax cranes). Morethan 25 shipping lines call at Oakland, linking the Bay Area with the major trading centers ofglobal commerce around the world.
The Commercial Real Estate Division (CRE) oversees a total of 874 acres of land along theOakland Estuary which includes warehouses, parking lots, hotels, offices, shops and restaurants.CRE oversees all of the Port's commercial real estate that is not used for maritime or aviationpurposes. The majority of the land was granted to the Port years ago as part of the StateTidelands Trust grants. The Port acts as trustee for the waterfront property serving commercial,recreational and other public access purposes as well as for all its other Tidelands Trustproperties.
The Port's operating budget is an essential and major component in its overall planning andmanagement process. The operating budget is a plan for each division's operating revenue andexpenses and for Port-wide non-operating income and expenses. A three-year operating budget ispresented annually to the Board. The current fiscal year operating budget is adopted by theBoard, while the subsequent years are presented only in concept and not for adoption. Inaddition, the Port's 5-year Capital Needs Assessment and current fiscal year capital budget arepresented to the Board. The current fiscal year capital budget is adopted by the Board while the5-Year Capital Needs Assessment is presented only in concept and not for adoption. Theapproved fiscal year 2010-2011 Operating and Capital Budgets are posted on the Port's website athttp://www.portofoakland.com/portnyou/investors.asp.
Economic OutlookThe Port's major lines of business continue to be pressured by the general downturn in the U.S.economy and by the unprecedented global downturn, which continues to have an adverse impacton the Port's tenants and customers.
The Aviation Division has been negatively impacted by the recent U.S. recession, airlinebankruptcies, airline capacity reductions at OAK, and increased competition from low costcarriers at neighboring San Francisco International Airport. In fiscal year 2010, passengeractivity declined by 3.7% which resulted in reduced parking and tenninal concession revenues,and Customer Facility Charges. Passenger traffic, however, for the time period November 2009through June 2010 increased 1.4% compared to the same time period the prior year. In addition,in 2009, OAK welcomed two new airlines that added six new destinations to OAK's route map,while maintaining service to all of its existing routes. The financial challenges, however, areexpected to persist for the airline industry and demand for airline traffic is expected to remainmuted due to general economic conditions. Passenger traffic is projected to be essentially flat forfiscal year 2011 compared to fiscal year 2010. Aviation revenues were flat in fiscal year 2010compared to fiscal year 2009 and are projected to increase 1.9% in fiscal year 2011.
Cargo, as measured by full TEUs, increased 7.7% while Maritime operating revenues increasedby 1.9% in fiscal year 2010 compared to fiscal year 2009. The Port has long-tenn contracts withall of its major maritime tenants. These contracts include a revenue component in the fonn ofMinimum Annual Guaranteed revenues (MAGs). The MAGs provide a degree of revenuestability and in fiscal year 2010 provided the majority (83.5%) of maritime revenues. Full TEUsare projected to increase by 1.4% while revenues are expected to be reduced by 3.6% in fiscalyear 2011 compared to fiscal year 2010. Because ofthe MAGs and temporary space assignmentswith our maritime tenants, there is not always a direct correlation between TEU activity andrevenues.
11

The CRE Division has also been impacted by the downturn in the economy. CRE revenues weredown 4.2% in fiscal year 20 I0 compared to fiscal year 2009 and are projected to decrease another4.8% in fiscal year 2011 due to continued decrease in demand for parking and reduction inpercentage rent due to decrease spending at Port tenant properties.
Strategic PlanIn November 2009, the Port began updating its Strategic Plan. On October 5, 2010, the Boardapproved the Port of Oakland Strategic Plan Fiscal Years 2011-2015. The Port's Strategic Plan isenvisioned as both an on-going planning process and a documented plan. The Strategic Plan willserve as a general statement of the Port's vision, mission, goals, objectives, and guiding principlesto guide organizational performance and decision-making over the next five years.
The objectives of the Strategic Plan include:Prepare the Port organization for continued growth and change;Articulate a coherent vision and mission, as well as prioritized goals, objectivesand guiding principles;Develop guiding principles criteria against which recommended actions can bemeasured and weighed to assist in decision-making;Clarify the Board's and staffs roles, responsibilities, and spheres of decisionmaking; andSet agreed-upon priorities for near term action.
Major InitiativesDespite weak economic conditions, the Port accomplished many of its major initiatives in fiscalyear 2010, including: implementation of the Comprehensive Truck Management Program andMaritime Air Quality Program, lease and concession of Berths 20-24 to Ports America OuterHarbor Terminal, and substantial completion of the -50 foot channel deepening, as well aswelcoming the addition of two new airlines that added six new destinations to OAK's route map.In addition, in January 20 I0, the Port defeased $48.5 million of its outstanding bonds.
While the upcoming year is also expected to be challenging, the Port has several initiativesunderway to support the long-term sustainability of the Port, including:
Terminal I Improvements. Planned improvements at Terminal I focus on replacement of aginginfrastructure, bringing building systems up to code, and improving life cycle costs.Improvements include seismic retrofit, mechanical upgrades and new special systems and somearchitecturaVlife cycle maintenance upgrades. The Terminal I improvement project also includesa new mechanical building and upgraded Central Utility Plant (CUP). It is anticipated thatconstruction on the CUP may begin in 2011 and major construction of the Terminal I renovationmay begin in 2012.
Air Service Development. Aviation is developing an enhanced and competitive incentiveprogram to encourage new domestic passenger service, in order to increase passenger traffic andassociated revenues.
Oakland Army Base Redevelopment. The Port is currently in the process of preparing for thefuture development of approximately 168 acres at the former Oakland Army Base (OAB), whichwould enhance the Port's maritime facilities and its ability to handle cargo. The Port currentlycontemplates that the OAB property will be redeveloped into a trade and logistics centercomprised of a rail terminal and warehouses to facilitate the clean and efficient movement ofcargo in and out of the Port's maritime terminals. In connection with the redevelopment of theOAB property, the Port is preparing to make improvements to the public streets that service the
111

OAB and other Port mantIme terminals that will further enhance the flow of traffic andmovement of cargo into and out of the Port.
Shore Power. California law requires container vessels berthed at the Port of Oakland to reduceemissions associated with auxiliary engines powering the vessel. In September 2010, the Boardadopted a Resolution finding and determining that it is in the best interest of the Port to design,build, and finance shore power infrastructure in cooperation with its marine terminal operatorsand ocean carrier customers provided that the Port commitment does not exceed a total amount of$57 million without subsequent Board action.
Export Marketing Program. Maritime is developing an export marketing program to increase anddiversify cargo activity and associated revenues by creating partnerships between ocean carriers,terminal operators, logistics service providers, promotion associations, and exporters.
Oak to Ninth Development. The Port is currently working with a private developer to redevelopthe Oak-to-Ninth waterfront district, centrally located on the Oakland Estuary minutes from JackLondon Square and downtown Oakland. The intention is to create a new waterfrontneighborhood with many acres of new public access and open space.
AwardsThe Port has received GFOA's Certificate of Achievement for Excellence in Financial Reportingfor the Port's Comprehensive Annual Financial Report for the fiscal year ended June 30, 2009.The Port has also received GFOA's Distinguished Budget Presentation Award for its annualbudget document for the fiscal year beginning July 1, 2009 for the fourth consecutive year.
AcknowledgementsWe would like to express our appreciation to the Financial Services Division for theirprofessionalism, dedication, and efficiency in the preparation of this report. We also extend ourappreciation to the other Port Divisions who contributed to this report and to Macias Gini &O'Connell LLP for their assistance and guidance.
Finally, we thank the Board of Port Commissioners for their interest and continuing support inplanning and conducting the Port's fmancial operations in a responsible and progressive manner.
2~~ittoo,
" Chief Financial Officer
IV
Olivier FlewellenDirector of Finance/Controller

v
Certificate of Achievement for Excellence
in Financial Reporting
Presented to
Port of OaklandCalifornia
For its Comprehensive Annual
Financial Report for the Fiscal
Year Ended June 30, 2009
A Certificate of Achievement for Excellence in Financial Reporting is presented by the Government Finance Officers Association of the United States and Canada to government
units and public employee retirement systems whose comprehensive annual financial reports (CAFRs) achieve
the highest standards in government accounting and financial reporting.
President
Executive Director

vi
PORT OF OAKLAND
ORGANIZATION CHARTFiscal Year 2009-10
480 Funded FTEs (Full-Time Equivalents)1
- South Airport-- Administration-- Services-- Landside
Operations-- Airside
Operations-- Security-- Properties-- Airport Business
- North Airport- Marketing
-- Operations-- Properties
- Facilities-- Administration-- Construction &
Maintenance
- Administration - Operations- Marketing- Security- Facilities
-- Administration-- Construction &
Maintenance
- Development - Asset Management
- Administration- Organizational
Effectiveness-- ISO Manager
- Human Resources- Building Services- Equal Opportunity- Media and Public
Relations
- Administration- Construction Management- Dredging- Engineering Services- Project Design & Delivery - Aviation- Project Design & Delivery - Maritime- Utilities & Support
- Community and Customer Relations- Employment Resources Development Program- Contract Compliance
- Administration- Compliance and
Safety- Aviation/
Commercial Real Estate
- Maritime
Executive4 FTEs
Maritime65 FTEs
CommercialReal Estate
7 FTEs
Aviation263 FTEs
Corporate Administrative
Services22 FTEs
Engineering44 FTEs
Social Responsibility
10 FTEs
Environmental Programs and
Planning16 FTEs
Financial Services45 FTEs
Board of Port Commissioners
7 members
Port Attorney14 FTEs
Audit Services7 FTEs
Secretary of the Board2 FTEs
- Finance/Controller- Financial Planning- Purchasing- Enterprise Risk Management- Information Technology
Operations Admin1 FTE
1Total FTE Positions 500.0 Less: Vacancy Factor (10.0) Retirement Incentive Program (10.0) Net Funded FTE Positions 480.0

vii
PORT OF OAKLAND
COMPREHENSIVE FINANCIAL REPORT For the Year Ended
June 30, 2010
Board of Port Commissioners of the City of Oakland
Victor Uno, President James W. Head, First Vice-President Margaret Gordon, Second Vice-President Pamela Calloway, Commissioner Gilda Gonzales, Commissioner Kenneth Katzoff, Commissioner Michael Lighty, Commissioner
Senior Staff Omar R. Benjamin, Executive Director Joyce Washington, Acting Deputy Executive Director David L. Alexander, Port Attorney John T. Betterton, Secretary of the Board Arnel Atienza, Chief Audit Officer James J. Kwon, Director of Maritime Deborah Ale-Flint, Director of Aviation Pamela Kershaw, Acting Director of Commercial Real Estate Sara Lee, Chief Financial Officer Oliviér Flewellen, Director of Finance/Controller Chris Chan, Acting Director of Engineering Diann Castleberry, Director of Social Responsibility/Acting Director of
Administration Richard Sinkoff, Director of Environmental Programs and Planning
530 Water Street Oakland, California 94607
Phone: 510-627-1100
Website: portofoakland.com
CAFR Project Team Oliviér Flewellen, Director of Finance/Controller Cecilia Ravare Betsy Kwok Katri Jones Stanley Tanaka Leandro Denoga Alice Fan Ceola Richardson Sandra Yee Saw May Khoo Andrea Zamora

viii
This page left intentionally blank.
FINANCIAL SECTION
Independent Auditors’ Report
Management’s Discussion and Analysis (unaudited)
Basic Financial Statements
Required Supplementary Information (unaudited)

1
Board of Port Commissioners of the City of Oakland Oakland, California
Independent Auditors’ Report We have audited the accompanying basic financial statements of the Port of Oakland (Port), a component unit of the of the City of Oakland, California, as of and for the years ended June 30, 2010 and 2009, as listed in the table of contents. These financial statements are the responsibility of the Port’s management. Our responsibility is to express an opinion on these financial statements based on our audits. We conducted our audits in accordance with auditing standards generally accepted in the United States of America and the standards applicable to financial audits contained in Government Auditing Standards, issued by the Comptroller General of the United States. Those standards require that we plan and perform the audits to obtain reasonable assurance about whether the financial statements are free of material misstatement. An audit includes consideration of internal control over financial reporting as a basis for designing audit procedures that are appropriate in the circumstances, but not for the purpose of expressing an opinion on the effectiveness of the Port’s internal control over financial reporting. Accordingly, we express no such opinion. An audit also includes examining, on a test basis, evidence supporting the amounts and disclosures in the financial statements, assessing the accounting principles used and significant estimates made by management, as well as evaluating the overall financial statement presentation. We believe that our audits provide a reasonable basis for our opinion. In our opinion, the financial statements referred to above present fairly, in all material respects, the financial position of the Port as of June 30, 2010 and 2009, and the changes in its financial position and its cash flows for the years then ended in conformity with accounting principles generally accepted in the United States of America. As described in Note 2 to the financial statements, the Port implemented the provisions of Governmental Accounting Standards Board (GASB) Statement No. 49, Accounting and Financial Reporting for Pollution Remediation Obligations and GASB Statement No. 51, Accounting and Financial Reporting for Intangible Assets, effective July 1, 2008. In accordance with Government Auditing Standards, we have also issued our report dated December 8, 2010 on our consideration of the Port’s internal control over financial reporting and on our tests of its compliance with certain provisions of laws, regulations, contracts and grant agreements and other matters. The purpose of that report is to describe the scope of our testing of internal control over financial reporting and compliance and the results of that testing, and not to provide an opinion on the internal control over financial reporting or on compliance. That report is an integral part of an audit performed in accordance with Government Auditing Standards and should be considered in assessing the results of our audit.

2
Our audit was conducted for the purpose of forming an opinion on the basic financial statements taken as a whole. The introductory and statistical sections listed in the table of contents are presented for purposes of additional analysis and are not a required part of the basic financial statements. Such additional information has not been subjected to the auditing procedures applied in the audit of the basic financial statements and, accordingly, we express no opinion on them. Certified Public Accountants Oakland, California December 8, 2010

Port of Oakland (A Component Unit of the City of Oakland)
Management’s Discussion and Analysis (unaudited) June 30, 2010 and 2009
(dollar amounts in thousands)
3
Management’s Discussion and Analysis The Management’s Discussion and Analysis (MD&A) is intended to provide information concerning known facts and conditions affecting the Port of Oakland’s (the Port) operations. The statements are not forecasts or statements of the future generally known as “forward-looking statements.” The achievement of results, or other expectations, involves known and unknown risks, uncertainties and other factors that may cause actual results to be materially different than forecasted results. The Port is not obligated to issue updates or revisions to this discussion if and when the expectations, events, conditions or circumstances on which these statements are based, occur or fail to occur, as the case may be. The following discussion and analysis of the financial performance and activities of the Port provides an introduction and understanding of the financial statements of the Port for the fiscal years ended June 30, 2010 and 2009. This MD&A has been prepared by management and should be read in conjunction with the financial statements and the accompanying notes, which follow this section. Financial Statement Overview The Port’s financial report includes MD&A, the basic financial statements, and the notes to the basic financial statements. The report includes the following three basic financial statements: the Statements of Net Assets; the Statements of Revenues, Expenses and Changes in Net Assets; and the Statements of Cash Flows. This report also includes required and other supplementary information in addition to the basic financial statements. The Port, an enterprise fund, prepares the basic financial statements on an accrual basis in accordance with generally accepted accounting principles promulgated by the Governmental Accounting Standards Board (GASB). Revenues are recognized when earned, not when received, and expenses are recognized when incurred, not when paid. Capital assets are capitalized and, with the exception of land and noise easements, depreciated over their useful lives.
Port of Oakland (A Component Unit of the City of Oakland)
Management’s Discussion and Analysis (unaudited) June 30, 2010 and 2009
(dollar amounts in thousands)
4
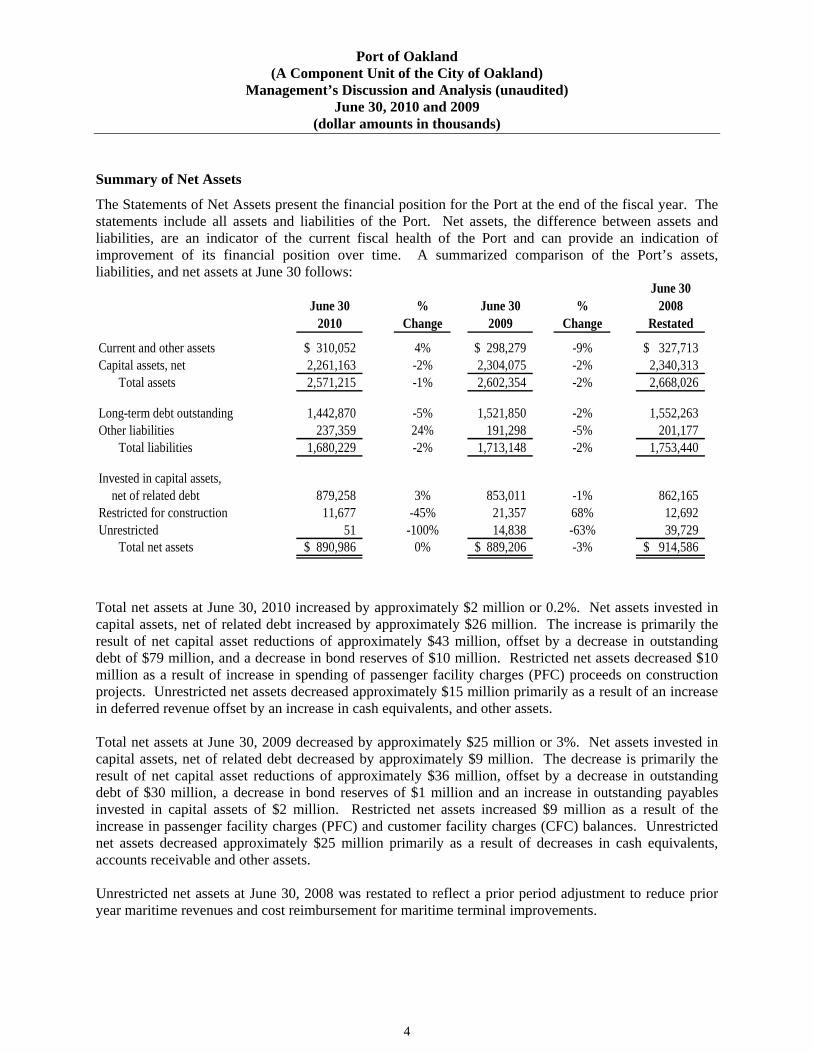
Summary of Net Assets The Statements of Net Assets present the financial position for the Port at the end of the fiscal year. The statements include all assets and liabilities of the Port. Net assets, the difference between assets and liabilities, are an indicator of the current fiscal health of the Port and can provide an indication of improvement of its financial position over time. A summarized comparison of the Port’s assets, liabilities, and net assets at June 30 follows:
June 30 2010
% Change
June 30 2009
% Change
June 30 2008
Restated
Current and other assets 310,052$ 4% 298,279$ -9% 327,713$ Capital assets, net 2,261,163 -2% 2,304,075 -2% 2,340,313
Total assets 2,571,215 -1% 2,602,354 -2% 2,668,026
Long-term debt outstanding 1,442,870 -5% 1,521,850 -2% 1,552,263 Other liabilities 237,359 24% 191,298 -5% 201,177
Total liabilities 1,680,229 -2% 1,713,148 -2% 1,753,440
Invested in capital assets, net of related debt 879,258 3% 853,011 -1% 862,165
Restricted for construction 11,677 -45% 21,357 68% 12,692 Unrestricted 51 -100% 14,838 -63% 39,729
Total net assets 890,986$ 0% 889,206$ -3% 914,586$
Total net assets at June 30, 2010 increased by approximately $2 million or 0.2%. Net assets invested in capital assets, net of related debt increased by approximately $26 million. The increase is primarily the result of net capital asset reductions of approximately $43 million, offset by a decrease in outstanding debt of $79 million, and a decrease in bond reserves of $10 million. Restricted net assets decreased $10 million as a result of increase in spending of passenger facility charges (PFC) proceeds on construction projects. Unrestricted net assets decreased approximately $15 million primarily as a result of an increase in deferred revenue offset by an increase in cash equivalents, and other assets. Total net assets at June 30, 2009 decreased by approximately $25 million or 3%. Net assets invested in capital assets, net of related debt decreased by approximately $9 million. The decrease is primarily the result of net capital asset reductions of approximately $36 million, offset by a decrease in outstanding debt of $30 million, a decrease in bond reserves of $1 million and an increase in outstanding payables invested in capital assets of $2 million. Restricted net assets increased $9 million as a result of the increase in passenger facility charges (PFC) and customer facility charges (CFC) balances. Unrestricted net assets decreased approximately $25 million primarily as a result of decreases in cash equivalents, accounts receivable and other assets. Unrestricted net assets at June 30, 2008 was restated to reflect a prior period adjustment to reduce prior year maritime revenues and cost reimbursement for maritime terminal improvements.

Port of Oakland (A Component Unit of the City of Oakland)
Management’s Discussion and Analysis (unaudited) June 30, 2010 and 2009
(dollar amounts in thousands)
5
Summary of Revenues, Expenses and Changes in Net Assets The Statements of Revenues, Expenses and Changes in Net Assets reflect how the Port’s net assets changed during the most recent fiscal year compared to the prior year. These changes are reported as soon as the underlying event giving rise to the change occurs, regardless of the timing of related cash flows. The following is a summary of the Statements of Revenues, Expenses and Changes in Net Assets:
June 30 2010
% Change
June 30 2009
% Change
June 30 2008
Restated
Operating revenues 285,225$ 1% 283,290$ -6% 299,883$ Passenger facility charge revenue 19,702 2% 19,391 -28% 27,033 Customer facility charge revenue 4,530 -13% 5,235 -25% 6,999 Interest income 8,635 -11% 9,655 -27% 13,145 Other income 292 100% - -100% 2,452
Total revenues 318,384 0% 317,571 -9% 349,512
Operating expenses before depreciation 149,899 -10% 167,307 -1% 169,367 Depreciation 98,810 2% 96,938 9% 88,907 Interest expense 78,518 0% 78,415 2% 76,796 Loss on debt defeasance 4,158 100% - 0% - Other expense - -100% 5,072 100% -Loss on disposal of capital assets 6,562 1409% 435 -97% 14,985
Total expenses 337,947 -3% 348,167 -1% 350,055
Change in net assets before capitalcontributions (19,563) -36% (30,596) 5535% (543)
Capital contributions:Grants from government agencies 21,343 79% 11,896 -56% 27,092
Increase (decrease) in net assets 1,780 110% (18,700) -170% 26,549 Net assets, beginning of the year 889,206 -3% 914,586 2% 897,249 Prior period adjustment - -100% (6,680) -27% (9,212)
Net assets, end of the year 890,986$ 0% 889,206$ -3% 914,586$
Twelve Months Ended
Port of Oakland (A Component Unit of the City of Oakland)
Management’s Discussion and Analysis (unaudited) June 30, 2010 and 2009
(dollar amounts in thousands)
6
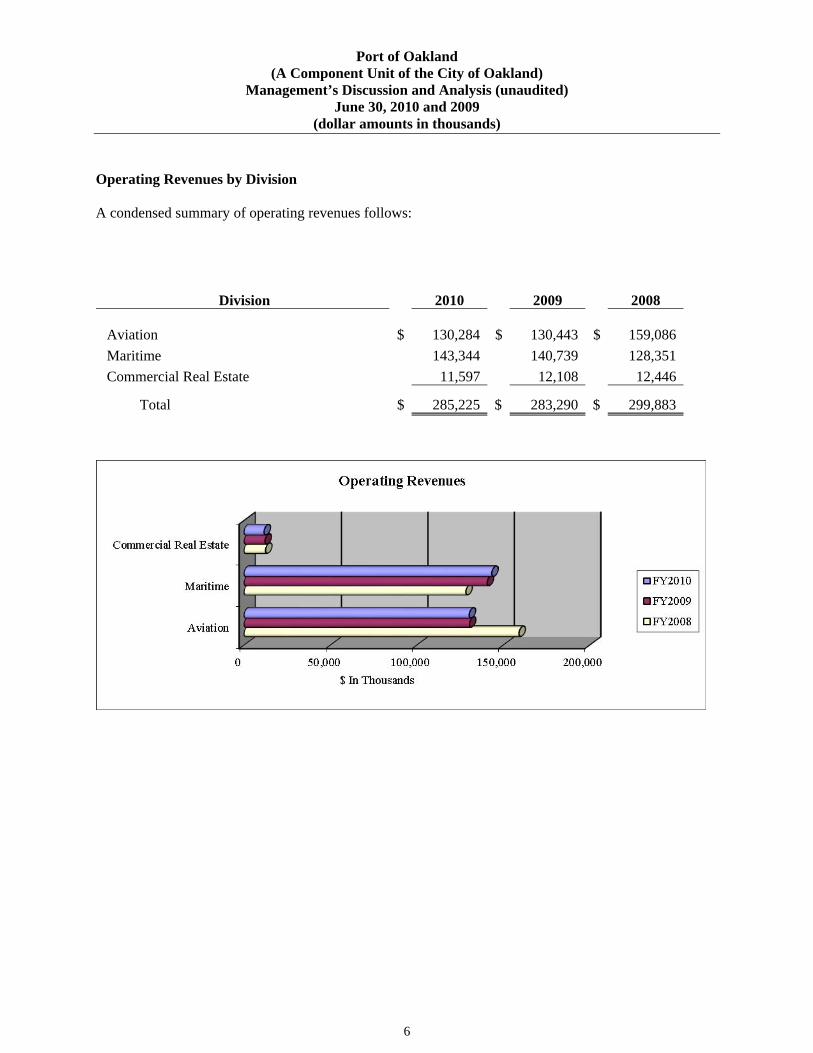
Operating Revenues by Division A condensed summary of operating revenues follows:
Division 2010 2009 2008
Aviation
$ 130,284
$ 130,443
$ 159,086
Maritime 143,344 140,739 128,351
Commercial Real Estate 11,597 12,108 12,446
Total $ 285,225 $ 283,290 $ 299,883
Port of Oakland (A Component Unit of the City of Oakland)
Management’s Discussion and Analysis (unaudited) June 30, 2010 and 2009
(dollar amounts in thousands)
7
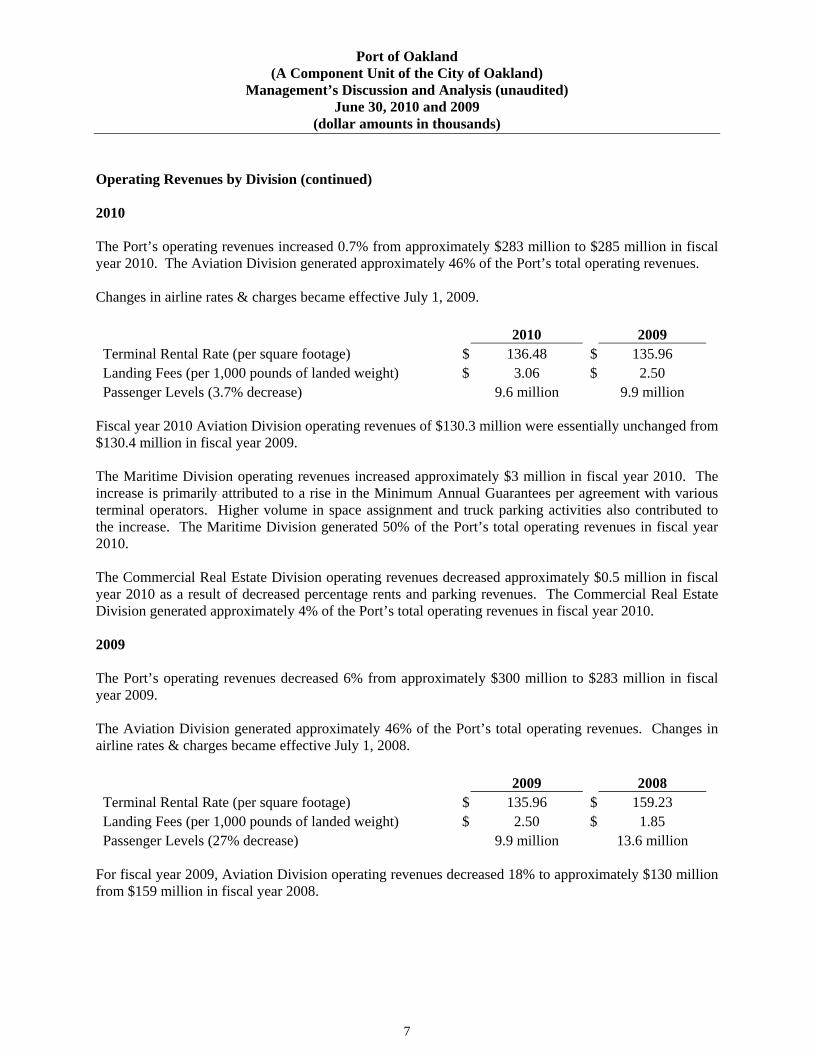
Operating Revenues by Division (continued) 2010 The Port’s operating revenues increased 0.7% from approximately $283 million to $285 million in fiscal year 2010. The Aviation Division generated approximately 46% of the Port’s total operating revenues. Changes in airline rates & charges became effective July 1, 2009. 2010 2009 Terminal Rental Rate (per square footage) $ 136.48 $ 135.96 Landing Fees (per 1,000 pounds of landed weight) $ 3.06 $ 2.50 Passenger Levels (3.7% decrease) 9.6 million 9.9 million
Fiscal year 2010 Aviation Division operating revenues of $130.3 million were essentially unchanged from $130.4 million in fiscal year 2009. The Maritime Division operating revenues increased approximately $3 million in fiscal year 2010. The increase is primarily attributed to a rise in the Minimum Annual Guarantees per agreement with various terminal operators. Higher volume in space assignment and truck parking activities also contributed to the increase. The Maritime Division generated 50% of the Port’s total operating revenues in fiscal year 2010. The Commercial Real Estate Division operating revenues decreased approximately $0.5 million in fiscal year 2010 as a result of decreased percentage rents and parking revenues. The Commercial Real Estate Division generated approximately 4% of the Port’s total operating revenues in fiscal year 2010. 2009 The Port’s operating revenues decreased 6% from approximately $300 million to $283 million in fiscal year 2009. The Aviation Division generated approximately 46% of the Port’s total operating revenues. Changes in airline rates & charges became effective July 1, 2008. 2009 2008 Terminal Rental Rate (per square footage) $ 135.96 $ 159.23 Landing Fees (per 1,000 pounds of landed weight) $ 2.50 $ 1.85 Passenger Levels (27% decrease) 9.9 million 13.6 million
For fiscal year 2009, Aviation Division operating revenues decreased 18% to approximately $130 million from $159 million in fiscal year 2008.
Port of Oakland (A Component Unit of the City of Oakland)
Management’s Discussion and Analysis (unaudited) June 30, 2010 and 2009
(dollar amounts in thousands)
8
Operating Revenues by Division (continued) The following contributed to the decreases reflected in Aviation operating revenues:
Reduction in Terminal rates coupled with loss of based airlines such as American, Allegiant, Aloha, ATA, Atlantic Southeast (ASA), Continental, and Expressjet.
Reduction in flights by Alaska, US Airways, Delta, JetBlue, Mexicana, Skywest, Southwest, and United Airlines contributed to lower passenger levels.
Loss of preferential Holdroom airline users (i.e. American & Aloha, etc.). Passenger activity levels decreased by 27.2% from fiscal year 2008 levels. Reduction in Food & Newsstand concession revenues attributable to construction and refitting of
new concession spaces. Overall, demand for parking at the Airport declined 401,247 exits or 27.8% for the fiscal year due
to decreased passenger levels and increased competition by Off-Airport parking tenants. Reduced AirBart revenue due to the decline in ridership by 328,885 passengers or 28.2% from
fiscal year 2008. Fiscal year 2009 Fueling revenue no longer reflects the $9 million payment by the Fuel
consortium in fiscal year 2008 for the reimbursement of past costs. Prepayment of future bond debt service is being amortized throughout the life of the Oakland Fuel Facilities Corporation (OFFC) lease.
The Maritime Division operating revenues increased approximately $12 million in fiscal year 2009. The increase is primarily attributed to a rise in the Minimum Annual Guarantees per agreement with various terminal operators. Higher volume in space assignment and truck parking activities also contributed to the increase. The Maritime Division generated 50% of the Port’s total operating revenues in fiscal year 2009. The Commercial Real Estate Division operating revenues decreased approximately $0.3 million in fiscal year 2009 as a result of decreases in parking revenue. The Commercial Real Estate Division generated approximately 4% of the Port’s total operating revenues in fiscal year 2009.
Port of Oakland (A Component Unit of the City of Oakland)
Management’s Discussion and Analysis (unaudited) June 30, 2010 and 2009
(dollar amounts in thousands)
9
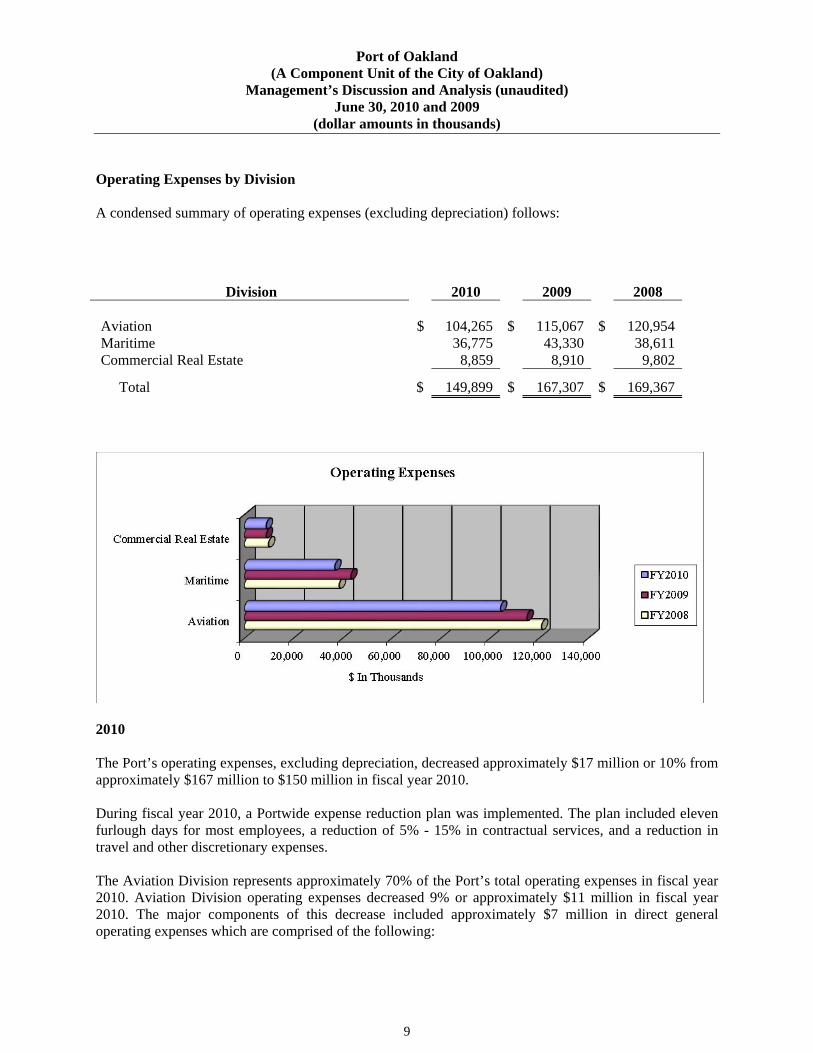
Operating Expenses by Division A condensed summary of operating expenses (excluding depreciation) follows:
2010 The Port’s operating expenses, excluding depreciation, decreased approximately $17 million or 10% from approximately $167 million to $150 million in fiscal year 2010. During fiscal year 2010, a Portwide expense reduction plan was implemented. The plan included eleven furlough days for most employees, a reduction of 5% - 15% in contractual services, and a reduction in travel and other discretionary expenses. The Aviation Division represents approximately 70% of the Port’s total operating expenses in fiscal year 2010. Aviation Division operating expenses decreased 9% or approximately $11 million in fiscal year 2010. The major components of this decrease included approximately $7 million in direct general operating expenses which are comprised of the following:
Division 2010 2009 2008
Aviation
$ 104,265 $ 115,067
$ 120,954
Maritime 36,775 43,330 38,611 Commercial Real Estate 8,859 8,910 9,802
Total $ 149,899 $ 167,307 $ 169,367
Port of Oakland (A Component Unit of the City of Oakland)
Management’s Discussion and Analysis (unaudited) June 30, 2010 and 2009
(dollar amounts in thousands)
10
Operating Expenses by Division (continued) A $2.1 million savings resulted from the reconfiguration of security service deployments by ABC
Security Service, Inc. and the Alameda County Sheriff. A $1.1 million decrease in personnel costs was realized from the unfilled positions after the
retirement of personnel availing of the early retirement program. A decrease of $1.1 million was realized from reduced parking lot and shuttle bus operations due to
lower parking demand and decreased passenger traffic at the Airport. Rental car shuttle operational costs decreased by $840 after reducing the frequency of shuttle bus
operations traveling from the terminal to the car rental facilities. Costs for Aircraft Rescue and Fire Fighting (ARFF) services rendered by the City of Oakland were
reduced by $536. General and administrative costs were reduced by $467 while purchases of supplies were decreased
by $251. Facility maintenance expense reductions of $1.3 million were realized from the deferral of
maintenance on Aviation facilities. The Maritime Division operating expenses decreased 15% or approximately $7 million in fiscal year 2010. The decrease is primarily attributed to expenses related to air quality mitigation efforts, such as the truck retrofit program, in fiscal year 2009. The Maritime Division represents 24% of the Port’s total operating expenses in fiscal year 2010. The Commercial Real Estate Division represents approximately 6% of the Port’s total operating expenses in fiscal year 2010. 2009 The Port’s operating expenses, excluding depreciation, decreased by 1% from approximately $169 million to $167 million in fiscal year 2009. Aviation Division operating expenses decreased 5% or approximately $6 million in fiscal year 2009. The major components of this decrease included approximately $5 million for general operating expenses. A decrease of $2 million was realized from reduced parking lot and shuttle operation expenses due to lower parking demand and decreased passenger traffic at the Airport (OAK). $1 million was due to the restriction and reduction of overtime due to the lower volume of operations and workload at OAK. A $1 million savings resulted from the consolidation of the Oakland Police security services with the Alameda County Sheriff. Advertising and promotion decreased approximately $1 million. The Aviation Division represents approximately 69% of the Port’s total operating expenses in fiscal year 2009.
Port of Oakland (A Component Unit of the City of Oakland)
Management’s Discussion and Analysis (unaudited) June 30, 2010 and 2009
(dollar amounts in thousands)
11
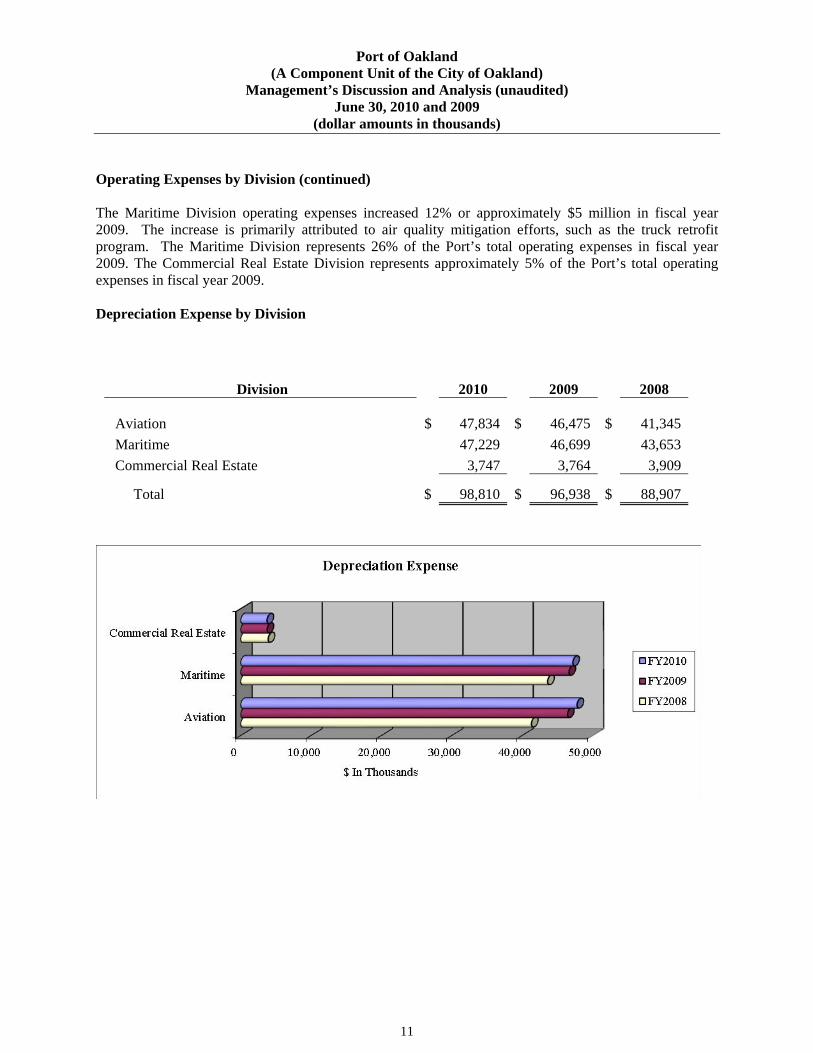
Operating Expenses by Division (continued) The Maritime Division operating expenses increased 12% or approximately $5 million in fiscal year 2009. The increase is primarily attributed to air quality mitigation efforts, such as the truck retrofit program. The Maritime Division represents 26% of the Port’s total operating expenses in fiscal year 2009. The Commercial Real Estate Division represents approximately 5% of the Port’s total operating expenses in fiscal year 2009. Depreciation Expense by Division
Division 2010 2009 2008
Aviation
$ 47,834 $ 46,475
$ 41,345
Maritime 47,229 46,699 43,653
Commercial Real Estate 3,747 3,764 3,909
Total $ 98,810 $ 96,938 $ 88,907
Port of Oakland (A Component Unit of the City of Oakland)
Management’s Discussion and Analysis (unaudited) June 30, 2010 and 2009
(dollar amounts in thousands)
12
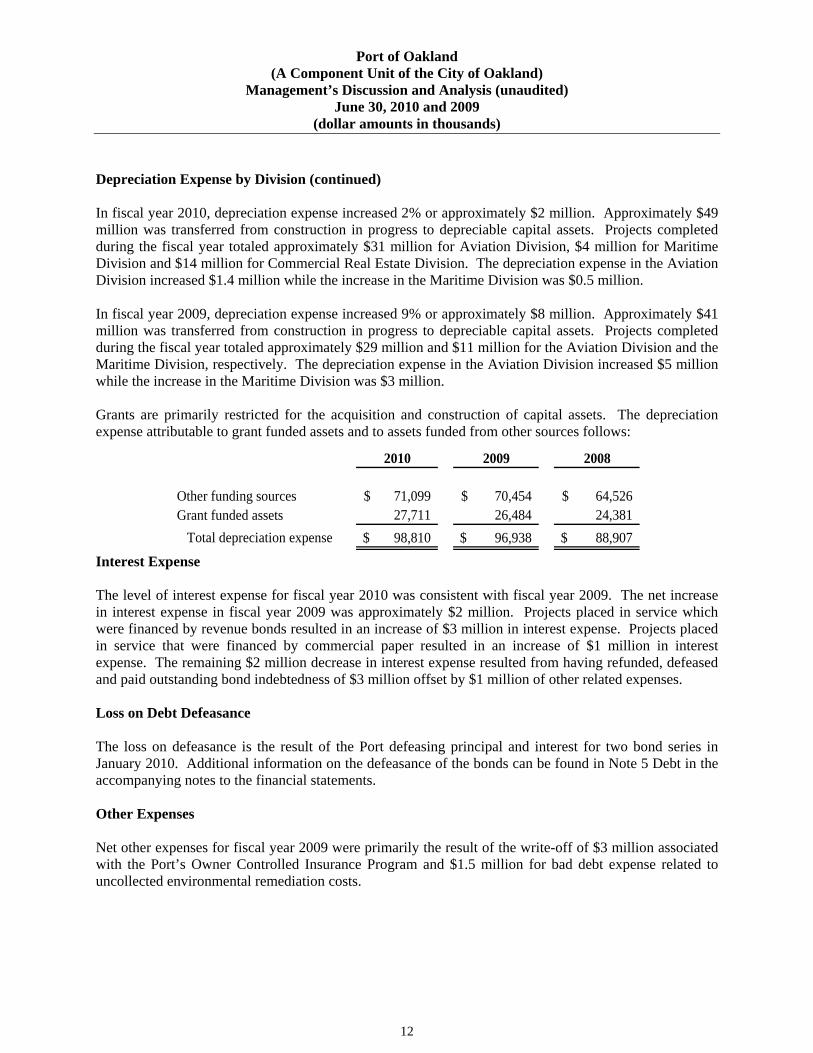
Depreciation Expense by Division (continued) In fiscal year 2010, depreciation expense increased 2% or approximately $2 million. Approximately $49 million was transferred from construction in progress to depreciable capital assets. Projects completed during the fiscal year totaled approximately $31 million for Aviation Division, $4 million for Maritime Division and $14 million for Commercial Real Estate Division. The depreciation expense in the Aviation Division increased $1.4 million while the increase in the Maritime Division was $0.5 million. In fiscal year 2009, depreciation expense increased 9% or approximately $8 million. Approximately $41 million was transferred from construction in progress to depreciable capital assets. Projects completed during the fiscal year totaled approximately $29 million and $11 million for the Aviation Division and the Maritime Division, respectively. The depreciation expense in the Aviation Division increased $5 million while the increase in the Maritime Division was $3 million. Grants are primarily restricted for the acquisition and construction of capital assets. The depreciation expense attributable to grant funded assets and to assets funded from other sources follows:
2010 2009 2008
Other funding sources 71,099$ 70,454$ 64,526$ Grant funded assets 27,711 26,484 24,381
Total depreciation expense 98,810$ 96,938$ 88,907$
Interest Expense The level of interest expense for fiscal year 2010 was consistent with fiscal year 2009. The net increase in interest expense in fiscal year 2009 was approximately $2 million. Projects placed in service which were financed by revenue bonds resulted in an increase of $3 million in interest expense. Projects placed in service that were financed by commercial paper resulted in an increase of $1 million in interest expense. The remaining $2 million decrease in interest expense resulted from having refunded, defeased and paid outstanding bond indebtedness of $3 million offset by $1 million of other related expenses. Loss on Debt Defeasance The loss on defeasance is the result of the Port defeasing principal and interest for two bond series in January 2010. Additional information on the defeasance of the bonds can be found in Note 5 Debt in the accompanying notes to the financial statements. Other Expenses Net other expenses for fiscal year 2009 were primarily the result of the write-off of $3 million associated with the Port’s Owner Controlled Insurance Program and $1.5 million for bad debt expense related to uncollected environmental remediation costs.

Port of Oakland (A Component Unit of the City of Oakland)
Management’s Discussion and Analysis (unaudited) June 30, 2010 and 2009
(dollar amounts in thousands)
13
Loss on Disposal of Capital Assets During fiscal year 2010, the Port disposed of certain Maritime assets resulting in a net loss of approximately $6 million. Additional information on the loss on disposal of assets can be found in Note 4 Changes in Capital Assets in the accompanying notes to the financial statements. Abandoned capital assets in fiscal year 2010 were the result of $297 in Aviation projects and $61 in Maritime and other projects. Abandoned capital assets in fiscal year 2009 were primarily the result of $326 in Aviation projects and $104 for Utility projects. In fiscal year 2008, the Aviation Terminal A Development Program was abandoned. Approximately $15 million was written-off which included planning, engineering, and development costs. Capital Contributions Grants are, for the most part, restricted for the acquisition or construction of capital assets. In fiscal year 2010, grants from government agencies increased 79% or approximately $9 million. This was attributed to an increase in capital projects for Maritime security and Airport runways and aprons. Approximately $6 million was received under the American Reinvestment Recovery Act of 2009 (ARRA) to fund the East Apron project. In fiscal year 2009, grants from government agencies declined 56% or approximately $15 million. The decrease was attributed to slower spending of capital expenditures on the South Airport Taxiway B, Runway Safety Area and Airport Noise and Operation Monitoring System projects and lower project cost for Taxiway W. Restatement of Net Assets Net assets as of the beginning of fiscal year 2009 was restated by $6,680. The restatement was due to the adoption of a new accounting pronouncement to account for existing pollution remediation liabilities. Net assets as of the beginning of fiscal year 2008 was restated by $9,212. The restatement was due to the correction of prior year Maritime revenues and cost reimbursement related to Maritime terminal improvements.
Port of Oakland (A Component Unit of the City of Oakland)
Management’s Discussion and Analysis (unaudited) June 30, 2010 and 2009
(dollar amounts in thousands)
14
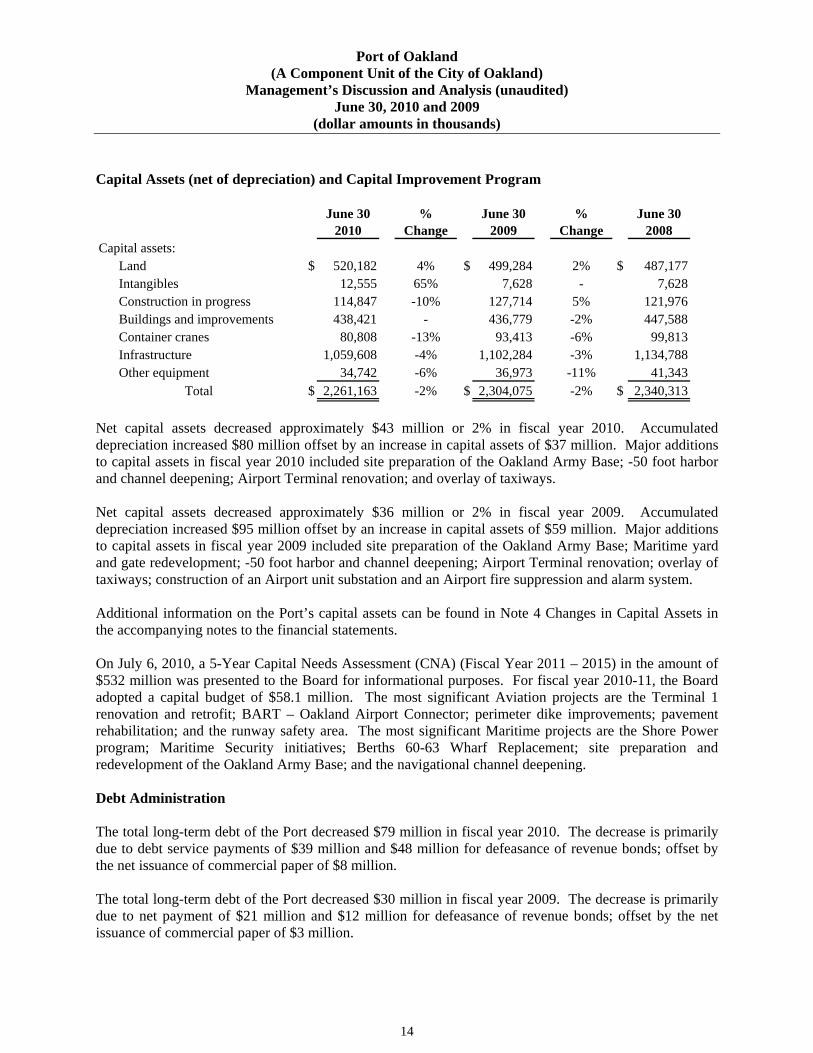
Capital Assets (net of depreciation) and Capital Improvement Program
June 30 2010
% Change
June 30 2009
% Change
June 30 2008
Capital assets:Land $ 520,182 4% $ 499,284 2% $ 487,177Intangibles 12,555 65% 7,628 - 7,628Construction in progress 114,847 -10% 127,714 5% 121,976Buildings and improvements 438,421 - 436,779 -2% 447,588Container cranes 80,808 -13% 93,413 -6% 99,813Infrastructure 1,059,608 -4% 1,102,284 -3% 1,134,788Other equipment 34,742 -6% 36,973 -11% 41,343
Total $ 2,261,163 -2% $ 2,304,075 -2% $ 2,340,313
Net capital assets decreased approximately $43 million or 2% in fiscal year 2010. Accumulated depreciation increased $80 million offset by an increase in capital assets of $37 million. Major additions to capital assets in fiscal year 2010 included site preparation of the Oakland Army Base; -50 foot harbor and channel deepening; Airport Terminal renovation; and overlay of taxiways. Net capital assets decreased approximately $36 million or 2% in fiscal year 2009. Accumulated depreciation increased $95 million offset by an increase in capital assets of $59 million. Major additions to capital assets in fiscal year 2009 included site preparation of the Oakland Army Base; Maritime yard and gate redevelopment; -50 foot harbor and channel deepening; Airport Terminal renovation; overlay of taxiways; construction of an Airport unit substation and an Airport fire suppression and alarm system. Additional information on the Port’s capital assets can be found in Note 4 Changes in Capital Assets in the accompanying notes to the financial statements. On July 6, 2010, a 5-Year Capital Needs Assessment (CNA) (Fiscal Year 2011 – 2015) in the amount of $532 million was presented to the Board for informational purposes. For fiscal year 2010-11, the Board adopted a capital budget of $58.1 million. The most significant Aviation projects are the Terminal 1 renovation and retrofit; BART – Oakland Airport Connector; perimeter dike improvements; pavement rehabilitation; and the runway safety area. The most significant Maritime projects are the Shore Power program; Maritime Security initiatives; Berths 60-63 Wharf Replacement; site preparation and redevelopment of the Oakland Army Base; and the navigational channel deepening. Debt Administration The total long-term debt of the Port decreased $79 million in fiscal year 2010. The decrease is primarily due to debt service payments of $39 million and $48 million for defeasance of revenue bonds; offset by the net issuance of commercial paper of $8 million. The total long-term debt of the Port decreased $30 million in fiscal year 2009. The decrease is primarily due to net payment of $21 million and $12 million for defeasance of revenue bonds; offset by the net issuance of commercial paper of $3 million.

Port of Oakland (A Component Unit of the City of Oakland)
Management’s Discussion and Analysis (unaudited) June 30, 2010 and 2009
(dollar amounts in thousands)
15
Debt Administration (continued) The following table summarizes the Port’s long-term debt as of June 30:
2010 2009 2008
Bond Indebtedness 1,353,430$ 1,440,410$ 1,473,723$ Commercial Paper 89,440 81,440 78,540
Total long-term debt 1,442,870$ 1,521,850$ 1,552,263$
The debt coverage ratios for the fiscal years ending June 30 were as follows:
2010 2009 2008 Senior Lien (Minimum 1.25) 1.76 2.02 2.03 Intermediate Lien (Minimum 1.10) 1.42 1.38 1.72 Intermediate Lien with Rolling (Minimum 1.10) 1.86 - - Combined 1.42 1.37 1.61
In May 2009, the Board amended the Port’s Intermediate Lien Indenture to allow, until June 30, 2012, for the inclusion of specified amounts from the Port Bond Reserve Fund and/or the Capital Reserve Fund, in addition to Net Pledge Revenues, for the purpose of calculating the Debt Coverage Ratio under the Intermediate Lien Indenture (Intermediate Lien with Rolling). The calculation to determine Combined Debt Coverage Ratio (as it is neither defined nor a requirement in any Indenture) includes Senior Lien debt service, California Department of Boating and Waterways debt service, Intermediate Lien debt service and Commercial Paper interest. There is no amortization of principal associated with Commercial Paper. Credit Ratings In 2009, all credit rating agencies downgraded the Port’s Senior and Intermediate Debt due to the combination of weakening operating trends and a growing debt service burden. On March 5, 2009, Fitch lowered its rating on the Port’s Senior Lien Bonds to “A+” from “AA-”. In addition, the Port’s Intermediate Lien Bonds were downgraded to “A” from “A+”. On July 21, 2009, Standard & Poor’s lowered its underlying rating on the Port’s Senior Lien Bonds to “A” from “A+” and on the Intermediate Lien Bonds to “A-” from “A”. The Port’s Intermediate Lien Bonds reflect the insured rating of “A”.
Port of Oakland (A Component Unit of the City of Oakland)
Management’s Discussion and Analysis (unaudited) June 30, 2010 and 2009
(dollar amounts in thousands)
16
Credit Ratings (continued) On December 16, 2009, Moody’s Investors Service, Inc. lowered its underlying rating on the Port’s Senior Lien Bonds to “A2” from “A1” and on the Intermediate Lien Bonds to “A3” from “A2”. The Port’s Intermediate Lien Bonds reflect the insured rating of “A2”. Additional information on the Port’s debt activity can be found in Note 5 Debt in the accompanying notes to the financial statements. Notes to the Basic Financial Statements The notes to the Port’s basic financial statements can be found on pages 24-56 of this report. These notes provide additional information that is essential to a full understanding of the basic financial statements. Facts and Conditions Affecting the Port’s Operation The Port’s three lines of business – Aviation, Maritime and Commercial Real Estate – continue to be pressured by the general downturn in the U.S. economy and by the unprecedented global downturn, which continues to have an adverse impact on the Port’s tenants and customers. The Aviation Division, which operates OAK, has been negatively impacted by the recent U.S. recession, airline bankruptcies, airline capacity reductions at OAK and increased competition from low cost carriers at neighboring San Francisco International Airport. OAK is one of the three international airports serving the San Francisco Bay Area. In fiscal year 2010, OAK maintained itself as the second busiest airport in the Bay Area, with an approximate 18% market share of the total number of Bay Area passengers served. However, in fiscal year 2010, passenger activity declined by 3.7% to 9.6 million passengers, which resulted in reduced parking and terminal concession revenues and customer facility charges. Passenger traffic however, for the time period November 2009 through June 2010 increased 1.4% compared to the same time period the prior year. In addition, in 2009, OAK welcomed two new airlines that added six new destinations to OAK’s route map, while maintaining service to all of its existing routes. For the calendar year ended December 2009, OAK was ranked as the 12th largest cargo volume airport among the 162 cargo airports in North America. OAK, like many other major cargo airports, has seen declining volumes as the global recession has taken a toll on imports and exports. North American demand for Asian-manufactured consumer goods has decreased. During fiscal year 2010, OAK handled approximately 1.08 billion pounds, or 490,000 metric tons of air cargo (freight plus mail). This represented a decrease of 133 million pounds, or 60,000 metric tons (-10.9%) from fiscal year 2009 levels. Overall, Aviation revenues were flat in fiscal year 2010 compared to fiscal year 2009.

Port of Oakland (A Component Unit of the City of Oakland)
Management’s Discussion and Analysis (unaudited) June 30, 2010 and 2009
(dollar amounts in thousands)
17
Facts and Conditions Affecting the Port’s Operation (continued) The Maritime Division operates the fifth busiest cargo container seaport in the United States, as measured by twenty-foot equivalent unit (TEU) container volume. In calendar year 2009, approximately 2 million TEUs, or about 1.2 million containers, moved through the Port. Approximately 88% of the Port’s trade is with international partners/regions and 12% is domestic. Asia is the most significant trading partner of the Port. In calendar year 2009, 83% of the TEUs moved through the Port either originated from or were destined to Asia. In calendar year 2009, loaded container cargo activity at the Port declined by 2%. Imports fell 11.9% compared to calendar year 2008, and exports had a 6.2% growth. The Port has historically been a strong export seaport moving California agricultural products and other U.S. goods oversea to foreign markets. However, the growth of export volume at the Port in calendar year 2009 was hindered by a lack of vessel capacity as ocean carriers moved tonnage from the transpacific trade lane to other trade lanes. Also contributing to the hindrance of growth was the idling of container vessels by the ocean carriers. In addition, the substantial decline in import volume created a deficit of empty containers available for export loads in Northern California. After a long period of declining import volume, imports began a small recovery at the end of 2009 and that trend continued into 2010. The Commercial Real Estate Division (CRE), which manages approximately 900 acres along the Oakland Estuary, has also been impacted by the downturn in the economy. CRE revenues were down 4.2% in fiscal year 2010 compared to fiscal year 2009 due to a decrease in demand for parking and reduction in percentage rent due to a decrease in spending at Port tenant properties. To address the downturn in the economy and to meet the operating budget objectives, during fiscal year 2010, the Port initiated an early retirement incentive program and a reduction in force. The Port reduced its staff from 538 Full Time Employees (FTEs) at the beginning of fiscal year 2010 to a low of 440 FTEs at the end of January 2010. Contacting the Port’s Financial Management For additional information about this report, please contact Director of Finance, Port of Oakland, 530 Water Street, Oakland, California 94607 or visit the website at www.portofoakland.com.

2010 2009Assets
Current assets:Unrestricted:
Cash equivalents $ 139,085 $ 77,384Accounts receivable (less allowance for doubtful accounts
of $3,220 in 2010 and $3,326 in 2009) 27,689 40,632Accrued interest receivable 153 170Prepaid expenses and other assets 3,620 8,295
Total unrestricted current assets 170,547 126,481
Restricted:Cash equivalents 11,508 24,516Investments 1,946 5,467Deposits in escrow 1,411 1,575Receivables - passenger facility charges and customer facility charges 2,478 3,492Accrued interest receivable 79 633
Total restricted current assets 17,422 35,683
Total current assets 187,969 162,164
Non-current assets:Capital assets:
Land 520,182 499,284Intangibles 12,555 7,628Construction in progress 114,847 127,714Buildings and improvements 845,335 809,563Container cranes 153,775 177,980Infrastructure 1,545,442 1,535,415Other equipment 75,660 73,079
Total capital assets, at cost 3,267,796 3,230,663Less accumulated depreciation (1,006,633) (926,588)
Capital assets, net 2,261,163 2,304,075
Unrestricted deferred charges and other assets 52,530 60,605Restricted investments 69,553 75,510
Total non-current assets 2,383,246 2,440,190
Total assets $ 2,571,215 $ 2,602,354
(Continued)
Port of Oakland(A Component Unit of the City of Oakland)
Statements of Net AssetsJune 30, 2010 and 2009
(dollar amounts in thousands)
The accompanying notes are an integral part of these financial statements.
18
2010 2009
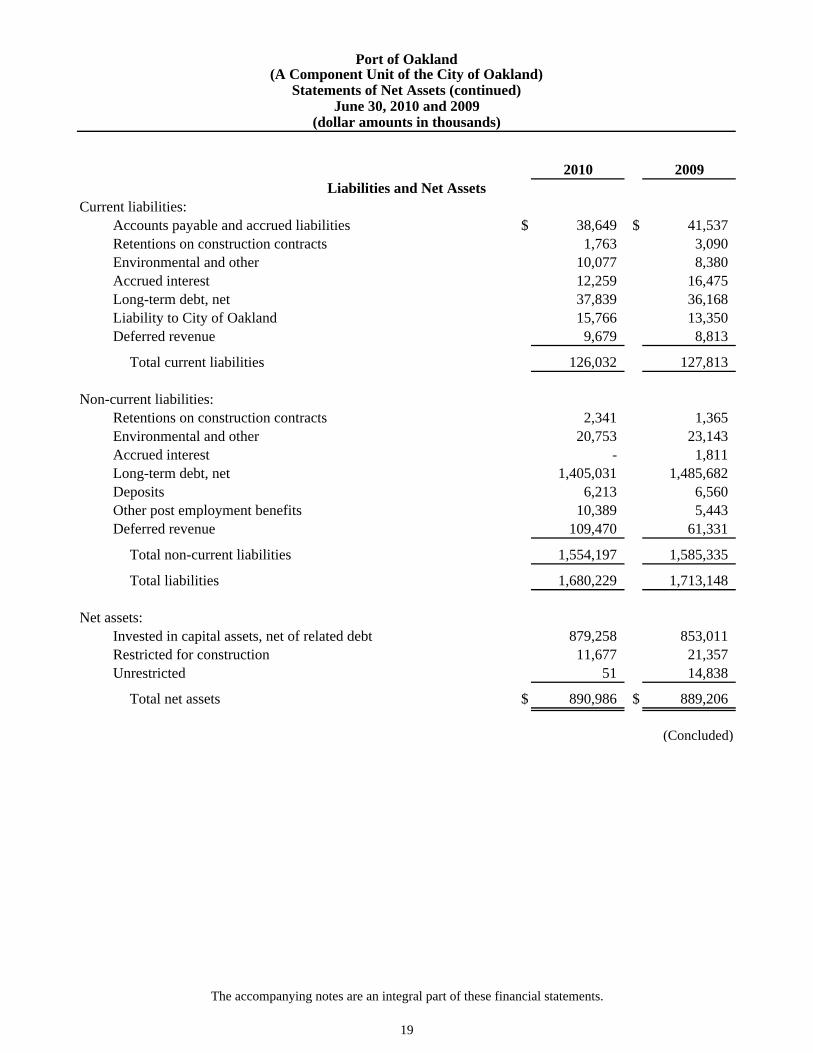
Current liabilities:Accounts payable and accrued liabilities $ 38,649 $ 41,537Retentions on construction contracts 1,763 3,090Environmental and other 10,077 8,380Accrued interest 12,259 16,475Long-term debt, net 37,839 36,168Liability to City of Oakland 15,766 13,350Deferred revenue 9,679 8,813
Total current liabilities 126,032 127,813
Non-current liabilities:Retentions on construction contracts 2,341 1,365Environmental and other 20,753 23,143Accrued interest - 1,811Long-term debt, net 1,405,031 1,485,682Deposits 6,213 6,560Other post employment benefits 10,389 5,443Deferred revenue 109,470 61,331
Total non-current liabilities 1,554,197 1,585,335
Total liabilities 1,680,229 1,713,148
Net assets:Invested in capital assets, net of related debt 879,258 853,011Restricted for construction 11,677 21,357Unrestricted 51 14,838
Total net assets $ 890,986 $ 889,206
(Concluded)
Liabilities and Net Assets
Port of Oakland(A Component Unit of the City of Oakland)
Statements of Net Assets (continued)June 30, 2010 and 2009
(dollar amounts in thousands)
The accompanying notes are an integral part of these financial statements.
19
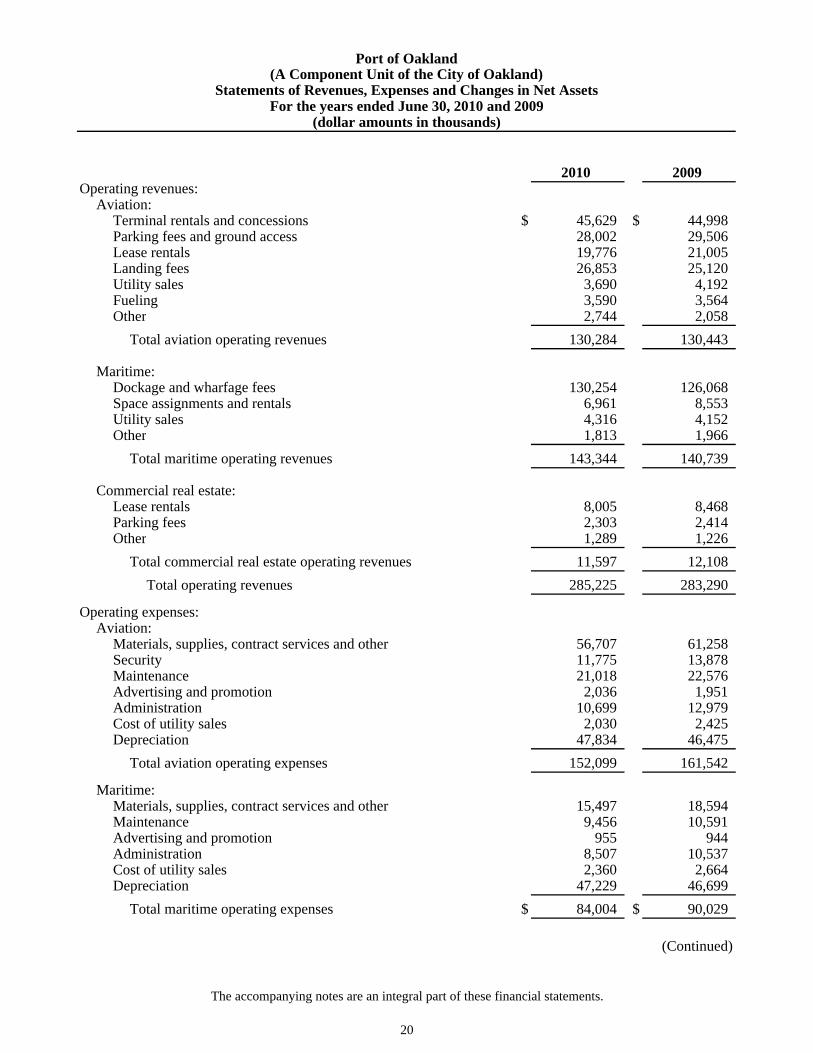
2010 2009Operating revenues:
Aviation:Terminal rentals and concessions $ 45,629 $ 44,998Parking fees and ground access 28,002 29,506Lease rentals 19,776 21,005Landing fees 26,853 25,120Utility sales 3,690 4,192Fueling 3,590 3,564Other 2,744 2,058
Total aviation operating revenues 130,284 130,443
Maritime: Dockage and wharfage fees 130,254 126,068
Space assignments and rentals 6,961 8,553Utility sales 4,316 4,152Other 1,813 1,966
Total maritime operating revenues 143,344 140,739
Commercial real estate:Lease rentals 8,005 8,468Parking fees 2,303 2,414Other 1,289 1,226
Total commercial real estate operating revenues 11,597 12,108
Total operating revenues 285,225 283,290
Operating expenses:Aviation:
Materials, supplies, contract services and other 56,707 61,258Security 11,775 13,878Maintenance 21,018 22,576Advertising and promotion 2,036 1,951Administration 10,699 12,979Cost of utility sales 2,030 2,425Depreciation 47,834 46,475
Total aviation operating expenses 152,099 161,542
Maritime:Materials, supplies, contract services and other 15,497 18,594Maintenance 9,456 10,591Advertising and promotion 955 944Administration 8,507 10,537Cost of utility sales 2,360 2,664Depreciation 47,229 46,699
Total maritime operating expenses $ 84,004 $ 90,029
(Continued)
(A Component Unit of the City of Oakland)Port of Oakland
(dollar amounts in thousands)For the years ended June 30, 2010 and 2009
Statements of Revenues, Expenses and Changes in Net Assets
The accompanying notes are an integral part of these financial statements.
20

2010 2009Operating expenses, continued
Commercial real estate: Materials, supplies, contract services and other $ 5,954 $ 6,066Maintenance 1,067 1,075Advertising and promotion 113 111Administration 1,619 1,552Cost of utility sales 106 106Depreciation 3,747 3,764
Total commercial real estate operating expenses 12,606 12,674
Total operating expenses 248,709 264,245
Operating income 36,516 19,045
Non-operating revenues (expenses):Interest income 8,635 9,655Interest expense (78,518) (78,415)Loss on debt defeasance (4,158) - Customer facility charges 4,530 5,235Passenger facility charges 19,702 19,391Other income (expense) 292 (5,072)Loss on disposal of capital assets (6,562) (435)
Total net non-operating expenses (56,079) (49,641)
Decrease in net assets before capital contributions (19,563) (30,596)
Capital contributions:Grants from government agencies 21,343 11,896
Increase (decrease) in net assets 1,780 (18,700)
Net assets, beginning of the year, as previously reported 889,206 914,586Prior period adjustment - (6,680)
Net assets, beginning of the year, as restated 889,206 907,906
Net assets, end of the year $ 890,986 $ 889,206
(Concluded)
(dollar amounts in thousands)For the years ended June 30, 2010 and 2009
Statements of Revenues, Expenses and Changes in Net Assets (continued)(A Component Unit of the City of Oakland)
Port of Oakland
The accompanying notes are an integral part of these financial statements.
21

2010 2009Cash flows from operating activities:
Receipts from customers and users $ 350,358 $ 285,595Payments to suppliers (62,906) (98,061)Payments to employees (70,805) (74,735)Other operating cash receipts (payments) 3,791 (827)
Net cash provided by operating activities 220,438 111,972
Cash flows from capital and related financing activities:Proceeds from new borrowings 22,959 25,340Repayments/refunding of debt (99,007) (54,269)Grants from government agencies 17,811 13,867Interest paid on debt (91,675) (83,164)Purchase of capital assets (62,021) (67,806)Proceeds from sale of capital assets 64 142Customer facility charge and passenger facility charge receipts 21,347 19,584
Net cash used in capital and related financing activities (190,522) (146,306)
Cash flows from investing activities:Interest received on investments 9,137 10,756Purchase of restricted investments (16,077) (16,265)Proceeds from maturity of restricted investments 25,717 28,355
Net cash provided by investing activities 18,777 22,846
Net increase (decrease) in cash equivalents 48,693 (11,488)
Cash equivalents, beginning of year 101,900 113,388
Cash equivalents, end of year $ 150,593 $ 101,900
(Continued)
Port of Oakland
(dollar amounts in thousands)For the years ended June 30, 2010 and 2009
Statements of Cash Flows(A Component Unit of the City of Oakland)
The accompanying notes are an integral part of these financial statements.
22
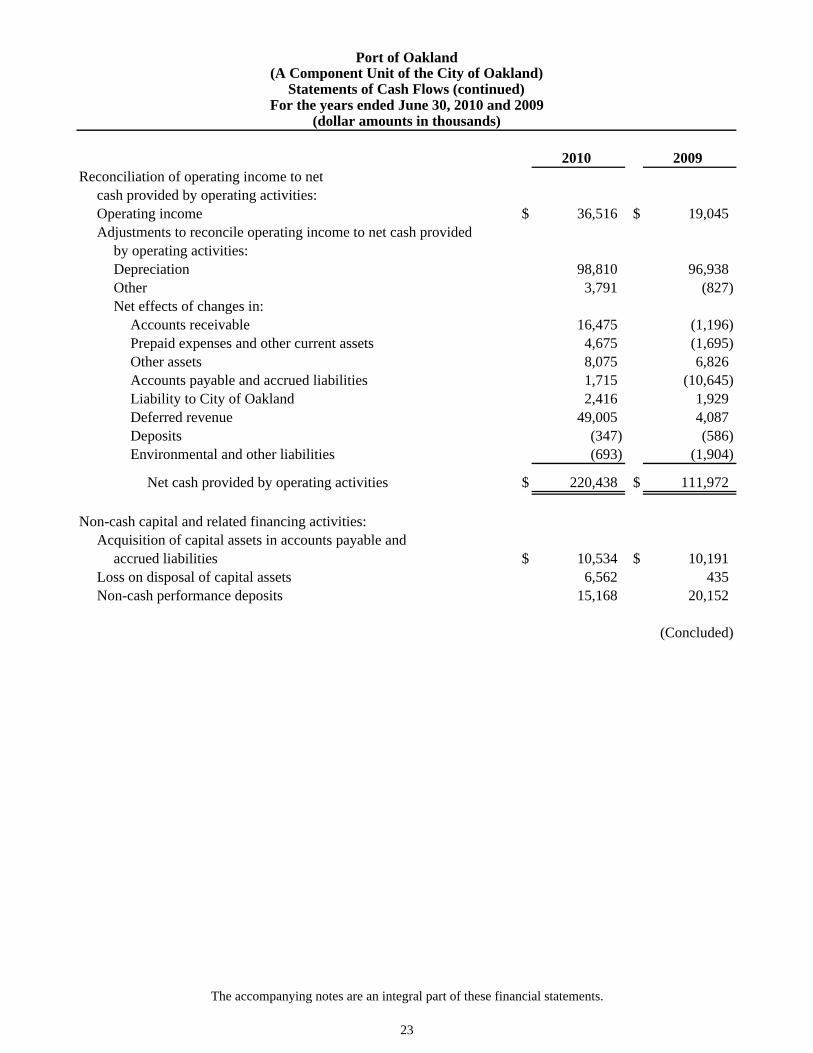
2010 2009Reconciliation of operating income to net
cash provided by operating activities:Operating income $ 36,516 $ 19,045Adjustments to reconcile operating income to net cash provided
by operating activities:Depreciation 98,810 96,938Other 3,791 (827)Net effects of changes in:
Accounts receivable 16,475 (1,196)Prepaid expenses and other current assets 4,675 (1,695)Other assets 8,075 6,826Accounts payable and accrued liabilities 1,715 (10,645)Liability to City of Oakland 2,416 1,929Deferred revenue 49,005 4,087Deposits (347) (586)Environmental and other liabilities (693) (1,904)
Net cash provided by operating activities $ 220,438 $ 111,972
Non-cash capital and related financing activities:Acquisition of capital assets in accounts payable and
accrued liabilities $ 10,534 $ 10,191Loss on disposal of capital assets 6,562 435Non-cash performance deposits 15,168 20,152
(Concluded)
Port of Oakland
(dollar amounts in thousands)For the years ended June 30, 2010 and 2009
Statements of Cash Flows (continued)(A Component Unit of the City of Oakland)
The accompanying notes are an integral part of these financial statements.
23

Port of Oakland (A Component Unit of the City of Oakland)
Notes to Financial Statements For the years ended June 30, 2010 and 2009
(dollar amounts in thousands)
24
1. Organization
The Port of Oakland, California (Port) was established in 1927 by the City of Oakland (City) and is included as a component unit in the City’s basic financial statements. The accompanying financial statements include the operations of the Oakland International Airport (OAK), the Port of Oakland maritime facilities, and commercial real estate operations.
The Port is governed by a seven-member Board of Port Commissioners (Board) whose members are appointed by the City Council, upon nomination by the Mayor. The Board appoints an Executive Director to administer operations. The Port prepares and controls its own budget, administers and controls its fiscal activities, and is responsible for all Port construction and operations. The Port is required by the City Charter to deposit its revenues in the City Treasury. The City Treasurer is responsible for investing and managing such funds.
2. Significant Accounting Policies
Basis of Accounting
The Port’s financial statements are presented on the accrual basis of accounting. Revenues are recognized when they are earned, and expenses are recognized when they are incurred.
Grants from Government Agencies
Grants are, for the most part, restricted for the acquisition or construction of capital assets. Such grants are recorded as revenue when entitlements to such funds are earned under the appropriate grant terms.
Passenger Facility Charges
The Port, as authorized by the Federal Aviation Administration (FAA) pursuant to the Aviation Safety and Capacity Expansion Act of 1990 (the Act), as amended, imposes a Passenger Facility Charge (PFC) of $4.50 for each enplaning passenger at the Airport. Under the Act, air carriers are responsible for the collection of PFC charges and are required to remit PFC revenues to the Port in the following month after they are recorded by the air carrier. The Port’s most recent application was approved by the FAA on December 14, 2009. The current authority to impose PFCs is estimated to end May 1, 2023. PFC revenues, including any interest earned thereon, are restricted solely to finance allowable costs of new airport planning and development projects as defined and authorized by the FAA. PFC revenues may be used to pay debt service and related expenditures associated with FAA approved projects and the Port has received FAA approval to pay certain debt service if debt proceeds are used for qualifying projects. PFC revenues are recorded as non-operating revenue and any unspent PFC revenues are recorded as restricted cash.
Port of Oakland (A Component Unit of the City of Oakland)
Notes to Financial Statements For the years ended June 30, 2010 and 2009
(dollar amounts in thousands)
25
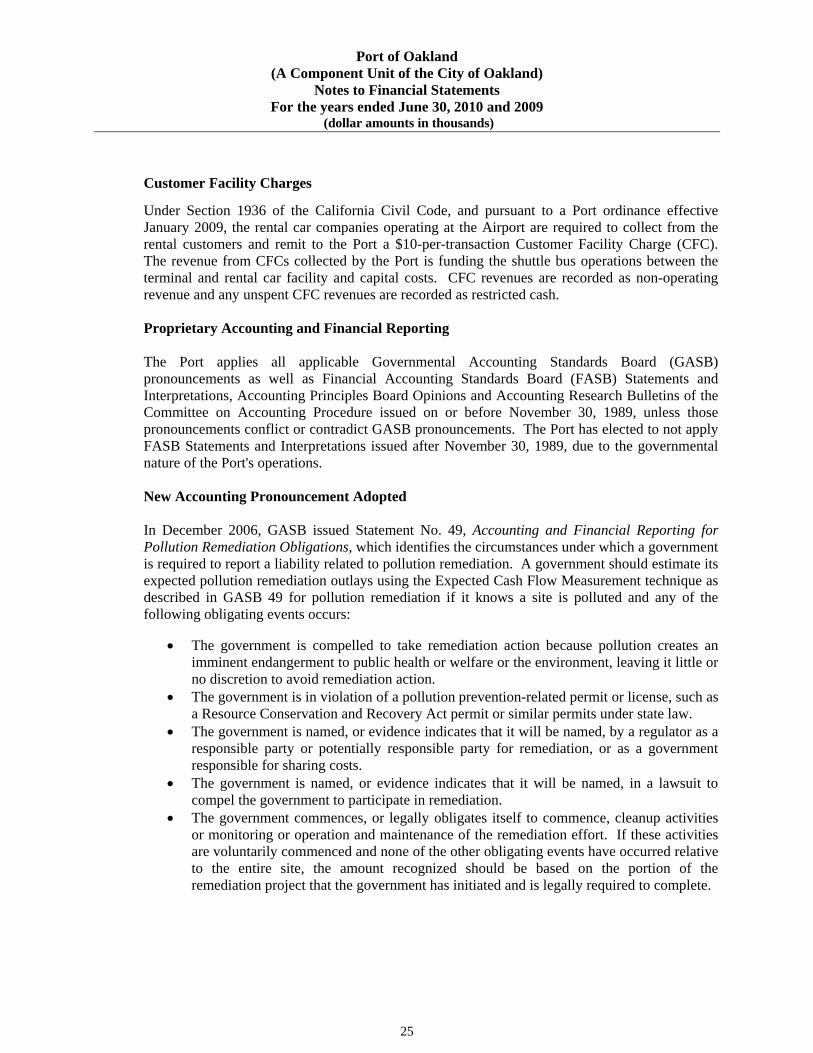
Customer Facility Charges
Under Section 1936 of the California Civil Code, and pursuant to a Port ordinance effective January 2009, the rental car companies operating at the Airport are required to collect from the rental customers and remit to the Port a $10-per-transaction Customer Facility Charge (CFC). The revenue from CFCs collected by the Port is funding the shuttle bus operations between the terminal and rental car facility and capital costs. CFC revenues are recorded as non-operating revenue and any unspent CFC revenues are recorded as restricted cash. Proprietary Accounting and Financial Reporting
The Port applies all applicable Governmental Accounting Standards Board (GASB) pronouncements as well as Financial Accounting Standards Board (FASB) Statements and Interpretations, Accounting Principles Board Opinions and Accounting Research Bulletins of the Committee on Accounting Procedure issued on or before November 30, 1989, unless those pronouncements conflict or contradict GASB pronouncements. The Port has elected to not apply FASB Statements and Interpretations issued after November 30, 1989, due to the governmental nature of the Port's operations. New Accounting Pronouncement Adopted In December 2006, GASB issued Statement No. 49, Accounting and Financial Reporting for Pollution Remediation Obligations, which identifies the circumstances under which a government is required to report a liability related to pollution remediation. A government should estimate its expected pollution remediation outlays using the Expected Cash Flow Measurement technique as described in GASB 49 for pollution remediation if it knows a site is polluted and any of the following obligating events occurs:
The government is compelled to take remediation action because pollution creates an imminent endangerment to public health or welfare or the environment, leaving it little or no discretion to avoid remediation action.
The government is in violation of a pollution prevention-related permit or license, such as a Resource Conservation and Recovery Act permit or similar permits under state law.
The government is named, or evidence indicates that it will be named, by a regulator as a responsible party or potentially responsible party for remediation, or as a government responsible for sharing costs.
The government is named, or evidence indicates that it will be named, in a lawsuit to compel the government to participate in remediation.
The government commences, or legally obligates itself to commence, cleanup activities or monitoring or operation and maintenance of the remediation effort. If these activities are voluntarily commenced and none of the other obligating events have occurred relative to the entire site, the amount recognized should be based on the portion of the remediation project that the government has initiated and is legally required to complete.

Port of Oakland (A Component Unit of the City of Oakland)
Notes to Financial Statements For the years ended June 30, 2010 and 2009
(dollar amounts in thousands)
26
New Accounting Pronouncement Adopted (continued) GASB 49 also requires governments to disclose information about their pollution obligations associated with clean up efforts in the notes to the financial statements. By adopting the provisions of GASB 49, the Port recorded remediation liabilities related to its pollution remediation activities. As a result, the Port recorded a reduction of net assets as of July 1, 2008 of $6,680. See Note 10 for additional information. In June 2007, GASB issued Statement No. 51, Accounting and Financial Reporting for Intangible Assets. This statement requires that all intangible assets not specifically excluded by its scope provisions be classified as capital assets. Accordingly, existing authoritative guidance related to the accounting and financial reporting for capital assets should be applied to these intangible assets, as applicable. This Statement also provides authoritative guidance that specifically addresses the nature of these intangible assets. Upon adoption of GASB 51, the Port identified intangible assets recorded as capital assets. The amount reclassified to intangible assets as of July 1, 2008 was $7,628. See Note 4 for additional information. Net Assets
Net assets represent the residual interest in the Port's assets after liabilities are deducted and consist of three sections: invested in capital assets, net of related debt; restricted and unrestricted. Net assets invested in capital assets, net of related debt include capital assets, net of accumulated depreciation, reduced by outstanding debt. Net assets are reported as restricted when constraints are imposed by third parties or enabling legislation. As of June 30, 2010 and 2009, the statement of net assets reported $11,677 and $21,357, respectively, as restricted by enabling legislation. All other net assets are unrestricted.
Restatement of Net Assets Net assets as of the beginning of fiscal year 2008-09 has been restated by $6,680 to account for existing pollution remediation liabilities from prior periods, as allowed by GASB 49.
Cash Equivalents The Port considers highly liquid investments with a maturity of three months or less when purchased to be cash equivalents. The Port's cash and investments in the City Treasury are, in substance, demand deposits and are considered cash equivalents. Investments
The Port reports its investments at fair value in the accompanying financial statements, except for investment agreements, which are reported at cost, and the corresponding change in fair value of investments is reported in the year in which the change occurs. Fair value is based upon quoted market prices.

Port of Oakland (A Component Unit of the City of Oakland)
Notes to Financial Statements For the years ended June 30, 2010 and 2009
(dollar amounts in thousands)
27
Restricted Assets
Assets whose use is restricted to specific purposes by bond indenture or otherwise are segregated on the statements of net assets. These assets are primarily restricted for construction and debt service purposes. Capital Assets
Capital assets are stated at cost and it is the policy of the Port to capitalize all expenditures related to capital assets greater than $5. Interest costs applicable to qualifying assets are capitalized as part of the cost of the assets. Interest earned on temporary investment of the proceeds from qualifying tax-exempt debt is offset against interest costs capitalized. Depreciation expense is calculated using the straight-line method over the following estimated useful lives of the assets:
Buildings and improvements 5 to 50 yearsContainer cranes 25 yearsInfrastructure 10 to 50 yearsOther equipment 5 to 10 years
Tenant improvements paid for and owned by the Port are recorded in an appropriate capital asset account, with an offsetting credit to deferred revenue. The asset is amortized over the shorter of the life of the lease or the economic value of the asset and the deferred revenue is amortized over the same terms. Intangible assets which are identifiable are recorded as capital assets. The Port has identified noise easements, air rights and computer software as intangible assets. Intangible assets not having indefinite useful lives are amortized over the estimated service capacity of the asset.
Other Assets
These assets are deferred and amortized principally on the straight-line method, which approximates the effective interest method, over the lives of the related bond issues and recorded as interest expense. Other assets include bond issuance costs, future lease payments from a fifty-year finance lease agreement, other charges related to lease agreements and prepaid insurance. Loss on Debt Refunding The redemption loss at the time of a refunding is reported as deferred loss on refunding and is amortized as interest expense over the shorter of the remaining life of the refunded bonds or life of the new bonds. Loss on refundings are reported as a component of long-term debt in the financial statements. Deferred Revenue Unearned interest revenue, deferred rent and tenant revenue, related to tenant leases, are deferred and amortized principally on the straight-line method over the life of the remaining lease term.
Port of Oakland (A Component Unit of the City of Oakland)
Notes to Financial Statements For the years ended June 30, 2010 and 2009
(dollar amounts in thousands)
28
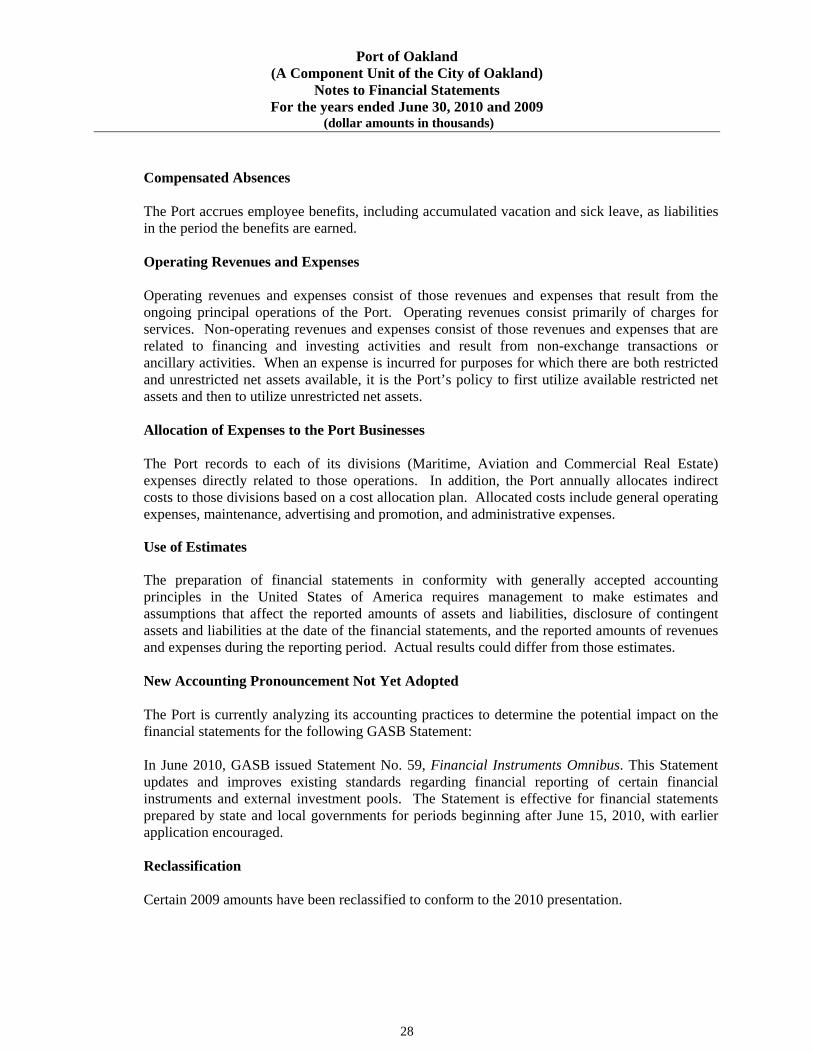
Compensated Absences
The Port accrues employee benefits, including accumulated vacation and sick leave, as liabilities in the period the benefits are earned.
Operating Revenues and Expenses
Operating revenues and expenses consist of those revenues and expenses that result from the ongoing principal operations of the Port. Operating revenues consist primarily of charges for services. Non-operating revenues and expenses consist of those revenues and expenses that are related to financing and investing activities and result from non-exchange transactions or ancillary activities. When an expense is incurred for purposes for which there are both restricted and unrestricted net assets available, it is the Port’s policy to first utilize available restricted net assets and then to utilize unrestricted net assets.
Allocation of Expenses to the Port Businesses
The Port records to each of its divisions (Maritime, Aviation and Commercial Real Estate) expenses directly related to those operations. In addition, the Port annually allocates indirect costs to those divisions based on a cost allocation plan. Allocated costs include general operating expenses, maintenance, advertising and promotion, and administrative expenses.
Use of Estimates
The preparation of financial statements in conformity with generally accepted accounting principles in the United States of America requires management to make estimates and assumptions that affect the reported amounts of assets and liabilities, disclosure of contingent assets and liabilities at the date of the financial statements, and the reported amounts of revenues and expenses during the reporting period. Actual results could differ from those estimates. New Accounting Pronouncement Not Yet Adopted
The Port is currently analyzing its accounting practices to determine the potential impact on the financial statements for the following GASB Statement:
In June 2010, GASB issued Statement No. 59, Financial Instruments Omnibus. This Statement updates and improves existing standards regarding financial reporting of certain financial instruments and external investment pools. The Statement is effective for financial statements prepared by state and local governments for periods beginning after June 15, 2010, with earlier application encouraged. Reclassification Certain 2009 amounts have been reclassified to conform to the 2010 presentation.

Port of Oakland (A Component Unit of the City of Oakland)
Notes to Financial Statements For the years ended June 30, 2010 and 2009
(dollar amounts in thousands)
29
3. Cash, Cash Equivalents, Investments and Deposits
The Port's cash, cash equivalents, investments and deposits in escrow consisted of the following at June 30, 2010 and 2009:
2010 2009
U.S. Treasury Obligations 71,499$ 51,567$ Federal Agency Securities - 114 Government Securities Money Market Mutual Funds 2,309 6,651 Guaranteed Investment Contracts - 300 Bank Investment Contract - 28,996 City Investment Pool 148,138 95,103 Deposits in Escrow 1,411 1,575 Bank Deposits and Cash on Hand 146 146
223,503$ 184,452$
Deposits in Escrow Deposits in escrow consist of amounts received from construction contractors that are deposited into an escrow account in-lieu of retention withheld from construction progress billings. Interest on these deposits accrues to the contractor. Investments Under the City of Oakland Charter, all cash receipts from the operations of the Port are deposited in the City Treasury. Unused senior bond proceeds are on deposit with the Senior Lien Bonds trustee for both reserves and construction funds. The investment of funds held by the Senior Lien Bonds trustee is governed by the Amended and Restated Master Trust Indenture, dated as of April 1, 2006 (Restated Trust Indenture). There were no investments pertaining to the Intermediate Lien Debt. Escrow funds are on deposit with an escrow agent. At June 30, 2010, the Port had the following investments:
Fair Value
Credit Rating
Less than 1 Year 1-5 Years
5 or More Years
U.S. Treasury Notes $ 71,499 N/A $ 71,499 $ - $ - Government Securities Money
Market Mutual Funds 2,309 AAA 2,309 - - City Investment Pool 148,138 AAA 148,138 - -
Total Investments $ 221,946 $ 221,946 $ - $ -
Maturity
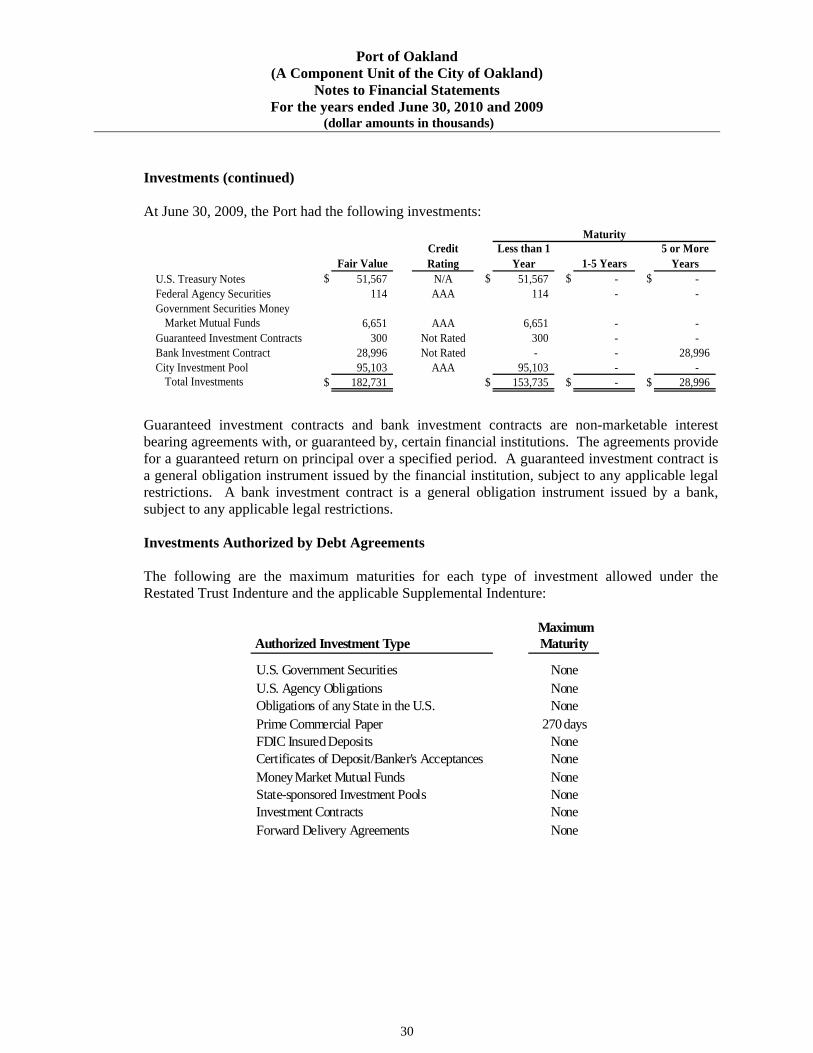
Port of Oakland (A Component Unit of the City of Oakland)
Notes to Financial Statements For the years ended June 30, 2010 and 2009
(dollar amounts in thousands)
30
Investments (continued) At June 30, 2009, the Port had the following investments:
Fair ValueCredit Rating
Less than 1 Year 1-5 Years
5 or More Years
U.S. Treasury Notes $ 51,567 N/A $ 51,567 $ - $ - Federal Agency Securities 114 AAA 114 - - Government Securities Money
Market Mutual Funds 6,651 AAA 6,651 - - Guaranteed Investment Contracts 300 Not Rated 300 - - Bank Investment Contract 28,996 Not Rated - - 28,996 City Investment Pool 95,103 AAA 95,103 - -
Total Investments $ 182,731 $ 153,735 $ - $ 28,996
Maturity
Guaranteed investment contracts and bank investment contracts are non-marketable interest bearing agreements with, or guaranteed by, certain financial institutions. The agreements provide for a guaranteed return on principal over a specified period. A guaranteed investment contract is a general obligation instrument issued by the financial institution, subject to any applicable legal restrictions. A bank investment contract is a general obligation instrument issued by a bank, subject to any applicable legal restrictions. Investments Authorized by Debt Agreements The following are the maximum maturities for each type of investment allowed under the Restated Trust Indenture and the applicable Supplemental Indenture:
Authorized Investment Type Maximum Maturity
U.S. Government Securities NoneU.S. Agency Obligations NoneObligations of any State in the U.S. NonePrime Commercial Paper 270 daysFDIC Insured Deposits NoneCertificates of Deposit/Banker's Acceptances NoneMoney Market Mutual Funds NoneState-sponsored Investment Pools NoneInvestment Contracts NoneForward Delivery Agreements None
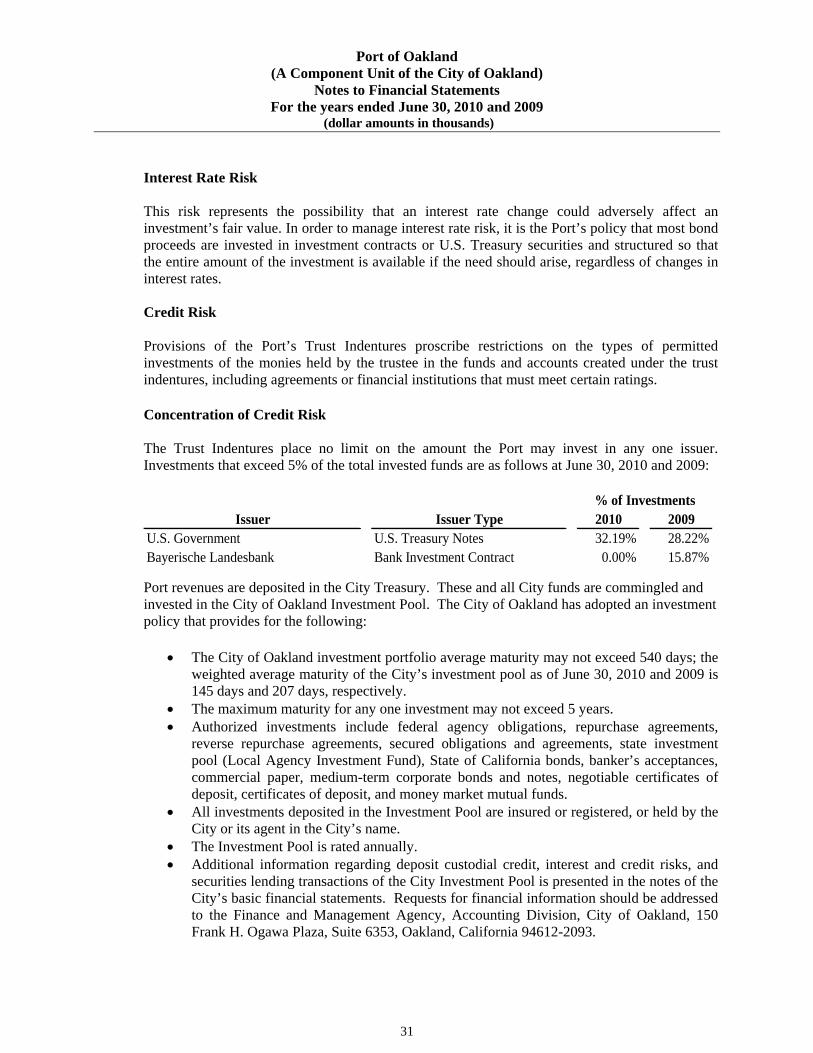
Port of Oakland (A Component Unit of the City of Oakland)
Notes to Financial Statements For the years ended June 30, 2010 and 2009
(dollar amounts in thousands)
31
Interest Rate Risk This risk represents the possibility that an interest rate change could adversely affect an investment’s fair value. In order to manage interest rate risk, it is the Port’s policy that most bond proceeds are invested in investment contracts or U.S. Treasury securities and structured so that the entire amount of the investment is available if the need should arise, regardless of changes in interest rates. Credit Risk Provisions of the Port’s Trust Indentures proscribe restrictions on the types of permitted investments of the monies held by the trustee in the funds and accounts created under the trust indentures, including agreements or financial institutions that must meet certain ratings. Concentration of Credit Risk
The Trust Indentures place no limit on the amount the Port may invest in any one issuer. Investments that exceed 5% of the total invested funds are as follows at June 30, 2010 and 2009:
Issuer Issuer Type 2010 2009U.S. Government U.S. Treasury Notes 32.19% 28.22%Bayerische Landesbank Bank Investment Contract 0.00% 15.87%
% of Investments
Port revenues are deposited in the City Treasury. These and all City funds are commingled and invested in the City of Oakland Investment Pool. The City of Oakland has adopted an investment policy that provides for the following:
The City of Oakland investment portfolio average maturity may not exceed 540 days; the weighted average maturity of the City’s investment pool as of June 30, 2010 and 2009 is 145 days and 207 days, respectively.
The maximum maturity for any one investment may not exceed 5 years. Authorized investments include federal agency obligations, repurchase agreements,
reverse repurchase agreements, secured obligations and agreements, state investment pool (Local Agency Investment Fund), State of California bonds, banker’s acceptances, commercial paper, medium-term corporate bonds and notes, negotiable certificates of deposit, certificates of deposit, and money market mutual funds.
All investments deposited in the Investment Pool are insured or registered, or held by the City or its agent in the City’s name.
The Investment Pool is rated annually. Additional information regarding deposit custodial credit, interest and credit risks, and
securities lending transactions of the City Investment Pool is presented in the notes of the City’s basic financial statements. Requests for financial information should be addressed to the Finance and Management Agency, Accounting Division, City of Oakland, 150 Frank H. Ogawa Plaza, Suite 6353, Oakland, California 94612-2093.

Port of Oakland (A Component Unit of the City of Oakland)
Notes to Financial Statements For the years ended June 30, 2010 and 2009
(dollar amounts in thousands)
32
Custodial Credit Risk For deposits, custodial credit risk is the risk that, in the event of a failure of a depository financial institution or counterparty to a transaction, recovery of the value of the investments or collateral securities in the possession of an outside party may be doubtful. For investments, custodial credit risks is the risk that, in the event of the failure of the counterparty to a transaction, the Port will not be able to recover the value of its investment or collateral securities that are in possession of another party. To protect against custodial credit risk, all securities owned by the Port are held in the name of the Port for safekeeping by a third party bank trust department, acting as an agent for the Port under the terms of the Restated Trust Indenture. The carrying amount of Port bank investment contracts and deposits in escrow was $1,411 at June 30, 2010 and $30,571 at June 30, 2009. Bank balances and escrow deposits of $250 at June 30, 2010, and of $841 at June 30, 2009, are insured or collateralized with securities held by the pledging financial institution’s trust department in the Port’s name. The remaining balance of $1,161 as of June 30, 2010, and $29,730 as of June 30, 2009 was exposed to custodial credit risk by not being insured or collateralized.
4. Changes in Capital Assets
A summary of changes in capital assets for the year ended June 30, 2010 is as follows:
Beginning Balance
July 1, 2009 Additions
Adjustments and
Retirements
Transfer of Completed
Construction
Ending Balance
June 30, 2010Capital assets not being depreciated
Land 499,284$ $ 20,898 $ - $ - $ 520,182 Intangibles (noise easements and air rights) 7,628 4,927 - - 12,555 Construction in progress 127,714 35,769 - (48,636) 114,847
Total capital assets not being depreciated 634,626 61,594 - (48,636) 647,584
Capital assets being depreciatedBuildings and improvements 809,563 - (465) 36,237 845,335 Container cranes 177,980 - (24,205) - 153,775 Infrastructure 1,535,415 4 460 9,563 1,545,442 Other equipment 73,079 455 (710) 2,836 75,660
Total capital assets being depreciated 2,596,037 459 (24,920) 48,636 2,620,212
Less accumulated depreciation forBuildings and improvements (372,784) (34,130) - - (406,914) Container cranes (84,567) (6,401) 18,001 - (72,967) Infrastructure (433,131) (52,703) - - (485,834) Other equipment (36,106) (5,576) 764 - (40,918)
Total accumulated depreciation (926,588) (98,810) 18,765 - (1,006,633)
Total being depreciated, net 1,669,449 (98,351) (6,155) 48,636 1,613,579
Total capital assets, net 2,304,075$ (36,757)$ (6,155)$ -$ 2,261,163$

Port of Oakland (A Component Unit of the City of Oakland)
Notes to Financial Statements For the years ended June 30, 2010 and 2009
(dollar amounts in thousands)
33
Changes in Capital Assets (continued) During fiscal year 2010, the Port’s Maritime Division disposed of three container cranes for a loss of $6,204. With the adoption of GASB Statement No. 51, Accounting and Financial Reporting for Intangible Assets, the Port reviewed its capital assets and identified intangible assets (easements and air rights) previously recorded as land. The Port reclassified these intangible assets from land as of July 1, 2008 in the amount of $7,628. A summary of changes in capital assets for the year ended June 30, 2009 is as follows:
Beginning Balance
July 1, 2008 Additions
Adjustments and
Retirements
Transfer of Completed
Construction
Ending Balance
June 30, 2009Capital assets not being depreciated
Land 487,177$ $ 12,107 $ - $ - $ 499,284 Intangibles (noise easements and air rights) 7,628 - - - 7,628 Construction in progress 121,976 47,070 - (41,332) 127,714
Total capital assets not being depreciated 616,781 59,177 - (41,332) 634,626
Capital assets being depreciatedBuildings and improvements 787,775 - (606) 22,394 809,563 Container cranes 177,980 - - - 177,980 Infrastructure 1,515,987 33 1,106 18,289 1,535,415 Other equipment 72,760 1,504 (1,834) 649 73,079
Total capital assets being depreciated 2,554,502 1,537 (1,334) 41,332 2,596,037
Less accumulated depreciation forBuildings and improvements (340,187) (32,627) 30 - (372,784) Container cranes (78,167) (6,400) - (84,567) Infrastructure (381,199) (51,902) (30) - (433,131) Other equipment (31,417) (6,009) 1,320 - (36,106)
Total accumulated depreciation (830,970) (96,938) 1,320 - (926,588)
Total being depreciated, net 1,723,532 (95,401) (14) 41,332 1,669,449
Total capital assets, net 2,340,313$ (36,224)$ (14)$ -$ 2,304,075$

Port of Oakland (A Component Unit of the City of Oakland)
Notes to Financial Statements For the years ended June 30, 2010 and 2009
(dollar amounts in thousands)
34
5. Debt
Long-term debt consists of the following at June 30, 2010 and 2009:Fiscal Beginning Ending Principal
Interest Maturity Original Balance Balance Due WithinRate Year Amount July 1, 2009 Additions Reductions June 30, 2010 One Year
Senior Lien Bonds1993 Revenue Bonds Series F 5.75 % 2010 75,342$ $ 3,927 $ - 3,927$ -$ $ - 2000 Revenue Bonds Series K 5.00-5.875 2031 400,000 357,570 - 6,735 350,835 2,555 2002 Revenue Bonds Series L 5.00-5.50 2033 401,530 401,530 - 44,505 357,025 - 2002 Revenue Bonds Series M 3.50-5.25 2021 218,470 69,690 - 13,495 56,195 13,975 2002 Revenue Bonds Series N 3.00-5.00 2023 121,150 102,955 - 11,010 91,945 5,240
Total Senior Lien Bonds 1,216,492 935,672 - 79,672 856,000 21,770
Dept. of Boating and Waterway (DBW) LoanSmall Craft Harbor Revenue Bonds, Series 1993 4.50 2030 7,176 6,133 - 181 5,952 190
Intermediate Lien Bonds2007 Revenue Bonds Series A 4.00-5.00 2030 242,075 237,800 - 3,655 234,145 13,975 2007 Revenue Bonds Series B 4.00-5.00 2030 182,450 182,220 - 540 181,680 565 2007 Revenue Bonds Series C 5.00 2020 78,565 78,565 - - 78,565 -
Total Intermediate Lien Bonds 503,090 498,585 - 4,195 494,390 14,540
Commercial Paper, 1999 Series D, E, F Notes1 0.1-5.15 2011 N/A 81,440 22,959 14,959 89,440 6
Sub-Total 1,521,830 22,959 99,007 1,445,782 36,506
Unamortized bond (discount) premium 19,212 86 2,957 16,341 3,646 Deferred loss on refunding (19,192) - 61 (19,253) (2,313) Current maturities of long-term debt (36,168) 1,671 (37,839) -
Total Debt - long-term portion 1,485,682$ 23,045$ 103,696$ 1,405,031$ 37,839$
1As of June 30, 2010, the Port was authorized to issue an aggregate principal amount of commerical paper notes up to $300 million.
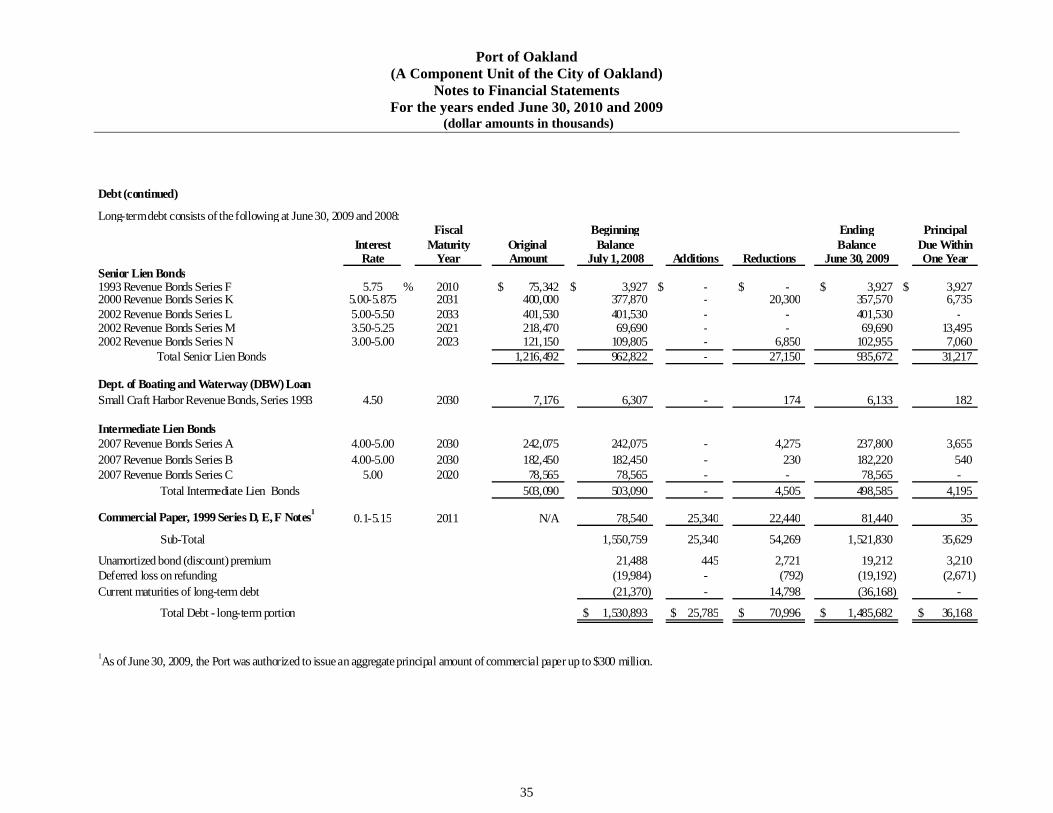
Port of Oakland (A Component Unit of the City of Oakland)
Notes to Financial Statements For the years ended June 30, 2010 and 2009
(dollar amounts in thousands)
35
Debt (continued)
Long-term debt consists of the following at June 30, 2009 and 2008:Fiscal Beginning Ending Principal
Interest Maturity Original Balance Balance Due WithinRate Year Amount July 1, 2008 Additions Reductions June 30, 2009 One Year
Senior Lien Bonds1993 Revenue Bonds Series F 5.75 % 2010 75,342$ $ 3,927 $ - -$ 3,927$ $ 3,927 2000 Revenue Bonds Series K 5.00-5.875 2031 400,000 377,870 - 20,300 357,570 6,735 2002 Revenue Bonds Series L 5.00-5.50 2033 401,530 401,530 - - 401,530 - 2002 Revenue Bonds Series M 3.50-5.25 2021 218,470 69,690 - - 69,690 13,495 2002 Revenue Bonds Series N 3.00-5.00 2023 121,150 109,805 - 6,850 102,955 7,060
Total Senior Lien Bonds 1,216,492 962,822 - 27,150 935,672 31,217
Dept. of Boating and Waterway (DBW) LoanSmall Craft Harbor Revenue Bonds, Series 1993 4.50 2030 7,176 6,307 - 174 6,133 182
Intermediate Lien Bonds2007 Revenue Bonds Series A 4.00-5.00 2030 242,075 242,075 - 4,275 237,800 3,655 2007 Revenue Bonds Series B 4.00-5.00 2030 182,450 182,450 - 230 182,220 540 2007 Revenue Bonds Series C 5.00 2020 78,565 78,565 - - 78,565 -
Total Intermediate Lien Bonds 503,090 503,090 - 4,505 498,585 4,195
Commercial Paper, 1999 Series D, E, F Notes1
0.1-5.15 2011 N/A 78,540 25,340 22,440 81,440 35
Sub-Total 1,550,759 25,340 54,269 1,521,830 35,629
Unamortized bond (discount) premium 21,488 445 2,721 19,212 3,210 Deferred loss on refunding (19,984) - (792) (19,192) (2,671) Current maturities of long-term debt (21,370) - 14,798 (36,168) -
Total Debt - long-term portion 1,530,893$ 25,785$ 70,996$ 1,485,682$ 36,168$
1As of June 30, 2009, the Port was authorized to issue an aggregate principal amount of commercial paper up to $300 million.
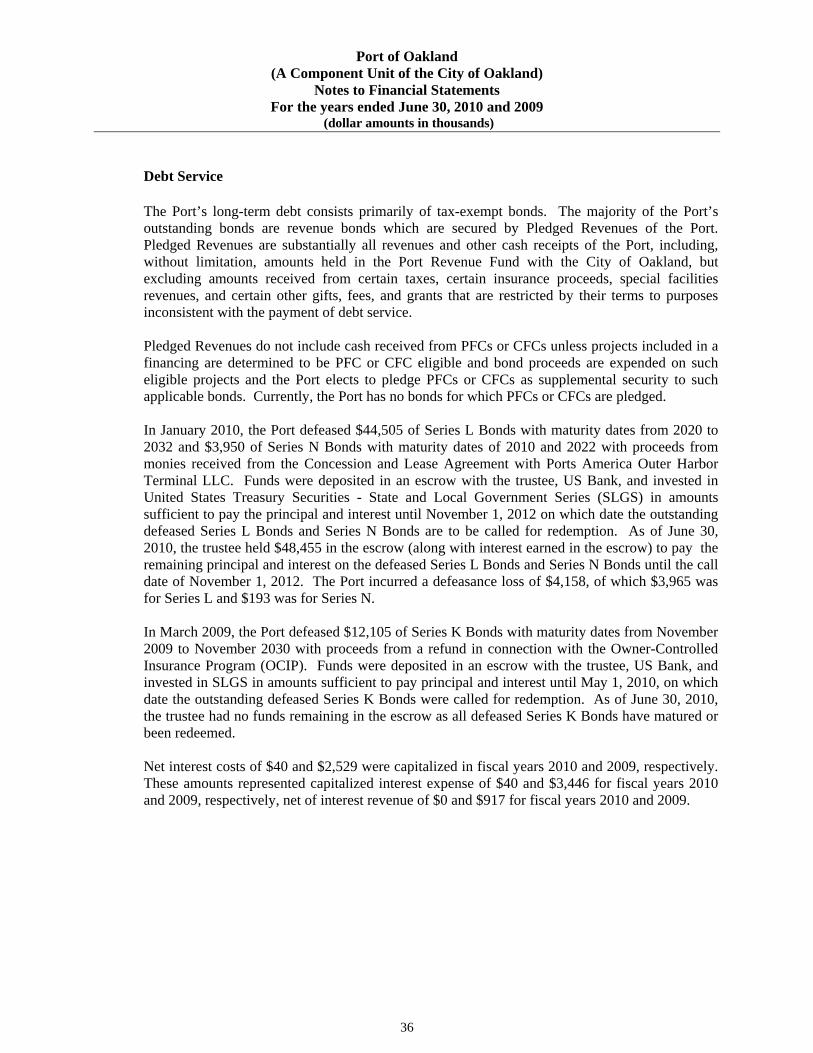
Port of Oakland (A Component Unit of the City of Oakland)
Notes to Financial Statements For the years ended June 30, 2010 and 2009
(dollar amounts in thousands)
36
Debt Service The Port’s long-term debt consists primarily of tax-exempt bonds. The majority of the Port’s outstanding bonds are revenue bonds which are secured by Pledged Revenues of the Port. Pledged Revenues are substantially all revenues and other cash receipts of the Port, including, without limitation, amounts held in the Port Revenue Fund with the City of Oakland, but excluding amounts received from certain taxes, certain insurance proceeds, special facilities revenues, and certain other gifts, fees, and grants that are restricted by their terms to purposes inconsistent with the payment of debt service. Pledged Revenues do not include cash received from PFCs or CFCs unless projects included in a financing are determined to be PFC or CFC eligible and bond proceeds are expended on such eligible projects and the Port elects to pledge PFCs or CFCs as supplemental security to such applicable bonds. Currently, the Port has no bonds for which PFCs or CFCs are pledged. In January 2010, the Port defeased $44,505 of Series L Bonds with maturity dates from 2020 to 2032 and $3,950 of Series N Bonds with maturity dates of 2010 and 2022 with proceeds from monies received from the Concession and Lease Agreement with Ports America Outer Harbor Terminal LLC. Funds were deposited in an escrow with the trustee, US Bank, and invested in United States Treasury Securities - State and Local Government Series (SLGS) in amounts sufficient to pay the principal and interest until November 1, 2012 on which date the outstanding defeased Series L Bonds and Series N Bonds are to be called for redemption. As of June 30, 2010, the trustee held $48,455 in the escrow (along with interest earned in the escrow) to pay the remaining principal and interest on the defeased Series L Bonds and Series N Bonds until the call date of November 1, 2012. The Port incurred a defeasance loss of $4,158, of which $3,965 was for Series L and $193 was for Series N. In March 2009, the Port defeased $12,105 of Series K Bonds with maturity dates from November 2009 to November 2030 with proceeds from a refund in connection with the Owner-Controlled Insurance Program (OCIP). Funds were deposited in an escrow with the trustee, US Bank, and invested in SLGS in amounts sufficient to pay principal and interest until May 1, 2010, on which date the outstanding defeased Series K Bonds were called for redemption. As of June 30, 2010, the trustee had no funds remaining in the escrow as all defeased Series K Bonds have matured or been redeemed. Net interest costs of $40 and $2,529 were capitalized in fiscal years 2010 and 2009, respectively. These amounts represented capitalized interest expense of $40 and $3,446 for fiscal years 2010 and 2009, respectively, net of interest revenue of $0 and $917 for fiscal years 2010 and 2009.

Port of Oakland (A Component Unit of the City of Oakland)
Notes to Financial Statements For the years ended June 30, 2010 and 2009
(dollar amounts in thousands)
37
Debt Service (continued)
The Port’s required debt service payments on its Senior Lien Bonds and Intermediate Lien Bonds are due each May 1 and November 1, and the California Department of Boating and Waterways Loan is due on August 1. The Port’s required debt service payment for the outstanding long-term debt, not including Commercial Paper Notes, for years ending June 30 are as follows:
Year Ending Principal Interest Total
2011 $ 36,500 $ 69,145 $ 105,645 2012 46,243 67,266 113,509 2013 49,567 64,897 114,464 2014 52,117 62,348 114,465 2015 52,921 59,735 112,656 2016 - 2020 293,373 256,444 549,817 2021 - 2025 315,097 178,785 493,882 2026 - 2030 373,984 85,169 459,153 2031 - 2033 136,540 9,117 145,657
Total $ 1,356,342 $ 852,906 $ 2,209,248
Types of Debt and Priority of Payment Senior Lien Bonds The 1993 Series F Bonds, 2000 Series K Bonds; 2002 Series L Bonds, 2002 Series M Bonds and 2002 Series N Bonds (collectively, the Senior Lien Bonds) are issued under the Amended and Restated Master Trust Indenture and are paid from Pledged Revenues first. The final payment on the 1993 Series F Bonds was made in November 2009.
As long as any Senior Lien Bonds remain outstanding, the Port has covenanted to collect rates, tolls, fees, rentals and charges so that Pledged Revenues in each fiscal year will be sufficient to pay all of the following amounts: (i) the sum of principal and interest on the outstanding Senior Lien Bonds; (ii) all other payments required for compliance with terms of the Amended and Restated Master Trust Indenture and any Supplemental Indenture including, but not limited to, required deposits to any Reserve Fund; (iii) all other payments necessary to meet ongoing legal obligations to be paid from Pledged Revenues; and (iv) operation and maintenance expenses of the Port. In addition, payment of principal and interest on the Senior Lien Bonds when due is secured by a reserve fund held by the trustee and invested in Government Treasuries, as well as being insured by municipal bond insurance policies.
The Port has also covenanted in the Amended and Restated Master Trust Indenture that Net Pledged Revenue (Revenues less the Operation and Maintenance Expenses) will be equal to at least 125% of actual debt service for the Senior Lien Bonds (Senior Lien Debt Coverage Ratio).

Port of Oakland (A Component Unit of the City of Oakland)
Notes to Financial Statements For the years ended June 30, 2010 and 2009
(dollar amounts in thousands)
38
California Department of Boating and Waterways (DBW) Loan
The DBW Loan is subordinate to the Senior Lien Bonds but superior to the Intermediate Lien Bonds and the Port’s Commercial Paper Notes with respect to the Pledged Revenues. The Port turned over the operation of its Marinas, financed, in part, with DBW Loans, to a private company through a fifty-year capital lease in May 2004. The only DBW Loan outstanding as of June 30, 2010 was Series 1993 with a balance of $5,952.
Intermediate Lien Bonds The 2007 Series A, Series B and Series C Bonds (collectively, the Intermediate Lien Bonds) issued under the Intermediate Lien Master Trust Indenture are next in payment priority. The Intermediate Lien Bonds are paid from the Intermediate Lien Pledged Revenues. The Intermediate Lien Pledged Revenues are the Pledged Revenues after payment first, of all amounts payable for any Senior Lien Bonds and second, any debt service requirements payable on the DBW Loan. Payment of principal and interest on the Intermediate Lien Bonds when due is secured by a debt service reserve surety policy, as well as being insured by municipal bond insurance policies.
The Port covenanted in the Intermediate Lien Master Trust Indenture that Net Pledged Revenues will be equal to at least 110% of the actual debt service becoming due and payable on Intermediate Lien Bonds, Senior Lien Bonds, and DBW Loan (Intermediate Lien Debt Coverage Ratio). In May 2009, the Port amended the Trust Indenture to allow for the inclusion of specific amounts from the Port Bond Reserve Fund and/or the Capital Reserve Fund, in addition to Net Pledged Revenues for the purpose of calculating the Debt Coverage Ratio under the Intermediates Indenture, until June 30, 2012. The Port informed the Trustee on October 20, 2009 that the Bond Reserve Fund ($30,000) and the Capital Reserve Fund ($15,000) will be included in the calculation of the Intermediate Lien Debt Coverage Ratio for Fiscal Year 2010.
Commercial Paper Notes Commercial Paper Notes (CP Notes) have the lowest payment priority. The Board originally authorized a $150,000 Commercial Paper program in 1998 and a further $150,000 was authorized in 1999. The maximum maturity of the CP Notes is 270 days and the maximum interest rate is 12%. Interest income paid to the holders of the CP Notes may fall under one of three tax treatments: tax-exempt Alternative Minimum Tax (AMT), tax-exempt non-AMT and taxable. As of June 30, 2010, the CP Notes were backed by an irrevocable Letter of Credit (LOC) which was held jointly by BNP Paribas and Lloyds TSB Bank plc. The BNP/Lloyds LOC was issued on August 1, 2005 with a maximum stated amount of $308,877 (principal of $300,000 and interest of $8,877) and a termination date of August 3, 2010 (see Note 11). The stated amount of the LOC at June 30, 2010, was $102,959 (principal of $100,000 and interest of $2,959) and the outstanding balance of the CP Notes was $89,440.

Port of Oakland (A Component Unit of the City of Oakland)
Notes to Financial Statements For the years ended June 30, 2010 and 2009
(dollar amounts in thousands)
39
Commercial Paper Notes (continued) In May 2009, the Port refunded and converted its outstanding $55.4 million AMT CP Notes issued in 2006 though 2008 to non-AMT CP Notes as permitted under the American Recovery and Reinvestment Act of 2009.
The Port also covenants in the Letter of Credit and Reimbursement Agreement that the Intermediate Lien Debt Coverage Ratio will be no less than 1.10 to 1.00. Priority of Payment
Maturity Date
Total Debt Service to Maturity
FY 2010 Debt
Principal and
Interest
FY 2010 Net Pledged Revenues**
Total Net Pledged Revenues $ 147,860
Senior Lien Bonds:1993 Revenue Bonds Series F 11/1/2009 $ - $ 9,915 2000 Revenue Bonds Series K 11/1/2030 609,844 27,095 2002 Revenue Bonds Series L 11/1/2032 675,141 19,440 2002 Revenue Bonds Series M 11/1/2020 61,720 16,104 2002 Revenue Bonds Series N 11/1/2022 121,337 11,664 Subtotal Senior Lien Bonds 1,468,042 84,218 (84,218)
Net Pledged Revenues Remaining after Sr. Lien 63,642
Dept. of Boating and Waterways Loan 8/1/2029 9,151 457 (457)
Net Pledged Revenues Remaining after DBW 63,185
Intermediate Lien Bonds:2007 Series A 11/1/2029 358,750 15,381 2007 Series B 11/1/2029 264,934 9,319 2007 Series C 11/1/2019 108,371 3,928 Subtotal Intermediate Lien Bonds 732,055 28,628 (28,628)
Net Pledged Revenues Remaining after Int. Lien 34,557
Commercial Paper Notes* 89,440 308 (308)
Net Pledged Revenues Remaining after CP Notes $ 34,249
Total $ 2,298,688 $ 113,611
* Maturity date is excluded for Commercial Paper as there is no set schedule for repayment. Amounts
for Commercial Paper under “Total Debt Service to Maturity” include principal only and under “FY 2010 Debt Principal and Interest” include interest only.
** Net Pledged Revenue is Revenues less Operation and Maintenance Expenses (not including operating expenses paid with CFC) plus Interest Earned (does not include interest earned on PFC/CFC funds).
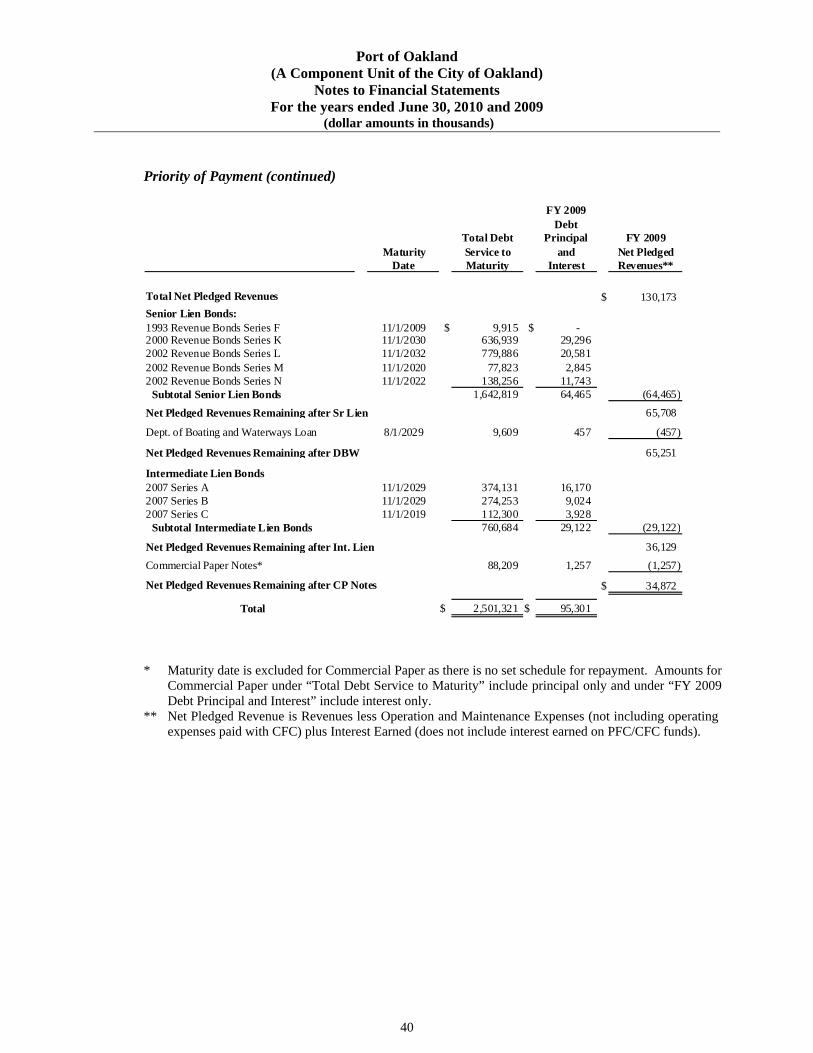
Port of Oakland (A Component Unit of the City of Oakland)
Notes to Financial Statements For the years ended June 30, 2010 and 2009
(dollar amounts in thousands)
40
Priority of Payment (continued)
Maturity Date
Total Debt Service to Maturity
FY 2009 Debt
Principal and
Interest
FY 2009 Net Pledged Revenues**
Total Net Pledged Revenues $ 130,173
Senior Lien Bonds:1993 Revenue Bonds Series F 11/1/2009 $ 9,915 $ - 2000 Revenue Bonds Series K 11/1/2030 636,939 29,296 2002 Revenue Bonds Series L 11/1/2032 779,886 20,581 2002 Revenue Bonds Series M 11/1/2020 77,823 2,845 2002 Revenue Bonds Series N 11/1/2022 138,256 11,743 Subtotal Senior Lien Bonds 1,642,819 64,465 (64,465)
Net Pledged Revenues Remaining after Sr Lien 65,708
Dept. of Boating and Waterways Loan 8/1/2029 9,609 457 (457)
Net Pledged Revenues Remaining after DBW 65,251
Intermediate Lien Bonds2007 Series A 11/1/2029 374,131 16,170 2007 Series B 11/1/2029 274,253 9,024 2007 Series C 11/1/2019 112,300 3,928 Subtotal Intermediate Lien Bonds 760,684 29,122 (29,122)
Net Pledged Revenues Remaining after Int. Lien 36,129
Commercial Paper Notes* 88,209 1,257 (1,257)
Net Pledged Revenues Remaining after CP Notes $ 34,872
Total $ 2,501,321 $ 95,301
* Maturity date is excluded for Commercial Paper as there is no set schedule for repayment. Amounts for
Commercial Paper under “Total Debt Service to Maturity” include principal only and under “FY 2009 Debt Principal and Interest” include interest only.
** Net Pledged Revenue is Revenues less Operation and Maintenance Expenses (not including operating expenses paid with CFC) plus Interest Earned (does not include interest earned on PFC/CFC funds).

Port of Oakland (A Component Unit of the City of Oakland)
Notes to Financial Statements For the years ended June 30, 2010 and 2009
(dollar amounts in thousands)
41
Bond Premium (Discount) and Refunding Loss
The Port amortizes the original issue discount or premium over the life of each bond issue. Refunding loss is amortized over the shorter of the life of the refunded bonds or the life of the refunding bonds. The unamortized amount for each Port issue is as follows:
2010 2009 2010 2009(Discount) (Discount) Refunding Refunding
Bond Issue Premium Premium Loss Loss
Commercial Paper -$ (10)$ -$ -$ 2000 Series K (1,668) (1,551) - - 2002 Series L (5,378) (5,965) - - 2002 Series M 1,862 6,152 - - 2002 Series N 2,403 3,039 (4,226) (2,753) 2007 Series A 6,154 7,102 (7,054) (7,911) 2007 Series B 8,173 5,085 (2,966) (2,979) 2007 Series C 4,795 5,360 (5,007) (5,549)
Total 16,341$ 19,212$ (19,253)$ (19,192)$
Other Long-Term Liabilities
Other long-term liabilities activities for the years ended June 30, 2010 and 2009 are as follows:
Beginning Ending Amounts Balance Balance Due Within
July 1, 2009 Additions Reductions June 30, 2010 One YearGeneral liability $ 2,571 $ 3,282 $ (2,774) $ 3,079 $ - Accrued vacation, sick leave and compensatory time 6,725 466 (1,581) 5,610 4,215 Pollution remediation liability 17,535 6,714 (3,810) 20,439 5,862 Other long-term liabilities 4,692 932 (3,922) 1,702 -
Total $ 31,523 $ 11,394 $ (12,087) $ 30,830 $ 10,077
Beginning Ending Amounts Balance Balance Due Within
July 1, 2008 Additions Reductions June 30, 2009 One YearGeneral liability $ 3,925 $ 1,131 $ (2,485) $ 2,571 $ - Accrued vacation, sick leave and compensatory time 7,497 1,523 (2,295) 6,725 4,186 Pollution remediation liability 11,657 10,578 (4,700) 17,535 4,194 Other long-term liabilities 3,668 1,078 (54) 4,692 -
Total $ 26,747 $ 14,310 $ (9,534) $ 31,523 $ 8,380

Port of Oakland (A Component Unit of the City of Oakland)
Notes to Financial Statements For the years ended June 30, 2010 and 2009
(dollar amounts in thousands)
42
6. Leases A major portion of the Port’s capital assets are leased to others. Leased assets include maritime facilities, aviation facilities, office and commercial space, and land. The majority of the Port’s leases are classified as operating leases. Certain maritime facilities are leased under agreements, which provide the tenants with preferential, but nonexclusive, use of the facilities. Certain leases provide for rentals based on gross revenues of the leased premises, or in the case of marine terminal facilities, on annual usage of the facilities. Such leases generally provide for minimum rentals, and certain preferential assignments provide for both minimum and maximum rentals. A summary of revenues from long-term leases for years ended June 30 is as follows:
2010 2009
Minimum non-cancelable rentals, including preferential assignments $ 159,646 $ 152,532 Contingent rentals in excess of minimums 14,537 16,094 Secondary use of facilities leased under preferential assignments 317 334
$ 174,500 $ 168,960
The Port and Ports America Outer Harbor Terminal, LLC, a private company, entered into a long-term concession and lease agreement on January 1, 2010 for the operation of Berths 20-24 for 50 years. A $60 million upfront fee was paid to the Port with offsets of approximately $7 million for contractual obligations. The net upfront fee of approximately $53 million at June 30, 2010, is classified as short-term and long-term deferred revenue of $1,074 and $52,077, respectively. The Port’s goals for the concession and lease agreement for Berths 20-24 was, among other things, to maintain the continuous use and occupancy of Berths 20-24 by a rent-paying tenant and maximize the annual revenue guarantee over the life of the concession, while also transferring the risk and responsibility for the berths to the concessionaire to the greatest extent commercially reasonable to do so. In furtherance of these goals, the concession and lease agreement provides that the concessionaire is responsible for any redevelopment of the berths. Except for certain emissions reductions measures which the concessionaire is obligated to implement, the improvements to be made by the concessionaire are at the discretion of the concessionaire, subject to market conditions and the concessionaire’s ability to compete for and handle cargo under the then existing condition of the facilities at Berths 20-24.

Port of Oakland (A Component Unit of the City of Oakland)
Notes to Financial Statements For the years ended June 30, 2010 and 2009
(dollar amounts in thousands)
43
Leases (continued) Minimum future rental revenues for years ending June 30 under non-cancelable operating leases having an initial term in excess of one year are as follows:
2011 $ 169,075 2012 164,225 2013 153,960 2014 153,809 2015 142,079 2016-2020 446,982 2021-2025 292,842 2026-2030 260,800 2031-2035 227,620 2036-2040 230,441 2041-2045 252,107 2046-2050 276,356 Thereafter 621,719
$ 3,392,015
The Port turned over the operation of its Marina to a private company through a long-term financing lease and operating agreement on May 1, 2004. Minimum future lease payments to be received for years ending June 30 are as follows:
2011 $ 357 2012 367 2013 378 2014 390 2015 401 2016-2020 2,194 2021-2025 2,544 2026-2030 2,949 2031-2035 3,419 2036-2040 3,963 2041-2045 4,594 2046-2050 5,326 Thereafter 4,648
$ 31,530

Port of Oakland (A Component Unit of the City of Oakland)
Notes to Financial Statements For the years ended June 30, 2010 and 2009
(dollar amounts in thousands)
44
Leases (continued)
The capital assets leased to others at June 30 consist of the following:
2010 2009
Land $ 364,707 $ 270,640 Container cranes 153,775 177,980 Buildings and other facilities 1,188,380 1,157,605
1,706,862 1,606,225 Less accumulated depreciation (478,275) (435,273)
Capital assets, net, on lease $ 1,228,587 $ 1,170,952
7. Retirement Plans
Public Employees’ Retirement System Plan Description All full-time and certain other qualifying employees of the Port are eligible to participate in the Public Employees’ Retirement Fund (Fund) of the State of California’s Public Employees’ Retirement System (CALPERS). Port employees are included on a cost-sharing basis with City employees in the City of Oakland miscellaneous unit of CALPERS. The Fund provides retirement, disability, and death benefits based on the employee’s years of service, age and final compensation. Employees vest after five years of service and may receive retirement benefits at age 50. These benefit provisions and all other requirements are established by State statute and City ordinance. CALPERS issues a separate comprehensive annual financial report. Copies of the annual financial report may be obtained from the CALPERS Executive Office, 400 Q Street, Sacramento, California 95814 or at www.calpers.ca.gov. A separate report for the City’s plan within CALPERS is not available.
Port employees have an obligation to contribute 8% of their annual CALPERS earnings to the Fund. Except for the employees described below, the Port has elected to pay such employees’ member contributions to the Fund. Employees hired on or after October 1, 2009, with the exception of members of Service Employees International Union (Local 1021) and members of the International Brotherhood of Electrical Workers (Local 1245), will be collectively known as Tier II Port employees. Tier II Port employees have an obligation to contribute 8% of their annual CALPERS earnings to the Fund.

Port of Oakland (A Component Unit of the City of Oakland)
Notes to Financial Statements For the years ended June 30, 2010 and 2009
(dollar amounts in thousands)
45
Public Employees’ Retirement System Plan Description (continued)
The Port is required to contribute the remaining amounts necessary to fund retirement benefits for its employees, using the actuarial basis determined by CALPERS. The Port’s employer contribution to the Fund was 19.558%, 19.553% and 19.199% of covered payroll in fiscal years 2010, 2009 and 2008, respectively. For the years ended June 30, 2010, 2009, and 2008, the Port’s annual pension costs for the employer contribution to CALPERS was $11,141, $9,898, and $10,655, respectively. The Port contributed 100% for each of the three years. The employer contribution rate for the year ended June 30, 2010, was based upon an actuarial valuation study performed by CALPERS Actuarial & Employer Services Division as of June 30, 2007. The Port's payroll reported to CALPERS, for employees participating in the Fund, was $56,964, $50,621, and $55,498 for the years ended June 30, 2010, 2009 and 2008, respectively. The Port's payroll for all employees was $42,867, $47,724, and $51,910 in fiscal years 2010, 2009 and 2008, respectively. The Port has exercised its option to include 8.0% employer paid member contributions paid by the Port as compensation for purposes of calculating the CALPERS contribution for the fiscal years 2010, 2009, and 2008. The payroll reported to CALPERS includes these amounts.
Agreement Between the City and the Port Regarding CALPERS Payments
During the period from July 1, 1976 through January 17, 1998, the Port appointed certain employees to positions in the classifications of Airport Servicemen and Airport Operations Supervisors. The Port was and has always been the employer that directly appointed, retained, employed and compensated the personnel in these positions.
As result of a decision by CALPERS’ Board of Administration on April 15, 1998, employees appointed to positions in the classifications of Airport Servicemen and Airport Operations Supervisors were reclassified from miscellaneous member status in CALPERS to safety member status, effective retroactively to the later of either the date of their respective employment in such classifications or July 1, 1976.
The decision to reclassify employees to safety member status has resulted in a net cost to provide retirement benefits. CALPERS’ actuary estimated that the present value of this net cost (including subsequent actual experience through June 30, 2000, and projected experience through June 30, 2002) was $5,915.
An agreement was entered into with the City of Oakland for the payment of this net cost by the Port directly to CALPERS. The agreement provides for the Port to make payments over 20 years in annual installments, adjusted for cost of living at a rate of 3.75%, until fully paid. No pre-payment penalty applies. Total payments to CALPERS through June 30, 2010 amount to $4,248. All contributions were paid from Airport revenues.
Port of Oakland (A Component Unit of the City of Oakland)
Notes to Financial Statements For the years ended June 30, 2010 and 2009
(dollar amounts in thousands)
46
Other Postemployment Benefits (OPEB)
Plan Description The Port contributes to the California Employer’s Retiree Benefit Trust (CERBT), a single-employer defined benefit postemployment healthcare plan administered by CALPERS. The CERBT is an Internal Revenue Code Section 115 trust and an investment vehicle that can be used by all California public employers to prefund future retiree health and Other Postemployment Benefits (OPEB) costs. The Port’s Retiree Health plan allows eligible retirees and their dependents to receive employer paid medical insurance benefits through CALPERS. The medical insurance reimbursement is not to exceed the Kaiser-HMO family plan rate. The Retiree Health Plan also includes dental, and vision benefits and reimbursement of Medicare Part B monthly insurance premium. The financial statements for CERBT may be obtained by writing the California Public Employees’ Retirement System, Constituent Relations Office, CERBT (OPEB), P.O. Box 242709, Sacramento, California 94229-2709 or by calling 888-225-7377.
Funding Policy Benefit provisions are established and are amended through negotiations between the Port and the various bargaining units during each bargaining period. The Port pays retiree benefit expenses on a pay-as–you-go basis. As of June 30, 2010, there were approximately 500 employees who had retired from the Port and were in the Port’s retiree benefit plan. During the fiscal year ended June 30, 2010, the Port made payments of $5,073 on behalf of OPEB eligible retirees to third parties outside of the CERBT. For fiscal year 2010, the CERBT had net investment earning of $1.5 million.
As of June 30, 2009, there were approximately 450 employees who had retired from the Port and were in the Port’s retiree benefit plan. During the fiscal year ended June 30, 2009, the Port contributed $7,754 to CERBT and made payments of $4,575 on behalf of OPEB eligible retirees to third parties outside of CERBT. For fiscal year 2009, the CERBT had net investment earning of $1.9 million.
Annual OPEB Cost and Net OPEB Obligation The Port’s annual OPEB cost is equal to actuarially determine (a) the annual required contribution (ARC), plus (b) one year’s interest on the beginning balance of the net OPEB obligation, and minus (c) an adjustment to the ARC. The ARC represents a level of funding that, if paid on an ongoing basis, is projected to cover the normal cost of each year and any unfunded actuarial liabilities (or funding excess) amortized over thirty years.

Port of Oakland (A Component Unit of the City of Oakland)
Notes to Financial Statements For the years ended June 30, 2010 and 2009
(dollar amounts in thousands)
47
Annual OPEB Cost and Net OPEB Obligation (continued)
The following table shows the components of the Port’s annual OPEB cost for the year, the amount contributed to the Plan, and changes in the Port’s net OPEB obligation to the Plan:
June 30, 2010 June 30, 2009Annual required contribution $ 10,019 $ 10,019 Interest on prior year net OPEB obligation 422 401 Adjustment to annual required contribution (422) (401) Annual OPEB Cost 10,019 10,019 Contribution made (5,073) (12,330) Decrease/increase in net OPEB obligation 4,946 (2,311) Net OPEB obligation - beginning of year 5,443 7,754 Net OPEB obligation - end of year $ 10,389 $ 5,443
The Port’s annual OPEB cost, the percentage of annual OPEB cost contributed to the plan, and the net OPEB obligation (asset) for the current and prior two years are as follows:
Fiscal Year End
Annual OPEB Cost
Percentage of OPEB
Cost Contributed
Net OPEB Obligation
6/30/2008 $ 11,683 34% $ 7,7546/30/2009 $ 10,019 123% $ 5,4436/30/2010 $ 10,019 51% $ 10,389
Funding Status and Funding Progress The unfunded actuarial accrued liability is being amortized as level percentage of expected payroll over 30 years. The table below indicated the funded status of the Plan as of January 1, 2009, the most recent actuarial valuation date.
Actuarial Accrued Liability (AAL) $ 100,412 Actuarial Value of Plan Assets - Unfunded Actuarial Accrued Liability (UAAL) $ 100,412
Funded Ratio (actuarial value of plan assets/AAL) 0.0%Annual Covered Payroll (active plan members) $ 48,400 UAAL as a Percentage of Annual Covered Payroll 207%

Port of Oakland (A Component Unit of the City of Oakland)
Notes to Financial Statements For the years ended June 30, 2010 and 2009
(dollar amounts in thousands)
48
Funding Status and Funding Progress GASB Statement No. 45 requires that the interest rate used to discount future benefit payments back to the present be based on the expected rate of return on any investments set aside to pay for these benefits. As of the January 1, 2009 actuarial valuation, the Port intended to fully fund its OPEB liabilities by contributing the annual OPEB cost to the CERBT trust and used a discount rate of 7.75% for this valuation based on CALPERS’ expected return on assets held in the Port’s OPEB Trust. For the year ended June 30, 2010, the Port funded its annual OPEB cost at 51%. Recognizing that a lower discount rate should be considered, the Port performed a sensitivity analysis and obtained a second valuation using a lower discount rate of 4.0% to reflect a pay-as-you-go funding policy and keeping all other assumptions constant. The Port’s UAAL, as of the January 1, 2009 actuarial valuation, would increase by approximately $68.4 million to $168.8 million and its annual OPEB cost would increase by $4.0 million to $14.0 million. The Port is currently evaluating its funding policy and its other economic actuarial assumptions in preparation for its January 1, 2011 actuarial valuation.
Eligible Retirees Defined
Employees must have attained the age of fifty or over at the time of retirement, have five or more years of CALPERS service, and must be eligible to receive PERS retirement benefits in order to be classified as an Eligible Retiree.
Actuarial Methods and Assumptions
The actuarial cost method used for determining the benefit obligations of the Port is the Entry Age Normal Cost Method and amortized over an open period of 30 years. Under the principles of this method, the actuarial present value of the projected benefits of each individual included in the valuation is allocated as a level percentage of expected salary for each year of employment between entry age (defined as age at hire) and assumed exit. Actuarial valuations of an ongoing plan involve estimates of the value of reported amounts and assumptions about the probability of occurrence of events far into the future. Examples include assumptions about future employment, mortality, and the healthcare cost trend. Actuarially determined amounts are subject to continual revision as actual results are compared with past expectations and new estimates are made about the future. Projections of benefits for financial reporting purposes are based on the substantive plan in effect and include the types of benefits provided at the time of each valuation and the historical pattern of sharing of benefit costs between the employer and plan members to that point. The actuarial methods and assumptions used include techniques that are designed to reduce the effects of short-term volatility in actuarial accrued liabilities and the actuarial value of assets, consistent with the long-term perspective of the calculations.
Port of Oakland (A Component Unit of the City of Oakland)
Notes to Financial Statements For the years ended June 30, 2010 and 2009
(dollar amounts in thousands)
49
Actuarial Methods and Assumptions (continued) The actuarial assumptions used included a discount rate of 7.75%, and an annual health cost trend rate of 5% to 6.5% in health premiums. Annual salary increases were assumed at 3.25%. The demographic assumptions regarding turnover and retirement are based on statistics from reports for CALPERS under a “2.7% @ 55” benefit schedule. The schedules presented as required supplementary information following the notes to the financial statements, present multiyear trend information. The Schedule of Funding Progress - Other Postemployment Benefits presents information about whether the actuarial values of plan assets are increasing or decreasing over time relative to the actuarial accrued liabilities for benefits.
8. Agreements with City of Oakland
The Port has entered into agreements with the City, which include, but are not limited to, the following: aircraft rescue and fire fighters; and police, fire, public street cleaning and maintenance; and similar services (General Services) provided by the City to the Port; and Lake Merritt payments. The Port and the City have not finalized agreements for Special Services (administrative, personnel and financial services). Payments are made upon execution of appropriate agreements and for some payments periodic findings and authorizations from the Board. Special Services Payments for Special Services are treated as a cost of Port operations pursuant to City Charter Section 717(3) Clause Third and have priority over certain other expenditures of Port revenues. Special Services from the City totaled $6,566 and $7,103 in 2010 and 2009, respectively, and are included in "Operating Expenses.” At June 30, 2010 and 2009, $9,284 and $8,987, respectively, were accrued as current liabilities for these payments. General Services and Lake Merritt Payments for General Services from the City are payable only to the extent the Port determines annually that surplus monies are available under the Charter for such purposes. As of June 30, 2010 and 2009, the Port accrued approximately $3,617 and $2,435, respectively, of payments for General Services. Additionally, subject to certain conditions, the Port accrued approximately $2,865 and $1,928 to reimburse the City for General Services for net City expenditures for Lake Merritt tideland trust purposes in the 2010 and 2009 fiscal years, respectively. Subject to availability of surplus monies, the Port expects that it will continue to reimburse the City annually for General Services and Lake Merritt tideland trust purpose costs.

Port of Oakland (A Component Unit of the City of Oakland)
Notes to Financial Statements For the years ended June 30, 2010 and 2009
(dollar amounts in thousands)
50
Lease with the City The Port has leased property to the City under a 66-year lease, which is expressed in terms of the Amended and Restated Lease between the Port and the City for the development and operation of a public golf course by the City. The lease commenced in 2003 when the Port delivered a completed 164.90 acre golf course to the City to replace the City’s golf course that was destroyed when the Port used the site as a dredge disposal site. The golf course is leased to a third party and the minimum annual rental is $270 payable in twelve installments of $22 per month, which is then split 50/50 between the Port and the City. Deferred Rent In November 1994, the City Redevelopment Agency (Agency), a blended component unit of the City, entered into an agreement to assist in the development of a project related to a lease. The lease required $5,145 in tenant improvements partially financed by $2,000 in deferred rent from the Agency. The deferred rent is classified as deferred revenue. At June 30, 2010 and 2009, deferred rent approximated $1,082 and $1,151, respectively. The amount classified as short term deferred revenue at June 30, 2010 and 2009 was $70.
9. Commitments
Capital Program
The $532 million 5-Year Capital Needs Assessment includes projects in the Aviation, Maritime, Commercial Real Estate and Support Divisions. The most significant Aviation projects are the Terminal 1 renovation and retrofit; reconstruction of aprons and taxiways; runway safety area; perimeter dike improvements; passenger boarding bridges replacement program, and storm water and utility infrastructure rehabilitation. The most significant Maritime projects are the shore power program; security initiatives; site preparation and redevelopment of the former Oakland Army Base; and Berth 30-32 terminal development. As of June 30, 2010, the Port had construction commitments for the acquisition and construction of assets as follows:
Aviation $ 46,524 Maritime 37,646 Commercial Real Estate 609
Total $ 84,779
The most significant projects for which the Port has contractual commitments are airport terminal renovation projects of $7,605, runways and east apron reconstruction of $14,947, modernization of maritime wharves and terminals projects of $9,881, yard and gate improvement projects of $2,427 and safety projects of $6,041.

Port of Oakland (A Component Unit of the City of Oakland)
Notes to Financial Statements For the years ended June 30, 2010 and 2009
(dollar amounts in thousands)
51
Power Purchases The Port purchases electrical power for resale and self-consumption at the Airport, and at Port Maritime facilities located at the former Navy Fleet and Industrial Supply Center Oakland and the former Oakland Army Base. After power requirements are determined, the Port commits and enters into purchase contracts, in advance, with power providers. The price is fixed at the time the Port enters into the contract. At June 30, 2010, the total purchase commitment is approximately $7,714 for 125,045 megawatt-hours. Management Agreement The Port has entered into a cost reimbursable Management Agreement with the East Bay Regional Park District. Under the Management Agreement, the Port is responsible for the costs of management and operation of the Middle Harbor Shoreline Park, including the costs of supplies, services and administration, which are estimated to be approximately $1,200 to $1,750 for each year between 2005 and 2011. Payments totaling $1,092 and $1,601 were made in fiscal years 2010 and 2009, respectively.
10. Contingencies
Environmental
On April 20, 1999, the Board adopted Vision 2000 Air Quality Mitigation Program (“AQMP”) per Resolution No. 99154. The AQMP included a Port commitment to spend approximately $9,000 for various air quality mitigation measures. The AQMP was developed in consultation with representatives of West Oakland Neighbors (WON), per the terms of the WON Consent Decree that was approved by the Board on February 3, 1998 (Resolution No. 98065). To date approximately $6,182 has been spent.
As part of the Airport Development Program (ADP), the Port is subject to environmental, operational and regulatory obligations. These obligations arise from the adopted ADP Mitigation Monitoring and Reporting Program required under the California Environmental Quality Act regulatory requirements imposed by the Regional Water Quality Control Board and the Bay Conservation and Development Commission and obligations pursuant to litigation settlements.
The Port anticipates spending approximately $2,425 annually for all environmental compliance and remediation obligations. Environmental monitoring costs relating to legal mandates such as regulatory agency orders, court orders or other affirmative legal obligations are included in the anticipated spending.

Port of Oakland (A Component Unit of the City of Oakland)
Notes to Financial Statements For the years ended June 30, 2010 and 2009
(dollar amounts in thousands)
52
Environmental (continued) A summary of the environmental compliance and remediation liability accounts, included within the "Environmental and other" section of the statements of net assets at June 30, 2010 and 2009, is as follows:
June 30, 2010 Estimated Obligating Event Liability Recovery
Pollution poses an imminent danger to the public or environment $ - $ - Violated a pollution prevention-related permit or license - - Identified as responsible to clean-up pollution 17,542 619 Named in a lawsuit to compel to cleanup 51 - Begins or legally obigates to cleanup or post-cleanup activities 2,846 60
Total by Obligating Event $ 20,439 $ 679
June 30, 2009 Estimated Obligating Event Liability Recovery
Pollution poses an imminent danger to the public or environment $ - $ - Violated a pollution prevention-related permit or license - - Identified as responsible to clean-up pollution 15,109 1,319 Named in a lawsuit to compel to cleanup 16 - Begins or legally obigates to cleanup or post-cleanup activities 2,410 31
Total by Obligating Event $ 17,535 $ 1,350
The environmental liability accounts in the summary tables are listed by the initial obligating event. Due to new information, the obligating event may change from the initial obligating event. Examples of obligating events include: 1) the Port is named, or evidence indicates that it will be named, by a regulator such as the Department of Toxic Substances Control or the Regional Water Quality Control Board, as a responsible party or potentially responsible party for remediation; or 2) the Port has commenced, or legally obligates itself to commerce, clean-up activities or monitoring or operation and maintenance of the remediation effort (e.g., by undertaking a soil and groundwater pre-development investigation). Methods and Assumptions The Port measured the environmental liabilities for pollution remediation sites on Port-owned property using the Expected Cash Flow technique. The measurements are based on the current value of the outlays expected to be incurred. The cash flow scenarios include each component which can be reasonably estimated for outlays such as testing, monitoring, legal services and indirect outlays for Port labor instead of ranges of all components. Reasonable estimates of ranges of possible cash flows are limited from a single scenario to a few scenarios. Data used to develop the cash flow scenarios is obtained from outside consultants, Port staff, and the Port’s outside legal counsel.
Port of Oakland (A Component Unit of the City of Oakland)
Notes to Financial Statements For the years ended June 30, 2010 and 2009
(dollar amounts in thousands)
53
Methods and Assumptions (continued) Changes to estimates will be made when new information becomes available. Estimates for the pollution remediation sites will be developed when the following benchmarks or changes in estimated outlays occur: Receipt of an administrative order. Participation, as a responsible party or a potentially responsible party, in the site
assessment or investigation. Completion of a corrective measures feasibility study. Issuance of an authorization to proceed. Remediation design and implementation, through and including operation and
maintenance and postremediation monitoring. Change in the remediation plan or operating conditions, including but not limited to type
of equipment, facilities and services that will be used and price increases. Changes in technology. Changes in legal or regulatory requirements. Recoveries In calculating the estimated future recoveries that are listed on the prior page, Port staff and outside legal counsel reviewed and applied the requirements of GASB 49 for accounting for recoveries. For example, if a Port tenant has a contract obligation to reimburse the Port for certain pollution remediation costs, an estimate was made of the expected recovery. As another example, if an insurance carrier has paid money on a certain claim and the Port is pursuing additional costs from the insurance carrier associated with the claim, the recovery has been estimated. In those cases where an insurance carrier has not yet acknowledged coverage, then, a recovery has not been estimated.

Port of Oakland (A Component Unit of the City of Oakland)
Notes to Financial Statements For the years ended June 30, 2010 and 2009
(dollar amounts in thousands)
54
Litigation
As of June 30, 2010, the Port was a defendant in various lawsuits arising in the normal course of constructing public improvements or construction related claims for unspecified amounts. The ultimate disposition of these suits and claims is not known. The Port’s insurance may cover a portion of any losses. A summary of the reported liability included within the “Environmental and other” section of the statements of net assets is as follows:
General liability at June 30, 2007 $ 4,747 Current year claims and changes in estimates 4,287 Vendor payments (5,109)
General liability at June 30, 2008 3,925 Current year claims and changes in estimates 1,131 Vendor payments (2,485)
General liability at June 30, 2009 2,571 Current year claims and changes in estimates 3,282 Vendor payments (2,774)
General liability at June 30, 2010 $ 3,079
Insurance
Workers' Compensation
The Port is exposed to risk of loss related to injuries to employees. The Port is self-insured and self-administered for workers' compensation up to a maximum of $750 per accident. The Port carries commercial insurance for claims in excess of $750 per accident. There were no workers’ compensation claims paid in fiscal years 2010, 2009 and 2008 above the $750 per accident limit.
Claim expenses and liabilities are reported when it is probable that a loss has occurred and the amount of that loss can be reasonably estimated. The claims payments and liability include an estimate of allocated loss adjustment expenses and claims that have been incurred but not yet reported. These losses are based on an actuarial valuation performed as of June 30, 2009 and include an estimate of claims that have been incurred but not reported. Estimated reserves can be defined as “actuarial central estimates” which represent the expected value of range of reasonably possible outcomes. The probability level refers to the probability that actual future payments will not exceed the indicated reserve amount. The June 30, 2010 Workers’ Compensation Loss Reserve amount of $6,900 has been based upon an actuarial study. The total reserve is equal to case reserves plus incurred but not reported (IBNR) reserves. Case reserves are established by individual claims adjusters. The IBNR reserves are estimated by the actuary and include reserves for late reported claims as well as development on known claims. The reserve amount is net of excess insurance on an expected value, undiscounted basis. The loss reserve amount represents an estimated reserve amount required to satisfy the Port’s retained liability without a contingency provision for unanticipated development.

Port of Oakland (A Component Unit of the City of Oakland)
Notes to Financial Statements For the years ended June 30, 2010 and 2009
(dollar amounts in thousands)
55
Workers' Compensation (continued)
Changes in the reported liability, which is included as part of accounts payable and accrued liabilities, follows:
Workers' compensation liability at June 30, 2007 $ 6,000 Current year claims and changes in estimates 869 Claim payments (869)
Workers' compensation liability at June 30, 2008 6,000 Current year claims and changes in estimates 962
Claim payments (825)
Workers' compensation liability at June 30, 2009 6,137
Current year claims and changes in estimates 1,699 Claim payments (936)
Workers' compensation liability at June 30, 2010 $ 6,900
Liability Insurance
The Port maintains liability insurance in excess of specified deductibles. For the Airport, coverage is provided in excess of $200 in the aggregate up to a maximum of $200,000 per occurrence. For the harbor area and the Port’s real estate holdings, coverage is provided in excess of $1,000 per occurrence up to a maximum amount of $150,000 per occurrence. Additionally, the Port maintains a Public Officials Errors & Omissions and Employment Practices policy. The policy limits are $25,000 with a $500 per claim deductible. Defense costs are in addition to the policy limits, but are included in the deductible. The Port is uninsured for losses in excess of these amounts. Casualty losses are accrued when it is determined that a loss to the Port is probable and the amount is estimable.
Landscaping and Lighting Assessment District (LLAD)
LLAD assessments in the aggregate amount of $2,171 have been imposed on Airport property within the Port Area for the years ended June 30, 1997 through 2010. The Port has not received sufficient information from the City to conclude that payments for such assessments are permissible by the Port under the Federal Aviation Administration's Policy and Procedures Concerning the Use of Airport Revenue.
11. Subsequent Event
The Commercial Paper Notes were backed by an irrevocable Letter of Credit (LOC) which was held jointly by BNP Paribas (BNP) and Lloyds TSB Bank plc (Lloyds), which was expected to terminate on August 20, 2010. The Port substituted BNP and Lloyds’ LOC with LOCs issued by Wells Fargo Bank, National Association (Wells) and JPMorgan Chase Bank, National Association (JPM). The LOCs with Wells and JPM became effective on August 2, 2010 and expires on August 2, 2013 and August 2, 2012, respectively. The LOC with BNP and Lloyds terminated on August 3, 2010.

56
This page left intentionally blank.

REQUIRED SUPPLEMENTARY INFORMATION


Port of Oakland (A Component Unit of the City of Oakland)
Required Supplementary Information (Unaudited) For the years ended June 30, 2010 and 2009
(dollar amounts in thousands)
57
1. Schedule of Funding Progress – Other Postemployment Benefits
The schedule of funding progress presented below provides a consolidated snapshot of a Port’s ability to meet current and future liabilities with the plan assets. Of particular interest to most is the funded ratio. This ratio conveys a plan’s level of assets to liabilities, an important indicator to determine the financial health of the OPEB plan. The closer the plan is to a 100% funded status, the better position it will be in to meet all of its future liabilities.
The next valuation will be performed January 1, 2011. The Actuarial Accrued Liability decreased $43,182 as a result of the Port establishing the California Employer’s Retiree Benefit Trust (CERBT) in fiscal year 2009.
Actuarial Valuation
Date
Actuarial Value of
Assets (a)
Actuarial Accrued Liability
(AAL) (b)
Unfunded AAL
(UAAL) (b-a)
Funded Ratio (a/b)
Covered Payroll (c)
UAAL as a % of Covered Payroll
((b-a)/c)
1/1/2009 $ - $ 100,412 $ 100,412 - $ 48,400 207%
1/1/2007 $ - $ 143,594 $ 143,594 - $ 49,400 291%

58
This page left intentionally blank.

Statistical Section (Unaudited)


PORT OF OAKLAND (A Component Unit of the City of Oakland)
Statistical Section
59
This part of the comprehensive annual financial report for the Port of Oakland presents detailed information as a context for understanding the financial statements, note disclosures, and required supplementary information. Contents Schedule Financial Trends Net Assets by Components .................................................................................................... 1 Statements of Revenues, Expenses and Changes in Net Assets ............................................. 2 Revenue Capacity Aviation Division: Principal Revenue Sources and Airline Revenue per Enplaned Passenger ............................ 3 Aviation Statistics – South Airport ........................................................................................ 4 Top Ten Individual Sources of Aviation Revenue by Alphabetical Order ............................ 5
Schedule of Airline Rates and Charges .................................................................................. 6 Maritime Division: Principal Revenue Sources, Revenue per Container .............................................................. 7 Maritime Division - Container Trends ................................................................................... 8 Top Ten Individual Sources of Maritime Revenue by Alphabetical Order ........................... 9 Debt Capacity Net Revenue Calculation for Debt Service Coverage .......................................................... 10 Debt Service Coverage ......................................................................................................... 11
Ratios of Debt Service ......................................................................................................... 12 Demographic and Economic Information Demographic and Economic Statistics for the City of Oakland .......................................... 13 Principal Employers – FY 2010 vs. FY 2006 ...................................................................... 14 Operating Information Employee Count by Division ............................................................................................... 15 Capital Assets Statistics by Function/Program .................................................................... 16

Port of Oakland (A Component Unit of the City of Oakland)
Schedule of Net Assets by Components Last Ten Fiscal Years
(dollar amounts in thousands)
Schedule 1
2001 2002 2003 2004 2005 2006 2007 2008 (1) 2009 2010Net assets: Invested in capital assets,
net of related debt $ 362,907 $ 549,074 $ 533,365 $ 483,659 $ 592,698 $ 663,939 $ 875,547 $ 862,165 $ 853,011 $ 879,258 Restricted 50,922 55,508 117,119 175,229 136,004 114,377 9,806 12,692 21,357 11,677 Unrestricted 195,607 72,284 68,566 49,925 34,414 49,266 11,896 39,729 14,838 51
Total net assets $ 609,436 $ 676,866 $ 719,050 $ 708,813 $ 763,116 $ 827,582 $ 897,249 $ 914,586 $ 889,206 $ 890,986
Note: (1) The 2008 unrestricted net assets amount was reduced by $9,212 in 2009 for a prior period adjustment.
Source: Port of Oakland Statements of Net Assets
60

Port of Oakland(A Component Unit of the City of Oakland)
Statements of Revenues, Expenses and Changes in Net AssetsLast Ten Years
(dollars amounts in thousands)
Schedule 2
2001 2002 2003 2004 2005 2006 2007 2008 2009 2010Operating revenues:
Aviation $ 103,141 $ 106,232 $ 112,960 $ 121,183 $ 126,988 $ 133,869 $ 139,491 $ 159,086 $ 130,443 $ 130,284Maritime 77,806 84,302 92,047 99,605 112,859 122,819 127,141 128,351 140,739 143,344Commercial real estate 16,223 15,511 12,572 11,747 11,163 10,773 10,742 12,446 12,108 11,597
Total operating revenues 197,170 206,045 217,579 232,535 251,010 267,461 277,374 299,883 283,290 285,225
Operating expenses:Aviation 82,112 98,140 110,517 116,385 123,295 134,104 144,169 162,299 161,542 152,099Maritime 38,109 49,443 60,491 64,271 67,609 72,451 75,570 82,264 90,029 84,004Commercial real estate 20,856 23,156 20,559 17,333 15,154 13,553 14,140 13,711 12,674 12,606
Total operating expenses (1) 141,077 170,739 191,567 197,989 206,058 220,108 233,879 258,274 264,245 248,709
Operating income 56,093 35,306 26,012 34,546 44,952 47,353 43,495 41,609 19,045 36,516
Non-operating revenues (expenses):Interest income 5,763 5,587 6,939 3,653 8,935 11,146 10,457 13,145 9,655 8,635Interest expense (32,086) (42,550) (48,151) (54,410) (59,488) (61,405) (65,261) (76,796) (78,415) (78,518)Loss on debt defeasance - - - - - - - - - (4,158)Customer facility charges (2) - - - 5,936 5,375 7,742 7,430 6,999 5,235 4,530Passenger facility charges (2) - - 7,600 - - 29,671 30,221 27,033 19,391 19,702Other income (expenses) 3,959 4,243 17,166 12,874 3,678 2,136 10,419 2,452 (5,072) 292Loss on disposal of capital assets - - (992) (57,631) (514) (1,835) (2,761) (14,985) (435) (6,562)
Total net non-operating expenses (22,364) (32,720) (17,438) (89,578) (42,014) (12,545) (9,495) (42,152) (49,641) (56,079)
Change in net assets before capital contributions 33,729 2,586 8,574 (55,032) 2,938 34,808 34,000 (543) (30,596) (19,563)
Capital contributions: Grants from government agencies 32,082 45,550 12,877 10,339 19,180 29,658 14,094 27,092 11,896 21,343Land conveyed to Port - - - 3,173 - - - - - -Land conveyed from U.S. Army - - - - - - 21,573 - - -Passenger facility charges (PFC) (2) 18,840 17,613 12,460 29,130 29,031 - - - - -Customer facility charges (CFC) (2) - 1,681 6,944 1,118 2,043 - - - - -Interest income from PFC and CFC - - 1,329 1,035 1,111 - - - - -
Total capital contributions 50,922 64,844 33,610 44,795 51,365 29,658 35,667 27,092 11,896 21,343
Change in net assets 84,651 67,430 42,184 (10,237) 54,303 64,466 69,667 26,549 (18,700) 1,780Net assets, beginning of the year, as restated 524,785 609,436 676,866 719,050 708,813 763,116 827,582 888,037 (3) 907,906 (4) 889,206Net assets, end of the year $ 609,436 $ 676,866 $ 719,050 $ 708,813 $ 763,116 $ 827,582 $ 897,249 $ 914,586 $ 889,206 $ 890,986
Note:
(1) Total operating expenses include depreciation and amortization.(2) CFC and PFC were presented in various formats and in separate line items. Commencing in FY 2006, all CFC and PFC were categorized as "Non-operating revenues & expenses" in the Port's audited financial statements(3) The 2008 unrestricted net assets amount was reduced by $9,212 in 2009 for a prior period adjustment.(4) The beginning balance decreased by $6,680 due to the adoption of GASB 49.
Source: Port of Oakland Statements of Revenues, Expenses and Changes in Net Assets
61

Port of Oakland (A Component Unit of the City of Oakland)
Principal Revenue Sources and Airline Revenue per Enplaned Passenger Last Ten Fiscal Years (dollars in thousands)
Schedule 3
2001 2002 2003 2004 2005 2006 2007 2008 2009 2010
Aviation revenues:
Terminal rental (1) $ 11,870,965 $ 13,408,112 $ 14,585,818 $ 20,215,042 $ 23,115,191 $ 26,496,828 $ 29,086,828 $ 32,153,229 $ 26,263,040 (3) $ 26,832,076 Landing fees (Excludes Cargo Airlines) 8,000,943 8,571,857 9,991,696 10,604,702 11,296,427 12,587,169 14,442,874 16,838,252 17,213,846 19,206,913
Total airline revenues 19,871,908 21,979,969 24,577,514 30,819,744 34,411,618 39,083,997 43,529,702 48,991,481 43,476,886 46,038,989
Concession 12,316,022 13,245,806 15,235,316 15,250,009 15,892,401 17,323,078 18,773,156 21,861,577 17,948,928 (3) 18,797,132 Parking & ground access 36,544,098 35,899,771 39,756,363 45,140,417 42,425,750 42,381,447 41,567,417 39,221,863 29,505,355 (3) 28,001,940 Lease rentals 17,275,405 16,975,576 17,109,045 15,149,828 16,522,758 16,173,463 18,054,979 20,551,862 21,004,740 19,776,344 Landing Fees--Cargo Airlines 3,809,480 3,646,189 4,058,914 3,998,258 4,350,225 4,911,713 5,677,359 6,603,275 7,926,263 7,646,361 Aviation Fueling 2,800,884 3,017,525 2,943,949 3,111,504 6,833,030 5,879,259 3,993,271 13,411,817 3,564,246 3,589,896 Utility sales 6,697,319 8,173,134 5,484,901 4,088,391 4,585,644 3,941,092 3,803,021 4,000,763 4,192,036 3,690,206 Other (2) 3,825,512 3,294,176 3,794,076 3,625,020 1,967,402 6,174,920 4,092,139 4,443,581 2,824,306 2,743,363
Total revenues $ 103,140,628 $ 106,232,146 $ 112,960,078 $ 121,183,171 $ 126,988,828 $ 135,868,969 $ 139,491,044 $ 159,086,219 $ 130,442,760 $ 130,284,231
Enplaned passengers 5,659,448 5,743,634 (4) 6,643,967 (4) 6,957,782 7,171,141 7,187,587 7,267,170 6,802,486 4,955,743 (3) 4,777,514
Airline revenue per enplaned passenger $ 3.51 $ 3.83 $ 3.70 $ 4.43 $ 4.80 $ 5.44 $ 5.99 $ 7.20 $ 8.77 $ 9.64
Note:(1) Terminal rentals are for airlines only. Non-airline Terminal Revenues are classified under "Other".
(2) Includes non-airline terminal revenues, miscellaneous revenues and other field revenue.
(3) The drop in commercial activities were due to loss of 7 airlines, namely American Airline, Aloha Airline, Continental Airline, Express Jet, Skybus, ATA Airlines and TACA International Airlines.
(4) Reflects difference from Continuing Disclousure Certificates-Table 5. Numbers herein reflect adjustment on United Airlines reported passengers which double counted Skywest passengers.
Source: Port of Oakland Aviation Monthly Activities Report
0.002.004.006.008.00
10.0012.00
2001 2002 2003 2004 2005 2006 2007 2008 2009 2010
Rev
enu
e in
$
Fiscal Years
Airline Revenue Per Enplaned Passenger
62

Port of Oakland (A Component Unit of the City of Oakland)
Aviation Statistics - South Airport Last Ten Fiscal Years
Schedule 4
2001 2002 2003 2004 2005 2006 2007 2008 2009 2010PASSENGERSEnplaned 5,659,448 5,743,634 (4) 6,643,967 (4) 6,957,782 7,171,141 7,187,587 7,267,170 6,802,486 4,955,743 4,777,514Deplaned 5,697,286 5,744,352 6,619,648 6,939,143 7,135,168 7,180,976 7,266,655 6,824,544 4,968,042 4,780,661 Total 11,356,734 11,487,986 13,263,615 13,896,925 14,306,309 14,368,563 14,533,825 13,627,030 9,923,785 (1) 9,558,175
FREIGHT ( in 000 lb)Inbound 732,984 694,314 675,629 674,783 713,544 703,118 693,291 694,513 568,696 516,536Outbound 657,621 657,789 716,146 723,190 767,210 771,810 768,048 741,453 626,474 541,473 Total 1,390,605 1,352,103 1,391,775 1,397,973 1,480,754 1,474,928 1,461,339 1,435,966 1,195,170 (2) 1,058,009
TOTAL AIR CARGO (in 000 lb) 1,472,908 1,369,024 1,401,226 1,408,452 1,493,531 1,485,973 1,471,796 1,452,437 1,212,414 (2) 1,079,243 (Freight & Mail)
LANDED WEIGHT (in 000 lb)Passenger Carriers 7,519,149 7,739,933 8,634,533 8,866,505 9,169,200 9,146,466 9,385,634 9,095,540 6,873,515 (1) 6,317,054Cargo Carriers 3,539,511 3,292,053 3,495,899 3,332,566 3,523,295 3,568,463 3,678,155 3,560,162 3,158,521 (2) 2,513,201 Total 11,058,660 11,031,986 12,130,432 12,199,071 12,692,495 12,714,929 13,063,789 12,655,702 10,032,036 8,830,255
AIRCRAFT MOVEMENTS 179,332 171,262 179,641 182,079 187,858 186,321 189,712 181,690 122,028 (1) 114,327
PARKINGNumber of stalls 7,965 7,306 7,616 8,596 8,431 7,298 6,864 7,868 6,103 (3) 6,315Average revenue per stall $4,173 $4,399 $4,633 $4,648 $4,391 $4,991 $5,112 $4,151 $3,991 (1) $3,605
Note: Oakland Airport was comprised of the North and South Airport. North Airport handles general aviation and South Airport handles commercial passengers and freight airlines.
(1) The drop in commercial activities was due to loss of 7 airlines, namly American Airlines, Aloha Airlines, Continental Airlines, Express Jet, Skybus, ATA Airlines and TACA International Airlines.(2) Federal Express reduced the number of flights by 13% during FY 2008-09.(3) 1,186 stalls in Daily Parking Lot were blocked due to the drop of volume, abbreviating the parking lot shuttle bus route to enhance efficiency. (4) Reflects difference from Continuing Disclosure Certificates-Table 5. Numbers herein reflect adjustment on United Airlines reported passengers which double counted Skywest passengers.
Source: Port of Oakland Aviation Statistical Reports
63
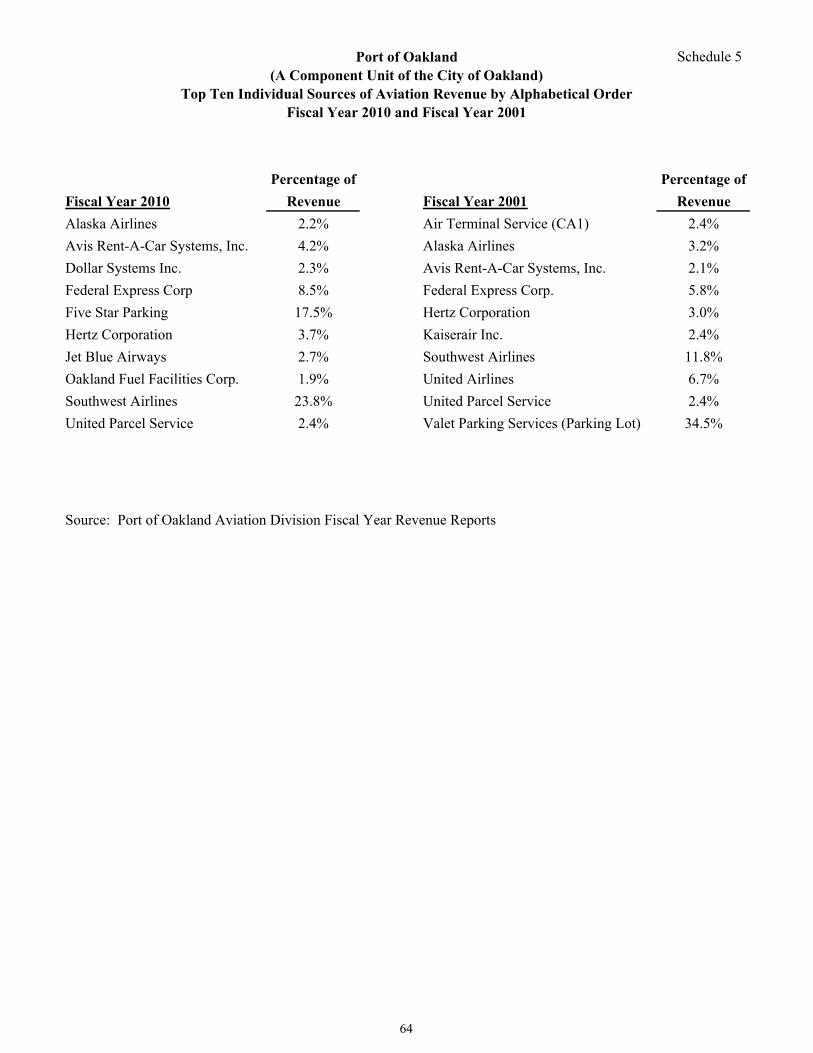
Port of Oakland (A Component Unit of the City of Oakland)
Top Ten Individual Sources of Aviation Revenue by Alphabetical Order Fiscal Year 2010 and Fiscal Year 2001
Schedule 5
Percentage of Percentage of
Fiscal Year 2010 Revenue Fiscal Year 2001 Revenue
Alaska Airlines 2.2% Air Terminal Service (CA1) 2.4%
Avis Rent-A-Car Systems, Inc. 4.2% Alaska Airlines 3.2%
Dollar Systems Inc. 2.3% Avis Rent-A-Car Systems, Inc. 2.1%
Federal Express Corp 8.5% Federal Express Corp. 5.8%
Five Star Parking 17.5% Hertz Corporation 3.0%
Hertz Corporation 3.7% Kaiserair Inc. 2.4%
Jet Blue Airways 2.7% Southwest Airlines 11.8%
Oakland Fuel Facilities Corp. 1.9% United Airlines 6.7%
Southwest Airlines 23.8% United Parcel Service 2.4%
United Parcel Service 2.4% Valet Parking Services (Parking Lot) 34.5%
Source: Port of Oakland Aviation Division Fiscal Year Revenue Reports
64
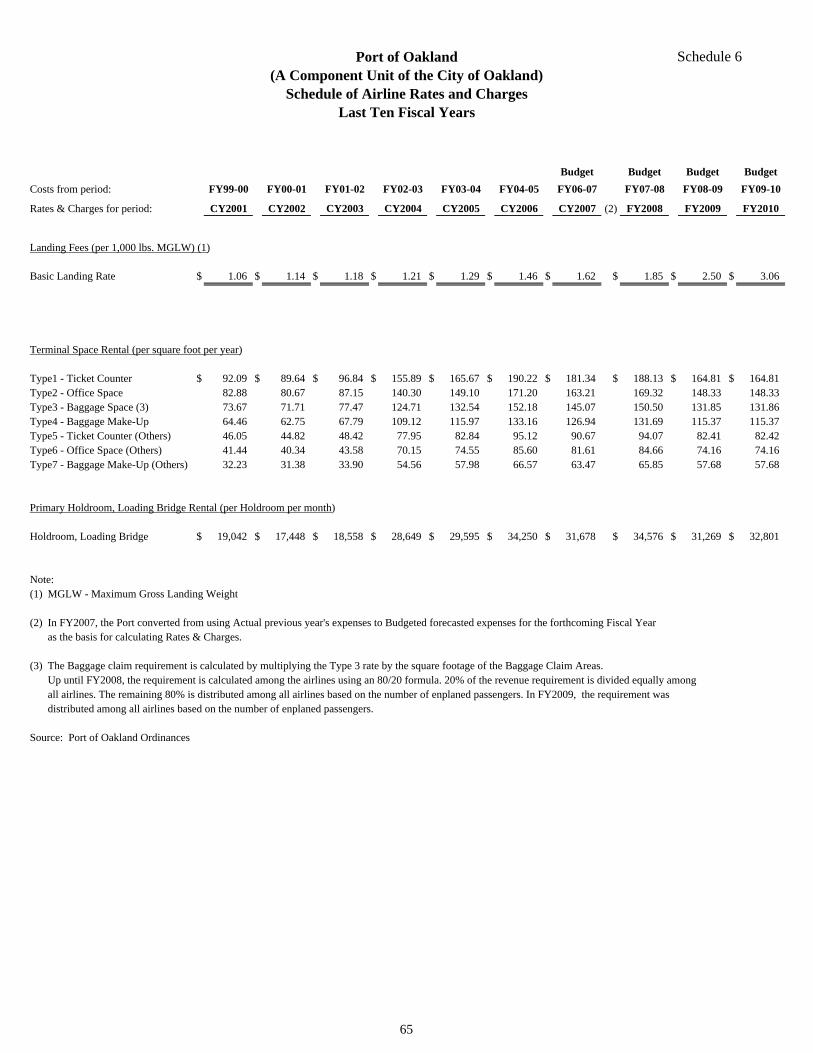
Port of Oakland (A Component Unit of the City of Oakland)
Schedule of Airline Rates and Charges Last Ten Fiscal Years
Schedule 6
Budget Budget Budget Budget
Costs from period: FY99-00 FY00-01 FY01-02 FY02-03 FY03-04 FY04-05 FY06-07 FY07-08 FY08-09 FY09-10
Rates & Charges for period: CY2001 CY2002 CY2003 CY2004 CY2005 CY2006 CY2007 (2) FY2008 FY2009 FY2010
Landing Fees (per 1,000 lbs. MGLW) (1)
Basic Landing Rate $ 1.06 $ 1.14 $ 1.18 $ 1.21 $ 1.29 $ 1.46 $ 1.62 $ 1.85 $ 2.50 $ 3.06
Terminal Space Rental (per square foot per year)
Type1 - Ticket Counter $ 92.09 $ 89.64 $ 96.84 $ 155.89 $ 165.67 $ 190.22 $ 181.34 $ 188.13 $ 164.81 $ 164.81Type2 - Office Space 82.88 80.67 87.15 140.30 149.10 171.20 163.21 169.32 148.33 148.33Type3 - Baggage Space (3) 73.67 71.71 77.47 124.71 132.54 152.18 145.07 150.50 131.85 131.86Type4 - Baggage Make-Up 64.46 62.75 67.79 109.12 115.97 133.16 126.94 131.69 115.37 115.37Type5 - Ticket Counter (Others) 46.05 44.82 48.42 77.95 82.84 95.12 90.67 94.07 82.41 82.42Type6 - Office Space (Others) 41.44 40.34 43.58 70.15 74.55 85.60 81.61 84.66 74.16 74.16Type7 - Baggage Make-Up (Others) 32.23 31.38 33.90 54.56 57.98 66.57 63.47 65.85 57.68 57.68
Primary Holdroom, Loading Bridge Rental (per Holdroom per month)
Holdroom, Loading Bridge $ 19,042 $ 17,448 $ 18,558 $ 28,649 $ 29,595 $ 34,250 $ 31,678 $ 34,576 $ 31,269 $ 32,801
Note: (1) MGLW - Maximum Gross Landing Weight
(2) In FY2007, the Port converted from using Actual previous year's expenses to Budgeted forecasted expenses for the forthcoming Fiscal Yearas the basis for calculating Rates & Charges.
(3) The Baggage claim requirement is calculated by multiplying the Type 3 rate by the square footage of the Baggage Claim Areas.Up until FY2008, the requirement is calculated among the airlines using an 80/20 formula. 20% of the revenue requirement is divided equally amongall airlines. The remaining 80% is distributed among all airlines based on the number of enplaned passengers. In FY2009, the requirement was distributed among all airlines based on the number of enplaned passengers.
Source: Port of Oakland Ordinances
65

Port of Oakland (A Component Unit of the City of Oakland)
Principal Revenue Sources, Revenue per Container Last Ten Fiscal Years
Schedule 7
2001 2002 2003 2004 2005 2006 2007 2008 2009 2010
Maritime revenues:
Dockage and wharfage fees $ 64,241,000 $ 72,327,000 $ 79,684,000 $ 89,178,000 $ 101,198,000 $ 109,001,000 $ 115,305,000 $ 117,795,000 $ 126,068,000 $ 130,254,000 Space assignments and rentals 4,267,000 4,360,000 4,612,000 4,042,000 3,361,000 3,809,000 3,306,000 3,731,000 8,553,000 6,961,000 Crane rentals 5,726,000 5,109,000 2,192,000 4,000 - - - - - -
Total 74,234,000 81,796,000 86,488,000 93,224,000 104,559,000 112,810,000 118,611,000 121,526,000 134,621,000 137,215,000
Non-terminal revenues 3,572,000 2,506,000 5,559,000 6,381,000 8,300,000 10,009,000 8,530,000 6,825,000 6,118,000 6,129,000
Total revenues $ 77,806,000 $ 84,302,000 $ 92,047,000 $ 99,605,000 $ 112,859,000 $ 122,819,000 $ 127,141,000 $ 128,351,000 $ 140,739,000 $ 143,344,000
TEUs (Full only) 1,291,309 1,242,701 1,352,886 1,406,250 1,628,369 1,723,181 1,722,522 1,802,004 1,605,613 (1) 1,729,122
Terminal revenue per TEU $ 57.49 $ 65.82 $ 63.93 $ 66.29 $ 64.21 $ 65.47 $ 68.86 $ 67.44 $ 83.84 $ 79.36
Note: Contracts with terminals operators were changed to new all-inclusive agreements in FY 2004. Hence, crane rentals were not individually billed. (1) FY 2009 TEU was revised to reflect updated actual statistics.
Source: Port of Oakland Maritime Division
50.00 55.00 60.00 65.00 70.00 75.00 80.00 85.00 90.00
2001 2002 2003 2004 2005 2006 2007 2008 2009 2010
Rev
enue
in
$
Fiscal Years
Terminal Revenue Per TEU
66
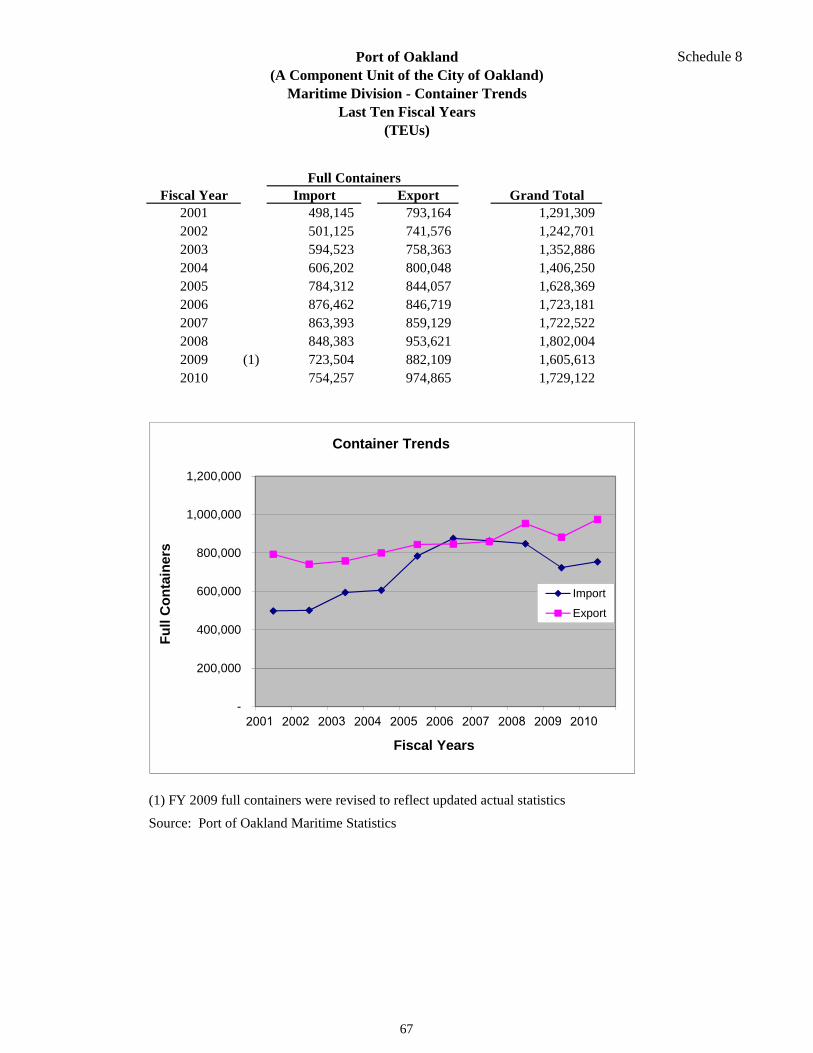
Port of Oakland (A Component Unit of the City of Oakland)
Maritime Division - Container TrendsLast Ten Fiscal Years
(TEUs)
Schedule 8
Full ContainersFiscal Year Import Export Grand Total
2001 498,145 793,164 1,291,309 2002 501,125 741,576 1,242,701 2003 594,523 758,363 1,352,886 2004 606,202 800,048 1,406,250 2005 784,312 844,057 1,628,369 2006 876,462 846,719 1,723,181 2007 863,393 859,129 1,722,522 2008 848,383 953,621 1,802,004 2009 (1) 723,504 882,109 1,605,613 2010 754,257 974,865 1,729,122
(1) FY 2009 full containers were revised to reflect updated actual statistics
Source: Port of Oakland Maritime Statistics
-
200,000
400,000
600,000
800,000
1,000,000
1,200,000
Fu
ll C
on
tain
ers
Fiscal Years
Container Trends
Import
Export
67

Port of Oakland (A Component Unit of the City of Oakland)
Top Ten Individual Sources of Maritime Revenue by Alphabetical OrderFiscal Year 2010 and Fiscal Year 2001
Schedule 9
Fiscal Year 2010 Fiscal Year 2001
APM Terminals Pacific, Ltd. American President Lines
Burlington Northern/Santa Fe (OIG) China Ocean Shipping (Group) Company
Eagle Marine Services DSR-Senator Lines GmbH and Cho Yang
Evergreen Marine Corporation (Taiwan) Ltd. (Nutter) Evergreen Marine Corp. (Taiwan) Ltd.
International Transportation Service Hanjin Shipping Company, Ltd.
Ports America Outer Harbor Terminal, LLC International Transportation Service
Shipper's Transport Express Maersk-Sealand/CSX
SSA Terminals, LLC Matson Navigation Company
Total Terminals International Trans Pacific Container Service Corporation
Trans Pacific Container Service Corporation Yusen Terminal, Inc.
Source: Port of Oakland Maritime Fiscal Year Operating Reports
68

Port of Oakland (A Component Unit of the City of Oakland)
Net Revenue Calculation For Debt Service Coverage Last Ten Fiscal Years
($ 000's)
Schedule 10
2001 2002 2003 2004 2005 2006 2007 2008 2009 2010
Operating Revenue (Excluding OPA) $ 189,137 $ 198,398 $ 211,134 $ 224,372 $ 251,010 $ 267,461 $ 277,374 $ 299,883 $ 283,290 $ 285,225 Operating Expenses before Depreciation (2) (104,242) (123,275) (131,956) (125,977) (131,791) (139,837) (147,754) (164,047) (162,499) (145,931) Operating Income before Depreciation 84,895 75,123 79,178 98,395 119,219 127,624 129,620 135,836 120,791 139,294
Gross Interest Earned 10,410 7,005 11,099 8,183 7,417 8,942 8,835 9,095 9,382 8,566 Pledged OPA Revenue (1) 3,300 3,300 4,333 4,219 - - - - - -
Net Revenue Available for Debt Service $ 98,605 $ 85,428 $ 94,610 $ 110,797 $ 126,636 $ 136,566 $ 138,455 $ 144,931 $ 130,173 $ 147,860
Note:(1) OPA - Oakland Portside Associates, a blended component unit in the Port's fiscal financial statements, was dissolved effective June 30, 2004 and its assets transferred to the Port. (2) Operating Expenses before Depreciation does not include operating expenses reimbursed by customer facility charges (CFC).
Source: Port of Oakland Department Revenues And Expenses Schedule
69

Port of Oakland (A Component Unit of the City of Oakland)
Debt Service Coverage Last Ten Fiscal Years
($ 000's)
Schedule 11
2001 2002 2003 2004 2005 2006 2007 2008 2009 2010
Net Pledged Revenues Available for Debt Service $ 98,605 $ 85,428 $ 94,610 $ 110,797 $ 126,636 $ 136,566 $ 138,455 $ 144,931 $ 130,173 $ 147,860
Debt Service
Senior Revenue Bonds (1) $ 37,677 $ 53,191 $ 59,961 $ 59,365 $ 61,788 $ 71,774 $ 82,649 $ 71,230 $ 64,465 $ 84,218
Intermediate Revenue Bonds (2) N/A N/A N/A N/A N/A N/A N/A 84,458 94,044 113,303
Combined Debt Service (3) N/A N/A N/A N/A N/A N/A N/A 90,274 95,301 113,611
Debt Service Coverage Ratio (4)
Senior Lien (minimum 1.25) 2.62 1.61 1.66 1.87 2.05 1.90 1.68 2.03 2.02 1.76
Intermediate Lien (minimum 1.10) (5) N/A N/A N/A N/A N/A N/A N/A 1.72 1.38 1.42
Combined (5) N/A N/A N/A N/A N/A N/A N/A 1.61 1.37 1.42
Intermediate with Rolling Coverage (5) (6) N/A N/A N/A N/A N/A N/A N/A N/A N/A 1.86
Note:(1) Senior Revenue Bond debt service is less capitalized interest.(2) Intermediate Revenue Bond debt service consists of Senior Lien, Department of Boating and Waterways Loans and Intermediate Lien debt.(3) Combined debt service is all debt service including interest on Commerical Paper.(4) Debt Service Ratio is calculated by dividing the Net Pledged Revenues Available for Debt Service by the corresponding Debt Service.(5) In FY 2010, Intermediate, Intermediate with Rolling and Combined Debt Service Coverage Ratios reflect the reduction in debt service of $9.5 million due to the release of funds from the Series F, Series K, Series L and Series N bond reserve funds.(6) Intermediate with Rolling Coverage includes $30 million from the Port Bond Reserve Fund and $15 million from the Capital Reserve Fund in addition to the stated Net Pledged Revenues.
Source: Port of Oakland Budget Summary
0
20000
40000
60000
80000
100000
120000
140000
160000
2001 2002 2003 2004 2005 2006 2007 2008 2009 2010
in $
00
0s
Fiscal Years
Net Pledged Revenues to Debt Service
Net Pledged Revenues
Senior Revenue Bonds
Intermediate Revenue Bonds
Combined Debt Service
70

Port of Oakland (A Component Unit of the City of Oakland)
Ratios of Debt Service Last Ten Fiscal Years
($ 000's)
Schedule 12
2001 2002 2003 2004 2005 2006 2007 2008 2009 2010
Debt Service
Senior Revenue Bonds (1)
Aviation $ 5,945 $ 5,965 $ 6,463 $ 7,320 $ 7,818 $ 8,254 $ 9,845 $ 5,997 $ 5,437 $ 14,887
Maritime 29,925 45,421 52,052 47,779 48,745 58,269 67,515 61,159 59,021 67,682
Commercial Real Estate 1,807 1,805 1,446 4,266 5,225 5,251 5,289 4,074 7 1,649
Total Senior Revenue Bonds Debt Service $ 37,677 $ 53,191 $ 59,961 $ 59,365 $ 61,788 $ 71,774 $ 82,649 $ 71,230 $ 64,465 $ 84,218
Intermediate Revenue Bonds
Aviation $ - $ - $ - $ - $ - $ - $ - $ 3,618 $ 7,610 $ 7,617
Maritime - - - - - - - 8,886 20,985 20,486
Commercial Real Estate - - - - - - - 267 527 525
Total Intermediate Revenue Bonds Debt Service $ - $ - $ - $ - $ - $ - $ - $ 12,771 $ 29,122 $ 28,628
Revenue Bonds (Senior & Intermediate)
Aviation $ 5,945 $ 5,965 $ 6,463 $ 7,320 $ 7,818 $ 8,254 $ 9,845 $ 9,615 $ 13,047 $ 22,504
Maritime 29,925 45,421 52,052 47,779 48,745 58,269 67,515 70,045 80,006 88,168
Commercial Real Estate 1,807 1,805 1,446 4,266 5,225 5,251 5,289 4,341 534 2,174
Total Revenue Bonds Debt Service (2) (3) $ 37,677 $ 53,191 $ 59,961 $ 59,365 $ 61,788 $ 71,774 $ 82,649 $ 84,001 $ 93,587 $ 112,846
Ratio of Aviation Debt Service
Enplaned passengers 5,659 5,744 6,644 6,958 7,171 7,188 7,267 6,802 4,956 4,778
Aviation Revenue Bonds Debt Service per
Enplaned Passenger (not in 000's) $ 1.05 $ 1.04 $ 0.97 $ 1.05 $ 1.09 $ 1.15 $ 1.35 $ 1.41 $ 2.63 $ 4.71
Ratio of Maritime Debt Service
Maritime TEUs (Full only) 1,291 1,243 1,353 1,406 1,628 1,723 1,723 1,802 1,606 1,729
Maritime Revenue Bonds Debt Service per TEU $ 23.18 $ 36.54 $ 38.47 $ 33.98 $ 29.94 $ 33.82 $ 39.18 $ 38.87 $ 49.82 $ 50.99
(not in 000's)
Note:(1) Senior Revenue Bond debt service is less capitalized interest.(2) Does not include debt service for Department of Boating and Waterways Loan or Commercial Paper.(3) In FY 2010, debt service payments were offset by $9.5 million due to release of funds from the Series F, Series K, Series L and Series N bond reserve funds.
Source: Port of Oakland
71

Port of Oakland (A Component Unit of the City of Oakland)
Demographic And Economic Statistics for the City of OaklandLast Ten Fiscal Years
Schedule 13
Personal Per CapitaCalendar Income Personal Median School Unemployment
Year Population ($000s) Income Age Enrollment Rate (%)
2001 407,000 13,730,552$ 33,736$ (a) 33.3 55,525 2.9
2002 408,800 16,192,977$ 39,611$ (a) 33.3 53,108 6.7
2003 412,200 17,979,340$ 43,618$ (a) 33.3 52,629 6.8
2004 411,600 18,163,496$ 44,129$ (a) 33.3 49,334 6.1
2005 412,300 9,044,213$ 21,936$ 33.3 49,334 5.3
2006 411,755 11,697,548$ 28,409$ 33.3 41,467 7.1
2007 415,492 9,114,233$ 21,936$ 33.3 39,802 7.4
2008 420,183 10,554,157$ 25,118$ 36.1 39,705 9.6
2009 425,068 11,182,689$ 26,308$ 36.7 38,826 17.1
2010 430,666 11,690,429$ 27,145$ 37.1 38,450 17.2
Note: (a) In CY 2001 - 2004 median family income was used as per capita personal income
Source: City of Oakland - Demographics And Economic Statistics
72

Port of Oakland (A Component Unit of the City of Oakland) Principal Employers - FY 2010 vs FY 2006
Schedule 14
FY 2010 FY 2006 (1)
Number of Percentage of Number of Percentage ofEmployer Employees Rank Total Employment Employees Rank Total Employment
County of Alameda 10,374 1 6.06% 9,740 1 5.69%
Wells Fargo & Co 5,862 2 3.42% N/A
Oakland Unified School District 5,704 3 3.33% 8,000 2 4.67%
City of Oakland 4,478 4 2.61% 4,290 5 2.50%
Cost Plus Inc 4,125 5 2.41% N/A
Kaiser Foundation Hospitals 3,105 6 1.81% 4,340 4 2.53%
Peralta Community College District 2,759 7 1.61% N/A
Safeway Inc 2,692 8 1.57% N/A
Internal Revenue Service 2,500 9 1.46% N/A
Albertson's LLC 2,209 10 1.29% N/A
Kaiser Permanente Medical Group N/A 5,450 3 3.18%
Bay Area Rapid Transit N/A 2,800 6 1.63%
Federal Express N/A 2,790 7 1.63%
Alta-Bates Medical Center N/A 2,620 8 1.53%
Kaiser Foundaiton Health Plan N/A 2,590 9 1.51%
Summit Medical Center N/A 2,230 10 1.30%
Total 43,808 44,850
Note:(1) Data pertaining to principal employers for past 10 years is not readily available. As such, 2006 data was used as the base year which is the earliest information available.
Sources: Fiscal Year 2006 --Economic Development Alliance for Business, Alameda County Largest Employers.Fiscal Year 2010--Economic Development Alliance for Business, Alameda County Largest Employers. Total employement of 171,319 (2009 estimate) from DemographicsNow.com is used to calculate the percentage of employment.
73

Port of Oakland (A Component Unit of the City of Oakland)
Employee Count by Division Last Ten Fiscal Years
Schedule 15
Revenue Divisions 2001 2002 2003 2004 2005 2006 2007 2008 2009 2010
Aviation 294 305 312 316 290 310 289 315 307 238Maritime 30 30 31 26 21 18 65 (1) 77 78 63Commercial Real Estate 19 18 14 12 9 9 7 8 7 8
Subtotal 343 353 357 354 320 337 361 400 392 309
Support DivisionsCorporate Administrative Services 39 32 34 32 31 26 29 26 35 17Engineering 236 226 225 204 170 167 108 (1) 91 49 37Financial Services 38 35 37 42 39 39 42 40 33 27Others 71 92 96 91 81 82 89 92 64 58 Subtotal 384 385 392 369 321 314 268 249 181 139
Total 727 738 749 723 641 651 629 649 573 448
Note:(1) Harbor Facilities was moved from Engineering Division to Maritime Division in FY 2007.
Source: Port of Oakland Human Resources System active employees head count report.
0
300
600
900
2001 2002 2003 2004 2005 2006 2007 2008 2009 2010
Em
ploy
ees
Fiscal Years
Employee Count
74

Port of Oakland (A Component Unit of the City of Oakland)
Capital Assets Statistics By Function/Program Last Ten Fiscal Years
Schedule 16
Function/Program 2001 2002 2003 2004 2005 2006 2007 2008 2009 2010
Aviation facilitiesPaved airport runways 4 4 4 4 4 4 4 4 4 4 Total length of runways (in feet) 25,038 25,038 25,038 25,038 25,038 25,038 25,038 25,038 25,038 25,038 Area of airport (in acres) 2,600 2,600 2,600 2,600 2,600 2,600 2,600 2,600 2,600 2,600 Parking stalls 7,965 7,306 7,616 8,596 8,431 7,298 6,864 7,868 6,103 (1) 6,315
Harbor facilitiesMiles of waterfront N/A N/A 19 19 19 19 19 19 19 19 Berthing length at wharves (in feet) N/A N/A 23,031 23,031 23,031 23,063 23,063 23,063 23,233 23,233 Harbor area (in acres) N/A N/A 770 770 770 786 786 786 786 786
Commercial Real EstateOwned acreage 960 958 950 914 877 876 876 874 874 874Parking stalls 2,114 2,114 2,114 2,114 2,114 2,114 2,004 1,479 1,429 1,429
Note: N/A--Data pertaining to Harbor Facilities for Fiscal Year 2001 through 2002 were not available.(1) 1,186 stalls in Daily Parking Lot were blocked due to the drop of volume, abbreviating the parking lot shuttle bus route to enhance efficiency.
Source: Port of Oakland Division Statistics
75

76
This page left intentionally blank.