Comprehensive Annual Financial Report - Speer PD 2016 Audit.pdf · Comprehensive Annual Financial...
161
Comprehensive Annual Financial Report HOMEWOOD-FLOSSMOOR PARK DISTRICT, Il.LINOIS For the fiscal year ended April 30, 2016 Ho1newood•Flo11•oor Park Dletrlct 2006 Winner & 2016 Finalist National Gold Medal Award for Excellence in Park and Recreation Management
Transcript of Comprehensive Annual Financial Report - Speer PD 2016 Audit.pdf · Comprehensive Annual Financial...

Comprehensive Annual Financial Report HOMEWOOD-FLOSSMOOR PARK DISTRICT, Il.LINOIS
For the fiscal year ended April 30, 2016
,,,.----•~ Ho1newood•Flo11•oor
Park Dletrlct
2006 Winner & 2016 Finalist National Gold Medal Award for Excellence
in Park and Recreation Management

HOMEWOOD-FLOSSMOOR PARK DISTRICT, ILLINOIS COMPREHENSIVE ANNUAL FINANCIAL REPORT FOR THE YEAR ENDED APRIL 30, 2016 Prepared by the Business Department Renae Ross Superintendent of Finance and Administration

HOMEWOOD-FLOSSMOOR PARK DISTRICT, ILLINOIS Table of Contents PAGE INTRODUCTORY SECTION Principal Officials i Organization Chart ii Letter of Transmittal iii-vi Certificate of Achievement for Excellence in Financial Reporting vii Facility Locations viii Park District Map ix FINANCIAL SECTION EXHIBIT INDEPENDENT AUDITOR’S REPORT 1-3 MANAGEMENT’S DISCUSSION AND ANALYSIS 4-11 BASIC FINANCIAL STATEMENTS District-Wide Financial Statements Statement of Net Position A-1 12-13 Statement of Activities A-2 14-15 Fund Financial Statements Balance Sheet - Governmental Funds A-3 16-17 Reconciliation of the Balance Sheet of Governmental Funds to the Statement of Net Position A-4 18 Statement of Revenues, Expenditures, and Changes in Fund Balances - Governmental Funds A-5 19-20 Reconciliation of the Statement of Revenues, Expenditures, and Changes in Fund Balances of Governmental Funds to the Statement of Activities A-6 21 Statement of Revenues, Expenditures, and Changes in Fund Balance - Budget and Actual - General Fund A-7 22 Statement of Revenues, Expenditures, and Changes in Fund Balance - Budget and Actual - Recreation Fund A-8 23

HOMEWOOD-FLOSSMOOR PARK DISTRICT, ILLINOIS Table of Contents PAGE FINANCIAL SECTION (CONT.) EXHIBIT BASIC FINANCIAL STATEMENTS (CONT.) Statement of Revenues, Expenditures, and Changes in Fund Balance - Budget and Actual - Museum Fund A-9 24 Statement of Net Position - Proprietary Funds A-10 25 Statement of Revenues, Expenses, and Changes in Net Position - Proprietary Funds A-11 26 Statement of Cash Flows - Proprietary Funds A-12 27 Notes to the Financial Statements 28-54 REQUIRED SUPPLEMENTARY INFORMATION (UNAUDITED) Schedule of Changes in the District’s Net Pension Liability and Related Ratios B-1 55 Schedule of District Contributions B-2 56 COMBINING AND INDIVIDUAL FUND FINANCIAL STATEMENTS AND SCHEDULES GOVERNMENTAL FUND TYPES NONMAJOR GOVERNMENTAL FUNDS Combining Balance Sheet C-1 57-58 Combining Statement of Revenues, Expenditures, and Changes in Fund Balances C-2 59-60 GENERAL FUND Schedule of Revenues - Budget and Actual D-1 61 Schedule of Expenditures - Budget and Actual D-2 62-63 SPECIAL REVENUE FUNDS Recreation Fund Schedule of Revenues - Swimming Pool - Budget and Actual E-1 64 Schedule of Expenditures - Budget and Actual E-2 65-66
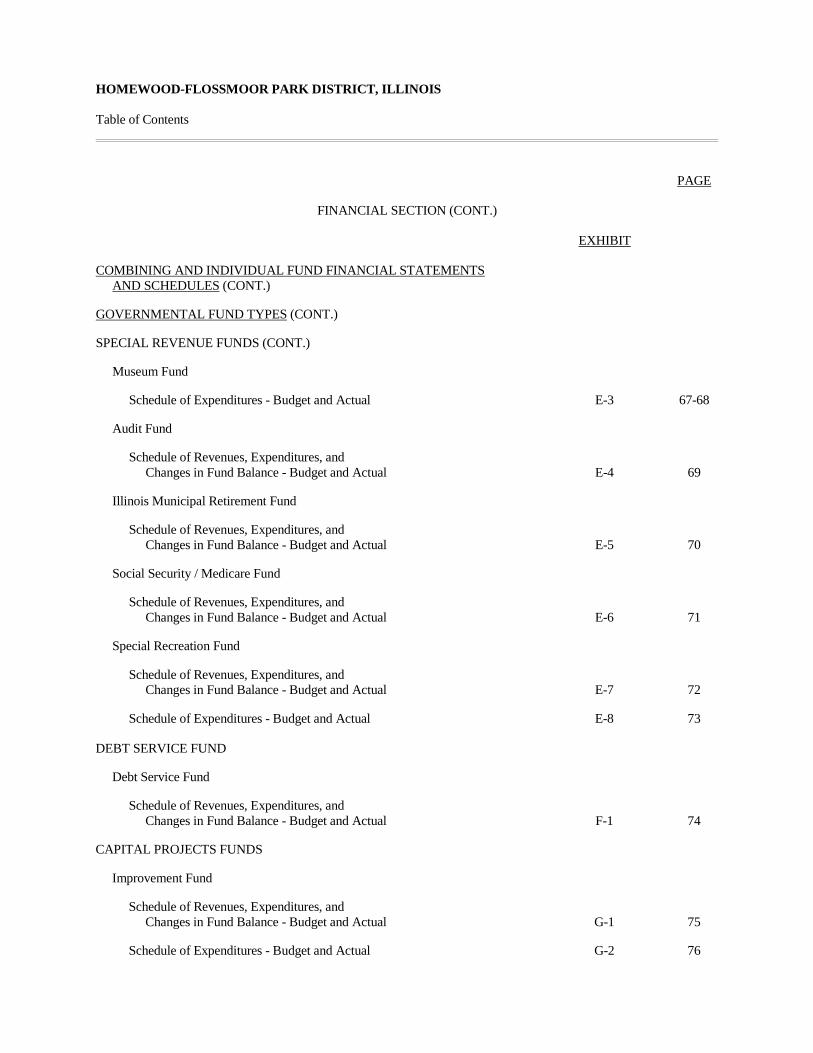
HOMEWOOD-FLOSSMOOR PARK DISTRICT, ILLINOIS Table of Contents PAGE FINANCIAL SECTION (CONT.) EXHIBIT COMBINING AND INDIVIDUAL FUND FINANCIAL STATEMENTS AND SCHEDULES (CONT.) GOVERNMENTAL FUND TYPES (CONT.) SPECIAL REVENUE FUNDS (CONT.) Museum Fund Schedule of Expenditures - Budget and Actual E-3 67-68 Audit Fund Schedule of Revenues, Expenditures, and Changes in Fund Balance - Budget and Actual E-4 69 Illinois Municipal Retirement Fund Schedule of Revenues, Expenditures, and Changes in Fund Balance - Budget and Actual E-5 70 Social Security / Medicare Fund Schedule of Revenues, Expenditures, and Changes in Fund Balance - Budget and Actual E-6 71 Special Recreation Fund Schedule of Revenues, Expenditures, and Changes in Fund Balance - Budget and Actual E-7 72 Schedule of Expenditures - Budget and Actual E-8 73 DEBT SERVICE FUND Debt Service Fund Schedule of Revenues, Expenditures, and Changes in Fund Balance - Budget and Actual F-1 74 CAPITAL PROJECTS FUNDS Improvement Fund Schedule of Revenues, Expenditures, and Changes in Fund Balance - Budget and Actual G-1 75 Schedule of Expenditures - Budget and Actual G-2 76

HOMEWOOD-FLOSSMOOR PARK DISTRICT, ILLINOIS Table of Contents PAGE FINANCIAL SECTION (CONT.) EXHIBIT COMBINING AND INDIVIDUAL FUND STATEMENTS AND SCHEDULES (CONT.) GOVERNMENTAL FUND TYPES (CONT.) CAPITAL PROJECTS FUNDS (CONT.) Iron Oaks Development Fund Schedule of Revenues, Expenditures, and Changes in Fund Balance - Budget and Actual G-3 77 PROPRIETARY FUND TYPES ENTERPRISE FUNDS Racquet Club Fund Schedule of Operating Expenses - Budget and Actual H-1 78-79 Artificial Ice Skating Rink Fund Schedule of Operating Expenses - Budget and Actual H-2 80-81 Golf Course Fund Schedule of Operating Expenses - Budget and Actual H-3 82-83 LONG-TERM DEBT REQUIREMENTS General Obligation Refunding Bond Series 2009 (Refunded Bond Series 1998) 1 84 Golf Course, Racquet Club and Ice Arena General Obligation Refunding Park Bonds (Alternate Revenue Source), Series 2011B - Refunded Bond Series 2003A and 2005A 2 85 General Obligation Refunding Bonds (Alternate Revenue Source), Series 2013B 3 86 General Obligation Park Bonds (Limited Tax Park Bonds), Series 2014A 4 87 General Obligation Refunding Bonds (Alternate Revenue Source), Series 2014B 5 88 General Obligation Refunding Bonds (Limited Tax Park Bonds), Series 2015 6 89
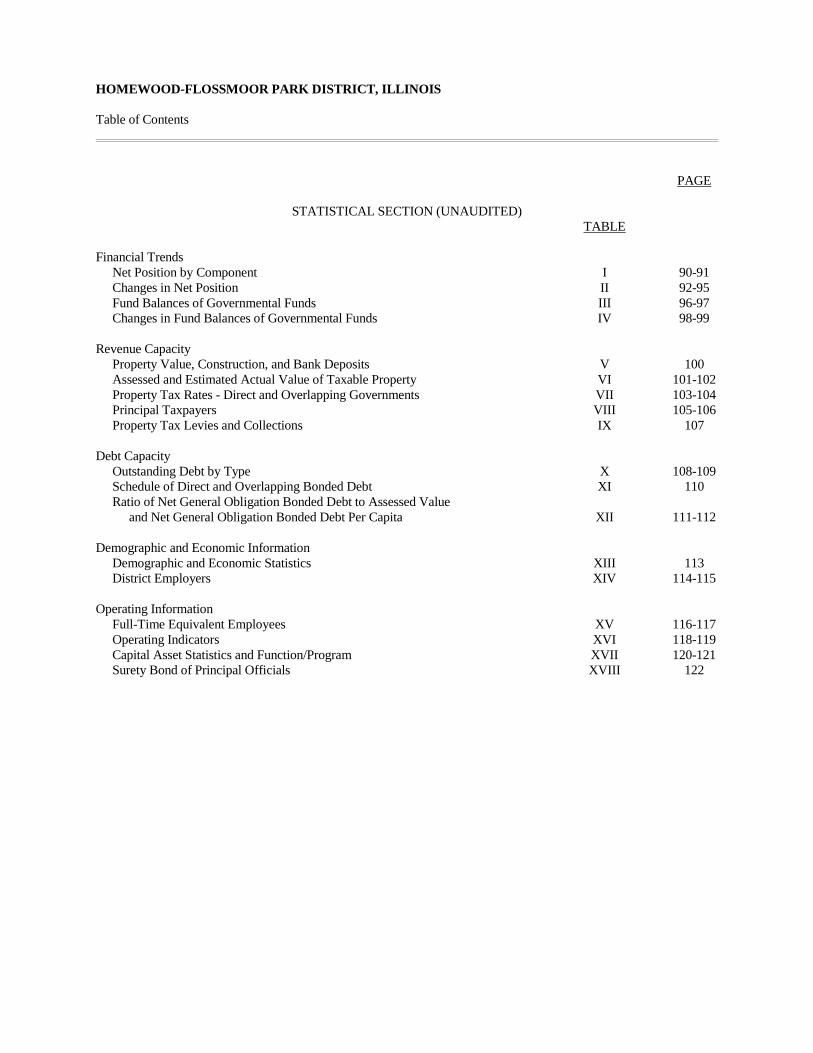
HOMEWOOD-FLOSSMOOR PARK DISTRICT, ILLINOIS Table of Contents PAGE STATISTICAL SECTION (UNAUDITED) TABLE Financial Trends Net Position by Component I 90-91 Changes in Net Position II 92-95 Fund Balances of Governmental Funds III 96-97 Changes in Fund Balances of Governmental Funds IV 98-99 Revenue Capacity Property Value, Construction, and Bank Deposits V 100 Assessed and Estimated Actual Value of Taxable Property VI 101-102 Property Tax Rates - Direct and Overlapping Governments VII 103-104 Principal Taxpayers VIII 105-106 Property Tax Levies and Collections IX 107 Debt Capacity Outstanding Debt by Type X 108-109 Schedule of Direct and Overlapping Bonded Debt XI 110 Ratio of Net General Obligation Bonded Debt to Assessed Value and Net General Obligation Bonded Debt Per Capita XII 111-112 Demographic and Economic Information Demographic and Economic Statistics XIII 113 District Employers XIV 114-115 Operating Information Full-Time Equivalent Employees XV 116-117 Operating Indicators XVI 118-119 Capital Asset Statistics and Function/Program XVII 120-121 Surety Bond of Principal Officials XVIII 122

INTRODUCTORY SECTION
i
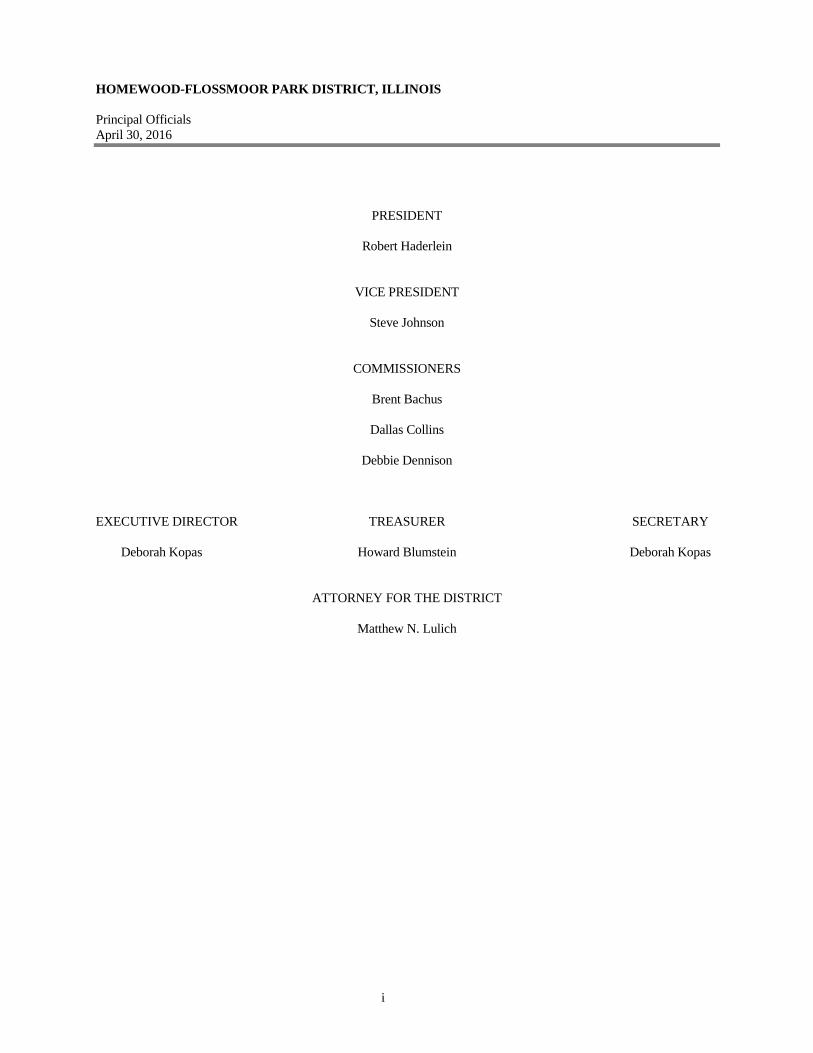
HOMEWOOD-FLOSSMOOR PARK DISTRICT, ILLINOIS Principal Officials April 30, 2016 PRESIDENT Robert Haderlein VICE PRESIDENT Steve Johnson COMMISSIONERS Brent Bachus Dallas Collins Debbie Dennison EXECUTIVE DIRECTOR TREASURER SECRETARY Deborah Kopas Howard Blumstein Deborah Kopas ATTORNEY FOR THE DISTRICT Matthew N. Lulich
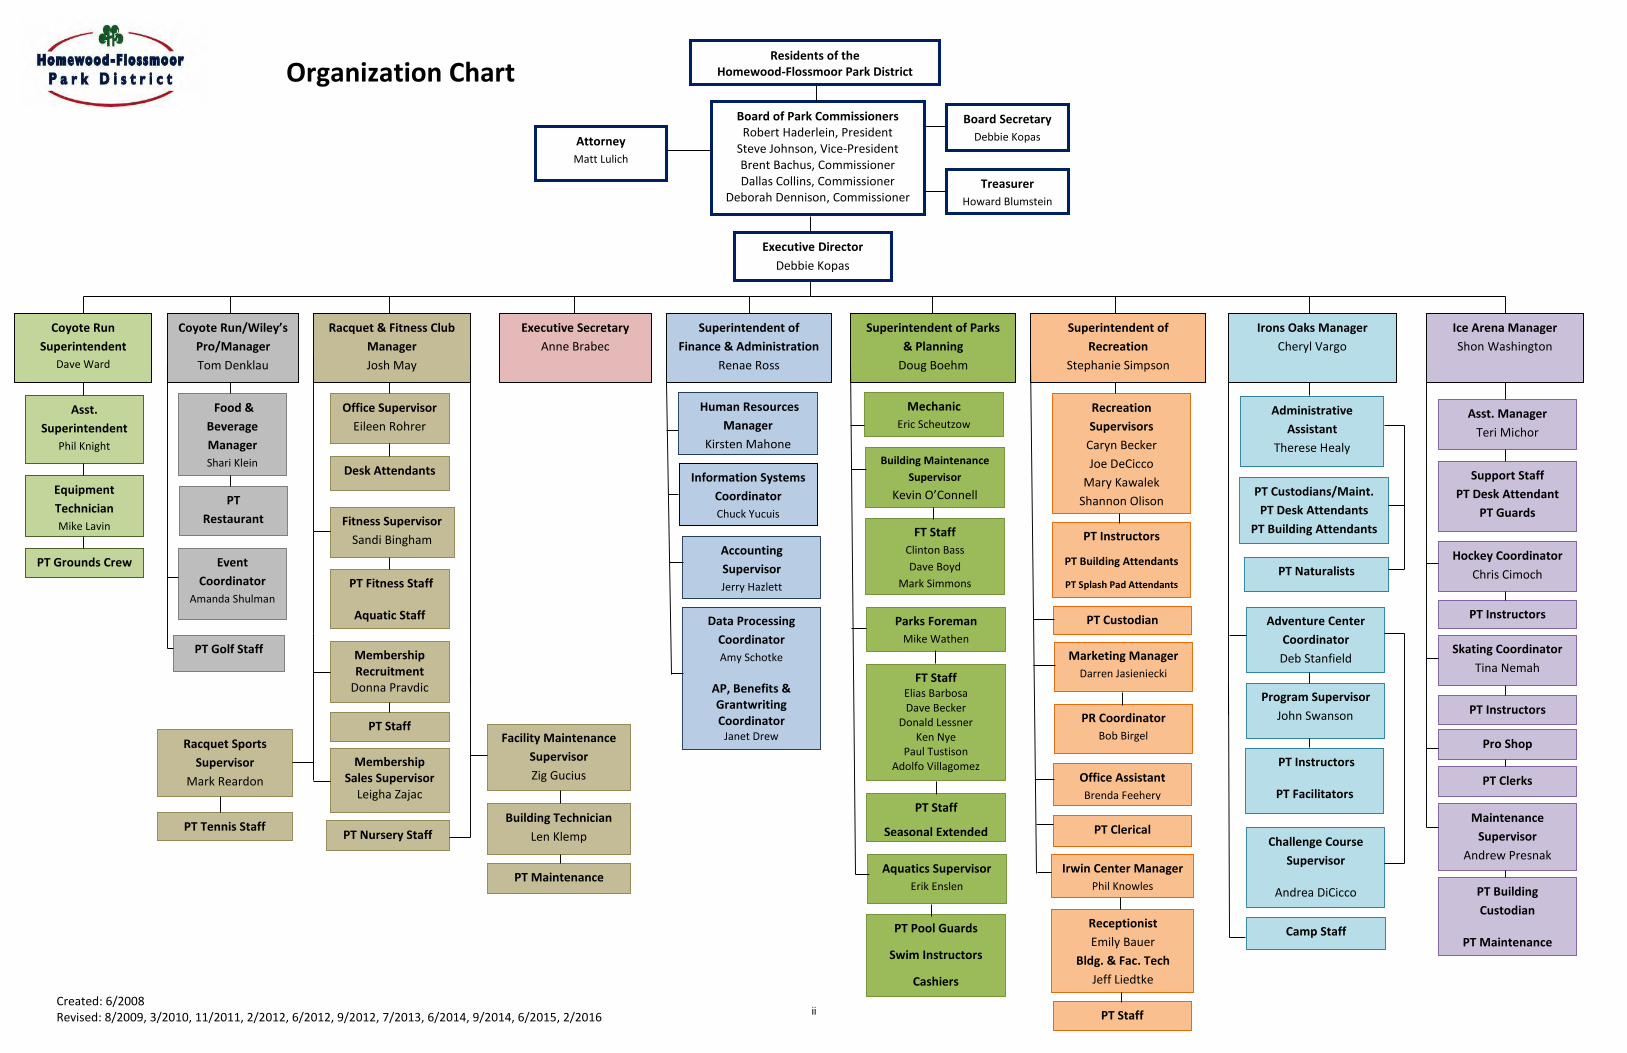
Residents of the Homewood-Flossmoor Park District
Board Secretary
Debbie Kopas
Treasurer
Howard Blumstein
Board of Park Commissioners Robert Haderlein, President
Steve Johnson, Vice-President Brent Bachus, Commissioner Dallas Collins, Commissioner
Deborah Dennison, Commissioner
Attorney Matt Lulich
Executive Director
Debbie Kopas
Coyote Run
Superintendent
Dave Ward
Coyote Run/Wiley’s
Pro/Manager
Tom Denklau
Racquet & Fitness Club
Manager
Josh May
Superintendent of
Finance & Administration
Renae Ross
Executive Secretary
Anne Brabec
Ice Arena Manager
Shon Washington
Superintendent of Parks
& Planning
Doug Boehm
Superintendent of
Recreation
Stephanie Simpson
Irons Oaks Manager
Cheryl Vargo
Organization Chart
Asst.
Superintendent
Phil Knight
Equipment
Technician
Mike Lavin
PT Grounds Crew
PT Golf Staff
Food &
Beverage
Manager
Shari Klein
PT
Restaurant
Staff
Information Systems
Coordinator
Chuck Yucuis
Accounting
Supervisor
Jerry Hazlett
Data Processing
Coordinator
Amy Schotke
AP, Benefits & Grantwriting Coordinator
Janet Drew
Membership Recruitment
Donna Pravdic
PT Fitness Staff
Aquatic Staff
Fitness Supervisor
Sandi Bingham
Office Supervisor
Eileen Rohrer
Desk Attendants
PT Staff
Racquet Sports
Supervisor
Mark Reardon
PT Tennis Staff
Facility Maintenance
Supervisor
Zig Gucius
Building Technician
Len Klemp
PT Maintenance
Event
Coordinator
Amanda Shulman
Membership Sales Supervisor
Leigha Zajac
PT Nursery Staff
FT Staff Elias Barbosa Dave Becker
Donald Lessner Ken Nye
Paul Tustison Adolfo Villagomez
Building Maintenance
Supervisor
Kevin O’Connell
Mechanic
Eric Scheutzow
Aquatics Supervisor
Erik Enslen
PT Pool Guards
Swim Instructors
Cashiers
PT Staff
Seasonal Extended
Skating Coordinator
Tina Nemah
PR Coordinator
Bob Birgel
Marketing Manager
Darren Jasieniecki
PT Instructors
PT Building Attendants
PT Splash Pad Attendants
PT Custodian
Recreation
Supervisors
Caryn Becker
Joe DeCicco
Mary Kawalek
Shannon Olison
Support Staff
PT Desk Attendant
PT Guards
Asst. Manager
Teri Michor
Hockey Coordinator
Chris Cimoch
PT Instructors
Maintenance
Supervisor
Andrew Presnak
Pro Shop
PT Clerks
PT Building
Custodian
PT Maintenance
Adventure Center
Coordinator
Deb Stanfield
PT Naturalists
Camp Staff
Administrative
Assistant
Therese Healy
Challenge Course
Supervisor
Andrea DiCicco
PT Instructors
PT Facilitators
Irwin Center Manager
Phil Knowles
Receptionist
Emily Bauer
Bldg. & Fac. Tech
Jeff Liedtke
PT Staff
PT Custodians/Maint.
PT Desk Attendants
PT Building Attendants
Created: 6/2008 Revised: 8/2009, 3/2010, 11/2011, 2/2012, 6/2012, 9/2012, 7/2013, 6/2014, 9/2014, 6/2015, 2/2016
Program Supervisor
John Swanson PT Instructors
Human Resources
Manager
Kirsten Mahone
Office Assistant
Brenda Feehery
PT Clerical
FT Staff
Clinton Bass
Dave Boyd
Mark Simmons
Parks Foreman
Mike Wathen
ii

~-~ Homewood·Flossmoor
Park District ........................ ~~-------___,-
"November 7, 2016
To The Citiu!ls of Homewood-Flossmoor Park District:
The comprehensive aruJuai financial n;port, of the Homewood-Fl.ossmoor Park Dis!li~t for the fiscal year ended AJJril30, 2016 is hereby submitted. Responsibility fur both the accuracy of the data and the completeness and fairness of1he presentation, including all disclosures, rests ,witli the Park District. To the bestofour knowledge and belief, ,the enclosed. data is accw:a1e ill .all mat~rilll respects and is reponed in,a 1nanner desigMd •to present.faltlythe financial position of the ·governmental activifu!s, ttie business typeactiVities, each major fund and the aggregate remaining fund infonnation of the l!ark rnstrict. A.II disclosuri:s necesswy to enable the reader 10 gain an µndersta11di11g of the P.ark Djstri~'s firumpWl activities have been included.
Management's discussion and analysis (MD&A) Immediately foi!o\Vs tlie independent aut!ltor's report and provides- a n!!ITiltive lnlrod~lion, overview and analysis 11f lhe b~ic ffulu!cial Statemenrs,. 'MD&A complement lflis lettef of, transmitt8i and should be read in cortjunction with i~
T'ne Dislrict operates under a Boord of Commissioner.; elected by the voteis offu<, Homewood-Flossmoor Park Disttiet. The District provid~ ll!l 1)'pes of recreational programs 81\d facilities, maintenance of parks end athletic lieldS. outdoor swimming pool, indoor ke arena, indoor racquet .sports a11d fifuess facility, golf c6W'Se, restaurant end driving range; communiry c.enter, nature center and general administration services.
The comprehensive ·111111ual financial report includes all en lilies ful"Which ·the District is fi11<U1ciallyacc®n1able as defined by 1he:Oovemmeatal Ac1»U11ting StandanlS Board.
ECONOMIC CONDITION AND OUTLOOK
The Homewood-Flossmoor Park District is locatedrin the south suburbs in lheClilcago rneU'Opolitan area The Distrlcl has access to strong inlerstale, railway and busing system; thin link ihe district residents ta the City of Chicag;;i end the greater metropolitan area. Major employers in the DU!Uict include Clil)adi3D National Railway, Comcas1 Conununications,, local school districts as well 3.'l a variety of retail outlets. Though demographics hnvecbanged-0ver the 'past twenty ¥em 1he population of the dist;'ict has remaine-0 stable ?I approximately 30,000.
For Ille fifth year in a row, property values (EA Vs) forthe vast majority of Cook Com:lty's taxing districts were low1:>r than the previous year. The District's 2015 EA V decreased 3%,from 2014. Factors causing the reductions ioch1de indi~idual assessment 1'educ1ions d11e to the appeal process and the tri-annual r,,..sssessm'ent in 2014. lr)~reases in eire1t1ption amounts reduce the an1ount of taxable EA V available to taxingdimicts. Despite the continuing: decreases in EA V there are indications that the local economy is improving.
The number 6f building pennits Issued for the Vlllnges in the District remailied stable .last year·whlle the value of construction increased. New liusiaesses to Homewood include Portillo's, Uncle John's BarBQue, Mat1J'ess Firm and Pe111:le Vision. 'l'he Menard's in Homewood will close temporarily to expand tl\eir space lllld reapen as· a remodeled superstore in approximately one year. The fonner Kmart siore on Halsted hl!S been le8Sed by Walman and is· beiqg renovated with an expected Ch:tober opening.

Citizens of Homewood-Flossmoor Park District Page Two The Meijer Superstore opened in Flossmoor in June. The store and gas station, along with five outlots, comprise one of the largest developments in the village’s history. The new store will financially impact the village and District with a significant increase in property tax revenue. MAJOR INITIATIVES The clubhouse project was completed and the grand opening held in October of 2015. The demand for rental of the new space has exceeded our expectations. In addition to the added revenue generated by building rentals, Wiley’s Grill has an added revenue stream as a caterer for the facility. The recent stopgap budget passed by the state includes the funds for OSLAD grants that were suspended in March 2015. This means that once we have completed and submitted the proper documentation the $400,000 matching grant we were awarded in 2014 for land improvements at Dolphin Lake will be disbursed. In addition to completing the Dolphin Lake renovation, projects completed during the year include:
• The second high ropes course at Irons Oaks was replaced. • A salary compensation study was conducted by Management Association. • Two new vehicles and mowing equipment were added to the district fleet. • The Racquet Fitness Club added a building wide clock system. • A safety gate was added at the Parks Department entrance. • Asphalt projects were completed throughout the District.
FUTURE Projects planned for Fiscal 2016-17 include:
• Lions pool filtration system replacement. • Design of a new splash pad. • Implementation of the Irons Oaks master plan will take place in phases beginning with signage
recommendations and rebuilding decks. • Racquet & Fitness Club has re-budgeted to redesign the club entry, roof and HVAC improvements and new
parking lot lighting. Equipment upgrades include an additional Pilate’s reformer and multi-use cable machine.
• District-wide projects include concrete repairs as well as tennis court renovations at Lions, Orchard and Pheasant Trails Parks.
• Lobby seating, flooring replacement in the locker room hallway and exterior exit door replacements are planned for the Ice Arena.
• Coyote Run Golf Course is expected to have a roof replacement, reconfigure the golf simulator space and create a fenced off dumpster area for Wiley’s Grill.
FINANCIAL POLICIES The Park District Board works diligently to establish policies and directives that best serve the community. The Park District staff, under the direction of the Executive Director, carries out the policies in the most fiscally responsible and efficient means possible. Management of the Park District is responsible for establishing and maintaining an internal control structure designed to ensure that the assets of the Park District are protected from loss, theft or misuse, and to ensure that adequate accounting data are compiled to allow for the preparation of financial statements in conformity with generally accepted accounting principles. The internal control structure is designed to provide reasonable, but not absolute, assurance that these objectives are met. The concept of reasonable assurance recognizes that: (1) the cost of a control should not exceed the benefits likely to be derived; and (2) the valuation of costs and benefits requires estimates and judgments by management.

Citizens of Homewood-Flossmoor Park District Page Three The District is a member of the Park District Risk Management Agency (PDRMA) which was organized by Illinois park districts in accordance with the terms of an intergovernmental cooperative agreement. The purpose of PDRMA is to obtain insurance coverage as a single insurable unit for member districts for coverage in excess of self-insurance limits and to administer the payment of claims. The secondary benefit of PDRMA is their strong risk management program designed to identify risk and prevent losses. As demonstrated by the statements and schedules included in the financial section of this report, the Park District continues to meet its responsibility for sound financial management. Budgeting Controls The Park District maintains fiscal budgetary controls; the objective is to ensure compliance with legal provisions embodied in the annual appropriated budget approved by the Park District’s governing body. Activities of the general fund, special revenue funds, debt service fund and capital projects funds are included in the annual appropriated budget. The annual budget serves as the foundation for the District’s financial planning and control. A strategic planning session with the Board of Commissioners begins the budget process, at which time, the Board sets the long and short-term goals for the District. Departments prepare their budgets based on these goals and enter their budget requests for the upcoming fiscal year into the financial software. The director, superintendent of finance and department heads review these budget requests and develop a budget to achieve the established goals within anticipated revenues. The proposed budget is then presented to the Board. The Board is required to hold a public hearing on the proposed budget, and a final budget is adopted by the Board by April 30th of each fiscal year. The legal level of budgetary control is at the fund level. The Superintendent of Finance is authorized to make budget transfers within any fund. Additions and transfers between funds require Board approval. Original and final amended budget-to-actual comparisons are provided for each individual governmental fund for which an annual budget has been adopted. The general fund comparison is included in the required supplementary information section. Other governmental fund comparisons are presented in the Combining, Individual Fund, and Capital Asset Financial Statements and Schedules subsection of this report. Debt Administration The Homewood-Flossmoor Park District’s use of debt to enhance existing and acquire new facilities is and has been a key element in the District’s success. The use of general obligation debt by the Park District is principally governed by two Illinois State Statues: 1. Outstanding general obligation bonds may not exceed 0.575 percent of the assessed valuation of a district. 2. Total general obligation indebtedness may not exceed 2.875 percent of the assessed valuation of a district. The Homewood-Flossmoor Park District typically issues general obligation bonds each year to fund capital improvements throughout the District. Both outstanding general obligation bonds and total general obligation debt for statutory purposes are at 0.2 percent of assessed valuation. The Park District has always budgeted sufficient funds to allow timely retirement of debt. Prudent use of debt will continue to play a key role in the future success of the Homewood-Flossmoor Park District. OTHER INFORMATION Independent Audit State statutes require an annual audit by independent certified public accountants; the accounting firm of BKD, LLP was selected by the Park District. The auditor’s report on the basic financial statements as listed in the accompanying table of contents is included in the financial section of this report.
Citizens of Humewood,.Flossmoor Park District Page Four
Awards
The Hbmewood-Flossmoor Park Districr is one of fOUF finalists in their PQptJlation categol)' for the 2016 National Gold Medal Award presented by the National Recreation & Plltks A5sociation .. The District prevlo11Sly reeeived the award in 2006. The National (l-Old Medal Award honors the nation's outsUUldihg'parR and recreation agencies .. The program gives 11ational recognition. to communities for excellence 'in long rmge pla!llling. fiSC<l! resource managemen~ citizen suppon syswms, enviwrtmenlal s1ewardship, preservation, technologlcal int~tion, progrem planning, and assessment,. professional development, agency recognition, and services for special p1>p\llations. The National Gold Medal i~ the most celebrated parlc and recreation awaro in the counll)' and the Homewood-Flossmoor J>arl<: District fa honored to have been selected '8S a finalist fur 2016.
In 2013 the District completed the PDRMA risk management review process. The review is a comprehensive risk management assessment and education tool designed to measure the risk management programs of PDRl'vlA members, The Distrkt received accreditation from PDR.MA with 11 score of 98.38%. T~e process is lengthy and involves the majority of full-time employees anll a significant contiibutlon from many part•time staff. The Distrit! will go through the risk management review process again in 2017.
T)le Disrrict has been awarded 1he Distinguis)Jed Agency A ward through JPRA and lAPD in 1997 and 2003. Ill 2009 the award was changed to 3Jl accreditation program meant to ~nhance the goal. of it11provtii delivery of recreation services to the residents of Illinois through a voluntary comprehensive review proc<)ss. TI1e DiStriet applied for and received Illinois AssociatiQn of Park District Distinguished Accreditati9n h12009 and i1120 I 5.
The Government Finance Officer.; Association ofil'le United States and Canada (Gl'OA) awarded a Certificate of .Achievement for Eitcetlence in Financial Reponing to the Homewood-Flossmoor'Patk District fur irs comprehensiVe annual fin1U1cial .repon for 11\e fiscal year ended April JO, 2015. This was the thiny-flist consecutive year that the Pork District has achieved dlis prestigious award. In order to be awarded a Certificate of Achievement,_a government• unit must publi;h an easily readable and efficiently or!lllnized comprehensive annual financial report This report must satisfy both generally accepted accounting principles and applicable le,Slll requirements.
A Cenificate of Achievement is valid for a period ofo11e year only, MMagement believes the current Comprehensive Annual Financial Report continues to meet the Certificate of Achievement Program's requirements and will be submitting it'to the OFOA to determine ilS eligibllity fo1 another certificate.
Ackno.wledgements
The preparation oflhe Cllrn,P~hensive annual llmmcial rep~rt on a timely basis .we.s made poosible by the dedica~d service·.ofthe entire Business Department and the finn ofBKD, LLP. each member of the depat1ment has my sincere appreciation forlhe contr·ibution madeloward the preparation of this repon ..
Si!)cerely,
Deborah Kopas fo:ecutive DirectDr

vii

HOMEWOOD
Apollo Park (31.75 acres)Morgan Street & Bowling GreenRoadWalking/Bike Path, Sand Volleyball Courts,Playground, Ball Fields, Football Field, Picnic Areawith BBQ, Tennis Courts, Playfield & Soccer Fields
Butterfield Park (26 acres)Center Avenue & Center CourtBike and Walking Paths
Cedar Park (.3 acres) Highland Avenue & Cedar RoadPlayground
Dolphin Lake Park (8.5 acres)183rd Street & Gov’s Hwy • 798-0085Clubhouse, Fishing and Meeting Rooms
eXtreme Scene Skate Park (1 acre)18350 Harwood Ave.Skateboard and In-Line Skating Area
H-F Park District Auditorium2010 ChestnutBasketball and Volleyball Courts, Theatre Stage
H-F Racquet & Fitness Club2920 W. 183rd Street • 799-1323Fitness Center, Tennis Courts, Racquetballand Basketball Courts, Track, Lap Pool, Pro Shopand Child Care
H-F Sports Complex18211 Aberdeen StreetBasketball and Volleyball Courtsand Table Tennis Center
Heritage Park (2.5 acres)Riegel Road & Idlewild LanePlayground and Playfield
Hillcrest Park (10 acres)Locust Road & Rockwell AvenuePlayground, Ball Field, Picnic Area with BBQ,Seasonal Sledding Hill, Playfield and Soccer
Hollydale Park (4 acres)Turtlecreek DrivePlayground and Playfield
Homewood Estates Park (15.1 acres)2920 W. 183rd StreetPlayground, Ball Fields and Playfield
Independence Park (.3 acre)Hickory Road & Dixie HighwayOutdoor Seating Area \
Indian Trails Park (4.6 acres)Riegel Road & Willow RoadWalking and Bike Path (1/2 mile) and Tennis Courts
Lions Club Park & Pool (8.5 acres)1041 Ridge Road • 799-2223Pool and Waterslide, Ballfield, Concessions, Tennisand Playfield
Millennium Park (6.5 acres)18600 Harwood AvenueWalking Path (4/10 mile), Moss Memorial Garden,Splash Pad, Soccer Field, Roller Hockey, Playgroundwith Picnic Shelter and BBQ, NardoniMemorial Garden
Orchard Park (3 acres)1701 Olive RoadPlayground, Tennis Courts, Ballfield and Playfield
Patriots Park (11 acres)187th Street & Center AvenuePlayground, Walking Path (4/10 mile), Ballfield andPicnic Shelter with BBQ, Soccer Field, Disc Golf
Pinewood Park (5.5 acres)Hedgerow Lane & Fresno AvenueSand Volleyball Court, Soccer, Playground,Ballfield and Playfield
Richard D. Irwin Park & Marie IrwinCommunity Center (6 acres)18120 S. Highland Avenue • 957-7275Playground, Gazebo, Plaza Area, Fountain,Ballfield, Playfield and Picnic Area
Rover’s Run Dog Park (3 acres)191st St., 2 blocks east of Center Ave.Open Play Area and Doggie/Owner Water Fountain
Scandia Park (1 acre)Hickory & RockwellPlayground
Tower Park (.6 acre)Pierce Avenue & Evergreen RoadTot Lot
Willowview Park (5 acres)Highland Avenue & Willow RoadSchool Playground, Ballfield, Seasonal Ice Skatingand Sledding, Playfield and Soccer
Woodborough Park (8.75 acres)18402 Aberdeen StreetWalking and Bike Path (3/10 mile), Soccer, Playground and Playfield
OLYMPIA FIELDS
Irons Oaks (38 acres)20000 Western Avenue • 481-2330Walking Trails (1-1/2 miles), Picnic Area, Nature Trails,Adventure Course, Meeting Rooms and Cross-Country Skiing
FLOSSMOOR
Ballantrae Park (6 acres)Antholl & Kinross StreetsWalking Path (3/10 mile), Playground, Playfieldand Picnic Shelter with BBQ
Coyote Run Golf Course (140 acres)800 Kedzie Avenue • 957-870018-Hole Golf Course, 3-Hole Learning Course, Driving Range and Pro Shop
Wiley’s Grill at Coyote Run Golf Course800 Kedzie Avenue • 957-8774Restaurant, Bar, Scenic Patio, Parties and Banquets
Flossmoor Hills Park (.5 acres)Hamlin Avenue & 188th StreetWalking Path (4/10 mile), Tennis Courts,School Playground
Flossmoor Park & Fieldhouse (6.5 acres)2523 Flossmoor RoadFlossmoor Fieldhouse, School Playground, Ballfield,Seasonal Ice Skating, Tennis Courts, Meeting Roomsand Playfield
Goldberg Center & Park (3.3 acres)3301 Flossmoor Road • 957-0300Administration Center, Walking Path (1/10 mile), Playground and Picnic Area with BBQ
H-F Ice Arena777 Kedzie Avenue • 957-0100Ice Rinks, Party Room, Pro Shop and Concessions
Heather Hill Park (1 acre)Lawrence CrescentTennis Courts, School Playground
Highlands Park (5 acres)Crescent Drive & Kathleen LaneWalking and Bike Path (2/10 mile), Playground,Ball Field and Playfield
Leavitt Park (3.75 acres)1010 Leavitt AvenuePerennial Garden, Gazebo, Playground, SculpturePark, Ballfield and Playfield
Parks Department18900 S. Kedzie Avenue • 957-0280
Pheasant Trails Park (6 acres)Hanover Lane & Dixie HighwayPlayground and Tennis Courts
Pinehurst Park (.5 acres)1501 Tina Lane
Passive Recreation
FA C I L I T Y L O C AT I O N S
Homewood-Flossmoor park disTricT • 708-957-7275
jbush
Typewritten Text
viii

PA R K D I S T R I C T M A P
Homewood1. Apollo Park2. Butterfield Park3. Cedar Park4. Dolphin Lake Park & Clubhouse5. eXtreme Scene Skate Park6. Patriots Park7. Heritage Park8. Hillcrest Park9. Hollydale Park10. Homewood Estates Park11. Park District Auditorium12. Independence Park13. Indian Trails Park14. Lions Club Park & Pool15. Millennium Park16. Orchard Park17. Pinewood Park18. H-F Racquet & Fitness Club19. Richard D. Irwin Park &
Marie Irwin Community Center20. Rover’s Run Dog Park21. Scandia Park22. Tower Park23. Willowview Park24. Woodborough Park25. H-F Sports Complex
Flossmoor26. Pinehurst Park27. H-F Ice Arena28. Highlands Park29. Ballantrae Park30. Flossmoor Hills Park31. Flossmoor Park32. Gretchen Goldberg, M.D.,
Memorial Park & GoldbergAdministration Center
33. Heather Hill Park34. Leavitt Avenue Park35. Parks Department36. Pheasant Trails Park37. Coyote Run Golf Course
& Wiley’s Grill
olympia Fields38. Irons Oaks Environmental
Learning Centera cooperative facility withOlympia Fields Park District
Programs are also hosted at the followingcommunity facilities:
Homewood
39. Churchill School, 190th St. & Center Ave.40. James Hart JHS, 18211 Aberdeen St.41. Willow School, 1804 Willow Rd.
Flossmoor
42. Flossmoor Hills School, 3721 Beech43. Heather Hills School,
1439 Lawrence Crescent44. H-F High School-North,
Governors Highway45. H-F High School-South, 999 Kedzie Ave.46. Parker JHS, 2810 School47. Western Ave. School, 940 Western Ave.
olympia Fields
The Barn at Sgt. Means Park,20712 S. Western Ave.
Tinley park
SSSRA, 19910 80th Ave.
jbush
Typewritten Text
ix

FINANCIAL SECTION
INDEPENDENT AUDITOR’S REPORT

Independent Auditor’s Report Members of the Board of Park Commissioners Homewood-Flossmoor Park District Flossmoor, Illinois We have audited the accompanying financial statements of the governmental activities, the business-type activities, each major fund and the aggregate remaining fund information of the Homewood-Flossmoor Park District, Illinois, as of and for the year ended April 30, 2016, and the related notes to the financial statements, which collectively comprise the District’s basic financial statements as listed in the table of contents.
Management’s Responsibility for the Financial Statements
Management is responsible for the preparation and fair presentation of these financial statements in accordance with accounting principles generally accepted in the United States of America; this includes the design, implementation and maintenance of internal control relevant to the preparation and fair presentation of financial statements that are free from material misstatement, whether due to fraud or error.
Auditor’s Responsibility
Our responsibility is to express opinions on these financial statements based on our audit. We conducted our audit in accordance with auditing standards generally accepted in the United States of America. Those standards require that we plan and perform the audit to obtain reasonable assurance about whether the financial statements are free from material misstatement.
An audit involves performing procedures to obtain audit evidence about the amounts and disclosures in the financial statements. The procedures selected depend on the auditor’s judgment, including the assessment of the risks of material misstatement of the financial statements, whether due to fraud or error. In making those risk assessments, the auditor considers internal control relevant to the entity’s preparation and fair presentation of the financial statements in order to design audit procedures that are appropriate in the circumstances, but not for the purpose of expressing an opinion on the effectiveness of the entity’s internal control. Accordingly, we express no such opinion. An audit also includes evaluating the appropriateness of accounting policies used and the reasonableness of significant accounting estimates made by management, as well as evaluating the overall presentation of the financial statements.
We believe that the audit evidence we have obtained is sufficient and appropriate to provide a basis for our audit opinions.

Members of the Board of Park Commissioners Homewood-Flossmoor Park District Page 2
Opinions
In our opinion, the financial statements referred to above present fairly, in all material respects, the respective financial position of the governmental activities, the business-type activities, each major fund and the aggregate remaining fund information of the Homewood-Flossmoor Park District, Illinois, as of April 30, 2016, and the respective changes in financial position and, where applicable, cash flows thereof, and the respective budgetary comparisons for the General, Recreation and Museum Funds for the year then ended, in conformity with accounting principles generally accepted in the United States of America.
Emphasis of Matters
As disclosed in Note 1 to the financial statements, in 2016 the District adopted new accounting guidance required by Governmental Accounting Standards Board Statement No. 68, Accounting and Financial Reporting for Pensions – an amendment of GASB Statement No. 27, as amended by Governmental Accounting Standards Board Statement No. 71, Pension Transition for Contributions Made Subsequent to the Measurement Date – an amendment of GASB Statement No. 68. Our opinions are not modified with respect to these matters.
Other Matters
Required Supplementary Information
Accounting principles generally accepted in the United States of America require that the management’s discussion and analysis and pension information as listed in the table of contents, be presented to supplement the basic financial statements. Such information, although not a part of the basic financial statements, is required by the Governmental Accounting Standards Board, who considers it to be an essential part of financial reporting for placing the basic financial statements in an appropriate operational, economic or historical context. We have applied certain limited procedures to the required supplementary information in accordance with auditing standards generally accepted in the United States of America, which consisted of inquiries of management about the methods of preparing the information and comparing the information for consistency with management’s responses to our inquiries, the basic financial statements and other knowledge we obtained during our audit of the basic financial statements. We do not express an opinion or provide any assurance on the information because the limited procedures do not provide us with sufficient evidence to express an opinion or provide any assurance.
Prior Year Comparative Information
The financial statements include summarized prior year comparative information. Such information does not include all of the information required for a presentation in accordance with accounting principles generally accepted in the United States of America. Accordingly, such information should be read in conjunction with the District’s financial statements for the year ended April 30, 2015, from which such summarized information is derived.

Members of the Board of Park Commissioners Homewood-Flossmoor Park District Page 3
Other Information
Our audit as of and for the year ended April 30, 2016, was conducted for the purpose of forming opinions on the financial statements that collectively comprise the Homewood-Flossmoor Park District, Illinois’ basic financial statements. The introductory section, combining and individual fund financial statements and schedules and statistical section, for the year ended April 30, 2016, are presented for purposes of additional analysis and are not a required part of the basic financial statements. Such information is the responsibility of management and was derived from and relates directly to the underlying accounting and other records used to prepare the basic financial statements. The combining and individual fund financial statements and schedules for the year ended April 30, 2016, have been subjected to the auditing procedures applied in the audit of the basic financial statements as of and for the year ended April 30, 2016, and certain additional procedures, including comparing and reconciling such information directly to the underlying accounting and other records used to prepare the basic financial statements or to the basic financial statements themselves, and other additional procedures in accordance with auditing standards generally accepted in the United States of America. In our opinion, the combining and individual fund financial statements and schedules for the year ended April 30, 2016, are fairly stated in all material respects in relation to the basic financial statements as a whole as of and for the year ended April 30, 2016. The combining and individual fund financial statements and schedules include certain summarized prior year comparative information. Such information should be read in conjunction with the District’s combining and individual fund financial statements and schedules as of and for the year ended April 30, 2015.
The introductory and statistical sections as listed in the table of contents are presented for additional analysis and are not required parts of the basic financial statements. Such information has not been subjected to the auditing procedures applied in the audit of the basic financial statements and, accordingly, we do not express an opinion or provide any assurance on them.
Oakbrook Terrace, Illinois November 7, 2016

MANAGEMENT’S DISCUSSION AND ANALYSIS
4
Homewood-Flossmoor Park District Management’s Discussion and Analysis
April 30, 2016 The Homewood-Flossmoor Park District (the “District”) discussion and analysis is designed to: (1) assist the reader in focusing on significant financial issues, (2) provide an overview of the District’s financial activity, (3) identify changes in the District’s financial position (its ability to address the next and subsequent year challenges), (4) identify any material deviations from the financial plan (the approved budget) and (5) identify individual fund issues or concerns. The Management’s Discussion and Analysis (“MD&A”) is an element of the reporting model adopted by the Governmental Accounting Standards Board (GASB) in their Statement No. 34, Basic Financial Statements – and Management’s Discussion and Analysis – for State and Local Governments, issued June 1999. Certain comparative information between the current year and the prior year is required to be presented in the MD&A. In this fiscal year, the District implemented a new accounting standard as required by GASB Statement No. 68, Accounting and Financial Reporting for Pensions – an amendment of GASB Statement No. 27, as amended by Governmental Accounting Standards Board Statement No. 71, Pension Transition for Contributions Made Subsequent to the Measurement Date – an amendment of GASB Statement No. 68 (GASB 68). As the District is a participant in the Illinois Municipal Retirement Fund (IMRF), a multi-employer defined benefits pension plan, the Statement requires the District to record pension liabilities. To the extent that the plan’s actuarial liability for future benefits exceeds the fair value of plan assets, the District now recognizes a proportional share of the resulting net pension liability. Also recognized are new actuarial components of pension expense and certain deferred outflows and inflows of resources as explained in Notes 13 and 14. 2015 information has not been adjusted for the adoption of GASB 68. Since the MD&A is designed to focus on the current year’s activities, resulting changes and currently known facts, please read it in conjunction with the Transmittal Letter (beginning on page iii) and the District’s financial statements (beginning on page 12). Financial Highlights
• Although the assets and deferred outflows of resources of the District exceeded its liabilities and deferred inflows of resources at the close of the fiscal year ended April 30, 2016 by $23,301,078, the unrestricted portion of net position is negative by $2,479,654 after applying the newly adopted accounting standard GASB 68 for IMRF pension liabilities. Without the impact of the new pension standard, the unrestricted portion would have been negative by $818,964 compared to a positive position of $602,163 last year. While the obligation to pay for future expected pension benefits has always been present, the recognition of the actuarial value in the financial statements has not.
• The District’s overall expenses of $12,245,866 exceeded revenues of $12,091,115 resulting in a
decrease in the District-wide net position of $154,751. The District recognized an additional $76,190 in pension expense due to implementation of the new accounting standard.
• Property-related taxes received during the year were $5,107,778 compared to $4,971,970 last
year, an increase of $135,808, or 2.7%. Tax increment financing receipts (TIF) were negligible in either year.
• Recreational activities for the year resulted in charges for services of $1,884,627, or 61% of
program costs. Revenues increased by $76,437, or 4.2%, from last year’s total of $1,808,190,

5
while related expenses of $3,079,783 represent a decrease of $47,799, or 1.5%, from last year’s total of $3,127,582.
• Resources spent on capital improvements by governmental funds were $2,303,876, an increase
of $472,297, or 2.6%, from last year.
• The District’s total outstanding long-term debt was $16,128,075 as of April 30, 2016, a net decrease of $535,875 from the prior year end as principal repayments exceeded new debt.
OVERVIEW OF THE FINANCIAL STATEMENTS Management’s Discussion and Analysis introduces the District’s basic financial statements. The basic financial statements include: (1) District-wide financial statements, (2) fund financial statements, and (3) notes to the financial statements. The District also includes in this report additional information to supplement the basic financial statements. District-wide Financial Statements The comprehensive annual financial report includes two District-wide financial statements. These statements provide both long-term and short-term information about the District’s overall status. Financial reporting at this level uses a perspective similar to that found in the private sector with its basis in full accrual accounting and elimination or reclassification of internal activities. The first of these District-wide statements is the Statement of Net Position. This statement of financial condition as of a point in time compares all of the District’s assets and deferred outflows of resources to its liabilities and deferred inflows of resources, with the difference reported as net position. Over time, increases or decreases in net position may serve as a useful indicator of whether the financial condition of the District as a whole is improving or deteriorating. Evaluation of the overall financial health of the District would extend to other non-financial factors such as diversification of the taxpayer base or the condition of the District’s infrastructure in addition to the financial information provided in this report. The second District-wide statement is the Statement of Activities which reports how the District’s net position changed during the current fiscal year. All current year revenues and expenses are included regardless of when cash is received or paid. An important purpose of the design of this statement is to show the financial reliance of the District’s distinct activities or functions on revenues provided by the District’s taxpayers. Both of the District-wide financial statements distinguish governmental activities of the District that are supported by taxes and intergovernmental revenues, such as grants, from business-type activities that are intended to recover all or a significant portion of their costs through user fees and charges. Business-type activities include the Racquet and Fitness Club, the Ice Arena and the Coyote Run Golf Course. The District-wide financial statements are presented on pages 12-15 of this report. Fund Financial Statements A fund is an accountability unit used to maintain control over resources segregated for specific activities or objectives. The District uses funds to ensure and demonstrate compliance with finance-related laws and regulations. Within the basic financial statements, fund financial statements focus on the District’s most significant funds rather than the District as a whole. Major funds are separately reported while all

6
others are combined into a single aggregated presentation. Individual fund data for nonmajor funds is provided in the form of combining statements in a later section of this report. The District has two kinds of funds: Governmental funds are reported in the fund financial statements and encompass essentially the same functions reported as governmental activities in the District-wide financial statements. However, the focus is very different, with fund statements providing a distinctive view of the District’s governmental funds. These statements report short-term fiscal accountability focusing on the use of spendable resources and balances of spendable resources available at the end of the year. They are useful in evaluating annual financing requirements of governmental programs and the commitment of spendable resources for the near term. Since the District-wide focus includes the long-term view, comparisons between these two perspectives may provide insight into the long-term impact of short-term financing decisions. Both the governmental fund balance sheet and the governmental fund statement of revenues, expenditures and changes in fund balances provide a reconciliation to assist in understanding the differences between these two perspectives. Summary budgetary comparison statements are included in the basic financial statements for certain major funds - the General Fund and major special revenue funds (Recreation Fund and Museum Fund). Detailed budgetary comparison schedules for these and other special revenue funds can be found in a later section of this report. These statements and schedules demonstrate compliance with the District’s adopted annual appropriated budget. The basic governmental fund budgetary financial statements are presented on pages 22-24 of this report. Proprietary funds are also included in the fund financial statements. These funds generally report services for which the District charges customer fees and are intended to be self-sufficient. The District reports three enterprise funds in this category. Enterprise funds essentially encompass the same functions reported as business-type activities in the District-wide statements. Proprietary fund statements provide both long-term and short-term financial information consistent with the focus provided by the District-wide financial statements but with more detail for major enterprise funds. The basic enterprise fund financial statements are presented on pages 25-27 of this report. Notes to the Financial Statements The accompanying notes to the financial statements provide information essential to a full understanding of the District-wide and fund financial statements. The notes to the financial statements follow the basic fund financial statements. Other Information In addition to the basic financial statements and accompanying notes, this report also presents certain required supplementary information concerning the District’s net pension liability and progress in funding its obligation to provide pension benefits. While major funds are reported in the basic financial statements as discussed, combining and individual statements and schedules for nonmajor funds are presented in a subsequent section of this report following the required supplementary information.

7
District-wide Financial Analysis An analysis of the District’s net position may serve as a useful indicator of the government’s financial condition. The largest portion of the District’s net position is an investment in capital assets such as land, buildings and improvements, and equipment. The District uses these capital assets to provide services to customers; consequently, these assets are not available for future spending. Although the District’s investment in its capital assets is presented net of related debt used to acquire those assets, it should be noted that the resources needed to repay this debt must be provided from other sources, since the capital assets themselves cannot be used to pay off these liabilities. As year-to-year financial information is accumulated on a consistent basis, changes in net position may be observed and used to understand the changing financial condition of the District as a whole. The following charts summarize the net position reported in statements on pages 12-15 of this report.
2016 2015 2016 2015 2016 2015
Current Assets 8,660,702$ 10,846,870 292,718 391,261 8,953,420 11,238,131 Internal Balances 3,421,235 3,518,531 (3,421,235) (3,518,531) Capital Assets 18,567,024 17,100,865 16,986,996 17,584,412 35,554,020 34,685,277 Deferred Outflows - Pensions 633,867 604,888 1,238,755 Deferred Outflows - Other 248,138 268,760 248,138 268,760
Total Assets and Deferred Outflows 31,530,966 31,735,026 14,463,367 14,457,142 45,994,333 46,192,168
Current Liabilities (1,879,098) (2,214,699) (730,763) (910,377) (2,609,861) (3,125,076) Noncurrent - Net Pension Liability (1,447,979) (1,381,781) (2,829,760) Noncurrent - Other (13,379,790) (13,790,704) (1,661,077) (1,855,509) (15,040,867) (15,646,213) Deferred Inflows - Pensions (35,658) (34,028) (69,686) Deferred Inflows - Other (2,143,081) (2,380,549) (2,143,081) (2,380,549)
Total Liabilities and Deferred Inflows (18,885,606) (18,385,952) (3,807,649) (2,765,886) (22,693,255) (21,151,838)
Net PositionNet Investment in Capital Assets 8,383,872 6,740,728 15,194,002 15,602,949 23,577,874 22,343,677 Restricted 2,202,858 2,094,490 2,202,858 2,094,490 Unrestricted 2,058,630 4,513,856 (4,538,284) (3,911,693) (2,479,654) 602,163
Total Net Position 12,645,360 13,349,074 10,655,718 11,691,256 23,301,078 25,040,330
SUMMARY OF DISTRICT-WIDE NET POSITIONApril 30, 2016 and 2015
Governmental Activities Business-type Activities Total

8
2016 2015 2016 2015 2016 2015Revenues
Program RevenuesCharges for Services 1,884,627$ 1,808,190 4,926,222 5,028,335 6,810,849 6,836,525 Operating Grants and Contributions 24,796 45,411 24,796 45,411 Capital Grants and Contributions
Total Program Revenues 1,909,423 1,853,601 4,926,222 5,028,335 6,835,645 6,881,936
General RevenuesProperty Tax 5,107,778 4,971,970 5,107,778 4,971,970 Replacement and Other Taxes 74,223 89,553 74,223 89,553 Investment Income 15,904 3,530 5,000 2,530 20,904 6,060 Miscellaneous 52,565 45,511 52,565 45,511
Total General Revenues 5,250,470 5,110,564 5,000 2,530 5,255,470 5,113,094 Total Revenues 7,159,893 6,964,165 4,931,222 5,030,865 12,091,115 11,995,030
ExpensesGeneral Government 3,317,759 3,004,612 3,317,759 3,004,612 Recreational 3,079,783 3,127,582 3,079,783 3,127,582 Interest and Issuance Costs 606,821 545,488 606,821 545,488 Racquet Club 2,487,603 2,554,317 2,487,603 2,554,317 Ice Arena 798,297 835,041 798,297 835,041 Golf Course 1,955,603 1,961,256 1,955,603 1,961,256
Total Expenses 7,004,363 6,677,682 5,241,503 5,350,614 12,245,866 12,028,296 Transfers (48,461) (407,561) 48,461 407,561
Change in Net Position - Current Year 107,069 (121,078) (261,820) 87,812 (154,751) (33,266) Adjsutment for Adoption of GASB 68 (810,783) (773,718) (1,584,501)
Total Change in Net Position (703,714) (121,078) (1,035,538) 87,812 (1,739,252) (33,266)
Fiscal Years Ended April 30, 2016 and 2015
Governmental Activities Business-type Activities Total
SUMMARY OF CHANGES IN DISTRICT-WIDE NET POSITION
Governmental Activities (referring to the preceding charts) Excluding the effect from adopting the new pension accounting standard which has no comparative data in the prior year, the District-wide net position from governmental activities increased $107,069 compared to a decrease of $121,078 last year. While net spending for recreational activities, to maintain parks and facilities and to make permanent asset contributions to business-type activities, remained relatively constant, property tax collections increased by $135,308 over last year. The current level of restricted and unrestricted net position allows the District to meet its debt service needs, provide for future improvements, and support business-type activities. Although the District continued its strategy of keeping cash not immediately needed for operations in low-risk, highly liquid investments, persistently low interest rates resulted in insignificant income from this type of investment. Interest expense and debt issuance costs increased by $61,333 from last year reflecting the current structure for debt repayment. Business-type Activities (referring to the preceding charts) Excluding the effect from adopting the new pension accounting standard which has no comparative data in the prior year, business-type activities reduced the District-wide net position by $261,820. Combined operating losses of $231,275 were relatively unchanged from last year’s $239,963. More discussion follows in the analysis of the District’s individual funds.

9
Financial Analysis of the District’s Funds (referring primarily to pages 16-20 and pages 25-27 of this report) Governmental Funds As explained, Governmental Funds are reported in the fund statements with a focus on short-term inflow and outflow of spendable resources. This information is useful in assessing resources available at the end of the year in comparison with upcoming financing requirements. Governmental Funds reported ending fund balances of $9,535,655, a decrease of $1,679,189 from last year. Of the year-end total, $6,507,574 is available for continuing the District’s future operations as assigned fund balances. Major Governmental Funds The General, Recreation, Museum, Debt Service and Improvement Funds are the primary operating funds of the District. As of April 30, 2016, the General Fund balance was $824,446, most of which was dedicated to advances to support golf course operations. In the Improvement Fund, $2,601,802 has been advanced to support ice arena and golf course operations, leaving $2,948,837 available to support the District’s future operations. The General Fund balance decreased by $28,217 during the year compared to a reduction of $373,390 last year. Mitigating the decrease, property tax revenue increased by $88,770 while overall expenditures decreased slightly by $29,158. The Recreation Fund balance increased by $73,562 compared to a decrease of $73,661 last year. Revenues from fees and charges kept pace with increasing costs while property tax revenue rose by $179,524. While the continued popularity of the programs and services offered by the Irons Oaks Environmental Learning Center remained strong, the Museum Fund balance decreased by $235,443, due to a planned reduction in levied taxes and increased capital expenditures. The remaining fund balance of $588,020 will allow for major repairs and capital improvements in the future. The Improvement Fund balance decreased by $1,420,833 primarily due to major capital spending to complete the Dolphin Lake Clubhouse renovation. All of the Debt Service Fund balance of $560,890 is available for future debt obligations. Business-type Activities, Major Proprietary Funds The following analysis by fund excludes the effect from adopting the new pension accounting standard which has no comparative data in the prior year: The Racquet Club Fund is an enterprise fund used to account for the operation and maintenance of the Racquet and Fitness Club. Operations include racquet sports and related programs, fitness programs, lap pool, pro-shop and administration. The cost of operations is recovered through membership fees and user charges. The net position of the Racquet Club Fund was $2,476,611 as of April 30, 2016, includes a decrease of $169,264 from current operations compared to last year end. A general decline in memberships and participation in both tennis and fitness programs resulted in an operating income level which was not sufficient to cover depreciation and financing expenses.

10
The Artificial Ice Skating Rink Fund is used to account for the operation and maintenance of the Ice Arena. Operations include figure skating and hockey related programs, pro-shop and administration. The cost of operations is recovered through user charges. The net position of the Skating Rink Fund increased by $21,332 from current operations during the year. A decline in operating revenue was offset by a corresponding reduction in operating expenses resulting in an operating income of $36,609 which continued the reversal of several years of declines in net position from operating losses. Nevertheless, excluding net capital assets, the Skating Rink Fund had an unrestricted deficit net position of $2,524,468 at year end. Advances from the Racquet Club Fund and Improvement Fund totaling $2,468,257 are being used to support ice arena operations. The Golf Course Fund is used to account for the operation and maintenance of Coyote Run Golf Course. Operations include a golf course, learning center, pro-shop, restaurant and administration. The cost of operations is recovered through user charges. Excluding financing transfers and capital asset contributions from other funds, the net position of the Golf Course Fund declined $187,857. Although both golf course and restaurant operations had gains of $155,580, the combined profitability was not sufficient to cover depreciation and financing expenses. Excluding net capital assets, the Golf Course Fund had a deficit net position of $2,457,233 at year end. Advances from the General and Improvement Funds totaling $2,115,682 are being used to support operations. Budgetary Highlights (referring to page 22, Exhibit A-7 of this report) The General Fund accounts for all of the resources for services traditionally associated with a park district, except those for which a special fund has been created. Each year, approximately 25% of the District’s total governmental revenues and expenditures are budgeted in this fund. During the 2016 budget year, the District did not revise the annual operating budget. Revenues were lower than budgeted in the General Fund due to a variance in property tax revenues of $66,919. Contributing factors were a significant reduction from reassessment of property values within the District coupled with legal caps on the ability to levy taxes for the General Fund. Higher than expected costs in almost all types of building and equipment repairs also resulted in a negative variance. More than offsetting were positive variances in spending for part-time labor, risk management programs and professional development. Combined with other minor effects, the net positive variance from budget before debt service and transfers was $35,510. CAPITAL ASSETS AND DEBT ADMINISTRATION Capital Assets As of April 30, 2016, the District’s investment in capital assets net of accumulated depreciation for governmental and business-type activities was $18,567,024 and $16,986,996, respectively. The majority of capital spending during the year was for completion of Dolphin Lake Clubhouse and purchase of related equipment. Other major spending was for an upgrade to the high ropes course at the environmental learning center, parking lot repaving and replacement purchases of service trucks, grounds equipment to maintain the golf course and parks, computer servers, fitness machines and the replacement of various other equipment throughout the District. For more detailed information, see Notes to the Financial Statements, Note 5.

11
Debt Administration As of April 30, 2016, the District had general obligation bond issues outstanding totaling $16,128,075. Of this amount, $1,760,000 is being paid from alternate revenue sources. During the year, the District made repayments of $1,435,873 and issued $900,000 in new general obligation bonds, primarily for future capital expenditures. For more information, see Notes to the Financial Statements, Note 6. Factors Bearing on the District’s Future At the time that these financial statements were prepared and audited, the District was not aware of any existing circumstances that would adversely affect its financial health in the near future.
CONTACTING THE DISTRICT’S FINANCIAL MANAGEMENT This financial report is designed to provide a general overview of the District’s finances, comply with finance-related laws and regulations, and demonstrate the District’s commitment to public accountability. If you have any questions about this report or would like to request additional information, please contact:
Sharon Dangles Superintendent of Finance & Administration
Homewood-Flossmoor Park District 3301 Flossmoor Road Flossmoor, IL 60422
BASIC FINANCIAL STATEMENTS

12
Exhibit A-1HOMEWOOD-FLOSSMOOR PARK DISTRICT, ILLINOIS
Statement of Net Position
April 30, 2016
Governmental Business-typeActivities Activities Total
AssetsCurrent Assets
Cash and Investments 3,533,714$ 3,533,714 Restricted Cash 2,896,867 2,896,867 Receivables
Property Taxes 2,185,751 2,185,751 Accounts 72,784 72,784 Other 38,580 38,580
Prepaid Items 5,790 5,790 Inventory 219,934 219,934
Total Current Assets 8,660,702 292,718 8,953,420
Noncurrent AssetsInternal Balances 3,421,235 (3,421,235)
Capital Assets Not Being Depreciated 8,315,305 8,479,000 16,794,305 Capital Assets Depreciable, Net 10,251,719 8,507,996 18,759,715
18,567,024 16,986,996 35,554,020 Total Noncurrent Assets 21,988,259 13,565,761 35,554,020
Deferred Outflows of ResourcesOutflows Related to Pensions 633,867 604,888 1,238,755 Deferred Charge on Debt Refunding 248,138 248,138
Total Deferred Outflows of Resources 882,005 604,888 1,486,893
Total Assets and Deferred Outflows of Resources 31,530,966 14,463,367 45,994,333
See Notes to Financial Statements (Cont.)
13
Exhibit A-1HOMEWOOD-FLOSSMOOR PARK DISTRICT, ILLINOIS
Statement of Net Position (Cont.)
April 30, 2016
Governmental Business-typeActivities Activities Total
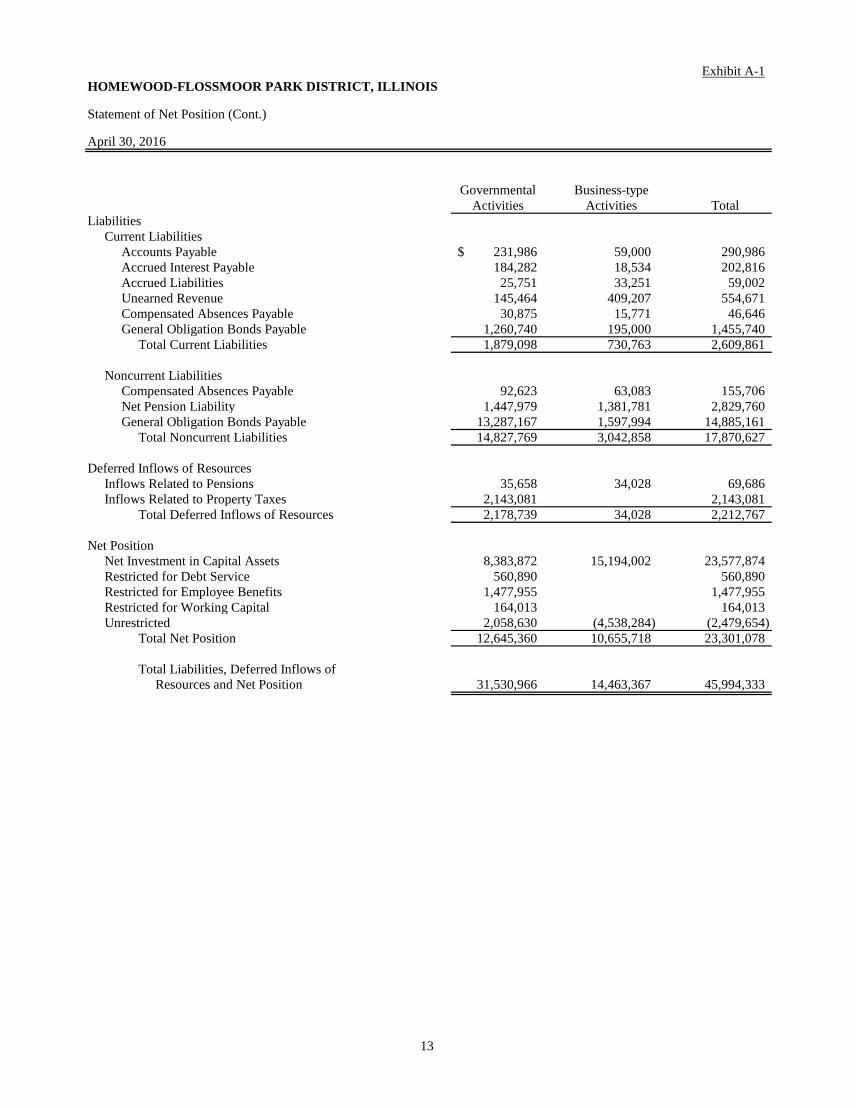
LiabilitiesCurrent Liabilities
Accounts Payable 231,986$ 59,000 290,986 Accrued Interest Payable 184,282 18,534 202,816 Accrued Liabilities 25,751 33,251 59,002 Unearned Revenue 145,464 409,207 554,671 Compensated Absences Payable 30,875 15,771 46,646 General Obligation Bonds Payable 1,260,740 195,000 1,455,740
Total Current Liabilities 1,879,098 730,763 2,609,861
Noncurrent LiabilitiesCompensated Absences Payable 92,623 63,083 155,706 Net Pension Liability 1,447,979 1,381,781 2,829,760 General Obligation Bonds Payable 13,287,167 1,597,994 14,885,161
Total Noncurrent Liabilities 14,827,769 3,042,858 17,870,627
Deferred Inflows of ResourcesInflows Related to Pensions 35,658 34,028 69,686 Inflows Related to Property Taxes 2,143,081 2,143,081
Total Deferred Inflows of Resources 2,178,739 34,028 2,212,767
Net PositionNet Investment in Capital Assets 8,383,872 15,194,002 23,577,874 Restricted for Debt Service 560,890 560,890 Restricted for Employee Benefits 1,477,955 1,477,955 Restricted for Working Capital 164,013 164,013 Unrestricted 2,058,630 (4,538,284) (2,479,654)
Total Net Position 12,645,360 10,655,718 23,301,078
Total Liabilities, Deferred Inflows of Resources and Net Position 31,530,966 14,463,367 45,994,333

14
HOMEWOOD-FLOSSMOOR PARK DISTRICT, ILLINOIS
Statement of Activities
Year Ended April 30, 2016
Operating CapitalCharges for Grants and Grants and
Expenses Services Contributions Contributions
Governmental ActivitiesGeneral Government 3,317,759$ Recreational 3,079,783 1,884,627 24,796 Interest Expense and Issuance Costs 606,821
Total Governmental Activities 7,004,363 1,884,627 24,796 -
Business-type ActivitiesRacquet Club 2,487,603 2,331,916 Artificial Ice Skating Rink 798,297 826,560 Golf Course 1,955,603 1,767,746
Total Business-type Activities 5,241,503 4,926,222 - -
12,245,866 6,810,849 24,796 -
General Revenues Taxes Property Replacement Other Investment Income MiscellaneousTransfers Total General Revenues
Change in Net Position
Net PositionBeginning - as Previously ReportedAdjustment for adoption of GASB 68 (see Note 14)
Beginning - as Restated
Ending
See Notes to Financial Statements
Functions/Programs
Program Revenues
15
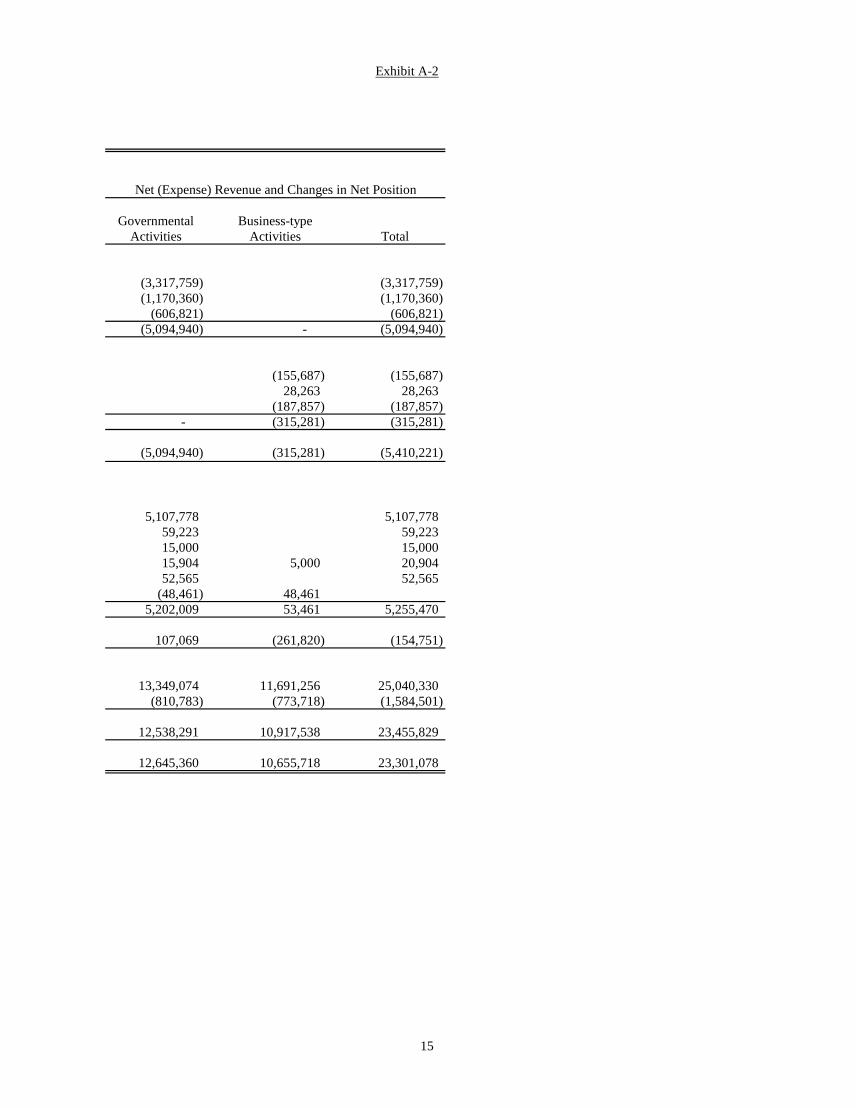
Exhibit A-2
Governmental Business-typeActivities Activities Total
(3,317,759) (3,317,759) (1,170,360) (1,170,360)
(606,821) (606,821) (5,094,940) - (5,094,940)
(155,687) (155,687) 28,263 28,263
(187,857) (187,857) - (315,281) (315,281)
(5,094,940) (315,281) (5,410,221)
5,107,778 5,107,778 59,223 59,223 15,000 15,000 15,904 5,000 20,904 52,565 52,565
(48,461) 48,461 5,202,009 53,461 5,255,470
107,069 (261,820) (154,751)
13,349,074 11,691,256 25,040,330 (810,783) (773,718) (1,584,501)
12,538,291 10,917,538 23,455,829
12,645,360 10,655,718 23,301,078
Net (Expense) Revenue and Changes in Net Position

16
HOMEWOOD-FLOSSMOOR PARK DISTRICT, ILLINOIS
Balance Sheet - Governmental Funds
April 30, 2016
General Recreation MuseumFund Fund Fund
Cash and Investments 27,994$ 364,802 611,453 Restricted CashReceivables, Net
Property Taxes 911,962 357,385 23,614 Replacement Taxes 11,248Other 1,927 6,892 5,695
Advances to Other Funds 819,433 Prepaid Items 5,013 327 450
Total Assets 1,777,577 729,406 641,212
LiabilitiesAccounts Payable 54,163$ 173,046 3,422 Accrued Liabilities 3,978 10,889 3,752Unearned Revenue 1,738 120,891 22,835
Total Liabilities 59,879 304,826 30,009
Deferred Inflows of ResourcesUnavailable Revenue - Property Taxes 893,252 350,471 23,183
Fund BalancesNonspendable
Advances 819,433 Prepaid Items 5,013 327 450
Restricted forDebt ServiceEmployee BenefitsWorking Capital
Assigned toSpecial Revenue Fund Purposes 73,782 587,570 Capital Project Fund Purposes
Unassigned
Total Fund Balances 824,446 74,109 588,020
Total Liabilities, Deferred Inflows of Resources and Fund Balances 1,777,577 729,406 641,212
See Notes to Financial Statements
ASSETS
RESOURCES AND FUND BALANCESLIABILITIES, DEFERRED INFLOWS OF

17
Exhibit A-3
Debt Nonmajor TotalService Improvement Governmental GovernmentalFund Fund Funds Funds
551,979 40,780 1,936,706 3,533,714 2,896,867 2,896,867
487,303 405,487 2,185,751 11,248
12,818 27,332 2,601,802 3,421,235
5,790
1,039,282 5,552,267 2,342,193 12,081,937
1,355 231,986 1,628 5,504 25,751
145,464
- 1,628 6,859 403,201
478,392 397,783 2,143,081
819,433 5,790
560,890 560,890
1,477,955 1,477,955 164,013 164,013
295,078 956,430
5,550,639 505 5,551,144
560,890 5,550,639 1,937,551 9,535,655
1,039,282 5,552,267 2,342,193 12,081,937

See Notes to Financial Statements18
Exhibit A-4HOMEWOOD-FLOSSMOOR PARK DISTRICT, ILLINOIS
Reconciliation of the Balance Sheet of Governmental Fundsto the Statement of Net Position
April 30, 2016
Total Fund Balances - Governmental Funds 9,535,655$
Amounts reported for governmental activities in the Statement of Net Positionare different because:
Deferred Charge on Debt Refunding, which is reported in the Statement of NetPosition, does not provide a current financial resource and, therefore, is notreported as an asset in the governmental funds. 248,138
Capital assets used in governmental activities are not financial resources and,therefore, are not reported in the governmental funds balance sheet. 18,567,024
Interest expense is not subject to accrual in governmental funds. (184,282)
Some liabilities reported in the Statement of Net Position do not require theuse of current financial resources and, therefore, are not reported asliabilities in governmental funds. These activities consist of:
Deferred Outflows of Resources - Pension Related 633,867 Deferred Inflows of Resources - Pension Related (35,658) General Obligation Bonds Payable, Net (14,547,907) Net Pension Liability (1,447,979) Compensated Absences (123,498)
Net Position of Governmental Activities 12,645,360

19
HOMEWOOD-FLOSSMOOR PARK DISTRICT, ILLINOIS
Statement of Revenues, Expenditures, and Changes inFund Balances - Governmental Funds
Year Ended April 30, 2016
General Recreation MuseumFund Fund Fund
RevenuesProperty Taxes 2,286,231$ 629,138 45,754 Swimming Pools 175,204 Fees and Charges 1,028,083 501,155 Building Rental 179,622 Replacement Taxes 59,223 Investment Income 14,904 Grants and Donations 14,307 10,489 Interfund Services 31,000 Miscellaneous 29,577 10,451 28,100
Total Revenues 2,420,935 2,036,805 585,498 Expenditures
CurrentGeneral Government 1,742,777 Recreation 1,963,243 710,469 Retirement Contributions
Capital Outlay 5,596 110,472 Debt Service
Principal 265,000 Interest 406,401 Bond Issuance Costs
Total Expenditures 2,419,774 1,963,243 820,941
Excess (Deficiency) of Revenuesover Expenditures 1,161 73,562 (235,443)
Other Financing Sources (Uses)Transfers In 48,519 Transfers Out (77,897) Issuance of Long-Term Debt
Total Other Financing Sources (Uses) (29,378) - -
Net Change in Fund Balances (28,217) 73,562 (235,443)
Fund BalancesBeginning - May 1 852,663 547 823,463
Ending - April 30 824,446 74,109 588,020
See Notes to Financial Statements
20
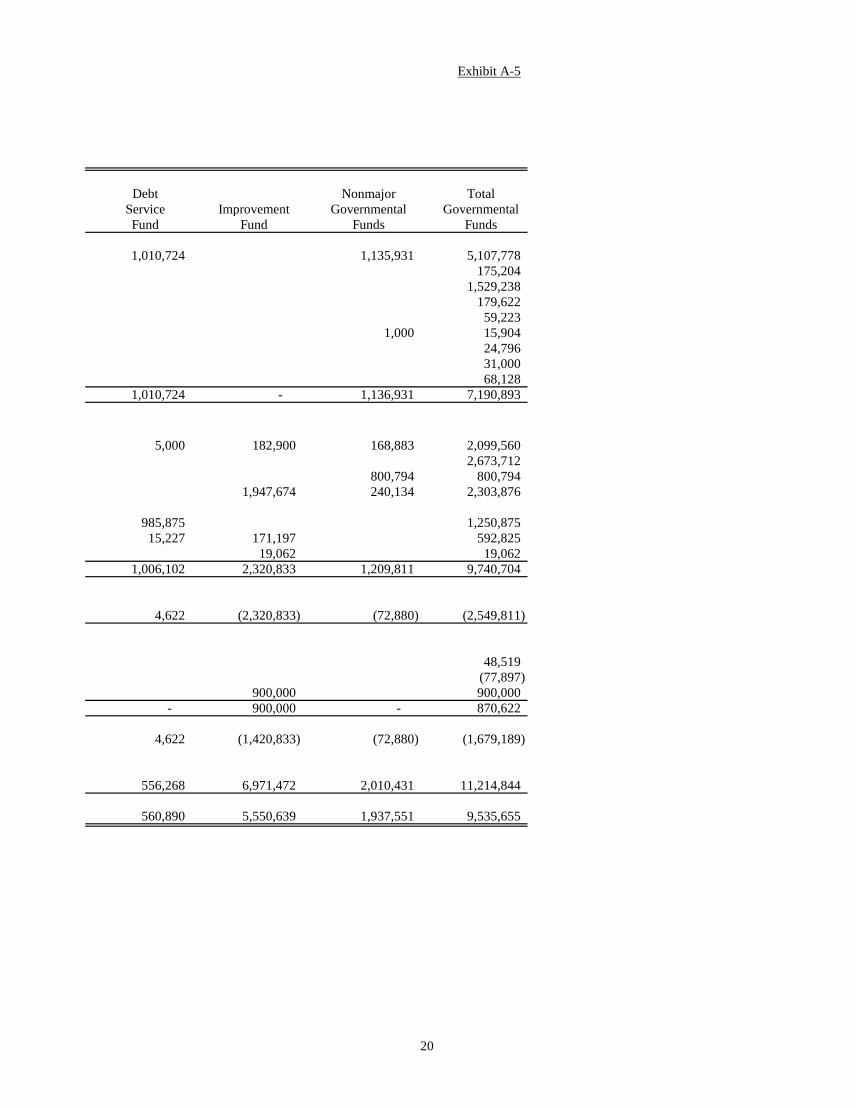
Exhibit A-5
Debt Nonmajor TotalService Improvement Governmental GovernmentalFund Fund Funds Funds
1,010,724 1,135,931 5,107,778 175,204
1,529,238 179,622
59,223 1,000 15,904
24,796 31,000
68,128 1,010,724 - 1,136,931 7,190,893
5,000 182,900 168,883 2,099,560 2,673,712
800,794 800,794 1,947,674 240,134 2,303,876
985,875 1,250,875 15,227 171,197 592,825
19,062 19,062 1,006,102 2,320,833 1,209,811 9,740,704
4,622 (2,320,833) (72,880) (2,549,811)
48,519 (77,897)
900,000 900,000 - 900,000 - 870,622
4,622 (1,420,833) (72,880) (1,679,189)
556,268 6,971,472 2,010,431 11,214,844
560,890 5,550,639 1,937,551 9,535,655
See Notes to Financial Statements21
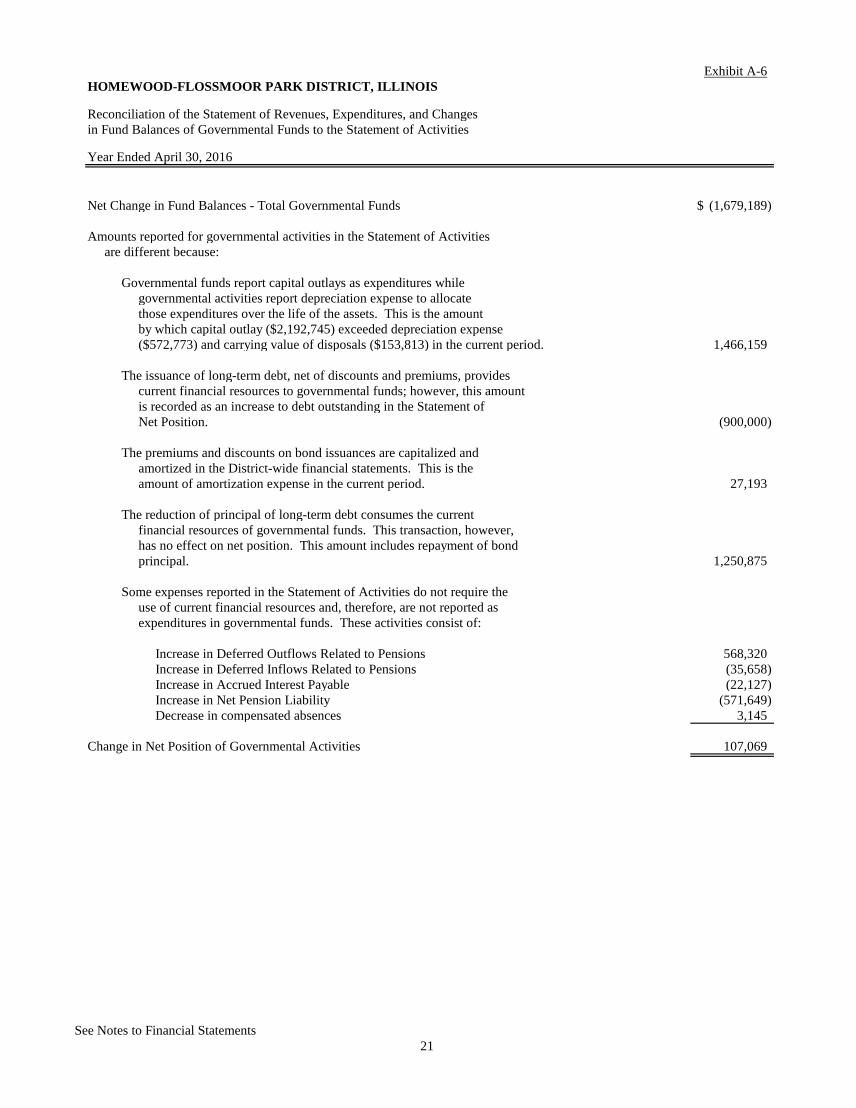
Exhibit A-6HOMEWOOD-FLOSSMOOR PARK DISTRICT, ILLINOIS
Reconciliation of the Statement of Revenues, Expenditures, and Changes in Fund Balances of Governmental Funds to the Statement of Activities
Year Ended April 30, 2016
Net Change in Fund Balances - Total Governmental Funds (1,679,189)$
Amounts reported for governmental activities in the Statement of Activitiesare different because:
Governmental funds report capital outlays as expenditures whilegovernmental activities report depreciation expense to allocatethose expenditures over the life of the assets. This is the amount by which capital outlay ($2,192,745) exceeded depreciation expense($572,773) and carrying value of disposals ($153,813) in the current period. 1,466,159
The issuance of long-term debt, net of discounts and premiums, provides current financial resources to governmental funds; however, this amount is recorded as an increase to debt outstanding in the Statement of
Net Position. (900,000)
The premiums and discounts on bond issuances are capitalized andamortized in the District-wide financial statements. This is theamount of amortization expense in the current period. 27,193
The reduction of principal of long-term debt consumes the current financial resources of governmental funds. This transaction, however,has no effect on net position. This amount includes repayment of bond principal. 1,250,875
Some expenses reported in the Statement of Activities do not require theuse of current financial resources and, therefore, are not reported asexpenditures in governmental funds. These activities consist of:
Increase in Deferred Outflows Related to Pensions 568,320 Increase in Deferred Inflows Related to Pensions (35,658) Increase in Accrued Interest Payable (22,127) Increase in Net Pension Liability (571,649) Decrease in compensated absences 3,145
Change in Net Position of Governmental Activities 107,069

See Notes to Financial Statements22
Exhibit A-7HOMEWOOD-FLOSSMOOR PARK DISTRICT, ILLINOIS
General Fund
Statement of Revenues, Expenditures, andChanges in Fund Balance - Budget and Actual Year Ended April 30, 2016(With Summarized Comparative Actual Amounts for the Year Ended April 30, 2015)
Variance WithFinal Budget
Original/Final Positive 2015 Budget Actual (Negative) Actual
RevenuesProperty Taxes
General Corporate 1,945,026$ 1,868,556 (76,470) 1,816,050 Liability Insurance 321,691 332,066 10,375 300,593 Worker’s Compensation 86,433 85,609 (824) 80,818
Replacement Taxes 72,977 59,223 (13,754) 73,717 Investment Income 3,000 14,904 11,904 2,530 Interfund Services 31,000 31,000 16,000 Miscellaneous 18,250 29,577 11,327 18,042
Total Revenues 2,478,377 2,420,935 (57,442) 2,307,750
ExpendituresGeneral Government
Personnel 923,012 864,213 58,799 892,636 Contractual Services 721,783 660,100 61,683 711,952 Supplies and Materials 117,000 103,293 13,707 122,718 Repairs and Maintenance 73,530 115,171 (41,641) 81,081
Capital OutlayContribution to Golf Course Fund 16,293 Other 6,000 5,596 404
Debt ServicePrincipal 321,298 265,000 56,298 260,000 Interest 379,480 406,401 (26,921) 364,252
Total Expenditures 2,542,103 2,419,774 122,329 2,448,932
Excess (Deficiency) of Revenues over Expenditures (63,726) 1,161 64,887 (141,182)
Other Financing Sources (Uses)Transfer Out - Golf Course Fund (77,897) (77,897) (232,208) Transfer In - Enterprise Funds 48,519 48,519
Total Other Financing Sources (Uses) - (29,378) (29,378) (232,208)
Net Change in Fund Balance (63,726) (28,217) 35,509 (373,390)
Fund Balance Beginning - May 1 852,663 1,226,053
Ending - April 30 824,446 852,663
2016

See Notes to Financial Statements23
Exhibit A-8HOMEWOOD-FLOSSMOOR PARK DISTRICT, ILLINOIS
Recreation Fund
Statement of Revenues, Expenditures, andChanges in Fund Balance - Budget and ActualYear Ended April 30, 2016(With Summarized Comparative Actual Amounts for the Year Ended April 30, 2015)
Variance WithFinal Budget
Original/Final Positive 2015 Budget Actual (Negative) Actual
RevenuesProperty Taxes 482,536$ 629,138 146,602 449,614Swimming Pool 243,303 175,204 (68,099) 180,261Fees and Charges 1,150,977 1,028,083 (122,894) 975,657Building Rental 144,639 179,622 34,983 124,268Donations 22,465 14,307 (8,158) 19,074Miscellaneous 12,875 10,451 (2,424) 22,451
Total Revenues 2,056,795 2,036,805 (19,990) 1,771,325
ExpendituresRecreation
Personnel 1,218,071 1,160,267 57,804 1,164,802Contractual Services 632,767 559,850 72,917 516,845Supplies and Materials 150,378 162,112 (11,734) 132,227Repairs and Maintenance 29,372 81,014 (51,642) 31,112
Total Expenditures 2,030,588 1,963,243 67,345 1,844,986
Net Change in Fund Balance 26,207 73,562 47,355 (73,661)
Fund BalanceBeginning - May 1 547 74,208
Ending - April 30 74,109 547
2016
See Notes to Financial Statements24
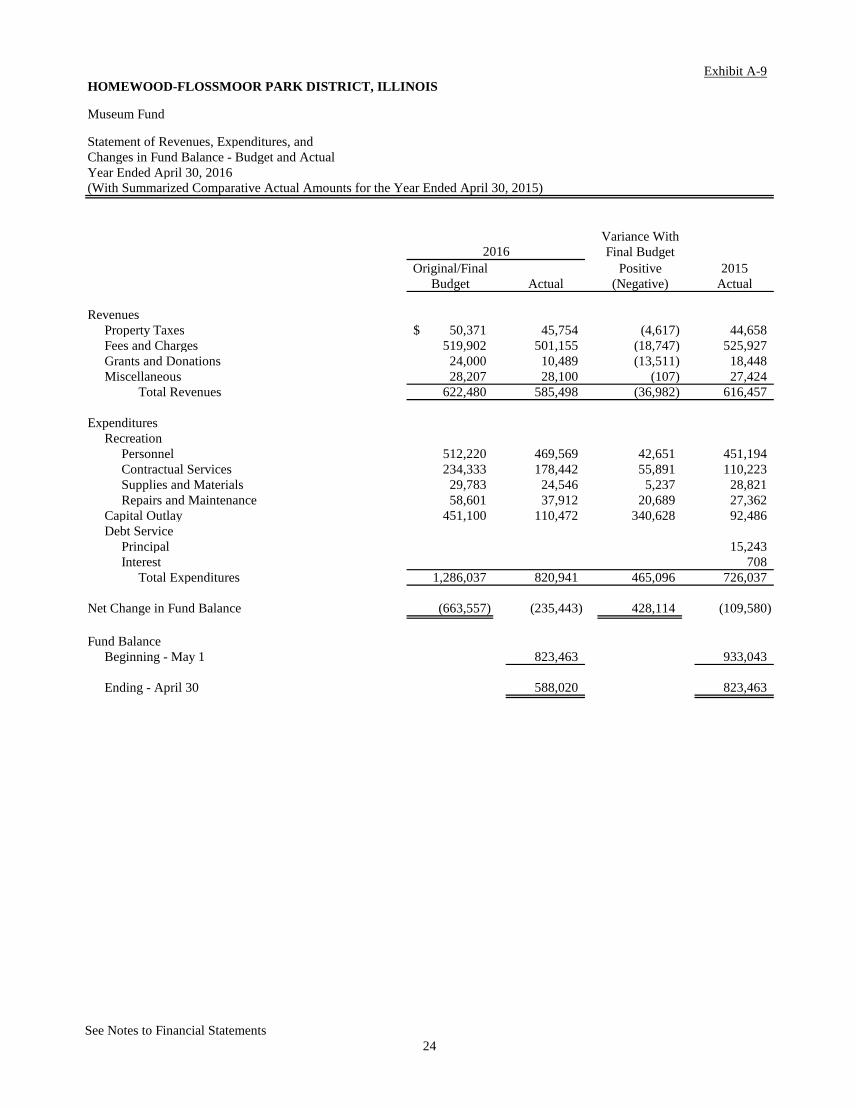
Exhibit A-9HOMEWOOD-FLOSSMOOR PARK DISTRICT, ILLINOIS
Museum Fund
Statement of Revenues, Expenditures, andChanges in Fund Balance - Budget and ActualYear Ended April 30, 2016(With Summarized Comparative Actual Amounts for the Year Ended April 30, 2015)
Variance WithFinal Budget
Original/Final Positive 2015Budget Actual (Negative) Actual
RevenuesProperty Taxes 50,371$ 45,754 (4,617) 44,658 Fees and Charges 519,902 501,155 (18,747) 525,927 Grants and Donations 24,000 10,489 (13,511) 18,448 Miscellaneous 28,207 28,100 (107) 27,424
Total Revenues 622,480 585,498 (36,982) 616,457
ExpendituresRecreation
Personnel 512,220 469,569 42,651 451,194 Contractual Services 234,333 178,442 55,891 110,223 Supplies and Materials 29,783 24,546 5,237 28,821 Repairs and Maintenance 58,601 37,912 20,689 27,362
Capital Outlay 451,100 110,472 340,628 92,486 Debt Service
Principal 15,243 Interest 708
Total Expenditures 1,286,037 820,941 465,096 726,037
Net Change in Fund Balance (663,557) (235,443) 428,114 (109,580)
Fund Balance Beginning - May 1 823,463 933,043
Ending - April 30 588,020 823,463
2016
See Notes to Financial Statements25
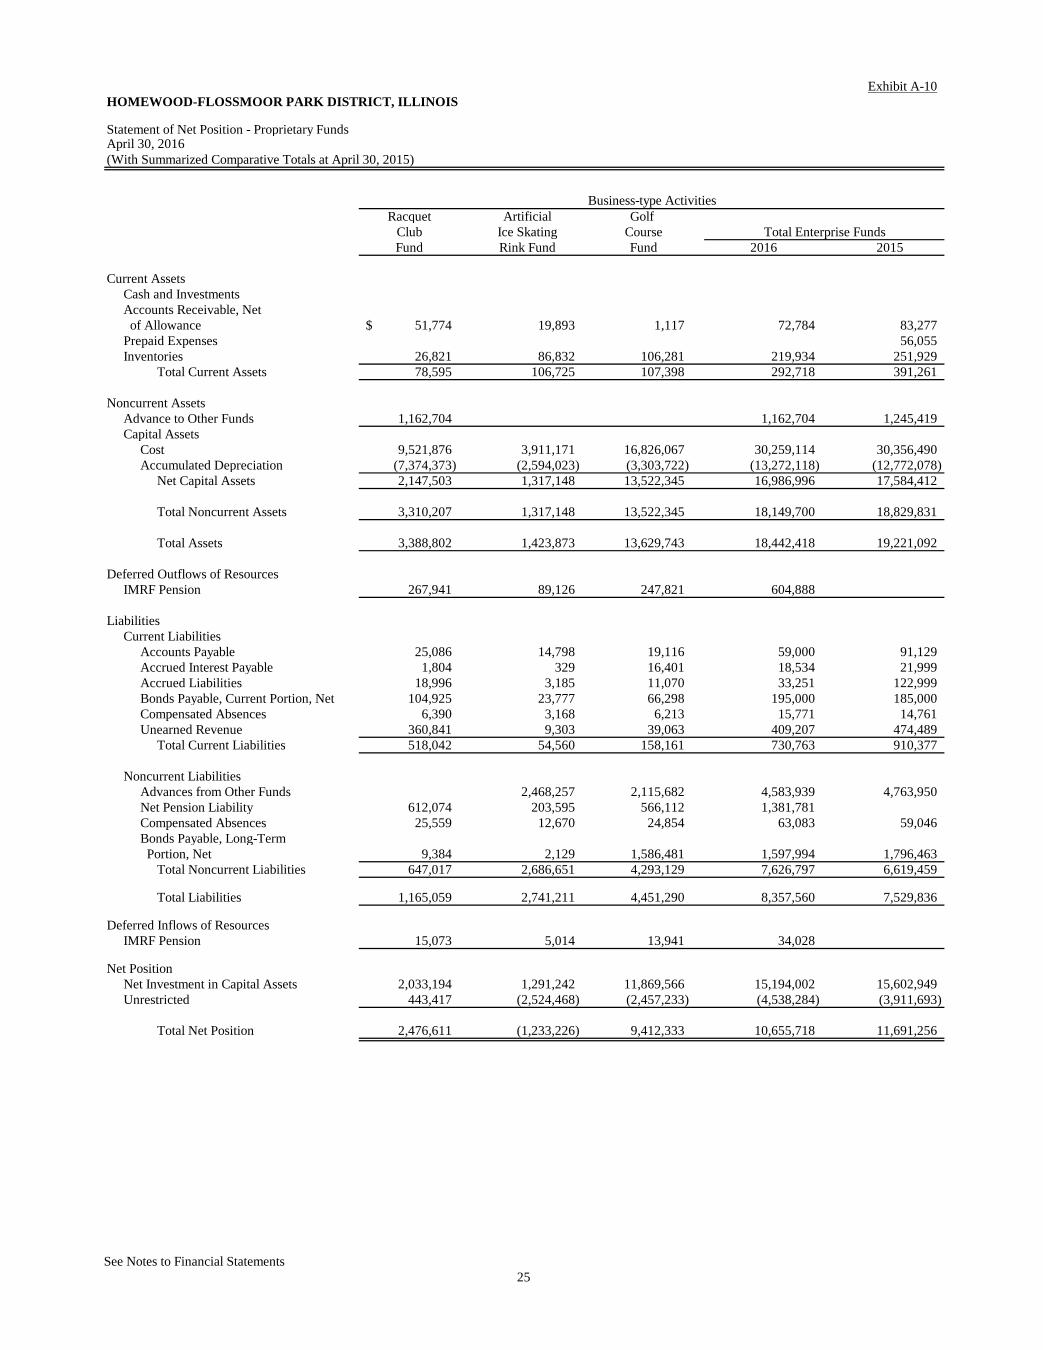
Exhibit A-10HOMEWOOD-FLOSSMOOR PARK DISTRICT, ILLINOIS
Statement of Net Position - Proprietary Funds
(With Summarized Comparative Totals at April 30, 2015)
Racquet Artificial Golf Club Ice Skating Course Total Enterprise FundsFund Rink Fund Fund 2016 2015
Current AssetsCash and Investments Accounts Receivable, Net of Allowance 51,774$ 19,893 1,117 72,784 83,277 Prepaid Expenses 56,055 Inventories 26,821 86,832 106,281 219,934 251,929
Total Current Assets 78,595 106,725 107,398 292,718 391,261
Noncurrent AssetsAdvance to Other Funds 1,162,704 1,162,704 1,245,419 Capital Assets
Cost 9,521,876 3,911,171 16,826,067 30,259,114 30,356,490 Accumulated Depreciation (7,374,373) (2,594,023) (3,303,722) (13,272,118) (12,772,078)
Net Capital Assets 2,147,503 1,317,148 13,522,345 16,986,996 17,584,412
Total Noncurrent Assets 3,310,207 1,317,148 13,522,345 18,149,700 18,829,831
Total Assets 3,388,802 1,423,873 13,629,743 18,442,418 19,221,092
Deferred Outflows of ResourcesIMRF Pension 267,941 89,126 247,821 604,888
LiabilitiesCurrent Liabilities
Accounts Payable 25,086 14,798 19,116 59,000 91,129 Accrued Interest Payable 1,804 329 16,401 18,534 21,999 Accrued Liabilities 18,996 3,185 11,070 33,251 122,999 Bonds Payable, Current Portion, Net 104,925 23,777 66,298 195,000 185,000 Compensated Absences 6,390 3,168 6,213 15,771 14,761 Unearned Revenue 360,841 9,303 39,063 409,207 474,489
Total Current Liabilities 518,042 54,560 158,161 730,763 910,377
Noncurrent LiabilitiesAdvances from Other Funds 2,468,257 2,115,682 4,583,939 4,763,950 Net Pension Liability 612,074 203,595 566,112 1,381,781 Compensated Absences 25,559 12,670 24,854 63,083 59,046 Bonds Payable, Long-Term Portion, Net 9,384 2,129 1,586,481 1,597,994 1,796,463
Total Noncurrent Liabilities 647,017 2,686,651 4,293,129 7,626,797 6,619,459
Total Liabilities 1,165,059 2,741,211 4,451,290 8,357,560 7,529,836
Deferred Inflows of ResourcesIMRF Pension 15,073 5,014 13,941 34,028
Net PositionNet Investment in Capital Assets 2,033,194 1,291,242 11,869,566 15,194,002 15,602,949 Unrestricted 443,417 (2,524,468) (2,457,233) (4,538,284) (3,911,693)
Total Net Position 2,476,611 (1,233,226) 9,412,333 10,655,718 11,691,256
Business-type Activities
April 30, 2016

See Notes to Financial Statements26
Exhibit A-11HOMEWOOD-FLOSSMOOR PARK DISTRICT, ILLINOIS
Statement of Revenues, Expenses,and Changes in Net Position - Proprietary Funds
(With Summarized Comparative Totals for the Year Ended April 30, 2015)
Racquet Artificial GolfClub Ice Skating CourseFund Rink Fund Fund 2016 2015
Operating Revenues Charges for Services 2,171,957$ 792,564 1,106,408 4,070,929 4,126,012 Retail Sales 75,087 21,131 661,055 757,273 764,778 Other 84,872 12,865 283 98,020 137,545
Total Operating Revenues 2,331,916 826,560 1,767,746 4,926,222 5,028,335
Operating Expenses excluding Depreciation Cost of Goods Sold 53,780 14,579 260,333 328,692 357,488 Personnel 1,362,773 363,003 849,908 2,575,684 2,629,081 Contractual Services 638,406 228,747 333,847 1,201,000 1,149,057 Supplies 109,417 48,562 117,129 275,108 292,000 Repairs and Maintenance 44,368 40,625 50,949 135,942 173,537
Total Operating Expenses 2,208,744 695,516 1,612,166 4,516,426 4,601,163
Operating Income before Depreciation 123,172 131,044 155,580 409,796 427,172
Depreciation 221,342 94,435 325,294 641,071 667,135
Operating Income (Loss) (98,170) 36,609 (169,714) (231,275) (239,963)
Nonoperating Income (Expense) Interest Income 5,000 5,000 2,530 Loss on Disposal of Capital Assets (19,965) (19,965) (4,824) Interest and Amortization Expense (37,552) (8,346) (18,143) (64,041) (77,492)
Total Nonoperating Income (Expense) (52,517) (8,346) (18,143) (79,006) (79,786)
Income (Loss) before Transfers and Contributions (150,687) 28,263 (187,857) (310,281) (319,749)
Contributions Received from Improvement Fund 6,376 12,707 19,083 159,060 General Fund 16,293
Transfers Out - General Fund (24,953) (6,931) (16,635) (48,519) Transfers In - General Fund 77,897 77,897 232,208
Change in Net Position (169,264) 21,332 (113,888) (261,820) 87,812
Net PositionBeginning - as Previously Reported 2,988,601 (1,140,556) 9,843,211 11,691,256 11,603,444 Adjustment for Adoption of GASB 68 (See Note 14) (342,726) (114,002) (316,990) (773,718) Beginning - as Restated 2,645,875 (1,254,558) 9,526,221 10,917,538 11,603,444
Ending 2,476,611 (1,233,226) 9,412,333 10,655,718 11,691,256
Business-type Activities
Year Ended April 30, 2016
Total Enterprise Funds

Exhibit A-12HOMEWOOD-FLOSSMOOR PARK DISTRICT, ILLINOIS
Statement of Cash Flows - Proprietary FundsYear Ended April 30, 2016
Racquet Artificial Golf TotalClub Ice Skating Course EnterpriseFund Rink Fund Fund Funds
Cash Flows from Operating ActivitiesReceipts from Customers and Users 2,266,176$ 830,302 1,774,955 4,871,433 Payments to Suppliers (843,021) (341,498) (790,050) (1,974,569) Payments to Employees (1,346,685) (352,487) (834,262) (2,533,434)
Net Cash Provided by Operating Activities 76,470 136,317 150,643 363,430
Cash Flows from Noncapital Financing ActivitiesChange in Advances To/From Other Funds 82,715 (90,289) (89,722) (97,296)
Cash Flows from Capital and Related FinancingActivities
Capital Assets Purchased (13,555) (6,198) (44,284) (64,037) Insurance Proceeds for Capital Assets 19,500 19,500 Transfer Out to General Fund (24,953) (6,931) (16,635) (48,519) Transfer In from General Fund 77,897 77,897 Principal Payments on Bonds (104,925) (23,777) (56,298) (185,000) Interest and Other Charges (40,252) (9,122) (21,601) (70,975)
Net Cash Used by Capital and Related Financing Activities (164,185) (46,028) (60,921) (271,134)
Cash Flows from Investing ActivitiesInterest Received 5,000 5,000
Net Increase in Cash and Cash Equivalents - - - -
Cash and Cash EquivalentsBeginning - May 1
Ending - April 30 - - - -
Reconciliation of Operating Income (Loss) to NetCash Provided by Operating Activities
Operating Income (Loss) (98,170)$ 36,609 (169,714) (231,275) Items Not Requiring Cash
Depreciation Expense 221,342 94,435 325,294 641,071 Changes in Assets and Liabilities
Accounts Receivable 6,209 2,890 1,394 10,493 Inventories 28,358 (1,542) 5,179 31,995 Prepaid Expenses 55,655 400 56,055 Deferred Outflows of Resources (240,234) (79,910) (222,195) (542,339) Accounts Payable and Accrued Liabilities (81,063) (7,443) (33,371) (121,877) Unearned Revenue (71,949) 852 5,815 (65,282) Net Pension Liability 241,641 80,377 223,496 545,514 Deferred Inflows of Resources 15,073 5,014 13,941 34,028 Compensated Absences (392) 5,035 404 5,047
Net Cash Provided by Operating Activities 76,470 136,317 150,643 363,430
Non-cash Capital and Financing ActivitiesInterfund Contribution of Capital Assets
From Governmental Funds 6,376$ - 12,707 19,083
Business-type Activities
See Notes to Financial Statements27

HOMEWOOD-FLOSSMOOR PARK DISTRICT, ILLINOIS Notes to the Financial Statements April 30, 2016
28
1. Summary of Significant Accounting Policies The financial statements of the Homewood-Flossmoor Park District, Illinois (District) have been prepared in
conformity with generally accepted accounting principles (GAAP) as applied to government units. The Governmental Accounting Standards Board (GASB) is the accepted standard-setting body for establishing governmental accounting and financial reporting principles. The more significant of the District’s accounting policies are described below.
A. Reporting Entity Homewood-Flossmoor Park District, Illinois, was formed by the merger of the Homewood and Flossmoor
Park Districts in 1969 under the provisions of Chapter 105 of the Illinois Compiled Statutes, as amended. The District operates under a Board of Commissioners elected by the voters of the District and provides all types of recreational programs and facilities, maintenance of parks and athletic fields, outdoor swimming pool, indoor ice arena, indoor racquet sports and fitness facility, golf course, restaurant and general administrative services.
As required by generally accepted accounting principles, the financial statements include those of the
Homewood-Flossmoor Park District, Illinois and its component units, where applicable. In evaluating how to define the District for financial reporting purposes, management has considered potential component units as required by Governmental Accounting Standards Board Statement No. 14, The Financial Reporting Entity, as amended by GASB Statement No. 61, The Financial Reporting Entity: Omnibus, under which the financial statements include all the organizations, activities, functions and component units for which the District is financially accountable. Financial accountability is defined as the appointment of a voting majority of the component unit’s board, and either (1) the District’s ability to impose its will over the component unit or (2) the possibility that the component unit will provide a financial benefit to or impose a financial burden on the District. The primary government is also financially accountable if an organization is fiscally dependent on, and there is a potential for the organization to provide specific financial benefits to, or impose specific financial burdens on, the primary government regardless of whether the organization has (1) a separately elected governing board, (2) a governing board appointed by a higher level of government or (3) a jointly appointed board. The District has determined that no outside agency meets the above criteria; therefore, no other agency has been included as a component unit in the District’s financial statements.
B. District-wide and Fund Financial Statements District-wide Financial Statements The District-wide Statement of Net Position and Statement of Activities report the overall financial activity
of the District. Eliminations have been made to minimize the double-counting of internal activities of the District. The financial activities of the District consist of governmental activities, which are primarily supported by property taxes, fees and charges and business-type activities, which rely to a significant extent on charges for services.
The Statement of Net Position presents the District’s assets and liabilities with the difference reported in
three categories:
Net investment in capital assets consists of capital assets, net of accumulated depreciation and reduced by outstanding balances for bonds and other debt that are attributable to the acquisition, construction or improvement of those assets.
HOMEWOOD-FLOSSMOOR PARK DISTRICT, ILLINOIS Notes to the Financial Statements April 30, 2016
29
1. Summary of Significant Accounting Policies (Cont.) B. District-wide and Fund Financial Statements (Cont.) District-wide Financial Statements (Cont.)
Restricted net position results when constraints placed on the use of net position are either externally imposed by creditors, grantors, contributors and the like, or imposed by law through constitutional provision or enabling legislation.
Unrestricted net position represents net position not appropriable for expenditures or legally segregated for a specific future use.
The Statement of Activities demonstrates the degree to which the direct expenses of a given function (i.e., general government, recreation) are offset by program revenues. Direct expenses are those that are clearly identifiable with a specific function. Program revenues include (a) charges paid by the recipients of goods or services offered by the programs (including fines and fees) and (b) grants and contributions that are restricted to meeting the operational requirements of a particular program. Revenues that are not classified as program revenues, including all taxes, are presented as general revenues.
Fund Financial Statements
Separate financial statements are provided for governmental funds and proprietary funds. The fund financial statements provide information about the District’s individual funds. The emphasis of fund financial statements is on major governmental funds, each displayed in a separate column. The District has the following major governmental funds – General Fund, Recreation Fund, Museum Fund, Debt Service Fund and Improvement Fund. All remaining governmental funds are aggregated and reported as nonmajor governmental funds. The District has the following major enterprise funds – Racquet Club Fund, Artificial Ice Skating Rink Fund and Golf Course Fund.
The District administers the following major governmental funds:
General Fund – This is the District’s primary operating fund. It accounts for all financial resources of the general government, except those required to be accounted for in another fund.
Recreation Fund – This fund accounts for the specific levy and fees collected to fund recreational programs and facilities, maintenance of parks and athletic fields and outdoor swimming pools of the District.
Museum Fund – This fund accounts for the specific levy and fees collected to fund payments for operation of the Irons Oaks Environmental Learning Center of the District.
Debt Service Fund – This fund was established to account for the accumulation of resources for, and the payment of, general long-term debt principal and interest (other than those financed by General and Proprietary Funds).
Improvement Fund – This fund accounts for the financial resources accumulated for other major capital transactions of the District.

HOMEWOOD-FLOSSMOOR PARK DISTRICT, ILLINOIS Notes to the Financial Statements April 30, 2016
30
1. Summary of Significant Accounting Policies (Cont.) B. District-wide and Fund Financial Statements (Cont.) Fund Financial Statements (Cont.)
The District administers the following major proprietary funds:
Racquet Club Fund – This fund was established for control of operating revenues and expenses of the indoor tennis courts and fitness club. Although a program of the District, the activity is operated as a separate enterprise and the accounting records are maintained on an Enterprise Fund basis. Accordingly, the account classifications used are designed specifically for the indoor tennis court operations. Artificial Ice Skating Rink Fund – This fund was established for control of operating revenues and expenses of the artificial ice skating rink. Although also a program of the District, the activity is operated as a separate enterprise and the accounting records are maintained on an Enterprise Fund basis. Accordingly, the account classifications used are designed specifically for the artificial ice skating rink operations.
Golf Course Fund – This fund was established for control of operating revenues and expenses of Coyote Run Golf Course, an eighteen hole facility. In January 2012, the District took over the operation of the onsite full service restaurant, now known as Wiley’s Grill. Although golf is also a program of the District, the activity is operated as a separate enterprise and the accounting records are maintained on an Enterprise Fund basis. Accordingly, the account classifications used are designed specifically for the golf course operations.
C. Measurement Focus and Basis of Accounting and Financial Statement Presentation
The District-wide financial statements are reported using the economic resources measurement focus and the accrual basis of accounting, as are the proprietary fund financial statements. Revenues are recorded when earned and expenses are recorded at the time liabilities are incurred, regardless of when the related cash flow takes place. Nonexchange transactions, in which the District gives (or receives) value without directly receiving (or giving) equal value in exchange, include various taxes, State-shared revenues, and various State, Federal and local grants, if any. On an accrual basis, revenues from taxes are recognized when the District has a legal claim to the resources. Grants, entitlements, State-shared revenues and similar items are recognized in the fiscal year in which all eligibility requirements imposed by the provider have been met.
Governmental funds are reported using the current financial resources measurement focus and the modified accrual basis of accounting. Revenues are recognized as soon as they are both measurable and available. Revenues are considered to be available when they are collectible within the current period or soon enough thereafter to pay liabilities of the current period. For this purpose, the District considers revenues to be available if they are collected within 90 days of the end of the current fiscal year (60 days for property taxes).
Significant revenue sources which are susceptible to accrual include property taxes, other taxes, grants, charges for services and interest. All other revenue sources are considered to be measurable and available only when cash is received.

HOMEWOOD-FLOSSMOOR PARK DISTRICT, ILLINOIS Notes to the Financial Statements April 30, 2016
31
1. Summary of Significant Accounting Policies (Cont.) C. Measurement Focus and Basis of Accounting and Financial Statement Presentation (Cont.)
Expenditures generally are recorded when the liability is incurred, as under accrual accounting. However, compensated absences are recorded in governmental funds only when payment is due (upon employee retirement or termination). General capital asset acquisitions are reported as expenditures in governmental funds.
Proprietary funds distinguish operating revenues and expenses from nonoperating items. Operating revenues and expenses generally result from providing services in connection with the proprietary fund’s principal ongoing operations.
D. Deposits and Investments For the purposes of the Statement of Cash Flows, the District’s proprietary funds consider all highly liquid
investments with an original maturity of three months or less when purchased to be cash equivalents. Investments with a maturity of one year or less are stated at cost plus or minus amortized discount or
premium. Investments with a maturity greater than one year are stated at fair value in accordance with GASB Statement No. 31.
E. Inventories and Prepaid Items
Enterprise Fund inventories are valued at the lower of cost or market using the rolling average method of
pricing inventory. The cost of such inventories is recorded as expenses when consumed rather than when purchased.
Certain payments to vendors reflect costs applicable to future accounting periods and are recorded as
prepaid items in both government-wide and fund financial statements. The cost of prepaid items is recorded as expenditures/expenses when consumed rather than when purchased.
F. Capital Assets
Capital assets which include land, land improvements, buildings and equipment are reported in the
applicable governmental or business-type activities columns in the government-wide financial statements. Capital assets are defined as assets with an estimated useful life of greater than one year and an original cost of greater than $2,000. Additions or improvements that significantly extend the useful life of an asset, or that significantly increase the capacity of an asset are capitalized. Expenditures for asset acquisitions and improvements are stated as capital outlay expenditures in the governmental funds.
The costs of normal maintenance and repairs that do not add to the value of the asset or materially extend
asset lives are not capitalized. Improvements are capitalized and depreciated over the remaining useful lives of the related capital assets, as applicable.

HOMEWOOD-FLOSSMOOR PARK DISTRICT, ILLINOIS Notes to the Financial Statements April 30, 2016
32
1. Summary of Significant Accounting Policies (Cont.) F. Capital Assets (Cont.) Depreciation of capital assets is recorded in the Statement of Activities with accumulated depreciation
reflected in the Statement of Net Position and is provided on the straight-line basis over the following estimated useful lives:
Estimated Useful Life (in Years)
Buildings 30 - 50 Land Improvements 20 Machinery, Equipment and Vehicles 10
G. Long-Term Obligations In the government-wide financial statements and proprietary fund financial statements, long-term debt and
other long-term obligations, including compensated absences, are reported as liabilities in the applicable governmental or business-type activities and proprietary fund Statement of Net Position. Bond premiums and discounts are deferred and amortized over the life of the bonds as further described in Note 1N.
Debt service funds are specifically established to account for and service the long-term obligations for the
governmental funds debt. Enterprise funds individually account for and service the applicable debt that benefits those funds. Long-term debt is recognized as a liability in a governmental fund when due, or when resources have been accumulated for payment early in the following year.
H. Compensated Absences In the event of termination, an employee is reimbursed for accumulated vacation days. Employees are not
reimbursed for unused sick leave. Vacation pay is accrued when incurred in the government-wide and proprietary fund financial statements. A liability for these amounts is reported in the governmental funds only if they have matured; for example, as a result of employee resignations and retirements. For governmental funds, the District accrues the remaining portion of such benefits, which are reported as a liability in the Statement of Net Position. For enterprise funds, the District accrues the entire amount of such benefits as current liabilities within the enterprise funds.
I. Deferred Outflows/Inflows of Resources The District reports deferred outflows of resources on its Statement of Net Position. Deferred outflows of
resources represent a consumption of net position that applies to a future period(s) and so will not be recognized as an outflow of resources (expense/expenditure) until then. The District has two items that qualify for reporting in this category, the outflows related to pensions, which represents pension items that will be recognized in future periods, and the unamortized loss on debt refunding that will be amortized to interest expense in future periods.
The District also reports deferred inflows of resources on its Statement of Net Position and funds
statements. Deferred inflows of resources represent an acquisition of net position that applies to a future period(s) and so will not be recognized as an inflow of resources (revenue) until that time. The District has two items that qualify for reporting in this category in the government-wide statements, deferred inflows related to property taxes levied in 2015 but will be collected in a future period, and deferred inflows related

HOMEWOOD-FLOSSMOOR PARK DISTRICT, ILLINOIS Notes to the Financial Statements April 30, 2016
33
1. Summary of Significant Accounting Policies (Cont.) I. Deferred Outflows/Inflows of Resources (Cont.)
to pensions, which represent pension items that will be recognized in future periods. In the funds statements, deferred inflows are reported for unavailable property taxes.
J. Fund Equity In the fund financial statements, governmental funds report nonspendable fund balance for amounts that are either not in spendable form or legally or contractually required to be maintained intact. Restrictions of fund balance are reported for amounts constrained by legal restrictions from outside parties for use for a specific purpose, or externally imposed by outside entities. None of the restricted fund balances result from enabling legislation adopted by the Park District. Committed fund balance, if any, is constrained by formal actions of the Park District’s Board, which is considered the Park District’s highest level of decision-making authority. Formal actions include ordinances approved by the Board. Once adopted, the limitation imposed by the ordinance remains in place until a similar action is taken to remove or revise the limitation. Assigned fund balance represents amounts constrained by the Park District’s intent to use them for a specific purpose. The authority to assign fund balance has been delegated to the Park District’s executive director through the approved fund balance policy of the Park District. Any residual fund balance of the General Fund is reported as unassigned. The Park District’s flow of funds assumption prescribes that the funds with the highest level of constraint are expended first. If restricted or unrestricted funds are available for spending, the restricted funds are spent first. Additionally, if different levels of unrestricted funds are available for spending, the District considers committed funds to be expended first followed by assigned and then unassigned funds.
K. Fund Balance/Net Position
Net position of the Working Capital Cash Fund is restricted for working capital purposes by Illinois Statute and is not available for appropriation.
L. Interfund Transactions
The District has the following types of transactions between funds:
Interfund balances are amounts provided with a requirement for repayment. Interfund balances are reported as due from other funds in lender funds and due to other funds in borrower funds for short-term borrowings, and advances to other funds in lender funds and advances from other funds in borrower funds for long-term borrowings. Amounts are reported as internal balances in the government-wide Statement of Net Position, except for amounts between similar activities, which have been eliminated.
Services provided and used are sales and purchases of goods and services between funds for a price approximating their external exchange value. Interfund services provided and used are reported as revenues in seller funds and expenditures or expenses in purchaser funds. Unpaid amounts are reported as due to/from other funds in the fund Balance Sheets or fund Statements of Net Position. Since the interfund services provided and used are not eliminated in the process of consolidation, generally, the interfund charges and balances are eliminated within the governmental activities reported in the Statements of Net Position and Activities.

HOMEWOOD-FLOSSMOOR PARK DISTRICT, ILLINOIS Notes to the Financial Statements April 30, 2016
34
1. Summary of Significant Accounting Policies (Cont.) L. Interfund Transactions (Cont.)
Interfund transfers are flows of assets (such as cash or goods) without equivalent flows of assets in return and without a requirement for repayment. In governmental funds, transfers are reported as other financing uses in the funds making transfers and as other financing sources in the funds receiving transfers. In proprietary funds, transfers in/out are reported as a separate category after nonoperating revenues and expenses.
M. Use of Estimates
Management has made a number of estimates and assumptions relating to the reporting of assets, deferred outflows of resources, liabilities and deferred inflows of resources to prepare these financial statements in conformity with GAAP. Actual results could differ from those estimates.
N. Bond Discounts/Premiums/Deferred Amounts on Refunding Bond discounts, premiums and gains/losses on refunding for proprietary fund types are deferred and
amortized over the term of the bonds using the bonds-outstanding method which approximates the effective interest method. Bond discounts and premiums are presented as a reduction or increase of the face amount of the bonds payable. These items are also deferred and amortized in the Statement of Net Position for the governmental activities.
In the fund financial statements, governmental funds recognize bond premiums and discounts, as well as
bond issuance costs, during the current period. The face amount of debt issued is reported as other financing sources. Premiums received on debt issuances are reported as other financing sources while discounts on debt issuances are reported as other financing uses. Issuance costs, whether or not withheld from the actual debt proceeds received, are reported as debt service expenditures.
O. Pensions
For purposes of measuring the net pension liability, deferred outflows of resources and deferred inflows of resources related to pensions, and pension expense, information about the fiduciary net position of the Illinois Municipal Retirement Fund agent multiple-employer defined benefit plan (IMRF) and additions to/deductions from the IMRF’s fiduciary net position have been determined on the same basis as they are reported by the IMRF. For this purpose, benefit payments (including refunds of employee contributions) are recognized when due and payable in accordance with the benefit terms. Investments are reported at fair value.
P. Comparative Information The basic financial statements include certain prior-year summarized comparative information in total but
not at the level of detail required for a presentation in accordance with generally accepted accounting principles. Accordingly, such information should be read in conjunction with the government’s financial statements for the year ended April 30, 2015, from which the summarized information was derived. The comparative information has not been restated for the adoption of GASB Statement No. 68 because it is impractical to do so because of the actuarial valuation information necessary for such restatement is not available.

HOMEWOOD-FLOSSMOOR PARK DISTRICT, ILLINOIS Notes to the Financial Statements April 30, 2016
35
1. Summary of Significant Accounting Policies (Cont.) Q. Implementation of New Accounting Standard In fiscal year 2016, the District adopted the provisions of GASB Statement No. 68, Accounting and
Financial Reporting for Pensions – an amendment of GASB Statement No. 27, and GASB No. 71, Pension Transition for Contributions Made Subsequent to the Measurement Date – an amendment to GASB Statement No. 68, which have as their objectives improving the usefulness of pension information included in the general purpose external financial reports of state and local governments that provide pension benefits to their employees under defined benefit pension plans for making decisions and assessing accountability.
Adoption of GASB Statement No. 68 resulted in a restatement of beginning net position at May 1, 2015,
and is described in Note 14. In addition, the Statement changed the requirements for information disclosed in the notes to the financial statements and information required to be presented as required supplementary information. GASB Statement No. 71 provides guidance on the recognition of pension contributions made after the measurement date.
2. Legal Compliance and Accountability All budgets are prepared based on the annual fiscal year of the District. The District does not use the
encumbrance method of accounting. Budgetary funds are controlled by an integrated budgetary accounting system in accordance with various legal requirements which govern the District.
The District follows these procedures in establishing the estimated revenue and budget data reflected in the
financial statements:
(1) The District submits to the Board of Park Commissioners a proposed operating budget for the fiscal year commencing the following May 1. The operating budget includes proposed expenditures and the means of financing them.
(2) Public hearings are conducted by the District to obtain taxpayer comments.
(3) Subsequently, the budget is legally enacted through passage of an ordinance.
(4) Formal budgetary integration is employed as a management control device during the year for the
General Fund, all Special Revenue Funds, the Debt Service Fund, all Capital Projects Funds and all Enterprise Funds.
(5) Budgets for the General Fund, Special Revenue Funds, Debt Service Fund and Capital Projects Funds are
adopted on a basis consistent with generally accepted accounting principles (GAAP). The Enterprise Fund budgets are prepared on the same basis of accounting as previously discussed, except capital improvements, depreciation and debt principal payments are budgeted as expenses. All annual appropriations lapse at fiscal year end.
(6) The annual appropriated budget is legally enacted and provides for a legal level of control at the fund
level. The Superintendent of Finance is authorized to make budget transfers within any fund. Additions and transfers between funds require Board approval. All annual appropriations lapse at fiscal year end.
HOMEWOOD-FLOSSMOOR PARK DISTRICT, ILLINOIS Notes to the Financial Statements April 30, 2016
36
2. Legal Compliance and Accountability (Cont.) The following funds had an excess of expenditures over budget:
Illinois Municipal Retirement Fund 16,853$ Debt Service Fund 1
3. Deposits and Investments The District maintains a cash and investment pool that is available for use by all funds. Each fund type’s portion
of this pool is displayed on the combined balance sheet as “cash and investments.” In addition, investments are separately held by several of the District’s funds.
Permitted Deposits and Investments - Statutes authorize the District to make deposits/invest in commercial
banks, savings and loan institutions, obligations of the U.S. Treasury and U.S. Agencies, insured credit union shares, money market mutual funds with portfolios of securities issued or guaranteed by the United States or agreements to repurchase these same obligations, repurchase agreements, short-term commercial paper rated within the three highest classifications by at least two standard rating services and the Illinois Park District Liquid Asset Fund Plus.
A. Deposits At year end the carrying amount of the District’s deposits totaled $2,230,562 and the bank balances totaled
$2,310,768. These amounts do not include petty cash on hand as of April 30, 2016, totaling $6,050. B. Investments The Illinois Park District Liquid Asset Fund Plus, an external investment pool, was established in 1995
under the Investment Company Act of 1940 as amended, to provide an investment vehicle for Illinois park districts and similar organizations. The Board of Trustees consists of representatives from participating members. This fund consists of two classes of shares for the existing IIT Portfolio; namely, the IIT Class and the IPDLAF+ Class. The pool has an affirmed AAAm Standard & Poor’s credit quality rating. The fair value of the assets in the pool is the same as the value of the pool shares. The average yield on the pool was 0.85% at April 30, 2016, and the balance in the IPDLAF+ Class was $977,969, with the remaining balance of $3,216,000 invested in the Illinois Trust CD program.
C. Collateral
At April 30, 2016, deposits and investments are fully collateralized. 4. Receivables - Taxes Property tax revenue is recognized to the extent of taxes due and collected within the current year or expected to
be collected soon enough thereafter (not to exceed 60 days) to be used to pay liabilities of the current period. Net taxes receivable, less the amount expected to be collected within 60 days, is reflected as unavailable revenue.
The County Assessor is responsible for assessment of all taxable real property within the County except for
certain railroad property, which is assessed directly by the State. One-third of the County is reassessed each year on a repeating triennial schedule established by the County Assessor.

HOMEWOOD-FLOSSMOOR PARK DISTRICT, ILLINOIS Notes to the Financial Statements April 30, 2016
37
4. Receivables - Taxes (Cont.) The County Clerk computes the annual tax for each parcel of real property and prepares tax books used by the
County Collector as the basis for issuing tax bills to all taxpayers in the County. Property taxes are collected by the County Collector and are submitted to the County Treasurer who remits to the units their respective shares of the collections. Property taxes for 2015 attach as an enforceable lien on January 1, 2015, on property values assessed as of the same date. Taxes are levied by December of the subsequent fiscal year (by passage of a Tax Levy Ordinance). Tax bills are prepared by the County and issued on or about February 1 and August 1, and are payable in two installments on or about March 1 and September 1. The County collects such taxes and remits them periodically.
The uncollected 2015 property tax levy is recorded as a receivable, net of estimated uncollectibles. Based upon
collection histories, the District has provided at April 30, 2016, an allowance for uncollectible real property taxes equivalent to 5% of the current year’s levy. All uncollected taxes relating to prior years’ levies have been written off.
5. Capital Assets A. Governmental Activities A summary of changes in capital assets for governmental activities of the District is as follows:
Balance Additions/ Deletions/ Balance
May 1, 2015 Transfers Transfers April 30, 2016
GOVERNMENTAL ACTIVITIES
Capital Assets Not Being DepreciatedLand 8,115,152$ 8,115,152 Construction in Progress 986,603 786,450 200,153
9,101,755 - 786,450 8,315,305
Capital Assets Being DepreciatedLand Improvements 3,738,035 206,848 33,595 3,911,288 Buildings 9,069,512 2,058,083 551,716 10,575,879 Machinery and Equipment 3,185,260 714,264 221,855 3,677,669 Vehicles 683,802 683,802
16,676,609 2,979,195 807,166 18,848,638
Less Accumulated Depreciation ForLand Improvements 2,241,141 112,443 20,261 2,333,323 Buildings 4,122,394 237,144 433,355 3,926,183 Machinery and Equipment 1,728,360 182,895 199,737 1,711,518 Vehicles 585,604 40,291 625,895
8,677,499 572,773 653,353 8,596,919
Total Capital Assets Being Depreciated, Net 7,999,110 2,406,422 153,813 10,251,719
Governmental Activities Capital Assets, Net 17,100,865 2,406,422 940,263 18,567,024

HOMEWOOD-FLOSSMOOR PARK DISTRICT, ILLINOIS Notes to the Financial Statements April 30, 2016
38
5. Capital Assets (Cont.) A. Governmental Activities (Cont.)
Depreciation was charged to the governmental functions of the District as follows: General Government 342,776$ Culture and Recreation 229,997
572,773
B. Business-type Activities A summary of changes in capital assets for business-type activities of the District is as follows:
Balance Additions/ Deletions/ Balance
May 1, 2015 Transfers Transfers April 30, 2016
BUSINESS-TYPE ACTIVITIES
Capital Assets Not Being DepreciatedLand 8,479,000$ 8,479,000 Construction in Progress 68,678 68,678
8,547,678 - 68,678 8,479,000
Capital Assets Being DepreciatedLand Improvements 4,633,290 4,633,290 Buildings 14,934,370 14,934,370 Machinery and Equipment 2,222,924 126,829 162,267 2,187,486 Vehicles 18,228 24,969 18,228 24,969
21,808,812 151,798 180,495 21,780,115
Less Accumulated Depreciation ForLand Improvements 1,553,621 154,363 1,707,984 Buildings 9,958,632 367,678 10,326,310 Machinery and Equipment 1,241,597 118,120 122,802 1,236,915 Vehicles 18,228 910 18,228 910
12,772,078 641,071 141,030 13,272,119
Total Capital Assets Being Depreciated, Net 9,036,734 (489,273) 39,465 8,507,996
Business-type Activities Capital Assets, Net 17,584,412 (489,273) 108,143 16,986,996
HOMEWOOD-FLOSSMOOR PARK DISTRICT, ILLINOIS Notes to the Financial Statements April 30, 2016
39
5. Capital Assets (Cont.)
B. Business-type Activities (Cont.) Depreciation was charged to the business-type functions of the District as follows:
Racquet Club Fund 221,342$ Artificial Ice Skating Rink Fund 94,435 Golf Course Fund 325,294
641,071
6. Long-term Obligations
A. Governmental Activities The following is a summary of long-term obligation activities of the District associated with governmental
activities for the year ended April 30, 2016:
DueBalance Balance at Within
May 1, 2015 Additions Reductions April 30, 2016 One Year
Compensated Absences 126,643$ 77,906 81,051 123,498 30,875 General Obligation Bonds 14,718,950 900,000 1,250,875 14,368,075 1,260,740
14,845,593 977,906 1,331,926 14,491,573 1,291,615
Compensated absences are being paid from the General Fund, and charged to General Government and
Recreation functions. Specific property tax levies are used to provide debt service on the bond issues.
B. Business-type Activities The following is a summary of long-term obligation activities of the District associated with business-type
activities for the year ended April 30, 2016:
DueBalance at Balance at Within
May 1, 2015 Additions Reductions April 30, 2016 One Year
Compensated Absences 73,807$ 52,284 47,237 78,854 15,771 General Obligation Bonds 1,945,000 185,000 1,760,000 195,000
2,578,068 52,284 232,237 1,838,854 210,771

HOMEWOOD-FLOSSMOOR PARK DISTRICT, ILLINOIS Notes to the Financial Statements April 30, 2016
40
6. Long-term Obligations
C. Changes in Long-term Obligations
Fund Debt Retired By
Balances May 1, 2015
Issuances
Retirements
Balances April 30,
2016
Due Within
One Year General Obligation Bonds Dated September 28, 2009, provides for
retirement of principal from $155,000 in 2009 to $290,000 in 2018, interest payable on June 1 and December 1 at rates from 2.00% to 3.25%, funded by property tax levy. Proceeds used for payment of 1998 Series G.O. Bonds.
General
$ 1,115,000
265,000
850,000
275,000
Dated November 1, 2013, Series 2013A,
provides for retirement of principal of $671,050 in 2014 and $228,950 in 2015, interest payable on June 1 and December 1 at 1.25% and 1.50%, funded by property tax levy.
Debt Service
228,950
228,950
Dated November 1, 2013, Series 2013B,
provides for retirement of principal from $560,000 in 2024 to $1,235,000 in 2032, interest payable annually on December 15 at rates from 4.0% to 5.0%, funded by property tax levy. Proceeds used for payment of 2006A Series G.O. Bonds and capital improvements.
General and Improvement
8,990,000
8,990,000
Dated December 11, 2014, Series
2014A, provides for retirement of principal of $756,925 in 2015 and $143,075 in 2016, interest payable on June 1 and December 1 at 1.30% and 1.60%, funded by property tax levy.
General and Improvement
900,000
756,925
143,075
143,075
Dated December 17, 2014, Series 2014B, provides for retirement of principal from $100,000 in 2017 to $170,000 in 2024, interest payable on June 15 and December 15 at 4.00%, funded by property tax levy.
General and Improvement
3,485,000
3,485,000
Dated December 14, 2015, Series 2015,
provides for retirement of principal of $842,665 in 2016 and $57,335 in 2017, interest payable on June 1 and December 1 at 2.43% funded by property tax levy.
General and Improvement
900,000
900,000
842,665
Governmental Activities 14,718,950 900,000 1,250,875 14,368,075 1,260,740

HOMEWOOD-FLOSSMOOR PARK DISTRICT, ILLINOIS Notes to the Financial Statements April 30, 2016
41
6. Long-term Obligations (Cont.)
C. Changes in Long-term Obligations (Cont.)
Fund Debt Retired By
Balances May 1, 2015
Issuances
Retirements
Balances April 30,
2016
Due Within
One Year General Obligation Bonds (Cont.) Dated November 1, 2011, provides for
retirement of principal from $166,402 in 2012 to $104,925 in 2016, interest payable on June 1 and December 1 at rates from 2.0% to 4.0%, funded by revenues in the Racquet Club Fund.
Racquet Club
209,850
104,925
104,925
104,925
Dated November 1, 2011, provides for
retirement of principal from $37,722 in 2012 to $23,777 in 2016, interest payable on June 1 and December 1 at rates from 2.0% to 4.0%, funded by revenues in the Ice Arena Fund.
Ice Arena
47,555
23,777
23,778
23,778
Dated November 1, 2011, provides for
retirement of principal from $380,876 in 2012 to $255,000 in 2023, interest payable on June 1 and December 1 at rates from 2.0% to 4.0%, funded by revenues in the Golf Course Fund.
Golf Course
1,687,595
56,298
1,631,297
66,297
Business-type Activities 1,945,000 - 185,000 1,760,000 195,000 Total Long-Term Obligations Excluding
Compensated Absences
16,663,950 900,000
1,435,875
16,128,075
1,455,740

HOMEWOOD-FLOSSMOOR PARK DISTRICT, ILLINOIS Notes to the Financial Statements April 30, 2016
42
6. Long-term Obligations (Cont.)
D. Annual Debt Requirements
The annual requirements to amortize all long-term debt, except compensated absences and OPEB obligations as of April 30, 2016, are as follows:
Governmental Activities
Principal Interest
2017 1,260,740$ 594,454 2018 442,335 564,503 2019 425,000 550,275 2020 565,000 535,450 2021 610,000 512,850
2022-2026 3,530,000 2,185,250 2027-2031 5,120,000 1,330,500 2032-2034 2,415,000 182,500
14,368,075 6,455,782
General Obligation Bonds
Business-type Activities
Principal Interest
2017 195,000$ 65,425 2018 200,000 59,575 2019 205,000 53,575 2020 215,000 46,400 2021 220,000 37,800
2022-2026 725,000 59,000
1,760,000 321,775
General Obligation Bonds
E. Advance Refundings
In January 2006, the District defeased the outstanding balance of the 2001B General Obligation Park Bonds (the “old bonds”) by placing the proceeds of the 2006A General Obligation Park Bonds in an irrevocable trust to provide for all future debt service requirements on the old bonds. The balance of the defeased debt outstanding at April 30, 2016, was $5,285,000.
In September 2009, the District defeased the outstanding balance of the 1998 General Obligation Park Bonds (the “old bonds”) by placing the proceeds of the 2009 General Obligation Park Bonds in an irrevocable trust to provide for all future debt service requirements on the old bonds. The balance of the defeased debt outstanding at April 30, 2016, was $835,000.

HOMEWOOD-FLOSSMOOR PARK DISTRICT, ILLINOIS Notes to the Financial Statements April 30, 2016
43
6. Long-term Obligations (Cont.)
E. Advance Refundings (Cont.)
In November 2011, the District defeased the outstanding balance of the 2003A and 2005A General Obligation Park Bonds (the “old bonds”) by placing the proceeds of the 2011B General Obligation Park Bonds in an irrevocable trust to provide for all future debt service requirements on the old bonds. The balance of the defeased debt outstanding at April 30, 2016, was $1,735,000.
In November 2013, the District defeased the outstanding balance of the 2006A General Obligation Park
Bonds (the “old bonds”) by placing the proceeds of the 2013B General Obligation Park Bonds in an irrevocable trust to provide for all future debt service requirements on the old bonds. The balance of the defeased debt outstanding at April 30, 2016, was $5,465,000.
F. Bonds Payable - Net The following is a summary of the gross/net bonds payable as of April 30, 2016:
Racquet Ice GolfGovernmental Club Arena Course Total
Gross Bonds Payable at April 30, 2016 14,368,075$ 104,925 23,778 1,631,297 1,760,000 Premium (Discount) Net of
Accumulated Amortization 179,832 9,384 2,128 21,482 32,994
14,547,907 114,309 25,906 1,652,779 1,792,994
Reported asCurrent Portion 1,260,740$ 104,925 23,777 66,298 195,000 Long-Term Portion 13,287,167 9,384 2,129 1,586,481 1,597,994
14,547,907 114,309 25,906 1,652,779 1,792,994
Business-type
7. Other Fund Disclosures A. Deficit Fund Balance/Net Position
The following fund reported a deficit in fund balance/net position at April 30, 2016:
Proprietary Fund
Artificial Ice Skating Rink Fund 1,233,226$

HOMEWOOD-FLOSSMOOR PARK DISTRICT, ILLINOIS Notes to the Financial Statements April 30, 2016
44
7. Other Fund Disclosures (Cont.) B. Interfund Balances Interfund advances as of April 30, 2016, were as follows:
Receivable Fund Payable Fund Amount
General Fund Golf Course Fund 819,433$ Improvement Fund Golf Course Fund 1,296,249 Improvement Fund Artificial Ice Skating Rink Fund 1,305,553 Racquet Club Fund Artificial Ice Skating Rink Fund 1,162,704
The advances to the Artificial Ice Skating Rink Fund and the Golf Course Fund were made to fund
cumulative operating deficits. C. Interfund Transfers
Interfund transfers for the year ending April 30, 2016, are as follows:
Receiving Fund Transferring Fund Amount
General Fund Racquet Club Fund 24,953$ General Fund Artificial Ice Skating Rink Fund 6,931 General Fund Golf Course Fund 16,635 Golf Course Fund General Fund 77,897 The 2003A Alternate Bond, refinanced with the Series 2011B General Obligations Bonds issued on November 1, 2011, approved by referendum for completion of golf course construction, is the basis for the interfund transfer for $77,897 to the Golf Course Fund from the General Fund. The 2003A Alternate Bond was refinanced with the Series 2011B General Obligations Bonds issued on November 1, 2011. Transfers to the General Fund from the Enterprise Funds (Racquet Club Fund, Artificial Ice Skating Rink Fund and Golf Course Fund) were made to provide for debt service costs.

HOMEWOOD-FLOSSMOOR PARK DISTRICT, ILLINOIS Notes to the Financial Statements April 30, 2016
45
8. Joint Venture South Suburban Special Recreation Association The District is a member of the South Suburban Special Recreation Association (SSSRA), which was organized
by area park and recreation districts and departments in order to provide special recreation programs to the physically and mentally handicapped within their districts and to share the expenses of such programs on a cooperative basis. Each member park and recreation department’s contribution is determined based upon the proportion of each member’s assessed valuation to the total assessed valuation of all members. The following are the contributions for the year ended May 31, 2016:
Country Club Hills 46,014$ Frankfort Square 122,738 Hazel Crest 32,622 Homewood-Flossmoor 132,879 Lan - Oak 89,392 Matteson 96,136 Oak Forest 93,612 Olympia Fields 31,668 Park Forest 30,807 Richton Park 34,561 Tinley Park 302,970
1,013,399
The SSSRA Board of Directors consists of one representative from each participating park and recreation
department. The Board of Directors is the governing body of the SSSRA and is responsible for establishing all major policies and changes therein and for approving all budgets, capital outlay, programming and master plans. This cooperative association however, is considered a separate reporting entity by the District’s administration. Separate financial statements for the SSSRA are available upon written request to the Homewood-Flossmoor Park District, 3301 Flossmoor Road, Flossmoor, Illinois 60422.
9. Risk Management The District is exposed to various risks related to torts, theft of, damage to, and destruction of assets, errors and
omissions, injuries to employees and net income losses. Since 1984, the District has been a member of the Park District Risk Management Agency (PDRMA)
Property/Casualty Program. PDRMA is a public entity risk pool consisting of park districts, forest preserve districts, special recreation associations and certain non-profit organizations serving the needs of public entities formed in accordance with the terms of an intergovernmental cooperative agreement among its members. Property, general liability, automobile liability, crime, boiler and machinery, public officials’ liability, employment practices liability, workers compensation and pollution liability coverage is provided in excess of specified limits for the members, acting as a single insurable unit.
For the January 1, 2015 through January 1, 2016 period, liability losses exceeding $21,500,000 per occurrence,
self-insured and reinsurance limit would be the responsibility of the District.

HOMEWOOD-FLOSSMOOR PARK DISTRICT, ILLINOIS Notes to the Financial Statements April 30, 2016
46
9. Risk Management (Cont.)
As a member of PDRMA’s Property/Casualty Program, the District is represented on the Property/Casualty Program Council and the Membership Assembly and is entitled to one vote on each. The relationship between the Park District and PDRMA is governed by a contract and the by-laws that have been adopted by resolution of the Park District’s governing body. The District is contractually obligated to make all annual and supplementary contributions to PDRMA, to report claims on a timely basis, cooperate with PDRMA, its claims administrator and attorneys in claims investigation and settlement, and to follow risk management procedures as outlined by PDRMA.
Members have a contractual obligation to fund any deficit of PDRMA attributable to a membership year during
which they were a member. PDRMA is responsible for administering the self-insurance program and purchasing excess insurance according
to the direction of the Program Council. PDRMA also provides its members with risk management services, including the defense of and settlement of claims, and establishes reasonable and necessary loss reduction and prevention procedures to be followed by the members.
The following represents a summary of PDRMA’s balance sheet at December 31, 2015, and the Statement of
Revenues and Expenses for the period ending December 31, 2015. The District’s portion of the overall equity of the pool is 2.146% or $873,677.
Assets 63,181,823$ Liabilities 23,063,014 Member Balances 40,708,211 Revenues 18,585,098 Expenditures 19,500,046
Since 96% of PDRMA’s liabilities are reserves for losses and loss adjustment expenses which are based on an
actuarial estimate of the ultimate losses incurred, the member balances are adjusted annually as more recent loss information becomes available.
The District has purchased insurance from private insurance companies. Risks covered include medical, dental
and others. Premiums have been displayed as expenditures/expenses in appropriate funds. There have been no significant reductions in insurance coverage. For all programs, settlement amounts have not exceeded insurance coverage for the current or the three prior years.
10. Use Agreements Beginning July 1, 2006, the District entered into a use agreement with Sertoma Speech and Hearing (Sertoma)
for space within the Homewood-Flossmoor Racquet and Fitness Club. Under the terms of the agreement, Sertoma will have exclusive use of 2,000 square feet of office space billed monthly. Total usage fees for the year ending April 30, 2016, was $19,082. This original agreement, which expired on June 30, 2012, was extended through September 30, 2015, and subsequently terminated.
Beginning March 1, 2014, the District entered into a use agreement with Conroy Orthopaedic & Sports Physical
Therapy (Conroy) for space within the Homewood-Flossmoor Racquet Club (Racquet Club). Under the terms of the agreement, Conroy will have exclusive use of 1,300 square feet of office space billed monthly. Total usage fees for the year ending April 30, 2016, was $42,000. This agreement expired on February 29, 2016, and the tenant is now on a month-to-month leasing arrangement.

HOMEWOOD-FLOSSMOOR PARK DISTRICT, ILLINOIS Notes to the Financial Statements April 30, 2016
47
11. Operating Leases The District leases an auditorium from the Village of Homewood for the purpose of conducting various
recreational and other District programs. The agreement requires nominal rent payments of $1 per year. In addition, the District is responsible for certain utility, maintenance and repair costs of the premises. The lease expires July 31, 2026. The District’s share of operating expense was $27,092 for fiscal 2016.
The District leases golf carts for use at Coyote Run Golf Course. The agreement requires 24 monthly payments
of $7,133 to be paid May through October of each fiscal year. In addition, the District is responsible for certain daily inspections and maintenance in addition to any damage repairs from accident, abuse or negligence. The lease expires December 1, 2018. Future minimum lease payments under this agreement are as follows:
2017 42,799$ 2018 42,799
85,598
12. Deferred Compensation Plan The District offers its employees a deferred compensation plan (Plan) created in accordance with Internal
Revenue Code Section 457. The Plan, available to all District employees, permits them to defer a portion of their salary until future years. Participation in the Plan is optional. The deferred compensation is not available to employees until termination, retirement, death or unforeseeable emergency. All amounts of compensation deferred under the Plan, all property and rights purchased with those amounts, and all income attributable to those amounts, property or rights (until paid or made available to the employee or other beneficiary) are held in Trust for the exclusive benefit of participants and beneficiaries.
It is the opinion of the District’s management that the District has no liability for losses under the Plan but does have the duty of due care that would be required of an ordinary prudent investor.
The Plan is administered by Mass Mutual Financial Group - Retirement Services. Since amounts held in Trust are for the exclusive benefit of all participants, the District does not maintain the assets on the balance sheet.
13. Defined Benefit Pension Plan Plan Description The District’s agent multiple-employer defined benefit pension plan for regular employees provides retirement
and disability benefits, postemployment increases and death benefits to plan members and beneficiaries. The District’s plan is administered by the Illinois Municipal Retirement Fund (IMRF), an agent multiple-employer public employee retirement system. Benefit provisions are established by statute and may only be changed by the General Assembly of the State of Illinois. IMRF issues a publicly available financial report that includes financial statements and required supplementary information. That report may be obtained on-line at www.imrf.org.

HOMEWOOD-FLOSSMOOR PARK DISTRICT, ILLINOIS Notes to the Financial Statements April 30, 2016
48
13. Defined Benefit Pension Plan (Cont.) Benefits Provided All employees hired in positions that meet or exceed the prescribed annual hourly standard must be enrolled in
IMRF as participating members. Employees hired before January 1, 2011, are eligible for Tier 1 benefits. Tier 1 employees are vested for
pension benefits when they have at least 8 years of qualifying service credit. Tier 1 employees who retire at age 55 (at reduced benefits) or after age 60 (at full benefits) with 8 years of service are entitled to an annual retirement benefit, payable monthly for life, in an amount equal to 1-2/3% of the final rate of earnings for the first 15 years of service credit, plus 2% for each year of service credit after 15 years to a maximum of 75% of their final rate of earnings. Final rate of earnings is the highest total earnings during any consecutive 48 months within the last 10 years of service, divided by 48. Under Tier 1, the pension is increased by 3% of the original amount on January 1 every year after retirement.
Employees hired on or after January 1, 2011, are eligible for Tier 2 benefits. For Tier 2 employees, pension
benefits vest after 10 years of service. Participating employees who retire at age 62 (at reduced benefits) or after age 67 (at full benefits) with 10 years of service are entitled to an annual retirement benefit, payable monthly for life, in an amount equal to 1-2/3% of the final rate of earnings for the first 15 years of service credit, plus 2% for each year of service credit after 15 years to a maximum of 75% of their final rate of earnings. Final rate of earnings is the highest total earnings during any 96 consecutive months within the last 10 years of service, divided by 96. Under Tier 2, the pension is increased on January 1 every year after retirement, upon reaching age 67, by the lesser of 3% of the original pension amount or 1/2 of the increase in the Consumer Price Index of the original pension amount.
Employees Covered by Benefit Terms As of December 31, 2015, the measurement date for the net pension liability, the following employees were
covered by the benefit terms:
Retirees and Beneficiaries Currently Receiving Benefits 65Terminated Employees Entitled to But Not Yet Receiving Benefits 77Active Plan Members 77
219
Contributions As set by statute, the District plan members are required to contribute 4.5% of their annual covered salary. The
statute requires employers to contribute the amount necessary, in addition to member contributions, to finance the retirement coverage of its own employees. The District’s annual contribution rate for calendar 2015 was 12.43%. For the year ended April 30, 2016, the District contributed $446,862 to the plan. The District also contributes for disability benefits, death benefits and supplemental retirement benefits, all of which are pooled at the IMRF level. Contribution rates for disability and death benefits are set by IMRF’s Board of Trustees, while the supplemental retirement benefits rate is set by statute.
HOMEWOOD-FLOSSMOOR PARK DISTRICT, ILLINOIS Notes to the Financial Statements April 30, 2016
49
13. Defined Benefit Pension Plan (Cont.) Investments
The long-term expected rate of return on pension plan investments was determined using a building-block method in which best-estimate ranges of expected future real rates of return (expected returns, net of pension plan investment expense and inflation) are developed for each major asset class. These ranges are combined to produce the long-term expected rate of return by weighting the expected future real rates of return to the target asset allocation percentage and adding expected inflation. The target allocation and best estimates of geometric real rates of return for each major asset class are summarized in the following table:
Long-termPortfolio ExpectedTarget Real Rate
Asset Class Percentage of Return
Domestic Equities 38% 7.39%International Equities 17% 7.59%Fixed Income 27% 3.00%Real Estate 8% 6.00%Alternative Investments 9% 2.75% - 8.15%Cash Equivalents 1% 2.25%
100%
Net Pension Liability
The District’s net pension liability at April 30, 2016, was measured as of December 31, 2015, and the total pension liability used to calculate the net pension liability was determined by an actuarial valuation as of that date. The net pension liability as of April 30, 2016, is $2,829,760.
The following are the methods and assumptions used to determine the net pension liability as of April 30, 2016:
Actuarial Valuation Date December 31, 2015
Measurement Date December 31, 2015
Actuarial Cost Method Entry-age Normal
Assumptions Inflation 2.75%
Salary Increases 3.75% to 14.50%, including inflation
Investment Rate of Return 7.48%
Asset Valuation Method Market Value of Assets

HOMEWOOD-FLOSSMOOR PARK DISTRICT, ILLINOIS Notes to the Financial Statements April 30, 2016
50
13. Defined Benefit Pension Plan (Cont.)
Net Pension Liability (Cont.)
Retirement age is based on Experienced-Based Table of Rates, specific to the type of eligibility condition, last updated for the 2014 valuation according to an experience study from years 2011 to 2013.
For non-disabled retirees, an IMRF specific mortality table was used with fully generational projection scale MP-2014 (base year 2014). The IMRF specific rates were developed from the RP-2014 Blue Collar Health Annuitant Mortality Table with adjustments to match current IMRF experience. For disabled retirees, an IMRF-specific mortality table was used with fully generational projection scale MP-2014 (base year 2014). The IMRF specific rates were developed from the RP-2014 Disabled Retirees Mortality Table, applying the same adjustments that were applied for non-disabled lives. For active members, an IMRF-specific mortality table was used with fully generational projection scale MP-2014 (base year 2014). The IMRF-specific rates were developed from the RP-2014 Employee Mortality Table with adjustments to match current IMRF experience.
Discount Rate
A single discount rate (SDR) of 7.48% was used to measure the total pension liability. The projection of cash flow used to determine the SDR assumed that the plan members’ contributions will be made at the current contribution rate, and that employer contributions will be made at rates equal to the difference between actuarially determined contribution rates and the member rate. The SDR reflects (1) the long-term expected rate of return on pension plan investments (during the period in which the fiduciary net position is projected to be sufficient to pay benefits) and (2) the tax-exempt municipal bond rate based on an index of 20-year general obligation bonds with an average AA credit rating (which is published by the Federal Reserve) as of the measurement date (to the extent that the contributions for use with the long-term expected rate of return are not met). For the purpose of the 2015 valuation, the expected rate of return on plan investments is 7.50%, the municipal bond rate is 3.57% and the resulting SDR is 7.48%, which represents a .01% decrease from the SDR of 7.49% used in the 2014 valuation.
HOMEWOOD-FLOSSMOOR PARK DISTRICT, ILLINOIS Notes to the Financial Statements April 30, 2016
51
13. Defined Benefit Pension Plan (Cont.)
Changes in Net Pension Liability
Total PlanPension Fiduciary Net PensionLiability Net Position Liability
(a) (b) (a)-(b)
Balance, Beginning of Year 21,038,864$ 19,326,267 1,712,597
Changes for the YearService Cost 395,886 395,886 Interest 1,553,450 1,553,450 Differences Between Expected and Actual Experience (94,434) (94,434) Changes in Assumptions 24,833 24,833 Contributions - Employer 428,054 (428,054) Contributions - Employee 155,709 (155,709) Net Investment Income 95,608 (95,608) Benefit Payments, Including Refunds of Employees Contributions (992,975) (992,975) Administrative ExpensesOther (Net Transfer) 83,201 (83,201)
Net Changes 886,760 (230,403) 1,117,163
Balance, End of Year 21,925,624 19,095,864 2,829,760
Discount Rate Sensitivity The following is a sensitivity analysis of the District’s net pension liability to changes in the discount rate. The table below represents the net pension liability of the District calculated using the discount rate of 7.48% as well as what the District’s net pension liability would be if it were calculated using a discount rate that is one percentage point lower (6.48%) or one percentage point higher (8.48%) than the current rate:
Current1% Decrease Discount Rate 1% Increase
(6.48%) (7.48%) (8.48%)
District’s net pension liability 5,522,862$ 2,829,760 615,837

HOMEWOOD-FLOSSMOOR PARK DISTRICT, ILLINOIS Notes to the Financial Statements April 30, 2016
52
13. Defined Benefit Pension Plan (Cont.)
Pension Expense, Deferred Outflows of Resources and Deferred Inflows of Resources Related to IMRF Pension
For the year ended April 30, 2016, the District recognized IMRF pension expense of $523,268 ($267,755 for governmental activities and $255,513 for business-type activities). At April 30, 2016, the District reported deferred outflows of resources and deferred inflows of resources related to pensions from the following sources:
(a) (b)Deferred Deferred
Outflows of Inflows of Resources Resources
Differences Between Expected and Actual Experience $ 69,686 Changes in Assumptions 18,325 Net Differences Between Projected and Actual Earnings on Pension Plan Investments 1,073,311 Pension Contributions Made Subsequent to the Measurement Date 147,119
Total 1,238,755 69,686
2016
Contributions subsequent to the December 31, 2015 measurement date through April 30, 2016, of $147,119, included in deferred outflows of resources, will be reported as a reduction of the net pension liability at April 30, 2017. Other amounts reported as deferred outflows of resources and deferred inflows of resources related to pensions will be recognized in pension expense in future periods as follows:
Year EndingApril 30, Amount
2017 250,087$ 2018 250,087 2019 253,446 2020 268,330
1,021,950
Allocations Pension items have been allocated between governmental activities and business-type activities on the basis of covered payroll.

HOMEWOOD-FLOSSMOOR PARK DISTRICT, ILLINOIS Notes to the Financial Statements April 30, 2016
53
13. Defined Benefit Pension Plan (Cont.)
Pension Plan Fiduciary Net Position Detailed information about the pension plan’s fiduciary net position is available in the separately issued IMRF financial report – Schedule of Changes in Fiduciary Net Position by Employer.
14. Adoption of GASB Statement No. 68 (GASB 68)
The governmental activities, business-type activities, and proprietary funds beginning net position were adjusted due to the implementation of Governmental Accounting Standards Board Statement No. 68, Accounting and Financial Reporting for Pensions – an amendment of GASB Statement No. 27 and Governmental Accounting Standards Board Statement No. 71, Pension Transition for Contributions Made Subsequent to the Measurement Date – an amendment of GASB Statement No. 68, as follows: Governmental Activities Net Position, May 1, 2015, as Previously Reported 13,349,074$
Adjustment at May 1, 2015 for Pension Contributions Subsequent to December 31, 2014 through April 30, 2015 65,547
Record GASB 68 Net Pension Liability at May 1, 2015 (876,330)
Net Position, May 1, 2015, as Restated 12,538,291
Business-type Activities
Artificial Racquet Ice Skating Golf
Club Rink CourseFund Fund Fund Total
Net Position, May 1, 2015, as Previously Reported 2,988,601$ (1,140,556) 9,843,211 11,691,256
Adjustment at May 1, 2015 for Pension ContributionsSubsequent to December 31, 2014 through April 30, 2015 27,707 9,216 25,626 62,549
Record GASB 68 Net Pension Liability at May 1, 2015 (370,433) (123,218) (342,616) (836,267)
Net Position, May 1, 2015, as Restated 2,645,875 (1,254,558) 9,526,221 10,917,538
HOMEWOOD-FLOSSMOOR PARK DISTRICT, ILLINOIS Notes to the Financial Statements April 30, 2016
54
15. Accounting Pronouncements The Government Accounting Standards Board (GASB) has issued the following statements: Statement No. 72, Fair Value Measurement and Application. This Statement was issued to enhance comparability of financial statements among governments by requiring measurement of certain assets and liabilities at fair value using a consistent and more detailed definition of fair value and accepted valuation techniques. This Statement also will enhance fair value application guidance and related disclosures in order to provide information to financial statement users about the impact of fair value measurements on a government’s financial position. The District is required to implement this Statement for the fiscal year ending April 30, 2017. Statement No. 82, Pension Issues – an amendment of GASB Statements No. 67, No. 68, and No. 73, is effective for periods beginning after June 15, 2016, except for certain of its provisions which are effective on or after June 15, 2017. GASB 82 addresses three issues: presentation of payroll-related measures in RSI, selection of assumptions and classification of employer-paid member contributions.

REQUIRED SUPPLEMENTARY INFORMATION (Unaudited)

55
Exhibit B-1
Required Supplementary InformationSchedule of Changes in the District’s Net Pension Liability and Related Ratios
Illinois Municipal Retirement Fund - Regular Plan
Calendar Year Ended December 31, 2015
Total Pension LiabilityService Cost 395,886$ Interest 1,553,450 Changes in Benefit TermsDifferences Between Expected and Actual Experience (94,434) Change of Assumptions 24,833 Benefit Payments, Including Refunds of Member Contributions (992,975)
Net Change in Total Pension Liability 886,760 Total Pension Liability - Beginning 21,038,864
Total Pension Liability - Ending 21,925,624
Plan Fiduciary Net PositionContributions - District 428,054$ Contributions - Members 155,709 Net Investment Income 95,608 Benefit Payments, Including Refunds of Member Contributions (992,975) Other (Net Transfer) 83,201
Net Change in Plan Fiduciary Net Position (230,403) Plan Net Position - Beginning 19,326,267
Plan Net Position - Ending 19,095,864
District’s Net Pension Liability 2,829,760$
Plan Fiduciary Net Position as a Percentage of the Total Pension Liability 87.09%
Covered Employee Payroll 3,443,719$
District’s Net Pension Liability as a Percentage of Covered-Employee Payroll 82.17%
April 30, 2016
GASB Statement No. 68 requires the presentation of ten fiscal years of data; however, the fiscal years completed prior to theadoption of this pronouncement are not required to be presented in this schedule. The pronouncement was adopted in fiscalyear 2016. Information in this schedule has been determined as of the District’s measurement date (December 31) of the netpension liability.
HOMEWOOD-FLOSSMOOR PARK DISTRICT, ILLINOIS

56
Exhibit B-2
Illinois Municipal Retirement Fund - Regular Plan
ActualContributions
as a PercentageActuarially Contribution Covered of Covered
Year Determined Actual Excess/ Employee EmployeeEnded Contribution Contributions (Deficiency) Payroll Payroll
4/30/2016 446,862$ 446,862 - 3,610,460 12.38%
Notes to the Required Supplementary Information
Valuation date Actuarially determined contribution rates are calculated as of December 31 each year, which are 12 months prior to the beginning of the fiscal year in which contributions are reported.
Methods and Assumptions Used to Determine 2015 Contribution Rates
Actuarial Cost MethodAmortization MethodRemaining Amortization PeriodAsset Valuation MethodWage GrowthPrice Inflation 3.00% approximate; no explicit price inflation assumption is used in this
valuation.Salary IncreasesInvestment Rate of ReturnRetirement age Experience-based table of rates that are specific to the type of eligibility
condition; last updated for the 2011 valuation pursuant to an experience study of the period 2008 to 2010.
Mortality RP-2000 Combined Healthy Mortality Table, adjusted for mortalityimprovements to 2020 using projection scale AA. For men, 120%of the table rates were used. For women, 92% of the table rates were used. For disabled lives, the mortality rates are therates applicable to non-disabled lives set forward 10 years.
Other There were no benefit changes during the year.
Required Supplementary InformationSchedule of District Contributions
April 30, 2016
HOMEWOOD-FLOSSMOOR PARK DISTRICT, ILLINOIS
Aggregate Entry Age Normal
7.50%
Level Percentage of Payroll, Closed28-Years Closed Period5-Year Smoothed Market; 20% Corridor4.00%
4.40% to 16.00%, Including Inflation
Information above based on valuation assumptions used in the December 31, 2013 actuarial valuation; note two year lag betweenvaluation and rate setting.
GASB Statement No. 68 requires the presentation of ten fiscal years of data; however, the fiscal years completed prior to the adoption ofthis pronouncement are not required to be presented in this schedule. The pronouncement was adopted in fiscal year 2016. Informationin this schedule has been determined as of the District’s most recent fiscal year-end.

COMBINING AND INDIVIDUAL FUND FINANCIAL STATEMENTS AND SCHEDULES

GOVERNMENTAL FUND TYPES

NONMAJOR GOVERNMENTAL FUNDS

57
Exhibit C-1HOMEWOOD-FLOSSMOOR PARK DISTRICT, ILLINOIS
Nonmajor Governmental Funds
Combining Balance Sheet
Illinois SocialMunicipal Security / Special Total
Audit Retirement Medicare Recreation SpecialFund Fund Fund Fund Revenue
ASSETS
Cash and Investments 13,340$ 956,784 522,046 280,018 1,772,188 Receivables
Property Taxes, Net 4,808 191,868 127,502 81,309 405,487
Total Assets 18,148 1,148,652 649,548 361,327 2,177,675
LIABILITIES, DEFERRED INFLOWSOF RESOURCES AND FUND BALANCES
LiabilitiesAccounts Payable 51$ 759 508 37 1,355 Accrued Liabilities 1,650 3,854 5,504
Total Liabilities 51 2,409 4,362 37 6,859
Deferred Inflows of ResourcesUnavailable Revenue - Property Taxes 4,715 188,329 125,145 79,594 397,783
Fund BalancesNonspendable
Permanent FundRestricted for
Employee Benefits 957,914 520,041 1,477,955 Assigned for Special Revenue Purposes 13,382 281,696 295,078 Assigned for Capital Projects
Total Fund Balances 13,382 957,914 520,041 281,696 1,773,033
Total Liabilities, Deferred Inflows of Resources and Fund Balances 18,148 1,148,652 649,548 361,327 2,177,675
Special Revenue
April 30, 2016
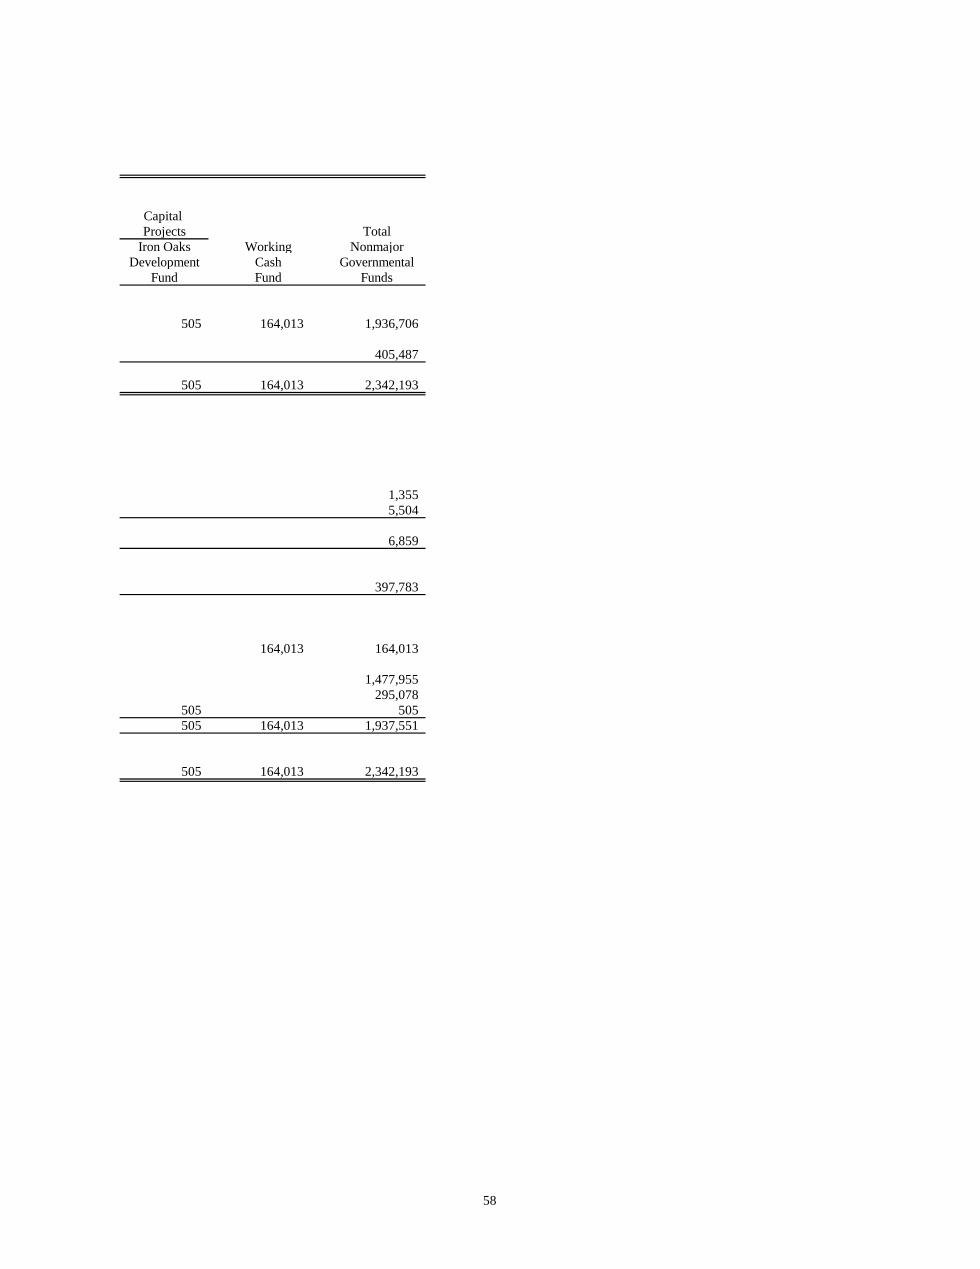
58
Capital Projects Total
Iron Oaks Working NonmajorDevelopment Cash Governmental
Fund Fund Funds
505 164,013 1,936,706
405,487
505 164,013 2,342,193
1,355 5,504
6,859
397,783
164,013 164,013
1,477,955 295,078
505 505 505 164,013 1,937,551
505 164,013 2,342,193
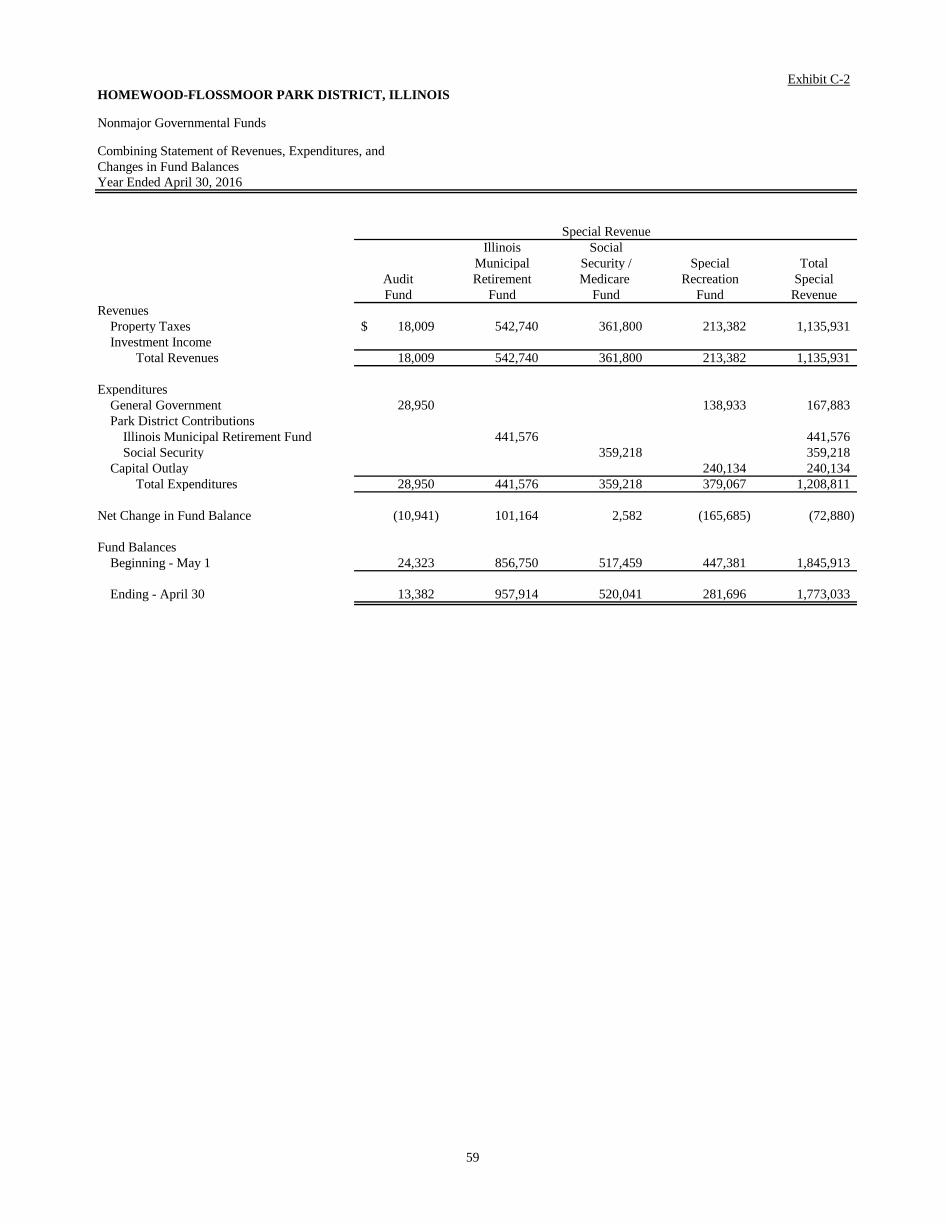
59
Exhibit C-2HOMEWOOD-FLOSSMOOR PARK DISTRICT, ILLINOIS
Nonmajor Governmental Funds
Combining Statement of Revenues, Expenditures, and Changes in Fund BalancesYear Ended April 30, 2016
Illinois SocialMunicipal Security / Special Total
Audit Retirement Medicare Recreation SpecialFund Fund Fund Fund Revenue
RevenuesProperty Taxes 18,009$ 542,740 361,800 213,382 1,135,931 Investment Income
Total Revenues 18,009 542,740 361,800 213,382 1,135,931
ExpendituresGeneral Government 28,950 138,933 167,883 Park District Contributions
Illinois Municipal Retirement Fund 441,576 441,576 Social Security 359,218 359,218
Capital Outlay 240,134 240,134 Total Expenditures 28,950 441,576 359,218 379,067 1,208,811
Net Change in Fund Balance (10,941) 101,164 2,582 (165,685) (72,880)
Fund BalancesBeginning - May 1 24,323 856,750 517,459 447,381 1,845,913
Ending - April 30 13,382 957,914 520,041 281,696 1,773,033
Special Revenue
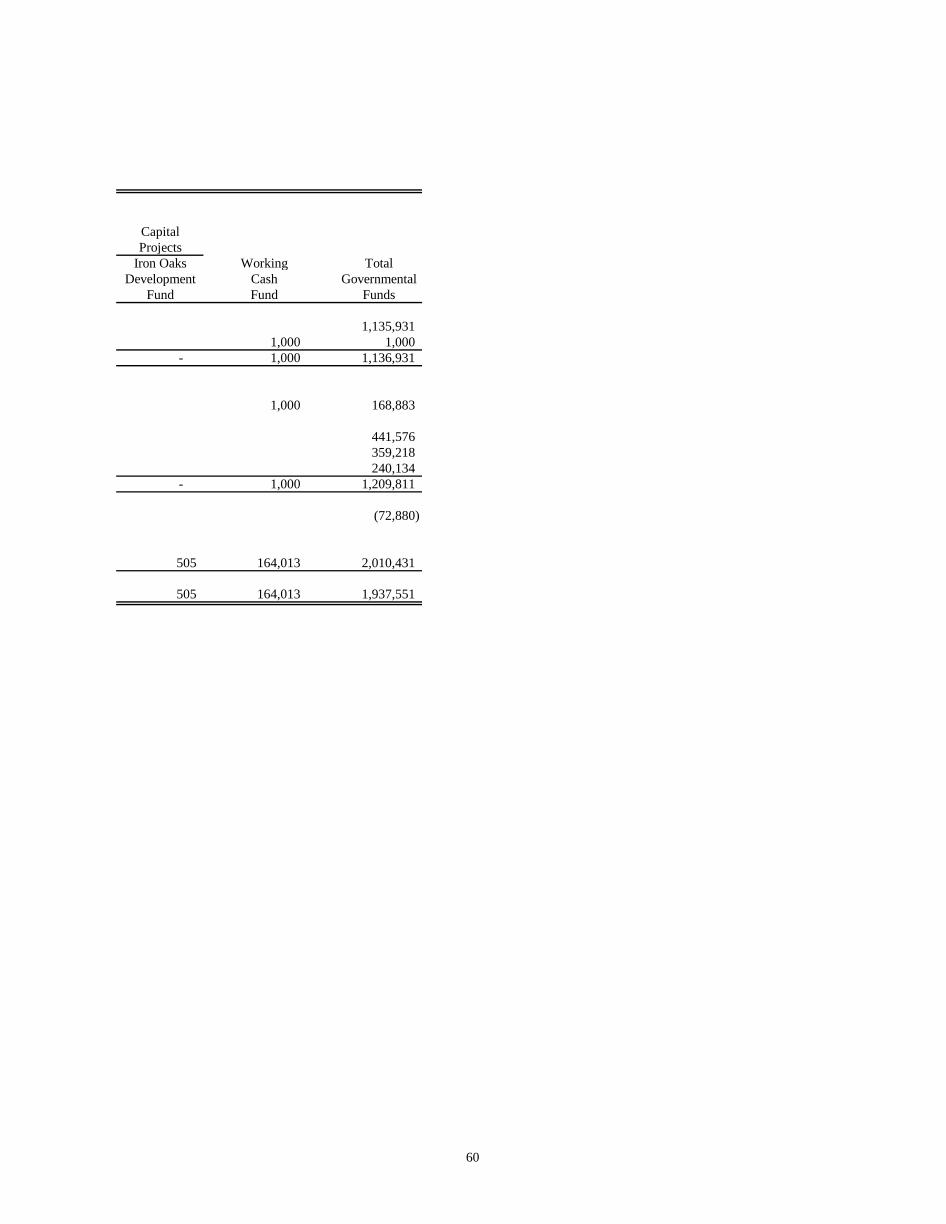
60
CapitalProjects
Iron Oaks Working TotalDevelopment Cash Governmental
Fund Fund Funds
1,135,931 1,000 1,000
- 1,000 1,136,931
1,000 168,883
441,576 359,218
240,134 - 1,000 1,209,811
(72,880)
505 164,013 2,010,431
505 164,013 1,937,551
GENERAL FUND The General Fund is established to account for resources devoted to finance the services traditionally
associated with local government. Included in these services are general administrative services of the District. Any other activity for which a special fund has not been created is accounted for in the General Fund.

61
Exhibit D-1HOMEWOOD-FLOSSMOOR PARK DISTRICT, ILLINOIS
General Fund
Schedule of Revenues - Budget and ActualYear Ended April 30, 2016(With Comparative Actual Amounts for the Year Ended April 30, 2015)
Original/Final 2015 Budget Actual Actual
Property TaxesGeneral Corporate 1,945,026$ 1,868,556 1,816,050Liability Insurance 321,691 332,066 300,593Worker’s Compensation 86,433 85,609 80,818
2,353,150 2,286,231 2,197,461
Replacement Taxes 72,977 59,223 73,717
Investment Income 3,000 14,904 2,530
Interfund Services 31,000 31,000 16,000
Miscellaneous 18,250 29,577 18,042
Total Revenues 2,478,377 2,420,935 2,307,750
2016
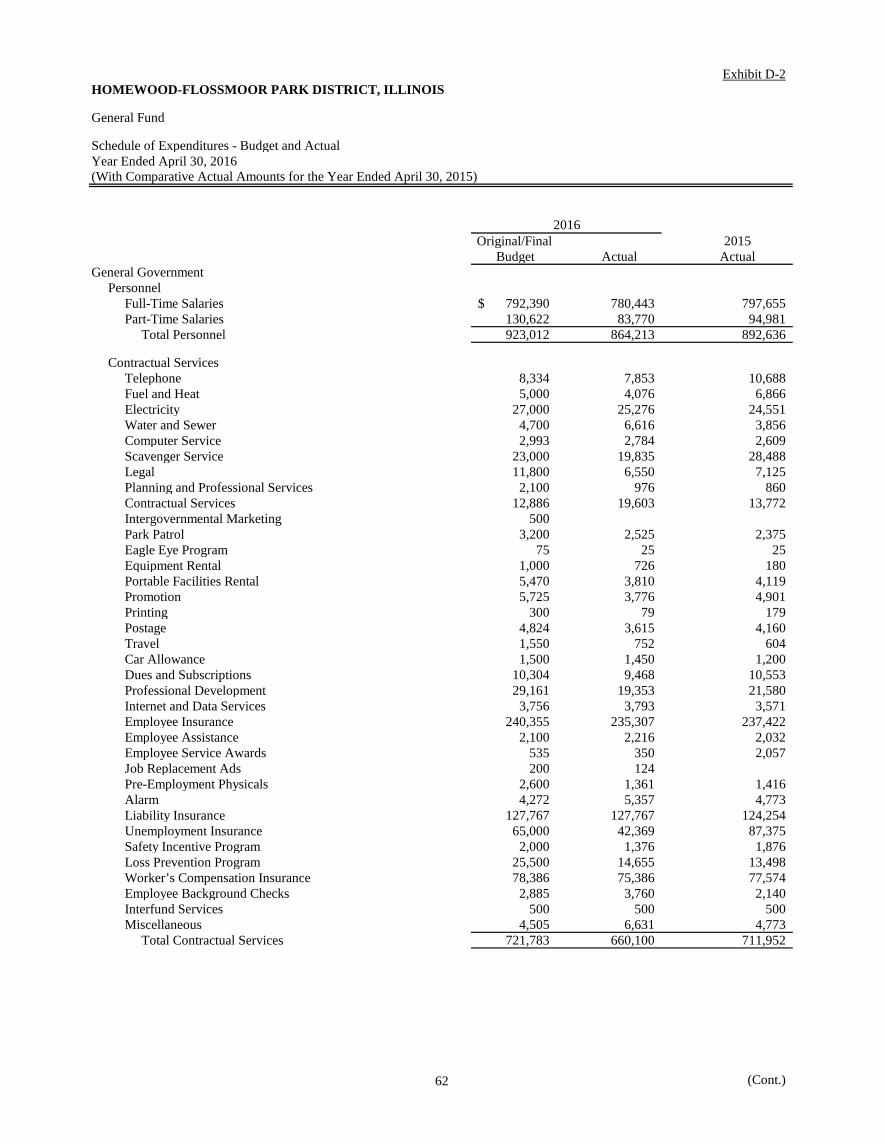
62
Exhibit D-2HOMEWOOD-FLOSSMOOR PARK DISTRICT, ILLINOIS
General Fund
Schedule of Expenditures - Budget and ActualYear Ended April 30, 2016(With Comparative Actual Amounts for the Year Ended April 30, 2015)
Original/Final 2015 Budget Actual Actual
General GovernmentPersonnel
Full-Time Salaries 792,390$ 780,443 797,655 Part-Time Salaries 130,622 83,770 94,981
Total Personnel 923,012 864,213 892,636
Contractual ServicesTelephone 8,334 7,853 10,688 Fuel and Heat 5,000 4,076 6,866 Electricity 27,000 25,276 24,551 Water and Sewer 4,700 6,616 3,856 Computer Service 2,993 2,784 2,609 Scavenger Service 23,000 19,835 28,488 Legal 11,800 6,550 7,125 Planning and Professional Services 2,100 976 860 Contractual Services 12,886 19,603 13,772 Intergovernmental Marketing 500 Park Patrol 3,200 2,525 2,375 Eagle Eye Program 75 25 25 Equipment Rental 1,000 726 180 Portable Facilities Rental 5,470 3,810 4,119 Promotion 5,725 3,776 4,901 Printing 300 79 179 Postage 4,824 3,615 4,160 Travel 1,550 752 604 Car Allowance 1,500 1,450 1,200 Dues and Subscriptions 10,304 9,468 10,553 Professional Development 29,161 19,353 21,580 Internet and Data Services 3,756 3,793 3,571 Employee Insurance 240,355 235,307 237,422 Employee Assistance 2,100 2,216 2,032 Employee Service Awards 535 350 2,057 Job Replacement Ads 200 124 Pre-Employment Physicals 2,600 1,361 1,416 Alarm 4,272 5,357 4,773 Liability Insurance 127,767 127,767 124,254 Unemployment Insurance 65,000 42,369 87,375 Safety Incentive Program 2,000 1,376 1,876 Loss Prevention Program 25,500 14,655 13,498 Worker’s Compensation Insurance 78,386 75,386 77,574 Employee Background Checks 2,885 3,760 2,140 Interfund Services 500 500 500 Miscellaneous 4,505 6,631 4,773
Total Contractual Services 721,783 660,100 711,952
(Cont.)
2016

63
Exhibit D-2HOMEWOOD-FLOSSMOOR PARK DISTRICT, ILLINOIS
General Fund
Schedule of Expenditures - Budget and Actual (Cont.)Year Ended April 30, 2016(With Comparative Actual Amounts for the Year Ended April 30, 2015)
Original/Final 2015 Budget Actual Actual
General Government (Cont.)Supplies and Materials
Office Supplies 6,200 6,596 6,744 Computer Supplies 1,000 948 1,002 Training Supplies 200 63 Maintenance 30,000 25,783 44,822 Uniforms 3,975 4,195 4,306 Light Bulb Supplies 2,500 2,952 5,120 Safety Supplies 350 353 96 Ice Melt 13,000 12,810 1,525 Chemicals 1,200 975 Gas and Oil 44,000 30,700 53,153 Signs 2,500 693 27 Park Pride Supplies 2,900 3,131 2,738 Splashpad Supplies 9,175 14,157 3,122
Total Supplies and Materials 117,000 103,293 122,718
Repairs and MaintenancePlumbing 1,800 11,321 598 Electrical 4,500 6,890 7,334 Grounds 11,000 16,285 16,418 Building 3,500 10,142 1,581 Vehicle Repair 20,000 22,114 18,888 Equipment Repair 1,500 807 787 Computer Equipment 600 383 40 Office Equipment 2,280 1,930 1,990 Playground Equipment and Shelters 8,500 12,740 9,852 Pumps and Valves 1,000 2,133 894 HVAC Repairs 1,800 4,312 1,463 Tractor Repair 8,000 15,831 10,667 Small Tools and Minor Equipment 1,300 1,328 1,708 Radio 1,200 45 1,415 Irrigation Repair 2,000 3,676 819 Fountains 750 200 5,226 Waterline Repairs 1,000 1,531 Traffic Signal Repairs 2,800 3,503 1,401
Total Repairs and Maintenance 73,530 115,171 81,081
Total General Government 1,835,325 1,742,777 1,808,387
Capital OutlayPark Improvements 6,000 5,596 16,293
Debt ServicePrincipal 321,298 265,000 260,000 Interest 379,480 406,401 364,252
Total Debt Service 700,778 671,401 624,252
Total Expenditures 2,542,103 2,419,774 2,448,932
2016

SPECIAL REVENUE FUNDS Special Revenue Funds are established to account for the proceeds of specific revenue sources (other
than those for debt service or major capital projects) that are legally restricted to expenditures for specified purposes.
Recreation Fund (a Major Fund) – accounts for the specific levy and fees collected to fund
recreational programs and facilities and outdoor swimming pool of the District. Museum Fund (a Major Fund) - accounts for the specific levy and fees collected to fund payments for
operation of the Irons Oaks Environmental Learning Center of the District. Audit Fund - accounts for the specific levy of taxes to fund payments of audit fees of the District. Illinois Municipal Retirement Fund - accounts for the specific levy of taxes to fund payments to the
state-controlled Pension Fund, and Social Security/Medicare Taxes. Social Security / Medicare Fund - accounts for the specific levy of taxes to fund payments for Social
Security and Medicare taxes. Special Recreation Fund - accounts for the specific levy of taxes to fund payments for special
recreation of the District.

64
Exhibit E-1HOMEWOOD-FLOSSMOOR PARK DISTRICT, ILLINOIS
Recreation Fund
Schedule of Revenues - Swimming Pool - Budget and ActualYear Ended April 30, 2016(With Comparative Actual Amounts for the Year Ended April 30, 2015)
Original/Final 2015Budget Actual Actual
Swimming PoolProgram Fees 7,390$ 6,131 6,582Swimming/Diving Lessons 45,492 30,306 33,675Pool Passes 130,850 89,197 95,936Pool Rental 2,000 2,800 2,750 Resident Identification Cards 955Daily Fees 41,800 32,112 27,159Concessions/Vending 15,771 14,658 13,204
Total Swimming Pool 243,303 175,204 180,261
2016
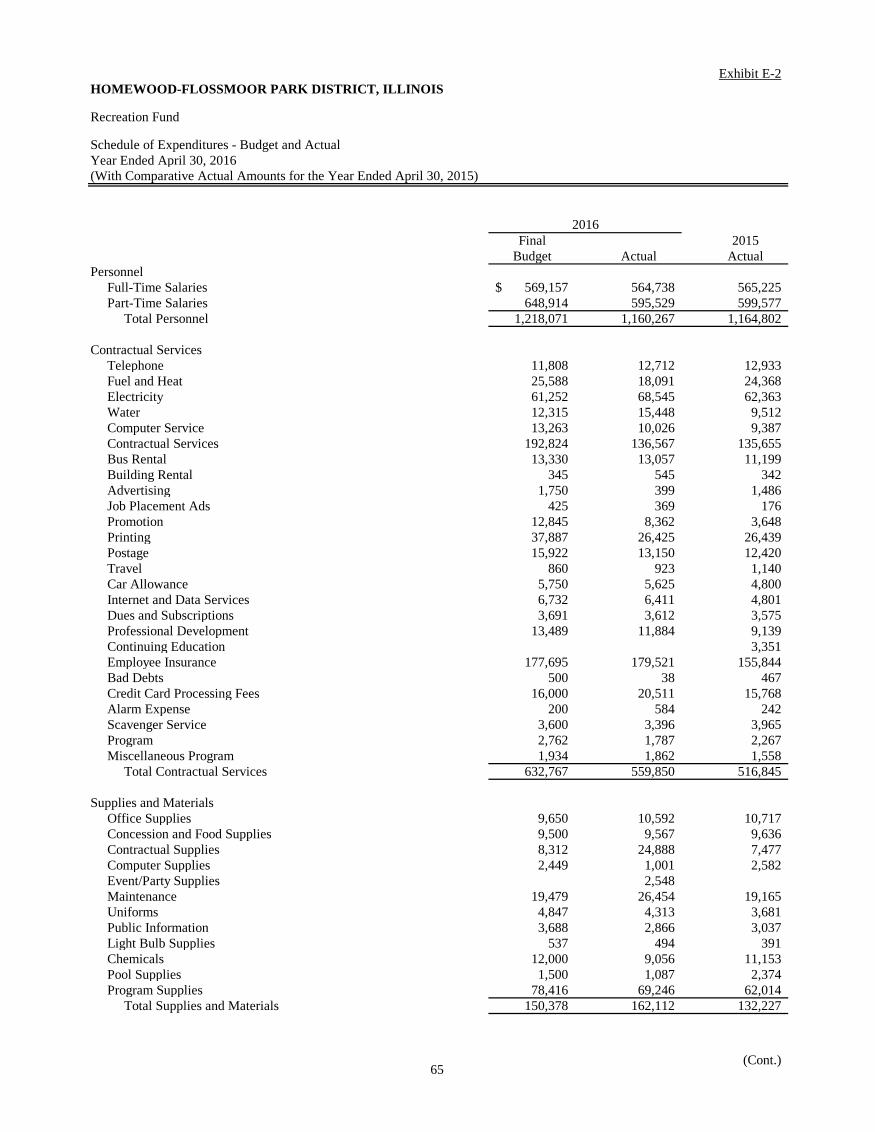
65
Exhibit E-2HOMEWOOD-FLOSSMOOR PARK DISTRICT, ILLINOIS
Recreation Fund
Schedule of Expenditures - Budget and ActualYear Ended April 30, 2016(With Comparative Actual Amounts for the Year Ended April 30, 2015)
Final 2015Budget Actual Actual
PersonnelFull-Time Salaries 569,157$ 564,738 565,225 Part-Time Salaries 648,914 595,529 599,577
Total Personnel 1,218,071 1,160,267 1,164,802
Contractual ServicesTelephone 11,808 12,712 12,933 Fuel and Heat 25,588 18,091 24,368 Electricity 61,252 68,545 62,363 Water 12,315 15,448 9,512 Computer Service 13,263 10,026 9,387 Contractual Services 192,824 136,567 135,655 Bus Rental 13,330 13,057 11,199 Building Rental 345 545 342 Advertising 1,750 399 1,486 Job Placement Ads 425 369 176 Promotion 12,845 8,362 3,648 Printing 37,887 26,425 26,439 Postage 15,922 13,150 12,420 Travel 860 923 1,140 Car Allowance 5,750 5,625 4,800 Internet and Data Services 6,732 6,411 4,801 Dues and Subscriptions 3,691 3,612 3,575 Professional Development 13,489 11,884 9,139 Continuing Education 3,351 Employee Insurance 177,695 179,521 155,844 Bad Debts 500 38 467 Credit Card Processing Fees 16,000 20,511 15,768 Alarm Expense 200 584 242 Scavenger Service 3,600 3,396 3,965 Program 2,762 1,787 2,267 Miscellaneous Program 1,934 1,862 1,558
Total Contractual Services 632,767 559,850 516,845
Supplies and MaterialsOffice Supplies 9,650 10,592 10,717 Concession and Food Supplies 9,500 9,567 9,636 Contractual Supplies 8,312 24,888 7,477 Computer Supplies 2,449 1,001 2,582 Event/Party Supplies 2,548 Maintenance 19,479 26,454 19,165 Uniforms 4,847 4,313 3,681 Public Information 3,688 2,866 3,037 Light Bulb Supplies 537 494 391 Chemicals 12,000 9,056 11,153 Pool Supplies 1,500 1,087 2,374 Program Supplies 78,416 69,246 62,014
Total Supplies and Materials 150,378 162,112 132,227
(Cont.)
2016
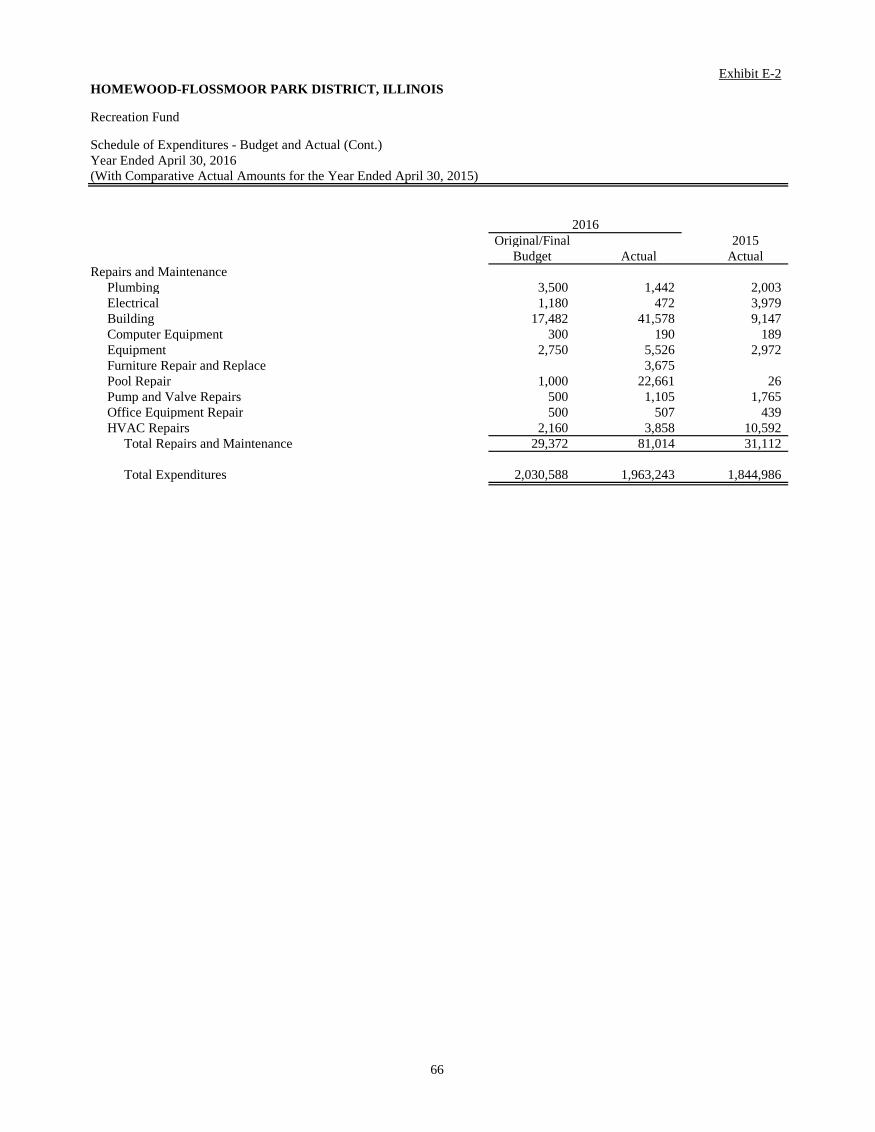
66
Exhibit E-2HOMEWOOD-FLOSSMOOR PARK DISTRICT, ILLINOIS
Recreation Fund
Schedule of Expenditures - Budget and Actual (Cont.)Year Ended April 30, 2016(With Comparative Actual Amounts for the Year Ended April 30, 2015)
Original/Final 2015Budget Actual Actual
Repairs and MaintenancePlumbing 3,500 1,442 2,003 Electrical 1,180 472 3,979 Building 17,482 41,578 9,147 Computer Equipment 300 190 189 Equipment 2,750 5,526 2,972 Furniture Repair and Replace 3,675 Pool Repair 1,000 22,661 26 Pump and Valve Repairs 500 1,105 1,765 Office Equipment Repair 500 507 439 HVAC Repairs 2,160 3,858 10,592
Total Repairs and Maintenance 29,372 81,014 31,112
Total Expenditures 2,030,588 1,963,243 1,844,986
2016
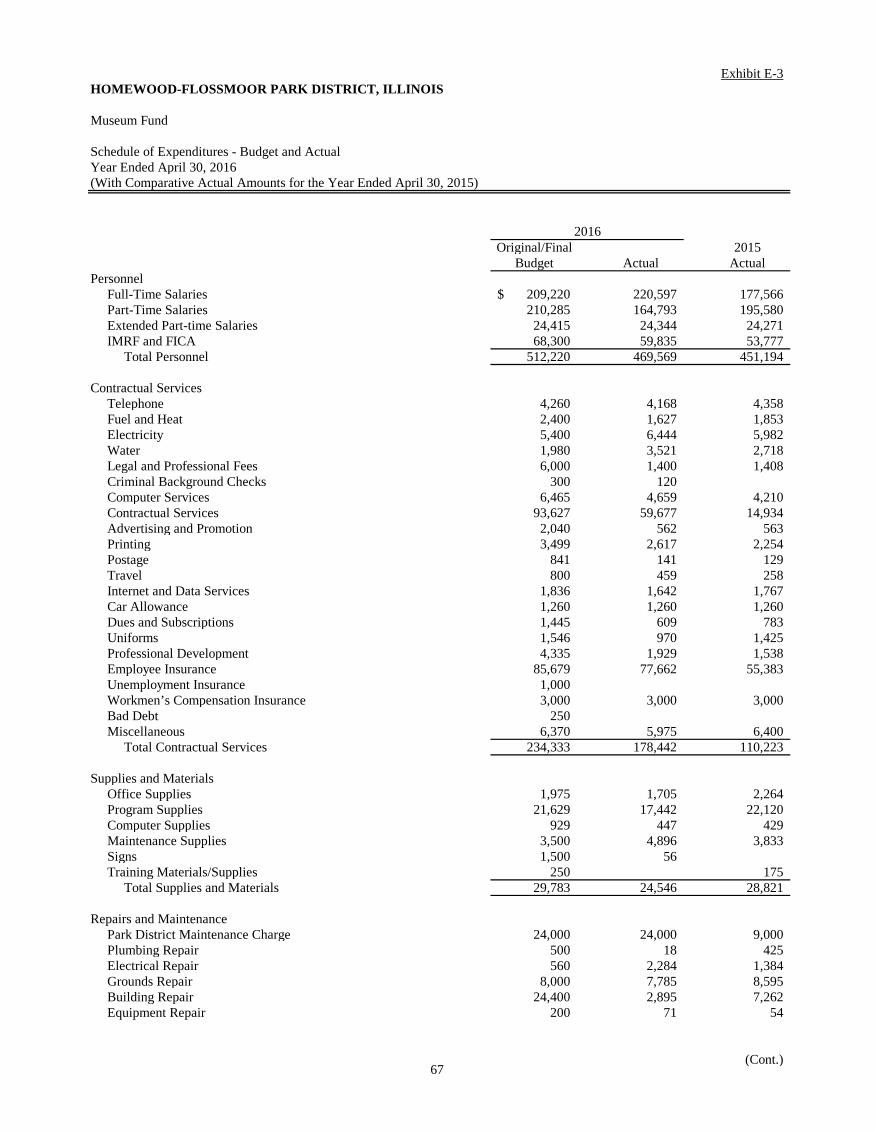
67
Exhibit E-3HOMEWOOD-FLOSSMOOR PARK DISTRICT, ILLINOIS
Museum Fund
Schedule of Expenditures - Budget and ActualYear Ended April 30, 2016(With Comparative Actual Amounts for the Year Ended April 30, 2015)
Original/Final 2015Budget Actual Actual
PersonnelFull-Time Salaries 209,220$ 220,597 177,566 Part-Time Salaries 210,285 164,793 195,580 Extended Part-time Salaries 24,415 24,344 24,271 IMRF and FICA 68,300 59,835 53,777
Total Personnel 512,220 469,569 451,194
Contractual ServicesTelephone 4,260 4,168 4,358 Fuel and Heat 2,400 1,627 1,853 Electricity 5,400 6,444 5,982 Water 1,980 3,521 2,718 Legal and Professional Fees 6,000 1,400 1,408 Criminal Background Checks 300 120 Computer Services 6,465 4,659 4,210 Contractual Services 93,627 59,677 14,934Advertising and Promotion 2,040 562 563 Printing 3,499 2,617 2,254 Postage 841 141 129 Travel 800 459 258 Internet and Data Services 1,836 1,642 1,767 Car Allowance 1,260 1,260 1,260 Dues and Subscriptions 1,445 609 783 Uniforms 1,546 970 1,425 Professional Development 4,335 1,929 1,538 Employee Insurance 85,679 77,662 55,383 Unemployment Insurance 1,000 Workmen’s Compensation Insurance 3,000 3,000 3,000 Bad Debt 250 Miscellaneous 6,370 5,975 6,400
Total Contractual Services 234,333 178,442 110,223
Supplies and MaterialsOffice Supplies 1,975 1,705 2,264 Program Supplies 21,629 17,442 22,120 Computer Supplies 929 447 429 Maintenance Supplies 3,500 4,896 3,833 Signs 1,500 56 Training Materials/Supplies 250 175
Total Supplies and Materials 29,783 24,546 28,821
Repairs and MaintenancePark District Maintenance Charge 24,000 24,000 9,000 Plumbing Repair 500 18 425 Electrical Repair 560 2,284 1,384 Grounds Repair 8,000 7,785 8,595 Building Repair 24,400 2,895 7,262 Equipment Repair 200 71 54
(Cont.)
2016

68
Exhibit E-3HOMEWOOD-FLOSSMOOR PARK DISTRICT, ILLINOIS
Museum Fund
Schedule of Expenditures - Budget and Actual (Cont.)Year Ended April 30, 2016(With Comparative Actual Amounts for the Year Ended April 30, 2015)
Original/Final 2015Budget Actual Actual
Repairs and Maintenance (Cont.)Furniture Repair and Replacement 200 Office Equipment Repair 941 659 642
Total Repairs and Maintenance 58,601 37,912 27,362
Capital OutlayAsphalt Parking Lots 170,000 Building Improvements 271,100 110,472 92,486 Furniture and Equipment 10,000
Total Capital Outlay 451,100 110,472 92,486
Debt ServicePrincipal 15,243 Interest 708
Total Debt Service - - 15,951
Total Expenditures 1,286,037 820,941 726,037
2016
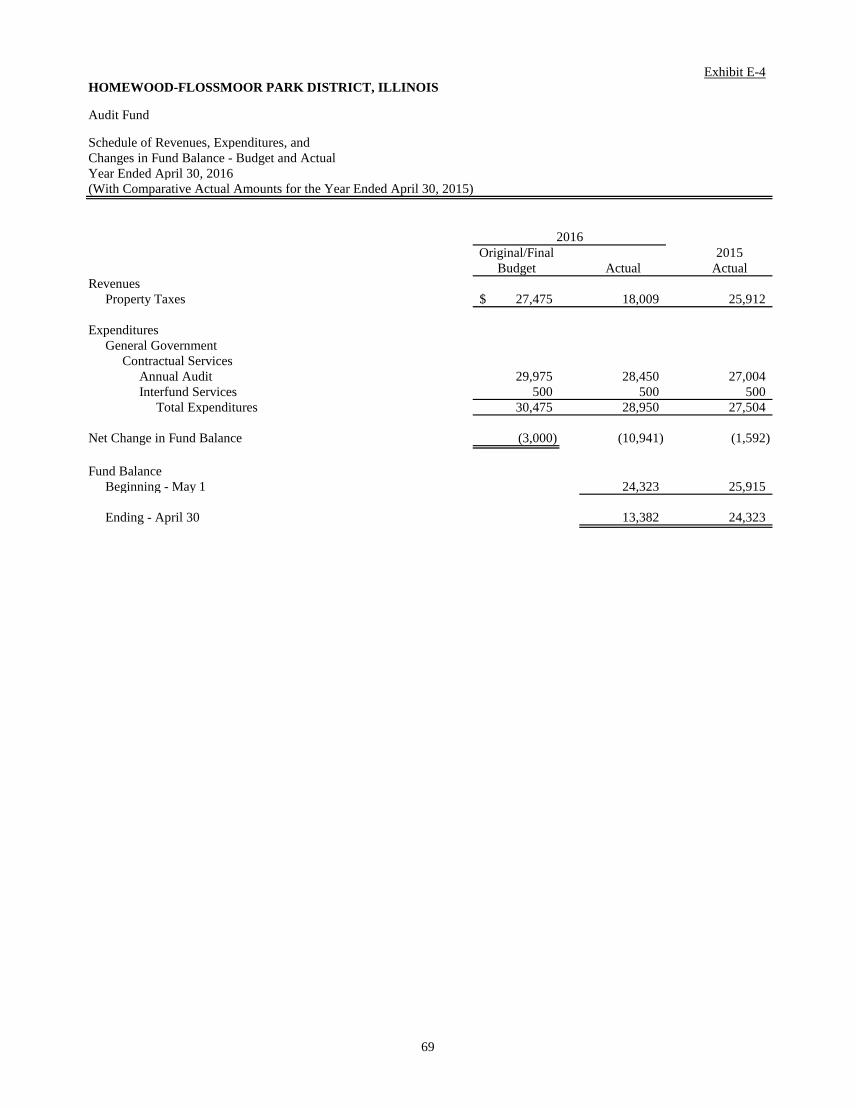
69
Exhibit E-4HOMEWOOD-FLOSSMOOR PARK DISTRICT, ILLINOIS
Audit Fund
Schedule of Revenues, Expenditures, andChanges in Fund Balance - Budget and ActualYear Ended April 30, 2016(With Comparative Actual Amounts for the Year Ended April 30, 2015)
Original/Final 2015Budget Actual Actual
RevenuesProperty Taxes 27,475$ 18,009 25,912
ExpendituresGeneral Government
Contractual ServicesAnnual Audit 29,975 28,450 27,004Interfund Services 500 500 500
Total Expenditures 30,475 28,950 27,504
Net Change in Fund Balance (3,000) (10,941) (1,592)
Fund BalanceBeginning - May 1 24,323 25,915
Ending - April 30 13,382 24,323
2016

70
Exhibit E-5HOMEWOOD-FLOSSMOOR PARK DISTRICT, ILLINOIS
Illinois Municipal Retirement Fund
Schedule of Revenues, Expenditures, andChanges in Fund Balance - Budget and ActualYear Ended April 30, 2016(With Comparative Actual Amounts for the Year Ended April 30, 2015)
Original/Final 2015Budget Actual Actual
RevenuesProperty Taxes 688,601$ 542,740 645,279
ExpendituresRetirement Contributions
Illinois Municipal Retirement Fund 424,723 441,576 469,084
Net Change in Fund Balance 263,878 101,164 176,195
Fund BalanceBeginning - May 1 856,750 680,555
Ending - April 30 957,914 856,750
2016

71
Exhibit E-6HOMEWOOD-FLOSSMOOR PARK DISTRICT, ILLINOIS
Social Security / Medicare Fund
Schedule of Revenues, Expenditures, andChanges in Fund Balance - Budget and ActualYear Ended April 30, 2016(With Comparative Actual Amounts for the Year Ended April 30, 2015)
Original/Final 2015Budget Actual Actual
RevenuesProperty Taxes 459,067$ 361,800 430,005
ExpendituresRetirement Contributions
Social Security/Medicare Taxes 390,740 359,218 366,249
Net Change in Fund Balance 68,327 2,582 63,756
Fund BalanceBeginning - May 1 517,459 453,703
Ending - April 30 520,041 517,459
2016
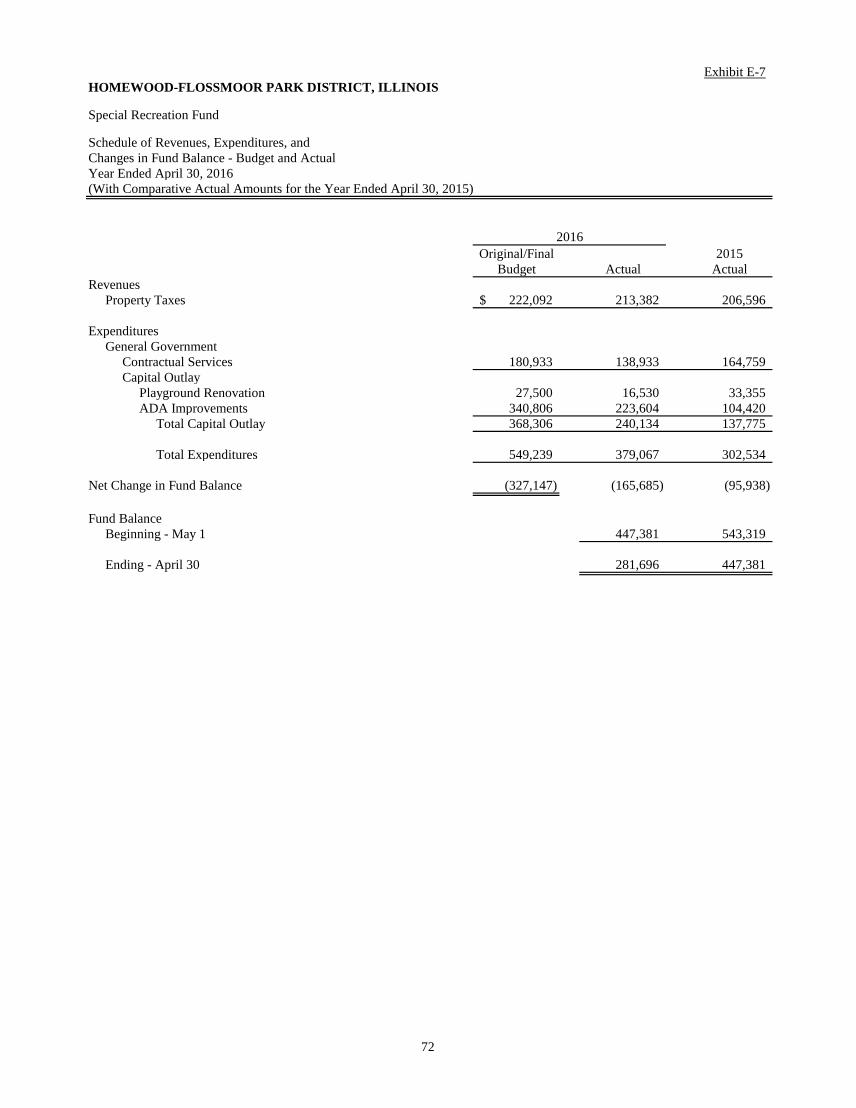
72
Exhibit E-7HOMEWOOD-FLOSSMOOR PARK DISTRICT, ILLINOIS
Special Recreation Fund
Schedule of Revenues, Expenditures, andChanges in Fund Balance - Budget and ActualYear Ended April 30, 2016(With Comparative Actual Amounts for the Year Ended April 30, 2015)
Original/Final 2015Budget Actual Actual
RevenuesProperty Taxes 222,092$ 213,382 206,596
ExpendituresGeneral Government
Contractual Services 180,933 138,933 164,759 Capital Outlay
Playground Renovation 27,500 16,530 33,355 ADA Improvements 340,806 223,604 104,420
Total Capital Outlay 368,306 240,134 137,775
Total Expenditures 549,239 379,067 302,534
Net Change in Fund Balance (327,147) (165,685) (95,938)
Fund BalanceBeginning - May 1 447,381 543,319
Ending - April 30 281,696 447,381
2016

73
Exhibit E-8HOMEWOOD-FLOSSMOOR PARK DISTRICT, ILLINOIS
Special Recreation Fund
Schedule of Expenditures - Budget and ActualYear Ended April 30, 2016(With Comparative Actual Amounts for the Year Ended April 30, 2015)
Original/Final 2015Budget Actual Actual
Contractual ServicesSSSRA Assessments 138,933$ 138,933 148,766 Planning and Professional Services 42,000 15,993
Total Contractual Services 180,933 138,933 164,759
Capital OutlayADA Improvements 340,806 223,604 104,420 Playground Equipment 27,500 16,530 33,355
Total Capital Outlay 368,306 240,134 137,775
Total Expenditures 549,239 379,067 302,534
2016

DEBT SERVICE FUND The Debt Service Fund (a Major Fund) is established to account for the accumulation of resources for,
and the payment of, general long-term debt principal and interest (other than those financed by Proprietary Funds).
The District’s Debt Service Fund is legal in nature. It is established in accordance with statutes and/or
bond indentures. Inclusion of Debt Service Fund provisions in the indenture indicates to the buyer that the timing of the acquisition of assets with which to satisfy maturing debt has been formalized and that an adequate administrative approach to servicing the debt will be followed.
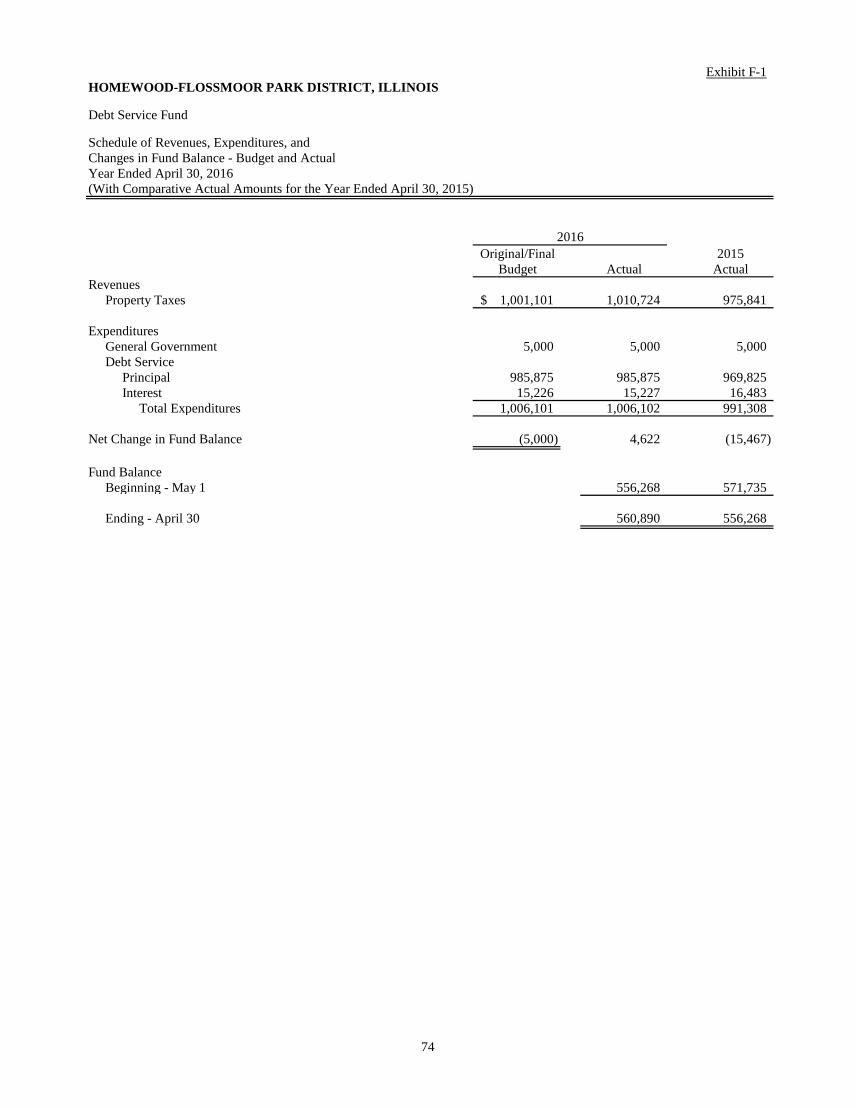
74
Exhibit F-1HOMEWOOD-FLOSSMOOR PARK DISTRICT, ILLINOIS
Debt Service Fund
Schedule of Revenues, Expenditures, andChanges in Fund Balance - Budget and ActualYear Ended April 30, 2016(With Comparative Actual Amounts for the Year Ended April 30, 2015)
Original/Final 2015Budget Actual Actual
RevenuesProperty Taxes 1,001,101$ 1,010,724 975,841
ExpendituresGeneral Government 5,000 5,000 5,000 Debt Service
Principal 985,875 985,875 969,825 Interest 15,226 15,227 16,483
Total Expenditures 1,006,101 1,006,102 991,308
Net Change in Fund Balance (5,000) 4,622 (15,467)
Fund BalanceBeginning - May 1 556,268 571,735
Ending - April 30 560,890 556,268
2016
CAPITAL PROJECTS FUNDS The Capital Projects Funds are established to account for financial resources to be used for the
acquisition or construction of major capital facilities (other than those financed by Proprietary Funds.)
Improvement Fund (a Major Fund) - accounts for the other major capital transactions of the District. Iron Oaks Development Fund - accounts for the contributions to fund capital projects for Iron Oaks.
There was no activity in this Fund during fiscal 2016 or 2015.

75
Exhibit G-1HOMEWOOD-FLOSSMOOR PARK DISTRICT, ILLINOIS
Improvement Fund
Schedule of Revenues, Expenditures, andChanges in Fund Balance - Budget and ActualYear Ended April 30, 2016(With Comparative Actual Amounts for the Year Ended April 30, 2015)
Original/Final 2015Budget Actual Actual
ExpendituresGeneral Government
Contractual Services $ 17,500 Repairs and Maintenance 193,841 182,900 180,660
Capital Outlay 3,078,594 1,947,674 1,585,025 Debt Service
Interest 171,197 171,197 81,090 Issuance Costs 17,500 19,062 68,193
Total Expenditures 3,461,132 2,320,833 1,932,468
Excess (Deficiency) of Revenuesover Expenditures (3,461,132) (2,320,833) (1,932,468)
Other Financing SourcesIssuance of Long-Term Debt 900,000 900,000 4,385,000Premium (Discount) on Issuance of Long-Term Debt 318,594
Total Other Financing Sources 900,000 900,000 4,703,594
Net Change in Fund Balance (2,561,132) (1,420,833) 2,771,126
Fund BalanceBeginning - May 1 6,971,472 4,200,346
Ending - April 30 5,550,639 6,971,472
2016
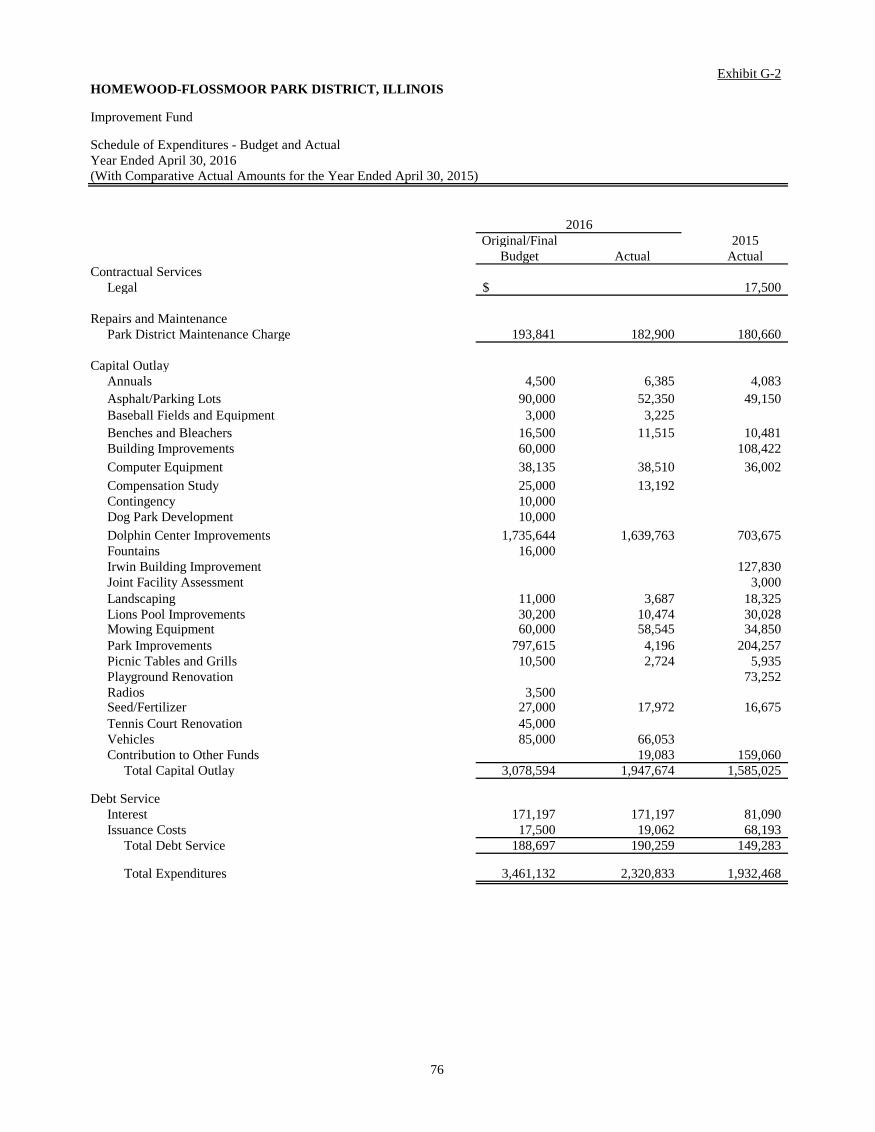
76
Exhibit G-2HOMEWOOD-FLOSSMOOR PARK DISTRICT, ILLINOIS
Improvement Fund
Schedule of Expenditures - Budget and ActualYear Ended April 30, 2016(With Comparative Actual Amounts for the Year Ended April 30, 2015)
Original/Final 2015Budget Actual Actual
Contractual ServicesLegal $ 17,500
Repairs and MaintenancePark District Maintenance Charge 193,841 182,900 180,660
Capital OutlayAnnuals 4,500 6,385 4,083 Asphalt/Parking Lots 90,000 52,350 49,150 Baseball Fields and Equipment 3,000 3,225 Benches and Bleachers 16,500 11,515 10,481 Building Improvements 60,000 108,422 Computer Equipment 38,135 38,510 36,002 Compensation Study 25,000 13,192 Contingency 10,000 Dog Park Development 10,000 Dolphin Center Improvements 1,735,644 1,639,763 703,675 Fountains 16,000 Irwin Building Improvement 127,830 Joint Facility Assessment 3,000 Landscaping 11,000 3,687 18,325 Lions Pool Improvements 30,200 10,474 30,028 Mowing Equipment 60,000 58,545 34,850 Park Improvements 797,615 4,196 204,257 Picnic Tables and Grills 10,500 2,724 5,935 Playground Renovation 73,252 Radios 3,500 Seed/Fertilizer 27,000 17,972 16,675 Tennis Court Renovation 45,000 Vehicles 85,000 66,053 Contribution to Other Funds 19,083 159,060
Total Capital Outlay 3,078,594 1,947,674 1,585,025
Debt ServiceInterest 171,197 171,197 81,090 Issuance Costs 17,500 19,062 68,193
Total Debt Service 188,697 190,259 149,283
Total Expenditures 3,461,132 2,320,833 1,932,468
2016
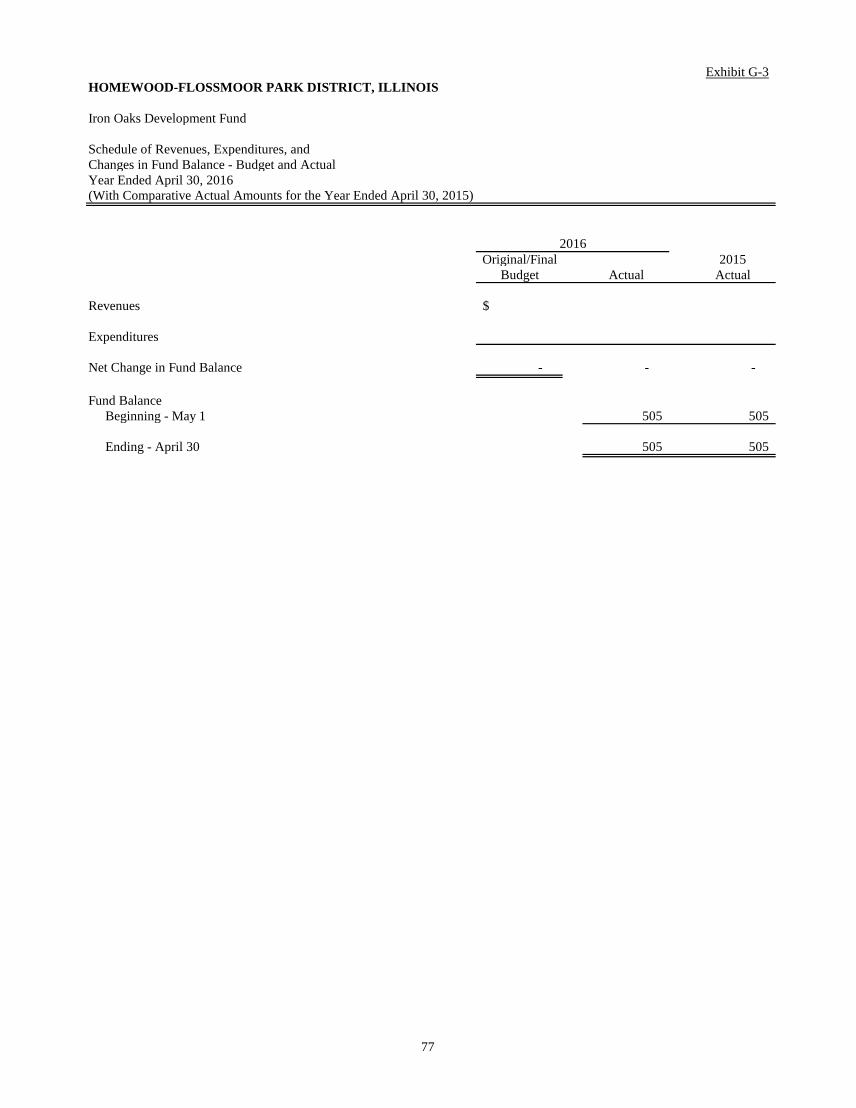
77
Exhibit G-3HOMEWOOD-FLOSSMOOR PARK DISTRICT, ILLINOIS
Iron Oaks Development Fund
Schedule of Revenues, Expenditures, andChanges in Fund Balance - Budget and ActualYear Ended April 30, 2016(With Comparative Actual Amounts for the Year Ended April 30, 2015)
Original/Final 2015Budget Actual Actual
Revenues $
Expenditures
Net Change in Fund Balance - - -
Fund BalanceBeginning - May 1 505 505
Ending - April 30 505 505
2016
PROPRIETARY FUND TYPES

ENTERPRISE FUNDS
Enterprise Funds are established to account for operations (a) that are financed and operated in a manner similar to private business enterprises where the intent of the governing body is that the costs (expenses, including depreciation) of providing goods or services to the general public on a continuing basis be financed or recovered primarily through user charges; or (b) where the governing body has decided that periodic determination of revenue earned, expenses incurred, and/or net income is appropriate for capital maintenance, public policy, management control, accountability, or other purposes.
Racquet Club Fund - established for control of operating revenues and expenses of the indoor tennis
court. Although a program of the District, the activity is operated as a separate enterprise and the accounting records are maintained on an Enterprise Fund basis. Accordingly, the account classifications used are designed specifically for the indoor tennis court operations.
Artificial Ice Skating Rink Fund - established for control of operating revenues and expenses of the
artificial ice skating rink. Although a program of the District, the activity is operated as a separate enterprise and the accounting records are maintained on an Enterprise Fund basis. Accordingly, the account classifications used are designed specifically for the artificial ice skating rink operations.
Golf Course Fund – established for control of operating revenues and expenses of Coyote Run Golf
Course, an eighteen hole facility. In January, 2012, the District took over the operation of the onsite full service restaurant, now known as Wiley’s Grill. Although golf is also a program of the District, the activity, along with the restaurant, is operated as a separate enterprise and the accounting records are maintained on an Enterprise Fund basis. Accordingly, the account classifications used are designed specifically for the golf course operations.

78
Exhibit H-1HOMEWOOD-FLOSSMOOR PARK DISTRICT, ILLINOIS
Racquet Club Fund
Schedule of Operating Expenses - Budget and ActualYear Ended April 30, 2016(With Comparative Actual Amounts for the Year Ended April 30, 2015)
Original/Final 2015Budget Actual Actual
Cost of Goods Sold 94,280$ 53,780 89,487
Operating ExpensesPersonnel
Full-Time Salaries 548,365 543,641 553,803 Part-Time Salaries 777,845 686,131 738,361 Extended Part-Time Salaries 157,811 133,393 135,599 Other (392) (3,244)
Total Personnel 1,484,021 1,362,773 1,424,519
Contractual ServicesTelephone 7,704 8,077 8,781 Fuel and Heat 30,000 26,817 28,964 Electricity 100,000 102,907 117,436 Water 39,000 36,287 34,316 Computer Service 14,188 10,100 9,387 Legal 2,000 10,828 5,046 Scavenger Service 2,610 2,766 2,619 Contractual Services 63,510 104,760 73,356 Cleaning Service 31,700 30,788 30,789 Service Awards 1,610 1,498 1,280 Advertising 24,115 15,823 20,527 Job Placement Ads 300 399 Internet and Data Services 2,511 2,626 2,236 Planning and Professional Services 10,000 34,491 11,642 Promotion 9,508 5,843 5,484 Printing 11,442 8,128 10,222 Postage 5,800 1,042 4,191 Travel Expenses 800 2,261 442 Car Allowance 525 300 525 Dues and Subscriptions 3,120 1,930 2,741 Professional Development 8,700 5,496 5,123 Employee Insurance 194,317 178,426 160,998 Bad Debt Expense 1,000 983 2,030 Credit Card Processing Fees 37,500 40,197 39,343 Alarm Expense 750 454 Internet Café 6,300 5,633
Total Contractual Services 609,010 638,406 577,932
SuppliesProgram 40,976 33,394 31,758 Office 5,500 5,172 6,414 Computer Supplies 6,654 6,086 7,984 Maintenance 21,110 15,875 19,290 Uniforms 2,280 1,823 2,551 Light Bulb Supplies 2,000 2,003 2,624 Chemicals 4,365 4,369 3,081 Pool 700 295 409 Pro Shop 500 68
(Cont.)
2016

79
Exhibit H-1HOMEWOOD-FLOSSMOOR PARK DISTRICT, ILLINOIS
Racquet Club Fund
Schedule of Operating Expenses - Budget and Actual (Cont.)Year Ended April 30, 2016(With Comparative Actual Amounts for the Year Ended April 30, 2015)
Final 2015Budget Actual Actual
Operating Expenses (Cont.)
Supplies (Cont.)Signs 1,000 155 686 Safety Supplies 800 652 1,109 Cosmetics 12,634 7,264 9,282 Replacement Towels 10,880 9,485 10,319 Tennis Lesson 1,200 585 1,085 Laundry Supplies 3,040 3,441 3,010 Tennis Ball Supplies 3,250 4,241 3,229 Tennis Courts and Nets 2,350 64 2,024Fitness Center Supplies 2,134 1,901 7,949 Racquet Stringing 12,000 12,612 12,437
Total Supplies 133,373 109,417 125,309
Repairs and MaintenancePlumbing 3,950 3,952 3,456 Electrical 4,000 1,893 1,860 Computer 300 Building 9,000 6,258 7,755 HVAC Repairs 6,500 6,189 6,895 Equipment 6,650 6,026 3,219 Exercise Room Equipment 12,600 16,154 25,346Pool Repair 4,000 1,195 4,081 Equipment - Office 934 Pump and Valve Repair 2,000 2,701 1,481
Total Repairs and Maintenance 49,000 44,368 55,027
Provision for Depreciation 251,134 221,342 255,074
Total Operating Expenses 2,620,818 2,430,086 2,527,348
Capital OutlaysBuilding Improvements 6,000 HVAC 83,463 Furniture and Equipment 33,100 13,555 6,464
Total Capital Outlays 39,100 13,555 89,927
Debt PaymentsPrincipal 104,925 104,925 305,700Interest and Amortization 65,207 37,552 26,969
Total Debt Payments 170,132 142,477 332,669
Total Expenses and Other Outlays 2,830,050 2,586,118 2,949,944
LessCapital Outlays (39,100) (13,555) (89,927) Debt Payments (170,132) (142,477) (332,669)
Total Operating Expenses 2,620,818 2,430,086 2,527,348
2016

80
Exhibit H-2HOMEWOOD-FLOSSMOOR PARK DISTRICT, ILLINOIS
Artificial Ice Skating Rink Fund
Schedule of Operating Expenses - Budget and ActualYear Ended April 30, 2016(With Comparative Actual Amounts for the Year Ended April 30, 2015)
Original/Final 2015Budget Actual Actual
Cost of Goods Sold 27,900$ 14,579 22,751
Operating ExpensesPersonnel
Full-Time Salaries 402,620 363,003 379,901
Contractual ServicesTelephone 4,416 3,822 4,330 Fuel and Heat 8,400 6,901 7,258 Electricity 80,000 80,198 83,075 Water 17,760 19,491 14,785 Computer Service 4,374 3,419 3,035 Legal 500 43 187 Scavenger Service 3,000 1,942 2,114 Program Contractual Services 18,557 13,270 17,608 Advertising 2,050 (375) 1,683 Internet and Data Services 2,040 1,811 1,772 Job Placement Ads 200 103 346 Planning and Professional Services 8,000Promotion 700 194 418 Printing 3,850 3,851 3,196 Postage 150 2 27 Travel Expense 500 300 340 Dues and Subscriptions 1,025 818 1,034 Professional Development 3,347 1,584 1,678 Refrigeration Contract 13,100 13,936 9,771 Staff Training 500 Employee Insurance 61,516 61,631 66,818 Credit Card Processing Fees 7,000 8,466 8,886 Miscellaneous 8,757 7,340 6,706
Total Contractual Services 249,742 228,747 235,067
SuppliesProgram 19,320 23,021 25,158 Office 2,500 1,353 3,250 Computer Supplies 374 152 764 Concession Food/Supplies 5,000 4,608 4,343 Maintenance 8,500 6,840 10,913 Uniforms 500 478 80 Light Bulb Supplies 1,400 508 1,741 Gas and Oil 6,000 5,093 5,881 Pro Shop 200 11 Zamboni Supplies 3,000 1,187 3,183 Safety Supplies 300 236 100 Skate Sharpening 400 2,247 Skate Rental Supplies 2,600 2,828 1,965
Total Supplies 50,094 48,562 57,378
(Cont.)
2016

81
Exhibit H-2HOMEWOOD-FLOSSMOOR PARK DISTRICT, ILLINOIS
Artificial Ice Skating Rink Fund
Schedule of Operating Expenses - Budget and Actual (Cont.)Year Ended April 30, 2016(With Comparative Actual Amounts for the Year Ended April 30, 2015)
Final 2015Budget Actual Actual
Operating Expenses (Cont.)Repairs and Maintenance
Plumbing 1,500 1,712 1,127 Electrical 2,000 1,314 342 Building 6,000 6,468 3,082 Equipment 6,000 5,439 5,661 Office Equipment 800 616 988 HVAC Repairs 12,000 24,762 27,732 Small Signs and Repairs 1,000 190 1,384 Zamboni Repair 1,000 124 220
Total Repairs and Maintenance 30,300 40,625 40,536
Provision for Depreciation and Amortization 86,683 94,435 92,979
Total Operating Expenses 847,339 789,951 828,612
Capital OutlaysFurniture and Equipment 12,000 6,198 9,657
Debt PaymentsPrincipal 23,777 23,777 Interest and Amortization 16,053 8,346 6,429
Total Debt Service 39,830 32,123 6,429
Total Expenses and Other Outlays 899,169 828,272 844,698
LessCapital Outlays (12,000) (6,198) (9,657) Debt Payments (39,830) (32,123) (6,429)
Total Operating Expenses 847,339 789,951 828,612
2016

82
Exhibit H-3HOMEWOOD-FLOSSMOOR PARK DISTRICT, ILLINOIS
Golf Course Fund
Schedule of Operating Expenses - Budget and Actual Year Ended April 30, 2016(With Comparative Actual Amounts for the Year Ended April 30, 2015)
Original/Final 2015Budget Actual Actual
Cost of Goods Sold 248,780$ 260,333 245,250
Operating ExpensesPersonnel
Full-Time Salaries 446,268 450,917 439,956 Part-Time Salaries 429,013 398,587 385,379 Other 1,025 404 (674)
Total Personnel 876,306 849,908 824,661
Contractual ServicesTelephone 5,316 5,465 6,546 Internet and Data Service 4,296 4,148 4,031 Fuel and Heat 9,020 6,312 7,964 Electricity 47,056 43,783 45,203 Water 5,500 5,768 4,947 Computer Service 3,284 2,427 3,454 Legal 200 3,292 204 Scavenger Service 3,500 2,947 4,063 Cleaning Service Contractual Services 22,447 23,545 26,681 Advertising 12,400 11,331 13,233 Promotion 3,000 2,198 2,419 Printing 5,400 5,434 5,489 Postage 350 15 169 Travel Expenses 200 27 70 Car Allowance 300 675 300 Dues and Subscriptions 3,465 2,494 2,706 Professional Development 5,835 4,243 3,179 Employee Insurance 122,227 111,244 116,153 Employee Service Awards 538 222 Bank Service Charges 360 360 328 Credit Card Processing Fees 24,000 28,734 23,839 Licenses and Permits 4,125 3,585 3,315 Alarm Expense 730 696 585 Portable Facilities Rental 1,200 930 724 Equipment Rental 500 2,634 924 Arboriculture 4,000 1,600 1,500 Golf Carts 52,706 52,608 51,963 Handicapping 1,200 2,509 642 Goose Dog Rental 900 1,058 1,026 Restaurant Equipment Lease 3,443 3,247 4,179
Total Contractual Services 346,960 333,847 336,058
SuppliesOffice 3,375 3,191 3,706 Computer 824 1,231 1,009Decorations 3,000 1,778 2,279Kitchen Supplies 3,000 5,647 2,932Maintenance 13,720 12,406 16,084 Uniforms 4,575 4,242 5,644
(Cont.)
2016
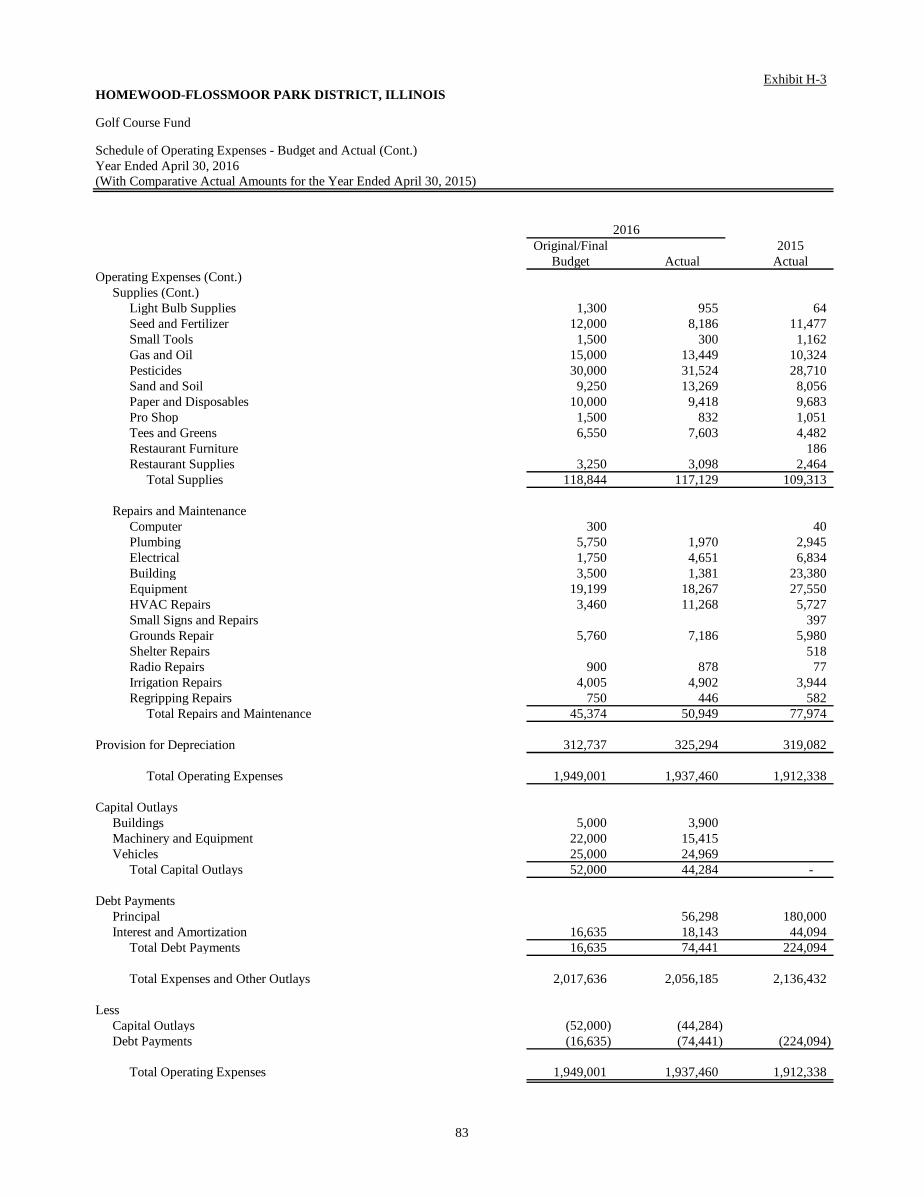
83
Exhibit H-3HOMEWOOD-FLOSSMOOR PARK DISTRICT, ILLINOIS
Golf Course Fund
Schedule of Operating Expenses - Budget and Actual (Cont.) Year Ended April 30, 2016(With Comparative Actual Amounts for the Year Ended April 30, 2015)
Original/Final 2015Budget Actual Actual
Operating Expenses (Cont.)Supplies (Cont.)
Light Bulb Supplies 1,300 955 64 Seed and Fertilizer 12,000 8,186 11,477 Small Tools 1,500 300 1,162 Gas and Oil 15,000 13,449 10,324 Pesticides 30,000 31,524 28,710 Sand and Soil 9,250 13,269 8,056 Paper and Disposables 10,000 9,418 9,683 Pro Shop 1,500 832 1,051 Tees and Greens 6,550 7,603 4,482 Restaurant Furniture 186 Restaurant Supplies 3,250 3,098 2,464
Total Supplies 118,844 117,129 109,313
Repairs and MaintenanceComputer 300 40 Plumbing 5,750 1,970 2,945 Electrical 1,750 4,651 6,834 Building 3,500 1,381 23,380 Equipment 19,199 18,267 27,550 HVAC Repairs 3,460 11,268 5,727 Small Signs and Repairs 397 Grounds Repair 5,760 7,186 5,980 Shelter Repairs 518 Radio Repairs 900 878 77 Irrigation Repairs 4,005 4,902 3,944 Regripping Repairs 750 446 582
Total Repairs and Maintenance 45,374 50,949 77,974
Provision for Depreciation 312,737 325,294 319,082
Total Operating Expenses 1,949,001 1,937,460 1,912,338
Capital OutlaysBuildings 5,000 3,900Machinery and Equipment 22,000 15,415Vehicles 25,000 24,969
Total Capital Outlays 52,000 44,284 -
Debt PaymentsPrincipal 56,298 180,000 Interest and Amortization 16,635 18,143 44,094
Total Debt Payments 16,635 74,441 224,094
Total Expenses and Other Outlays 2,017,636 2,056,185 2,136,432
LessCapital Outlays (52,000) (44,284) Debt Payments (16,635) (74,441) (224,094)
Total Operating Expenses 1,949,001 1,937,460 1,912,338
2016

LONG-TERM DEBT REQUIREMENTS

Schedule 1
84
HOMEWOOD-FLOSSMOOR PARK DISTRICT, ILLINOIS
Long-Term Debt Requirements
General Obligation Refunding Bond Series 2009 (Refunded Bond Series 1998)April 30, 2016
Date of Issue September 28, 2009Date of Maturity December 1, 2018Authorized Issue $2,510,000Denomination of Bonds $5,000Interest Rates 2.0% - 3.25%Interest Dates June 1 and December 1Principal Maturity Date December 1
FiscalYear
Ending Principal Interest Total
2017 275,000$ 26,236 301,236 2018 285,000 18,260 303,260 2019 290,000 9,426 299,426
850,000 53,922 903,922
CURRENT AND FUTURE PRINCIPAL AND INTEREST REQUIREMENTS

Schedule 2
85
HOMEWOOD-FLOSSMOOR PARK DISTRICT, ILLINOIS
Long-Term Debt Requirements
Golf Course, Racquet Club and Ice Arena General Obligation Refunding Park Bonds (Alternate Revenue Source), Series 2011B - Refunded Bond Series 2003A and 2005AApril 30, 2016
Date of Issue October 18, 2011Date of Maturity December 1, 2023Authorized Issue 3,740,000$ Denomination of Bonds $5,000Interest Rates 2.00% - 4.00%Interest Dates June 1 and December 1Principal Maturity Date December 1
FiscalYear
Ending Principal Interest Total
2017 195,000$ 65,425 260,425 2018 200,000 59,575 259,575 2019 205,000 53,575 258,575 2020 215,000 46,400 261,400 2021 220,000 37,800 257,800 2022 230,000 29,000 259,000 2023 240,000 19,800 259,800 2024 255,000 10,200 265,200
1,760,000 321,775 2,081,775
Note: Bonds are to be paid 86.64% from Golf Course, 10.89% from Racquet Club Fund and 2.45% from theArtificial Ice Arena Fund.
CURRENT AND FUTURE PRINCIPAL AND INTEREST REQUIREMENTS

Schedule 3
86
HOMEWOOD-FLOSSMOOR PARK DISTRICT, ILLINOIS
Long-Term Debt Requirements
General Obligation Refunding Bonds (Alternate Revenue Source), Series 2013B
Date of Issue November 1, 2013Date of Maturity December 15, 2032Authorized Issue $8,990,000Denomination of Bonds $5,000Interest Rates 4.0% - 5.0%Interest Dates December 15Principal Maturity Date December 15
FiscalYear
Ending Principal Interest Total
2017 $ 405,450 405,450 2018 405,450 405,450 2019 405,450 405,450 2020 405,450 405,450 2021 405,450 405,450 2022 405,450 405,450 2023 405,450 405,450 2024 405,450 405,450 2025 560,000 405,450 965,450 2026 895,000 383,050 1,278,050 2027 930,000 347,250 1,277,250 2028 975,000 310,050 1,285,050 2029 1,020,000 271,050 1,291,050 2030 1,070,000 225,150 1,295,150 2031 1,125,000 177,000 1,302,000 2032 1,180,000 120,750 1,300,750 2033 1,235,000 61,750 1,296,750
8,990,000 5,545,100 14,535,100
April 30, 2016
CURRENT AND FUTURE PRINCIPAL AND INTEREST REQUIREMENTS

Schedule 4
87
HOMEWOOD-FLOSSMOOR PARK DISTRICT, ILLINOIS
Long-Term Debt Requirements
General Obligation Park Bonds (Limited Tax Park Bonds), Series 2014AApril 30, 2016
Date of Issue December 11, 2014Date of Maturity December 1, 2016Authorized Issue $900,000Denomination of Bonds $5,000Interest Rates 1.30% and 1.60%Interest Dates June 1, December 1Principal Maturity Date December 1
FiscalYear
Ending Principal Interest Total
2017 143,075$ 2,289 145,364
CURRENT AND FUTURE PRINCIPAL AND INTEREST REQUIREMENTS
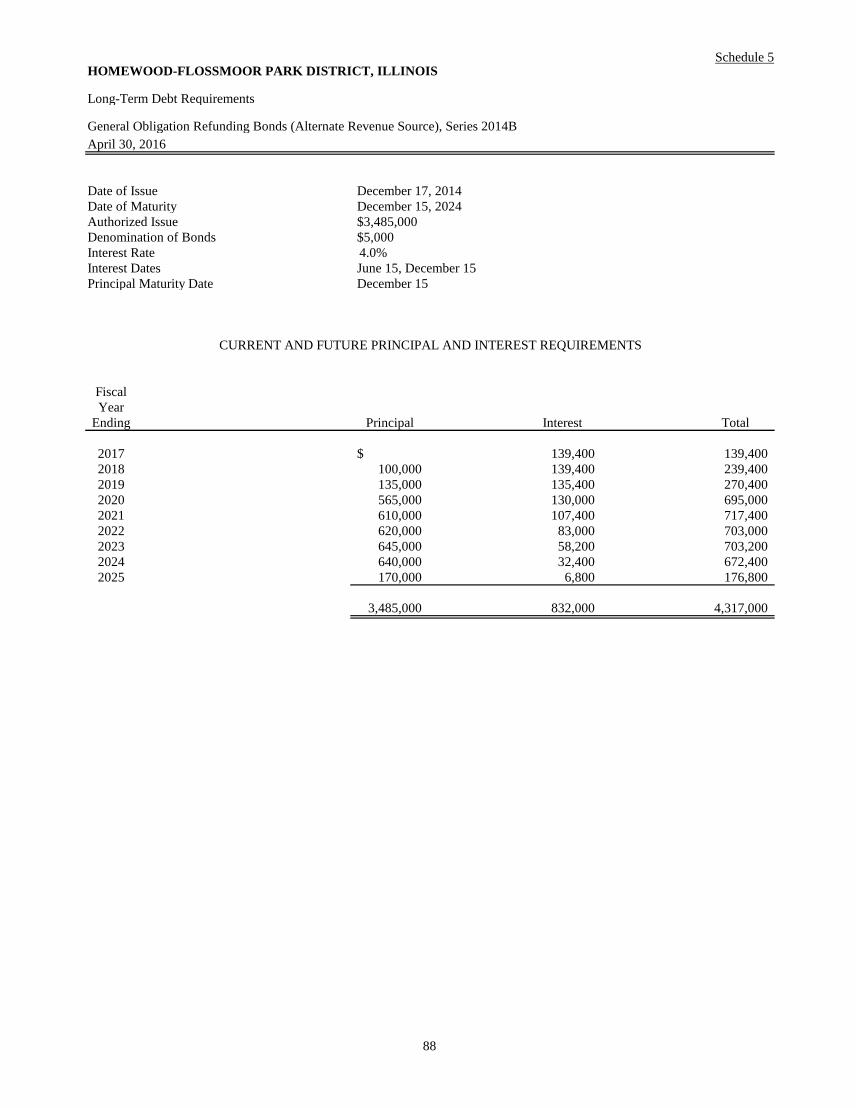
Schedule 5
88
HOMEWOOD-FLOSSMOOR PARK DISTRICT, ILLINOIS
Long-Term Debt Requirements
General Obligation Refunding Bonds (Alternate Revenue Source), Series 2014B
Date of Issue December 17, 2014Date of Maturity December 15, 2024Authorized Issue $3,485,000Denomination of Bonds $5,000Interest Rate 4.0% Interest Dates June 15, December 15Principal Maturity Date December 15
FiscalYear
Ending Principal Interest Total
2017 $ 139,400 139,400 2018 100,000 139,400 239,400 2019 135,000 135,400 270,400 2020 565,000 130,000 695,000 2021 610,000 107,400 717,400 2022 620,000 83,000 703,000 2023 645,000 58,200 703,200 2024 640,000 32,400 672,400 2025 170,000 6,800 176,800
3,485,000 832,000 4,317,000
April 30, 2016
CURRENT AND FUTURE PRINCIPAL AND INTEREST REQUIREMENTS

Schedule 6
89
HOMEWOOD-FLOSSMOOR PARK DISTRICT, ILLINOIS
Long-Term Debt Requirements
General Obligation Park Bonds (Limited Tax Park Bonds), Series 2015April 30, 2016
Date of Issue December 14, 2015Date of Maturity December 1, 2017Authorized Issue $900,000Denomination of Bonds $5,000Interest Rate 2.43% Interest Dates June 1, December 1Principal Maturity Date December 1
FiscalYear
Ending Principal Interest Total
2017 842,665$ 21,080 863,745 2018 57,335 1,393 58,728
900,000 22,473 922,473
CURRENT AND FUTURE PRINCIPAL AND INTEREST REQUIREMENTS

STATISTICAL SECTION (Unaudited)

HOMEWOOD-FLOSSMOOR PARK DISTRICT, ILLINOIS Statistical Section This portion of the Homewood-Flossmoor Park District’s Comprehensive Annual Financial Report presents detailed information as a context for understanding what the information in the financial statements, note disclosures, and required supplementary information says about the District’s overall economic condition. Contents Page Financial Trends 90-99 These schedules contain trend information to help the reader understand how the District’s
financial performance and well-being have changed over time.
Revenue Capacity 100-107 These schedules contain information to help the reader assess the District’s most significant
local revenue sources, the sales tax and the property tax.
Debt Capacity 108-112 These schedules present information to help the reader assess the affordability of the
District’s current levels of outstanding debt and the District’s ability to issue additional debt.
Demographic and Economic Information 113-115 These schedules offer demographic and economic indicators to help the reader understand
the environment within which the District’s financial activities take place.
Operating Information 116-122 These schedules contain service and infrastructure data to help the reader understand how
the information in the District’s financial report relates to the services the District provides and the activities it performs.
Sources Unless otherwise noted, the information in these schedules is derived from the Comprehensive Annual Financial Reports for the relevant year.

FINANCIAL TRENDS

90
Table IHOMEWOOD-FLOSSMOOR PARK DISTRICT, ILLINOIS
Net Position by Component Last Ten Fiscal Years
April 30, 2016
2016 2015 2014 2013
Governmental ActivitiesNet Investment in Capital Assets 8,383,872$ 6,740,728 6,873,691 6,217,607 Restricted 2,202,858 2,094,490 1,870,006 1,853,153 Unrestricted 2,058,630 4,513,856 4,726,455 5,393,281
Total Governmental Activities Net Assets 12,645,360 13,349,074 13,470,152 13,464,041
Business-type ActivitiesInvested in Capital Assets, Net of Related Debt 15,194,002$ 15,602,949 15,434,566 15,250,637 Unrestricted (4,538,284) (3,911,693) (3,831,122) (3,837,171)
Total Business-type Activities Net Assets 10,655,718 11,691,256 11,603,444 11,413,466
Total GovernmentInvested in Capital Assets, Net of Related Debt 23,577,874$ 22,343,677 22,308,257 21,468,244 Restricted 2,202,858 2,094,490 1,870,006 1,853,153 Unrestricted (2,479,654) 602,163 895,333 1,556,110
Total Government Net Assets 23,301,078 25,040,330 25,073,596 24,877,507
Data Source
Audited Financial Reports
Fiscal Year

91
2012 2011 2010 2009 2008 2007
5,046,432 4,424,081 3,870,550 3,867,418 2,664,646 2,018,740 1,798,114 1,918,914 1,893,491 1,863,874 1,724,959 1,433,508 5,574,935 5,194,797 4,660,718 3,539,984 4,193,751 3,675,376
12,419,481 11,537,792 10,424,759 9,271,276 8,583,356 7,127,624
15,107,354 15,062,241 14,991,159 15,027,767 14,849,600 14,671,610 (3,594,884) (3,290,507) (2,981,698) (2,827,101) (2,300,729) (1,421,536)
11,512,470 11,771,734 12,009,461 12,200,666 12,548,871 13,250,074
20,153,786 19,486,322 18,861,709 18,895,185 17,514,246 16,690,350 1,798,114 1,918,914 1,893,491 1,863,874 1,724,959 1,433,508 1,980,051 1,904,290 1,679,020 712,883 1,893,022 2,253,840
23,931,951 23,309,526 22,434,220 21,471,942 21,132,227 20,377,698

92
Table IIHOMEWOOD-FLOSSMOOR PARK DISTRICT, ILLINOIS
Changes in Net PositionLast Ten Fiscal Years
April 30, 2016
Fiscal Year 2016 2015 2014 2013
ExpensesGovernmental Activities
General Government 3,317,759$ 3,004,612 3,305,066 3,178,150 Recreational 3,079,783 3,127,582 2,908,213 2,967,233 Retirement Contributions Interest Expense 606,821 545,488 487,167 420,552
Total Governmental Activities Expenses 7,004,363 6,677,682 6,700,446 6,565,935
Business-type Activities Racquet Club Fund 2,487,603 2,554,317 2,491,685 2,463,939 Artificial Ice Skating Rink Fund 798,297 835,041 834,505 850,797 Golf Course Fund 1,955,603 1,961,256 1,952,165 1,829,827
Total Business-type Activities Expenses 5,241,503 5,350,614 5,278,355 5,144,563
Total Primary Government Expenses 12,245,866 12,028,296 11,978,801 11,710,498
Program RevenuesGovernmental Activities
Charges for ServicesRecreational 1,884,627$ 1,808,190 1,806,556 1,829,999
Operating Grants and Contributions 24,796 45,411 21,124 44,551 Capital Grants and Contributions
Total Governmental Activities Program Revenues 1,909,423 1,853,601 1,827,680 1,874,550
Business-type ActivitiesCharges for Services
Racquet Club Fund 2,331,916 2,437,221 2,517,787 2,628,424 Artificial Ice Skating Rink Fund 826,560 959,043 929,770 851,761 Golf Course Fund 1,767,746 1,632,071 1,557,095 1,418,140
Total Business-type Activities Program Revenues 4,926,222 5,028,335 5,004,652 4,898,325
Total Primary Government Program Revenues 6,835,645 6,881,936 6,832,332 6,772,875
Net (Expense) RevenueGovernmental Activities (5,094,940)$ (4,824,081) (4,872,766) (4,691,385) Business-type Activities (315,281) (322,279) (273,703) (246,238)
Total Primary Government Net Expense (5,410,221) (5,146,360) (5,146,469) (4,937,623)

93
2012 2011 2010 2009 2008 2007
3,179,758 2,963,163 2,146,342 2,262,982 1,978,131 1,765,070 3,076,077 3,008,205 3,059,610 3,109,741 2,855,289 2,788,602
859,421 848,494 713,898 696,872 481,595 504,002 569,402 608,949 628,988 574,458
6,737,430 6,475,370 6,634,775 6,830,166 6,176,306 5,825,002
2,701,186 2,799,404 2,717,593 2,889,697 3,017,510 2,921,572 977,110 1,036,303 1,122,533 1,043,157 1,020,730 1,119,777
1,484,052 1,323,916 1,337,503 1,403,446 1,440,615 1,364,120 5,162,348 5,159,623 5,177,629 5,336,300 5,478,855 5,405,469
11,899,778 11,634,993 11,812,404 12,166,466 11,655,161 11,230,471
1,808,108 1,931,962 1,991,591 2,024,597 1,945,564 1,902,702 25,376 23,989 43,322 54,783 39,004
30,000 22,500 7,500 1,833,484 1,985,951 2,057,413 2,079,380 1,992,068 1,902,702
2,754,045 2,768,022 2,739,028 2,790,755 2,830,763 2,943,437 905,794 936,721 901,489 778,389 773,491 911,455
1,036,740 956,399 1,091,079 1,148,423 1,161,898 1,142,605 4,696,579 4,661,142 4,731,596 4,717,567 4,766,152 4,997,497
6,530,063 6,647,093 6,789,009 6,796,947 6,758,220 6,900,199
(4,903,946) (4,489,419) (4,577,362) (4,750,786) (4,184,238) (3,922,300) (465,769) (498,481) (446,033) (618,733) (712,703) (407,972)
(5,369,715) (4,987,900) (5,023,395) (5,369,519) (4,896,941) (4,330,272)

94
Table IIHOMEWOOD-FLOSSMOOR PARK DISTRICT, ILLINOIS
Changes in Net PositionLast Ten Fiscal Years
April 30, 2016
Fiscal Year 2016 2015 2014 2013
General Revenues and Other Changes in Net AssetsGovernmental Activities
Taxes Property 5,107,778$ 4,971,970 5,177,890 5,776,829 Replacement 59,223 73,717 70,454 67,226 Other 15,000 15,836 43,590 55,000
Earnings on Investment 15,904 3,530 4,434 8,178 Other Income 52,565 45,511 42,755 41,287 Transfers (48,461) (407,561) (460,246) (212,575)
Total Governmental Activities 5,202,009 4,703,003 4,878,877 5,735,945
Business-type ActivitiesUnrestricted Investment Earnings 5,000 2,530 3,435 Transfers 48,461 407,561 460,246 212,575
Total Business-type Activities 53,461 410,091 463,681 212,575
Total Primary Government 5,255,470 5,113,094 5,342,558 5,948,520
Change in Net AssetsGovernmental Activities 107,069$ (121,078) 6,111 1,044,560 Business-type Activities (261,820) 87,812 189,978 (33,663)
Total Primary Government Change in Net Assets (154,751) (33,266) 196,089 1,010,897
Data Source
Audited Financial Reports

95
2012 2011 2010 2009 2008 2007
5,829,174 5,688,815 5,824,865 5,483,072 5,392,865 5,012,900 63,516 72,016 58,379 70,309 80,201 72,760 55,000 53,000 53,000 59,540 59,116 48,239
1,435 4,000 12,824 64,207 102,413 135,160 42,015 40,249 36,605 20,607 5,375 49,096
(205,505) (255,628) (254,828) (259,028) 5,785,635 5,602,452 5,730,845 5,438,707 5,639,970 5,318,155
1,000 5,126 11,500 11,500 11,500 205,505 255,628 254,828 259,028 206,505 260,754 254,828 270,528 11,500 11,500
5,992,140 5,863,206 5,985,673 5,709,235 5,651,470 5,329,655
881,689 1,113,033 1,153,483 687,921 1,455,732 1,395,855 (259,264) (237,727) (191,205) (348,205) (701,203) (396,472)
622,425 875,306 962,278 339,716 754,529 999,383

96
Table IIIHOMEWOOD-FLOSSMOOR PARK DISTRICT, ILLINOIS
Fund Balances of Governmental FundsLast Ten Fiscal Years
April 30, 2016
Fiscal Year 2016 2015 2014 2013 2012*
General FundReserved $
Reserved for AdvancesReserved for InsuranceReserved for Prepaid Items
UnreservedDesignatedUndesignated
NonspendableAdvances 819,433 836,739 1,186,256 1,742,242 1,968,488 Prepaid Expenses 5,013 15,924 556 191 3,107 Permanent Fund
Unassigned 39,241 35,361 29,694
Total General Fund 824,446 852,663 1,226,053 1,777,794 2,001,289
All Other Governmental FundsReserved
Reserved for AdvancesReserved for Prepaid ExpendituresReserved for Capital Projects FundsReserved for Debt Service
UnreservedDesignated - Special Revenue FundsUndesignated Special Revenue Funds Capital Projects Funds Permanent Fund
NonspendableAdvancesPrepaid Expenses 777 1,384 2,158 4,520 Permanent Fund
Restricted forDebt Service 560,890 556,268 571,735 576,174 512,578 Employee Benefits 957,914 856,750 1,134,258 1,112,966 1,121,523 Social Security and Medicare 520,041 517,459 Working Capital 164,013 164,013 164,013 164,013 164,013
Assigned forSpecial Revenue Fund Purposes 956,430 1,295,714 1,575,101 1,646,742 1,405,887 Capital Project Fund Purposes 5,551,144 6,971,977 4,200,851 2,640,169 2,503,523
Total All Other Governmental Funds 8,711,209 10,362,181 7,647,342 6,142,222 5,712,044
Total Governmental Funds 9,535,655 11,214,844 8,873,395 7,920,016 7,713,333
Governmental Fund Balances Over (Under) Prior Year (1,679,189)$ 2,341,449 953,379 206,683 263,894
* Fund balance categories changed as required by GASB 54
Data Source
Audited Financial Reports

97
2011* 2010 2009 2008 2007
2,020,619 2,389,394 1,733,930 1,672,103
148 239 8,244
17,817 (742,348) 107,911 103,041
1,995,042 1,980
36,446
2,033,468 2,038,584 1,647,285 1,850,085 1,775,144
497,477 757,104 9,886 47,537 18,959 38,086
543,415 473,877 429,978 401,052
822,299 688,687 785,048 741,524
1,322,676 1,377,024 1,175,469 724,792 1,455,056 587,234 1,378,776 1,102,165
164,013 164,013 164,013 164,013
11,519
498,476 753,855 502,570 164,013
1,263,759 2,221,779
5,415,971 4,814,822 4,095,476 3,952,243 3,171,632
7,449,439 6,853,406 5,742,761 5,802,328 4,946,776
596,033 1,110,645 (59,567) 855,552 741,911
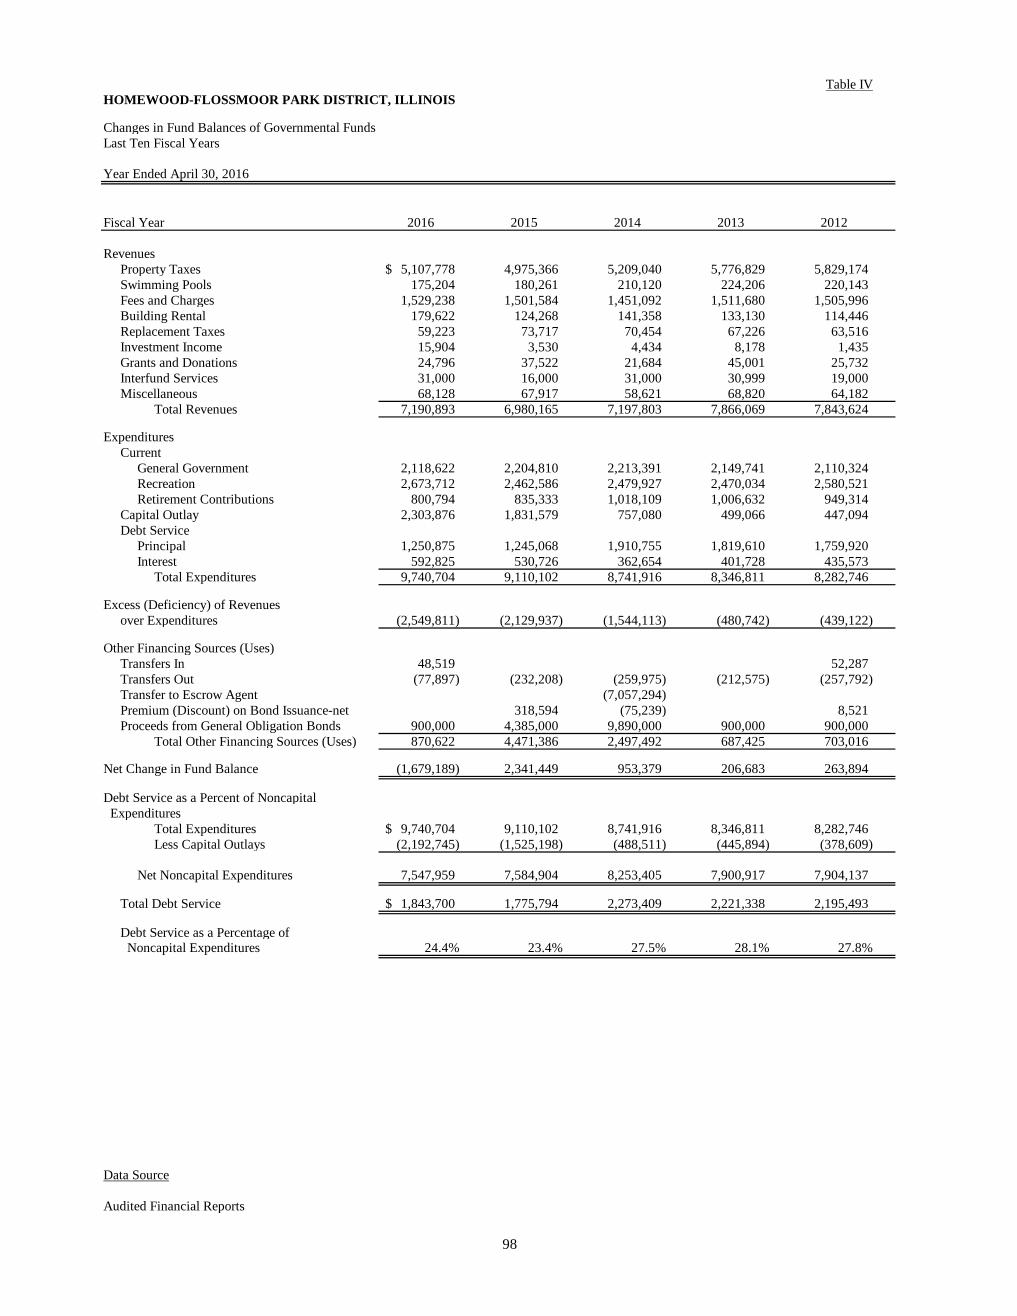
98
Table IVHOMEWOOD-FLOSSMOOR PARK DISTRICT, ILLINOIS
Changes in Fund Balances of Governmental FundsLast Ten Fiscal Years
Year Ended April 30, 2016
Fiscal Year 2016 2015 2014 2013 2012
RevenuesProperty Taxes 5,107,778$ 4,975,366 5,209,040 5,776,829 5,829,174 Swimming Pools 175,204 180,261 210,120 224,206 220,143 Fees and Charges 1,529,238 1,501,584 1,451,092 1,511,680 1,505,996 Building Rental 179,622 124,268 141,358 133,130 114,446 Replacement Taxes 59,223 73,717 70,454 67,226 63,516 Investment Income 15,904 3,530 4,434 8,178 1,435 Grants and Donations 24,796 37,522 21,684 45,001 25,732 Interfund Services 31,000 16,000 31,000 30,999 19,000 Miscellaneous 68,128 67,917 58,621 68,820 64,182
Total Revenues 7,190,893 6,980,165 7,197,803 7,866,069 7,843,624
ExpendituresCurrent
General Government 2,118,622 2,204,810 2,213,391 2,149,741 2,110,324 Recreation 2,673,712 2,462,586 2,479,927 2,470,034 2,580,521 Retirement Contributions 800,794 835,333 1,018,109 1,006,632 949,314
Capital Outlay 2,303,876 1,831,579 757,080 499,066 447,094 Debt Service
Principal 1,250,875 1,245,068 1,910,755 1,819,610 1,759,920 Interest 592,825 530,726 362,654 401,728 435,573
Total Expenditures 9,740,704 9,110,102 8,741,916 8,346,811 8,282,746
Excess (Deficiency) of Revenuesover Expenditures (2,549,811) (2,129,937) (1,544,113) (480,742) (439,122)
Other Financing Sources (Uses)Transfers In 48,519 52,287 Transfers Out (77,897) (232,208) (259,975) (212,575) (257,792) Transfer to Escrow Agent (7,057,294) Premium (Discount) on Bond Issuance-net 318,594 (75,239) 8,521 Proceeds from General Obligation Bonds 900,000 4,385,000 9,890,000 900,000 900,000
Total Other Financing Sources (Uses) 870,622 4,471,386 2,497,492 687,425 703,016
Net Change in Fund Balance (1,679,189) 2,341,449 953,379 206,683 263,894
Debt Service as a Percent of Noncapital Expenditures
Total Expenditures 9,740,704$ 9,110,102 8,741,916 8,346,811 8,282,746 Less Capital Outlays (2,192,745) (1,525,198) (488,511) (445,894) (378,609)
Net Noncapital Expenditures 7,547,959 7,584,904 8,253,405 7,900,917 7,904,137
Total Debt Service 1,843,700$ 1,775,794 2,273,409 2,221,338 2,195,493
Debt Service as a Percentage of Noncapital Expenditures 24.4% 23.4% 27.5% 28.1% 27.8%
Data Source
Audited Financial Reports

99
2011 2010 2009 2008 2007
5,688,815 5,824,865 5,483,072 5,392,865 5,012,900 219,264 245,428 273,523 287,125 268,359
1,596,055 1,672,187 1,653,454 1,559,432 1,533,141 146,344 109,101 132,589 136,799 130,688
72,016 58,379 70,309 80,201 72,760 4,000 12,824 64,207 102,413 135,160
55,658 65,938 56,333 46,504 26,595 14,000 3,000 22,319 156,456 196,300 61,879 60,890 43,628 36,349 57,099
7,858,031 8,052,612 7,799,434 7,798,144 7,433,002
1,991,587 1,864,356 1,929,735 1,837,939 1,702,006 2,499,660 2,820,800 2,850,839 2,709,317 2,570,021
871,291 859,421 848,494 713,898 696,872 362,671 367,055 702,277 417,127 495,397
1,691,090 1,549,865 1,567,360 1,536,327 1,477,960 465,074 500,638 568,219 597,984 617,150
7,881,373 7,962,135 8,466,924 7,812,592 7,559,406
(23,342) 90,477 (667,490) (14,448) (126,404)
(255,628) (254,828) (259,028)
(2,450,434)
875,000 3,725,434 866,950 870,000 868,315 619,372 1,020,172 607,922 870,000 868,315
596,030 1,110,649 (59,568) 855,552 741,911
7,881,373 7,962,135 8,466,924 7,812,592 7,559,406 (305,247) (322,192) (702,277) (470,529) (454,473)
7,576,126 7,639,943 7,764,647 7,342,063 7,104,933
2,156,164 2,050,503 2,135,579 2,134,311 2,095,110
28.5% 26.8% 27.5% 29.1% 29.5%

REVENUE CAPACITY
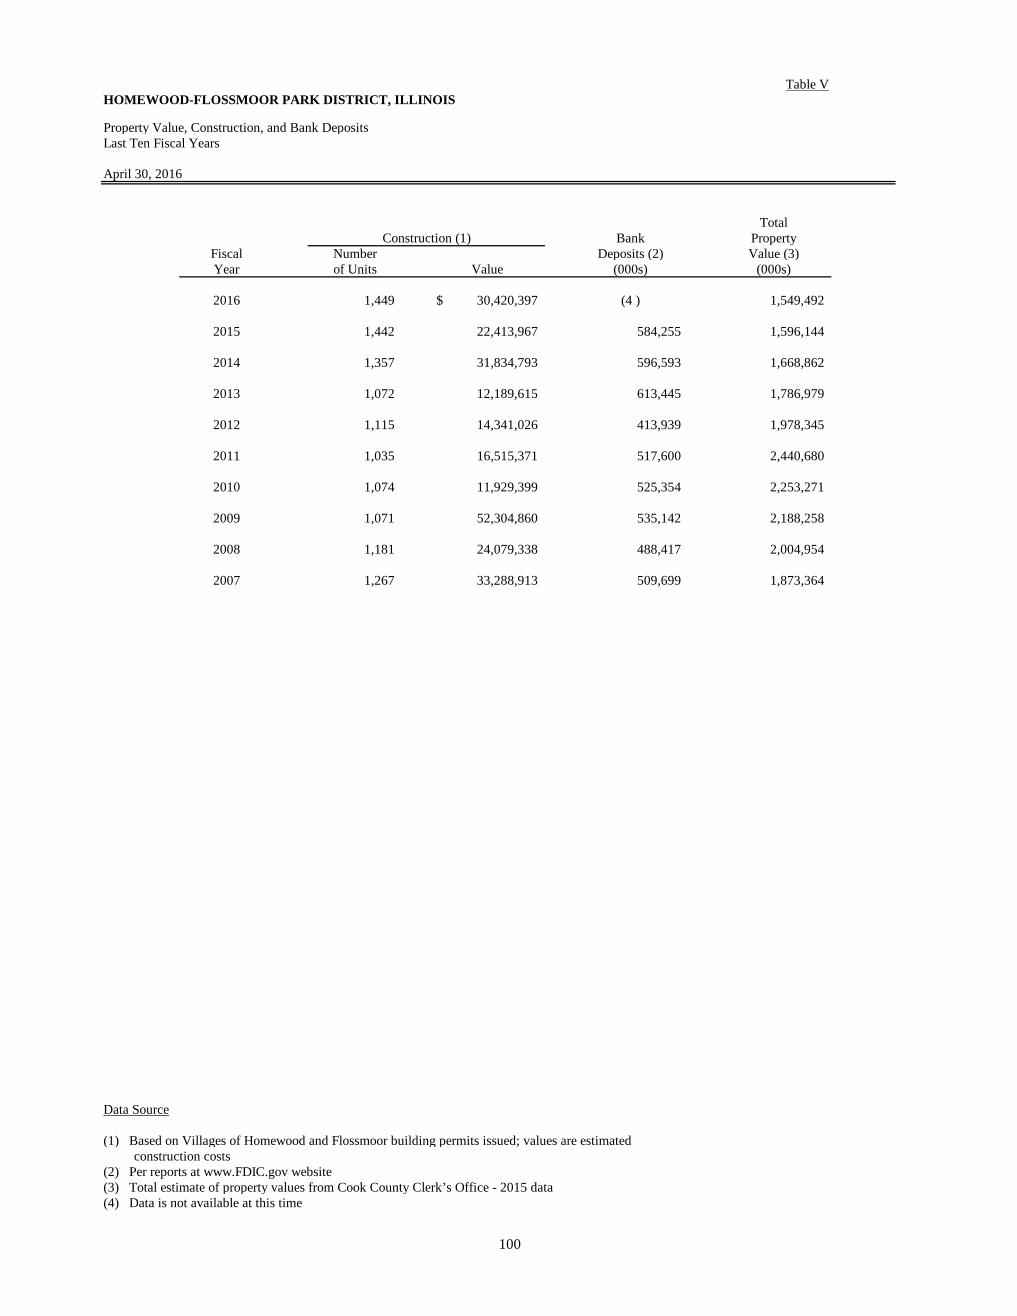
100
Table VHOMEWOOD-FLOSSMOOR PARK DISTRICT, ILLINOIS
Property Value, Construction, and Bank DepositsLast Ten Fiscal Years
April 30, 2016
TotalConstruction (1) Bank Property
Fiscal Number Deposits (2) Value (3)Year of Units Value (000s) (000s)
2016 1,449 30,420,397$ (4 ) 1,549,492
2015 1,442 22,413,967 584,255 1,596,144
2014 1,357 31,834,793 596,593 1,668,862
2013 1,072 12,189,615 613,445 1,786,979
2012 1,115 14,341,026 413,939 1,978,345
2011 1,035 16,515,371 517,600 2,440,680
2010 1,074 11,929,399 525,354 2,253,271
2009 1,071 52,304,860 535,142 2,188,258
2008 1,181 24,079,338 488,417 2,004,954
2007 1,267 33,288,913 509,699 1,873,364
Data Source
(1) Based on Villages of Homewood and Flossmoor building permits issued; values are estimated construction costs(2) Per reports at www.FDIC.gov website(3) Total estimate of property values from Cook County Clerk’s Office - 2015 data(4) Data is not available at this time

101
Table VIHOMEWOOD-FLOSSMOOR PARK DISTRICT, ILLINOIS
Assessed and Estimated Actual Value of Taxable Property Last Ten Levy Years
April 30, 2016
Tax Levy Farm Residential Commercial Industrial RailroadYear Property Property Property Property Property
2015
2014 $ 400,940,710 119,056,684 7,246,888 4,271,567
2013 419,918,438 103,799,384 27,696,996 4,316,377
2012 448,721,018 112,049,727 30,097,393 4,196,008
2011 498,253,527 124,175,634 32,216,174 4,143,389
2010 628,462,740 144,918,771 35,574,058 3,790,912
2009 613,557,898 96,335,905 36,914,327 3,530,956
2008 578,248,754 104,979,206 42,201,759 3,260,301
2007 537,181,007 90,304,969 37,137,728 3,025,919
2006 501,536,506 82,170,850 37,100,002 3,022,850
Data Source
Cook County Clerk’s Office - 2014 data
Details not available
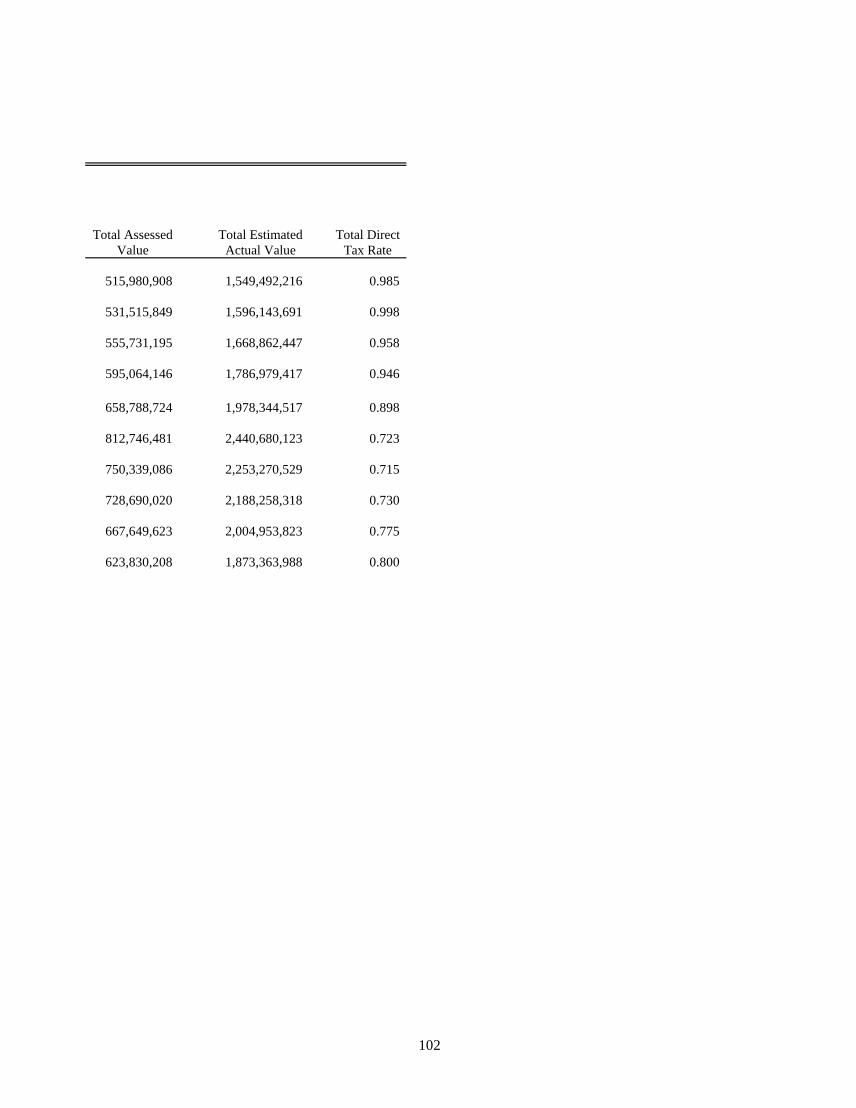
102
Total Assessed Total Estimated Total DirectValue Actual Value Tax Rate
515,980,908 1,549,492,216 0.985
531,515,849 1,596,143,691 0.998
555,731,195 1,668,862,447 0.958
595,064,146 1,786,979,417 0.946
658,788,724 1,978,344,517 0.898
812,746,481 2,440,680,123 0.723
750,339,086 2,253,270,529 0.715
728,690,020 2,188,258,318 0.730
667,649,623 2,004,953,823 0.775
623,830,208 1,873,363,988 0.800

103
Table VIIHOMEWOOD-FLOSSMOOR PARK DISTRICT, ILLINOIS
Property Tax Rates - Direct and Overlapping GovernmentsLast Ten Levy Years
April 30, 2016
Tax Levy Bond & AllYear General Recreation Museum Interest Pensions SocSec Other
2015 0.350 0.154 0.010 0.205 0.083 0.055 0.129 2014 0.350 0.094 0.010 0.198 0.133 0.089 0.124 2013 0.350 0.087 0.009 0.186 0.124 0.083 0.119 2012 0.350 0.090 0.036 0.171 0.111 0.074 0.114 2011 0.350 0.097 0.050 0.150 0.082 0.056 0.113 2010 0.230 0.069 0.042 0.120 0.080 0.065 0.117 2009 0.340 0.076 0.032 0.126 0.060 0.038 0.044 2008 0.285 0.076 0.027 0.130 0.074 0.049 0.087 2007 0.331 0.077 0.031 0.142 0.091 0.061 0.043 2006 0.336 0.075 0.031 0.152 0.093 0.062 0.052
*Property tax rates are per $100 of assessed valuation.
Data Source
Cook County Clerk’s Office - Tax Extension & Tax Rate Reportwww.cookcountyclerk.com
Park District Direct Rates

104
TotalHFPD Schools Villages Others
0.985 19.839 5.033 4.388 0.998 18.880 4.836 4.315 0.958 17.591 4.445 4.191 0.946 16.133 4.192 3.902 0.898 14.198 3.623 3.428 0.723 11.042 2.849 2.807 0.715 10.938 2.769 2.718 0.730 11.230 2.710 2.717 0.775 11.737 2.814 2.844 0.800 12.117 2.908 2.958
Overlapping Rates

105
Table VIIIHOMEWOOD-FLOSSMOOR PARK DISTRICT, ILLINOIS
Principal TaxpayersLast Fiscal Year Compared to Nine Years Ago
April 30, 2016
Percentageof Total
Equalized EqualizedAssessed Assessed
Taxpayer Type of Business Valuation Rank Valuation
Inland Amer Homewood Real Property 10,533,495$ 1 2.04%Kohl’s Department Store Department Store 4,399,890 2 0.85%Albertson’s Grocery Store 3,974,547 3 0.77%Target Retail Stores 3,894,257 4 0.75%Home Depot Home Improvement Center 3,367,796 5 0.65%Homewood Assoc. Real Property 3,358,646 6 0.65%Health Care & Retirement Healthcare 3,280,518 7 0.64%Menard, Inc. Retail Stores 3,230,628 8 0.63%Sunrise Assisted Living Senior Living 3,202,200 9 0.62%Homewood Mercy Prop. Real Property 2,835,078 10 0.55%K-Mart Retail StoresMontesand Cap Mgt Real PropertyHomewood Office Center Real Property
42,077,055 8.15%
Total District Taxable Assessed Value 515,980,908
Data Source
Cook County Clerk’s Office - 2015 data most recent available Village of Homewood, Village of Flossmoor
2015

106
Percentageof Total
Equalized EqualizedAssessed AssessedValuation Rank Valuation
5,723,341 7 0.92%6,668,613 4 1.07%6,522,646 5 1.05%5,691,800 8 0.91%
0.00%
4,738,289 9 0.76%
3,837,327 10 0.62%8,575,397 1 1.37%8,167,221 2 1.31%
7583809 3 1.22%6,457,642 6 1.04%
63,966,085 10.25%
623,830,298
2006

107
Table IXHOMEWOOD-FLOSSMOOR PARK DISTRICT, ILLINOIS
Property Tax Levies and CollectionsLast Ten Levy Years
April 30, 2016
Fiscal CollectionsYear Taxes Levied Amount % of Levy in Subsequent Yrs Amount % of Levy
2015 5,087,587 2,647,876 52.05% N/A 2,647,876 52.05%2014 5,304,532 2,621,869 49.43% 2,508,074 5,129,943 96.71%2013 5,323,919 2,776,270 52.15% 2,444,564 5,220,834 98.06%2012 5,629,318 3,006,129 53.40% 2,494,096 5,500,225 97.71%2011 5,915,923 2,995,587 50.64% 2,742,303 5,737,890 96.99%2010 5,876,158 2,868,356 48.81% 2,839,755 5,708,111 97.14%2009 5,364,924 2,647,451 49.35% 2,501,625 5,149,076 95.98%2008 5,319,437 2,322,259 43.66% 2,932,018 5,254,277 98.78%2007 5,174,282 2,308,573 44.62% 2,721,488 5,030,061 97.21%2006 4,990,642 2,219,770 44.48% 2,729,874 4,949,644 99.18%
Data Source
Cook County Clerk’s Office - 2015 data
Note:
Tax collections from the County in theory could exceed 100%. Cook County adds 3% to the District’s levy foruncollectible taxes (5% for debt service funds) and incorporates this allowance into the total extension
Collected Within Fiscal Year Total Collections to Date

DEBT CAPACITY

108
Table XHOMEWOOD-FLOSSMOOR PARK DISTRICT, ILLINOIS
Outstanding Debt by TypeLast Ten Fiscal Years
April 30, 2016
General GeneralFiscal Obligation Installment Debt Obligation DebtYear Bonds Contract Certificates Bonds Certificates
2016 14,368,075$ 1,760,000 2015 14,718,950 1,945,000 2014 11,563,775 15,243 2,500,000 2013 10,495,000 29,773 3,145,000 2012 11,400,730 43,653 3,730,000 2011 12,247,380 56,923 4,235,000 2010 13,020,000 30,800 69,593 4,780,000 2009 13,151,950 61,600 81,708 5,305,000 63,870 2008 13,810,000 92,400 93,268 5,820,000 187,991 2007 14,438,315 119,350 104,330 6,320,000 307,496
Notes:
Details of the District’s outstanding debt may be found in the Notes to the Financial Statements.
*Refer to the Schedule of Demographic and Economic Statistics for personal income and population data.
Data Source
District’s RecordsU.S. Department of Commerce, Bureau of Census, 2010 Census
Governmental ActivitiesBusiness-type
Activities

109
TotalOutstanding Total
Debt of OutstandingTotal Percentage Debt
Government Personal Income per Capita*
16,128,075 3.13% 542 16,663,950 3.14% 558 14,079,018 2.53% 471 13,669,773 2.30% 458 15,174,383 2.30% 508 16,539,303 2.03% 557 17,900,393 2.39% 603 18,664,128 2.56% 629 20,003,659 2.75% 673 21,289,491 3.19% 716
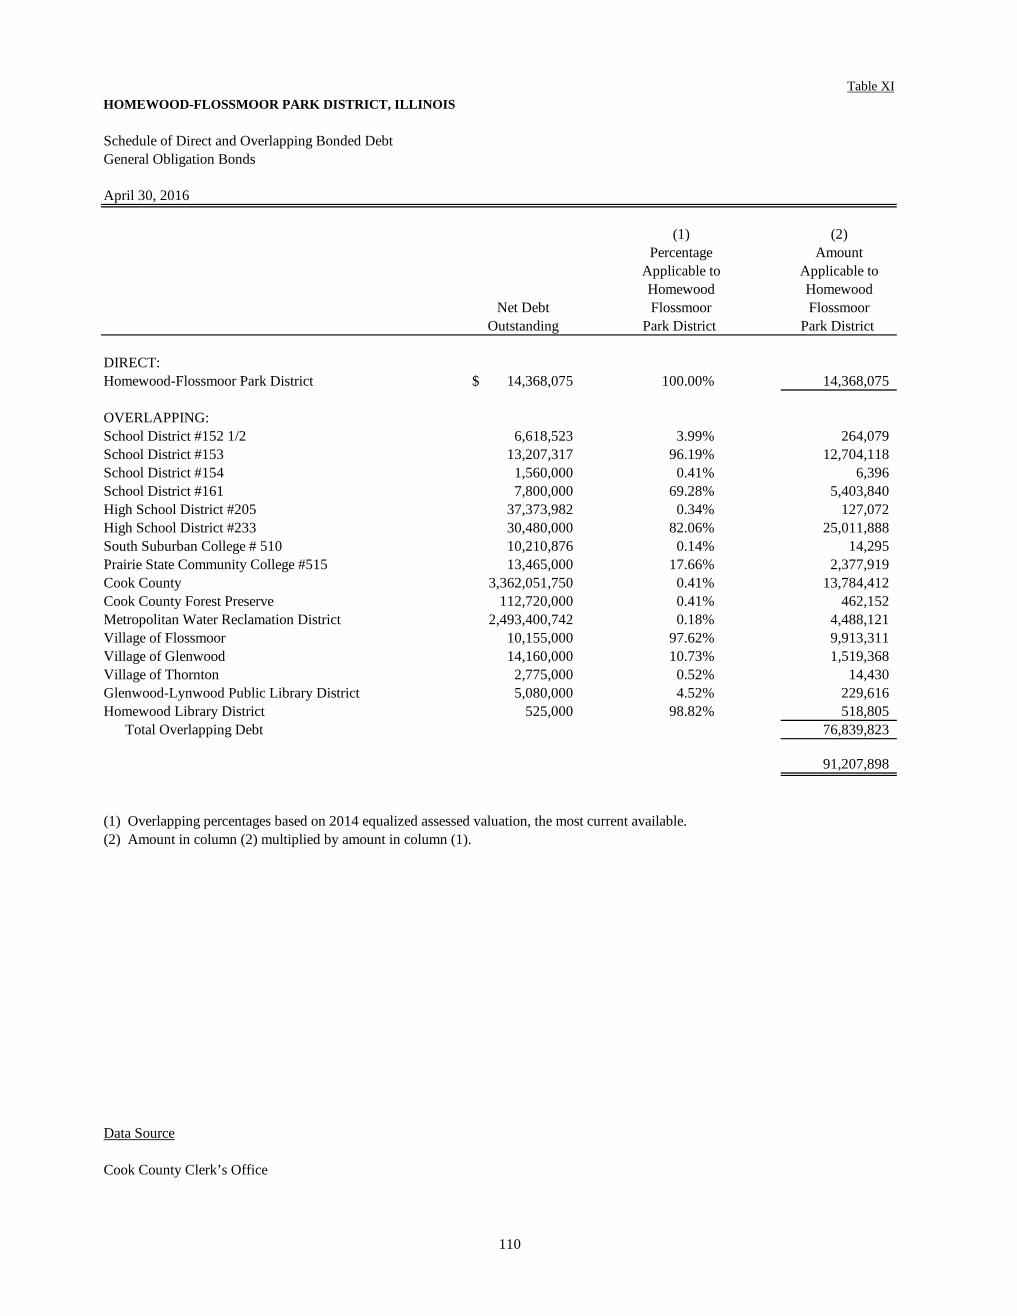
110
Table XIHOMEWOOD-FLOSSMOOR PARK DISTRICT, ILLINOIS
Schedule of Direct and Overlapping Bonded DebtGeneral Obligation Bonds
April 30, 2016
(1) (2)Percentage Amount
Applicable to Applicable toHomewood Homewood
Net Debt Flossmoor FlossmoorOutstanding Park District Park District
DIRECT:Homewood-Flossmoor Park District 14,368,075$ 100.00% 14,368,075
OVERLAPPING:School District #152 1/2 6,618,523 3.99% 264,079 School District #153 13,207,317 96.19% 12,704,118 School District #154 1,560,000 0.41% 6,396 School District #161 7,800,000 69.28% 5,403,840 High School District #205 37,373,982 0.34% 127,072 High School District #233 30,480,000 82.06% 25,011,888 South Suburban College # 510 10,210,876 0.14% 14,295 Prairie State Community College #515 13,465,000 17.66% 2,377,919 Cook County 3,362,051,750 0.41% 13,784,412 Cook County Forest Preserve 112,720,000 0.41% 462,152 Metropolitan Water Reclamation District 2,493,400,742 0.18% 4,488,121 Village of Flossmoor 10,155,000 97.62% 9,913,311 Village of Glenwood 14,160,000 10.73% 1,519,368 Village of Thornton 2,775,000 0.52% 14,430 Glenwood-Lynwood Public Library District 5,080,000 4.52% 229,616 Homewood Library District 525,000 98.82% 518,805
Total Overlapping Debt 76,839,823
91,207,898
(1) Overlapping percentages based on 2014 equalized assessed valuation, the most current available.(2) Amount in column (2) multiplied by amount in column (1).
Data Source
Cook County Clerk’s Office

111
Table XIIHOMEWOOD-FLOSSMOOR PARK DISTRICT, ILLINOIS
Ratio of Net General Obligation Bonded Debt to Assessed Valueand Net General Obligation Bonded Debt Per Capita
Last Ten Levy Years
April 30, 2016
Tax Levy Year 2015 2014 2013 2012
Population (1) 29,874 29,874 29,874 29,874
Assessed Value (2) 515,980,908$ 531,515,849 555,731,195 595,064,146
Debt from Governmental Activities 14,368,075 14,718,950 11,579,018 10,524,773 Debt from Business Activities 1,760,000 1,945,000 2,500,000 3,145,000
Total Debt 16,128,075 16,663,950 14,079,018 13,669,773
Less General Obligation (Alternate Revenue Source) (15,085,000) (15,535,000) (12,880,243) (12,419,773) Less Restricted for Debt Service 560,890 (556,268) (571,735) (576,174) Net General Obligation Bonded Debt (3) 1,043,075 1,128,950 627,040 673,826
Ratio of Net General Obligation BondedDebt to Assessed Value 0.20% 0.21% 0.11% 0.11%
Net General Obligation Bonded Debt Per Capita 35 38 21 23
Data Source
See Table X(1) U.S. Department of Commerce, Bureau of Census(2) Cook County Clerk’s Office - 2015 data(3) District Records
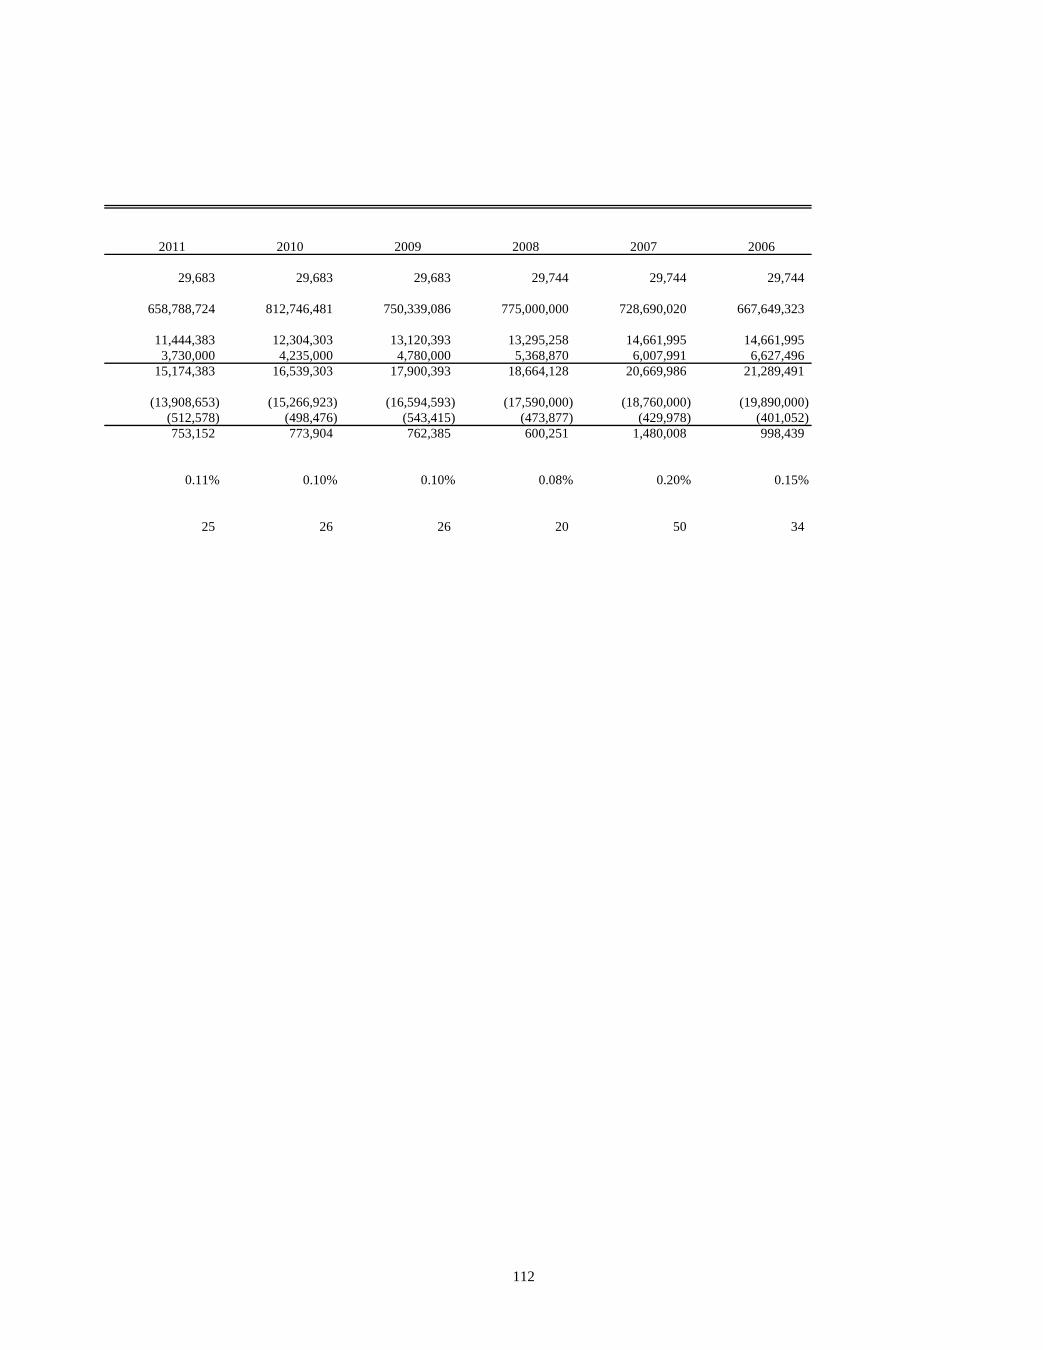
112
2011 2010 2009 2008 2007 2006
29,683 29,683 29,683 29,744 29,744 29,744
658,788,724 812,746,481 750,339,086 775,000,000 728,690,020 667,649,323
11,444,383 12,304,303 13,120,393 13,295,258 14,661,995 14,661,995 3,730,000 4,235,000 4,780,000 5,368,870 6,007,991 6,627,496
15,174,383 16,539,303 17,900,393 18,664,128 20,669,986 21,289,491
(13,908,653) (15,266,923) (16,594,593) (17,590,000) (18,760,000) (19,890,000) (512,578) (498,476) (543,415) (473,877) (429,978) (401,052) 753,152 773,904 762,385 600,251 1,480,008 998,439
0.11% 0.10% 0.10% 0.08% 0.20% 0.15%
25 26 26 20 50 34
DEMOGRAPHIC AND ECONOMIC INFORMATION
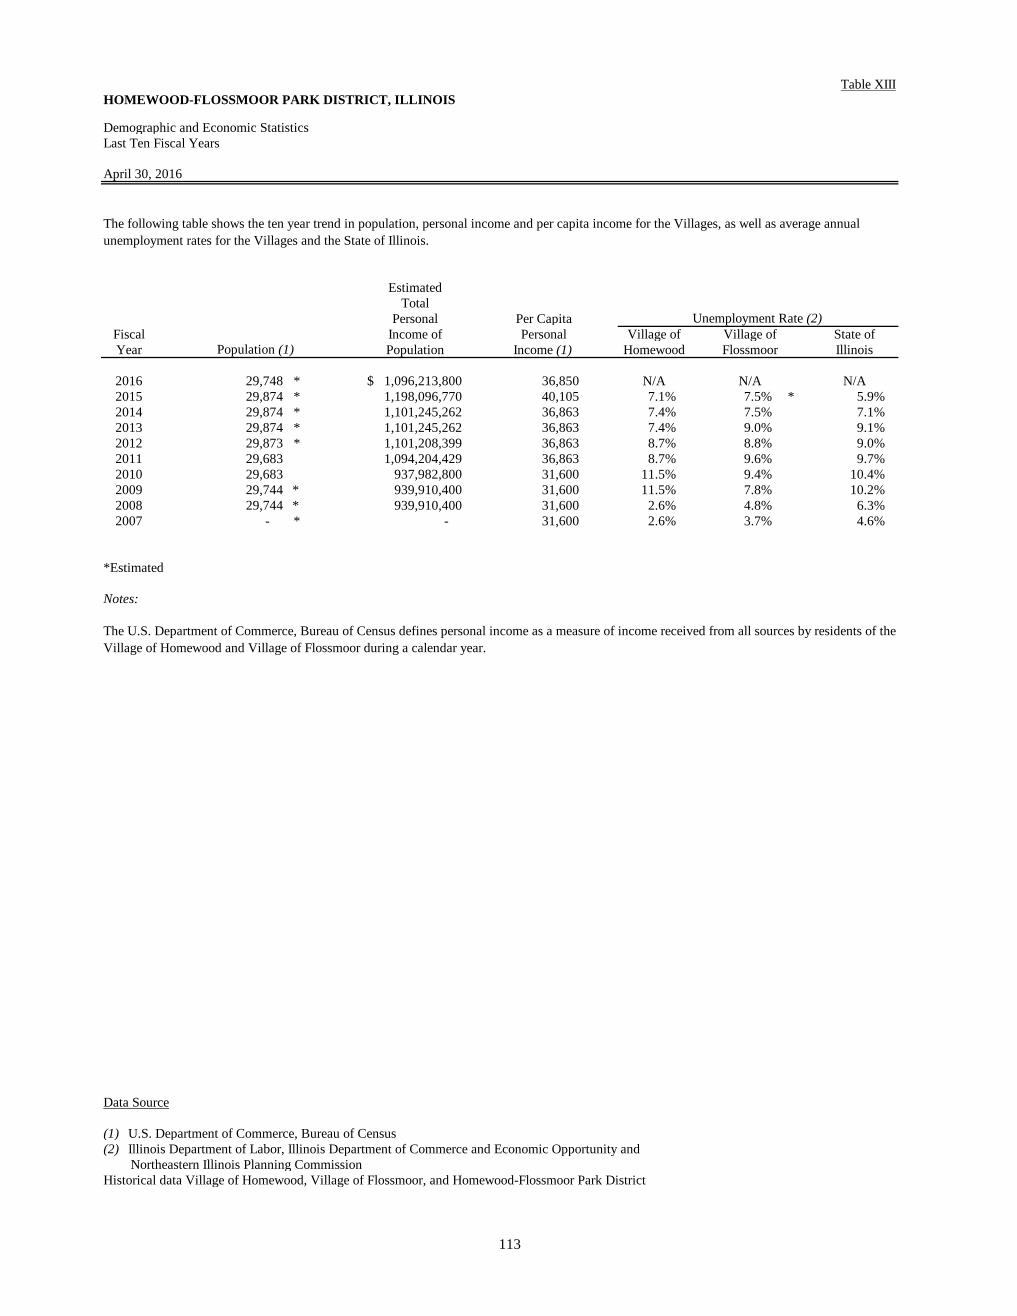
113
Table XIIIHOMEWOOD-FLOSSMOOR PARK DISTRICT, ILLINOIS
Demographic and Economic StatisticsLast Ten Fiscal Years
April 30, 2016
EstimatedTotal
Personal Per CapitaFiscal Income of Personal Village of Village of State ofYear Population Income (1) Homewood Flossmoor Illinois
2016 29,748 * 1,096,213,800$ 36,850 N/A N/A N/A2015 29,874 * 1,198,096,770 40,105 7.1% 7.5% * 5.9%2014 29,874 * 1,101,245,262 36,863 7.4% 7.5% 7.1%2013 29,874 * 1,101,245,262 36,863 7.4% 9.0% 9.1%2012 29,873 * 1,101,208,399 36,863 8.7% 8.8% 9.0%2011 29,683 1,094,204,429 36,863 8.7% 9.6% 9.7%2010 29,683 937,982,800 31,600 11.5% 9.4% 10.4%2009 29,744 * 939,910,400 31,600 11.5% 7.8% 10.2%2008 29,744 * 939,910,400 31,600 2.6% 4.8% 6.3%2007 - * - 31,600 2.6% 3.7% 4.6%
*Estimated
Notes:
Data Source
(1) U.S. Department of Commerce, Bureau of Census(2) Illinois Department of Labor, Illinois Department of Commerce and Economic Opportunity and Northeastern Illinois Planning CommissionHistorical data Village of Homewood, Village of Flossmoor, and Homewood-Flossmoor Park District
The following table shows the ten year trend in population, personal income and per capita income for the Villages, as well as average annual unemployment rates for the Villages and the State of Illinois.
The U.S. Department of Commerce, Bureau of Census defines personal income as a measure of income received from all sources by residents of the Village of Homewood and Village of Flossmoor during a calendar year.
Population (1)
Unemployment Rate (2)

114
Table XIVHOMEWOOD-FLOOSMOOR PARK DISTRICT, ILLINOIS
District EmployersCurrent Fiscal Year and Nine Years Ago
April 30, 2016
Percentof Total
Approximate DistrictEmployer Product/Service Rank Employment Population
Candian Northern Railroad Corporate Headquaters 1 700 2.34%Comcast Telecommunications 2 450 1.51%Jewel/Osco Grocery Stores 2 450 1.51%School District 161 Elementary School District 4 336 1.12%School District 153 Elementary School District 5 331 1.11%Homewood-Flossmoor High School High School 6 324 1.08%Benefit Administrative Systems Medical Claims Processing 7 200 0.67%Village of Homewood Municipality 8 210 0.70%Village of Flossmoor Municipality 9 151 0.51%Ingalls Family Care Center Medical Center 10 150 0.50%Target Retail Store 10 150 0.50%Manor Health Care Rehabilitation and Healthcare 10 150 0.50%Home Depot, Inc. Home Improvement & Building Super Kmart Retail StorePrudential Partners Real Estate Brokers
3,602 12.06%
Information is intended to be presented for the current year and nine years prior. However, 2007 is the latest data available.
Data Source
2016 Illinois Manufacturer’s Directory, 2016 Illinois Services Directory and a selective telephone survey Park District bond recordsVillage of Homewood and Village of Flossmoor records
2016

115
Percentof Total
Approximate DistrictRank Employment Population
0.00%
0.00%3 239 0.81%
0.00%2 300 1.02%
10 90 4 200 0.68%7 120 0.41%
1 400 1.36%5 150 6 130 0.44%8 115 0.39%9 10 0.03%
1,754 5.15%
2007

OPERATING INFORMATION

116
Table XVHOMEWOOD-FLOSSMOOR PARK DISTRICT, ILLINOIS
Full-Time Equivalent EmployeesLast Ten Fiscal Years
April 30, 2016
Function/Program 2016 2015 2014 2013 2012
General GovernmentAdministration 13.5 12.4 12.5 12.7 12.6 Recreation 33.8 32.9 31.8 34.1 35.5 Museum 10.2 10.2 9.3 9.6 10.2 Maintenance 19.7 20.1 19.8 20.7 21.2
Total General Government 77.3 75.5 73.4 77.0 79.6
Business-type EntitiesRacquet Club
Administration 25.7 26.9 28.1 26.6 28.3 Maintenance 8.0 7.6 8.1 8.5 8.6
Artificial Ice Skating RinkAdministration 6.6 6.9 7.1 6.8 7.5 Maintenance 2.2 2.4 2.7 2.7 2.7
Golf CourseAdministration 8.6 7.8 8.2 9.4 10.6 Maintenance 5.5 4.8 5.1 5.3 5.5 Restaurant 11.9 12.1 13.0 12.1 1.3
Total Business-type Entities 68.4 68.4 72.3 71.3 64.6
Total District 145.7 144.0 145.7 148.3 144.1
Data Source
Park District Records - classified by primary functionTotal hours/2080 hours = estimated full-time employees

117
2011 2010 2009 2008 2007
13.0 14.9 14.9 15.2 14.0 35.0 37.8 39.0 37.6 36.9 11.4 11.0 12.3 11.8 11.5 20.3 21.4 21.7 20.3 19.5 79.8 85.1 87.9 84.9 81.9
27.5 27.8 29.3 28.4 29.7 8.3 8.4 8.4 8.5 8.2
8.3 10.0 9.0 8.1 9.5 2.2 2.3 2.8 3.4 4.1
11.2 11.3 11.4 12.1 11.2 5.4 5.2 5.9 5.8 6.4
63.0 65.1 66.7 66.3 69.1
142.8 150.1 154.6 151.2 151.0
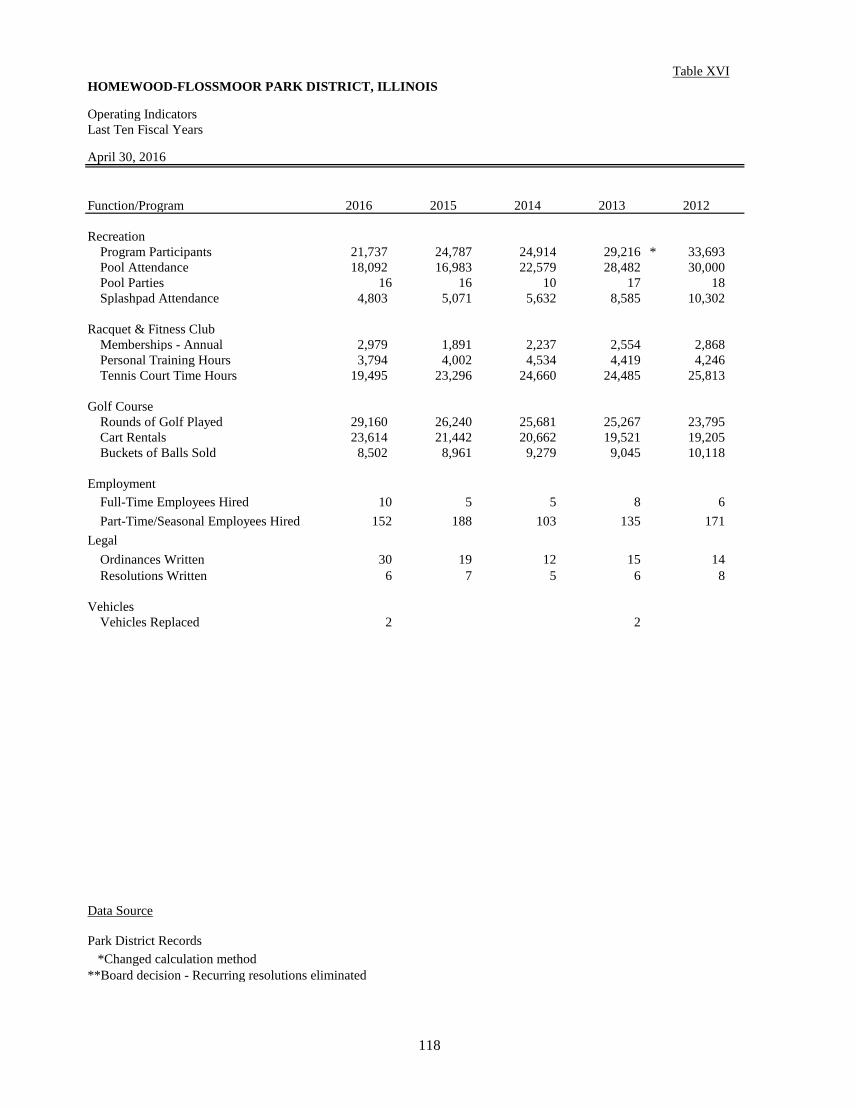
118
Table XVIHOMEWOOD-FLOSSMOOR PARK DISTRICT, ILLINOIS
Operating IndicatorsLast Ten Fiscal Years
April 30, 2016
Function/Program 2016 2015 2014 2013 2012
RecreationProgram Participants 21,737 24,787 24,914 29,216 * 33,693 Pool Attendance 18,092 16,983 22,579 28,482 30,000 Pool Parties 16 16 10 17 18 Splashpad Attendance 4,803 5,071 5,632 8,585 10,302
Racquet & Fitness ClubMemberships - Annual 2,979 1,891 2,237 2,554 2,868 Personal Training Hours 3,794 4,002 4,534 4,419 4,246 Tennis Court Time Hours 19,495 23,296 24,660 24,485 25,813
Golf CourseRounds of Golf Played 29,160 26,240 25,681 25,267 23,795 Cart Rentals 23,614 21,442 20,662 19,521 19,205 Buckets of Balls Sold 8,502 8,961 9,279 9,045 10,118
EmploymentFull-Time Employees Hired 10 5 5 8 6 Part-Time/Seasonal Employees Hired 152 188 103 135 171
LegalOrdinances Written 30 19 12 15 14 Resolutions Written 6 7 5 6 8
VehiclesVehicles Replaced 2 2
Data Source
Park District Records *Changed calculation method**Board decision - Recurring resolutions eliminated

119
2011 2010 2009 2008 2007
32,619 34,560 33,435 32,498 28,538 28,162 26,530 37,599 29,704 27,057
18 33 46 41 36 11,811 8,060 9,334 9,399 7,276
3,151 3,848 3,340 3,299 3,442 3,622 3,349 3,294 3,385 3,539
26,318 26,429 25,780 25,837 25,737
26,442 27,444 28,184 28,480 27,217 18,662 19,654 20,144 20,411 19,416 10,469 12,775 13,416 14,956 13,062
5 2 2 7 10 95 139 173 177 169
14 19 13 14 18 9 4 ** 11 14 12
1 5 5 2

120
Table XVIIHOMEWOOD-FLOSSMOOR PARK DISTRICT, ILLINOIS
Capital Asset Statistics and Function/ProgramLast Ten Fiscal Years
April 30, 2016
Function/Program 2016 2015 2014 2013 2012 2011
RECREATIONPlaygrounds 22 21 21 21 21 21Parks 30 30 30 30 30 30Vollyball 4 4 4 4 4 4Health Club 1 1 1 1 1 1Outdoor Tennis Courts 24 24 24 24 24 24Indoor Tennis Courts 10 10 10 10 10 10Racquetball/Handball Courts 2 2 2 2 2 2Indoor Ice Arena 1 1 1 1 1 1Soccer Fields 11 11 11 11 11 11Basketball Courts - Indoor 3 3 3 3 3 3Baseball Fields 13 13 13 13 13 13Softball Fields 8 8 8 8 8 8Jogging & Bike Trails 10 10 10 10 10 10Golf Courses 1 1 1 1 1 1Driving Range 1 1 1 1 1 1Indoor Golf Simulator 1 1 1 1 1 1Recreation Centers 1 1 1 1 1 1Swimming Pools - Outdoor 1 1 1 1 1 1Swimming Pools - Indoor 1 1 1 1 1 1Water Slide 1 1 1 1 1 1Water Playground 1 1 1 1 1 1Fishing 1 1 1 1 1 1Dog Park 1 1 1 1 1 1Skate Park 1 1 1 1 1 1Rollerblade - Outdoor 1 1 1 1 1 1Nature Museum 1 1 1 1 1 1Cross Country Skiing 1 1 1 1 1 1Sledding Hill 2 2 2 2 2 2Gymnasium 2 2 2 2 2 2
Data Source
Park District Records

121
2010 2009 2008 2007
21 21 21 2130 30 30 30
4 4 4 41 1 1 1
24 24 24 2410 10 10 10
2 2 2 31 1 1 1
11 11 11 113 3 3 3
13 13 13 138 8 8 8
10 10 10 101 1 1 11 1 1 11 1 - -1 1 1 11 2 2 21 1 1 11 1 1 11 1 1 11 1 1 11 1 1 11 1 1 11 1 1 11 1 1 11 1 1 12 2 2 22 2 2 2

122
Table XVIIIHOMEWOOD-FLOSSMOOR PARK DISTRICT, ILLINOIS
Surety Bonds of Principal Officials
April 30, 2016
Amount ofPrincipal Official Surety Bond
Executive Director 2,000,000$
Superintendent of Finance & Administration 2,000,000
Data Source
Schedule of Insurance in Force