
COMPREHENSIVE ANNUAL FINANCIAL REPORT FOR FISCAL YEAR ENDED … › sites › default › files ›...
178
CITY OF BURLINGTON VERMONT COMPREHENSIVE ANNUAL FINANCIAL REPORT FOR FISCAL YEAR ENDED JUNE 30, 2016
Transcript of COMPREHENSIVE ANNUAL FINANCIAL REPORT FOR FISCAL YEAR ENDED … › sites › default › files ›...

CITY OF BURLINGTON VERMONT
COMPREHENSIVE ANNUAL FINANCIAL REPORT FOR FISCAL YEAR ENDED JUNE 30, 2016

(This page intentionally left blank.)

CITY OF BURLINGTON, VERMONT Comprehensive Annual Financial Report
For the Year Ended June 30, 2016
Prepared by: The Clerk Treasurer Office
Bob Rusten Rich Goodwin Ann Barton Chief Administrative Officer Director of Financial Operations Comptroller

(This page intentionally left blank.)

CITY OF BURLINGTON, VERMONT
TABLE OF CONTENTS PAGE INTRODUCTORY SECTION: Transmittal Letter 1 Organization Chart 6 Principal Officials 7 Department and Division Heads 8 FINANCIAL SECTION: INDEPENDENT AUDITORS’ REPORT 11 MANAGEMENT’S DISCUSSION AND ANALYSIS 17 BASIC FINANCIAL STATEMENTS:
Government-wide Financial Statements:
Statement of Net Position 31
Statement of Activities 33 Fund Financial Statements:
Governmental Funds:
Balance Sheet 35
Reconciliation of Total Governmental Fund Balances to Net Position of Governmental Activities in the Statement of Net Position 36
Statement of Revenues, Expenditures, and Changes in Fund Balances 37
Reconciliation of the Statement of Revenues, Expenditures, and Changes in Fund Balances of Governmental Funds to the Statement of Activities 38
General Fund Statement of Revenues and Other Sources, and Expenditures and Other Uses - Budget and Actual 39 Proprietary Funds:
Statement of Net Position 40
Statement of Revenues, Expenses, and Changes in Fund Net Position 42
Statement of Cash Flows 43

Fiduciary Funds:
Statement of Fiduciary Net Position 45
Statement of Changes in Fiduciary Net Position 46 Component Units:
Statement of Net Position 47
Statement of Activities 49 Notes to Financial Statements 50 REQUIRED SUPPLEMENTARY INFORMATION
Schedules of OPEB Funding Progress, Net Pension Liability, Employer Contributions, and Investment Returns 119
Schedule of Changes in the Employers’ Net Pension Liability 120 SUPPLEMENTARY STATEMENTS AND SCHEDULES
Combining Financial Statements:
Governmental Funds:
Combining Balance Sheet – Nonmajor Governmental Funds 128
Combining Statement of Revenues, Expenditures, and Changes in Fund Equity – Nonmajor Governmental Funds 134 Proprietary Funds:
Combining Statement of Net Position – Nonmajor Proprietary Funds 140
Combining Statement of Revenues, Expenses, and Changes in Fund Net Position – Nonmajor Proprietary Funds 141
Combining Statement of Cash Flows – Nonmajor Proprietary Funds 142 Fiduciary Funds:
Combing Statement of Fiduciary Net Position – Private Purpose Trust Funds 144
Combing Statement of Change in Fiduciary Net Position – Private Purpose Trust Funds 145 STATISTICAL SECTION: Financial Trends
Net Position by Component – Last Ten Years 150

Changes in Net Position – Last Ten Years 151
Fund Balances of Governmental Funds – Last Ten Years 153
Changes in Fund Balances of Governmental Funds – Last Ten Years 154 Revenue Capacity
Assessed Value and Estimated Actual Value of Taxable Property – Last Ten Fiscal Years 155
Property Tax Rates – Direct and Overlapping Governments - Last Ten Fiscal Years 156
Principal Property Taxpayers – Current Year and Nine Years Ago 157
Property Tax Levies and Collections – Last Ten Fiscal Years 158 Debt Capacity
Ratios of Outstanding Debt by Type – Last Ten Fiscal Years 159
Ratios of General Bonded Debt Outstanding – Last Ten Fiscal Years 160
Direct and Overlapping Governmental Activities Debt – June 30, 2016 161
Legal Debt Margin Information – June 30, 2016 162
Airport Enterprise Fund Bond Coverage – Last Ten Fiscal Years 163 Demographic and Economic Information
Demographic and Economic Indicators – Last Ten Years 164
Principal Employers – Current Year and Nine Years Ago 165 Operating Information
Full Time Equivalent Employees by Function/Program – Last Ten Years 166
Operating Indicators by Function/Program – Last Ten Years 167
Capital Asset Statistics by Function/Program – Last Ten Years 168

(This page intentionally left blank.)

INTRODUCTORY SECTION

(This page intentionally left blank.)

1
January 24, 2017 Mayor and City Council City of Burlington 149 Church Street Burlington, VT 05401 To the Citizens, Mayor, and City Council of the City of Burlington: The Comprehensive Annual Financial Report of the City of Burlington for the Fiscal Year ended June 30, 2016, is hereby submitted. Responsibility for both the accuracy of the data, and the completeness and fairness of the presentation, including all disclosures, rests with the City. To the best of our knowledge and belief, the following data, including financial state-ments, supporting schedules and statistical tables, is accurate in all material respects and is reported in a manner designed to present fairly the financial position and results of operations of the City. To provide a reasonable basis for making representations, management has established a comprehensive internal control framework that is designed to both protect the government’s assets from loss, theft, or misuse and compile sufficient reliable information to the preparation of the financial statements in conformity with Generally Accepted Accounting Principles (GAAP). Because the cost of internal control should not exceed anticipated bene-fits, the objective is to provide reasonable, rather than absolute, assurance that the financial statements are free of any material misstatements. Fiscal year 2016 represents the first year that the City of Burlington has compiled a Comprehensive Annual Financial Report (CAFR). The compilation of this report required a substantial time investment by the Clerk/Treasurer’s Office, but we are proud to continue our commitment to expanded disclosures of our financial position and results of operations. City Charter, as well as State statues, requires an annual audit by independent certified public accounts. The City’s audit firm is Melanson Heath. The independent auditors’ report is located at the front of the financial section of this report. In addition, the audit was designed to meet the requirements of the Single Audit Act Amendments of 1996, including require-ments relating to preparation of the schedule of expenditures of federal awards, or Title 2 CFR Part 200, Uniform Administrative Requirements, Cost Principles, and Audit Require-ments of Federal Awards (the Uniform Guidance), as applicable. Information related to the Single Audit, including the Schedule of Expenditures of Federal Awards, findings and recommendations, and auditor’s reports on the internal control structure and compliance with applicable laws and regulations, is not included in this year’s CAFR but is available in a separate report. Management’s discussion and analysis (MD&A) immediately follows the independent auditors’ report and provides a narrative introduction, overview, and analysis of the basic financial statements. MD&A complements this letter of transmittal and should be read in conjunction with it for additional narrative overview and analysis of the City’s activities.

2
THE CITY OF BURLINGTON The source for this section is the Introduction to Official Statement, dated November 1, 2016. Description of the City The City of Burlington, Vermont (the “City”) is the largest city in Vermont and located in northwestern Vermont on the eastern shore of Lake Champlain directly across from northern New York State. The City is the commercial center of Chittenden County and encompasses 16 square miles. The City is 90 miles south of Montreal, Quebec, 220 miles northwest of Boston, Massachusetts, and 300 miles north of New York, New York. Highways serving Burlington include State Highways 2 and 7 and Interstates U.S. 89 and 189. The Lake Champlain Transportation Company operates ferries on Lake Champlain between Vermont and New York. The Burlington International Airport serves over 1.2 million passengers per year and accom-modates non-stop air service to all three New York City area airports, Philadelphia, both Washington D.C. airports, Chicago, Atlanta, Charlotte, NC, Orlando/Sanford, FL, Detroit, and seasonally to Toronto. Passengers can reach nearly any destination world-wide with just one connection from Burlington. Bus service is provided by Greyhound Lines, Megabus, and Vermont Trans Lines (operated by Vermont Agency of Transportation). Freight service is provided by the Vermont Railway Corporation and Rail America. The Chittenden County Transportation Authority, which rep-resents Burlington, Essex Junction, South Burlington, Shelburne, Charlotte and Winooski, provides local bus service. Form of Government Burlington was incorporated as a City in 1865. On November 7, 2000, voters approved amendments to the City Charter providing for direct Mayoral appointment of department heads with City Council confirmation, clarified the Mayor’s authority as the City’s Chief Executive Officer, established the position of Chief Administrative Officer, and provided that City commissions would become advisory except when authority was re-delegated by the City Council. City Services The City provides the full range of municipal services including police and fire protection, emergency medical services, street construction and maintenance, solid waste management, traffic signalization, planning and zoning, community and economic development, parks and recreation, library services, youth services, arts programs, educational and general adminis-trative services. The City also operates the following major enterprise funds: (1) electric, (2) water, (3) sewage collection and treatment, (4) airport facilities and (5) telecommunica-tion services.

3
Community Amenities Located between the highest section of the Green Mountains and the widest part of Lake Champlain, the City of Burlington enjoys superb scenery and outstanding year-round recrea-tional opportunities. Cultural activities abound and are encouraged by the participation of businesses, educational institutions, and government. Several theaters for the performing arts, theater troupes, muse-ums, fairs, and festivals fill the City’s cultural calendar, while Burlington City Arts, a City Department, provides a well-known gallery for the display of contemporary art, as well as events including music, film, and performance. The University of Vermont Medical Center is the state’s academic medical center and serves approximately one million people in Vermont and New York. UVM Medical Center includes three founding organizations – Medical Center Hospital of Vermont, Fanny Allen Hospital, and University Health Center – and the UVM College of Medicine. The Vermont Regional Cancer Center and the Vermont-New Hampshire Regional Red Cross Blood Center are also located in Greater Burlington. Burlington is also known throughout the state and the nation for its innovative and entre-preneurial spirit. The City of Burlington was the first city in the country to use 100% renew-able energy for the electricity needs of its residents. The Burlington International Airport is leading the industry with its continued amenity upgrades, such as the Mamava nursing mothers’ pod, green roof which includes solar panels and a garden, as well as free wifi and convenient access. Meanwhile a range of notable companies, from Seventh Generation to Dealer.com to Burton, are proud to call Burlington home. Burlington is regularly recognized in nationally published periodicals as one of the best places to live. The City’s location, economic climate, and abundance of community resources con-tributed to its award as the most livable city in America for cities of less than 100,000 people by the U.S. Conference of Mayors in 1989. Since then, the City has enjoyed numerous awards from national publications recognizing the City for its beauty, sustainability, and livability. Highlights include: In 2008 a U.S. Centers for Disease Control and Prevention named the City America’s health-iest city. In May 2010, Forbes.com named the City “prettiest town in America” and “one of the best cities for new jobs this spring”. In June 2010, Kiplinger’s recognized Burlington as “one of the 10 best cities in the United States for the decade.” In December 2010, the City received a Home Depot Foundation Award of “Excellence for Sustainable Community Development.” In March 2011, Gallup-Healthways Poll listed the City as #1 of the top 10 small cities for well-being.

4
In October 2011, Livability.com Magazine listed the City as #3 in its top 10 downtowns ranking. In 2012, Gallup-Healthways Poll ranked the City #3 of the top 10 cities in the nation for well-being. Cheapflights.com ranked the Burlington International Airport 4th in the United States for airport affordability based on August 2013 prices In September 2013, Kiplinger ranked the City #2 on their “Great Places to Live” list. In August 2014, The SpareFoot Blog ranked the City #10 among top 12 college towns for commuting. In 2015, Men’s Health Magazine named the City as “Top 10 Places to Live Now.” Economic Activity The Greater Burlington area, which includes the City of Burlington and all of Chittenden County, is Vermont’s major economic area. Most of the County’s nonfarm employment lies within the three-community region of Burlington, Essex and South Burlington. Manufactur-ing employment represents approximately 10% of the nonagricultural employment in the Burlington area labor market. Non-manufacturing employment accounts for approximately 90% of employment. Education and health services, government and trade are principal areas of non-manufacturing employment in the Greater Burlington area. Chittenden County has provided the bulk of the State’s economic growth over the past ten years, which is reflected in the area’s employment statistics. The Burlington Labor Market Area had an annual unemployment rate of 2.9% in June 2015. The State’s unemployment rate was 3.6% as of June 2015. Employment Data The Greater Burlington area possesses a growing, educated work force with skills in a variety of areas. To keep a supply of workers skilled to meet the needs of new and existing business and industry, the State of Vermont assists with tuition-free training of new Vermont employees. Educational institutions, such as the University of Vermont, provide customized training pro-grams and continuing education required by technicians and others in rapidly changing tech-nological fields. Employment opportunities in Burlington and Chittenden County have grown to more than match growth in the area’s work force. Housing Market Since 2010 and through December 2015, the median sales price of single family homes in Burlington increased 12.9% to $310,000. During that same period, condominium sales prices have increased 6.7% to $230,000. The City contains approximately 6,675 owner-occupied

5
housing units, accounting for 16% of Chittenden County’s 42,085 owner-occupied units. The number of single family primary residences sold in Burlington has remained relatively stable since tracking data began in 1988, though 2015 showed a 25% increase against the average. Single family home sales in 2015 were 229. A number of homes sold in Burlington that fall below the median sale price are purchased through Champlain Housing Trust (CHT) or Green Mountain Habitat for Humanity. CHT and Green Mountain Habitat for Humanity have placed resale restriction covenants on over 236 homes in Burlington. These organizations receive operating or development grants from the City in order to ensure an adequate supply of homes for low and moderate income residents. The rental housing market in Burlington remains very strong, though low vacancy rates pose a challenge for prospective renters. According to the December 2015 Allen & Brooks Report, Burlington’s rental vacancy rate is 3.0%. The low vacancy rate pushes demand for rental housing up which results in increased rental rates. Various forms of rental housing assistance for low to moderate-income households are provided by the Burlington Housing Authority, Champlain Housing Trust, and several other nonprofit housing corporations. Vermont enjoys a low foreclosure rate relative to the national average, but saw an increase in foreclosures throughout the summer of 2015 for a foreclosure rate of 1 in every 4,363 homes; Chittenden County enjoys a slightly lower rate of 1 in every 6,000. Burlington has seen a steady decline in foreclosures since 2009, when 40 homes went into foreclosure in the wake of the economic recession. In 2014, eight Burlington homes went into foreclosure, the lowest number in 11 years. Acknowledgements This report reflects the City’s commitment to improve and maintain financial statements in conformity with the highest standards of accountability. The strong financial position and excellent financial results reflected in this report would not have been possible without the leadership, and fiscal policies established by the Mayor, City Council, Chief Administrative Officer, and the hard work and dedication of the finance and accounting team. Respectfully submitted,
Bob Rusten Rich Goodwin Chief Administrative Officer Director of Financial Operations

6
As of June 30, 2016

7
CITY OF BURLINGTON, VERMONT PRINCIPAL OFFICIALS
Initial Term Current Term
Commenced Expires Miro Weinberger Mayor 2012 2018
City Council
Sharon Foley Bushor Ward 1 1987 2018 Max Tracy Ward 2 2012 2018 Sara Giannoni Ward 3 2015 2018 Kurt Wright Ward 4 2013 2018 William “Chip” Mason Ward 5 2012 2018 Karen Paul Ward 6 2008 2018 Tom Ayres Ward 7 2013 2018 Adam Roof Ward 8 2015 2018 Selene Colburn East District 2014 2017 Jane Knodell, President Central District 2013 2017 Dave Hartnett North District 2011 2017 Joan Shannon South District 2003 2017
Clerk Treasurer Office
Bob Rusten Chief Administrative Officer Rich Goodwin Director of Financial Operations Ann Barton Amy Bovee Lori Olberg
Comptroller Assistant City Clerk License / Voter/ Records Coordinator

8
CITY OF BURLINGTON, VERMONT DEPARTMENT AND DIVISION HEADS
OFFICE OF THE MAYOR
Mayor Miro Weinberger CLERK TREASURER’S OFFICE
Chief Administrative Officer Robert Rusten Director of Financial Operations Richard Goodwin Comptroller Ann Barton
LEGAL City Attorney & Corporate Counsel Eileen Blackwood
INNOVATION & TECHNOLOGY Chief Innovation Officer Beth Anderson
HUMAN RESOURCES Direct of Human Resources Susan Leonard
POLICE DEPARTMENT Chief of Police Brandon del Pozo Deputy Chief Jannine Wright Deputy Chief Shawn Burke
FIRE DEPARTMENT Chief Engineer Steven Locke
DEPARTMENT OF PUBLIC WORKS Director Chapin Spencer City Engineer Norman Baldwin
CODE ENFORCEMENT Code Enforcement Director William Ward
PARKS, RECREATION & WATERFRONT Director & Harbormaster Jesse Bridges
COMMUNITY & ECONOMIC DEVELOPMENT OFFICE Director Noelle MacKay
FLETCHER FREE LIBRARY Director Rubi Simon
SCHOOL DEPARTMENT Superintendent Yaw Obeng
ASSESSOR’S OFFICE City Assessor John Vickery
BURLINGTON INTERNATIONAL AIRPORT Director of Aviation Eugene Richards
CHURCH STREET MARKETPLACE Executive Director Ron Redmond
BURLINGTON TELECOM General Manager Stephen Barraclough
BURLINGTON CITY ARTS Executive Director Doreen Kraft
BURLINGTON ELECTRIC DEPARTMENT General Manager Nealle Lunderville
PLANNING & ZONING Director David White
As of June 30, 2016

FINANCIAL SECTION

10
(This page intentionally left blank.)

102 Perimeter RoadNashua, NH 03063(603)882-1111melansonheath.com
Additional Offices:Andover, MAGreenfield, MAManchester, NHEllsworth, ME
11
INDEPENDENT AUDITORS’ REPORT To the Honorable Mayor and City Council City of Burlington, Vermont Report on the Financial Statements We have audited the accompanying financial statements of the governmental activities, the business-type activities, the aggregate discretely presented component units, each major fund, and the aggregate remaining fund information of the City of Burlington, Vermont (the City), as of and for the year ended June 30, 2016, and the related notes to the financial statements, which collectively comprise the City’s basic financial statements as listed in the Table of Contents. Management’s Responsibility for the Financial Statements The City’s management is responsible for the preparation and fair presentation of these finan-cial statements in accordance with accounting principles generally accepted in the United States of America; this includes the design, implementation, and maintenance of internal control relevant to the preparation and fair presentation of financial statements that are free from material misstatement, whether due to fraud or error. Auditors’ Responsibility Our responsibility is to express opinions on these financial statements based on our audit. We did not audit the financial statements of the Burlington Electric Enterprise Fund which represents 41 percent, 28 percent, and 60 percent, of the assets and deferred outflows, net position and revenues of the business-type activities respectively. Those financial statements were audited by other auditors whose report thereon has been furnished to us, and our opinion, insofar as it relates to the amounts included for the Burlington Electric Enterprise Fund and its effects on the business-type activities, is based solely on the report of the other auditors. Also, we did not audit the financial statements of the Burlington School District, which represents 91 percent, 91 percent and 99 percent, of the assets and deferred outflows, net position and revenues of the aggregate discretely presented component units. The financial statements of Burlington School District were audited by other auditors whose report thereon has been furnished to us, and our opinion, insofar as it relates to the amounts included for the School District is based solely on the report of the other auditors. We conducted our audit in accordance with auditing standards generally accepted in the United States of America and the standards applicable to financial audits contained in Government Auditing Standards, issued by the Comptroller General of the United States. Those standards require that we plan and perform the audit to obtain reasonable assurance about whether the

12
financial statements are free from material misstatement. The financial statements of the Burlington Electric Department, a major proprietary fund, were not audited in accordance with Government Auditing Standards. An audit involves performing procedures to obtain audit evidence about the amounts and disclosures in the financial statements. The procedures selected depend on the auditors’ judgment, including the assessment of the risks of material misstatement of the financial statements, whether due to fraud or error. In making those risk assessments, the auditor considers internal control relevant to the entity’s preparation and fair presentation of the financial statements in order to design audit procedures that are appropriate in the circum-stances, but not for the purpose of expressing an opinion on the effectiveness of the entity’s internal control. Accordingly, we express no such opinion. An audit also includes evaluating the appropriateness of accounting policies used and the reasonableness of significant accounting estimates made by management, as well as evaluating the overall presentation of the financial statements. We believe that the audit evidence we have obtained is sufficient and appropriate to provide a basis for our audit opinions. Opinions In our opinion, based on our audit and the reports of the other auditors, the financial statements referred to above present fairly, in all material respects, the respective financial position of the governmental activities, business-type activities, each major fund, the aggre-gate discretely presented component units, and the aggregate remaining fund information of the City, as of June 30, 2016, and the respective changes in financial position and, where applicable, cash flows thereof and the respective budgetary comparison for the General fund for the year then ended in accordance with accounting principles generally accepted in the United States of America. Other Matters Required Supplementary Information Accounting principles generally accepted in the United States of America require that Management’s Discussion and Analysis, the Schedule of OPEB Funding Progress, the Schedule of Changes in Net Pension Liability, and the Schedules of Net Pension Liability, Contributions, and Investment Returns be presented to supplement the basic financial state-ments. Such information, although not a part of the basic financial statements, is required by the Governmental Accounting Standards Board, who considers it to be an essential part of financial reporting for placing the basic financial statements in an appropriate operational, economic, or historical context. We have applied certain limited procedures to the required supplementary information in accordance with auditing standards generally accepted in the United States of America, which consisted of inquiries of management about the methods of preparing the information and comparing the information for consistency with management’s responses to our inquiries, the basic financial statements, and other knowledge we obtained

13
during our audit of the basic financial statements. We do not express an opinion or provide any assurance on the information because the limited procedures do not provide us with evidence sufficient to express an opinion or provide any assurance. Other Information Our audit was conducted for the purpose of forming opinions on the financial statements that collectively comprise the City’s basic financial statements. The combining and individual nonmajor fund financial statements are presented for purposes of additional analysis and are not a required part of the basic financial statements. Such information is the responsibility of manage-ment and was derived from and relates directly to the underlying accounting and other records used to prepare the financial statements. The information has been subjected to the auditing procedures applied in the audit of the financial statements and certain additional procedures, including comparing and reconciling such information directly to the underlying accounting and other records used to prepare the financial statements or to the financial statements themselves, and other additional procedures in accordance with auditing standards generally accepted in the United States of America. In our opinion, the information is fairly stated in all material respects in relation to the financial statements as a whole. Our audit was conducted for the purpose of forming opinions on the financial statements that collectively comprise the City’s basic financial statements. The introductory and statistical sections are presented for purposes of additional analysis and are not a required part of the basic financial statements. Such information has not been subjected to the auditing procedures applied in the audit of the basic financial statements and, accordingly, we do not express an opinion or provide any assurance on it. Other Reporting Required by Government Auditing Standards In accordance with Government Auditing Standards, we have also issued our report dated January 24, 2017 on our consideration of the City's internal control over financial reporting and on our tests of its compliance with certain provisions of laws, regulations, contracts, and grant agreements and other matters. The purpose of that report is to describe the scope of our testing of internal control over financial reporting and compliance and the results of that testing, and not to provide an opinion on internal control over financial reporting or on compliance. That report is an integral part of an audit performed in accordance with Government Auditing Standards in considering the City’s internal control over financial reporting and compliance.
January 24, 2017

14
(This page intentionally left blank.)

15
BASIC FINANCIAL STATEMENTS

16
(This page intentionally left blank.)

17
MANAGEMENT’S DISCUSSION AND ANALYSIS As management of the City of Burlington (the City), we offer readers this narrative overview and analysis of the financial activities of the City for the fiscal year ended June 30, 2016. Unless otherwise noted, all amounts are expressed in thousands.
A. OVERVIEW OF THE FINANCIAL STATEMENTS
This discussion and analysis is intended to serve as an introduction to the basic financial statements. The basic financial statements comprise three components: (1) government-wide financial statements, (2) fund financial statements, and (3) notes to financial state-ments. This report also contains other supplementary information in addition to the basic financial statements themselves. Government-wide financial statements. The government-wide financial statements are designed to provide readers with a broad overview of our finances in a manner similar to a private-sector business. The Statement of Net Position presents information on all assets, liabilities, and deferred outflows/inflows of resources with the difference reported as net position. Over time, increases or decreases in net position may serve as a useful indicator of whether the financial position is improving or deteriorating. The Statement of Activities presents information showing how the City’s net position changed during the most recent fiscal year. All changes in net position are reported as soon as the underlying event giving rise to the change occurs, regardless of the timing of related cash flows. Thus, revenues and expenses are reported in this statement for some items that will only result in cash flows in future fiscal periods (e.g., uncollected taxes, earned but unused vacation leave, and net pension liability). Both of the government-wide financial statements distinguish functions that are princi-pally supported by taxes and intergovernmental revenues (governmental activities) from other functions that are intended to recover all or a significant portion of their costs through user fees and charges (business-type activities). The governmental activities include general government, public safety, public works, culture and recreation, and com-munity development. The business-type activities include the operation of the Airport, Electric, Water, Wastewater, and Stormwater Utilities, Telecommunications (including cable television, internet access, and telephone service). Fund financial statements. A fund is a grouping of related accounts that is used to main-tain control over resources that have been segregated for specific activities or objectives. Fund accounting is used to ensure and demonstrate compliance with finance-related legal requirements. All of the funds can be divided into three categories: governmental funds, proprietary funds, and fiduciary funds. Governmental funds. Governmental funds are used to account for essentially the same functions reported as governmental activities in the government-wide financial state-

18
ments. However, unlike the government-wide financial statements, governmental fund financial statements focus on near-term inflows and outflows of spendable resources, as well as on balances of spendable resources measurable and available at the end of the fiscal year. Such information may be useful in evaluating a government’s near-term financing requirements. Because the focus of governmental funds is narrower than that of the government-wide financial statements, it is useful to compare the information presented for governmental funds with similar information presented for governmental activities in the government-wide financial statements. By doing so, readers may better understand the long-term impact of the City’s near-term financing decisions. Both the governmental fund balance sheet and the governmental fund statement of revenues, expenditures, and changes in fund balances provide a reconciliation to facilitate this comparison between governmental funds and governmental activities. An annual appropriated budget is adopted for the general fund. A budgetary comparison statement has been provided for the general fund to demonstrate compliance with this budget. Proprietary funds. Proprietary funds are maintained as follows: Enterprise funds are used to report the same functions presented as business-type activities in the government-wide financial statements. Specifically, enterprise funds are used to account for Airport, Electric, Telecom, Wastewater, Water, and Stormwater. Proprietary funds provide the same type of information as the business-type activities reported in the government-wide financial statements, only in more detail. The proprie-tary fund financial statements provide separate information for the Airport and Electric which are considered to be major funds. Fiduciary funds. Fiduciary funds are used to account for resources held for the benefit of parties outside the City. Fiduciary funds are not reflected in the government-wide financial statements because the resources of those funds are not available to support the City’s own programs. The accounting used for fiduciary funds is much like that used for proprietary funds. Notes to financial statements. The notes provide additional information that is essential to a full understanding of the data provided in the government-wide and fund financial statements. Other information. In addition to the basic financial statements and accompanying notes, this report also presents certain required supplementary information which is required to be disclosed by accounting principles generally accepted in the United States of America.
B. FINANCIAL HIGHLIGHTS (in thousands)
As of the close of the current fiscal year, the total of assets exceeded liabilities by $316,119 (i.e., net position), a change of $27,566 in comparison to the prior year.

19
As of the close of the current fiscal year, governmental funds reported combined ending fund balances of $24,148, a change of $4,617 in comparison to the prior year.
At the end of the current fiscal year, unassigned fund balance for the general fund was $6,520, a change of $2,233 in comparison to the prior year.
Total long-term liabilities at the close of the current fiscal year were $257,783, a change of $6,365 in comparison to the prior year.
Total net position of the City’s component units, the Burlington Community Develop-ment Corporation and the Burlington School District, amounted to $14,981, an increase of $2,800 for the year
The nonspendable portion of the governmental funds balance was $3,856 which con-sists of inventories, prepaid assets, and permanent funds, as well as general fund advances to other funds not expected to be repaid within a short period of time. $10,330 of the governmental funds balance is restricted for specific purposes. In addition, $5,916 is committed for purposes funded by dedicated revenue. This leaves the City with an unassigned fund balance of $4,047.
C. GOVERNMENT-WIDE FINANCIAL ANALYSIS
The following is a summary of condensed government-wide financial data for the current and prior fiscal years.
2016 2015 2016 2015 2016 2015
Current and other assets $ 47,197 $ 44,199 $ 97,796 $ 91,045 $ 144,993 $ 135,244 Capital assets 134,091 126,353 299,941 297,193 434,032 423,546
Total assets 181,288 170,552 397,737 388,238 579,025 558,790
Deferred outflows of resources 11,476 5,485 7,070 3,504 18,546 8,989
Total assets and deferred outflows $ 192,764 $ 176,037 $ 404,807 $ 391,742 $ 597,571 $ 567,779
Long-term liabilities outstanding $ 93,519 $ 89,212 $ 164,264 $ 162,206 $ 257,783 $ 251,418 Other liabilities 9,248 8,366 12,651 13,529 21,899 21,895
Total liabilities 102,767 97,578 176,915 175,735 279,682 273,313
Deferred inflows of resources 1,770 4,122 - 1,791 1,770 5,913
Net position:Net investment in capital assets 92,236 82,986 179,096 172,630 271,332 255,616 Restricted 17,725 16,800 20,813 19,319 38,538 36,119 Unrestricted (21,734) (25,449) 27,983 22,267 6,249 (3,182)
Total net position 88,227 74,337 227,892 214,216 316,119 288,553
Total liabilities, deferred inflows of resources and net position $ 192,764 $ 176,037 $ 404,807 $ 391,742 $ 597,571 $ 567,779
NET POSITION (000s)Governmental
ActivitiesBusiness-Type
Activities Total

20
2016 2015 2016 2015 2016 2015Revenues:
Program revenues:Charges for services $ 25,439 $ 23,141 $ 105,128 $ 103,117 $ 130,567 $ 126,258 Operating grants and contributions 4,516 5,922 205 - 4,721 5,922 Capital grants and contributions 4,688 3,113 9,119 7,432 13,807 10,545
General revenues:Property taxes 31,409 33,054 - - 31,409 33,054 Rooms and meals tax 3,907 3,665 - - 3,907 3,665 Local sales option tax 2,240 2,180 - - 2,240 2,180 Payment in lieu of tax 5,079 2,396 - - 5,079 2,396 Franchise fees 2,377 2,128 - - 2,377 2,128 Impact fees 139 350 - - 139 350 Interest and penalties on delinquent taxes 339 356 - - 339 356 Investment income 194 101 185 127 379 228 Dividends from associated companies - - 3,236 3,129 3,236 3,129 Other revenue 642 1,175 274 429 916 1,604
Total revenues 80,969 77,581 118,147 114,234 199,116 191,815
Expenses:Governmental activities:
General government 11,354 12,393 - - 11,354 12,393 Public safety 23,501 24,915 - - 23,501 24,915 Public works 15,484 17,038 - - 15,484 17,038 Culture and recreation 10,067 10,736 - - 10,067 10,736 Community development 4,895 4,931 - - 4,895 4,931 Interest on long-term debt 1,782 1,582 - - 1,782 1,582
Business-type activities:Electric - - 63,913 62,409 63,913 62,409 Airport - - 19,754 20,289 19,754 20,289 Non-major - - 20,804 19,931 20,804 19,931
Total expenses 67,083 71,595 104,471 102,629 171,554 174,224
Change in net position before transfers, additions to permanent fund principal, and special items 13,886 5,986 13,676 11,605 27,562 17,591
Additions to permanent fund principal 4 67 - - 4 67 Transfers in (out) - 29 - (29) - -
Change in net position 13,890 6,082 13,676 11,576 27,566 17,658
Net position - beginning of year 74,337 68,255 214,216 202,640 288,553 270,895
Net position - end of year $ 88,227 $ 74,337 $ 227,892 $ 214,216 $ 316,119 $ 288,553
Governmental Activities
Business-TypeActivities Total
CHANGES IN NET POSITION (000s)

21
The largest portion of net position $271,333 reflects our investment in capital assets (e.g., land, buildings, machinery, equipment, and infrastructure); less any related debt used to acquire those assets that is still outstanding. These capital assets are used to pro-vide services to citizens; consequently, these assets are not available for future spending. Although the investment in capital assets is reported net of related debt, it should be noted that the resources needed to repay this debt must be provided from other sources, since the capital assets themselves cannot be used to liquidate these liabilities. An additional portion of net position of $38,538 represents resources that are subject to external restrictions on how they may be used. The remaining balance of unrestricted net position of $6,248 represents a combination of our governmental activities and business-type activities or enterprise funds. Our governmental activities unrestricted net position is $(21,734). The negative balance primarily results from recognizing our Net Pension Liability in accordance with Governmental Accounting Standards Board (GASB) State-ment Number 68, Accounting and Financial Reporting for Pensions. See financial state-ment notes for additional information. Our business-type activities unrestricted net posi-tion is $27,819. The majority of this balance is derived from our Electric Enterprise Fund. Governmental activities. Governmental activities for the year resulted in a change in net position of $13,890. Key elements of this change are as follows:
General fund revenues over expenditures $ 5,082 Change in net pension liability, net of related deferred outflows/inflows 1,631 Capital assets acquired with property tax revenue, grants, and contributions 7,310 Depreciation in excess of principal debt service expense (2,083) Other 1,950
Total $ 13,890
Our net pension liability (Governmental Activities only) increased by $(6,391) over the prior year primarily resulting from actual investment earnings being less than expected. In accordance with GASB 68, the difference between expected and actual results was reported as deferred outflow of $3,657 in FY16 as compared to deferred inflow of $4,122, a change of $7,779. The deferred outflow will be amortized over the next 4 years, resulting in future increases to pension expenses as disclosed in Note 25. Business-type activities. Business-type activities for the year resulted in a change in net position of $13,676. Key elements of this change are discussed in Section D of the Man-agement’s Discussion and Analysis.
D. FINANCIAL ANALYSIS OF THE CITY’S FUNDS
Governmental funds. The focus of governmental funds is to provide information on near-term inflows, outflows, and balances of spendable resources. Such information is

22
useful in assessing financing requirements. In particular, unassigned fund balance may serve as a useful measure of the City’s net resources available for spending at the end of the fiscal year. As of the end of the current fiscal year, governmental funds reported combined ending fund balances of $24,148, a change of $4,617 in comparison to the prior year. Key ele-ments of this change are as follows:
General fund revenues and transfers in, in excess of expenditures and other financing uses $ 3,749 Special revenue fund revenues, transfers in and issuance of debt in excess of expenditures and transfers out (mostly Traffic and CEDO) 923 Capital project fund expenditures and transfers out in excess of revenues and other financing sources (55)
Total $ 4,617
The general fund is the chief operating fund. At the end of the current fiscal year, unassigned fund balance of the general fund was $6,520, while total fund balance was $12,000. As a measure of the general fund’s liquidity, it may be useful to compare both unassigned fund balance and total fund balance to total general fund expenditures. Refer to the table below, and also Note 2A.
City General Fund 6/30/16 6/30/15 Change
Unassigned fund balance $ 6,520 $ 4,287 $ 2,233 11.7%Total fund balance $ 12,000 $ 8,251 $ 3,749 21.5%
% ofTotal General
Fund Expenditures
The general fund unassigned fund balance positive increase of $2,233 results from the positive operating results reported in the budget and actual comparative schedule. The following table summarizes the activity in the general fund unassigned fund balance:
Unassigned fund balance, June 30, 2015 $ 4,287 Budgetary use of fund balance (1,577) Actual revenues greater than budgeted 1,088 Actual expenditures less than budgeted 2,928 Other (206)
Unassigned fund balance, June 30, 2016 $ 6,520

23
The City issued $9,000 in fiscal stability bonds in fiscal year 2013 to reduce reliance on tax anticipation notes. In accordance with the Governmental Accounting Standards Board’s Statement 54, the City has classified the $9,000 as a component of unassigned fund balance because the authorized stability bonds do not contain any specific spending purpose constraints. In fact, the bonds were issued as taxable bonds since the purpose was not to finance specific capital governmental projects for the City as is customarily financed by tax-exempt bonds. Without the issues of the stability bonds, the City’s unassigned fund balance would have been $(2,480). In accordance with the bond resolution, as stated by Bond Council; the City can use the proceeds for working capital, and cash flow needs.
Proprietary funds. Proprietary funds provide the same type of information found in the business-type activities reported in the government-wide financial statements, but in more detail. A comparison of the unrestricted net position of each enterprise compared to the prior year is show below:
6/30/16 6/30/15 Change
Electric $ 17,766 $ 15,918 $ 1,848 Airport 4,063 2,805 1,258 Nonmajor funds: Telecom 96 (48) 144 Wastewater 3,016 1,929 1,087
Water 2,418 1,102 1,316 Stormwater 624 560 64
Total $ 27,983 $ 22,266 $ 5,717
Unrestricted Net Position
Specific factors concerning the finances of each proprietary fund are discussed below: The Electric Department reported an increase in net position of $3,508 due to lower
personnel costs in 2016 associated with the reduction and replacement of positions related to the voluntary buyout and increased capital contributions offsetting certain capital projects. For additional information, please refer the separate financial state-ments issued for the Electric Department.
The Burlington International Airport’s unrestricted net position increased from the previous year due to a variety of reasons including principal debt service payments being less than asset depreciation (which reduced net investment in capital assets and increased unrestricted net positon) and operations. For additional information, please refer the separate financial statements issued for the Airport Enterprise Fund.
The Burlington Telecom’s unrestricted net position increased slightly during fiscal year 2016 despite an overall increase in net position of $1,558. Telecom’s cash flows

24
provided by operations were used to acquire additional capital assets resulting in a $1.5 million increase in net investment in capital assets component of net position, thereby leaving unrestricted net position essentially unchanged.
The net increase in the Wastewater, Water and Stormwater Funds (which are managed on a combined basis) is primarily the result of operations due to increased user fees.
E. GENERAL FUND BUDGETARY HIGHLIGHTS
The City approved a fiscal year 2016 budget of $68,551 including dedicated taxes, tax increment financing and interdepartmental charges that were netted against appropria-tions for the presentation on the budget and actual statement in the financial statements. The following is a reconciliation of the approved fiscal year 2016 appropriation with the amounts reported on the General fund budget and actual comparison statement on page 39:
City approved appropriation $ 68,551 Less dedicated taxes: Capital streets program (2,243) Open space (196) Housing Trust Pennies for parks (364) Less tax increment (2,415) Less interdepartmental charges (2,507) Less other charges (341)
Appropriation reported $ 60,485
The City’s adopted general fund budget for fiscal year 2016 after amendments resulted in a surplus of $1,309. The adjusted actual performance (budgetary basis) resulted in reve-nues and other sources exceeding expenditures and other uses by $2,439. This variance is primarily attributable to: Revenue from housing and development licenses and certificates exceeded budget
expectations by $640 due to several large projects requiring additional permitting including, but not limited to, the Hospital, Grove Street and University Place. This revenue is included in charges for services category.
Revenue from building permits exceeded expectations by $775.
Various departments had significant unspent appropriations in the General Admin-istration and Public Works functions. The lighter than normal snow fall contributed to these positive operating results.
The City encumbered approximately $1,200 of the unspent appropriations.

25
F. CAPITAL ASSET AND DEBT ADMINISTRATION
Capital assets. Total investment in capital assets for governmental activities at year-end amounted to $134,091 (net of accumulated depreciation), a change of $7,738 from the prior year. Total investment in capital assets for business-type activities at year-end amounted to $299,942 (net of accumulated depreciation), a change of $2,749 from the prior year. This investment in capital assets includes land, construction in progress, build-ings, improvements, infrastructure, intangible assets, and vehicles, machinery, equip-ment, and furniture. Major capital asset events during the current fiscal year for Governmental Activities included the following:
Burlington College, 12 acres $500 Bike path rehabilitation 706 Champlain parkway construction 816 Cliff St. sidewalk repairs 309 Manhattan Dr. west slope repair 671 Pine & Lakeside traffic signal 379 Waterfront access north construction 3,243 Wayfinding construction 340 College St. garage, phase 1 1,150 Various street paving 1,513 Public works vehicles 662 CNG fueling facility upgrade 302
Major capital asset events during the current fiscal year for Business-Type Activities included the following:
Electric major fund: o Distribution plant construction $2,700 o Production plant construction 1,023
Airport major fund: o Security update 1,055 o Land acquisition, and demolition 3,169 o Air carrier apron, phase 2 2,064 o Taxiway K construction 1,833
Nonmajor Enterprise funds: o Telecom - fiber electronics 497 o Water – south reservoir reline 218 o Water – filter plant rebuilt 217
Additional information on capital assets can be found in the Notes to the Financial Statements.

26
Change in credit rating. On March 2, 2016 Moody’s Investor Service (Moody’s) assigned an A3 rating to the City’s general obligation debt with a stable outlook. Moody’s rated the certificates of participation at Baa1 and Baa2, with a stable outlook. These ratings were maintained subsequent to year end, on October 4, 2016. Moody’s maintained Burlington International Airport’s rating of Baa3 on December 11, 2015 with stable outlook. Moody’s upgraded BED credit rating from Baa2 to Baa1 with stable outlook on November 9, 2015. Long-term debt. The table below outlines our long-term debt (bonds payable) at the cur-rent and prior year end. Revenue bonds are backed by pledged revenues of the respective enterprise funds and other debt is backed by full faith and credit of the government.
6/30/16 6/30/15 Change
Governmental Activities:City $ 44,244 $ 46,423 $ (2,179)
Business-Type Activities:Electric 74,720 76,501 (1,781) Airport 37,040 38,690 (1,650) Wastewater 15,191 16,076 (885) Water 228 228 - Stormwater 376 394 (18)
Subtotal bussiness-type 127,555 131,889 (4,334)
Component Units:School District 28,653 28,010 643
3,846 4,081 (235)
Subtotal bussiness-type 32,499 32,091 408
Total $ 204,298 $ 210,403 $ (6,105)
Burlington Community Development Corporation
Additional information on long-term debt can be found in the Notes to the Financial Statements.

27
Net pension liability. The following is an analysis of the City’s and our component units’ net pension liability at the end of the current and prior fiscal years. The majority (approx-imately $11,276) of this increase will increase pension expense and therefore reduce unrestricted net position over the next four years.
6/30/16 6/30/15 Change
Governmental Activities:City $ 40,989 $ 34,597 $ 6,392
Business-Type Activities:Electric 12,674 9,427 3,247 Airport 2,169 1,278 891 Telecom 1,124 746 378 Wastewater 856 533 323 Water 1,170 790 380
Subtotal bussiness-type 17,993 12,774 5,219
Component Unit:School District 9,182 6,458 2,724
Total $ 68,164 $ 53,829 $ 14,335
Net Pension Liability
G. ECONOMIC FACTORS AND NEXT YEAR’S BUDGETS AND RATES
Mayor’s Overview Summary: the FY17 budget represents progress and good news on many fronts The City’s FY17 Budget builds on the financial progress we have made together over the past four years and projects to achieve more of the City’s goals than any of our prior budget submissions. The budget continues to strengthen the City’s fiscal position while also including critical new investments in public safety, infrastructure, and City service quality. It continues to expand opportunities for all Burlingtonians through investment in the Housing Trust Fund at nearly double its historic rate and through new services at the Library and in an Old North End community center. As a result of hard and disciplined work by Department Heads, the City Council, and the CAO’s office, progress on some of structural financial challenges, as well as a strong and growing economy, the FY17 budget achieves all of this and more while also responding to the concerns of Burlingtonians about rising property tax rates by slightly lowering taxes for the second year in a row. FY17 budget reduces municipal tax rate for second year in a row For the second year in a row, the municipal tax rate will be slightly lower than the preceding year. The FY17 decrease will be about a penny per hundred dollars of property

28
value. The two years of modest tax rate decreases together represent progress restraining the property tax growth, a major constituent priority. The largest factor in the tax rate reduction is the refinancing of the City’s General Fund debt, made possible by the restoration of the City’s “A” credit rating in March 2016 and resulting in a decrease in the portion of the municipal tax rate related to debt service. In explaining their decision to upgrade the City’s rating, Moody’s Financial Services (which evaluates the risk associated with Burlington’s debt) called out the City’s improved liquidity, conservative budgeting, prudent expenditure management, and commitment to addressing financial pressures in a responsible manner. Budget again includes substantial new investment in public safety These new efforts include:
Becoming one of the first agencies in New England to deploy body cameras for all of our sworn officers.
Increasing substantially the number of foot patrols and bike patrols in the City.
Creating new community engagement and domestic violence officer positions to build trust and communication with the community and respond to one of our largest public safety concerns.
Organizing the new CommunityStat initiative that will attempt to effectively help coordinate the many agencies that are working on some element of opiate challenge.
The FY17 budget continues expanded infrastructure investment Last year, the FY16 budget funded the first year of the 10-year Capital Plan using a number of secured and anticipated one-time sources to increase capital investment by $2.3 million. This additional investment focused on three areas: Enhanced sidewalk fund-ing; $1 million for continuing the expansion and rebuilding of the Bike Path from the Urban Reserve to North Beach; and Substantial investments in City facilities, especially in criti-cal deferred maintenance items identified in our recent independent study of City facilities. The FY17 General Fund Budget includes significant new investments intended to save money and continue to strengthen the City’s finances In recent years we have pursued numerous strategies that required up-front investment to achieve medium and long-term financial progress. These strategies have included:
An agency-wide re-organization and early retirement initiative at BED.
Creation of a centralized purchasing position.
Replacement of short-term debt with the Fiscal Stability Bond.
Creation of new Assistant City Attorney positions to take legal work in house.
Energy-efficiency investments in City facilities.

29
Cumulatively, these and other efforts have saved the City millions of dollars and played a significant role in the tax rate decreases of the last two years and our success at maintain-ing energy rates at their 2009 levels for another year. The FY17 budget also includes a number of new investments similarly designed to build on this track record and achieve sustained savings over time, including:
The creation of a new municipal risk management position that will assess liabili-ties in the City’s operations and direct efforts to improve workplace safety and reduce claims against the City.
Additional investment in information technology modernization, and the creation of new network and data positions.
Retention of a management consultant to evaluate efficiency opportunities in some major General Fund departments.
FY17 Budget Expands Opportunity for Burlingtonians The FY17 budget includes important new or recent investments in expanded opportunity for Burlingtonians of all backgrounds, including:
Continued funding of the Housing Trust Fund at historically high levels.
Funding for a new community center in the Old North End.
Continued investment in the expansion of Library Services youth services. Conclusion: the FY17 Budget represents the institutionalizing of important steps toward greater municipal financial health and improved operations.

30
REQUESTS FOR INFORMATION This financial report is designed to provide a general overview of the City of Burlington’s finances for all those with an interest in the government’s finances. Questions concerning any of the information provided in this report or requests for additional financial information can be found on the City’s web page at www.burlingtonvt.gov or should be addressed to:
Clerk/Treasurer Office City Hall
149 Church Street Burlington, Vermont 05401

31
Governmental Business-TypeActivities Activities Total
ASSETS AND DEFERRED OUTFLOWS OF RESOURCES
ASSETS:Current:
Cash and cash equivalents $ 24,387,316 $ 25,090,056 $ 49,477,372 $ 12,016,808 Investments 3,271,842 - 3,271,842 199,408 Restricted investments - 630,031 630,031 - Receivables, net of allowance for uncollectibles:
Property taxes 1,928,929 - 1,928,929 - User fees - 8,217,267 8,217,267 - Departmental and other 2,233,976 - 2,233,976 180,862 Intergovernmental 6,006,717 2,691,909 8,698,626 4,472,482 Estimated unbilled revenues - 3,616,807 3,616,807 -
Capital lease receivable - - - 98,400 Due from component unit 66,731 70,007 136,738 - Due from fiduciary fund 2,000,000 - 2,000,000 - Inventory 474,851 6,087,618 6,562,469 44,639 Prepaid expenses 438,852 80,117 518,969 23,162 Other assets 73,320 1,005,721 1,079,041 3,425
Total current assets 40,882,534 47,489,533 88,372,067 17,039,186
Noncurrent:Restricted cash - 12,881,416 12,881,416 - Restricted investments - 7,931,468 7,931,468 - Due from component unit 221,600 734,084 955,684 - Notes and loans receivable 4,933,306 - 4,933,306 - Capital lease receivable - - - 1,455,266 Accrued interest receivable 1,159,316 - 1,159,316 - Investment in associated companies - 25,990,556 25,990,556 - Regulatory assets and other prepaid charges - 2,767,707 2,767,707 - Capital assets:
Land and construction in progress 39,207,548 61,005,832 100,213,380 4,879,802 Intangible asset - 5,400,000 5,400,000 - Other capital assets, net of
accumulated depreciation 94,883,640 233,535,682 328,419,322 42,455,831
Total noncurrent assets 140,405,410 350,246,745 490,652,155 48,790,899
TOTAL ASSETS 181,287,944 397,736,278 579,024,222 65,830,085
Deferred Outflows of Resources - pension related 11,136,299 6,582,319 17,718,618 2,522,582 Deferred Outflows of Resources - non pension related 339,762 487,796 827,558 201,196
TOTAL ASSETS AND DEFERRED OUTFLOWS OF RESOURCES $ 192,764,005 $ 404,806,393 $ 597,570,398 $ 68,553,863
PresentedComponent
Units
CITY OF BURLINGTON, VERMONT
STATEMENT OF NET POSITION
JUNE 30, 2016
Primary Government Discretely
(continued)

32
(continued)
Governmental Business-TypeActivities Activities Total
PresentedComponent
Units
Primary Government Discretely
LIABILITIES, DEFERRED INFLOWS OF RESOURCES AND NET POSITION
LIABILITIES:Current:
Accounts payable $ 4,531,207 $ 5,600,101 $ 10,131,308 $ 2,107,324 Accrued payroll and benefits payable 1,270,930 112,429 1,383,359 - Accrued liabilities 264,210 - 264,210 1,407,984 Accrued interest payable 256,573 837,762 1,094,335 - Unearned revenue 1,978,212 1,854,485 3,832,697 78,000 Line of credit 833,628 646,602 1,480,230 - Due to primary government - - - 136,738 Due to fiduciary fund - - - 1,268,901 Other liabilities 112,038 2,969,488 3,081,526 3,425 Payable from restricted assets - 630,031 630,031 - Current portion of long-term liabilities:
General obligation bonds and other debt payable 3,445,411 2,300,000 5,745,411 1,315,119 Revenue bonds payable - 4,534,921 4,534,921 - Note payable - 8,485 8,485 - Capital lease payable 413,232 355,447 768,679 26,507 Compensated absences 202,903 - 202,903 255,768 Insurance reserves 918,809 - 918,809 -
14,227,153 19,849,751 34,076,904 6,599,766
Noncurrent:Due to primary government - - - 955,684 General obligation bonds and other debt payable 42,191,389 46,580,636 88,772,025 31,556,805 Revenue bonds payable - 78,656,697 78,656,697 - Long term note payable - 219,521 219,521 - Capital lease payable 792,996 6,197,671 6,990,667 9,053 Compensated absences 1,826,126 1,489,490 3,315,616 2,301,909 Insurance reserves 1,659,536 - 1,659,536 - Net OPEB obligation 1,080,440 667,235 1,747,675 2,518,010 Net pension liability 40,988,644 17,993,590 58,982,234 9,182,200 Regulatory liabilities - 5,132,037 5,132,037 - Other liabilities - 127,960 127,960 417,409
Total noncurrent liabilities 88,539,131 157,064,837 245,603,968 46,941,070
TOTAL LIABILITIES 102,766,284 176,914,588 279,680,872 53,540,836
Deferred Inflows of Resources - pension related 1,770,237 - 1,770,237 32,405
NET POSITION:Net investment in capital assets 92,236,468 179,096,254 271,332,722 15,090,590 Restricted externally or constitutionally for:
Education - - - 1,214,467 Community development 8,963,584 - 8,963,584 - Debt service/renewal and replacements/capital projects 5,522,634 13,347,517 18,870,151 - Contingency reserve - 1,434,845 1,434,845 - Revenue fund - 663,213 663,213 - Deposits with bond trustees - 5,367,315 5,367,315 - Permanent funds:
Nonspendable 909,230 - 909,230 - Spendable 376,215 - 376,215 -
Restricted by enabling legislation 1,953,669 - 1,953,669 - Unrestricted (21,734,316) 27,982,661 6,248,345 (1,324,435)
TOTAL NET POSITION 88,227,484 227,891,805 316,119,289 14,980,622
TOTAL LIABILITIES, DEFERRED INFLOWS OFRESOURCES AND NET POSITION $ 192,764,005 $ 404,806,393 $ 597,570,398 $ 68,553,863
The accompanying notes are an integral part of these financial statements.

33
Operating CapitalCharges for Grants and Grants and Net (Expenses)
Expenses Services Contributions Contributions Revenue
Primary Government:Governmental Activities:
General government $ 11,353,565 $ 5,043,853 $ 241,983 $ 33,243 $ (6,034,486) Public safety 23,500,758 6,997,158 171,963 132,332 (16,199,305) Public works 15,484,410 8,898,625 390,475 3,948,469 (2,246,841) Culture and recreation 10,066,735 4,277,482 340,318 550,499 (4,898,436) Community development 4,895,091 221,533 3,370,836 23,673 (1,279,049) Interest on long-term debt 1,782,295 - - - (1,782,295)
Total Governmental Activities 67,082,854 25,438,651 4,515,575 4,688,216 (32,440,412)
Business-Type Activities:Electric 63,912,747 62,505,682 - 1,483,457 76,392 Airport 19,753,724 18,470,124 154,266 7,635,497 6,506,163 Nonmajor 20,803,532 24,151,054 51,121 - 3,398,643
Total Business-Type Activities 104,470,003 105,126,860 205,387 9,118,954 9,981,198
Total Primary Government $ 171,552,857 $ 130,565,511 $ 4,720,962 $ 13,807,170 (22,459,214)
Discretely Presented Component Units:Burlington School District $ 87,841,148 $ 838,954 $ 28,880,175 $ - $ (58,122,019) Burlington Community
Development Corporation 330,931 364,000 - - 33,069
Total component units $ 88,172,079 $ 1,202,954 $ 28,880,175 $ - $ (58,088,950)
The accompanying notes are an integral part of these financial statements. (continued)
CITY OF BURLINGTON, VERMONT
STATEMENT OF ACTIVITIES
FOR THE YEAR ENDED JUNE 30, 2016
Program Revenues

34
(continued)
DiscretelyBusiness- Presented
Governmental Type ComponentActivities Activities Total Units
Change in Net PositionNet (expenses) revenue
from previous page $ (32,440,412) $ 9,981,198 $ (22,459,214) $ (58,088,950)
General Revenues:Property taxes 31,409,270 - 31,409,270 - Gross receipts taxes 3,906,652 - 3,906,652 - Local option sales tax 2,239,937 - 2,239,937 - Payments in lieu of taxes 5,079,036 - 5,079,036 - Franchise fees 2,376,990 - 2,376,990 - Impact fees 138,723 - 138,723 - Interest and penalties on delinquent taxes 339,034 - 339,034 - General state support - - - 57,332,457 Unrestricted investment earnings 193,991 184,630 378,621 602,485 Dividends from associated companies - 3,236,147 3,236,147 - Other revenues 642,968 273,598 916,566 2,954,175
Additions to permanent funds 3,968 - 3,968 -
Total general revenues and additions to permanent funds 46,330,569 3,694,375 50,024,944 60,889,117
Change in Net Position 13,890,157 13,675,573 27,565,730 2,800,167
Net Position:Beginning of year 74,337,327 214,216,232 288,553,559 12,180,455
End of year $ 88,227,484 $ 227,891,805 $ 316,119,289 $ 14,980,622
Primary Government
CITY OF BURLINGTON, VERMONT
STATEMENT OF ACTIVITIES
FOR THE YEAR ENDED JUNE 30, 2016

35
Nonmajor TotalGovernmental
General Funds Funds
Cash and cash equivalents $ 7,990,315 $ 16,397,000 $ 24,387,315 Investments 2,026,488 1,245,354 3,271,842 Receivables, net of allowance for uncollectibles:
Property and other taxes 1,928,929 - 1,928,929 Departmental and other 1,918,868 315,109 2,233,977 Intergovernmental 594,048 4,221,669 4,815,717
Notes and loans receivable 200,000 4,933,306 5,133,306 Accrued interest receivable - 1,159,316 1,159,316 Due from fiduciary fund 2,000,000 - 2,000,000 Due from other funds 688,529 - 688,529 Advances to other funds 2,033,562 - 2,033,562 Inventory 189,535 285,317 474,852 Prepaid expenditures 438,777 - 438,777 Other current assets 71,522 1,873 73,395 Due from component unit - 288,331 288,331
TOTAL ASSETS $ 20,080,573 $ 28,847,275 $ 48,927,848
Liabilities:Accounts payable $ 1,837,578 $ 2,693,632 $ 4,531,210 Intergovernmental payable - 1,703,111 1,703,111 Accrued payroll and benefits payable 1,168,029 102,901 1,270,930 Accrued liabilities 239,047 25,162 264,209 Unearned revenue 1,978,211 - 1,978,211 Note payable - 200,000 200,000 Line of credit - 833,628 833,628 Due to other funds - 688,529 688,529 Advances from other funds - 2,033,562 2,033,562 Insurance reserve 918,809 - 918,809 Other liabilities 11,155 100,882 112,037
TOTAL LIABILITIES 6,152,829 8,381,407 14,534,236
Deferred Inflows of Resources 1,927,666 8,317,488 10,245,154
Fund Balances:Nonspendable 2,661,874 1,194,547 3,856,421 Restricted 38,500 10,291,502 10,330,002 Committed 2,779,209 3,136,294 5,915,503 Unassigned 6,520,495 (2,473,963) 4,046,532
TOTAL FUND BALANCES 12,000,078 12,148,380 24,148,458
$ 20,080,573 $ 28,847,275 $ 48,927,848
The accompanying notes are an integral part of these financial statements.
OF RESOURCES AND FUND BALANCES
LIABILITIES, DEFERRED INFLOWS OF
ASSETS
CITY OF BURLINGTON, VERMONT
BALANCE SHEET
JUNE 30, 2016
GOVERNMENTAL FUNDS
Governmental
RESOURCES AND FUND BALANCES
TOTAL LIABILITIES, DEFERRED INFLOWS

36
Total governmental fund balances $ 24,148,458
Capital assets used in governmental activities are not financialresources and, therefore, are not reported in the funds. 134,091,188
Revenues are reported on the accrual basis of accountingand are not deferred until collection. 10,245,154
Long-term receivable from Vermont Municipal Bond Bank forgeneral obligation bond drawdowns, net of payable. 2,894,110
Deferred outflows of resources related to pension resulting fromcontributions subsequent to the measurement date will be recognizedas an increase in pension expense in the year ended June 30, 2017. 5,539,955
Deferred outflows of resources related to pension resulting fromchanges in proportional share of contributions, difference betweenexpected and actual pension experience and investment earningswhich will be recognized as an increase in pension expense in theyears ended June 30, 2017 through June 30, 2020. 5,596,344
Deferred debt expense for refunding is net of amortization on the statement of net position, whereas all debt expense is reported 339,762 when paid in the governmental funds.
Deferred inflows of resources related to pension resulting fromchanges in proportion and differences between employer contributions and proportionate share of contributions will be recognized as a reductionof pension expense in the years ending June 30, 2017 throughJune 30, 2019. (1,770,237)
Long-term liabilities, including bonds and other debt payable and net pension obligation, are not due and payable in the current period and, therefore, are not reported in the governmental funds.
General obligation bonds and other debt payable, net of related unamortized premiums (45,636,800)
Capital lease payable (1,206,228)
Compensated absenses payable (2,029,029)
Insurance reserves, long-term (1,659,536)
Net other post-employment benefits payable (1,080,440)
Net pension obligation (40,988,644)
Accrued interest on long-term obligations (256,573)
Net position of governmental activities $ 88,227,484
The accompanying notes are an integral part of these financial statements.
CITY OF BURLINGTON, VERMONT
RECONCILIATION OF TOTAL GOVERNMENTAL FUND
JUNE 30, 2016
BALANCES TO NET POSITION OF GOVERNMENTALACTIVITIES IN THE STATEMENT OF NET POSITION

37
Nonmajor TotalGovernmental
General Funds FundsRevenues:
Taxes $ 33,707,475 $ 5,390,231 $ 39,097,706 Payments in lieu of taxes 5,079,036 - 5,079,036 Licenses and permits 4,939,556 142,713 5,082,269 Intergovernmental 1,352,545 7,217,393 8,569,938 Charges for services 14,945,795 6,553,289 21,499,084 Contributions 486,516 52,362 538,878 Investment income 163,470 30,523 193,993 Loan repayments - 104,033 104,033 Other 224,627 377,222 601,849
Total Revenues 60,899,020 19,867,766 80,766,786
Expenditures:Current:
General government 11,335,648 64,685 11,400,333 Public safety 25,315,019 246,080 25,561,099 Public works 4,339,066 5,449,535 9,788,601 Culture and recreation 10,627,882 1,473,021 12,100,903 Community development 815,336 3,309,706 4,125,042
Capital outlay - 13,179,734 13,179,734 Debt service:
Principal 2,062,222 2,055,388 4,117,610 Interest and bond issue costs 1,322,265 483,457 1,805,722
Total Expenditures 55,817,438 26,261,606 82,079,044
Excess (deficiency) of revenuesover (under) expenditures 5,081,582 (6,393,840) (1,312,258)
Other Financing Sources (Uses):Issuance of bonds and loans - 5,062,083 5,062,083 Issuance of refunding debt 8,785,000 - 8,785,000 Payment to refunding escrow (10,044,139) - (10,044,139) Bond premium 894,052 244,923 1,138,975 Issuance of capital lease 987,234 - 987,234 Transfers in 406,548 4,125,792 4,532,340 Transfers out (2,361,696) (2,170,644) (4,532,340)
Total Other Financing Sources (Uses) (1,333,001) 7,262,154 5,929,153
Net change in fund balances 3,748,581 868,314 4,616,895
Fund Balances, at Beginning of Year 8,251,497 11,280,066 19,531,563
Fund Balances, at End of Year $ 12,000,078 $ 12,148,380 $ 24,148,458
The accompanying notes are an integral part of these financial statements.
CITY OF BURLINGTON, VERMONT
GOVERNMENTAL FUNDS
STATEMENT OF REVENUES, EXPENDITURES AND CHANGES IN FUND BALANCES
FOR THE YEAR ENDED JUNE 30, 2016
Governmental

38
$ 4,616,895
Governmental funds report capital outlays as expenditures. However,in the Statement of Activities the cost of those assets is allocatedover their estimated useful lives and reported as depreciation expense:
Capital outlay purchases 13,979,299
Depreciation (6,200,588)
Loss on disposal of capital assets (40,666)
Revenues in the Statement of Activities that do not provide currentfinancial resources are fully deferred in the Statement of Revenues,Expenditures and Changes in Fund Balances. Therefore, therecognition of revenue for various types of accounts receivable (i.e., realestate and personal property, etc.) differ between the two statements. This amount represents the net change in deferred inflows. 119,704
The issuance of long-term debt (e.g., bonds and leases) providescurrent financial resources to governmental funds, while therepayment of the principal of long-term debt consumes the financialresources of governmental funds. Neither transaction, however, has any effect on net position:
Issuance of debt (13,847,083)
Issuance of capital leases (987,234)
Repayments of debt 4,117,610
Defeasance of debt refunding 9,713,571
Bond premium activity (1,084,687)
Loss on refunding activity 321,364
In the statement of activities, interest is accrued on outstanding long-term debt, whereas in governmental funds interest is not reported until due. 23,429
Some expenses reported in the Statement of Activities do not require the use of current financial resources and therefore, are
Net pension obligation, net of related deferred outflows and inflows 1,630,309
Compensated absences 18,122
Net OPEB obligation (117,389)
Insurance reserves 1,627,501
$ 13,890,157
The accompanying notes are an integral part of these financial statements.
CHANGE IN NET POSITION OF GOVERNMENTAL ACTIVITIES
NET CHANGES IN FUND BALANCES - TOTAL GOVERNMENTAL FUNDS
not reported as expenditures in the governmental funds.
CITY OF BURLINGTON, VERMONT
RECONCILIATION OF THE STATEMENT OF REVENUES
FOR THE YEAR ENDED JUNE 30, 2016
EXPENDITURES, AND CHANGES IN FUND BALANCES OFGOVERNMENTAL FUNDS TO THE STATEMENT OF ACTIVITIES

39
AdjustedOriginal Final Actual Variance WithBudget Budget Amounts Final Budget
Revenues and other sources:Taxes and special assessments $ 31,674,745 $ 31,674,745 $ 31,467,538 $ (207,207) Local option sales tax 2,200,000 2,200,000 2,239,937 39,937 Payments in lieu of taxes 4,824,281 4,824,281 5,079,036 254,755 Licenses and permits 4,093,000 4,093,000 4,939,556 846,556 Intergovernmental 799,963 1,348,756 1,352,545 3,789 Charges for services 14,230,475 14,270,251 14,945,795 675,544 Investment income 64,400 64,400 163,470 99,070 Contributions and donations 903,500 867,870 486,516 (381,354) Transfers in 222,876 400,605 406,548 5,943 Other 429,200 473,651 224,627 (249,024) Use of fund balance - 1,577,201 - (1,577,201)
Total Revenues and Other Sources 59,442,440 61,794,760 61,305,568 (489,192)
Expenditures and other uses:Nondepartmental 3,224,116 3,212,801 2,743,758 469,043 City council 2,489,599 2,483,599 2,394,035 89,564 Mayor 393,609 409,173 406,146 3,027 Clerk treasurer 2,607,536 2,620,536 2,355,430 265,106 City attorney 1,105,623 1,105,623 1,107,419 (1,796) Planning and zoning 845,242 901,879 785,096 116,783 City assessor 291,205 291,205 277,381 13,824 Human resources 650,687 650,687 574,839 75,848 Information technology 902,882 902,882 762,568 140,314 Fire 9,150,789 9,356,539 9,329,121 27,418 Police 14,776,613 15,046,006 14,871,746 174,260 Code enforcement 1,062,736 1,062,736 1,043,127 19,609 Public works 4,492,291 4,509,551 3,694,666 814,885 Library 1,984,838 1,984,838 1,890,193 94,645 Parks and recreation 6,594,124 6,737,170 6,523,287 213,883 Burlington city arts 1,930,474 1,930,474 1,807,995 122,479 Community and economic development 686,473 903,694 815,336 88,358 Debt service 4,305,601 3,969,225 3,813,148 156,077 Transfers 829,342 2,406,543 2,361,696 44,847
Total Expenditures and Other Uses 58,323,780 60,485,161 57,556,987 2,928,174
Excess (deficiency) of revenues and other sources over expenditures and other uses $ 1,118,660 $ 1,309,599 $ 3,748,581 $ 2,438,982
The accompanying notes are an integral part of these financial statements.
Budgeted Amounts
CITY OF BURLINGTON, VERMONT
GENERAL FUND
STATEMENT OF REVENUES AND OTHER SOURCES,AND EXPENDITURES AND OTHER USES - BUDGET AND ACTUAL
FOR THE YEAR ENDED JUNE 30, 2016

40
NonmajorEnterprise
Electric Airport Funds Total
OUTFLOWS OF RESOURCES
Current:Cash and cash equivalents $ 14,780,928 $ 4,271,079 $ 6,038,049 $ 25,090,056 Restricted investments 630,031 - - 630,031 Receivables, net of allowance for uncollectibles:
User fees 4,288,766 1,382,747 2,545,754 8,217,267 Intergovernmental - 2,634,698 57,211 2,691,909 Estimated unbilled revenues 2,163,490 312,480 1,140,837 3,616,807
Due from Burlington Community Development Corporation - current - 70,007 - 70,007
Inventory 5,017,140 247,544 822,934 6,087,618 Prepaid expenses - - 80,117 80,117 Other current assets 1,000,721 - 5,000 1,005,721
Total current assets 27,881,076 8,918,555 10,689,902 47,489,533
Noncurrent:Restricted cash - 10,783,358 2,098,058 12,881,416 Restricted investments 5,367,309 2,564,159 - 7,931,468 Due from Burlington Community
Development Corporation - long-term - 734,084 - 734,084 Investment in associated companies 25,990,556 - - 25,990,556 Regulatory assets and other prepaid charges 2,767,707 - - 2,767,707 Capital assets:
Land and construction in progress 3,675,248 56,119,246 1,211,338 61,005,832 Intangible asset - - 5,400,000 5,400,000 Capital assets, net of accumulated depreciation 95,429,896 97,635,505 40,470,281 233,535,682
Total noncurrent assets 133,230,716 167,836,352 49,179,677 350,246,745
TOTAL ASSETS 161,111,792 176,754,907 59,869,579 397,736,278
Deferred Outflow of Resources - pension related 3,684,416 1,278,833 1,619,070 6,582,319 Deferred Outflow of Resources - non pension related 487,796 - - 487,796
TOTAL ASSETS AND DEFERRED OUTFLOWS OF RESOURCES $ 165,284,004 $ 178,033,740 $ 61,488,649 $ 404,806,393
ASSETS AND DEFERRED
ASSETS:
CITY OF BURLINGTON, VERMONT
Business-Type ActivitiesEnterprise Funds
PROPRIETARY FUNDS
STATEMENT OF NET POSITION
JUNE 30, 2016
(continued)

41
(continued)
NonmajorEnterprise
Electric Airport Funds Total
Business-Type ActivitiesEnterprise Funds
LIABILITIES, DEFERRED INFLOWS OF
RESOURCES AND NET POSITION
LIABILITIES:Current:
Accounts payable $ 2,531,847 $ 2,082,976 $ 985,278 $ 5,600,101 Accrued payroll and benefits payable - 61,870 50,559 112,429 Accrued interest - 837,762 - 837,762 Unearned revenue - 1,384,957 469,528 1,854,485 Line of credit - 646,602 - 646,602 Other current liabilities 2,058,308 - 911,180 2,969,488 Payable from restricted assets:
Deposits with bond trustees 630,031 - - 630,031 Current portion of long-term liabilities:
General obligation bonds payable 2,300,000 - - 2,300,000 Revenue bonds payable 1,430,000 2,198,155 906,766 4,534,921 Note payable - - 8,485 8,485 Capital leases payable - 154,786 200,661 355,447
Total current liabilities 8,950,186 7,367,108 3,532,457 19,849,751
Noncurrent:General obligation bonds payable 46,580,636 - - 46,580,636 Revenue bonds payable 27,637,396 36,359,614 14,659,687 78,656,697 Long term note payable - - 219,521 219,521 Capital leases payable - 492,324 5,705,347 6,197,671 Compensated absences payable 975,386 192,783 321,321 1,489,490 Net OPEB obligation 261,213 139,084 266,938 667,235 Net pension liability 12,674,005 2,169,468 3,150,117 17,993,590 Regulatory liabilities 5,132,037 - - 5,132,037 Other noncurrent liabilities 127,960 - - 127,960
Total noncurrent liabilities 93,388,633 39,353,273 24,322,931 157,064,837
TOTAL LIABILITIES 102,338,819 46,720,381 27,855,388 176,914,588
NET POSITION:Net investment in capital assets 39,811,834 113,903,269 25,381,151 179,096,254 Restricted:
For debt service/renewal and replacements/capital projects - 13,347,517 - 13,347,517
For contingency reserve - - 1,434,845 1,434,845 For revenue fund - - 663,213 663,213 Deposits with bond trustees 5,367,315 - - 5,367,315
Unrestricted 17,766,036 4,062,573 6,154,052 27,982,661
TOTAL NET POSITION 62,945,185 131,313,359 33,633,261 227,891,805
OF RESOURCES AND NET POSITION $ 165,284,004 $ 178,033,740 $ 61,488,649 $ 404,806,393
The accompanying notes are an integral part of these financial statements.
TOTAL LIABILITIES, DEFERRED INFLOWS

42
NonmajorEnterprise
Electric Airport Funds TotalOperating Revenues:
Charges for services $ 47,647,458 $ 16,148,693 $ 23,891,773 $ 87,687,924 Intergovernmental - 154,266 51,121 205,387 Miscellaneous 14,858,224 - 259,281 15,117,505
Total Operating Revenues 62,505,682 16,302,959 24,202,175 103,010,816
Operating Expenses:Personnel - 4,106,060 5,786,400 9,892,460 Nonpersonnel - 8,009,403 9,801,379 17,810,782 Electric department 52,061,720 - - 52,061,720 Depreciation and amortization 5,751,037 5,928,642 2,882,147 14,561,826 Payments in lieu of taxes - - 1,414,619 1,414,619
Total Operating Expenses 57,812,757 18,044,105 19,884,545 95,741,407
Operating Income (Loss) 4,692,925 (1,741,146) 4,317,630 7,269,409
Nonoperating Revenues (Expenses):Dividends from associated companies 3,236,147 - - 3,236,147 Passenger facility charges - 2,321,431 - 2,321,431 Investment income 102,446 80,386 1,798 184,630 Other income/expense - net 92,650 (126,698) 86,420 52,372 Interest income/expense - net (3,315,839) (1,709,619) (918,987) (5,944,445) Amortization of bond premium - 192,077 - 192,077 Gain/loss on disposal of capital assets (630,373) 29,149 - (601,224)
Total Nonoperating Revenues (Expenses) (514,969) 786,726 (830,769) (559,012)
4,177,956 (954,420) 3,486,861 6,710,397
Capital contributions 1,483,457 7,635,497 - 9,118,954 Payment in lieu of taxes (2,153,778) - - (2,153,778)
Change in Net Position 3,507,635 6,681,077 3,486,861 13,675,573
Net Position at Beginning of Year 59,437,550 124,632,282 30,146,400 214,216,232
Net Position at End of Year $ 62,945,185 $ 131,313,359 $ 33,633,261 $ 227,891,805
The accompanying notes are an integral part of these financial statements.
Income Before Contributions and Transfers
CITY OF BURLINGTON, VERMONT
PROPRIETARY FUNDS
STATEMENT OF REVENUES, EXPENSES AND CHANGES IN FUND NET POSITION
FOR THE YEAR ENDED JUNE 30, 2016
Enterprise FundsBusiness-Type Activities

43
NonmajorEnterprise
Electric Airport Funds Total
Cash Flows From Operating Activities:Receipts from customers and users $ 48,280,260 $ 16,116,987 $ 23,826,127 $ 88,223,374 Receipts of operating grants - 154,266 51,121 205,387 Receipts for interfund services - - 256,681 256,681 Other receipts 15,059,425 352,769 - 15,412,194 Payments to suppliers (41,085,608) (7,509,186) (9,582,758) (58,177,552) Payments for wages and benefits - (3,850,185) (5,844,549) (9,694,734) Payment in lieu of taxes - - (1,414,619) (1,414,619) Payments for other expenses (13,865,159) (549,408) - (14,414,567)
Net Cash Provided by Operating Activities 8,388,918 4,715,243 7,292,003 20,396,164
Cash Flows From Noncapital Financing Activities:Other income, net 92,650 - 102,923 195,573 Payment in lieu of taxes (2,153,778) - - (2,153,778) Receipt from loan receivable from BCDC - 67,956 - 67,956 Interest paid on cash deficit to general fund - (4,077) - (4,077)
Net Cash Provided/(Used) by Noncapital Financing Activities (2,061,128) 63,879 102,923 (1,894,326)
Cash Flows From Capital and Related Financing Activities:Proceeds from bonds and notes payable 13,235,000 - 151,612 13,386,612 Proceeds from premium 2,206,093 - - 2,206,093 Acquisition and construction of capital assets (7,000,172) (8,908,219) (2,077,893) (17,986,284) Proceeds from sale of capital assets 32,500 35,434 - 67,934 Capital grants/contributions 1,483,457 7,544,737 - 9,028,194 Passenger facility charges - 2,321,431 - 2,321,431 Drawdowns on line of credit - 1,017,925 - 1,017,925 Repayment of line of credit - (371,323) - (371,323) Principal paid on: General obligation bonds (15,015,000) - - (15,015,000) Revenue bonds - (1,650,000) (903,345) (2,553,345) Capital lease obligations - (150,798) (194,374) (345,172) Interest paid on outstanding debt, including issue costs (3,182,657) (1,765,659) (919,876) (5,868,192)
Net Cash Used by Capital and Related Financing Activities (8,240,779) (1,926,472) (3,943,876) (14,111,127)
Cash Flows From Investing Activities:
Net (additions)/reductions to restricted cash and investments (30,867) (1,104,219) (300,446) (1,435,532) Receipt of interest & dividends 3,300,131 80,388 2,325 3,382,844
Net Cash Provided/(Used) by Investing Activities 3,269,264 (1,023,831) (298,121) 1,947,312
Net Increase in Cash 1,356,275 1,828,819 3,152,929 6,338,023 Cash and cash equivalents at beginning of year 13,424,653 2,442,260 2,885,120 18,752,033 Cash and cash equivalents at end of year $ 14,780,928 $ 4,271,079 $ 6,038,049 $ 25,090,056
CITY OF BURLINGTON, VERMONT
PROPRIETARY FUNDS
STATEMENT OF CASH FLOWS
FOR THE YEAR ENDED JUNE 30, 2016
(continued)

44
(continued)
NonmajorEnterprise
Electric Airport Funds Total
Adjustments to Reconcile Operating Income/(Loss) to Net Cash Provided by Operating Activities:
Operating income/(loss) $ 4,692,925 $ (1,741,146) $ 4,317,630 $ 7,269,409 Depreciation and amortization 6,021,339 5,928,642 2,882,147 14,832,128 Other operating net revenues and expenses - (126,698) - (126,698) (Increase)/decrease in receivables 792,550 (165,142) 1,459 628,867 (Increase)/decrease in unbilled revenues (111,613) 10,054 (86,098) (187,657) (Increase)/decrease in inventory 337,306 18,650 (206,311) 149,645 Increase/(decrease) in accounts payable (360,775) 494,982 (61,304) 72,903 Increase/(decrease) in customer deposits - - (7,708) (7,708) Increase/(decrease) in accrued payroll and benefits - (12,276) (32,793) (45,069) Increase/(decrease) in accrued liabilities - (13,415) 489,954 476,539 Increase/(decrease) in deferred charges 128,658 - 24,101 152,759 Increase/(decrease) in compensated absences - (7,264) 13,540 6,276 Increase/(decrease) in other post employment benefits liability 37,114 12,642 50,620 100,376
(185,648) 262,773 268,456 345,581 Increase/(decrease) in unearned revenue - 53,441 - 53,441 Increase/(decrease) in other operating assets/liabilities (2,962,938) - (3,717) (2,966,655) Capitalized labor - - (357,973) (357,973)
Net Cash Provided by Operating Activities $ 8,388,918 $ 4,715,243 $ 7,292,003 $ 20,396,164
Statement of noncash transactions:Vehicles acquired under capital lease financing $ - $ - $ 63,993 $ 63,993
The accompanying notes are an integral part of these financial statements.
Increase/(decrease) in net pension liability, net of related deferred outflows/inflows

45
PrivatePension Purpose
Trust TrustFund Funds
Cash and cash equivalents $ 1,329,973 $ 37,848 Investments:
Equity 108,703,235 - Fixed income 42,319,105 - Real assets 3,271,228 -
Due from component unit 1,268,901 - Due from broker 2,047,807 -
Total Assets 158,940,249 37,848
Accounts payable 146,714 - Accrued liabilities 1,608 - Compensated absences 2,422 - Other liabilities 132 - Due to primary government 2,000,000 -
Total Liabilities 2,150,876 -
NET POSITION
Held in trust for:Employees' pension benefits 156,789,373 - Individuals and organizations - 37,848
Total Net Position $ 156,789,373 $ 37,848
The accompanying notes are an integral part of these financial statements.
ASSETS
LIABILITIES
CITY OF BURLINGTON, VERMONT
FIDUCIARY FUNDS
STATEMENT OF FIDUCIARY NET POSITION
JUNE 30, 2016

46
Pension PrivateTrust PurposeFund Trust Funds
Additions:Contributions:
Employer - pension $ 9,149,159 $ - Plan members 2,304,971 -
Total Contributions 11,454,130 -
Investment earnings:Investment income 4,440,805 - Net increase in the fair value of investments (6,033,305) 30
Total Investment Earnings (1,592,500) 30 Less Investment Expenses (496,032) -
Net Investment Earnings (2,088,532) 30
Total Additions 9,365,598 30
Deductions:Benefits - pension 13,922,952 - Administrative expenses 369,130 -
Total deductions 14,292,082 -
Change in net position (4,926,484) 30
Net position:Beginning of year 161,715,857 37,818
End of year $ 156,789,373 $ 37,848
The accompanying notes are an integral part of these financial statements.
CITY OF BURLINGTON, VERMONT
FIDUCIARY FUNDS
STATEMENT OF CHANGES IN FIDUCIARY NET POSITION
FOR THE YEAR ENDED JUNE 30, 2016

47
BurlingtonBurlington Community
School DevelopmentDistrict Corporation Total
OUTFLOWS OF RESOURCES
Current:Cash and cash equivalents $ 11,952,650 $ 64,158 $ 12,016,808 Investments 199,408 - 199,408 Receivables, net of allowance for uncollectibles:
Intergovernmental 4,472,482 - 4,472,482 Other 180,862 - 180,862
Capital lease receivable - 98,400 98,400 Inventory 44,639 - 44,639 Prepaid expenses 23,162 - 23,162 Other current assets - 3,425 3,425
Total current assets 16,873,203 165,983 17,039,186
Noncurrent:Capital lease receivable - 1,455,266 1,455,266 Capital assets:
Land and construction in progress 4,387,157 492,645 4,879,802 Capital assets, net of accumulated depreciation 38,400,897 4,054,934 42,455,831
Total noncurrent assets 42,788,054 6,002,845 48,790,899
TOTAL ASSETS 59,661,257 6,168,828 65,830,085
Deferred Outflows of Resources - pension related 2,522,582 - 2,522,582 Deferred Outflows of Resources - non pension related - 201,196 201,196
TOTAL ASSETS AND DEFERRED OUTFLOWS OF RESOURCES $ 62,183,839 $ 6,370,024 $ 68,553,863
ASSETS AND DEFERRED
ASSETS:
CITY OF BURLINGTON, VERMONT
COMPONENT UNITS
STATEMENT OF NET POSITION
JUNE 30, 2016
(continued)

48
(continued)
BurlingtonBurlington Community
School DevelopmentDistrict Corporation Total
LIABILITIES, DEFERRED INFLOWS OF RESOURCES AND NET POSITION
LIABILITIES:Current:
Accounts payable $ 2,107,324 $ - $ 2,107,324 Accrued expenses 1,407,984 - 1,407,984 Due to primary government - 136,738 136,738 Due to fiduciary fund 1,268,901 - 1,268,901 Unearned revenue - 78,000 78,000 Other liabilities - 3,425 3,425 Current portion of long-term liabilities:
General obligation bonds payable 1,071,968 243,151 1,315,119 Capital leases payable 26,507 - 26,507 Compensated absences payable 255,768 - 255,768
Total current liabilities 6,138,452 461,314 6,599,766
Noncurrent:Due to primary government - 955,684 955,684 General obligation bonds and other debt payable 27,953,908 3,602,897 31,556,805 Capital leases payable 9,053 - 9,053 Compensated absences payable 2,301,909 - 2,301,909 Net OPEB obligation 2,518,010 - 2,518,010 Net pension liability 9,182,200 - 9,182,200 Other 417,409 - 417,409
Total noncurrent liabilities 42,382,489 4,558,581 46,941,070
TOTAL LIABILITIES 48,520,941 5,019,895 53,540,836
Deferred Inflows of Resources - pension related 32,405 - 32,405
NET POSITION:Net investment in capital assets 13,726,618 1,363,972 15,090,590 Restricted:
For education 1,214,467 - 1,214,467 Unrestricted (1,310,592) (13,843) (1,324,435)
TOTAL NET POSITION 13,630,493 1,350,129 14,980,622
$ 62,183,839 $ 6,370,024 $ 68,553,863
The accompanying notes are an integral part of these financial statements.
TOTAL LIABILITIES, DEFERRED INFLOWS OF RESOURCES AND NET POSITION

49
BurlingtonOperating Capital Burlington Community
Charges for Grants and Grants and School DevelopmentExpenses Services Contributions Contributions District Corporation Total
Burlington School District
Educational $ 86,372,546 $ 838,954 $ 28,880,175 $ - $ (56,653,417) $ - $ (56,653,417) Interest on long-term debt 1,468,602 - - - (1,468,602) - (1,468,602)
Total Burlington School District 87,841,148 838,954 28,880,175 - (58,122,019) - (58,122,019)
Burlington Community Development Corporation
Cost of services 26,430 364,000 - - - 337,570 337,570 Interest on long-term debt 197,252 - - - - (197,252) (197,252) Depreciation 107,249 - - - - (107,249) (107,249)
Total Burlington Community Development Corporation 330,931 364,000 - - - 33,069 33,069
Total component units $ 88,172,079 $ 1,202,954 $ 28,880,175 $ - (58,122,019) 33,069 (58,088,950)
General Revenues:General state support 57,332,457 - 57,332,457 Investment earnings 602,490 (5) 602,485 Miscellaneous 2,851,778 102,397 2,954,175
Total general revenues 60,786,725 102,392 60,889,117
Change in Net Position 2,664,706 135,461 2,800,167
Net Position:Beginning of year 10,965,787 1,214,668 12,180,455
End of year $ 13,630,493 $ 1,350,129 $ 14,980,622
The accompanying notes are an integral part of these financial statements.
Program RevenuesNet (Expenses) Revenues and Changes
in Net Position
CITY OF BURLINGTON, VERMONT
COMPONENT UNITS
STATEMENT OF ACTIVITIES
FOR THE YEAR ENDED JUNE 30, 2016

50
CITY OF BURLINGTON, VERMONT
Notes to Financial Statements Incorporated in 1865, the City of Burlington operates under a tripartite system of government with the Mayor serving as Chief Executive, the City Council as the legislative body and the Commissioners as the primary policy makers within their respective departments. The City Charter authorizes the provision for the following services for the residents of the City: gen-eral administration, public safety, public works, community development, culture and recrea-tion, utilities and education.
1. Summary of Significant Accounting Policies
The accounting policies adopted by the City of Burlington (the “City”) conform to generally accepted accounting principles (GAAP) as applicable to governmental enti-ties. The Governmental Accounting Standards Board (GASB) is the accepted stand-ard-setting body for establishing accounting and financial reporting principles. The following is a summary of the more significant accounting policies employed in the preparation of these financial statements.
A. The Financial Reporting Entity
This report includes all of the funds of the City of Burlington, Vermont. The reporting entity consists of the primary government; organizations for which the primary government is financially accountable; and other organizations for which the nature and significance of their relationship with the primary government are such that their exclusion would cause the reporting entity’s financial statements to be misleading or incomplete. Component units are legally separate organizations for which the elected officials of the primary government are financially account-able. The primary government is financially accountable if it appoints a voting majority of the organization’s governing body and it is able to impose its will on that organization or there is a potential for the organization to provide specific financial benefits to or burdens on the primary government. The primary govern-ment may be financially accountable if an organization is fiscally dependent on the primary government. The following entities are reported as discretely pre-sented component units, in a separate column in the government-wide financial statements to emphasize that they are legally separate from the City:
Burlington School District – the organization’s primary purpose is to carry out the vision of education in the community. The Burlington School District is governed by a separately elected School Board, the legal entity for conducting a system of public education within the geographic area of a school district. The system was created by, and is governed by, state statutes. Members of a board are, therefore, state officers chosen by citizens of a district to represent them and the state in the legislative management of public schools. The Board of School Commissioners has the dual responsibility for implementing statu-

51
tory requirements pertaining to public education and local citizens’ desires for educating the community’s youth. For detailed information on the Burlington School District accounts, refer to separately issued financial statements. Burlington Community Development Corporation – the organization’s primary purpose is to carry out the industrial and economic development within the City. As such, the purposes of the Corporation shall include fostering, encour-aging and assisting the physical location of business enterprises in the Greater Burlington area and otherwise fulfilling the purposes of a “local development corporation”. The Board of Directors of the Burlington Community Develop-ment Corporation must be members of the City of Burlington’s Board of Finance.
B. Basis of Presentation
The accounts of the City are organized and operated on the basis of fund account-ing. A fund is an independent fiscal and accounting entity with a separate set of self-balancing accounts which comprise its assets, liabilities, fund equity, reve-nues, and expenditures or expenses, as appropriate. Government resources are allocated to and accounted for in individual funds based upon the purposes for which they are spent and the means by which spending activities are controlled. The basic financial statements of the City include both government-wide statements and fund financial statements. The focus of the government-wide statements is on reporting the operating results and financial position of the City as a whole and present a longer term view of the City’s finances. The focus of the fund financial statements is on reporting on the operating results and financial position of the most significant funds of the City and present a shorter term view of how oper-ations were financed and what remains available for future spending. Government-wide Statements: The statement of net position and the statement of activities display information about the primary government, the City, and its component units, the Burlington Community Development Corporation and the Burlington School District. These statements include the financial activities of the overall City, except for fiduciary activities. Eliminations have been made to mini-mize the double counting of activities between funds. These statements distinguish between the governmental and business-type activities of the City. Governmental activities generally are financed through taxes, intergovernmental revenues, and other nonexchange transactions. Business-type activities are financed in whole or in part by fees charged to external parties. The Statement of Activities presents a comparison between direct expenses and program revenues for each function of the City’s governmental activities and for each segment of the City’s business-type activities. Direct expenses are those that are specifically associated with a program or function and, therefore, are clearly identifiable to a particular function. Program revenues include (a) charges paid by the recipients of goods or services offered by the programs and (b) grants and contributions that are restricted to meeting the operational or capital requirements

52
of a particular program. Revenues that are not classified as program revenues, including all taxes, are presented as general revenues. Fund Financial Statements: The fund financial statements provide information about the City’s funds, including fiduciary funds. Separate statements for each fund category – governmental, proprietary, and fiduciary – are presented. The emphasis of fund financial statements is on major governmental and enterprise funds, each displayed in a separate column. All remaining governmental and enterprise funds are aggregated and reported as nonmajor funds. Proprietary fund operating revenues, such as charges for services, result from exchange transactions associated with the principal activity of the fund. Exchange transactions are those in which each party receives and gives up essentially equal values. Operating revenues consists of sales of electricity, rents of electric prop-erty, fees to transmit electricity of others, sales of renewable energy credits, opera-tion of other utilities to run generation facilities, rent of airport terminal space and buildings, concessions, commissions, parking receipts, sales of water, wastewater user charges, telephone, cable and internet access, hot lunch sales and other mis-cellaneous fees for service. Nonoperating revenues result from certain nonexchange transactions or ancillary activities. Non-operating revenues consist of investment earnings, electric services rendered to customers upon their request, passenger facility charges, grant income and building rents from buildings purchased for future expansion. Operating expenses are defined as the ordinary costs and expenses for the opera-tion, maintenance and repairs of the electric plant, airport, water facility, waste-water facility, telecommunications equipment and lines, and hot lunch programs. Operating expenses include the cost of production, purchased power, maintenance of transmission and distribution systems, administrative, and general expenses and depreciation and amortization. Operating expenses do not include the interest on bonds, notes or other evidences or indebtedness and related costs. The City reports on the following major governmental funds:
General Fund - This is the City’s main operating fund. It accounts for all financial resources of the City except those required to be accounted for in another fund.
The City reports on the following major Enterprise funds:
Electric Fund - This fund accounts for the operations of the Burlington Electric Department.
Airport Fund - This fund accounts for the operations of the Burlington Interna-tional Airport.

53
Additionally, the City reports the following fund types: Pension Trust Fund – This fund accounts for monies contributed by the City and its employees and the income on investments less amounts expended for the pensions of retired City employees. This fund is supported by a dedicated tax rate from the General Fund and charges to non-general fund funds based on a percent-age of payroll. This Fund also pays for the FICA costs for the City’s employer’s share of FICA. Private-Purpose Trust Funds – These funds are used to report trust arrangements under which resources are to be used for the benefit of firemen injured in the line of duty, Christmas gifts for servicemen overseas, Christmas dinners for the desti-tute and student educational expenses and scholarships. All investment earnings, and in some cases, the principal of these funds may be used to support these activities.
C. Measurement Focus
The accounting and financial reporting treatment applied to a fund is determined by its measurement focus. Government-wide and proprietary fund financial state-ments are reported using the economic resources measurement focus. This means that all assets and liabilities associated with the operation of these funds (whether current or noncurrent) are included on the balance sheet (or statement of net posi-tion). Equity (i.e., net total assets) is segregated into net investment in capital assets; restricted net position; and unrestricted net position. Operating statements present increases (i.e., revenues) and decreases (i.e., expenses) in net total position. Governmental fund financial statements are reported using the current financial resources measurement focus. This means that only current assets and current lia-bilities are generally reported on their balance sheets. Their reported fund balances (net current assets) are considered a measure of available spendable resources, and are segregated into nonspendable; restricted; committed; assigned and unassigned amounts. Operating statements of these funds present increases (i.e., revenues and other financing sources) and decreases (i.e., expenditures and other financing uses) in net current assets. Accordingly, they are said to present a summary of sources and uses of available spendable resources during a period.
D. Basis of Accounting
Basis of accounting refers to when revenues and expenditures or expenses are recognized in the accounts and reported in the financial statements. Basis of accounting relates to the timing of the measurements made, regardless of the measurement focus applied. The government-wide and proprietary fund financial statements are reported using the accrual basis of accounting. Revenues are recorded when earned and expenses are recorded at the time the liabilities are incurred, regardless of when the related cash flow takes place. Nonexchange transactions, in which the City

54
gives (or receives) value without directly receiving (or giving) equal value in exchange, include property taxes, grants, entitlements, and donations. On the accrual basis, revenue from property taxes is recognized in the fiscal year for which the taxes are levied. Revenue from grants, entitlements, and donations is recognized in the fiscal year in which all eligibility requirements have been satisfied. Governmental funds are reported using the modified accrual basis of accounting. Under this method, revenues are recognized when measurable and available. “Measurable” means the amount of the transaction can be determined, and “avail-able” means the amount is collectible within the current period or soon enough thereafter to be used to pay liabilities of the current period. The City considers all revenues reported in governmental funds to be available if the revenues are col-lected within sixty days after year-end. Expenditures are recorded when the related fund liability is incurred, except for principal and interest on general long-term debt, certain compensated absences, self-insured health and dental benefits, reserves for property and casualty and workers’ compensation claims, landfill post-closure costs, net pension obligation, post-employment benefits and other long-term liabili-ties which are recognized when the obligations are expected to be liquidated or are funded with expendable available financial resources. General capital asset acquisitions are reported as expenditures in governmental funds. Proceeds of general long-term debt and acquisitions under capital leases are reported as other financing sources. Under the terms of grant agreements, the City funds certain programs by a combi-nation of specific cost-reimbursement grants, categorical block grants, and gen-eral revenues. Thus, when program expenses are incurred, there are both restricted and unrestricted net positions available to finance the program. It is the City’s policy to first apply cost-reimbursement grant resources to such programs, fol-lowed by general revenues. Expenditure driven grants are recognized as revenue when the qualifying expenditures have been incurred and other grant requirements have been met. Recognition of revenues on funds received in connection with loan programs are recognized when loans are awarded and expenses incurred in excess of current grants and program income. An offsetting deferred revenue is recognized for all loans receivable. Loan repayment revenue is recognized as the loans are repaid. The Burlington Electric Department (the Department) is an enterprise fund of the City of Burlington, Vermont (the City). The City has overall financial account-ability for the Department; its Council appoints the Commissioners of the Depart-ment which oversee its operations, and the City collateralizes the Department’s general obligation debt. The Department is also subject as to rates, accounting, and other matters, to the regulatory authority of the State of Vermont Public Service Board (VPSB) and the Federal Energy Regulatory Commission (FERC). In accordance with FASB ASC Topic 980, Regulated Operations (and Codified in GASB Statement 62), the Department records certain assets and liabilities in accordance with the economic effects of the rate making process.

55
E. Cash and Short-Term Investments
Cash balances from all funds, except those required to be segregated by law, are combined to form a consolidation of cash. Cash balances are invested to the extent available, and interest earnings are recognized in the general fund. Certain special revenue, proprietary, and fiduciary funds segregate cash, and investment earnings become a part of those funds. Deposits with financial institutions consist primarily of demand deposits, certifi-cates of deposits, and savings accounts. A cash and sweep account is maintained that is available for use by all funds. Each fund’s portion of this pool is reflected on the combined financial statements under the caption “cash and short-term invest-ments”. The interest earnings attributable to each fund type are included under investment income. For purpose of the statement of cash flows, the proprietary funds consider invest-ments with original maturities of three months or less to be short-term investments.
F. Investments
State and local statutes place certain limitations on the nature of deposits and investments available. Deposits in any financial institution may not exceed certain levels within the financial institution. Non-fiduciary fund investments can be made in securities issued by or unconditionally guaranteed by the U.S. Govern-ment or agencies that have a maturity of one year or less from the date of pur-chase and repurchase agreements guaranteed by such securities with maturity dates of no more than 90 days from the date of purchase. Investments for the Trust Funds consist of marketable securities, bonds, and short-term money market investments. Investments are carried at fair value, except for certificates of deposits, which are nonparticipating interest-earning investment contracts, and therefore, the City uses the cost-based measurement for these investments.
G. Interfund Receivables and Payables
Transactions between funds that are representative of lending/borrowing arrange-ments outstanding at the end of the fiscal year are referred to as either “due from/to other funds” (i.e., the current portion of interfund loans) or “advances to/from other funds” (i.e., the non-current portion of interfund loans). Advances between funds are offset by a fund balance reserve account in appli-cable governmental funds to indicate the portion not available for appropriation and not available as expendable financial resources. Any residual balances outstanding between the governmental activities and business-type activities are reported in the government-wide financial statements as “internal balances”.

56
H. Jointly Owned Facilities
The Burlington Electric Department has recorded its ownership interest in jointly owned facilities as capital assets. The Department’s ownership interest in each of the jointly owned facilities is as follows:
McNeil Station 50.0%Highgate Station 7.7%
The Department is responsible for its proportionate share of the operating expenses of the jointly owned facilities which are billed to the Department on a monthly basis. The associated operating costs allocated to the Department are classified in their respective expense categories in the statement of operations. Separate finan-cial statements are available from the Department for these jointly owned facilities.
I. Investments in Associated Companies
The Electric Department follows the cost method of accounting for its 6.38% Class B common stock, 1.97% Class C common stock and 7.69% Class C preferred stock ownership interest in Vermont Electric Power Company, Inc. (VELCO), and its 5.17% ownership interest in Vermont Transco LLC (Transco). Transco is an affiliated entity of VELCO. VELCO owns and operates a transmission system in the State of Vermont over which bulk power is delivered to all electric utilities in the State of Vermont. Under a Power Transmission Contract with the State of Vermont, VELCO bills all costs, including amortization of its debt and a fixed return on equity, to the State of Vermont and others using the system.
During the year ended June 30, 2016, there was no offer of equity investment from VELCO/Transco.
Schedule of Ownership in Associated CompaniesFY 16
Velco, Class B Common Stock $ 1,403,800 Velco, Class C Common Stock 39,200 Velco, Class C Preferred Stock 11,196 VT Transco, LLC, A Units 10,796,000 VT Transco, LLC, B Units 13,740,360
$ 25,990,556
J. Inventories
Inventories are valued at cost using the first-in/first-out (FIFO) method. The costs of governmental fund-type inventories are recorded as expenditures when pur-chased rather than when consumed. No significant inventory balances were on hand in governmental funds.

57
K. Capital Assets
1. City: Capital assets, which include property, plant, equipment, land improvements, buildings and improvements, and infrastructure assets, are reported in the appli-cable governmental or business-type activities columns in the government-wide financial statements. Depreciable capital assets are defined by the government as assets with an estimated useful life of five years or greater, while non-depreciable do not consider estimated useful life. Such assets are recorded at historical cost or estimated historical cost if purchased or constructed. Donated capital assets are recorded at estimated acquisition value at the date of donation. The costs of normal maintenance and repairs that do not add to the value of the asset or materially extend assets’ lives are not capitalized. Major outlays for capital assets and improvements are capitalized as projects are constructed. Interest incurred during the construction phase of capital assets of business-type activities is included as part of the capitalized value of the assets constructed. Property, plant, and equipment are depreciated using the straight-line method over the following estimated useful lives:
EstimatedService Life
Land $ - N/AConstruction in Progress - N/ALand Improvements 25,000 30 yearsIntangible asset - 20 yearsBuildings - 25-150 yearsBuilding Improvements 20,000 25-150 yearsVehicles, Machinery, Equipment and Furniture 10,000 5-15 yearsComputer Equipment - Hardware and Software 10,000 5-15 yearsBook Collections 10,000 5 yearsInfrastructure 50,000 10-40 years
CapitalizationThreshold
Capital assets reported in the government-wide and proprietary fund financial statements are depreciated in order that the cost of these assets will be charged to expenses over their estimated service lives, generally using the straight line method of calculating depreciation. 2. Electric Department: The Electric Department capital assets are stated at historical cost. Provisions for depreciation of general capital assets are reported using the straight-line method at

58
rates based upon the estimated service lives and salvage values of the several classes of property. Depreciation of capital assets of the McNeil Station, the Highgate Converter Facility, and the Winooski One hydroelectric plant, are calculated using the straight-line method. However, a portion of the current depreciation expense is only recoverable through future rates. The difference is included in deferred charges (calculated as the straight-line depreciation expense less the depreciation expense on a sinking fund basis) and will be recovered in future years. See Note 4, Regulatory Assets and Other Prepaid Charges. Maintenance and repairs of capital assets are charged to maintenance expense. Replacements and betterments are capitalized to capital assets. When assets are retired or otherwise disposed of, the costs are removed from capital assets, and such costs, plus removal costs, net of salvage, are charged to accumulated depreciation. The Department’s capitalization policy considers four factors. Property will be cap-italized when: 1) The combined cost to put a unit in service is more than $500.
2) The unit’s estimated life is at least three years.
3) The unit is vital to the Department and must be controlled, and tracked, even if it falls under the dollar limit stated in (1) above. Watt-hour meters to record electric usage are the only unit in this category.
4) The Public Service Board rules in a rate making decision that the Department will capitalize a cost that normally would not be capitalized based on the first three factors above. The Department does not have any assets in this category.
The depreciable lives of utility plant are as follows:
Production plant 10-50 yearsTransmission plant 33-50 yearsDistribution plant 25-50 yearsGeneral plant 5-50 yearsOther plan 5 years
EstimatedService Life
3. Discretely Presented Component Unit – School District: Capital assets purchased or acquired with an original cost of $5,000 or more are reported at historical cost or estimated historical cost. Contributed assets are reported at fair market value as of the date received. Additions, improvements and other capital outlays that significantly extend the useful life of an asset are capitalized. Other costs incurred for repairs and maintenance are expensed as incurred. Depreciation on all assets is provided on the straight-line basis over the estimated useful lives.

59
The assets are valued at historical cost when available and estimated historical cost where actual invoices or budgetary data was unavailable. Donated fixed assets are valued at their estimated fair market value on the date received. All retirements have been recorded by eliminating the net carrying values. Estimated useful lives are as follows:
EstimatedService Life
Buildings $ 5,000 20-50 yearsMachinery and Equipment 5,000 3-50 yearsVehicles 5,000 3-25 years
ThresholdCapitalization
L. Renewable Energy Credit Sales
In 2008, the McNeil Generating Station (McNeil) installed a Regenerative Selective Catalytic Reduction (RSCR) unit. The RSCR unit significantly reduces McNeil’s Nitrous Oxide (NOx) emission levels which allows the station to qualify to sell Connecticut Class 1 Renewable Energy Certificates (RECs). The McNeil RECs are determined to be qualified for sale based on a review of emissions outputs sub-mitted by McNeil. At the end of every quarter, an affidavit is signed stating whether or not McNeil’s emissions output met the requirements needed to sell the RECs. McNeil receives a certification from the State of Connecticut indicating that they met the standards for the quarter based on the statistics provided by McNeil. Sales are recorded as revenue upon delivery of the RECs to the customer. Effective September 1, 2014, the Department became the 100% owner of the Winooski One hydro facility. Currently operations at the facility are being managed through a contract with Northbrook Energy. Winooski One is a Low Impact Hydro Institute (LIHI) certified generator and is qualified to produce Massachusetts Class 2 RECs (non-waste-to-energy). In February 2015, the Department commissioned a 500 kw AC solar array at the Burlington International Airport. The Department owns 100% of this resource, and leases space on the parking garage roof under a long term agreement between the Department and the Burlington International Airport. The Airport solar array is designed to help reduce the Department s peak demand and energy needs during high priced periods. In October 2015, the Department commissioned a 107 kw AC solar array at the Department’s offices at 585 Pine Street. The Department owns 100% of this resource. Like the Airport solar array, the Pine Street solar array is designed to help reduce the Department s peak demand and energy needs during high priced periods. The Department also receives RECs from Vermont Standard Offer projects purchased by the Vermont Purchasing Agent. Energy from these projects is assigned to BED

60
pro-rata based on retail sales, and BED receives RECs in an amount equal to the energy it receives from these projects. The Department receives RECs from the Vermont Wind Project in Sheffield (the Department is entitled to 40% of the output of the 40 MW project). During FY 2013, commercial operations commenced at the Georgia Mountain Community Wind Farm (the Department has entitlement to the full 10 MW of output from the project). The RECs from both of these wind facilities are qualified for participation in most of the high value New England REC markets, making revenue for the sale of these RECs a significant source of revenue as well. The Department planning staff monitors output levels from the REC producing units, REC commitments made, the markets for these RECs, and the State statutes and rules that govern the creation and sale of these RECs. The Department has and will continue to involve itself in discussions/proceedings as needed, either in Vermont or elsewhere in New England, where such rules and statutes are the sub-ject at hand. The Department periodically sells RECs either, through broker-initiated trans-actions, or through direct placement with entities that need the RECs to comply with various New England statutes. The Department enters into agreements to sell these RECs for prior, current, and future years’ production.
M. Pollution Remediation Obligations
The Electric Department faces possible liability as a potentially responsible party (PRP) with respect to the cleanup of certain hazardous waste sites. The City is currently a PRP as a landowner of a hazardous waste superfund site in Burlington, Vermont that is the subject of a remediation investigation by the Environmental Protection Agency (the EPA). The Department has agreed to share on an equal basis all past and future costs incurred in connection with any and all settlements or actions resulting from the designation of the City as a PRP at this site. In light of a recent agreement between the City and the EPA concerning the remediation plan at the site, the Department believes that the likelihood of any liability mate-rial to the financial position of the Department is remote and as such, no liability has been accrued as of June 30, 2016.
N. Compensated Absences
It is the government’s policy to permit employees to accumulate earned but unused vacation and sick pay benefits. All vested sick and vacation pay is accrued when incurred in the government-wide, proprietary, and fiduciary fund financial state-ments. A liability for these amounts is reported in governmental funds only if they have matured, for example, as a result of employee resignations and retirements.

61
O. Liabilities to be Paid from Restricted Assets
The balance in these liabilities represents accrued interest payable on the revenue bonds and construction invoices which will be paid from restricted assets. The restricted assets will also be used for additional construction of certain assets, including certain costs in accounts and contracts payable.
P. Long-Term Obligations
In the government-wide financial statements, and proprietary fund types in the fund financial statements, long-term debt and other long-term obligations are reported as liabilities in the applicable governmental activities, business-type activities, or proprietary fund type statement of net position.
Q. Fund Equity
Fund equity at the governmental fund financial reporting level is classified as “fund balance”. Fund equity for all other reporting is classified as “net position”.
Fund Balance - Fund balance represents the difference between the current assets/deferred outflows and current liabilities/deferred inflows. The City reserves those portions of fund balance that are legally segregated for a specific future use or which do not represent available, spendable resources and therefore, are not available for appropriation or expenditure. Unassigned fund balance indi-cates that portion of fund balance that is available for appropriation in future periods. The City’s fund balance classification policies and procedures are as follows: 1) Nonspendable funds represents amounts that cannot be spent because they
are either (a) not in spendable form (i.e., inventory or prepaid items) or (b) legally or contractually required to be maintained intact (i.e., perpetual care). This fund balance classification includes general fund reserves for prepaid expenditures, inventory, and nonmajor governmental fund reserves for the principal portion of permanent trust funds
2) Restricted funds represent amounts that are restricted to specific purposes by constraints imposed by creditors, grantors, contributors, or laws or reg-ulations of other governments, or constraints imposed by law through constitutional provisions or enabling legislation. In the case of capital pro-ject funds, these funds are restricted for projects financed by bonds.
3) Committed funds represent amounts that can only be used for specific purposes pursuant to constraints imposed by formal action of the City’s highest level of decision-making authority, the City Council.
4) Assigned funds represent amounts that are constrained by the City’s intent to use these resources for a specific purpose.

62
5) Unassigned funds represent the residual classification for the general fund and include all amounts not contained in other classifications. Unassigned amounts are available for any purpose. Temporary fund balance deficits are reported as negative amounts in the unassigned classification in other governmental funds. Positive unassigned amounts are reported only in the general fund.
When an expenditure is incurred that would qualify for payment from multiple fund balance types, the City uses the following order to liquidate liabilities: restricted, committed, assigned, and unassigned. Net Position - Net position represents the difference between assets/deferred out-flows and liabilities/deferred inflows. Net investment in capital assets, consist of capital assets, net of accumulated depreciation, reduced by the outstanding bal-ances of any borrowing used for the acquisition, construction or improvement of those assets. Net position is reported as restricted when there are limitations imposed on their use either through the enabling legislation adopted by the City or through external restrictions imposed by creditors, grantors, or laws or regulations of other governments. The remaining net position is reported as unrestricted.
R. Use of Estimates
The preparation of basic financial statements in conformity with generally accepted accounting principles requires management to make estimates and assumptions that affect the reported amounts of assets and liabilities and disclosures for contingent assets and liabilities at the date of the basic financial statements, and the reported amounts of the revenues and expenditures/expenses during the fiscal year. Actual results could vary from estimates that were used.
2. Stewardship, Compliance, and Accountability
A. Liquidity Risk
During fiscal year 2013, the City issued a $9,000,000 Stability Bond to decrease its reliance on short-term cash flow financing. Prior to the issuance of the stability bonds, the City faced liquidity risk which is the risk of not having sufficient liquid financial resources to meet obligations when they fall due, or having to incur excessive costs to do so. Primarily as a result of the Burlington Telecom (BT) def-icit and various capital project and enterprise funds deficits, the City had relied on short-term borrowing to obtain cash to pay operating expenditures. On July 1, 2013 the City signed a Revolving Tax Anticipation Line of Credit for $10,000,000 which matured on June 30, 2014, and renewed on July 1, 2014. The General Fund unassigned fund balance includes the proceeds of the $9,000,000 stability bond from fiscal year 2013. It is the City’s intent to arrange its financial affairs, manage its budget and provide for future balanced financial operations.

63
The City’s current plans include:
Adhere to policy with financing first, and spending second.
Continue to monitor cash position daily, and update forecast weekly.
Improve the collection rate on outstanding receivables.
Refinance short-term debt with attractive rates, and issue long-term debt approved by the voters.
Utilize lines of credit (LOC) instead of anticipation notes and reduce the amounts of LOC.
Ensure Enterprise and Special Funds operate at a profit, and are cash posi-tive reducing reliance on General Fund pooled cash.
B. Budgetary Information
The City follows these procedures in establishing the budgetary data reflected in the financial statements for the General Fund:
1) Departments, and departments with commission approval, prepare detailed recommendations to the Mayor on the budget. Prior to June 15, the Mayor, with the assistance of the other members of the Board of Finance, prepares and submits to the City Council a proposed budget for the fiscal year com-mencing the following July 1. The operating budget includes proposed expenditures and estimated revenues.
2) Prior to July l, the budget is legally enacted through passage of a resolu-tion of the City Council.
3) The Mayor may propose, with the advice of the Board of Finance, amend-ments to the budget. Such proposed amendments require a majority approval of the City Council. The amount of such proposed amendments may be decreased by a simple majority vote of the City Council. Such proposed amendments may be increased above the level proposed by the Mayor only with a two-thirds vote of the City Council.
4) The Board of Finance is authorized to transfer budgeted amounts between line items within an appropriation account or within accounts of a depart-ment. Any revisions which increase the total expenditures of any depart-ment function or fund above the original appropriation must be approved by resolution of the City Council.
5) That portion of the designated fund balance that consists of operating and capital improvement carry-overs, represents unexpended appropriations, which are allowed to be carried over to later years as provided for by City Charter or by resolution of the City Council. All other unexpended appro-priations lapse at the close of the fiscal year. The City Charter specifically prohibits expenditures in excess of appropriations, except on an emergency basis for health, police, fire and public welfare.

64
6) The City of Burlington tax rate can change each year by the cost of CCTA, Retirement, County and Debt Service without voter approval. However, any rate change on the tax rate for other purposes, above the maximum approved tax rate previously approved by voters, must be approved by City voters.
7) Title III, Section 70(a) of the Burlington City Charter defines the legal level of budgeting control at the department level. Excerpts of Section 70(a) are as follows:
No superintendent, board or commission member or corresponding exec-utive officer of any city department, with the exception of the health, police and fire departments, and then only in case of an emergency, shall expend any money or incur any obligation, unless there is an avail-able appropriation from which the same may be paid and to which it may be charged, and shall not at any time expend any money or incur any obligation in excess of such appropriation. In case any such super-intendent, board or commission member or corresponding executive officer of any city department violates this provision, the city chief administrative officer shall report such occurrence to the mayor and to the city council. The mayor shall advise the city council as to whether there was appropriate justification for such violation and if the mayor and city council agree that such violation was unjustified, the mayor may recommend and the city council may determine that the office shall thereupon become vacant and shall be forthwith filled for the unexpired term of the officials authorized to make the original appointment in such case. Nothing in this section shall be construed to authorize the city council to remove a duly-elected school commis-sioner or the superintendent of schools.
Encumbrance accounting, under which purchase orders, contracts and other com-mitments for the expenditure of monies are recorded in order to reserve that por-tion of the applicable appropriation, is not employed as an extension of formal budgetary integration in any fund in the City.
C. Budgetary Basis
The general fund final appropriation appearing on the “Budget and Actual” page of the fund financial statements represents the final amended budget after all reserve fund transfers and supplemental appropriations.
D. Budget/GAAP Reconciliation
The budgetary data for the general fund is based upon accounting principles that differ from generally accepted accounting principles (GAAP). Therefore, in addi-tion to the GAAP basis financial statements, the results of operations of the general fund are presented in accordance with budgetary accounting principles to provide a meaningful comparison to budgetary data.

65
The following is a summary of adjustments made to the actual revenues and other sources, and expenditures and other uses, to conform to the budgetary basis of accounting.
General Fund
Revenues/expenditures(GAAP Basis) $ 60,899,020 $ 55,817,438
Other financing sources/uses(GAAP Basis) 11,072,834 12,405,835
Reverse refunding gross up (9,679,052) (9,679,052)
Reverse gross up of capital leases (987,234) (987,234)
Budgetary Basis $ 61,305,568 $ 57,556,987
Revenuesand Other
Financing Sources
Expendituresand Other
Financing Uses
E. Budget Over Expenditures
The City Attorney’s department overspent their budget by $1,796 due to arbitra-tion and contractual services costs.
F. Deficit Fund Equity
The following funds had unassigned fund balance deficits as of June 30, 2016:
Non-major Governmental funds:Special Revenue funds:
Church St. marketplace $ (43,594) Capital Project funds:
Champlain parkway (554,296) Waterfront access (244,396) Traffic capital (1,489,632) Wayfinding (127,360) Downtown westlake (11,132) Other (3,553)
Total $ (2,473,963)
The deficits will be eliminated through future departmental revenues, bond pro-ceeds, and transfers from other funds.

66
3. Cash and Cash Equivalents
The custodial credit risk for current operating deposits is the risk that in the event of a bank failure, the City’s deposits may not be recovered. Primary Government – The deposits at June 30, 2016 totaled $65,986,025, of which $43,238,880 were insured or collateralized by the FDIC and the FHLB Pittsburgh letter of credit up to $20,000,000 and FHLB Cincinnati letter of credit up to $20,000,000. At June 30, 2016, $22,747,145 remains uncollateralized and exposed to custodial credit risk. Discretely Presented Component Unit – School District – At June 30, 2016, the School District has an outstanding irrevocable standby letter of credit issued by the Federal Home Loan Bank of Pittsburgh serving as collateral for its deposits held at TD, Bank, N.A. This letter of credit, which expires at the close of business on August 22, 2016, authorizes one draw only up to the amount of $17,000,000. There were no draws for the year ended June 30, 2016. Component Unit Fiduciary in Nature – BERS – At June 30, 2016, the System’s deposits exceeded collateralization levels when combined with the City.
4. Investments
Primary Government, Excluding Electric Department
A. Investments
The City’s investments include various certificates of deposits for a total of $3,271,841 and US Treasury and other US Government obligation securities in the amount of $2,564,159.
B. Credit Risk
Generally, credit risk is the risk that an issuer of an investment will not fulfill its obligation to the holder of the investment. The City’s investment in debt related securities include US Treasury and other US Government obligation securities with implicit rating of AAA.
C. Custodial Credit Risk
The custodial credit risk for investments is the risk that, in the event of the failure of the counterparty (e.g., broker-dealer) to a transaction, a government will not be able to recover the value of its investment or collateral securities that are in the possession of another party. The City does not have policies for custodial credit risk. At June 30, 2016, $32,052 of the certificates of deposits exceeded the FDIC limit. The City’s investment in debt related securities was not insured or collateralized.

67
D. Concentration of Credit Risk
The City places no limit on the amount the City may invest in any one issuer. At June 30, 2016, the City did not have any investments in any one issuer (other than U.S. Treasury and Government agencies securities) that represented 5% or more of City investments.
E. Interest Rate Risk
Interest rate risk is the risk that changes in market interest rates will adversely affect the fair value of an investment. Generally, the longer the maturity of an investment, the greater the sensitivity of its fair value to changes in market interest rates. The City has a formal investment policy that limits investment maturities as a means of managing its exposure to fair value losses arising from increasing interest rates.
F. Foreign Currency Risk
Foreign currency risk is the risk that changes in foreign exchange rates will adversely affect the fair value of an investment. The City does not have any such invest-ments, or policies for foreign currency risk.
G. Fair Value
The City categorizes its fair value measurements within the fair value hierarchy established by Governmental Accounting Standards Board Statement No. 72 Fair Value Measurement and Application (GASB 72). The hierarchy is based on the valuation inputs used to measure the fair value of the asset and give the highest priority to unadjusted quoted prices in active markets for identical assets or liabilities (level 1 measurements) and the lowest priority to unobservable inputs (level 3 measurements).
Level 1 - Unadjusted quoted prices for identical instruments in active markets. Level 2 – Quoted prices for similar instruments in active markets; quoted prices for identical or similar instruments in markets that are not active; and model-derived valuations in which all significant inputs are observable. Level 3 – Valuations derived from valuation techniques in which significant inputs are unobservable.

68
The City categorizes its fair value investments as follows:
Description
Investments by fair value level:Debt securities
Federal agency securities $ 2,063,609 $ - $ 2,063,609 $ - US Treasury notes 500,550 - 500,550 -
Total $ 2,564,159 $ - $ 2,564,159 $ -
identical assets inputs inputs (Level 1) (Level 2) (Level 3)
markets for observable unobservable
Fair Value Measurements Using:
Quoted pricesin active Significant Significant
Burlington Electric Department
A. Investments
The Department has a formal investment policy and is authorized per Article 1, Section 1.1 of the General Bond Resolution to invest in obligations as follows: 1) Direct obligations of the United States of America or obligations guaranteed
by the United States of America.
2) Bonds, notes or other evidence of indebtedness issued or guaranteed by the CoBank, Federal Intermediate Credit Banks, FHLB, FNMA, GNMA, Export-Import Bank of the United States, Federal Land Banks, U.S. Postal Service, Federal Financing Bank, or any agency or instrumentality of or corporation wholly-owned by the United States of America.
3) New Housing Authority Bonds issued by public agencies or municipalities and fully secured by a pledge of annual contributions under annual contri-bution contracts with the United States or America, or Project Notes issued by public agencies or municipalities and fully secured by a requisition or pay-ment agreement with the United States of America.
4) Obligations of any state, commonwealth or territory of the United States of America, or the District of Columbia, or any political subdivision of the fore-going, with an investment grade rating not lower than the three highest cate-gories by at least one nationally recognized debt rating service.
5) Certificates of deposit and bankers acceptances issued by banks which are members of the FDIC and each of which has a combined capital and surplus of not less than ten million dollars, provided that the time deposits in and acceptances of any bank under the Resolution (a) do not exceed at any time twenty-five percent of the combined capital and surplus of the bank or (b) are fully secured by obligations described in items 1, 2, 3, and 4 of this paragraph.

69
6) Repurchase contracts with banks which are described in item 5 of this para-graph, or with recognized primary dealers in government bonds, fully secured by obligations described in items 1, 2, 3, and 4 or this paragraph.
B. Concentration of Credit Risk
Concentration of credit risk of investments is the risk of loss attributable to the magnitude of a government’s investment in a single issuer. The Electric Department invests its current operating cash in three money market accounts with TD Bank and its restricted noncurrent funds in several money market accounts with its bond trustees (US Bank and Peoples United), which exceed 29% of the total investment balance at June 30, 2016. The invested balance of current money market funds at June 30, 2016 was $4,212,742. The invested balance on noncurrent money market funds at June 30, 2016 was $3,239,114.
C. Interest Rate Risk
Interest rate risk is the risk that changes in interest rates of debt investments that will adversely affect the fair value of an investment. The Electric Department has minimized its risk exposure as its investments are limited to government securities and other conservative investments as outlined in the investment policy. The Electric Department’s investments as of June 30, 2016 (all of which are restricted by Bond resolution) only included money market funds and certificates of deposit. The Department is required by its bond indenture to make monthly deposits into the renewal and replacement fund equal to 10% of the monthly revenue bond debt service funding requirements. Funds on deposit may be withdrawn from the renewal and replacement fund for expenses allowed by the bond covenant. Amounts in excess of $867,000 at June 30 may be returned to the revenue fund. A summary of deposits with bond trustees is as follows:
6/30/16
Bond funds:Renewal and replacement fund $ 1,135,640 Debt service fund 2,073,296 Debt service reserve fund 2,744,177
5,953,113 Accrued interest receivable 44,227
Total $ 5,997,340
D. Fair Value
The Department categorizes its money market investments within level 1 of the fair value hierarchy established by GASB 72.

70
Discretely Presented Component Unit – School District
A. Credit Risk
Statutes for the State of Vermont authorize the School District to invest in obliga-tions of the U.S. Treasury, agencies and instrumentalities, other states and Canada, provided such securities are rated within the three highest grades by an approved rating service of the State of Vermont, corporate stocks and bonds within statutory limits, financial institutions, mutual funds and repurchase agreements. The School District does not have an investment policy on credit risk. Generally, the School District invests excess funds in savings accounts and various insured certificates of deposit.
B. Custodial Credit Risk
The custodial credit risk for investments is that, in the event of failure of the coun-terparty, the School District will not be able to recover the value of its investments or collateral securities that are in possession of an outside party. Currently, the School District does not have a policy for custodial credit risk for investments. At June 30, 2016, the District’s investments of $199,408 in certificates of deposit were fully insured by federal depository insurance and consequently were not exposed to custodial credit risk.
C. Interest Rate Risk
Interest rate risk is the risk that changes in interest rates will adversely affect the fair value of an investment. The School District does not have a formal invest-ment policy that limits investment maturities as a means of managing its exposure to fair value losses arising from fluctuations in interest rates.
Burlington Employees Retirement System
A. Credit Risk
The System invests in private equities, which are exempt from the credit risk disclosure.
B. Custodial Credit Risk
The custodial credit risk for investments is the risk that, in the event of the failure of the counterparty (e.g., broker-dealer) to a transaction, a government will not be able to recover the value of its investment or collateral securities that are in the possession of another party. The System does not have a policy for custodial credit risk. The System’s investment in private equities has a custodial credit risk exposure because the related securities are either uninsured or uncollateralized.

71
C. Concentration of Credit Risk
The System does not have a policy for concentration of credit risk. The following represents investments in one issuer greater than 5% of total investments:
EB DV Non-SL Stock Index Fund $ 46,826,352 EB DL Smid Cap Stock Index Fund $ 28,352,332 EB DV Non-SL International Stock Index Fund $ 14,668,936 EB DV Non-SL Emerging Markets Stock Index Fund $ 16,392,711 EB DV Non-SL Intermediate Govt/Credit Bond Index Fund $ 42,319,105
D. Interest Rate Risk
Interest rate risk is the risk that changes in market interest rates will adversely affect the fair value of an investment. The System does not have a policy for interest rate risk.
E. Foreign Currency Risk
Foreign currency risk is the risk that changes in foreign exchange rates will adversely affect the fair value of an investment. The System does not have a policy to man-age foreign currency risk.
F. Fair Value
GASB 72 established the fair value hierarchy levels based on the valuation inputs used to measure the fair value of the asset. The System does not place their investments by these levels, as they are all measured at NAV (net asset value per share or its equivalent), such as share of index funds or partnership member units.
Investments that are measured at fair value using the NAV as a practical expedient are not classified in the fair value hierarchy per GASB 72. Hamilton Lane and Sustainable Woodlands investment value is based on the System’s share of fair value of partner’s capital at year end. The System’s share of EB DV and DL Index Funds of the Bank of New York Mellon were valued based on net asset values of the Funds derived from audited financial statements of the respective funds. The investment strategy of the System matches the investment strategy of the funds. The primary holdings of the BNY Mellon funds are as follows:
EB DV Non-SL Stock Index Fund – level 1 EB DL Smid Cap Stock Index Fund – level 2 EB DV Non-SL International Stock Index Fund – level 1 EB DV Non-SL Emerging Markets Stock Index Fund – level 1 EB DV Non-SL Intermediate Govt/Credit Bond Index Fund – level 2
The following summarizes the investment strategies of the underlying BNY Mellon funds:
Equities – Stocks traded on U.S. security exchanges are valued by the Service approved by the Trustee at closing market prices on the valuation date. Stocks

72
traded on a non-U.S. security exchange are valued at closing market prices on the applicable non-U.S. security exchange on the valuation date. These types of investments are generally categorized within Level 1 of the fair value hierarchy. If market quotations are not readily available for any stocks traded on U.S. or non-U.S. security exchanges, the assets may be valued by a method the Trustee of the Fund has determined accurately reflects fair value. In these instances, stocks are generally categorized within Level 2 of the fair value hierarchy. Bond funds – Fixed income securities are valued on the basis of valuations provided by the Service which determines valuations using methods based upon market transactions for comparable securities and various relationships between securities which are generally recognized by institutional traders. These valua-tions are based on methods which include the consideration of: yields or prices of securities of comparable quality, coupon, maturity and type; indications as to values from dealers; and general market conditions. If market quotations are not readily available for valuations, assets may be valued by a method the Trustee of the Fund has determined accurately reflects fair value. These types of investments are generally categorized within Level 2 of the fair value hierarchy.
The System categorizes its investments as follows:
Investments measured atthe net asset value (NAV): Hamilton Lane Secondary Fund II LP $ 540,388 Hamilton Lane Private Equity Offshore Fund VII Series A LP 1,198,519 Hamilton Lane Private Equity Offshore Fund VII Series B LP 723,997 Sustainable Woodlands Fund II LP 3,271,228 EB DV Non-SL Stock Index Fund 46,826,352 EB DL Smid Cap Stock Index Fund 28,352,332 EB DV Non-SL International Stock Index Fund 14,668,936 EB DV Non-SL Emerging Markets Stock Index Fund 16,392,711 EB DV Non-SL Intermediate Govt/Credit Bond Index Fund 42,319,105
Total $ 154,293,568
Description
Hamilton Lane Secondary Fund II LP $ 540,388 $ 417,305 N/A (a) N/A Hamilton Lane Private Equity Offshore Fund VII Series A LP 1,198,519 176,274 N/A (a) N/A Hamilton Lane Private Equity Offshore Fund VII Series B LP 723,997 304,341 N/A (a) N/A Sustainable Woodlands Fund II LP 3,271,228 - N/A (a) N/A EB DV Non-SL Stock Index Fund 46,826,352 - daily 1 day EB DL Smid Cap Stock Index Fund 28,352,332 - daily 1 day EB DV Non-SL International Stock Index Fund 14,668,936 - daily 1 day EB DV Non-SL Emerging Markets Stock Index Fund 16,392,711 - weekly 2 days EB DV Non-SL Intermediate Govt/Credit Bond Index Fund 42,319,105 - daily 1 day
(a) Units may be sold at any time on the secondaries market, with approval of the General Partner, although not ordinarily done, as this mostly likely will result in a loss. Parternship agreements are entered into with the intent of holding them to maturity when the partnerships sell all the remaining assets and declares distributions. Therefore, redemptions are not typically eligible until end of partnership terms.
Value Commitments eligible) Period
RedemptionFrequency Redemption
Unfunded (If currently Notice

73
5. Taxes Receivable
The City is responsible for assessing and collecting its own property taxes as well as education property taxes for the State. Property taxes are assessed based on property valuations as of April 1, annually. Taxes are due four times per year on August 12, November 12, March 12, and June 12. Taxes unpaid after each due date are considered to be late and are subject to 1% interest added on the next day; an additional 4% interest is added after the tenth day late and an additional 1% per month thereafter. Taxes which remain unpaid ten days after the June 12 due date are delinquent and are subject to an 8% penalty and interest calculated at 12%. Unpaid taxes become an enforceable lien on the property and such properties are subject to tax sale. Taxes receivable at June 30, 2016 consist of the following:
Property taxes:2016 $ 589,657 2015 100,455 2014 30,994 Prior years 736,111
Gross receipts taxes 581,912 Allowance for doubtful taxes (110,200)
Total $ 1,928,929
6. User Fees Receivable
User fees receivable include amounts due from customers for electric service, rent and passenger facility charges at the airport, cable, internet and phone services, and water, wastewater, and stormwater usage. User fees receivable are reported net of an allow-ance for doubtful accounts estimated at up to 30% of accounts receivable depending on the aging of the receivables. Water, wastewater, and stormwater delinquent receivables are liened in a similar manner as property taxes, described in Note 5. User fees receivable and related allowance for doubtful accounts at June 30, 2016 consist of the following:
Billed Allowance forService Fees Doubtful Fees Total
Electric $ 4,641,904 $ (353,138) $ 4,288,766 Airport 1,409,068 (26,321) 1,382,747 Nonmajor Enterprise Funds:
Telecom 930,063 (128,468) 801,595 Wastewater 873,081 (3,000) 870,081 Water 746,497 (3,000) 743,497 Stormwater 130,581 - 130,581
Total $ 8,731,194 $ (513,927) $ 8,217,267

74
7. Departmental and Other Receivables
Departmental and other receivables, as reported in the governmental funds, represent ambulance, police tickets, local option sales tax, community and economic develop-ment office receivables, and other reimbursements.
LocalPolice OptionTickets Sales Tax Other Total
Gross $ 164,498 $ 2,610,911 $ 594,048 $ 814,318 $ 4,183,775 Less: Allowance for doubtful accounts - (1,860,414) - (89,385) (1,949,799)
Total $ 164,498 $ 750,497 $ 594,048 $ 724,933 $ 2,233,976
Ambulance
8. Intergovernmental Receivables
This balance represents reimbursements requested from Federal and State agencies for expenditures incurred in fiscal 2016.
Total
Public safety grants $ 594,049 $ - $ 594,049 V.T. municipal bond bank 2,112,949 57,211 2,170,160 Capital project grants 2,052,994 - 2,052,994 Community development grants 1,246,725 - 1,246,725 Airport improvements - 2,634,698 2,634,698
Total $ 6,006,717 $ 2,691,909 $ 8,698,626
ActivitiesGovernmental Business-Type
Activities
9. Notes and Loans Receivables
The City, through various state and federal grant programs, has extended loans for the development or rehabilitation of residential and commercial properties within the City and small business loans for new Burlington businesses. The repayment terms of these loans and interest rates all vary and are contingent on numerous factors outside of the control of the City, such as the financial viability of the projects. It is the City’s policy to recognize the grant revenues when the loans are repaid.

75
The following is a summary of the major components of notes, loans, and accrued interest receivables at June 30, 2016: Governmental Funds: Less: Less:
Receivable Discount Allowance Total
HODAG loans $ 7,415,942 $ - $ (6,949,348) $ 466,594 Housing and Urban Development Programs: -
HOME loans 7,505,994 (2,361,907) (3,894,155) 1,249,932 Lead Paint loans 2,416,890 (216,772) (1,651,823) 548,295 CEDO admin loan 2,006,678 (321,832) - 1,684,846 Other loans 1,409,810 (128,344) (297,827) 983,639
Total notes and loans receivable $ 20,755,314 $ (3,028,855) $ (12,793,153) $ 4,933,306
10. Capital Lease Receivable - BCDC
The Burlington Community Development Corporation (BCDC) has various receiv-ables on outstanding development or rehabilitation of properties within the City from new businesses. The repayment terms vary and are contingent on numerous factors outside the control of the City. The following is a summary of the major components of capital lease receivables for BCDC at June 30, 2016:
BCDC capital lease receivable from Westlake Parking, LLC dated 7/26/2007. The annual lease payment is $72,000, including interest at 7% annually, maturing on 7/26/2026 with a lump sum payment of $448,000. The lease requires an annual contribution of $6,000 to a capital reserve fund. $ 752,746
BCDC 1993 relief bond receivables (3) from Champlain Housing Trust Corporation, offset by bond payable. The total quarterly payments are $21,588 including interest rates between 3.25% - 4.00%, maturing in FY2024 and FY2025. 593,678
BCDC Multi-generational bond receivable from Champlain Housing Trust Corporation, offset by bond payable. The monthly payment is $1,879, maturing on October 1, 2028. 207,242
Total capital leases receivable 1,553,666
Less: amount due within one year (98,400)
Capital leases receivable,net of current portion $ 1,455,266
ComponentUnit

76
Expected future receipts of BCDC’s lease receivables are as follows:
FiscalYear Principal Interest Total
2017 $ 98,401 $ 82,497 $ 180,898 2018 102,744 78,154 180,898 2019 107,289 73,599 180,888 2020 112,076 68,822 180,898 2021 117,088 63,810 180,898
2022-2026 480,496 241,463 721,959 2027-2029 535,572 37,065 572,637
Total $ 1,553,666 $ 645,410 $ 2,199,076
11. Due from Fiduciary/Due to Primary Government
At June 30, 2016, the General Fund reported $2,000,000 due from Fiduciary Pension Trust Fund – Burlington Employee Retirement System, while the System reported a corresponding due to Primary Government. The System sold investments on June 27, 2016 to reimburse the pooled cash fund shared with the City. The settlement date for investment sales was July 1, 2016 and therefore the System reported the securities sold receivable and the amount is included in Due from Broker at year end.
12. Interfund Advances and Transfers
Although self-balancing funds are maintained, most transactions flow through the general fund. In order to obtain accountability for each fund, interfund receivable and payable accounts must be utilized. The composition of advances to/from other funds (amounts considered to be long-term) as of June 30, 2016 is as follows:
Fund
General fund $ 2,033,562 $ - Other Nonmajor Governmental funds:
Community and Economic Development Office - 414,408 Church Street Marketplace - 43,594 Champlain Parkway - 534,296 Wayfinding - 127,360 FEMA - 211,879 General Capital - 361,145 Downtown Westlake - 299,463 Other - 41,417
Total $ 2,033,562 $ 2,033,562
Advances toOther Funds
Advances fromOther Funds

77
The City reports interfund transfers between many of its funds. The sum of all trans-fers presented in the table agrees with the sum of interfund transfers presented in the governmental and proprietary fund financial statements. The following is an analysis of interfund transfers made in fiscal year 2016:
Governmental Funds:
Major funds:General fund $ 406,548 $ 2,361,696 Nonmajor funds:
Special Revenue funds:Traffic commission 317,470 27,197 Community and economic development 232,590 - Tax increment financing - 1,783,195 Church street market place 11,000 - Impact Fees - 18,000 Dedicated taxes 181,775 -
Capital Project funds:Champlain parkway 17,361 - Waterfront access 1,722,567 - Street & sidewalk infrastructure 1,627,201 312,949 Wayfinding 7,197 - Other 8,631 -
Permanent funds:Cemetery - 29,303
Subtotal Nonmajor Governmental funds 4,125,792 2,170,644
Grand Total $ 4,532,340 $ 4,532,340
Transfers In Transfers Out
Transfers are used to (1) move revenues from the fund that statute or budget requires collecting them to the fund that statute or budget requires to expend them, and (2) use unrestricted revenues collected in the general fund to finance various programs and accounted for in other funds in accordance with budgetary authorizations.
13. Capital Assets
Capital asset activity for the City’s Governmental and Business-Type Activities, as well as each enterprise fund, for the year ended June 30, 2016 was as follows:

78
Governmental Activities: Capital assets, not being depreciated:
Land $ 13,680,454 $ 500,000 $ - $ 14,180,454 Construction in progress 16,117,199 8,881,545 (23,650) 24,975,094 Antiques and works of art 52,000 - - 52,000
Total capital assets, not being depreciated 29,849,653 9,381,545 (23,650) 39,207,548
Capital assets, being depreciated:Land improvements 2,919,766 425,099 - 3,344,865 Buildings and building improvements 52,294,202 536,324 - 52,830,526 Vehicles, machinery, equipment and furniture 21,804,965 1,790,656 (655,395) 22,940,226 Book collections 1,816,161 183,955 - 2,000,116 Infrastructure 114,582,381 1,685,370 - 116,267,751
Total capital assets, being depreciated 193,417,475 4,621,404 (655,395) 197,383,484
Less accumulated depreciation for:Land improvements (1,291,240) (106,599) - (1,397,839) Buildings and building improvements (12,066,253) (755,944) - (12,822,197) Vehicles, machinery, equipment and furniture (15,963,794) (1,571,773) 614,729 (16,920,838) Book collections (1,330,772) (194,455) - (1,525,227) Infrastructure (66,261,926) (3,571,817) - (69,833,743)
Total accumulated depreciation (96,913,985) (6,200,588) 614,729 (102,499,844)
Total capital assets, being depreciated, net 96,503,490 (1,579,184) (40,666) 94,883,640
Governmental activities capital assets, net $ 126,353,143 $ 7,802,361 $ (64,316) $ 134,091,188
Beginning Balance Increases Decreases
Ending Balance
Business-Type Activities- Combined all Enterprise Funds: Capital assets, not being depreciated: Land $ 25,458,985 $ 864,910 $ - $ 26,323,895 Construction in progress 36,040,741 12,024,744 (13,383,548) 34,681,937
Total capital assets, not being depreciated 61,499,726 12,889,654 (13,383,548) 61,005,832
Capital assets, being depreciated:Land improvements 98,088,249 9,440,361 - 107,528,610 Buildings and building improvements 85,833,806 1,117,813 - 86,951,619 Vehicles, machinery, equipment and furniture 24,900,162 2,214,172 (170,581) 26,943,753 Distribution and collection systems 234,633,283 5,953,154 (1,129,856) 239,456,581 Intangible asset 6,000,000 - - 6,000,000
Total capital assets, being depreciated 449,455,500 18,725,500 (1,300,437) 466,880,563
Less accumulated depreciation for:Land improvements (48,331,072) (3,530,911) - (51,861,983) Buildings and building improvements (32,228,378) (2,555,265) - (34,783,643) Vehicles, machinery, equipment and furniture (16,838,241) (1,458,472) 149,295 (18,147,418) Distribution and collection systems (116,065,031) (7,129,287) 642,481 (122,551,837) Intangible asset (300,000) (300,000) - (600,000)
Total accumulated depreciation (213,762,722) (14,973,935) 791,776 (227,944,881)
Total capital assets, being depreciated, net 235,692,778 3,751,565 (508,661) 238,935,682
Business-type activities capital assets, net $ 297,192,504 $ 16,641,219 $ (13,892,209) $ 299,941,514
Beginning Balance Increases Decreases
Ending Balance

79
Electric Enterprise Fund: Capital assets, not being depreciated: Land $ 1,335,521 $ - $ - $ 1,335,521 Construction in progress 805,158 6,488,109 (4,953,540) 2,339,727
Total capital assets, not being depreciated 2,140,679 6,488,109 (4,953,540) 3,675,248
Capital assets, being depreciated:Distribution and collection systems 181,139,755 5,288,964 (1,113,680) 185,315,039
Total capital assets, being depreciated 181,139,755 5,288,964 (1,113,680) 185,315,039
Less accumulated depreciation for:Distribution and collection systems (84,349,439) (6,163,150) 627,446 (89,885,143)
Total accumulated depreciation (84,349,439) (6,163,150) 627,446 (89,885,143)
Total capital assets, being depreciated, net 96,790,316 (874,186) (486,234) 95,429,896
Electric Enterprise Fund capital assets, net $ 98,930,995 $ 5,613,923 $ (5,439,774) $ 99,105,144
Beginning Balance Increases Decreases
Ending Balance
Airport Enterprise Fund: Capital assets, not being depreciated: Land $ 23,066,462 $ 864,910 $ - $ 23,931,372 Construction in progress 35,020,624 5,382,299 (8,215,049) 32,187,874
Total capital assets, not being depreciated 58,087,086 6,247,209 (8,215,049) 56,119,246
Capital assets, being depreciated:Land improvements 68,169,214 9,440,361 - 77,609,575 Buildings and building improvements 84,552,248 1,055,345 - 85,607,593 Vehicles, machinery, equipment and furniture 10,332,419 380,353 (85,474) 10,627,298
Total capital assets, being depreciated 163,053,881 10,876,059 (85,474) 173,844,466
Less accumulated depreciation for:Land improvements (32,768,475) (2,798,610) - (35,567,085) Buildings and building improvements (31,984,299) (2,527,534) - (34,511,833) Vehicles, machinery, equipment and furniture (5,606,733) (602,498) 79,188 (6,130,043)
Total accumulated depreciation (70,359,507) (5,928,642) 79,188 (76,208,961)
Total capital assets, being depreciated, net 92,694,374 4,947,417 (6,286) 97,635,505
Airport Enterprise Fund capital assets, net $ 150,781,460 $ 11,194,626 $ (8,221,335) $ 153,754,751
Beginning Balance Increases Decreases
Ending Balance

80
Telecom Enterprise Fund: Capital assets, not being depreciated: Land $ 157,800 $ - $ - $ 157,800
Total capital assets, not being depreciated 157,800 - - 157,800
Capital assets, being depreciated:Buildings and building improvements 1,199,240 50,751 - 1,249,991 Vehicles, machinery, equipment and furniture 1,141,737 1,632,489 - 2,774,226 Intangible asset 6,000,000 - - 6,000,000
Total capital assets, being depreciated 8,340,977 1,683,240 - 10,024,217
Less accumulated depreciation for:Buildings and building improvements (242,433) (24,204) - (266,637) Vehicles, machinery, equipment and furniture (161,818) (275,585) - (437,403) Intangible asset (300,000) (300,000) - (600,000)
Total accumulated depreciation (704,251) (599,789) - (1,304,040)
Total capital assets, being depreciated, net 7,636,726 1,083,451 - 8,720,177
Telecom Enterprise Fund capital assets, net $ 7,794,526 $ 1,083,451 $ - $ 8,877,977
Beginning Balance Increases Decreases
Ending Balance
Wastewater Enterprise Fund: Capital assets, not being depreciated: Land $ 847,952 $ - $ - $ 847,952
Total capital assets, not being depreciated 847,952 - - 847,952
Capital assets, being depreciated:Land improvements 29,919,035 - - 29,919,035 Buildings and building improvements 82,318 11,717 - 94,035 Vehicles, machinery, equipment and furniture 11,952,352 68,582 (39,763) 11,981,171 Distribution and collection systems 17,689,669 - - 17,689,669
Total capital assets, being depreciated 59,643,374 80,299 (39,763) 59,683,910
Less accumulated depreciation for:Land improvements (15,562,597) (732,301) - (16,294,898) Buildings and building improvements (1,646) (3,527) - (5,173) Vehicles, machinery, equipment and furniture (10,160,821) (489,909) 34,763 (10,615,967) Distribution and collection systems (7,548,649) (355,576) - (7,904,225)
Total accumulated depreciation (33,273,713) (1,581,313) 34,763 (34,820,263)
Total capital assets, being depreciated, net 26,369,661 (1,501,014) (5,000) 24,863,647
Wastewater Enterprise Fund capital assets, net $ 27,217,613 $ (1,501,014) $ (5,000) $ 25,711,599
Beginning Balance Increases Decreases
Ending Balance
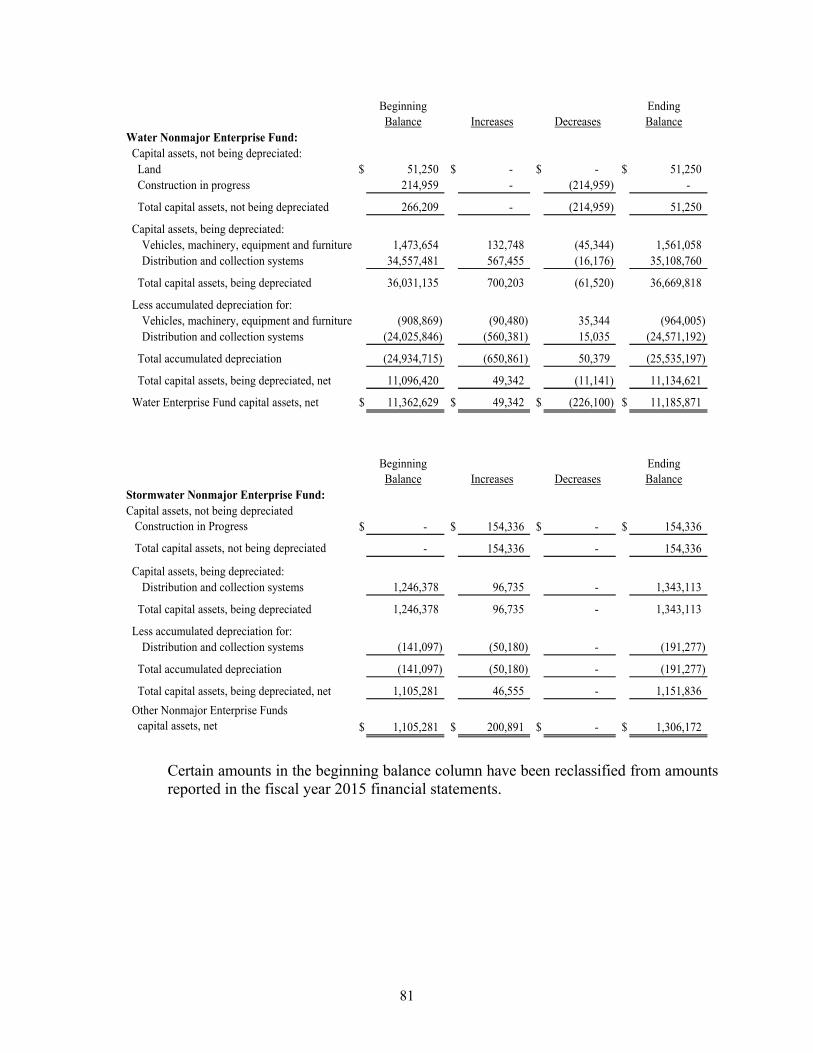
81
Water Nonmajor Enterprise Fund: Capital assets, not being depreciated: Land $ 51,250 $ - $ - $ 51,250 Construction in progress 214,959 - (214,959) -
Total capital assets, not being depreciated 266,209 - (214,959) 51,250
Capital assets, being depreciated:Vehicles, machinery, equipment and furniture 1,473,654 132,748 (45,344) 1,561,058 Distribution and collection systems 34,557,481 567,455 (16,176) 35,108,760
Total capital assets, being depreciated 36,031,135 700,203 (61,520) 36,669,818
Less accumulated depreciation for:Vehicles, machinery, equipment and furniture (908,869) (90,480) 35,344 (964,005) Distribution and collection systems (24,025,846) (560,381) 15,035 (24,571,192)
Total accumulated depreciation (24,934,715) (650,861) 50,379 (25,535,197)
Total capital assets, being depreciated, net 11,096,420 49,342 (11,141) 11,134,621
Water Enterprise Fund capital assets, net $ 11,362,629 $ 49,342 $ (226,100) $ 11,185,871
Beginning Balance Increases Decreases
Ending Balance
Stormwater Nonmajor Enterprise Fund:Capital assets, not being depreciated Construction in Progress $ - $ 154,336 $ - $ 154,336
Total capital assets, not being depreciated - 154,336 - 154,336
Capital assets, being depreciated:Distribution and collection systems 1,246,378 96,735 - 1,343,113
Total capital assets, being depreciated 1,246,378 96,735 - 1,343,113
Less accumulated depreciation for:Distribution and collection systems (141,097) (50,180) - (191,277)
Total accumulated depreciation (141,097) (50,180) - (191,277)
Total capital assets, being depreciated, net 1,105,281 46,555 - 1,151,836
Other Nonmajor Enterprise Funds capital assets, net $ 1,105,281 $ 200,891 $ - $ 1,306,172
Beginning Balance Increases Decreases
Ending Balance
Certain amounts in the beginning balance column have been reclassified from amounts reported in the fiscal year 2015 financial statements.

82
Depreciation expense was charged to functions of the City as follows:
Governmental Activities:General government $ 290,230Public safety 847,883 Public works 4,050,499 Community development 140,241 Culture and recreation 871,735
Total depreciation expense - governmental activities $ 6,200,588
Business-Type Activities:
Electric $ 6,163,150 *Airport 5,928,642 Telecom 599,789 Wastewater 1,581,313 Water 650,861 Stormwater 50,180
Total depreciation expense - business-type activities $ 14,973,935
*Represents depreciation of Electric Capital Assets and not regulatory depreciation expense as reported on the Proprietary Funds Statement of Revenues, Expenses and Changes in Fund Net Position. A summary of Burlington’s component unit Burlington Community Development Corporation’s capital assets activity is as follow:
Beginning EndingBalance Increases Decreases Balance
Burlington Community Development Corporation:Capital Assets, Not Being Depreciated:
Land $ 492,645 $ - $ - $ 492,645 Total Capital Assets, Not Being Depreciated 492,645 - - 492,645
Capital Assets, Being Depreciated:Buildings 4,690,387 - - 4,690,387
Total 4,690,387 - - 4,690,387
Less accumulated depreciation for:Buildings (572,914) (62,539) - (635,453)
Total (572,914) (62,539) - (635,453)
Total Capital Assets, Being Depreciated 4,117,473 (62,539) - 4,054,934
Component Unit Capital Assets, Net $ 4,610,118 $ (62,539) $ - $ 4,547,579

83
A summary of Burlington’s component unit Burlington School District’s capital assets activity is as follow:
Burlington School District: Capital assets, not being depreciated:
Land $ 2,251,677 $ - - $ 2,251,677 Construction in progress 48,074 2,087,406 - 2,135,480
Total capital assets, not being depreciated 2,299,751 2,087,406 - 4,387,157
Capital assets, being depreciated:Buildings and building improvements 51,718,532 75,005 (215,886) 51,577,651 Vehicles, machinery, equipment and furniture 7,062,273 159,235 (458,501) 6,763,007
Total capital assets, being depreciated 58,780,805 234,240 (674,387) 58,340,658
Less accumulated depreciation for:Buildings and building improvements (13,034,951) (1,203,371) 207,250 (14,031,072) Vehicles, machinery, equipment and furniture (5,988,897) (311,566) 391,774 (5,908,689)
Total accumulated depreciation (19,023,848) (1,514,937) 599,024 (19,939,761)
Total capital assets, being depreciated, net 39,756,957 (1,280,697) (75,363) 38,400,897
School capital assets, net $ 42,056,708 $ 806,709 $ (75,363) $ 42,788,054
Beginning Balance Increases Decreases
Ending Balance
14. Regulatory Assets and Other Prepaid Charges
Regulatory and other prepaid charges at June 30, 2016 comprise the following:
Deferred depreciation expense to be recovered in future years $ 2,198,962 Deferred VPSB accounting orders 267,133 Retirement of meters 301,612
Total $ 2,767,707
FundElectric
A. Deferred Depreciation Expense to be Recovered in Future Years
Provisions for depreciation of capital assets, with the exception of the Joseph C. McNeil Generating Station (the McNeil Station) and the Highgate Converter Station (the Highgate Station), are reported using the straight-line method at rates based upon the estimated service lives and salvage values of the several classes of property. Depreciation of capital assets for the McNeil Station and the Highgate Station are calculated using the straight-line method. However, a portion of the current depreciation expense is only recoverable through future rates. The differ-ence is included in deferred charges (calculated as the straight-line depreciation expense less the depreciation expense on a sinking fund basis) and will be recovered

84
in future years. The Department recorded straight-line depreciation of $5,708,741 for the year ended June 30, 2016. In 2016 $275,378 of deferred depreciation expense was realized. Unamortized deferred depreciation balance of $2,198,962 remained at June 30, 2016.
B. Deferred-VPSB Accounting Orders
In 2012, the Department obtained an accounting order from the Vermont Public Service Board (VPSB) related to costs for the McNeil Station turbine overhaul. The total deferred cost was $935,044 and will be amortized over seven years (84 months) beginning July 2011. Amortization expense related to the deferred overhaul charges was $133,566 for 2016, and has been reported as a component of production expense. The unamortized balance at June 30, 2016 is $267,133.
C. Deferred Retirement of Meters
Due to the Smart Grid/Meter project in 2012-2013, under a Department of Public Service directive, the depreciated book value of certain retired meters has been deferred and will be amortized over a five-year period. Amortization expense related to the deferred write off was $128,658 for 2016.
15. Deferred Outflows of Resources – Non Pension Related
Deferred outflows of resources represent the consumption of net assets by the City that is applicable to future reporting periods. Deferred outflows of resources have a positive effect on net position, similar to assets. At June 30, 2016, the Primary Government’s non-pension related deferred outflows of resources consisted of a loss on advance refunding while the Component Unit’s consisted of swap termination fees.
16. Accounts Payable and Accrued Expenses
Accounts payable represent fiscal year 2016 expenditures paid on or after July 1, 2016.
17. Line of Credit
In December 2015, the City issued a $2,200,000 Parking Revenue Note with an interest rate of 2.50% which matures on December 3, 2016. The note is solely payable from net revenues, after payment of operating expenses, of the City’s parking system. During the year drawdowns amounted to $833,628 with no repayments. In February 2012, the City issued on behalf of the Electric Department, a $5,000,000 General Obligation Revenue Anticipation Note (Line of Credit) with a local bank, placing the Line of Credit directly with the Electric Department. In March 2015, this Line of Credit was renewed for a two year term to March 30, 2017. The Electric Department had the entire Line of Credit balance of $5,000,000 available for use during fiscal year 2016.

85
In September 2015, City issued on behalf of the Airport, a Grant Anticipation Line of Credit in the principal amount of up to $7,000,000 with an interest rate of $2.75% which matures on September 20, 2016. The note was secured by AIP grant reimburse-ments. During the year drawdowns on the grant amounted to $1,017,925 while repay-ments were $371,323, leaving an outstanding balance at June 30, 2016 of $646,602.
18. Long-Term Obligations – Primary Government
A. Types of Long-Term Obligations
General Obligation Bonds. The City issues general obligation bonds to provide resources for the acquisition and construction of major capital facilities and to refund prior bond issues. General obligation bonds have been issued for both gov-ernmental and proprietary activities. Bonds are reported in governmental activities if the debt is expected to be repaid from governmental fund revenues and in business-type activities if the debt is expected to be repaid from proprietary fund revenues. General obligation bonds are direct obligations and pledge the full faith and credit of the City. No-Interest Revolving Loans. The State of Vermont offers a number of no-interest revolving loan programs to utilize for predetermined purposes. Two of the five no-interest loans do charge a 2% administration fee. The City has borrowed money from the Vermont Special Environmental Revolving Fund for sewer stormwater projects. These bonds are both general obligation and revenue supported bonds. Revenue Bonds - The City issues bonds where the City pledges income to pay the debt service. Revenue bonds are reported in business type activities only because the debt is expected to be repaid from proprietary fund revenues. Certificates of Participation - The City enters into agreements for the purpose of financing the acquisition and/or renovation of land and buildings. These agree-ments qualify as long-term debt obligations for accounting purposes (even though they include clauses that allow for cancellation of the certificate of participation in the event the City does not appropriate funds in future years). The Certificates of Participation are reported in governmental activities because all of the debt is expected to be repaid from general governmental revenues. Other Notes Payable - The City has other notes payable to finance various capital projects through local banks and U.S. Government agencies. Capital Lease Obligations - The City enters into lease agreements as the lessee for the purpose of financing the acquisition of major pieces of equipment. These lease agreements qualify as capital lease obligations for accounting purposes (even though they include clauses that allow for cancellation of the lease in the event the City does not appropriate funds in future years) and, therefore, have been recorded

86
at the present value of the future minimum lease payments as of the inception date of the leases. Leases are reported in governmental activities if the debt is expected to be repaid from general governmental revenue and in business–type activities if the debt is expected to be repaid from proprietary fund revenues. Compensated Absences - It is the policy of the City to permit certain employees to accumulate earned but unused benefits. The City, excluding the School Fund, allows employees to carryover up to 360 hours of vested vacation time to the next fiscal year. The City also allows all employees hired prior to July 1, 2000 to carry over the lesser of 25% of their sick leave balance or 120 hours. City employees hired after July 1, 2000 may carryover earned sick leave balances; however, it is not a vested benefit upon termination. The School Fund allows certain employees to carryover up to 80 hours vested vacation time. The School Fund also allows sick leave to be vested upon reaching certain plateaus, depending on the individual contract. The School has made the assumption that the employee will likely reach the eligibility threshold once they are within three (3) years of the actual vesting date. The accrual for unused compensated absences time, based on current pay rates, is recorded in the government-wide financial statements and proprietary fund financial statements. Unamortized Premiums, Discounts, and Refunding Losses - Debt premiums, dis-counts, and refunding losses incurred in connection with the sale of bonds are amortized over the terms of the related debt. Unamortized balances are included as a component of long-term debt. Insurance Reserves – This liability represents an estimate of claims incurred but not reported and includes only an estimate for known loss events expected to later be presented as claims. The City is unable to estimate the amount of unknown loss events expected to become claims and expected future developments on claims already reported. Other Post-employment Benefits - The City has recorded a liability for the gov-ernmental activities in the government-wide financial statements and in the indi-vidual enterprise funds and for the business-type activities in the government-wide financial statements which represent their actuarially determined costs for post-employment benefits. These costs relate to subsidized health care and life insurance for retirees during the period from retirement to the date of eligibility for social security benefits. Compensated Absences and Post-employment Benefits are paid by the applicable fund where the employee is charged. Insurance Reserves are generally liquidated by the General Fund.

87
A detailed listing of the general obligation bonds and other notes payable expected to be repaid by governmental funds are as follows:
AmountSerial Outstanding
Maturities Interest Amount as ofGovernmental Activities: Through Rate(s) % Issued 6/30/16
General obligation bonds:General Improvements 2004 Refunding Series B 12/01/2016 2.00 - 3.80% $ 530,000 $ 45,000General Improvements 2006 Series A 11/01/2026 3.50 - 4.00% 1,000,000 45,000General Improvements 2007 Series A 11/01/2027 3.50 - 4.25% 1,000,000 90,000General Improvements 2009 Series C 11/01/2029 2.00 - 4.125% 1,000,000 765,000General Improvements 2009 Series C 11/01/2029 2.00 - 4.125% 1,000,000 765,000General Improvements 2009 Series C - Street Impr. 11/01/2029 2.00 - 4.125% 2,250,000 1,725,000General Improvements 2011 Series A 11/01/2031 3.00 - 4.75% 1,000,000 860,000General Improvements 2011 Series A - Fire 11/01/2031 3.00 - 4.75% 1,325,000 1,140,000General Improvements 2011 Series A - Street Paving 11/01/2031 3.00 - 4.75% 3,250,000 2,790,000General Improvements 2011 Series B 11/01/2031 2.00 - 4.75% 1,000,000 855,000Public Improvement Bonds 2012 Series A 11/01/2032 5.00% 1,000,000 905,000Public Improvement Bonds 2012 Series A 11/01/2032 5.00% 2,000,000 1,815,000Taxable G.O. Bonds 2013 Series A - Fiscal Stability 11/01/2028 3.50 - 5.25% 9,000,000 7,960,000Public Improvement Bonds 2013 Series B 11/01/2033 4.00 - 6.75% 2,000,000 1,364,286Public Improvement Bonds 2014 Series A 11/15/2034 0.51 - 3.99% 2,000,000 1,900,000Public Improvement Bonds 2015 Series A 11/1/2035 5.00% 2,000,000 2,000,000Refunding Bond Series 2016A 6/30/2030 3.00 - 5.00% 1,570,000 2,195,000
Total general obligation bonds 27,219,286 Other debt:
HUD Section 108 - US Guaranteed Notes 1999 08/01/2017 5.40 - 6.20% 1,930,000 220,000 HUD Section 108 - US Guaranteed Notes 2003 08/01/2022 3.25% 3,602,000 495,000 HUD Section 108 - US Guaranteed Notes 2005 08/01/2018 variable 1,827,000 800,000 Special Obligation Tax Increment Financing Bond 11/15/2024 0.51 - 4.28% 7,800,000 7,020,000 HUD Section 108 - US Guaranteed Notes 2014 06/15/2025 5.00% 2,091,000 1,900,000 Refunding Series 2016A - Lakeview Garage Project 6/30/2025 3.00-5.00% 5,145,000 5,145,000 Refunding Series 2016B - DPW Facility Project 6/30/2021 3.00-5.00% 1,445,000 1,445,000
Total other debt 17,025,000
Total Governmental Activities: $ 44,244,286
The HUD Section 108-US guaranteed notes, originally issued in 2003 and 2005, have a variable rate of interest based on the three (3) month LIBOR rate plus .2%.

88
A detailed listing of the general and revenue obligation bonds expected to be repaid by proprietary funds are as follows:
AmountSerial Outstanding
Maturities Interest Amount as ofBusiness-Type Activities: Through Rate(s) % Issued 6/30/16
General obligation bonds:Electric 2004 Series B Refunding Bonds 12/01/2016 2.00 - 3.80% $ 510,002 $ 40,000 Electric 2006 Series A Bonds 11/01/2026 3.50 - 4.00% 1,000,000 45,000 Electric 2007 Series A Bonds 11/01/2027 3.50 - 4.25% 1,000,000 90,000 Electric 2009 Series A Bonds 11/01/2029 2.00 - 4.375% 12,750,000 1,670,000 Electric 2009 Series B Bonds 11/01/2029 4.00 - 6.00% 8,250,000 6,600,000 Electric 2009 Series C Bonds 11/01/2029 2.00 - 4.125% 10,985,000 3,690,000 Electric 2009 Series D Bonds 11/01/2029 1.45 - 5.60% 4,615,000 765,000 Electric 2009 Series C Bonds 11/01/2029 2.00 - 4.125% 1,000,000 765,000 Electric 2009 Series C Bonds 11/01/2029 2.00 - 4.125% 1,000,000 8,405,000 Electric General Improvements 2011 Series A 11/01/2031 3.00 - 4.75% 1,000,000 860,000 Electric General Improvements 2011 Series B 11/01/2031 2.00 - 4.75% 1,000,000 855,000 Electric Public Improvement 2012 Series A 11/01/2032 5.00% 2,000,000 1,815,000 Electric Public Improvement 2012 Series A 11/01/2032 5.00% 1,750,000 1,585,000 Electric Taxable Public Improvement 2012 Series B 11/01/2032 6.00% 1,250,000 1,145,000 Electric G.O. Public Improvement Bonds 2013 Series B 11/01/2033 4.00 - 6.75% 3,000,000 1,960,714 Electric G.O. Public Improvement Bonds 2014 Series 3 11/01/2034 2.78% 3,000,000 2,850,000 Electric G.O. Public Improvement Bonds 2015 Series A 11/1/2035 5.00% 3,000,000 3,000,000 Electric G.O. Refunding Bond 2016 Series A 3/15/2016 2.00-5.00% 10,235,000 10,235,000
Total general obligation bonds 46,375,714 Other debt:
Electric Revenue Bonds 2011 Series A 07/01/2031 4.25 - 5.75% 8,775,000 8,430,000 Electric Revenue Bonds 2011 Series B 07/01/2031 7.25 - 8.25% 3,135,000 3,040,000 Electric Revenue Bonds 2014 Series A 07/01/2035 3.78% 12,000,000 11,565,000 Electric Revenue Bonds 2014 Series B 07/01/2035 3.36% 5,820,000 5,310,000 Wastewater State of VT-EPA 2006 Series 1 (Siphon) 02/01/2027 0.00% 1,650,000 919,200 Stormwater Revenue Obligation Bond 10/01/2031 0.00% 1,204,000 375,504 Wastewater State of VT-EPA 2009 Series I (Turbo) 10/01/2031 0.00% 120,000 46,290 Wastewater State of VT-EPA 2001 Series 1 (Digester) 08/01/2027 0.00% 2,500,000 1,044,400 Airport Revenue Refunding 2012 Series A 07/01/2028 4.00 - 5.00% 17,670,000 17,670,000 Airport Revenue Refunding 2012 Series B 07/01/2018 3.50% 7,130,000 4,085,000 Wastewater VT Municpal Bond Bank 2014 Series 1 11/15/2033 0.643 - 4.723% 14,645,620 13,181,058 Water State Revolving Loan RF3-295 11/01/2034 1.00% 253,340 228,006 Airport Revenue Refunding 2014 Series A 07/01/2030 0.67 - 3.59% 15,660,000 15,285,000
Total other debt 81,179,458
Total Business-Type Activities: $ 127,555,172

89
B. Future Debt Service
The annual payments to retire all governmental general obligation long-term debt outstanding as of June 30, 2016 are as follows:
GovernmentalActivities Combined Total
2017 $ 3,648,143 $ 1,625,225 $ 5,273,368 2018 3,971,000 1,522,309 5,493,309 2019 4,746,000 1,403,162 6,149,162 2020 3,126,000 1,287,978 4,413,978 2021 3,216,000 1,195,895 4,411,895
2022 - 2026 14,671,429 4,207,209 18,878,638 2027 - 2031 8,370,714 1,505,687 9,876,401 2032 - 2036 2,495,000 202,357 2,697,357
Total $ 44,244,286 $ 12,949,822 $ 57,194,108
Principal Interest
The annual payments to retire all business-type (and each Enterprise fund) long-term debt outstanding as of June 30, 2016 are as follows:
Business-Type ActivitiesCombined all
Enterprise Funds Total
2017 $ 6,660,251 $ 5,363,976 $ 12,024,227 2018 6,933,996 5,145,818 12,079,814 2019 7,172,818 4,925,982 12,098,800 2020 7,306,717 4,665,571 11,972,288 2021 7,565,700 4,366,632 11,932,332
2022 - 2026 42,218,308 16,575,962 58,794,270 2027 - 2031 39,858,051 6,698,925 46,556,976 2032 - 2036 9,839,331 744,567 10,583,898
Total $ 127,555,172 $ 48,487,433 $ 176,042,605
Principal Interest

90
Electric Enterprise Fund Total
2017 $ 3,730,000 $ 3,283,288 $ 7,013,288 2018 3,905,000 3,150,450 7,055,450 2019 4,055,000 3,029,650 7,084,650 2020 4,135,000 2,885,076 7,020,076 2021 4,280,000 2,719,956 6,999,956
2022 - 2026 23,857,143 10,562,457 34,419,600 2027 - 2031 23,243,571 4,594,947 27,838,518 2032 - 2036 7,515,000 590,910 8,105,910
Total $ 74,720,714 $ 30,816,734 $ 105,537,448
Principal Interest
Airport Enterprise Fund Total
2017 $ 2,015,000 $ 1,634,938 $ 3,649,938 2018 2,110,000 1,551,838 3,661,838 2019 2,195,000 1,465,063 3,660,063 2020 2,245,000 1,364,675 3,609,675 2021 2,355,000 1,249,675 3,604,675
2022 - 2026 13,645,000 4,390,675 18,035,675 2027 - 2031 12,475,000 1,200,325 13,675,325
Total $ 37,040,000 $ 12,857,189 $ 49,897,189
Principal Interest
Wastewater Non-major TotalEnterprise Fund
2017 $ 888,002 $ 445,750 $ 1,333,752 2018 891,117 436,690 1,327,807 2019 894,294 424,683 1,318,977 2020 897,533 409,497 1,307,030 2021 900,839 390,948 1,291,787
2022 - 2026 4,556,129 1,596,906 6,153,035 2027 - 2031 3,959,904 885,825 4,845,729 2032 - 2034 2,203,131 144,725 2,347,856
Total $ 15,190,949 $ 4,735,024 $ 19,925,973
InterestPrincipal

91
Water Non-major TotalEnterprise Fund
2017 $ 8,485 $ - $ 8,485 2018 8,740 6,840 15,580 2019 9,002 6,586 15,588 2020 9,272 6,323 15,595 2021 9,550 6,053 15,603
2022 - 2026 52,225 25,924 78,149 2027 - 2031 60,544 17,828 78,372 2032 - 2036 70,187 8,932 79,119
Total $ 228,005 $ 78,486 $ 306,491
Principal Interest
Stormwater Non-major TotalEnterprise Fund
2017 $ 18,764 $ - $ 18,764 2018 19,139 - 19,139 2019 19,522 - 19,522 2020 19,912 - 19,912 2021 20,311 - 20,311
2022 - 2026 107,811 - 107,811 2027 - 2031 119,032 - 119,032 2032 - 2033 51,013 - 51,013
Total $ 375,504 $ - $ 375,504
Principal Interest
C. Changes in General Long-Term Liabilities
During the year ended June 30, 2016, the following changes occurred in long-term liabilities for the City’s Governmental and Business-Type Activities, as well as each enterprise fund:
EqualTotal Total Less Long
Balance Balance Current Term7/1/2015 Additions Reduction Refunding 6/30/2016 Portion Portion
Governmental ActivitiesGeneral obligation bonds payable $ 27,082,144 $ 4,195,000 $ (1,689,287) $ (2,368,571) $ 27,219,286 $ (1,362,143) $ 25,857,143 Other debt 19,341,000 6,590,000 (1,561,000) (7,345,000) 17,025,000 (1,996,000) 15,029,000
Add unamortized premium 307,827 1,135,466 (20,606) (30,173) 1,392,514 (87,268) 1,305,246 Subtotal 46,730,971 11,920,466 (3,270,893) (9,743,744) 45,636,800 (3,445,411) 42,191,389
Obligations under capital leases 1,086,318 987,234 (867,324) - 1,206,228 (413,232) 792,996 Compensated absences 2,047,151 1,724,342 (1,742,464) - 2,029,029 (202,903) 1,826,126 Insurance reserves 3,787,037 - (1,208,692) - 2,578,345 (918,809) 1,659,536 Net OPEB obligation 963,051 117,389 - - 1,080,440 - 1,080,440 Net pension obligation 34,597,295 6,391,349 - - 40,988,644 - 40,988,644
Total $ 89,211,823 $ 21,140,780 $ (7,089,373) $ (9,743,744) $ 93,519,486 $ (4,980,355) $ 88,539,131

92
EqualTotal Total Less Long
Business-type Activities - Combined Balance Balance Current TermAll Enterprise Funds 7/1/2015 Additions Reduction Refunding 6/30/2016 Portion Portion
General obligation bonds payable $ 46,770,714 $ 13,235,000 $ (13,630,000) $ - $ 46,375,714 $ (2,300,000) $ 44,075,714 Add unamortized premium 431,414 2,206,093 (102,147) - 2,535,360 - 2,535,360 Subtract unamortized discount (31,914) - 1,476 - (30,438) - (30,438)
Subtotal 47,170,214 15,441,093 (13,730,671) - 48,880,636 (2,300,000) 46,580,636
Revenue bonds payable 84,889,798 - (3,938,345) - 80,951,453 (4,351,766) 76,599,687 Add unamortized premium 2,474,669 - (234,504) - 2,240,165 (183,155) 2,057,010
Subtotal 87,364,467 - (4,172,849) - 83,191,618 (4,534,921) 78,656,697
Long term note payable 228,006 - - - 228,006 (8,485) 219,521 Obligations under capital leases 6,834,297 63,993 (345,172) - 6,553,118 (355,447) 6,197,671 Compensated absences 1,684,129 432,587 (627,226) - 1,489,490 - 1,489,490 Net OPEB obligation 566,859 100,376 - - 667,235 - 667,235 Net pension obligation 12,774,362 5,219,228 - - 17,993,590 - 17,993,590 Other noncurrent liabilities 5,583,813 - (323,816) - 5,259,997 - 5,259,997
Total $ 162,206,147 $ 21,257,277 $ (19,199,734) $ - $ 164,263,690 $ (7,198,853) $ 157,064,837
EqualTotal Total Less Long
Balance Balance Current TermElectric Enterprise Fund 7/1/2015 Additions Reduction Refunding 6/30/2016 Portion Portion
General obligation bonds payable $ 46,770,714 $ 13,235,000 $ (13,630,000) $ - $ 46,375,714 $ (2,300,000) $ 44,075,714 Add unamortized premium 431,414 2,206,093 (102,147) - 2,535,360 - 2,535,360 Subtract unamortized discount (31,914) - 1,476 - (30,438) - (30,438)
Subtotal 47,170,214 15,441,093 (13,730,671) - 48,880,636 (2,300,000) 46,580,636
Revenue bonds payable 29,730,000 - (1,385,000) - 28,345,000 (1,430,000) 26,915,000 Add unamortized premium 764,822 - (42,426) - 722,396 - 722,396
Subtotal 30,494,822 - (1,427,426) - 29,067,396 (1,430,000) 27,637,396
Compensated absences 1,176,301 - (200,915) - 975,386 - 975,386 Net OPEB obligation 224,099 37,114 - - 261,213 - 261,213 Net pension obligation 9,427,247 3,246,758 - - 12,674,005 - 12,674,005 Other noncurrent liabilities 5,583,813 - (323,816) - 5,259,997 - 5,259,997
Total $ 94,076,496 $ 18,724,965 $ (15,682,828) $ - $ 97,118,633 $ (3,730,000) $ 93,388,633
EqualTotal Total Less Long
Balance Balance Current TermAirport Enterprise Fund 7/1/2015 Additions Reduction Refunding 6/30/2016 Portion Portion
Revenue bonds payable $ 38,690,000 $ - $ (1,650,000) $ - $ 37,040,000 $ (2,015,000) $ 35,025,000 Add unamortized premium 1,709,847 - (192,078) - 1,517,769 (183,155) 1,334,614
Subtotal 40,399,847 - (1,842,078) - 38,557,769 (2,198,155) 36,359,614
Obligations under capital leases 797,908 - (150,798) - 647,110 (154,786) 492,324 Compensated absences 200,047 138,486 (145,750) - 192,783 - 192,783 Net OPEB obligation 126,442 12,642 - - 139,084 - 139,084 Net pension obligation 1,278,506 890,962 - - 2,169,468 - 2,169,468
Total $ 42,802,750 $ 1,042,090 $ (2,138,626) $ - $ 41,706,214 $ (2,352,941) $ 39,353,273
EqualTotal Total Less Long
Telecom Non-Major Balance Balance Current TermEnterprise Fund 7/1/2015 Additions Reduction Refunding 6/30/2016 Portion Portion
Obligations under capital leases $ 6,014,500 $ 63,993 $ (179,852) $ - $ 5,898,641 $ (193,294) $ 5,705,347 Compensated absences 81,200 66,402 (49,721) - 97,881 - 97,881 Net OPEB obligation 106,762 15,600 - - 122,362 - 122,362 Net pension obligation 745,843 378,186 - - 1,124,029 - 1,124,029
Total $ 6,948,305 $ 524,181 $ (229,573) $ - $ 7,242,913 $ (193,294) $ 7,049,619

93
EqualTotal Total Less Long
Wastewater Non-Major Balance Balance Current TermEnterprise Fund 7/1/2015 Additions Reduction Refunding 6/30/2016 Portion Portion
Revenue bonds payable $ 16,075,898 $ - $ (884,949) $ - $ 15,190,949 $ (888,002) $ 14,302,947 Compensated absences 75,035 93,819 (90,435) - 78,419 - 78,419 Net OPEB obligation 47,206 13,713 - - 60,919 - 60,919 Net pension obligation 532,524 323,828 - - 856,352 - 856,352
Total $ 16,730,663 $ 431,360 $ (975,384) $ - $ 16,186,639 $ (888,002) $ 15,298,637
EqualTotal Total Less Long
Water Non-Major Balance Balance Current TermEnterprise Fund 7/1/2015 Additions Reduction Refunding 6/30/2016 Portion Portion
Long term note payable $ 228,006 $ - $ - $ - $ 228,006 $ (8,485) $ 219,521 Obligations under capital leases 21,889 - (14,522) - 7,367 (7,367) - Compensated absences 151,546 133,880 (140,405) - 145,021 - 145,021 Net OPEB obligation 62,350 18,690 - - 81,040 - 81,040 Net pension obligation 790,242 379,494 - - 1,169,736 - 1,169,736
Total $ 1,254,033 $ 532,064 $ (154,927) $ - $ 1,631,170 $ (15,852) $ 1,615,318
EqualTotal Total Less Long
Stormwater Non-Major Balance Balance Current TermEnterprise Fund 7/1/2015 Additions Reduction Refunding 6/30/2016 Portion Portion
Revenue bonds payable $ 393,900 $ - $ (18,396) $ - $ 375,504 $ (18,764) $ 356,740 Net OPEB obligation - 2,617 - - 2,617 - 2,617
Total $ 393,900 $ 2,617 $ (18,396) $ - $ 378,121 $ (18,764) $ 359,357
19. Capital Lease Obligations
The City is the lessee of certain equipment under capital and operating leases expiring in various years through 2034. Future minimum lease payments under the capital and operating leases consisted of the following as of June 30, 2016:
Capital lease for garage equipment. The rental payments are to be made in equal monthly installments of $1,032 including interest at 4.3601% annually, maturing on June 29, 2017. $ 12,093 $ -
Capital lease for airport equipment. The rental payments are to be made in equal semiannual installments of $86,730 including interest at 3.214% annually, maturing on June 26, 2020. - 644,932
Capital lease for accounting software, police cars, public works vehicles, office equipment, mowers, tractors, backhoe, and zamboni. The rental payments are to be made in equal semiannual installments of $120,160 including interest at 1.96% annually, maturing on November 18, 2016. 125,908 9,545
GovernmentalActivities
Business-TypeActivities
(continued)

94
(continued)
GovernmentalActivities
Business-TypeActivities
Capital lease for traffic vehicles. The rental payments are to be made in equal annual installments of $28,649 including interest at 5.155% annually, maturing on June 22, 2017. 26,317 -
Capital lease for public works vehicle. The rental payments are to be made in equal annual installments of $7,996 including interest at 5.95% annually, maturing on June 12, 2019. 21,393 -
Capital lease for public works vehicle and plow gear. The rental payments are to be made in equal annual installments of $27,812 including interest at 2.67% annually, maturing on April 2, 2020. 103,579 -
Capital lease for public works vehicle. The rental payments are to be made in equal annual installments of $38,929 including interest at 3.28% annually, maturing on October 15, 2018. 109,526 -
Capital lease for public works sidewalk tractor. The rental payments are to be made in equal annual installments of $27,540, maturing in fiscal year 2019. 82,620 -
Capital lease for parks and recreation 2015 ford E350 cut away. The rental payments are to be made in equal annual installments of $10,584 including interest at 5.95% annually, maturing on March 11, 2019. 28,318 -
Capital lease for public works 2016 ford F450. The rental payments are to be made in equal annual installments of $11,044 including interest at 5.45% annually, maturing on July 22, 2019. 38,756 -
Capital lease for public works and parks vehicles and equipment. The rental payments are to be made in equal annual installments of $92,442 including interest at 2.33% annually, maturing on October 20, 2019. 349,027 -
Capital lease for parks and fire vehicles and equipment. The rental payments are to be made in equal annual installments of $81,413 including interest at 2.591% annually, maturing on October 20, 2016. 308,691 -
Capital lease for telecom bucket truck. The rental payments are to be made in equal monthly installments of $753 including interest at 0.60% annually, maturing on November 1, 2017. - 12,141
Capital lease for telecom truck. The rental payments are to be made in equal monthly installments of $1,143 including interest at 0.64% annually, maturing on November 8, 2018. - 41,197
Capital lease for telecom ford focus. The rental payments are to be made in equal monthly installments of $346 including interest at 0.61% annually, maturing on September 1, 2019. - 11,988
Capital lease for telecom ford E350 bucket van. The rental payments are to be made in equal monthly installments of $1,270, maturing on June 1, 2020. - 52,401
Capital lease for Burlington Telecom with Blue Water Holdings LLC. The rental payments are to be made in equal monthly installments of $46,544 including interest at 7% annually, maturing on December 30, 2034. - 5,780,914
Total capital lease obligations 1,206,228 6,553,118 Less: amount due within one year (413,232) (355,447)
Capital lease obligation, net of current portion $ 792,996 $ 6,197,671

95
Fiscal Governmental Business-TypeYear Activities Activities
2017 $ 437,782 $ 782,886 2018 322,026 754,821 2019 297,761 765,586 2020 212,713 769,415 2021 - 558,532
Thereafter - 7,536,502
Total minimum lease payments 1,270,282 11,167,742 Less amounts representing interest (64,054) (4,614,624)
Present Value of Minimum Lease Payments $ 1,206,228 $ 6,553,118
The following is an analysis for the leased assets included in capital assets at June 30, 2016:
Governmental Business-TypeActivities Activities
Machinery, vehicles and equipment $ 1,449,960 $ 7,696,033 Less: accumulated depreciation (258,706) (1,000,978)
Equipment under capital leases, net $ 1,191,254 $ 6,695,055
20. Sale-Leaseback Transaction Accounted for as a Financing Arrangement
On December 31, 2014, after receiving approval from Vermont’s Public Service Board for the transaction, the City executed a lease and other agreements with Blue Water Holdings, LLC (BWH), conveying primarily the fiber optic network and the related capital assets for a consideration of $6M to BWH and leasing back the assets to the City for BT to provide phone, internet, and cable television service to its resi-dents and businesses under its trade name “Burlington Telecom”. Under the sale leaseback arrangement, BT began making periodic lease payments to BWH on January 31, 2015 in monthly amounts of $46,544, including interest payment of 7%, maturing on December 30, 2034. The transaction has been accounted for as a financ-ing arrangement, wherein the right of use of the fiber optic network and the related assets (ROU) is reported on BT’s books as an intangible asset and the financing obligation in the amount of $6M is reported under capital leases payable. The arrangement with BWH contemplates the sale of Burlington Telecom by the City by December 31, 2018, and if the City has not found a qualified purchaser by then, BWH shall have the right to direct a sale to a qualified purchaser of its choice. If the lease is terminated and the successor operator with PSB approval is not in place, the City will continue to operate BT as required under the terms of the Certificate of Public Good (CPG). Per the subsequent first amendment to the agreements, BT owns the capital additions and improvements to the ROU acquired since December 31, 2014, and

96
therefore the transactions are accounted for as capital assets. The capital additions and improvements to the Telecom System shall further be transferred by lessee directly to the buyer of the system at and upon the closing of any future sale of the system as provided under the Burlington Telecom Management and Sale Agreement. Lessee shall not sell or otherwise transfer such capital additions and improvements except as expressly permitted under this agreement.
21. Long-Term Obligations of Component Units
Burlington School District:
A. Bonds Payable
The Burlington School District has various bonds outstanding as follows (amounts include unamortized bond premium):
AmountSerial Outstanding
Maturities Interest Amount as ofSchool District: Through Rate(s) % Issued 6/30/16
General obligation bonds, net of premiums:G.O. School 2002 Series A Bonds 9/1/2022 3.00 - 4.75% 860,000 $ 390,000 G.O. School 2004 Refunding Series B Bonds 12/01/2016 2.00 - 3.80% 2,370,000 194,061 G.O. School 2005 Series B Bonds 11/1/2025 3.25 - 4.2% 750,000 473,809 G.O. School 2006 Series A Bonds 11/1/2026 3.50 - 4.00% 750,000 513,609 G.O. School 2006 Series A Bonds - Athletic Field 11/1/2026 3.50 - 4.00% 3,615,000 2,350,000 G.O. School 2007 Series A Bonds 11/1/2027 3.50 - 4.25% 750,000 525,000 G.O. School 2009 Series C Bonds 11/1/2029 2.00 - 4.125% 750,000 575,000 G.O. School 2009 Series C Bonds 11/1/2029 2.00 - 4.125% 2,000,000 1,650,199 G.O. School 2010 Series A Qualified School Constr. 11/1/2026 6.50% 9,700,000 9,700,000 G.O. School 2010 Series B Taxable GO Public Impr. 11/1/2026 6.50% 2,000,000 2,000,000 General Improvements 2011 Series B 11/1/2031 2.00 - 4.75% 2,000,000 1,710,000 Public Improvement Bonds 2012 Series A 6/30/2033 5.00% 3,250,000 3,146,421 G.O. Public Improvement Bonds 2013 Series B 11/1/2033 4.00 - 6.75% 2,000,000 1,897,777 G.O. Public Improvement Bonds 2014 Series A 11/15/2034 0.51 - 3.99% 2,000,000 1,900,000 G.O. Public Improvement Bonds 2015 Series A 11/1/2035 5.00% 2,000,000 2,000,000
Subtotal School District 29,025,876
Less: unamortized premuims (373,019)
Total School District $ 28,652,857

97
B. Future Debt Service
The annual payments to retire the Burlington School District’s notes payable out-standing as of June 30, 2016 are as follows (amounts include unamortized bond premiums):
School Total
2017 $ 1,042,143 $ 1,485,457 $ 2,527,600 2018 896,429 1,453,547 2,349,976 2019 920,714 1,418,158 2,338,872 2020 960,000 1,380,513 2,340,513 2021 999,286 1,340,207 2,339,493
2022 - 2026 5,453,571 6,018,846 11,472,417 2027 - 2031 16,175,714 1,436,909 17,612,623 2032 - 2036 2,205,000 196,513 2,401,513
Total $ 28,652,857 $ 14,730,150 $ 43,383,007
Principal Interest
Burlington Community Development Corporation:
A. Notes Payable
The Burlington Community Development Corporation (BCDC) has various loans outstanding as follows:
Unit
TD Bank (Gilbane Property) Note secured by the mortgage on the property. The terms require annual payment of $33,483 for 15 years with an interest rate of 6.25% maturing in October 2025. $ 235,449
People's United Bank notes offset by notes receivable from Champlain Housing Trust Corporation. The terms require annual payments of $22,547 for 21 years with an interest rate of 5.00% maturing October 1, 2028. 207,242
Union Bank Note (refinanced previous VEDA Loan) requiring annual payment of $217,818 for 10 years with an interest rate of 4.09% maturing in November 2020. A balloon payment of $1,803,380 is due at maturity. The City guarantees the debt. 2,358,054
BCDC 1993 Relief Bonds terms require annual payments of $86,352 with an interest rate ranging between 3.25% - 4.00% maturing in FY2024 and FY2025. 593,679
Swap Terminator Fee Loan (related to above noted VEDA refinancing) terms require annual payment of $38,333 for 20 years with an interest rate of 3.75% maturing in November 2030. 451,624
Total Notes Payable $ 3,846,048
Component

98
B. Future Debt Service
The annual payments to retire BCDC’s notes payable outstanding as of June 30, 2016 are as follows:
FiscalYear Principal Interest Total
2017 $ 243,151 $ 155,212 $ 398,363 2018 253,355 145,002 398,357 2019 264,001 134,348 398,349 2020 274,867 123,473 398,340 2021 1,975,403 70,098 2,045,501
2022-2026 592,836 104,847 697,683 2027-2031 242,435 23,157 265,592
Total $ 3,846,048 $ 756,137 $ 4,602,185
C. Due to Primary Government
ComponentUnit
BCDC borrowed $1,400,000 from the Airport Enterprise fund to assist in financing construction of the Aviation Support Hanger. The terms require annual payments of $93,172 for 20 years with an interest rate of 3%, maturing in June 2026. $ 804,091
BCDC owes the City (the Primary Government) for its share of the Westlake Parking Garage. The terms requires annual payment of at least $72,000 with an interest rate of 2.3%, maturing in December 2020. 288,331
Total Due to Primary Government $ 1,092,422
D. Future Debt Service
The annual payments to retire the amounts that BCDC owes to the City (the Primary government) are as follows:
FiscalYear Principal Interest Total
2017 $ 136,738 $ 28,434 $ 165,172 2018 140,212 24,960 165,172 2019 143,778 21,394 165,172 2020 160,667 17,734 178,401 2021 78,921 14,251 93,172
2022-2026 432,106 33,758 465,864
Total $ 1,092,422 $ 140,531 $ 1,232,953

99
22. Deferred Inflows of Resources – Non Pension Related
Deferred inflows of resources are the acquisition of net assets by the City that are applicable to future reporting periods. Deferred inflows of resources have a negative effect on net position, similar to liabilities. Governmental funds report unavailable revenue in connection with receivables for revenues that are not considered to be available to liquidate liabilities of the current period.
23. Governmental Funds - Balances
Fund balances are segregated to account for resources that are either not available for expenditure in the future or are legally set aside for a specific future use. The City has implemented GASB Statement No. 54 (GASB 54), Fund Balance Reporting and Governmental Fund Type Definitions, which enhances the usefulness of fund balance information by providing clearer fund balance classifications that can be more consistently applied and by clarifying existing governmental fund type definitions. The following types of fund balances are reported at June 30, 2016: Nonspendable - This fund balance classification includes general fund reserves for prepaid expenditures, inventory, advances to other funds, and nonmajor governmental fund reserves for the principal portion of permanent trust funds.
Restricted - This fund balance classification includes various special revenue funds, capital project unspent bond proceeds, unspent grants and the income portion of permanent trust funds.
Committed - This fund balance classification includes general fund encumbrances for non-lapsing, special article appropriations approved at City Council meetings and various special revenue funds, including dedicated taxes.
Unassigned - Represents general fund amounts that may be available to be spent in future periods and deficits in other governmental funds.

100
Following is a breakdown of the City's fund balances at June 30, 2016:
Nonmajor TotalGeneral Governmental Governmental
Fund Funds FundsNonspendable
Inventory and prepaid expenditures $ 628,312 $ 285,317 $ 913,629 Advances to other funds 2,033,562 - 2,033,562 Nonexpendable permanent funds - 909,230 909,230
Total Nonspendable 2,661,874 1,194,547 3,856,421
RestrictedCommunity development 38,500 2,438,984 2,477,484 Tax increment financing - 1,646,451 1,646,451 Impact fees - 307,218 307,218 Street and sidewalk infrastructure - 5,382,234 5,382,234 FEMA - 7,934 7,934 General capital - 132,466 132,466 Expendable permanent funds - 376,215 376,215
Total Restricted 38,500 10,291,502 10,330,002
CommittedNon-departmental 407,531 - 407,531 Clerk and Treasurer's office 80,000 - 80,000 Planning and zoning 7,617 - 7,617 Information technology 85,000 - 85,000 Fire 20,000 - 20,000 Public works 600,000 - 600,000 CCTA and County tax 36,669 - 36,669 Library books and donations 182,332 - 182,332 Mayor's special events 6,743 - 6,743 Natural gas 128,125 - 128,125 Parking 23,000 - 23,000 Plan BTV south 35,191 - 35,191 Police equitable sharing funds 700,633 - 700,633 Public records restoration 141,059 - 141,059 Reappraisal 140,000 - 140,000 Recycle, vehicle 47,500 - 47,500 Sale of land 100,000 - 100,000 Substainability donations 20,000 - 20,000 Wellness 17,809 - 17,809 Traffic - 1,959,682 1,959,682 Dedicated taxes:
Pennies for parks - 311,739 311,739 Greenbelt - 142,696 142,696 Conservation legacy - 573,046 573,046 Bike path - 149,131 149,131
Total Committed 2,779,209 3,136,294 5,915,503
Unassigned 6,520,495 (2,473,963) 4,046,532 Total Unassigned 6,520,495 (2,473,963) 4,046,532
Total Fund Balance $ 12,000,078 $ 12,148,380 $ 24,148,458

101
24. Restricted Net Position
The accompanying entity-wide financial statements report restricted net position when external constraints from grantors or contributors are placed on net position. Permanent fund restricted net position are segregated between nonexpendable and expendable. The nonexpendable portion represents the original restricted principal contribution, and the expendable represents accumulated earnings which are available to be spent based on donor restrictions.
25. Retirement System
The City follows the provisions of GASB Statement No. 68, Accounting and Financial Reporting for Pensions with respect to the Burlington Employees’ Retirement System (the System). The System follows the provision of GASB Statement No. 67, Financial Reporting for Pension Plans.
A. Plan Description
The System is a cost sharing, single employer, defined benefit pension plan cover-ing substantially all of its employees except elective officials, other than the mayor, and the majority of the public school teachers, who are eligible for the Vermont State Teacher's Retirement System. The plan is broken down into Class A participants and Class B participants. Class A participants are composed of fire-men and policemen. Class B participants include all other covered City employees. The City’s total covered payroll was $44,765,172. The System does not issue a stand-alone financial report. The System is governed by an eight-member board. The eight members include three appointed by the City Council, two Class A members of the system selected by the Class A membership, two Class B members of the system elected by the Class B membership, and the City Treasurer as an ex officio member. Of the Class A and Class B board members, no two shall be employed at the same department. The City Council has the authority to amend the benefit terms of the System by enacting ordinances and sending them to the Mayor for approval. There are 842 active members and 614 retirees or beneficiaries currently receiving benefits. Additionally, there are 383 former employees with vested rights.
B. Benefits Provided
Class A participants vest 20 percent after three years of creditable service, and 20 percent for each year thereafter until they are 100 percent vested after 7 years of creditable service. The normal benefit is payable commencing at age 55 or with 25 years of service. Class A participants who retire at or after age 55 with 7 years of creditable service are entitled to a retirement benefit, payable monthly for life,

102
equal to 2.75 percent of their average final compensation (AFC) during the high-est three non-overlapping twelve-month periods (five years for certain non-union police employees) times creditable service not in excess of 25 years plus .5 per-cent of the AFC times years of creditable service between 25 and 35 years, prior to age 60 and a yearly COLA based on CPI. Class A retirees could alternatively elect to choose an accrual rate of 3.25% and one-half the yearly COLA, or an accrual rate of 3.8% (3.6% for service from July, 2006 forward) and no COLA. The half and no COLA options have been eliminated for new policemen hired after July 1, 2006 and new firemen hired after January 1, 2007. Also, these new hires have a 2.65 percent accrual rate only. Employees may retire prior to age 55 and receive reduced retirement benefits. Class A employees have unreduced bene-fits after 25 years of service, regardless of age. All eligible City Class B employees vest 20 percent after three years of creditable service, and 20 percent for each year thereafter until they are 100 percent vested after 7 years of creditable service. Class B participants who retire at or after age 65 are entitled to a retirement benefit, payable monthly for life, equal to 1.60 percent of AFC (at age 65) during the highest three non-overlapping twelve-month periods times creditable service at age 65 not in excess of 25 years plus .5 percent of AFC times creditable service at age 65 in excess of 25 years and a yearly COLA based on the CPI. Class B retirees could alternatively elect to choose an accrual rate of 1.9% for service up to June 30, 2006 and 1.8% thereafter and one half the yearly COLA, or an accrual rate of 2.2% for service up to June 30, 2006 and 2.0% thereafter and no COLA. The half and no COLA options have been eliminated for new hires after January 1, 2006 and they are only entitled to a 1.4% accrual rate. Employees may retire prior to age 65 and receive reduced retirement benefits. Creditable service or an actuarial increase is used after age 65. For Class B IBEW participants hired after October 30, 2012, the number of years used in the calculation of AFC was changed from three years to five. Also the disability retirement was revised from 75% of pay to 66⅔% of pay. The system also provides accidental and line of duty death benefits for Class A participants, and disability and survivor income benefits for both Class A and Class B participants. The benefits are changed by negotiation and by the Retirement Board with budgetary approval by the City Council.
C. Contributions
Participants contribute a set percentage of their gross regular compensation annu-ally. Class A participants contribute 10.8% of earnable compensation for the first 35 years of creditable service, and none thereafter. Class A employees do not contribute to the social security retirement system. Class B participants contribute 3.0% of earnable compensation other than IBEW employees hired before May 1, 2008 who elected to contribute 4.0% of earnable compensation. The Board establishes employer contributions based on an actuarially determined contribution recommended by an independent actuary. The actuarially determined contribution is the estimated amount necessary to finance the costs of benefits

103
earned by the System members during the year, with an additional amount to finance a portion of any unfunded accrued liability. The calculation of the actuarially deter-mined contribution is governed by the applicable provisions of the Retirement Code. It is the policy of the City of Burlington to fund, by actuarially determined peri-odic contributions, the normal cost of the Plan plus a provision for amortization of past service cost over a thirty (30) year period from date of establishment. The contribution rate for normal cost is determined using the projected unit credit cost method with costs allocated based on earnings of plan members. The City funded one hundred percent (100%) of the annual required contribution in 2016.
D. Summary of Significant Accounting Policies
Basis of Accounting - For purposes of measuring the net pension liability, deferred outflows of resources and deferred inflows of resources related to pensions, and pension expense, information about the fiduciary net position of the System and additions to/deductions from System’s fiduciary net position have been deter-mined on the same basis as they are reported by System. For this purpose, benefit payments (including refunds of employee contributions) are recognized when due and payable in accordance with benefit terms. Basis of Presentation - The System is operated on the accrual basis of accounting in accordance with U.S. generally accepted accounting principles. The preparation of the statements requires management to make a number of estimates and assumptions relating to the reported amounts. Due to the inherent nature and uncertainty of these estimates, actual results could differ, and the differences may be material. Method Used to Value Investments - Investments are reported at fair value.
E. Actuarial Assumptions
The total actuarially determined contribution to the system for 2015 was $8,840,769. A summary of the actuarial assumptions as of the latest actuarial valuation is shown below:
Valuation Date June 30, 2015Actuarial cost method Entry Age Normal - Level
Percentage of Pay
Actuarial assumptions:Investment rate of return 8.0%Inflation rate 3.0%Projected salary increases 3.8 - 8.8%Post-retirement cost-of-living adjustment Increases averaging 3.0% per
year were assumed

104
Actuarial valuation of the ongoing System involves estimates of the reported amounts and assumptions about probability of occurrence of events far into the future. Examples include assumptions about future employment mortality and future salary increases. Amounts determined regarding the net pension liability are subject to continual revision as actual results are compared with past expec-tations and new estimates are made about the future. The actuarial assumptions used in the June 30, 2015 valuation were based on the results of the most recent actuarial experience study for the five year period ending June 30, 2012. Mortality rates were based on the RP-2000 Combined Mortality tables for Males and Females projected to 2017 with scale AA; RP-2000 Disability Mortality Table projected with scale AA to 2017 for the period after disability retirement, and prior to the state of the service retirement benefit.
F. Net Pension Liability
The components of the net pension liability (i.e., the retirement system’s liability determined in accordance with GASB No. 67 less the fiduciary net position) as of June 30, 2015, is shown below:
Total pension liability $ 229,880,291
System fiduciary net position (161,715,857)
Net pension liability $ 68,164,434
System fiduciary net position as a percentage of the total pension liability 70.3%
Actuarial valuation of the ongoing System involves estimates of the reported amounts and assumptions about probability of occurrence of events far into the future. Examples include assumptions about future employment mortality and future salary increases. Amounts determined regarding the net pension liability are subject to continual revision as actual results are compared with past expec-tations and new estimates are made about the future. The Schedule of Employers’ Net Pension Liability presents multi-year end information about whether the plan fiduciary net positions are increasing or decreasing over time relative to the total pension liability. These schedules are presented in the Required Supplementary Information section. The Total Pension Liability as of June 30, 2014, is based on the results of an actuarial valuation date of January 1, 2013, and rolled-forward using generally accepted actuarial procedures. Target Allocations – The long-term expected rate of return on pension plan invest-ments was selected from a best estimate range determined using the building block approach. Under this method, an expected future real return range (expected returns, net of pension plan investment expense and inflation) is calculated sepa-rately for each asset class. These ranges are combined to produce the long-term expected rate of return by weighting the expected future real rates of return net of investment expenses by the target asset allocation percentage and by adding

105
expected inflation. The target allocation and best estimates of arithmetic real rates of return for each major class are summarized in the following table:
Long-termExpected
Target Asset Real rateAsset Class Allocation of Return
Equity 30.80% 6.70%Fixed income 31.50% 2.94%Alternatives 23.30% 6.26%Multi-strategy 14.40% 5.98%
Discount Rate – The discount rate used to measure the total pension liability was 8.00%. The projection of cash flows used to determine the discount rate assumed that contributions will continue to be made in accordance with the current funding policy. Based on those assumptions, the pension plan’s fiduciary net position was projected to be available to make all projected future benefit payments to current System members. Therefore, the long-term expected rate of return on pension plan investments was applied to all periods of projected benefit payments to deter-mine the total pension liability. Sensitivity of the Net Pension Liability to Changes in the Discount Rate – The following presents the System’s net pension liability calculated using the discount rate of 8.00 percent, as well as what the System’s net pension liability would be if it were calculated using a discount rate that is 1 percentage-point lower (7.00%) or 1 percentage-point higher (9.00%) than the current rate:
1% Decrease(7.00%)
Current Discount Rate
(8.00%)1% Increase
(9.00%)
Primary Government $ 85,172,152 $ 58,982,234 $ 45,112,915 Discretely Presented Component Unit 10,592,690 9,182,200 4,422,433
Total Net Pension Liability $ 95,764,842 $ 68,164,434 $ 49,535,348
G. Deferred Outflows and Inflows of Resources
For the year ended June 30, 2016, the City recognized pension expense of $6,578,188 and the School District recognized pension expense of $545,194. In addition, the City reported deferred outflows of resources and deferred inflows of resources related to pensions from the following sources:

106
Deferred Outflows of Resources
Deferred Inflows of Resources
Primary Government:
Fiscal year 2016 deferred pension contributions $ 7,862,893 $ -
Changes in proportional share of contributions 1,802,642 (1,770,237)
Difference between expected and actual pension experience 2,790,202 -
Difference between projected and actual investment earnings 5,262,881 -
Total Primary Government 17,718,618 (1,770,237)
Discretely Presented Component Unit:
Fiscal year 2016 deferred pension contributions 1,268,900 -
Changes in proportional share of contributions - (32,405)
Difference between expected and actual pension experience 434,371 -
Difference between projected and actual investment earnings 819,311 -
Total Discretely Presented Component Unit 2,522,582 (32,405)
Total $ 20,241,200 $ (1,802,642)
Deferred outflows of resources related to pension resulting from contributions subsequent to the measurement date will be recognized in pension expense in the year ended June 30, 2017. Other amounts reported as deferred outflows of resources and deferred inflows of resources related to pensions will be recognized in pen-sion expense as follows:
Deferred Outflows of Resources
Deferred Inflows of Resources
Year ended June 30:
2017 $ 2,599,488 $ (573,386) 2018 2,599,487 (573,386) 2019 2,300,513 (623,465) 2020 2,356,237 -
Total Primary Government 9,855,725 (1,770,237)
Year ended June 30:
2017 295,623 (127,153) 2018 295,623 (127,153) 2019 295,623 221,901 2020 366,813 -
1,253,682 (32,405)
Total $ 11,109,407 $ (1,802,642)
Total Discretely Presented
H. Rate of Return
For the year ended June 30, 2015, the annual money-weighted rate of return on pension plan investments, net of pension plan investment expenses, was 0.15%.

107
The money-weighted rate of return expresses investment performance, net of investment expense, adjusted for the changing amounts actually invested.
26. Post-Employment Healthcare and Life Insurance Benefits
Other Post-Employment Benefits GASB Statement 45, Accounting and Financial Reporting by Employers for Post-Employment Benefits Other Than Pensions, requires governments to account for other post-employment benefits (OPEB), primarily healthcare, on an accrual basis rather than on a pay-as-you-go basis. The effect is the recognition of an actuarially required contribution as an expense on the Statement of Activities when a future retiree earns their post-employment benefits, rather than when they use their post-employment benefit. To the extent that an entity does not fund their actuarially required contribu-tion, a post-employment benefit liability is recognized on the Statement of Net Position over time. Information about the Burlington School District’s OPEB Plan and Obliga-tion can be found in their basic financial statements.
A. Plan Description
In addition to providing the pension benefits described, the City provides post-employment healthcare and life insurance benefits for retired employees through the City and School’s plan. There are 699 active members and 33 retirees and beneficiaries as of June 30, 2015, the date of the last actuarial valuation. In addition, the City allows certain retired employees to purchase health insurance through the City at the City’s group rates. GASB No. 45 recognizes this as an implied subsidy and requires accrual of this liability.
B. Benefits Provided
The City provides medical, prescription drug, mental health/substance abuse and life insurance to retirees and their covered dependents. All active employees who retire from the City and meet the eligibility criteria may receive these benefits.
C. Funding Policy
Retirees contribute various amounts of the cost of the health plan, as determined by the City. The City contributes the remainder of the health plan costs on a pre-funded basis.
D. Annual OPEB Costs and Net OPEB Obligation
The City’s fiscal 2016 annual OPEB expense is calculated based on the annual required contribution of the employer (ARC), an amount actuarially determined in accordance with the parameters of GASB Statement No. 45. The ARC represents a level of funding that, if paid on an ongoing basis, is projected to cover the normal cost per year and amortize the unfunded actuarial liability over a period of

108
thirty years. The City has elected not to pre-fund OPEB liabilities. The following table shows the components of the City’s annual OPEB cost for the year ending June 30, 2016, the amount actually contributed to the plan, and the change in the City’s net OPEB obligation based on an actuarial valuation as of June 30, 2015 for the City.
Annual Required Contribution (ARC) $ 332,918 Interest on net OPEB obligation 61,196 Adjustment to ARC (50,997)
Annual OPEB cost 343,117 Contributions made (125,352)
Increase in net OPEB obligation 217,765 Net OPEB obligation - beginning of year 1,529,910
Net OPEB obligation - end of year $ 1,747,675
The City’s annual OPEB cost, the percentage of annual OPEB cost contributed to the plan, and the net OPEB obligation were as follows:
Fiscal Year Ended
Annual OPEBCost
Percentage of OPEB
Cost ContributedNet OPEBObligation
2016 $ 343,117 36.5% $ 1,747,675 2015 325,681 66.3% 1,529,910 2014 442,314 86.2% 1,420,191 2013 335,169 108.3% 1,359,145 2012 365,319 32.4% 1,387,098 2011 345,427 34.3% 1,140,113 2010 324,800 0.8% 913,000
E. Funded Status and Funding Progress
The funded status of the plan as of June 30, 2015, the date of the most recent actuarial valuation was as follows:
Actuarial accrued liability (AAL) $ 3,778,744 Actuarial value of plan assets -
Unfunded actuarial accrued liability (UAAL) $ 3,778,744
Funded ratio (actuarial value of plan assets/AAL) 0%
Covered payroll (active plan members) $ 36,668,126
UAAL as a percentage of covered payroll 10.3%
Actuarial valuations of an ongoing plan involve estimates of the value of reported amount and assumptions about the probability of occurrence of events far into the

109
future. Examples included assumptions about future employment, mortality, and the healthcare cost trend. Amounts determined regarding the funded status of the plan and the annual required contributions of the employer are subject to contin-ual revision as actual results are compared with past expectations and new estimates are made about the future. The schedule of funding progress, presented as required supplementary information following the Notes to the Financial Statements, presents multiyear trend information that shows whether the actuarial value of plan assets is increasing or decreasing over time relative to the actuarial accrued liabilities for benefits.
F. Actuarial Methods and Assumptions
Projections of benefits for financial reporting purposes are based on the plan as understood by the City and the plan members and include the types of benefits provided at the time of each valuation and the historical pattern of sharing of benefit costs between the City and plan members to that point. The actuarial methods and assumptions used include techniques that are designed to reduce short-term volatility in actuarial accrued liabilities and the actuarial value of assets, consistent with the long-term perspective of the calculations. In the June 30, 2015 City actuarial valuation the projected unit credit cost method was used. The actuarial value of assets was not determined as the City has not advance funded its obligation. The actuarial assumptions included a 4% invest-ment rate of return and an initial annual healthcare cost trend rate of 8%, which decreases to a 5% long-term rate for all healthcare benefits after six years for the City. The amortization costs for the initial UAAL is a level percentage of payroll for a period of 30 years, on an open basis. This has been calculated assuming the amortization payment increases at a rate of 4%.
27. Risk Management
The City is exposed to various risks of loss related to torts; theft of, damage to, and destruction of assets; errors and omissions; and natural disasters for which the City carries commercial insurance. There were no significant reductions in insurance coverage from the previous year and have been no material settlements in excess of coverage in any of the past three fiscal years.
28. Commitments and Contingencies
A. Burlington International Airport Mansfield Heliflight, Inc. v. City of Burlington, Vermont On or around July 29, 2014, Mansfield Heliflight, Inc. (“Mansfield”) filed a Part 16 Complaint with the FAA against the City, alleging the City has prevented Mansfield from becoming a Fixed-Base Operator (“FBO”) at BTV, and that its

110
efforts in this regard effectively granted an exclusive right to Heritage Aviation, Inc. The Complaint alleges that (1) the City is in violation of Grant Assurance No. 23, prohibiting the grant of an exclusive right to any person to conduct aero-nautical activities at BTV; (2) the City is in violation of Grant Assurance No. 2,2 prohibiting unjust discrimination; and (3) predatory conduct and illegal restraint of trade by the City in violation of the Sherman Act and Grant Assurance No. 1, which prohibits a sponsor’s violation of federal law. The City filed a Consolidated Answer, Motion for Summary Judgment and Motion to Dismiss on October 2, 2014, denying many of the factual allegations in Mansfield’s Complaint. The City has moved to dismiss Count 3 on the grounds FAA lacks jurisdiction over the alleged Sherman Act violation and for summary judgment on Counts 1 and 2 on the grounds that the undisputed facts do not demonstrate a violation of the City’s Grant Assurances. The last round of pleadings was filed in January of 2015. The case is now pending before FAA, which has granted itself several extensions, currently through December 2016. The City believes that Mansfield’s claims are without merit and will continue contesting them vigorously. South Burlington Assessments
In 2013, The City has appealed the City of South Burlington’s assessment of all the Airport-related properties owned by the City as of April 1, 2012, as well as the succeeding three years. The City appealed the assessments through South Burlington’s administrative proceedings and then to the civil division of the Vermont Superior Court. A mediation in the summer of 2016 reached a successful resolution, resulting in an agreed-upon value for the airport property through the April 2017 grand list, a credit for 2016 and 2017 to account for some of Burlington’s past over-payment, and agreed-upon values for the rest of the Burlington-owned properties for the next three years. The case was dismissed in August 2016. The parties also agreed on a ten-year tax stabilization agreement that will guide the future assessments of Burlington’s properties in South Burlington.
B. Electric Department Commitments and Contingencies
The Burlington Electric Department (BED) receives output from generation of the McNeil Station (of which the BED is the 50% owner and operator), the Burlington Gas Turbine, the Winooski One hydro facility, the Airport Solar array, and the Pine Street Solar array. Except for the McNeil station, the BED owns 100% of the remaining resources and is responsible for their operation. In addition to energy provided by its owned generation, BED purchases a portion of its electricity requirements pursuant to long-term (greater than one year in duration) contracts. During the fiscal year ended June 30, 2016, long-term sources of purchased power included:
New York Power Authority (NYPA) power from hydro stations on the
Niagara and St. Lawrence rivers under contracts through September 1, 2025 (Niagara) and through April 30, 2017 (St. Lawrence).

111
Vermont Electric Power Producers, Inc. (VEPP) which is agent for 16 hydro facilities located within Vermont.
Deliveries pursuant to a long term contract with Vermont Wind commenced in September 2011 (for test energy), with the official ten year contract start date being October 19, 2011 when commercial energy production began. Under the contract, BED receives 16 MW (40%) of Vermont Wind’s wind farm in northeast Vermont (Sheffield). BED’s 16 MW entitlement is expected to provide approximately 10.3% of BED’s annual energy requirements.
BED purchases energy from the Georgia Mountain Community Wind (GMCW) project with commercial operation on December 31, 2012. Pur-suant to a 25-year contract, BED receives 10MW (100%) entitlement from Georgia Mountain’s wind farm in Milton/Georgia, Vermont. GMCW is expected to produce energy sufficient to meet 9.2% of BED s energy needs.
Deliveries pursuant to a ten year contract with Hancock Wind were sched-uled to commence in 2016. Pursuant to a contract amendment, Hancock was given an extension in the required commercial operation date (which is now anticipated to be Jan 1, 2017). Construction of the project is well advanced. Under the contract, BED will receive 13.5 MW (26.5%) of Hancock’s wind farm.
Long-term purchases from a number of small in-state resources under a state mandated feed-in tariff program (called Standard Offer resources).
Purchase of the output from 6 small in-city solar projects under long-term agreements.
BED is purchasing energy and Renewal Energy Credits (RECs) from Nextera for a 5-year period beginning January 1, 2013. For calendar year 2013 and 2014, hourly energy is 10 MW, for the final 3 years (calendar 2015 – 2017), the volume is 5 MW per hour. The delivered energy is unit contingent on a portfolio of hydro facilities, and includes RECs from those units equal in volume to the energy purchased.
The Burlington City Council, the Vermont Public Service Board, and the voters of Burlington have approved a 23-year energy-only contract with Hydro-Quebec. The contract has been executed and deliveries began (for BED) in November 2015. Under the contract, BED will receive 5 MW of contract energy for the period November 1, 2015 to October 31, 2020 and a second (additional) 4 MW of contract energy for the period November 1, 2020 to October 31, 2038. BED’s entitlement is expected to provide approx-imately 6%-15% of BED’s annual energy requirements depending on whether one, or both, contract entitlements are flowing in a particular year.
In 2013, BED entered a long term power agreement to purchase the output of a proposed 2.5 MW solar generating facility to be located in Burlington (South Forty Solar). Permitting hearings completed in May 2016, and the developer has received a draft order approving construction from the Vermont Public Service Board. Production is likely to commence in 2017.

112
Payments under these long-term power supply contracts were $12,632,234 for the year ended June 30, 2016, with the decrease from 2015 being largely due to a decrease in short term purchases. Budgeted commitments under these long-term contracts and long-term contracts approved and executed for future delivery periods total approximately $77,301,845 for the 5-year period from July 1, 2016 to June 30, 2021. The remainder of BED’s energy requirement is satisfied through short-term pur-chases including:
Short-term purchases from a number of market counterparties.
Net exchange of energy through the Independent System Operator New England power markets.
The costs of power purchased under these contracts are accounted for as purchase power expenses in the statements of revenues, expenses, and changes in net posi-tion. The percentages of the Department’s total energy requirements were pro-vided as follows:
2016
McNeil Generating Station and Gas Turbine 44%Winooski One 8%New York Power Authority 4%Vermont Electric Power Producers 2%Standard Offer 2%Wind Production 19%Solar 0%Hydro-Quebec 8%Nextera 13%Short Term/Other (net) 0%
Total 100%
C. Other Funds’ Commitments and Contingencies
1) Grant Programs The City participates in a number of federally assisted grant programs. These programs are subject to program compliance audits by the grantors or their representatives. The audits of these programs for, or including, the year ended June 30, 2016 have not yet been conducted. Accordingly, the City’s compli-ance with grant application requirements will be established at some future date. The amount, if any, of expenditures which may be disallowed by the granting agencies cannot be determined at this time, although the City expects such amounts, if any, to be immaterial.

113
2) Construction Commitments The Airport has a number of ongoing Airport Improvement Program (AIP) projects for construction and land acquisition as well as several Passenger Facility Program (PFC) projects for terminal improvements that are funded from restricted assets. AIP projects include taxiway reconstruction, storm-water treatment projects, building demolition related to previously acquired property and land acquisition. The PFC projects include energy projects, cargo apron reconstruction, escalator and baggage carousel projects and related work.
D. General Commitments and Contingencies
The City has several claims for which the insurance carriers have issued a reser-vation of rights. The City is not able to assess the likelihood or the amount, if any, of an unfavorable outcome on these cases at this time. 1) Insurance Reserves
Starting fiscal year 2016, the City has a large-deductible worker’s compensa-tion plan with Travelers Indemnity Company and maintains a fund in its budget to cover claims as they occur up to the insurance limit. Prior to fiscal year 2016, the City was self-insured for worker’s compensation. Hickok & Boardman, the City’s insurance agent, provides the City with data estimating reserve development of prior year claims. The City’s claim reserve estimates are not created by an external actuary but are heavily based in actuarial con-cepts. Travelers Indemnity Company acts as the third-party administrator to process, pay, and administer the claims after which they bill the City for reim-bursement. The City has an irrevocable standby letter of credit with the Travelers Indemnity Company as beneficiary in the amount of $1,800,000 to secure the payment of claims. The City is self-insured for health insurance. The Plan is administered by a third-party administrator that is responsible for approval, processing and pay-ment of claims, after which they bill the City for reimbursement. The City has reinsurance for individual claims in excess of $130,000 and for aggregate stop loss of 125% of projected claims for the 2012 policy year. The City also self-insures for dental insurance. This plan is administered by a third-party administrator that is responsible for approval, processing and pay-ment of claims, after which they bill the City for reimbursement. Each covered employee is guaranteed $1,500 of paid claims per year after which the employee must pick up any excess costs.

114
The costs associated with these self-insurance plans are budgeted in the General Fund and allocated to other funds based on the following:
Type Allocation MethodWorker's Compensation 50% Experience and 50% Exposure Health Number of Employees and Levels of Coverage Dental Actual Claims and Administration Fees Paid
At June 30, 2016, the City has recorded an estimated liability of $918,809 in the General Fund, which represents the short term payable for health claims as of June 30, 2016. A long-term reserve liability of $1,659,536 is included for claims incurred but not reported on the governmental statement of net position. This consists of $1,639,970 for workers’ compensation claims and $19,566 for dental claims incurred on or before June 30, 2016, but not paid by the City as of that date. Settled claims resulting from insured risks have not exceeded coverage in the past three fiscal years. The City has elected to pay actual unemployment claims instead of enrolling in an unemployment insurance program. No liabilities have been accrued as the City is not able to make an estimate as to any future costs.
29. Deferred Compensation
The City also offers its employees two deferred compensation plans in accordance with Internal Revenue Code Section 457 through the International City/County Manage-ment Association’s (ICMA) Retirement Corporation and Nationwide Retirement Solutions. The plans permit employees to defer a portion of their salary until future years. Deferred compensation is not available to employees until termination, retire-ment, or death. The City has no liability for losses under the plans, but does have the duty of due care that would be required of an ordinary prudent inventor.
30. Voluntary Employee Buyout
On April 20, 2015 the Burlington City Council approved an employee Voluntary Buyout Plan (VBOP) for certain employees of the Electric Department. To qualify for the VBOP, an employee had to have a combination of age and years of service equal to 80 by June 30, 2016. There were 42 employees eligible and 23 employees signed up for the program. The VBOP included 20 weeks of base pay plus one week for every year of service (capped at 52 weeks), a $30,000 stipend, and eighteen months of health insurance coverage. The estimated cost of the program of $2.5 million was fully accrued in 2015 based on the number of employees who were eligible and who had made the election prior to June 30, 2016. Additionally, the estimated cash outlay

115
was entirely funded in fiscal year 2015, and was deposited in a separate reserve account and fully paid out prior to June 30, 2016.
31. Subsequent Events
On November 1, 2016 the City issued the following debt:
Interest MaturityAmount Rate Date
Governmental Activities:G.O. Public Improvement Bond 2016 Series B - City $ 2,000,000 5.00% 11/1/2036G.O. Obligation Refunding Bond 2016 Series C - City 2,545,000 2.00 - 4.00% 11/1/2029
Business-Type Activities:G.O. Public Improvement Bond 2016 Series B - Electric 3,000,000 5.00% 11/1/2036G.O. Obligation Refunding Bond 2016 Series C - Electric 7,785,000 2.00 - 4.00% 11/1/2029G.O. Obligation Refunding Bond 2016 Series D - Electric 9,680,000 1.15 - 3.25% 11/1/2029
Component Unit - Burlington School District:G.O. Public Improvement Bond 2016 Series B - School 2,000,000 5.00% 11/1/2036G.O. Obligation Refunding Bond 2016 Series C - School 1,650,000 2.00 - 4.00% 11/1/2029
Total $ 28,660,000

116
(This page intentionally left blank.)

117
REQUIRED SUPPLEMENTARY INFORMATION

118
(This page intentionally left blank.)

119
Actuarial UAAL asAccrued a Percent-
Actuarial Liability Unfunded age ofActuarial Value of (AAL) - AAL Funded Covered CoveredValuation Assets Entry Age (UAAL) Ratio Payroll Payroll
Date (a) (b) (b-a) (a/b) (c) [(b-a)/c]
6/30/2015 $ - $ 3,778,744 $ (3,778,744) 0.0% $ 36,668,126 10.3%6/30/2013 $ - $ 3,862,554 $ (3,862,554) 0.0% $ 36,346,808 10.6%6/30/2011 $ - $ 3,920,235 $ (3,920,235) 0.0% $ 34,624,868 11.3%6/30/2009 $ - $ 3,593,453 $ (3,593,453) 0.0% $ 33,073,193 10.9%
7/1/2015 $ - $ 5,503,193 $ (5,503,193) 0.0% $ 32,092,393 17.1%7/1/2014 $ - $ 2,678,711 $ (2,678,711) 0.0% $ 35,454,720 7.6%7/1/2012 $ - $ 2,365,074 $ (2,365,074) 0.0% $ 30,358,375 7.8%7/1/2010 $ - $ 2,257,751 $ (2,257,751) 0.0% $ 28,831,983 7.8%7/1/2008 $ - $ 3,891,509 $ (3,891,509) 0.0% $ 24,767,727 15.7%
See Independent Auditors' Report.
Discretely Presented Component Unit - School District
City Plan
Other Post-Employment Benefits
CITY OF BURLINGTON, VERMONT
SCHEDULE OF OPEB FUNDING PROGRESS
REQUIRED SUPPLEMENTARY INFORMATION
June 30, 2016(Unaudited)

120
2015 2014Total Pension Liability
Service $ 5,915,439 $ 5,314,021 Interest on unfunded liability - time value of $ 17,419,148 16,598,877 Changes of benefit terms (3,167,853) - Differences between expected and actual experience 4,312,195 - Changes of assumptions - - Benefit payments, including refunds of member contributions (12,602,652) (11,932,108)
Net change in total pension liability 11,876,277 9,980,790
Total pension liability - beginning 218,004,014 208,023,224
Total pension liability - ending (a) $ 229,880,291 $ 218,004,014
Plan Fiduciary Net PositionContributions - employer $ 8,840,768 $ 8,920,879 Contributions - member 2,167,652 2,148,842 Net investment income (557,357) 19,625,825 Benefit payments, including refunds of member contributions (12,602,652) (11,932,108) Administrative expense (306,795) (253,796) Other - 5,927
Net change in plan fiduciary net position (2,458,384) 18,515,569
Plan fiduciary net position - beginning 164,174,241 145,658,672
Plan fiduciary net position - ending (b) $ 161,715,857 $ 164,174,241
Net pension liability (asset) - ending (a-b) $ 68,164,434 $ 53,829,773
(continued)
CITY OF BURLINGTON, VERMONTEMPLOYEES' RETIREMENT SYSTEM
(A Component Unit of the City of Burlington, Vermont)
SCHEDULE OF CHANGES IN THEEMPLOYERS' NET PENSION LIABILITY
REQUIRED SUPPLEMENTAL INFORMATION
June 30, 2016(Unaudited)

121
(continued)
Schedules of Net Pension Liability2015 2014
Total pension liability $ 229,880,291 $ 218,004,014 Plan fiduciary net position (161,715,857) (164,174,241)
Net pension liability $ 68,164,434 $ 53,829,773
Plan fiduciary net position as a percentage of the total pension liability 70.35% 75.31%
Covered payroll $ 44,765,172 $ 45,788,172
Net -pension liability as a percentage of covered payroll 152.27% 117.56%
Schedules of Employer Contributions2015 2014
Actuarially determined contribution $ 8,840,768 $ 8,920,879 Contributions in relation to the actuarially determined contribution 8,840,768 8,920,879
Contribution deficiency (excess) $ - $ -
Covered payroll $ 44,765,172 $ 45,788,172
Contributions as a percentage of covered employee payroll 19.75% 19.48%
Schedule of Investment Returns2015 2014
Annual money weighted rate of return, net of investment expense -0.15% 13.62%
Schedules are intended to show information for 10 years. Additional years will be displayed as they become available.
See Independent Auditors' Report.

122
(This page intentionally left blank.)

123
SUPPLEMENTARY STATEMENTS AND SCHEDULES

124
(This page intentionally left blank.)

125
Combining Financial Statements and
Other Supplementary Schedules

126
NON-MAJOR GOVERNMENTAL FUNDS
SPECIAL REVENUE FUNDS
Special Revenue Funds are established to account for resources obtained and expended for specific purposes and restricted by law or local action. Traffic: The Traffic Division provides planning, engineering, operations, and maintenance
of the traffic signs, markings, and signals that allow the transportation system to operate safely and efficiently for all modes of travel. Traffic also owns and operates 1,612 public parking spaces in three parking structures downtown; 1,080 on street parking meters; and 176 metered parking spaces in six surface lots.
Community and Economic Development: The Community and Economic Development Office (CEDO) works with the community to foster economic vitality, preserve and enhance neighborhoods, improve the quality of life and the environment, and promote equity and opportunity for all residents of Burlington.
Tax Increment Financing: The Waterfront TIF fund is utilized for enhancing public infra-structure and making the waterfront area more accessible and vibrant.
Church Street Marketplace: Church Street Marketplace manages the public right of way for a four block pedestrian mall and business improvement district. This includes mainte-nance, marketing and administrative services.
Impact Fees: Impact fees are assessed against new development to help offset the costs of new infrastructure required by the City’s growth. These funds are restricted for the use of capital improvement projects.
Dedicated Taxes: The City of Burlington has several voter-approved dedicated taxes to be utilized for parks and tree upgrades, conservation of open space, assistance with building of affordable housing, and upgrades to the Cities streets.
CAPITAL PROJECT FUNDS
Capital Project funds are established to account for resources obtained and expended for the acquisition of major capital facilities or equipment. Champlain Parkway: This fund is used to account for the construction of a new City
street from I89 to the City's center.
Waterfront Access: This fund is used to account for access improvements to waterfront and college streets including a new road and skate park.

127
Street and Sidewalk Infrastructure: This fund is used to account for our Capital Street program utilizes dedication tax funding to replace City Street infrastructure.
Traffic Capital: This fund is used to account for multi-year capital investment in parking infrastructure improvements.
Wayfinding: This fund is used to account for the creation of new directional signage including gateway, downtown, parking facilities, destination, recreation, and education directional.
FEMA: This fund is used to account for Federal Emergency Management funding for declared emergencies including the 2012 Spring flooding.
General Capital: This fund is used to account for the Parks Department dedicated funding for parks and waterfront improvements.
Downtown Westlake: This fund is used to account for funding for a two-story parking structure to service area hotel users.
Other: This fund is used to account for Other Projects that are over $50,000 and cross multiple fiscal years.
PERMANENT FUNDS
Permanent funds are established to account for certain assets held by the Town in a fiduciary capacity as trustee. Cemetery: This fund is used to account for the sale of endowments and interest for main-
tenance of cemetery.
Loomis Library: This fund is used to account for a bequest by Horatio G Loomis in 1902 and interest to be used by Fletcher Free Library.
Lolita Deming Estate: This fund is used to account for a bequest from L. Deming 1972 for use by parks department for the removal and planting of trees.
Mary E. Waddell: This fund is used to account for a bequest of M. Waddell in 1988 to be used for planting flowers in public flower beds.
WEZF 93 FM DARE: This fund is used to account for contributions by Norman Knight Charitable Foundation to assist police department with DARE Program.

128
Community Taxand Economic Increment
Traffic Development Financing
ASSETS
Cash and short-term investments $ 2,331,441 $ 2,281,701 $ 1,687,990 Investments - - - Departmental and other receivables 84,866 - - Intergovernmental receivables - 1,246,725 - Loans receivable - 4,933,306 - Accrued interest receivable - 1,159,316 - Inventory 285,317 - - Due from component unit - - - Other current assets 122 - -
Total Assets $ 2,701,746 $ 9,621,048 $ 1,687,990
LIABILITIES AND FUND BALANCES
Liabilities:Accounts payable $ 191,340 $ 197,603 $ - Intergovernmental payable - - 41,539 Accrued payroll and benefits payable 37,988 41,092 - Accrued liabilities - 4,362 - Note payable 200,000 - - Line of creditDue to other funds - - - Advances from other funds - 414,408 - Other liabilities - - -
Total Liabilities 429,328 657,465 41,539
DEFERRED INFLOWS OF RESOURCESDeferred revenues 27,419 6,524,599 -
Fund Balances:Nonspendable 285,317 - - Restricted - 2,438,984 1,646,451 Committed 1,959,682 - - Unassigned - - -
Total Fund Balances 2,244,999 2,438,984 1,646,451
Total Liabilities. Deferred Inflows of Resources and Fund Balances $ 2,701,746 $ 9,621,048 $ 1,687,990
Special Revenue Funds
CITY OF BURLINGTON, VERMONT
Combining Balance Sheet
Nonmajor Governmental Funds
June 30, 2016

129
ChurchStreet Impact Dedicated
Marketplace Fees Taxes Subtotals
$ 10,159 $ 335,092 $ 1,176,612 $ 7,822,995 - - - -
45,831 - - 130,697 - - - 1,246,725 - - - 4,933,306 - - - 1,159,316 - - - 285,317 - - - - - 1,676 - 1,798
$ 55,990 $ 336,768 $ 1,176,612 $ 15,580,154
$ 15,087 $ 29,550 $ - $ 433,580 - - - 41,539
11,746 - - 90,826 - - - 4,362 - - - 200,000
- - - - -
43,594 - - 458,002 - - - -
70,427 29,550 - 1,228,309
29,157 - - 6,581,175
- - - 285,317 - 307,218 - 4,392,653 - - 1,176,612 3,136,294
(43,594) - - (43,594)
(43,594) 307,218 1,176,612 7,770,670
$ 55,990 $ 336,768 $ 1,176,612 $ 15,580,154
(continued)
Special Revenue Funds

130
(continued)
Street &Champlain Waterfront Sidewalk TrafficParkway Access Infrastructure Capital Wayfinding FEMA
ASSETS
Cash and short-term investments $ 203,944 $ 19,513 $ 8,076,644 $ - $ 90,540 $ - Investments - - - - - - Departmental and other receivables - 128,206 56,206 - - - Intergovernmental receivables 669,182 167,476 746,297 - 147,319 278,765 Loans receivable - - - - - - Accrued interest receivable - - - - - - Inventory - - - - - - Due from component unit - - - - - - Other current assets - - - - - -
Total Assets $ 873,126 $ 315,195 $ 8,879,147 $ - $ 237,859 $ 278,765
LIABILITIES AND FUND BALANCES
Liabilities:Accounts payable $ 234,377 $ 427,604 $ 1,067,997 $ 290,196 $ 119,325 $ - Intergovernmental payable - - 1,661,572 - - - Accrued payroll and benefits payable - - 1,936 - - - Accrued liabilities - - - - - - Note payable - - - - - - Line of credit 833,628 - - Due to other funds - - - 365,808 - - Advances from other funds 534,296 - - - 127,360 211,879 Other liabilities - - - - - -
Total Liabilities 768,673 427,604 2,731,505 1,489,632 246,685 211,879
DEFERRED INFLOWS OF RESOURCESDeferred revenues 658,749 131,987 765,408 - 118,534 58,952
Fund Balances:Nonspendable - - - - - - Restricted - - 5,382,234 - - 7,934 Committed - - - - - - Unassigned (554,296) (244,396) - (1,489,632) (127,360)
Total Fund Balances (554,296) (244,396) 5,382,234 (1,489,632) (127,360) 7,934
Total Liabilities. Deferred Inflows of Resources and Fund Balances $ 873,126 $ 315,195 $ 8,879,147 $ - $ 237,859 $ 278,765
(continued)
Capital Project Funds

131
LolitaGeneral Downtown Loomis DemingCapital Westlake Other Subtotals Cemetery Library Estate
$ - $ - $ 143,273 $ 8,533,914 $ 1,779 $ 10,948 $ 11,242 - - - - 1,245,354 - - - - - 184,412 - - -
921,950 - 43,955 2,974,944 - - - - - - - - - - - - - - - - - - - - - - - - - 288,331 - 288,331 - - - 75 - - 75 - - -
$ 922,025 $ 288,331 $ 187,228 $ 11,981,676 $ 1,247,133 $ 10,948 $ 11,242
$ 95,554 $ - $ 24,999 $ 2,260,052 $ - $ - $ - - - - 1,661,572 - - -
10,139 - - 12,075 - - - - - 20,800 20,800 - - - - - - - - - - - - - 833,628 - - -
322,721 - - 688,529 - - - 361,145 299,463 41,417 1,575,560 - - -
- - 100,882 100,882 - - -
789,559 299,463 188,098 7,153,098 - - -
- - 2,683 1,736,313 - - -
- - - - 894,796 10,948 2,486 132,466 - - 5,522,634 352,337 - 8,756
- - - - - - - - (11,132) (3,553) (2,430,369) - - -
132,466 (11,132) (3,553) 3,092,265 1,247,133 10,948 11,242
$ 922,025 $ 288,331 $ 187,228 $ 11,981,676 $ 1,247,133 $ 10,948 $ 11,242
(continued)
Permanent FundsCapital Project Funds

132
(continued)
WEZF NonmajorMary E. 93 FM GovernmentalWaddell DARE Subtotals Funds
ASSETS
Cash and short-term investments $ 13,886 $ 2,236 $ 40,091 $ 16,397,000 Investments - - 1,245,354 1,245,354 Departmental and other receivables - - - 315,109 Intergovernmental receivables - - - 4,221,669 Loans receivable - - - 4,933,306 Accrued interest receivable - - - 1,159,316 Inventory - - - 285,317 Due from component unit - - - 288,331 Other current assets - - - 1,873
Total Assets $ 13,886 $ 2,236 $ 1,285,445 $ 28,847,275
LIABILITIES AND FUND BALANCES
Liabilities:Accounts payable $ - $ - $ - $ 2,693,632 Intergovernmental payable - - - 1,703,111 Accrued payroll and benefits payable - - - 102,901 Accrued liabilities - - - 25,162 Note payable - - - 200,000 Line of credit - - 833,628 Due to other funds - - - 688,529 Advances from other funds - - - 2,033,562 Other liabilities - - - 100,882
Total Liabilities - - - 8,381,407
DEFERRED INFLOWS OF RESOURCESDeferred revenues - - - 8,317,488
Fund Balances:Nonspendable - 1,000 909,230 1,194,547 Restricted 13,886 1,236 376,215 10,291,502 Committed - - - 3,136,294 Unassigned - - - (2,473,963)
Total Fund Balances 13,886 2,236 1,285,445 12,148,380
Total Liabilities. Deferred Inflows of Resources and Fund Balances $ 13,886 $ 2,236 $ 1,285,445 $ 28,847,275
Permanent Funds

133
(This page intentionally left blank.)

134
Communityand Economic
Development and Tax IncrementTraffic Housing Trust Financing
Revenues:Taxes $ - $ 196,648 $ 2,385,881 Licenses and permits - - - Intergovernmental - 2,973,263 - Charges for services 5,334,917 64,867 - Contributions - 11,370 - Investment income 551 408 - Loan repayments - 104,033 - Other 11,140 107,225 -
Total Revenues 5,346,608 3,457,814 2,385,881
Expenditures:Current:
General government - - 64,685 Public safety - - - Public works 4,568,082 - - Culture and recreation - - - Community development - 3,309,706 -
Capital outlay - - - Debt service:
Principal 221,743 - 1,809,405 Interest and bond issue costs 20,646 - 461,510
Total Expenditures 4,810,471 3,309,706 2,335,600
Excess (deficiency) of revenuesover (under) expenditures 536,137 148,108 50,281
Other Financing Sources (Uses):Issuance of bonds and loans - - 1,801,705 Bond premium - - - Transfers in 317,470 232,590 - Transfers out (27,197) - (1,783,195)
Total Other FinancingSources (Uses) 290,273 232,590 18,510
Net change in fund balances 826,410 380,698 68,791
Fund Balances, beginning of year 1,418,589 2,058,286 1,577,660
Fund Balances, end of year $ 2,244,999 $ 2,438,984 $ 1,646,451
CITY OF BURLINGTON, VERMONT
Combining Statement of Revenues, Expendituresand Changes in Fund Equity
Nonmajor Governmental Funds
For the Year Ended June 30, 2016
Special Revenue Funds

135
ChurchStreet Impact Dedicated
Marketplace Fees Taxes Subtotals
$ - $ - $ 706,523 $ 3,289,052 142,713 - - 142,713
98,575 - 68,500 3,140,338 716,490 138,047 44,502 6,298,823
- - 14,884 26,254 3 3,331 - 4,293
- - - 104,033 - - 3,570 121,935
957,781 141,378 837,979 13,127,441
- - - 64,685 - 246,080 - 246,080
881,453 - - 5,449,535 - 167,512 1,305,509 1,473,021 - - - 3,309,706 - - - -
24,152 - - 2,055,300 1,301 - - 483,457
906,906 413,592 1,305,509 13,081,784
50,875 (272,214) (467,530) 45,657
- - 161,072 1,962,777 - - - -
11,000 - 181,775 742,835 - (18,000) - (1,828,392)
11,000 (18,000) 342,847 877,220
61,875 (290,214) (124,683) 922,877
(105,469) 597,432 1,301,295 6,847,793
$ (43,594) $ 307,218 $ 1,176,612 $ 7,770,670
(continued)
Special Revenue Funds

136
(continued)
Street &Champlain Waterfront Sidewalk TrafficParkway Access Infrastructure Capital Wayfinding FEMA
Revenues:Taxes $ - $ - $ 2,101,179 $ - $ - $ - Licenses and permits - - - - - - Intergovernmental 208,016 2,781,915 609,448 - 184,317 293,359 Charges for services - - 254,466 - - - Contributions - - 26,108 - - - Investment income - - - - - - Loan repayments - - - - - - Other - 53,345 137,767 - 60,207 -
Total Revenues 208,016 2,835,260 3,128,968 - 244,524 293,359
Expenditures:Current:
General government - - - - - - Public safety - - - - - - Public works - - - - - - Culture and recreation - - - - - - Community development - - - - - -
Capital outlay 868,046 3,379,134 6,158,102 1,489,632 350,339 - Debt service:
Principal - - - - - - Interest and bond issue costs - - - - - -
Total Expenditures 868,046 3,379,134 6,158,102 1,489,632 350,339 -
Excess (deficiency) of revenuesover (under) expenditures (660,030) (543,874) (3,029,134) (1,489,632) (105,815) 293,359
Other Financing Sources (Uses):Issuance of bonds and loans - - 2,338,428 - - - Bond premium - - 244,923 - - - Transfers in 17,361 1,722,567 1,627,201 - 7,197 - Transfers out - - (312,949) - - -
Total Other FinancingSources (Uses) 17,361 1,722,567 3,897,603 - 7,197 -
Net change in fund balances (642,669) 1,178,693 868,469 (1,489,632) (98,618) 293,359
Fund Balances, beginning of year 88,373 (1,423,089) 4,513,765 - (28,742) (285,425)
Fund Balances, end of year $ (554,296) $ (244,396) $ 5,382,234 $ (1,489,632) $ (127,360) $ 7,934
Capital Project Funds

137
LolitaGeneral Downtown Loomis DemingCapital Westlake Other Subtotals Cemetery Library Estate
$ - $ - $ - $ 2,101,179 $ - $ - $ - - - - - - - - - - - 4,077,055 - - - - - - 254,466 - - - - - - 26,108 - - - - - - - 26,230 - - - - - - - - - - - - 251,319 3,968 - -
- - - 6,710,127 30,198 - -
- - - - - - - - - - - - - - - - - - - - - - - - - - - - - - - - - - -
925,850 - 8,631 13,179,734 - - -
88 - - 88 - - - - - - - - - -
925,938 - 8,631 13,179,822 - - -
(925,938) - (8,631) (6,469,695) 30,198 - -
760,878 - - 3,099,306 - - - - - - 244,923 - - - - - 8,631 3,382,957 - - - - - - (312,949) (29,303) - -
760,878 - 8,631 6,414,237 (29,303) - -
(165,060) - - (55,458) 895 - -
297,526 (11,132) (3,553) 3,147,723 1,246,238 10,948 11,242
$ 132,466 $ (11,132) $ (3,553) $ 3,092,265 $ 1,247,133 $ 10,948 $ 11,242
(continued)
Capital Project Funds Permanent Funds

138
(continued)
TotalWEZF Nonmajor
Mary E. 93 FM GovernmentalWaddell DARE Subtotals Funds
Revenues:Taxes $ - $ - $ - $ 5,390,231 Licenses and permits - - - 142,713 Intergovernmental - - - 7,217,393 Charges for services - - - 6,553,289 Contributions - - - 52,362 Investment income - - 26,230 30,523 Loan repayments - - - 104,033 Other - - 3,968 377,222
Total Revenues - - 30,198 19,867,766
Expenditures:Current:
General government - - - 64,685 Public safety - - - 246,080 Public works - - - 5,449,535 Culture and recreation - - - 1,473,021 Community development - - - 3,309,706
Capital outlay - - - 13,179,734 Debt service:
Principal - - - 2,055,388 Interest and bond issue costs - - - 483,457
Total Expenditures - - - 26,261,606
Excess (deficiency) of revenuesover (under) expenditures - - 30,198 (6,393,840)
Other Financing Sources (Uses):Issuance of bonds and loans - - - 5,062,083 Bond premium - - - 244,923 Transfers in - - - 4,125,792 Transfers out - - (29,303) (2,170,644)
Total Other FinancingSources (Uses) - - (29,303) 7,262,154
Net change in fund balances - - 895 868,314
Fund Balances, beginning of year 13,886 2,236 1,284,550 11,280,066
$ 13,886 $ 2,236 $ 1,285,445 $ 12,148,380
Permanent Funds
Fund Balances, end of year

139
NON-MAJOR PROPRIETARY (ENTERPRISE) FUNDS Enterprise Funds were established to account for activities that are financed and operated in a manner similar to private business enterprises, where the intent of the governing body is that the activity be self-supporting based on user charges. Telecom: A fiber optic network that passes to almost 16,000 homes and businesses in the
City, as well as connecting the City’s municipal offices, schools, and essential services. Telecom provides internet, telephone, and video services to residential and business customers.
Wastewater: This Division of Public Works provides 3 wastewater treatment plants, 25 pump stations, and 100 miles of collection system for year-round wastewater disposal.
Water: Delivery of potable water to residents of Burlington and wholesale to the Colchester Fire District.
Stormwater: Stormwater addresses state and federal stormwater requirements to improve the water quality of Lake Champlain and the Winooski Rivers, as well as the streams that flow into them.

140
Telecom Wastewater Water Stormwater Total
Assets:Current:
Cash and cash equivalents $ 1,283,516 $ 2,328,436 $ 1,826,283 $ 599,814 $ 6,038,049 Receivables, net of allowance for uncollectibles:
User fees 801,595 870,081 743,497 130,581 2,545,754 Intergovernmental - - 57,211 - 57,211 Estimated unbilled revenues 4,072 581,999 463,230 91,536 1,140,837
Inventory 434,174 119,870 268,890 - 822,934 Prepaid expenses 77,464 1,462 1,191 - 80,117 Other current assets 5,000 - - - 5,000
Total current assets 2,605,821 3,901,848 3,360,302 821,931 10,689,902
Noncurrent:Restricted cash 663,213 1,434,845 - - 2,098,058 Capital assets:
Land and construction in progress 157,800 847,952 51,250 154,336 1,211,338 Intangible asset 5,400,000 - - - 5,400,000
3,320,177 24,863,647 11,134,621 1,151,836 40,470,281
Total noncurrent assets 9,541,190 27,146,444 11,185,871 1,306,172 49,179,677
TOTAL ASSETS 12,147,011 31,048,292 14,546,173 2,128,103 59,869,579
Deferred Outflows of Resources - pension related 514,424 466,844 637,802 - 1,619,070
$ 12,661,435 $ 31,515,136 $ 15,183,975 $ 2,128,103 $ 61,488,649
Liabilities:Current:
Accounts payable $ 326,471 $ 338,072 $ 133,184 $ 187,551 $ 985,278 Accrued payroll and benefits payable - 19,031 24,185 7,343 50,559 Unearned revenue 469,528 - 469,528 Other current liabilities 884,097 - 27,083 - 911,180 Current portion of long-term liabilities:
Revenue bonds payable - 888,002 - 18,764 906,766 Note payable - - 8,485 - 8,485 Capital leases payable 193,294 - 7,367 - 200,661
Total current liabilities 1,873,390 1,245,105 200,304 213,658 3,532,457
Noncurrent:Revenue bonds payable - 14,302,947 - 356,740 14,659,687 Long term note payable - - 219,521 - 219,521 Capital leases payable, net of current portion 5,705,347 - - - 5,705,347 Compensated absences payable 97,881 78,419 145,021 - 321,321 Net OPEB obligation 122,362 60,919 81,040 2,617 266,938 Net pension liability 1,124,029 856,352 1,169,736 - 3,150,117
Total noncurrent liabilities 7,049,619 15,298,637 1,615,318 359,357 24,322,931
8,923,009 16,543,742 1,815,622 573,015 27,855,388
Deferred Inflows of Resources - - - - -
Net investment in capital assets 2,979,336 10,520,649 10,950,498 930,668 25,381,151 For contingency reserve - 1,434,845 - - 1,434,845 For revenue fund 663,213 - - - 663,213 Unrestricted 95,877 3,015,900 2,417,855 624,420 6,154,052
TOTAL NET POSITION 3,738,426 14,971,394 13,368,353 1,555,088 33,633,261
$ 12,661,435 $ 31,515,136 $ 15,183,975 $ 2,128,103 $ 61,488,649
See notes to financial statements.
TOTAL LIABILITIES, DEFERRED INFLOWS OF RESOURCES AND NET POSITION
NET POSITION
TOTAL LIABILITIES
ASSETS AND DEFERRED OUTFLOWS OF RESOURCES
LIABILITIES, DEFERRED INFLOWS OF RESOURCES AND NET POSITION
TOTAL ASSETS AND DEFERRED OUTFLOWS OF RESOURCES
Capital assets, net of accumulated depreciation
Nonmajor Enterprise Funds
CITY OF BURLINGTON, VERMONT
NONMAJOR PROPRIETARY FUNDS
STATEMENT OF NET POSITION
JUNE 30, 2016

141
Telecom Wastewater Water Stormwater Total
Operating Revenues:Charges for services $ 8,321,752 $ 8,026,247 $ 6,275,964 $ 1,267,810 $ 23,891,773 Intergovernmental - - - 51,121 51,121 Miscellaneous - - 256,681 2,600 259,281
Total Operating Revenues 8,321,752 8,026,247 6,532,645 1,321,531 24,202,175
Operating Expenses:Personnel 1,899,689 1,454,677 2,151,842 280,192 5,786,400 Nonpersonnel 3,859,582 3,105,993 2,127,637 708,167 9,801,379 Depreciation and amortization 599,789 1,581,314 650,864 50,180 2,882,147 Payments in lieu of taxes 84,111 917,913 412,595 - 1,414,619
Total Operating Expenses 6,443,171 7,059,897 5,342,938 1,038,539 19,884,545
Operating Income 1,878,581 966,350 1,189,707 282,992 4,317,630
Nonoperating Revenues (Expenses):Investment income - 1,798 - - 1,798 Other income/expense - net 100,019 (2,457) (11,142) - 86,420 Interest income/expense - net (420,819) (498,700) 4 528 (918,987)
Total Nonoperating Revenues (Expenses) (320,800) (499,359) (11,138) 528 (830,769)
Income Before Contributions and Transfers 1,557,781 466,991 1,178,569 283,520 3,486,861
Capital contributions - - - - - Transfers out - - - - -
Change in Net Position 1,557,781 466,991 1,178,569 283,520 3,486,861
Net Position at Beginning of Year 2,180,645 14,504,403 12,189,784 1,271,568 30,146,400
Net Position at End of Year $ 3,738,426 $ 14,971,394 $ 13,368,353 $ 1,555,088 $ 33,633,261
See notes to financial statements.
Nonmajor Enterprise Funds
CITY OF BURLINGTON, VERMONT
NONMAJOR PROPRIETARY FUNDS
STATEMENT OF REVENUES, EXPENSES AND CHANGES IN FUND NET POSITION
FOR THE YEAR ENDED JUNE 30, 2016

142
Telecom Wastewater Water StormwaterFund Fund Fund Fund Total
Cash Flows From Operating Activities:Receipts from customers and users $ 8,422,174 $ 8,033,803 $ 6,143,904 $ 1,226,246 $ 23,826,127 Receipts of operating grants - - - 51,121 51,121 Receipts for interfund services - - 256,681 - 256,681 Payments to suppliers (3,642,177) (3,109,407) (2,284,984) (546,190) (9,582,758) Payments for wages and benefits (2,096,783) (1,391,995) (2,079,913) (275,858) (5,844,549) Payments in lieu of taxes (84,111) (917,913) (412,595) - (1,414,619)
Net Cash Provided by Operating Activities 2,599,103 2,614,488 1,623,093 455,319 7,292,003
Cash Flows From Noncapital Financing Activities:Other income, net 100,019 2,542 362 - 102,923
Cash Provided/(Used) by Noncapital Financing Activities 100,019 2,542 362 - 102,923
Cash Flows From Capital and Related Financing Activities:Acquisition and construction of capital assets (1,261,274) (80,300) (485,248) (251,071) (2,077,893) Issuance of bonds and notes - - 151,612 - 151,612 Principal paid on: Bonds and notes - (884,949) - (18,396) (903,345) Capital lease obligations (179,852) - (14,522) - (194,374) Interest paid on outstanding debt, including issue costs (420,819) (498,700) (357) - (919,876)
Net Cash Provided/(Used) by Capital and Related Financing Activities (1,861,945) (1,463,949) (348,515) (269,467) (3,943,876)
Cash Flows From Investing Activities:Increase in restricted cash (299,027) (1,419) - - (300,446) Receipt of interest & dividends - 1,799 - 526 2,325
Net Cash Provided/(Used) by Investing Activities (299,027) 380 - 526 (298,121)
Net Increase/(Decrease) in Cash 538,150 1,153,461 1,274,940 186,378 3,152,929 Cash and cash equivalents at beginning of year 745,366 1,174,975 551,343 413,436 2,885,120 Cash and cash equivalents at end of year $ 1,283,516 $ 2,328,436 $ 1,826,283 $ 599,814 $ 6,038,049
Adjustments to Reconcile Operating Income to Net Cash Provided by Operating Activities:
Operating Income $ 1,878,581 $ 966,350 $ 1,189,707 $ 282,992 $ 4,317,630 Depreciation and amortization 599,789 1,581,314 650,864 50,180 2,882,147 (Increase)/Decrease in receivables 76,667 20,680 (59,586) (36,302) 1,459 (Increase)/Decrease in unbilled revenues (346) (13,124) (64,766) (7,862) (86,098) (Increase)/Decrease in inventory (246,851) 6,504 34,036 - (206,311) Increase/(Decrease) in accounts payable (22,312) (9,918) (191,051) 161,977 (61,304) Increase/(Decrease) in customer deposits - - (7,708) - (7,708) Increase/(Decrease) in accrued payroll and benefits - (9,566) (24,944) 1,717 (32,793) Increase/(Decrease) in accrued liabilities 489,954 - - - 489,954 Increase/(Decrease) in deferred charges 24,101 - - - 24,101 Increase/(Decrease) in compensated absences 16,681 3,384 (6,525) - 13,540 Increase/(Decrease) in other post employment benefits liability 15,600 13,713 18,690 2,617 50,620
128,598 55,151 84,707 - 268,456 Increase/(Decrease) in other operating assets/liabilities (3,386) - (331) - (3,717) Capitalized labor (357,973) - - - (357,973)
Net Cash Provided by Operating Activities $ 2,599,103 $ 2,614,488 $ 1,623,093 $ 455,319 $ 7,292,003
Statement of noncash transactions:Vehicles acquired under capital lease financing $ 63,993 $ - $ - $ - $ 63,993
See Notes to Financial Statements
FOR THE YEAR ENDED JUNE 30, 2016
CITY OF BURLINGTON, VERMONT
Increase/(Decrease) in net pension liability and related deferred inflow/outflow
STATEMENT OF CASH FLOWSNONMAJOR PROPRIETARY FUNDS

143
PRIVATE PURPOSE FUNDS Private purpose trust funds are used to account for assets held by the City of Burlington, Vermont in a trustee capacity. Louisa Howard: Bequest by L. Howard in 1894 with interest to be used for benefit of
firemen injured in the line of duty.
Walter Carpenter: Bequest W. Carpenter in 1929 with interest to be used yearly for Christmas dinner for destitute in Burlington.
Fireman’s Relief: Appropriated by the City with interest earned for benefit of firemen injured in line of duty.
Christmas Gift: Donations during WWII for gifts to servicemen oversees.

144
Louisa Walter Fireman's ChristmasHoward Carpenter Relief Gift Total
Cash and short-term investments $ 28,088 $ 7,512 $ 628 $ 1,620 $ 37,848
Total Assets 28,088 7,512 628 1,620 37,848
Net position held in trust $ 28,088 $ 7,512 $ 628 $ 1,620 $ 37,848
NET POSITION
CITY OF BURLINGTON, VERMONT
Combining Statement of Fiduciary Net Position
Private Purpose Trust Funds
June 30, 2016
ASSETS

145
Louisa Walter Fireman's ChristmasHoward Carpenter Relief Gift Total
Investment income $ - $ 29 $ - $ 1 $ 30
Total Additions - 29 - 1 30
Payments to beneficiaries - - - - -
Net increase - 29 - 1 30
Beginning of year 28,088 7,483 628 1,619 37,818
End of year $ 28,088 $ 7,512 $ 628 $ 1,620 $ 37,848
DEDUCTIONS
NET POSITION
CITY OF BURLINGTON, VERMONT
Combining Statement of Changes in Fiduciary Net Position
Private Purpose Trust Funds
For the Year Ended June 30, 2016
ADDITIONS

146
(This page intentionally left blank)

147
STATISTICAL SECTION

148
(This page intentionally left blank.)

149
CITY OF BURLINGTON, VERMONT
STATISTICAL SECTION The City of Burlington’s comprehensive annual financial report presents detailed information as a context for understanding what the information in the financial statements, note disclo-sures, and required supplementary information says about the City’s overall financial health. Page Financial Trends
These schedules contain trend information to help the reader understand how the Town’s financial performance and well-being have changed over time.
150 - 154
Revenue Capacity These schedules contain information to help the reader assess the Town’s most significant local revenue source, the property tax.
155 – 158
Debt Capacity These schedules present information to help the reader assess the affordability of the Town’s current levels of outstanding debt and the Town’s ability to issue additional debt in the future.
159 - 163
Demographic and Economic Information These schedules offer demographic and economic indicators to help the reader understand the environment within which the Town’s financial activities take place.
164 - 165
Operating Information These schedules contain service and infrastructure data to help the reader understand how the information in the Town’s financial report relates to the service the government provides and the activities it performs.
166 - 168

2016 2015 (1) 2014 2013 2012 2011 2010 2009 2008 2007
Governmental ActivitiesNet Investment in Capital Assets 92,236,468$ 82,986,888$ 104,389,306$ 101,991,786$ 111,373,478$ 140,431,453$ 141,325,963$ 135,869,663$ 131,531,661$ 127,785,651$ Restricted 17,725,332 16,799,937 15,285,119 13,949,243 10,773,209 9,275,500 7,931,128 9,784,253 6,318,445 9,735,281 Unrestricted (21,734,316) (25,449,498) (5,306,520) 7,927,203 2,958,684 (4,062,816) (6,476,248) (10,766,232) (8,025,245) (8,935,478)
Total GovernmentalActivities Net Position 88,227,484 74,337,327 114,367,905 123,868,232 125,105,371 145,644,137 142,780,843 134,887,684 129,824,861 128,585,454
Business-type ActivitiesNet Investment in Capital Assets 179,096,254 172,629,734 156,804,042 149,806,307 139,041,152 134,805,081 98,953,992 77,968,937 72,812,022 68,493,396 Restricted 20,812,890 19,319,510 32,017,674 31,999,045 39,020,023 32,944,710 34,179,074 31,366,671 29,204,097 28,310,340 Unrestricted 27,982,661 22,266,988 28,692,499 12,449,872 3,526,400 4,799,188 1,160,504 12,444,615 21,079,712 29,181,293
Total Business-typeActivities Net Position 227,891,805 214,216,232 217,514,215 194,255,224 181,587,575 172,548,979 134,293,570 121,780,223 123,095,831 125,985,029
Primary GovernmentNet Investment in Capital Assets 271,332,722 255,616,622 261,193,348 251,798,093 250,414,630 275,236,534 240,279,955 213,838,600 204,343,683 196,279,047 Restricted 38,538,222 36,119,447 47,302,793 45,948,288 49,793,232 42,220,210 42,110,202 41,150,924 35,522,542 38,045,621 Unrestricted 6,248,345 (3,182,510) 23,385,979 20,377,075 6,485,084 736,372 (5,315,744) 1,678,383 13,054,467 20,245,815
Total Primary GovernmentNet Position 316,119,289$ 288,553,559$ 331,882,120$ 318,123,456$ 306,692,946$ 318,193,116$ 277,074,413$ 256,667,907$ 252,920,692$ 254,570,483$
Source: Each respective Annual Financial Report
(1) Net position restated due to School District adjustments.
CITY OF BURLINGTON, VERMONTNET POSITION BY COMPONENT
LAST TEN YEARS(accrual basis of accounting)
150

CITY OF BURLINGTON, VERMONT CHANGES IN NET POSITION
LAST TEN YEARS(accrual basis of accounting)
2016 2015 (1) 2014 2013 2012 2011 2010 2009 2008 2007
ExpensesGovernmental Activities:
General Government 11,353,565$ 12,393,196$ 12,702,289$ 14,800,538$ 13,479,552$ 13,426,363$ 8,396,986$ 7,833,861$ 7,731,527$ 7,545,288$ Public Safety 23,500,758 24,915,179 22,692,852 24,499,396 22,702,099 21,931,701 20,783,010 20,708,638 20,262,074 19,894,557 Education - - 77,470,770 77,438,762 70,038,411 66,901,788 62,376,087 57,639,807 53,322,002 48,509,636 Public Works 15,484,410 17,038,012 14,172,277 13,051,255 13,409,033 13,101,541 12,042,610 12,111,622 11,375,602 10,673,896 Culture and Recreation 10,066,735 10,736,031 9,965,826 8,584,443 9,453,885 9,244,881 11,026,270 10,069,342 9,247,568 8,529,244 Community Development 4,895,091 4,931,161 4,068,608 8,470,457 4,743,445 5,082,322 4,734,066 4,149,542 4,104,701 4,820,282 Interest on Long-term Debt 1,782,295 1,581,846 3,087,143 2,330,680 1,541,535 2,791,517 1,752,555 1,520,465 1,796,364 1,900,299
Total Governmental Activities 67,082,854 71,595,425 144,159,765 149,175,531 135,367,960 132,480,113 121,111,584 114,033,277 107,839,838 101,873,202
Business-type Activities:Electric 63,912,747 62,408,788 65,061,544 58,972,894 58,154,956 56,676,147 55,160,426 54,915,355 50,408,203 46,479,941 Airport 19,753,724 20,288,983 20,772,761 20,192,615 19,983,379 16,690,935 15,623,985 16,562,164 15,071,525 13,791,063 Telecom - - 6,791,829 6,118,395 6,109,867 7,107,667 10,579,222 10,480,260 7,848,863 5,290,332 Wastewater - - 7,289,587 6,648,603 6,863,244 6,522,461 5,655,138 5,447,686 5,100,231 5,061,186 Nonmajor 20,803,532 19,931,149 8,302,064 8,048,347 7,725,191 7,485,535 6,778,199 6,791,139 6,595,387 6,256,704
Total Business-Type Activities 104,470,003 102,628,920 108,217,785 99,980,854 98,836,637 94,482,745 93,796,970 94,196,604 85,024,209 76,879,226
Total Expenses 171,552,857 174,224,345 252,377,550 249,156,385 234,204,597 226,962,858 214,908,554 208,229,881 192,864,047 178,752,428
Program RevenuesGovernmental Activities:
Charges for ServicesGeneral Government 5,043,853 5,289,088 4,938,750 4,372,982 4,566,523 4,629,070 1,198,950 965,261 1,105,956 853,361 Public Safety 6,997,158 5,587,200 6,526,060 5,174,000 6,298,499 5,823,531 5,271,957 6,309,231 5,227,594 4,132,554 Education - - 1,036,876 4,575,124 3,112,442 3,110,746 5,946,825 1,210,392 1,314,480 2,804,186 Public Works 8,898,625 7,475,742 7,766,867 7,265,536 7,019,336 6,744,645 1,194,606 4,993,790 4,294,457 4,876,828 Culture and Recreation 4,277,482 4,074,232 3,849,129 3,722,853 3,328,668 2,983,704 3,792,403 3,128,842 3,435,507 3,209,126 Community Development 221,533 714,715 250,361 214,897 131,415 158,512 1,423,809 403,704 1,388,507 981,702 Capital Outlay - 302,592 429,582 464,401
Operating Grants and Contributions 4,515,575 5,922,165 84,297,547 76,620,402 77,050,104 72,053,237 67,279,458 59,707,134 53,039,312 49,344,678 Capital Grants and Contributions 4,688,216 3,112,726 2,339,931 5,193,962 3,476,470 1,524,271 3,050,389 4,978,575 2,161,602 5,599,034
Total Governmental Activities 34,642,442 32,175,868 111,005,521 107,139,756 104,983,457 97,027,716 89,158,397 81,999,521 72,396,997 72,265,870
Business-type Activities:Charges for Services
Electric 62,505,682 62,622,315 63,381,532 59,965,267 58,837,344 59,679,347 54,033,005 50,010,832 49,624,179 49,119,804 Airport 18,470,124 19,030,728 18,794,078 17,915,076 17,478,275 16,416,564 11,724,249 12,023,774 11,384,027 10,579,049 Telecom - - 7,246,329 6,959,342 6,701,375 7,199,476 7,052,969 6,284,633 2,984,347 1,101,180 Wastewater - - 7,726,659 7,751,070 7,588,128 7,176,316 6,680,437 6,024,216 5,201,648 5,338,678 Nonmajor 24,151,054 21,464,113 8,943,170 8,756,986 8,304,743 8,106,743 7,667,023 6,987,959 7,128,916 7,148,300
Operating Grants and Contributions 205,387 - - - - - 429,477 386,202 145,587 57,344 Capital Grants and Contributions 9,118,954 7,431,502 7,722,603 7,976,875 8,454,165 26,872,882 19,074,399 11,741,445 6,374,448 10,421,524
Total Business-type Activities 114,451,201 110,548,658 113,814,371 109,324,616 107,364,030 125,451,328 106,661,559 93,459,061 82,843,152 83,765,879
Total Program Revenues 149,093,643 142,724,526 224,819,892 216,464,372 212,347,487 222,479,044 195,819,956 175,458,582 155,240,149 156,031,749
Net (Expense)/RevenueGovernmental Activities (32,440,412) (39,419,557) (33,154,244) (42,035,775) (30,384,503) (35,452,397) (31,953,187) (32,033,756) (35,442,841) (29,607,332) Business-type Activities 9,981,198 7,919,738 5,596,586 9,343,762 8,527,393 30,968,583 12,864,589 (737,543) (2,181,057) 6,886,653
Total Net Expense (22,459,214)$ (31,499,819)$ (27,557,658)$ (32,692,013)$ (21,857,110)$ (4,483,814)$ (19,088,598)$ (32,771,299)$ (37,623,898)$ (22,720,679)$
(continued)
151

CITY OF BURLINGTON, VERMONTCHANGES IN NET POSITION (continued)
LAST TEN YEARS(accrual basis of accounting)
(continued)
2016 2015 2014 2013 2012 2011 2010 2009 2008 2007
General RevenuesGovernmental Activities:
Property Taxes 31,409,270$ 33,054,429$ 29,494,623$ 28,272,251$ 27,884,131$ 28,488,306$ 27,523,255$ 25,649,929$ 24,870,758$ 24,620,306$ Gross Receipts Taxes 3,906,652 3,665,158 3,190,082 2,902,808 2,761,865 2,507,382 2,362,060 2,184,515 2,199,949 2,077,741 Local Option Sales Tax 2,239,937 2,179,587 2,125,034 2,126,646 2,157,170 1,998,462 1,937,967 1,885,141 2,158,372 1,785,068 Payments in Lieu of Taxes 5,079,036 2,395,762 2,257,824 3,534,236 3,392,592 2,116,319 1,093,798 970,324 1,681,879 1,682,472 Franchise Fees 2,376,990 2,128,227 2,193,447 2,157,022 2,176,076 2,047,748 2,874,784 2,727,631 1,938,684 1,906,418 Impact Fees 138,723 349,714 82,262 272,852 385,702 118,207 268,019 91,956 198,144 457,645 Interest and Penalties on Deliquent Ta 339,034 356,550 368,602 278,419 331,971 319,667 318,881 288,033 311,708 363,515 Unrestricted Investment Earnings 193,991 100,725 634,071 52,148 27,695 714,974 435,179 651,377 635,693 695,021 Other Revenues 642,968 1,175,521 1,048,832 296,973 - - 76,337 1,220 - -
Additions to permanent Funds 3,968 67,115 25,715 20,005 34,565 - 25,145 36,874 56,641 23,050 Special item - - (16,936,492) - (29,251,302) - - - - 1,800 Transfers - 28,921 (97,572) (97,500) (54,728) 4,626 2,930,921 2,609,579 2,630,420 2,066,217 Total Governmental Activities 46,330,569 45,501,709 24,386,428 39,815,860 9,845,737 38,315,691 39,846,346 37,096,579 36,682,248 35,679,253
Business-type Activities:Unrestricted Investment Earnings 184,630 127,214 291,397 269,758 271,471 391,421 607,153 571,356 1,698,032 2,497,135 Dividends from associated companies 3,236,147 3,128,753 2,907,831 2,619,286 - - - - - Other Revenues 273,598 429,794 (368,970) 370,226 185,004 177,868 1,972,526 1,460,158 212,795 425,468
Special item - - 16,936,492 - - 6,722,163 - - - - Transfers - (28,921) 97,572 97,500 54,728 (4,626) (2,930,921) (2,609,579) (2,618,968) (2,066,217) Total Business-type Activities 3,694,375 3,656,840 19,864,322 3,356,770 511,203 7,286,826 (351,242) (578,065) (708,141) 856,386
Total Primary Government 50,024,944 49,158,549 44,250,750 43,172,630 10,356,940 45,602,517 39,495,104 36,518,514 35,974,107 36,535,639
Change in Net PositionGovernmental Activities 13,890,157 6,082,152 (8,767,816) (2,219,915) (20,538,766) 2,863,294 7,893,159 5,062,823 1,239,407 6,071,921 Business-type Activities 13,675,573 11,576,578 25,460,908 12,700,532 9,038,596 38,255,409 12,513,347 (1,315,608) (2,889,198) 7,743,039
Total Change in Net Position 27,565,730$ 17,658,730$ 16,693,092$ 10,480,617$ (11,500,170)$ 41,118,703$ 20,406,506$ 3,747,215$ (1,649,791)$ 13,814,960$
Source: Each respective Annual Financial Report
(1) School District was reclassified to Discretly Presented Component Unit due to change in legal entity structure.
152

CITY OF BURLINGTON, VERMONTFUND BALANCES OF GOVERNMENTAL FUNDS
LAST TEN YEARS(modified accrual basis of accounting)
2016 2015(2) 2014 2013 2012 2011(1) 2010 2009 2008 2007
All Governmental FundsNonspendable 3,856,421$ 3,486,412$ 3,958,011$ 21,441,396$ 24,261,046$ 26,651,255$ -$ -$ -$ -$ Restricted 10,330,002 9,525,627 6,424,997 7,604,997 7,740,185 5,130,240 - - - - Committed 5,915,503 4,133,553 6,831,663 3,558,828 8,769,100 2,870,793 - - - - Assigned - - - 208,962 262,810 438,727 - - - - Unassigned 4,046,532 2,385,971 (2,997,049) (9,011,184) (20,338,070) (24,743,477) - - - - Reserved - - - - - - 4,820,275 6,278,556 3,586,543 4,871,057 Unreserved - - - - - - 1,155,138 (1,468,566) 1,008,781 1,064,893
Total All Other Governmental Funds 24,148,458$ 19,531,563$ 14,217,622$ 23,802,999$ 20,695,071$ 10,347,538$ 5,975,413$ 4,809,990$ 4,595,324$ 5,935,950$
General FundNonspendable 2,661,874$ 2,321,904$ 2,845,487$ 20,334,968$ 23,132,150$ 25,529,737$ -$ -$ -$ -$ Restricted 38,500 17,265 17,265 17,261 3,867,936 1,794,807 - - - - Committed 2,779,209 1,624,950 2,058,049 1,041,535 3,345,215 2,332,434 - - - - Assigned - - - 208,962 262,810 438,727 - - - - Unassigned 6,520,495 4,287,378 71,822 (2,178,623) (14,982,331) (16,790,895) - - - - Reserved - - - - - - 2,677,175 4,013,988 1,584,181 2,281,888 Unreserved - - - - - - 7,238,591 4,839,768 5,550,016 3,819,540
Total General Fund 12,000,078$ 8,251,497$ 4,992,623$ 19,424,103$ 15,625,780$ 13,304,810$ 9,915,766$ 8,853,756$ 7,134,197$ 6,101,428$
All Other Governmental FundsNonspendable 1,194,547$ 1,164,508$ 1,112,524$ 1,106,428$ 1,128,896$ 1,121,518$ -$ -$ -$ -$ Restricted 10,291,502 9,508,362 6,407,732 7,587,736 3,872,249 3,335,433 - - - - Committed 3,136,294 2,508,603 4,773,614 2,517,293 5,423,885 538,359 - - - - Assigned - - - - - - - - - - Unassigned (2,473,963) (1,901,407) (3,068,871) (6,832,561) (5,355,739) (7,952,582) - - - - Reserved - - - - - - 2,143,100 2,264,568 2,002,362 2,589,169 Unreserved - - - - - - (6,083,453) (6,308,334) (4,541,235) (2,754,647)
Total All Other Governmental Funds 12,148,380$ 11,280,066$ 9,224,999$ 4,378,896$ 5,069,291$ (2,957,272)$ (3,940,353)$ (4,043,766)$ (2,538,873)$ (165,478)$
Source: Each respective Annual Financial Report
(1) Components of fund balance were reclassified with the implementation of GASB Statement No. 54, Fund Balance Reporting and Governmental Fund Type Definitions .(2) School District was reclassified to Discretly Presented Component Unit due to change in legal entity structure.
153

CITY OF BURLINGTON, VERMONTCHANGES IN FUND BALANCES OF GOVERNMENTAL FUNDS
LAST TEN YEARS(modified accrual basis of accounting)
2016 2015(1) 2014 2013 2012 2011 2010 2009 2008 2007
RevenuesTaxes 39,097,706$ 38,770,459$ 35,721,358$ 33,509,448$ 33,409,559$ 32,937,202$ 31,969,583$ 29,760,367$ 29,482,074$ 28,767,501$ Payments in lieu of taxes 5,079,036 2,395,762 2,257,824 3,534,236 3,391,718 3,438,180 4,073,883 3,665,263 4,514,706 4,073,189 Licenses and permits 5,082,269 3,866,933 4,396,587 4,070,213 5,270,706 5,439,891 6,480,017 5,323,127 5,231,991 4,911,763 Intergovernmental 8,569,938 8,717,811 86,426,117 78,334,827 73,660,719 68,884,213 67,722,285 60,727,565 55,480,481 52,982,717 Charges for services 21,499,084 21,781,930 21,636,460 23,437,932 18,154,362 17,281,634 15,951,249 15,164,771 13,699,078 14,446,635 Contributions 538,878 - - - - - - - - - Investment income 193,993 100,725 634,070 52,148 675,834 955,816 418,298 638,530 630,227 701,580 Fines and forfeits - - - - 1,572,016 1,609,974 1,736,306 1,812,353 1,693,492 1,881,930 Loan repayments 104,033 122,544 245,074 46,741 4,873,509 74,160 233,006 280,222 1,236,092 472,396 Other revenue 601,849 1,230,412 1,160,440 415,290 5,536,858 4,654,385 3,568,399 2,650,227 2,128,834 2,066,703
Total Revenues 80,766,786 76,986,576 152,477,930 143,400,835 146,545,281 135,275,455 132,153,026 120,022,425 114,096,975 110,304,414
ExpendituresCurrent:
General government 11,400,333 11,158,205 13,643,302 13,704,648 13,339,250 12,958,447 10,064,841 9,487,847 8,783,755 7,989,597 Public safety 25,561,099 24,668,195 22,734,841 23,507,829 21,768,729 21,075,037 21,067,550 20,740,944 20,432,704 19,795,590 Education - - 76,037,906 81,284,025 70,399,945 66,139,968 60,669,307 56,147,563 51,980,275 47,895,773 Public works 9,788,601 9,455,450 8,378,414 6,533,226 8,994,691 8,302,028 8,700,816 8,575,237 8,168,098 7,770,644 Culture and Recreation 12,100,903 11,624,098 10,355,792 7,348,962 8,263,436 8,148,833 9,947,876 9,031,010 8,287,390 7,560,459 Community development 4,125,042 4,081,123 3,915,514 8,463,496 4,739,169 5,078,399 5,265,051 5,822,484 4,193,431 5,057,894
Capital Outlay 13,179,734 9,483,616 7,239,386 9,121,280 8,770,755 19,799,363 14,159,910 10,199,057 6,816,084 12,216,335 Debt Service:
Principal 4,117,610 3,373,102 4,950,428 4,729,974 3,976,551 3,766,324 4,285,797 4,374,613 6,502,172 4,438,505 Interest and bond issue costs 1,805,722 1,568,269 2,763,625 1,873,163 2,072,080 3,016,548 1,812,548 1,505,013 1,869,200 1,970,308
Total Expenditures 82,079,044 75,412,058 150,019,208 156,566,603 142,324,606 148,284,947 135,973,696 125,883,768 117,033,109 114,695,105
Excess (Deficiency) of Revenuesover Expenditures (1,312,258) 1,574,518 2,458,722 (13,165,768) 4,220,675 (13,009,492) (3,820,670) (5,861,343) (2,936,134) (4,390,691)
Other Financing Sources (Uses)Issuance of bonds and loans 5,062,083 5,934,807 3,989,967 14,250,000 3,560,000 12,361,991 5,014,085 6,142,128 1,793,374 6,388,585 Issuance of Refunding debt 8,785,000 - - - - - - - - - Issuance of leases - 683,718 - 261,242 1,621,586 - - - - - Payment to refunding escrow (10,044,139) - - - - - - - - - Sale of capital assets - - 1,000,000 - - - - - - 5,300 Bond premium 1,138,975 - - 419,080 - - 22,008 19,881 5,182 78,632 Ussiance of capital lease 987,234 - - - - - - - - - Issuance of notes - - - - 1,000,000 5,015,000 - - - 13,972 Transfers in 4,532,340 4,363,550 4,190,396 1,854,249 2,630,787 2,179,272 1,292,498 1,943,194 1,388,122 1,370,922 Transfers out (4,532,340) (4,334,629) (4,287,968) (1,951,749) (2,685,515) (2,174,646) (1,342,498) (2,029,194) (1,591,170) (1,695,422)
Total Other Financing Sources (Uses) 5,929,153 6,647,446 4,892,395 14,832,822 6,126,858 17,381,617 4,986,093 6,076,009 1,595,508 6,161,989
Special Item - - (16,936,492) - - - - - - -
Net Change in Fund Balances 4,616,895$ 8,221,964$ (9,585,375)$ 1,667,054$ 10,347,533$ 4,372,125$ 1,165,423$ 214,666$ (1,340,626)$ 1,771,298$
Debt Service as a Percentageof Noncapital Expenditures 8.60% 7.50% 5.40% 4.48% 4.53% 5.28% 5.01% 5.08% 7.60% 6.25%
Source: Each respective Annual Financial Report
(1) School District was reclassified to Discretly Presented Component Unit due to change in legal entity structure.
154

Fiscal Year Assessed ValueEstimated Actual
ValueTotal Direct
Tax Rate
2016 3,735,864,309$ 4,267,608,304$ 0.7926$ 2015 3,646,921,910 4,137,177,436 0.79582014 3,617,870,130 4,019,395,477 0.75842013 3,587,077,000 4,056,808,890 0.71532012 3,563,141,000 3,957,600,400 0.72802011 3,530,253,980 3,907,269,536 0.72002010 3,505,811,750 3,933,636,760 0.71202009 3,472,718,196 3,925,485,365 0.67002008 3,401,015,819 3,667,787,134 0.67002007 3,408,723,052 3,454,359,229 0.6700
Source: Most recent official statement
CITY OF BURLINGTON, VERMONTASSESSED VALUE AND ESTIMATED ACTUAL VALUE OF TAXABLE PROPERTY
LAST TEN FISCAL YEARS(amounts expressed in hundreds)
155

Fiscal YearCity of
Burlington Residential Nonresidential Residential Nonresidential
2016 0.7926$ 1.6544$ 1.7535$ 2.4470$ 2.5461$ 2015 0.7958 1.6358 1.7187 2.4316 2.51452014 0.7584 1.5257 1.6055 2.2841 2.36392013 0.7153 1.4302 1.5684 2.1455 2.28372012 0.7280 1.3019 1.5441 2.0299 2.27212011 0.7200 1.2820 1.5390 2.0020 2.25902010 0.7120 1.2394 1.5334 1.9514 2.24542009 0.6700 1.1090 1.4560 1.7790 2.12602008 0.6700 1.0217 1.3786 1.6917 2.04862007 0.6700 0.9920 1.3026 1.6620 1.9726
Notes:
Tax rates are per $100 of assessed value.
Source: Most recent Official Statement
State-wide Education Taxes Total TaxesAfter Act 68
CITY OF BURLINGTON, VERMONTPROPERTY TAX RATES
DIRECT AND OVERLAPPING GOVERNMENTSLAST TEN FISCAL YEARS
156

TaxpayerTaxable
Assessed Value Rank
Percentage of Total Assessed
ValueTaxable
Assessed Value Rank
Percentage of Total Assessed
value
Forfeith Burlington 29,120,000$ 1 0.78% 30,000,000$ 1 0.88%Diamondrock Burlington Owner LLC 25,933,400 2 0.69%UVM/Redstone Lofts LLC 24,820,000 3 0.66%Burlington Town Center LLC 20,837,900 4 0.56% 25,005,480 3 0.73%Burlington Harbor Hotel Group LLC 16,833,400 5 0.45%Burlington Electric Dept/CVPS 14,902,723 6 0.40% 17,883,268 4 0.52%Antonio B Pormeleau LLC 14,649,300 7 0.39% 17,579,160 5 0.52%Vermont Electric Power 13,197,200 8 0.35%May Department Stores Co 11,123,400 9 0.30% 13,348,080 6 0.39%New Northagate Housing LLC 11,089,000 10 0.30% 11,089,000 7 0.33%Howard Opera 10,801,560 8 0.32%Lake and College LLC 9,305,400 10 0.27%
182,506,323$ 4.89% 135,011,948$ 3.97%
Source: Most recent Official Statement
*Some data is not available at the time of publication.
2016 2007*
CITY OF BURLINGTON, VERMONTPRINCIPAL PROPERTY TAXPAYERS
CURRENT YEAR AND NINE YEARS AGO
157

CITY OF BURLINGTON, VERMONTPROPERTY TAX LEVIES AND COLLECTIONS
LAST TEN FISCAL YEARS
Fiscal Year Ended June 30
Total Tax Levy for Fiscal Year
Amount Collected
Percentage of Levy
Collections in Subsequent
YearsAmount
CollectedPercentage of
Levy
2016 93,015,324$ 92,467,139$ 99.41% -$ 92,467,139$ 99.41%2015 89,907,261 89,275,258 99.30% 444,509 89,719,767 99.79%2014 83,526,157 82,869,824 99.21% 523,857 83,393,681 99.84%2013 78,862,874 78,330,310 99.32% 8,000 78,338,310 99.33%2012 76,089,194 75,617,383 99.38% 351,274 75,968,657 99.84%2011 74,818,352 74,276,290 99.28% 482,664 74,758,954 99.92%2010 73,213,724 72,730,820 99.34% 491,548 73,222,368 100.01%2009 67,656,483 67,163,625 99.27% 579,945 67,743,570 100.13%2008 64,198,793 63,485,136 98.89% 1,189,522 64,674,658 100.74%2007 60,621,369 59,804,755 98.65% 487,278 60,292,033 99.46%
Source: Most recent Official Statement
Collected within the Fiscal Year of the Levy Total Collections to Date
158

CITY OF BURLINGTON, VERMONTRATIOS OF OUSTANDING DEBT BY TYPE
LAST TEN FISCAL YEARS
Fiscal Year
Bonds and Loans
Revenue Bonds Notes Capital Leases Bonds Revenue Bonds Notes Capital Leases
Total Debt Outstanding
Estimated Population (1)
Debt per Capita
Percentage of Personal Income (2)
2016 45,636,800$ - -$ 1,206,228$ 48,880,636$ 83,191,618$ 228,006$ 6,553,118$ 185,696,406$ 42,452 4,374$ 17.33%2015 46,423,144 - - 1,086,318 46,770,713 84,889,798 228,006 6,834,297 186,232,276 42,452 4,387$ 17.38%2014 63,903,739 - - 1,370,191 45,810,000 85,630,972 - 1,152,142 197,867,044 42,613 4,643$ 18.43%2013 63,358,572 - - 1,946,424 44,685,000 94,863,085 - 1,714,567 206,567,648 42,738 4,833$ 19.19%2012 51,756,866 - 1,000,000 2,749,589 42,725,908 93,863,525 2,000,000 2,320,054 196,415,942 42,637 4,607$ 18.29%2011 46,000,199 - 5,015,000 2,294,817 42,413,105 93,648,092 900,000 2,866,790 193,138,003 42,450 4,550$ 18.06%2010 36,447,374 - - 3,251,485 43,948,084 108,637,954 - 1,908,996 194,193,893 42,442 4,576$ 18.17%2009 32,680,809 - 4,000,000 2,289,762 49,820,834 96,125,000 1,000,000 33,878,667 219,795,072 42,417 5,182$ 20.57%2008 35,315,956 - - 1,887,100 29,907,220 105,440,000 13,340 33,774,149 206,337,765 42,417 4,865$ 19.31%2007 39,105,564 - - 2,806,290 29,798,954 114,315,000 39,860 22,034,599 208,100,267 42,417 4,906$ 19.48%
Source: Each respective Annual Financial Report
(1) United States Census Bureau(2) Personal Income is disclosed in Demographic and Economic Indicators Table
Governmental Activities* Business-type Activities*
159

CITY OF BURLINGTON, VERMONTRATIOS OF GENERAL BONDED DEBT OUTSTANDING
LAST TEN FISCAL YEARS
Fiscal Year Total Debt
Less: Debt Payable from
Enterprise Fund Revenues
Net General Obligation Debt Population (1) Debt per Capita Assessed Value
Ratio of Debt to Assessed Value
2016 185,696,406$ 138,853,378$ 46,843,028$ 42,452$ 1,103$ 3,735,864,309$ 1.25%2015 186,232,276 138,722,814 47,509,462 42,452 1,119 3,646,921,910 1.30%2014 197,867,044 132,593,114 65,273,930 42,613 1,532 3,617,870,130 1.80%2013 206,567,648 141,262,652 65,304,996 42,738 1,528 3,587,077,000 1.82%2012 196,415,942 140,909,487 55,506,455 42,637 1,302 3,563,141,000 1.56%2011 193,138,003 139,827,987 53,310,016 42,450 1,256 3,530,253,980 1.51%2010 194,193,893 154,495,034 39,698,859 42,442 935 3,505,811,750 1.13%2009 219,795,072 180,824,501 38,970,571 42,417 919 3,472,718,196 1.12%2008 206,337,765 169,134,709 37,203,056 42,417 877 3,401,015,819 1.09%2007 208,100,267 166,188,413 41,911,854 42,417 988 3,408,723,052 1.23%
Sources: Each respective Annual Financial Report and
(1) United States Census Bureau
160

CITY OF BURLINGTON, VERMONTDIRECT AND OVERLAPPING GOVERNMENTAL ACTIVITIES DEBT
JUNE 30, 2016
Jurisdiction
Net General Obligation Debt
Outstanding
Percentage Applicable to
the City
Amount Applicable to
the City of Burlington
Direct:City of Burlington 46,843,028$ 100.0% 46,843,028$
Overlapping:Burlington School District 29,025,876 100.0% 29,025,876
Total 75,868,904$ 75,868,904$
Source: June 30, 2016 Annual Financial Reports
161

CITY OF BURLINGTON, VERMONTLEGAL DEBT MARGIN INFORMATION
JUNE 30, 2016
Grand List Valuation 3,778,550,520$
Legal Debt Margin
Debt Limitation - Ten Times Last Grant List 377,855,052
Debt Applicable to Limitation 55,092,130
Legal Debt Margin 322,762,922$
Debt as Percentage of Debt Limit 14.58%
LEGAL DEBT MARGINPRECEDING NINE YEARS
Fiscal Year Debt LimitApplicable
Debt*Legal Debt
Margin
Debt as Percentage of
Debt Limit
2016 377,855,052$ 55,092,103$ 322,762,949$ 14.58%2015 373,586,431 55,092,130 318,494,301 14.75%2014 364,692,191 53,150,000 311,542,191 14.57%2013 361,787,013 51,505,000 310,282,013 14.24%2012 358,707,700 37,605,000 321,102,700 10.48%2011 356,314,100 30,753,333 325,560,767 8.63%2010 353,025,398 20,757,499 332,267,899 5.88%2009 350,581,175 15,897,809 334,683,366 4.53%2008 347,271,820 18,067,175 329,204,645 5.20%2007 340,101,582 18,762,305 321,339,277 5.52%
Source: Most recent Official Statement
162

Fiscal YearGross
Revenues*Operating Expenses*
Net Revenues (as defined)
PFC Revenues
Available for DS
Funds Available for
DS
25% PFC Revenue For DS coverage
Adjusted funds
Available for DS Debt Service
Debt Service Coverage
Adjusted Debt Service
Coverage
2016 16,677$ 12,376$ 4,301$ 1,087$ 5,388$ 272$ 5,660$ 3,386$ 1.59$ 1.67$ 2015 16,933 12,347 4,586 1,284 5,870 321 6,191 3,956 1.48 1.56 2014 16,382 12,508 3,874 1,291 5,165 323 5,488 3,402 1.52 1.61 2013 15,890 11,731 4,159 1,938 6,097 485 6,582 4,268 1.43 1.54 2012 15,080 11,259 3,821 1,939 5,760 485 6,245 4,195 1.37 1.49 2011 14,203 10,659 3,544 1,938 5,482 485 5,967 4,366 1.26 1.37 2010 12,431 9,586 2,845 1,939 4,784 485 5,269 4,269 1.12 1.23 2009 12,706 10,456 2,250 1,965 4,215 491 4,706 4,273 0.99 1.10 2008 12,021 9,029 2,992 1,965 4,957 491 5,448 4,275 1.16 1.27 2007 11,114 7,802 3,312 1,716 5,028 N/A N/A 4,275 1.31 N/A
*Using Operating Revenue / Expenses Only, as calculated in the Airport Audit
Source: Data from each respective Annual Financial Report.
CITY OF BURLINGTON, VERMONTAIRPORT ENTERPRISE FUND BOND COVERAGE
LAST TEN FISCAL YEARS(In Thousands)
163

CITY OF BURLINGTON, VERMONTDEMOGRAPHIC AND ECONOMIC INDICATORS
LAST TEN YEARS
Calendar Year Population (1, 2)
Per Capita Income (1, 2)* Personal Income
State-wide Per Capita Income (3)
State-wide Median Family
Income (1)
Burlington City (3)
State-wide (3)
Enrollment Grades 9-12 (2)
High School Graduation Rate (2)
2015 42,452 25,234$ 1,071,233,768$ -$ -$ 3.10% 3.60% 1,067 88%2014 42,613 25,188 1,073,336,244 - 54,447 3.20% 4.10% 1,070 96%2013 42,738 25,188 1,076,484,744 45,483 54,267 3.50% 4.40% 1,048 87%2012 42,637 25,188 1,073,940,756 44,545 54,168 3.80% 5.00% 1,048 83%2011 42,450 25,188 1,069,230,600 41,572 53,422 4.30% 5.50% 1,086 85%2010 42,442 25,188 1,069,029,096 40,134 51,841 5.00% 6.10% 1,160 86%2009 42,417 25,188 1,068,399,396 39,205 51,284 5.80% 6.90% 1,187 85%2008 42,417 25,188 1,068,399,396 36,185 51,704 4.20% 4.50% 1,172 93%2007 42,417 25,188 1,068,399,396 37,949 49,382 3.50% 4.00% 1,152 81%2006 42,417 25,188 1,068,399,396 35,142 - 3.40% 3.60% 1,162 84%
Sources:
(1) United States Census Bureau (2) Vermont Economic-Demographic Profile(3) Vermont Department of Labor, Economic & Labor Market Information
*Using MFRA Data
Unemployment Rate
164

CITY OF BURLINGTON, VERMONTPRINCIPAL EMPLOYERS
CURRENT YEAR AND NINE YEARS AGO
Employer Employees (1, 2) Rank
Percentage of Total City
Employment (3) Employees (2) Rank
Percentage of Total City
Employment (3)
University of Vermont Medical Center 5,383 1 4.30% 4,709 2 4.07%International Business Machines 4,000 2 3.20% 6,200 1 5.35%University of Vermont 3,446 3 2.76% 3,103 3 2.68%City of Burlington/Burlington School District 1,612 4 1.29% 2,650 4 2.29%People's United Bank 1,000 5 0.80% 1,208 5 1.04%Howard Center for Human Services 998 6 0.80% 727 9 0.63%Adecco Staffing 775 7 0.62% Less than 400 0.00%Ben & Jerry's Homemade 735 8 0.59% 735 8 0.63%GE Healthcare 700 9 0.56% 752 7 0.65%Dealer. Com 675 10 0.54% Less than 400 0.00%Verizon Communication 0.00% 800 6 0.69%
19,324 15.45% 20,884 18.03%
Sources:
(1) Chittenden County(2) Vermont Business Magazine, Vermont Business Directory(3) Vermont Department of Labor*Some data is not available at the time of publication.
Calendar Year 2015 Calendar Year 2006
165

CITY OF BURLINGTON, VERMONTFULL-TIME EQUIVALENT EMPLOYEES BY FUNCTION/PROGRAM
LAST TEN YEARS
Function/Program 2016 2015 2014 2013 2012 2011 2010 2009 2008 2007
General Government: Mayor's Office 4.00 4.00 4.00 4.00 3.00 3.00 3.00 3.00 3.00 3.00
Clerk/Treasurer's Office 26.51 21.00 19.00 20.00 20.00 20.60 19.60 20.10 20.50 20.50 Payroll 4.00 4.00 3.00 3.00 4.00 4.00 4.00 4.00 4.00 4.00 Central Computer 4.00 6.00 3.00 3.00 3.20 4.00 3.00 2.50 2.00 2.00 City Attorney's Office 8.00 8.00 7.00 7.00 7.50 7.50 7.50 6.00 5.90 4.90 Human Resources 6.00 5.50 5.50 5.50 6.00 5.00 5.00 6.00 5.00 5.00 City Assessor 3.00 3.00 3.00 3.00 3.00 3.00 3.00 3.00 3.00 3.00 Planning and Zoning 8.00 8.00 8.00 8.00 8.00 8.00 8.00 8.00 8.00 8.00
Public Safety:Fire 80.80 79.80 79.80 79.80 79.80 79.80 79.80 79.80 79.00 79.00Police 139.20 136.20 137.20 137.20 138.20 137.20 137.70 134.20 135.30 140.00DPW Inspection 5.00 4.00 4.00 4.00 3.00 3.00 3.00 3.00 3.00 3.00Code Enforcement 12.00 12.00 11.00 11.00 11.00 11.00 11.00 11.00 11.00 11.00
Public Works:Highways 43.45 42.90 42.90 43.60 42.60 41.60 41.60 38.60 38.60 38.50Public Works Administration 4.00 4.00 6.00 6.00 6.00 6.00 6.00 6.00 5.00 5.00
Culture and Recreation 85.00 81.80 78.80 75.48 71.25 71.72 67.20 67.80 66.00 66.00
General Fund Total 432.96 420.20 412.20 410.58 406.55 405.42 399.40 393.00 389.30 392.90
Community Development*
Burlington Electric 131.90 125.00 128.00 125.00 123.00 125.00 125.00 126.00 125.00 126.00
Burlington Telecom 26.00 25.00 21.00 24.50 22.00 30.68 33.00 32.50 30.50 15.00
Burlington International Airport* 39.00 42.00 41.00
Water*
Stormwater*
Wastewater*
Total Employees 1058.82 1028.40 1010.40 966.66 955.10 963.52 953.80 941.50 931.10 923.80
*Data is not available at the time of publication.
Full-time Equivalent Employees
166

CITY OF BURLINGTON, VERMONTOPERATING INDICATORS BY FUNCTION/PROGRAM
LAST TEN YEARS
Function/Program 2016 2015 2014 2013 2012 2011 2010 2009 2008 2007
General Government:Full-time equivalent positions filled 432.96 420.20 412.20 410.58 406.55 405.42 399.40 393.00 389.30 392.90 Tax bills mailed 10,714 10,737 10,685 10,633 11,106 11,112 11,094 11,116 11,080 10,978 Active recreation programs 285 Recreation participants 4,762 Birth certificatesrecorded 2,177 2,252 2,257 2,207 2,254 2,164 2,204 2,184 2,276 2,234 Marriage licenses recorded 229 401 599 366 362 449 462 346 354 336 Death certificates recorded 489 1,045 965 1,036 931 970 963 961 945 952 Dog licenses issued 1,175 1,256 1,191 1,234 1,248 1,307 1,367 1,446 1,501 1,485
Public Safety:Total cases 28,608 28,243 31,182 31,353 29,978 32,146 33,141 35,040 36,654 37,976 Number of traffic tickets 1,990 1,938 1,793 1,895 1,616 1,949 2,658 2,431 1,797 2,122 Number of traffic warnings 3,507 4,822 4,432 4,524 3,996 3,793 4,220 3,758 2,162 1,936 Fire incident responses 7,305 7,338 7,326 7,241 7,160 6,819 5,633 6,157 5,942 5,816
Water System:Average daily consumption (gallons) 3,753,328 3,976,008 3,649,433 3,953,940 4,242,691 4,228,153 4,292,238 4,163,753 4,269,552 4,432,978
Wastewater System:Average daily treatment (gallons) 4,917,000 5,132,000 5,692,000 5,677,000 5,736,000 7,132,000 5,884,000 5,932,000 6,127,000 6,362,000 Sludge disposed (tons) 8,633 8,583 8,402 8,287 8,322 8,873 9,809 9,058 9,250 9,661
Burlington International Airport Enplanements 595,244 600,402 617,301 605,505 652,793 643,683 677,468 743,248 725,843 697,932
Burlington Electric Department Sales to Customers - KWHs 338.2 336.2 342.8 341.4 342.5 348.6 343.9 355.6 361.4 359.0
Fiscal Year
167

CITY OF BURLINGTON, VERMONTCAPITAL ASSET STATISTICS BY FUNCTION/PROGRAM
LAST TEN YEARS
Function/Program 2016 2015 2014 2013 2012 2011 2010 2009 2008 2007
General Government:Number of general government buildings 3 3 3 3 3 3 3 3 3 3
Public Safety:Number of police stations 1 1 1 1 1 1 1 1 1 1Number of police vehicles 45 45 44 44 42 42 42 42 42 42Number of fire stations 5 5 5 5 5 5 5 5 5 5Number of fire vehicles 28 27 26 26 26 26 26 26 26 26
Public Works:Number of public works buildings 2 2 2 2 2 2 2 2 2 2Miles of streets 95 95 95 95 95 95 95 95 95 95Miles of sidewalks 130 127 127 127 127 127 127 127 127 127
Culture and Recreation:Number of culture and recreation facilities 6 5 5 5 5 5 5 5 5 5Acres of parks 540 540 540 540 540 540 540 540 540 540
Water:Number of water treatment facilities 3 3 3 3 3 3 3 3 3 3Miles of water mains 110 110 110 110 110 110 110 110 110 110
Wastewater:Number of wastewater facilities 3 3 3 3 3 3 3 3 3 3Miles of sanitary sewers 89 89 89 89 89 89 89 89 89 89
Burlington International Airport: Number of facilities 23 23 23 23 23 23 23 23 23 23
Burlington Electric Department: Number of facilities 12 12 12 12 12 12 12 12 12 12
Fiscal Year
168


![Consolidated Financial Results for the Fiscal Year Ended ...Note: Comprehensive income Fiscal year ended March 31, 2019: ¥1,761 million [24.3%] Fiscal year ended March 31, 2018: ¥1,417](https://static.fdocuments.in/doc/165x107/5fe4d06806b4775830253106/consolidated-financial-results-for-the-fiscal-year-ended-note-comprehensive.jpg)
