COMPREHENSIVE ANNUAL FINANCIAL REPORT Finance Department is pleased to present the Comprehensive...
137
COMPREHENSIVE ANNUAL FINANCIAL REPORT of the TOWN OF FAIRFIELD, CONNECTICUT YEAR ENDED JUNE 30, 2015 PREPARED BY: FINANCE DEPARTMENT CAITLIN T. BOSSE CONTROLLER ROBERT MAYER, CPA FISCAL OFFICER
-
Upload
phungthien -
Category
Documents
-
view
225 -
download
0
Transcript of COMPREHENSIVE ANNUAL FINANCIAL REPORT Finance Department is pleased to present the Comprehensive...

COMPREHENSIVE
ANNUAL FINANCIAL REPORT
of the
TOWN OF FAIRFIELD,
CONNECTICUT
YEAR ENDED
JUNE 30, 2015
PREPARED BY: FINANCE DEPARTMENT
CAITLIN T. BOSSE CONTROLLER
ROBERT MAYER, CPA FISCAL OFFICER

TOWN OF FAIRFIELD. CONNECTICUT
COMPREHENSIVE ANNUAL FINANCIAL REPORT YEAR ENDED JUNE 30, 2015
TABLE OF CONTENTS
INTRODUCTORY SECTION
TRANSMITTAL LETTER................................................................................................................ 1-4
ORGANIZATION CHART............................................................................................................... 5
PRINCIPAL OFFICIALS.................................................................................................................. 6
CERTIFICATE OF ACHIEVEMENT FOR EXCELLENCE IN FINANCIAL REPORTING FOR THE YEAR ENDED JUNE 30, 2014.................................................................................... 7
FINANCIAL SECTION
INDEPENDENT AUDITOR'S REPORT................................................................................ 8-10
MANAGEMENT'S DISCUSSION AND ANALYSIS.............................................................. 11-18
BASIC FINANCIAL STATEMENTS
GOVERNMENT-WIDE FINANCIAL STATEMENTS:
EXHIBITS
A STATEMENT OF NET POSITION........................................................................................ 19-20
B STATEMENT OF ACTIVITIES............................................................................................. 21
FUND FINANCIAL STATEMENTS:
C BALANCE SHEET- GOVERNMENTAL FUNDS AND RECONCILIATION OF FUND BALANCE TO NET POSITION OF GOVERNMENTAL ACTIVITIES................... 22-23
D STATEMENT OF REVENUES, EXPENDITURES AND CHANGES IN FUND BALANCES- GOVERNMENTAL FUNDS............................................................. 24
E RECONCILIATION OF THE STATEMENT OF REVENUES, EXPENDITURES AND CHANGES IN FUND BALANCES OF GOVERNMENTAL FUNDS TO STATEMENT OF ACTIVITIES......................................................................................... 25-26
F STATEMENT OF REVENUES, EXPENDITURES AND CHANGES IN FUND BALANCE-BUDGET AND ACTUAL- GENERAL FUND ............ .... .. .... .... .... .......... ...... .... .. .. .. ........... 27
G STATEMENT OF NET POSITION- PROPRIETARY FUNDS............................................. 28
H STATEMENT OF REVENUES, EXPENSES AND CHANGES IN FUND NET POSITION-PROPRIETARY FUNDS.................................................................................................. 29
STATEMENT OF CASH FLOWS- PROPRIETARY FUNDS.............................................. 30
J STATEMENT OF FIDUCIARY NET POSITION................................................................... 31
K STATEMENT OF CHANGES IN FIDUCIARY NET POSITION............................................ 32
TOWN OF FAIRFIELD, CONNECTICUT TABLE OF CONTENTS (CONTINUED)
NOTES TO FINANCIAL STATEMENTS
L NOTES TO FINANCIAL STATEMENTS.............................................................................. 33-79
REQUIRED SUPPLEMENTARY INFORMATION
RSI-1A SCHEDULE OF CHANGES IN NET PENSION LIABILITY-TOWN OF FAIRFIELD EMPLOYEES' RETIREMENT PLAN.......................................... 80
RSI-1B SCHEDULE OF CHANGES IN NET PENSION LIABILITY-TOWN OF FAIRFIELD POLICE AND FIREMEN'S RETIREMENT PLAN....................... 81
RSI-2A SCHEDULE OF NET PENSION LIABILITY AND SCHEDULE OF INVESTMENT RETURNS- TOWN OF FAIRFIELD EMPLOYEES' RETIREMENT PLAN...................... 82
RSI-2B SCHEDULE OF NET PENSION LIABILITY AND SCHEDULE OF INVESTMENT RETURNS- TOWN OF FAIRFIELD POLICE AND FIREMEN'S RETIREMENT PLAN... 83
RSI-3A SCHEDULE OF CONTRIBUTIONS -TOWN OF FAIRFIELD EMPLOYEES' RETIREMENT PLAN.......................................... 84
RSI-3B SCHEDULE OF CONTRIBUTIONS -TOWN OF FAIRFIELD POLICE AND FIREMEN'S RETIREMENT PLAN....................... 85
RSI-4A NOTES TO REQUIRED SUPPLEMENTARY INFORMATION-TOWN OF FAIRFIELD EMPLOYEES' RETIREMENT PLAN .......... ........................ .... .. .. 86
RSI-4B NOTES TO REQUIRED SUPPLEMENTARY INFORMATION-TOWN OF FAIRFIELD POLICE AND FIREMEN'S RETIREMENT PLAN....................... 87
TOWN OF FAIRFIELD OTHER POST-EMPLOYMENT BENEFIT PLANS
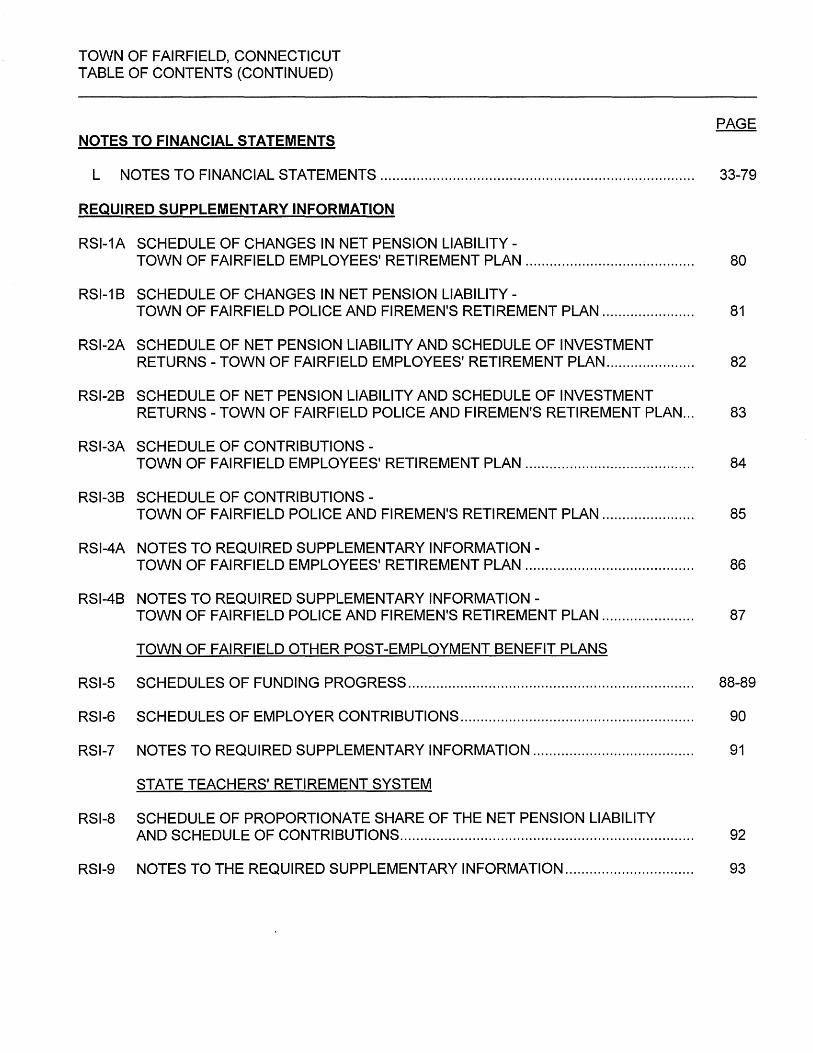
RSI-5 SCHEDULES OF FUNDING PROGRESS....................................................................... 88-89
RSI-6 SCHEDULES OF EMPLOYER CONTRIBUTIONS.......................................................... 90
RSI-7 NOTES TO REQUIRED SUPPLEMENTARY INFORMATION........................................ 91
STATE TEACHERS' RETIREMENT SYSTEM
RSI-8 SCHEDULE OF PROPORTIONATE SHARE OF THE NET PENSION LIABILITY AND SCHEDULE OF CONTRIBUTIONS......................................................................... 92
RSI-9 NOTES TO THE REQUIRED SUPPLEMENTARY INFORMATION................................ 93

TOWN OF FAIRFIELD, CONNECTICUT TABLE OF CONTENTS (CONTINUED)
SCHEDULES
SUPPLEMENTAL SCHEDULES
GENERAL FUND:
1 COMPARATIVE BALANCE SHEET..................................................................................... 94
2 SCHEDULE OF REVENUES AND OTHER FINANCING SOURCES-BUDGET AND ACTUAL................................................................................................... 95
3 SCHEDULE OF EXPENDITURES AND OTHER FINANCING USES-BUDGET AND ACTUAL................................................................................................... 96-97
4 SCHEDULE OF EXPENDITURES- BOARD OF EDUCATION- BUDGET AND ACTUAL. 98
5 REPORT OFT AX COLLECTOR.......................................................................................... 99
NONMAJOR GOVERNMENTAL FUNDS:
6 COMBINING BALANCE SHEET ......................................................................................... 100-102
7 COMBINING STATEMENT OF REVENUES, EXPENDITURES AND CHANGES IN FUND BALANCES.................................................................................... 103-105
8 SCHEDULE OF REVENUES, EXPENDITURES AND CHANGES IN FUND BALANCE-BUDGET AND ACTUAL- WATER POLLUTION CONTROL AUTHORITY.................... 106
FIDUCIARY FUNDS:
9 AGENCY FUND- STUDENT ACTIVITY FUND- STATEMENT OF CHANGES IN ASSETS AND LIABILITY............................................................................................. 107
TOWN OF FAIRFIELD, CONNECTICUT TABLE OF CONTENTS (CONTINUED)
TABLE
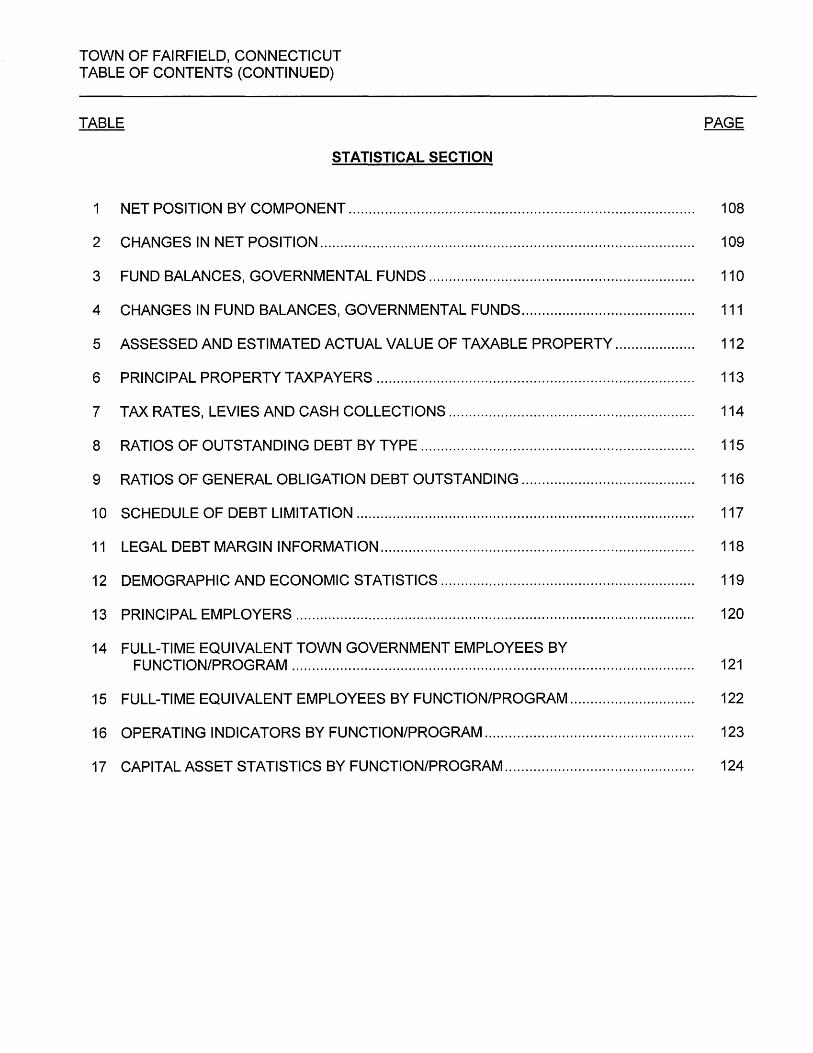
STATISTICAL SECTION
1 NET POSITION BY COMPONENT...................................................................................... 1 08
2 CHANGES IN NET POSITION............................................................................................. 109
3 FUND BALANCES, GOVERNMENTAL FUNDS.................................................................. 110
4 CHANGES IN FUND BALANCES, GOVERNMENTAL FUNDS........................................... 111
5 ASSESSED AND ESTIMATED ACTUAL VALUE OF TAXABLE PROPERTY.................... 112
6 PRINCIPAL PROPERTY TAXPAYERS............................................................................... 113
7 TAX RATES, LEVIES AND CASH COLLECTIONS............................................................. 114
8 RATIOS OF OUTSTANDING DEBT BY TYPE.................................................................... 115
9 RATIOS OF GENERAL OBLIGATION DEBT OUTSTANDING........................................... 116
10 SCHEDULE OF DEBT LIMITATION.................................................................................... 117
11 LEGAL DEBT MARGIN INFORMATION.............................................................................. 118
12 DEMOGRAPHIC AND ECONOMIC STATISTICS . . . . . . . . . . . . . . . . . . . . . . . . . . . . . . . . . . . . . . . . . . . . . . . . . . . . . . . . . . . . . . . 119
13 PRINCIPAL EMPLOYERS................................................................................................... 120
14 FULL-TIME EQUIVALENT TOWN GOVERNMENT EMPLOYEES BY FUNCTION/PROGRAM.................................................................................................... 121
15 FULL-TIME EQUIVALENT EMPLOYEES BY FUNCTION/PROGRAM............................... 122
16 OPERATING INDICATORS BY FUNCTION/PROGRAM.................................................... 123
17 CAPITAL ASSET STATISTICS BY FUNCTION/PROGRAM............................................... 124

Introductory Section

Sullivan Independence Hall Finance Department
December 16, 2015
\lroltln of jf airfielb 725 Old Post Road
Fairfield, Connecticut 06824 Phone (203) 256-3065
Fax (203) 255-7380
To the Honorable First Selectman, Members of the Board of Selectmen, Members of the Board of Finance and Citizens of the Town of Fairfield, Connecticut.
The Finance Department is pleased to present the Comprehensive Annual Financial Report (CAFR) of the Town of Fairfield for the year ended June 30, 2015. The report includes the independent auditor's report as required by Connecticut Statutes. The report is prepared in conformity with generally accepted accounting principles (GAAP) and standards set forth by the Governmental Accounting Standards Board (GASB).
Responsibility for both the accuracy of the data, and the completeness and fairness of the presentation, including all disclosures, rests with the management of the Town. Management of the Town is responsible for establishing and maintaining internal controls designed to ensure that the assets of the Town are protected from loss, theft or misuse and to ensure that adequate accounting data are compiled to allow for the preparation of financial statements in conformity with generally accepted accounting principles. The internal controls are designed to provide reasonable, but not absolute, assurance that these objectives are met. The concept of reasonable assurance recognizes that: (1) the cost of a control should not exceed the benefits likely to be derived; and (2) the calculation of costs and benefits requires estimates and judgments by management. To the best of our knowledge and belief, the enclosed data are accurate in all material respects and are reported in a manner that presents fairly the financial position and results of operations as measured by the financial activity of its various funds. All disclosures necessary to enable the reader to gain an understanding of the Town's financial activities have been included.
CohnReznick LLP, a public accounting firm fully licensed and qualified to perform audits of municipalities within the State of Connecticut, has audited the financial statements. The goal of the independent audit was to provide reasonable assurance that the financial statements of the Town of Fairfield, Connecticut for the fiscal year ended June 30, 2015, are free from material misstatement. The independent audit involved examining, on a test basis, evidence supporting the amounts and disclosures in the financial statements; assessing the accounting principles used and significant estimates made by management; and evaluating the overall financial statement presentation. The independent auditor concluded, based upon the audit, that there was a reasonable basis for rendering an unmodified opinion that the Town of Fairfield's financial statements for the fiscal year ended June 30, 2015, are fairly presented in conformity with GAAP. The independent auditor's report is presented as the first component of the financial section of this report.
The independent audit of the financial statements of the Town was part of a broader, federal and state mandated "Single Audit" designed to meet the special needs of grantor agencies. The standards governing Single Audit engagements require the independent auditor to report not only on the fair presentation of the financial statements, but also on the audited government's internal controls and compliance with legal requirements, with special emphasis on internal controls and legal requirements involving the administration of federal awards. These reports are available in the Town's separately issued Single Audit Report.
1

Generally accepted accounting principles (GAAP) require that management provide a narrative introduction, overview, and analysis to accompany the basic financial statements in the form of Management's Discussion and Analysis (MD&A). This letter of transmittal is designed to complement MD&A and should be read in conjunction with it. The Town's MD&A can be found immediately following the independent auditor's report.
Profile of the Town of Fairfield
The Town of Fairfield covers approximately 31.3 square miles and is located on Long Island Sound immediately west of the City of Bridgeport. Fairfield is bordered by Westport, Weston, Easton, Trumbull and Bridgeport. Fairfield is primarily a residential community; however, there is significant commercial development scattered throughout the Town. The Town is serviced by the Connecticut Turnpike (1-95), the Merritt Parkway (Conn. 15) and the Metro North commuter railroad. Fairfield is the home to the world headquarters of General Electric Corporation and also the home of both Fairfield University and Sacred Heart University. The 2015 population was 60,126. The Town was originally settled in 1639.
The Town operates under a Charter most recently revised in 2006. The Town functions under a Board of Selectmen, Representative Town Meeting (RTM) form of government, adopted in 1947. The RTM is the final budget-making authority and the legislative body of the Town. The RTM consists of 40 members, elected for 2 year terms from 1 0 voting districts. The Board of Selectmen consists of 3 members, chaired by the First Selectman and is elected every 4 years. The First Selectman serves as the Chief Elected Official of the Town. The Board of Finance consists of 9 members, elected for 6 year terms on a staggered basis. The financial administrator of the Town is the Fiscal Officer. The Fiscal Officer oversees the Accounting, Internal Audit and Budget functions along with the Purchasing Department, the Assessor's Office and the Tax Collector's office. The Accounting Office is administered by the Controller and accounts for all Town funds. The Assessor's Office develops the list of property and related assessments for all real estate, personal property and motor vehicles for the purpose of taxation. The Tax Collector's Office bills, collects, processes and deposits taxes, interest and fees on all taxable property in the Town. The Controller is responsible for maintaining the financial records of the Town and for the financial reporting of the Town's activities and operations.
The annual budget serves as the foundation for the Town's financial planning and control. The Town maintains budgetary controls with the objectives to ensure compliance with legal provisions embodied in the annual appropriated budget, approved by the budget referendum. The Town maintains an encumbrance accounting system as one technique of accomplishing budgetary controls. As demonstrated by the budgetary schedules included in the financial section of this report, the Town continues to meet its responsibility for sound financial management. In addition to budgetary schedules, Exhibit L (II) A in the Notes to Financial Statements describes the budget process used by the Town.
Local Economy and Major Initiatives
The Town was impacted by the economic downturn that started in 2008 and both Storms Nemo and Sandy in 2012. Fairfield, however, has been fortunate that the Town's unemployment and foreclosure rates have been below regional, state and national levels. Vacancy levels for both retail and office space has also been and are below regional, state and national levels.
The Town's third train station (Fairfield Metro) was officially opened on December 5, 2011. The development of the 930,000 square foot private commercial space associated with the train station has not progressed. The site is being actively marketed to prospective tenants.
2
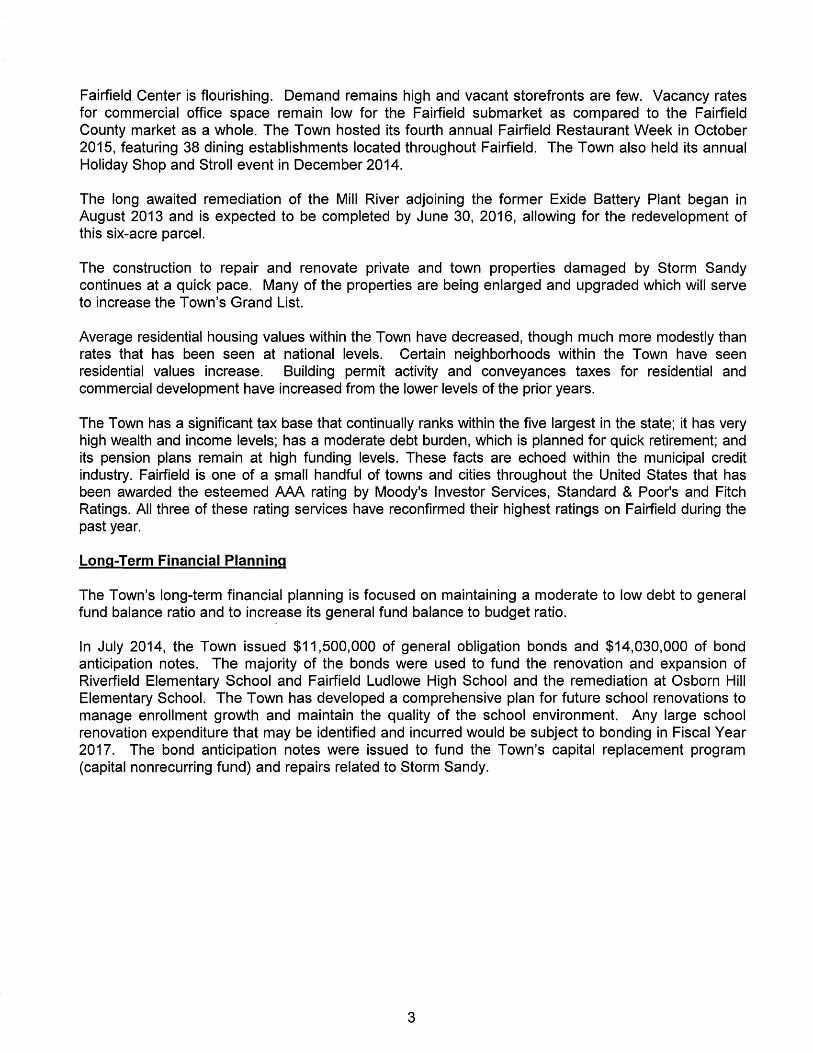
Fairfield Center is flourishing. Demand remains high and vacant storefronts are few. Vacancy rates for commercial office space remain low for the Fairfield submarket as compared to the Fairfield County market as a whole. The Town hosted its fourth annual Fairfield Restaurant Week in October 2015, featuring 38 dining establishments located throughout Fairfield. The Town also held its annual Holiday Shop and Stroll event in December 2014.
The long awaited remediation of the Mill River adjoining the former Exide Battery Plant began in August 2013 and is expected to be completed by June 30, 2016, allowing for the redevelopment of this six-acre parcel.
The construction to repair and renovate private and town properties damaged by Storm Sandy continues at a quick pace. Many of the properties are being enlarged and upgraded which will serve to increase the Town's Grand List.
Average residential housing values within the Town have decreased, though much more modestly than rates that has been seen at national levels. Certain neighborhoods within the Town have seen residential values increase. Building permit activity and conveyances taxes for residential and commercial development have increased from the lower levels of the prior years.
The Town has a significant tax base that continually ranks within the five largest in the state; it has very high wealth and income levels; has a moderate debt burden, which is planned for quick retirement; and its pension plans remain at high funding levels. These facts are echoed within the municipal credit industry. Fairfield is one of a small handful of towns and cities throughout the United States that has been awarded the esteemed AAA rating by Moody's Investor Services, Standard & Poor's and Fitch Ratings. All three of these rating services have reconfirmed their highest ratings on Fairfield during the past year.
Long-Term Financial Planning
The Town's long-term financial planning is focused on maintaining a moderate to low debt to general fund balance ratio and to increase its general fund balance to budget ratio.
In July 2014, the Town issued $11,500,000 of general obligation bonds and $14,030,000 of bond anticipation notes. The majority of the bonds were used to fund the renovation and expansion of Riverfield Elementary School and Fairfield Ludlowe High School and the remediation at Osborn Hill Elementary School. The Town has developed a comprehensive plan for future school renovations to manage enrollment growth and maintain the quality of the school environment. Any large school renovation expenditure that may be identified and incurred would be subject to bonding in Fiscal Year 2017. The bond anticipation notes were issued to fund the Town's capital replacement program (capital nonrecurring fund) and repairs related to Storm Sandy.
3

Relevant Financial Policies
The Town's financial policies have been applied consistently with the prior year and had no notable current year effect on the financial statements. There were no developments at the State level that impacted the current year financial statements.
The Town did approve a formal fund balance policy that set the minimum fund balance at least 7.25% for the current fiscal year, to be increased in subsequent years up to 11.00%.
Awards and Acknowledgements
The Government Finance Officers Association (GFOA) awarded a Certificate of Achievement for Excellence in Financial Reporting to the Town for its comprehensive annual financial report (CAFR) for the fiscal year ended June 30, 2014. This was the thirteenth consecutive year that the Town has achieved this prestigious award. In order to be awarded a Certificate of Achievement, the Town published an easily readable and efficiently organized comprehensive annual financial report. This report satisfied both generally accepted accounting principles and applicable legal requirements.
A Certificate of Achievement is valid for a period of one year only. We believe that our current comprehensive annual financial report continues to meet the Certificate of Achievement Program's requirements, and we are submitting it to the GFOA to determine its eligibility for another certificate.
Additionally, Fitch Rating Services, in their bond rating report for the Town's General Obligation Bond Offering of July 2015 noted that the Town's sound operating results are the result of its strong financial management, prudent fiscal policies and conservative budgeting practices.
The preparation of this report would not have been possible without the efficient and dedicated services of the entire staff of the Finance Department. Each member has my sincere appreciation for their contributions made in the preparation of this report. In particular, Caitlin T. Bosse, Controller, who continues to provide exceptional service at the highest level of professionalism.
This comprehensive annual financial report reflects a commitment to the citizens of Fairfield, the Board of Finance, the Board of Selectmen, and the RTM, and all concerned readers of this report, to provide information in conformance with the highest standards of financial accountability.
Respectfully submitted,
!""') !l ;1 ~"'") l.~ / . l) / t I ~~ . /f11 lf;·tii , s i? v·t.---~~~~~· ' I • II/, d""" L~~~ f} , b'l ~i.-t:...,.,i-,!l···u t L.v-t;'-\-"~ vr . \, I
Robert Mayer, CPA Fiscal Officer
4

01
TOWN OF FAIRFIELp CONNECTICUT
ORGANIZATION CHART

TOWN OF FAIRFIELD. CONNECTICUT
PRINCIPAL OFFICIALS JUNE 30, 2015
BOARD OF SELECTMEN
Michael C. Tetreau, First Selectman Kevin P. Kiley
Sheila H. Marmion
BOARD OF FINANCE
Thomas M. Flynn, Chairman James B. Brown, Vice Chairman
Mary E. LeClerc, Secretary Tara Cook-Littman
John Mitola Christopher W. Dewitt
David Becker Robert S. Stone James Walsh
ADMINISTRATION
Town Clerk ....................................................................................... Elizabeth P. Browne Town Attorney ....................................................................................... Stanton H. Lesser Fiscal Officer ................................................................................................ Robert Mayer Public Works Director ...................................................................... Joseph Michelangelo Police Chief ........................................................................................... Gary MacNamara Fire Chief ............................................................................................... Richard S. Feiner Director of Human Resources ......................................................... Mary Carroll -Mirylees Health Director ............................................................................................. Sands Cleary Town Librarian ........................................................................................ Karen B. Ronald Planning Director .......................................................................... Joseph Devonshuk, Jr. Conservation Director ..................................................................................... Brian Carey Assessor ....................................................................................................... Donald Ross Tax Collector ............................................................................................... Cinda Buchter Controller ................................................................................................. Caitlin T. Bosse Recreation Director ........................................................................... Gerald A. Lombardo Purchasing Director ...................................................................................... Twig Holland Building Inspector .................................................................................... Thomas Conley
BOARD OF EDUCATION
Philip Dwyer, Chairman John Convertito, Vice Chairman
Jessica Gerber, Secretary Donna Karnal Paul Fattibene
Eileen Liu-McCormack Jennifer Maxon Kennelly
John Llewellyn Marc Patten
David Title, Superintendent of Schools
6
Government Finance Officers Association
Certificate of Achievement
for Excellence in Financial Reporting
Presented to
Town of Fairfield
Connecticut
For its Comprehensive Annual Financial Report
for the Fiscal Year Ended
June 30, 2014
Executive Director/CEO
7

Financial Section

COHN~REZNICK ACCOUNTING • TAX • ADV ISORY
INDEPENDENT AUDITOR'S REPORT
Board of Finance Town of Fairfield, Connecticut
Report on the Financial Statements
CohnRezn ick LLP
cohnreznick.com
We have audited the accompanying financial statements of the governmental activities, each major fund and the aggregate remaining fund information of the Town of Fairfield, Connecticut, as of and for the year ended June 30, 2015, and the related notes to the financial statements, which collectively comprise the Town's basic financial statements as listed in the table of contents.
Management's Responsibility for the Financial Statements
Management is responsible for the preparation and fair presentation of · these financial statements in accordance with accounting principles generally accepted in the United States of America; this includes the design, implementation and maintenance of internal control relevant to the preparation and fair presentation of financial statements that are free from material misstatement, whether due to fraud or error.
Auditor's Responsibility
Our responsibility is to express optntons on these financial statements based on our audit. We conducted our audit in accordance with auditing standards generally accepted in the United States of America and the standards applicable to financial audits contained in Government Auditing Standards, issued by the Comptroller General of the United States. Those standards require that we plan and perform the audit to obtain reasonable assurance about whether the financial statements are free from material misstatement.
An audit involves performing procedures to obtain audit evidence about the amounts and disclosures in the financial statements. The procedures selected depend on the auditor's judgment, including the assessment of the risks of material misstatement of the financial statements, whether due to fraud or error. In making those risk assessments, the auditor considers internal control relevant to the entity's preparation and fair presentation of the financial statements in order to design audit procedures that are appropriate in the circumstances, but not for the purpose of expressing an opinion on the effectiveness of the entity's internal control. Accordingly, we express no such opinion. An audit also includes evaluating the appropriateness of accounting policies used and the reasonableness of significant accounting estimates made by management, as well as evaluating the overall presentation of the financial statements.
We believe that the audit evidence we have obtained is sufficient and appropriate to provide a basis for our audit opinions.
8

Opinions
In our opinion, the financial statements referred to above present fairly, in all material respects, the respective financial position of the governmental activities, each major fund and the aggregate remaining fund information of the Town of Fairfield, Connecticut, as of June 30, 2015, and the respective changes in financial position, and, where applicable, cash flows thereof and the respective budgetary comparison for the general fund for the year then ended in accordance with accounting principles generally accepted in the United States of America.
Other Matters
Required Supplementary Information
Accounting principles generally accepted in the United States of America require that the management's discussion and analysis and the pension and other post-employment benefit schedules on pages 11 to 18 and pages 80 to 93, respectively, be presented to supplement the basic financial statements. Such information, although not a part of the basic financial statements, is required by the Governmental Accounting Standards Board, who considers it to be an essential part of financial reporting for placing the basic financial statements in an appropriate operational, economic or historical cont~xt. We have applied certain limited procedures to the required supplementary information in accordance with auditing standards generally accepted in the United States of America, which consisted of inquiries of management about the methods of preparing the information and comparing the information for consistency with management's responses to our inquiries, the basic financial statements and other knowledge we obtained during our audit of the basic financial statements. We do not express an opinion or provide any assurance on the information because the limited procedures do not provide us with sufficient evidence to express an opinion or provide any assurance.
Other Information
Our audit was conducted for the purpose of forming op1mons on the financial statements that collectively comprise the Town of Fairfield, Connecticut's basic financial statements. The introductory section, supplemental schedules and statistical section are presented for purposes of additional analysis and are not a required part of the basic financial statements.
The supplemental schedules are the responsibility of management and were derived from and relate directly to the underlying accounting and other records used to prepare the basic financial statements. Such information has been subjected to the auditing procedures applied in the audit of the basic financial statements and certain additional procedures, including comparing and reconciling such information directly to the underlying accounting and other records used to prepare the basic financial statements or to the basic financial statements themselves, and other additional procedures in accordance with auditing standards generally accepted in the United States of America. In our opinion, the supplemental schedules are fairly stated in all material respects in relation to the basic financial statements as a whole.
9

The introductory and statistical sections have not been subjected to the auditing procedures applied in the audit of the basic financial statements and, accordingly, we do not express an opinion or provide any assurance on them.
Other Reporting Required by Government Auditing Standards
In accordance with Government Auditing Standards, we have also issued our report dated December 16, 2015, on our consideration of the Town of Fairfield, Connecticut's internal control over financial reporting and on our tests of its compliance with certain provisions of laws, regulations, contracts, and grant agreements and other matters. The purpose of that report is to describe the scope of our testing of internal control over financial reporting and compliance and the results of that testing, and not to provide an opinion on internal control over financial reporting or on compliance. That report is an integral part of an audit performed in accordance with Government Auditing Standards in considering the Town of Fairfield, Connecticut's internal control over financial reporting and compliance.
~~,(~ Hartford, Connecticut December 16, 2015
10

Sullivan Independence Hall Finance Department
'Oro tun of jf airfielb 725 Old Post Road
Fairfield, Connecticut 06824
Management's Discussion and Analysis Year ended June 30, 2015
(Thousands)
Phone (203) 256-3065 Fax (203) 255-7380
As management of the Town of Fairfield, Connecticut, we offer readers of the Town of Fairfield's financial statements this narrative overview and analysis of the financial activities of the Town for the fiscal year ended June 30, 2015. The amounts presented are in thousands.
Financial Highlights
• During the fiscal year, the Town implemented GASB 68 related to pensions. GASB 68 required that the net pension liability be recorded on the government-wide financial statements. The result of implementing GASB 68 was a prior period adjustment as of July 1, 2014 to record the net pension liability and other related amounts of $7,447. The current year pension expense was $10,709 and the net pension liability at June 30, 2015 was $30,274.
• The Town recorded a net impairment gain of $704 related the damage caused by Storm Sandy to the Penfield Pavilion.
• The assets of the Town exceeded its liabilities at the close of the most recent fiscal year by $278,341 (net position). Unrestricted net position was $4,458 at June 30, 2015.
• The Town's total net position increased by $11,457. The increase is substantially due to positive operations in the general fund of $3, 140, and the different basis of accounting (accrual versus modified accrual) for capital assets and long-term debt. During the fiscal year, there was a significant increase in capital assets of $9,428 primarily due to construction in progress related to school expansion projects. In addition, there was a decrease in long-term debt of $12,7 41 primarily due to principal payments made during the year. These amounts were offset by the $12,351 deficit operations of the Capital Project Fund due the financing of the construction project with bond anticipation notes.
• As of the close of the current fiscal year, the Town's governmental funds reported combined ending fund balances of $21,253, a decrease of $9,295 in comparison with the prior year. The decrease was due substantially to the decrease in fund balance in the capital projects fund of $12,351 as a result of the costs of various school expansion and other capital projects net with an increase in general fund balance of $3,140.
• At the end of the current fiscal year, unassigned fund balance for the general fund was $24,260 or 8.53% of total general fund expenditures and other financing uses (budgetary basis). This figure represents a 0.93% increase over the previous fiscal year's percent of7.6%.
11

MANAGEMENT'S DISCUSSION AND ANALYSIS (CONTINUED)
• The Town of Fairfield's total bond/note debt decreased by a net of$12,741 (6.2%) during the current fiscal year due to a current year general obligation refunding bond issuance of $24,240 which offset refunded bonds in the amount of $23,745, the issuance of general obligation bonds of $3,312, which was offset by scheduled principal payments of $16,548 made during the year.
Overview of the Basic Financial Statements
This discussion and analysis is intended to serve as an introduction to the Town of Fairfield's basic financial statements. The Town's basic financial statements comprise three components: 1) government-wide financial statements, 2) fund financial statements and 3) notes to financial statements. This report also contains other supplementary information in addition to the basic financial statements themselves.
Government-wide financial statements. The government-wide financial statements are designed to provide readers with a broad overview of the Town's finances, in a manner similar to a private-sector business.
The statement of net position presents information on all of the Town's assets, deferred outflow of resources, liabilities and deferred inflow of resources, with the net difference reported as net position. Over time, increases or decreases in net position may serve as a useful indicator of whether the financial position of the Town is improving or deteriorating.
The statement of activities presents information showing how the Town's net position changed during the most recent fiscal year. All changes in net position are reported as soon as the underlying event giving rise to the change occurs, regardless of the timing of related cash flows. Thus, revenues and expenses are reported in this statement for some items that will only result in cash flows in future fiscal periods (e.g., uncollected taxes and earned but unused vacation leave).
The government-wide financial statements present the functions of the Town that are principally supported by taxes and intergovernmental revenues (governmental activities). The governmental activities of the Town include general government, finance, public safety, public works, health and welfare, culture and recreation, education and interest expense.
Fund financial statements. A fund is a grouping of related accounts that is used to maintain control over resources that have been segregated for specific activities or objectives. The Town uses fund accounting to ensure and demonstrate compliance with finance-related legal requirements. All of the funds ofthe Town can be divided into three categories: governmental funds, proprietary funds and fiduciary funds.
Governmental funds. Governmental funds are used to account for essentially the same functions reported as governmental activities in the government-wide financial statements. However, unlike the government-wide financial statements, governmental fund financial statements focus on near-term inflows and outflows of spendable resources, as well as on balances of spendable resources available at the end of the fiscal year. Such information may be useful in evaluating a Town's near-term financing requirements.
Because the focus of governmental funds is narrower than that of the government-wide financial statements, it is useful to compare the information presented for governmental funds with similar information presented for governmental activities in the government-wide financial statements. By doing so, readers may better understand the long-term impact of the Town's near-term financing decisions. Both the governmental fund balance sheet and the governmental fund statement of revenues, expenditures and changes in fund balances provide a reconciliation to facilitate this comparison between governmental funds and governmental activities.
12

MANAGEMENT'S DISCUSSION AND ANALYSIS (CONTINUED)
The Town reports 19 individual governmental funds. Information is presented separately in the governmental fund balance sheet and in the governmental fund statement of revenues, expenditures and changes in fund balances for the General Fund and Capital Projects Fund, both of which are considered to be major funds. Data from the other 17 governmental funds are combined into a single, aggregated presentation. Individual fund data for each of these nonmajor governmental funds is provided in the form of combining statements elsewhere in this report.
The Town adopts an annual budget for its General Fund. A budgetary comparison statement has been provided for the general fund to demonstrate compliance with this budget.
Proprietary fund. The Town maintains one proprietary fund. Internal service funds are an accounting device used to accumulate and allocate costs internally among the Town's various functions. The Town uses an internal service fund to account for its self-insured medical benefits and various other self-insured risks.
The data for the internal service fund is provided in Exhibits G, H and I of this report.
Fiduciary funds. Fiduciary funds are used to account for resources held for the benefit of parties outside the government. Fiduciary funds are not reflected in the government-wide financial statements because the resources of those funds are not available to support the Town's own programs. The accounting used for fiduciary funds is much like that used for proprietary funds.
Notes to financial statements. The notes provide additional information that is essential to a full understanding of the data provided in the government-wide and fund financial statements.
Other information. In addition to the basic financial statements and accompanying notes, this report also presents certain required supplementary information concerning the Town's pension funds as required by GASB 67 and 68. Required supplementary information can be found following the notes.
The combining statements referred to earlier in connection with nonmajor governmental funds are presented immediately following the required supplementary information on pensions.
Government-Wide Financial Analysis
As noted earlier, net position may serve over time as a useful indicator of a town's financial position. In the case of the Town, assets exceeded liabilities by $278,341 at the close of the most recent fiscal year.
By far the largest portion of the Town's net position reflects its investment in capital assets (e.g., land, buildings, machinery, equipment and infrastructure), less any related debt used to acquire those assets that are still outstanding. The Town uses these capital assets to provide services to citizens; consequently, these assets are not available for future spending. Although the Town's investment in its capital assets is reported net of related debt, it· should be noted that the resources needed to repay this debt must be provided from other sources, since the capital assets themselves cannot be used to liquidate these liabilities.
13

MANAGEMENT'S DISCUSSION AND ANALYSIS (CONTINUED)
SUMMARY STATEMENT OF NET POSITION (THOUSANDS)
Current and other assets ................... . Capital assets (net) .......................... .
TOTAL ASSETS ............................ .
Deferred outflows of resources ........... .
Long-term liabilities outstanding ......... . Other liabilities ................................ .
TOTAL LIABILITIES ....................... .
Deferred inflows of resources ............ .
Net investment in capital assets ........ .. Restricted ....................................... . Unrestricted .................................... .
TOTAL NET POSITION .................. .
2015
$ 94,306 482,676
576,982
34,610
251,849 73,853
325,702
7,549
267,658 6,225 4,458
$ 278,341
2014
$ 97,368 473,248
570,616
2,946
238,931 63,968
302,899
3,779
246,055 4,909
15,920
$ 266,884
A portion of the Town's net position of $6,225 represents resources that are subject to external restrictions on how they may be used. The remaining balance of unrestricted net position is $4,458.
The Town's net position increased by $11,457 during the current fiscal year. The increase is substantially due to positive general fund operations of $3,140, the increase in capital assets of $9,428 primarily from the construction in progress related to the school expansion projects, as well as the principal payments on long-term debt ($16,548) net with the issuance of refunding and general obligation bonds. This was offset by the $12,351 deficit operations of the Capital Project Fund due the financing of the construction project with bond anticipation notes.
14
MANAGEMENT'S DISCUSSION AND ANALYSIS (CONTINUED)
STATEMENT OF CHANGES IN NET POSITION (THOUSANDS)
2015
REVENUES: Program revenues:
Charges for services .................................... $ 26,074 Operating grants and contributions ................. 30,912 Capital grants and contributions ..................... 2,603
General revenues: Property taxes ............................................. 264,619 Grants and contributions not
restricted to specific programs ..................... 3,753
Investment income ....................................... 524 Miscellaneous ............................................. 185
TOTAL REVENUES .......................................... 328,670
EXPENSES: General government. ..................................... 29,673 Finance ....................................................... 5,997 Public safety ................................................. 38,629 Public works ................................................. 28,938 Health and welfare ......................................... 7,794 Culture and recreation .................................... 7,951 Education .................................................... 192,338 Railroad station project. .................................. 31 Interest expense ............................................ 6,566
TOTAL EXPENSES .......................................... 317,917
CHANGE IN NET POSITION BEFORE EXTRAORDINARY ITEM ................................ 10,753
EXTRAORDINARY ITEM- ASSET IMPAIRMENT GAIN, NET OF INSURANCE RECOVERY .......... 704
CHANGE IN NET POSITION 11,457
NET POSITION- JULY 1 (AS RESTATED) ............ 266,884
RESTATEMENT FOR NET PENSION LIABILITY .......
NET POSITION -JUNE 30 ................................. $ 278,341
15
2014
$ 26,028 32,428
4,842
257,832
3,860
1,120 144
326,254
27,542 4,833
34,958 32,259
7,693 9,424
186,797 26
6,916
310,448
15,806
15,806
258,525
(7,447)
$ 266,884
MANAGEMENT'S DISCUSSION AND ANALYSIS (CONTINUED)
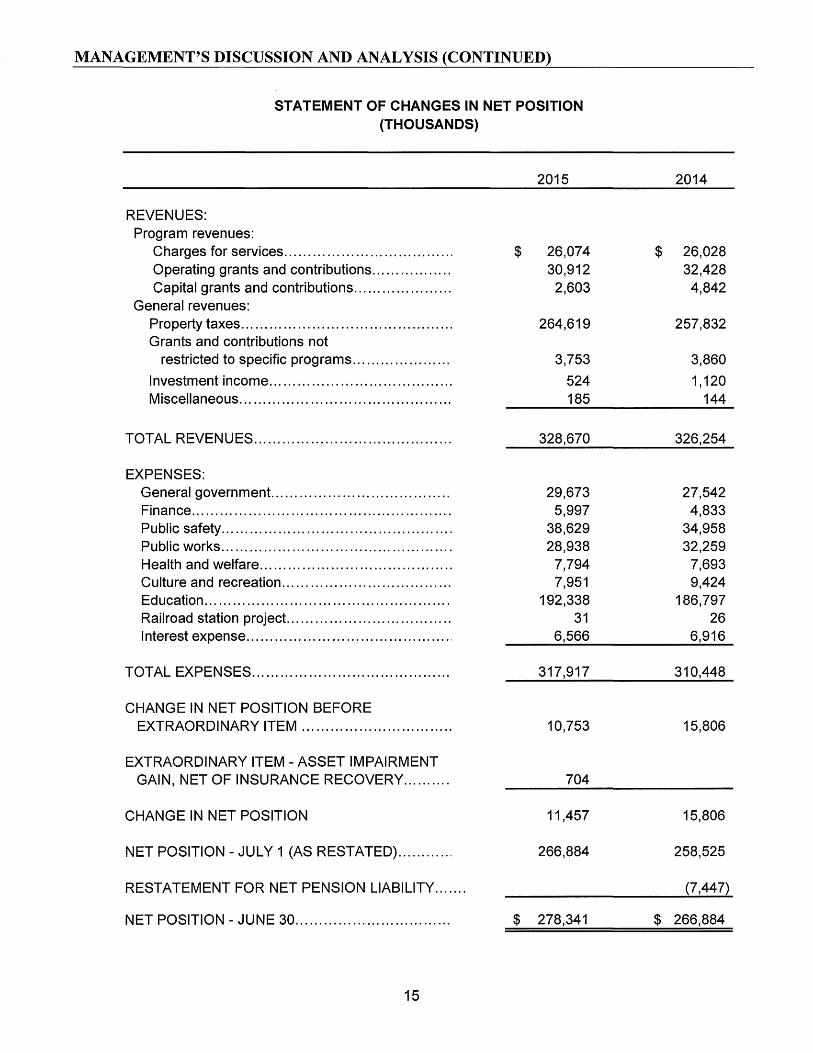
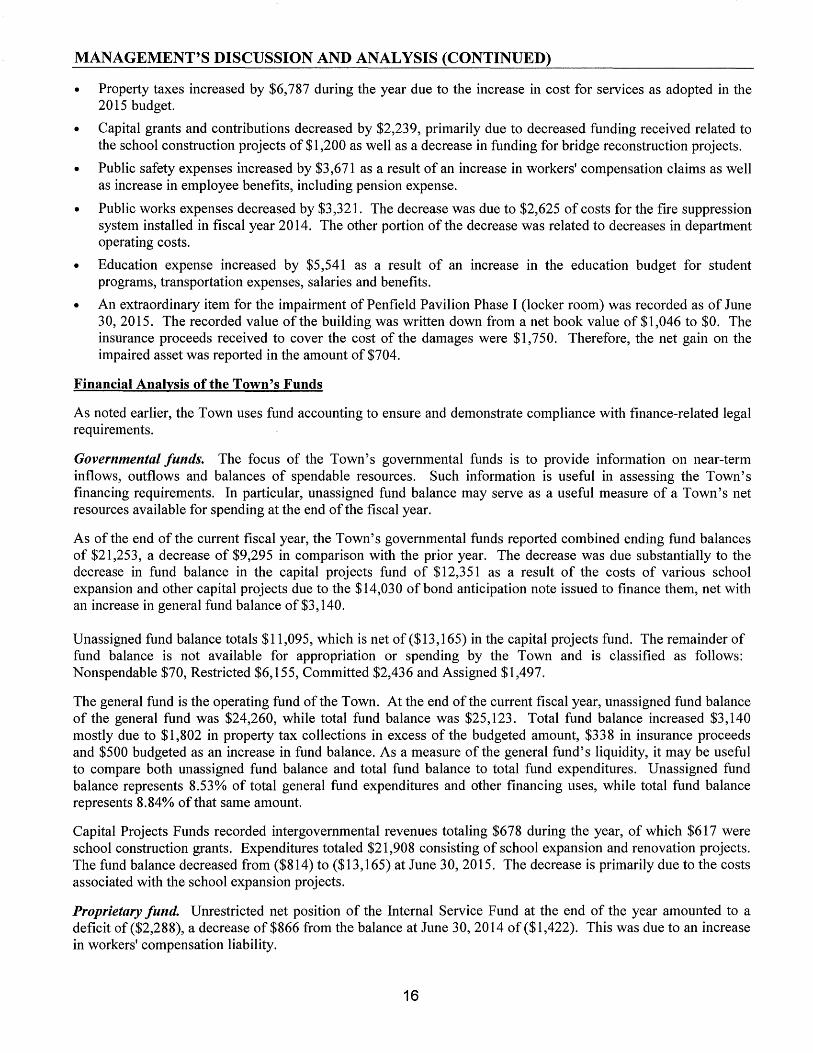
• Property taxes increased by $6,787 during the year due to the increase in cost for services as adopted in the 2015 budget.
• Capital grants and contributions decreased by $2,239, primarily due to decreased funding received related to the school construction projects of $1 ,200 as well as a decrease in funding for bridge reconstruction projects.
• Public safety expenses increased by $3,671 as a result of an increase in workers' compensation claims as well as increase in employee benefits, including pension expense.
• Public works expenses decreased by $3,321. The decrease was due to $2,625 of costs for the fire suppression system installed in fiscal year 2014. The other portion of the decrease was related to decreases in department operating costs.
• Education expense increased by $5,541 as a result of an increase in the education budget for student programs, transportation expenses, salaries and benefits.
• An extraordinary item for the impairment of Penfield Pavilion Phase I (locker room) was recorded as of June 30, 2015. The recorded value of the building was written down from a net book value of $1,046 to $0. The insurance proceeds received to cover the cost of the damages were $1,750. Therefore, the net gain on the impaired asset was reported in the amount of $704.
Financial Analysis of the Town's Funds
As noted earlier, the Town uses fund accounting to ensure and demonstrate compliance with finance-related legal requirements.
Governmental funds. The focus of the Town's governmental funds is to provide information on near-term inflows, outflows and balances of spendable resources. Such information is useful in assessing the Town's financing requirements. In particular, unassigned fund balance may serve as a useful measure of a Town's net resources available for spending at the end of the fiscal year.
As ofthe end ofthe current fiscal year, the Town's governmental funds reported combined ending fund balances of $21,253, a decrease of $9,295 in comparison with the prior year. The decrease was due substantially to the decrease in fund balance in the capital projects fund of $12,351 as a result of the costs of various school expansion and other capital projects due to the $14,030 of bond anticipation note issued to finance them, net with an increase in general fund balance of $3, 140.
Unassigned fund balance totals $11,095, which is net of($13,165) in the capital projects fund. The remainder of fund balance is not available for appropriation or spending by the Town and is classified as follows: Nonspendable $70, Restricted $6,155, Committed $2,436 and Assigned $1,497.
The general fund is the operating fund of the Town. At the end of the current fiscal year, unassigned fund balance of the general fund was $24,260, while total fund balance was $25,123. Total fund balance increased $3,140 mostly due to $1,802 in property tax collections in excess of the budgeted amount, $338 in insurance proceeds and $500 budgeted as an increase in fund balance. As a measure of the general fund's liquidity, it may be useful to compare both unassigned fund balance and total fund balance to total fund expenditures. Unassigned fund balance represents 8.53% of total general fund expenditures and other financing uses, while total fund balance represents 8.84% of that same amount.
Capital Projects Funds recorded intergovernmental revenues totaling $678 during the year, of which $617 were school construction grants. Expenditures totaled $21,908 consisting of school expansion and renovation projects. The fund balance decreased from ($814) to ($13,165) at June 30, 2015. The decrease is primarily due to the costs associated with the school expansion projects.
Proprietary fund. Unrestricted net position of the Internal Service Fund at the end of the year amounted to a deficit of($2,288), a decrease of$866 from the balance at June 30,2014 of($1,422). This was due to an increase in workers' compensation liability.
16
MANAGEMENT'S DISCUSSION AND ANALYSIS (CONTINUED)
General Fund Budgetary Highlights
There were no differences between the original budget and the final amended budget. Significant budgetary variances were as follows:
• Property taxes revenue was in excess of the amount budgeted by $1,802 primarily due to greater than anticipated collections on delinquent taxes, interest and liens.
• Charges for services revenue was in excess of the amount budgeted by $413 substantially due to higher than anticipated amounts of building permits, as well as higher than anticipated conveyance tax charges.
• There was a budgeted contribution to fund balance in the amount of $500 as part of the Town's plan to increase the Town's fund balance.
Capital Assets and Debt Administration
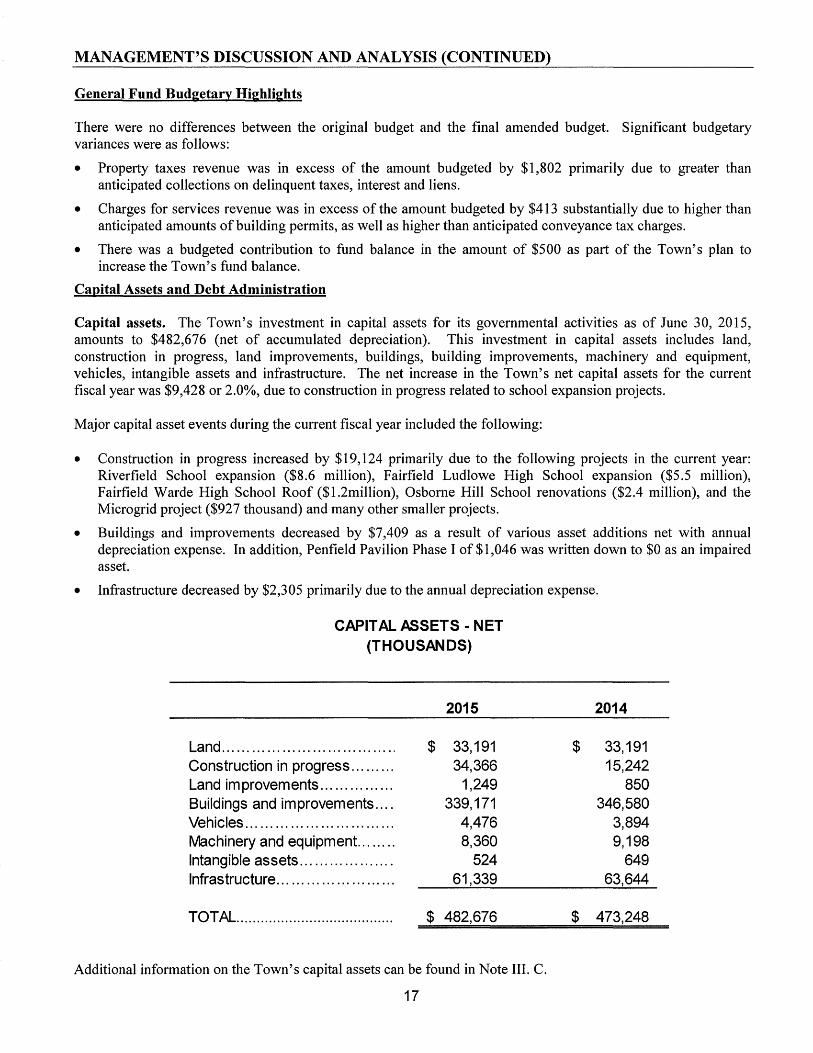
Capital assets. The Town's investment in capital assets for its governmental activities as of June 30, 2015, amounts to $482,676 (net of accumulated depreciation). This investment in capital assets includes land, construction in progress, land improvements, buildings, building improvements, machinery and equipment, vehicles, intangible assets and infrastructure. The net increase in the Town's net capital assets for the current fiscal year was $9,428 or 2.0%, due to construction in progress related to school expansion projects.
Major capital asset events during the current fiscal year included the following:
• Construction in progress increased by $19,124 primarily due to the following projects in the current year: Riverfield School expansion ($8.6 million), Fairfield Ludlowe High School expansion ($5.5 million), Fairfield Warde High School Roof ($1.2million), Osborne Hill School renovations ($2.4 million), and the Microgrid project ($927 thousand) and many other smaller projects.
• Buildings and improvements decreased by $7,409 as a result of various asset additions net with annual depreciation expense. In addition, Penfield Pavilion Phase I of $1,046 was written down to $0 as an impaired asset.
• Infrastructure decreased by $2,305 primarily due to the annual depreciation expense.
CAPITAL ASSETS -NET (THOUSANDS)
2015
Land ................................... $ 33,191 Construction in progress ......... 34,366 Land improvements ............... 1,249 Buildings and improvements .... 339,171 Vehicles .............................. 4,476 Machinery and equipment. ....... 8,360 Intangible assets ................... 524 Infrastructure ........................ 61,339
TOTAL ....................................... $ 482,676
Additional information on the Town's capital assets can be found in Note III. C.
17
2014
$ 33,191 15,242
850 346,580
3,894 9,198
649 63,644
$ 473,248

MANAGEMENT'S DISCUSSION AND ANALYSIS (CONTINUED)
Long-term debt. At the end of the current fiscal year, the Town had total bonds and notes outstanding of $193,167. This entire amount comprises debt backed by the full faith and credit of the Town. This debt will be partially retired by $469 in State of Connecticut grants for school building projects.
GENERAL OBLIGATION BONDS/NOTES (THOUSANDS)
General obligation bonds ........ . Clean water notes payable ...... . Bond anticipation notes .......... .
TOTAL ...................................... .
2015
$ 180,975 12,192
$ 193,167
2014
$ 183,760 13,960 8,188
$ 205,908
The Town's total debt decreased by $12,741 (6.2%) during the current fiscal year due to a current year general obligation refunding bond issuance of $24,240 which offset refunded bonds in the amount of $23,745, the issuance of general obligation bonds of $3,312, which was offset by scheduled principal payments of $16,548 made during the year.
The Town's short-term debt increased from $12,078 to $14,030 during the year.
Moody's, Standard and Poor's and Fitch Ratings continue to express the highest levels of confidence in the Town, its management and its ability to manage an increasing debt burden by all awarding their highest AAA rating to Fairfield.
State statutes limit the amount of general obligation debt a governmental entity may issue to 7 times total tax collections including interest and lien fees and the tax relief for elderly freeze grant. The current debt limitation for the Town is $1,845,858, which is significantly in excess of the Town's outstanding general obligation debt.
Additional information on the Town's long-term debt can be found in Note III. F.
Economic Factors and Next Year's Budgets and Rates
• The unemployment rate for the Town as of June 2015 was 4.7%, which is a decrease from last year of 5.0%. This is comparable to the state's average unemployment rate of 5.5%.
• Inflationary trends in the region compare favorably to national indices.
• Public school population was substantially the same as 2014.
All of these factors were considered in preparing the Town's budget for the 2016 fiscal year.
Requests for Information
This financial report is designed to provide a general overview of the Town's finances for all those with an interest in the government's finances. Questions concerning any of the information provided in this report or requests for additional financial information should be addressed to the Finance Department, Town of Fairfield, Independence Hall, 725 Old Post Road, Fairfield, Connecticut 06430.
18

Basic Financial Statements

Current assets:
TOWN OF FAIRFIELD. CONNECTICUT
STATEMENT OF NET POSITION GOVERNMENTAL ACTIVITIES
JUNE 30, 2015 (THOUSANDS)
ASSETS
Cash ........................................................................................... . Investments ................................................................................ . Receivables: Property taxes ............................................................ . Assessments and use .............................................................. . Intergovernmental. .................................................................. .. Loan ......................................................................................... . Other ........................................................................................ .
Other assets ................................................................ .
Total current assets ............................................................... .
Noncurrent assets:
Restricted assets: Temporarily restricted investments ................................. .. Permanently restricted investments ........................................ .
Total restricted assets ................................................... ..
Receivables (net): Property taxes ............................................................ . Assessments and use ............................................................. .. Intergovernmental. ................................................................... . Loan ......................................................................................... . Other ........................................................................................ .
Total receivables (net) .................................................... .
Capital assets (net of accumulated depreciation): Land ......................................................................... . Construction in progress ............................................... . Land improvements ..................................................... . Buildings and improvements .......................................... . Vehicles .................................................................... . Machinery and equipment. ............................................ . Intangible assets (net of accumulated amortization) ............ . Infrastructure .............................................................. .
Total capital assets (net of accumulated depreciation) .......... .
Total noncurrent assets ........................................................ ..
TOTAL ASSETS ......................................................................... .
DEFERRED OUTFLOWS OF RESOURCES
Deferred charge on refunding .......................................... . Pension related ............................................................ .
TOTAL DEFERRED OUTFLOWS OF RESOURCES ............ ..
19
$
EXHIBIT A (1 of 2)
4,035 67,805
4,162 356
4,511 86
1,954 18
82,927
4,080 70
4,150
3,867 787 190
1,615 770
7,229
33,191 34,366
1,249 339,171
4,476 8,360
524 61,339
482,676
494,055
576,982
3,228 31,382
34,610
(Continued)

Current liabilities:
TOWN OF FAIRFIELD. CONNECTICUT
STATEMENT OF NET POSITION GOVERNMENTAL ACTIVITIES
JUNE 30, 2015 (THOUSANDS)
LIABILITIES
Accounts payable .................................................................... . Accrued payroll and related liabilities .................................... . Accrued interest payable .......................................................... . Unearned revenue ................................................................... . Bond anticipation notes ................................................. .. Other .......................................................................... . Bonds and notes payable ............................................... . Capital lease ................................................................ . Compensated absences ................................................. . Heart and hypertension .................................................. . Risk management. ........................................................ .
Total current liabilities ................................................... ..
Noncurrent liabilities: Bonds, notes and related liabilities .................................. . Capital lease .............................................................. . Compensated absences ............................................... . Heart and hypertension ................................................. . Net pension liability ...................................................... . Net OPEB obligation .................................................... .. Risk management. .......................................................... .
Total noncurrent liabilities ............................................... .
TOTAL LIABILITIES ........................................................ .
DEFERRED INFLOWS OF RESOURCES
Advanced property tax collections .................................... . Pension related ............................................................ .
TOTAL DEFERRED INFLOWS OF RESOURCES ................ .
NET POSITION
Net investment in capital assets ......................................... . Restricted for:
Endowments: Nonexpendable ......................................................... . Expendable .............................................................. .
Public works ................................................................ . Education ................................................................... . Other purposes ............................................................ .
Unrestricted .................................................................. .
TOTAL NET POSITION ................................................... .
See Notes to Financial Statements.
20
$
$
EXHIBIT A (2 of 2)
12,272 13,185 3,844
715 14,030 5,158
17,354 41
859 673
5,722
73,853
186,682 139
3,434 2,131
30,274 20,671
8,518
251,849
325,702
2,620 4,929
7,549
267,658
70 376
5,244 110 425
4,458
278,341
(Concluded)

TOWN OF FAIRFIELD. CONNECTICUT
STATEMENT OF ACTIVITIES GOVERNMENTAL ACTIVITIES YEAR ENDED JUNE 30, 2015
(THOUSANDS)
PROGRAM REVENUES
OPERATING
CHARGES FOR GRANTS AND
FUNCTIONS/PROGRAMS EXPENSES SERVICES CONTRI BUTtONS
General government. ......................... . $ 29,673 $ 3,487 $ Finance .......................... . 5,997 62 Public safety .................................... . 38,629 8,682 1,249 Public works .................................... . 28,938 3,413 1,427 Health and welfare ............................ . 7,794 3,407 487 Culture and recreation ....................... . 7,951 3,541 272 Education ........................................ . 192,338 3,482 27,477 Railroad station project. ..................... . 31
6,566 1\J
Interest expense ............................... .
....l..
TOTAL GOVERNMENTAL ACTIVITIES ..... $ 317,917 $ 26,074 $ 30,912
GENERAL REVENUES: Property taxes ....................... . Grants and contributions not restricted to specific programs ................................. . Investment income .......................................................................... . Miscellaneous ................................ .
TOTAL GENERAL REVENUES ............................. .
CHANGE IN NET POSITION BEFORE EXTRAORDINARY ITEM ............................ .
EXTRAORDINARY ITEM -ASSET IMPAIRMENT GAIN, NET OF INSURANCE RECOVERY .......................... .
CHANGE IN NET POSITION ................................ .
NET POSITION- JULY 1, 2014 (AS RESTATED) ................................................ .
NET POSITION - JUNE 30, 2015 ........... .
See Notes to Financial Statements.
CAPITAL
GRANTS AND
CONTRIBUTIONS
$ $
1,759
844
$ 2,603 $
$
$
EXHIBIT 8
NET (EXPENSES)
REVENUES
AND CHANGES IN NET POSITION
TOTAL
GOVERNMENTAL
ACTIVITIES
(26, 186)
(5,935) (28,698) (22,339)
(3,900) (4, 138)
(161 ,379) 813
(6,566)
(258,328)
264,619 3,753
524 185
269,081
10,753
704
11,457
266,884
278,341
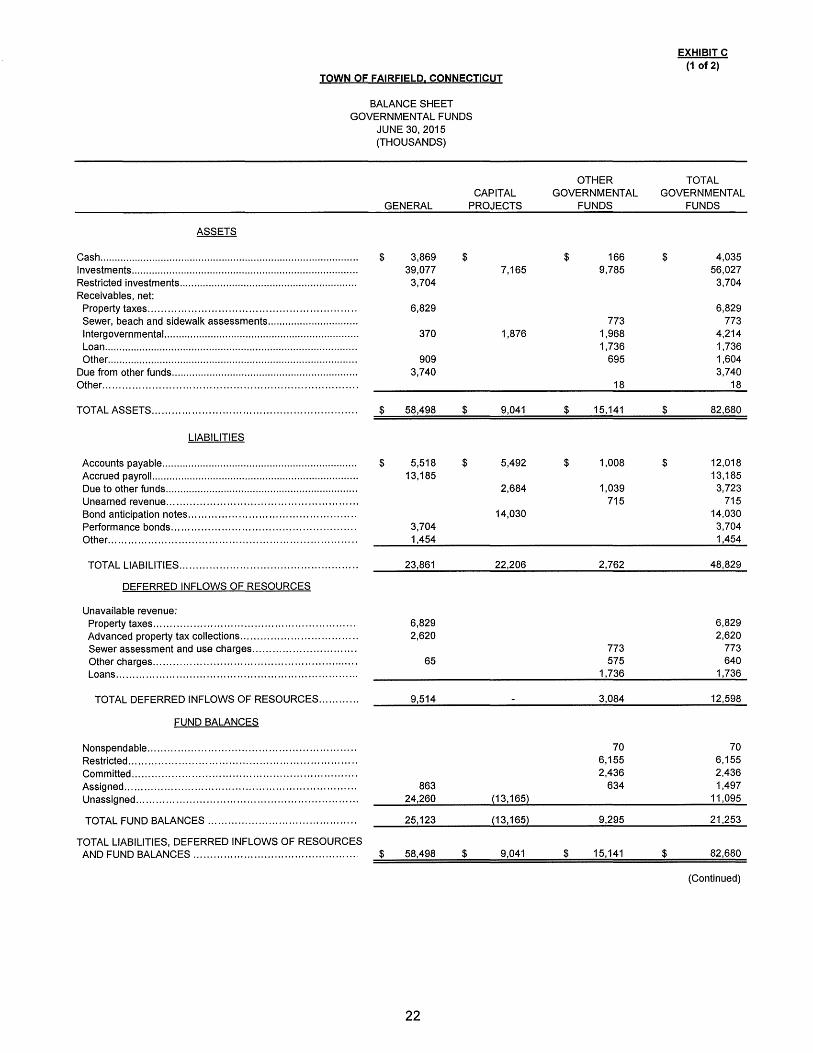
TOWN OF FAIRFIELD CONNECTICUT
BALANCE SHEET GOVERNMENTAL FUNDS
JUNE 30, 2015 (THOUSANDS)
GENERAL CAPITAL
PROJECTS
Cash ........................................................................................ . Investments ............................................................................. . Restricted investments ............................................................ . Receivables, net:
Property taxes ............................................................. . Sewer, beach and sidewalk assessments ............................. .. Intergovernmental. ................................................................. . Loan ...................................................................................... . Other ..................................................................................... .
Due from other funds ............................................................... . Other. .......................................................................... .
TOTAL ASSETS ............................................................ .
LIABILITIES
Accounts payable .................................................................. . Accrued payroll ...................................................................... . Due to other funds ................................................................. . Unearned revenue ....................................................... .. Bond anticipation notes ................................................. . Performance bonds ...................................................... . Other ......................................................................... .
TOTAL LIABILITIES ................................................... ..
DEFERRED INFLOWS OF RESOURCES
Unavailable revenue: Property taxes ............................................................ . Advanced property tax collections .................................. . Sewer assessment and use charges .............................. . Other charges ............................................................ . Loans ....................................................................... .
TOTAL DEFERRED INFLOWS OF RESOURCES .......... ..
FUND BALANCES
Nons pend able ............................................................ .. Restricted .................................................................. .. Committed .................................................................. . Assigned .................................................................... . Unassigned ................................................................ ..
TOTAL FUND BALANCES ........................................... .
TOTAL LIABILITIES, DEFERRED INFLOWS OF RESOURCES
$
$
$
3,869 39,077
3,704
6,829
370
909 3,740
58,498
5,518 13,185
3,704 1,454
23,861
6,829 2,620
65
9,514
863 24,260
25,123
$ 7,165
1,876
$ 9,041
$ 5,492
2,684
14,030
22,206
(13,165)
(13,165)
OTHER GOVERNMENTAL
FUNDS
$
$
$
166 9,785
773 1,968 1,736
695
18
15,141
1,008
1,039 715
2,762
773 575
1,736
3,084
70 6,155 2,436
634
9,295
EXHIBITC (1 of 2)
TOTAL GOVERNMENTAL
FUNDS
$
$
$
4,035 56,027
3,704
6,829 773
4,214 1,736 1,604 3,740
18
82,680
12,018 13,185 3,723
715 14,030
3,704 1,454
48,829
6,829 2,620
773 640
1,736
12,598
70 6,155 2,436 1,497
11,095
21,253
AND FUND BALANCES ... . .. .. . ... ... ... ... ... ... ... ... . . . . .. ... ... .. . . :::::$=====::58::,:::::49:::8=:::::::$====9=:,0:::4::1 ===$===1:5:::::, 1:4:::::1 ===$=====82:::,6::8:::0
(Continued)
22
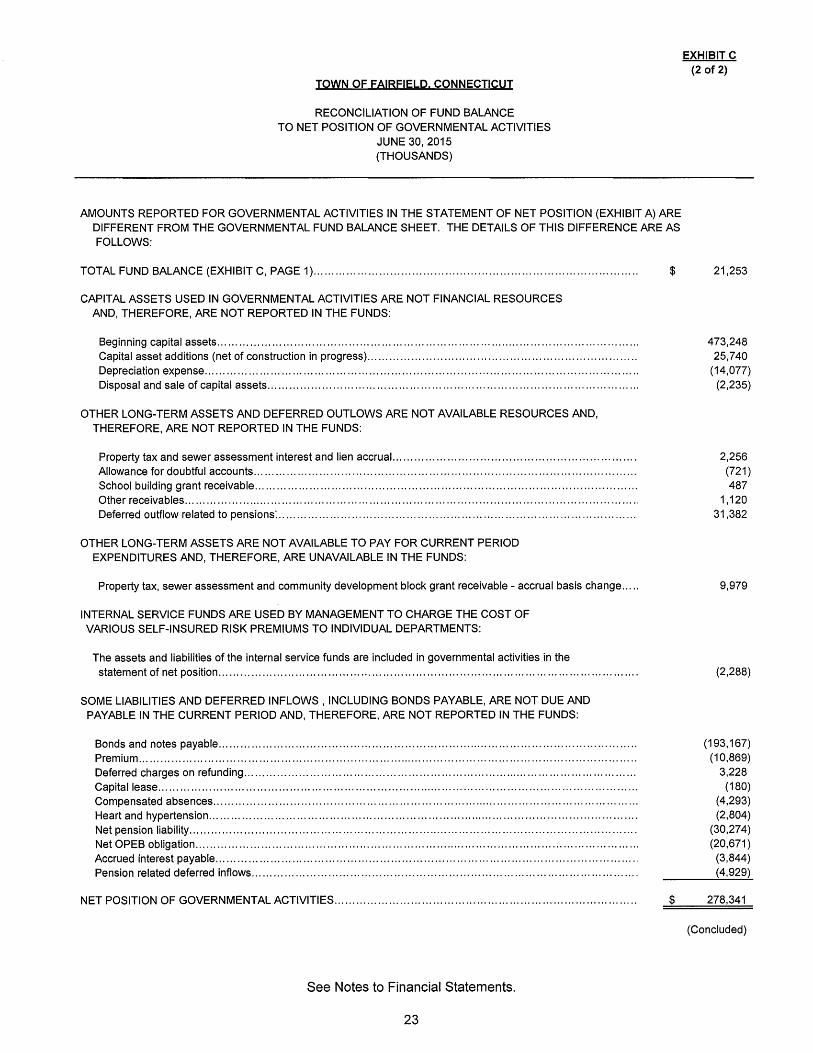
TOWN OF FAIRFIELD CONNECTICUT
RECONCILIATION OF FUND BALANCE TO NET POSITION OF GOVERNMENTAL ACTIVITIES
JUNE 30, 2015 (THOUSANDS)
AMOUNTS REPORTED FOR GOVERNMENTAL ACTIVITIES IN THE STATEMENT OF NET POSITION (EXHIBIT A) ARE DIFFERENT FROM THE GOVERNMENTAL FUND BALANCE SHEET. THE DETAILS OF THIS DIFFERENCE ARE AS FOLLOWS:
TOTAL FUND BALANCE (EXHIBIT C, PAGE 1) ........................................................................................ .
CAPITAL ASSETS USED IN GOVERNMENTAL ACTIVITIES ARE NOT FINANCIAL RESOURCES AND, THEREFORE, ARE NOT REPORTED IN THE FUNDS:
Beginning capital assets ................................................................................................................... . Capital asset additions (net of construction in progress) ......................................................................... . Depreciation expense ...................................................................................................................... . Disposal and sale of capital assets ..................................................................................................... .
OTHER LONG-TERM ASSETS AND DEFERRED OUTLOWS ARE NOT AVAILABLE RESOURCES AND, THEREFORE, ARE NOT REPORTED IN THE FUNDS:
Property tax and sewer assessment interest and lien accrual. ................................................................. . Allowance for doubtful accounts ........................................................................................................ . School building grant receivable ........................................................................................................ . Other receivables ........................................................................................................................... .. Deferred outflow related to pensions: ................................................................................................. .
OTHER LONG-TERM ASSETS ARE NOT AVAILABLE TO PAY FOR CURRENT PERIOD EXPENDITURES AND, THEREFORE, ARE UNAVAILABLE IN THE FUNDS:
Property tax, sewer assessment and community development block grant receivable- accrual basis change .....
INTERNAL SERVICE FUNDS ARE USED BY MANAGEMENT TO CHARGE THE COST OF VARIOUS SELF-INSURED RISK PREMIUMS TO INDIVIDUAL DEPARTMENTS:
The assets and liabilities of the internal service funds are included in governmental activities in the statement of net position .................................................................................................................. .
SOME LIABILITIES AND DEFERRED INFLOWS, INCLUDING BONDS PAYABLE, ARE NOT DUE AND PAYABLE IN THE CURRENT PERIOD AND, THEREFORE, ARE NOT REPORTED IN THE FUNDS:
Bonds and notes payable .................................................................................................................. . Premium ........................................................................................................................................ . Deferred charges on refunding ........................................................................................................... . Capital lease .................................................................................................................................. .. Compensated absences .................................................................................................................... . Heart and hypertension ..................................................................................................................... . Net pension liability .......................................................................................................................... . Net OPES obligation ........................................................................................................................ .. Accrued interest payable .................................................................................................................. .. Pension related deferred inflows ......................................................................................................... .
NET POSITION OF GOVERNMENTALACTIVITIES .................................................................................. .
See Notes to Financial Statements.
23
$
$
EXHIBITC (2 of 2)
21,253
473,248 25,740
(14,077) (2,235)
2,256 (721) 487
1,120 31,382
9,979
(2,288)
(193,167) (10,869)
3,228 (180)
(4,293) (2,804)
(30,274) (20,671)
(3,844) (4,929)
278,341
(Concluded)
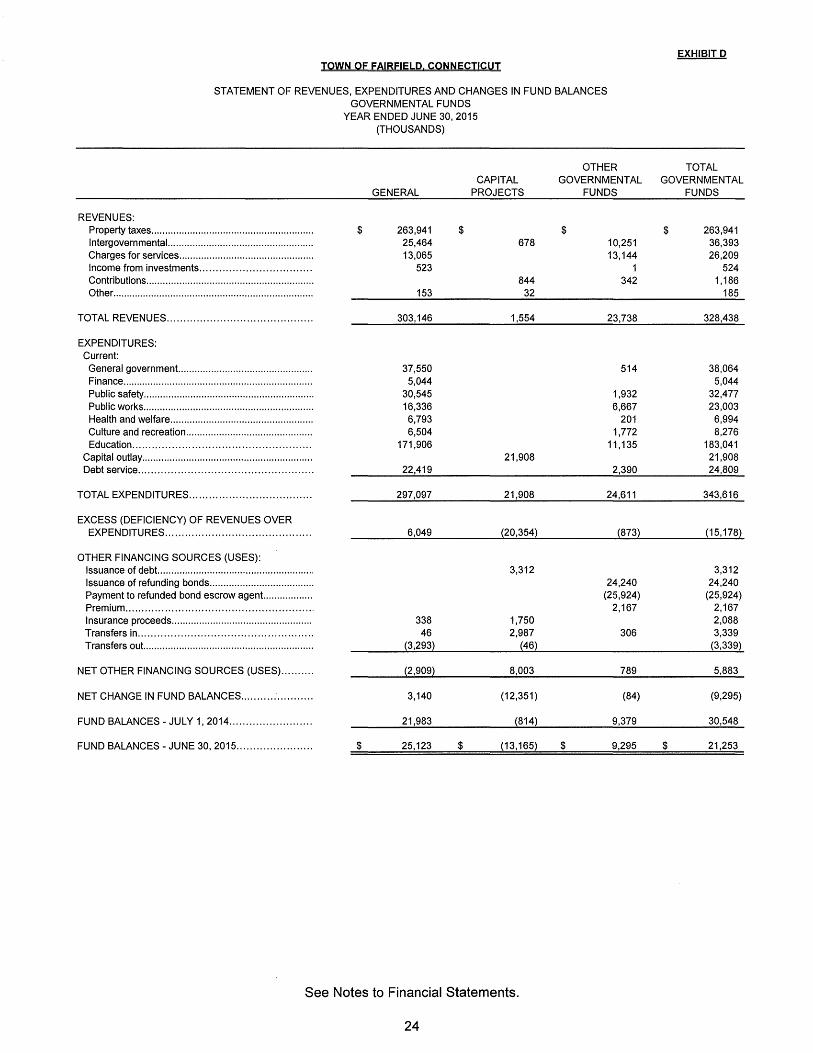
EXHIBITD !OWN QE EAIBEIELD CQNNECIIC!JI
STATEMENT OF REVENUES, EXPENDITURES AND CHANGES IN FUND BALANCES GOVERNMENTAL FUNDS
YEAR ENDED JUNE 30, 2015 (THOUSANDS)
OTHER TOTAL CAPITAL GOVERNMENTAL GOVERNMENTAL
GENERAL PROJECTS FUNDS FUNDS
REVENUES: Property taxes ........................................................... $ 263,941 $ $ $ 263,941 Intergovernmental. .................................................... 25,464 678 10,251 36,393 Charges for services ................................................. 13,065 13,144 26,209 Income from investments .................................. 523 1 524 Contributions ............................................................. 844 342 1,186 Other ......................................................................... 153 32 185
TOTAL REVENUES ............................................ 303,146 1,554 23,738 328,438
EXPENDITURES: Current:
General government. ................................................ 37,550 514 38,064 Finance ..................................................................... 5,044 5,044 Public safety .............................................................. 30,545 1,932 32,477 Public works .............................................................. 16,336 6,667 23,003 Health and welfare .................................................... 6,793 201 6,994 Culture and recreation .............................................. 6,504 1,772 8,276 Education ...................................................... 171,906 11 '135 183,041
Capital outlay .............................................................. 21,908 21,908 Debt service ..................................................... 22,419 2,390 24,809
TOTAL EXPENDITURES ..................................... 297,097 21,908 24,611 343,616
EXCESS (DEFICIENCY) OF REVENUES OVER EXPENDITURES ............................................ 6,049 ~20,354~ ~873~ (15,178)
OTHER FINANCING SOURCES (USES): Issuance of debt ......................................................... 3,312 3,312 Issuance of refunding bonds ...................................... 24,240 24,240 Payment to refunded bond escrow agent.. ................ (25,924) (25,924) Premium ......................................................... 2,167 2,167 Insurance proceeds ................................................... 338 1,750 2,088 Transfers in ..................................................... 46 2,987 306 3,339 Transfers out. ............................................................. ~3,293~ ~46) (3,339)
NET OTHER FINANCING SOURCES (USES) .......... ~2,909~ 8,003 789 5,883
NET CHANGE IN FUND BALANCES ...................... 3,140 (12,351) (84) (9,295)
FUND BALANCES-JULY 1, 2014 ......................... 21,983 ~814~ 9,379 30,548
FUND BALANCES- JUNE 30, 2015 ....................... $ 25,123 $ ~13,165~ $ 9,295 $ 21,253
See Notes to Financial Statements.
24

TOWN OF FAIRFIELD CONNECTICUT
RECONCILIATION OF THE STATEMENT OF REVENUES, EXPENDITURES AND CHANGES IN FUND BALANCES OF GOVERNMENTAL FUNDS TO STATEMENT OF ACTIVITIES
YEAR ENDED JUNE 30, 2015 (THOUSANDS)
AMOUNTS REPORTED FOR GOVERNMENTAL ACTIVITIES IN THE STATEMENT OF ACTIVITIES (EXHIBIT B) ARE DUE TO:
EXHIBIT E (1 of 2)
NET CHANGE IN FUND BALANCES- TOTAL GOVERNMENTAL FUNDS (EXHIBIT D) ......................................................... _$,___ _ _,(......,9,:.-29:.-5'-'-)
Governmental funds report capital outlays as expenditures. However, in the statement of activities the cost of those assets is allocated over their estimated useful lives and reported as depreciation expense. This is the amount by which capital outlays exceeded depreciation in the current period:
Capital outlay ............................................................................................................................................ . Depreciation expense ................................................................................................................................. .
Total. ............................................................................................................................................................. .
The net effect of various miscellaneous transactions involving capital assets (i. e., sales, trade-ins and donations) is to increase net position. In the statement of activities, only the loss on the sale of capital assets is reported.
However, in the governmental funds, the proceeds from the sale increases financial resources. Thus, the change in net position differs from the change in fund balance by the cost of the capital assets sold ............................................ .
Revenues in the statement of activities that do not provide current financial resources are not reported as revenues in the funds and revenues recognized in the fund financial statements are not recognized in the statement of activities:
School building grant receipts ......................................................................................................................... . Change in property tax, sewer assessment and community development block grant receivable - accrual basis change ... . Change in property tax and sewer assessment interest and lien revenue ................................................................. . Change in other receivables ........................................................................................................................... .
Total ............................................................................................................................................................ .
The issuance of long-term debt (e.g., bonds, leases) provides current financial resources to governmental funds, while the repayment of the principal of long-term debt consumes the current financial resources of governmental funds. Neither transaction, however, has any effect on net position. Also, governmental funds report the effect of premiums, discounts, and similar items when debt is first issued, whereas these amounts are deferred and amortized in the statement of activities. The details of these differences in the treatment of long-term debt and related items are as follows:
Debt issued or incurred: Issuance of general obligation bonds ............................................................................................................... . Issuance of general obligation refunding bonds ................................................................................................. . Deferred charges ........................................................................................................................................ . Premium .................................................................................................................................................... . Principal repayments: General obligation bonds and notes .............................................................................................................. . General obligation refunding bonds ............................................................................................................... . Capital lease payments ............................................................................................................................... .
Total ............................................................................................................................................................ .
25
25,740 (14,077)
11,663
(2,235)
(311) 601
16 (411)
(105)
(3,312) (24,240)
495 (188)
16,548 23,745
40
13,088
(Continued)

TOWN OF FAIRFIELD CONNECTICUT
RECONCILIATION OF THE STATEMENT OF REVENUES, EXPENDITURES AND CHANGES
IN FUND BALANCES OF GOVERNMENTAL FUNDS TO STATEMENT OF ACTIVITIES
YEAR ENDED JUNE 30, 2015
(THOUSANDS)
Some expenses reported in the statement of activities do not require the use of current financial resources and, therefore, are not reported as expenditures in governmental funds:
Premium ................................................................................................................................................. . Compensated absences ............................................................................................................................. . Heart and hypertension .............................................................................................................................. . Pension expense ...................................................................................................................................... . Net OPES obligation .................................................................................................................................. . Deferred charges ...................................................................................................................................... . Accrued interest payable ............................................................................................................................ .
Total ............................................................................................................................................................ .
Internal service funds are used by management to charge costs of various self-insured risk premiums to individual departments .................................................................................................................................................. .
CHANGE IN NET POSITION OF GOVERNMENTAL ACTIVITIES (EXHIBIT B) ....................................................................... ..
See Notes to Financial Statements.
26
$
$
EXHIBIT E
(2 of 2)
1,252 85
(1,001) (653) (624) (213) 361
(793)
(866)
11,457
(Concluded)

EXHIBIT F
TOWN OF FAIRFIELD CONNECTICUT
GENERAL FUND STATEMENT OF REVENUES, EXPENDITURES AND CHANGES IN FUND BALANCE
BUDGET AND ACTUAL YEAR ENDED JUNE 30, 2015
(THOUSANDS)
VARIANCE WITH
ORIGINAL FINAL FINAL BUDGET BUDGET ACTUAL BUDGET
REVENUES: Property taxes ............................................. $ 262,139 $ 262,139 $ 263,941 $ 1,802 Intergovernmental ........................................ 9,163 9,163 9,199 36 Charges for services .................................... 12,652 12,652 13,065 413 Income from investments .............................. 879 879 523 (356) Other ......................................................... 130 130 153 23
TOTAL REVENUES ....................................... 284,963 284,963 286,881 1,918
EXPENDITURES: Current:
General government .................................. 40,207 37,640 37,579 61 Contribution to fund balance ........................ 500 500 500 Finance ................................................... 4,105 5,073 5,052 21 Public safety ............................................. 29,595 30,638 30,608 30 Public works ............................................. 15,518 16,365 16,362 3 Health and welfare .................................... 7,048 6,824 6,793 31 Culture and recreation ................................ 6,418 6,493 6,447 46 Education ................................................ 155,718 155,718 155,718
Debt service ............................................... 22,614 22,419 22,419
TOTAL EXPENDITURES ................................. 281,723 281,670 280,978 692
EXCESS (DEFICIENCY) OF REVENUES OVER EXPENDITURES .......................................... 3,240 3,293 5,903 2,610
OTHER FINANCING SOURCES (USES): Cancellation of prior year encumbrances ........... 98 98 Insurance proceeds ...................................... 338 338 Transfers in ................................................. 46 46 Transfers out. .............................................. (3,240} (3,293) (3,293)
NET OTHER FINANCING SOURCES (USES) ..... ~3,240} (3,293} (2,811) 482
NET CHANGE IN FUND BALANCE ................... $ $ 3,092 $ 3,092
FUND BALANCE- JULY 1, 2014 ....................... 21,168
FUND BALANCE- JUNE 30, 2015 .................... $ 24,260
See Notes to Financial Statements.
27

TOWN OF FAIRFIELD. CONNECTICUT
ASSETS
STATEMENT OF NET POSITION PROPRIETARY FUNDS
JUNE 30, 2015 (THOUSANDS)
Investments .................................................................................................. .
LIABILITIES
Current liabilities: Accounts payable ..................................................................................... . Due to other funds .................................................................................... . Claims payable .............................................................................. .
Total current liabilities ............................................................................ .
Noncurrent liability: Claims payable .............................................................................. .
TOTAL LIABILITIES .......................................................................... .
NET POSITION
Unrestricted ..................................................................................... .
See Notes to Financial Statements.
28
$
$
EXHIBIT G
GOVERNMENTAL ACTIVITIES
INTERNAL SERVICE FUND
12,223
254 17
5,722
5,993
8,518
14,511
(2,288)
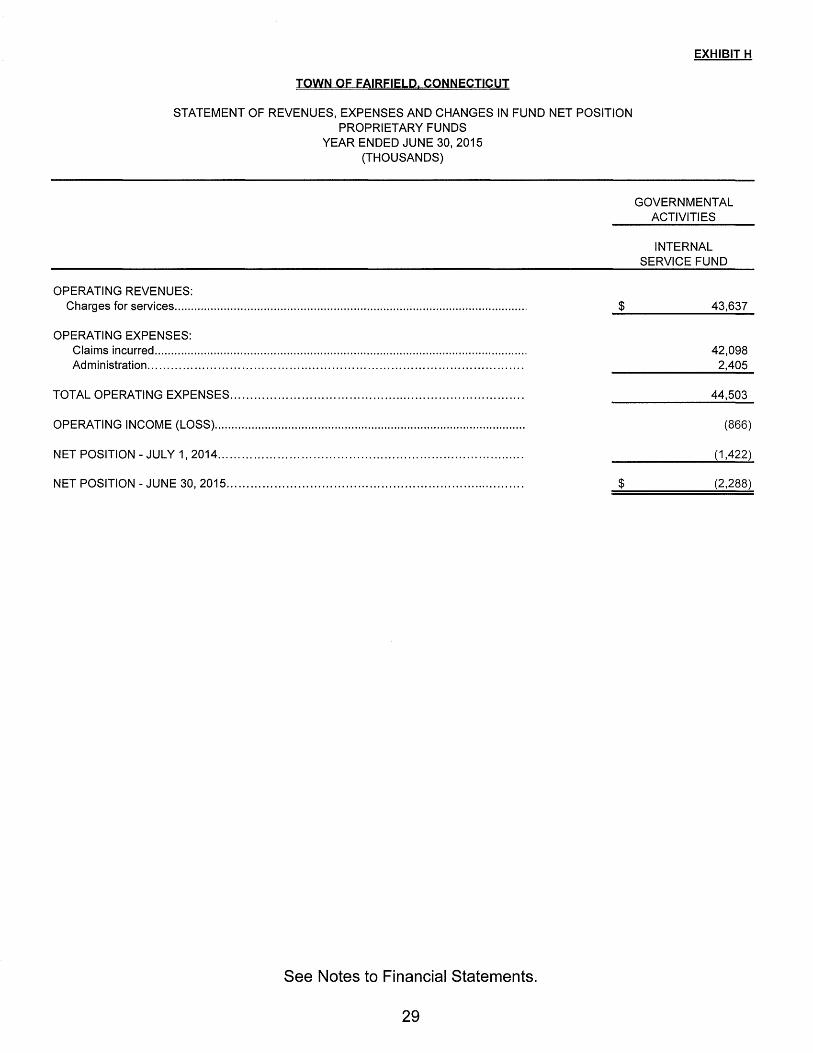
TOWN OF FAIRFIELD. CONNECTICUT
STATEMENT OF REVENUES, EXPENSES AND CHANGES IN FUND NET POSITION PROPRIETARY FUNDS
YEAR ENDED JUNE 30, 2015 (THOUSANDS)
OPERATING REVENUES: Charges for services ......................................................................................................... .. $
OPERATING EXPENSES: Claims incurred ................................................................................................................ . Administration ............................................................................................... .
TOTAL OPERATING EXPENSES .......................................................................... .
OPERATING INCOME (LOSS) ............................................................................................. .
NET POSITION-JULY 1, 2014 .............................................................................. .
NET POSITION - JUNE 30, 2015 ........................................................................... . $
See Notes to Financial Statements.
29
EXHIBIT H
GOVERNMENTAL ACTIVITIES
INTERNAL SERVICE FUND
43,637
42,098 2,405
44,503
(866)
(1 ,422)
(2,288)

TOWN OF FAIRFIELD, CONNECTICUT
STATEMENT OF CASH FLOWS PROPRIETARY FUNDS
YEAR ENDED JUNE 30, 2015 (THOUSANDS)
CASH FLOWS FROM OPERATING ACTIVITIES: Cash received for charges for services .............................................................. . Cash paid for benefits and claims ..................................................................... . Cash paid for administration ............................................................................ .
NET CASH PROVIDED BY (USED IN) OPERATING ACTIVITIES ............................. .
CASH FLOWS FROM INVESTING ACTIVITIES: Purchase of investments ................................................................................ .
NET INCREASE (DECREASE) IN CASH ............................................................. .
CASH-JULY 1, 2014 ....................................................................................... .
CASH - JUNE 30, 2015 .................................................................................... .
RECONCILIATION OF OPERATING INCOME (LOSS) TO NET CASH PROVIDED BY (USED IN) OPERATING ACTIVITIES:
Operating income (loss) ............................................................................. .
Adjustments to reconcile operating income (loss) to net cash provided by (used in) operating activities:
Increase (decrease) in: Accounts and other payables .............................................................. . Due to other funds ............................................................................ .
NET CASH PROVIDED BY (USED IN) OPERATING ACTIVITIES ............................. .
See Notes to Financial Statements,
30
$
$
$
$
EXHIBIT I
GOVERNMENTAL ACTIVITIES
INTERNAL SERVICE FUND
43,619 (40,678)
(2,377)
564
(564)
(866)
1,448 (18)
564
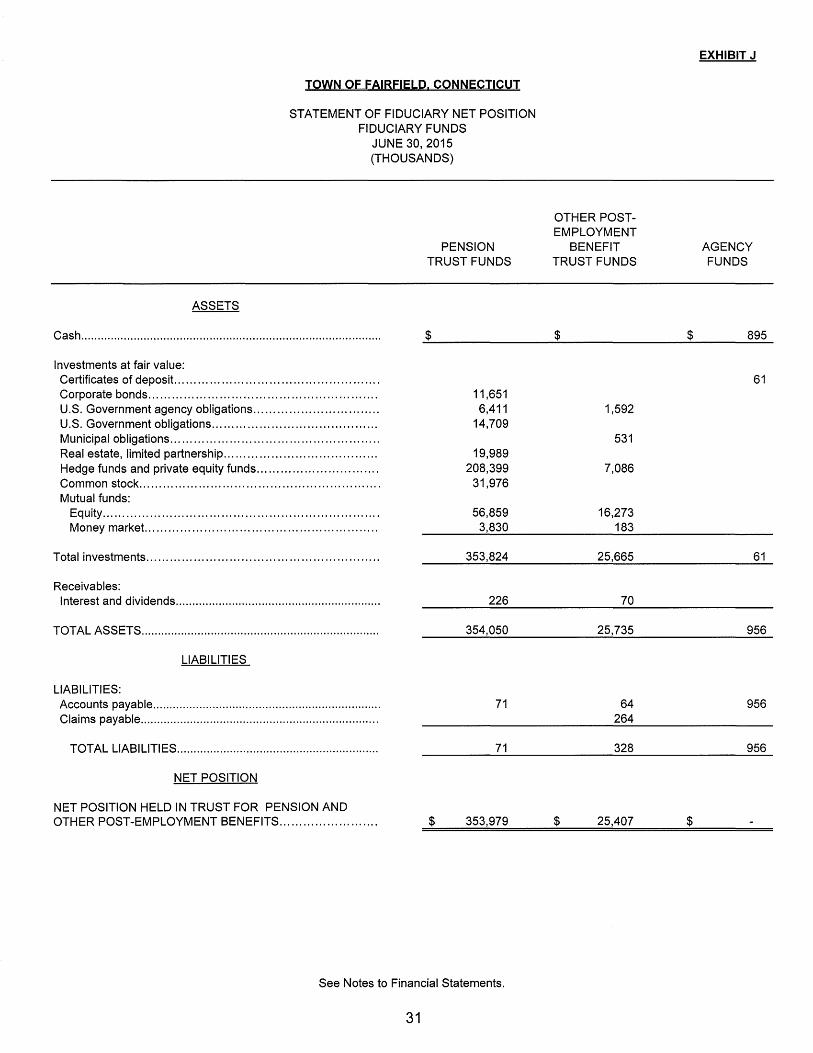
TOWN OF FAIRFIELD CONNECTICUT
STATEMENT OF FIDUCIARY NET POSITION FIDUCIARY FUNDS
JUNE 30, 2015 (THOUSANDS)
ASSETS
Cash ...........................................................................................
Investments at fair value: Certificates of deposit. ................................................... Corporate bonds .......................................................... U.S. Government agency obligations ................................ U.S. Government obligations .......................................... Municipal obligations ..................................................... Real estate, limited partnership ....................................... Hedge funds and private equity funds ............................... Common stock ............................................................. Mutual funds:
Equity ...................................................................... Money market. ..........................................................
Total investments ...........................................................
Receivables: Interest and dividends ..............................................................
TOTAL ASSETS ........................................................................
LIABILITIES
LIABILITIES: Accounts payable ..................................................................... Claims payable ........................................................................
TOTAL LIABILITIES .............................................................
NET POSITION
NET POSITION HELD IN TRUST FOR PENSION AND OTHER POST-EMPLOYMENT BENEFITS .........................
PENSION TRUST FUNDS
$
11,651 6,411
14,709
19,989 208,399
31,976
56,859 3,830
353,824
226
354,050
71
71
$ 353,979
See Notes to Financial Statements.
31
OTHER POSTEMPLOYMENT
BENEFIT TRUST FUNDS
$
1,592
531
7,086
16,273 183
25,665
70
25,735
64 264
328
$ 25,407
$
$
EXHIBIT J
AGENCY FUNDS
895
61
61
956
956
956

TOWN OF FAIRFIELD. CONNECTICUT
STATEMENT OF CHANGES IN FIDUCIARY NET POSITION FIDUCIARY FUNDS
YEAR ENDED JUNE 30, 2015 (THOUSANDS)
ADDITIONS: Contributions:
Employer ......................................................................... . Plan members .................................................................. . Other ............................................................................... .
Total contributions .................................................... .
Investment income (loss): Change in fair value of investments ................................... . Recoveries (Madoff) ........................................................... . Interest and dividends ........................................................ .
Total investment income (loss) ............................................ .
Less investment expenses ................................................. .
Net investment income (loss) ........................................... ..
TOTAL ADDITIONS .............................................................. .
DEDUCTIONS: Benefits ............................................................................. . Recovery expenses (Mad off) ............................................. . Administration ................................................................... ..
TOTAL DEDUCTIONS .......................................................... .
CHANGES IN NET POSITION ...................................... .
NET POSITION-JULY 1, 2014 .................................... ..
NET POSITION- JUNE 30, 2015 .................................. ..
$
$
PENSION TRUST FUNDS
10,056 1,922
11,978
5,334 355
4,185
9,874
696
9,178
21 '156
19,986 71
298
20,355
801
353,178
353,979
See Notes to Financial Statements.
32
EXHIBIT K
OTHER POSTEMPLOYMENT
BENEFIT TRUST FUNDS
$
$
9,638 243
60
9,941
203
346
549
2
547
10,488
5,596
264
5,860
4,628
20,779
25,407
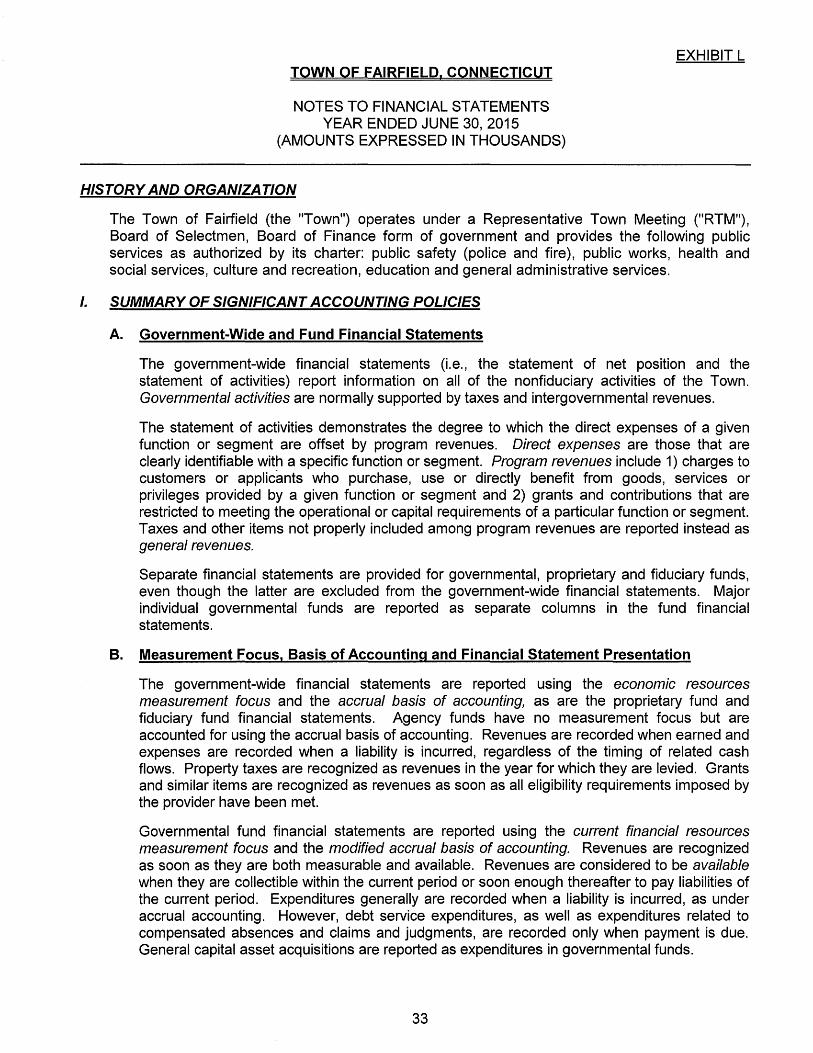
TOWN OF FAIRFIELD. CONNECTICUT
NOTES TO FINANCIAL STATEMENTS YEAR ENDED JUNE 30, 2015
(AMOUNTS EXPRESSED IN THOUSANDS)
HISTORY AND ORGANIZATION
EXHIBIT L
The Town of Fairfield (the "Town") operates under a Representative Town Meeting ("RTM"), Board of Selectmen, Board of Finance form of government and provides the following public services as authorized by its charter: public safety (police and fire), public works, health and social services, culture and recreation, education and general administrative services.
I. SUMMARY OF SIGNIFICANT ACCOUNTING POLICIES
A. Government-Wide and Fund Financial Statements
The government-wide financial statements (i.e., the statement of net position and the statement of activities) report information on all of the nonfiduciary activities of the Town. Governmental activities are normally supported by taxes and intergovernmental revenues.
The statement of activities demonstrates the degree to which the direct expenses of a given function or segment are offset by program revenues. Direct expenses are those that are clearly identifiable with a specific function or segment. Program revenues include 1) charges to customers or applicants who purchase, use or directly benefit from goods, services or privileges provided by a given function or segment and 2) grants and contributions that are restricted to meeting the operational or capital requirements of a particular function or segment. Taxes and other items not properly included among program revenues are reported instead as general revenues.
Separate financial statements are provided for governmental, proprietary and fiduciary funds, even though the latter are excluded from the government-wide financial statements. Major individual governmental funds are reported as separate columns in the fund financial statements.
B. Measurement Focus. Basis of Accounting and Financial Statement Presentation
The government-wide financial statements are reported using the economic resources measurement focus and the accrual basis of accounting, as are the proprietary fund and fiduciary fund financial statements. Agency funds have no measurement focus but are accounted for using the accrual basis of accounting. Revenues are recorded when earned and expenses are recorded when a liability is incurred, regardless of the timing of related cash flows. Property taxes are recognized as revenues in the year for which they are levied. Grants and similar items are recognized as revenues as soon as all eligibility requirements imposed by the provider have been met.
Governmental fund financial statements are reported using the current financial resources measurement focus and the modified accrual basis of accounting. Revenues are recognized as soon as they are both measurable and available. Revenues are considered to be available when they are collectible within the current period or soon enough thereafter to pay liabilities of the current period. Expenditures generally are recorded when a liability is incurred, as under accrual accounting. However, debt service expenditures, as well as expenditures related to compensated absences and claims and judgments, are recorded only when payment is due. General capital asset acquisitions are reported as expenditures in governmental funds.
33

EXHIBIT L TOWN OF FAIRFIELD, CONNECTICUT NOTES TO FINANCIAL STATEMENTS (CONTINUED)
I. SUMMARY OF SIGNIFICANT ACCOUNTING POLICIES (CONTINUED)
Property taxes, expenditure reimbursement type grants, certain intergovernmental revenues, transfers and interest associated with the current fiscal period are all considered to be susceptible to accrual and so have been recognized as revenues of the current fiscal period. For reimbursement grants, the Town considers revenues to be available if they are collected within one year of the end of the current fiscal period. Only the portion of special assessments receivable due within the current fiscal period is considered to be susceptible to accrual as revenue of the current period. All other revenue items are considered to be measurable and available only when cash is received by the Town.
The Town reports the following major governmental funds:
The General Fund is the government's primary operating fund. It accounts for all financial resources of the general government, except those required to be accounted for in another fund.
The Capital Projects Fund accounts for the financial revenues to be used for major capital asset construction and/or purchases. The types of revenues recorded in this fund are grant revenue, contributions and other fees.
Additionally, the Town reports the following fund types:
The Internal Service Fund accounts for risk financing activities for medical insurance benefits and other self-insured risks.
The Pension Trust Funds account for the activities of the Town Employees' Retirement Plan and the Police and Fire Retirement Plan, which accumulates resources for pension benefit payments to qualified employees.
The Other Post-Employment Benefit Trust Funds account for the activities of the Town and Police and Fire OPES Plan, which accumulates resources for retiree medical and life insurance benefits.
The Agency Funds account for monies held on behalf of students.
As a general rule, the effect of interfund activity has been eliminated from the government-wide financial statements. Exceptions are charges between certain Town functions because the elimination of these charges would distort the direct costs and program revenues reported for the various functions concerned.
Amounts reported as program revenues include 1) charges to customers or applicants for goods, services or privileges provided, 2) operating grants and contributions and 3) capital grants and contributions, including special assessments. Internally dedicated resources are reported as general revenues rather than as program revenues. Likewise, general revenues include all taxes.
34

EXHIBIT L TOWN OF FAIRFIELD, CONNECTICUT NOTES TO FINANCIAL STATEMENTS (CONTINUED)
I. SUMMARY OF SIGNIFICANT ACCOUNTING POLICIES (CONTINUED)
Proprietary funds distinguish operating revenues and expenses from nonoperating items. Operating revenues and expenses generally result from providing services and producing and delivering goods in connection with a proprietary fund's principal ongoing operations. The principal operating revenues of the Town's internal service fund are charges to Town Departments for various types of self-insurance. Operating expenses for the internal service fund includes the cost of insurance and administrative expenses. All revenues and expenses not meeting this definition are reported as nonoperating revenues and expenses.
Pensions - For purposes of measuring the net pension liability, deferred outflows of resources and deferred inflows of resources related to pensions and pension expense, information about the fiduciary net position and additions to/deductions from fiduciary net position of the Town of Fairfield pension plans and the Connecticut State Teachers' Retirement System (TRS) have been determined on the same basis as they are reported by the Town of Fairfield pension plans and TRS. For this purpose, benefit payments (including refunds of employee contributions) are recognized when due and payable in accordance with benefit terms.
C. Assets, Liabilities. Deferred Outflows/Inflows of Resources and Net Position or Equity
1. Deposits and Investments
Deposits - The Town considers cash and cash equivalents as cash on hand, demand deposits, money market accounts and short-term investments with original maturities of three months or less from the date of acquisition.
Investments - In general, State of Connecticut Statutes allow the Town to invest in obligations of the United States of America or United States government sponsored corporations, in shares or other interests in any custodial arrangement, pool, or no-load, open-end management type investment company or investment trust (as defined), in obligations of any state or political subdivision rated within the top two rating categories of any nationally recognized rating service, or in obligations of the State of Connecticut or political subdivision rated within the top three rating categories of any nationally recognized rating service. Investment income is recorded in the fund in which it was earned.
Investments for the Town are reported at fair value. State Treasurers Investment Fund is an investment pool managed by the State of Connecticut Office of the State Treasurer. Investments must be made in instruments authorized by Connecticut General Statutes 3-27c- 3-27e. Investment guidelines are adopted by the State Treasurer. The fair value of the position in the pool is the same as the value of the pool shares. The balance of the pooled fixed income investments was invested in a 2a-7 like pool, which operates under State Statutes. The fair value of the position in the pool is the same as the value of the pool shares.
The Town's pension plan investment policy targets investment in equities of 50%, fixed income of 30%, hedge funds of 1 0°/o, commodities and real estate of 8°/o and cash of 2°/o.
35
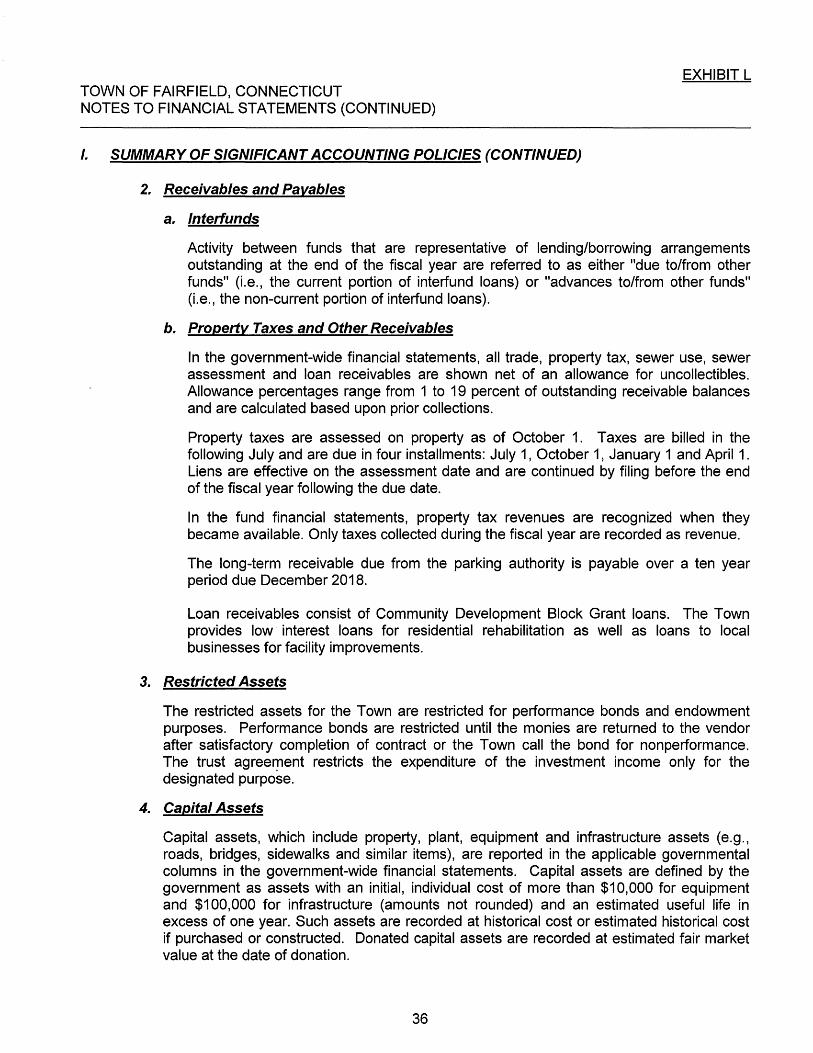
TOWN OF FAIRFIELD, CONNECTICUT NOTES TO FINANCIAL STATEMENTS (CONTINUED)
I. SUMMARY OF SIGNIFICANT ACCOUNTING POLICIES (CONTINUED)
2. Receivables and Payables
a. lnterlunds
EXHIBIT L
Activity between funds that are representative of lending/borrowing arrangements outstanding at the end of the fiscal year are referred to as either "due to/from other funds" (i.e., the current portion of interfund loans) or "advances to/from other funds" (i.e., the non-current portion of interfund loans).
b. Properly Taxes and Other Receivables
In the government-wide financial statements, all trade, property tax, sewer use, sewer assessment and loan receivables are shown net of an allowance for uncollectibles. Allowance percentages range from 1 to 19 percent of outstanding receivable balances and are calculated based upon prior collections.
Property taxes are assessed on property as of October 1. Taxes are billed in the following July and are due in four installments: July 1, October 1, January 1 and April 1. Liens are effective on the assessment date and are continued by filing before the end of the fiscal year following the due date.
In the fund financial statements, property tax revenues are recognized when they became available. Only taxes collected during the fiscal year are recorded as revenue.
The long-term receivable due from the parking authority is payable over a ten year period due December 2018.
Loan receivables consist of Community Development Block Grant loans. The Town provides low interest loans for residential rehabilitation as well as loans to local businesses for facility improvements.
3. Restricted Assets
The restricted assets for the Town are restricted for performance bonds and endowment purposes. Performance bonds are restricted until the monies are returned to the vendor after satisfactory completion of contract or the Town call the bond for nonperformance. The trust agreerpent restricts the expenditure of the investment income only for the designated purpose.
4. Capital Assets
Capital assets, which include property, plant, equipment and infrastructure assets (e.g., roads, bridges, sidewalks and similar items), are reported in the applicable governmental columns in the government-wide financial statements. Capital assets are defined by the government as assets with an initial, individual cost of more than $10,000 for equipment and $100,000 for infrastructure (amounts not rounded) and an estimated useful life in excess of one year. Such assets are recorded at historical cost or estimated historical cost if purchased or constructed. Donated capital assets are recorded at estimated fair market value at the date of donation.
36

EXHIBIT L TOWN OF FAIRFIELD, CONNECTICUT NOTES TO FINANCIAL STATEMENTS (CONTINUED)
I. SUMMARY OF SIGNIFICANT ACCOUNTING POLICIES (CONTINUED)
4. Capital Assets (Continued)
The costs of normal maintenance and repairs that do not add to the value of the asset or materially extend assets' lives are not capitalized.
Major outlays for capital assets and improvements are capitalized as projects are constructed.
Property, plant and equipment of the primary government are depreciated using the straight-line method over the following estimated useful lives:
Assets
Land improvements Buildings and improvements Machinery and equipment Vehicles Infrastructure Intangible assets (software)
5. Deferred Outflows/Inflows of Resources
Years
20 45
5-20 6-15 20-70
10
In addition to assets, the statement of net position will sometimes report a separate section for deferred outflows of resources. This separate financial statement element, deferred outflows of resources, represents a consumption of net position that applies to a future period(s) and so will not be recognized as an outflow of resources (expense/expenditure) until then. The Town reports deferred outflows of resources related to pensions for changes in assumptions and net difference between projected and actual earnings of the pension plan investments. The deferred outflow related to the change in assumptions will be amortized over the average remaining service life of all plan members. The deferred outflow for the net difference between projected and actual earnings of the pension plan investments will be amortized over a five year period. The Town also reports a deferred charge on refunding which results from the difference in the carrying value of refunded debt and its reacquisition price. This amount is deferred and amortized over the shorter of the life of the refunded or refunding debt.
In addition to liabilities, the statement of net position will sometimes report a separate section for deferred inflows of resources. This separate financial statement element, deferred inflows of resources, represents an acquisition of net position that applies to a future period(s) and so will not be recognized as an inflow of resources (revenue) until that time. The Town reports a deferred inflow related to pensions for the differences between expected and actual experience of the pension plan.
For governmental funds, the Town reports unavailable revenue, which arises only under the modified accrual basis of accounting. Accordingly, unavailable revenue is reported only in the governmental funds' balance sheet. The governmental funds report unavailable revenues from several sources: property taxes (including advance collections, if any), sewer assessment and user charges, certain other charges for services and loans. These amounts are deferred and recognized as an inflow of resources in the period that the amounts become available.
37
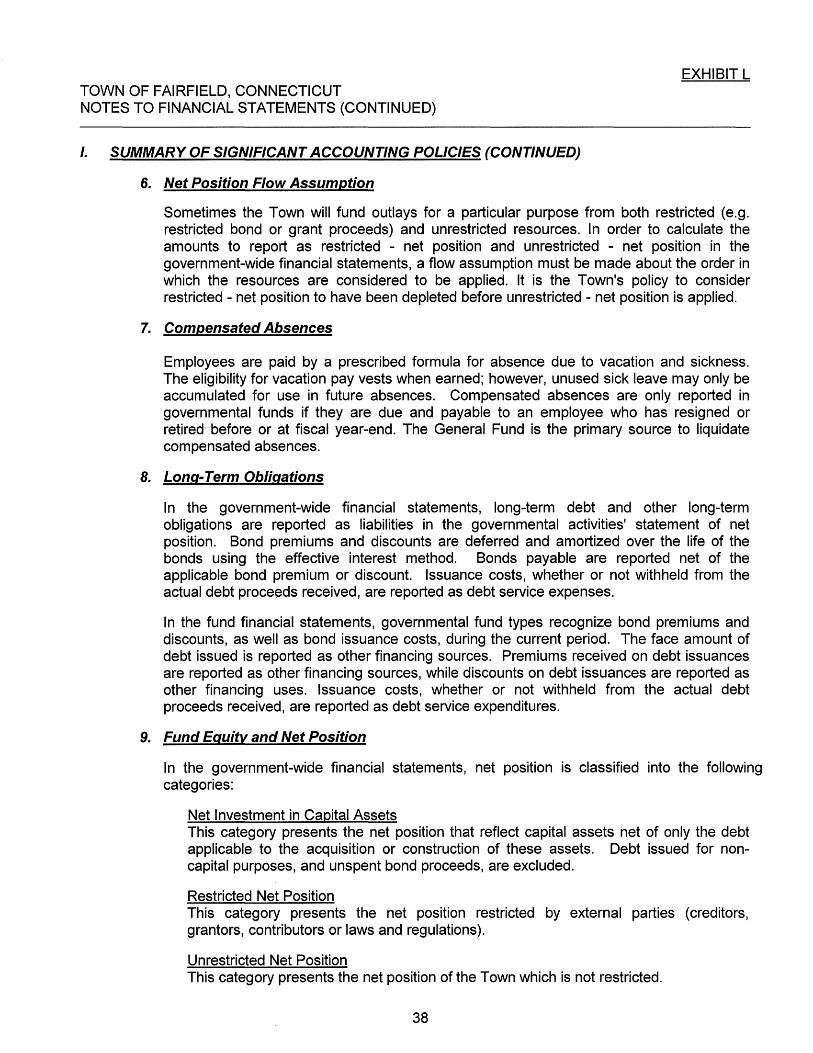
EXHIBIT L TOWN OF FAIRFIELD, CONNECTICUT NOTES TO FINANCIAL STATEMENTS (CONTINUED)
I. SUMMARY OF SIGNIFICANT ACCOUNTING POLICIES (CONTINUED)
6. Net Position Flow Assumption
Sometimes the Town will fund outlays for a particular purpose from both restricted (e.g. restricted bond or grant proceeds) and unrestricted resources. In order to calculate the amounts to report as restricted - net position and unrestricted - net position in the government-wide financial statements, a flow assumption must be made about the order in which the resources are considered to be applied. It is the Town's policy to consider restricted- net position to have been depleted before unrestricted- net position is applied.
7. Compensated Absences
Employees are paid by a prescribed formula for absence due to vacation and sickness. The eligibility for vacation pay vests when earned; however, unused sick leave may only be accumulated for use in future absences. Compensated absences are only reported in governmental funds if they are due and payable to an employee who has resigned or retired before or at fiscal year-end. The General Fund is the primary source to liquidate compensated absences.
B. Long-Term Obligations
In the government-wide financial statements, long-term debt and other long-term obligations are reported as liabilities in the governmental activities' statement of net position. Bond premiums and discounts are deferred and amortized over the life of the bonds using the effective interest method. Bonds payable are reported net of the applicable bond premium or discount. Issuance costs, whether or not withheld from the actual debt proceeds received, are reported as debt service expenses.
In the fund financial statements, governmental fund types recognize bond premiums and discounts, as well as bond issuance costs, during the current period. The face amount of debt issued is reported as other financing sources. Premiums received on debt issuances are reported as other financing sources, while discounts on debt issuances are reported as other financing uses. Issuance costs, whether or not withheld from the actual debt proceeds received, are reported as debt service expenditures.
9. Fund Equity and Net Position
In the government-wide financial statements, net position is classified into the following categories:
Net Investment in Capital Assets This category presents the net position that reflect capital assets net of only the debt applicable to the acquisition or construction of these assets. Debt issued for noncapital purposes, and unspent bond proceeds, are excluded.
Restricted Net Position This category presents the net position restricted by external parties (creditors, grantors, contributors or laws and regulations).
Unrestricted Net Position This category presents the net position of the Town which is not restricted.
38
EXHIBIT L TOWN OF FAIRFIELD, CONNECTICUT NOTES TO FINANCIAL STATEMENTS (CONTINUED)
I. SUMMARY OF SIGNIFICANT ACCOUNTING POLICIES (CONTINUED)
9. Fund Equity and Net Position (Continued)
In the fund financial statements, fund balances are classified into the following categories:
Nonspendable This category presents amounts that cannot be spent either because they are in nonspendable form or because they are legally or contractually required to be maintained intact.
Restricted This category· presents amounts that can be spent only for specific purposes because of enabling legislation or because of constraints that are externally imposed by creditors, grantors, contributors, or the laws or regulations of other governments.
Committed This category presents amounts that can be used only for specific purposes determined by a formal action of the highest level of decision-making authority for the Town. Commitments may be established, modified or rescinded only through resolutions approved by the Board of Finance.
Assigned This category presents amounts that do not meet the criteria to be classified as restricted or committed but that are intended to be used for specific purposes. Intent is expressed by the approval of a resolution by the Board of Finance or by a properly approved purchase order (encumbrances).
Unassigned This category presents amounts that do not meet the criteria above and are available for any purpose. This category is only reported in the general fund for positive amounts and in any other fund that has a fund balance deficit.
When an expenditure is incurred for purposes for which both restricted and unrestricted fund balance is available, the Town considers restricted funds to have been spent first. When an expenditure is incurred for which committed, assigned or unassigned fund balances are available, the Town considers amounts to have been spent first out of committed funds, then assigned funds and finally unassigned funds, as needed, unless Board of Finance or the finance committee has provided otherwise in its commitment or assignment actions.
Minimum Fund Balance Policy The Board of Finance has adopted a minimum fund balance policy for the General Fund. The policy establishes the intent to maintain a level of unassigned fund balance of at least 7 .25°/o to 11 °/o of annual budgeted expenditures. Further, once unassigned fund balance is greater than 8%, the Board of Finance may transfer any excess above 8% to the Town's Internal Service Fund.
39

EXHIBIT L TOWN OF FAIRFIELD, CONNECTICUT NOTES TO FINANCIAL STATEMENTS (CONTINUED)
I. SUMMARY OF SIGNIFICANT ACCOUNTING POLICIES (CONTINUED)
10. Use of Estimates
The preparation of the financial statements in conformity with accounting principles generally accepted in the United States of America requires management to make estimates and assumptions that affect the reported amounts of assets and liabilities including disclosures of contingent assets and liabilities and reported revenues, expenses and expenditures during the fiscal year. Accordingly, actual results could differ from those estimates.
11. Reclassifications
Certain amounts presented in the prior year data have been reclassified in order to be consistent with the current year's presentation.
II. STEWARDSHIP, COMPLIANCE AND ACCOUNTABILITY
A. Budgets and Budgetary Accounting
The Town adheres to the following procedures in establishing the budgetary data included in the general fund financial statements. The operating budget, which is prepared by function and department, includes proposed expenditures and the means of financing them.
• Annually in May, the proposed budget is presented at a Representative Town Meeting, at which taxpayer comments are obtained. Prior to July 1, the budget is legally enacted through passage of a resolution.
• The Board of Finance is authorized to transfer budgeted amounts within departments. However, any revisions that alter the total expenditures of any department must be approved at a Representative Town Meeting. There were no additional appropriations.
• Formal budgetary integration is employed as a management control device during the year.
• The legal level of control (the level at which expenditures may not legally exceed appropriations) is.at the department level.
• The Board of Education is authorized under state law to make any transfers required within their budget at their discretion. Additionally, as required by the Charter, these transfers must be reported to the Board of Selectmen. Any additional appropriations must have Board of Education and Board of Selectmen approval and, if over one-half of one percent of the annual budget, Town Meeting approval.
• Encumbrances are recognized as a valid and proper charge against a budget appropriation in the year in which the purchase order, contract or other commitment is issued and, accordingly, encumbrances outstanding at year end are reported in budgetary reports (Exhibit F) as expenditures in the current year. Generally, all unencumbered appropriations lapse at year end, except those for the capital projects funds and those specifically reappropriated by the Board of Finance.
40

TOWN OF FAIRFIELD, CONNECTICUT NOTES TO FINANCIAL STATEMENTS (CONTINUED)
II. STEWARDSHIP, COMPLIANCE AND ACCOUNTABILITY (CONTINUED)
A. Budgets and Budgetary Accounting (Continued)
EXHIBIT L
• In addition to the general fund, the Water Pollution Control Authority ("WPCA") Fund has a legally adopted annual operating budget. The control level on which expenditures may not legally exceed appropriations is the fund level. Appropriations for capital projects are continued until completion of applicable projects, even when projects extend more than one fiscal year.
B. Budget - GAAP Reconciliation
A reconciliation of revenues, expenditures and fund balance between the accounting treatment required by GAAP (Exhibit D) and budgetary requirements (Exhibit F) is as follows:
FUND REVENUES EXPENDITURES BALANCE
BALANCE, BUDGETARY BASIS, EXHIBIT F- JUNE 30, 2015 ................................... $ 286,881 $ 280,978 $ 24,260
Encumbrances outstanding at June 30, 2014, liquidated during the year ended June 30, 2015 ..... 713
Encumbrances outstanding at June 30, 2014 and 2015 .................................................................. 4
Encumbrances outstanding at June 30, 2015, charged to budgetary expenditures ......................... (859) 859
On behalf amount for the State contribution to teachers' retirement system ..... .' .............................................. 16 265 16 265
BALANCE, GAAP BASIS, EXHIBIT D-JUNE 30, 2015 ........................................................ $ 303:146 $ 291091 $ 25 :123
41

TOWN OF FAIRFIELD, CONNECTICUT NOTES TO FINANCIAL STATEMENTS (CONTINUED)
II. STEWARDSHIP. COMPLIANCE AND ACCOUNTABILITY (CONTINUED)
C. Capital Projects Authorizations
The following is a summary of Capital Projects at June 30, 2015:
PROJECT NAME
Infrastructure improvements ........................... .. MUNIS ............................................................. . School annexes ............................................... . W.P.C.A. facility improvements ...................... .. Penfield Pavilion .............................................. . Tomlinson Middle School renovation ............... . Black Rock Train .Station ................................. . Stratfield Elementary renovation ...................... . FWMS renovation ............................................ . FWHS roof ....................................................... . FLHS windows ................................................. . Sherman Elementary renovation ..................... . Roof Warranty extension ................................. . Riverfield School renovation ............................ . Storm Sandy facilities restoration .................... . Osborn Hill remediation .................................. .. FLHS expansion .............................................. . Penfield repair and restoration ........................ .. Kings Highway/Commerce Drive ..................... . WPCF improvements ...................................... . Capital projects ................................................ . Nonrecurring capital projects ........................... . Harbor Road Bridge ......................................... . Fire Suppression Line ...................................... . Flood construction ........................................... . Mill Plain Road Bridge .................................... .. Golf course expansion .................................... ..
TOTAL ............................................................. .
PROJECT CUMULATIVE AUTHORIZATION EXPENDITURES
$ 1,200 1,690 3,495 5,139 4,976
31,797 17,500 17,565 24,453 11,035
40 3,050
725 16,600 5,156 4,536
11,630 6,029 2,000 5,588
22,374 26,887 3,900 2,655
640 380 100
$ 231 140
(THOUSANDS)
$ 724 1,585 3,461 5,109 4,850
31,794 44,882 17,391 24,445
5,678 38
2,850 679
9,770 2,679 3,534 5,871
136 46
13,602 25,437
3,588 2,625
530 379 47
$ 211 730
EXHIBIT L
BALANCE JUNE 30. 2015
$ 476 105 34 30
126 3
(27,382)* 174
8 5,357
2 200 46
6,830 2,477 1,002 5,759 5,893 1,954 5,588 8,772 1,450
312 30
110 1
53
$ 19 410
*Cumulative expenditures for the Black Rock Train Station exceed the project authorization at June 30, 2015. The original project was modified in 2010 by the Town and the state to have the Town complete additional portions of the project. The state provided the funding to the Town for completion of the additional work. The Town accepted the grants and related project responsibility but did not resubmit the project to the various Town governing bodies for formal approval of the increased project amount. In August 2011, the Town submitted to the Town governing bodies a request for additional funding that was determined to be necessary to complete the project. The requested additional funding was approved by the respective governing bodies. The project is expected to be closed by June 30, 2016.
D. Donor-Restricted Endowments
The Town has received certain endowments for the improvement and betterment of Fairfield public schools. The amounts are reflected in net position as restricted for endowments. Investment income is approved for disbursement by the Board of Education or the applicable Trustee and is included in restricted fund balance. At June 30, 2015, net appreciation available for appropriation is $31 from the H. Smith Richardson Conservation Fund.
42

EXHIBIT L TOWN OF FAIRFIELD, CONNECTICUT NOTES TO FINANCIAL STATEMENTS (CONTINUED)
Ill. DETAILED NOTES
A. Cash and Investments
Deposits - Custodial Credit Risk - Custodial credit risk is the risk that, in the event of a bank failure, the Town's deposits may not be returned to it. The Town does not have a deposit policy for custodial credit risk. As of June 30, 2015, $25,876 of the Town's bank balance of $29,561 was exposed to custodial credit risk as follows:
Uninsured and uncollateralized .......................................... . Uninsured and collateral held by the pledging bank's
trust department, not in the Town's name ....................... .
Total amount subject to custodial credit risk .................. ..
$ 23,114
2,762
$ 25 876
Financial instruments that potentially subject the Town to significant concentrations of credit risk consist primarily of cash. From time to time, the Town's cash account balances exceed the Federal Deposit Insurance Corporation limit. The Town reduces its credit risk by maintaining its cash deposits with major financial institutions and monitoring their credit ratings.
At June 30, 2015, the Town's investments (including restricted investments) consisted of the following:
INVESTMENT MATURITIES (IN YEARS)
FAIR LESS 1-5 5-10 OVER TYPE OF INVESTMENT VALUE N/A THAN 1 YEARS YEARS 10
Mutual Funds: Equity .................................................. $ 73,418 $ 73,418 $ $ $ $ Money Market. .................................... 4,525 4,525 Fixed Income Funds ........................... 106 106
Hedge Funds and Private Equity Funds 215,485 208,399 7,086 Certificates of Deposit .......................... 23,651 23,651 Pooled Fixed Income ............................ 8,664 8,664 U.S. Government Obligations ............... 14,777 2,069 6,117 2,937 3,654 U.S. Government Agency Obligations .. 34,226 26,564 7,662 Common Stock ..................................... 31,976 31,976 Real Estate Limited Partnership ........... 19,989 19,989 Municipal Obligations ........................... 8,312 272 8,040 Corporate Bonds .................................. 16 376 62 8 391 2 935 4 988
TOTAL .................................................. $ 45:1 505 $333 782 $ 39349 $ 49:1:12 $ 20620 $ 8 642
43
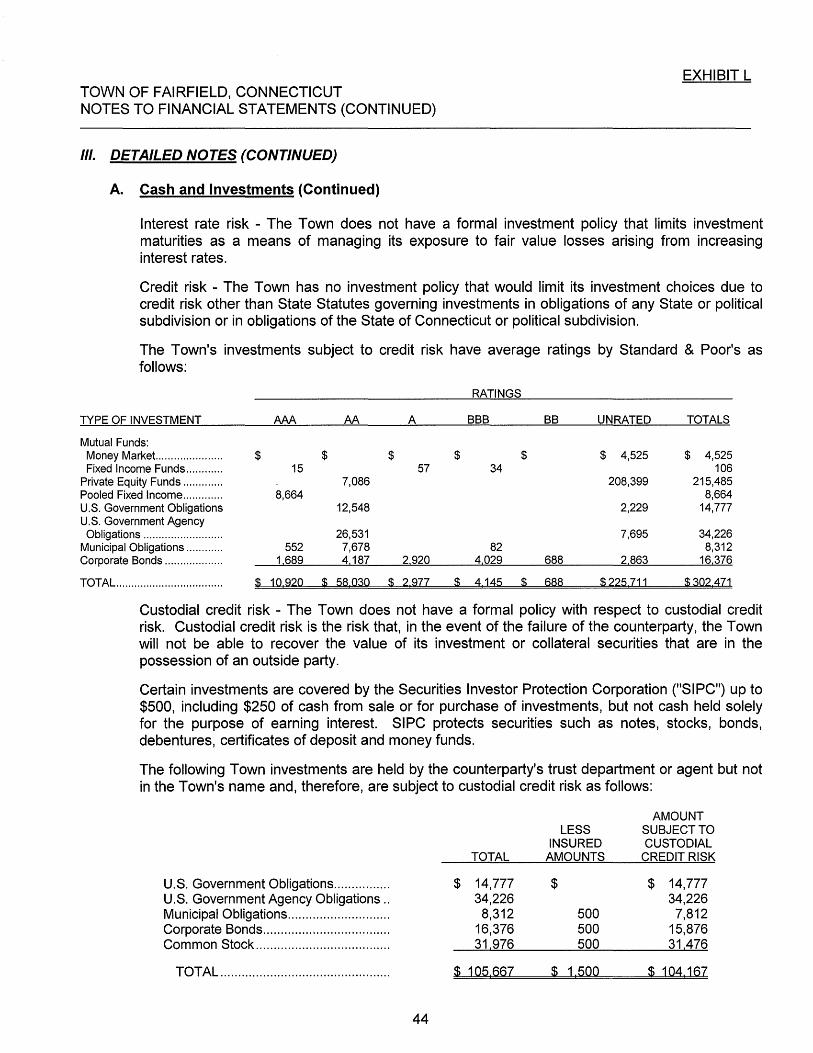
EXHIBIT L TOWN OF FAIRFIELD, CONNECTICUT NOTES TO FINANCIAL STATEMENTS (CONTINUED)
Ill. DETAILED NOTES (CONTINUED)
A. Cash and Investments (Continued)
Interest rate risk - The Town does not have a formal investment policy that limits investment maturities as a means of managing its exposure to fair value losses arising from increasing interest rates.
Credit risk - The Town has no investment policy that would limit its investment choices due to credit risk other than State Statutes governing investments in obligations of any State or political subdivision or in obligations of the State of Connecticut or political subdivision.
The Town's investments subject to credit risk have average ratings by Standard & Poor's as follows:
TYPE OF INVESTMENT
Mutual Funds: Money Market.. ................... . Fixed Income Funds .......... ..
Private Equity Funds ............ . Pooled Fixed Income ............ . U.S. Government Obligations U.S. Government Agency Obligations ........................ ..
Municipal Obligations .......... ..
$
AAA AA
$ 15
7,086 8,664
12,548
26,531 7,678
RATINGS
A BBB BB UNRATED TOTALS
$ $ $ $ 4,525 $ 4,525 57 34 106
208,399 215,485 8,664
2,229 14,777
7,695 34,226 82 8,312
Corporate Bonds .................. . 552
1.689 4.187 2.920 4.029 688 2.863 16.376
TOTAL .................................. . $ 10 920 $ 58 030 $ 2 977 $ 4 145 $ 688 $225 711 $302 471
Custodial credit risk - The Town does not have a formal policy with respect to custodial credit risk. Custodial credit risk is the risk that, in the event of the failure of the counterparty, the Town will not be able to recover the value of its investment or collateral securities that are in the possession of an outside party.
Certain investments are covered by the Securities Investor Protection Corporation ("SIPC") up to $500, including $250 of cash from sale or for purchase of investments, but not cash held solely for the purpose of earning interest. SIPC protects securities such as notes, stocks, bonds, debentures, certificates of deposit and money funds.
The following Town investments are held by the counterparty's trust department or agent but not in the Town's name and, therefore, are subject to custodial credit risk as follows:
AMOUNT LESS SUBJECT TO
INSURED CUSTODIAL TOTAL AMOUNTS CREDIT RISK
U.S. Government Obligations .............. .. $ 14,777 $ $ 14,777 U.S. Government Agency Obligations .. 34,226 34,226 Municipal Obligations ............................ . 8,312 500 7,812 Corporate Bonds ................................... . 16,376 500 15,876 Common Stock ..................................... . 31 976 500 31 476
TOTAL ............................................... . ~ 105 66Z ~ j 5QQ ~ 104 16Z
44
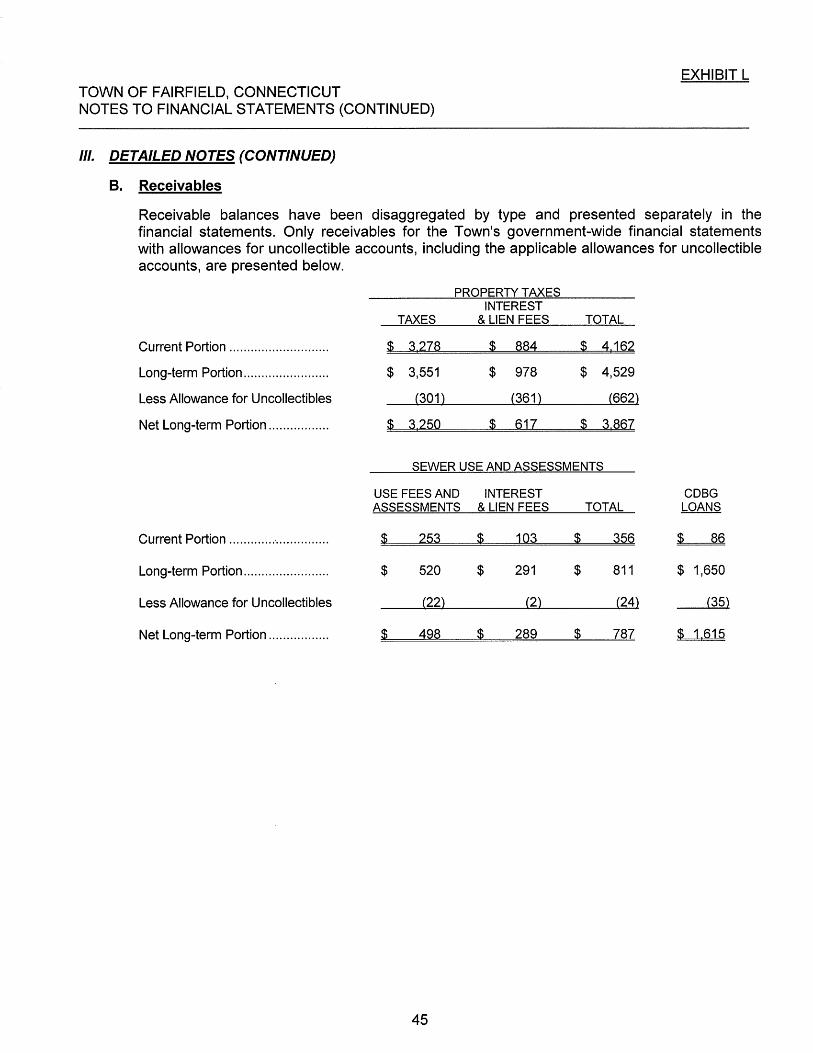
EXHIBIT L TOWN OF FAIRFIELD, CONNECTICUT NOTES TO FINANCIAL STATEMENTS (CONTINUED)
Ill. DETAILED NOTES (CONTINUED)
B. Receivables
Receivable balances have been disaggregated by type and presented separately in the financial statements. Only receivables for the Town's government-wide financial statements with allowances for uncollectible accounts, including the applicable allowances for uncollectible accounts, are presented below.
PROPERTY TAXES INTEREST
TAXES & LIEN FEES TOTAL
Current Portion ........................... . ~ 3 2Z8 ~ 884 ~ 4 j62
Long-term Portion ....................... . $ 3,551 $ 978 $ 4,529
Less Allowance for Uncollectibles (301} (361} (662}
Net Long-term Portion ................ . $ 3 250 $ 6j7 $ 3 86Z
SEWER USE AND ASSESSMENTS
USE FEES AND INTEREST CDBG ASSESSMENTS & LIEN FEES TOTAL LOANS
Current Portion ........................... . $ 253 $ j03 $ 356 $ 86
Long-term Portion ....................... . $ 520 $ 291 $ 811 $ 1,650
Less Allowance for Uncollectibles (22} (2} (24} (35}
Net Long-term Portion ................ . $ 498 $ 289 $ Z8Z $ j 615
45

TOWN OF FAIRFIELD, CONNECTICUT NOTES TO FINANCIAL STATEMENTS (CONTINUED)
Ill. DETAILED NOTES (CONTINUED)
C. Capital Assets
Capital asset activity for the year ended June 30, 2015 was as follows:
BALANCE JULY 1, 2014 INCREASES DECREASES
(THOUSANDS)
CaQital Assets, not being DeQreciated: Land .......................................................... $ 33,191 $ $ Construction in progress ........................... 15,242 21.796 2,672
Total Capital Assets, not being Depreciated ... 48.433 21.796 2,672
CaQital Assets, being DeQreciated: Land improvements .................................. 1,582 465 Buildings and improvements .................... 466,587 4,173 2,320 Vehicles .................................................... 17,861 1,555 880 Machinery and equipment ........................ 16,597 128 493 Intangible assets ....................................... 1,278 Infrastructure ............................................. 142,315 295 25
Total Capital Assets, being Depreciated ......... 646,220 6,616 3.718
Total Capital Assets ......................................... 694,653 28.412 6.390
Less Accumulated DeQreciation for: Land improvements .................................. 732 66 Buildings and improvements .................... 120,007 9,530 268 Vehicles .................................................... 13,967 894 801 Machinery and equipment ........................ 7,399 868 395 Intangible assets ....................................... 629 125 Infrastructure ............................................. 78671 2 594 19
Total Accumulated Depreciation ...................... 221,405 14,077 1,483
Total Capital Assets, being Depreciated, net.. 424,815 (7,461} 2,235
Governmental Activities Capital Assets, net ... $ 4Z3 248 $ j4 335 $ 4 90Z
Depreciation expense was charged to functions/programs of the Town as follows:
General government .................................................... . Finance ......................................................................... . Public safety ................................................................. . Public works ................................................................. . Health and welfare ....................................................... . Culture and recreation .................................................. . Education ..................................................................... .
Total Depreciation Expense ................................ .
46
$ 126 200 753
4,297 51
655 7,995
$ 14 077
EXHIBIT L
BALANCE JUNE 30, 2015
$ 33,191 34.366
67,557
2,047 468,440
18,536 16,232
1,278 142.585
649,118
716,675
798 129,269
14,060 7,872
754 81246
233,999
415,119
$ 482 6Z6
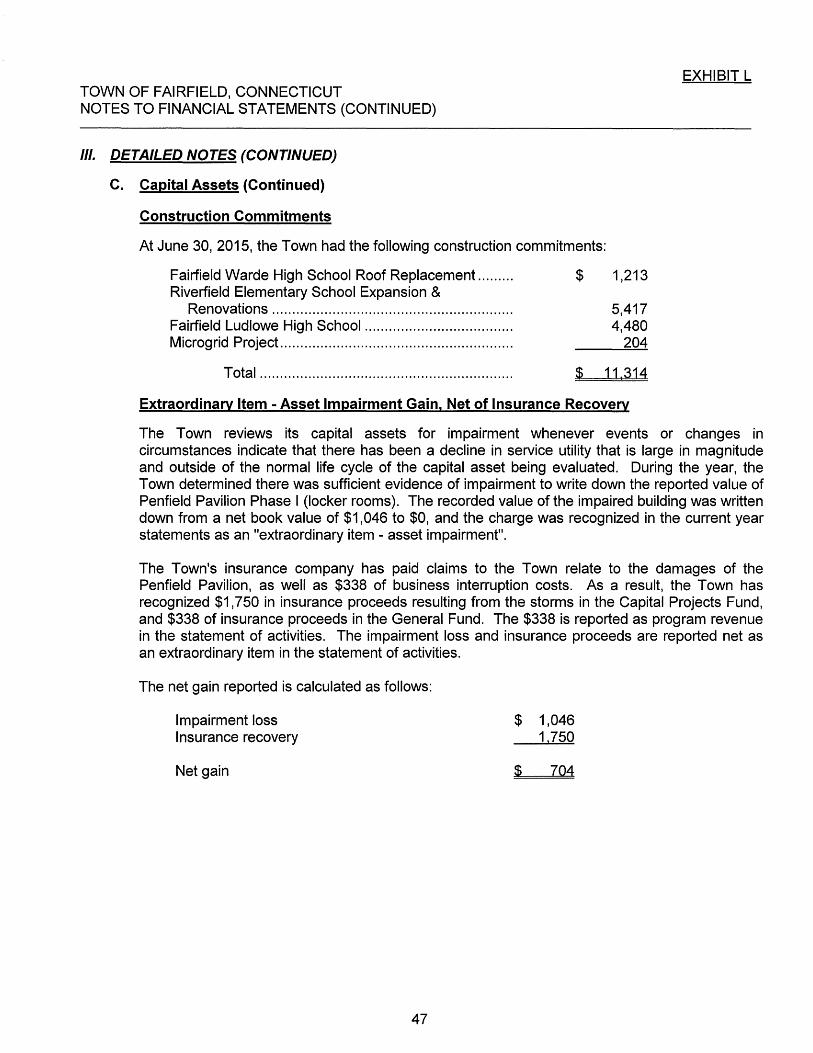
TOWN OF FAIRFIELD, CONNECTICUT NOTES TO FINANCIAL STATEMENTS (CONTINUED)
Ill. DETAILED NOTES (CONTINUED)
C. Capital Assets (Continued)
Construction Commitments
At June 30, 2015, the Town had the following construction commitments:
Fairfield Warde High School Roof Replacement ........ . Riverfield Elementary School Expansion &
Renovations ........................................................... . Fairfield Ludlowe High School .................................... . Microgrid Project ......................................................... .
Total .............................................................. .
$ 1,213
5,417 4,480
204
$ 11 314
Extraordinary Item -Asset Impairment Gain, Net of Insurance Recovery
EXHIBIT L
The Town reviews its capital assets for impairment whenever events or changes in circumstances indicate that there has been a decline in service utility that is large in magnitude and outside of the normal life cycle of the capital asset being evaluated. During the year, the Town determined there was sufficient evidence of impairment to write down the reported value of Penfield Pavilion Phase I (locker rooms). The recorded value of the impaired building was written down from a net book value of $1,046 to $0, and the charge was recognized in the current year statements as an "extraordinary item- asset impairment".
The Town's insurance company has paid claims to the Town relate to the damages of the Penfield Pavilion, as well as $338 of business interruption costs. As a result, the Town has recognized $1,750 in insurance proceeds resulting from the storms in the Capital Projects Fund, and $338 of insurance proceeds in the General Fund. The $338 is reported as program revenue in the statement of activities. The impairment loss and insurance proceeds are reported net as an extraordinary item in the statement of activities.
The net gain reported is calculated as follows:
Impairment loss Insurance recovery
Net gain
47
$ 1,046 1.750
$ 704

EXHIBIT L TOWN OF FAIRFIELD, CONNECTICUT NOTES TO FINANCIAL STATEMENTS (CONTINUED)
Ill. DETAILED NOTES (CONTINUED)
D. lnterfund Accounts
1. lnterlund Payables and Receivables
A summary of interfund balances as of June 30, 2015 is as follows:
CORRESPONDING MAJOR FUNDS FUND DUE FROM DUE TO
GENERAL FUND: Special Revenue Funds- Town ................... N/A $ 1,039 $ Capital Projects Fund ................................... N/A 2,684 Internal Service Fund .................................... N/A 17
TOTAL GENERAL FUND ................................. 3 740
CAPITAL PROJECTS FUND ......................... General Fund 2684
NONMAJOR FUNDS SPECIAL REVENUE FUNDS:
Special Revenue Funds- Town ................... General Fund 1 039
INTERNAL SERVICE FUND ............................ General Fund 17
GRAND TOTAL ................................................ $ 3Z40 $ 3 Z40
All interfund balances resulted from the time lag between the dates payments occurred between funds for interfund goods, payroll and services provided or in instances where certain funds do not have an operation cash account.
2. lnterlund Transfers
A summary of interfund transfers for the year ended June 30, 2015 is as follows:
MAJOR FUNDS:
GENERAL FUND: Special Revenue Funds ............................... . Debt Service Fund ....................................... . Capital Projects Fund ................................. ..
TOTAL GENERAL FUND ................................ .
CAPITAL PROJECTS FUND: Capital Projects Fund ................................. ..
NONMAJOR FUNDS: Special Revenue Funds ............................... . Debt Service Fund ....................................... .
TOTAL NONMAJOR FUNDS ......................... ..
GRAND TOTAL ............................................... .
CORRESPONDING FUND TRANSFERS IN TRANSFERS OUT
N/A N/A N/A
General Fund
General Fund General Fund
$
$
46
46
2 987
53 253
306
3339
$ 53 253
2 987
3293
46
$ 3339
Transfers are used to move budgeted appropriations from the general fund for funding of the capital nonrecurring fund and various programs and activities in other funds and transfers for debt service activity.
48

EXHIBIT L TOWN OF FAIRFIELD, CONNECTICUT NOTES TO FINANCIAL STATEMENTS (CONTINUED)
Ill. DETAILED NOTES (CONTINUED)
E. Short-Term Obligations - Bond Anticipation Notes
F.
The Town is using bond anticipation notes during the construction of the school prior to the issuance of the bonds at the completion of the project.
Short-term obligation activity for the year ended June 30, 2015 was as follows:
MATURITY COUPON BALANCE BALANCE TYPE OF OBLIGATION DATE RATE JULY 1 2014 ADDITIONS REDUCTIONS JUNE 30, 2015
Bond Anticipation Notes: General Purpose ....... 7/17/2015 1.00% $ 4,462 $ 4,675 $ 4,462 $ 4,675 Schools ..................... 7/17/2015 1.00% 7 616 9 355 7 616 9 355
Total .......................... $ 12 oza $ 14 030 $ 12 oza $ 14 030
The bond anticipation notes mature in July 2015 and carry a coupon interest rate of 1.00% and a true interest cost of 0.11 0°/o.
In July 2015, the Town issued $35,020 of bond anticipation notes that mature in July 2016 and carry a coupon interest rate of 2.00°/o and a true interest cost of 0.280°/o.
Changes in Long -Term Obligations
1. SummarY. of Changes
The following is a summary of changes in long-term obligations during the fiscal year:
BALANCE BALANCE ORIGINAL DATE OF DATE OF INTEREST JULY 1, JUNE 30, CURRENT
DESCRIPTION AMOUNT ISSUE MATURITY RATE 2014* ADDITIONS DEDUCTIONS REFUNDED 2015 PORTION BONDS (THOUSANDS}
General Purpose: Debt issue ................ $ 1,070 2007 07/15/27 4.0%-5.0% $ 615 $ $ 59 $ 496 $ 60 $ 60 Refunding issue ....... 5,447 2008 01/01/23 3.375%-5.0% 3,576 460 3,116 462 Debt issue ................ 5,265 2008 07/15/28 3.125%-5.0% 3,568 218 1,705 1,645 255 Debt issue ................ 802 2009 07/15/21 5.0% 802 802 17 Debt issue ................ 8,925 2010 07/15/30 3.0%-5.0% 8,174 364 7,810 364 Refunding issue ....... 1,764 2012 06/30/26 2.0%-5.0% 1,764 1,764 Debt issue ................ 10,655 2012 07/15/32 2.125%-4.0% 10,655 555 10,100 555 Refunding issue ....... 1,439 2013 06/30/20 2.0%-4.0% 1,415 505 910 409 Debt issue ................ 500 2014 06/30/35 2.0%-4.0% 500 500 25 Refunding issue ....... 2467 2015 07/15/27 1.75%-4.0% 2467 2467 18
Total General Purpose 38 334 30 569 2 967 2 161 2 201 29174 2 165
Schools: Debt issue ................ 25,590 2007 07/15/27 4.0%-5.0% 16,410 1,181 14,024 1,205 1,205 Refunding issue ....... 40,623 2008 01/01/23 3.375%-5.0% 26,668 3,431 23,237 3,449 Debt issue ................ 23,095 2008 07/15/28 3.125%-5.0% 15,657 957 7,520 7,180 1,120 Debt issue ................ 18,608 2009 07/15/21 5.0% 18,608 18,608 2,073 Debt issue ................ 16,075 2010 07/15/30 3.0%-5.0% 14,826 636 14,190 636 Refunding issue ....... 25,011 2012 06/30/26 2.0%-5.0% 25,011 1,800 23,211 Debt issue ................ 26,945 2012 07/15/32 2.125%-4.0% 26,945 1,395 25,550 1,395 Refunding issue ....... 8,907 2013 06/30/20 2.0%-4.0% 8,755 3,131 5,624 2,527 Debt issue ................ 11,000 2014 06/30/35 2.0%-4.0% 8,188 2,812 11,000 550 Refunding issue ....... 21 773 2015 07/15/27 1.75%-4.0% 21 773 21 773 372
Total Schools .............. 217 627 161 068 24 585 12 531 21 544 151 578 13 327
Sewer: Refunding issue ....... 160 2008 01/01/23 3.375%-5.0% 106 14 92 14 Refunding issue ....... 209 2013 06/30/20 2.0%-4.0% 205 74 131 59
Total Sewer ................. 369 311 88 223 73
Total Bonds ................. 256 330 191 948 27 552 14 780 23 745 180 975 15 565
49

TOWN OF FAIRFIELD, CONNECTICUT NOTES TO FINANCIAL STATEMENTS (CONTINUED)
Ill. DETAILED NOTES (CONTINUED)
F. Changes in Long -Term Obligations (Continued)
1. Summary of Changes (Continued)
EXHIBIT L
BALANCE ORIGINAL DATE OF DATE OF INTEREST
BALANCE JULY 1, JUNE30, CURRENT
DESCRIPTION AMOUNT ISSUE MATURITY RATE 2014* ADDITIONS DEDUCTIONS REFUNDED 2015 PORTION
NOTES:
Water: CWF 245D............... $ CWF 355C .............. . CWF399D .............. . CWF 245C .............. . CWF 399C .............. .
335 1,575 2,280
830 29 436
Total Notes.................. 34 456
1996 1996 1999 1998 2003
04/01/16 06/30/16 07/31/18 08/01/17 07/31/22
2.0% 2.0% 2.0% 2.0% 2.0%
TOTAL BONDS/NOTES .......................................................................................... .
BOND PREMIUM ..................................................................................................... .
TOTAL BONDS/NOTES AND RELATED LIABILITIES ....................................... ..
CAPITAL LEASE ........................................................................................................... ..
COMPENSATED ABSENCES ....................................................................................... .
HEART AND HYPERTENSION .............................................................................. .
RISK MANAGEMENT .............................................................................................. .
NET PENSION LIABILITY ............................................................................................... .
NET OPEB OBLIGATION ............................................................................................... .
TOTAL GENERAL LONG-TERM OBLIGATIONS ........................................................ ..
* As restated
$ 20 $ 157 466 131
13 186
13 960
205,908
11 933
217,841
220
4,378
1,803
12,820
3,168
20 047
$ 260 277 $
<THOUSANDS)
$ 15 79
114 42
1 518
1 768
27,552 16,548
188 1 252
27,740 17,800
40
2,975 3,060
1,428 427
42,098 40,678
47,893 20,787
11 305 10 681
133 439 $ 93473
$ $
23,745
23,745
5 78
352 89
11 668
12 192
193,167
10 869
204,036
180
4,293
2,804
14,240
30,274
20 671
$ 23 745 $ 276 498
$
All bonds and notes will be liquidated by the General Fund, except for clean water loan 245C, which is liquidated by the Water Pollution Control Authority fund.
All other long-term liabilities listed above are also generally liquidated by the General Fund.
50
5 79
114 42
1 549
1 789
17,354
17,354
41
859
673
5,722
24 645

TOWN OF FAIRFIELD, CONNECTICUT NOTES TO FINANCIAL STATEMENTS (CONTINUED)
Ill. DETAILED NOTES (CONTINUED)
F. Changes in Long-Term Obligations (Continued)
1. Summary of Changes (Continued)
EXHIBIT L
The following is a summary of amounts to be provided by the State of Connecticut for the retirement of school bonds and bond and note maturities (Thousands):
FISCAL YEAR ENDED
JUNE 30.
2016 2017 2018 2019 2020 2021 2022 2023 2024 2025 2026 2027 2028 2029 2030 2031 2032 2033 2034 2035
AMOUNT TO BE PROVIDED
BY STATE PRINCIPAL
$
$
286 92 91
469
2. Capital Lease
AMOUNT TO BE PROVIDED
BY STATE INTEREST
$
$
12 4 2
18
BOND PRINCIPAL
$ 15,565 14,560 14,660 14,640 16,310 16,665 14,890 12,955 9,700 9,745 9,790 7,275 5,695 4,075 4,075 4,075 2,575 2,575
575 575
$ 180 975
NOTES PRINCIPAL
$ 1,789 1,735 1,733 1,654 1,678 1,711 1,746
146
$ 12 192
TOTAL INTEREST
$ -7,934 6,843 6,239 5,524 4,808 4,111 3,450 2,426 1,920 1,586 1,252
956 735 560 407 262 155 77
$ 49 245
The Town has entered into a lease agreement for the purchase of golf carts. The annual payments for the agreement are provided for by annual general fund appropriations.
The assets acquired through capital leases are as follows:
Asset: Equipment ................................................................. . $ 273 Less accumulated depreciation ................................. . (118)
Total $ 155
This year, $55 was included in depreciation expense.
51

EXHIBIT L TOWN OF FAIRFIELD, CONNECTICUT NOTES TO FINANCIAL STATEMENTS (CONTINUED)
Ill. DETAILED NOTES (CONTINUED)
F. Changes in Long-Term Obligations (Continued)
2. Capital Lease (Continued)
The lease agreement qualifies as a capital lease for accounting purposes and, therefore, has been recorded at the present value of future minimum lease payments as of the date of inception. The following is a schedule of the minimum lease payments under the lease and the present value of the future minimum lease payments at June 30, 2015:
YEAR ENDING JUNE 30.
2016 2017 2018
Less amount representing interest
Present value of minimum lease payments
3. Statutory Debt Limitations
$
$
47 47 97
(11)
180
The Town's indebtedness does not exceed the legal debt limitations as required by Connecticut General Statutes as reflected in the following schedule:
CATEGORY
General purpose: ..................... . Schools .................................... . Sewers ..................................... . Urban renewal ........................ .. Pension deficit ......................... .
NET DEBT LIMIT INDEBTEDNESS
$ 593,312 1,186,623
988,853 857,006 791,082
$ 33,849 160,464
194
BALANCE
$ 559,463 1,026,159
988,659 857,006 791,082
The total overall statutory debt limit for the Town is equal to seven times annual receipts from taxation, $1,845,858.
The indebtedness reflected above includes bonds outstanding in addition to the amount of bonds authorized and unissued against which bond anticipation notes are issued and outstanding. School building grants receivable of $469 for bond principal are reflected as deductions in the computation of net indebtedness.
4. Authorized/Unissued Bonds
The amount of authorized, unissued bonds is $39,875 for school and $38,442 for general purposes.
52

EXHIBIT L TOWN OF FAIRFIELD, CONNECTICUT NOTES TO FINANCIAL STATEMENTS (CONTINUED)
Ill. DETAILED NOTES (CONTINUED)
F. Changes in Long-Term Obligations (Continued)
5. Current Year Advance Refunding
In March 2015, the Town issued $24,240 of general obligation refunding bonds with an interest rate of 1.75°/o to 4.00%. These refunding bonds were issued to advance and defease bonds issued in July 2007 and July 2008. The refunding resulted in an economic gain of $1,390 with a total savings of $1,451.
6. Prior Year Advance Refunding
In prior years, the Town defeased certain general obligation bonds by placing the proceeds of the new bonds in an irrevocable trust to provide for all future debt service payments on the old bonds. Accordingly, the trust account assets and the liability of the defeased bonds are not included in the Town's financial statements. At June 30, 2015, $26,720 of bonds outstanding are considered defeased.
G. Restricted Net Position
The amount of restricted net position, which was restricted by enabling legislation, totaled $5,282 at June 30, 2015.
53

EXHIBIT L TOWN OF FAIRFIELD, CONNECTICUT NOTES TO FINANCIAL STATEMENTS (CONTINUED)
Ill. DETAILED NOTES (CONTINUED)
H. Fund Balance Classifications
As of June 30, 2015, fund balances are composed of the following:
GENERAL CAPITAL NONMAJOR FUND BALANCE COMPONENT FUND PROJECTS FUNDS TOTAL
NONSPENDABLE: Simeon and Carrie Pease for Education $ $ $ 20 $ 20 Library 20 20 H. Smith Richardson for Conservation 30 30
TOTALNONSPENDABLE 70 70
RESTRICTED: Conservation 373 373 Public Safety - Care of Animals 290 290 Sanitary Sewer Operations 5,244 5,244 Culture and Recreation:
Housing Rehabilitation Programs 80 80 Library Operations 58 58
School Lunch Programs 110 110
TOTAL RESTRICTED 6,155 6,155
COMMITTED: Other 71 71 Public Safety - Police 606 606 Public Works:
Fairfield Center Improvements 162 162 Other 52 52
Health and Rehabilitation Programs 463 463 Park and Recreation Programs 876 876 Various Education Programs 206 206
TOTAL COMMITTED 2,436 2,436
ASSIGNED: General Government 36 36 Finance 87 87 Public Safety 19 19 Public Works 75 75 Culture and Recreation 9 9 Education 637 637 Debt Service 634 634
TOTAL ASSIGNED 863 634 1,497
UNASSIGNED 24,260 (13, 165) 11,095
TOTAL $ 25,123 $ (13, 165) $ 9,295 $ 21,253
54
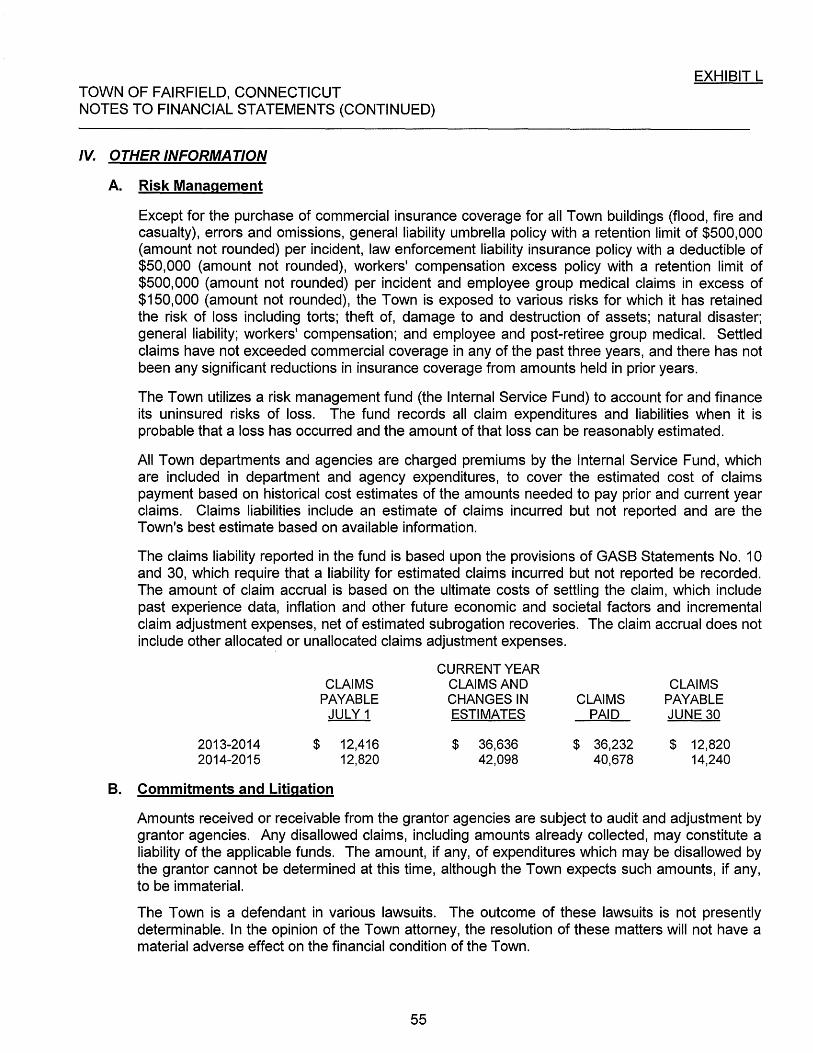
EXHIBIT L TOWN OF FAIRFIELD, CONNECTICUT NOTES TO FINANCIAL STATEMENTS (CONTINUED)
IV. OTHER INFORMATION
A. Risk Management
Except for the purchase of commercial insurance coverage for all Town buildings (flood, fire and casualty), errors and omissions, general liability umbrella policy with a retention limit of $500,000 (amount not rounded) per incident, law enforcement liability insurance policy with a deductible of $50,000 (amount not rounded), workers' compensation excess policy with a retention limit of $500,000 (amount not rounded) per incident and employee group medical claims in excess of $150,000 (amount not rounded), the Town is exposed to various risks for which it has retained the risk of loss including torts; theft of, damage to and destruction of assets; natural disaster; general liability; workers' compensation; and employee and post-retiree group medical. Settled claims have not exceeded commercial coverage in any of the past three years, and there has not been any significant reductions in insurance coverage from amounts held in prior years.
The Town utilizes a risk management fund (the Internal Service Fund) to account for and finance its uninsured risks of loss. The fund records all claim expenditures and liabilities when it is probable that a loss has occurred and the amount of that loss can be reasonably estimated.
All Town departments and agencies are charged premiums by the Internal Service Fund, which are included in department and agency expenditures, to cover the estimated cost of claims payment based on historical cost estimates of the amounts needed to pay prior and current year claims. Claims liabilities include an estimate of claims incurred but not reported and are the Town's best estimate based on available information.
The claims liability reported in the fund is based upon the provisions of GASB Statements No. 1 0 and 30, which require that a liability for estimated claims incurred but not reported be recorded. The amount of claim accrual is based on the ultimate costs of settling the claim, which include past experience data, inflation and other future economic and societal factors and incremental claim adjustment expenses, net of estimated subrogation recoveries. The claim accrual does not include other allocated or unallocated claims adjustment expenses.
2013-2014 2014-2015
CLAIMS PAYABLE
JULY 1
$ 12,416 12,820
B. Commitments and Litigation
CURRENT YEAR CLAIMS AND CHANGES IN ESTIMATES
$ 36,636 42,098
CLAIMS PAID
$ 36,232 40,678
CLAIMS PAYABLE JUNE 30
$ 12,820 14,240
Amounts received or receivable from the grantor agencies are subject to audit and adjustment by grantor agencies. Any disallowed claims, including amounts already collected, may constitute a liability of the applicable funds. The amount, if any, of expenditures which may be disallowed by the grantor cannot be determined at this time, although the Town expects such amounts, if any, to be immaterial.
The Town is a defendant in various lawsuits. The outcome of these lawsuits is not presently determinable. In the opinion of the Town attorney, the resolution of these matters will not have a material adverse effect on the financial condition of the Town.
55
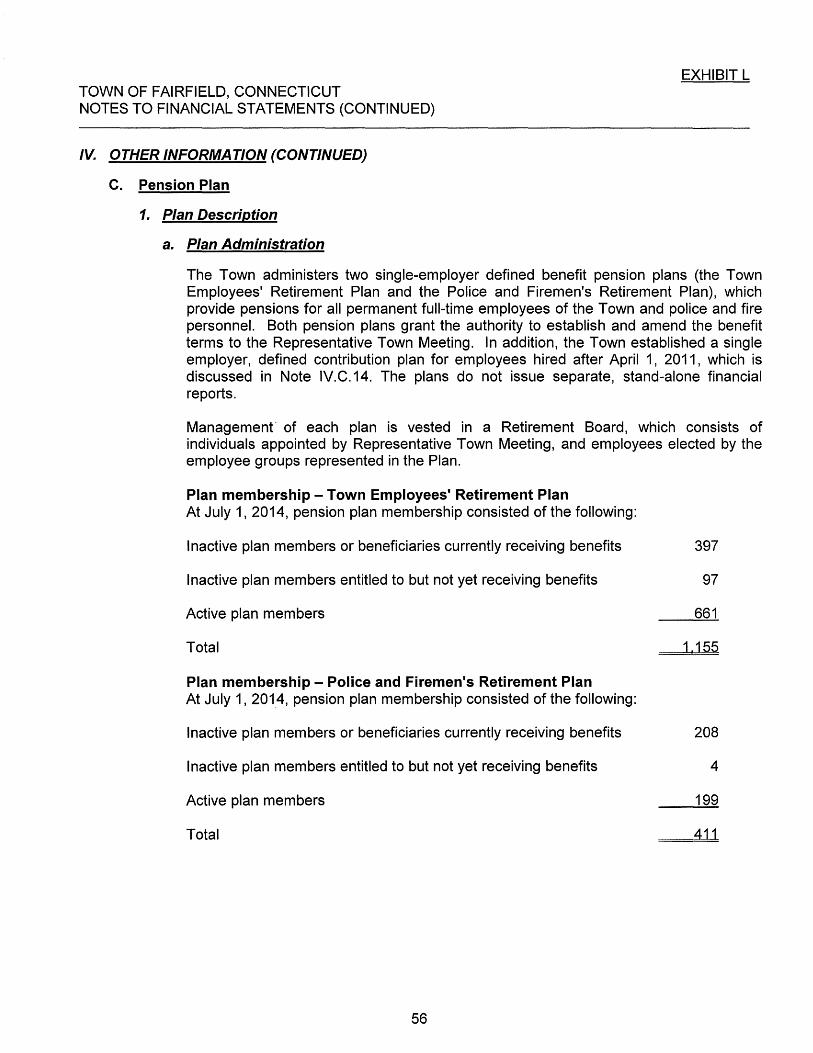
EXHIBIT L TOWN OF FAIRFIELD, CONNECTICUT NOTES TO FINANCIAL STATEMENTS (CONTINUED)
IV. OTHER INFORMATION (CONTINUED)
C. Pension Plan
1. Plan Description
a. Plan Administration
The Town administers two single-employer defined benefit pension plans (the Town Employees' Retirement Plan and the Police and Firemen's Retirement Plan), which provide pensions for all permanent full-time employees of the Town and police and fire personnel. Both pension plans grant the authority to establish and amend the benefit terms to the Representative Town Meeting. In addition, the Town established a single employer, defined contribution plan for employees hired after April 1, 2011, which is discussed in Note IV.C.14. The plans do not issue separate, stand-alone financial reports.
Management' of each plan is vested in a Retirement Board, which consists of individuals appointed by Representative Town Meeting, and employees elected by the employee groups represented in the Plan.
Plan membership- Town Employees' Retirement Plan At July 1, 2014, pension plan membership consisted of the following:
Inactive plan members or beneficiaries currently receiving benefits 397
Inactive plan members entitled to but not yet receiving benefits 97
Active plan members 661
Total 1.155
Plan membership- Police and Firemen's Retirement Plan At July 1, 2014, pension plan membership consisted of the following:
Inactive plan members or beneficiaries currently receiving benefits 208
Inactive plan members entitled to but not yet receiving benefits 4
Active plan members 199
Total 411
56
TOWN OF FAIRFIELD, CONNECTICUT NOTES TO FINANCIAL STATEMENTS (CONTINUED)
IV. OTHER INFORMATION (CONTINUED)
C. Pension Plan (Continued)
2. Benefit Provisions
a. Town Employees' Retirement Plan
EXHIBIT L
The plan provides retirement, disability and death benefits to full-time employees who participate in the plan. The plan covers substantially all noncertified Board of Education employees and all regular Town employees. The retirement benefit is calculated at 2.2% of the average of final salary over the period of highest 2 consecutive years times years of service for Public Works, 2.275%> of a member's highest salary times years of service for Educational Office Professionals and Professional and Technical Employees and department heads, and 1.25%, of final salary up to $7,800 plus 2.3%> of the excess for all other members. Final and highest salary includes base salary plus longevity. Benefits and contributions are established by the Town and may be amended by the Retirement Board, or union contract. Plan members are eligible to retire with full benefits at age 62 upon completion of 10 years of service, except public works members, who may retire at age 59 1/2.
All plan members are eligible for non-work related disability benefits after 10 years of service who are determined to have a total and permanent disability. Disability retirement benefits are calculated in the same manner as regular retirement benefits. A member who is permanently and totally disabled solely and exclusively as a result of an accident or injury incurred during the course of Town employment will be retired, regardless of period of service, at an amount equal to 50%, of the member's annual base salary on the date of the accident or injury reduced by any workers' compensation benefits being received after retirement. Death benefits as a result of an accident occurring during the course of Town employment will be equal to 50% of member's highest salary. Upon death of a member from causes not related to Town employment, the member's accumulated contributions with interest shall be paid to the member's spouse or beneficiary if there is no spouse. If the member was eligible to retire at the time of death, the spouse may elect to receive 50%> of the member's benefit as if the member had retired.
A plan member who terminates employment with less than 10 years of credited service shall forfeit all rights to benefits under the plan except for the return of member contributions with credited interest.
Members shall receive automatic cost of living adjustments ("COLA") regulated by the change in the U.S. Consumer Price Index, and members receive the COLA in even numbered years, except where a union contract requires an annual COLA. The adjustment shall not exceed 3%, in each year of the calculation period.
57

EXHIBIT L TOWN OF FAIRFIELD, CONNECTICUT NOTES TO FINANCIAL STATEMENTS (CONTINUED)
IV. OTHER INFORMATION (CONTINUED)
C. Pension Plan (Continued)
2. Benefit Provisions (Continued)
b. Police and Firemen's Retirement Plan
The plan provides retirement, disability and death benefits to regular members of the Police and Fire departments. For Police members hired prior to March 18, 2013 and Fire members hired prior to March 10, 2012, the retirement benefit is calculated at 2% of base salary plus longevity for each year of service up to 10 years, plus 2.5% for years 11-20, 3°/o for years 21-25, and 4% for years 26-30. The maximum benefit is 80% of base salary plus longevity. For employees hired after the dates above, the benefit is calculated in the same way as for previously hired employees until the period following 25 years. After 25 years, the benefit is calculated at 3%> for each year of service up to a maximum of 70%> for Police and 75%) for Fire. If an employee leaves covered employment before 10 years of service, accumulated employee contributions and credited interest earnings are refunded. Benefits and contributions are established by the Town and may be amended by the Retirement Board, or union contract. Plan members upon completion of 25 years of service are eligible to retire at age 51 with full benefits or, in the case of the Fire Department, upon completion of 30 years of service regardless of age.
A member who is totally and permanently disabled through a job related accident or injury is eligible to receive a benefit not less than 66 2/3°/o of the member's annual base salary, plus longevity on the date of the accident. Non-service connected benefits are determined in the same manner as retirement benefits, and members must have at least five years of continuous service. Death benefits will be paid if a member dies prior to the normal retirement date equal to 25°/o of the member's final pay after one year of service. After five years of service, benefits are payable equal to 1% of final salary multiplied by years of service to a maximum of ten years plus 1 %% of final salary multiplied by years of service in excess of 10 years to a maximum of 25% of final pay. After the normal retirement date, the benefit is 75°/o of the member's retirement benefit. If death is incurred in the line of duty, the benefit is equal to 50% of the member's final salary.
A plan member who terminates employment with less than 10 years of credited service shall forfeit all rights to benefits under the plan except for the return of member contributions with credited interest.
Members shall receive automatic COLA regulated by the change in the U.S. Consumer Price Index, and members receive the COLA in even numbered years. The adjustment shall not exceed 3o/o in each year of the two year calculation period.
58
TOWN OF FAIRFIELD, CONNECTICUT NOTES TO FINANCIAL STATEMENTS (CONTINUED)
IV. OTHER INFORMATION (CONTINUED)
C. Pension Plan (Continued)
3. Contributions
a. Employees' Retirement Plan
EXHIBIT L
Article 2.5 of the Pension Plan provides that member contributions shall be determined by the applicable collective bargaining agreement or by Town Policy. Currently, employees under the plan are required to contribute 4.0°/o of their annual compensation.
The Town is required to contribute the amount determined by the actuary, considering the member contributions.
For the year ended June 30, 2015, the average active member contribution rate was 4.0% of annual base compensation, and the Town's average contribution rate was 15.1% of annual payroll.
b. Police and Firemen~ Retirement Plan
Article 2.4 of the Pension Plan provides that members will contribute 5.0°/o of their annual compensation; however, current union contracts require contributions of 2.5°/o to 4.5% of earnings.
The Town is required to contribute the amount determined by the actuary, considering the member contributions.
For the year ended June 30, 2015, the average active member contribution rate was 4.5°/o of annual base compensation, and the Town's average contribution rate was 36.1% of annual payroll.
4. Investments
a. Investment Policy
The pension plans' policy in regard to the allocation of invested assets is established and may be amended by the Retirement Board by a majority vote of its members. It is the policy of the Town's Retirement Board to pursue an investment strategy that reduces risk through the prudent diversification of the portfolio across a broad selection of distinct asset classes. The following was the Board's adopted asset allocation policy for both the Employees' and Police and Firemen's Retirement Plans as of June 30, 2015:
59
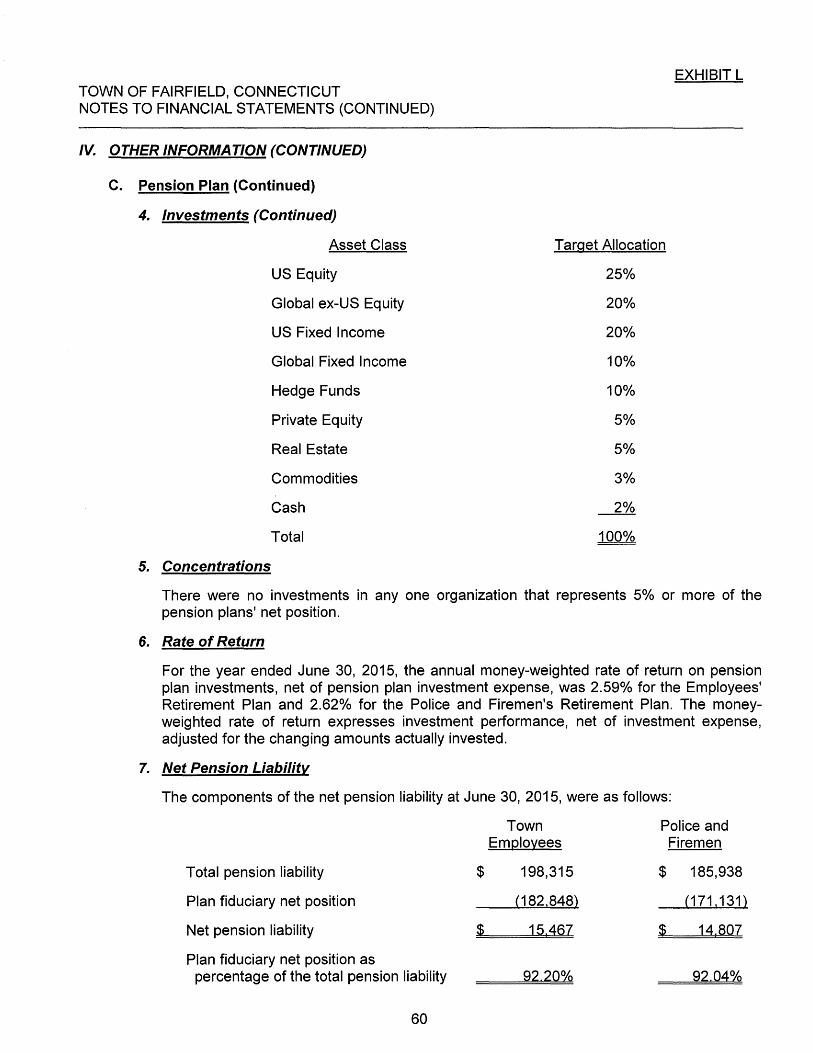
EXHIBIT L TOWN OF FAIRFIELD, CONNECTICUT NOTES TO FINANCIAL STATEMENTS (CONTINUED)
IV. OTHER INFORMATION (CONTINUED)
c. Pension Plan (Continued)
4.
5.
Investments (Continued)
Asset Class Target Allocation
US Equity 2S%>
Global ex-US Equity 20°1o
US Fixed I nco me 20°1o
Global Fixed Income 10%
Hedge Funds 10°1o
Private Equity S01o
Real Estate S%
Commodities 301o
Cash 201o
Total 100%>
Concentrations
There were no investments in any one organization that represents S01o or more of the pension plans' net position.
6. Rate of Return
For the year ended June 30, 201S, the annual money-weighted rate of return on pension plan investments, net of pension plan investment expense, was 2.S9% for the Employees' Retirement Plan and 2.62°/o for the Police and Firemen's Retirement Plan. The moneyweighted rate of return expresses investment performance, net of investment expense, adjusted for the changing amounts actually invested.
7. Net Pension Liability
The components of the net pension liability at June 30, 201S, were as follows:
Total pension liability
Plan fiduciary net position
Net pension liability
Plan fiduciary net position as percentage of the total pension liability
60
$
$
Town Employees
198,31S
(182.848)
1S.467
Police and Firemen
$ 18S,938
(171.131)
$ 14 807
92 04°;0

EXHIBIT L TOWN OF FAIRFIELD, CONNECTICUT NOTES TO FINANCIAL STATEMENTS (CONTINUED)
IV. OTHER INFORMATION (CONTINUED)
C. Pension Plan (Continued)
B. Actuarial Assumptions
The total pension liability was determined by an actuarial valuation as of July 1, 2014, using the following actuarial assumptions, applied to all periods included in the measurement:
The actuarial accrued liability is determined under the entry age normal method. Under this method, actuarial gains and losses are identified each year and are automatically included in the unfunded actuarial accrued liability. Therefore, they are amortized over the same number of years as the unfunded actuarial accrued liability.
GASB 67 Actuarial cost method Asset valuation method Post-retirement increases Amortization method Inflation Salary increase Investment rate of return Mortality rates
Town Employees
Entry age Fair value 3.00°/o, where applicable Level dollar, open 1.25°/o 2.50% 7.50% RP-2014 Table Dataset Mortality Table projected to valuation date with Scale MP-2014. Blue collar adjustment included for Custodians and Public Works (nonbeneficiaries).
Police and Firemen
Entry age Fair value 3.00%, where applicable Level dollar, open 1.25°/o 2.00%-2.50°/o 7.50% RP-2014 Blue Collar Mortality Table projected to valuation date with Scale MP-2014.
The long-term expected rate of return on pension plan investments was determined using a building-block method in which best-estimate ranges of expected future real rates of return (expected returns, net of pension plan investment expense and inflation) are developed for each major asset class. These ranges are combined to produce the long-term expected rate of return by weighting the expected future real rates of return by the target asset allocation percentage and by adding expected inflation. Best estimates of arithmetic real rates of return for each major asset class included in the pension plan's target asset allocation (see the discussion of the pension plan's investment policy) are summarized in the following table:
61

EXHIBIT L TOWN OF FAIRFIELD, CONNECTICUT NOTES TO FINANCIAL STATEMENTS (CONTINUED)
IV. OTHER INFORMATION (CONTINUED)
c. Pension Plan (Continued)
B.
9.
Actuarial Assumptions (Continued)
Town Employees Police and Firemen
Long-Term Expected Long-Term Expected Asset Class Real Rate of Return Real Rate of Return
U.S. Equity 6.90% 6.90%>
Global ex-U.S. Equity 7.55% 7.55%>
U.S. Fixed Income 0.80% 0.80°/o
Global Fixed Income 0.45% 0.45%
Real Estate 5.1 0°/o 5.10%
Private Equity 11.30o/o 11.30°/o
Hedge Funds 3.30% 3.30%
Commodities 2.15°/o 2.15°/o
Cash 0.00°/o 0.00°/o
Discount Rate
The discount rate used to measure the total pension liability was 7.50%. The projection of cash flows used to determine the discount rate assumed that plan member contributions will be made at the current contribution rate and that Town contributions will be made at rates equal to the difference between actuarially determined contribution rates and the member rate. Based on those assumptions, the pension plan's fiduciary net position was projected to be available to make all projected future benefit payments of current plan members. Therefore, the long-term expected rate of return on pension plan investments was applied to all periods of projected benefit payments to determine the total pension liability.
10. Changes in the Net Pension Liability
The Town's net pension liability was measured at June 30, 2015, and the total pension liability used to calculate the net pension liability was determined by an actuarial valuation as of that date. The changes in net pension liability for each plan for the year ended June 30, 2015 were as follows:
62

EXHIBIT L TOWN OF FAIRFIELD, CONNECTICUT NOTES TO FINANCIAL STATEMENTS (CONTINUED)
IV. OTHER INFORMATION (Continued)
c. Pension Plan (Continued)
10. Chang_es in the Net Pension Liabilit'[ (Continued)
Increase {Decrease)
Total Pension Plan Fiduciary Net Pension Liability Net Position Liability
Town Plan {a~ {b~ (a~- {b)
Balance at June 30, 2014 $ 180,206 $ 182,008 $ {1,802)
Service cost 3,697 3,697 Interest 13,426 13,426 Differences between expected and actual experience (1,618) (1,618) Changes of assumptions 12,556 12,556 Contributions - employer 4,964 (4,964) Contributions - member 1,299 (1,299) Net investment income 4,703 (4,703) Benefit payments, including refunds
of member contributions (9,952) (9,952) Administrative expenses {174~ 174
Net change 18,109 840 17,269
Balance at June 30, 2015 $ 198,315 $ 182,848 $ 15,467
Increase (Decrease)
Total Pension Plan Fiduciary Net Pension Liability Net Position Liability
Police and Firemen Plan {a~ {b~ {a~ - {b)
Balance at June 30, 2014 $ 176,140 $ 171,170 $ 4,970
Service cost 2,596 2,596 Interest 13,036 13,036 Differences between expected and actual experience (4,108) (4,1 08) Changes of assumptions 8,308 8,308 Contributions - employer 5,092 (5,092) Contributions - member 623 (623) Net investment income 4,475 (4,475) Benefit payments, including refunds
of member contributions (1 0,034) (1 0,034) Administrative expenses (195) 195
Net change 9,798 {39~ 9,837
Balance at June 30, 2015 $ 185,938 $ 171,131 $ 14,807
63

EXHIBIT L TOWN OF FAIRFIELD, CONNECTICUT NOTES TO FINANCIAL STATEMENTS (CONTINUED)
IV. OTHER INFORMATION (CONTINUED)
C. Pension Plan (Continued)
11. Sensitivity of the Net Pension Liability to Changes in the Discount Rate
The following presents the net pension liability, calculated using the discount rate of 7.50%> as well as what the Town's net pension liability would be if it were calculated using a discount rate that is 1-percentage-point lower (6.50°/o) or 1-percentage-point higher (8.50o/o) than the current rate:
Town EmQioyees 1%> Current 1%>
Decrease Discount Increase (6.50%) (7.50%>) (8.50%)
Net pension liability (asset) $ 42,348 $ 15,467 $ (5,010)
Police and Firemen 1%> Current 1%
Decrease Discount Increase (6.50°/o) (7.50°/o) (8.50%)
Net pension liability (asset) $ 39,304 $ 14,807 $ (5,374)
12. Pension Expense and Deferred Outflows of Resources and Deferred Inflows of Resources Related to Pensions
For the year ended June 30, 2015, the Town recognized pension expense of $10,709. The Town reported deferred outflows of resources and deferred inflows of resources related to pensions from the following sources:
Description of outflows/inflows
Deferred Outflows of Resources
Differences between expected and actual experience $
Changes in assumptions
Net difference between projected and actual earnings on penS?ion plan investments
Total
Net amount of deferred inflow and outflow excluding Town contributions subsequent to measurement date
64
17,778
13,604
$ 31,382
Deferred Inflows of
Resources
$ 4,929
$ 4,929
$ 26,453

EXHIBIT L TOWN OF FAIRFIELD, CONNECTICUT NOTES TO FINANCIAL STATEMENTS (CONTINUED)
IV. OTHER INFORMATION (CONTINUED)
C. Pension Plan (Continued)
12. Pension Expense and Deferred Outflows of Resources and Deferred Inflows of Resources Related to Pensions (Continued)
Actual investment earnings below (or above) projected earnings are amortized over 5 years for both plans. Changes of assumptions and experience losses (gains) are amortized over the average remaining service period of actives and inactives, which was 6.3 years for the Town Employees' Plan and 7.6 years for the Police and Firemen's Plan.
Amounts reported as deferred outflows (inflows) of resources related to pensions will be recognized in pension expense as follows:
Year Ending June 30: 2016 2017 2018 2019 2020
Thereafter
Total
65
$ 5,689 5,689 5,689 5,689 2,289 1.408
$ 26 453

TOWN OF FAIRFIELD, CONNECTICUT NOTES TO FINANCIAL STATEMENTS (CONTINUED)
IV. OTHER INFORMATION (CONTINUED)
C. Pension Plans (Continued)
13. Plan Statements
COMBINING STATEMENT OF FIDUCIARY NET POSITION PENSION TRUST FUNDS
JUNE 30, 2015 (THOUSANDS)
TOWN POLICE EMPLOYEES AND FIREMEN
Investments at fair value: Corporate bonds ................................................................. . $ 5,949 $ 5,702 U.S. Government agency obligations ...................................... . 3,273 3,138 U.S. Government obligations ................................................. . 7,510 7,199 Real estate, limited partnership ............................................. . 10,206 9,783 Hedge funds and private equity funds ..................................... . 106,409 101,990 Common stock ................................................................... . 16,327 15,649 Mutual funds:
Equity ............................................................................. . 31,131 25,728 Money market. .................................................................. . 1,956 1,874
Total investments ................................................................ . 182,761 171,063
Recievables: Interest and dividends .......................................................... . 115 111
TOTAL ASSETS ...................................................................................... . 182,876 171,174
LIABILITY
.A.ccounts payable .................................................................. . 28 43
NET POSITION
NET POSITION HELD IN TRUST FOR PENSION BENEFITS ......... . $ 182,848 $ 171,131
66
EXHIBIT L
TOTAL
$ 11,651 6,411
14,709 19,989
208,399 31,976
56,859 3,830
353,824
226
354,050
71
$ 353,979
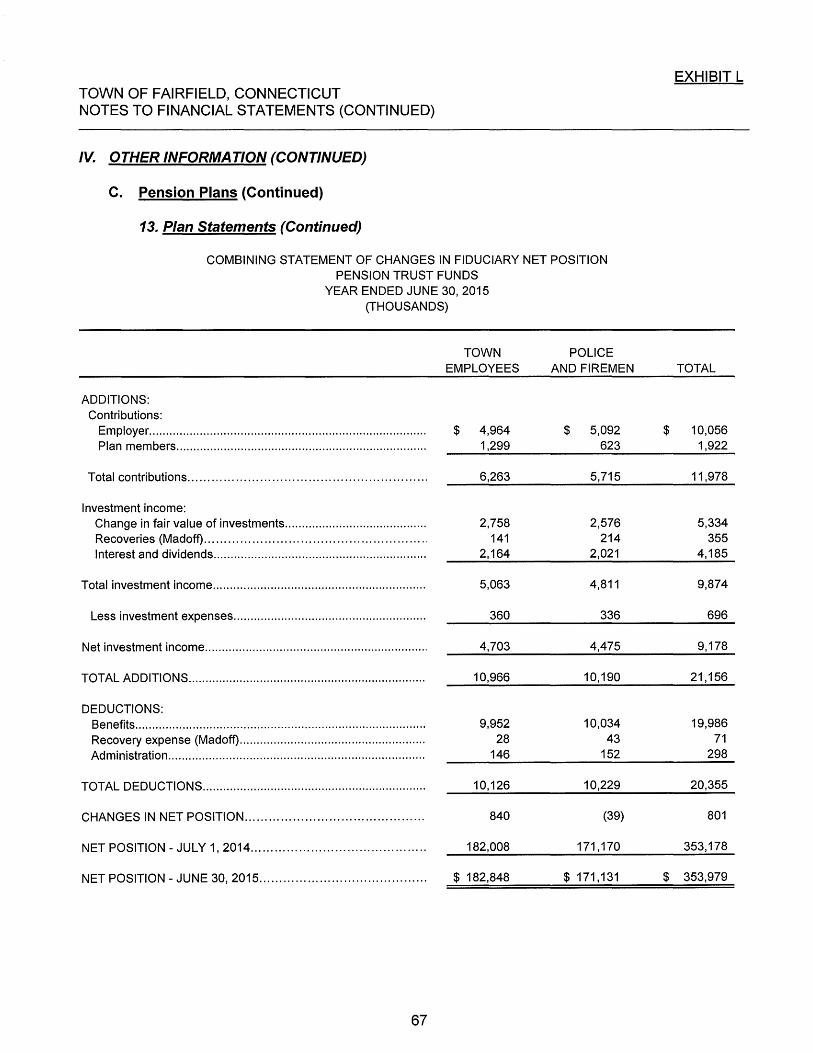
TOWN OF FAIRFIELD, CONNECTICUT NOTES TO FINANCIAL STATEMENTS (CONTINUED)
IV. OTHER INFORMATION (CONTINUED)
C. Pension Plans (Continued)
13. Plan Statements (Continued)
COMBINING STATEMENT OF CHANGES IN FIDUCIARY NET POSITION PENSION TRUST FUNDS
YEAR ENDED JUNE 30, 2015 (THOUSANDS)
ADDITIONS: Contributions:
Employer. ................................................................................ . Plan members ......................................................................... .
Total contributions .......................................................... ..
Investment income: Change in fair value of investments ........................................ .. Recoveries (Mad off) ....................................................... . Interest and dividends .............................................................. .
Total investment income .............................................................. .
Less investment expenses ........................................................ .
Net investment income ................................................................. .
TOTAL ADDITIONS ..................................................................... .
DEDUCTIONS: Benefits ..................................................................................... . Recovery expense (Madoff) ...................................................... . Administration ........................................................................... .
TOTAL DEDUCTIONS ................................................................. .
CHANGES IN NET POSITION ............................................ .
NET POSITION- JULY 1, 2014 .......................................... ..
NET POSITION - JUNE 30, 2015 ........................................ ..
67
TOWN EMPLOYEES
$ 4,964 1,299
6,263
2,758 141
2,164
5,063
360
4,703
10,966
9,952 28
146
10,126
840
182,008
$ 182,848
POLICE AND FIREMEN
$ 5,092 623
5,715
2,576 214
2,021
4,811
336
4,475
10,190
10,034 43
152
10,229
(39)
171,170
$ 171,131
EXHIBIT L
TOTAL
$ 10,056 1,922
11,978
5,334 355
4,185
9,874
696
9,178
21,156
19,986 71
298
20,355
801
353,178
$ 353,979

EXHIBIT L TOWN OF FAIRFIELD, CONNECTICUT NOTES TO FINANCIAL STATEMENTS (CONTINUED)
IV. OTHER INFORMATION (CONTINUED)
C. Pension Plans (Continued)
14. Defined Contribution Plan
The Town administers a single employer, defined contribution plan, which covers employees hired after April 1, 2011 who are members of various bargaining units. The plan is not included in the Town's financial statements. The plan was approved as part of the Union approved contracts and any subsequent amendments would occur as part of future contracts.
Each employee will participate in the Town's defined contribution plan. Each employee shall be required to contribute at least 4o/o to the plan but may contribute the maximum allowed under IRS regulations. The Town shall match the employee's contribution up to a maximum of 5°/o for one of the contracts and 4o/o for the remaining contracts in the Plan. The Town's contribution shall not vest until the employee has been continuously employed for 5 years for all plans. The contributions made by employees and employer totaled $89 and $75, respectively, for the year ended June 30, 2015.
D. Pension Plans - Connecticut State Teachers' Retirement Plan
1. Plan Description
Teachers, principals, superintendents, or supervisors engaged in service of public schools are provided with pensions through the Connecticut State Teachers' Retirement System (TRS) - a cost sharing multiple-employer defined benefit pension plan administered by the Teachers' Retirement Board (TRB). Chapter 167a of the State Statutes grants authority to establish and amend the benefit terms to the TRB. TRS issues a publicly available financial report that can be obtained at www.ct.gov.
2. Benefit Provisions
The plan provides retirement, disability and death benefits. Employees are eligible to retire at age 60 with 20 years of credited service in Connecticut, or 35 years of credited service including at least 25 years of service in Connecticut.
Normal Retirement: Retirement benefits for the employees are calculated as 2% of the average annual salary times the years of credited service (maximum benefit is 75%, of average annual salary during the 3 years of highest salary).
Early Retirement: Employees are eligible after 25 years of credited service including 20 years of Connecticut service, or age 55 with 20 years of credited service including 15 years of Connecticut service. Benefit amounts are reduced by 6°/o per year for the first 5 years preceding normal retirement age and 4% per year for the next 5 years preceding the normal retirement age. Effective July 1, 1999, the reduction for individuals with 30 or more years of service is 3°/o per year by which retirement precedes normal retirement date.
68
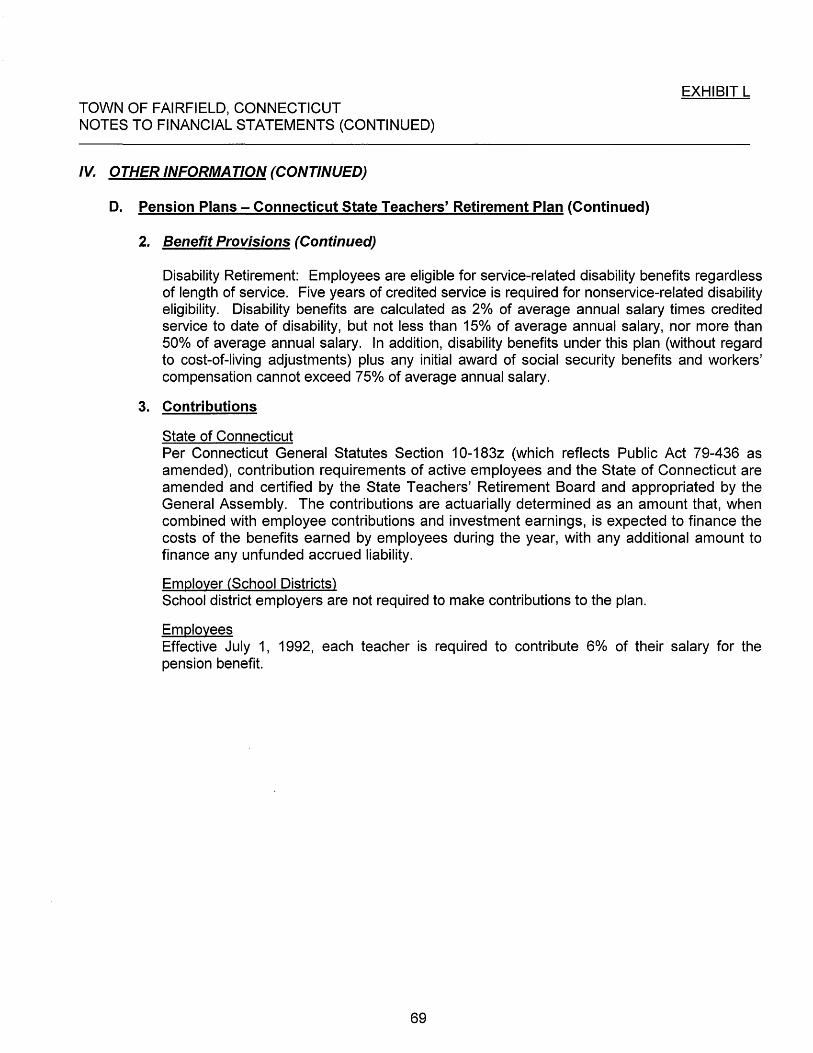
EXHIBIT L TOWN OF FAIRFIELD, CONNECTICUT NOTES TO FINANCIAL STATEMENTS (CONTINUED)
IV. OTHER INFORMATION (CONTINUED)
D. Pension Plans - Connecticut State Teachers' Retirement Plan (Continued)
2. Benefit Provisions (Continued)
Disability Retirement: Employees are eligible for service-related disability benefits regardless of length of service. Five years of credited service is required for nonservice-related disability eligibility. Disability benefits are calculated as 2% of average annual salary times credited service to date of disability, but not less than 15% of average annual salary, nor more than 50% of average annual salary. In addition, disability benefits under this plan (without regard to cost-of-living adjustments) plus any initial award of social security benefits and workers' compensation cannot exceed 75%> of average annual salary.
3. Contributions
State of Connecticut Per Connecticut General Statutes Section 1 0-183z (which reflects Public Act 79-436 as amended), contribution requirements of active employees and the State of Connecticut are amended and certified by the State Teachers' Retirement Board and appropriated by the General Assembly. The contributions are actuarially determined as an amount that, when combined with employee contributions and investment earnings, is expected to finance the costs of the benefits earned by employees during the year, with any additional amount to finance any unfunded accrued liability.
Employer (School Districts) School district employers are not required to make contributions to the plan.
Employees Effective July 1, 1992, each teacher is required to contribute 6% of their salary for the pension benefit.
69

EXHIBIT L TOWN OF FAIRFIELD, CONNECTICUT NOTES TO FINANCIAL STATEMENTS (CONTINUED)
IV. OTHER INFORMATION (CONTINUED)
D. Pension plans- Connecticut State Teachers' Retirement Plan (Continued)
4. Pension Liabilities. Pension Expense. and Deferred Outflows of Resources and Deferred Inflows of Resources Related to Pensions
The Town reports no amounts for its proportionate share of the net pension liability, and related deferred outflows and inflows due to the statutory requirement that the State pay 100% of the required contribution. The amounts recognized by the Town as its proportionate share of the net pension liability, the related state support, and the total portion of the net pension liability that was associated with the Town were as follows:
Town's proportionate share of the net pension liability
State's proportionate share of the net pension liability associated with the Town
Total
$
216.781
$ 216 781
The net pension liability was measured as of June 30, 2014, and the total pension liability used to calculate the net pension liability was determined by an actuarial valuation as of that date. At June 30, 2015, the Town has no proportionate share of the net pension liability.
For the year ended June 30, 2015, the Town recognized pension expense and revenue of $16,265 for on-behalf amounts for the benefits provided by the State.
5. Actuarial Assumptions
The total pension liability was determined by an actuarial valuation as of June 30, 2014, using the following actuarial assumptions, applied to all periods included in the measurement:
Inflation Salary increase Investment rate of return
3.00°/o 3.75-7.00o/o, including inflation 8.50°/o, net of pension plan investment
expense, including inflation
Mortality rates were based on the RP-2000 Combined Mortality Table projected 19 years using scale AA, with a two year setback for males and females for the period after service retirement and for dependent beneficiaries.
The actuarial assumptions used in the June 30, 2014 valuation were based on the results of an actuarial experience study for the period July 1, 2005- June 30, 2010.
70

EXHIBIT L TOWN OF FAIRFIELD, CONNECTICUT NOTES TO FINANCIAL STATEMENTS (CONTINUED)
IV. OTHER INFORMATION (CONTINUED)
D. Pension plans -Connecticut State Teachers' Retirement Plan (Continued)
5. Actuarial Assumptions (Continued)
Future cost-of-living increases - For teachers who retired prior to September 1, 1992, pension benefit adjustments are made in accordance with increases in the Consumer Price Index, with a minimum of 3% and a maximum of 5°/o per annum. For teachers who were members of the Teachers' Retirement System before July 1, 2007, and retire on or after September 1 , 1992, pension benefit adjustments are made that are consistent with those provided for social security benefits on January 1 of the year granted, with a maximum of 6°/o per annum. If the return on assets in the previous year was less than 8.5°/o, the maximum increase is 1.5%>. For teachers who were members of the Teachers' Retirement System after July 1, 2007, pension benefit adjustments are made that are consistent with those provided for social security benefits on January 1 of the year granted, with a maximum of 5% per annum. If the return on assets in the previous year was less than 11.5°/o, the maximum increase is 3%>, and if the return on the assets in the previous year was less than 8.5°/o, the maximum increase is 1.0°/o.
The long-term expected rate of return on pension plan investments was determined using a log-normal distribution analysis in which best-estimate ranges of expected future real rates of return (expected returns, net of pension plan investment expense and inflation) are developed for each major asset class. These ranges are combined to produce the longterm expected rate of return by weighting the expected future real rates of return by the target asset allocation percentage and by adding expected inflation. The target asset allocation and best estimates of arithmetic real rates of return for each major class are summarized in the following table:
Long-Term Target Expected Real
Asset Class Allocation Rate of Return
Large cap U.S. equities 21.0°/o 7.3o/o Developed non-U.S. equities 18.0% 7.5o/o Emerging markets (non-U.S.) 9.0°/o 8.6°/o Core fixed income 7.0°/o 1. 7°/o Inflation linked bond fund 3.0% 1.3°/o Emerging market bond 5.0°/o 4.8°/o High yield bonds 5.0°/o 3.7% Real estate 7.0°/o 5.9% Private equity 11.0°/o 10.9% Alternative investments 8.0°/o 0.7°/o Liquidity fund 6.0% 0.4%
Total 100.0°/o
71

EXHIBIT L TOWN OF FAIRFIELD, CONNECTICUT NOTES TO FINANCIAL STATEMENTS (CONTINUED)
IV. OTHER INFORMATION (CONTINUED)
D. Pension plans - Connecticut State Teachers' Retirement Plan (Continued)
6. Discount Rate
The discount rate used to measure the total pension liability was 8.50o/o. The projection of cash flows used to determine the discount rate assumed that plan member contributions will be made at the current contribution rate and that employer contributions will be made at rates equal to the difference between actuarially determined contribution rates and the member rate. Based on those assumptions, the pension plan's fiduciary net position was projected to be available to make all projected future benefit payments of current plan members. Therefore, the long-term expected rate of return on pension plan investments was applied to all periods of projected benefit payments to determine the total pension liability.
7. Sensitivity of the Net Pension Liability to Changes in the Discount Rate
The Town's proportionate share of the net pension liability is $0 and, therefore, the change in the discount rate would only impact the amount recorded by the State of Connecticut.
8. Plan Fiduciary Net Position
Detailed information about the Connecticut State Teachers' Retirement Plan fiduciary net position is available in the separately issued State of Connecticut Comprehensive Annual Financial Report as of and for the year ended June 30, 2014.
E. Other Post-Employment Benefit Plans
1. Plan Description
The Town administers three single-employer, post retirement healthcare plans for the Town, Police and Fire and Board of Education for the Town of Fairfield Other Post Employment Benefit ("OPES"). The Town and Police and Fire plans provide medical, dental and life insurance benefits for eligible retirees and their spouses. The Board of Education plan provides medical and dental benefits to eligible retirees and their spouses. The plans are considered to be part of the Town's financial reporting entity and are included in the Town's financial reports as an Other Post-Employment Benefit Trust Fund. The plan does not issue stand-alone financial reports.
2. Summary of Significant Accounting Policies and Plan Asset Matters
a. Basis of Accounting
The OPES trust fund is accounted for using the accrual basis of accounting. Contributions are recognized when due, pursuant to formal commitments and contractual requirements, revenue (investment income) is recognized when earned and expenses (benefits, administration and refunds) are recognized when due and payable in accordance with the terms of the plan.
72

EXHIBIT L TOWN OF FAIRFIELD, CONNECTICUT NOTES TO FINANCIAL STATEMENTS (CONTINUED)
IV. OTHER INFORMATION (CONTINUED)
E. Other Post-Employment Benefit Plan (Continued)
2. Summarv of Significant Accounting Policies and Plan Asset Matters (Continued)
b. Valuation of Investments
Investments are valued at fair value. Securities traded on national exchanges are valued at the last reported sales price. There are no investments of 5o/o or greater in any one organization.
3. Classes of Employees Covered
As of July 1, 2014 for Town, Police and Fire and Board of Education, the plans' membership consisted of:
POLICE BOARD AND OF
TOWN FIRE EDUCATION Retirees and beneficiaries currently
receiving benefits ..................................... . 289 274 238 Active plan members .................................. . 258 199 1 348
TOTAL ..................................................... . 54Z 4Z3 :l 586
4. Benefit Provisions
a. Benefit Provisions
The Town plan provides for medical, dental and life insurance benefits for all eligible Town, Police and Fire retirees and their spouses. The Board of Education plan provides medical and dental benefits for all Board of Education retirees and their spouses. Benefits and contributions are established by contract and may be amended by union negotiations. Administration costs are financed from investment earnings.
b. Em plover Contributions
The Town's recommended contributions are actuarially determined on an annual basis using the projected unit credit method. The Town, Police and Fire and Board of Education's total plan contribution was $10,681.
c. Employee Contributions
There are no employee contributions to the Town and Board of Education plans. For the Police and Fire plan, contributions are to be made as follows:
Police and Fire 1.5o/o basic annual salary including longevity
Teachers who no longer work for the Board of Education are allowed by State Statute to participate in the Town's group medical insurance plan until they formally begin receiving benefits from the State Teachers' Retirement Plan. These teachers are required to contribute the cost of the insurance to the Town.
73
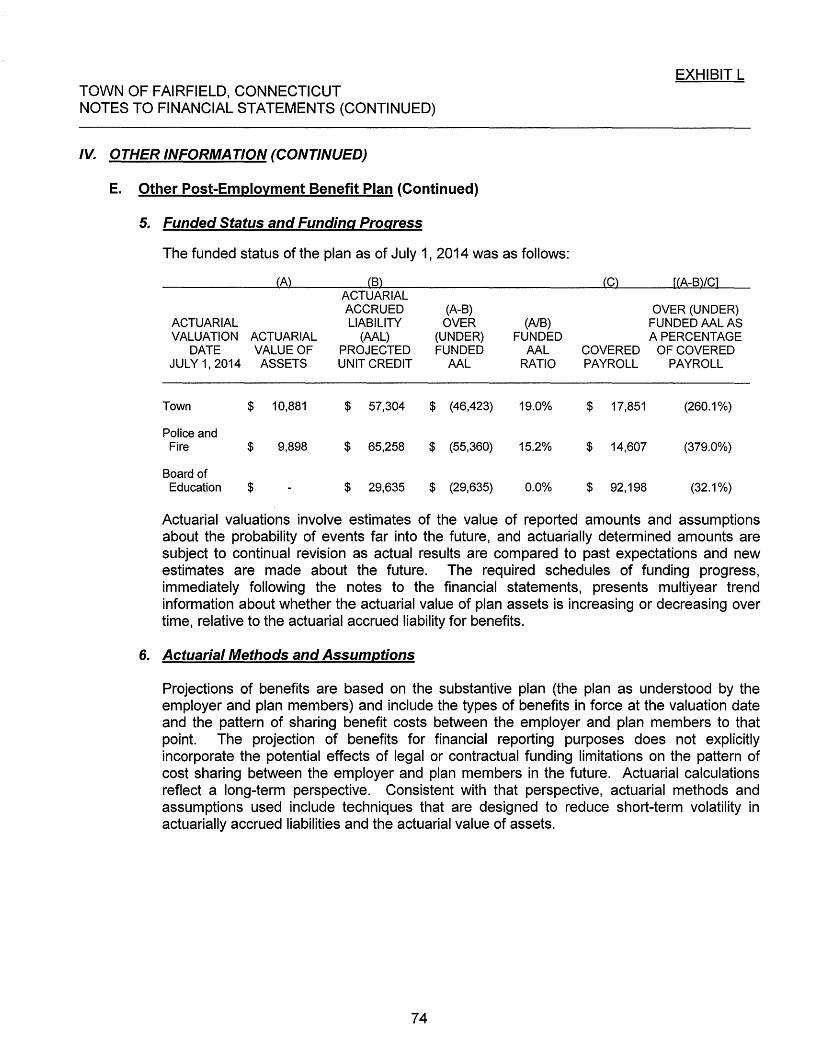
EXHIBIT L TOWN OF FAIRFIELD, CONNECTICUT NOTES TO FINANCIAL STATEMENTS (CONTINUED)
IV. OTHER INFORMATION (CONTINUED)
E. Other Post-Employment Benefit Plan (Continued)
5. Funded Status and Funding_ Prog_ress
The funded status of the plan as of July 1, 2014 was as follows:
(A} (B} (C} [(A-B}/C] ACTUARIAL ACCRUED (A-B) OVER (UNDER)
ACTUARIAL LIABILITY OVER (NB) FUNDED AAL AS VALUATION ACTUARIAL (AAL) (UNDER) FUNDED A PERCENTAGE
DATE VALUE OF PROJECTED FUNDED AAL COVERED OF COVERED JULY1,2014 ASSETS UNIT CREDIT AAL RATIO PAYROLL PAYROLL
Town $ 10,881 $ 57,304 $ (46,423) 19.0% $ 17,851 (260.1%)
Police and Fire $ 9,898 $ 65,258 $ (55,360) 15.2% $ 14,607 (379.0%)
Board of Education $ $ 29,635 $ (29,635) 0.0% $ 92,198 (32.1%)
Actuarial valuations involve estimates of the value of reported amounts and assumptions about the probability of events far into the future, and actuarially determined amounts are subject to continual revision as actual results are compared to past expectations and new estimates are made about the future. The required schedules of funding progress, immediately following the notes to the financial statements, presents multiyear trend information about whether the actuarial value of plan assets is increasing or decreasing over time, relative to the actuarial accrued liability for benefits.
6. Actuarial Methods and Assumptions
Projections of benefits are based on the substantive plan (the plan as understood by the employer and plan members) and include the types of benefits in force at the valuation date and the pattern of sharing benefit costs between the employer and plan members to that point. The projection of benefits for financial reporting purposes does not explicitly incorporate the potential effects of legal or contractual funding limitations on the pattern of cost sharing between the employer and plan members in the future. Actuarial calculations reflect a long-term perspective. Consistent with that perspective, actuarial methods and assumptions used include techniques that are designed to reduce short-term volatility in actuarially accrued liabilities and the actuarial value of assets.
74

EXHIBIT L TOWN OF FAIRFIELD, CONNECTICUT NOTES TO FINANCIAL STATEMENTS (CONTINUED)
IV. OTHER INFORMATION (CONTINUED)
E. Other Post-Employment Benefit Plan (Continued)
6. Actuarial Methods and Assumptions (Continued)
The data presented in the schedules of funding progress and schedules of contributions were determined as part of the actuarial valuation at the date indicated. Additional information for all plans as of the latest valuation date is as follows:
VALUATION DATE ACTUARIAL COST METHOD AMORTIZATION METHOD REMAINING AMORTIZATION PERIOD:
Town Police and Fire Board of Education
ASSET VALUATION METHOD
ACTUARIAL ASSUMPTIONS:
July 1, 2014 Projected Unit Credit
Level Dollar
15.5 years open 25 years open 25 years open
Fair Value
Investment rate of return- Town and Police and Fire Investment rate of return- Board of Education Project Healthcare Cost Increases:
7.5% 4.5°/o
Inflation Initial Ultimate
2.5% 9.0°/o 5.0o/o
Projected Salary Increases 2.5% to 6.5°/o
7. Annual OPEB Cost and Net OPEB Obligation C'NOO"J
The changes in the NOO were as follows: POLICE
AND TOWN FIRE
Annual required contribution ......................... $ 4,633 $ 4,750 Interest on net OPEB obligation ................... 524 654 Adjustment to annual required contribution . (404) (505)
Annual OPEB cost.. ...................................... 4,753 4,899
Contributions made ...................................... (4.777) (4.861)
Change in net OPEB obligation .................... (24) 38
Net OPEB obligation - July 1, 2014 .............. 6 983 8 719
Net OPEB obligation - June 30, 2015 .......... $ 6 959 s 8 Z5Z
75
BOARD OF
EDUCATION
$ 1,634 196
(177)
1,653
(1 .043)
610
4345
s 4 955

EXHIBIT L TOWN OF FAIRFIELD, CONNECTICUT NOTES TO FINANCIAL STATEMENTS (CONTINUED)
IV. OTHER INFORMATION (CONTINUED)
E. Other Post-Employment Benefit Plan (Continued)
B. Three Year Trend Information
ANNUAL YEAR OPEB PERCENTAGE NET
ENDING COST OFAOC OPEB TOTAL JUNE 30 (AOC) CONTRIBUTED OBLIGATION CONTRIBUTIONS
TOWN
2013 $ 4,413 98% $ 7,023 $ 4,332 2014 4,550 101% 6,983 4,590 2015 4,753 101% 6,959 4,777
POLICE AND FIRE
2013 $ 4,641 98% $ 8,682 $ 4,535 2014 4,696 99% 8,719 4,659 2015 4,899 99% 8,757 4,861
BOARD OF EDUCATION
2013 $ 1,424 65% $ 3,625 $ 922 2014 1,622 56% 4,345 902 2015 1,653 63% 4,955 1,043
76

TOWN OF FAIRFIELD, CONNECTICUT NOTES TO FINANCIAL STATEMENTS (CONTINUED)
IV. OTHER INFORMATION (CONTINUED)
E. Other Post-Employment Benefit Plan (Continued)
9. Plan Statements
COMBINING STATEMENT OF FIDUCIARY NET POSITION OTHER POST-EMPLOYMENT BENEFIT TRUST FUNDS
JUNE 30, 2015 (THOUSANDS)
TOWN
ASSETS
Investments at fair value: U.S. Government agency obligations......... $ 1,154 Municipal obligations ............................. . Hedge funds and private equity funds ....... . Mutual funds:
Equity ............................................... . Money market. .................................... .
Total investments .................................... .
Interest and dividends receivable ................. .
TOTAL ASSETS ...................................................... .
LIABILITIES
Liabilities: Accounts payable ................................................ . Claims payable ................................................... ..
TOTAL LIABILITIES ............................................... ..
NET POSITION
NET POSITION HELD IN TRUST FOR
385 3,620
8,277 83
13,519
36
13,555
43 134
177
$
POLICE AND FIRE
438 146
3,466
7,996 100
12,146
34
12,180
21 130
151
$
EXHIBIT L
TOTAL
1,592 531
7,086
16,273 183
25,665
70
25,735
64 264
328
OPES BENEFITS..................................... $ 13,378 $ 12,029 25,407 =====================================
77
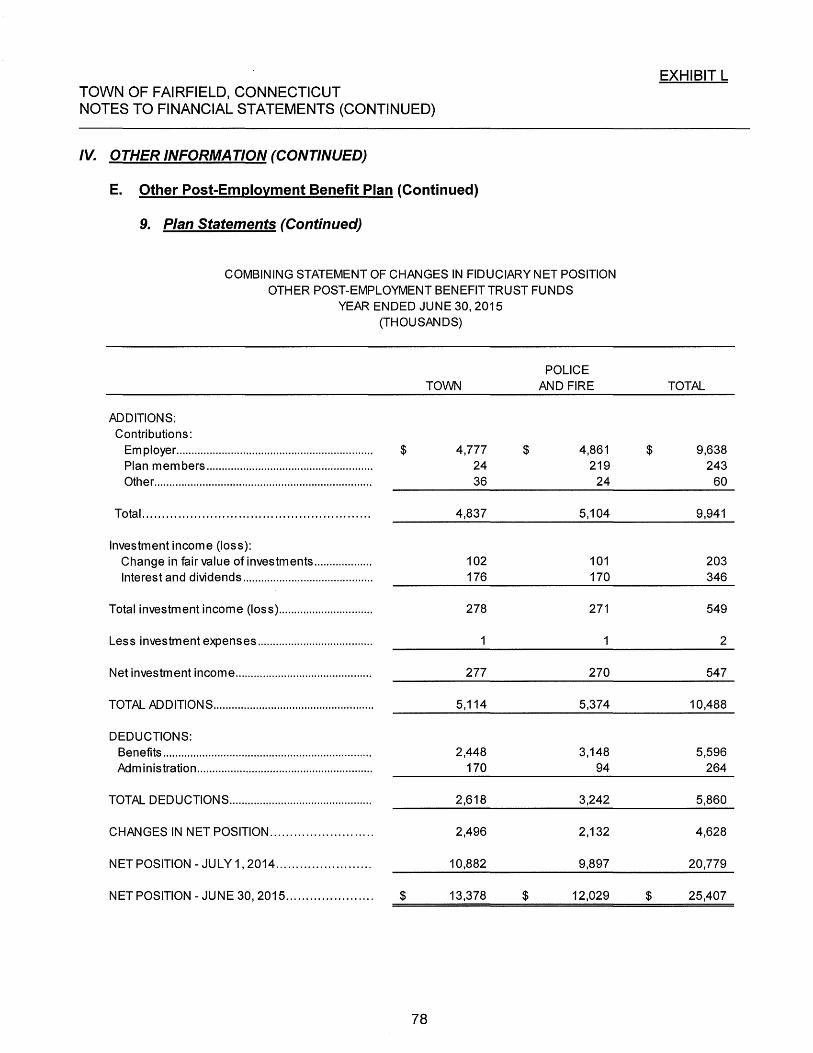
TOWN OF FAIRFIELD, CONNECTICUT NOTES TO FINANCIAL STATEMENTS (CONTINUED)
IV. OTHER INFORMATION (CONTINUED)
E. Other Post-Employment Benefit Plan (Continued)
9. Plan Statements (Continued)
COMBINING STATEMENT OF CHANGES IN FIDUCIARY NET POSITION OTHER POST-EMPLOYMENT BENEFIT TRUST FUNDS
YEAR ENDED JUNE 30, 2015 (THOUSANDS)
TOWN
ADDITIONS: Contributions:
Employer ................................................................ . $ 4,777 Plan members ...................................................... . 24 Other. ...................................................................... . 36
Total ........................................................ . 4,837
Investment income (loss): Change in fair value of investments .................. . 102 Interest and dividends ......................................... .. 176
Total investment income (loss) .............................. . 278
Less investment expenses .................................... ..
Net investment income ............................................ . 277
TOTAL ADDITIONS .................................................... . 5,114
DEDUCTIONS: Benefits .................................................................... . 2,448 Administration ......................................................... . 170
TOTAL DEDUCTIONS .............................................. . 2,618
CHANGES IN NET POSITION ........................ .. 2,496
NET POSITION- JULY 1, 2014 ....................... . 10,882
NET POSITION- JUNE 30, 2015 .................... .. $ 13,378
78
$
$
POLICE AND FIRE
4,861 219
24
5,104
101 170
271
270
5,374
3,148 94
3,242
2,132
9,897
12,029
$
$
EXHIBIT L
TOTAL
9,638 243
60
9,941
203 346
549
2
547
10,488
5,596 264
5,860
4,628
20,779
25,407

TOWN OF FAIRFIELD, CONNECTICUT NOTES TO FINANCIAL STATEMENTS (CONTINUED)
IV. OTHER INFORMATION (CONTINUED)
F. Prior Period Adjustment
The government-wide net position was restated as follows:
Net position as previously reported at June 30, 2014
To remove net pension asset
To record beginning net pension liability (NPL) - Police and firemen's retirement plan
To record beginning net pension asset (NPA)- Employees' retirement plan
Net position as restated as of July 1, 2014
*Beginning net pension liability presented as $3, 168.
79
EXHIBIT L
$ 274,331
(4,279)
(4,970)*
1 ,802*
$ 266 884

Required Supplementary Information
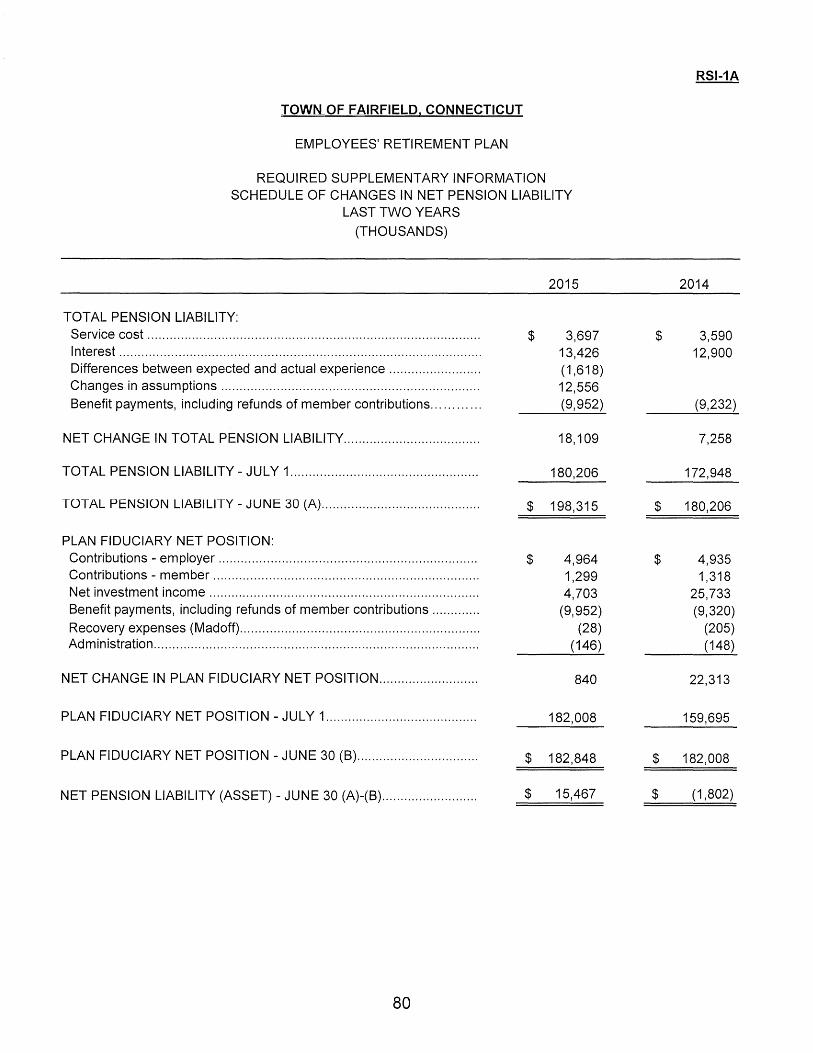
TOWN OF FAIRFIELD. CONNECTICUT
EMPLOYEES' RETIREMENT PLAN
REQUIRED SUPPLEMENTARY INFORMATION SCHEDULE OF CHANGES IN NET PENSION LIABILITY
LAST TWO YEARS
(THOUSANDS)
2015
TOTAL PENSION LIABILITY: Service cost .......................................................................................... $ 3,697 Interest .................................................................................................. 13,426 Differences between expected and actual experience ......................... (1,618) Changes in assumptions ...................................................................... 12,556 Benefit payments, including refunds of member contributions ............ (9,952)
NET CHANGE IN TOTAL PENSION LIABILITY ..................................... 18,109
TOTAL PENSION LIABILITY- JULY 1 ................................................... 180,206
TOTAL PENSION LIABILITY -JUNE 30 (A) ........................................... $ 198,315
PLAN FIDUCIARY NET POSITION: Contributions- employer ...................................................................... $ 4,964 Contributions- member ........................................................................ 1,299 Net investment income ......................................................................... 4,703 Benefit payments, including refunds of member contributions ............. (9,952) Recovery expenses (Madoff) ................................................................. (28) Administration ........................................................................................ (146)
NET CHANGE IN PLAN FIDUCIARY NET POSITION ........................... 840
PLAN FIDUCIARY NET POSITION -JULY 1 ......................................... 182,008
PLAN FIDUCIARY NET POSITION -JUNE 30 (B) ................................. $ 182,848
NET PENSION LIABILITY (ASSET)- JUNE 30 (A)-(B) .......................... $ 15,467
80
RSI-1A
2014
$ 3,590 12,900
(9,232)
7,258
172,948
$ 180,206
$ 4,935 1,318
25,733 (9,320)
(205) (148)
22,313
159,695
$ 182,008
$ (1 ,802)
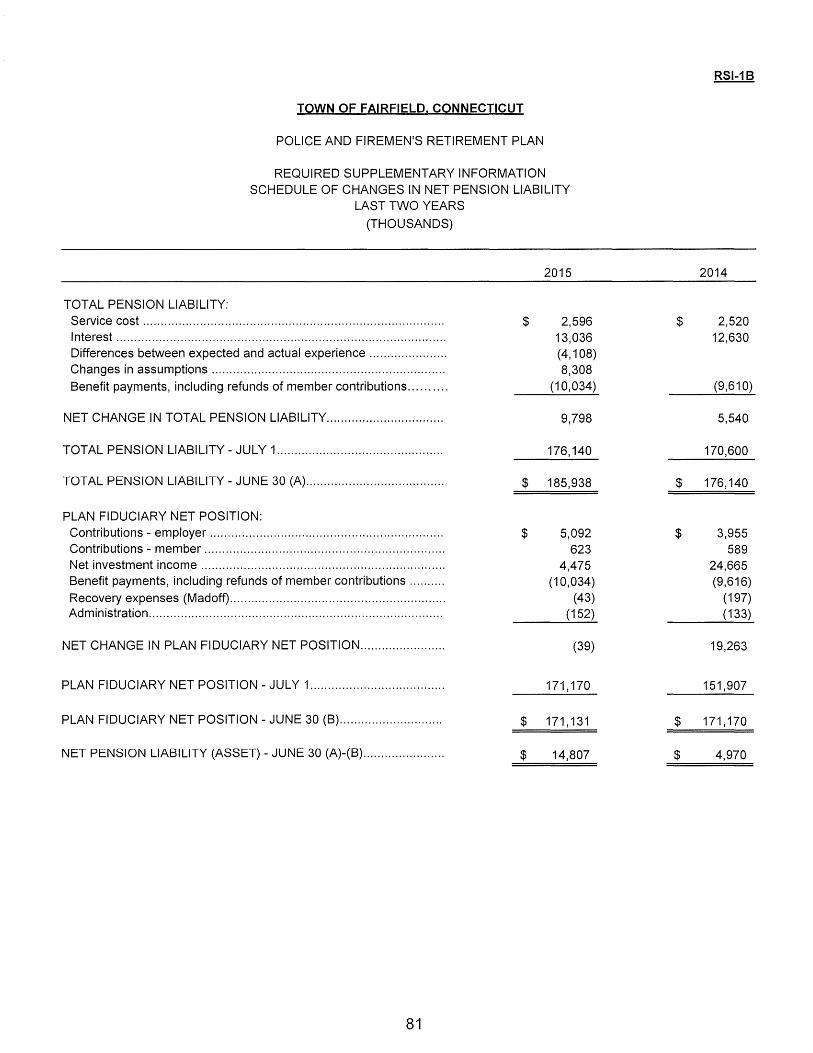
TOWN OF FAIRFIELD. CONNECTICUT
POLICE AND FIREMEN'S RETIREMENT PLAN
REQUIRED SUPPLEMENTARY INFORMATION SCHEDULE OF CHANGES IN NET PENSION LIABILITY
LAST TWO YEARS
(THOUSANDS)
2015
TOTAL PENSION LIABILITY: Service cost .................................................................................... . $ 2,596 Interest ............................................................................................ . 13,036 Differences between expected and actual experience ..................... . (4, 1 08) Changes in assumptions ................................................................. . 8,308 Benefit payments, including refunds of member contributions ......... . (1 0,034)
NET CHANGE IN TOTAL PENSION LIABILITY ................................ . 9,798
TOTAL PENSION LIABILITY-JULY 1 .............................................. . 176,140
TOTAL PENSION LIABILITY- JUNE 30 (A) ...................................... . $ 185,938
PLAN FIDUCIARY NET POSITION: Contributions - employer ................................................................. . $ 5,092 Contributions - member ................................................................... . 623 Net investment income .................................................................... . 4,475 Benefit payments, including refunds of member contributions ......... . (1 0,034) Recovery expenses (Madoff) ............................................................ . (43) Administration .................................................................................. . (152)
NET CHANGE IN PLAN FIDUCIARY NET POSITION ....................... . (39)
PLAN FIDUCIARY NET POSITION -JULY 1 ..................................... . 171,170
PLAN FIDUCIARY NET POSITION -JUNE 30 (B) ............................ . $ 171,131
NET PENSION LIABILITY (ASSET)- JUNE 30 (A)-(B) ...................... . $ 14,807
81
RSI-18
2014
$ 2,520 12,630
(9,61 0)
5,540
170,600
$ 176,140
$ 3,955 589
24,665 (9,616)
(197) (133)
19,263
151,907
$ 171,170
$ 4,970

TOWN OF FAIRFIELD. CONNECTICUT
EMPLOYEES' RETIREMENT PLAN
REQUIRED SUPPLEMENTARY INFORMATION SCHEDULE OF NET PENSION LIABILITY
LAST TWO YEARS (THOUSANDS)
TOTAL PENSION LIABILITY ........................................................................................... .
PLAN FIDUCIARY NET POSITION ................................................................................ .
NET PENSION LIABILITY (ASSET) ................................................................................ .
PLAN FIDUCIARY NET POSITION AS A PERCENTAGE OF
THE TOTAL PENSION LIABILITY. .............................................................................. .
CUVI::KI::lJ-I::MPLUYI::I:: PAYKULL. ............................................................................... .
NET PENSION LIABILITY (ASSET) AS A PERCENTAGE OF COVERED-EMPLOYEE PAYROLL. ............................................................................ .
SCHEDULE OF INVESTMENT RETURNS
ANNUAL MONEY WEIGHTED RATE OF RETURN, NET INVESTMENT EXPENSE ...
82
$
$
2015 2014
198,315 $ 180,206
(182,848) (182,008)
15,467 $ (1,802)
92.20% 101.00%
32,822 $ 34,B65
46.98% (5.2%)
2015 2014
2.59% 16.07%

TOWN OF FAIRFIELD CONNECTICUT
POLICE AND FIREMEN'S RETIREMENT PLAN
REQUIRED SUPPLEMENTARY INFORMATION SCHEDULE OF NET PENSION LIABILITY
LAST TWO YEARS (THOUSANDS)
TOTAL PENSION LIABILITY ................................................................................................. .
PLAN FIDUCIARY NET POSITION ....................................................................................... .
NET PENSION LIABILITY (ASSET) ...................................................................................... .
PLAN FIDUCIARY NET POSITION AS A PERCENTAGE OF
THE TOTAL PENSION LIABILITY .................................................................................... ..
COVERED-EMPLOYEE PAYROLL. ..................................................................................... .
NET PENSION LIABILITY (ASSET) AS A PERCENTAGE OF COVERED-EMPLOYEE PAYROLL. .................................................................................. .
SCHEDULE OF INVESTMENT RETURNS
ANNUAL MONEY WEIGHTED RATE OF RETURN, NET INVESTMENT EXPENSE ........
83
$
$
$
2015 2014
185,938 $ 176,140
(171,131) (171,170)
14,807 $ 4,970
92.04% 97.18%
14,072 $ 14,283
105.22% 34.80%
2015 2014
2.62% 16.05%

RSI-3A TOWN OF FAIRFIELD. CONNECTICUT
EMPLOYEES' RETIREMENT PLAN
REQUIRED SUPPLEMENTARY INFORMATION SCHEDULE OF CONTRIBUTIONS
LAST 10 FISCAL YEARS
(THOUSANDS)
CONTRIBUTIONS CONTRIBUTIONS IN RELATION ASA
TO THE PERCENTAGE OF ACTUARIALL Y ACTUARIALL Y CONTRIBUTION COVERED- COVERED-
FISCAL DETERMINED DETERMINED EXCESS EMPLOYEE EMPLOYEE YEAR CONTRIBUTION CONTRIBUTION (DEFICIENCY) PAYROLL PAYROLL
2015 $ 4,964 $ 4,964 $ $ 32,922 15.08%
2014 4,935 4,935 34,865 14.15%
2013 2,961 3,772 811 34,856 10.82%
2012 3,936 3,936 35,062 11.23%
2011 2,887 2,887 33,826 8.53%
2010 1,569 1,569 31,806 4.93%
2009 33,094 0.00%
2008 31,313 0.00%
2007 22 (22) 29,526 0.00%
2006 818 (818) 27,641 0.00%
84
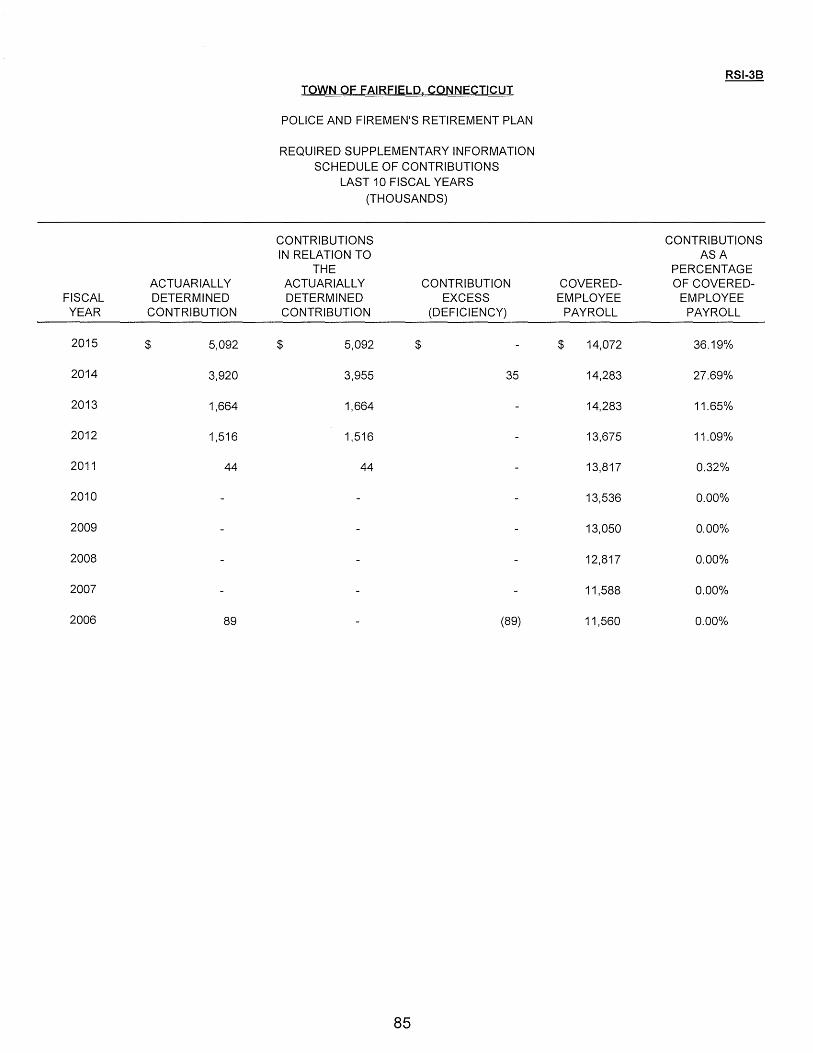
RSI-38 TOWN OF FAIRFIELD. CONNECTICUT
POLICE AND FIREMEN'S RETIREMENT PLAN
REQUIRED SUPPLEMENTARY INFORMATION SCHEDULE OF CONTRIBUTIONS
LAST 10 FISCAL YEARS (THOUSANDS)
CONTRIBUTIONS CONTRIBUTIONS IN RELATION TO ASA
THE PERCENTAGE ACTUARIALL Y ACTUARIALL Y CONTRIBUTION COVERED- OF COVERED-
FISCAL DETERMINED DETERMINED EXCESS EMPLOYEE EMPLOYEE YEAR CONTRIBUTION CONTRIBUTION (DEFICIENCY) PAYROLL PAYROLL
2015 $ 5,092 $ 5,092 $ $ 14,072 36.19%
2014 3,920 3,955 35 14,283 27.69%
2013 1,664 1,664 14,283 11.65%
2012 1,516 1,516 13,675 11.09%
2011 44 44 13,817 0.32%
2010 13,536 0.00%
2009 13,050 0.00%
2008 12,817 0.00%
2007 11,588 0.00%
2006 89 (89) 11,560 0.00%
85

RSI-4A
TOWN OF FAIRFIELD. CONNECTICUT
EMPLOYEES' RETIREMENT PLAN
NOTES TO REQUIRED SUPPLEMENTARY INFORMATION JUNE 30, 2015
. Changes of benefit terms None
2015 - Changed from RP-2000 mortality table to RP-Changes of assumptions 2014 mortality table
The actuarially determined contribution rates in the Method and assumptions used in calculations of schedule of contributions are calculated as of July 1, actuarially determined contribution 2013, one year prior to the end of the fiscal year in
which contributions are reported
The following actuarial methods and assumptions were used to determine contribution rates reported in that schedule:
!Actuarial Cost Method !Entry age
!Amortization Method I Level dollar, open
I Remaining Amortization Period 13 Years
!Asset Valuation Method I Fair value
!Inflation 11.25%
I Salary Increases j2.50%, average, including inflation
!Investment Rate of Return j7.50%
86
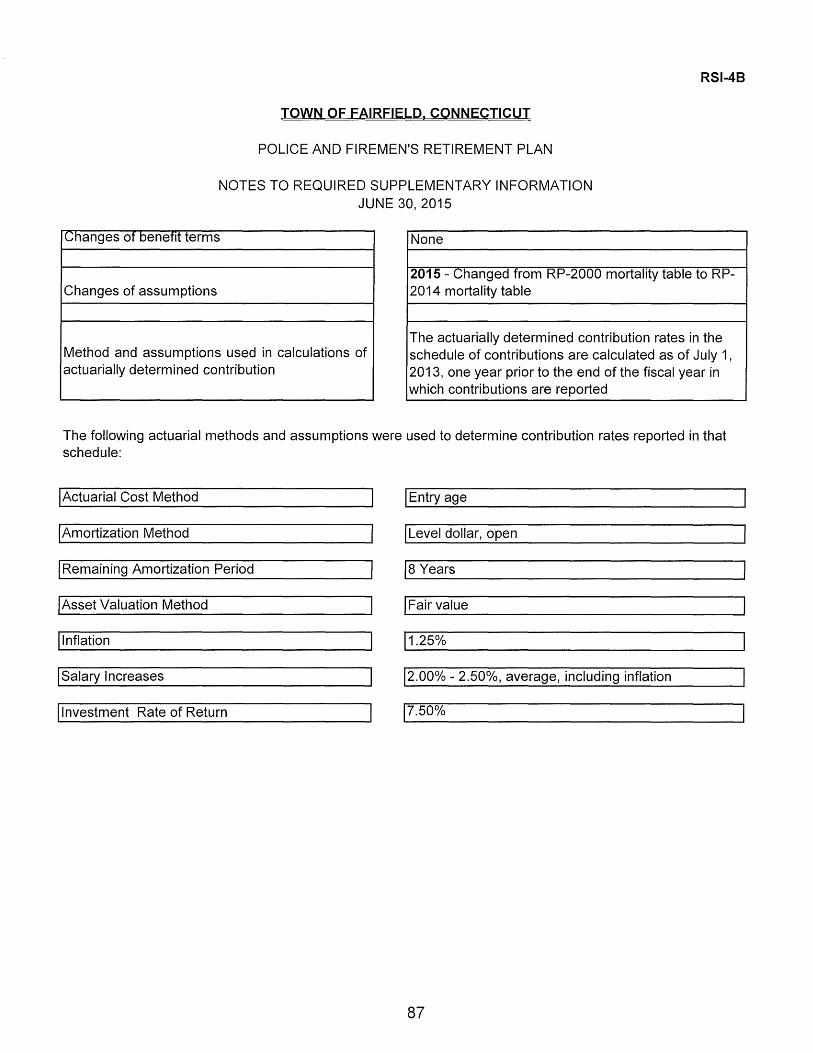
RSI-48
TOWN OF FAIRFIELD. CONNECTICUT
POLICE AND FIREMEN'S RETIREMENT PLAN
NOTES TO REQUIRED SUPPLEMENTARY INFORMATION JUNE 30, 2015
I Changes of benefit terms None
2015 - Changed from RP-2000 mortality table to RP-Changes of assumptions 2014 mortality table
The actuarially determined contribution rates in the Method and assumptions used in calculations of schedule of contributions are calculated as of July 1, actuarially determined contribution 2013, one year prior to the end of the fiscal year in
which contributions are reported
The following actuarial methods and assumptions were used to determine contribution rates reported in that schedule:
!Actuarial Cost Method I Entry age
!Amortization Method I Level dollar, open
I Remaining Amortization Period Is Years
!Asset Valuation Method !Fair value
!Inflation 11.25%
I Salary Increases 12.00% - 2.50°/o, average, including inflation
!Investment Rate of Return 17.50%
87

RSI-5 (1 of 2)
TOWN OF FAIRFIELD CONNECTICUT
OTHER POST-EMPLOYMENT BENEFIT (OPEB) PLANS
REQUIRED SUPPLEMENTARY INFORMATION SCHEDULES OF FUNDING PROGRESS
LAST EIGHT YEARS (THOUSANDS)
TOWN OPEB TRUST PLAN
A B (A-B) (AlB) c [(A-B)/C] ACTUARIAL
ACTUARIAL ACCRUED OVER OVER (UNDER) VALUATION ACTUARIAL LIABILITY (AAL) (UNDER) FUNDED FUNDED AAL AS
DATE VALUE OF PROJECTED UNIT FUNDED AAL COVERED A PERCENT AGE OF JULY 1 ASSETS CREDIT AAL RATIO PAYROLL COVERED PAYROLL
2007 $ $ 55,451 $ (55,451) 0.0% $ 17,678 (314%) 2008 N/A N/A N/A N/A N/A N/A 2009 1,773 53,312 (51,539) 3.3% 15,146 (340.3%) 2010 2,441 47,443 (45,002) 5.1% 16,893 (266.4%) 2011 N/A N/A N/A N/A N/A N/A 2012 5,554 55,048 (49,494) 10.1% 17,798 (278.1%) 2013 N/A N/A N/A N/A N/A N/A 2014 10,881 57,304 (46,423) 19.0% 17,851 (260.1%)
POLICE AND FIRE OPEB TRUST PLAN (X) (X)
A B (A-B) (AlB) c [(A-B)/C] ACTUARIAL
ACTUARIAL ACCRUED OVER OVER (UNDER) VALUATION ACTUARIAL LIABILITY (AAL) (UNDER) FUNDED FUNDED AAL AS
DATE VALUE OF PROJECTED UNIT FUNDED AAL COVERED A PERCENTAGE OF JULY 1 ASSETS CREDIT AAL RATIO PAYROLL COVERED PAYROLL
2007 $ $ 55,668 $ (55,668) 0.0% $ 12,818 (434%) 2008 N/A N/A N/A N/A N/A N/A 2009 1,454 62,090 (60,636) 2.3% 11,536 (525.6%) 2010 2,382 55,434 (53,052) 4.3% 13,817 (384.0%) 2011 N/A N/A N/A N/A N/A N/A 2012 5,291 62,310 (57,019) 8.5% 14,283 (399.2%) 2013 N/A N/A N/A N/A N/A N/A 2014 9,898 65,258 (55,360) 15.2% 14,607 (379.0%)
(Continued)

(X) co
ACTUARIAL VALUATION
DATE
2007
2008
2009
2010
2011
2012
2013
2014
N/A- No valuation performed.
A
ACTUARIAL VALUE OF ASSETS
$ -
N/A
N/A
N/A
TOWN OF FAIRFIELD. CONNECTICUT
OTHER POST-EMPLOYMENT BENEFIT (OPEB) PLANS
REQUIRED SUPPLEMENTARY INFORMATION SCHEDULES OF FUNDING PROGRESS
LAST EIGHT YEARS (THOUSANDS)
BOARD OF EDUCATION OPEB TRUST PLAN
B (A-B) (AlB)
ACTUARIAL ACCRUED OVER
LIABILITY (AAL) (UNDER) FUNDED PROJECTED UNIT FUNDED AAL
CREDIT AAL RATIO
$ 29,443 $ (29,443) 0.0%
N/A N/A N/A
27,097 (27,097) 0.0%
22,225 (22,225) 0.0%
N/A N/A N/A
24,559 (24,559) 0.0%
N/A N/A N/A
29,635 (29,635) 0.0%
RSI-5 (2 of 2)
c [(A-B)/C]
OVER (UNDER) FUNDED AAL AS
COVERED A PERCENTAGE OF PAYROLL COVERED PAYROLL
$ 83,018 (35.5%)
N/A N/A
87,722 (30.9%)
91,750 (24.2%)
N/A N/A
91,149 (26.9%)
N/A N/A
92,198 (32.1 %)
(Concluded)

RSI-6 TOWN OF FAIRFIELD, CONNECTICUT
OTHER POST-EMPLOYMENT BENEFIT (OPEB) PLANS
REQUIRED SUPPLEMENTARY INFORMATION SCHEDULES OF EMPLOYER CONTRIBUTIONS
LAST EIGHT YEARS
(THOUSANDS)
YEAR ANNUAL ENDED REQUIRED ACTUAL PERCENTAGE
JUNE 30, CONTRIBUTION CONTRIBUTION CONTRIBUTED
OTHER POST -EMPLOYMENT BENEFIT PLANS
TOWN 2008 $ 4,707 $ 1,938 41.2% 2009 4,842 3,194 66.0% 2010 4,112 4,777 116.2% 2011 4,218 3,653 86.6% 2012 4,338 3,924 90.5% 2013 4,231 4,332 102.4% 2014 4,430 4,590 103.6% 2015 4,633 4,777 103.1%
POLICE AND FIRE 2008 $ 4,770 $ 1,761 36.9% 2009 4,909 3,167 64.5% 2010 4,423 4,861 109.9% 2011 4,998 3,880 77.6% 2012 4,503 4,078 90.6% 2013 4,416 4,535 102.7% 2014 4,548 4,659 102.4% 2015 4,750 4,861 102.3%
BOARD OF EDUCATION 2008 $ 1,643 $ 1,183 72.0% 2009 1,671 1,530 91.6% 2010 1,629 611 37.5% 2011 1,660 689 41.5% 2012 1,364 894 65.5% 2013 1,387 922 66.5% 2014 1,607 902 56.1% 2015 1,634 1,043 63.8%
90

RSI-7
TOWN OF FAIRFIELD. CONNECTICUT
OTHER POST-EMPLOYMENT BENEFIT PLANS
NOTES TO REQUIRED SUPPLEMENARY INFORMATION JUNE 30, 2015
Changes of benefit terms
Changes of assumptions
Method and assumptions used in calculations of actuarially determined contribution
None
2015 - Changed from RP-2000 mortality table to RP-2014 mortality table
The actuarially determined contribution rates in the schedule of contributions are calculated as of July 1, 2014, one year prior to the end of the fiscal year in which contributions are reported.
The following actuarial methods and assumptions were used to determine contribution rates reported in that schedule:
!Actuarial Cost Method
!Amortization Method
Remaining Amortization Period -Town, Police and Fire, and Board of Education
I Asset Valuation Method
Investment Rate of Return- Town, Police and Fire, and Board of Education
I Healthcare inflation rate- Initial
I Healthcare inflation rate - Ultimate
I salary Increases
I Projected unit credit
ILeveldollar
I Fair value
17.5%, 7.5% and 4.5%, respectively
19.00%
15.00%
12.50% - 6.50%
91

TOWN OF FAIRFIELD. CONNECTICUT
STATE TEACHERS' RETIREMENT SYSTEM
REQUIRED SUPPLEMENTARY INFORMATION SCHEDULE OF PROPORTIONATE SHARE OF THE NET PENSION LIABILITY
(THOUSANDS)
JUNE 30, 2015
Town's proportion of the net pension liability
Town's proportionate share of the net pension liability
State of Connecticut's proportionate share of the net pension liability associated with Town
Total
Town's covered-employee payroll
Town's proportionate share of the net pension liability (asset) as a percentage of its covered-employee payroll
Plan fiduciary net position as a percentage of the total pension liability
SCHEDULE OF CONTRIBUTIONS
Contractually required contribution (1)
Contributions in relation to the contractually required contribution
Contribution deficiency (excess)
Town's covered-employee payroll
Contributions as a percentage of covered-employee payroll
(1) Local employers are not required to contribute to the plan
(2) Not applicable since 0% proportional share of the net pension liability
92
2015
$
$
(2) N/A
2015
( 1) $
$
(2) N/A
0.00%
216,781
216,781
0.00%
0.00%
0.00%

TOWN OF FAIRFIELD. CONNECTICUT
STATE TEACHERS' RETIREMENT SYSTEM
NOTES TO REQUIRED SUPPLEMENARY INFORMATION JUNE 30, 2015
Changesofbenefitterms
Changes of assumptions
!Actuarial Cost Method
!Amortization Method
I Remaining Amortization Period
I Asset Valuation Method
!Inflation
jSalary Increases
!Investment Rate of Return
93
None
In 2011, rates of withdrawal, retirement and assumed rates of salary increase were adjusted more closely to reflect actual and anticipated experience. These assumptions were recommended as part of the Experience Study for the System for the five year period ended June 30, 2010.
!Entry age
I Level percent of salary, closed
122.4 years
14 year smoothed market
j3.75%-7.00%, average, including inflation
8.50°/o, net of pension plan investment expense, including inflation
General Fund
The general fund is the principal fund of the Town and is used to account for all activities of the Town, except those required to be accounted for in another fund. The general fund accounts for the normal recurring activities of the Town (i.e., general government, public safety, public works, buildings and grounds, planning and development, health and human services, library, education, etc.). These activities are funded principally by property taxes, user fees and grants from other governmental units.

TOWN OF FAIRFIELD. CONNECTICUT
ASSETS
GENERAL FUND COMPARATIVE BALANCE SHEET
JUNE 30, 2015 AND 2014 (THOUSANDS)
Cash ............................................................................................ . Investments ................................................................................. . Resticted investments ................................................................. . Receivables, net:
Property taxes ............................................................... . Intergovernmental. .................................................................... . Other ......................................................................................... .
Due from other funds ................................................................. ..
TOTAL ASSETS .............................................................. .
LIABILITIES
Accounts payable ...................................................................... . Accrued payroll ......................................................................... . Unearned revenue ......................................................... . Performance bonds ....................................................... .. Other .......................................................................... .
TOTAL LIABILITIES ...................................................... .
DEFERRED INFLOWS OF RESOURCES
Unavailable revenue - property taxes ................................. . Unavailable revenue- advanced property tax collections ........ . Unavailable revenue- other charges .................................. .
TOTAL DEFERRED INFLOWS OF RESOURCES .............. .
FUND BALANCES Assigned ...................................................................... . Unassigned .................................................................. .
TOTAL FUND BALANCES ............................................ .
TOTAL LIABILITIES, DEFERRED INFLOWS OF RESOURCES
2015
$ 3,869 39,077
3,704
6,829 370 909
3,740
$ 58,498
$ 5,518 13,185
3,704 1,454
23,861
6,829 2,620
65
9,514
863 24,260
25,123
AND FUND BALANCES ................................................ . $ 58,498
94
SCHEDULE 1
$
$
$
$
2014
4,681 32,314
3,667
6,248 374 802
5,678
53,764
4,899 11,709
34 3,667 1,380
21,689
6,248 3,779
65
10,092
815
21 '168
21,983
53,764
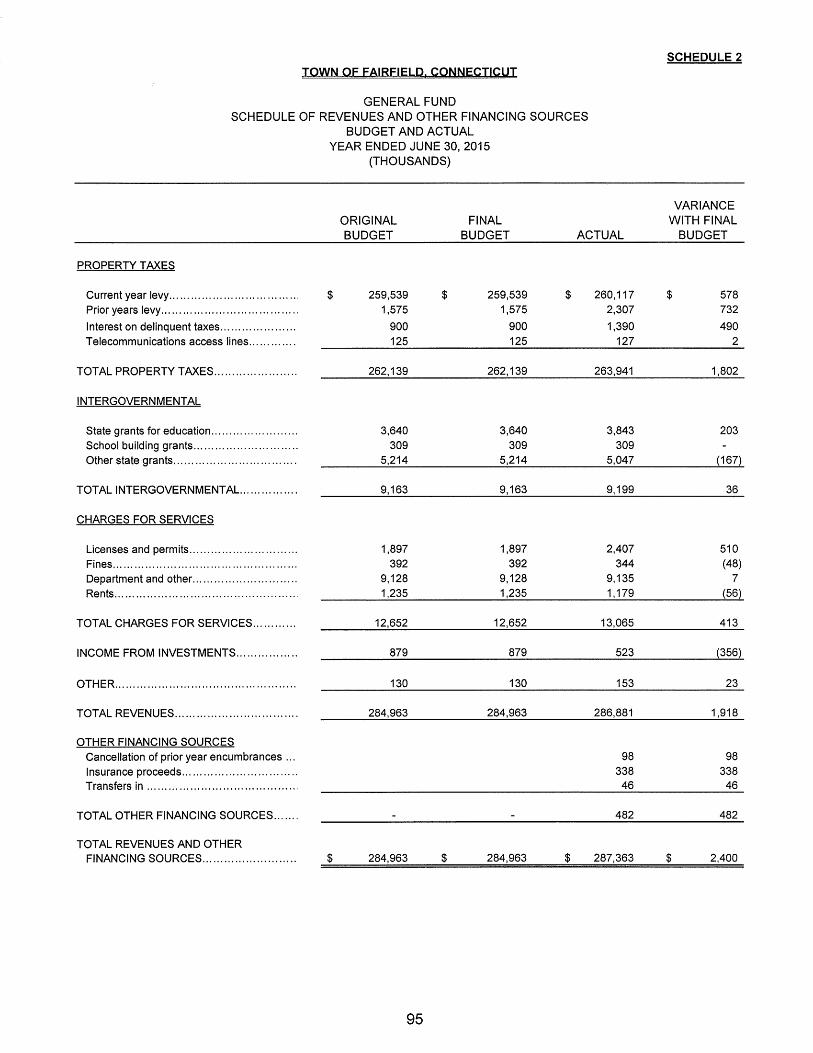
SCHEDULE 2 TOWN OF FAIRFIELD CONNECTICUT
GENERAL FUND SCHEDULE OF REVENUES AND OTHER FINANCING SOURCES
BUDGET AND ACTUAL YEAR ENDED JUNE 30, 2015
(THOUSANDS)
VARIANCE ORIGINAL FINAL WITH FINAL BUDGET BUDGET ACTUAL BUDGET
PROPERTY TAXES
Current year levy .................................... $ 259,539 $ 259,539 $ 260,117 $ 578 Prior years levy ...................................... 1,575 1,575 2,307 732
Interest on delinquent taxes ..................... 900 900 1,390 490 Telecommunications access lines ............. 125 125 127 2
TOTAL PROPERTY TAXES ....................... 262,139 262,139 263,941 1,802
INTERGOVERNMENTAL
State grants for education ........................ 3,640 3,640 3,843 203 School building grants ............................. 309 309 309 Other state grants .................................. 5,214 5,214 5,047 (167)
TOTAL INTERGOVERNMENTAL. ............... 9,163 9,163 9,199 36
CHARGES FOR SERVICES
Licenses and permits .............................. 1,897 1,897 2,407 510 Fines ................................................... 392 392 344 (48) Department and other ............................. 9,128 9,128 9,135 7 Rents ................................................... 1,235 1,235 1,179 (56)
TOTAL CHARGES FOR SERVICES ............ 12,652 12,652 13,065 413
INCOME FROM INVESTMENTS ................. 879 879 523 (356)
OTHER .................................................. 130 130 153 23
TOTAL REVENUES .................................. 284,963 284,963 286,881 1,918
OTHER FINANCING SOURCES Cancellation of prior year encumbrances ... 98 98 Insurance proceeds ................................ 338 338 Transfers in .......................................... 46 46
TOTAL OTHER FINANCING SOURCES ....... 482 482
TOTAL REVENUES AND OTHER FINANCING SOURCES .......................... $ 284,963 $ 284,963 $ 287,363 $ 2,400
95

TOWN OF FAIRFIELD CONNECTICUT
GENERAL FUND SCHEDULE OF EXPENDITURES AND OTHER FINANCING USES
BUDGET AND ACTUAL YEAR ENDED JUNE 30, 2015
(THOUSANDS)
ORIGINAL BUDGET
FINAL BUDGET ACTUAL
GENERAL GOVERNMENT
Administrative and general: Board of selectmen ............................. . $ 458 $ 472 $ 469 Town clerk ......................................... . 527 506 506 Administrative services ........................ .. 101 101 87 Registrar of voters .............................. .. 226 237 237 Zoning board of appeals ...................... . 5 5 4 Town planning and zoning commission .... . 579 612 612 Probate court .................................... .. 31 31 25 Historical district commission ................. . 12 12 10 Conservation commission ..................... . 916 932 932 Shellfish commission ........................... . 8 8 6 Legal services .................................... . 450 450 426 Miscellaneous contingencies ................. . 45 45 36 Retiree benefits .................................. . 16,803 16,841 16,841 Human resources ................................ . 6,124 5,768 5,768 Medical benefits ................................. .. 9,139 9,139 9,139 Economic development commission ...... .. 199 205 205 Harbor management commission .......... .. 24 25 25
Total Administrative and general ............... . 35,647 35,389 35,328
Miscellaneous: Private agencies ................................. . 801 801 801 Private school transportation ................. . 1,402 1,450 1,450 Contingency ................................... : ... . 2,357
Total Miscellaneous ................................ . 4,560 2,251 2,251
TOTAL GENERAL GOVERNMENT ........... . 40,207 37,640 37,579
CONTRIBUTION TO FUND BALANCE ....... 500 500
FINANCE
Finance ............................................. . 822 864 858 Purchasing ......................................... . 247 256 255 Assessor ........................................... . 587 988 988 Tax collector ..................................... .. 581 606 600 Information systems ............................. . 1,543 1,927 1,927 Board of finance .................................. . 120 120 112 Unemployment compensation ................ . 205 312 312
TOTAL FINANCE ................................. .. 4,105 5,073 5,052
96
SCHEDULE 3 (1 of 2)
VARIANCE WITH FINAL
BUDGET
$ 3
14
6 2
2 24
9
61
61
500
6 1
6
8
21
(Continued)

SCHEDULE 3 (2 of 2)
TOWN OF FAIRFIELD, CONNECTICUT GENERAL FUND SCHEDULE OF EXPENDITURES AND OTHER FINANCING USES (CONCLUDED)
VARIANCE ORIGINAL FINAL WITH FINAL BUDGET BUDGET ACTUAL BUDGET
PUBLIC SAFETY
Fire ................................................... $ 11,815 $ 12,379 $ 12,379 $ Police ................................................ 13,439 13,923 13,923 Animal control. .................................... 409 421 400 21 Street lighting ...................................... 675 680 680 Hydrant and water service ..................... 1,690 1,690 1,685 5 Emergency management.. ..................... 56 57 53 4 Emergency communications center ......... 1,511 1,488 1,488
TOTAL PUBLIC SAFETY ......................... 29,595 30,638 30,608 30
PUBLIC WORKS
Public works administration .................... 490 512 512 Public works operations ......................... 13,771 14,637 14,634 3 Building .............................................. 607 569 569 Engineering ........................................ 650 647 647
TOTAL PUBLIC WORKS ......................... 15,518 16,365 16,362 3
HEALTH AND WELFARE
Health ................................................ 2,711 2,775 2,775 Welfare .............................................. 137 137 134 3 Human services ................................... 555 544 527 17 Solid waste and recycling ....................... 3,645 3,368 3,357 11
TOTAL HEALTH AND WELFARE .............. 7,048 6,824 6,793 31
CULTURE AND RECREATION
Library ............................................... 3,574 3,653 3,652 Penfield pavillion complex ...................... 59 59 50 9 Parks and recreation ............................. 679 703 695 8 Beaches and lifeguards ......................... 402 402 397 5 Golf courses ........................................ 1,704 1,676 1,653 23
TOTAL CULTURE AND RECREATION ...... 6,418 6,493 6,447 46
EDUCATION ......................................... 155,718 155,718 155,718
DEBT SERVICE ..................................... 22,614 22,419 22,419
TOTAL EXPENDITURES ......................... 281,723 281,670 280,978 692
OTHER FINANCING USES
Transfers out. ................................. ~ .... 3,240 3,293 3,293
TOTAL EXPENDITURES AND OTHER FINANCING USES ............................... $ 284,963 $ 284,963 $ 284,271 $ 692
(Concluded)
97
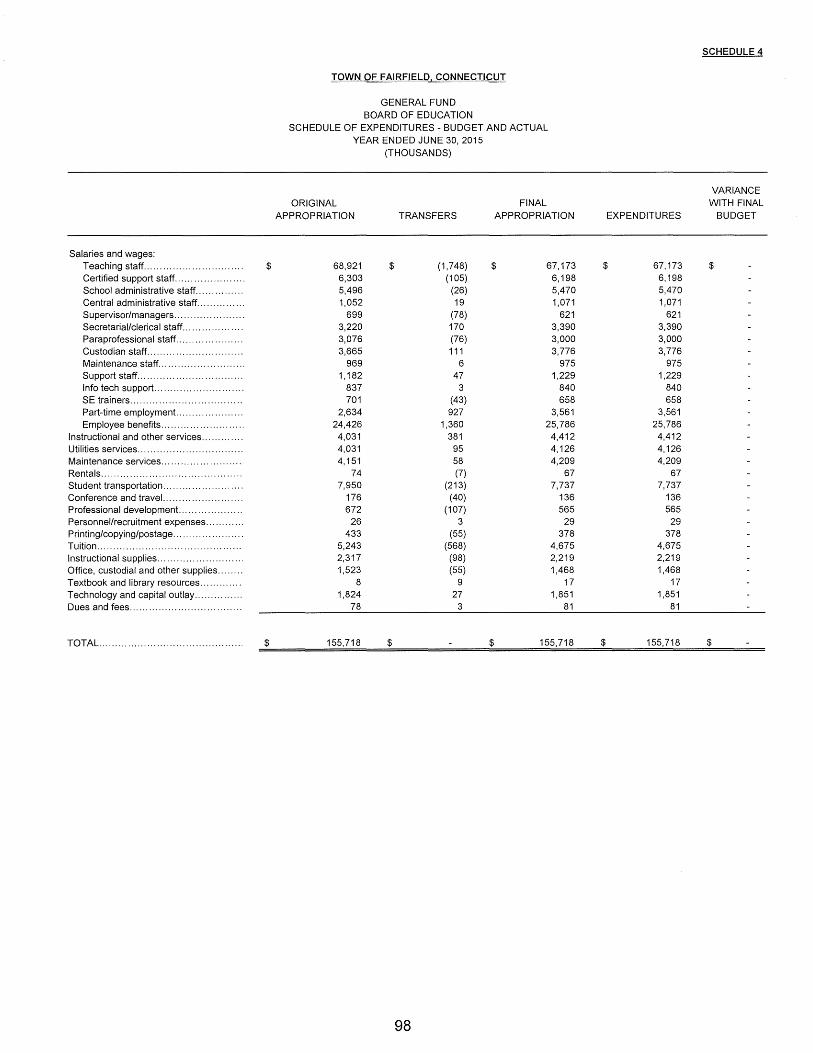
Salaries and wages: Teaching staff ............................... $ Certified support staff ...................... School administrative staff ............... Central administrative staff ............... Supervisor/managers ...................... Secretarial/clerical staff ................... Paraprofessional staff ..................... Custodian staff .............................. Maintenance staff ........................... Support staff ................................. Info tech support ............................ SE trainers ................................... Part-time employment. .................... Employee benefits ..........................
Instructional and other services ............. Utilities services ................................. Maintenance services ......................... Rentals ............................................ Student transportation ......................... Conference and travel. ........................ Professional development. ................... Personnel/recruitment expenses ............ Printing/copying/postage ...................... Tuition ............................................. Instructional supplies ........................... Office, custodial and other supplies ........ Textbook and library resources ............. Technology and capital outlay ............... Dues and fees ...................................
TOTAL. ............................................ $
TOWN OF FAIRFIELD CONNECTICUT
GENERAL FUND BOARD OF EDUCATION
SCHEDULE OF EXPENDITURES- BUDGET AND ACTUAL YEAR ENDED JUNE 30, 2015
(THOUSANDS)
ORIGINAL APPROPRIATION
68,921 6,303 5,496 1,052
699 3,220 3,076 3,665
969 1,182
837 701
2,634 24,426 4,031 4,031 4,151
74 7,950
176 672
26 433
5,243 2,317 1,523
8 1,824
78
155,718
$
$
TRANSFERS
(1,748) (105)
(26) 19
(78) 170 (76) 111
6 47
3 (43) 927
1,360 381
95 58 (7)
(213) (40)
(107) 3
(55) (568) (98) (55)
9 27
3
98
FINAL APPROPRIATION
$ 67,173 6,198 5,470 1,071
621 3,390 3,000 3,776
975 1,229
840 658
3,561 25,786 4,412 4,126 4,209
67 7,737
136 565
29 378
4,675 2,219 1,468
17 1,851
81
$ 155,718
EXPENDITURES
$ 67,173 6,198 5,470 1,071
621 3,390 3,000 3,776
975 1,229
840 658
3,561 25,786 4,412 4,126 4,209
67 7,737
136 565 29
378 4,675 2,219 1,468
17 1,851
81
$ 155,718
SCHEDULE 4
VARIANCE WITH FINAL
BUDGET
$
$
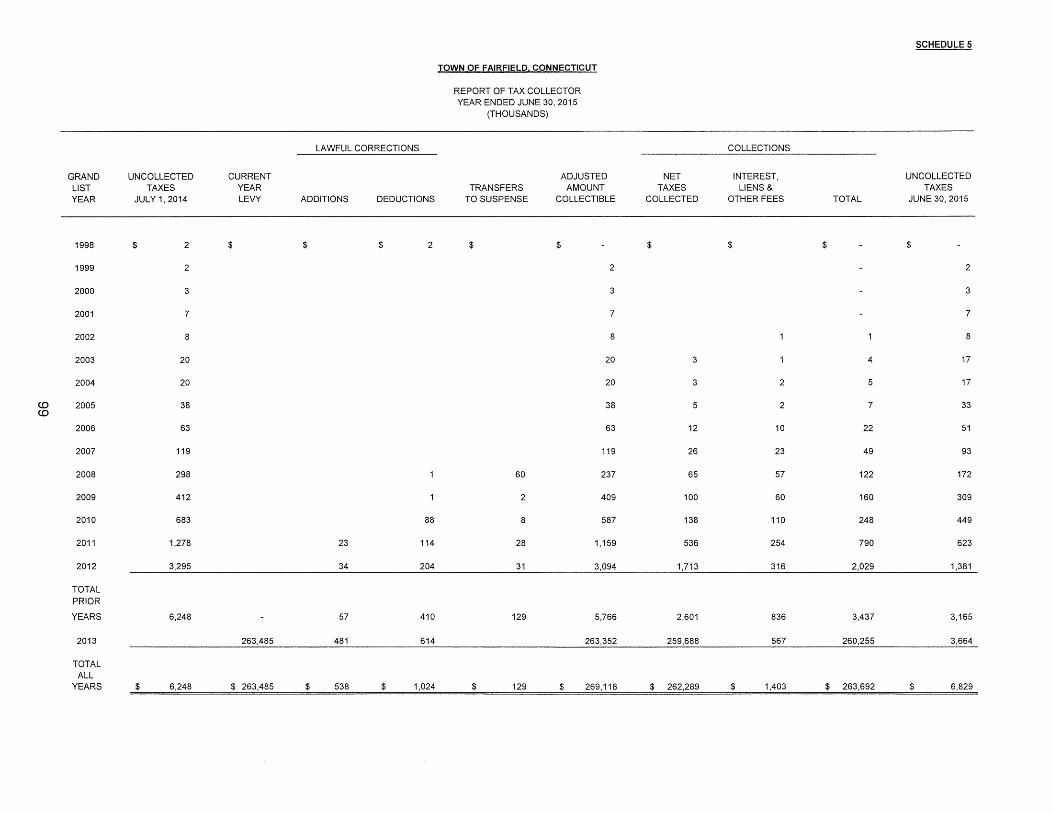
SCHEDULE 5
IQW!'!I QF EAIRFIEL.~ CQ!'!!!'!!ECTICUT
REPORT OF TAX COLLECTOR YEAR ENDED JUNE 30,2015
(THOUSANDS)
LAWFUL CORRECTIONS COLLECTIONS
GRAND UNCOLLECTED CURRENT ADJUSTED NET INTEREST, UNCOLLECTED LIST TAXES YEAR TRANSFERS AMOUNT TAXES LIENS & TAXES YEAR JULY 1, 2014 LEVY ADDITIONS DEDUCTIONS TO SUSPENSE COLLECTIBLE COLLECTED OTHER FEES TOTAL JUNE 30, 2015
1998 $ 2 $ $ $ 2 $ $ $ $ $ $
1999 2 2 2
2000 3 3 3
2001 7 7 7
2002 8 8 1 1 8
2003 20 20 3 1 4 17
2004 20 20 3 2 5 17
(!) 2005 38 38 5 2 7 33 (!)
2006 63 63 12 10 22 51
2007 119 119 26 23 49 93
2008 298 1 60 237 65 57 122 172
2009 412 1 2 409 100 60 160 309
2010 683 88 8 587 138 110 248 449
2011 1,278 23 114 28 1,159 536 254 790 623
2012 3,295 34 204 31 3,094 1,713 316 2,029 1,381
TOTAL PRIOR
YEARS 6,248 57 410 129 5,766 2,601 836 3,437 3,165
2013 263,485 481 614 263,352 259,688 567 260,255 3,664
TOTAL ALL
YEARS $ 6,248 $ 263,485 $ 538 $ 1,024 $ 129 $ 269,118 $ 262,289 $ 1,403 $ 263,692 $ 6,829

Special Revenue Funds
Non major Governmental Funds
Special revenue funds are used to account for the proceeds of specific revenue sources that are designated or legally restricted to expenditures for specific purposes. The nature and purpose of each Special Revenue Fund is as follows:
Fund Funding Source Function Special Assessments Sewer and beach Accumulation of resources for
assessments debt retirement Community Development Block Federal grant Town development programs Grant Special Education State and Federal grant, School related programs
custodial fees, continuing education and summer school programs
Recreation User fees Recreation programs Public Safety State and Federal grants/ Public safety programs
contributions Shellfish Permit fees Stocking shellfish beds Navy Housing Property rental and future Purchase and sub-division of
sale U.S. Navy property for affordable housing
Public School Lunch Sale of food and grants School lunch program Water Pollution Control Authority Sewer use fees Sanitary sewer operations Miscellaneous State and Federal grants, Health, law enforcement, and
and public health public safety programs administrative charges
Downtown Parking Parking fees Downtown employee parking and Fairfield Center improvements
Donations Private donations Various Library Trust income Support and benefit of the
Town's library Debt Service Fund
The Debt Service Fund accounts for the payment of principal and interest on long-term debt of the Town.
Permanent Funds
Permanent funds are used to report resources that are legally restricted to the extent that only earnings, not principal, may be used for purposes that support the reporting Town's programs.
H. Smith Richardson Conservation Fund - established in 1971 and 1990 for conservation purposes.
Simeon and Carrie Pease Fund - established in 1980 for education purposes.
Library Fund- support and benefit of the Town's library.
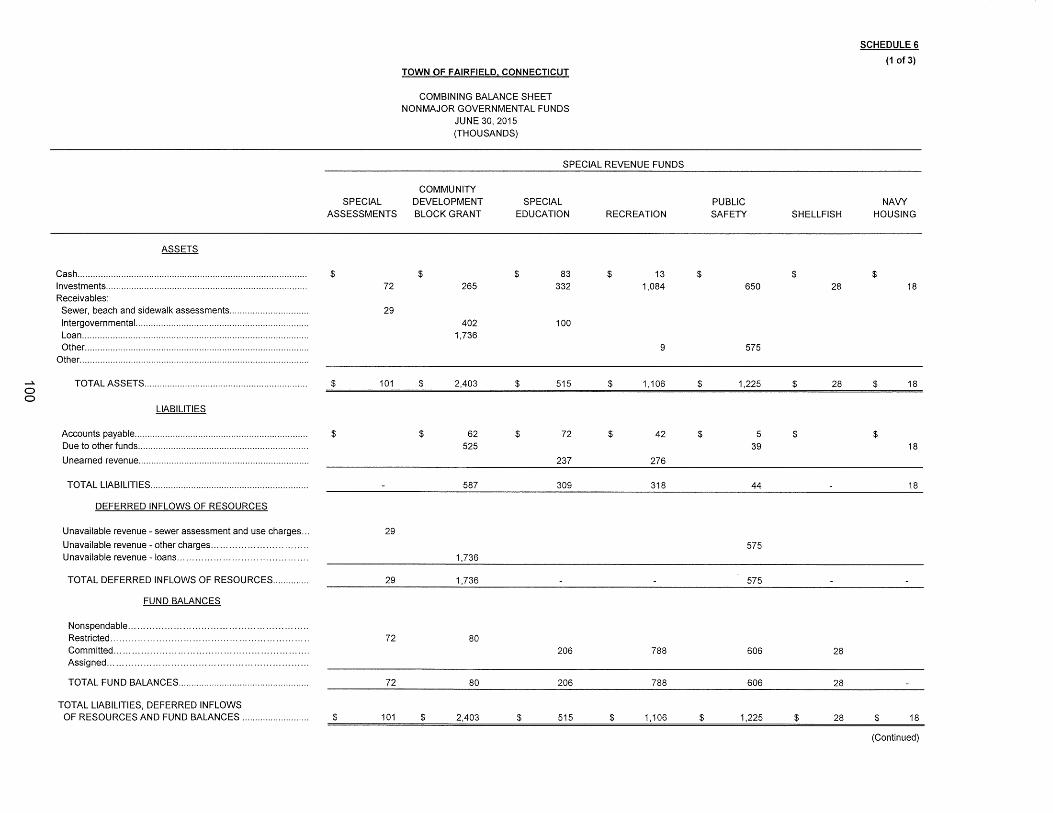
SCHEDULE 6
(1 of 3) TOWN OF FAIRFIELD CONNECTICUT
COMBINING BALANCE SHEET NONMAJOR GOVERNMENTAL FUNDS
JUNE 30, 2015 (THOUSANDS)
SPECIAL REVENUE FUNDS
COMMUNITY SPECIAL DEVELOPMENT SPECIAL PUBLIC NAVY
ASSESSMENTS BLOCK GRANT EDUCATION RECREATION SAFETY SHELLFISH HOUSING
ASSETS
$ $ $ 83 $ 13 $ $ $ Investments ............................................................................... 72 265 332 1,084 650 28 18 Receivables:
Sewer, beach and sidewalk assessments ............................... 29 Intergovernmental. ................................................................... 402 100
1,736 9 575
!L .........................................................................................
-lo. TOTAL ASSETS ................................................................ $ 101 0
$ 2,403 $ 515 $ 1,106 $ 1,225 $ 28 $ 18
0 LIABILITIES
Accounts payable .................................................................... $ $ 62 $ 72 $ 42 $ 5 $ $ Due to other funds ................................................................... 525 39 18
Unearned revenue ................................................................... 237 276
TOTAL LIABILITIES .............................................................. 587 309 318 44 18
DEFERRED INFLOWS OF RESOURCES
Unavailable revenue- sewer assessment and use charges ... 29
Unavailable revenue - other charges ................................ 575 Unavailable revenue- loans ........................................... 1,736
TOTAL DEFERRED INFLOWS OF RESOURCES .............. 29 1,736 575
FUND BALANCES
Nonspendable ........................................................... Restricted ................................................................. 72 80 Committed ................................................................ 206 788 606 28 Assigned .................................
TOTAL FUND BALANCES ................................................... 72 80 206 788 606 28
TOTAL LIABILITIES, DEFERRED INFLOWS OF RESOURCES AND FUND BALANCES .......................... $ 101 $ 2,403 $ 515 $ 1,106 $ 1,225 $ 28 $ 18
(Continued)
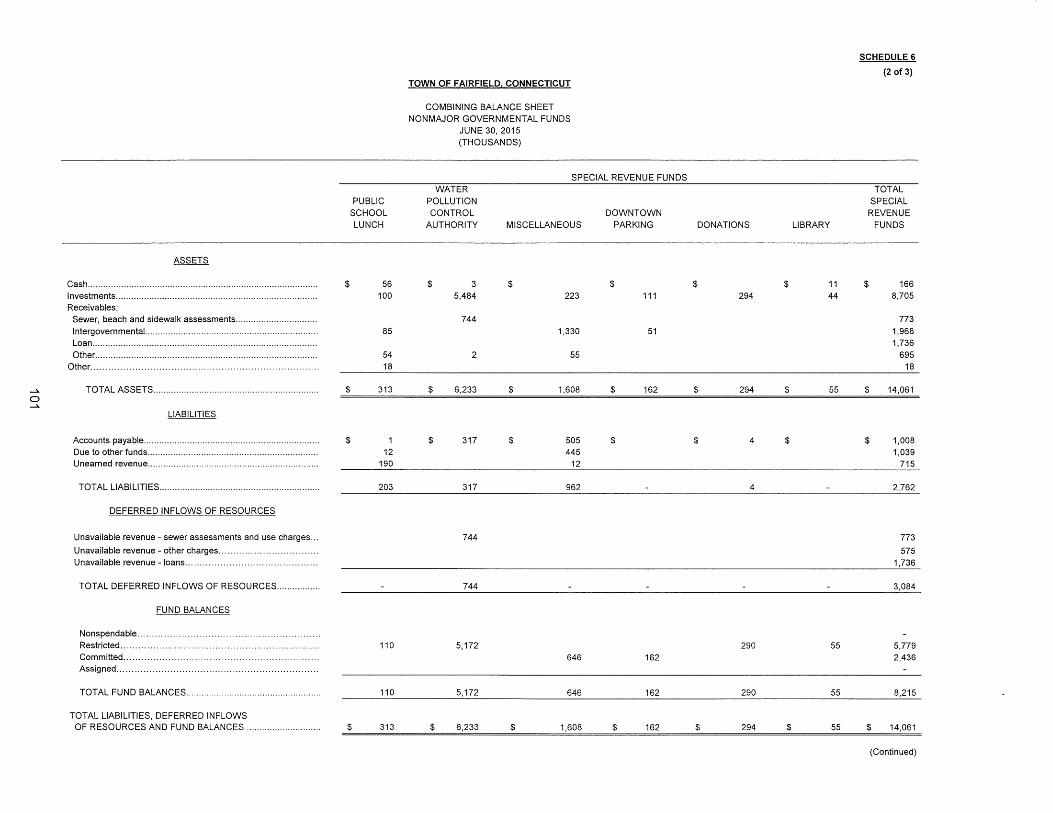
SCHEDULE 6
(2 of3) TOWN OF FAIRFIELD CONNECTICUT
COMBINING BALANCE SHEET NONMAJOR GOVERNMENTAL FUNDS
JUNE 30, 2015 (THOUSANDS)
SPECIAL REVENUE FUNDS WATER TOTAL
PUBLIC POLLUTION SPECIAL SCHOOL CONTROL DOWNTOWN REVENUE LUNCH AUTHORITY MISCELLANEOUS PARKING DONATIONS LIBRARY FUNDS
ASSETS
$ 56 $ 3 $ $ $ $ 11 $ 166 Investments ............................................................................... 100 5,484 223 111 294 44 8,705 Receivables:
Sewer, beach and sidewalk assessments ................................ 744 773 Intergovernmental. ................................................................... 85 1,330 51 1,968
1,736 54 2 55 695 18 18
-lo. TOTAL ASSETS ................................................................. $ 313 $ 6,233 $ 1,608 $ 162 $ 294 $ 55 $ 14,061 0 -lo.
LIABILITIES
Accounts payable ..................................................................... $ 1 $ 317 $ 505 $ $ 4 $ $ 1,008 Due to other funds ................................................................... 12 445 1,039 Unearned revenue ................................................................... 190 12 715
TOTAL LIABILITIES ............................................................... 203 317 962 4 2,762
DEFERRED INFLOWS OF RESOURCES
Unavailable revenue- sewer assessments and use charges ... 744 773
Unavailable revenue- other charges .................................. 575 Unavailable revenue - loans ............................................. 1,736
TOTAL DEFERRED INFLOWS OF RESOURCES ................. 744 3,084
FUND BALANCES
Nonspendable .............................................................. 110 5,172 290 55 5,779
646 162 2,436 Assigned ....................................................................
TOTAL FUND BALANCES .................................................... 110 5,172 646 162 290 55 8,215
TOTAL LIABILITIES, DEFERRED INFLOWS OF RESOURCES AND FUND BALANCES ............................. $ 313 $ 6,233 $ 1,608 $ 162 $ 294 $ 55 $ 14,061
(Continued)

ASSETS
$ Investments .............................................................................. Receivables: Sewer, beach and sidewalk assessments ............................. Intergovernmental. .................................................................
TOTAL ASSETS ................................................................ $ ........ 0
"' LIABILITIES
$
Unearned revenue ..................................................................
TOTAL LIABILITIES .............................................................
DEFERRED INFLOWS OF RESOURCES
Unavailable revenue - sewer assessment and use charges .. Unavailable revenue- other charges ................................ Unavailable revenue - loans ...........................................
TOTAL DEFERRED INFLOWS OF RESOURCES ...............
FUND BALANCES
Nonspendable .............................................................
TOTAL FUND BALANCES ...................................................
TOTAL LIABILITIES, DEFERRED INFLOWS OF RESOURCES AND FUND BALANCES ........................... $
TOWN OF FAIRFIELD CONNECTICUT
COMBINING BALANCE SHEET NONMAJOR GOVERNMENTAL FUNDS
JUNE 30, 2015 (THOUSANDS)
PERMANENT FUNDS H. SMITH SIMEON
DEBT RICHARDSON AND CARRIE SERVICE CONSERVATION PEASE LIBRARY
FUND FUND FUND FUND
$ $ $ 634 403 20
634 $ 403 $ 20 $
$ $ $
30 20 373
634
634 403 20
634 $ 403 $ 20 $
TOTAL PERMANENT
FUNDS
$ 23 446
23 $ 446
$
20 70 3 376
23 446
23 $ 446
SCHEDULE 6 (3 of 3)
TOTAL NONMAJOR
GOVERNMENTAL FUNDS
$ 166 9,785
773 1,968 1,736
695 18
$ 15,141
$ 1,008 1,039
715
2,762
773 575
1,736
70 6,155 2,436
634
9,295
$ 15,141
(Concluded)
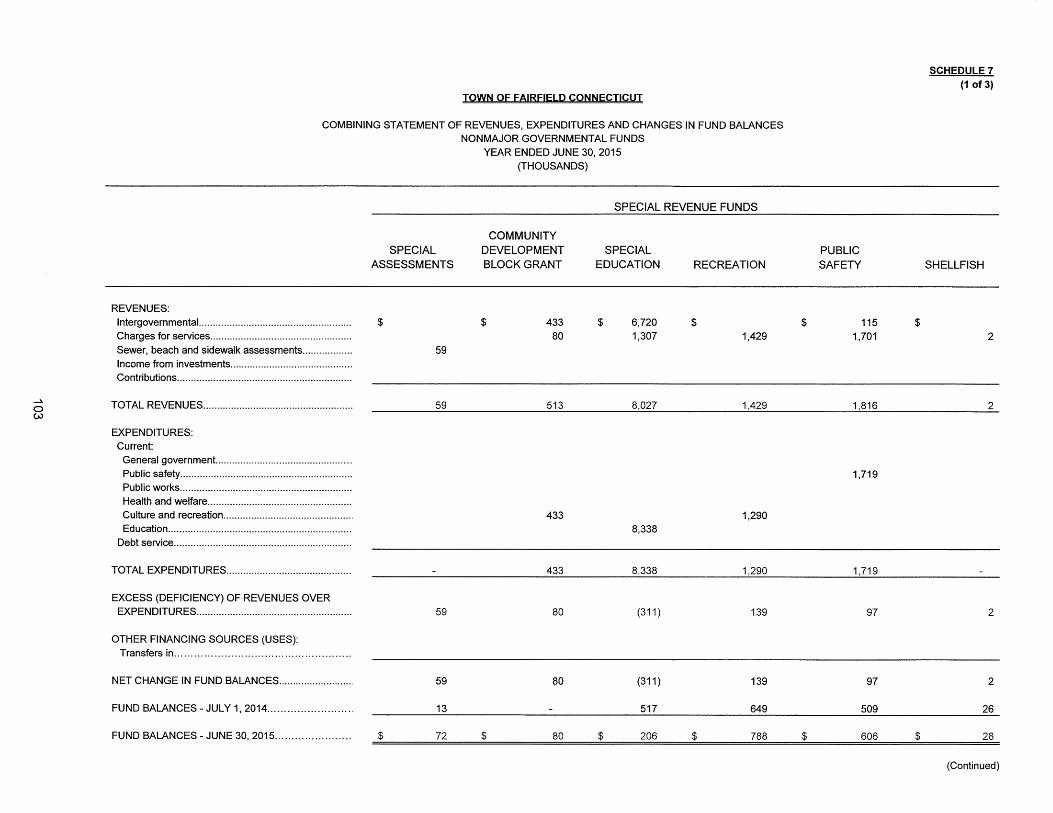
~
0 c.v
TOWN OF FAIRFIELD CONNECTICUT
COMBINING STATEMENT OF REVENUES, EXPENDITURES AND CHANGES IN FUND BALANCES NONMAJOR GOVERNMENTAL FUNDS
REVENUES: Intergovernmental. ...................................................... Charges for services ................................................... Sewer, beach and sidewalk assessments .................. Income from investments ............................................ Contributions ...............................................................
TOTAL REVENUES ......................................................
EXPENDITURES: Current:
General government. ................................................ Public safety .............................................................. Public works .............................................................. Health and welfare .................................................... Culture and recreation ............................................... Education ..................................................................
Debt service ................................................................
TOTAL EXPENDITURES .............................................
EXCESS (DEFICIENCY) OF REVENUES OVER EXPENDITURES ........................................................
OTHER FINANCING SOURCES (USES): Transfers
NET CHANGE IN FUND BALANCES ...........................
FUND BALANCES- JULY 1, 2014 ..........................
FUND BALANCES- JUNE 30, 2015 .......................
SPECIAL ASSESSMENTS
$
59
59
-
59
59
13
$ 72
YEAR ENDED JUNE 30, 2015 (THOUSANDS)
COMMUNITY DEVELOPMENT BLOCK GRANT
$ 433 80
513
433
433
80
80
-
$ 80
SPECIAL REVENUE FUNDS
SPECIAL EDUCATION
$ 6,720 1,307
8,027
8,338
8,338
(311)
(311)
517
$ 206
RECREATION
$ 1,429
1,429
1,290
1,290
139
139
649
$ 788
$
$
PUBLIC SAFETY
115 1,701
1,816
1,719
1,719
97
97
509
606
$
$
SCHEDULE 7 {1 of 3)
SHELLFISH
2
2
2
2
26
28
(Continued)
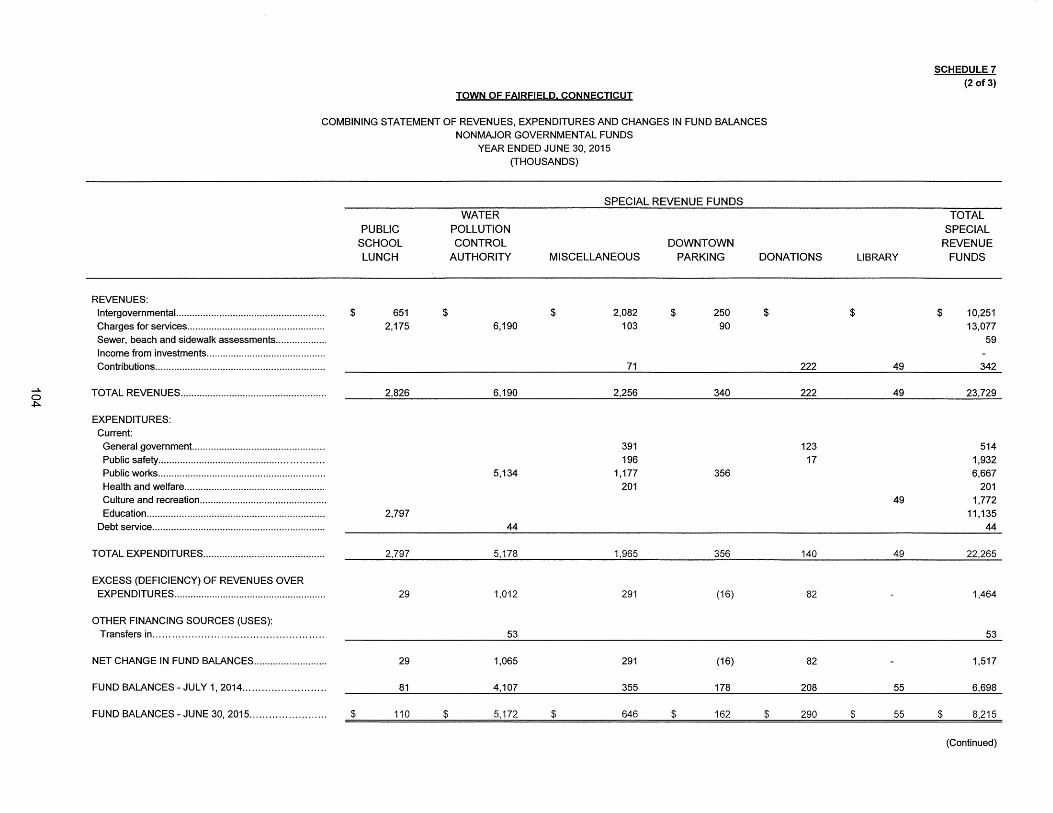
SCHEDULE 7 (2 of 3)
TOWN OF FAIRFIELD CONNECTICUT
COMBINING STATEMENT OF REVENUES, EXPENDITURES AND CHANGES IN FUND BALANCES NONMAJOR GOVERNMENTAL FUNDS
YEAR ENDED JUNE 30, 2015 (THOUSANDS)
SPECIAL REVENUE FUNDS WATER TOTAL
PUBLIC POLLUTION SPECIAL
SCHOOL CONTROL DOWNTOWN REVENUE
LUNCH AUTHORITY MISCELLANEOUS PARKING DONATIONS LIBRARY FUNDS
REVENUES: Intergovernmental. ....................................................... $ 651 $ $ 2,082 $ 250 $ $ $ 10,251 Charges for services ................................................... 2,175 6,190 103 90 13,077 Sewer, beach and sidewalk assessments ................... 59 Income from investments ............................................ Contributions ............................................................... 71 222 49 342
0 TOTAL REVENUES ...................................................... 2,826 6,190 2,256 340 222 49 23,729 ~
EXPENDITURES: Current:
General government.. ............................................... 391 123 514 Public safety ........................................................... 196 17 1,932 Public works .............................................................. 5,134 1,177 356 6,667 Health and welfare ..................................................... 201 201 Culture and recreation ............................................... 49 1,772 Education .................................................................. 2,797 11,135
Debt service ................................................................ 44 44
TOTAL EXPENDITURES ............................................. 2,797 5,178 1,965 356 140 49 22,265
EXCESS (DEFICIENCY) OF REVENUES OVER EXPENDITURES ........................................................ 29 1,012 291 (16) 82 1,464
OTHER FINANCING SOURCES (USES): Transfers in ...................................................... 53 53
NET CHANGE IN FUND BALANCES ........................... 29 1,065 291 (16) 82 - 1,517
FUND BALANCES-JULY 1, 2014 .......................... 81 4,107 355 178 208 55 6,698
FUND BALANCES- JUNE 30, 2015 ........................ $ 110 $ 5,172 $ 646 $ 162 $ 290 $ 55 $ 8,215
(Continued)
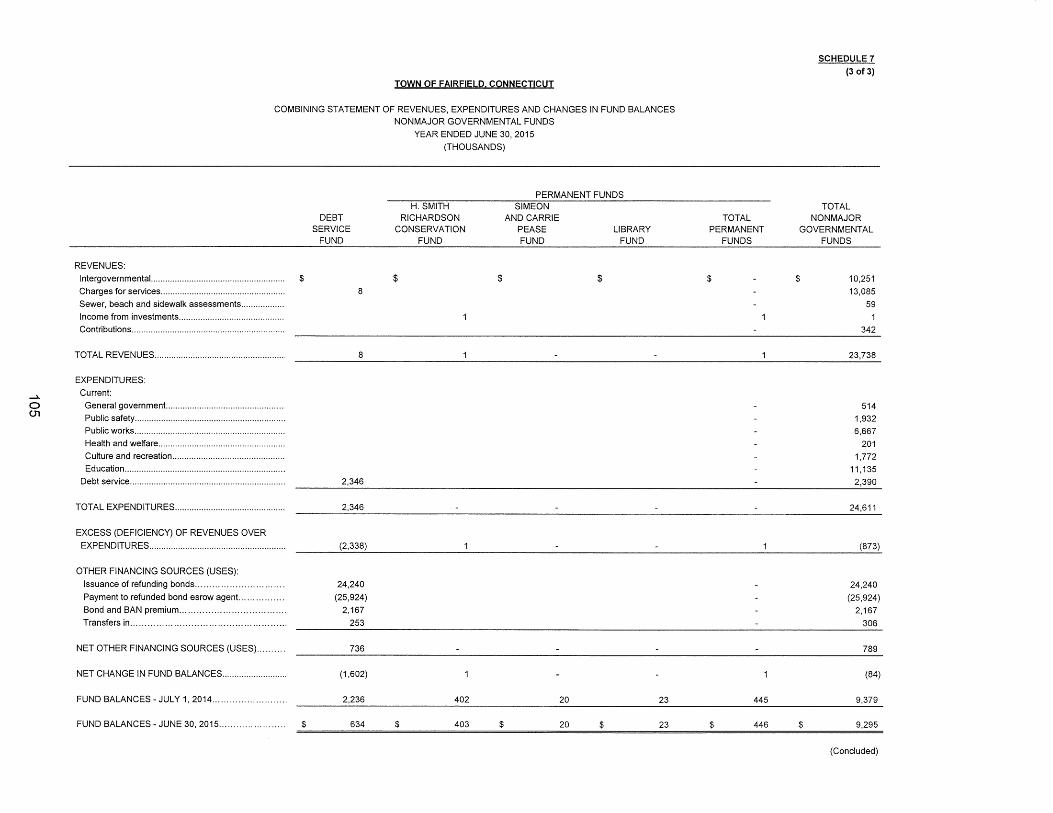
....Jo.
0 01
TOWN OF FAIRFIELD CONNECTICUT
COMBINING STATEMENT OF REVENUES, EXPENDITURES AND CHANGES IN FUND BALANCES NONMAJOR GOVERNMENTAL FUNDS
REVENUES:
Intergovernmental........................................................ $
Charges for services ................................................... .
Sewer, beach and sidewalk assessments ................. .
Income from investments ........................................... .
Contributions ............................................................... .
TOTAL REVENUES ..................................................... .
EXPENDITURES:
Current:
General government. ............................................... .
Public safety .............................................................. .
Public works .............................................................. .
Health and welfare .................................................... .
Culture and recreation .............................................. .
Education .................................................................. .
Debt service ................................................................ .
TOTAL EXPENDITURES ............................................. .
EXCESS (DEFICIENCY) OF REVENUES OVER
EXPENDITURES ........................................................ .
OTHER FINANCING SOURCES (USES):
Issuance of refunding bonds .............................. .
Payment to refunded bond esrow agent.. ............. .
Bond and BAN premium .................................... .
Transfers
NET OTHER FINANCING SOURCES (USES) ......... .
NET CHANGE IN FUND BALANCES .......................... .
FUND BALANCES - JULY 1,
DEBT SERVICE
FUND
8
8
2,346
2,346
(2,338)
24,240
(25,924)
2,167
253
736
(1,602)
2,236
YEAR ENDED JUNE 30, 2015
(THOUSANDS)
PERMANENT FUNDS H. SMITH
RICHARDSON CONSERVATION
FUND
$
1
1
402
$
SIMEON AND CARRIE
PEASE FUND
20
$
LIBRARY FUND
23
TOTAL PERMANENT
FUNDS
$
1
1
445
SCHEDULE 7
(3 of3)
TOTAL NONMAJOR
GOVERNMENTAL FUNDS
$ 10,251
13,085
59
1 342
23,738
514
1,932
6,667
201
1,772
11 '135 2,390
24,611
(873)
24,240
(25,924)
2,167
306
789
(84)
9,379
634 $ 403 $ ?0 $ 23 $ 446 $ FUND BALANCES- JUNE 30, 2015... ... ... ... ... ... ... .. =$========================================= 9,295
(Concluded)

REVENUES:
TOWN OF FAIRFIELD CONNECTICUT
WATER POLLUTION CONTROL AUTHORITY SCHEDULE OF REVENUES, EXPENDITURES AND CHANGES IN FUND BALANCE
BUDGET AND ACTUAL YEAR ENDED JUNE 30, 2015
(THOUSANDS)
ORIGINAL BUDGET
FINAL BUDGET ACTUAL
SCHEDULE 8
VARIANCE WITH
FINAL BUDGET
Charges for services...................................................... _$ ___ 5.;.....,2_5_9 ___ $ ___ 5;_,4_49 ____ $ __ 6_,1_9_0 ___ $ ____ 7_4_1_
EXPENDITURES: Current:
Public Works ........................................................... . Debt service:
Principal retirement. ................................................. . Interest. ................................................................... .
TOTAL EXPENDITURES .................................................. .
EXCESS (DEFICIENCY) OF REVENUES OVER EXPENDITURES .............................................. .
OTHER FINANCING SOURCES (USES): Transfers in .................................................................... .
NET CHANGE IN FUND BALANCES ............................... .
FUND BALANCE-JULY 1, 2014 ................................ .
FUND BALANCE - JUNE 30, 2015 .............................. .
RECONCILIATION TO GAAP BASIS- SCHEDULE 7
BALANCE, BUDGETARY BASIS- JUNE 30, 2015 ......... .
Encumbrances outstanding at June 30, 2014,
liquidated during the year ended June 30, 2015 ............ .
Encumbrances outstanding at June 30, 2015 charged to
budgetary expenditures ............................................ .
$
5,215
42 2
5,259
EXPENDITURES
$ 4,965
387
(174)
5,458 4,921
42 42 2 2
5,502 4,965
(53) 1,225
53 53
$ 1,278
3,720
$ 4,998
FUND
BALANCE
$ 4,998
174
BALANCE, GAAP BASIS - JUNE 30, 2015..................... $ 5,178 $ 5,172 ===================================
106
537
537
1,278
$ 1,278

Fiduciary Funds
Fiduciary funds are used to account for assets held by the Town in a trustee capacity for individuals, private organizations or other governments.
Agency Fund
Agency funds are used to report resources held by the reporting government in a purely custodial capacity (assets equal liabilities).
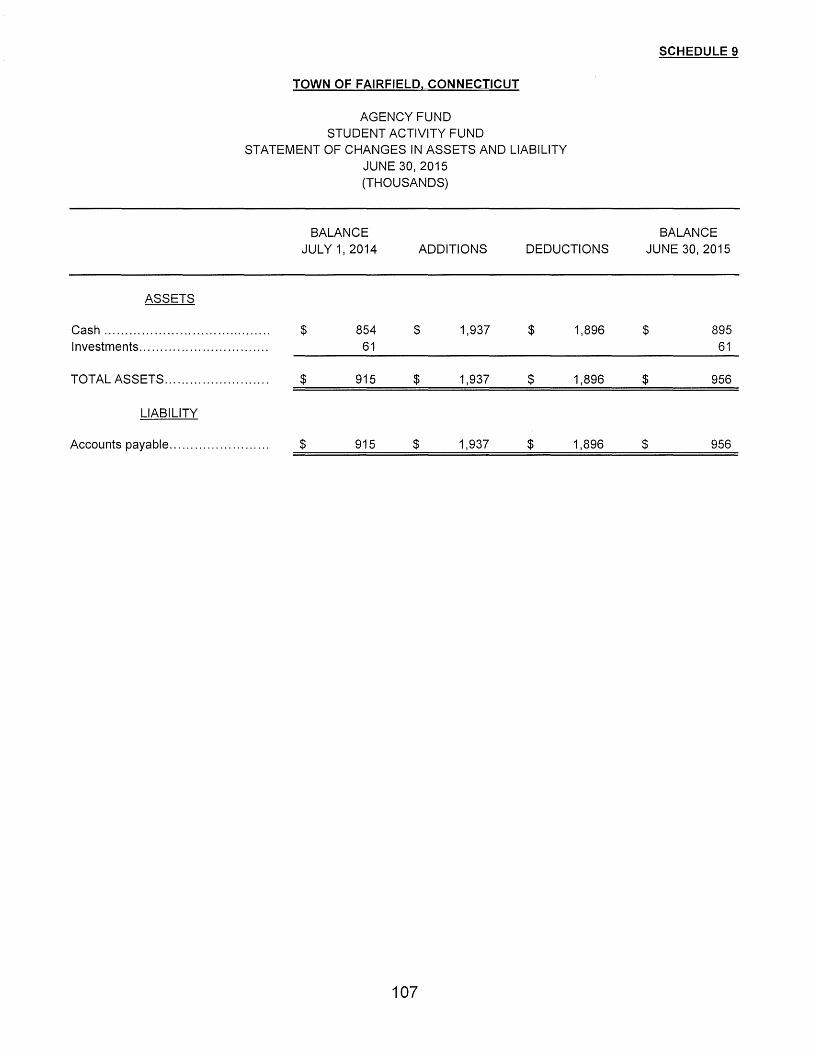
TOWN OF FAIRFIELD. CONNECTICUT
AGENCY FUND STUDENT ACTIVITY FUND
STATEMENT OF CHANGES IN ASSETS AND LIABILITY JUNE 30, 2015 (THOUSANDS)
BALANCE JULY 1, 2014 ADDITIONS DEDUCTIONS
ASSETS
Cash ........................................ $ 854 $ 1,937 $ 1,896 Investments ............................... 61
TOTAL ASSETS ......................... $ 915 $ 1,937 $ 1,896
LIABILITY
Accounts payable ........................ $ 915 $ 1,937 $ 1,896
107
SCHEDULE 9
BALANCE JUNE 30, 2015
$ 895 61
$ 956
$ 956

Statistical Section
This part of the Town's comprehensive annual financial report presents detailed information as a context for understanding what the information in the financial statements, note disclosures, and required supplementary information says about the Town's overall financial health.
CONTENTS
FINANCIAL TRENDS (TABLES 1- 4)
These schedules contain trend information to help the reader understand how the Town's financial performance and well-being have changed over time.
REVENUE CAPACITY (TABLES 5-7)
These schedules contain information to help the reader assess the Town's most significant local revenue source, the property tax.
DEBT CAPACITY (TABLES 8 -11)
These schedules present information to help the reader assess the affordability of the Town's current levels of outstanding debt and the Town's ability to issue additional debt in the future.
DEMOGRAPHIC AND ECONOMIC INFORMATION (TABLES 12 -15)
These schedules offer demographic and economic indicators to help the reader understand the environment within which the Town's financial activities take place.
OPERATING INFORMATION (TABLES 16 -17)
These schedules contain service and infrastructure data to help the reader understand how the information in the Town's financial report relates to the services the Town provides and the activities it performs.
Sources: Unless otherwise noted, the information in these schedules is derived from the comprehensive annual financial reports for the relevant year.

-Jr.
0 CX>
Net investment in capital assets
Restricted Unrestricted
TOTAL NET POSITION
2015
$267,658 6,225 4,458
$278,341
2014
$ 246,055 4,909
15,920
$ 266,884
TOWN OF FAIRFIELD CONNECTICUT
NET POSITION BY COMPONENT LAST TEN YEARS
(THOUSANDS) (UNAUDITED)
FISCAL YEAR
2013
$246,689 3,990 7,846
$258,525
2012
$ 249,503 4,056
(4,379)
$ 249,180
2011
$250,288 3,833
769
$254,890
2010
$249,899 3,282
(1 ,548)
$251,633
2009
$240,836 379
3,681
$244,896
2008
$ 229,184 452
7,972
$ 237,608
2007
$ 191,534 485
40,939
$ 232,958
TABLE 1
2006
$ 208,403 5,726 3,176
$ 217,305
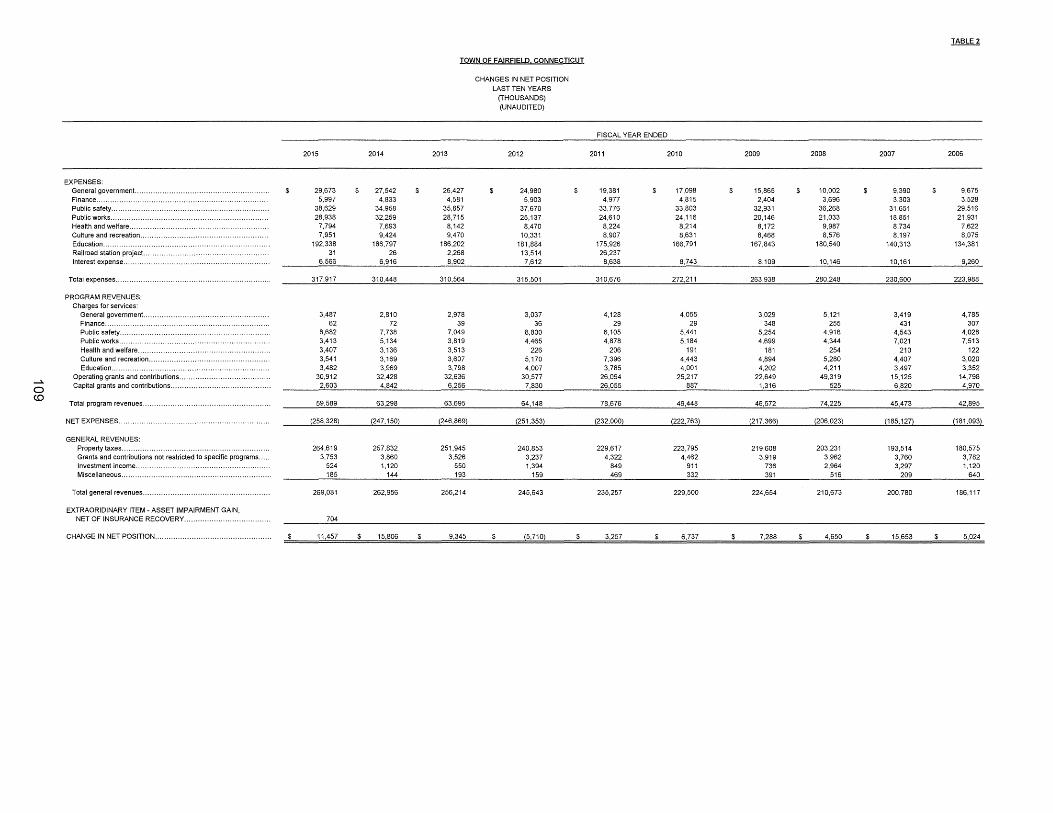
....lto.
0 (,0
EXPENSES: General government..
Interest expense ..
Total expenses .......................................................... .
PROGRAM REVENUES:
Public safety ... Public works .. Health
Operating grants and contributions .. . Capital grants and contributions ....................... .
Total program revenues ........................................ .
NET EXPENSES ..
GENERAL REVENUES: Property taxes ......................................... . Grants and contributions not restricted to specific programs. Investment income ..
Total general revenues .................................................. .
EXTRAORIDINARY ITEM- ASSET IMPAIRMENT GAIN, NET OF INSURANCE RECOVERY ............ .
CHANGE IN NET POSITION .............................. ..
2015
29,673 5,997
38,629 28,938
7,794 7,951
192,338 31
6,566
317,917
3,487 62
8,682 3,413 3,407 3,541 3,482
30,912 2,603
59,589
(258,328)
264,619 3,753
524 185
269,081
704
11,457
2014
$ 27,542 4,833
34,958 32,259
7,693 9,424
186,797 26
6,916
310.448
2,810 72
7,738 5,134 3,136 3,169 3,969
32,428 4,842
63,298
(247,150)
257,832 3,860 1,120
144
262,956
$ 15,806
TOWN OF FAIRFIELD CONNECTICUT
CHANGES IN NET POSITION LAST TEN YEARS
(THOUSANDS) (UNAUDITED)
2013 2012
$ 26.427 $ 24,980 $ 4,581 5,903
35,857 37,670 28,715 25,137
8,142 8,470 9,470 10,331
186,202 181,884 2,268 13,514 8,902 7,612
310,564 315,501
2,978 3,037 39 36
7,049 8,800 3,819 4,465 3,513 226 3,607 5,170 3,798 4,007
32,636 30,577 6,256 7,830
63,695 64,148
(246,869) (251,353)
251,945 240,853 3,526 3,237
550 1,394 193 159
256,214 245,643
$ 9,345 $ (5,710) $
TABLE 2
FISCAL YEAR ENDED
2011 2010 2009 2008 2007 2006
19,381 $ 17,098 $ 15,865 $ 10,002 $ 9,390 $ 9,675 4,977 4,815 2,404 3,696 3,303 3,528
33,776 33,803 32,931 36,268 31,651 29,516 24,610 24,116 20,146 21,033 18,851 21,931
8,224 8,214 8,172 9,987 8,734 7,622 8,907 8,631 8,468 8,576 8,197 8,075
175,926 166,791 167,843 180,540 140,313 134,381 26,237
8,638 8,743 8,109 10,146 10,161 9,260
310,676 272,211 263,938 280,248 230,600 223,988
4,128 4,055 3,029 5,121 3,419 4,785 29 29 348 255 431 307
6,105 5,441 5,254 4,916 4,543 4,028 4,878 5,184 4,699 4,344 7,021 7,513
206 191 181 254 210 122 7,396 4,443 4,894 5,280 4,407 3,020 3,785 4,001 4,202 4,211 3,497 3,352
26,094 25,217 22,649 49,319 15,125 14,798 26,055 887 1,316 525 6,820 4,970
78,676 49,448 46,572 74,225 45,473 42,895
(232,000) (222,763) (217,366) (206,023) (185,127) (181,093)
229,617 223,795 219,608 203,231 193,514 180,575 4,322 4,462 3,919 3,962 3,760 3,782
849 911 736 2,964 3,297 1,120 469 332 391 516 209 640
235,257 229,500 224,654 210,673 200,780 186,117
3,257 $ 6,737 $ 7,288 $ 4,650 $ 15,653 $ 5,024

......lt.
......lt.
0
GENERAL FUND:
TOTAL GENERAL
ALL OTHER GOVERNMETAL FUNDS: Nonspendable ................. . Restricted ...... Committed ...................... .
Unassigned ....
TOTAL ALL OTHER GOVERNMENALFUNDS ..
GRAND TOTAL ..
2015
863 24,260
25,123
2014
815 21,168
21,983
2013
1,398 17,408
18,806
TOWN OF FAIRFIELD CONNECTICUT
FUND BALANCES, GOVERNMENTAL FUNDS LAST TEN YEARS
(THOUSANDS) (UNAUDITED)
2012
2,094 14,593
16,687
FISCAL YEAR
2011
1,586 13,414
15,000
2010
1,576 11,786
13,362
2009
954 10,263
11,217
2008
2,489 9,049
11,538
2007
3,728 8,472
12,200
TABLE 3
2006
4,737 6,793
11,530
70 70 70 70 70 70 70 70 70 70 6,155 4,839 3,920 4,055 3,763 3,282 2,273 1,785 1,520 361 2,436 2,234 1,781 1,504 884 790 81 43
634 2,236 3,220 1 ,578 1 ,573 508 158 88 1,352 (13,165) (814) (12,092) (47,585) (20,150) (11,077) (11,693) (9,289) (26,556) (46,100)
(3,870) 8,565 (3, 101) (40,378) (13,860) (6,427) (9, 111) (7,334) (23,612) (45,626)
21,253 30,548 15,705 (23,691) $ 1,140 $ 6,935 $ 2,106 $ 4,204 $ (11,412) $ (34,096)
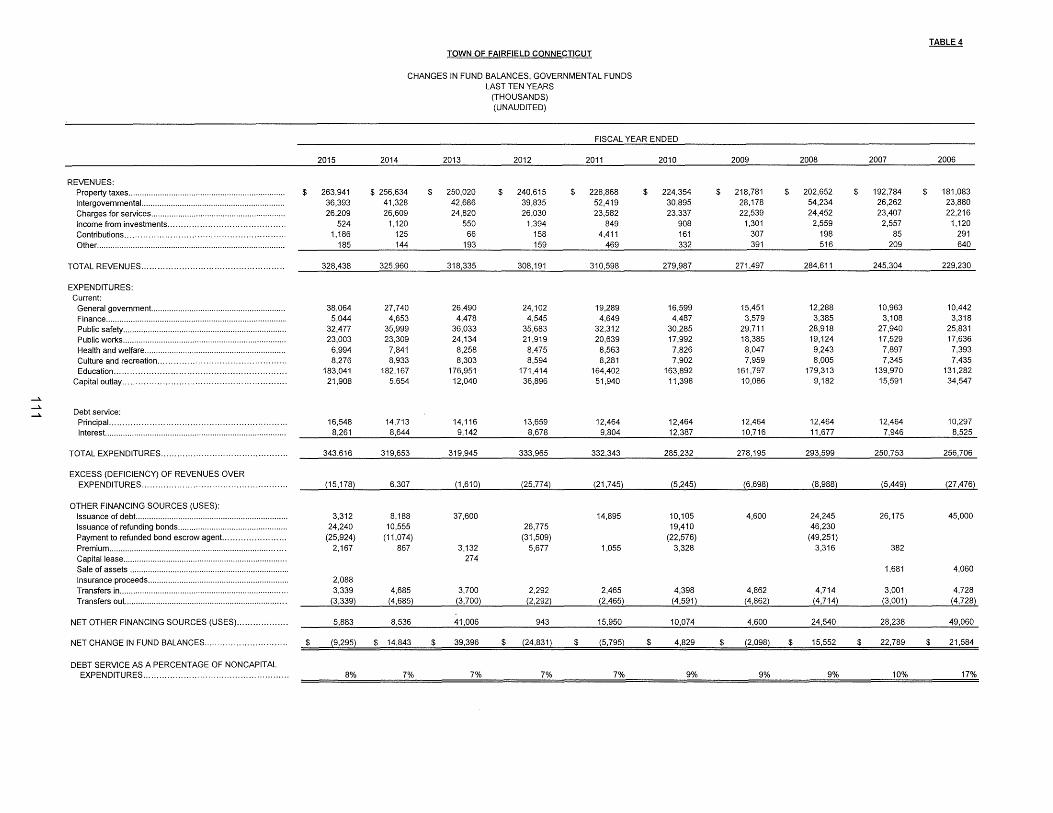
.....l..
.....l..
.....l..
REVENUES: Property taxes ..................................................................... . Intergovernmental ............................................................... . Charges for services ........................................................... . Income from investments ........................................... . Contributions .......................................................... ..
TOTAL REVENUES ................................................... ..
EXPENDITURES: Current:
General government. .......................................................... .
Public safety ........................................................................ . Public works ........................................................................ . Health and welfare .............................................................. . Culture and recreation ............................................... .
Debt service:
TOTAL EXPENDITURES ............................................. ..
EXCESS (DEFICIENCY) OF REVENUES OVER EXPENDITURES ..................................................... .
OTHER FINANCING SOURCES (USES): Issuance of debt... .................................. . Issuance of refunding bonds ................................................ . Payment to refunded bond escrow agent. ...................... .
Insurance proceeds .............................................................. . Transfers in .......................................................................... . Transfers out. ...................................................................... .
NET OTHER FINANCING SOURCES (USES) .................. .
NET CHANGE IN FUND BALANCES .............................. .
DEBT SERVICE AS A PERCENTAGE OF NONCAPITAL EXPENDITURES ..................................................... .
$
$
2015
263,941 36,393 26,209
524 1,186
185
328,438
38,064 5,044
32,477 23,003
6,994 8,276
183,041 21,908
16,548 8,261
343,616
(15,178)
3,312 24,240
(25,924) 2,167
2,088 3,339
(3,339)
5,883
(9,295)
8%
TOWN OF FAIRFIELD CONNECTICUT
CHANGES IN FUND BALANCES, GOVERNMENTAL FUNDS LAST TEN YEARS
(THOUSANDS) (UNAUDITED)
FISCAL YEAR ENDED
2014
$ 256,634 41,328 26,609
1,120 125 144
325,960
27,740 4,653
35,999 23,309
7,841 8,933
182,167 5,654
14,713 8,644
319,653
$
2013
250,020 42,686 24,820
550 66
193
318,335
26,490 4,478
36,033 24,134
8,258 8,303
176,951 12,040
14,116 9,142
319,945
2012
$ 240,615 39,835 26,030
1,394 158 159
308,191
24,102 4,545
35,683 21,919
8,475 8,594
171,414 36,896
13,659 8,678
333,965
2011 2010
$ 228,868 $ 224,354 52,419 30,895 23,582 23,337
849 908 4.411 161
469 332
310,598 279,987
19,289 16,599 4,649 4,487
32,312 30,285 20,639 17,992
8,563 7,826 8,281 7,902
164,402 163,892 51,940 11,398
12,464 12,464 9,804 12,387
332,343 285,232
TABLE4
2009 2008 2007 2006
$ 218,781 $ 202,652 $ 192,784 $ 181,083 28,178 54,234 26,262 23,880 22,539 24,452 23,407 22,216
1,301 2,559 2,557 1,120 307 198 85 291 391 516 209 640
271,497 284,611 245,304 229,230
15.451 12,288 10,963 10,442 3,579 3,385 3,108 3,318
29.711 28,918 27,940 25,831 18,385 19,124 17,529 17,636 8,047 9,243 7,897 7,393 7,959 8,005 7,345 7,435
161,797 179,313 139,970 131,282 10,086 9,182 15,591 34,547
12,464 12,464 12,464 10,297 10,716 11,677 7,946 8,525
278,195 293,599 250,753 256,706
6,307 (1,610) (25,774) (21 ,745) (5,245) (6,698) (8,988) (5,449) (27 ,476)
8,188 10,555
(11,074) 867
37,600
3,132 274
14,895 26,775
(31,509) 5,677 1,055
10,105 4,600 24,245 26,175 19,410 46,230
(22,576) (49,251) 3,328 3,316 382
1,681
4,685 3,700 2,292 2,465 4,398 4,862 4,714 3,001 (4,685) (3,700) (2,292) (2,465) (4,591) (4,862) (4,714) (3,001)
8,536 41,006 943 15,950 10,074 4,600 24,540 28,238
$ 14,843 $ 39,396 $ (24,831) $ (5,795) $ 4,829 $ (2,098) $ 15,552 $ 22,789
7% 7% 7% 7% 9% 9% 9% 10%
45,000
4,060
4,728 (4,728)
~60
$ 21,584
17%
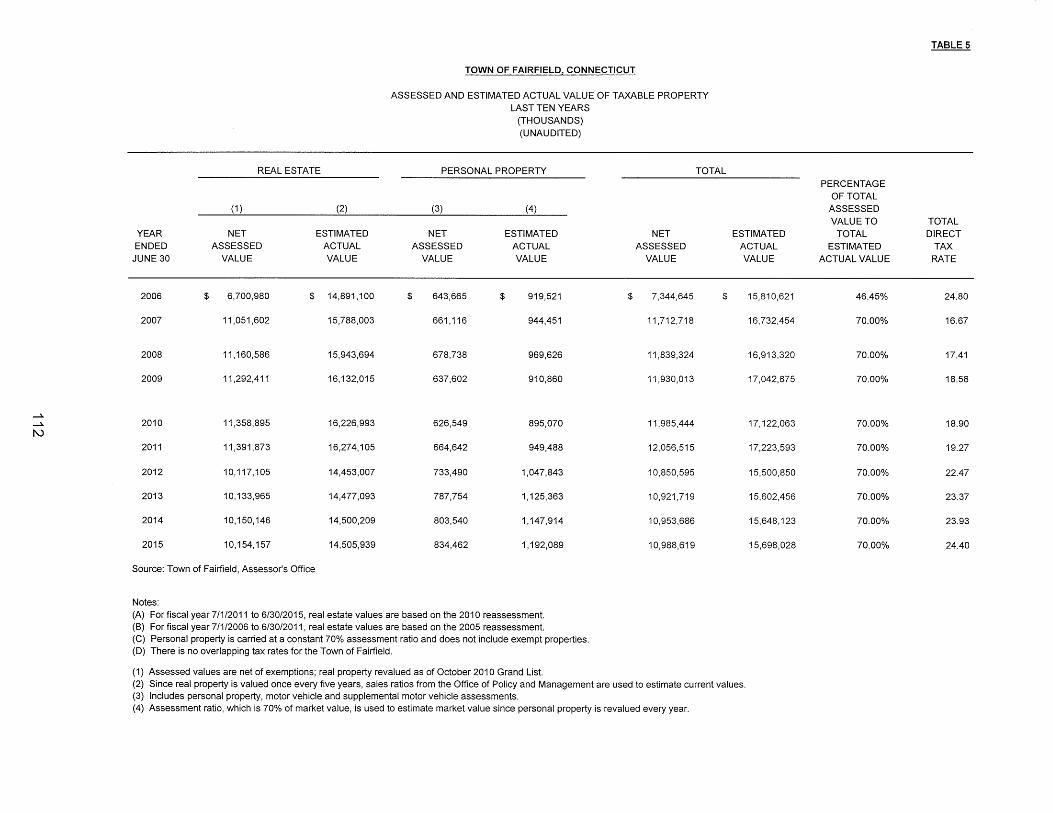
....lo.
....lo.
N
TOWN OF FAIRFIELD CONNECTICUT
ASSESSED AND ESTIMATED ACTUAL VALUE OF TAXABLE PROPERTY LAST TEN YEARS
(THOUSANDS) (UNAUDITED)
REAL ESTATE PERSONAL PROPERTY TOTAL
(1) (2) (3) (4)
YEAR NET ESTIMATED NET ESTIMATED ENDED ASSESSED ACTUAL ASSESSED ACTUAL
JUNE 30 VALUE VALUE VALUE VALUE
2006 $ 6,700,980 $ 14,891,100 $ 643,665 $ 919,521
2007 11,051,602 15,788,003 661,116 944,451
2008 11,160,586 15,943,694 678,738 969,626
2009 11,292,411 16,132,015 637,602 910,860
2010 11,358,895 16,226,993 626,549 895,070
2011 11,391,873 16,274,105 664,642 949,488
2012 10,117,105 14,453,007 733,490 1,047,843
2013 10,133,965 14,477,093 787,754 1,125,363
2014 10,150,146 14,500,209 803,540 1,147,914
2015 10,154,157 14,505,939 834,462 1,192,089
Source: Town of Fairfield, Assessor's Office
Notes: (A) For fiscal year 7/1/2011 to 6/30/2015, real estate values are based on the 2010 reassessment. (B) For fiscal year 7/1/2006 to 6/30/2011, real estate values are based on the 2005 reassessment. (C) Personal property is carried at a constant 70% assessment ratio and does not include exempt properties. (D) There is no overlapping tax rates for the Town of Fairfield.
(1) Assessed values are net of exemptions; real property revalued as of October 2010 Grand List.
NET ASSESSED
VALUE
$ 7,344,645 $
11,712,718
11,839,324
11,930,013
11,985,444
12,056,515
10,850,595
10,921,719
10,953,686
10,988,619
ESTIMATED ACTUAL VALUE
15,810,621
16,732,454
16,913,320
17,042,875
17,122,063
17,223,593
15,500,850
15,602,456
15,648,123
15,698,028
(2) Since real property is valued once every five years, sales ratios from the Office of Policy and Management are used to estimate current values. (3) Includes personal property, motor vehicle and supplemental motor vehicle assessments. (4) Assessment ratio, which is 70% of market value, is used to estimate market value since personal property is revalued every year.
TABLE 5
PERCENTAGE OF TOTAL
ASSESSED VALUE TO TOTAL
TOTAL DIRECT ESTIMATED TAX
ACTUAL VALUE RATE
46.45% 24.80
70.00% 16.67
70.00% 17.41
70.00% 18.58
70.00% 18.90
70.00% 19.27
70.00% 22.47
70.00% 23.37
70.00% 23.93
70.00% 24.40

TABLE 6 TOWN OF FAIRFIELD, CONNECTICUT
PRINCIPAL PROPERTY TAXPAYERS CURRENT YEAR AND NINE YEARS AGO
(UNAUDITED)
2015 2006
PERCENTAGE PERCENTAGE NATURE OF ASSESSED NET TAXABLE ASSESSED NET TAXABLE
NAME BUSINESS VALUE RANK GRAND LIST (1) VALUE RANK GRAND LIST (1)
General Electric Company Corporate Headquarters $ 76,541,780 1 0.70% $ 94,722,752 1 0.81%
R-K Black Rock 1-111, R-K Brick Walk 1-V, R-K Fairfield 1-
V, LLC's & Associated Partners2 Real Estate Holding Cos 76,286,593 2 0.70% 19,036,250 9 0.16%
Conn Light and Power Public Utility 59,074,290 3 0.54% 0.00%
Lenoci, Alfred et als Real Estate Investors 55,540,270 4 0.51% 56,721,980 3 0.49%
Aquarion Water Company Public Utility 53,680,330 5 0.49% 64,932,043 2 0.56%
United Illuminating Company Electric Utility 35,054,950 6 0.32% 0.00%
-.l..
-.l..
c.u Roberts, Samuel et al Real Estate Investors 25,858,350 7 0.24% 34,175,500 5 0.29%
Southern Connecticut Gas Company Gas Utility 24,339,750 8 0.22% 0.00%
Scinto, Robert et als Real Estate Investors 23,273,920 9 0.21% 20,382,040 8 0.17%
Jack, Bradley & Karin Residential Homeowner 23,151,810 10 0.21% 23,252,309 7 0.20%
CMF Realty et al Real Estate Investors 34,583,657 4 0.30%
Stone Ridge at Fairfield LLC Real Estate Investors 25,443,380 6 0.22%
Sosin, Howard Residential Homeowner __ 1_7,094,332 10 0.15%
TOTAL $ 452,802,043 4.14% $ 390,344,243 3.35%
Source: Assessor's Office, Town of Fairfield.
(1) Based on the October 2013 and October 2004 adjusted Grand lists of $10,988,619,000 and $7,344,645,000, respectively. 2 Formerly Kleban Cos. Et Als.
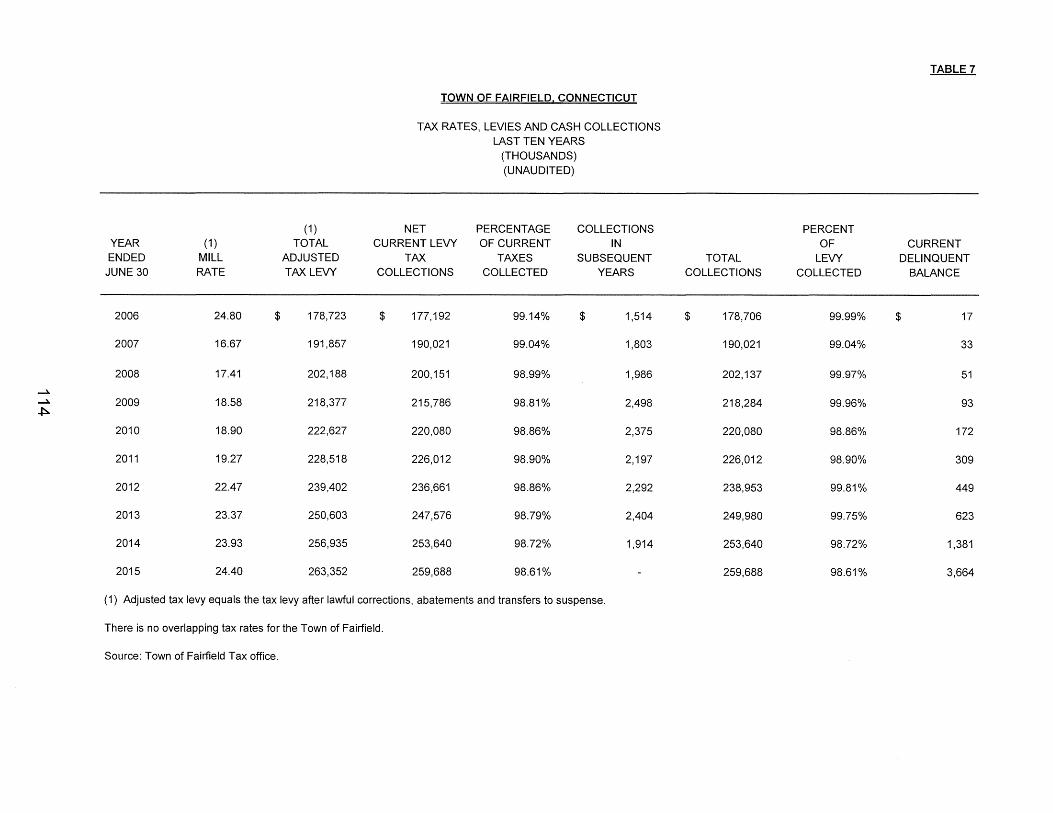
~
~
~
(1) YEAR (1) TOTAL ENDED MILL ADJUSTED
JUNE 30 RATE TAX LEVY
2006 24.80 $ 178,723
2007 16.67 191,857
2008 17.41 202,188
2009 18.58 218,377
2010 18.90 222,627
2011 19.27 228,518
2012 22.47 239,402
2013 23.37 250,603
2014 23.93 256,935
2015 24.40 263,352
TOWN OF FAIRFIELD CONNECTICUT
TAX RATES, LEVIES AND CASH COLLECTIONS LAST TEN YEARS
(THOUSANDS) (UNAUDITED)
NET PERCENTAGE COLLECTIONS CURRENT LEVY OF CURRENT IN
TAX TAXES SUBSEQUENT COLLECTIONS COLLECTED YEARS
$ 177,192 99.14% $ 1,514
190,021 99.04% 1,803
200,151 98.99% 1,986
215,786 98.81% 2,498
220,080 98.86% 2,375
226,012 98.90% 2,197
236,661 98.86% 2,292
247,576 98.79% 2,404
253,640 98.72% 1,914
259,688 98.61% -
(1) Adjusted tax levy equals the tax levy after lawful corrections, abatements and transfers to suspense.
There is no overlapping tax rates for the Town of Fairfield.
Source: Town of Fairfield Tax office.
TABLE 7
PERCENT OF CURRENT
TOTAL LEVY DELINQUENT COLLECTIONS COLLECTED BALANCE
$ 178,706 99.99% $ 17
190,021 99.04% 33
202,137 99.97% 51
218,284 99.96% 93
220,080 98.86% 172
226,012 98.90% 309
238,953 99.81% 449
249,980 99.75% 623
253,640 98.72% 1,381
259,688 98.61% 3,664

TABLE 8
TOWN OF FAIRFIELD. CONNECTICUT
RATIOS OF OUTSTANDING DEBT BY TYPE LAST TEN YEARS
(THOUSANDS, EXCEPT PERSONAL INCOME AND PER CAPITA) (UNAUDITED)
GENERAL OBLIGATION
YEAR BONDS CLEAN PERCENTAGE DEBT ENDED & LONG-TERM BOND WATER CAPITAL OF PERSONAL PER
JUNE 30 BANS PREMIUM NOTES LEASES TOTAL INCOME CAPITA
2006 $ 171,735 $ 363 $ 27,063 $ 1,216 $ 200,377 0.05% $ 3,425
2007 160,800 319 25,534 912 187,246 0.05% 3,206
2008 198,260 3,594 23,965 608 226,427 0.04% 3,935
.....lo.
.....lo. 2009 189,970 3,882 22,368 304 216,524 0.05% 3,809 01
2010 174,470 6,591 20,732 195,202 0.05% 3,569
2011 187,135 7,003 19,083 213,221 0.05% 3,769
2012 171,915 11,270 17,404 200,589 0.05% 3,345
2013 197,106 13,021 15,697 259 226,083 0.05% 3,806
2014 191,948 11,933 13,960 220 218,061 0.05% 3,660
2015 180,975 10,869 12,192 180 204,216 0.05% 3,395

YEAR ENDED
JUNE 30
2006
2007
2008
2009
...ll.
...ll. 2010 (j)
2011
2012
2013
2014
2015
NOTES:
TOWN OF FAIRFIELD CONNECTICUT
RATIOS OF GENERAL OBLIGATION DEBT OUTSTANDING LAST TEN YEARS
GENERAL OBLIGATION
BONDS
$ 171,735 $
160,800
198,260
189,970
174,470
187,135
171,915
197,106
191,948
180,975
(THOUSANDS, EXCEPT PER CAPITA) (UNAUDITED)
GENERAL OBLIGATION DEBT OUTSTANDING
(1) CLEAN
BOND WATER CAPITAL PREMIUM NOTES LEASES
363 $ 27,063 $ 1,216
319 25,534 912
3,594 23,965 608
3,882 22,368 304
6,591 20,732
7,003 19,083
11,270 17,404
13,021 15,655 259
11,933 13,829 220
10,869 12,103 180
Details regarding the Town's outstanding debt can be found in the notes to financial statements.
All general obligation debt above is liquidated by general fund appropriations.
(1) Excludes clean water loan 245C, which is paid by the Water Pollution Control Authority fund.
$
TABLE 9
PERCENTAGE OF ACTUAL TAXABLE DEBT
VALUE OF PER TOTAL PROPERTY CAPITA
200,377 1.27% $ 3,425
187,246 1.12% 3,206
226,427 1.34% 3,935
216,524 1.27% 3,809
201,793 1.14% 3,569
213,221 1.24% 3,769
200,589 1.29% 3,345
226,041 1.45% 3,759
217,930 1.39% 3,659
204,127 1.30% 3,395
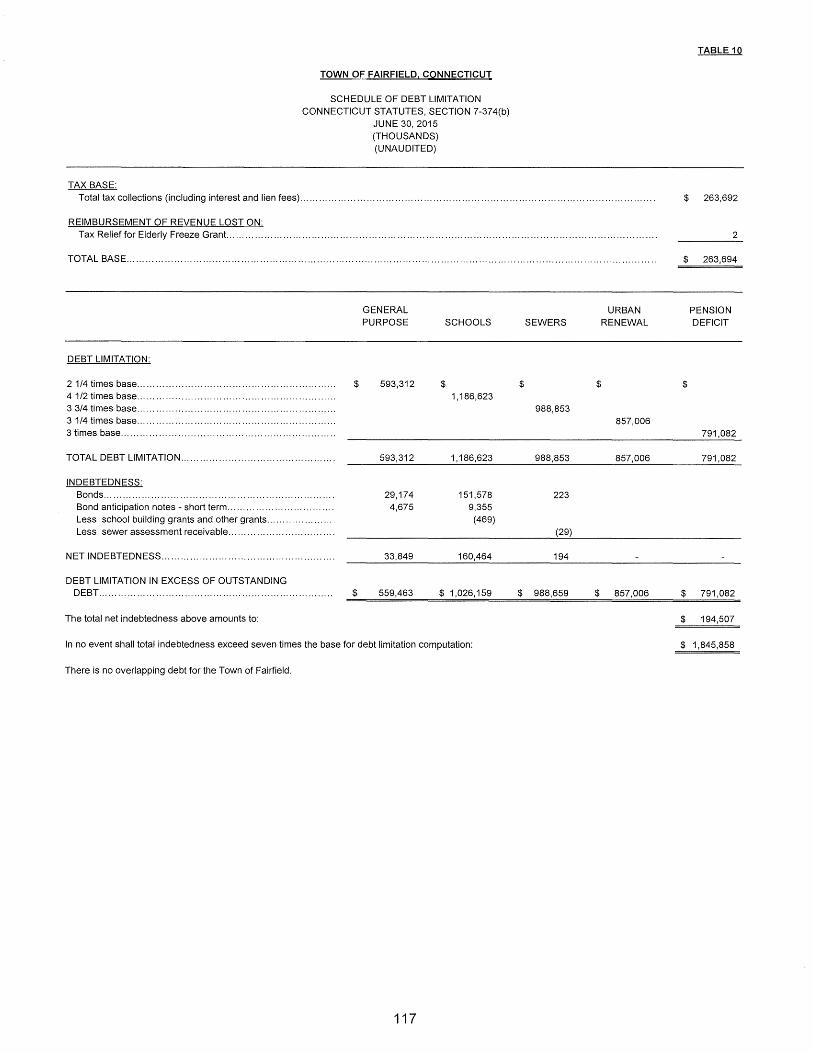
TAX BASE:
TOWN OF FAIRFIELD CONNECTICUT
SCHEDULE OF DEBT LIMITATION CONNECTICUT STATUTES, SECTION 7-374(b)
JUNE 30, 2015 (THOUSANDS) (UNAUDITED)
Total tax collections (including interest and lien fees) ............................................................................................................... .
REIMBURSEMENT OF REVENUE LOST ON: Tax Relief for Elderly Freeze Grant. ...................................................................................................................................... .
TOTAL BASE ...................................................................................................................................................................... .
DEBT LIMITATION:
2 1/4 times base .............................................................. . $ 4 1/2 times base .............................................................. . 3 3/4 times base .............................................................. . 3 1/4 times base .............................................................. . 3 times base ................................................................... .
TOTAL DEBT LIMITATION ................................................ .
INDEBTEDNESS: Bonds ........................................................................ . Bond anticipation notes - short term ................................. . Less school building grants and other grants ..................... . Less sewer assessment receivable ................................. .
NET INDEBTEDNESS ...................................................... .
DEBT LIMITATION IN EXCESS OF OUTSTANDING DEBT ......................................................................... . $
The total net indebtedness above amounts to:
GENERAL PURPOSE
593,312
593,312
29,174 4,675
33,849
559,463
SCHOOLS
$ 1 '186,623
1,186,623
151,578 9,355 (469)
160,464
$ 1,026,159
In no event shall total indebtedness exceed seven times the base for debt limitation computation:
There is no overlapping debt for the Town of Fairfield.
117
SEWERS
$
988,853
988,853
223
(29)
194
$ 988,659
$
URBAN RENEWAL
857,006
857,006
$ 857,006
TABLE 10
$ 263,692
2
$ 263,694
$
PENSION DEFICIT
791,082
791,082
$ 791,082
$ 194,507
$ 1,845,858
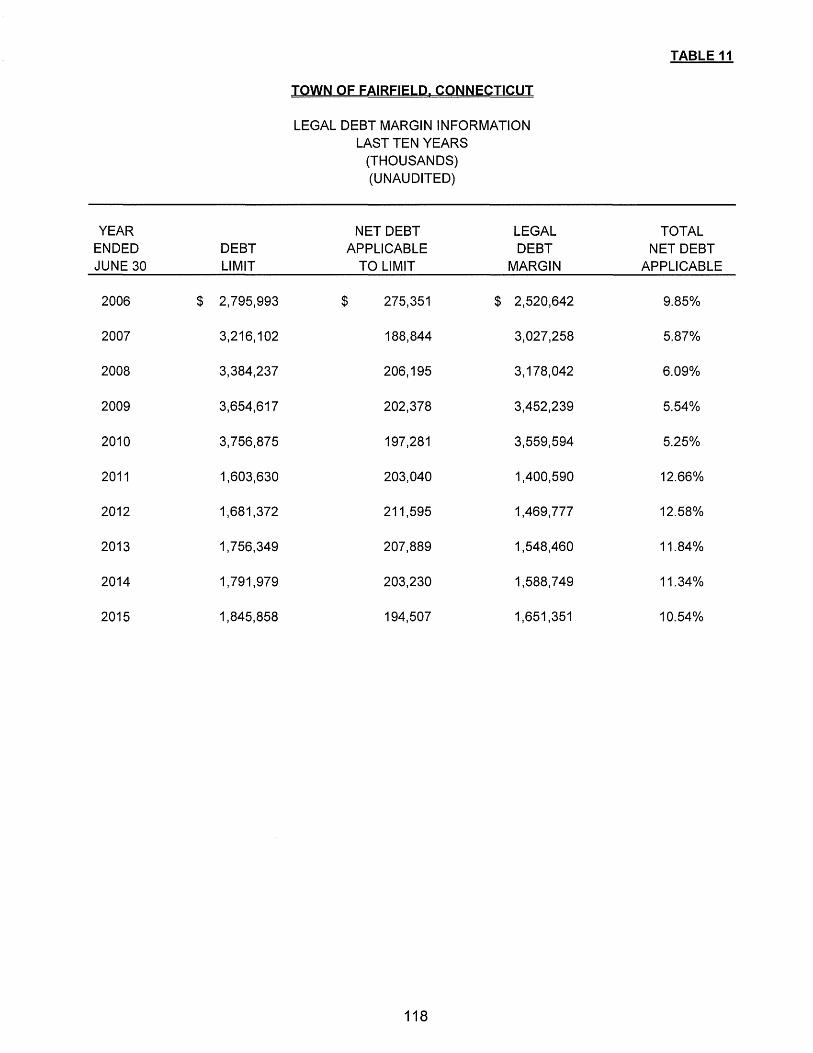
TABLE11
TOWN OF FAIRFIELD. CONNECTICUT
LEGAL DEBT MARGIN INFORMATION LAST TEN YEARS
(THOUSANDS) (UNAUDITED)
YEAR NET DEBT LEGAL TOTAL ENDED DEBT APPLICABLE DEBT NET DEBT JUNE 30 LIMIT TO LIMIT MARGIN APPLICABLE
2006 $ 2,795,993 $ 275,351 $ 2,520,642 9.85%
2007 3,216,102 188,844 3,027,258 5.87%
2008 3,384,237 206,195 3,178,042 6.09%
2009 3,654,617 202,378 3,452,239 5.54%
2010 3,756,875 197,281 3,559,594 5.25%
2011 1,603,630 203,040 1,400,590 12.66%
2012 1,681,372 211,595 1,469,777 12.58%
2013 1,756,349 207,889 1,548,460 11.84%
2014 1,791,979 203,230 1,588,749 11.34%
2015 1,845,858 194,507 1,651,351 10.54%
118

TABLE12
TOWN OF FAIRFIELD CONNECTICUT
DEMOGRAPHIC AND ECONOMIC STATISTICS LAST TEN YEARS
(UNAUDITED)
(2) (1) (3) (4) EDUCATION
LEVEL IN YEAR YEARS OF ENDED (1) PERSONAL PER CAPITA MEDIAN FORMAL SCHOOL UNEMPLOYMENT
JUNE 30 POPULATION INCOME INCOME AGE SCHOOLING ENROLLMENT RATE
52% Bachelor 2006 58,407 $ 100,290 $ 45,108 40.0 Degree or more 9,207 2.90%
52% Bachelor 2007 57,930 100,920 45,108 38.5 Degree or more 9,424 3.70%
52% Bachelor 2008 57,548 100,920 43,670 38.5 Degree or more 9,709 4.50%
-..\. 55% Bachelor -..\.
<0 2009 56,852 106,184 49,702 38.5 Degree or more 9,880 6.70%
55% Bachelor 2010 56,544 106,184 49,702 38.5 Degree or more 10,032 7.50%
55% Bachelor 2011 56,577 103,754 43,670 41.0 Degree or more 10,118 7.30%
59% Bachelor 2012 59,961 103,754 58,452 40.0 Degree or more 10,287 7.10%
59% Bachelor 2013 59,404 100,920 55,733 40.0 Degree or more 10,273 7.00%
60% Bachelor 2014 59,562 100,920 55,733 40.5 Degree or more 10,250 5.00%
60% Bachelor 2015 60,126 100,920 58,576 40.9 Degree or more 10,160 4.70%
(1) Source: State Health Department.
(2) Fairfield Profile Wikipedia.
(3) Town of Fairfield, Board of Education.
(4) Source: State Department of Labor.
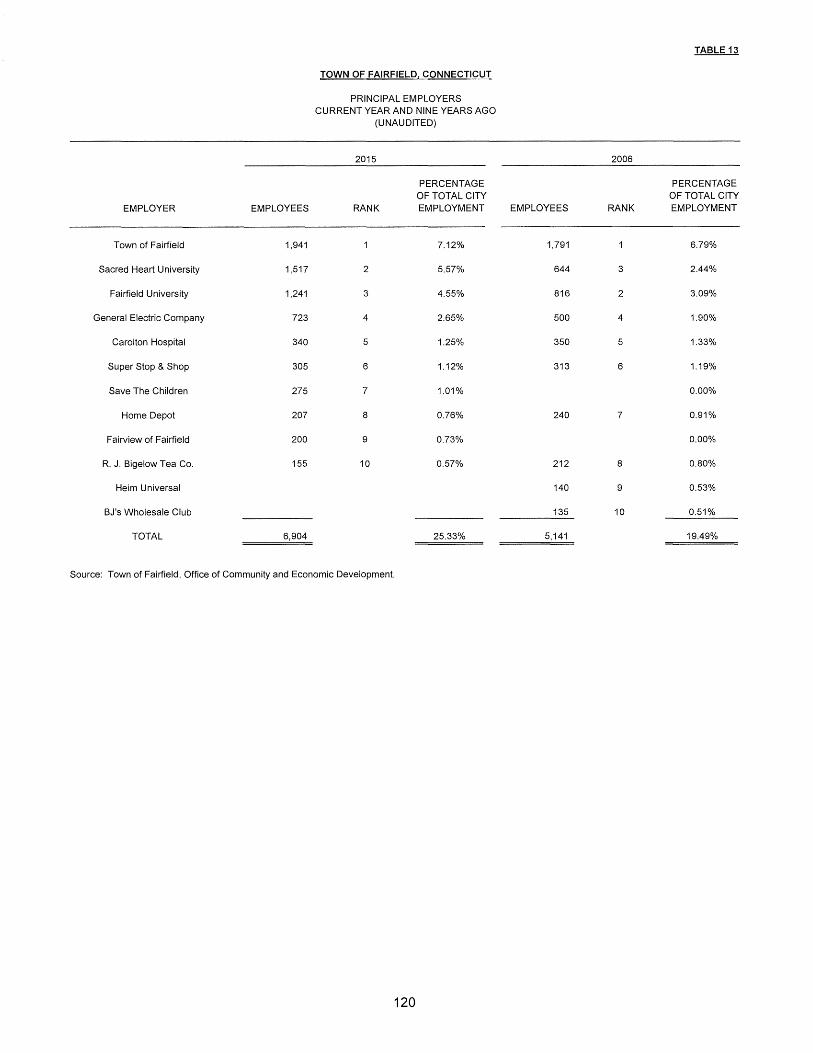
TABLE 13
TOWN OF FAIRFIELD CONNECTICUT
PRINCIPAL EMPLOYERS CURRENT YEAR AND NINE YEARS AGO
(UNAUDITED)
2015 2006
PERCENTAGE PERCENTAGE OF TOTAL CITY OF TOTAL CITY
EMPLOYER EMPLOYEES RANK EMPLOYMENT EMPLOYEES RANK EMPLOYMENT
Town of Fairfield 1,941 7.12% 1,791 6.79%
Sacred Heart University 1,517 2 5.57% 644 3 2.44%
Fairfield University 1,241 3 4.55% 816 2 3.09%
General Electric Company 723 4 2.65% 500 4 1.90%
Carolton Hospital 340 5 1.25% 350 5 1.33%
Super Stop & Shop 305 6 1.12% 313 6 1.19%
Save The Children 275 7 1.01% 0.00%
Home Depot 207 8 0.76% 240 7 0.91%
Fairview of Fairfield 200 9 0.73% 0.00%
R. J. Bigelow Tea Co. 155 10 0.57% 212 8 0.80%
Heim Universal 140 9 0.53%
BJ's Wholesale Club 135 10 0.51%
TOTAL 6,904 25.33% 5,141 19.49%
Source: Town of Fairfield, Office of Community and Economic Development.
120

......lo.
N ......lo.
FUNCTION I PROGRAM
Administrative and General Government Board of Selectmen Town Clerk Registrar of Voters Town Planning and Zoning Conservation Human Resources Community & Economic Development
Finance Finance Purchasing Assessor Tax Collector Information Systems
Public Safety Fire Police Animal Control Emergency Communications Center
Public Works Public Works Administration Public Works Operations Building Engineering
Health Social Human Services Health Social and Human Services Solid Waste & Recycling
Library
Recreation Parks and Recreation South Pine Creek Golf Course H. Smith Richardson Golf Course
GRAND TOTAL
Source: Town Finance Department.
2015
4.00 6.00 1.00 6.00 8.00 4.00 1.75
8.00 3.00 7.00 7.00 5.00
98.00 115.00
3.00 15.00
3.85 74.00
7.00 7.00
33.00 2.00 2.00
30.00
6.00 1.00 6.00
463.60
TOWN OF FAIRFIELD CONNECTICUT
FULL-TIME EQUIVALENT TOWN GOVERNMENT EMPLOYEES BY FUNCTION/PROGRAM LAST TEN YEARS
2014
4.00 6.00 1.00 6.00 8.00 4.00 1.75
8.00 3.00 7.00 7.00 5.00
98.00 113.00
3.00 15.00
3.85 74.00
7.00 7.00
33.00 2.00 2.00
30.00
6.00 1.00 6.00
461.60
2013
4.85 6.00 1.00 6.20 8.00 4.00 1.75
8.15 3.00 7.00 7.00 5.00
98.00 113.00
3.00 15.00
3.85 76.00
6.40 7.00
33.00 2.00 2.00
31.00
6.00 1.00 6.00
465.20
2012
4.85 6.00 1.00 6.20 8.00 4.00 1.00
8.15 3.00 7.00 7.00 5.00
98.00 113.00
3.00 15.00
3.85 76.00
6.40 7.00
33.00 2.00 2.00
31.00
6.00 1.00 6.00
464.45
(UNAUDITED)
FISCAL YEAR ENDED
2011
4.85 6.00 1.00 6.20 8.00 4.00 1.00
8.15 3.00 7.00 7.00 5.00
98.00 113.00
3.00 15.00
3.85 76.00
6.40 7.00
33.00 2.00 2.00
31.00
6.00 1.00 6.00
464.45
2010
5.00 6.00 1.00 6.00 9.00 4.00 1.00
8.00 3.00 7.00 7.00 5.00
98.00 112.00
3.00 15.00
4.00 76.00
7.00 7.00
33.00 2.00 2.00
31.00
6.00 1.00 6.00
465.40
2009
4.00 6.00 1.00 6.60 8.00 4.00 1.00
8.40 2.00 6.50 6.50 4.00
95.00 108.00
3.00 15.00
4.00 70.00
7.00 7.00
32.00 2.00 2.00
30.00
6.00 1.00 6.00
446.00
2008
5.00 6.00 1.00 7.00
10.00 4.00 1.00
10.00 3.00 7.00 7.00 3.00
97.00 114.00
3.00 15.00
5.00 79.00
7.00 7.00
34.00 3.00 2.00
31.00
6.00 1.00 6.00
474.00
2007
5.00 6.00 1.00 7.00
10.00 3.00 1.00
10.00 3.00 7.00 7.00 3.00
97.00 114.00
3.00 15.00
5.00 79.00
7.00 7.00
33.00 1.00 2.00
31.00
6.00 1.00 6.00
470.00
TABLE 14
2006
5.00 6.00 1.00 7.00
10.00 3.00 1.00
10.00 3.00 7.00 7.00 3.00
96.00 112.00
3.00 15.00
6.00 78.00
7.00 6.00
33.00 1.00 2.00
29.00
6.00 1.00 6.00
464.00

TABLE15
TOWN OF FAIRFIELD CONNECTICUT
FULL-TIME EQUIVALENT EMPLOYEES BY FUNCTION/PROGRAM LAST TEN YEARS
(UNAUDITED)
FISCAL YEAR ENDED
FUNCTION I PROGRAM 2015 2014 2013 2012 2011 2010 2009 2008 2007 2006
TOWN
Administrative and General Government.. ....... 30.75 30.75 31.80 31.05 31.05 32.00 30.60 34.00 33.00 33.00
Finance ................................................... 30.00 30.00 30.15 30.15 30.15 30.40 27.40 30.00 30.00 30.00
Public Safety ............................................ 231.00 229.00 229.00 229.00 229.00 228.00 221.00 229.00 229.00 226.00
Public Works ............................................ 91.85 91.85 93.25 93.25 93.25 94.00 88.00 98.00 98.00 97.00
Health, Social, Human Services .................... 37.00 37.00 37.00 37.00 37.00 37.00 36.00 39.00 36.00 36.00
Library ..................................................... 30.00 30.00 31.00 31.00 31.00 31.00 30.00 31.00 31.00 29.00
Recreation ............................................... 13.00 13.00 13.00 13.00 13.00 13.00 13.00 13.00 13.00 13.00 -.l.
1\..) 1\..)
TOTAL TOWN .......................................... 463.60 461.60 465.20 464.45 464.45 465.40 446.00 474.00 470.00 464.00
BOARD OF EDUCATION
Teaching Staff .......................................... 954.55 944.15 944.15 920.95 915.00 906.35 906.35 886.80 876.75 865.20
Administration ........................................... 46.80 44.80 44.80 44.80 44.25 44.80 44.80 44.80 43.80 43.80
Other Staff ............................................... 407.70 385.30 383.05 408.50 427.90 426.10 426.10 410.70 404.20 399.10
TOTAL BOARD OF EDUCATION ................. 1,409.05 1,374.25 1,372.00 1,374.25 1,387.15 1,377.25 1,377.25 1,342.30 1,324.75 1,308.10
TOTAL. ................................................ 1,872.65 1,835.85 1,837.20 1,838.70 1,851.60 1,842.65 1,377.25 1,816.30 1,794.75 1,772.10
Source: Town and Board of Education Human Resource Departments.

TABLE 16
TOWN OF FAIRFIELD CONNECTICUT
OPERATING INDICATORS BY FUNCTION/PROGRAM LAST TEN YEARS
(UNAUDITED)
FISCAL YEAR ENDED
FUNCTION I PROGRAM 2015 2014 2013 2012 2011 2010 2009 2008 2007 2006
Public safety Fire
Incidents 8,550 8,070 9,475 9,188 8,964 8,947 9,038 6,141 7,759 9,458 Unit responses 14,450 14,192 15,033 14,668 14,479 15,399 15,111 10,525 13,308 19,021 Fire Marshall Inspections 1,339 1,206 1,213 1,168 1,071 959 845 577 710 1,168
Police Criminal arrests 896 936 996 1,049 921 1,817 814 1,826 1,362 1,084 Parking violations 5,453 4,771 6,123 8,481 8,545 8,549 8,413 10,086 9,902 9,332 Citations 2,808 5,133 5,176 7,478 5,511 4,286 5,532 6,116 5,649 5,445
Public works Street resurfacing (paved miles) 4.40 7.40 5.98 8.22 10.30 7.19 9.59 11.96 17.07 10.60
......l.. Potholes repaired 1,186 696 1,752 1,883 4,433 4,554 2,875 2,260 1,553 2,127 N w
Refuse collection Refuse collected (tons per day) 89.53 93.25 93.11 93.63 94.78 96.85 90.87 133.10 144.56 149.51 Recyclables collected (tons per day) 13.96 13.78 13.54 11.75 12.92 65.55 4.84 5.38 5.68 7.22
Parks and recreation Fitness Center daily admissions 161 154 152 143 145 142 126 162 298 351
Library Volumes in collection 309,171 323,335 342,905 343,981 347,650 349,377 353,279 N/A 345,274 331,526 Total volumes borrowed 917,067 956,435 932,572 1,012,755 1,010,788 1,004,417 996,000 933,948 885,493 873,055
Education School enrollment 10,160 10,250 10,273 10,287 10,118 10,032 9,880 9,709 9,424 9,195
Source: Various Town Departments.
N/A - Information not available.

TABLE17
TQWN QF FAIRFIELD CQNNECTICUT
CAPITAL ASSET STATISTICS BY FUNCTION/PROGRAM LAST TEN YEARS
(UNAUDITED)
FISCAL YEAR ENDED
FUNCTION I PROGRAM 2015 2014 2013 2012 2011 2010 2009 2008 2007 2006
PARKS AND RECREATION: Playgrounds 28 25 25 25 25 25 24 24 24 24 Baseball/softball diamonds 25 25 25 24 24 24 24 24 24 24 Soccer/football fields 19 19 19 19 19 19 19 19 19 19 Community centers 2 1 1 1 1 1 1 1 1
PUBLIC SAFETY: Fire Stations 5 5 5 5 5 5 5 5 5 5 Police Stations 1 1 1 1 1 1
Patrol units 24 24 24 24 24 24 21 21 21 21
PUBLIC WORKS: Highway department
.....lo. Streets (miles) 274 274 274 274 273 273 273 273 273 273 N
Streetlights 4,191 4,186 4,181 4,179 4,176 4,172 4,172 4,171 4,168 4,155 ,.f:la.
Wastewater Sanitary sewers (miles) 187.19 187.19 187.17 187.17 187.16 187.16 187.00 187.00 187.00 187.00 Storm sewers (miles) 127.39 127.10 127.07 126.94 126.27 126.1 125.73 125.31 124.75 124.57
Treatment capacity (thousands of gallons/day) 9,000 9,000 9,000 9,000 9,000 9,000 9,000 9,000 9,000 9,000
LIBRARIES: Number of public libraries 2 2 2 2 2 2 2 2 2 2
EDUCATION: High schools 2 2 2 2 2 2 2 2 2 2 Middle schools 3 3 3 3 3 3 3 3 3 3 Elementary schools 11 11 11 11 11 11 11 11 11 11
Source: Town capital asset records and various Town Departments.