COMPREHENSIVE ANNUAL FINANCIAL REPORTflyspi.com/pdf/2015 CAFR_email.pdf · COMPREHENSIVE ANNUAL...
143
SPRINGFIELD AIRPORT AUTHORITY FISCAL YEAR ENDED COMPREHENSIVE ANNUAL FINANCIAL REPORT JUNE 30, 2015 SPRINGFIELD, ILLINOIS R
Transcript of COMPREHENSIVE ANNUAL FINANCIAL REPORTflyspi.com/pdf/2015 CAFR_email.pdf · COMPREHENSIVE ANNUAL...

SPRINGFIELD AIRPORTAUTHORITY
FISCAL YEAR ENDED
COMPREHENSIVEANNUAL
FINANCIAL REPORT
JUNE 30, 2015
SPRINGFIELD, ILLINOIS
R
SPRINGFIELD AIRPORT AUTHORITY
SPRINGFIELD, ILLINOIS
COMPREHENSIVE ANNUAL FINANCIAL REPORT
For the Year Ended June 30, 2015
Prepared by
Administration and Finance Department
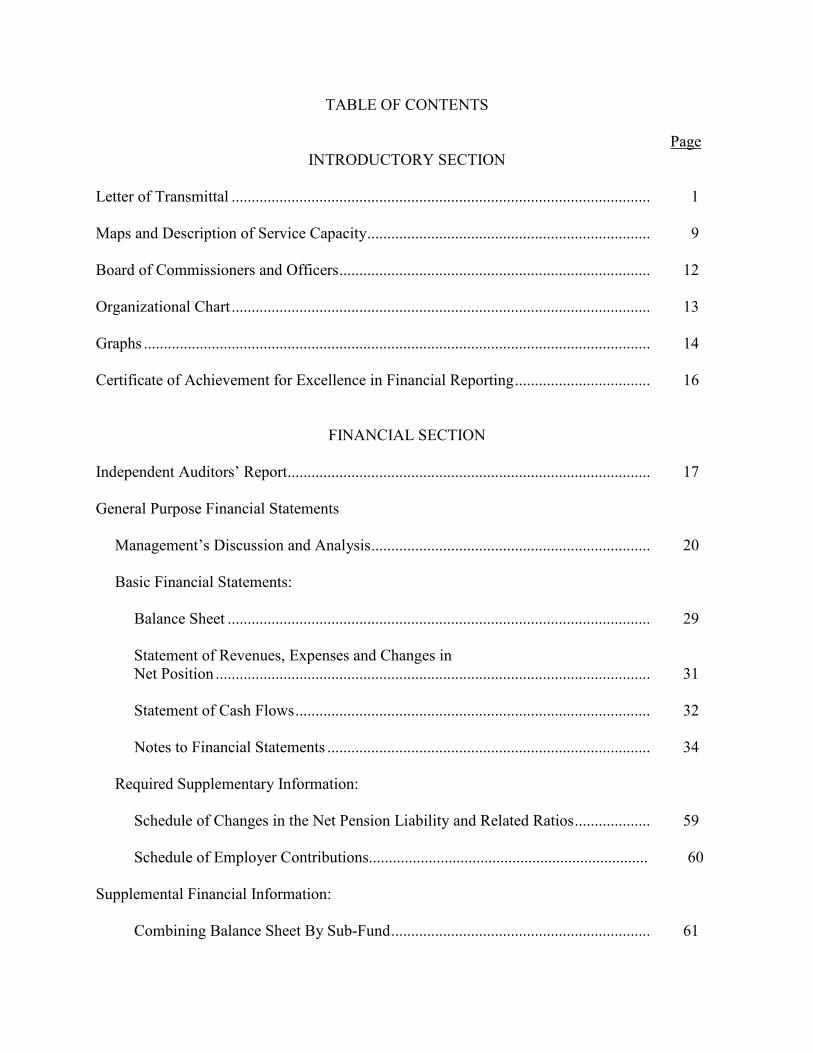
TABLE OF CONTENTS Page
INTRODUCTORY SECTION
Letter of Transmittal ......................................................................................................... 1 Maps and Description of Service Capacity ....................................................................... 9 Board of Commissioners and Officers .............................................................................. 12 Organizational Chart ......................................................................................................... 13 Graphs ............................................................................................................................... 14 Certificate of Achievement for Excellence in Financial Reporting .................................. 16
FINANCIAL SECTION
Independent Auditors’ Report ........................................................................................... 17 General Purpose Financial Statements Management’s Discussion and Analysis ...................................................................... 20 Basic Financial Statements: Balance Sheet .......................................................................................................... 29 Statement of Revenues, Expenses and Changes in Net Position ............................................................................................................. 31 Statement of Cash Flows ......................................................................................... 32 Notes to Financial Statements ................................................................................. 34 Required Supplementary Information: Schedule of Changes in the Net Pension Liability and Related Ratios ................... 59 Schedule of Employer Contributions...................................................................... 60 Supplemental Financial Information: Combining Balance Sheet By Sub-Fund ................................................................. 61

Page Combining Schedule of Revenues, Expenses and Changes in Net Position by Sub-Fund .................................................................... 65 Combining Balance Sheet - Restricted Investment Accounts ............................................................................................... 67 Combining Schedule of Revenues, Expenses and Changes in Net Position - Restricted Investment Accounts .................................... 68 Schedule of Expenses - Budget and Actual: Operations and Maintenance .............................................................................. 69 Capital Improvement and Clear Zone ................................................................ 72
STATISTICAL SECTION
Total Annual Revenues, Expenses and Changes In Net Position ..................................... 75 Revenues By Source, Expenses By Function and Net Income (Loss) – Operations and Maintenance – Presented In Constant Dollars .................................................................. 77 Property Tax Levies and Collections ................................................................................ 79 Summary of Tax Assessments and Collections ................................................................ 81 Schedule of Bonded Debt and Interest Requirements ...................................................... 83 Ratio of Bonded Debt to Assessed Valuation and Net Bonded Debt Per Capita ............. 85 Ratio of Annual General Obligation Bond Debt Service to Total Operations and Maintenance Expenditures ................................................................................................ 87 Ratios of Outstanding Debt By Type ................................................................................ 89 Revenue Bond Coverage................................................................................................... 91 Schedule of General Obligation (G.O.) Bond Coverage .................................................. 92 Principal Taxpayers .......................................................................................................... 94 Largest Non-Manufacturing Employers in Springfield Area ........................................... 95 Sangamon County Demographic Statistics ....................................................................... 96 Property Tax Values and Construction ............................................................................. 97 Per Capita Income and Unemployment Rate .................................................................... 98
Page Tenant Rents & Fees – Most Significant Own-Source Revenue ...................................... 99 Airport Information ........................................................................................................... 100 Full Time Equivalent Employees ...................................................................................... 101 Schedule of Insurance Coverage ....................................................................................... 102
PASSENGER FACILITY CHARGES
Independent Auditors’ Report on Compliance with Requirements That Could Have a Direct and Material Effect on the Passenger Facility Charge Program and On Internal Control Over Compliance .............................................................................. 104 Schedule of Expenditures of Passenger Facility Charges ................................................. 106
SINGLE AUDIT Independent Auditors’ Report on Internal Control Over Financial Reporting and on Compliance and Other Matters Based on an Audit of Financial Statements Performed in Accordance with Government Auditing Standards ...................................................... 107 Independent Auditors’ Report on Compliance For Each Major Program and on Internal Control Over Compliance Required By OMB Circular A-133 ........................... 109 Schedule of Expenditures of Federal Awards ................................................................... 111 Notes to Schedule of Expenditures of Federal Awards .................................................... 112 Schedule of Findings and Questioned Costs ..................................................................... 113 Summary Schedule of Prior Audit Findings ..................................................................... 114

THIS PAGE INTENTIONALLY LEFT BLANK
~ ~ ~
~ 0 ~ ~ INTRODUCTORY SECTION
:J ~
~ 0 ~ ~
~ 0 ~ ~ ~
~
u z ~
~ ~ (/)


November 5, 2015
Mark E. Hanna, A.A.E., Executive Director Springfield Airport Authority
To the Citizens of the Springfield Airport Authority's Taxing District and Commissioners of the Springfield Airport Authority:
State law requires that every local govemmental entity publish within six months of the close of each fiscal year a complete set of audited fmancial statemen~s. This report is published to fulfill that requirement for the fiscal year ended June 30, 2015.
Management assumes full responsibility for the completeness and reliability of the information contained in this report, based upon internal control that it has established for this purpose. Because the cost of internal control should not exceed anticipated benefits, the objective is to provide reasonable, rather than absolute, assurance that the financial statements are free of any material misstatements.
Eck, Schafer & Punlce, LLP~ Certified Public Accountants, have issued an unmodified ("clean") opinion on the Springfield Airport Authority's financial statements for the year ended June 30, 2015. The independent auditors' report is located on pages 17, 18 and 19 of this report.
The Government Finance Officers Association of the United States and Canada (GFOA) awarded a Certificate of Achievement for Excellence in Financial Rep01ting to the Springfield Airport Authority for its c9mprehensive annual financial report for the fiscal year ended June 30, 2014. This was the twelfth consecutive year that the Authority has achieved this prestigious award. In order to be awarded a Ce1tificate of Achievement, a government must publish an easily readable and efficiently organized comprehensive annual fmancial repmt. This repmt must satisfy both generally accepted accounting principles and applicable legal requirements.
A Cettificate of Achievement is valid for a period of one year only. We believe that our current comprehensive annual financial repmt continues to meet the Celtificate of Achievement Program's requirements and we are submitting it to the GFOA to determine its eligibility for another Certificate of Achievement.
Management's discussion and ~alysis (MD&A) immediately follows the independent auditors' report and provides a narrative introduction, overview, and analysis of the basic financial statements. The MD&A complements this letter of transmittal and should be read in conjunction with it.
1200 Capita l Airport Drive • Springfield, Ill inois 62707 217-788-1060 • 2 17-788-8o56 (Fax) • www.flyspi .com
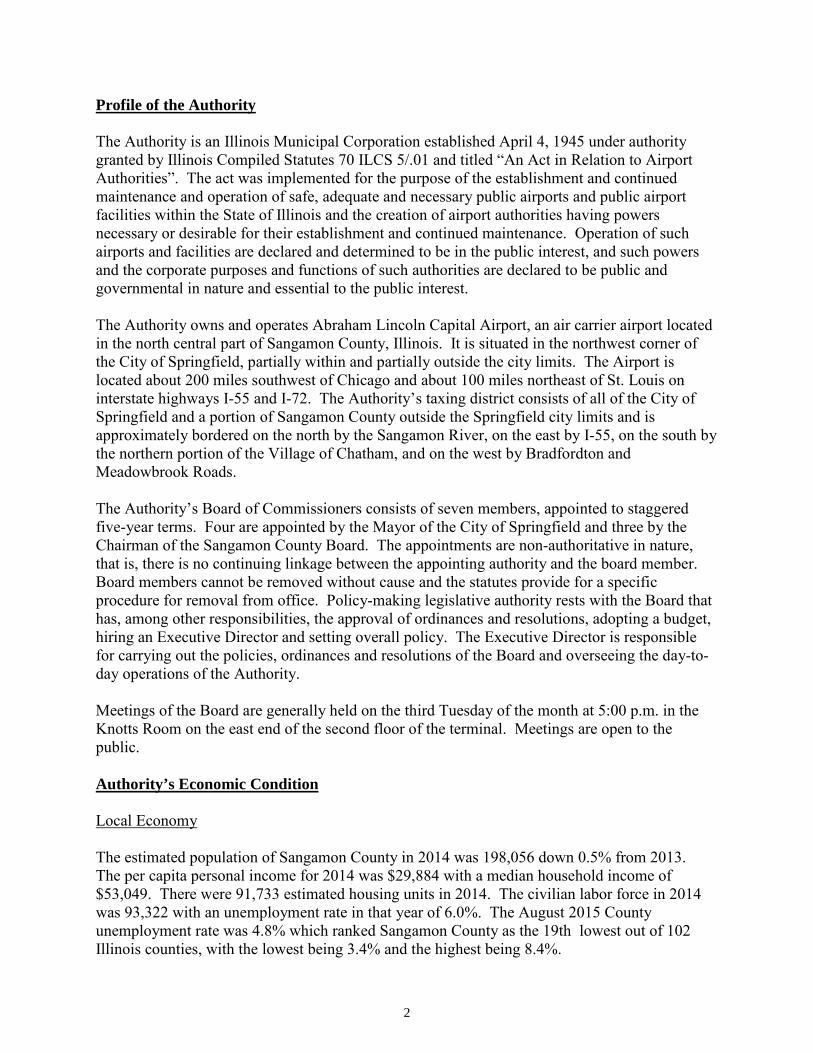
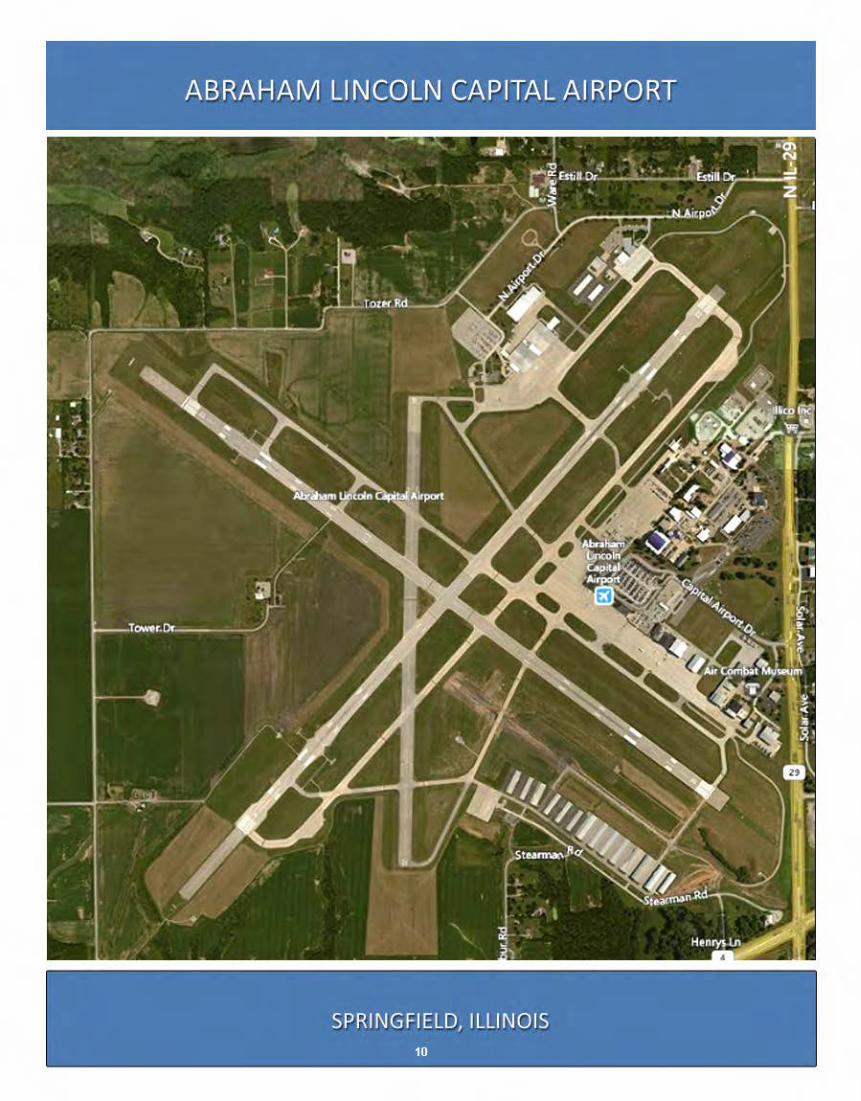
Profile of the Authority The Authority is an Illinois Municipal Corporation established April 4, 1945 under authority granted by Illinois Compiled Statutes 70 ILCS 5/.01 and titled “An Act in Relation to Airport Authorities”. The act was implemented for the purpose of the establishment and continued maintenance and operation of safe, adequate and necessary public airports and public airport facilities within the State of Illinois and the creation of airport authorities having powers necessary or desirable for their establishment and continued maintenance. Operation of such airports and facilities are declared and determined to be in the public interest, and such powers and the corporate purposes and functions of such authorities are declared to be public and governmental in nature and essential to the public interest. The Authority owns and operates Abraham Lincoln Capital Airport, an air carrier airport located in the north central part of Sangamon County, Illinois. It is situated in the northwest corner of the City of Springfield, partially within and partially outside the city limits. The Airport is located about 200 miles southwest of Chicago and about 100 miles northeast of St. Louis on interstate highways I-55 and I-72. The Authority’s taxing district consists of all of the City of Springfield and a portion of Sangamon County outside the Springfield city limits and is approximately bordered on the north by the Sangamon River, on the east by I-55, on the south by the northern portion of the Village of Chatham, and on the west by Bradfordton and Meadowbrook Roads. The Authority’s Board of Commissioners consists of seven members, appointed to staggered five-year terms. Four are appointed by the Mayor of the City of Springfield and three by the Chairman of the Sangamon County Board. The appointments are non-authoritative in nature, that is, there is no continuing linkage between the appointing authority and the board member. Board members cannot be removed without cause and the statutes provide for a specific procedure for removal from office. Policy-making legislative authority rests with the Board that has, among other responsibilities, the approval of ordinances and resolutions, adopting a budget, hiring an Executive Director and setting overall policy. The Executive Director is responsible for carrying out the policies, ordinances and resolutions of the Board and overseeing the day-to-day operations of the Authority. Meetings of the Board are generally held on the third Tuesday of the month at 5:00 p.m. in the Knotts Room on the east end of the second floor of the terminal. Meetings are open to the public. Authority’s Economic Condition Local Economy The estimated population of Sangamon County in 2014 was 198,056 down 0.5% from 2013. The per capita personal income for 2014 was $29,884 with a median household income of $53,049. There were 91,733 estimated housing units in 2014. The civilian labor force in 2014 was 93,322 with an unemployment rate in that year of 6.0%. The August 2015 County unemployment rate was 4.8% which ranked Sangamon County as the 19th lowest out of 102 Illinois counties, with the lowest being 3.4% and the highest being 8.4%.
2

FY 2015 Highlights • Received the Government Finance Officers Association Certificate of Achievement for
Excellence in Financial Reporting. In order to be awarded a Certificate of Achievement, a government must publish an easily readable and efficiently organized comprehensive annual financial report.
• During this fiscal year the Authority has received a zero deficiency rating as part of the FAA
Airport Certification Inspection. The inspection includes a review of the fuel farm, airfield condition, airfield lighting and signs. Document review includes auditing the Certification Manual, aircraft rescue and firefighting training records, inspection reports of the fuel facilities, fueling agents’ training certification, records of the most recent Airport Emergency Plan and the Full-Scale Disaster Exercise, airfield daily self-inspection records, the Airport Master Record and the NOTAM (Notice to Airmen) records. The Authority maintains an impeccable safety inspection record as it pertains to maintaining and operating a commercial air service airport.
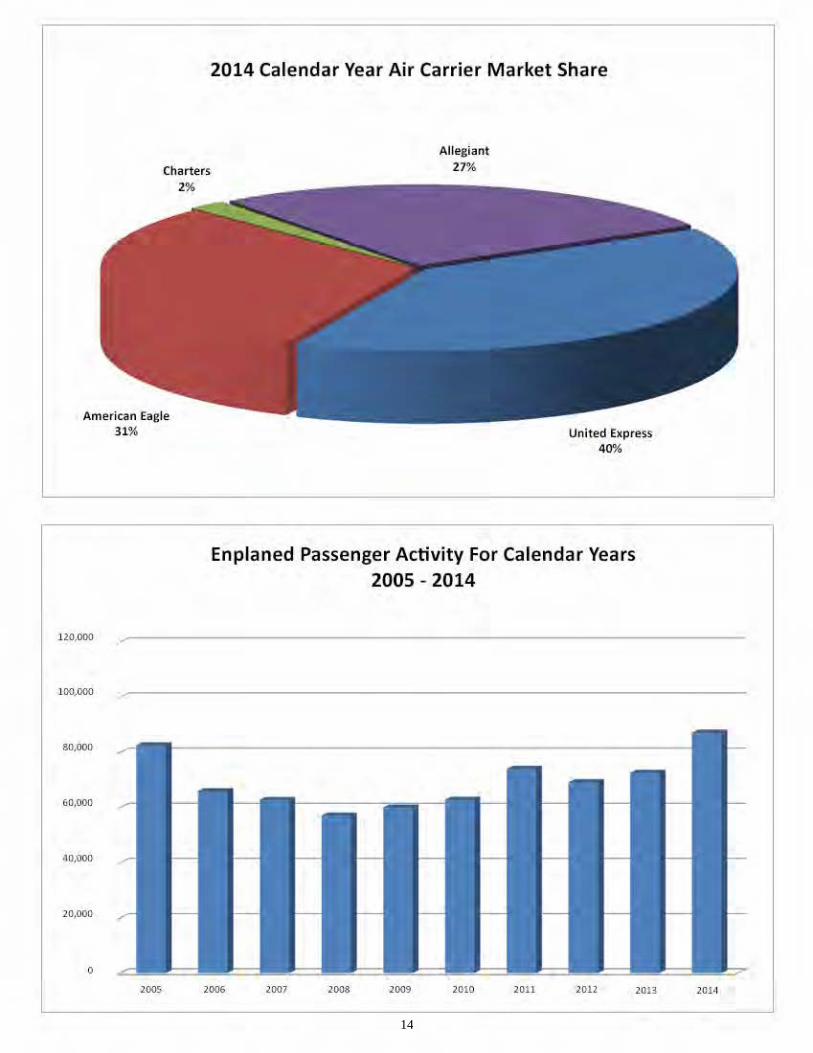
• Total passengers for calendar year 2014 were up 20.2% compared to the previous year. • Received two Airport Improvement grants totaling $2,079,856 in federal funds and $31,895
in State of Illinois funds.
• Refinanced to obtain lower rates of interest on the two loans regarding the Southeast Quadrant T-Hangars.
• Reconnected a total of 1,118 land parcels to the Airport Authority's taxing district in two actions. Additional reconnections will occur every December.
Accounting System and Budgetary Control The Authority’s reporting entity is defined by GASB Statement Number 39. In accordance with this Statement, the reporting entity includes all departments, operations and entities for which the Authority is legally accountable. The financial statements include only departments of the Authority and no other governmental unit. The Authority is structured as an enterprise fund. All financial statements are presented on the accrual basis of accounting. The Authority uses a purchase order system for internal control as well as following a Purchasing Standard Operating Procedure and a Board-adopted Purchasing Policy. Internal Control In developing and evaluating the Authority’s accounting system, consideration is given to the adequacy of the internal controls. They are designed to provide reasonable, but not absolute, assurance regarding: (1) the safety of assets against loss from theft, unauthorized use or disposition; and (2) the reliability of financial records for preparing financial statements in conformity with generally accepted accounting principles. The concept of reasonable assurance recognizes that the cost of a control should not exceed the benefits likely to be derived, and the evaluation of costs and benefits require estimates and judgment by management.
3
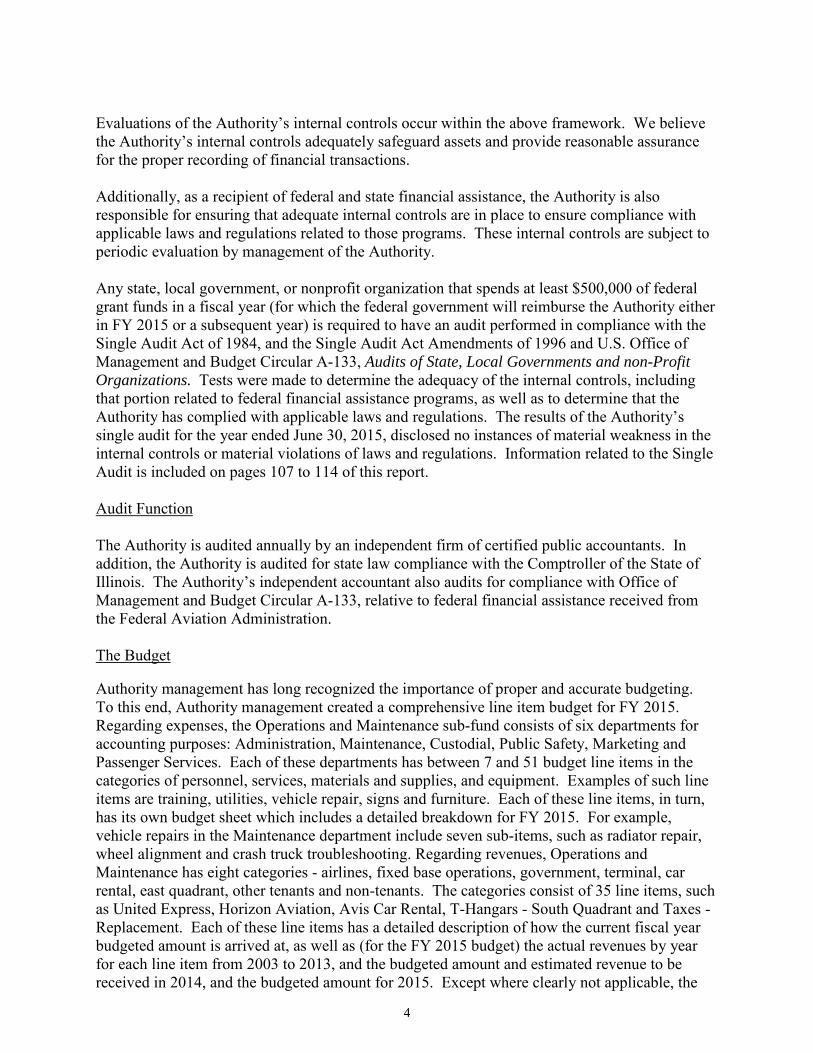
Evaluations of the Authority’s internal controls occur within the above framework. We believe the Authority’s internal controls adequately safeguard assets and provide reasonable assurance for the proper recording of financial transactions. Additionally, as a recipient of federal and state financial assistance, the Authority is also responsible for ensuring that adequate internal controls are in place to ensure compliance with applicable laws and regulations related to those programs. These internal controls are subject to periodic evaluation by management of the Authority. Any state, local government, or nonprofit organization that spends at least $500,000 of federal grant funds in a fiscal year (for which the federal government will reimburse the Authority either in FY 2015 or a subsequent year) is required to have an audit performed in compliance with the Single Audit Act of 1984, and the Single Audit Act Amendments of 1996 and U.S. Office of Management and Budget Circular A-133, Audits of State, Local Governments and non-Profit Organizations. Tests were made to determine the adequacy of the internal controls, including that portion related to federal financial assistance programs, as well as to determine that the Authority has complied with applicable laws and regulations. The results of the Authority’s single audit for the year ended June 30, 2015, disclosed no instances of material weakness in the internal controls or material violations of laws and regulations. Information related to the Single Audit is included on pages 107 to 114 of this report. Audit Function The Authority is audited annually by an independent firm of certified public accountants. In addition, the Authority is audited for state law compliance with the Comptroller of the State of Illinois. The Authority’s independent accountant also audits for compliance with Office of Management and Budget Circular A-133, relative to federal financial assistance received from the Federal Aviation Administration. The Budget Authority management has long recognized the importance of proper and accurate budgeting. To this end, Authority management created a comprehensive line item budget for FY 2015. Regarding expenses, the Operations and Maintenance sub-fund consists of six departments for accounting purposes: Administration, Maintenance, Custodial, Public Safety, Marketing and Passenger Services. Each of these departments has between 7 and 51 budget line items in the categories of personnel, services, materials and supplies, and equipment. Examples of such line items are training, utilities, vehicle repair, signs and furniture. Each of these line items, in turn, has its own budget sheet which includes a detailed breakdown for FY 2015. For example, vehicle repairs in the Maintenance department include seven sub-items, such as radiator repair, wheel alignment and crash truck troubleshooting. Regarding revenues, Operations and Maintenance has eight categories - airlines, fixed base operations, government, terminal, car rental, east quadrant, other tenants and non-tenants. The categories consist of 35 line items, such as United Express, Horizon Aviation, Avis Car Rental, T-Hangars - South Quadrant and Taxes - Replacement. Each of these line items has a detailed description of how the current fiscal year budgeted amount is arrived at, as well as (for the FY 2015 budget) the actual revenues by year for each line item from 2003 to 2013, and the budgeted amount and estimated revenue to be received in 2014, and the budgeted amount for 2015. Except where clearly not applicable, the
4

budget was created using the zero-based budgeting procedure whereby staff was required to estimate all revenues and expenditures as though each revenue and expenditure was in effect for the first time. Federal and State Grants The Authority receives both federal and state grants. Pursuant to the “Airport and Airway Improvement Act of 1982”, the federal government has participated with the Authority and the State of Illinois, Department of Transportation, Division of Aeronautics, for the acquisition and development of Abraham Lincoln Capital Airport. Participation has been via Airport Improvement Program Grants whereby the cost of construction projects is generally shared 90/5/5 or 90/0/10 percent by the Federal Aviation Administration, Illinois Department of Transportation, and the Authority, respectively. Administration of these grants is the responsibility of the Division of Aeronautics. On selected construction projects the Division of Aeronautics and the Authority are the only grant participants. The cost of these projects is typically shared on a 50/50 or 80/20 basis. During FY 2015, the Authority was awarded two grants through the FAA/Illinois Division of Aeronautics:
• Improve Airport Drainage (Rehabilitate Storm Sewer) - $ 579,856 Phase II (AIP-66)
• Upgrade Security & Public Safety (Fire Alarm) Systems - $ 1,500,000 Phase I (Construction) (AIP-67)
Long-Term Financial Planning The Authority from time to time does financial planning – projecting long-term revenues and expenses – but has found that both revenues and expenses have been fairly stationary over time. Large revenue and expenditure streams start and stop, but the Authority’s financial position continues to be stable with most of the financial ratios having a slightly favorable long-term trend as discussed in more detail on pages 21 and 22. The Authority’s long-term capital improvement plan is to review every capital project to determine if it is eligible for federal and/or state grant funding through the Airport Improvement Program (AIP) and/or Passenger Facility Charges (PFC). The Authority’s local funds are thereby leveraged by using AIP and PFC funds when a project so qualifies. Throughout its existence the Authority has been purposeful in attempting to build cash reserves to fund contingencies and future facilities development. The Authority uses these assets to provide services to the Airport. Financial Policies The Authority has had a strong ongoing effort in recent years to attract airlines and expand existing service. This effort has led to the occasional providing of incentives to airlines to varying degrees and maintaining excellent working relationships with SPI incumbent carriers -American Airlines, United Airlines and Allegiant Air. In September of 2012 the Authority received a Small Community Air Service Development Grant to “Secure and support new nonstop low-cost service from Abraham Lincoln Capital Airport at Springfield to leisure
5

destinations by utilizing ground handling cost offsets and a target marketing program”. As a result, Allegiant Travel Company began twice weekly nonstop flights between Ft Myers/ Punta Gorda, Florida and Abraham Lincoln Capital Airport with an effective date of November 8, 2012. Also, on November 22, 2013, Allegiant began twice weekly nonstop flights between Orlando/Sanford, Florida and Abraham Lincoln Capital Airport. Staff maintains regular communications with Allegiant's route planning/scheduling team to discuss other prospective markets that may have potential for long term success. Also, the Authority periodically provides introductory rent and fee abatement incentives to airlines starting or expanding service from Abraham Lincoln Capital Airport. The Authority’s Passenger Services Department provides ground handling services, consisting of above wing (counter and gate services) and below wing (ramp and baggage handling services), to attract and incentivize airlines to consider expanding current or to fly new routes to SPI. These ground handling services incentives can provide large initial cost savings to prospective airlines, while generating additional revenue for the Authority. Other financial policies of the Authority that have an effect on the current period’s financial statements are:
• With very few exceptions, rents and fees increase annually by the increase in the Consumer Price Index over the previous calendar year. More recently, this has been expanded for new leases to be the greater of the previous year’s CPI increase, or an increase of 2.5%.
• The Authority has a leasing policy in order to standardize lease terms, signature
authorization, renewals, amendments and legal approval.
• The Authority is self-insured for Workers’ Compensation insurance and has accumulated about $538,000 in assets against claims payable of $87,000.
• As indicated on the top of page 5, the Authority follows zero-based budgeting, whereby
all parts of each line item are identified, except where clearly not applicable, rather than the traditional incremental budgeting which assumes the previous year’s budget is automatically approved and only increases need to be identified.
• The Authority has had a Vehicle Replacement Program in effect since FY 2008 whereby
funds are set aside monthly for the acquisition of future vehicles. The amount set aside during FY 2015 was $86,224 and at June 30, 2015 the balance available was about $425,000.
• At any given time, the Authority has between $1 million to $2 million available for
investment. All checking account money is in The Illinois Funds and as funds are available for investment in a certificate of deposit or money market, a process is undertaken whereby interest rate quotes are sought from the high bidder from the previous solicitation plus three other financial institutions from among those who previously expressed interest.
• Because the Illinois Municipal Retirement Fund experienced heavy losses in its
investment portfolio in calendar 2008, for calendar 2010 the Authority elected the
6

higher of the two possible rates (the Annual Required Contribution) in order to more quickly pay off its increased liability and has continued the ARC since then.
• The Authority has implemented a management initiative to reduce energy costs. This has
taken the form of obtaining Illinois Clean Energy Foundation Grants, the issuing of over $2 million of general obligation bonds to finance energy efficiency and conservation measures, the acquisition of natural gas from an alternate supplier at a lower cost, the transition of lights from T12 and T8 to T5, installation of two solar thermal hot water systems, and other primarily terminal building energy conservation projects.
• In an attempt to reduce expenses, in November of 2013 the Airport Authority revised a
number of its employee policies which, among other things, reduce vacation time earned for new employees, and new employees leaving the Authority are not paid for a portion of health coverage and they are also paid for less of their accrued sick time compared to current employees leaving the Authority.
Commitments and Contingencies Certain airport capital improvements which are funded through Federal Aviation Administration (FAA) and Illinois Division of Aeronautics (IDOA) grants are subject to audit and acceptance by the granting agency. At June 30, 2015 there were ten FAA and IDOA grants open at Abraham Lincoln Capital Airport and one State IDOA grant: The FAA/IDOA grants open:
• Rehabilitate Apron (Design) (AIP-48)
• Enhance Security (Design) (AIP-55)
• Improve Terminal Building (restrooms, bag room and freight doors), Acquire ARFF Equipment, Install Windcone, Rehabilitate Access Road and Improve Airport Drainage-Phase I (AIP-59).
• Rehabilitate Golf Ramp and Hangar Taxiways – Phase II (AIP-61)
• Airfield Lighting Control and Monitoring System, Extend Taxiway Y, Construct ARFF Response Road, Realign Perimeter Road and Associated Improvements (AIP-62)
• Upgrade Perimeter Fence – Phase III (AIP-63)
• Modify Taxiway B (AIP-64)
• Acquire Snow Removal Equipment - Three Snow Plows, Two Front End Loaders and One Chemical Spreader (AIP-65)
• Improve Airport Drainage (Rehabilitate Storm Sewer) - Phase II (AIP-66)
• Upgrade Security & Public Safety (Fire Alarm) Systems - Phase I (Construction) (AIP-67)
7
There was one State IDOA grant open:
• Rehabilitate Charlie Ramp T-Hangar Taxilanes (III-4281)
Passenger Facility Charge CPFC)
The Authority was one of only five airports in the nation that had met the requirements for collecting PFCs by the first day of eligibility, June 1, 1992. The Authority collected $3.00 per enplaned passenger from that date until May l , 2002 when the amount increased to $4.50. As of June 30, 2015, the Authority has collected $6,760,825.51 in PFCs, earned an additional $265,337.03 in interest, and spent $6,383,443.07 on FAA-approved projects, with a remaining cash balance of $642,719.47. Further information is available on pages 104 through 106 of this rep01t.
Awards & Aclmowledgements
The Government Finance Officers Association of the United States and Canada (GFOA) award a Cettificate of Achievement for Excellence in Financial Reporting. This is the highest form of recognition for excellence in state and local government financial reporting. The Springfield Airport Authority received the Certificate of Achievement for its 2003, 2004, 2005, 2006, 2007, 2008,2009,2010,2011,2012,2013 and 2014 repotts and is submitting this report to the GFOA to determine its eligibility for a cettificate for the year ending June 30, 2015. In order to be awarded this Certificate, a governmental unit must publish an easily readable and efficiently organized Comprehensive Annual Financial Repott whose contents conform to program standards. Such a report must satisfy both generally accepted accounting principles and applicable legal requirements.
The valuable assistance ofEck, Schafer & Punke, LLP, the Authority's independent accounting firm, is acknowledged, as well as that of Jane Broeckling, Marilyn Carnduff, Traci Cline-Catter, and Nancy Hermes of the Authority's staff. Credit must also be given to the Authority's Board of Commissioners for their support for and insistence on maintaining the highest standards of professionalism in the management of the Authority's finances.
Further Information
The Authority's web site is www.flysp i.com. Questions and comments may be addressed to the Authority at: Springfield Airport Authority, 1200 Capital Airpott Drive, Springfield, IL 62707, phone 217-788-9213, fax 217-788-8056, or email at [email protected].
Michael Olinger Executive Director Director of Administration and Finance
8

9
LOCATION
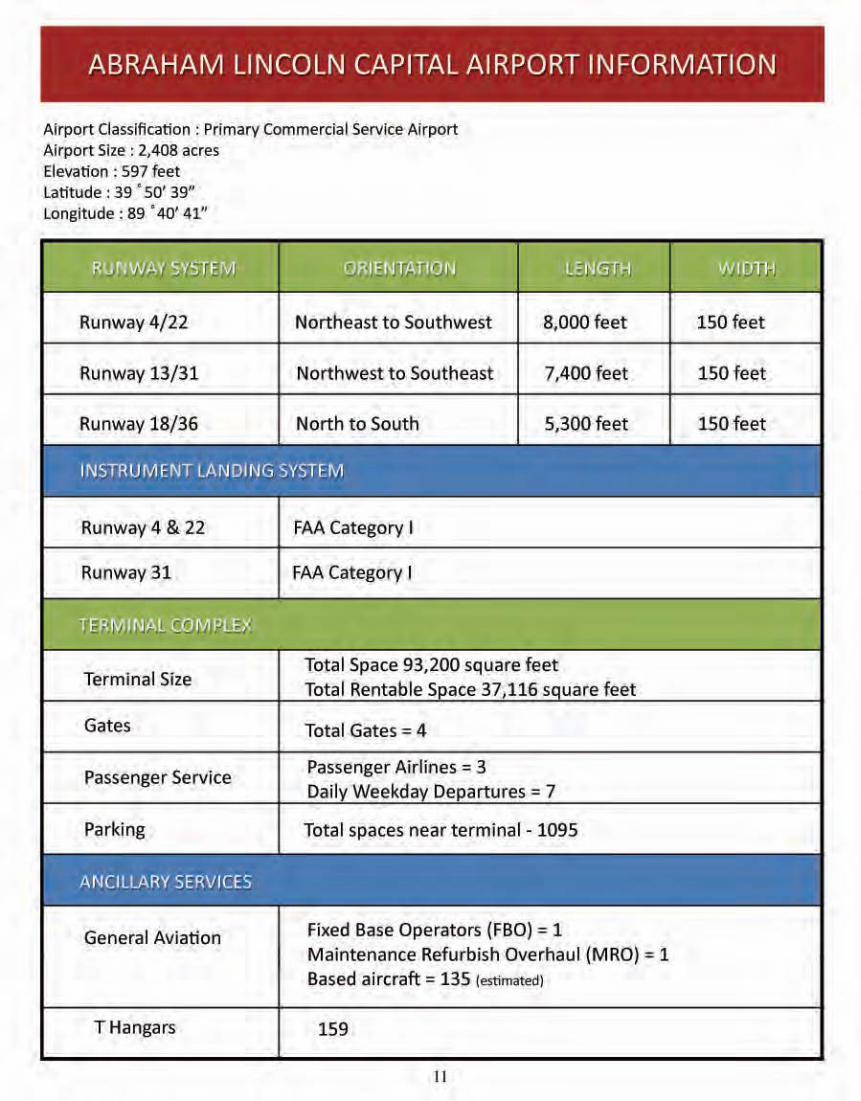
ABRAHAM LINCOLN CAPITAL AIRPORT INFORMATION
Airport Classification : Primary Commercial Service Airport Airport Size : 2,408 acres Elevation : 597 feet Latitude : 39 ' 50' 39" Longitude : 89 ' 40' 41"
Runway4/22 Northeast to Southwest 8,000 feet
Runway 13/31 Northwest to Southeast 7,400feet
Runway 18/36 North to South 5,300 feet
INSTRUMENT LANDI I\IG SYSTEM
Runway 4 & 22
Runway 31
Terminal Size
Gates
Passenger Service
Parking
ANCILLARY SERVICES
General Aviation
THangars
FAA Category I
FAA Category I
Total Space 93,200 square feet Total Rentable S ace 3h116 s uare feet
Total Gates= 4
Passenger Airlines = 3 Daily Weekday Departures = 7
Total spaces near terminal- 1095
Fixed Base Operators (FBO) = 1 Maintenance Refurbish Overhaul (MRO) = 1 Based aircraft= 135 (estimated)
159
1l
150 feet
150feet
150feet

12
Springfield Airport Authority Principal Officials
Kari Selinger Commissioner
8 Years
Mark Kinnaman Treasurer 9 years
Frank Vala Chair 13 years
Eric Hansen Commissioner
7 Years
Diartne Hardwick Commissioner
2 Years
Mark Hanna Executive Director
9 years
Herman Bodewes Vice Chair
10 years
Vince Toolen Commissioner
6 Years
Timothy Bramlet Commissioner
8 Years
R.Beverly Peters Secretary 7 Years
13
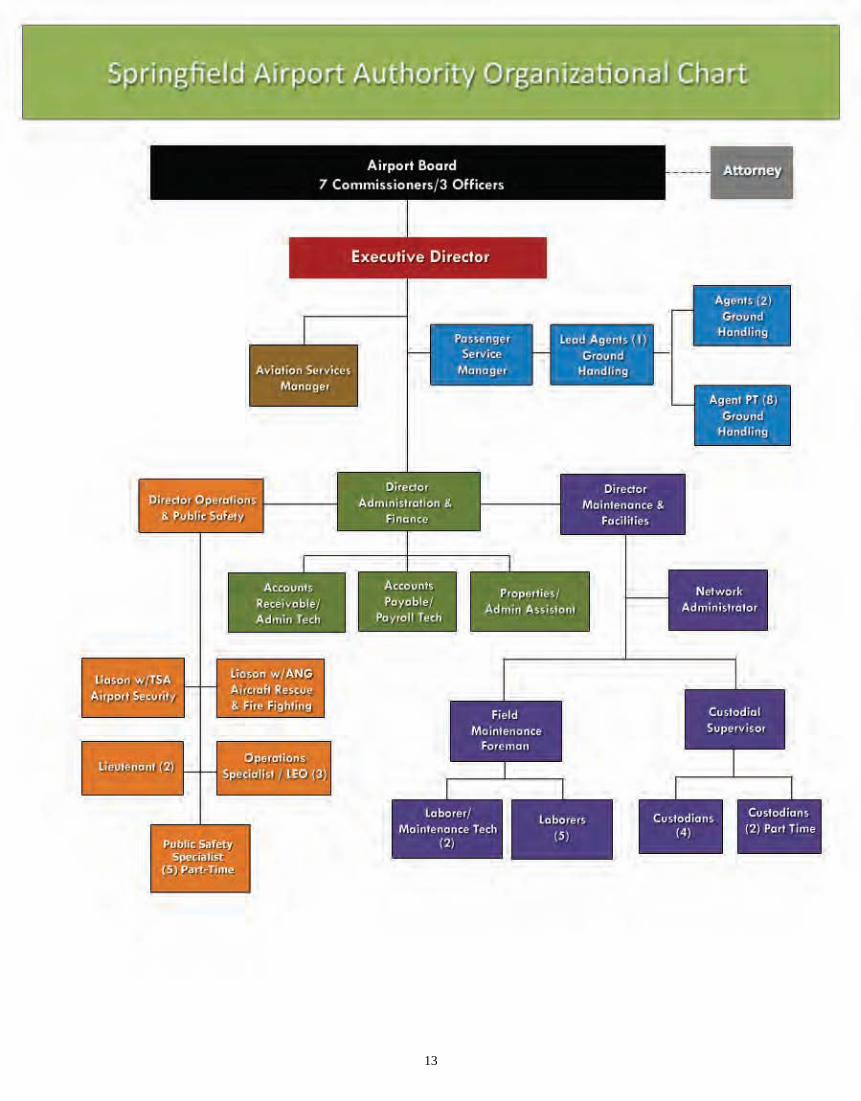
Accounts
Receivable/ Adrttin Tech
o;rector Admtnistratlon 8.
finance
Accou nts
Payable/ Payroll T•<h
Properties/ Admin Assistant
Field Ma tntenonce
Foreman
Oiredor Ma intenance &
Facilities
Network Administrator
laborer/ Maintenance Tech
(2 )
laborers (5)
Custodians (4)
Custodians (2) Part Time
14
Charters 2%
American Eagle 31%
120,000
100,000
80,000
<10,000
20,000
0
2014 Calendar Year Air Carrier Market Share
Allegiant 27%
United Express 40%
Enplaned Passenger Activity For Calendar Years 2005 - 2014
200S 2006 2007 2008 2009 2010 2011 2012 2013 20H

15
Farm 2%
FY 2015 COMPOSITION OF THE REVENUE DOLLAR
Rents & Fees 32%
Grants 36%
PFC 3%
Property Taxes 23%
Interest & Other 4%
FV 2015 COMPOSITION OF THE EXPENSE DOLLAR
Interest 4%
Depreciation 46%
Operations & Maintenance 48%
IMRF& FICA 2%

16
Government Finance Officers Association
Certificate of Achievement for Excellence
in Financial Reporting
Presented to
Springfield Airport Authority
Illinois
For its Comprehensive Annual Financial Report
for the Fiscal Year Ended
June 30, 2014
Executive Director/CEO


17
ECK, SCHAFER & PUNKE, LLP 11111 \1 rIll I
Board of Conunissioners Springfield Airport Aulhmity Springfield, Illinois
Independent Auditors' Regort
Repo1·t on the Financial Statements
We have audited the accompanying fmancial statements of Springfield Airport Auth01ity (the Authority) as of and for the year ended June 30, 201 5, and the related notes to the financial statements, which collectively comprise the Authority's basic financial statements, as listed in the table of contents.
M~magcment's RcsponsibiHty for tbc Financial Statements
Management is responsible for the preparation and fair presentation of these financial statements in accordance with accounting principles generally accepted in the United States of Arned ca; this includes the design, implementation, and maintenance of internal control relevant to the preparation and fair presentation of financial statements that are free from material misstatement, whether due to fraud or error.
Auditors' Responsibility
Our responsibility is to express an opinion on tbese fi nancial statements based on our audit. We conducted our audit in accordance with auditing standards generally accepted in the United States of .Amet·ica and the standards applicable to financial audits contained in Government Auditing Standards, issued by the Comptroller General of the United States. Those slandards require that ·we plan and perrorm· the audit to obtain reasonable assurance about whether the financial statements arc fi:ee from material misstatement.
An audit involves performing procedures to obtain audil evidence about the amounts and disclosures in the financial statements. The procedures selected depend on the auditors' judgment, including the assessment of the risks of material misstatement of the financial statements, whether due to fraud or error. In mak:i ng those risk assessments, U1e auditors consider internal control relevant to the entity's preparation and fair presentation of the financial statements in order to design audit proceduies that are appropriate in the circumstances, but not for the purpose of expressing an opinion on lhe effectiveness of ilie entity's internal control. Accordingly, we express no such opinion. An audit also includes evaluating the appropriateness of accounting policies used and the reasonableness of signjficant accounting estimates made by management, as well as evaluating the overa.JJ presentation oftl1e -financial statements.

We believe that the audit evidence we have obtained is sufficient and appropriate to provide a basis for our audit opinion. Opinion In our opinion, the financial statements referred to above present fairly, in all material respects, the financial position of Springfield Airport Authority as of June 30, 2015, and the changes in its net position and its cash flows for the year then ended in conformity with accounting principles generally accepted in the United States of America.
Other Matters Required Supplementary Information Accounting principles generally accepted in the United States of America require that Management’s Discussion and Analysis (MD&A) along with the information listed in the table of contents as Required Supplementary Information be presented to supplement the basic financial statements. Such information, although not part of the basic financial statements, is required by the Governmental Accounting Standards Board, who considers it to be an essential part of financial reporting for placing the basic financial statements in an appropriate operational, economic, or historical context. We have applied certain limited procedures to the required supplementary information in accordance with auditing standards generally accepted in the United States of America, which consisted of inquiries of management about the methods of preparing the information and comparing the information for consistency with management’s responses to our inquiries, the basic financial statements, and other knowledge we obtained during our audit of the basic financial statements. We do not express an opinion or provide any assurance on the information because the limited procedures do not provide us with sufficient evidence to express an opinion or provide any assurance. Other Information
Our audit was conducted for the purpose of forming an opinion on the financial
statements that collectively comprise the Authority’s basic financial statements. The accompanying financial information listed as “Supplemental Financial Information” in the table of contents is presented for the purposes of additional analysis and is not a required part of the basic financial statements. The accompanying financial information listed as “Schedule of Expenditures of Passenger Facility Charges” in the table of contents is presented for the purposes of additional analysis as specified in the Passenger Facility Charge Audit Guide for Public Agencies, issued by the Federal Aviation Administration, and is not a required part of the basic financial statements. The accompanying "Schedule of Expenditures of Federal Awards" is presented for purposes of additional analysis as required by U.S. Office of Management and Budget Circular A-133, Audits of States, Local Governments, and Non-Profit Organizations, and is not a required part of the basic financial statements. The information in the “Supplemental Financial Information”, “Schedule of Expenditures of Passenger Facility Charges” and "Schedule of Expenditures of Federal Awards" is the responsibility of management and was derived from and relate directly to the underlying accounting and other records used to prepare the basic financial statements. Such information has been subjected to the auditing procedures applied in the audit of the financial statements and certain additional procedures, including
18
19
comparing and reconciling such information directly to the underlying accounting and other records used to prepa~·e the basic financial statements or to the basic financial statements themselves, and other additional procedures i11 accordance with auditing standards generally accepted in the United States of America. In om opinion, the information is faitly stated in all material respects in relation to the basic financial statements as a whoJc.
The introductory section and s tatistical section listed in the foregoing table of contents have not been subjected to the auditing procedw·cs applied in the audit of the basic financial statements and, accordingly, we express no opinion or provide any assurance on them.
Other Reporting Requit·ed by Govemment Auditing Stmulal'fls
In accordance with Government Auditing Standard~, we have also issued our rcpmi dated November 5, 2015, on our consideration of the Authority's intomal control over financial teporting and on our tests of its compl ianoc with certain provisions of Jaws, regulations, contracts, and grant agreements and other matters. The purpose of that report is to describe the scope of our testing of jnternal control over financial reporting and compliance and the results of that testing, and not to provide an opinion on internal control over financial reporting or on compliance. That report is an integral parl of an audit performed in accordance with Government .Auditing Standards in considering the Authority's internal control over financial reporting and compliance.
Sptjngfield, Illinois November 5, 201 5

THIS PAGE INTENTIONALLY LEFT BLANK

SPRINGFIELD AIRPORT AUTHORITY
MANAGEMENT’S DISCUSSION AND ANALYSIS
JUNE 30, 2015 This discussion and analysis is designed to (1) assist the reader in focusing on significant financial issues, (2) provide an overview of the Authority’s financial activity, (3) identify changes in the Authority’s financial position (its ability to address the next and subsequent year challenges), and (4) identify any material deviations from the financial plan (the approved budget). Within this Financial Section, following the MD&A, are the basic financial statements that include the Balance Sheet; Statement of Revenues, Expenses and Changes In Net Position; and Statement of Cash Flows. The basic financial statements are followed by the Notes to Financial Statements that are an integral part of and complement the basic financial statements with further detailed documentation to enhance the readers’ understanding of the financial statements. In addition to the basic financial statements, the report also contains Required Supplementary Information, Supplemental Financial Information, an Introductory Section, a Statistical Section that is useful in understanding the overall operations of the Airport, a section on Passenger Facility Charges (PFCs), and a section on the Single Audit. The Authority’s basic financial statements are prepared using proprietary fund (enterprise fund) accounting that uses the same basis of accounting as private-sector business enterprises. Under this method of accounting an accrual basis of accounting is used. Revenue is recorded when earned and expenses are recorded when incurred. The proprietary fund is divided into the following sub-funds: Operations & Maintenance, Capital Improvement, Clear Zone, 1986 Revenue Bonds, 1988 Revenue Bonds, Property & Equipment, IMRF & FICA, Capital Improvement Project Reserve, Workers’ Compensation & Post Employment Benefits Compliance, Passenger Facility Charges #2, Passenger Facility Charges #3, Passenger Facility Charges #4, Passenger Facility Charges #6, Passenger Facility Charges #7, Southeast Quadrant T-Hangars, Property Taxes and 2011 G.O. Bonds-Bonds. Government-wide financial statements are designed to provide readers with a broad overview of the Authority’s finances in a manner similar to a private-sector business. The Authority’s presentation of its financial statements are, in and of themselves, government-wide. Not only is the Authority a legally separate and single entity, it accounts for itself, as indicated, using a single Proprietary Fund, specifically called an Enterprise Fund. An Enterprise Fund is required by generally accepted accounting principles when it is the government’s policy to establish fees and/or charges designed to recover the cost of providing services, similar to the practices of a business activity.
20
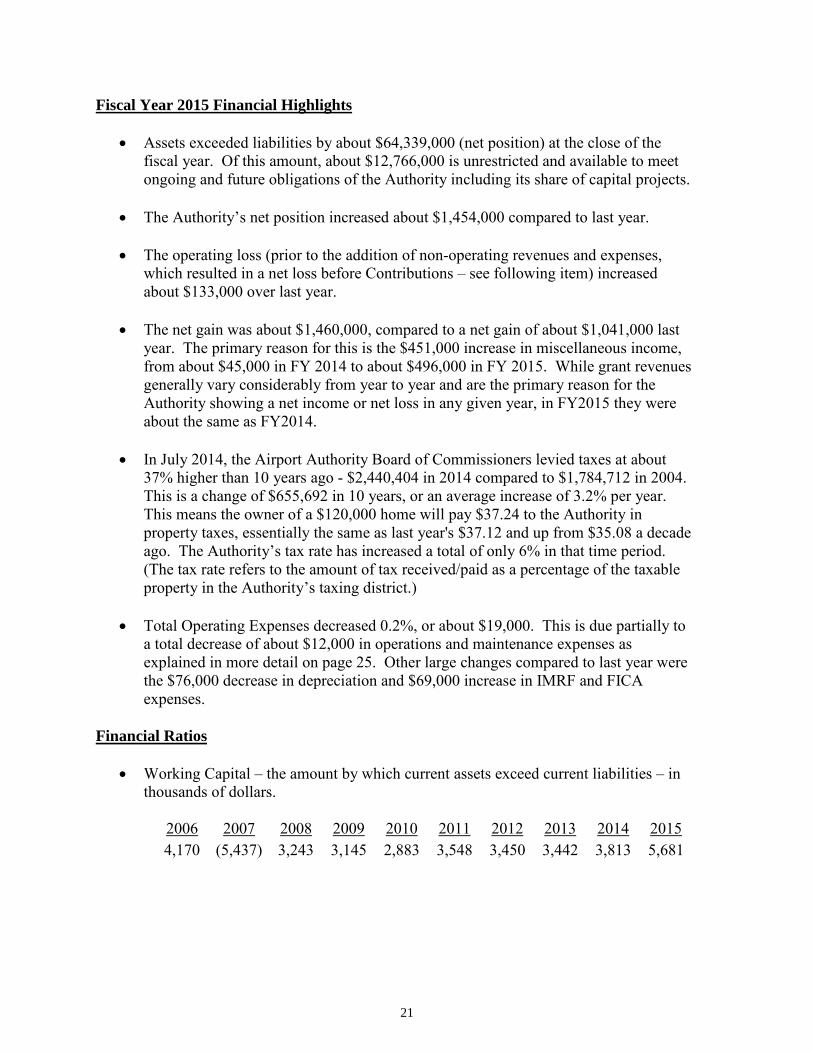
Fiscal Year 2015 Financial Highlights
• Assets exceeded liabilities by about $64,339,000 (net position) at the close of the fiscal year. Of this amount, about $12,766,000 is unrestricted and available to meet ongoing and future obligations of the Authority including its share of capital projects.
• The Authority’s net position increased about $1,454,000 compared to last year.
• The operating loss (prior to the addition of non-operating revenues and expenses,
which resulted in a net loss before Contributions – see following item) increased about $133,000 over last year.
• The net gain was about $1,460,000, compared to a net gain of about $1,041,000 last
year. The primary reason for this is the $451,000 increase in miscellaneous income, from about $45,000 in FY 2014 to about $496,000 in FY 2015. While grant revenues generally vary considerably from year to year and are the primary reason for the Authority showing a net income or net loss in any given year, in FY2015 they were about the same as FY2014.
• In July 2014, the Airport Authority Board of Commissioners levied taxes at about
37% higher than 10 years ago - $2,440,404 in 2014 compared to $1,784,712 in 2004. This is a change of $655,692 in 10 years, or an average increase of 3.2% per year. This means the owner of a $120,000 home will pay $37.24 to the Authority in property taxes, essentially the same as last year's $37.12 and up from $35.08 a decade ago. The Authority’s tax rate has increased a total of only 6% in that time period. (The tax rate refers to the amount of tax received/paid as a percentage of the taxable property in the Authority’s taxing district.)
• Total Operating Expenses decreased 0.2%, or about $19,000. This is due partially to
a total decrease of about $12,000 in operations and maintenance expenses as explained in more detail on page 25. Other large changes compared to last year were the $76,000 decrease in depreciation and $69,000 increase in IMRF and FICA expenses.
Financial Ratios
• Working Capital – the amount by which current assets exceed current liabilities – in thousands of dollars.
2006 2007 2008 2009 2010 2011 2012 2013 2014 2015 4,170 (5,437) 3,243 3,145 2,883 3,548 3,450 3,442 3,813 5,681
21

• Current Ratio – current assets divided by current liabilities – measures the ability to pay current obligations.
2006 2007 2008 2009 2010 2011 2012 2013 2014 2015 4.6
times 0.5
times 3.3
times 4.6
times 1.6
times 1.9
times 2.8
times 4.1
times 3.9
times 5.8
times
• Days Sales Outstanding – accounts receivable divided by total daily rent and fee income (annual rent and fee revenue divided by 360) – this measures the Authority’s ability to collect accounts receivable within a timely period – in days.
2006 2007 2008 2009 2010 2011 2012 2013 2014 2015 21.9 22.2 28.2 28.8 35.2 84.1 58.0 42.5 32.2 17.0
• Debt Ratio – total liabilities divided by total assets. This ratio measures the
proportion of total assets provided by a company’s creditors.
2006 2007 2008 2009 2010 2011 2012 2013 2014 2015 .31 .31 .22 .19 .23 .23 .22 .20 .20 .22
• Debt to Equity Ratio – long-term debt divided by total equity (total net position) -
measures the percentage of debt tied up in equity.
• Total Asset Turnover – sales (total rent and fee income) divided by total assets. This
is a measure of how efficiently and effectively the Authority uses its assets to generate rent and fee income.
2006 2007 2008 2009 2010 2011 2012 2013 2014 2015 .06 .09 .07 .05 .04 .04 .06 .05 .05 .04
Most of the ratios have remained fairly stable over the years. This year both Working Capital and Current Ratio had a large favorable increase. Days Sales Outstanding also showed a large favorable decrease, and the ratio is now lower than any of the last ten years, primarily due to no tenant owing a large amount at the end of FY 2015, unlike at the end of many recent years. The other three ratios are similar to last year. Fiscal Year 2015 Financial Impacts The Authority’s revenues and expenses are impacted by the following seven factors:
2006 2007 2008 2009 2010 2011 2012 2013 2014 2015 .42 .25 .24 .21 .21 .23 .24 .23 .22 .25
22

Revenues
• Economic Condition – the national, state and local economies affect the taxing district’s assessed valuation (the value of all taxable real estate) which affects the Authority’s tax rate. State of Illinois Replacement Taxes received are a direct result of the business climate in the state, the amount of airline travel is dependent on the state of the economy, and almost all of the Authority’s tenants are affected to some degree by the economy which influences the amount of space able to be rented, the number of tenant bankruptcies and the ability of the tenants to make timely lease payments, all of which affect the Authority’s revenues.
• Rental Rates – the amount of space available to be leased by the Authority is fairly
constant, but essentially all rental rates have been increased in recent years at least by the same percentage as the increase in the CPI, and some by higher percentages.
• Changing Patterns In Grant Revenues – grant revenues fluctuate from year to year
depending on the appropriation level from the U.S. Congress and the Illinois State Legislature.
• Market Impacts on Investment Income – the Authority has had between about $2
million to $4 million invested at any one time during the last few years. Market conditions affect the interest rate the Authority earns.
Expenses
• New Programs – the introduction and deletion of initiatives affects the Authority’s ability to balance its budget since most new programs do not result in an accompanying increase in revenues.
• Number of Employees – over the last few years the number of employees has
fluctuated from the low 30’s to the high 40’s, with the number at 35 full-time, 14 part-time and 4 temporary employee at June 30, 2015. The number changes due to the addition or deletion of programs and projects, such as operation of the restaurant/snack bar, providing ground handling services, and subcontracting of firefighting services.
• Inflation – inflation is increasing at below the historically typical rate (an increase of
0.1% for fiscal year ending June 30, 2015 and a combined total increase of 9.5% for the five years ending at the same time). Depending on the level of capital projects in a given year, the Authority purchases about $5 to $6 million annually in equipment, materials, supplies and personnel resources, all of which are subject to inflation.
23
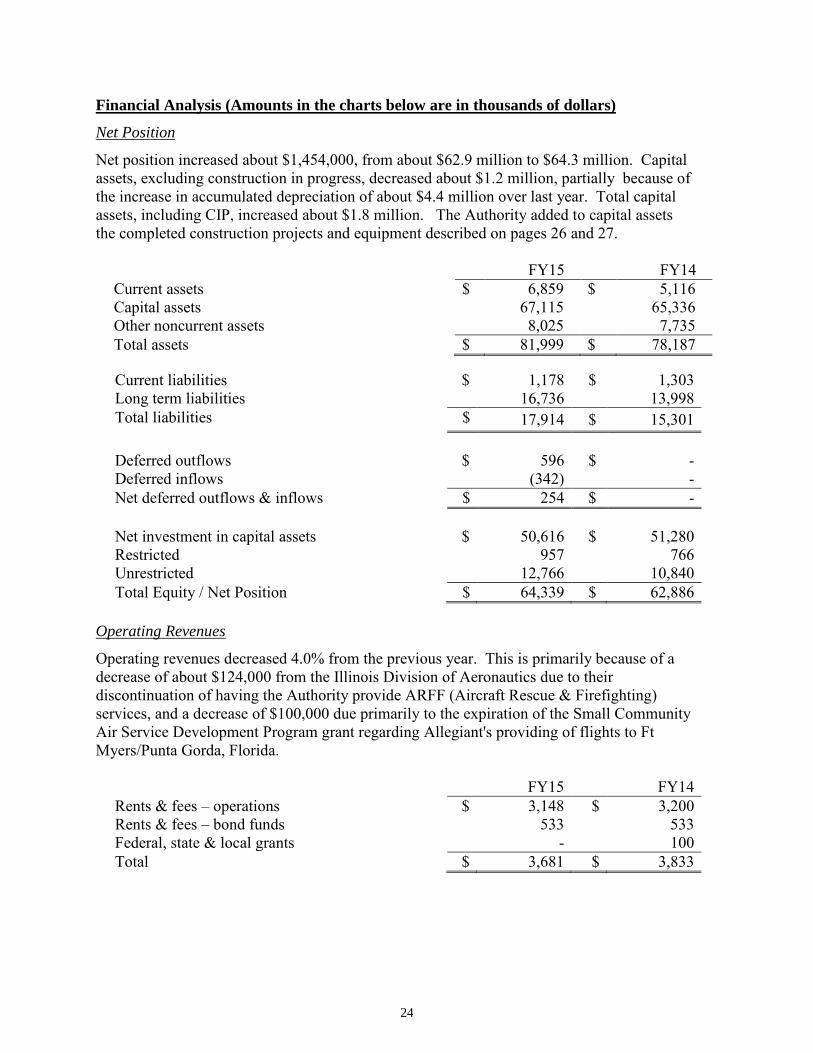
Financial Analysis (Amounts in the charts below are in thousands of dollars)
Net Position
Net position increased about $1,454,000, from about $62.9 million to $64.3 million. Capital assets, excluding construction in progress, decreased about $1.2 million, partially because of the increase in accumulated depreciation of about $4.4 million over last year. Total capital assets, including CIP, increased about $1.8 million. The Authority added to capital assets the completed construction projects and equipment described on pages 26 and 27. FY15 FY14
Current assets $ 6,859 $ 5,116 Capital assets 67,115 65,336 Other noncurrent assets 8,025 7,735 Total assets $ 81,999 $ 78,187
Current liabilities $ 1,178 $ 1,303 Long term liabilities 16,736 13,998 Total liabilities $ 17,914 $ 15,301 Deferred outflows
$
596
$
-
Deferred inflows (342) - Net deferred outflows & inflows $ 254 $ - Net investment in capital assets $ 50,616 $ 51,280 Restricted 957 766 Unrestricted 12,766 10,840 Total Equity / Net Position $ 64,339 $ 62,886
Operating Revenues
Operating revenues decreased 4.0% from the previous year. This is primarily because of a decrease of about $124,000 from the Illinois Division of Aeronautics due to their discontinuation of having the Authority provide ARFF (Aircraft Rescue & Firefighting) services, and a decrease of $100,000 due primarily to the expiration of the Small Community Air Service Development Program grant regarding Allegiant's providing of flights to Ft Myers/Punta Gorda, Florida.
FY15 FY14 Rents & fees – operations $ 3,148 $ 3,200 Rents & fees – bond funds 533 533 Federal, state & local grants - 100 Total $ 3,681 $ 3,833
24
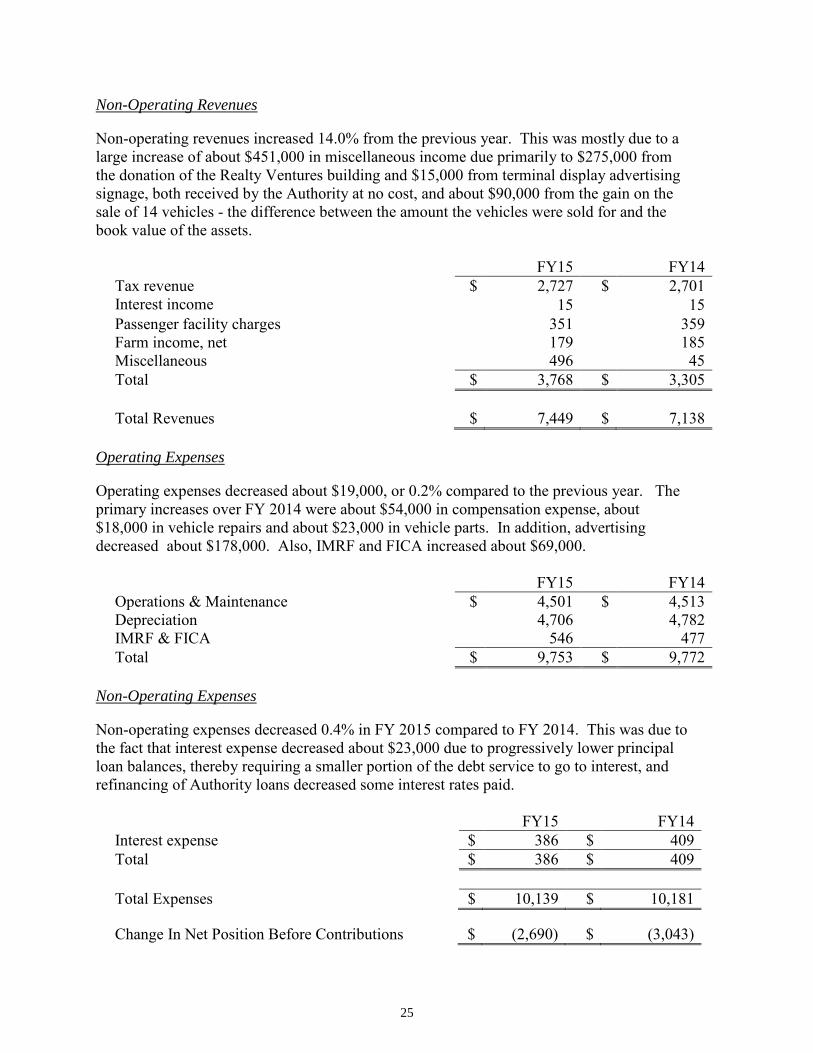
Non-Operating Revenues Non-operating revenues increased 14.0% from the previous year. This was mostly due to a large increase of about $451,000 in miscellaneous income due primarily to $275,000 from the donation of the Realty Ventures building and $15,000 from terminal display advertising signage, both received by the Authority at no cost, and about $90,000 from the gain on the sale of 14 vehicles - the difference between the amount the vehicles were sold for and the book value of the assets.
FY15 FY14 Tax revenue $ 2,727 $ 2,701 Interest income 15 15 Passenger facility charges 351 359 Farm income, net 179 185 Miscellaneous 496 45 Total $ 3,768 $ 3,305 Total Revenues $ 7,449 $ 7,138
Operating Expenses Operating expenses decreased about $19,000, or 0.2% compared to the previous year. The primary increases over FY 2014 were about $54,000 in compensation expense, about $18,000 in vehicle repairs and about $23,000 in vehicle parts. In addition, advertising decreased about $178,000. Also, IMRF and FICA increased about $69,000.
FY15 FY14 Operations & Maintenance $ 4,501 $ 4,513 Depreciation 4,706 4,782 IMRF & FICA 546 477 Total $ 9,753 $ 9,772
Non-Operating Expenses Non-operating expenses decreased 0.4% in FY 2015 compared to FY 2014. This was due to the fact that interest expense decreased about $23,000 due to progressively lower principal loan balances, thereby requiring a smaller portion of the debt service to go to interest, and refinancing of Authority loans decreased some interest rates paid.
FY15 FY14 Interest expense $ 386 $ 409 Total $ 386 $ 409 Total Expenses $ 10,139 $ 10,181
Change In Net Position Before Contributions $ (2,690) $ (3,043)
25
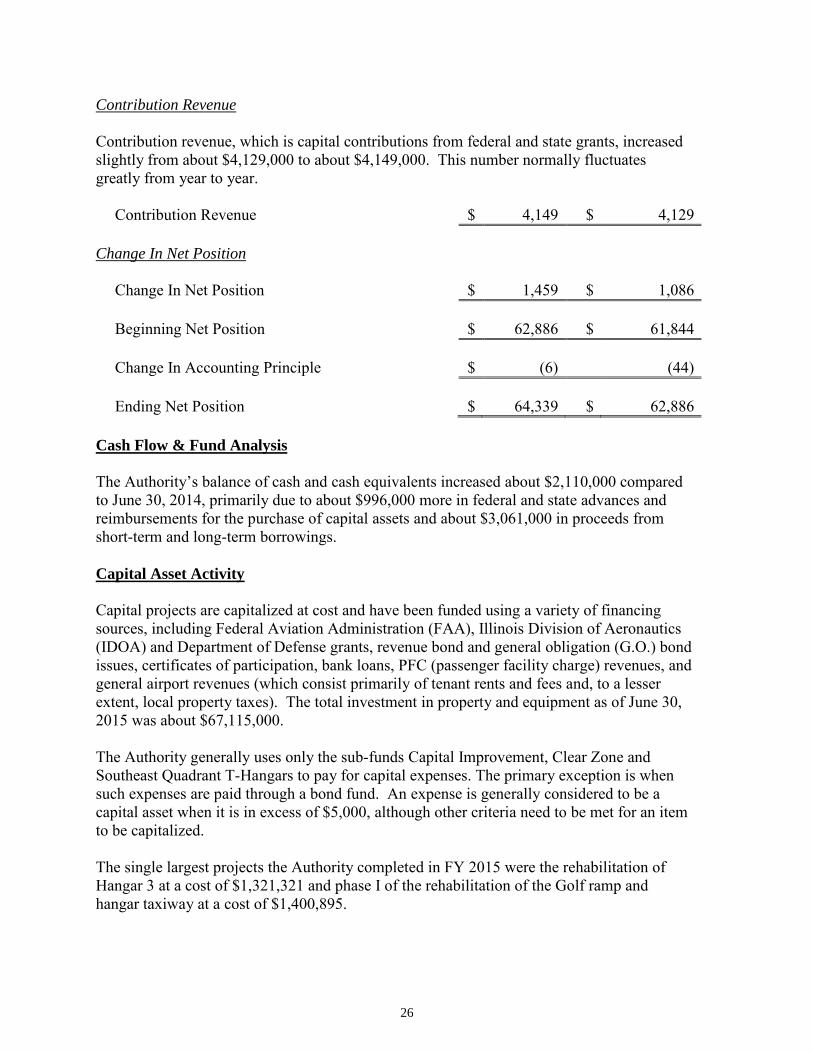
Contribution Revenue Contribution revenue, which is capital contributions from federal and state grants, increased slightly from about $4,129,000 to about $4,149,000. This number normally fluctuates greatly from year to year.
Contribution Revenue $ 4,149 $ 4,129
Change In Net Position
Change In Net Position $ 1,459 $ 1,086 Beginning Net Position $ 62,886 $ 61,844 Change In Accounting Principle $ (6) (44) Ending Net Position $ 64,339 $ 62,886
Cash Flow & Fund Analysis The Authority’s balance of cash and cash equivalents increased about $2,110,000 compared to June 30, 2014, primarily due to about $996,000 more in federal and state advances and reimbursements for the purchase of capital assets and about $3,061,000 in proceeds from short-term and long-term borrowings. Capital Asset Activity Capital projects are capitalized at cost and have been funded using a variety of financing sources, including Federal Aviation Administration (FAA), Illinois Division of Aeronautics (IDOA) and Department of Defense grants, revenue bond and general obligation (G.O.) bond issues, certificates of participation, bank loans, PFC (passenger facility charge) revenues, and general airport revenues (which consist primarily of tenant rents and fees and, to a lesser extent, local property taxes). The total investment in property and equipment as of June 30, 2015 was about $67,115,000. The Authority generally uses only the sub-funds Capital Improvement, Clear Zone and Southeast Quadrant T-Hangars to pay for capital expenses. The primary exception is when such expenses are paid through a bond fund. An expense is generally considered to be a capital asset when it is in excess of $5,000, although other criteria need to be met for an item to be capitalized. The single largest projects the Authority completed in FY 2015 were the rehabilitation of Hangar 3 at a cost of $1,321,321 and phase I of the rehabilitation of the Golf ramp and hangar taxiway at a cost of $1,400,895.
26
The larger equipment acquired in FY2015 were a Kubota mower at a cost of $42,908, three tugs for $64,000, a Ford Expedition at a cost of $35,583, a Chevrolet Tahoe for $41,011, and a 72 inch front mower with attachments at a cost of $29,191. Other projects were the rehabilitation of Hangars 4 and 5 at a cost of $79,634, the overlay and expansion of the parking lot adjacent to the facility leased by the U of I Extension at a cost of $152,796, and the recording of a value for the Realty Ventures Building of $275,000. More detailed information on capital asset activity is available in Note 4 to the Financial Statements starting on page 40. Changes In Fund Net Position A review of the changes in fund balances (net position) on pages 65, 66 and 68 indicates the following large changes: a decrease of about $1,193,000 in Operations & Maintenance due primarily to a transfer from Capital Improvement of the $1,300,000 loan payable balance on the Hangar 3 Rehabilitation project; an increase of about $2,772,000 in Capital Improvement due primarily to about $4,149,000 in grant revenue; a decrease of about $1,173,000 in Property & Equipment primarily because of only about $3,443,000 in capital assets transferred from other subfunds, less about $4,706,000 in depreciation; an increase of about $207,000 in the Southeast Quadrant T-Hangars and an increase in PFC #6 of about $310,000. Long-Term Debt Activity
The outstanding long-term debt of the Authority at June 30, 2015 was about $16,499,000, an increase from FY 2014 of about 2,443,000. This is due primarily to issuing additional debt - the last two items shown below. The Authority’s long term debt consists of the following: $4,254,000 1986 Revenue Bonds – 30 year bonds – this and the following amount are
obligations of Garrett Aviation, now known as StandardAero. $4,400,000 1988 Revenue Bonds – 30 year bonds – this and the preceding amount are
obligations of Garrett Aviation, now known as StandardAero. $1,531,880 2011 G.O. Bonds – 10 year bonds – issued in October 2011 primarily for
energy efficiency and conservation measures, specifically energy recovery systems, HVAC modifications and replacements, insulation, automated and computerized energy control systems, replacement and modification of lighting fixtures, and caulking and weather stripping. Also acquired was a deicing truck.
$2,999,246 Note Payable – for Southeast Quadrant T-Hangars-Rows G-N (financed by
tenant lease payments) – this and the following payable are for the same aircraft hangars but were financed at different financial institutions.
27

$ 427,616 Note Payable – for Southeast Quadrant T-Hangars-Rows G-N (financed by tenant lease payments) – this and the preceding payable are for the same aircraft hangars but were financed at different financial institutions.
$1,285,870 Note Payable – for the project to rehabilitate and upgrade Hangar 3.
$1,500,000 Note Payable – for the project to upgrade security and fire alarm systems - short term loan until grant revenue is received. $ 100,000 Note Payable – interest-free loan from fuel vendor. As indicated previously in the section on Financial Ratios, the Authority’s debt ratio has decreased over the last ten years from .31 in FY 2006 to .22 in FY 2015. Likewise, the debt to equity ratio has decreased from .42 in FY 2006 to .25 in FY 2015. The Authority’s line of credit was paid off in 1999 by using a portion of the proceeds of the 1999 G.O. Bonds, which was subsequently refunded by the 2002 G.O. Bonds. The available line of credit with Illini Bank expired in January 2002 and the Authority has seen no reason to reinstate a line since then. Additional information on the Authority’s debt can be found in Note 5 of this report starting on page 42. Request For Additional Information This financial report has been prepared to provide the residents of the Springfield Airport Authority’s taxing district, tenants, vendors, investors and creditors with a general overview of the Authority’s finances and to demonstrate the Authority’s accountability for the money it receives. Questions concerning this report or requests for additional financial information should be directed to: Mike Olinger, Director of Administration and Finance, Springfield Airport Authority, 1200 Capital Airport Drive, Springfield, Illinois 62707.
28

THIS PAGE INTENTIONALLY LEFT BLANK

BASIC FINANCIAL STATEMENTS
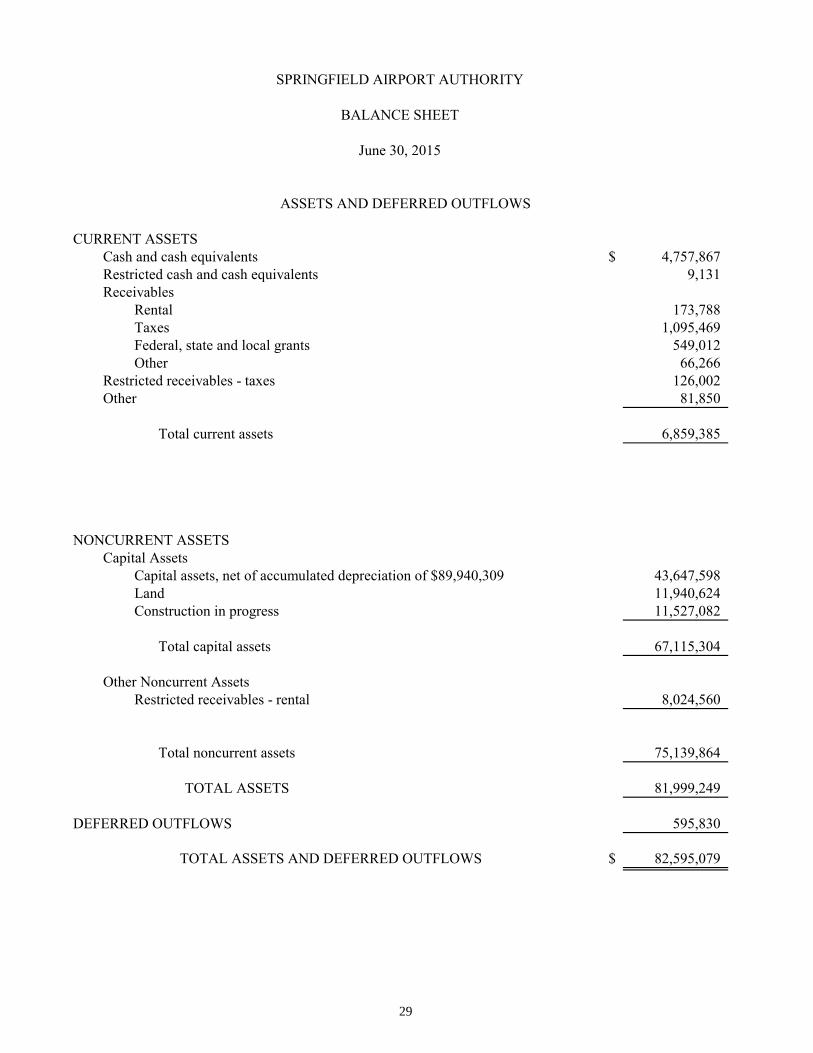
CURRENT ASSETSCash and cash equivalents $ 4,757,867 Restricted cash and cash equivalents 9,131 Receivables
Rental 173,788 Taxes 1,095,469 Federal, state and local grants 549,012 Other 66,266
Restricted receivables - taxes 126,002 Other 81,850
Total current assets 6,859,385
NONCURRENT ASSETSCapital Assets
Capital assets, net of accumulated depreciation of $89,940,309 43,647,598 Land 11,940,624 Construction in progress 11,527,082
Total capital assets 67,115,304
Other Noncurrent AssetsRestricted receivables - rental 8,024,560
Total noncurrent assets 75,139,864
TOTAL ASSETS 81,999,249
DEFERRED OUTFLOWS 595,830
TOTAL ASSETS AND DEFERRED OUTFLOWS $ 82,595,079
ASSETS AND DEFERRED OUTFLOWS
June 30, 2015
SPRINGFIELD AIRPORT AUTHORITY
BALANCE SHEET
29
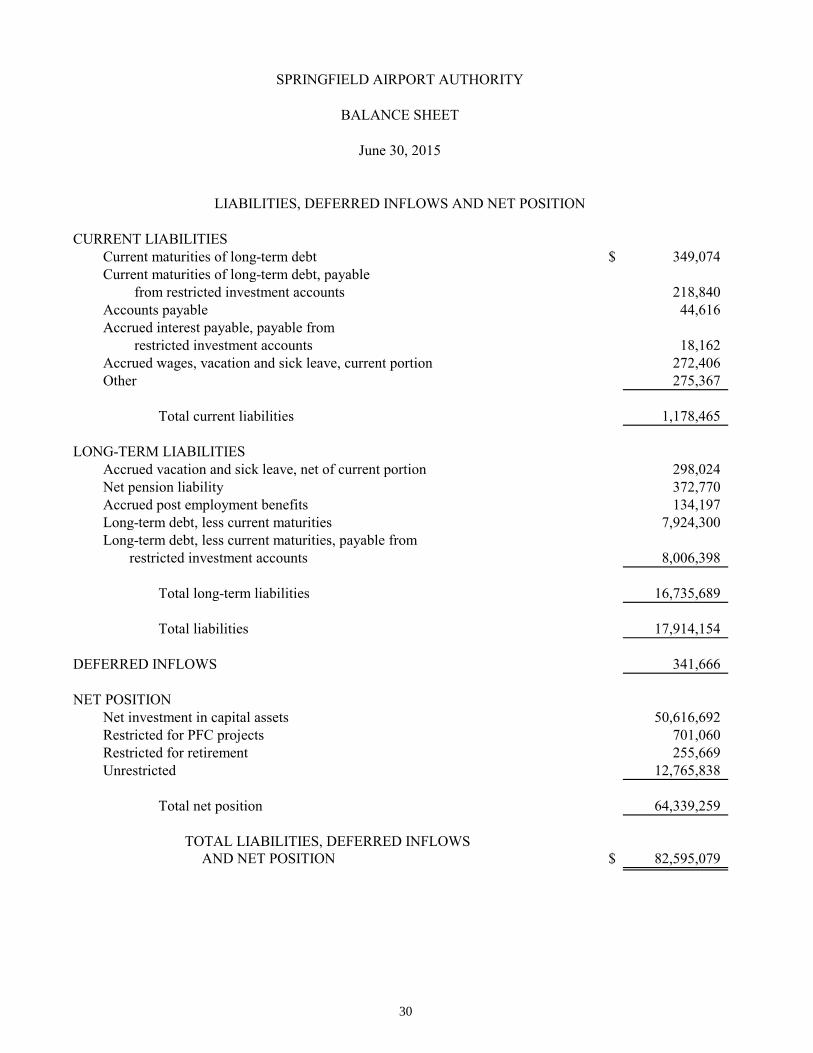
CURRENT LIABILITIESCurrent maturities of long-term debt $ 349,074 Current maturities of long-term debt, payable
from restricted investment accounts 218,840 Accounts payable 44,616 Accrued interest payable, payable from
restricted investment accounts 18,162 Accrued wages, vacation and sick leave, current portion 272,406 Other 275,367
Total current liabilities 1,178,465
LONG-TERM LIABILITIESAccrued vacation and sick leave, net of current portion 298,024 Net pension liability 372,770 Accrued post employment benefits 134,197 Long-term debt, less current maturities 7,924,300 Long-term debt, less current maturities, payable from
restricted investment accounts 8,006,398
Total long-term liabilities 16,735,689
Total liabilities 17,914,154
DEFERRED INFLOWS 341,666
NET POSITIONNet investment in capital assets 50,616,692 Restricted for PFC projects 701,060 Restricted for retirement 255,669 Unrestricted 12,765,838
Total net position 64,339,259
TOTAL LIABILITIES, DEFERRED INFLOWS AND NET POSITION $ 82,595,079
LIABILITIES, DEFERRED INFLOWS AND NET POSITION
SPRINGFIELD AIRPORT AUTHORITY
BALANCE SHEET
June 30, 2015
30
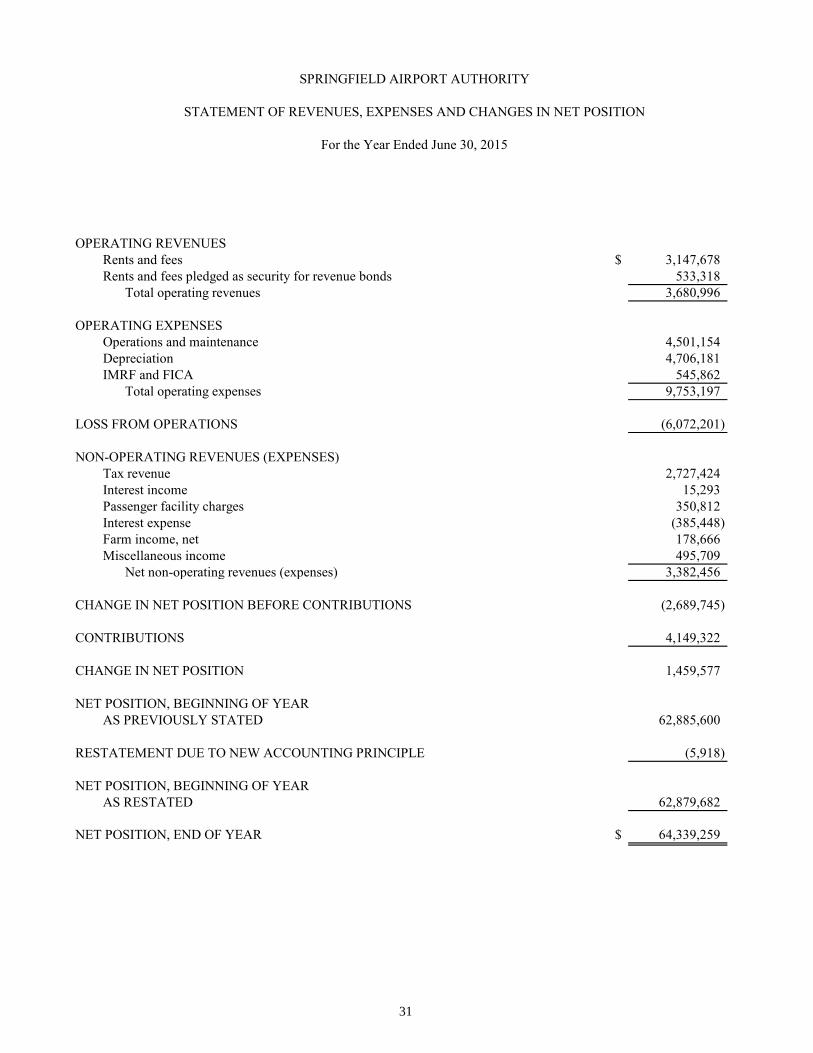
OPERATING REVENUESRents and fees $ 3,147,678 Rents and fees pledged as security for revenue bonds 533,318
Total operating revenues 3,680,996
OPERATING EXPENSESOperations and maintenance 4,501,154 Depreciation 4,706,181 IMRF and FICA 545,862
Total operating expenses 9,753,197
LOSS FROM OPERATIONS (6,072,201)
NON-OPERATING REVENUES (EXPENSES)Tax revenue 2,727,424 Interest income 15,293 Passenger facility charges 350,812 Interest expense (385,448) Farm income, net 178,666 Miscellaneous income 495,709
Net non-operating revenues (expenses) 3,382,456
CHANGE IN NET POSITION BEFORE CONTRIBUTIONS (2,689,745)
CONTRIBUTIONS 4,149,322
CHANGE IN NET POSITION 1,459,577
NET POSITION, BEGINNING OF YEARAS PREVIOUSLY STATED 62,885,600
RESTATEMENT DUE TO NEW ACCOUNTING PRINCIPLE (5,918)
NET POSITION, BEGINNING OF YEARAS RESTATED 62,879,682
NET POSITION, END OF YEAR $ 64,339,259
For the Year Ended June 30, 2015
SPRINGFIELD AIRPORT AUTHORITY
STATEMENT OF REVENUES, EXPENSES AND CHANGES IN NET POSITION
31

CASH FLOWS FROM OPERATING ACTIVITIESCash received from customers and users $ 4,050,769 Payments to suppliers (2,084,802) Payments to employees (2,829,067)
Net cash from operating activities (863,100)
CASH FLOWS FROM INVESTING ACTIVITIESInterest income 18,154 Proceeds from maturity of certificate of deposit 125,000
Net cash from investing activities 143,154
CASH FLOWS FROM NONCAPITAL FINANCING ACTIVITIESProceeds from taxes 1,997,596 Proceeds from farm income 178,666
Net cash from noncapital financing activities 2,176,262
CASH FLOWS FROM CAPITAL AND RELATED FINANCING ACTIVITIESCash paid for capital assets and construction in progress (4,472,580) Federal and state advances and reimbursements for the purchase of capital assets 2,007,058 Passenger facility charges receipts 350,050 Proceeds from short-term and long-term borrowings 3,061,216 Principal payments on short-term and long-term borrowings (618,163) Interest on borrowings (384,725) Proceeds from taxes 710,956
Net cash from capital and related financing activities 653,812
CHANGE IN CASH AND CASH EQUIVALENTS 2,110,128
CASH AND CASH EQUIVALENTS, BEGINNING OF YEAR 2,656,870
CASH AND CASH EQUIVALENTS, END OF YEAR $ 4,766,998
For the Year Ended June 30, 2015
SPRINGFIELD AIRPORT AUTHORITY
STATEMENT OF CASH FLOWS
32

CASH AND CASH EQUIVALENTS CONSIST OF THE FOLLOWING:
Cash and cash equivalents $ 4,757,867 Restricted cash and cash equivalents 9,131
Cash and cash equivalents, end of year $ 4,766,998
NON CASH TRANSACTIONS
Federal and state portion of capital assets recorded as contribution revenue $ 2,142,264
RECONCILIATION OF OPERATING LOSS TO NET CASH FROM OPERATING ACTIVITIES
Loss from operations $ (6,072,201) Adjustments to reconcile operating loss to net cash from operating activities:
Depreciation 4,706,181 Proceeds from miscellaneous non-operating activities 405,859 Changes in certain assets and liabilities:(Increase) decrease in: Receivables - rental 157,837
Receivables - federal, state and local grants 95,267 Receivables - restricted accounts (289,190) Other current assets 5,336
Increase (decrease) in:Accounts payable and accrued liabilities (7,267) Net pension liability 366,852 Net deferred outflows (254,164) Other liabilities 22,390
Net cash from operating activities $ (863,100)
For the Year Ended June 30, 2015
SPRINGFIELD AIRPORT AUTHORITY
STATEMENT OF CASH FLOWS - Continued
33

SPRINGFIELD AIRPORT AUTHORITY NOTES TO FINANCIAL STATEMENTS June 30, 2015 1. SUMMARY OF SIGNIFICANT ACCOUNTING POLICIES The Springfield Airport Authority (the Authority) is a body corporate and politic
established by the Illinois Compiled Statutes. The Authority’s board is jointly appointed by the City of Springfield and the Sangamon County Board. In accordance with the criteria established in the Governmental Accounting Standards Board (GASB) Statement No. 14, The Financial Reporting Entity, the Authority is not under control of a primary government. The Authority is legally separate and fiscally independent.
The Authority’s governing body is appointed through other units of local government.
Four commissioners are appointed by the Mayor of the City of Springfield and three are appointed by the Chairman of the Sangamon County Board. Therefore, even though the Authority is legally separate and fiscally independent, it is a related organization of the City of Springfield and Sangamon County.
The Authority applies all GASB pronouncements and has elected to apply only the
pronouncements issued on or before November 30, 1989 for the following: Statements and Interpretations of the Financial Accounting Standards Board (FASB), Accounting Principles Board (APB) Opinions, and Accounting Research Bulletins (ARBs) of the Committee on Accounting Procedure.
The Authority has established accounting policies which conform to accounting
principles generally accepted in the United States of America, as applicable to governmental units (hereinafter referred to as generally accepted accounting principles (GAAP)). The operations of the Authority constitute a proprietary fund type and are accounted for with a set of self-balancing accounts that comprise its assets, liabilities, net position, revenues, and expenses.
(a) Fund Accounting The Authority uses funds to report on its financial position and the results of its
operations. Fund accounting is designed to demonstrate legal compliance and to aid financial management by segregating transactions related to certain government functions or activities. A fund is a separate accounting entity with a self-balancing set of accounts. Proprietary funds are used to account for activities similar to those found in the private sector, where the determination of net income is necessary or useful to sound financial administration. The Authority is reported as an enterprise fund.
34

SPRINGFIELD AIRPORT AUTHORITY NOTES TO FINANCIAL STATEMENTS - CONTINUED June 30, 2015
1. SUMMARY OF SIGNIFICANT ACCOUNTING POLICIES - Continued
(b) Basis of Accounting (1) The accounts are maintained, and the financial statements have been prepared,
on the accrual basis of accounting. (2) Property and equipment is stated at cost, including amounts contributed by
Federal and State agencies. The Authority records all capital items, which are individually greater than $ 5,000, with a useful life of greater than one year, as capital assets.
(3) Depreciation is computed on the straight-line basis over estimated useful lives
of ten to forty years for land and building improvements, runways, and roadways and three to ten years for equipment.
(4) Operating revenues include estimates of certain unbilled rents and fees which,
under the terms of the lease agreements, are computed at a percentage of the lease income in excess of prescribed minimum amounts. Operating revenues and expenses generally result from providing services in connection with ongoing operations.
(5) Non-operating revenues from property taxes and certain other sources and the
related receivables at year-end are recorded on the accrual basis when such revenues become measurable. Non-operating revenues and expenses include any revenues and expenses not included in operating revenues and expenses.
(6) The Authority rents hangars, buildings and office space to tenants under
operating leases that expire over the next 1 to 17 years.
(7) The Authority considers all highly liquid investments with a maturity of three months or less when purchased to be “cash equivalents.”
35

SPRINGFIELD AIRPORT AUTHORITY NOTES TO FINANCIAL STATEMENTS - CONTINUED June 30, 2015
1. SUMMARY OF SIGNIFICANT ACCOUNTING POLICIES - Continued (c) Restricted Investment Accounts The restricted investment accounts consist of the assets and liabilities of the accounts
required by the various bond ordinances that are restricted for specific uses and are segregated on the financial statements.
(d) Deferred Outflows/Inflows of Resources
In addition to assets, the balance sheet reports a separate section for deferred outflows of resources. This separate financial statement element, deferred outflows, represents a consumption of net position that applies to future periods and will not be recognized as an outflow of resources until that time. The Airport’s deferred outflows relate to deferred amounts to be recognized in pension expenses in future periods. This amount will be recognized over the next four years. In addition to liabilities, the balance sheet reports a separate section for deferred inflows of resources. This separate financial statement element, deferred inflows, represents an acquisition of net position that applied to future periods and will not be recognized as an inflow of resources until that time. The Airport’s deferred inflows relate to deferred amounts to be recognized as reductions in pension expense in future periods. This amount will be recognized over the next four years.
(e) Compensated Absences The Authority accrues amounts for vested or accumulated vacation and vested sick
leave based on years of service and in accordance with various labor union agreements and internal policies. The activity for compensated absences for the year ended June 30, 2015 is as follows:
Balance at July 1 $ 506,888 Additions 263,162
Reductions (236,013) Balance at June 30 534,037 Less current portion 236,013 Long-term portion $ 298,024
36
SPRINGFIELD AIRPORT AUTHORITY NOTES TO FINANCIAL STATEMENTS - CONTINUED June 30, 2015
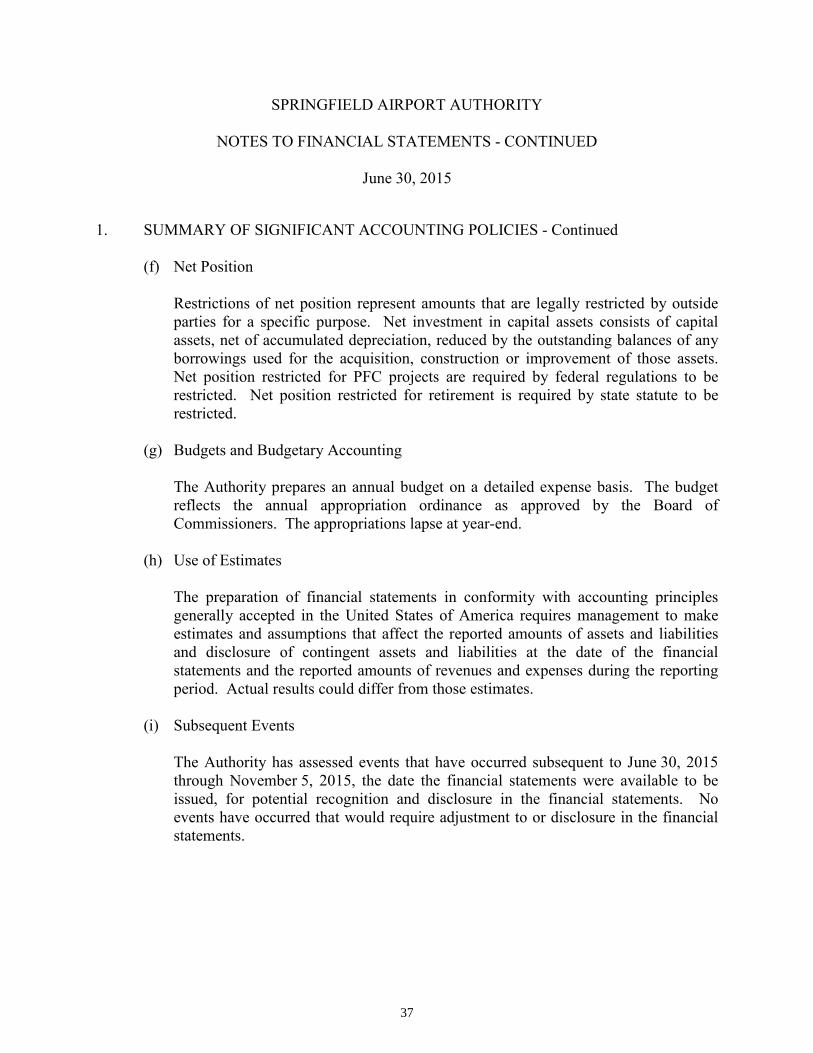
1. SUMMARY OF SIGNIFICANT ACCOUNTING POLICIES - Continued (f) Net Position Restrictions of net position represent amounts that are legally restricted by outside
parties for a specific purpose. Net investment in capital assets consists of capital assets, net of accumulated depreciation, reduced by the outstanding balances of any borrowings used for the acquisition, construction or improvement of those assets. Net position restricted for PFC projects are required by federal regulations to be restricted. Net position restricted for retirement is required by state statute to be restricted.
(g) Budgets and Budgetary Accounting The Authority prepares an annual budget on a detailed expense basis. The budget
reflects the annual appropriation ordinance as approved by the Board of Commissioners. The appropriations lapse at year-end.
(h) Use of Estimates The preparation of financial statements in conformity with accounting principles
generally accepted in the United States of America requires management to make estimates and assumptions that affect the reported amounts of assets and liabilities and disclosure of contingent assets and liabilities at the date of the financial statements and the reported amounts of revenues and expenses during the reporting period. Actual results could differ from those estimates.
(i) Subsequent Events The Authority has assessed events that have occurred subsequent to June 30, 2015
through November 5, 2015, the date the financial statements were available to be issued, for potential recognition and disclosure in the financial statements. No events have occurred that would require adjustment to or disclosure in the financial statements.
37

SPRINGFIELD AIRPORT AUTHORITY NOTES TO FINANCIAL STATEMENTS - CONTINUED June 30, 2015
2. CASH AND CASH EQUIVALENTS At June 30, 2015, the Authority’s cash and cash equivalents consisted of the Illinois
Funds Investment Pool, regular checking accounts, and money market accounts. Permitted Deposits and Investments - Statutes authorize the Authority to make deposits/
investments in insured commercial banks, savings and loan institutions, obligations of the U.S. Treasury and U.S. Agencies, insured credit union shares, money market mutual funds with portfolios of securities issued or guaranteed by the United States or agreement to repurchase these same obligations, repurchase agreements, short-term commercial paper rated within the three highest classifications by at least two standard rating services, and the Illinois Funds.
Investment in External Investment Pool - The Illinois Funds (the Fund) is an external investment pool authorized by the Illinois General Assembly. The Fund is exempt from registering with the Securities and Exchange Commission. The Fund is rated by Standard and Poor’s upon the request of the Fund’s management. The most recent money market rating issued by Standard and Poor’s was AAAm. The fair value of the position in the Illinois Funds Investment Pool is the same as the value of the pool shares. Illinois State Statutes provide the Illinois State Treasurer with regulatory oversight over the Fund.
Custodial Credit Risk - Custodial credit risk for deposits with financial institutions is the
risk that in the event of bank failure, the Authority’s deposits may not be returned to it. To guard against custodial credit risk for deposits with financial institutions, the Authority’s Investment Policy requires that deposits with financial institutions in excess of FDIC insurance be collateralized in an amount of 100% of the uninsured deposits with the collateral held by a third party approved by the Authority.
Concentration of Credit Risk - In order to avoid unreasonable credit risks, the Authority’s Investment Policy requires that diversification of the investment portfolio shall be made, consistent with the objectives of the Investment Policy. However, to the extent investments are made in fully guaranteed investments through either the FDIC or U.S. Government or fully collateralized other investments, diversification need not be considered a major factor in the Authority’s Investment Policy. Commercial paper shall not exceed 10% of the investment portfolio.
Credit Risk - The Authority’s Investment Policy requires funds be invested solely in
investments authorized by the Public Funds Investment Act, 30 ILCS 235/2.
38
SPRINGFIELD AIRPORT AUTHORITY NOTES TO FINANCIAL STATEMENTS - CONTINUED June 30, 2015
2. CASH AND CASH EQUIVALENTS - Continued
Interest Rate Risk - Interest rate risk is the risk that changes in market interest rates will adversely affect the fair value of an investment. Generally, the longer the maturity of an investment the greater the sensitivity of its fair value to changes in market interest rates. At June 30, 2015, the Authority’s cash and cash equivalents were deposits in financial institutions and an external investment pool. None of the Authority’s cash and cash equivalents are highly sensitive to interest rate fluctuations. The deposits, including those in the external investment pool, are all demand deposits.
3. ALLOWANCE FOR UNCOLLECTIBLE RECEIVABLES
The Authority reserves 2% of the estimated taxes receivable as uncollectible to reflect actual collection experience. As of June 30, 2015, the taxes receivable balance has been reduced by an uncollectible allowance of $ 48,809.
39

SPRINGFIELD AIRPORT AUTHORITY NOTES TO FINANCIAL STATEMENTS - CONTINUED June 30, 2015
4. CAPITAL ASSETS Capital assets activity for the year ended June 30, 2015 consists of the following: Balances Balances July 1 Additions Retirements June 30 Capital assets not being depreciated Land $ 11,930,485 $ 10,139 $ - $ 11,940,624 Construction in progress 8,574,511 5,970,885 3,018,314 11,527,082 Total capital assets not being depreciated 20,504,996 5,981,024 3,018,314 23,467,706 Capital assets being depreciated Building site and improvements 2,202,986 - - 2,202,986 Runways, taxiways and aprons 57,615,050 1,400,895 - 59,015,945 Roads, walks, fences and landscaping 9,473,373 166,282 - 9,639,655 Terminal area improvements 7,936,721 - - 7,936,721 Buildings 44,690,248 1,717,329 - 46,407,577 Utility systems 2,367,954 - - 2,367,954 Equipment 6,105,939 238,522 327,392 6,017,069 Total capital assets being depreciated 130,392,271 3,523,028 327,392 133,587,907 Total capital assets $ 150,897,267 $ 9,504,052 $ 3,345,706 $ 157,055,613
40

SPRINGFIELD AIRPORT AUTHORITY NOTES TO FINANCIAL STATEMENTS - CONTINUED June 30, 2015
4. CAPITAL ASSETS - Continued Accumulated depreciation activity for the year ended June 30, 2015 consists of the
following: Balances Balances July 1 Additions Retirements June 30 Building site and improvements $ 1,709,994 $ 52,368 $ - $ 1,762,362 Runways, taxiways and aprons 36,203,392 2,422,430 - 38,625,822 Roads, walks, fences and landscaping 1,873,600 481,064 - 2,354,664 Terminal area improvements 5,116,534 345,132 - 5,461,666 Buildings 33,569,330 1,066,067 - 34,635,397 Utility systems 2,177,772 9,943 - 2,187,715 Equipment 4,910,898 329,177 327,392 4,912,683 Total accumulated depreciation 85,561,520 4,706,181 327,392 89,940,309 Capital assets, net of accumulated depreciation $ 65,335,747 $ 4,797,871 $ 3,018,314 $ 67,115,304 At June 30, 2015, construction in progress totaled $ 11,527,082 representing amounts
expended for capital improvement projects. Construction in progress includes the federal, state and local share of the construction projects managed by the Illinois Department of Transportation Division of Aeronautics.
The construction in progress totaling $ 3,018,314 placed into service during the year
ended June 30, 2015 consists of the following: Land $ 10,139 Runways, taxiways and aprons 1,400,895 Roads, walks, fences and landscaping 152,796 Buildings 1,411,576 Equipment 42,908 Total $ 3,018,314
41
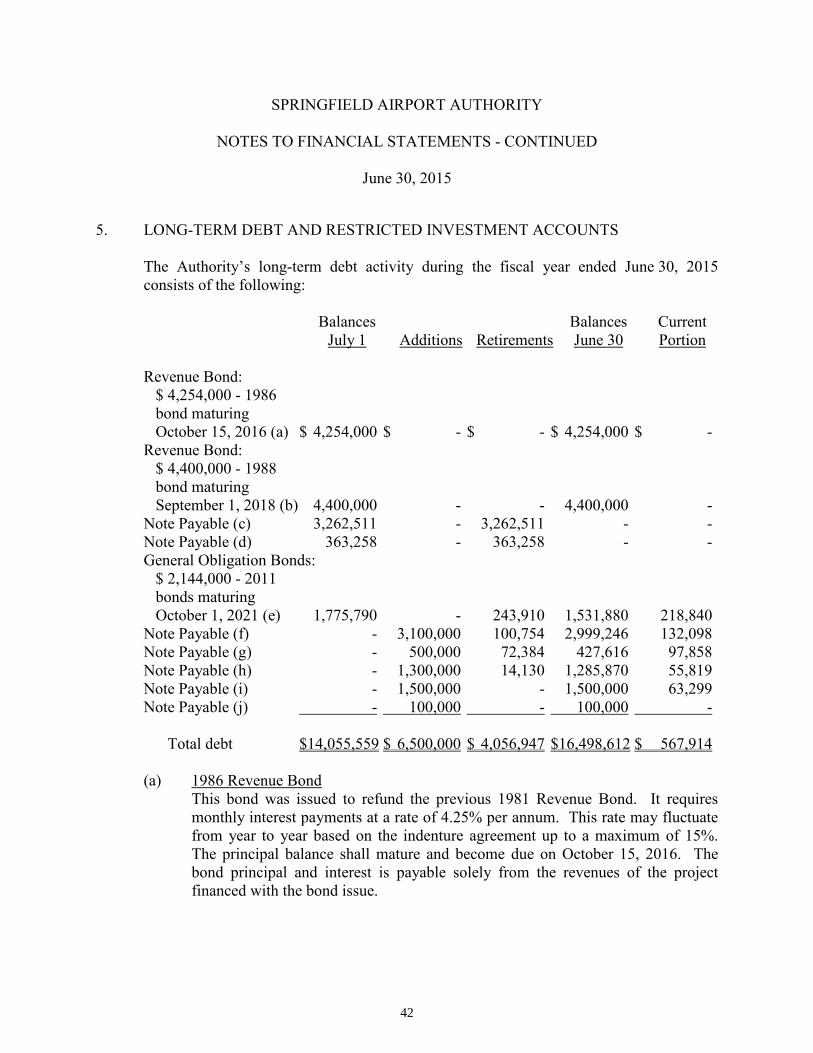
SPRINGFIELD AIRPORT AUTHORITY NOTES TO FINANCIAL STATEMENTS - CONTINUED June 30, 2015
5. LONG-TERM DEBT AND RESTRICTED INVESTMENT ACCOUNTS The Authority’s long-term debt activity during the fiscal year ended June 30, 2015
consists of the following: Balances Balances Current July 1 Additions Retirements June 30 Portion Revenue Bond: $ 4,254,000 - 1986 bond maturing October 15, 2016 (a) $ 4,254,000 $ - $ - $ 4,254,000 $ - Revenue Bond: $ 4,400,000 - 1988 bond maturing September 1, 2018 (b) 4,400,000 - - 4,400,000 - Note Payable (c) 3,262,511 - 3,262,511 - - Note Payable (d) 363,258 - 363,258 - - General Obligation Bonds: $ 2,144,000 - 2011 bonds maturing October 1, 2021 (e) 1,775,790 - 243,910 1,531,880 218,840 Note Payable (f) - 3,100,000 100,754 2,999,246 132,098 Note Payable (g) - 500,000 72,384 427,616 97,858 Note Payable (h) - 1,300,000 14,130 1,285,870 55,819 Note Payable (i) - 1,500,000 - 1,500,000 63,299 Note Payable (j) - 100,000 - 100,000 - Total debt $14,055,559 $ 6,500,000 $ 4,056,947 $16,498,612 $ 567,914 (a) 1986 Revenue Bond This bond was issued to refund the previous 1981 Revenue Bond. It requires
monthly interest payments at a rate of 4.25% per annum. This rate may fluctuate from year to year based on the indenture agreement up to a maximum of 15%. The principal balance shall mature and become due on October 15, 2016. The bond principal and interest is payable solely from the revenues of the project financed with the bond issue.
42

SPRINGFIELD AIRPORT AUTHORITY NOTES TO FINANCIAL STATEMENTS - CONTINUED June 30, 2015
5. LONG-TERM DEBT AND RESTRICTED INVESTMENT ACCOUNTS - Continued (b) 1988 Revenue Bond This bond was issued to finance part of the costs in constructing the 89,510 square
foot airport facility for Garrett expansion. It requires monthly interest payments at a rate of 5.9% per annum. This rate may fluctuate from year to year based on the indenture agreement up to a maximum of 15%. Bonds will mature September 1, 2018. The bond principal and interest is payable solely from the revenues of the project financed with the bond issue.
(c) Note Payable - Bank The balance represents the Authority’s refinanced debt for the Southeast Quadrant
T-Hangar construction project. The note was secured by the T-Hangars. The $ 3,450,000 note was payable through January 24, 2018 in monthly installments of $ 18,706 with the remaining balance payable on February 24, 2018 at a rate of 2.75%. The Authority made the debt service payments with rent income from the tenants of the T-Hangars. The Authority refinanced the note during the year ended June 30, 2015.
(d) Note Payable - Bank The balance represents the Authority’s refinanced debt for the Southeast Quadrant
T-Hangar construction project. The note was secured by the T-Hangars. The $ 500,000 note was payable through December 15, 2017 in monthly installments of $ 8,803 with the remaining balance payable on January 15, 2018 at a rate of 2.18%. The Authority made the debt service payments with rent income from the tenants of the T-Hangars. The Authority refinanced the note during the year ended June 30, 2015.
(e) 2011 General Obligation Bonds These bonds were issued to repair, renovate, improve and equip the Authority
including, but not limited to the removal and installation of lighting and HVAC equipment, restroom fixture replacement and the purchase of a deicing truck. The bonds mature serially and require principal payments of $ 243,910 in fiscal years 2014 and 2015, and $ 218,840 in fiscal years 2016 through 2021. Interest payments are due semi-annually at rates between 1.35% to 4.85%.
43
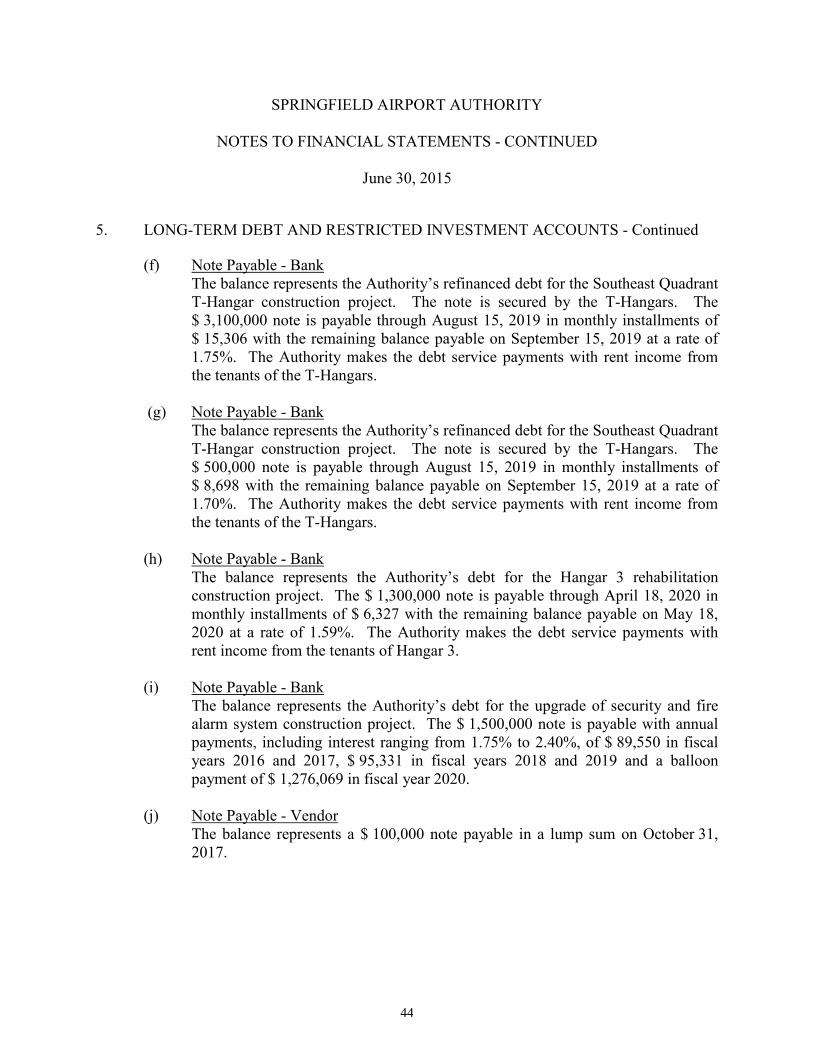
SPRINGFIELD AIRPORT AUTHORITY NOTES TO FINANCIAL STATEMENTS - CONTINUED June 30, 2015
5. LONG-TERM DEBT AND RESTRICTED INVESTMENT ACCOUNTS - Continued (f) Note Payable - Bank The balance represents the Authority’s refinanced debt for the Southeast Quadrant
T-Hangar construction project. The note is secured by the T-Hangars. The $ 3,100,000 note is payable through August 15, 2019 in monthly installments of $ 15,306 with the remaining balance payable on September 15, 2019 at a rate of 1.75%. The Authority makes the debt service payments with rent income from the tenants of the T-Hangars.
(g) Note Payable - Bank The balance represents the Authority’s refinanced debt for the Southeast Quadrant
T-Hangar construction project. The note is secured by the T-Hangars. The $ 500,000 note is payable through August 15, 2019 in monthly installments of $ 8,698 with the remaining balance payable on September 15, 2019 at a rate of 1.70%. The Authority makes the debt service payments with rent income from the tenants of the T-Hangars.
(h) Note Payable - Bank The balance represents the Authority’s debt for the Hangar 3 rehabilitation
construction project. The $ 1,300,000 note is payable through April 18, 2020 in monthly installments of $ 6,327 with the remaining balance payable on May 18, 2020 at a rate of 1.59%. The Authority makes the debt service payments with rent income from the tenants of Hangar 3.
(i) Note Payable - Bank The balance represents the Authority’s debt for the upgrade of security and fire
alarm system construction project. The $ 1,500,000 note is payable with annual payments, including interest ranging from 1.75% to 2.40%, of $ 89,550 in fiscal years 2016 and 2017, $ 95,331 in fiscal years 2018 and 2019 and a balloon payment of $ 1,276,069 in fiscal year 2020.
(j) Note Payable - Vendor The balance represents a $ 100,000 note payable in a lump sum on October 31,
2017.
44

SPRINGFIELD AIRPORT AUTHORITY NOTES TO FINANCIAL STATEMENTS - CONTINUED June 30, 2015
5. LONG-TERM DEBT AND RESTRICTED INVESTMENT ACCOUNTS - Continued The assets of the accounts required by the various bond ordinances are restricted for specific uses and have been segregated in the financial statements. The restricted investment accounts at June 30, 2015 consist of the following:
Cash $ 9,131 Receivables: Rental 8,024,560 Taxes 126,002 Inter-account 130,883 Total $ 8,290,576 The above assets are allocated to the following accounts: 1986 Revenue Bond $ 4,072,730 1988 Revenue Bond 3,951,830 2011 General Obligation Bonds 266,016 Total $ 8,290,576 Debt service requirements to maturity are as follows: General General Fiscal Year Obligation Obligation Revenue Revenue Notes Notes Ending Bonds Bonds Bonds Bonds Payable Payable June 30 Principal Interest Principal Interest Principal Interest Total 2016 $ 218,840 $ 43,049 $ - $ 440,395 $ 349,074 $ 104,526 $ 1,155,884 2017 218,840 37,828 4,254,000 312,332 355,296 98,233 5,276,529 2018 218,840 32,060 - 259,600 458,266 101,047 1,069,813 2019 218,840 25,678 4,400,000 43,266 364,838 94,474 5,147,096 2020 218,840 18,790 - - 4,785,258 55,923 5,078,811 2021-2025 437,680 15,441 - - - - 453,121 $ 1,531,880 $ 172,846 $ 8,654,000 $ 1,055,593 $ 6,312,732 $ 454,203 $ 18,181,254
45

SPRINGFIELD AIRPORT AUTHORITY NOTES TO FINANCIAL STATEMENTS - CONTINUED June 30, 2015
5. LONG-TERM DEBT AND RESTRICTED INVESTMENT ACCOUNTS - Continued Current Maturities by Issue: General Obligation Bonds, Series 2011 (e) $ 218,840 Note Payable (f) $ 132,098 Note Payable (g) $ 97,858 Note Payable (h) $ 55,819 Note Payable (i) $ 63,299 Net Investment in Capital Assets: Total capital assets, net of accumulated depreciation $ 67,115,304 Outstanding principal of related debt (16,498,612) $ 50,616,692
46
SPRINGFIELD AIRPORT AUTHORITY NOTES TO FINANCIAL STATEMENTS - CONTINUED June 30, 2015
6. RETIREMENT PLAN IMRF Plan Description The Authority’s defined benefit pension plan for regular employees provides retirement and disability benefits, post-retirement increases, and death benefits to plan members and beneficiaries. The Authority’s plan is managed by the Illinois Municipal Retirement Fund (IMRF), the administrator of a multi-employer public pension fund. A summary of IMRF’s pension benefits is provided in the “Benefits Provided” section of this note. Details of all benefits are available from IMRF. Benefit provisions are established by statute and may only be changed by the General Assembly of the State of Illinois. IMRF issues a publicly available Comprehensive Annual Financial Report that includes financial statements, detailed information about the pension plan’s fiduciary net position, and required supplementary information. The report is available for download at www.imrf.org. Benefits Provided IMRF has three benefit plans. The vast majority of IMRF members participate in the Regular Plan (RP). The Sheriff’s Law Enforcement Personnel (SLEP) plan is for sheriffs, deputy sheriffs, and selected police chiefs. Counties could adopt the Elected County Official (ECO) plan for officials elected prior to August 8, 2011 (the ECO plan was closed to new participants after that date). All three IMRF benefit plans have two tiers. Employees hired before January 1, 2011, are eligible for Tier 1 benefits. Tier 1 employees are vested for pension benefits when they have at least eight years of qualifying service credit. Tier 1 employees who retire at age 55 (at reduced benefits) or after age 60 (at full benefits) with eight years of service are entitled to an annual retirement benefit, payable monthly for life, in an amount equal to 1-2/3% of the final rate of earnings for the first 15 years of service credit, plus 2% for each year of service credit after 15 years to a maximum of 75% of their final rate of earnings. Final rate of earnings is the highest total earnings during any consecutive 48 months within the last 10 years of service, divided by 48. Under Tier 1, the pension is increased by 3% of the original amount on January 1 every year after retirement.
47

SPRINGFIELD AIRPORT AUTHORITY NOTES TO FINANCIAL STATEMENTS - CONTINUED June 30, 2015
6. RETIREMENT PLAN - Continued Employees hired on or after January 1, 2011, are eligible for Tier 2 benefits. For Tier 2 employees, pension benefits vest after ten years of service. Participating employees who retire at age 62 (at reduced benefits) or after age 67 (at full benefits) with ten years of service are entitled to an annual retirement benefit, payable monthly for life, in an amount equal to 1-2/3% of the final rate of earnings for the first 15 years of service credit, plus 2% for each year of service credit after 15 years to a maximum of 75% of their final rate of earnings. Final rate of earnings is the highest total earnings during any 96 consecutive months within the last 10 years of service, divided by 96. Under Tier 2, the pension is increased on January 1 every year after retirement, upon reaching age 67, by the lesser of:
• 3% of the original pension amount, or • 1/2 of the increase in the Consumer Price Index of the original pension amount.
Employees Covered by Benefit Terms As of December 31, 2014, the following employees were covered by the benefit items: IMRF Retirees and beneficiaries currently receiving benefits 37 Inactive plan members entitled to but not yet receiving benefits 17 Active plan members 35 Total 89 Contributions As set by statute, the Authority’s Regular Plan Members are required to contribute 4.5% of their annual covered salary. The statute requires employers to contribute the amount necessary, in addition to member contributions, to finance the retirement coverage of its own employees. The Authority’s annual contribution rate for calendar year 2014 was 12.59%. For the fiscal year ended June 30, 2015, the Authority contributed $ 301,020 to the plan. The Authority also contributes for disability benefits, death benefits, and supplemental retirement benefits, all of which are pooled at the IMRF level. Contribution rates for disability and death benefits are set by IMRF’s Board of Trustees, while the supplemental retirement benefits rate is set by statute.
48
SPRINGFIELD AIRPORT AUTHORITY NOTES TO FINANCIAL STATEMENTS - CONTINUED June 30, 2015
6. RETIREMENT PLAN - Continued Net Pension Liability The Authority’s net pension liability was measured as of December 31, 2014. The total pension liability used to calculate the net pension liability was determined by an actuarial valuation as of that date. Actuarial Assumptions The following are the methods and assumptions used to determine total pension liability at December 31, 2014:
• The actuarial cost method used was Entry Age Normal. • The asset valuation method used was Market Value of Assets. • The inflation rate was assumed to be 3.5%. • Salary increases were expected to be 3.75% to 14.50%, including inflation. • The investment rate of return was assumed to be 7.50%. • Projected retirement a ge w a s f r o m t h e Experience-based Table of
Rates, specific to the type of eligibility condition, last updated for the 2014 valuation according to an experience study from years 2011 to 2013.
• The IMRF-specific rates for mortality (for non-disabled retirees) were developed from the RP-2014 Blue Collar Health Annuitant Mortality Table with adjustments to match current IMRF experience.
• For disabled retirees, an IMRF-specific mortality table was used with fully generational projection scale MP-2014 (base year 2014). The IMRF-specific rates were developed from the RP-2014 Disabled Retirees Mortality Table, applying the same adjustments that were applied for non-disabled lives.
• For active members, an IMRF- specific mortality table was used with fully generational projection scale MP-2014 (base year 2014). The IMRF-specific rates were developed from the RP-2014 Employee Mortality Table with adjustments to match current IMRF experience.
49
SPRINGFIELD AIRPORT AUTHORITY NOTES TO FINANCIAL STATEMENTS - CONTINUED June 30, 2015
6. RETIREMENT PLAN - Continued
• The long-term expected rate of return on pension plan investments was determined using a building-block method in which best-estimate ranges of expected future real rates of return (expected returns, net of pension plan investment expense, and inflation) are developed for each major asset class. These ranges are combined to produce the long-term expected rate of return by weighting the expected future real rates of return to the target asset allocation percentage and adding expected inflation. The target allocation and best estimates of geometric real rates of return for each major asset class are summarized in the following table:
Long-Term Portfolio Expected Target Real Rate Asset Class Percentage of Return Domestic Equity 38% 7.60% International Equity 17 7.80 Fixed Income 27 3.00 Real Estate 8 6.15 Alternative Investments 9 5.25-8.50 Cash Equivalents 1 2.25 Total 100% Single Discount Rate A Single Discount Rate of 7.50% was used to measure the total pension liability. The projection of cash flow used to determine this Single Discount Rate assumed that the plan members’ contributions will be made at the current contribution rate, and that employer contributions will be made at rates equal to the difference between actuarially determined contribution rates and the member rate. The Single Discount Rate reflects:
1. The long-term expected rate of return on pension plan investments (during the period in which the fiduciary net position is projected to be sufficient to pay benefits), and
2. The tax-exempt municipal bond rate based on an index of 20-year general obligation bonds with an average AA credit rating (which is published by the Federal Reserve) as of the measurement date (to the extent that the contributions for use with the long-term expected rate of return are not met).
50

SPRINGFIELD AIRPORT AUTHORITY NOTES TO FINANCIAL STATEMENTS - CONTINUED June 30, 2015
6. RETIREMENT PLAN - Continued
For the purpose of the most recent valuation, the expected rate of return on plan investments is 7.50%, the municipal bond rate is 3.56%, and the resulting single discount rate is 7.50%. Changes in the Net Pension Liability Total Pension Plan Fiduciary Net Pension Liability Net Position Liability (A) (B) (A) - (B)
Balance at December 31, 2013 $ 12,672,108 $ 12,666,190 $ 5,918 Service cost 261,545 - 261,545 Interest on the total pension liability 941,394 - 941,394 Changes of benefit terms - - - Differences between expected and actual experience of the total pension liability (449,614) - (449,614) Changes of assumptions 440,639 - 440,639 Contributions - employer - 301,020 (301,020) Contributions - employees - 102,557 (102,557) Net investment income - 448,394 (448,394) Benefit payments, including refunds of employee contributions (501,920) (520,861) 18,941 Other (net transfer) - (5,918) 5,918 Net changes 692,044 325,192 366,852 Balance at December 31, 2014 $ 13,364,152 $ 12,991,382 $ 372,770
Sensitivity of the Net Pension Liability to Changes in the Discount Rate The following presents the plan’s net pension liability, calculated using a Single Discount Rate of 7.50% as well as what the plan’s net pension liability would be if it were calculated using a Single Discount Rate that is 1% lower or 1% higher: 1% Lower Current Discount 1% Higher 6.50% 7.50% 8.50% Net pension liability (asset) $ 2,177,807 $ 372,770 $ (1,128,853)
51
SPRINGFIELD AIRPORT AUTHORITY NOTES TO FINANCIAL STATEMENTS - CONTINUED June 30, 2015
6. RETIREMENT PLAN - Continued Pension Expense, Deferred Outflows of Resources, and Deferred Inflows of Resources Related to Pensions For the year ended June 30, 2015, the Authority recognized pension expense of $ 373,057. At June 30, 2015, the Authority reported deferred outflows of resources and deferred inflows of resources related to pensions from the following sources: Deferred Deferred Outflows of Inflows of Deferred Amounts Related to Pensions Resources Resources
Deferred amounts to be recognized in pension expense in future periods Differences between expected and actual experience $ - $ 341,666 Changes of assumptions 334,846 - Net difference between projected and actual earnings on pension plan investments 132,655 - Total deferred amounts to be recognized in pension expense in future periods 467,501 341,666 Pension contributions made subsequent to the measurement date 128,329 - Total deferred amounts related to pensions $ 595,830 $ 341,666
52

SPRINGFIELD AIRPORT AUTHORITY NOTES TO FINANCIAL STATEMENTS - CONTINUED June 30, 2015
6. RETIREMENT PLAN - Continued Net amounts reported as deferred outflows of resources and deferred inflows of resources related to pensions will be recognized in pension expense in future periods as follows: Net Deferred Year Ending Outflows December 31, of Resources 2015 $ 159,338 2016 31,009 2017 31,009 2018 32,808 2019 - Total $ 254,164
7. OTHER POST EMPLOYMENT BENEFITS (OPEB)
In addition to the retirement plan, the Authority offers post employment health care benefits to all employees hired prior to November 1, 2013 and who retired from the Authority on or after attaining age 55 with at least fifteen years of service. The benefit, which consists of the Authority paying a portion of the individual’s health insurance premium, continues until the employee’s death or eligibility for Medicare. The amount below represents the accrued liability of the Authority. The benefits are financed on a pay as you go basis.
Annual required contribution $ 29,531 Interest on net OPEB obligation 6,737 Adjustment to annual required contribution (42,904) Annual OPEB cost (6,636) Contributions made (8,885) Change in net OPEB obligation (15,521) Net OPEB obligation at beginning of year 149,718 Net OPEB obligation at end of year $ 134,197
53
SPRINGFIELD AIRPORT AUTHORITY NOTES TO FINANCIAL STATEMENTS - CONTINUED June 30, 2015
7. OTHER POST EMPLOYMENT BENEFITS - Continued
Actuarial Method and Assumptions - Projections of benefits for financial reporting purposes are based on the substantive plan (the plan understood by the employer and plan members) and included the types of benefits provided at the time of each valuation and the historical pattern of sharing of benefit costs between the employer and plan members to that point. The actuarial method and assumptions used include techniques that are designed to reduce the effects of short term volatility in actuarial accrued liabilities and the actuarial value of assets, consistent with the long term perspective of the calculations. Actuarial valuation date June 30, 2015 Actuarial cost method Entry Age, Normal Amortization method Level Dollar, Open Remaining amortization method 10 years Asset valuation method No assets (pay as you go) Actuarial assumptions OPEB investment rate of return 4.5% Projected salary increases inflation N/A Healthcare cost trend rate 8.0% General inflation rate N/A
OPEB COST SUMMARY
Percent of Annual Year Ended Annual OPEB Cost OPEB June 30: OPEB Cost Contributed Obligation
2015 $ (6,636) N/A $ 134,197 2014 3,187 861.41% 149,718 2013 16,946 273.14% 173,984
54
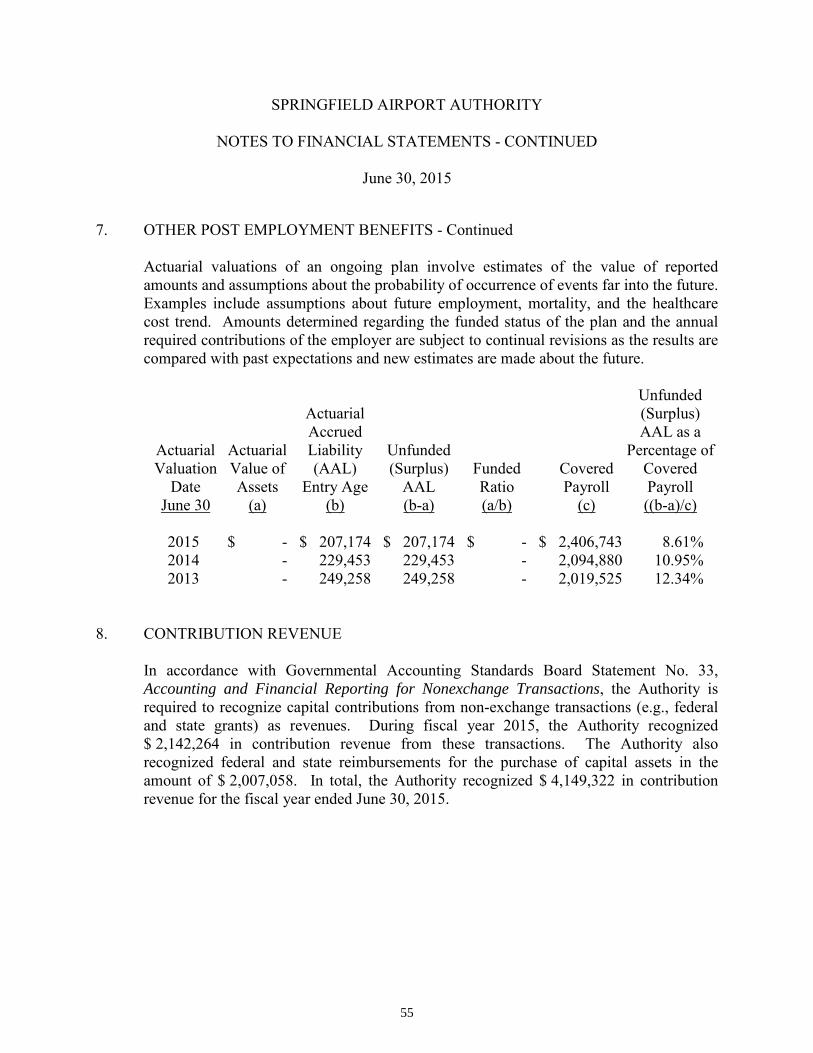
SPRINGFIELD AIRPORT AUTHORITY NOTES TO FINANCIAL STATEMENTS - CONTINUED June 30, 2015
7. OTHER POST EMPLOYMENT BENEFITS - Continued
Actuarial valuations of an ongoing plan involve estimates of the value of reported amounts and assumptions about the probability of occurrence of events far into the future. Examples include assumptions about future employment, mortality, and the healthcare cost trend. Amounts determined regarding the funded status of the plan and the annual required contributions of the employer are subject to continual revisions as the results are compared with past expectations and new estimates are made about the future. Unfunded Actuarial (Surplus) Accrued AAL as a Actuarial Actuarial Liability Unfunded Percentage of Valuation Value of (AAL) (Surplus) Funded Covered Covered Date Assets Entry Age AAL Ratio Payroll Payroll June 30 (a) (b) (b-a) (a/b) (c) ((b-a)/c) 2015 $ - $ 207,174 $ 207,174 $ - $ 2,406,743 8.61% 2014 - 229,453 229,453 - 2,094,880 10.95% 2013 - 249,258 249,258 - 2,019,525 12.34%
8. CONTRIBUTION REVENUE In accordance with Governmental Accounting Standards Board Statement No. 33,
Accounting and Financial Reporting for Nonexchange Transactions, the Authority is required to recognize capital contributions from non-exchange transactions (e.g., federal and state grants) as revenues. During fiscal year 2015, the Authority recognized $ 2,142,264 in contribution revenue from these transactions. The Authority also recognized federal and state reimbursements for the purchase of capital assets in the amount of $ 2,007,058. In total, the Authority recognized $ 4,149,322 in contribution revenue for the fiscal year ended June 30, 2015.
55

SPRINGFIELD AIRPORT AUTHORITY NOTES TO FINANCIAL STATEMENTS - CONTINUED June 30, 2015
9. RENTALS UNDER OPERATING LEASES The Authority has entered into various non-cancelable operating leases for the rental of
its facilities including hangars, buildings, and office space. Under these non-cancelable leases, the future minimum rental income as of June 30, 2015 is as follows:
Year ending June 30: 2016 $ 915,563 2017 740,842 2018 727,491 2019 607,203 2020 412,034 2021 - 2025 1,394,265 2026 - 2030 99,347 2031 - 2032 12,856 Total minimum future rental income $ 4,909,601 10. PROPERTY TAX CALENDAR The following information gives significant dates on the property tax calendar of the
Authority. - The property tax lien date is January 1, 2014. - The annual tax levy ordinance for 2014 received during 2015 was passed July
2014. - The first and second installments of property taxes are due to the Tax Collector
in June and September, respectively. - Significant amounts of property taxes for 2013 were distributed to the Authority
in June and September of 2014. 2014 property taxes payable in 2015 are recognized as revenues in fiscal year 2015. 2015
property taxes became an enforceable lien on January 1, 2015 and are payable in calendar year 2015, but the levy has not been passed as of June 30, 2015; therefore, these taxes are not accrued at June 30, 2015.
56
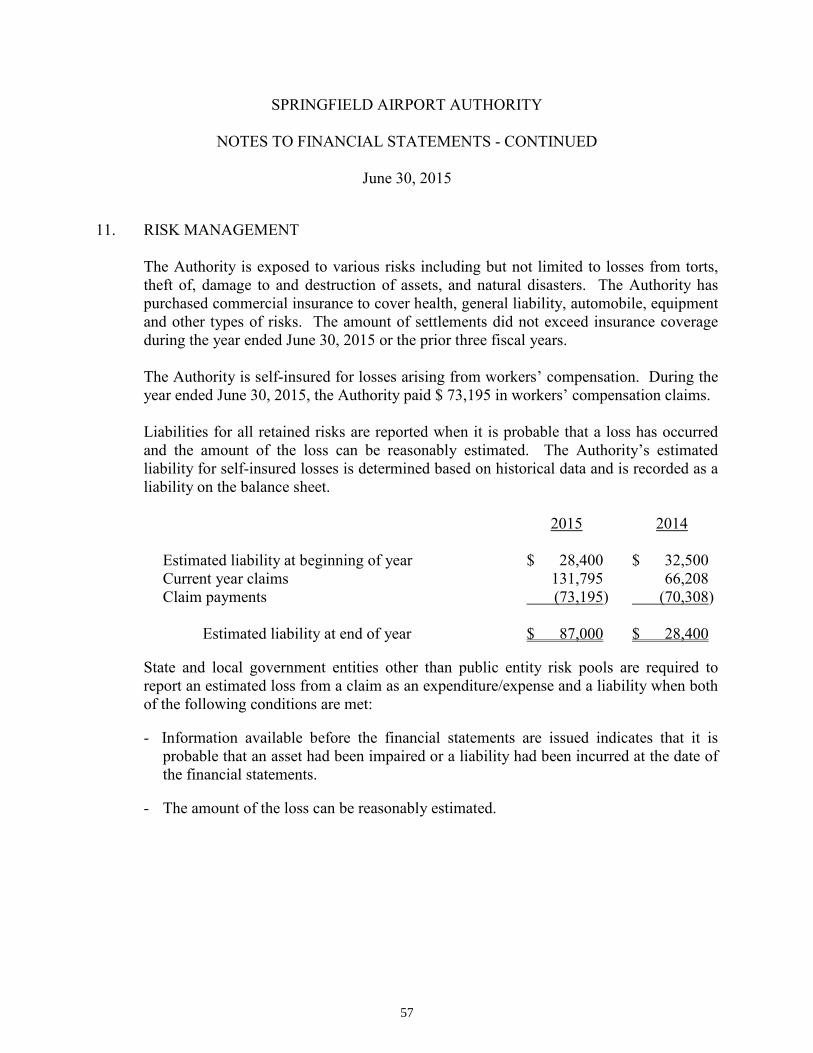
SPRINGFIELD AIRPORT AUTHORITY NOTES TO FINANCIAL STATEMENTS - CONTINUED June 30, 2015
11. RISK MANAGEMENT The Authority is exposed to various risks including but not limited to losses from torts,
theft of, damage to and destruction of assets, and natural disasters. The Authority has purchased commercial insurance to cover health, general liability, automobile, equipment and other types of risks. The amount of settlements did not exceed insurance coverage during the year ended June 30, 2015 or the prior three fiscal years.
The Authority is self-insured for losses arising from workers’ compensation. During the
year ended June 30, 2015, the Authority paid $ 73,195 in workers’ compensation claims. Liabilities for all retained risks are reported when it is probable that a loss has occurred
and the amount of the loss can be reasonably estimated. The Authority’s estimated liability for self-insured losses is determined based on historical data and is recorded as a liability on the balance sheet.
2015 2014 Estimated liability at beginning of year $ 28,400 $ 32,500 Current year claims 131,795 66,208 Claim payments (73,195) (70,308) Estimated liability at end of year $ 87,000 $ 28,400 State and local government entities other than public entity risk pools are required to
report an estimated loss from a claim as an expenditure/expense and a liability when both of the following conditions are met:
- Information available before the financial statements are issued indicates that it is
probable that an asset had been impaired or a liability had been incurred at the date of the financial statements.
- The amount of the loss can be reasonably estimated.
57

SPRINGFIELD AIRPORT AUTHORITY NOTES TO FINANCIAL STATEMENTS - CONTINUED June 30, 2015
12. COMMITMENTS AND CONTINGENCIES The Authority has several construction projects underway as of the end of the fiscal year.
A portion of some projects will be funded through Passenger Facility Charges. The Airport’s financial obligation for construction commitments are as follows:
Acquire custodial cargo van $ 24,000 Continue solar development study 1,000 Engineering at Commerce Park 3,000 Storm sewer rehab/drainage design (Phase I) 13,000 Upgrade security system (Phase I) 111,000 $ 152,000 13. RESTATEMENT DUE TO IMPLEMENTATION OF NEW ACCOUNTING PRINCIPLE
During the year ended June 30, 2015, the Authority implemented the GASB Statement No. 68, Accounting and Financial Reporting for Pensions. The objective of GASB Statement No. 68 is to improve accounting and financial reporting by state and local governments for pensions. The implementation of GASB Statement No. 68 resulted in the Authority reducing beginning net position by $ 5,918. The Authority was unable to obtain the beginning balances of the deferred outflows and deferred inflows related to the pension. As permitted by GASB Statement No. 68, these balances were not restated to their beginning balances at July 1, 2014.
58

THIS PAGE INTENTIONALLY LEFT BLANK
REQUIRED SUPPLEMENTARY INFORMATION
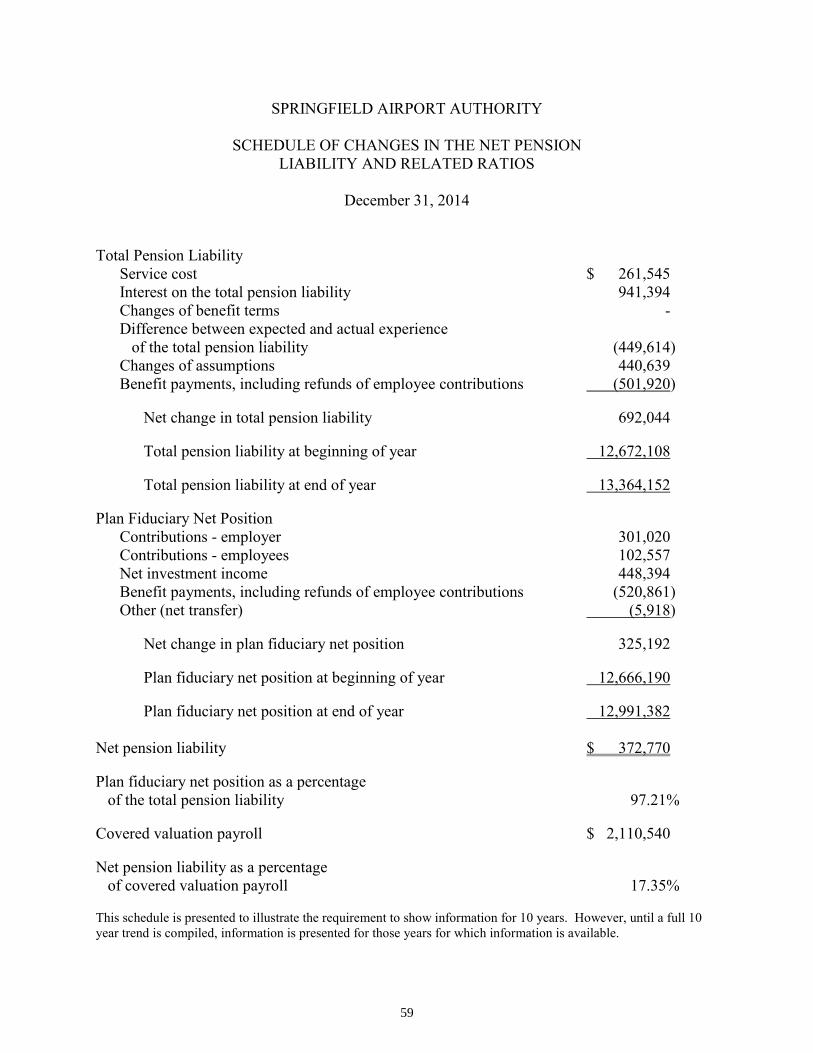
SPRINGFIELD AIRPORT AUTHORITY
SCHEDULE OF CHANGES IN THE NET PENSION LIABILITY AND RELATED RATIOS
December 31, 2014
Total Pension Liability Service cost $ 261,545 Interest on the total pension liability 941,394 Changes of benefit terms - Difference between expected and actual experience of the total pension liability (449,614) Changes of assumptions 440,639 Benefit payments, including refunds of employee contributions (501,920) Net change in total pension liability 692,044 Total pension liability at beginning of year 12,672,108 Total pension liability at end of year 13,364,152 Plan Fiduciary Net Position Contributions - employer 301,020 Contributions - employees 102,557 Net investment income 448,394 Benefit payments, including refunds of employee contributions (520,861) Other (net transfer) (5,918) Net change in plan fiduciary net position 325,192 Plan fiduciary net position at beginning of year 12,666,190 Plan fiduciary net position at end of year 12,991,382 Net pension liability $ 372,770 Plan fiduciary net position as a percentage of the total pension liability 97.21% Covered valuation payroll $ 2,110,540 Net pension liability as a percentage of covered valuation payroll 17.35% This schedule is presented to illustrate the requirement to show information for 10 years. However, until a full 10 year trend is compiled, information is presented for those years for which information is available.
59

SPRINGFIELD AIRPORT AUTHORITY
SCHEDULE OF EMPLOYER CONTRIBUTIONS
December 31, 2014 Actual Contribution Calendar as a percentage Year Actuarially Contribution Covered of Covered Ended Determined Actual Deficiency Valuation Valuation December 31, Contribution Contribution (Excess) Payroll Payroll 2014 $ 252,631 $ 287,935 $ (35,304) $ 2,110,540 13.64% Summary of Actuarial Methods and Assumptions Used in the Calculation of the 2014 Contribution Rate * Valuation Date: Actuarially determined contribution rates are calculated as of
December 31 each year, which are 12 months prior to the beginning of the fiscal year in which contributions are reported.
Methods and assumptions used to determine 2014 contribution rates: Actuarial Cost Method: Aggregate entry age = normal Amortization Method: Level percentage of payroll, closed Remaining Amortization Period: 29-year closed period Asset Valuation Method: 5-year smoothed market; 20% corridor Wage Growth: 4% Price Inflation: 3%, approximate; no explicit price inflation assumption is
used in this valuation. Salary Increases: 4.40% to 16%, including inflation Investment Rate of Return: 7.50% Retirement Age: Experience-based table of rates that are specific to the type
of eligibility condition; last updated for the 2011 valuation pursuant to an experience study of the period 2008 to 2010.
Mortality: RP-2000 Combined Healthy Mortality Table, adjusted for mortality improvements to 2020 using projection scale AA. For men, 120% of the table rates were used. For women, 92% of the table rates were used. For disabled lives, the mortality rates are the rates applicable to non-disabled lives set forward 10 years.
Other Information: There were no benefit changes during the year. * Based on Valuation Assumptions used in the December 31, 2012, actuarial valuation;
note two year lag between valuation and rate setting. This schedule is presented to illustrate the requirement to show information for 10 years. However, until a full 10 year trend is compiled, information is presented for those years for which information is available.
60

THIS PAGE INTENTIONALLY LEFT BLANK
SUPPLEMENTAL FINANCIAL INFORMATION
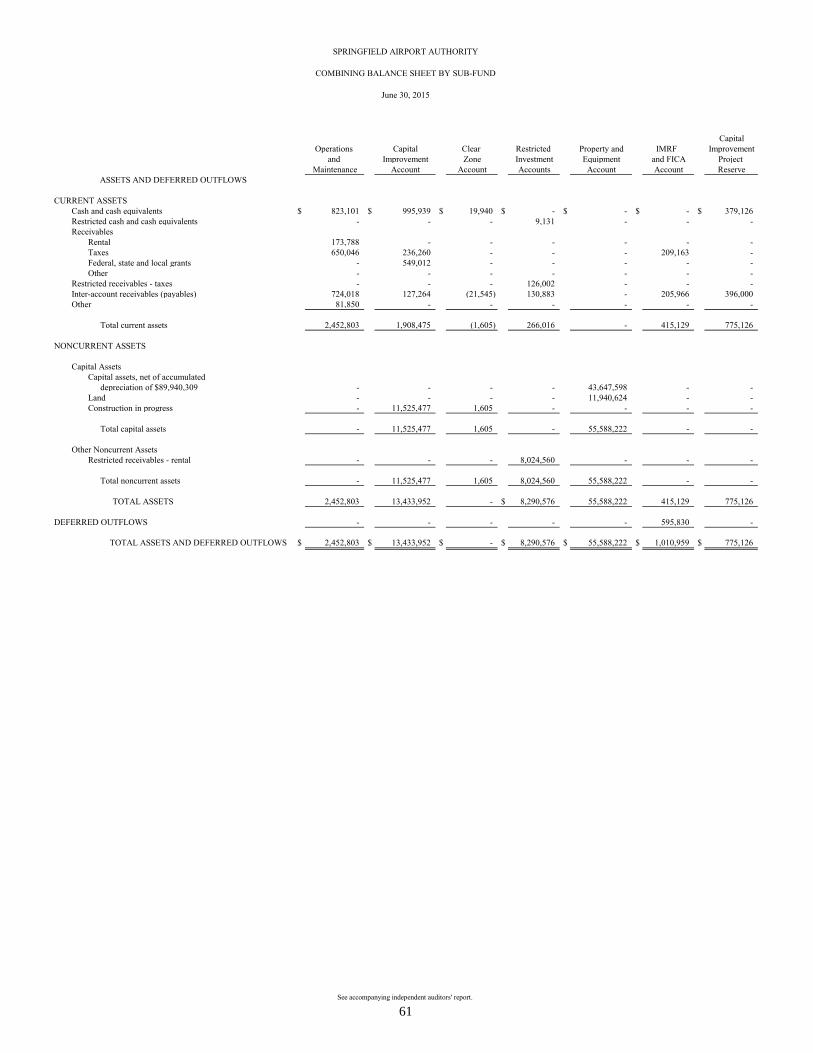
SPRINGFIELD AIRPORT AUTHORITY
COMBINING BALANCE SHEET BY SUB-FUND
June 30, 2015
See accompanying independent auditors' report.
CapitalOperations Capital Clear Restricted Property and IMRF Improvement
and Improvement Zone Investment Equipment and FICA Project Maintenance Account Account Accounts Account Account Reserve
CURRENT ASSETSCash and cash equivalents $ 823,101 $ 995,939 $ 19,940 $ - $ - $ - $ 379,126 Restricted cash and cash equivalents - - - 9,131 - - - Receivables
Rental 173,788 - - - - - - Taxes 650,046 236,260 - - - 209,163 - Federal, state and local grants - 549,012 - - - - - Other - - - - - - -
Restricted receivables - taxes - - - 126,002 - - - Inter-account receivables (payables) 724,018 127,264 (21,545) 130,883 - 205,966 396,000 Other 81,850 - - - - - -
Total current assets 2,452,803 1,908,475 (1,605) 266,016 - 415,129 775,126
NONCURRENT ASSETS
Capital AssetsCapital assets, net of accumulated
depreciation of $89,940,309 - - - - 43,647,598 - - Land - - - - 11,940,624 - - Construction in progress - 11,525,477 1,605 - - - -
Total capital assets - 11,525,477 1,605 - 55,588,222 - -
Other Noncurrent AssetsRestricted receivables - rental - - - 8,024,560 - - -
Total noncurrent assets - 11,525,477 1,605 8,024,560 55,588,222 - -
TOTAL ASSETS 2,452,803 13,433,952 - $ 8,290,576 55,588,222 415,129 775,126
DEFERRED OUTFLOWS - - - - - 595,830 -
TOTAL ASSETS AND DEFERRED OUTFLOWS $ 2,452,803 $ 13,433,952 $ - $ 8,290,576 $ 55,588,222 $ 1,010,959 $ 775,126
ASSETS AND DEFERRED OUTFLOWS
61
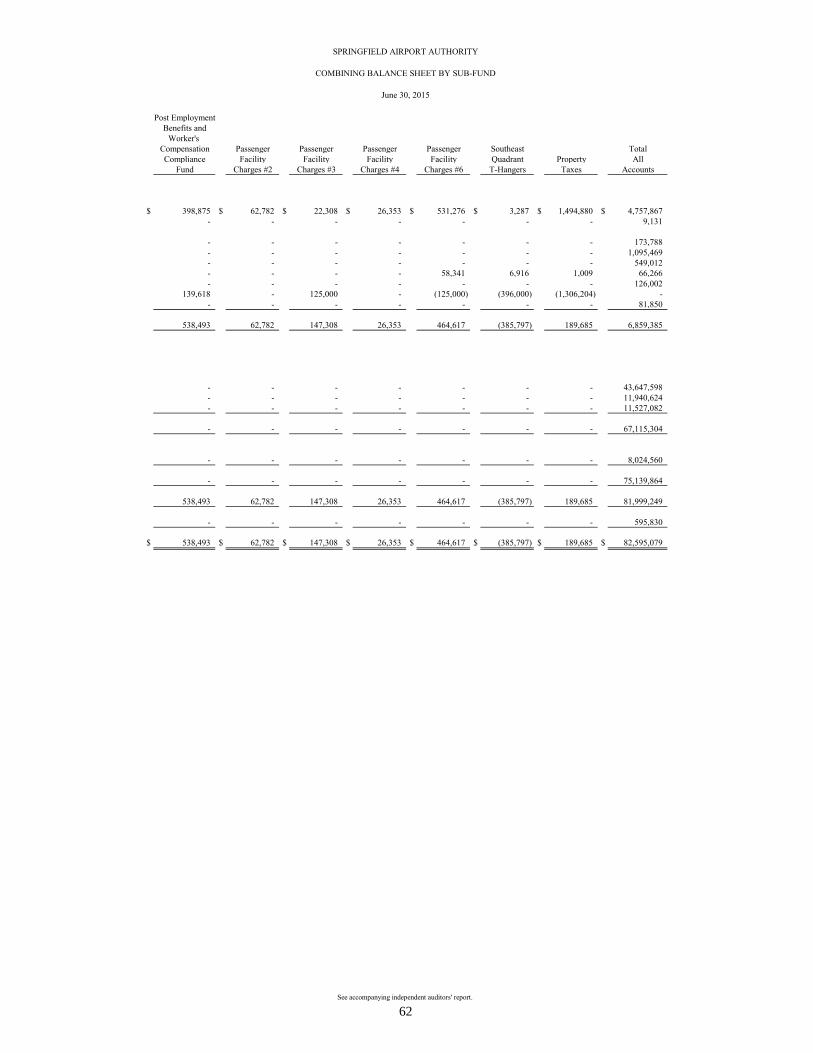
SPRINGFIELD AIRPORT AUTHORITY
COMBINING BALANCE SHEET BY SUB-FUND
June 30, 2015
See accompanying independent auditors' report.
Post EmploymentBenefits and
Worker's Compensation Passenger Passenger Passenger Passenger Southeast TotalCompliance Facility Facility Facility Facility Quadrant Property All
Fund Charges #2 Charges #3 Charges #4 Charges #6 T-Hangers Taxes Accounts
$ 398,875 $ 62,782 $ 22,308 $ 26,353 $ 531,276 $ 3,287 $ 1,494,880 $ 4,757,867 - - - - - - - 9,131
- - - - - - - 173,788 - - - - - - - 1,095,469 - - - - - - - 549,012 - - - - 58,341 6,916 1,009 66,266 - - - - - - - 126,002
139,618 - 125,000 - (125,000) (396,000) (1,306,204) - - - - - - - - 81,850
538,493 62,782 147,308 26,353 464,617 (385,797) 189,685 6,859,385
- - - - - - - 43,647,598 - - - - - - - 11,940,624 - - - - - - - 11,527,082
- - - - - - - 67,115,304
- - - - - - - 8,024,560
- - - - - - - 75,139,864
538,493 62,782 147,308 26,353 464,617 (385,797) 189,685 81,999,249
- - - - - - - 595,830
$ 538,493 $ 62,782 $ 147,308 $ 26,353 $ 464,617 $ (385,797) $ 189,685 $ 82,595,079
62

SPRINGFIELD AIRPORT AUTHORITY
COMBINING BALANCE SHEET BY SUB-FUND - CONTINUED
June 30, 2015
See accompanying independent auditors' report.
CapitalOperations Capital Clear Restricted Property and IMRF Improvement
and Improvement Zone Investment Equipment and FICA Project Maintenance Account Account Accounts Account Account Reserve
CURRENT LIABILITIESCurrent maturities of long-term debt $ 55,819 $ 63,299 $ - $ - $ - $ - $ - Current maturities of long-term debt, payable
from restricted investment accounts - - - 218,840 - - - Accounts payable 35,982 8,634 - - - - - Accrued interest payable, payable from
restricted investment accounts - - - 18,162 - - - Accrued wages, vacation and sick leave, current portion 272,406 - - - - - - Other 130,021 6,409 - - - 40,854 -
Total current liabilities 494,228 78,342 - 237,002 - 40,854 -
LONG-TERM LIABILITIESAccrued vacation and sick leave, net of current portion 298,024 - - - - - - Net pension liability - - - - - 372,770 - Accrued post employment benefits - - - - - - - Long-term debt, less current maturities 1,230,051 1,436,701 - 1,960,642 - - - Long-term debt, less current maturities, payable from
restricted investment accounts - - - 8,006,398 - - -
Total long-term liabilities 1,528,075 1,436,701 - 9,967,040 - 372,770 -
Total liabilities 2,022,303 1,515,043 - 10,204,042 - 413,624 -
DEFERRED INFLOWS - - - - - 341,666 -
NET POSITIONNet investment in capital assets (1,285,870) 10,025,477 1,605 (10,185,880) 55,588,222 - - Restricted for PFC projects - - - - - - - Restricted for retirement - - - - - 255,669 - Unrestricted 1,716,370 1,893,432 (1,605) 8,272,414 . - - 775,126
Total net position 430,500 11,918,909 - (1,913,466) 55,588,222 255,669 775,126
TOTAL LIABILITIES, DEFERRED INFLOWS AND NET POSITION $ 2,452,803 $ 13,433,952 $ - $ 8,290,576 $ 55,588,222 $ 1,010,959 $ 775,126
LIABILITIES, DEFERRED INFLOWS AND NET POSITION
63
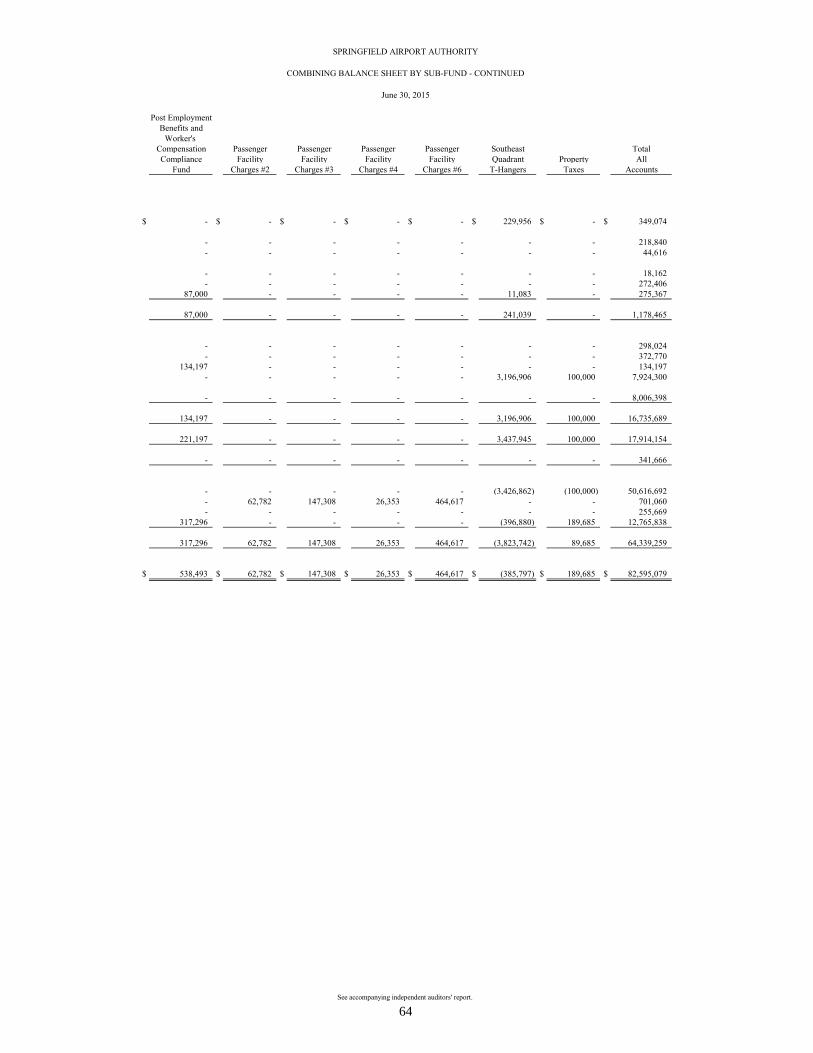
SPRINGFIELD AIRPORT AUTHORITY
COMBINING BALANCE SHEET BY SUB-FUND - CONTINUED
June 30, 2015
See accompanying independent auditors' report.
Post EmploymentBenefits and
Worker's Compensation Passenger Passenger Passenger Passenger Southeast TotalCompliance Facility Facility Facility Facility Quadrant Property All
Fund Charges #2 Charges #3 Charges #4 Charges #6 T-Hangers Taxes Accounts
$ - $ - $ - $ - $ - $ 229,956 $ - $ 349,074
- - - - - - - 218,840 - - - - - - - 44,616
- - - - - - - 18,162 - - - - - - - 272,406
87,000 - - - - 11,083 - 275,367
87,000 - - - - 241,039 - 1,178,465
- - - - - - - 298,024 - - - - - - - 372,770
134,197 - - - - - - 134,197 - - - - - 3,196,906 100,000 7,924,300
- - - - - - - 8,006,398
134,197 - - - - 3,196,906 100,000 16,735,689
221,197 - - - - 3,437,945 100,000 17,914,154
- - - - - - - 341,666
- - - - - (3,426,862) (100,000) 50,616,692 - 62,782 147,308 26,353 464,617 - - 701,060 - - - - - - - 255,669
317,296 - - - - (396,880) 189,685 12,765,838
317,296 62,782 147,308 26,353 464,617 (3,823,742) 89,685 64,339,259
$ 538,493 $ 62,782 $ 147,308 $ 26,353 $ 464,617 $ (385,797) $ 189,685 $ 82,595,079
64
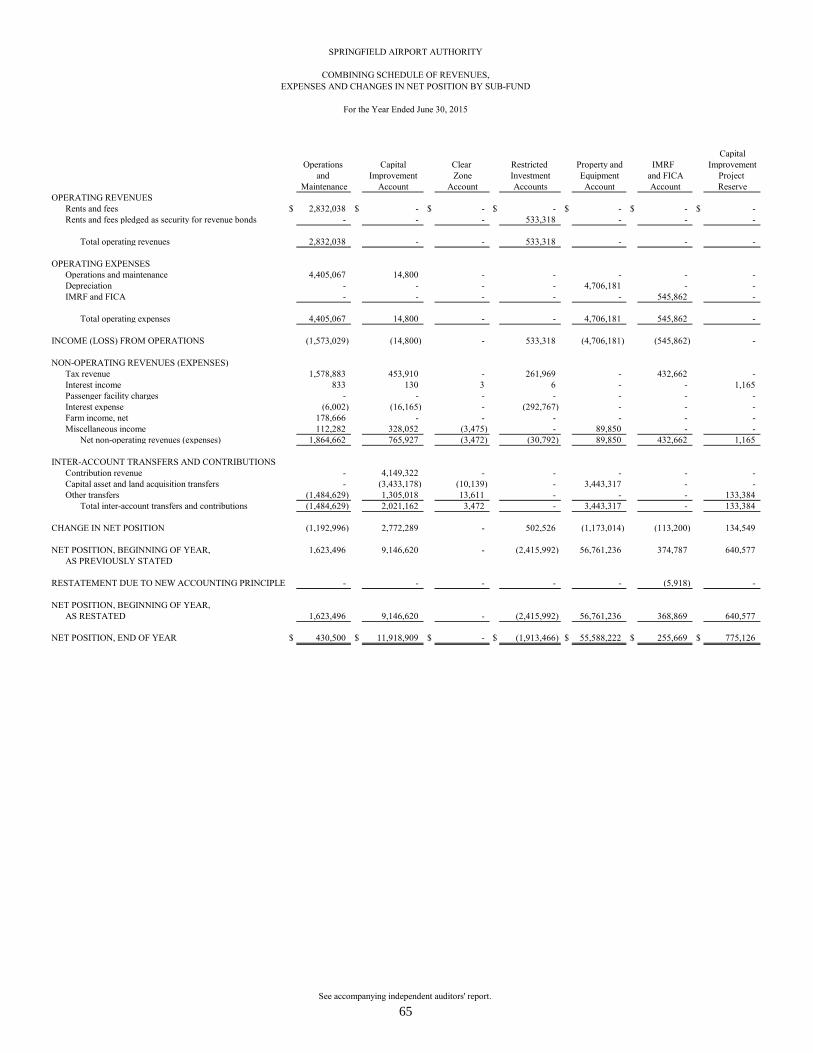
SPRINGFIELD AIRPORT AUTHORITY
COMBINING SCHEDULE OF REVENUES, EXPENSES AND CHANGES IN NET POSITION BY SUB-FUND
For the Year Ended June 30, 2015
See accompanying independent auditors' report.
CapitalOperations Capital Clear Restricted Property and IMRF Improvement
and Improvement Zone Investment Equipment and FICA Project Maintenance Account Account Accounts Account Account Reserve
OPERATING REVENUESRents and fees $ 2,832,038 $ - $ - $ - $ - $ - $ - Rents and fees pledged as security for revenue bonds - - - 533,318 - - -
Total operating revenues 2,832,038 - - 533,318 - - -
OPERATING EXPENSESOperations and maintenance 4,405,067 14,800 - - - - - Depreciation - - - - 4,706,181 - - IMRF and FICA - - - - - 545,862 -
Total operating expenses 4,405,067 14,800 - - 4,706,181 545,862 -
INCOME (LOSS) FROM OPERATIONS (1,573,029) (14,800) - 533,318 (4,706,181) (545,862) -
NON-OPERATING REVENUES (EXPENSES)Tax revenue 1,578,883 453,910 - 261,969 - 432,662 - Interest income 833 130 3 6 - - 1,165 Passenger facility charges - - - - - - - Interest expense (6,002) (16,165) - (292,767) - - - Farm income, net 178,666 - - - - - - Miscellaneous income 112,282 328,052 (3,475) - 89,850 - -
Net non-operating revenues (expenses) 1,864,662 765,927 (3,472) (30,792) 89,850 432,662 1,165
INTER-ACCOUNT TRANSFERS AND CONTRIBUTIONSContribution revenue - 4,149,322 - - - - - Capital asset and land acquisition transfers - (3,433,178) (10,139) - 3,443,317 - - Other transfers (1,484,629) 1,305,018 13,611 - - - 133,384
Total inter-account transfers and contributions (1,484,629) 2,021,162 3,472 - 3,443,317 - 133,384
CHANGE IN NET POSITION (1,192,996) 2,772,289 - 502,526 (1,173,014) (113,200) 134,549
NET POSITION, BEGINNING OF YEAR, 1,623,496 9,146,620 - (2,415,992) 56,761,236 374,787 640,577 AS PREVIOUSLY STATED
RESTATEMENT DUE TO NEW ACCOUNTING PRINCIPLE - - - - - (5,918) -
NET POSITION, BEGINNING OF YEAR,AS RESTATED 1,623,496 9,146,620 - (2,415,992) 56,761,236 368,869 640,577
NET POSITION, END OF YEAR $ 430,500 $ 11,918,909 $ - $ (1,913,466) $ 55,588,222 $ 255,669 $ 775,126
65
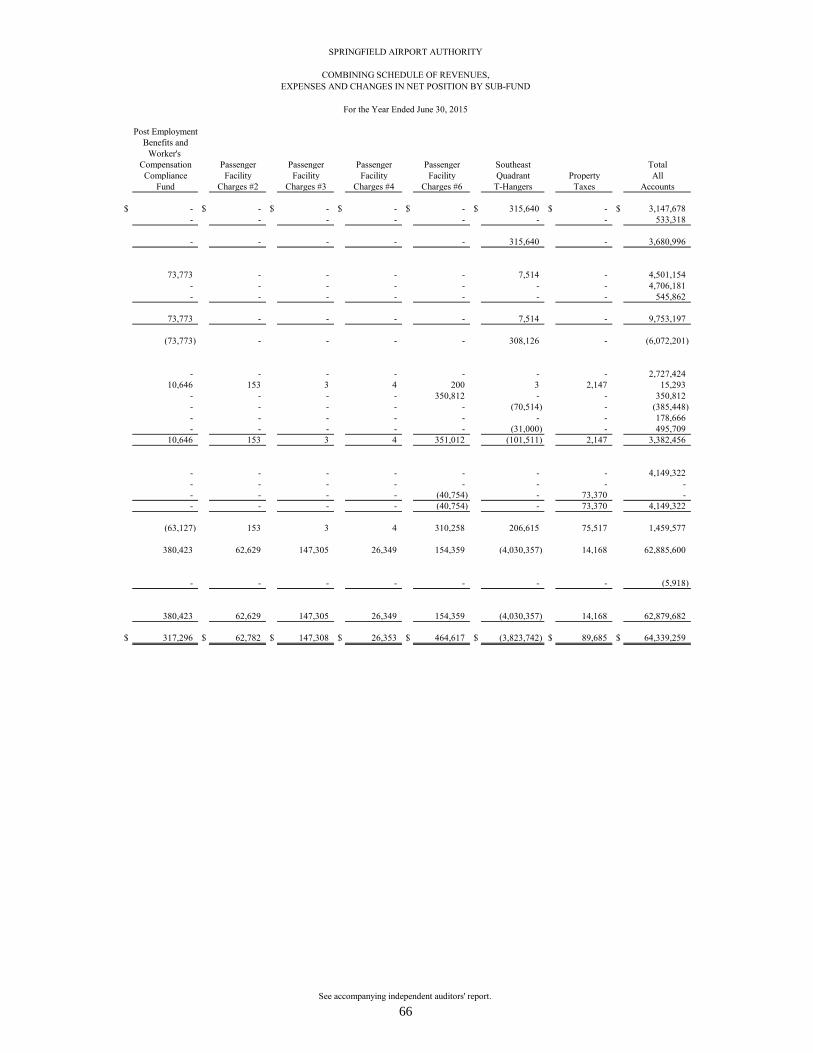
SPRINGFIELD AIRPORT AUTHORITY
COMBINING SCHEDULE OF REVENUES, EXPENSES AND CHANGES IN NET POSITION BY SUB-FUND
For the Year Ended June 30, 2015
See accompanying independent auditors' report.
Post EmploymentBenefits and
Worker's Compensation Passenger Passenger Passenger Passenger Southeast TotalCompliance Facility Facility Facility Facility Quadrant Property All
Fund Charges #2 Charges #3 Charges #4 Charges #6 T-Hangers Taxes Accounts
$ - $ - $ - $ - $ - $ 315,640 $ - $ 3,147,678 - - - - - - - 533,318
- - - - - 315,640 - 3,680,996
73,773 - - - - 7,514 - 4,501,154 - - - - - - - 4,706,181 - - - - - - - 545,862
73,773 - - - - 7,514 - 9,753,197
(73,773) - - - - 308,126 - (6,072,201)
- - - - - - - 2,727,424 10,646 153 3 4 200 3 2,147 15,293
- - - - 350,812 - - 350,812 - - - - - (70,514) - (385,448) - - - - - - - 178,666 - - - - - (31,000) - 495,709
10,646 153 3 4 351,012 (101,511) 2,147 3,382,456
- - - - - - - 4,149,322 - - - - - - - - - - - - (40,754) - 73,370 - - - - - (40,754) - 73,370 4,149,322
(63,127) 153 3 4 310,258 206,615 75,517 1,459,577
380,423 62,629 147,305 26,349 154,359 (4,030,357) 14,168 62,885,600
- - - - - - - (5,918)
380,423 62,629 147,305 26,349 154,359 (4,030,357) 14,168 62,879,682
$ 317,296 $ 62,782 $ 147,308 $ 26,353 $ 464,617 $ (3,823,742) $ 89,685 $ 64,339,259
66
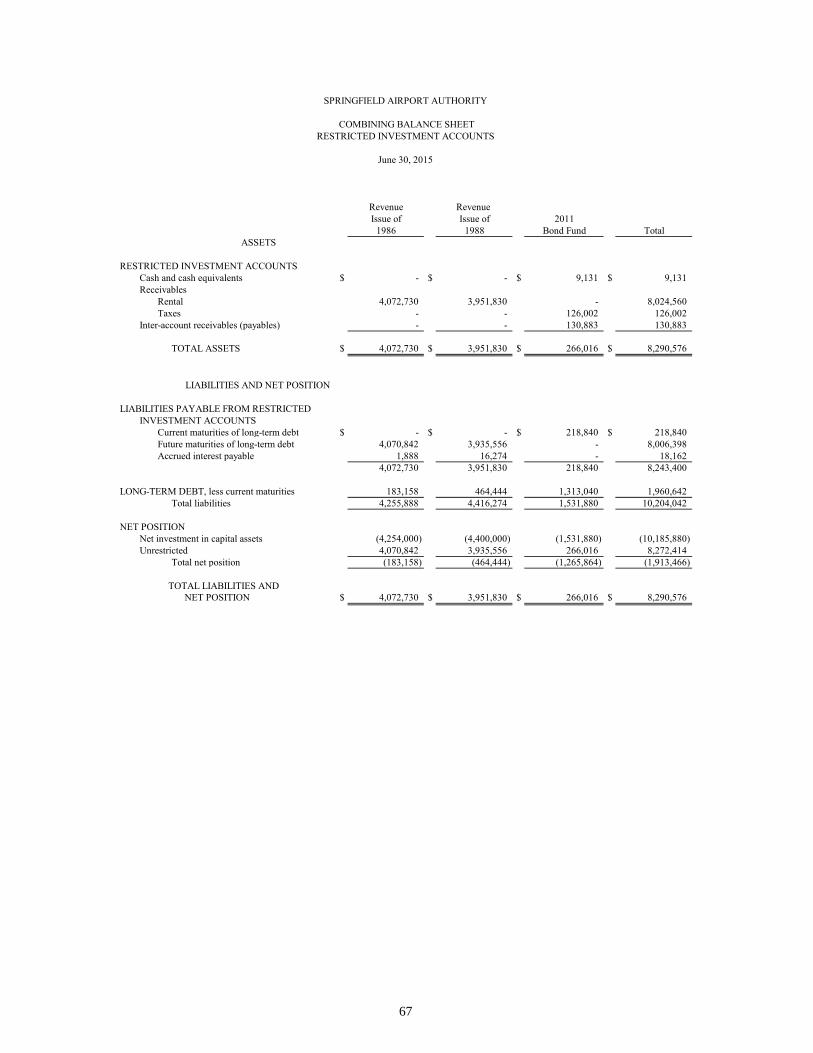
Revenue Revenue Issue of Issue of 2011
1986 1988 Bond Fund TotalASSETS
RESTRICTED INVESTMENT ACCOUNTSCash and cash equivalents $ - $ - $ 9,131 $ 9,131 Receivables
Rental 4,072,730 3,951,830 - 8,024,560 Taxes - - 126,002 126,002
Inter-account receivables (payables) - - 130,883 130,883
TOTAL ASSETS $ 4,072,730 $ 3,951,830 $ 266,016 $ 8,290,576
LIABILITIES AND NET POSITION
LIABILITIES PAYABLE FROM RESTRICTEDINVESTMENT ACCOUNTS
Current maturities of long-term debt $ - $ - $ 218,840 $ 218,840 Future maturities of long-term debt 4,070,842 3,935,556 - 8,006,398 Accrued interest payable 1,888 16,274 - 18,162
4,072,730 3,951,830 218,840 8,243,400
LONG-TERM DEBT, less current maturities 183,158 464,444 1,313,040 1,960,642 Total liabilities 4,255,888 4,416,274 1,531,880 10,204,042
NET POSITIONNet investment in capital assets (4,254,000) (4,400,000) (1,531,880) (10,185,880) Unrestricted 4,070,842 3,935,556 266,016 8,272,414
Total net position (183,158) (464,444) (1,265,864) (1,913,466)
TOTAL LIABILITIES AND NET POSITION $ 4,072,730 $ 3,951,830 $ 266,016 $ 8,290,576
June 30, 2015
COMBINING BALANCE SHEET
SPRINGFIELD AIRPORT AUTHORITY
RESTRICTED INVESTMENT ACCOUNTS
67
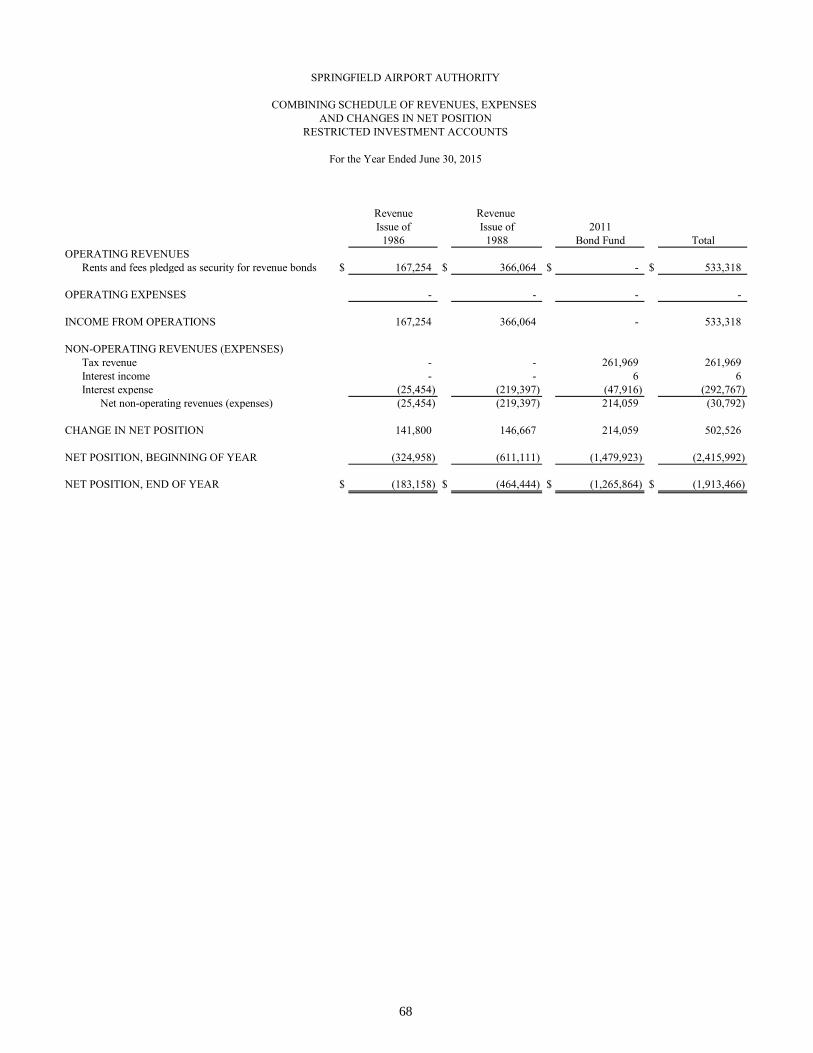
Revenue Revenue Issue of Issue of 2011
1986 1988 Bond Fund TotalOPERATING REVENUES
Rents and fees pledged as security for revenue bonds $ 167,254 $ 366,064 $ - $ 533,318
OPERATING EXPENSES - - - -
INCOME FROM OPERATIONS 167,254 366,064 - 533,318
NON-OPERATING REVENUES (EXPENSES)Tax revenue - - 261,969 261,969 Interest income - - 6 6 Interest expense (25,454) (219,397) (47,916) (292,767)
Net non-operating revenues (expenses) (25,454) (219,397) 214,059 (30,792)
CHANGE IN NET POSITION 141,800 146,667 214,059 502,526
NET POSITION, BEGINNING OF YEAR (324,958) (611,111) (1,479,923) (2,415,992)
NET POSITION, END OF YEAR $ (183,158) $ (464,444) $ (1,265,864) $ (1,913,466)
COMBINING SCHEDULE OF REVENUES, EXPENSES
SPRINGFIELD AIRPORT AUTHORITY
AND CHANGES IN NET POSITIONRESTRICTED INVESTMENT ACCOUNTS
For the Year Ended June 30, 2015
68

ActualUnder/(Over)
PERSONNEL Budget Actual BudgetCompensation $ 2,243,571 $ 2,251,249 $ (7,678) Overtime 55,092 64,271 (9,179) Holidays 42,770 39,598 3,172 Other pay 28,994 78,421 (49,427) IMRF and FICA 483,539 545,862 (62,323) Employee insurance 435,839 448,478 (12,639) Post Employment Benefits 9,003 3,808 5,195 Training 37,250 36,769 481 Education 2,096 6,539 (4,443) Official business 3,400 3,344 56 Uniforms 9,340 7,798 1,542 Board expense 975 1,088 (113)
Total 3,351,869 3,487,225 (135,356)
SERVICESLegal and litigation 65,800 86,465 (20,665) Audit and accounting services 26,500 26,450 50 Computer services 11,855 8,145 3,710 Engineering and architectural 4,000 2,848 1,152 Professional services 53,010 51,742 1,268 Insurance 80,200 73,311 6,889 Dues and subscriptions 20,594 19,269 1,325 Advertising 175,000 231,054 (56,054) Telephones 43,471 37,235 6,236 Property taxes 50,000 51,184 (1,184) Electricity 327,250 330,368 (3,118) Gas 38,000 28,933 9,067 Water and sewer 23,760 16,180 7,580 Equipment rental/maintenance 6,880 4,218 2,662 Disposal service 9,460 8,880 580 Vehicle repairs 3,750 26,999 (23,249) Electrical repairs 7,750 3,028 4,722 Heating, ventilating and A/C repairs 3,160 554 2,606 Plumbing repairs 2,300 2,081 219
(continued)
For the Year Ended June 30, 2015
SPRINGFIELD AIRPORT AUTHORITYSCHEDULE OF EXPENSESBUDGET AND ACTUAL
OPERATIONS AND MAINTENANCE
69

ActualUnder/(Over)
SERVICES - Continued Budget Actual BudgetRadio repairs $ 200 $ - $ 200 Communications equipment/repair 1,748 2,460 (712) Rental properties 3,600 3,200 400 Roof repairs 1,500 5,450 (3,950) Elevator/escalator 5,675 3,849 1,826 Signage 3,736 2,884 852 Fuel farm parts - 5,585 (5,585) Other maintenance/repairs 2,760 2,166 594 Miscellaneous 29,095 34,800 (5,705)
Total 1,001,054 1,069,338 (68,284)
MATERIALS AND SUPPLIESOffice supplies 9,967 7,887 2,080 Software/hardware 17,450 12,951 4,499 Printing 4,850 2,475 2,375 Postage 4,410 4,037 373 Promotions 1,500 - 1,500 Staff development 165 - 165 Fuel and oil for vehicles 82,924 73,790 9,134 Sand 560 134 426 Fuel Parts & Equipment 6,590 - 6,590 Asphalt, concrete & stone 15,685 10,180 5,505 Landscape 1,585 2,457 (872) Chemicals 44,092 49,377 (5,285) Fertilizer 1,777 - 1,777 Vehicle parts 56,689 55,653 1,036 Vehicle replacement 86,224 - 86,224 Electrical parts 23,298 28,056 (4,758) Heating, ventilating and A/C parts 7,969 8,216 (247) Plumbing parts 3,653 2,062 1,591 Hardware 5,889 6,671 (782) Signage 570 431 139 Paint 17,255 42,255 (25,000) Hand tools 1,305 1,515 (210) Janitor supplies 24,453 22,970 1,483
(continued)
For the Year Ended June 30, 2015
SPRINGFIELD AIRPORT AUTHORITYSCHEDULE OF EXPENSESBUDGET AND ACTUAL
OPERATIONS AND MAINTENANCE
70

ActualUnder/(Over)
MATERIALS AND SUPPLIES - Continued Budget Actual BudgetResidential rental properties $ 12,425 $ 12,283 $ 142 Commercial rental properties 3,000 12,521 (9,521) Safety supplies 5,655 7,854 (2,199) Identification 1,830 5,458 (3,628) Supplies - Sky Club 950 1,075 (125) Liquor 2,000 2,082 (82) Merchandise 2,000 1,054 946 Miscellaneous 8,365 16,426 (8,061)
Total 455,085 389,870 65,215
EQUIPMENTOffice 1,300 - 1,300 Furniture - 699 (699) Groundskeeping 1,117 60 1,057 Custodial 1,150 1,042 108 Radios 640 1,031 (391) Special tools 1,500 1,664 (164)
Total 5,707 4,496 1,211
GRAND TOTAL $ 4,813,715 4,950,929 $ (137,214)
OPERATIONS AND MAINTENANCE EXPENSESINCLUDED ELSEWHERE
Capital Improvement Account 14,800 Post Employment Benefits and Worker's Compensation Compliance Fund 73,773 South Quadrant T-Hangers 7,514
LESS OPERATIONS AND MAINTENANCE EXPENSESSHOWN ELSEWHERE
IMRF & FICA (545,862)
OPERATIONS AND MAINTENANCE EXPENSES PER STATEMENT OF REVENUES, EXPENSES AND CHANGES IN NET POSITION $ 4,501,154
For the Year Ended June 30, 2015
SPRINGFIELD AIRPORT AUTHORITYSCHEDULE OF EXPENSESBUDGET AND ACTUAL
OPERATIONS AND MAINTENANCE
71
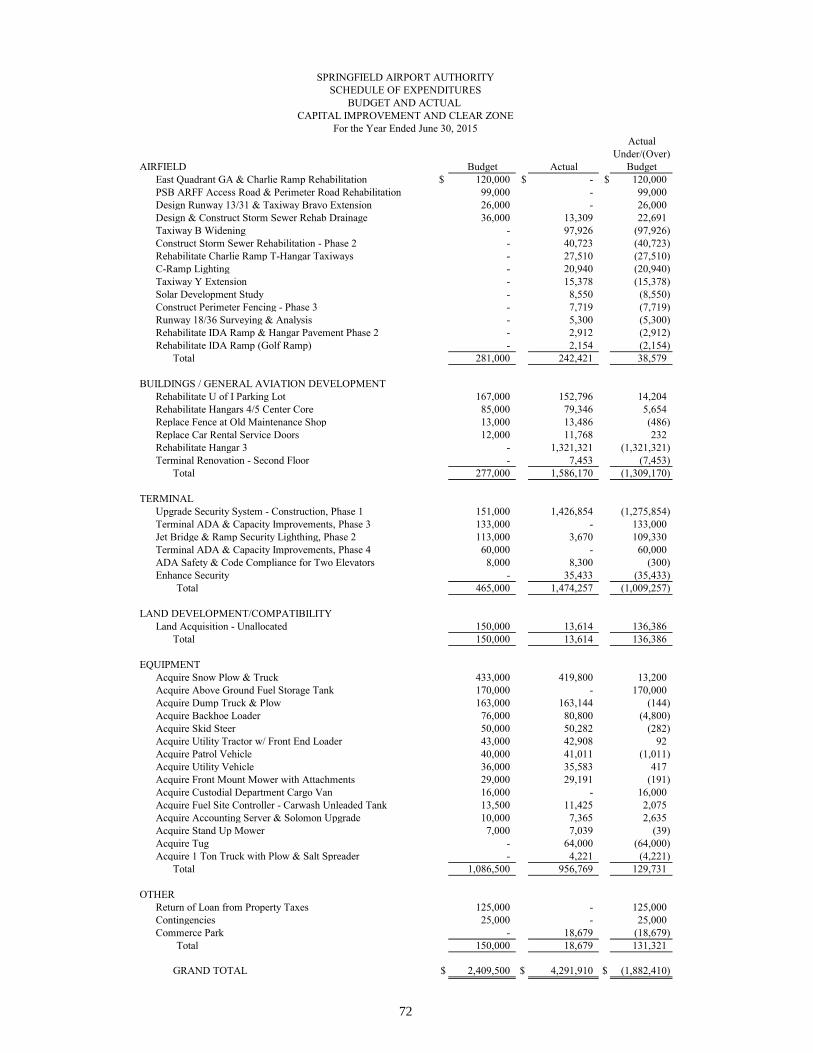
ActualUnder/(Over)
AIRFIELD Budget Actual BudgetEast Quadrant GA & Charlie Ramp Rehabilitation $ 120,000 $ - $ 120,000 PSB ARFF Access Road & Perimeter Road Rehabilitation 99,000 - 99,000 Design Runway 13/31 & Taxiway Bravo Extension 26,000 - 26,000 Design & Construct Storm Sewer Rehab Drainage 36,000 13,309 22,691 Taxiway B Widening - 97,926 (97,926) Construct Storm Sewer Rehabilitation - Phase 2 - 40,723 (40,723) Rehabilitate Charlie Ramp T-Hangar Taxiways - 27,510 (27,510) C-Ramp Lighting - 20,940 (20,940) Taxiway Y Extension - 15,378 (15,378) Solar Development Study - 8,550 (8,550) Construct Perimeter Fencing - Phase 3 - 7,719 (7,719) Runway 18/36 Surveying & Analysis - 5,300 (5,300) Rehabilitate IDA Ramp & Hangar Pavement Phase 2 - 2,912 (2,912) Rehabilitate IDA Ramp (Golf Ramp) - 2,154 (2,154)
Total 281,000 242,421 38,579
BUILDINGS / GENERAL AVIATION DEVELOPMENTRehabilitate U of I Parking Lot 167,000 152,796 14,204 Rehabilitate Hangars 4/5 Center Core 85,000 79,346 5,654 Replace Fence at Old Maintenance Shop 13,000 13,486 (486) Replace Car Rental Service Doors 12,000 11,768 232 Rehabilitate Hangar 3 - 1,321,321 (1,321,321) Terminal Renovation - Second Floor - 7,453 (7,453)
Total 277,000 1,586,170 (1,309,170)
TERMINALUpgrade Security System - Construction, Phase 1 151,000 1,426,854 (1,275,854) Terminal ADA & Capacity Improvements, Phase 3 133,000 - 133,000 Jet Bridge & Ramp Security Lighthing, Phase 2 113,000 3,670 109,330 Terminal ADA & Capacity Improvements, Phase 4 60,000 - 60,000 ADA Safety & Code Compliance for Two Elevators 8,000 8,300 (300) Enhance Security - 35,433 (35,433)
Total 465,000 1,474,257 (1,009,257)
LAND DEVELOPMENT/COMPATIBILITYLand Acquisition - Unallocated 150,000 13,614 136,386
Total 150,000 13,614 136,386
EQUIPMENTAcquire Snow Plow & Truck 433,000 419,800 13,200 Acquire Above Ground Fuel Storage Tank 170,000 - 170,000 Acquire Dump Truck & Plow 163,000 163,144 (144) Acquire Backhoe Loader 76,000 80,800 (4,800) Acquire Skid Steer 50,000 50,282 (282) Acquire Utility Tractor w/ Front End Loader 43,000 42,908 92 Acquire Patrol Vehicle 40,000 41,011 (1,011) Acquire Utility Vehicle 36,000 35,583 417 Acquire Front Mount Mower with Attachments 29,000 29,191 (191) Acquire Custodial Department Cargo Van 16,000 - 16,000 Acquire Fuel Site Controller - Carwash Unleaded Tank 13,500 11,425 2,075 Acquire Accounting Server & Solomon Upgrade 10,000 7,365 2,635 Acquire Stand Up Mower 7,000 7,039 (39) Acquire Tug - 64,000 (64,000) Acquire 1 Ton Truck with Plow & Salt Spreader - 4,221 (4,221)
Total 1,086,500 956,769 129,731
OTHERReturn of Loan from Property Taxes 125,000 - 125,000 Contingencies 25,000 - 25,000 Commerce Park - 18,679 (18,679)
Total 150,000 18,679 131,321
GRAND TOTAL $ 2,409,500 $ 4,291,910 $ (1,882,410)
For the Year Ended June 30, 2015
SPRINGFIELD AIRPORT AUTHORITYSCHEDULE OF EXPENDITURES
BUDGET AND ACTUAL CAPITAL IMPROVEMENT AND CLEAR ZONE
72

THIS PAGE INTENTIONALLY LEFT BLANK
~ ~ ~
~ 0 ~ ~ STATISTICAL SECTION
:J ~
~ 0 ~ ~
~ 0 ~ ~ ~
~
u z ~
~ ~ (/)


STATISTICAL SECTION (Unaudited)
The Statistical Section presents comparative data for revenue, expenses, obligation coverage, demographic statistics, schedule of insurance in force and industry specific statistics. Statistical schedules differ from financial statements because they usually cover more than one fiscal year and may present non-accounting data. These schedules reflect social and economic data and financial trends of the Authority. Financial Trends & Revenue Capacity These schedules contain trend information to help the reader understand how the Authority’s financial performances and well-being have changed over time. Also contained in these schedules is information to help the reader understand the Authority’s most significant revenue sources and the Authority’s capacity to insure itself against risk. Debt Capacity These schedules present information to help the reader assess the affordability of the Authority’s current levels of outstanding debt and also the ability of the Authority to issue additional debt in the future. Operating Information These schedules contain information to help the reader understand and to provide context for the Authority’s operations and how this relates to the Authority’s financial position. Economic & Demographic Information These schedules offer demographic and economic indicators to help the reader understand the environment within which the Authority’s financial activities take place.
73

THIS PAGE INTENTIONALLY LEFT BLANK
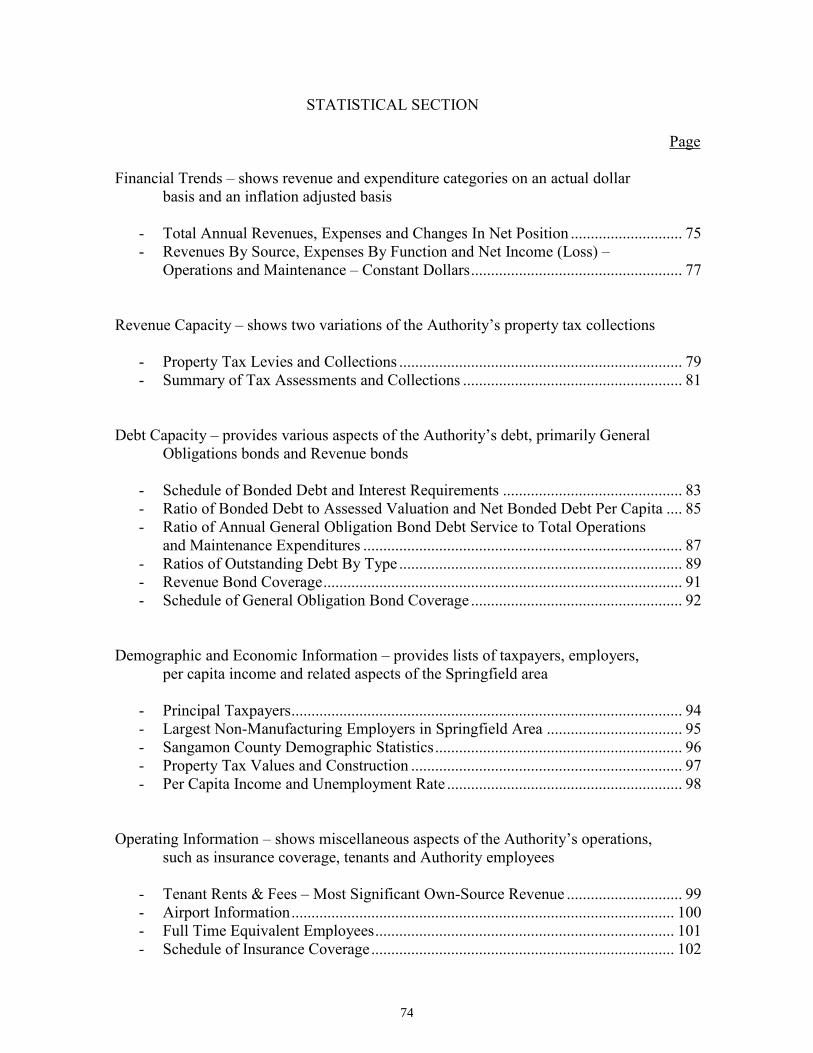
STATISTICAL SECTION
Page Financial Trends – shows revenue and expenditure categories on an actual dollar
basis and an inflation adjusted basis
- Total Annual Revenues, Expenses and Changes In Net Position ............................ 75 - Revenues By Source, Expenses By Function and Net Income (Loss) –
Operations and Maintenance – Constant Dollars ..................................................... 77 Revenue Capacity – shows two variations of the Authority’s property tax collections
- Property Tax Levies and Collections ....................................................................... 79 - Summary of Tax Assessments and Collections ....................................................... 81
Debt Capacity – provides various aspects of the Authority’s debt, primarily General
Obligations bonds and Revenue bonds
- Schedule of Bonded Debt and Interest Requirements ............................................. 83 - Ratio of Bonded Debt to Assessed Valuation and Net Bonded Debt Per Capita .... 85 - Ratio of Annual General Obligation Bond Debt Service to Total Operations and Maintenance Expenditures ................................................................................ 87 - Ratios of Outstanding Debt By Type ....................................................................... 89 - Revenue Bond Coverage .......................................................................................... 91 - Schedule of General Obligation Bond Coverage ..................................................... 92
Demographic and Economic Information – provides lists of taxpayers, employers, per capita income and related aspects of the Springfield area
- Principal Taxpayers .................................................................................................. 94 - Largest Non-Manufacturing Employers in Springfield Area .................................. 95 - Sangamon County Demographic Statistics .............................................................. 96 - Property Tax Values and Construction .................................................................... 97 - Per Capita Income and Unemployment Rate ........................................................... 98
Operating Information – shows miscellaneous aspects of the Authority’s operations, such as insurance coverage, tenants and Authority employees
- Tenant Rents & Fees – Most Significant Own-Source Revenue ............................. 99 - Airport Information ................................................................................................ 100 - Full Time Equivalent Employees ........................................................................... 101 - Schedule of Insurance Coverage ............................................................................ 102
74

2015 2014 2013 2012OPERATING REVENUES
Rents, fees and grants $ 3,680,996 $ 3,833,034 $ 3,732,852 $ 4,469,962
NON-OPERATING REVENUESTax revenue 2,727,424 2,701,034 2,583,646 2,559,104 Interest income 15,293 15,145 18,781 23,690 Passenger facility charges 350,812 359,349 263,964 257,472 Farm income, net 178,666 184,434 186,998 170,381 Micellaneous income 495,709 44,898 62,233 77,725
Total non-operating revenues 3,767,904 3,304,860 3,115,622 3,088,372
Total revenues 7,448,900 7,137,894 6,848,474 7,558,334
OPERATING EXPENSESOperations and maintenance 4,501,154 4,513,294 4,376,368 5,543,596 Depreciation 4,706,181 4,781,878 4,640,015 4,290,753 IMRF and FICA 545,862 482,870 418,427 394,182
Total operating expenses 9,753,197 9,778,042 9,434,810 10,228,531
NON-OPERATING EXPENSESInterest expense 385,448 408,796 469,224 523,873 Bond issuance costs - - - 53,260 Other - - - -
Total non-operating expenses 385,448 408,796 469,224 577,133
Total expenses 10,138,645 10,186,838 9,904,034 10,805,664
CONTRIBUTION REVENUE 4,149,322 4,128,395 2,782,832 8,039,227
CHANGE IN NET POSITION $ 1,459,577 $ 1,079,451 $ (272,728) $ 4,791,897
NET POSITION AT END OF YEAR COMPOSED OF:Net investment in capital assets $ 50,616,692 $ 51,280,188 $ 50,877,282 $ 51,415,629 Restricted 956,729 765,429 804,797 1,122,020 Unrestricted 12,765,838 10,834,065 10,118,152 9,535,310
Total net position $ 64,339,259 $ 62,879,682 $ 61,800,231 $ 62,072,959
SPRINGFIELD AIRPORT AUTHORITYTOTAL ANNUAL REVENUES, EXPENSES AND CHANGES IN NET POSITION
FOR THE YEARS ENDED JUNE 30,
75

2011 2010 2009 2008 2007 2006
$ 3,355,451 $ 3,155,996 $ 3,180,091 $ 4,517,735 $ 4,270,913 $ 4,099,862
2,370,645 2,247,733 2,269,344 2,237,056 2,154,341 2,059,848 25,595 9,710 28,684 116,439 183,147 131,056
253,117 235,919 197,571 256,024 234,704 324,228 131,940 115,627 106,826 107,206 99,447 97,864
55,151 59,814 33,712 2,592 17,486 24,445 2,836,448 2,668,803 2,636,137 2,719,317 2,689,125 2,637,441
6,191,899 5,824,799 5,816,228 7,237,052 6,960,038 6,737,303
4,068,912 4,258,627 3,956,960 5,003,707 4,803,266 3,169,972 4,079,179 3,901,064 3,779,128 3,790,542 3,901,116 3,920,161
410,913 351,933 290,475 449,267 311,676 298,486 8,559,004 8,511,624 8,026,563 9,243,516 9,016,058 7,388,619
415,898 434,159 442,391 648,510 869,809 827,164 - - - - - - - - - 60 154 414
415,898 434,159 442,391 648,570 869,963 827,578
8,974,902 8,945,783 8,468,954 9,892,086 9,886,021 8,216,197
5,353,072 3,103,521 7,479,018 3,144,123 1,022,283 3,987,301
$ 2,570,069 $ (17,463) $ 4,826,292 $ 489,089 $ (1,903,700) $ 2,508,407
$ 46,722,746 $ 45,178,212 $ 45,241,246 $ 46,631,020 $ 45,738,513 $ 46,843,449 1,079,679 1,225,474 902,762 955,161 1,133,908 1,088,026 9,478,637 8,307,307 8,584,448 2,315,983 2,540,654 3,385,300
$ 57,281,062 $ 54,710,993 $ 54,728,456 $ 49,902,164 $ 49,413,075 $ 51,316,775
SPRINGFIELD AIRPORT AUTHORITYTOTAL ANNUAL REVENUES, EXPENSES AND CHANGES IN NET POSITION
FOR THE YEARS ENDED JUNE 30,
76

2015 2014 2013 2012Revenues
Airlines 360,050$ 325,583$ 325,591$ 345,792$ Fixed Base Operations 201,152 195,469 193,707 194,974 Government 307,054 397,259 407,801 344,635 Terminal 524,047 494,574 518,264 613,729 Car Rental 333,191 371,337 335,795 337,582 East Quadrant 169,550 166,071 160,288 165,746 Other Tenants 279,082 276,039 263,062 257,251 Non-Tenants 2,120,098 2,143,640 2,225,085 2,818,893
Total 4,294,223 4,369,970 4,429,592 5,078,601
ExpensesPersonnel 2,817,783 2,837,493 2,748,297 2,740,317Services 884,956 1,007,870 1,018,640 2,194,810Materials and Services 40,271 393,415 431,863 303,321Equipment 9,227 10,897 8,987 7,172
Total 3,752,236 4,249,675 4,207,786 5,245,620
Net Income 541,987$ 120,296$ 221,806$ (167,019)$
CPI-U as of June 30 238.6 238.3 233.5 229.5
Full Time Equivalent Employees 42 40 40 40
SPRINGFIELD AIRPORT AUTHORITY
Revenues By Source, Expenses By Function And Net Income (Loss)Operations and Maintenance
Presented in Constant Dollars (2006 = 100)Last Ten Fiscal Years
77

2011 2010 2009 2008 2007 2006
339,911$ 340,569$ 358,767$ 359,784$ 288,785$ 385,891$ 191,130 180,858 190,802 217,543 224,476 217,132 216,564 214,187 203,890 198,671 198,673 161,613 589,677 515,384 475,002 523,371 316,708 269,256 321,653 287,637 362,264 353,673 362,250 364,626 173,784 193,064 201,643 195,760 207,945 194,252 246,107 240,909 245,774 200,203 191,303 199,713
2,213,674 2,118,495 2,133,575 2,057,240 2,269,501 1,981,111 4,292,498 4,091,103 4,171,717 4,106,245 4,059,641 3,773,595
2,634,580 2,620,325 2,534,340 2,628,335 2,503,583 2,339,213 1,064,108 1,075,133 1,052,423 2,082,151 2,224,149 801,216
296,656 254,871 241,728 262,505 240,337 225,863 8,026 15,003 7,872 25,612 10,645 18,977
4,003,369 3,965,332 3,836,362 4,998,603 4,978,715 3,385,270
289,129$ 125,771$ 335,355$ (892,358)$ (919,075)$ 388,325$
225.7 218.0 215.7 218.8 208.4 202.9
37 38 37 38 40 41
SPRINGFIELD AIRPORT AUTHORITY
Revenues By Source, Expenses By Function And Net Income (Loss)Operations and Maintenance
Presented in Constant Dollars (2006 = 100)Last Ten Fiscal Years
78
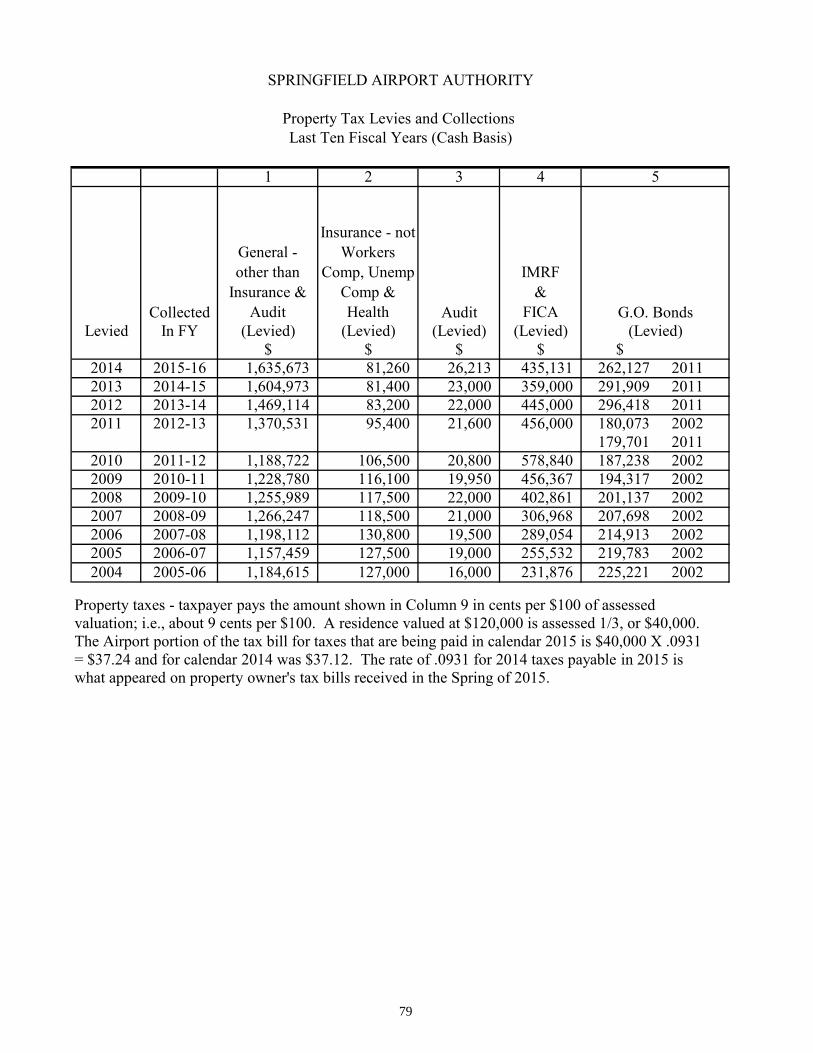
1 2 3 4
Collected
General - other than
Insurance & Audit
Insurance - not Workers
Comp, Unemp Comp & Health Audit
IMRF &
FICALevied In FY (Levied) (Levied) (Levied) (Levied)
$ $ $ $ $2014 2015-16 1,635,673 81,260 26,213 435,131 262,127 20112013 2014-15 1,604,973 81,400 23,000 359,000 291,909 20112012 2013-14 1,469,114 83,200 22,000 445,000 296,418 20112011 2012-13 1,370,531 95,400 21,600 456,000 180,073 2002
179,701 20112010 2011-12 1,188,722 106,500 20,800 578,840 187,238 20022009 2010-11 1,228,780 116,100 19,950 456,367 194,317 20022008 2009-10 1,255,989 117,500 22,000 402,861 201,137 20022007 2008-09 1,266,247 118,500 21,000 306,968 207,698 20022006 2007-08 1,198,112 130,800 19,500 289,054 214,913 20022005 2006-07 1,157,459 127,500 19,000 255,532 219,783 20022004 2005-06 1,184,615 127,000 16,000 231,876 225,221 2002
SPRINGFIELD AIRPORT AUTHORITY
Property Tax Levies and Collections Last Ten Fiscal Years (Cash Basis)
G.O. Bonds(Levied)
5
Property taxes - taxpayer pays the amount shown in Column 9 in cents per $100 of assessed valuation; i.e., about 9 cents per $100. A residence valued at $120,000 is assessed 1/3, or $40,000. The Airport portion of the tax bill for taxes that are being paid in calendar 2015 is $40,000 X .0931 = $37.24 and for calendar 2014 was $37.12. The rate of .0931 for 2014 taxes payable in 2015 is what appeared on property owner's tax bills received in the Spring of 2015.
79

6 7 8 9 10 11
Total
Assessed Valuation of
Property in SAA Taxing
Percent Change In Assessed
Tax Rate Per $100 of
Assessed
Collections As A Percentage of
Taxes(Levied) District Valuation Valuation Collections (Levied)
$ $ $ $2,440,404 2,621,271,487 +3.0% 0.0931 Not known yet Not known yet2,360,292 2,543,734,049 +0.8% 0.0928 2,354,402 99.8%2,315,732 2,524,291,679 +0.3% 0.0916 2,380,775 102.9%*2,303,305 2,515,694,634 +0.7% 0.0914 2,298,798 99.8%
2,082,100 2,499,276,456 +1.7% 0.0832 2,078,060 99.8%2,015,514 2,458,447,961 +2.2% 0.0820 2,020,470 100.2%1,999,487 2,405,307,860 +2.0% 0.0831 2,008,419 100.4%1,920,413 2,357,425,760 +4.3% 0.0814 1,916,503 99.8%1,852,379 2,259,967,062 +5.6% 0.0820 1,858,238 100.3%1,779,274 2,139,460,418 +5.1% 0.0832 1,788,950 100.5%1,784,712 2,036,105,331 +2.0% 0.0877 1,794,675 100.6%
SPRINGFIELD AIRPORT AUTHORITY
Property Tax Levies and CollectionsLast Ten Fiscal Years (Cash Basis) - Continued
Column 6 = Column 1 through 5; Column 9 = column 6 divided by column 7. Some years this calculation will be slightly different than the amount shown in column 9 because of the difference between taxes levied as shown on this page and taxes actually extended by the County. * Higher than normal due to about $71,900 Park South Tax Increment Financing (TIF) funds received.
80

SPRINGFIELD AIRPORT AUTHORITY
SUMMARY OF TAX ASSESSMENTS AND COLLECTIONS
FOR TAXES ASSESSED IN 2014, 2013, 2012, 2011, 2010, 2009, 2008, 2007, 2006, AND 2005
Replacement EstimatedGeneral Accounts: Valuation Rate Taxes Tax Tax
2014 2,621,271,487$ .0665 1,743,146$ 294,802$ 2,037,948$ 2013 2,543,734,049 .0672 1,709,389 272,893 1,982,282 2012 2,524,291,679 .0622 1,570,109 272,193 1,842,302 2011 2,515,694,634 .0590 1,484,260 265,202 1,749,462 2010 2,499,276,456 .0525 1,312,120 288,285 1,600,405 2009 2,458,447,961 .0555 1,364,439 222,302 1,586,741 2008 2,405,307,860 .0580 1,395,079 274,788 1,669,867 2007 2,357,425,762 .0596 1,405,026 314,126 1,719,152 2006 2,259,967,062 .0597 1,349,200 293,748 1,642,948 2005 2,139,460,418 .0610 1,305,071 269,243 1,574,314
General ObligationBond And Interest Accounts:
2014 2,621,271,487 .0100 262,127 - 262,127 2013 2,543,734,049 .0115 292,529 - 292,529 2012 2,524,291,679 .0118 297,866 - 297,866 2011 2,515,694,634 .0143 359,744 - 359,744 2010 2,499,276,456 .0075 187,446 - 187,446 2009 2,458,447,961 .0079 194,217 - 194,217 2008 2,405,307,860 .0084 202,046 - 202,046 2007 2,357,425,762 .0088 207,454 - 207,454 2006 2,259,967,062 .0095 214,697 - 214,697 2005 2,139,460,418 .0103 220,364 - 220,364
I.M.R.F. And F.I.C.A. Account:
2014 2,621,271,487 .0166 435,131 - 435,131 2013 2,543,734,049 .0141 358,667 - 358,667 2012 2,524,291,679 .0176 444,275 - 444,275 2011 2,515,694,634 .0181 455,341 - 455,341 2010 2,499,276,456 .0232 579,832 - 579,832 2009 2,458,447,961 .0186 457,271 - 457,271 2008 2,405,307,860 .0167 401,686 - 401,686 2007 2,357,425,762 .0130 306,465 - 306,465 2006 2,259,967,062 .0128 289,276 - 289,276 2005 2,139,460,418 .0119 254,596 - 254,596
Total All Accounts:
2014 2,621,271,487 .0931 2,440,404 294,802 2,735,206 2013 2,543,734,049 .0928 2,360,585 272,893 2,633,478 2012 2,524,291,679 .0916 2,312,250 272,193 2,584,443 2011 2,515,694,634 .0914 2,299,345 265,202 2,564,547 2010 2,499,276,456 .0832 2,079,398 288,285 2,367,683 2009 2,458,447,961 .0820 2,015,927 222,302 2,238,229 2008 2,405,307,860 .0831 1,998,811 274,788 2,273,599 2007 2,357,425,762 .0814 1,918,945 314,126 2,233,071 2006 2,259,967,062 .0820 1,853,173 293,748 2,146,921 2005 2,139,460,418 .0832 1,780,031 269,243 2,049,274
Property Tax
81

SPRINGFIELD AIRPORT AUTHORITY
SUMMARY OF TAX ASSESSMENTS AND COLLECTIONS
FOR TAXES ASSESSED IN 2014, 2013, 2012, 2011, 2010, 2009, 2008, 2007, 2006, AND 2005
General Accounts:
2014201320122011201020092008200720062005
General ObligationBond And Interest Accounts:
2014201320122011201020092008200720062005
I.M.R.F. And F.I.C.A. Account:
2014201320122011201020092008200720062005
Total All Accounts:
2014201320122011201020092008200720062005
ReserveFor Losses Estimate Amount Receivableand Costs Collectible Collected At June 30
34,863$ 2,003,085$ 1,116,779$ 886,306$ 34,188 1,948,094 1,064,410 883,684 31,402 1,810,900 985,398 825,502 29,685 1,719,777 925,248 794,529 26,242 1,574,163 890,770 683,393 27,290 1,559,451 851,404 708,047 27,901 1,641,966 880,255 761,711 28,101 1,691,051 910,695 780,356 26,969 1,615,979 853,393 762,586 26,101 1,548,213 811,216 736,997
5,243 256,884 130,882 126,002 5,850 286,679 143,416 143,263 5,957 291,909 145,455 146,454 7,195 352,549 171,700 180,849 3,749 183,697 91,096 92,601 3,884 190,333 94,285 96,048 4,041 198,005 93,899 104,106 4,149 203,305 95,082 108,223 4,298 210,399 99,119 111,280 4,407 215,957 99,860 116,097
8,703 426,428 217,265 209,163 7,174 351,493 175,841 175,652 8,886 435,389 216,949 218,440 9,107 446,234 217,328 228,906
11,597 568,235 281,789 286,446 9,145 448,126 221,987 226,139 8,034 393,652 186,680 206,972 6,129 300,336 140,461 159,875 5,781 283,495 130,919 152,576 5,092 249,504 113,796 135,708
48,809 2,686,397 1,464,926 1,221,471 47,212 2,586,266 1,383,667 1,202,599 46,245 2,538,198 1,347,802 1,190,396 45,987 2,518,560 1,314,276 1,204,284 41,588 2,326,095 1,263,655 1,062,440 40,319 2,197,910 1,167,676 1,030,234 39,976 2,233,623 1,160,834 1,072,789 38,379 2,194,692 1,146,238 1,048,454 37,048 2,109,873 1,083,431 1,026,442 35,600 2,013,674 1,024,872 988,802
82

GeneralRevenue Revenue Obligation
Fiscal Year Ended Bond Bond Bonds June 30, of 1986 of 1988 of 2011
2016 -$ -$ 218,840$ 2017 4,254,000 - 218,840 2018 - - 218,840 2019 - 4,400,000 218,840 2020 - - 218,840 2021 - - 218,840 2022 - - 218,840
4,254,000$ 4,400,000$ 1,531,880$
Total Principal Requirements 10,185,880$ Less Assets Restricted for Debt Service (8,033,691)
Net General Bonded Debt 2,152,189$
Principal Requirements
SPRINGFIELD AIRPORT AUTHORITY
SCHEDULE OF BONDED DEBT AND INTEREST REQUIREMENTS
June 30, 2015
83
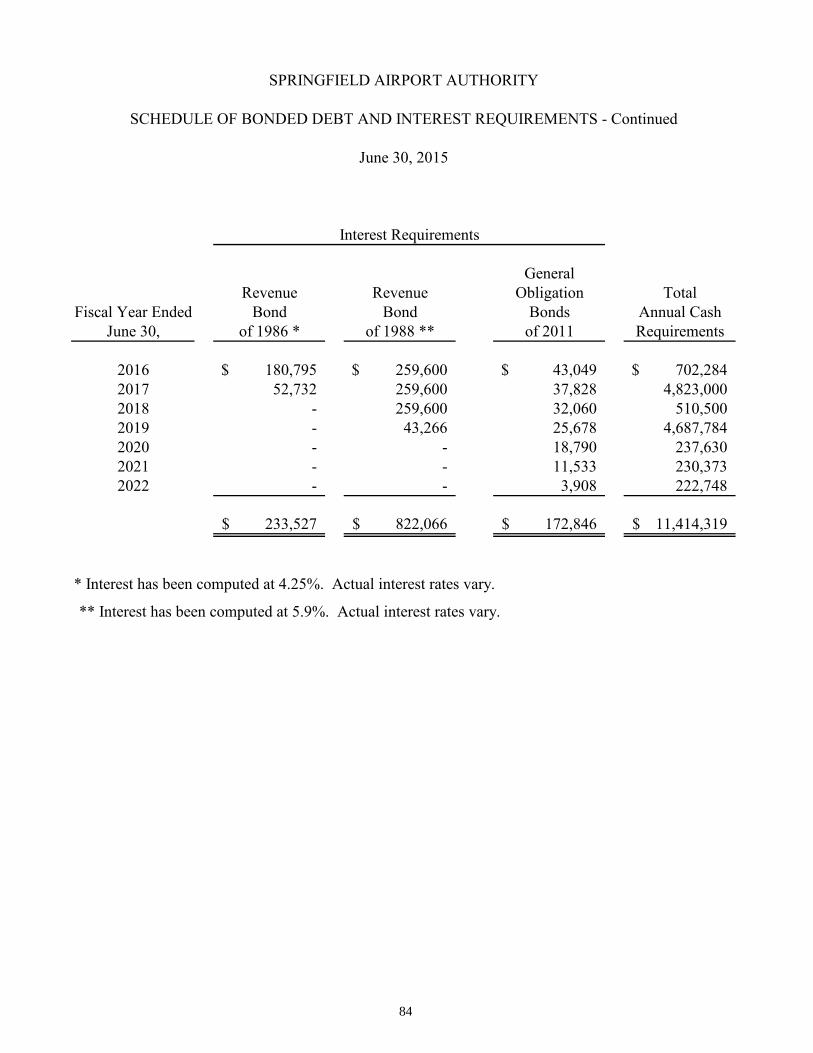
GeneralRevenue Revenue Obligation Total
Fiscal Year Ended Bond Bond Bonds Annual Cash June 30, of 1986 * of 1988 ** of 2011 Requirements
2016 180,795$ 259,600$ 43,049$ 702,284$ 2017 52,732 259,600 37,828 4,823,000 2018 - 259,600 32,060 510,500 2019 - 43,266 25,678 4,687,784 2020 - - 18,790 237,630 2021 - - 11,533 230,373 2022 - - 3,908 222,748
233,527$ 822,066$ 172,846$ 11,414,319$
* Interest has been computed at 4.25%. Actual interest rates vary.
** Interest has been computed at 5.9%. Actual interest rates vary.
SPRINGFIELD AIRPORT AUTHORITY
SCHEDULE OF BONDED DEBT AND INTEREST REQUIREMENTS - Continued
June 30, 2015
Interest Requirements
84

SPRINGFIELD AIRPORT AUTHORITY
Ratio of Bonded Debt to Assessed Valuation and Net Bonded Debt Per Capita Last Ten Fiscal Years
Collected in Calendar Year (and Levied in Previous Year to Year Shown)
2015 2014 2013 2012 2011Assessed Valuation ofSAA Taxing District 2,621,271,487$ 2,543,734,049$ 2,524,291,679$ 2,515,694,634$ 2,499,276,456$
.75% Limit 19,659,536 19,078,005 18,932,188 18,867,710 18,744,573
General Obligation Debt 1,531,880 1,775,790 2,019,700 2,316,650 345,300
Available G.O. Debt 18,127,656 17,302,215 16,912,488 16,551,060 18,399,273
Percentage of G.O. Debtto Assessed Valuation 0.058% 0.070% 0.080% 0.092% 0.014%
Percentage of G.O. Debt to Limit 7.79% 9.31% 10.67% 12.28% 1.84%
Population of TaxingDistrict* 138,535 139,152 139,152 138,174 138,174
Net Bonded Debt Per Capita $11.06 $12.76 $14.51 $16.77 $2.50
*Source: Springfield Sangamon County Regional Planning Commission
85

SPRINGFIELD AIRPORT AUTHORITY
Ratio of Bonded Debt to Assessed Valuation and Net Bonded Debt Per CapitaLast Ten Fiscal Years
Collected in Calendar Year (and Levied in Previous Year to Year Shown) - Continued
2010 2009 2008 2007 2006Assessed Valuation ofSAA Taxing District 2,458,447,961$ 2,405,307,860$ 2,357,425,760$ 2,259,967,092$ 2,139,460,418$
.75% Limit 18,438,360 18,039,809 17,680,693 16,949,753 16,045,953
General Obligation Debt 732,900 977,200 1,221,500 1,465,800 1,710,100
Available G.O. Debt 17,705,460 17,062,609 16,459,193 15,483,953 14,335,853
Percentage of G.O. Debtto Assessed Valuation 0.030% 0.041% 0.051% 0.065% 0.080%
Percentage of G.O. Debt to Limit 3.97% 5.42% 6.91% 8.65% 10.66%
Population of TaxingDistrict* 134,839 134,839 134,839 134,839 134,839
Net Debt Per Capita $5.44 $7.25 $9.06 $10.87 $12.68
86

2015 2014 2013 2012Principal 618,163$ 470,956$ 801,510$ * 425,750$ Interest 384,725 416,763 469,224 523,873 Total debt service 1,002,888$ 887,719$ 1,270,734$ 949,623$
Operating expenses (not including depreciation) 5,047,016$ 4,990,246$ 4,794,795$ 5,937,778$ Plus: Principal 618,163 470,956 801,510 425,750 Total expenditures 5,665,179$ 5,461,202$ 5,596,305$ 6,363,528$
Ratio of G.O. Bond debt service to total expenditures 17.7% 16.3% 22.7% 14.9%
* Includes refinanced debt of $3,950,000
Last Ten Fiscal Years
SPRINGFIELD AIRPORT AUTHORITY
Ratio of Annual General Obligation Bond Debt Service to Total Operationsand Maintenance Expenditures
87
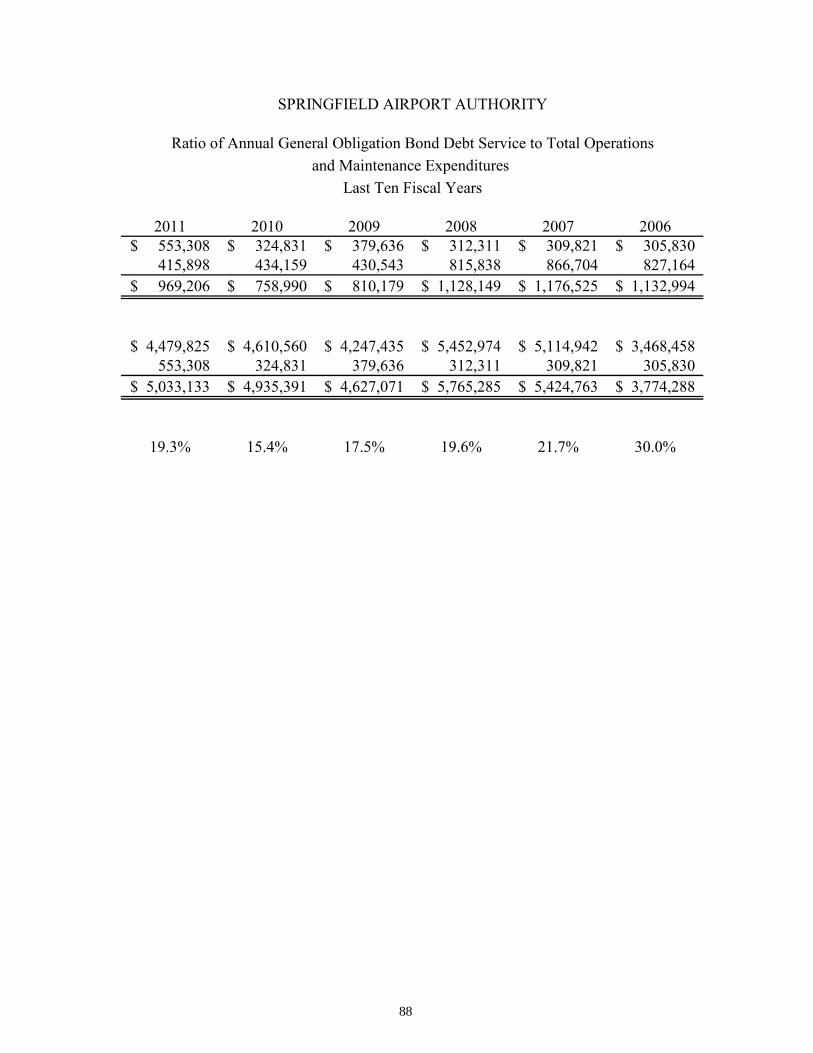
2011 2010 2009 2008 2007 2006553,308$ 324,831$ 379,636$ 312,311$ 309,821$ 305,830$ 415,898 434,159 430,543 815,838 866,704 827,164 969,206$ 758,990$ 810,179$ 1,128,149$ 1,176,525$ 1,132,994$
4,479,825$ 4,610,560$ 4,247,435$ 5,452,974$ 5,114,942$ 3,468,458$ 553,308 324,831 379,636 312,311 309,821 305,830
5,033,133$ 4,935,391$ 4,627,071$ 5,765,285$ 5,424,763$ 3,774,288$
19.3% 15.4% 17.5% 19.6% 21.7% 30.0%
SPRINGFIELD AIRPORT AUTHORITY
Ratio of Annual General Obligation Bond Debt Service to Total Operationsand Maintenance Expenditures
Last Ten Fiscal Years
88

SPRINGFIELD AIRPORT AUTHORITY
Ratios of Outstanding Debt By TypeLast Ten Fiscal Years
Notes - Notes -Fiscal Revenue G.O. SE Quadrant Leasehold Notes - Year Bonds Bonds T-Hangars Improvements Vendor
2015 8,654,000$ 1,531,880$ 3,426,862$ 1,285,870$ 100,000$
2014 8,654,000 1,775,790 3,625,769 - -
2013 8,654,000 2,019,700 3,852,815 - -
2012 8,654,000 2,316,650 4,037,798 319,577 -
2011 8,654,000 345,300 4,194,254 416,221 -
2010 8,654,000 732,900 2,276,183 - -
2009 8,654,000 977,200 2,356,714 - -
2008 8,654,000 1,221,500 2,413,043 - -
2007 17,404,000 1,465,800 2,468,554 - -
2006 17,404,000 1,710,100 2,520,599 - -
89
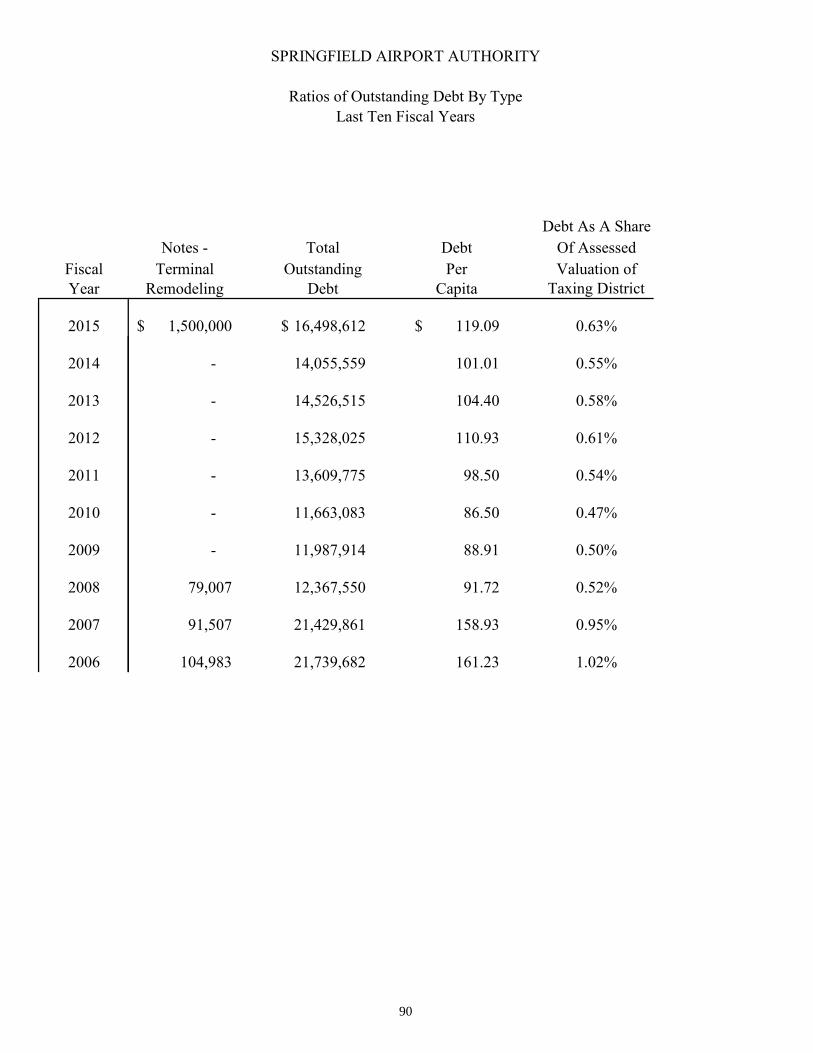
SPRINGFIELD AIRPORT AUTHORITY
Ratios of Outstanding Debt By TypeLast Ten Fiscal Years
FiscalYear
2015
2014
2013
2012
2011
2010
2009
2008
2007
2006
Debt As A ShareNotes - Total Debt Of Assessed
Terminal Outstanding Per Valuation ofRemodeling Debt Capita Taxing District
1,500,000$ 16,498,612$ 119.09$ 0.63%
- 14,055,559 101.01 0.55%
- 14,526,515 104.40 0.58%
- 15,328,025 110.93 0.61%
- 13,609,775 98.50 0.54%
- 11,663,083 86.50 0.47%
- 11,987,914 88.91 0.50%
79,007 12,367,550 91.72 0.52%
91,507 21,429,861 158.93 0.95%
104,983 21,739,682 161.23 1.02%
90

SPRINGFIELD AIRPORT AUTHORITY
Revenue Bond Coverage
The Authority has three revenue bond issues currently outstanding: 1986 Revenue Bonds, 1988 Revenue Bonds and 1998 Revenue Bonds. In all three instances, the principal and interest are legally the obligation of UNC/CFC Acquisition Company, d/b/a Garrett Aviation Services, a Delaware Corporation, and said indebtedness is in turn the obligation of General Electric Company, a New York Corporation. Garrett Aviation Services, the user of the facilities funded by the bond issues, has since the original issue in 1981 (subsequently refunded by the 1986 Revenue Bonds) made all interest payments. The principal payments are due at the final maturity of each of the bond issues, these dates being October 15, 2016 (for the 1986 bonds); September 1, 2018 (for the 1988 bonds and February 1, 2008 (for the
1998 bonds).
The Authority has two revenue bond issues currently outstanding: 1986 Revenue Bonds and 1988 Revenue Bonds. In both instances, the principal and interest are legally the obligation of Garrett Aviation Services, LLC, d/b/a StandardAero. Honeywell International, Inc., formerly Allied-Signal, Inc. is the guarantor of both the 1986 and 1988 bond payments. Garrett Aviation Services, the user of the facilities funded by the bond issues, has since the original issue in 1981 (subsequently refunded by the 1986 Revenue Bonds) made all interest payments. The principal payments are due at the final maturity of each of the bond issues, these dates being October 15, 2016 (for the 1986 bonds) and September 1, 2018 (for the 1988 bonds).
91

THIS PAGE INTENTIONALLY LEFT BLANK
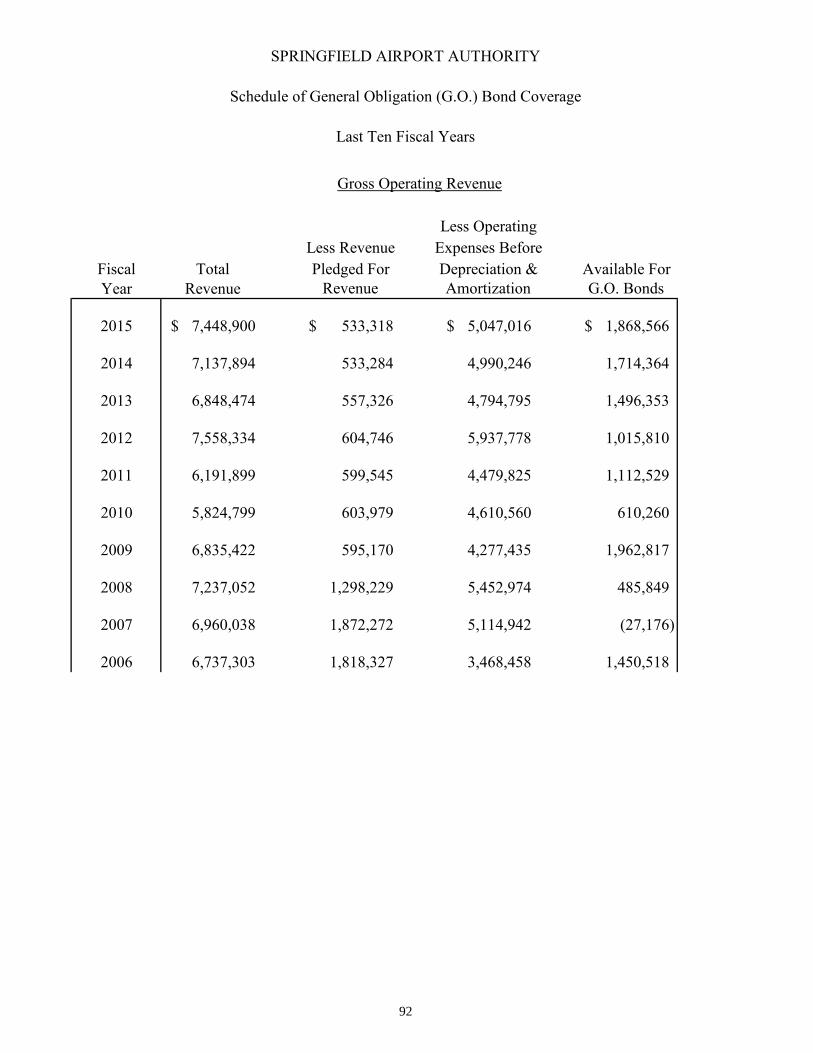
SPRINGFIELD AIRPORT AUTHORITY
Schedule of General Obligation (G.O.) Bond Coverage
Last Ten Fiscal Years
Less OperatingLess Revenue Expenses Before
Fiscal Total Pledged For Depreciation & Available ForYear Revenue Revenue Amortization G.O. Bonds
2015 7,448,900$ 533,318$ 5,047,016$ 1,868,566$
2014 7,137,894 533,284 4,990,246 1,714,364
2013 6,848,474 557,326 4,794,795 1,496,353
2012 7,558,334 604,746 5,937,778 1,015,810
2011 6,191,899 599,545 4,479,825 1,112,529
2010 5,824,799 603,979 4,610,560 610,260
2009 6,835,422 595,170 4,277,435 1,962,817
2008 7,237,052 1,298,229 5,452,974 485,849
2007 6,960,038 1,872,272 5,114,942 (27,176)
2006 6,737,303 1,818,327 3,468,458 1,450,518
Gross Operating Revenue
92

SPRINGFIELD AIRPORT AUTHORITY
Schedule of General Obligation (G.O.) Bond Coverage
Last Ten Fiscal Years
FiscalYear
2015
2014
2013
2012
2011
2010
2009
2008
2007
2006
CoveragePrincipal Interest Total (Times)
218,840$ 47,916$ 266,756$ 7.0
243,910 52,508 296,418 5.8
243,910 58,541 302,451 4.9
296,950 37,796 334,746 3.0
172,650 20,275 192,925 5.8
244,300 32,073 276,373 2.2
244,300 40,766 285,066 6.9
244,300 48,799 293,099 1.7
244,300 56,651 300,951 (0.1)
244,300 63,930 308,230 4.7
General Obligation Bond Requirement
93
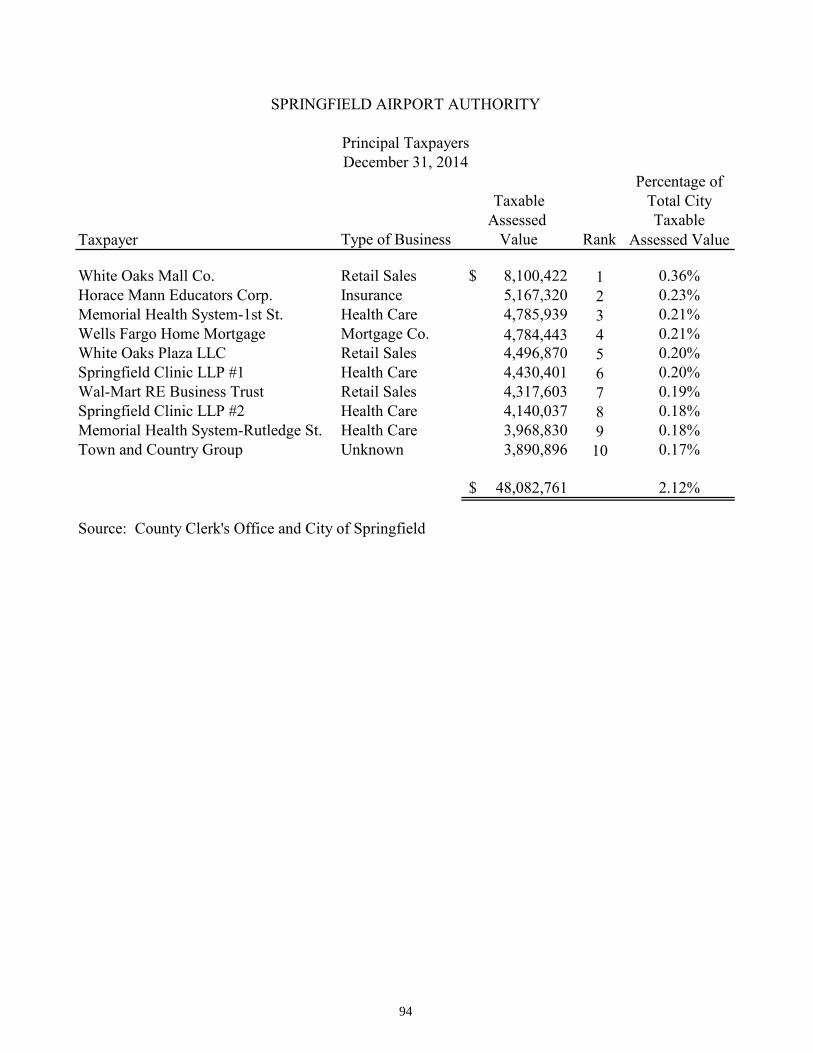
Percentage ofTaxable Total City
Assessed TaxableTaxpayer Type of Business Value Rank Assessed Value
White Oaks Mall Co. Retail Sales 8,100,422$ 1 0.36%Horace Mann Educators Corp. Insurance 5,167,320 2 0.23%Memorial Health System-1st St. Health Care 4,785,939 3 0.21%Wells Fargo Home Mortgage Mortgage Co. 4,784,443 4 0.21%White Oaks Plaza LLC Retail Sales 4,496,870 5 0.20%Springfield Clinic LLP #1 Health Care 4,430,401 6 0.20%Wal-Mart RE Business Trust Retail Sales 4,317,603 7 0.19%Springfield Clinic LLP #2 Health Care 4,140,037 8 0.18%Memorial Health System-Rutledge St. Health Care 3,968,830 9 0.18%Town and Country Group Unknown 3,890,896 10 0.17%
48,082,761$ 2.12%
Source: County Clerk's Office and City of Springfield
SPRINGFIELD AIRPORT AUTHORITY
Principal TaxpayersDecember 31, 2014
94
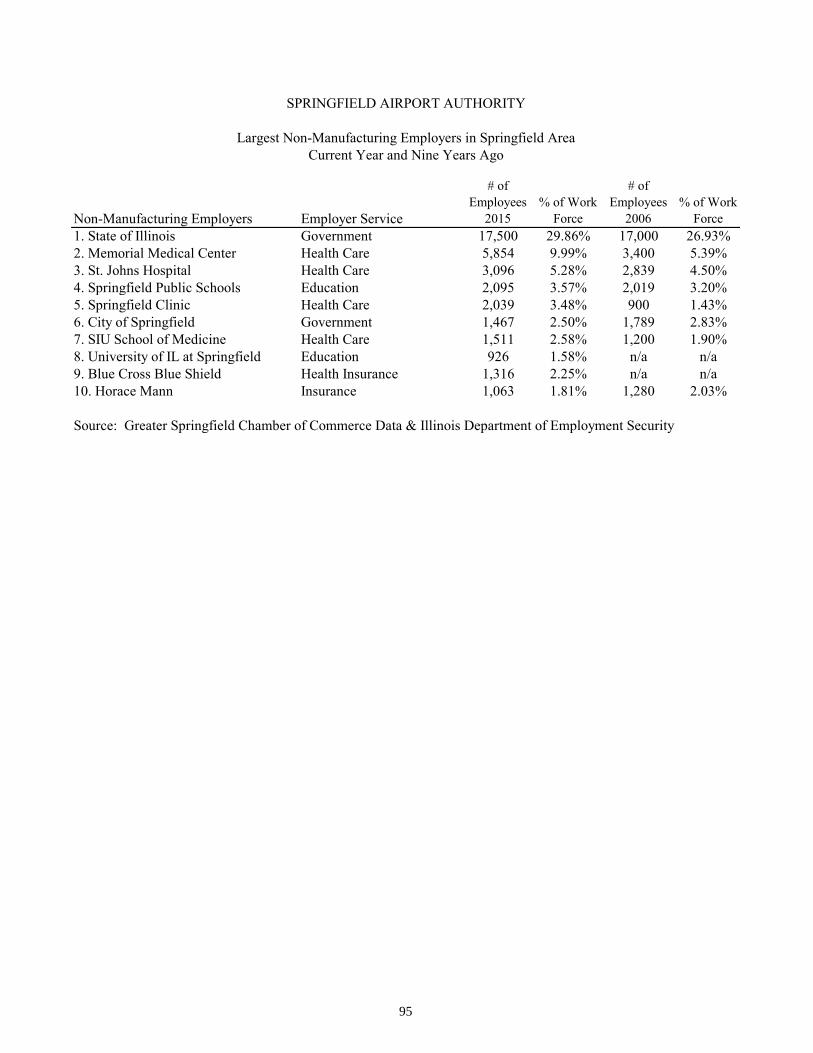
Non-Manufacturing Employers Employer Service
# of Employees
2015% of Work
Force
# of Employees
2006% of Work
Force1. State of Illinois Government 17,500 29.86% 17,000 26.93%2. Memorial Medical Center Health Care 5,854 9.99% 3,400 5.39%3. St. Johns Hospital Health Care 3,096 5.28% 2,839 4.50%4. Springfield Public Schools Education 2,095 3.57% 2,019 3.20%5. Springfield Clinic Health Care 2,039 3.48% 900 1.43%6. City of Springfield Government 1,467 2.50% 1,789 2.83%7. SIU School of Medicine Health Care 1,511 2.58% 1,200 1.90%8. University of IL at Springfield Education 926 1.58% n/a n/a9. Blue Cross Blue Shield Health Insurance 1,316 2.25% n/a n/a10. Horace Mann Insurance 1,063 1.81% 1,280 2.03%
Source: Greater Springfield Chamber of Commerce Data & Illinois Department of Employment Security
SPRINGFIELD AIRPORT AUTHORITY
Largest Non-Manufacturing Employers in Springfield AreaCurrent Year and Nine Years Ago
95
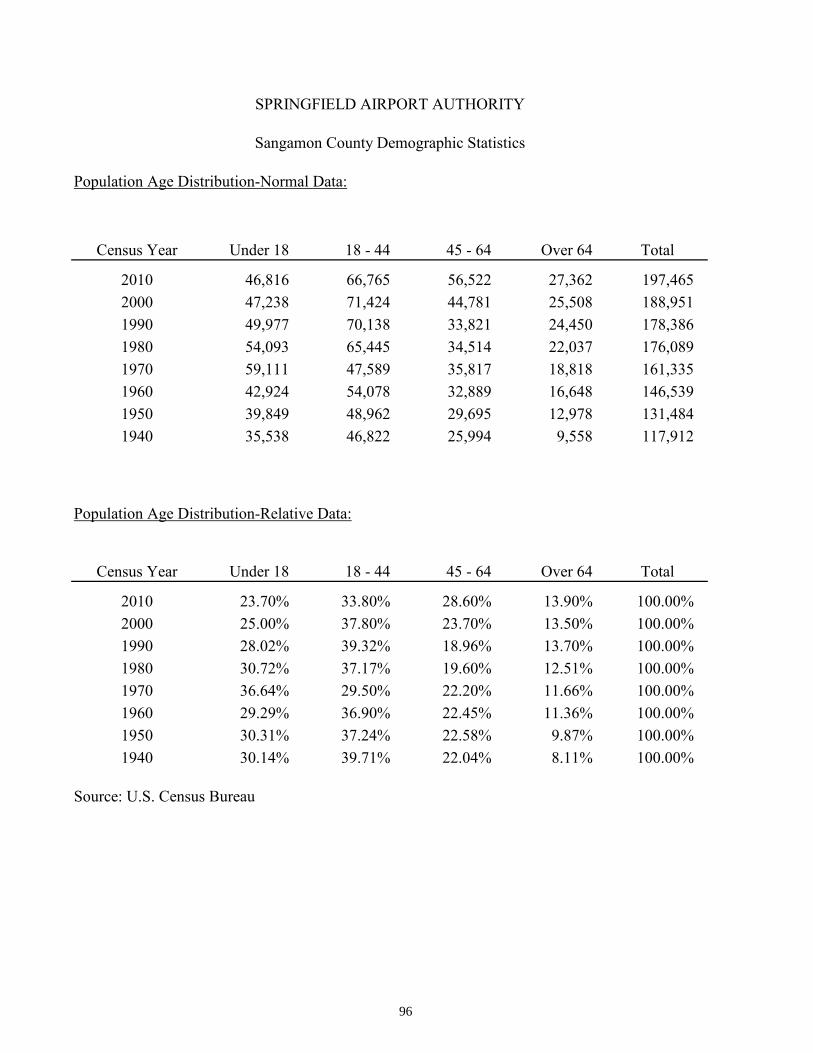
Population Age Distribution-Normal Data:
Census Year Under 18 18 - 44 Over 64 Total
2010 46,816 66,765 56,522 27,362 197,4652000 47,238 71,424 44,781 25,508 188,9511990 49,977 70,138 33,821 24,450 178,3861980 54,093 65,445 34,514 22,037 176,0891970 59,111 47,589 35,817 18,818 161,3351960 42,924 54,078 32,889 16,648 146,5391950 39,849 48,962 29,695 12,978 131,4841940 35,538 46,822 25,994 9,558 117,912
Population Age Distribution-Relative Data:
Census Year Under 18 18 - 44 45 - 64 Over 64 Total
2010 23.70% 33.80% 28.60% 13.90% 100.00%2000 25.00% 37.80% 23.70% 13.50% 100.00%1990 28.02% 39.32% 18.96% 13.70% 100.00%1980 30.72% 37.17% 19.60% 12.51% 100.00%1970 36.64% 29.50% 22.20% 11.66% 100.00%1960 29.29% 36.90% 22.45% 11.36% 100.00%1950 30.31% 37.24% 22.58% 9.87% 100.00%1940 30.14% 39.71% 22.04% 8.11% 100.00%
Source: U.S. Census Bureau
SPRINGFIELD AIRPORT AUTHORITY
Sangamon County Demographic Statistics
45 - 64
96

Building (1) Building (1) Average CalendarYear Permits Issued Permits Value Building Cost
$ $ $2014 3,310 161,782,726 48,877 2,270,421,746 2013 3,186 254,923,577 80,014 2,245,819,217 2012 3,520 193,633,649 55,010 2,237,598,949 2011 2,960 255,756,699 86,404 2,219,417,306 2010 3,326 207,229,681 62,306 2,178,101,932 2009 3,576 190,768,327 53,347 2,116,687,036 2008 3,196 198,228,372 62,024 2,059,575,896 2007 3,384 193,722,102 57,246 1,953,005,137 2006 3,786 187,264,987 49,462 1,841,511,751 2005 3,205 151,483,180 47,265 1,748,394,988
(1) Source: City of Springfield
(2) Source: County Clerk's Office and City of Springfield
Property Tax Value Total (2)
SPRINGFIELD AIRPORT AUTHORITY
City of Springfield
Property Tax Values and ConstructionLast Ten Years
97

Total Personal Unemployment Fiscal Year Population Income-MSA Per Capita Income Median Age Rate
2014 116,250 Not Available Not Available Not Available 5.6%
2013 116,250 $9,170,254 $43,307.00 40.0 7.5%
2012 116,250 $8,908,127 $42,025.00 39.9 8.3%
2011 116,250 $8,821,020 $41,899.00 38.2 8.4%
2010 116,250 $8,691,000 $41,286.00 37.9 8.1%
2009 118,033 $8,349,984 $40,109.00 37.0 10.1%
2008 117,096 $7,812,862 $37,672.00 36.7 7.1%
2007 117,096 $7,457,556 $36,229.00 37.2 5.4%
2006 111,454 $7,010,778 $35,237.00 36.9 5.1%
2005 111,454 $6,763,592 $33,699.00 36.9 5.1%
Source: Chamber of Commerce, Springfield Sangamon County Regional Planning Commissionand the U.S. Bureau of the Census.
SPRINGFIELD AIRPORT AUTHORITY
City of Springfield
Per Capita Income and Unemployment RateLast Ten Fiscal Years
98

Amount Paid Percent Amount Paid Percent Difference FromFY15 of Total FY14 of Total FY15 to FY14
U of I Extension 92,050$ 3% 74,613$ 3% 17,437$ United Airlines 243,814 8% 246,428 8% (2,614) TSA 101,284 4% 99,112 3% 2,172 SE Quadrant T-Hangars 315,640 11% 309,631 10% 6,009 Passenger Service Center 398,551 14% 376,147 13% 22,404 Avis 102,832 4% 110,095 4% (7,263) South Quadrant T-Hangars 149,808 5% 150,400 5% (592) Hertz 91,686 3% 105,497 4% (13,811) StandardAero/Garrett 90,400 3% 97,494 3% (7,094) Prairie Analytical 61,903 2% 61,878 2% 25 Budget 77,718 3% 94,189 3% (16,471) Illinois Division of Aeronautics 134,033 5% 257,541 9% (123,508) FAA - FSDO & SFA 93,736 3% 93,736 3% - Landmark / Horizon / McClelland 146,144 5% 97,977 3% 48,167 Lincoln Land Community College 91,816 3% 89,420 3% 2,396 American Airlines 162,756 6% 123,929 4% 38,827 Enterprise 119,581 4% 155,223 5% (35,642) Residential 142,819 5% 139,959 5% 2,860 All Other 255,730 9% 269,850 9% (14,120)
Total 2,872,301$ 100% 2,953,119$ 100% (80,818)$
The following revenue categories are not considered as tenants for purposes of this schedule:Taxes - General, Taxes - IMRF/FICA, Farm, Interest, Taxes - Replacement, Miscellaneous,Air Service Grant, Fuel Rates & Charges and Federal & State Grants.
At any given time, the Authority has leases with about 155 tenants occupying hangars for individual aircraft and about 85 leases with other tenants. This revenue is relatively stable - there is generally not a significant amount of tenantturnover in any given year. Over 95% of these leases have the payment to the Authority increaseby the Consumer Price Index (CPI-U), or the greater of the CPI-U or 2.5%, on an annual basis.
SPRINGFIELD AIRPORT AUTHORITY
Tenant Rents & FeesMost Significant Own-Source Revenue
99
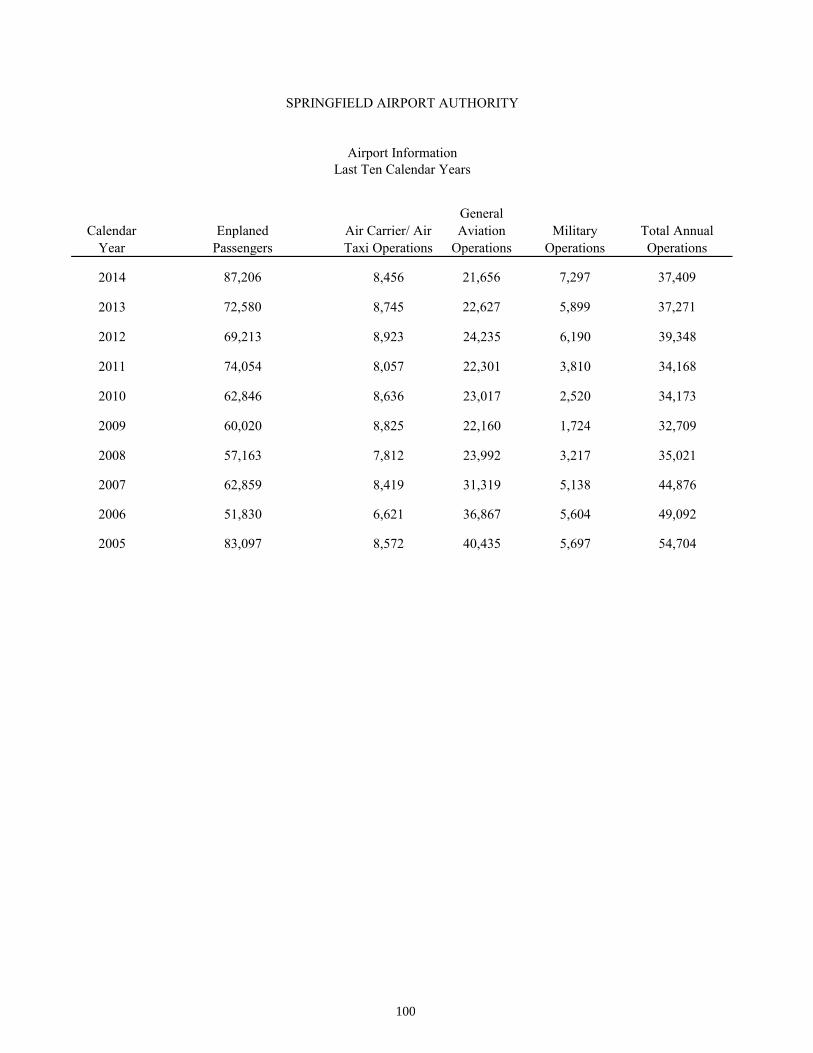
Calendar Year
Enplaned Passengers
Air Carrier/ Air Taxi Operations
General Aviation
OperationsMilitary
OperationsTotal Annual Operations
2014 87,206 8,456 21,656 7,297 37,409
2013 72,580 8,745 22,627 5,899 37,271
2012 69,213 8,923 24,235 6,190 39,348
2011 74,054 8,057 22,301 3,810 34,168
2010 62,846 8,636 23,017 2,520 34,173
2009 60,020 8,825 22,160 1,724 32,709
2008 57,163 7,812 23,992 3,217 35,021
2007 62,859 8,419 31,319 5,138 44,876
2006 51,830 6,621 36,867 5,604 49,092
2005 83,097 8,572 40,435 5,697 54,704
SPRINGFIELD AIRPORT AUTHORITY
Airport InformationLast Ten Calendar Years
100
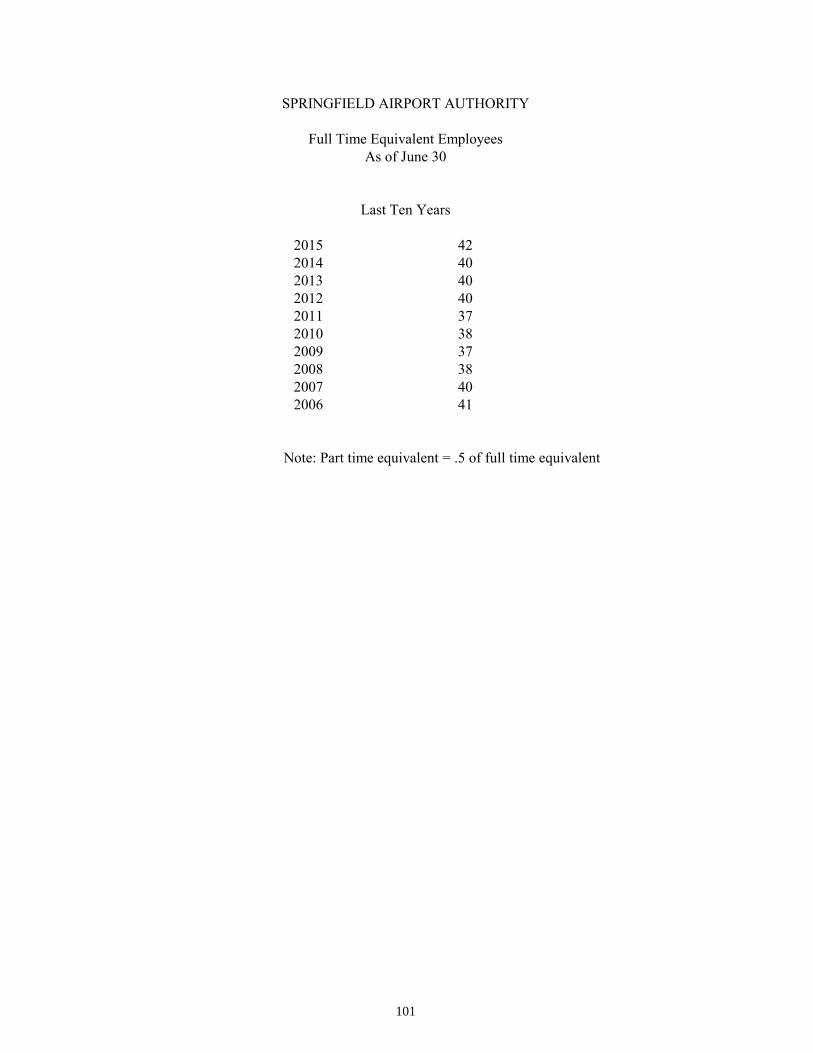
2015 422014 402013 402012 402011 372010 382009 372008 382007 402006 41
Note: Part time equivalent = .5 of full time equivalent
SPRINGFIELD AIRPORT AUTHORITY
Full Time Equivalent EmployeesAs of June 30
Last Ten Years
101
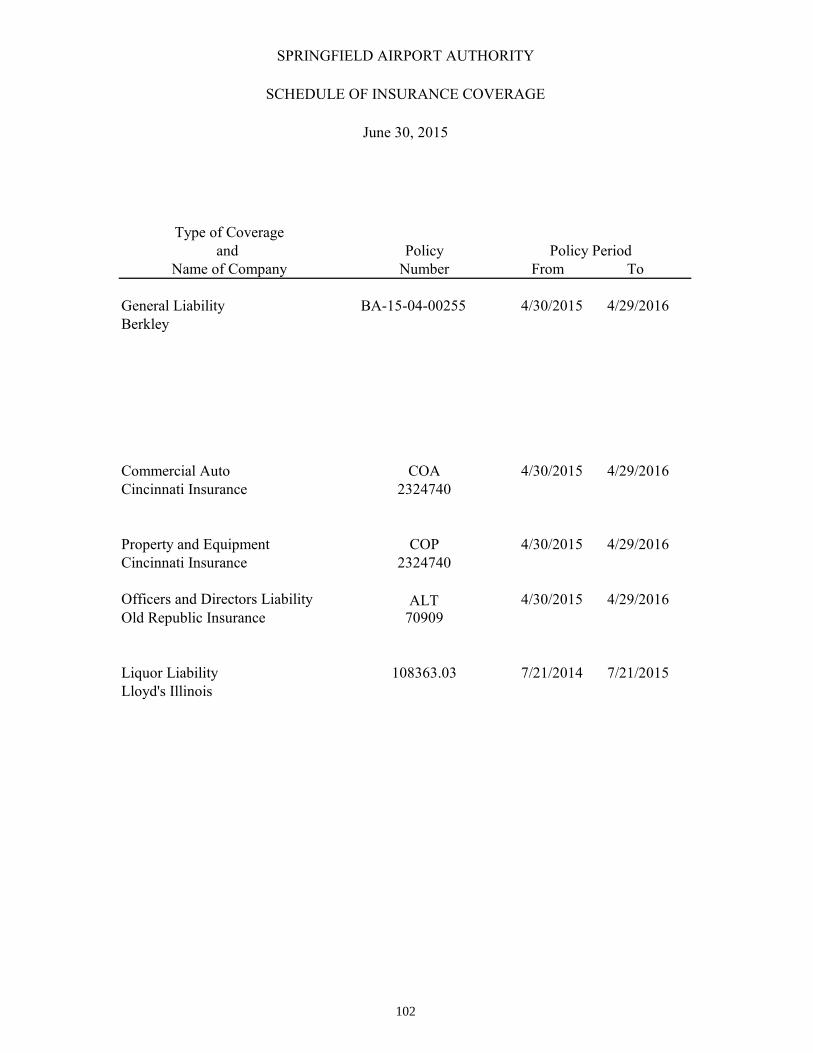
SPRINGFIELD AIRPORT AUTHORITY
SCHEDULE OF INSURANCE COVERAGE
June 30, 2015
Type of Coverageand Policy
Name of Company Number From To
General Liability BA-15-04-00255 4/30/2015 4/29/2016Berkley
Commercial Auto COA 4/30/2015 4/29/2016Cincinnati Insurance 2324740
Property and Equipment COP 4/30/2015 4/29/2016Cincinnati Insurance 2324740
Officers and Directors Liability ALT 4/30/2015 4/29/2016Old Republic Insurance 70909
Liquor Liability 108363.03 7/21/2014 7/21/2015Lloyd's Illinois
Policy Period
102
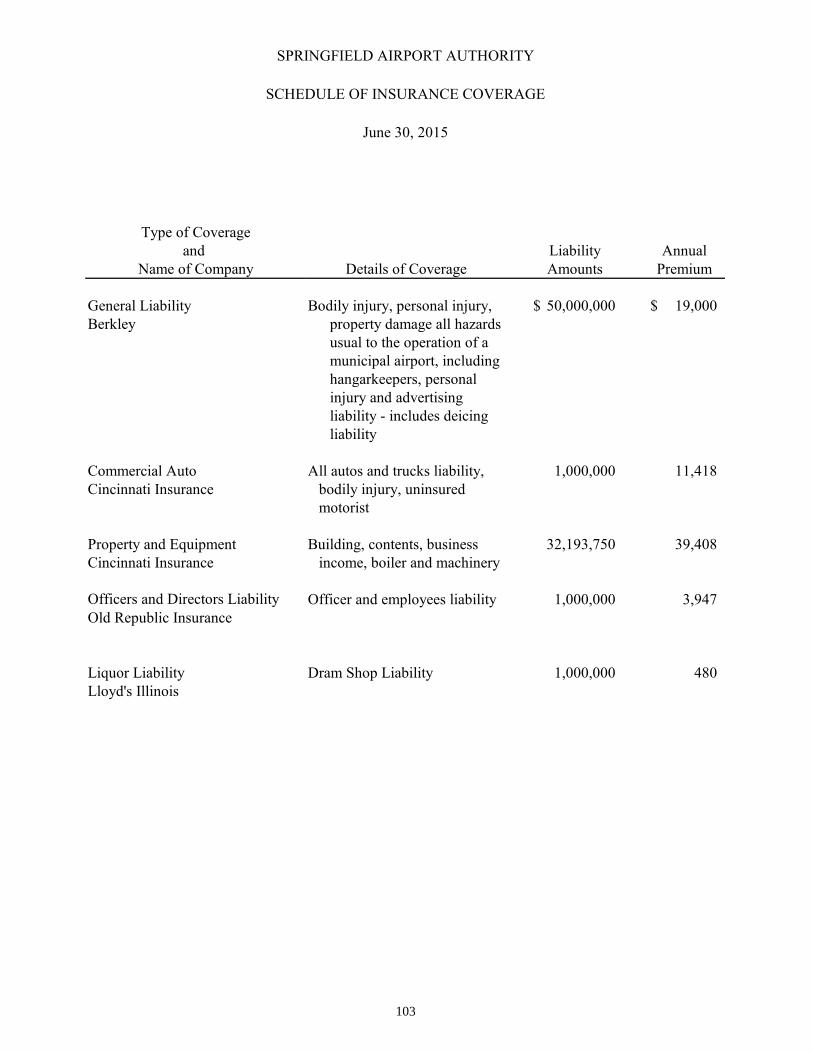
SPRINGFIELD AIRPORT AUTHORITY
SCHEDULE OF INSURANCE COVERAGE
June 30, 2015
Type of Coverageand
Name of Company
General LiabilityBerkley
Commercial AutoCincinnati Insurance
Property and EquipmentCincinnati Insurance
Officers and Directors LiabilityOld Republic Insurance
Liquor LiabilityLloyd's Illinois
Liability AnnualDetails of Coverage Amounts Premium
Bodily injury, personal injury, 50,000,000$ 19,000$ property damage all hazardsusual to the operation of amunicipal airport, including hangarkeepers, personal injury and advertising liability - includes deicingliability
All autos and trucks liability, 1,000,000 11,418 bodily injury, uninsuredmotorist
Building, contents, business 32,193,750 39,408 income, boiler and machinery
Officer and employees liability 1,000,000 3,947
Dram Shop Liability 1,000,000 480
103
THIS PAGE INTENTIONALLY LEFT BLANK
~ ~ ~
~ 0 ~ ~ PASSENGER FACILITY :J CHARGES
~
~ 0 ~ ~
~ 0 ~ ~ ~
~
u z ~
~ ~ (/)

104
ECK~ SCHAFER & PUNKE, LLP 1 11<11111 llj•l IIJ II \f I I II I
Independent Auditors' Report on Compliance with Requirements That Could Have a Direct and
Material Effect on the Passenger Facility Charge Program and on Intemal Control Over Compliance
Board of Commissioners Springl.ield Airport Authority Springfield, Illinois
Report on CompJiancc for the Passenger Facility Charge Program
We have audited Springfield Airport Authority's (the Authority) compliance with the types of compliance requirements described in the Passenger Facility Charge Audit Guide for Public Agencies, issued by the Federal Avialion Administration (Guide) that could have a direct and material effect on the passenger facility charge program for the year ended June 30,2015.
Management's Responsibility
Management is responsible for compliance wilh the requirements of laws and regulations applicable to its passenger faci li ty charge program.
Auditol's' Responsibility
Our responsibility is to express an opinion on compl iance of the Authority's passenger facility charge program based on our audit of the types of compliance requirements t'eferred to above. We conducted our audit of compliance in accordance with auditjng standards generally accepted in the United States of America; the standards applicable to financial audits contained in Govetnment Auditing Standatds, issued by the Comptroller General of the United States and the Guide. Those standards and the Guide require that we plan and perform the audit to obtain reasonable assurance about whether noncompliance with the types of compliance requirements Iefcrred to above that could have a direct and material effect on a n1a:jor federal program occurred. An audit includes examining, on a test basis, evidence about the Authority's compliance with those requirements and performing such other procedures as we considered necessary in the cil·cumstanccs.
We believe that our audit provides a reasonable basis for ow· opinion on compliance for the passenger facility chaJge program. However, our audit does not provide a legal determination of the Authority's compliance.
105
Opinion on the Passenger Facility Charge Program
In our opinion, Springfield Airport Authority complied, in all material respects, with the types of compliance requirements rcfened to above that could have a djrect and material effect on the passenger facility charge program for the year ended June 30, 2015.
Report on Internal Control Over Compliance
Management of the Authority is responsible for establishing and maintaining effective internal control over compliance with the types of compliance requirements referred to above. In planning and 1)erforming our audit of compliance, we considered the Authority's intema] control over compHance with lhe lypes of requirements that could have a direct and material effect on the passenger facility cl1argc program to determine the auditing procedures that are appropriate in the circumstances for the purpose of expr~ssing an opjnion on compliance for the passenger facility charge program and to test and report on internal control over compliance in accordance with tl1c Guide, but not for the purpose of expressing an opin ion on the effectiveness of internal control over compliance. Accordingly, we do not express an opinion on the effectiveness of the Authority's intcmal control over compliance.
J\ deficiency in internal control over compliance exists when the design or operation of a control ov01· compliance does not allow management or employees, in the normal course of performing thei r assigned functions, to prevent, or detect and correct, noncompliance with a type of compliance requirement of the passenger facility charge program on a timely basis. A mater;at weakness in internal control over compliance is a dciiciency, or combination of deficiencies, in internal control over compliance, such that there is a reasonable possibility that material noncompliance with a type of compliance requirement of the passenger facility charge program will not be prevented, or detected and conected, on a timely basis. A significant deficiency in internal control over compliance is a deficiency, or a combination of deficiencies, in internal control over compliance with a type of compliance requirement of the passenger faci lity charge program that is less severe tl1an a materiaJ wealmcss in internal control over compliance, yet important enough Lo merit attention by those charged with governance.
Our consideration of internal conlroJ over compliance was for the li mited purpose described in the first paragraph of this section and was not designed to identify all deficiencies in internal control over comr>liance that might be material weaknesses or significant deficiencies. We did not identify any deficiencies in inlernal conlroJ over compliance that we consider to be material weaknesses. However, material weaknesses may exist that have not been identified.
The purpose of this report on internal control over compliance is solely to describe the scope of our testing of internal control over compliance and the results of that testing based on the requirements of1.hc Guide. Accordingly, this report is not suitable for any other ptupose.
Springfield, Illinois November 5, 2015
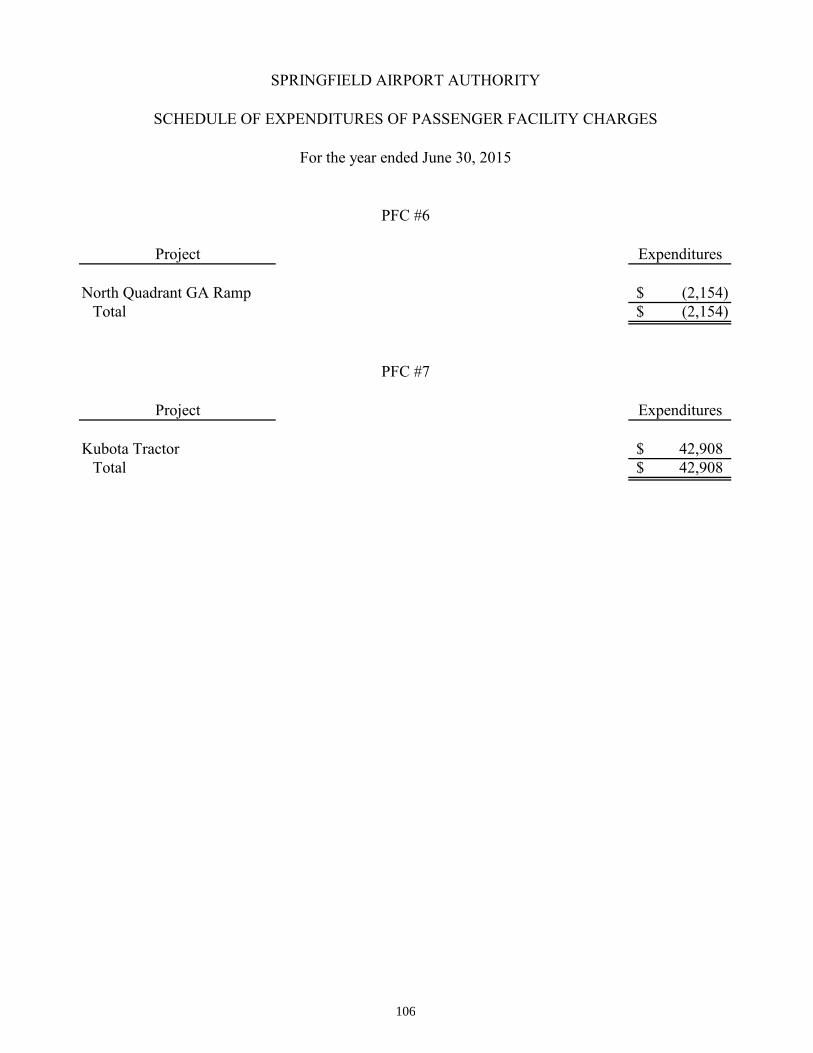
Project Expenditures
North Quadrant GA Ramp (2,154)$ Total (2,154)$
Project Expenditures
Kubota Tractor 42,908$ Total 42,908$
PFC #7
SPRINGFIELD AIRPORT AUTHORITY
For the year ended June 30, 2015
PFC #6
SCHEDULE OF EXPENDITURES OF PASSENGER FACILITY CHARGES
106

THIS PAGE INTENTIONALLY LEFT BLANK

~ ~ ~
~ 0 ~ ~ SINGLE AUDIT SECTION
:J ~
~ 0 ~ ~
~ 0 ~ ~ ~
~
u z ~
~ ~ (/)

107
ECK, SCHAFER & PUNKE, LLP ( I Rill II ll J•l hl ll ' \I I I II I
..... 5Mlllh S v.mHt ~~l!r r ( s1111n•lll"1'1 IIIJJI"'" a:.1101 ' II '12~·1 111 1 ,,. :·n "2'·' 1,1, 1'/WI'o i1fl11 1~~ < Ill
Independent Auditors' .Report on Intemal Control over Financial Reporting and on Compliance and Other Matters Based on an Audit of Financial Statements Performed in
Accordance with Government Auditing Standards
Board of Commissioners Springfield Airport Authority Springfield, Illinois
We have audited, in accordance with auditing standards generally accepted in the United States of America and the standards applicable to financial audits contained in Government Auditing Standards, issued by the Comptroller General of the United States, the baJauce sheet, stateme11t of revenues, expenses and changes in net position) and statement of cash flows, as of and for the year ended June 30, 2015, and the related notes to the financial statements which collectively comprise the basic finaucial statements of Springfield Airport Authority (the Authority), and have issued our report thereon dated November 5) 2015.
Internal Control Over Financial Reporting
In planning and performing our audit of the financial statements, we considered the Authority's internal conlrol over financial reporting (internal control) to determine the audit procedures that are appropriate in the circumstances for the purpose of expressing our opinion on the financial statements, but not for the purpose of expressing an opinion on the effectiveness of the Authority's internal control. Accordingly, we do not expfess an opinion on the effectiveness of the Authority's internal control.
A deficiency in. internal control exists when the design or operation of a control does not allow management or employees, in the normal course of performing their assigned functions, to prevent, or detect and correct, misstatements on a timely basis. A material weakness is a deficiency, or a combination of deficiencies, in internal control such that there is a reasonable possibility that a material misstatement ofthe entity,s financial statements will not be prevented, or detected and corrected; on a timely basis. A significant deficiency is a deficiency, or a combination of deficiencies, in internal control that is less severe than a material weakness, yet imp011,U1t enough to merit attention by those charged with governance.
108
Our consideration of internal controJ was for the .limited plU'pose described in the fi rst paragraph of this section and was not designed to identify all deficie11cies in intemal control that might be material weaknesses or significant deficiencies. Given these Jimitations, during our audit, we did not jdentify any deficiencies in intemal control that we consider to be material weaknesses. However, material weaknesses may exist that have not been identified.
Compliance and Othct· Matters
As p~nt of obtaining reasonable assurance about whether the Authority's financial statements are free from material misstatement, we perfonned tests of its compliance with certain provisions of laws, regulations, contracts and grant agreements, noncompliance with which could have a direct and material efiect on the determination of financial statement amounts. However, providing an opinion on compliance with those provisions was not an objective of our audit, and accordingly, we do not express such an opinion. The t'esnlts of our tests disclosed no instances of noncompliance or other matters that are required to be repolied under Government Auditing Standards.
Purpose of this Rer>ort
The purpose of this report is solely to describe the scope of our testing of internal control and compliance and the results of that testing, and not to provide an opinion on the effectiveness of the Authority's internal control or on compliance. This report .is an integral part of an audit pet"formed in accordance with Government Auditing Standards in considering the Authority's internal control and compliance. Accordingly, this communication is not suitable for any other purpose.
Springfield, Illinois November 5, 2015

109
ECK, SCHAFER & 'PUNKE, LLP
Www 1 ~~l~ 1.. Ill
C I I Ill I I I 1'1 Ill I \• I II I \ I 1
Independent Auditors' Report on Compliance For Each Major Program and on Internal Control
Over Compliance Required by OMB Circular A-1 33
Board of Commissioners Springfield Airport Authority Springfield, Illinois
Report on Compliance for Each Major Federal Program
We have audited Springfield Airport Authodty's (the Authority) compliance with the types of compliance requirements described in the OMB Circular A-133 Compliance Supplement that could have a direct and material effect on each of the Authority's major federal programs for the year ended June 30, 2015. The AuthOl'ity's major federal programs are identified in the summary of auditors' results section of the accompanying schedule of :findings and questioned costs.
Management's Responsibility
Management is responsible for compliance with the requirements of laws, regulations, contracts, and grants applicable to its federal programs.
Auditors' Responsibility
Our responsibility is to express an opinion on compliance for each of the Authority's major federal programs based on our audit of the types of compliance requirements refened to above. We conducted our audit of compliance in accordance with auditing standards general ly accepted in the United States of America; the standards applicable to financial audits contained in Government Auditing Standards, issued by the Comptroller General of the United States; and OMB Circular A-133, Audits of States, Local Governments, and Non-Profit Organizations. Those standards and OMB Circular A-133 require that we plan and perform the audit to obtain reasonabJc assurance about whether noncompliance with the types of compliance requirements referred to above that could have a direct and material effect on a major federal program occurred. An audit includes examining, on a test basis, evidence about the Authority's compliance with those requjrements and performing such other procedures as we considered necessary in the circumstances.
We believe that our audit provides a reasonable basis for our opinion on compliance for each major federal program. However, our audit docs not provide a legal determination of the Authorit-y's compliance.

110
Opinion on Each Majoa· Fedet·a1 Program
In our opinion, Springfield Airport Authority complied, in all material respects, with the types of compliance requirements refcned to above that could have a diJ:ect and material effect on each of its major federal programs for the year ended June 30, 2015.
ReJ>ort on Jntca·nal Control Over Compliance
Management of the Authority is responsible for establishing and maintaining effective internal control over compliance with the types of compliance requirements refened to above. In p lanning and performing our audit of compliance, we considered the Authority's intemal control over compliance with the types of requirements that could have a direct and material effect on each major federal program to determine the auditing procedures that are appropriate in the circumstances for the purpose of expressing an opinion on compliance for each major federal program and lo test and report on internal control over compliance in accordance with 0Ml3 Circular A-133, but not for the p lU·pose of expressing an opinion on the effectiveness of intctnal control over compliance. Accordingly, we do not express an opinion on the effectiveness of tho Authority's internal control over compliance.
A deficiency in internal control over compliance exists when the design or operatjon of a control over compliance does not allow management or employees, in the normal course of performing their assigned functions, to prevent, or detect and correct, noncompliance with a type of compliance requirement of a federal p rogram on a timely basis. A material weakness in internal control over compliance is a deflCicncy, or combination of deficiencies, in internal control over compliance, such that there is a reasonable possibility that material noncompliance with a type of compliance requirement of a federal program wi1l not be prevented, or detected and corrected, on a timely basis. A significant deficiency in internal control over cmnpliance is a deficiency, or a combination of deficiencies, in internal control over compliance with a type of compliance requirement of a federal program that is less severe than a material weakness in internal control over compliance, yet important enough to merit attention by those oharged with governance.
Our consideration of internal control over compliance was for the limited purpose described in the first paragraph of this section and was not designed to identify aU deficiencies hl inlcmaJ control over compliance that might be material weaknesses or significant deficiencies. We did not identify any deficiencies in internal control over compliance that we consider to be material wealmcssos. However, material weaknesses may exist that have not been .identified.
The purpose of this report on internal control over compJtance is solely to describe the scope of our testing of internal control over compliance and the results of that testing based on the requirements of OMB Circular A-133. Accordingly, this report is not StLilable for any other purpose.
Sprillgfield, Illinois November 5, 201 5

Springfield Airport Authority
SCHEDULE OF EXPENDITURES OF FEDERAL AWARDS
For the Year Ended June 30, 2015
Federal Agency/Pass-through Agency Federal Award and Program Title CFDA Number Expenditures U.S. Department of Transportation Passed through the Illinois Department of Transportation Airport Improvement Program (M) 20.106 $ 2,161,985 Total Expenditures of Federal Awards $ 2,161,985 (M) - Program was audited as a major program.
111

Springfield Airport Authority
NOTES TO SCHEDULE OF EXPENDITURES OF FEDERAL AWARDS
For the Year Ended June 30, 2015
1. SUMMARY OF SIGNIFICANT ACCOUNTING POLICIES
A. Basis of Accounting The accompanying schedule of expenditures of federal awards includes the federal grant activity of Springfield Airport Authority and is presented on the cash basis of accounting. The information in this schedule is presented in accordance with the requirements of OMB Circular A-133, Audits of States, Local Governments, and Non-Profit Organizations. Therefore, some amounts presented in this schedule may differ from amounts presented in, or used in the preparation of, the basic financial statements.
2. ADDITIONAL INFORMATION
A. Other Federal Assistance
As of and during the year ended June 30, 2015, Springfield Airport Authority did not receive any noncash federal assistance, federal insurance, or federal loans or loan guarantees.
B. Sub-recipient Grants
During the year ended June 30, 2015, Springfield Airport Authority did not pass through federal funds to sub-recipients.
112
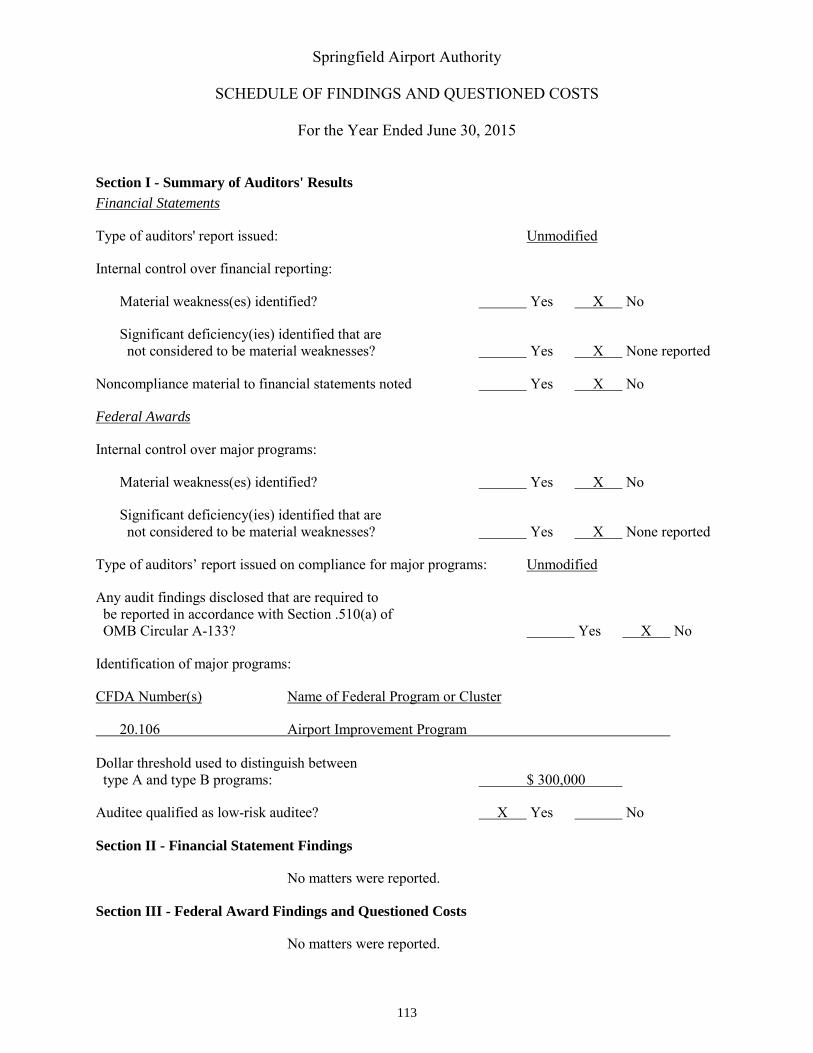
Springfield Airport Authority
SCHEDULE OF FINDINGS AND QUESTIONED COSTS
For the Year Ended June 30, 2015
Section I - Summary of Auditors' Results Financial Statements
Type of auditors' report issued: Unmodified
Internal control over financial reporting:
Material weakness(es) identified? Yes X No
Significant deficiency(ies) identified that are not considered to be material weaknesses? Yes X None reported
Noncompliance material to financial statements noted Yes X No
Federal Awards
Internal control over major programs:
Material weakness(es) identified? Yes X No
Significant deficiency(ies) identified that are not considered to be material weaknesses? Yes X None reported
Type of auditors’ report issued on compliance for major programs: Unmodified
Any audit findings disclosed that are required to be reported in accordance with Section .510(a) of OMB Circular A-133? Yes X No
Identification of major programs:
CFDA Number(s) Name of Federal Program or Cluster
20.106 Airport Improvement Program Dollar threshold used to distinguish between type A and type B programs: $ 300,000
Auditee qualified as low-risk auditee? X Yes No
Section II - Financial Statement Findings
No matters were reported.
Section III - Federal Award Findings and Questioned Costs
No matters were reported.
113

Springfield Airport Authority
SUMMARY SCHEDULE OF PRIOR AUDIT FINDINGS
For the Year Ended June 30, 2015
There were no prior audit findings required to be reported relative to Federal awards.
114
SPRINGFIELD AIRPORTAUTHORITY
1200 Capital Airport DriveSpringfield, IL 62707
217.788.1060
R