Comprehens ive En ergy A udit For uk Lift Station
16
C Compr Chu rehens athbal Pr City o Jun Pr AN 1901 Braga Anchora sive En For luk Lift repared For of Chuathbalu ne 13, 2012 epared By: NTHC‐DEHE aw Suite, Sui age, Alaska 99 nergy A t Statio uk ite 200 9508 Audit on 1
Transcript of Comprehens ive En ergy A udit For uk Lift Station

CCompr
Chu
rehens
athbal
Pr
City o
Jun
Pr
AN1901 BragaAnchora
siveEnForlukLift
repared For
of Chuathbalu
ne 13, 2012
epared By:
NTHC‐DEHE aw Suite, Suiage, Alaska 99
nergyA
tStatio
uk
ite 200 9508
Audit
on
1

2
TableofContents 1. EXECUTIVE SUMMARY .............................................................................................................................. 3 2. AUDIT AND ANALYSIS BACKGROUND ....................................................................................................... 4 2.1 Program Description ........................................................................................................................... 4 2.2 Audit Description ................................................................................................................................ 4 2.3. Method of Analysis ............................................................................................................................ 5 2.4 Limitations of Study ............................................................................................................................ 7
3. Chuathbaluk Lift Station ........................................................................................................................... 7 3.1. Building Description ........................................................................................................................... 7 3.2 Predicted Energy Use .......................................................................................................................... 8 3.2.1 Energy Usage / Tariffs .................................................................................................................. 8 3.2.2 Energy Use Index (EUI) .............................................................................................................. 11
3.3 AkWarm© Building Simulation ......................................................................................................... 12 4. ENERGY COST SAVING MEASURES ......................................................................................................... 13 4.1 Summary of Results .......................................................................................................................... 13 4.2 Interactive Effects of Projects ........................................................................................................... 13
5. ENERGY EFFICIENCY ACTION PLAN ......................................................................................................... 15 Appendix A – Listing of Energy Conservation and Renewable Energy Websites ........................................ 15
PREFACE
The Energy Projects Group at the Alaska Native Tribal Health Consortium (ANTHC) prepared this document for the City of Chuathbaluk. The authors of this report are Carl Remley, Certified Energy Auditor (CEA) and Gavin Dixon. The purpose of this report is to provide a comprehensive document that summarizes the findings and analysis that resulted from an energy audit conducted over the past couple months by the Energy Projects Group of ANTHC. This report analyzes historical energy use and identifies costs and savings of recommended energy efficiency measures. Discussions of site specific concerns and an Energy Efficiency Action Plan are also included in this report. ACKNOWLEDGMENTS The Energy Projects Group gratefully acknowledges the assistance of Bill Nesbit and Carl Nesbit, Water Plant Operators for the City of Chuathbaluk.

3
1.EXECUTIVESUMMARY This report was prepared for the City of Chuathbaluk. The scope of the audit focused on Chuathbaluk Lift Station. The scope of this report is a comprehensive energy study, which included an analysis of building shell, interior and exterior lighting systems, HVAC systems, and plug loads. Based on electricity and fuel oil prices in effect at the time of the audit, the annual predicted energy costs for the buildings analyzed are $1,509 for Electricity and $1,243 for #1 Oil. The total energy costs are $2,752 per year. It should be noted that, this facility did not appear to be charged for electricity. All costs are modeled as if the facility received the PCE rate that other facilities in the community received. Table 1.1 below summarizes the energy efficiency measures analyzed for the Chuathbaluk Lift Station. Listed are the estimates of the annual savings, installed costs, and two different financial measures of investment return.
Table 1.1PRIORITY LIST – ENERGY EFFICIENCY MEASURES
Rank
Feature
Improvement Description
Annual Energy Savings
Installed Cost
Savings to Investment Ratio, SIR1
Simple Payback (Years)2
1 Other Electrical - Controls Retrofit: Lift Station Pumps
The discharge line must drain back into the wet-well during winter to prevent the line from freezing. During summer months this process can be bypassed to reduce the run time on the pumps. Run time reduction is estimated to be 10-20% of total run time.
$107 + $3 Maint. Savings
$10 67.91 0.1
2 Setback Thermostat: Wet Well Side
Implement a Heating Temperature Unoccupied Setback to 40.0 deg F for the Wet Well Side space.
$350 $200 23.67 0.6
3 Setback Thermostat: Controls Side
Implement a Heating Temperature Unoccupied Setback to 40.0 deg F for the Controls Side space.
$85 $200 5.77 2.3
4 Air Tightening: Around pipes and in arctic box
Perform air sealing to reduce air leakage by 50 cfm at 50 Pascals.
$23 $100 2.17 4.3
TOTAL, all measures $565 + $3 Maint.
Savings
$510 13.30 0.9
Table Notes:

4
1 Savings to Investment Ratio (SIR) is a life‐cycle cost measure calculated by dividing the total savings over the life of a project (expressed in today’s dollars) by its investment costs. The SIR is an indication of the profitability of a measure; the higher the SIR, the more profitable the project. An SIR greater than 1.0 indicates a cost‐effective project (i.e. more savings than cost). Remember that this profitability is based on the position of that Energy Efficiency Measure (EEM) in the overall list and assumes that the measures above it are implemented first.
2 Simple Payback (SP) is a measure of the length of time required for the savings from an EEM to payback the investment cost, not counting interest on the investment and any future changes in energy prices. It is calculated by dividing the investment cost by the expected first‐year savings of the EEM.
With all of these energy efficiency measures in place, the annual utility cost can be reduced by $565 per year, or 20.5% of the buildings’ total energy costs. These measures are estimated to cost $510, for an overall simple payback period of 0.9 years. Table 1.2 below is a breakdown of the annual energy cost across various energy end use types, such as Space Heating and Water Heating. The first row in the table shows the breakdown for the building as it is now. The second row shows the expected breakdown of energy cost for the building assuming all of the retrofits in this report are implemented. Finally, the last row shows the annual energy savings that will be achieved from the retrofits.
Table 1.2 Annual Energy Cost Estimate
Description Space Heating
Space Cooling
Water Heating
Lighting Refrigeration Other
Electrical Cooking
Clothes Drying
Ventilation Fans
Total Cost
Existing Building
$1,628 $0 $0 $57 $0 $1,067 $0 $0 $0 $2,752
With All Proposed Retrofits
$1,170 $0 $0 $57 $0 $960 $0 $0 $0 $2,187
SAVINGS $458 $0 $0 $0 $0 $107 $0 $0 $0 $565
2.AUDITANDANALYSISBACKGROUND
2.1ProgramDescription This audit included services to identify, develop, and evaluate energy efficiency measures at the Chuathbaluk Lift Station. The scope of this project included evaluating building shell, lighting and other electrical systems, and HVAC equipment, motors and pumps. Measures were analyzed based on life‐cycle‐cost techniques, which include the initial cost of the equipment, life of the equipment, annual energy cost, annual maintenance cost, and a discount rate of 3.0%/year in excess of general inflation.
2.2AuditDescription

5
Preliminary audit information was gathered in preparation for the site survey. The site survey provides critical information in deciphering where energy is used and what opportunities exist within a building. The entire site was surveyed to inventory the following to gain an understanding of how each building operates:
• Building envelope (roof, windows, etc.) • Heating, ventilation, and air conditioning equipment (HVAC) • Lighting systems and controls • Building‐specific equipment
The building site visit was performed to survey all major building components and systems. The site visit included detailed inspection of energy consuming components. Summary of building occupancy schedules, operating and maintenance practices, and energy management programs provided by the building manager were collected along with the system and components to determine a more accurate impact on energy consumption. Details collected from Chuathbaluk Lift Station enable a model of the building’s energy usage to be developed, highlighting the building’s total energy consumption, energy consumption by specific building component, and equivalent energy cost. The analysis involves distinguishing the different fuels used on site, and analyzing their consumption in different activity areas of the building. Chuathbaluk Lift Station is classified as being made up of the following activity areas: 1) Wet Well Side: 177 square feet 2) Controls Side: 48 square feet In addition, the methodology involves taking into account a wide range of factors specific to the building. These factors are used in the construction of the model of energy used. The factors include: • Occupancy hours • Local climate conditions • Prices paid for energy
2.3.MethodofAnalysisData collected was processed using AkWarm© Energy Use Software to estimate energy savings for each of the proposed energy efficiency measures (EEMs). The recommendations focus on the building envelope; HVAC; lighting, plug load, and other electrical improvements; and motor and pump systems that will reduce annual energy consumption. EEMs are evaluated based on building use and processes, local climate conditions, building construction type, function, operational schedule, existing conditions, and foreseen future plans. Energy savings are calculated based on industry standard methods and engineering estimations. Our analysis provides a number of tools for assessing the cost effectiveness of various improvement options. These tools utilize Life‐Cycle Costing, which is defined in this context as

6
a method of cost analysis that estimates the total cost of a project over the period of time that includes both the construction cost and ongoing maintenance and operating costs. Savings to Investment Ratio (SIR) = Savings divided by Investment Savings includes the total discounted dollar savings considered over the life of the improvement. When these savings are added up, changes in future fuel prices as projected by the Department of Energy are included. Future savings are discounted to the present to account for the time‐value of money (i.e. money’s ability to earn interest over time). The Investment in the SIR calculation includes the labor and materials required to install the measure. An SIR value of at least 1.0 indicates that the project is cost‐effective—total savings exceed the investment costs. Simple payback is a cost analysis method whereby the investment cost of a project is divided by the first year’s savings of the project to give the number of years required to recover the cost of the investment. This may be compared to the expected time before replacement of the system or component will be required. For example, if a boiler costs $12,000 and results in a savings of $1,000 in the first year, the payback time is 12 years. If the boiler has an expected life to replacement of 10 years, it would not be financially viable to make the investment since the payback period of 12 years is greater than the project life. The Simple Payback calculation does not consider likely increases in future annual savings due to energy price increases. As an offsetting simplification, simple payback does not consider the need to earn interest on the investment (i.e. it does not consider the time‐value of money). Because of these simplifications, the SIR figure is considered to be a better financial investment indicator than the Simple Payback measure. Measures are implemented in order of cost‐effectiveness. The program first calculates individual SIRs, and ranks all measures by SIR, higher SIRs at the top of the list. An individual measure must have an individual SIR>=1 to make the cut. Next the building is modified and re‐simulated with the highest ranked measure included. Now all remaining measures are re‐evaluated and ranked, and the next most cost‐effective measure is implemented. AkWarm goes through this iterative process until all appropriate measures have been evaluated and installed. It is important to note that the savings for each recommendation is calculated based on implementing the most cost effective measure first, and then cycling through the list to find the next most cost effective measure. Implementation of more than one EEM often affects the savings of other EEMs. The savings may in some cases be relatively higher if an individual EEM is implemented in lieu of multiple recommended EEMs. For example implementing a reduced operating schedule for inefficient lighting will result in relatively high savings. Implementing a reduced operating schedule for newly installed efficient lighting will result in lower relative savings, because the efficient lighting system uses less energy during each hour of operation. If multiple EEM’s are recommended to be implemented, AkWarm calculates the combined savings appropriately.

7
Cost savings are calculated based on estimated initial costs for each measure. Installation costs include labor and equipment to estimate the full up‐front investment required to implement a change. Costs are derived from Means Cost Data, industry publications, and local contractors and equipment suppliers.
2.4LimitationsofStudyAll results are dependent on the quality of input data provided, and can only act as an approximation. In some instances, several methods may achieve the identified savings. This report is not intended as a final design document. The design professional or other persons following the recommendations shall accept responsibility and liability for the results.
3.ChuathbalukLiftStation
3.1.BuildingDescription The 225 square foot Chuathbaluk Lift Station was constructed in 2005, with a normal occupancy of two people. The building is rarely occupied, save for record keeping and maintenance, a few hours a week. The lift station receives sewage from the entire town and pumps the sewage up the hill into the sewage lagoon with a pair of discharge pumps. Description of Building Shell The exterior walls are constructed with six inch structurally insulated panels with 5.5 inches of polyurethane insulation. The roof of the building is a cold roof with seven inches of polyurethane insulation. The floor of the building is built on a concrete slab with the slab edges insulated by 2 inches of board stock insulation. Doors are insulated metal doors. Description of Heating Plants The Heating Plants used in the building are: Monitor MPI FCX20 Fuel Type: #1 Oil Input Rating: 81,250 BTU/hr Steady State Efficiency: 93 % Idle Loss: 1.5 % Heat Distribution Type: Glycol Boiler Operation: Oct ‐ May

8
Space Heating Distribution Systems Heat in the building is supplied primarily by the in floor glycol heating loop. There is one unit heater which is controlled by an aqua stat which is auxiliary to the in floor heat and will activate the fan for the unit heaters on or off if the in floor heat cannot maintain set temperatures. All controls are manually adjusted setpoints. Description of Building Ventilation System The existing building ventilation system consists of an air damper whichis operated with manual controls to ventilate the wet well. Primarily the doors are opened while working to ventilate the facility. Lighting Lighting in the facility is made up of a single T8 electronic ballast fixture with four 32 watt bulbs on the dry side of the lift station. In the wet well there are three incandescent, 150 watt light bulbs. None of these lights is on very often. Major Equipment The grinder discharge pumps in the lift station are the only major equipment in the facility. These pumps run about 20‐40 hours a month total and are six horsepower Flygt 2101.890‐0810633 model pumps.
3.2PredictedEnergyUse
3.2.1EnergyUsage/Tariffs
The electric usage profile charts (below) represents the predicted electrical usage for the building. If actual electricity usage records were available, the model used to predict usage was calibrated to approximately match actual usage. The electric utility measures consumption in kilowatt‐hours (kWh) and maximum demand in kilowatts (kW). One kWh usage is equivalent to 1,000 watts running for one hour. The fuel oil usage profile shows the fuel oil usage for the building. Fuel oil consumption is measured in gallons. One gallon of #1 Fuel Oil provides approximately 132,000 BTUs of energy. The following is a list of the utility companies providing energy to the building and the class of service provided: Electricity: Middle Kuskokwim Electric Coop ‐ Commercial ‐ Sm The average cost for each type of fuel used in this building is shown below in Table 3.1. This figure includes all surcharges, subsidies, and utility customer charges:
9
Table 3.1 – Average Energy Cost Description Average Energy Cost
Electricity $ 0.46/kWh
#1 Oil $ 6.80/gallons
3.2.1.1 Total Energy Use and Cost Breakdown
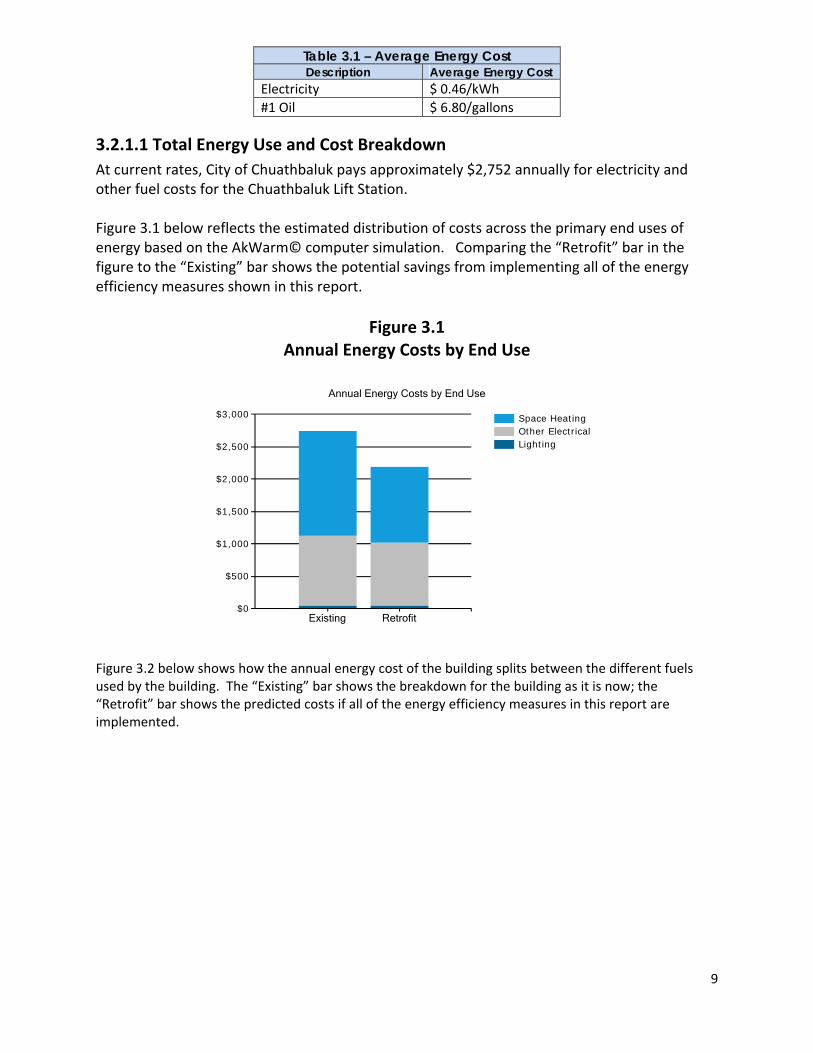
At current rates, City of Chuathbaluk pays approximately $2,752 annually for electricity and other fuel costs for the Chuathbaluk Lift Station. Figure 3.1 below reflects the estimated distribution of costs across the primary end uses of energy based on the AkWarm© computer simulation. Comparing the “Retrofit” bar in the figure to the “Existing” bar shows the potential savings from implementing all of the energy efficiency measures shown in this report.
Figure 3.1 Annual Energy Costs by End Use
Figure 3.2 below shows how the annual energy cost of the building splits between the different fuels used by the building. The “Existing” bar shows the breakdown for the building as it is now; the “Retrofit” bar shows the predicted costs if all of the energy efficiency measures in this report are implemented.
$0
$500
$1,000
$1,500
$2,000
$2,500
$3,000
Existing Retrofit
Space HeatingOther ElectricalLighting
Annual Energy Costs by End Use
10
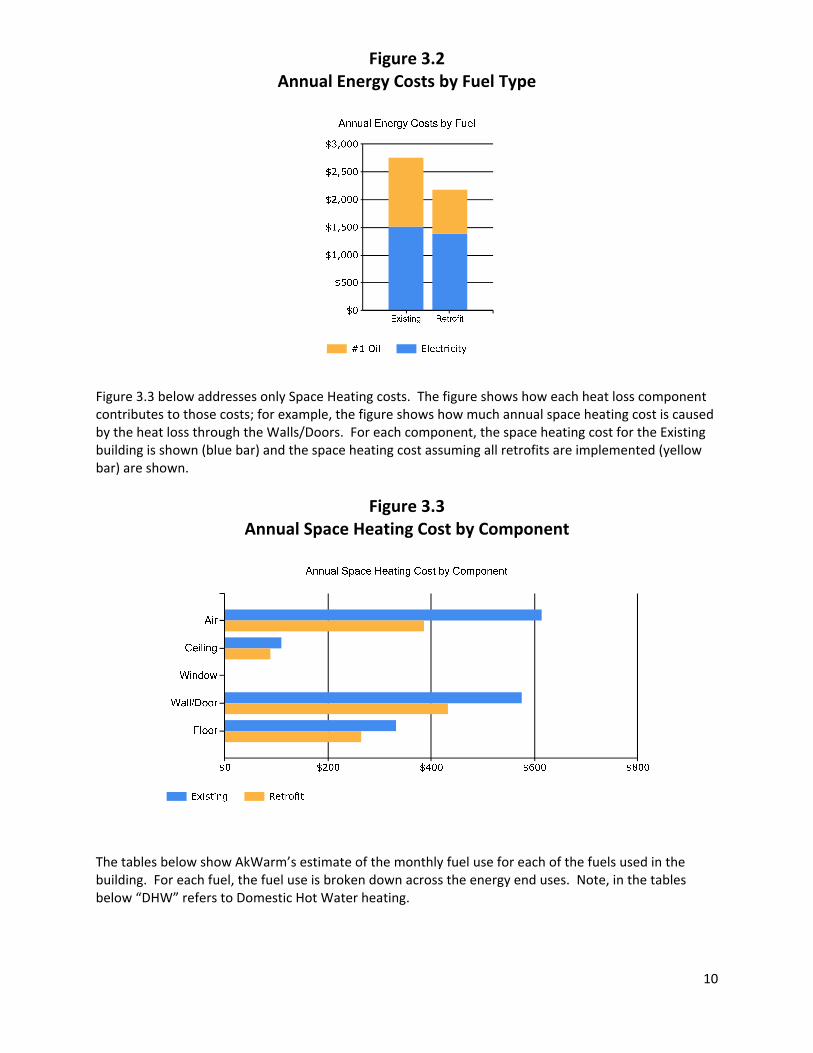
Figure 3.2 Annual Energy Costs by Fuel Type
Figure 3.3 below addresses only Space Heating costs. The figure shows how each heat loss component contributes to those costs; for example, the figure shows how much annual space heating cost is caused by the heat loss through the Walls/Doors. For each component, the space heating cost for the Existing building is shown (blue bar) and the space heating cost assuming all retrofits are implemented (yellow bar) are shown.
Figure 3.3 Annual Space Heating Cost by Component
The tables below show AkWarm’s estimate of the monthly fuel use for each of the fuels used in the building. For each fuel, the fuel use is broken down across the energy end uses. Note, in the tables below “DHW” refers to Domestic Hot Water heating.

11
Electrical Consumption (kWh)
Jan Feb Mar Apr May Jun Jul Aug Sept Oct Nov Dec Other_Electrical 197 179 197 191 197 191 197 197 191 197 191 197
Lighting 10 10 10 10 10 10 10 10 10 10 10 10
Space_Heating 79 71 76 71 64 61 63 63 63 73 74 79
Fuel Oil #1 Consumption (Gallons)
Jan Feb Mar Apr May Jun Jul Aug Sept Oct Nov Dec Space_Heating 35 28 24 14 4 0 0 0 4 15 25 34
3.2.2EnergyUseIndex(EUI) Energy Use Index (EUI) is a measure of a building’s annual energy utilization per square foot of building. This calculation is completed by converting all utility usage consumed by a building for one year, to British Thermal Units (Btu) or kBtu, and dividing this number by the building square footage. EUI is a good measure of a building’s energy use and is utilized regularly for comparison of energy performance for similar building types. The Oak Ridge National Laboratory (ORNL) Buildings Technology Center under a contract with the U.S. Department of Energy maintains a Benchmarking Building Energy Performance Program. The ORNL website determines how a building’s energy use compares with similar facilities throughout the U.S. and in a specific region or state. Source use differs from site usage when comparing a building’s energy consumption with the national average. Site energy use is the energy consumed by the building at the building site only. Source energy use includes the site energy use as well as all of the losses to create and distribute the energy to the building. Source energy represents the total amount of raw fuel that is required to operate the building. It incorporates all transmission, delivery, and production losses, which allows for a complete assessment of energy efficiency in a building. The type of utility purchased has a substantial impact on the source energy use of a building. The EPA has determined that source energy is the most comparable unit for evaluation purposes and overall global impact. Both the site and source EUI ratings for the building are provided to understand and compare the differences in energy use. The site and source EUIs for this building are calculated as follows. (See Table 3.4 for details): Building Site EUI = (Electric Usage in kBtu + Fuel Oil Usage in kBtu) Building Square Footage Building Source EUI = (Electric Usage in kBtu X SS Ratio + Fuel Oil Usage in kBtu X SS Ratio) Building Square Footage where “SS Ratio” is the Source Energy to Site Energy ratio for the particular fuel.

12
Table 3.4 Chuathbaluk Lift Station EUI Calculations
Energy Type Building Fuel Use per Year Site Energy Use per Year, kBTU
Source/Site Ratio
Source Energy Use per Year, kBTU
Electricity 3,281 kWh 11,199 3.340 37,405
#1 Oil 183 gallons 24,120 1.010 24,361
Total 35,319 61,767
BUILDING AREA 225 Square Feet
BUILDING SITE EUI 157 kBTU/Ft²/Yr
BUILDING SOURCE EUI 275 kBTU/Ft²/Yr
* Site ‐ Source Ratio data is provided by the Energy Star Performance Rating Methodology for IncorporatingSource Energy Use document issued March 2011.
3.3AkWarm©BuildingSimulationAn accurate model of the building performance can be created by simulating the thermal performance of the walls, roof, windows and floors of the building. The HVAC system and central plant are modeled as well, accounting for the outside air ventilation required by the building and the heat recovery equipment in place. The model uses local weather data and is trued up to historical energy use to ensure its accuracy. The model can be used now and in the future to measure the utility bill impact of all types of energy projects, including improving building insulation, modifying glazing, changing air handler schedules, increasing heat recovery, installing high efficiency boilers, using variable air volume air handlers, adjusting outside air ventilation and adding cogeneration systems. For the purposes of this study, the Chuathbaluk Lift Station was modeled using AkWarm© energy use software to establish a baseline space heating and cooling energy usage. Climate data from Chuathbaluk was used for analysis. From this, the model was be calibrated to predict the impact of theoretical energy savings measures. Once annual energy savings from a particular measure were predicted and the initial capital cost was estimated, payback scenarios were approximated. Equipment cost estimate calculations are provided in Appendix D. Limitations of AkWarm© Models • The model is based on typical mean year weather data for Chuathbaluk. This data represents the average ambient weather profile as observed over approximately 30 years. As such, the gas and electric profiles generated will not likely compare perfectly with actual energy billing information from any single year. This is especially true for years with extreme warm or cold periods, or even years with unexpectedly moderate weather. • The heating and cooling load model is a simple two‐zone model consisting of the building’s core interior spaces and the building’s perimeter spaces. This simplified approach loses accuracy for buildings that have large variations in cooling/heating loads across different parts of the building. • The model does not model HVAC systems that simultaneously provide both heating and cooling to the same building space (typically done as a means of providing temperature control in the space).

13
The energy balances shown in Section 3.1 were derived from the output generated by the AkWarm© simulations.
4.ENERGYCOSTSAVINGMEASURES
4.1SummaryofResultsThe energy saving measures is summarized in Table 4.1. Please refer to the individual measure descriptions later in this report for more detail. Calculations and cost estimates for analyzed measures are provided in Appendix C.
Table 4.1Chuathbaluk Lift Station, Chuathbaluk, Alaska PRIORITY LIST – ENERGY EFFICIENCY MEASURES
Rank
Feature
Improvement Description
Annual Energy Savings
Installed Cost
Savings to Investment Ratio, SIR
Simple Payback (Years)
1 Other Electrical - Controls Retrofit: Lift Station Pumps
The discharge line must drain back into the wet-well during winter to prevent the line from freezing. During summer months this process can be bypassed to reduce the run time on the pumps. Run time reduction is estimated to be 10-20% of total run time.
$107 + $3 Maint. Savings
$10 67.91 0.1
2 Setback Thermostat: Wet Well Side
Implement a Heating Temperature Unoccupied Setback to 40.0 deg F for the Wet Well Side space.
$350 $200 23.67 0.6
3 Setback Thermostat: Controls Side
Implement a Heating Temperature Unoccupied Setback to 40.0 deg F for the Controls Side space.
$85 $200 5.77 2.3
4 Air Tightening: Around pipes and in arctic box
Perform air sealing to reduce air leakage by 50 cfm at 50 Pascals.
$23 $100 2.17 4.3
TOTAL, all measures $565 + $3 Maint.
Savings
$510 13.30 0.9
4.2InteractiveEffectsofProjectsThe savings for a particular measure are calculated assuming all recommended EEMs coming before that measure in the list are implemented. If some EEMs are not implemented, savings for the remaining EEMs will be affected. For example, if ceiling insulation is not added, then savings from a project to replace the heating system will be increased, because the heating system for the building supplies a larger load.

14
In general, all projects are evaluated sequentially so energy savings associated with one EEM would not also be attributed to another EEM. By modeling the recommended project sequentially, the analysis accounts for interactive affects among the EEMs and does not “double count” savings. Interior lighting, plug loads, facility equipment, and occupants generate heat within the building. When the building is in cooling mode, these items contribute to the overall cooling demands of the building; therefore, lighting efficiency improvements will reduce cooling requirements in air‐conditioned buildings. Conversely, lighting‐efficiency improvements are anticipated to slightly increase heating requirements. Heating penalties and cooling benefits were included in the lighting project analysis.
4.3BuildingShellMeasures
4.3.1AirSealingMeasures
4.4MechanicalEquipmentMeasures
4.4.1NightSetbackThermostatMeasures
4.5Electrical&ApplianceMeasures
Rank Location Existing Air Leakage Level (cfm@50/75 Pa) Recommended Air Leakage Reduction (cfm@50/75 Pa)
4 Around pipes and in arctic box
Air Tightness estimated as: 555 cfm at 50 Pascals Perform air sealing to reduce air leakage by 50 cfm at 50 Pascals.
Installation Cost $100 Estimated Life of Measure (yrs) 10 Energy Savings (/yr) $23
Breakeven Cost $217 Savings‐to‐Investment Ratio 2.2 Simple Payback yrs 4
Auditors Notes: The wall space around the pipes which had been run through the wall for the backup pumps should be sealed. Additionally the arctic box could use additional insulation.
Rank Building Space Recommendation
2 Wet Well Side Implement a Heating Temperature Unoccupied Setback to 40.0 deg F for the Wet Well Side space.
Installation Cost $200 Estimated Life of Measure (yrs) 15 Energy Savings (/yr) $350
Breakeven Cost $4,733 Savings‐to‐Investment Ratio 23.7 Simple Payback yrs 1
Auditors Notes: The lift station needs only to be heated enough to keep equipment in the facility from freezing. Temperatures should be maintained at 40 degrees. When working in the facility, use the unit heaters to bring the temperature up to a comfortable working temperature, and turn them back down when leaving the facility.
Rank Building Space Recommendation
3 Controls Side Implement a Heating Temperature Unoccupied Setback to 40.0 deg F for the Controls Side space.
Installation Cost $200 Estimated Life of Measure (yrs) 15 Energy Savings (/yr) $85
Breakeven Cost $1,155 Savings‐to‐Investment Ratio 5.8 Simple Payback yrs 2
Auditors Notes: The lift station needs only to be heated enough to keep equipment in the facility from freezing. Temperatures should be maintained at 40 degrees. When working in the facility, use the unit heaters to bring the temperature up to a comfortable working temperature, and turn them back down when leaving the facility.
15
4.5.1OtherElectricalMeasures
5.ENERGYEFFICIENCYACTIONPLAN Through inspection of the energy‐using equipment on‐site and discussions with site facilities personnel, this energy audit has identified several energy‐saving measures. The measures will reduce the amount of fuel burned and electricity used at the site. The projects will not degrade the performance of the building and, in some cases, will improve it. Several types of EEMs can be implemented immediately by building staff, and others will require various amounts of lead time for engineering and equipment acquisition. In some cases, there are logical advantages to implementing EEMs concurrently. For example, if the same electrical contractor is used to install both lighting equipment and motors, implementation of these measures should be scheduled to occur simultaneously.
AppendixA–ListingofEnergyConservationandRenewableEnergyWebsites Lighting Illumination Engineering Society ‐ http://www.iesna.org/ Energy Star Compact Fluorescent Lighting Program ‐ www.energystar.gov/index.cfm?c=cfls.pr_cfls DOE Solid State Lighting Program ‐ http://www1.eere.energy.gov/buildings/ssl/ DOE office of Energy Efficiency and Renewable Energy ‐ http://apps1.eere.energy.gov/consumer/your_workplace/ Energy Star – http://www.energystar.gov/index.cfm?c=lighting.pr_lighting Hot Water Heaters Heat Pump Water Heaters ‐ http://apps1.eere.energy.gov/consumer/your_home/water_heating/index.cfm/mytopic=12840 Solar Water Heating FEMP Federal Technology Alerts – http://www.eere.energy.gov/femp/pdfs/FTA_solwat_heat.pdf
Rank Location Description of Existing Efficiency Recommendation
1 Lift Station Pumps 2 Lift Station Grinder/Discharge Pumps with Manual Switching
Improve Manual Switching
Installation Cost $10 Estimated Life of Measure (yrs) 7 Energy Savings (/yr) $107
Maintenance Savings (/yr) $3
Breakeven Cost $679 Savings‐to‐Investment Ratio 67.9 Simple Payback yrs 0
Auditors Notes: The discharge line must drain back into the wet‐well during winter to prevent the line from freezing. During summer months this process can be bypassed to reduce the run time on the pumps. Run time reduction is estimated to be 10‐20% of total run time.

16
Solar Radiation Data Manual – http://rredc.nrel.gov/solar/pubs/redbook Plug Loads DOE office of Energy Efficiency and Renewable Energy – http:apps1.eere.energy.gov/consumer/your_workplace/ Energy Star – http://www.energystar.gov/index.cfm?fuseaction=find_a_product The Greenest Desktop Computers of 2008 ‐ http://www.metaefficient.com/computers/the‐greenest‐pcs‐of‐2008.html Wind AWEA Web Site – http://www.awea.org National Wind Coordinating Collaborative – http:www.nationalwind.org Utility Wind Interest Group site: http://www.uwig.org WPA Web Site – http://www.windpoweringamerica.gov Homepower Web Site: http://homepower.com Windustry Project: http://www.windustry.com Solar NREL – http://www.nrel.gov/rredc/ Firstlook – http://firstlook.3tiergroup.com TMY or Weather Data – http://rredc.nrel.gov/solar/old_data/nsrdb/1991‐2005/tmy3/ State and Utility Incentives and Utility Policies ‐ http://www.dsireusa.org


![3] Meanwhile in first week of December 2006, accused No. 2 · 3 Pravin , resultantly her relationship with deceased Udit was broken. This fact was informed by Udit to his parents,](https://static.fdocuments.in/doc/165x107/5be673e409d3f2ea1a8d2230/3-meanwhile-in-first-week-of-december-2006-accused-no-2-3-pravin-resultantly.jpg)