Compositional variation in formation fluids and their ...
230
University of Calgary PRISM: University of Calgary's Digital Repository Graduate Studies Legacy Theses 2000 Compositional variation in formation fluids and their relation to fluid flow and water-rock interaction in Devonian to Lower Cretaceous sedimentary rocks of southern Alberta Kirste, Dirk Kirste, D. (2000). Compositional variation in formation fluids and their relation to fluid flow and water-rock interaction in Devonian to Lower Cretaceous sedimentary rocks of southern Alberta (Unpublished doctoral thesis). University of Calgary, Calgary, AB. doi:10.11575/PRISM/12671 http://hdl.handle.net/1880/40893 doctoral thesis University of Calgary graduate students retain copyright ownership and moral rights for their thesis. You may use this material in any way that is permitted by the Copyright Act or through licensing that has been assigned to the document. For uses that are not allowable under copyright legislation or licensing, you are required to seek permission. Downloaded from PRISM: https://prism.ucalgary.ca
Transcript of Compositional variation in formation fluids and their ...

University of Calgary
PRISM: University of Calgary's Digital Repository
Graduate Studies Legacy Theses
2000
Compositional variation in formation fluids and their
relation to fluid flow and water-rock interaction in
Devonian to Lower Cretaceous sedimentary rocks of
southern Alberta
Kirste, Dirk
Kirste, D. (2000). Compositional variation in formation fluids and their relation to fluid flow and
water-rock interaction in Devonian to Lower Cretaceous sedimentary rocks of southern Alberta
(Unpublished doctoral thesis). University of Calgary, Calgary, AB. doi:10.11575/PRISM/12671
http://hdl.handle.net/1880/40893
doctoral thesis
University of Calgary graduate students retain copyright ownership and moral rights for their
thesis. You may use this material in any way that is permitted by the Copyright Act or through
licensing that has been assigned to the document. For uses that are not allowable under
copyright legislation or licensing, you are required to seek permission.
Downloaded from PRISM: https://prism.ucalgary.ca

THE UNIVERSITY OF CALGARY
Compositional variation in formation fluids and their relation to fluid flow and water-rock interaction in Devonian to Lower Cretaceous sedimentary rocks of southern Alberta
Dirk Kirste
A THESIS SUBMITTED TO THE FACULTY OF GRADUATE STUDIES
IN PARTIAL FULFILMENT OF THE REQUIREMENTS FOR THE DEGREE OF DOCTOR OF PHILOSOPHY
DEPARTMENT OF GEOLOGY AND GEOPHYSICS
CALGARY, ALBERTA
SEPTEMBER, 2000
O Dirk Kirste 2000

National library l*l of,,, Biblioth&que nationale du Canada
Acquisitions and Acquisitions 2t Bibliographic Services services bibliographiques 395 Wellington Street 395, rue Wetlbrm Otraw8ON K1AON4 OttawaON K 1 A W Canada Canada
The author has granted a non- L'auteur a accorde me licence non exc1usive licence allowing the exclusive pennettant B la National Library of Canada to BibliothMue nationale du Canada de reproduce, loan, distniute or sell reproduire, preter, distribaer ou copies of this thesis in microform, vendre des copies de cette these sous paper or electronic fonnats. la forme de microfiche/fihn, de
reproduction sur papier ou sur format electronique.
The author retains ownership of the L'auteur conserve la propriete du copyright in this thesis. Neither the droit d'auteur qui protkge cette th+se. thesis nor substantial extracts from it Ni la these ni des exbaits substantiels may be printed or otherwise de celle-ci ne doivent etre imprimes reproduced without the author's ou autrement reproduits sans son permission. autorisation.

Abstract
Variations in the chemical composition of waters in six aquifers ranging in age fkom Upper
Devonian to Lower Cretaceous were examined to determine the chemical and hydrologic
controls on the evolution of formation fluids in southern Alberk The principal factors
affecting fluid composition are mixing, water-rock interaction, and bacterial sulfate
reduction. Mixing of chemically evolved formation waters with meteoric water has r d t e d
in a complex regional distrriution of chemical constituents. Several episodes of meteoric
influx are recognized based on isotopic and chemical variations. Overlain on the fluid
mixing signature are a number of chemical trends that are a product of water-rock
interaction. Mineralogical control of the water chemistry is dominated by calcite-dolomite
equilibrium in the carbonate and clastic reservoirs, although in the clastic reservoirs, calcium to magnesium activity ratios appear to be artifacts of earlier equilibria. The
Nisku/Arcs formation waters are close to equilibrium with calcite, dolomite and anhydrite.
Dissolved silica activities and pH of clastic-hosted waters are strongly influenced by the
presence of clay minerals and srnectite-aqueous solution metastable equilibrium.
Bicarbonate and sulfate content and stable isotopes of s u l k and carbon are interpreted to
reflect bacterial sulfate reduction that has occurred in areas affected by meteoric influx.
Fluid flow is dominated by south to north topography-driven flow with recharge in
Alberta, Montana and Wyoming. Rapid changes in chemical composition and hydraulic
head gradient indicate complex flow patterns that reflect changes in hydraulic conductivity
and/or continuity of aquifers, and structural features like the SweetgrasslBow Island Arch
and the Vulcan Low.
... lll

Acknowledgements
Three have been numerous people who have provided me with the support and inspiration
needed to me through this endeavor. First and foremost, thanks are extended to Ian Hutcheon who could always be relied on for insight and clarity and cash when confusion
or disillusion or poverty threatened- Terry Gordon, Lany Bentley, Ron Spencer, Dave
Pattison, Ed Ghent all provided guidance and answers to questions only a grad student
could ask. Graham Simpson, John Cody, Scott McLeUan and all of the other grad
students who entertained and enlightened. In particular I want to express my thanks to
Cindy Riediger, l M a . Fowler, Vern Stasiuk and Fari Goodard for encouraging me to return to research after a long hiatus. The stable isotope laboratory of Dr. H.R. Krouse
and its occupants Maria, Jesusa and Nenita need to be thanked profusely. Special thanks to
Maurice Shevalier for keeping the analytical and computational side of the research machine
running.
I am gratefiil to the following who provided money or services needed to conduct the
research. Kaush Rakhit of Rakhit Petroleum Consulting provided access to the AEUB
database of water chemistry. Wayne Cox and PanCanadian Petroleum Ltd. provided money and a tremendous amount of logistic support. Lithoprobe for financial support.
The AOSTRA COURSE funds also provided financial support. Ian Hutcheon's NSERC operating grant h d e d a substantial part of the sample collection and analyses.
Financial assistance is gratefbly acknowledged from the University of Calgary Faculty of
Graduate Studies through scholarships, AAPG Grants-in-Aid Foundation, Geological Society of America, and SPWLA.
I would also like to thank my parents and family for all that they have done.

Approval Page Abstract Acknowledgments Table of Contents List of Tables List of Figures
ii
iii iv
v vii
viii
CHAPTER 1 ................... .................. ....................................... 1
INTRODUCTION
CHAPTER 2 REGIONAL WATER CHEMISTRY
INTRODUCTION ..................................................................................... 4
GEOLOGY ............. ..-. ..................................................................................................... 6 MINERAL STABIL~TY DIAGRAMS ............................................................................................. 22 CALCULAT~ON OF THERMODYNAMIC PROPERTIES ..................................................................... 17
METHODS .......................................................................................... 22
RESULTS ........................................................................................... 2 8
PIPER PLOTS .................................................................................................................... 28 REGIONAL VARIATIONS IN CHEMICAL COMPOSITION ...................................... .....,............. ........ 42
Devonian NirWArcs Aquger ............................................................................................. 42 .................................................................................... Mississippian Aquijer. ........... ..., -46
Jurassic Aquger .......................................... ...,, ...............................................~............. -50 ................................................................................................ Lower Mannville Aquijer ... 53
Upper Mannville Aquger.. ................................................................................................ 59 VikingBow Island Aqur;fr ......................... .. ................................................................. -63
DISCUSSION ....................................................................................... 6 3
.............................................................................................................. CHEMICAL TRENDS -63 ........................................................................................... DEVONIAN NISKU/ARCS AQUIFER 66
Variations in cation composition ....................................................................................... -66 Mineralogical controls on solution composition .................................................................. 71 Origin of the Devonian NisXdArcs Formation waters .............. ,. .......................................A. 73
MLSSISSIPPIAN. JURASSIC SAWTOOTH, LOWER MANNVILLE AND UPPER MANNV~LLE AQUIFERS ........ -80 Variations in cation composition ....................................................................................... -80 Mineralogical controls on solution composition ................................................................... -96 Origin of Mississrjlgian to Upper Mannville formation waters ................................................ 117
............................................................................................. VIKING/BOW ISLAND AQUIFER 1 18 Variations in major ion composition ....................... .... ................................................. 118 Mineralogical controls on solution compositjon .................................................................. 122 Origin of the VikingYBow Island Formation water ................................................................ 125
. . ORIGIN OF HlGH BICARBONATE WATERS ................................................................................. 1 ~ 7
.................................................................................. CONCLUSIONS -13 1

CHAPTER 3 FLUID FLOW
.................................................................................. INTRODUCTION 135
FLOW MODELS .................................................................................................................. 138 STABLE ISOTOPES OF OXYGEN AND HYDROGEN ....................................................................... 142 AYDROSTRAT~GRAPHY ........................................................................................................ 143
.......................................................................................... RESULTS I46
6180-m) COMPOSITION OF THE FORMATION WATER ................................................................... 146 REGIONAL D I ~ I B U ~ I O N OF FRESHWATER HYDRAULIC HEAD, CL COMPOSITION, AND 6180 VALUES .. 150
NWArcs Aquger fluid flow paths ................................................................................... 154 Mississippian Aqu$erfruidflow paths ............................................................................... 156 Jurassk Aqu1j2rfluidflow paths ....................................................................................... 158 Lower Mannville Aqu~Jierfluidjlow paths ........................................................................... 160 Upper Mannville AqrrgerJluidJav paths- .......................................................................... 162 VikingLBow Island Aqrtijier fluid flow paths ....................... 164
PRESSURE - DEPTH PLOTS ................................................................................................. 166 OXYGEN ISOTOPIC COMPOSTTlON AND WATER-ROCK INTtRACTION .............................................. 173 6"O-CL ........................................................................................................................... I80 6D-CL ............................................................................................................................ 186
...................................................................................... DISCUSSION 187
CONCLUSIONS .................... ..., .......................................................... - 2 00
FUTURE W O R K ............................. .., ...... .................. .......................... - 202
GENERAL CONCLUSIONS ..................................................................... 204 REFERENCES CITED .......................................................................... - 2 05

LIST OF TABLES
Table 2.1
Table 2.2
TabIe 2.3
Table 2.4
Table 2.5
Table 3.1
Table 3.2

List of Figures
Figure 2. I
Figure 2.2
Figure 2.3
Figure 2.4
Figure 2.5 Figure 2.6
Figure 2.7 Figure 2.8
Figure 2.9
Figure 2.10
Figure 2.1 1
Figure 2.12
Figure 2.13
Figure 2.14
Figure 2.1 5
Figure 2.1 6 Figure 2.17
Figure 2.18
Figure 2.1 9
Figure 2.20
Figure 2.21
Figure 2.22
Figure 2.23
Figure 2.24
Figure 2.25
Figure 2.26
Figure 2.27
Figure 2.28
Figure 2.29
Figure 2.30
Figure 2.3 1
Figure 2.32
Figure 2.33
General stratigraphy Map of the study area NisWArs Piper plot
Mississippian Piper plot
Sawtooth Piper plot
Lower Mannville Piper plot
Upper Marmville Piper plot
VikingBow Island Piper plot
NisWArcs chloride map
NisWArcs bicarbonate map
NisMArcs sulfate map
Mississippian chloride map
Mississippian bicarbonate map
Mississippian sulfate map
Sawtooth chloride map
Sawtooth bicarbonate map
Lower Mannville chloride map
Lower Mannville bicarbonate map
Lower Mannville sulfate map
Lower Mannville latitude vs chloride plot
Mississippian latitude vs chloride plot
Upper Mannville chloride map
Upper Mannville bicarbonate map
Upper Mannville sulfate map
VikingBow Island chloride map
VikingBow Island sulfate map
NisWArcs major cations vs chloride plot
NiskdArcs log a (HCO3/Hg) vs a (SO,) plot NisWArcs log a ( ~ g ' ~ ) vs a (s0,/ca2+) plot
Calcitedolomite stability diagram
Mississippian to Upper Mannville sodium vs chloride plots
Mississippian to Upper Manndle calcium vs chloride plots
Mississippian to Upper Mannville magnesium vs chloride plots

Figure 2.34
Figure 2.35 Figure 2.36
Figure 2.37
Figure 2.38 Figure 2.39
Figure 2.40
Figure 2.41
Figure 2.42
Figure 2.43
Figure 2.44
Figure 2.45
Figure 2.46
Figure 2.47 Figure 3.1
Figure 3.2
Figure 3.3
Figure 3.4
Figure 3.5
Figure 3.6
Figure 3.7
Figure 3.8
Figure 3.9
Figure 3.10
Figure 3.1 1
Figure 3.12
Figure 3.13
Figure 3.14
Figure 3.15
Figure 3.16
Figure 3.1 7
Figure 3.19
Mississippian to Upper Mannville potassium vs chloride plots 89-90
Mississippian to Upper MannviIle bicarbonate vs chloride plots 92-93
Mississippian to Upper Mannville sulfate vs chloride plots 94-95
Smectite stability diagram 99
Mississippian aluminosilicate stability diagrams 100-101
Sawtooth duminosilicate stability diagrams 104-105
Lower Mmville aluminosilicate stability diagrams 1 06- 107
Upper Mannville alumhosilicate stability diagrams 108-109
Lower Mannville log a (Na+M) vs a (K'/H') 110
Temperature vs log a (silica) plot I11
Miss. To U. Mannville log a (C~"/(K)~) vs a (~g+/(~3') 1 15- 1 1 6
Viking/Bow Island major catiodanion vs chloride plots 119-121
VikingBow Island aluminosilicate stability diagrams 123-124
Vikingmow Island log a (C~'-/(H')') vs a (~g-/(H-)') 126
Major structural features of study area 139
Hydrostratigraphy 145
6D vs 6I8O of sampled water 149
Nisku/Arcs aquifer fluid flow paths
Mississippian aquifer fluid flow paths
Sawtooth aquifer fluid flow paths
Lower Mannville aquifer fluid flow paths
Upper Mannville aquifer fluid flow paths
Vikin&/Bow Island aquifer fluid £low paths
NisWArcs aquifer pressure-depth plot
Mississippian aquifer pressure-depth plot
Sawtooth aquifer pressuredepth plot
Lower Mannville aquifer pressure-depth plot
Upper Mannville aquifer pressure-depth plot
VikingBow Island aquifer pressure-depth plot
NisMArcs 6"0 vs T plot 175
Mississippian 6180 vs T plot 175
Sawtooth 6180 vs T plot 176
Lower Mannville 6180 vs T plot 176

Figure 3.20
Figure 3.2 1
Figure 3.22
Figure 3.23
Figure 3 -24
Figure 325
Figure 3.26
Figure 3.27
Figure 3.28
Figure 3.29
Figure 3.30
Figure 3.3 1
Figure 3.32
Figure 3.33
Upper MannviIle 6180 vs T plot
VikingBow Island 6180 vs T plot
NisWArcs 6180 vs chloride plot
Mississippian 6180 vs chloride plot
Sawtooth 6'*0 vs chloride plot
Lower Mannvi11e 6"O vs chloride plot
Upper Mannville 6"0 vs chloride plot
VikinglSow Island 6"O vs chloride plot
Nisku/Arcs 6D vs chloride plot
Mississippian 6D vs chloride plot
Sawtooth 6D vs chloride plot
Lower Mannville m) vs chloride plot
Upper Mannville 6D vs chloride plot
Viking/Bow Island 6D vs chloride plot

Chapter One
Introduction
The composition of aqueous fluids in sedimentary basins is intimately related to the
geochemical, biochemical, hydrogeologic, and t h d processes that occur during basin
evolution. These processes are all recognized to occur in the western Canada
sedimentary basin and are described to varying degrees in numerous publications. What
is of particular importance is that these processes can leave characteristic chemical
signatures on the fluid composition. The signatures are often subtle but can be
distinguished. The purpose of this study is to try and identify the effects of these
processes on waters fkorn a series of aquifers. The choice of a series of aquifers allows
for the recognition of interaction between fluids of different aquifers and to observe the
effects of different lithologies on fluid composition.
The study examines the chemistry of formation waters within the Devonian Nisku/Arcs
to Lower Cretaceous Viking/Bow Island Formations to determine the effects of mixing,
mineralogical and biological controls, and fluid flow. This objective is realized through
investigating:
1. Regional variations in the chemical and isotopic composition of the formation waters.
2. Changes in chemical composition related to mixing.

3. Water-mineral equilibria.
4. Origin and controls on bicarbonate and dissolved sulfide content.
5. Fluid flow potential and fluid flow paths as described by transport and isotopic
composition of the fluids.
Study ares
The study area is approximately 90,000 krn' bordered on the south and east, by Montana
and Saskatchewan, and extends north to township 30 and west to range 7 west of the 5'"
meridian on the Dominion Land Survey co-ordinates (49" to 5 1.6ON, 1 10' to 1 14.6OW).
Water samples were collected from throughout the region, but sampling was limited by
the availability of producing wells and sufficiently high water cuts. The work is an
extension of previous studies conducted by Cody and Hutcheon (1 994, 1999) and
McLellan (1 995).
There are some additional questions that a study such as this can broach. The answers
are perhaps beyond the scope of this study but they are almost certainly entangled within
the implications of the results. They are:
1. What is the extent of fluid flow in a sedimentary basin that has undergone uplift and
erosion in which flow is dominated by topography driven recharge?

3
2. To what extent do processes other than mixing affect the chemical composition of
formation waters?
3. Given that fluid flow, mixing and mineralogical controls on fluid composition exist,
what are the implications for mass transport?
This study does not directly address these questio~is and yet provides insight as to their
solution. Chapter 2 is an in depth look at the formation water chemistry, linking together
mixing and water-rock interaction in order to identify the processes and perhaps illustrate
how very different they are. Chapter 3 investigates fluid flow, from the potential for flow
to actual flow paths. Chemically conservative behavior is identified in chapter 2 and
utilized in chapter 3 but non-conservative behavior, especially in stable isotopes, is also
proven to be useful in interpreting fluid flow paths.

Chapter 2
Regional Water Chemistry
Introduction
The composition of aqueous fluids in sedimentary basins is intimately related to the
geochemical, biochemical, hydrogeologic and thermal processes that occur during basin
evolution. These processes have ramifications for hydrocarbon exploration and
production as they influence reservoir quality and the economic value of extractable
hydrocarbons. The composition of the fluids influences the kinds of dissolution and
precipitation reactions that occur, the potential for biodegradation of oils, and may affect
bulk sediment properties like resistivity and seismic velocity. Fluid flow may be a
mechanism for the transport of dissolved solids. The distribution of different dissolved
species can provide insight into reservoir continuity and compartmentalization, the
potential for porosity reduction by cementation or enhancement by dissolution, and the
occurrence of biologically mediated reactions such as sulfate reduction or methane
oxidation, ail of which are critical components in the assessment of hydrocarbon plays.
Understanding of the origin of variations in the composition of formation fluids in the
western Canada sedimentary basin (WCSB) has evolved considerably since first
addressed in a series of publications initiated by the Alberta Research Council (Hitchon

5
1964, 19693; Billings et al., 1969; Hitchon and Friedman, 1969; Hitchon et al., 197 1).
Hitchon and Friedman (1969) and Hitchon et al. (1971) suggest extensive mixing of
meteoric water and modified seawater as the origin of salinity variations in the WCSB.
They proposed seawater modification through solution of evaporites, exchange with
carbonates, clays and organic matter, membrane filtration and formation of new minerals.
Sources of chloride in excess of seawater were interpreted to be from dissolution of halite
and membrane filtration (Hitchon a al., 197 1). Spencer (1 987) attributed high salinity in
Devonian formation waters to significant contributions from residual evaporitic brines
with brine composition modified by reactions with Precambrian basement rocks followed
by dilution by meteoric waters. Loss of Na, Mg and increase in K and Ca was attributed
to albitization and dolomitization (Spencer, 1987). C o ~ o l l y et al. (1 990) studied
formation waters of Devonian through Cretaceous age rocks in central Alberta. Comolly
el al. ( 1990) interpreted the waters to comprise three distinct groups. The first two
groups (Group I and 11) are from carbonate and clastic reservoirs respectively and consist
of mixtures of residual evaporite brines and meteoric waters. The third group was
interpreted to be of meteoric origin. Mineral reactions among clay minerals, ankerite
precipitation and, possibly, ion exchange were suggested as having exerted some
influence on the composition of fluids in carbonate reservoirs (Comolly et al., 1990).
Clastic-hosted waters were interpreted to be modified by dissolution of feldspar and clay

6
minerds and ion exchange ( C o ~ o l l y et ai., 1990). Cody (1993), Cody and Hutcheon
(1994) interpreted variations in fluid composition of the Mannville Group of southern
Alberta to reflect dilution by meteoric waters, reactions between clay minerals and
feldspars, and bacterial sulfate reduction introducing carbon dioxide and hydrogen
sulfide.
This study concentrates on the chernisw, origin and evolution of formation waters of six
aquifers ranging in age from Devonian to Lower Cretaceous in southern Alberta. The
study integrates chemical data from the extensive Alberta Energy and Utilities Board
(AEUB) formation water database with 137 water samples collected for detailed
chemical analyses and stable isotopic compositions of C, 0, H, and S. Variations in the
distribution of dissolved constituents are related to mixing, water-rock interactions and
bacterially mediated processes to develop an understanding of the evolution and present
day composition of the formation fluids.
Geology
The study area is located in the southern portion of the WCSB and includes the southern
part of the Alberta basin and the western portion of the Williston basin (Figure 2.1).
There are three principal tectonic and geophysical features included in the study area:
The Rocky Mountain Fold and Thrust Belt and associated hinge zone; the Vuican Low;

Figure 2.1 Map of the study area including the major structural features identified in the text. The study area is indicated by the dashed box.

8
and the SweetgrassiBow Island Arch. The Mesozoic deformation fiont and the associated
hinge zone is marked by a rapid increase in dip, to the wesf of the crystalline basement
through a series of deep-rooted block faults with overlying foredeep strata thickening to
the west (Wright et al., 1994). The Vulcan Low is an aeromagnetic and gravity low
interpreted to be a collision suture bordered on the south by the Medicine Hat Block and
on the north by the Matzhiwin High (Ross et a/., 199 1). Brandley et al. ( 1993)
recognized Paleozoic displacement dong vertical faults in the region of the Vulcan Low
and suggest fault movement may have affected some Mesozoic deposition. In the south,
the Sweetgrass/Bow Island Arch has been identified as a composite feature of basement
structures that manifest themselves as a broad, low-angle, northeastward plunging
anticline (Lorenz, 1982). Topographic highs identified with movement of the complex
have been recognized fiom at least Ordovician to latest Tertiary time (Lorenz, 1982).
This study focuses on Upper Devonian to Lower Cretaceous sedimentary rocks in the
southern part of the Alberta basin. The general Devonian to Cretaceous stratigraphy is
given in Figure 2.2.
The Devonian Nisku/Arcs Formation consists of a shoaling upward cycle of
sedimentation (Switzer et al., 1994). Initial deposition of marine to marginal marine
mudstones to wackestones was followed by the development of a northeast-southwest
trending carbonate bank. East of the bank restricted and hypersaline conditions resulted

3 z! slos idurasslcl 1 Early Cretaceous I Late Cretaceous I
I Colorado Group I

10
in deposition of carbonate muds and evaporites, to the west and north, shallow shelf
carbonates were deposited (Kissling and Slingsby, 1992). The top of the Nisku
Formation is recognized as a regional unconfomity with karst features. Thin sands of
the Calmar Formation were deposited on the Nisku during late stages of Winterburn
Group deposition. The overlying Wabumun Group consists of thick anhydritic units of
the StettIer Formation.
Mississippian strata conformably overlie Devonian carbonates in southern Alberta. An
eustatic sea level rise resulted in deepening and anoxic conditions in the Late Devonian
(Richards ef al., 1994). After the initial deposition of the Late Devonian to Early
Mississippian lower Exshaw Formation, upwarping in conjunction with block faulting re-
established carbonate platform deposition. A period of deepening through flexural
subsidence and local block faulting followed. The reactivation of basement faults
resulted in sagging of Paleozoic strata and deposition of substantial amounts of
Carboniferous sediments. Shallow marine carbonates of the Pekisko Formation
developed, followed by, and coeval with, restricted marine carbonates and anhydrite of
the ShundaLivingstone Formations. Subsequent transgressions resulted in deposition of
carbonates of the Turner Valley and Mt. Head Formations. In southern Alberta
significant erosion of Mississippian strata began in the Late Carboniferous and continued
until Jurassic deposition commenced (Richards et al., 1994).

11
The Upper Jurassic marks the onset of the Columbian Orogen and the deveiopment of a
narrow foredeep trough towards the craton (Smith, 1994). The Middle Jurassic Sawtooth
Formation, a shallow marine shelf sandstone, was deposited around Paleozoic erosional
remnants on the sub-Jurassic d a c e (Poulton et at., 1994). The erosional surface
exhibits considerable local relief with karst features and collapse related to salt
dissolution. Overlying shelf sandstone and shale cycles of the Rierdon and Swift
Fonnations make up the remainder of Jurassic sediments in southern Alberta. A long
period of uplift and erosion followed as movement of the Sweetgrass Arch of southern
Alberta produced a positive topographic feature until late in Lower Cretaceous
deposition.
The Mannville Group unconformably overlies the Jurassic Ellis Group and Mississippian
strata. The Mannville Group is subdivided into Upper and Lower sections, separated by
the calcareous mudstone to limestone Ostracod Member. The Cutbank and Sunburst
members are fluvial-dominated sandstones within the Lower Mannville Formation
(Hayes, 1986, Farshori and Hopkins, 1989). Deposition typically followed a southeast to
northwest trend of sandstone channels. The Upper Mannville Glauconitic sandstone and
A, B, and C units have been identified as non-marine incised valleys surrounded by
interfluvial deposits completing a highly complex stratigraphic architecture (Wood and
Hopkins, 1992). Deposition of the Upper and Lower Mannville Formation channels and

12
incised valley systems was controlled by topographic highs of Mississippian strata whose
orientation was largely the result of north-south to northwest-southeast oriented block
fadts (Zaitlin, 1997)
Lower Cretaceous basal Colorado Formation sediments, marked by a thin conglomerate,
uncooforrnably overlie the Mannville Group. The formal units are the Basal Colorado
Formation sandstone and the Joli Fou Formation shale, which pass laterally into the
Viking/Bow Island Formation in southern Alberta. The VikingBow Island Formation
consists of interbedded fine to coarse grained marine offshore to shoreface sandstones
and conglomerates grading into non-marine sandstones in southeast Alberta overlying the
Sweetgrass Arch (Poulton et al., 1 994). A major transgression followed Viking/Bow
Island deposition resulting in the thick succession of marine shales of the Colorado
Group.
Mineral Stability Diagrams
The relationship between an aqueous solution and mineral phases is often understood
through the use of mineral stability diagrams. In surface and near surface environments
mixing, weathering and diagenesis are the principal processes that affect aqueous solution
composition. Of these, weathering and diagenesis are the processes that relate directly to
the composition of the mineral phases and, perhaps the most common mineral phases

13
associated with weathering and diagenesis are clay minerals. Unfortunately clay minerals
are also the most poorly constrained in terms of composition and thermodynamic
properties.
The clay minerals smectite and illite display considerable compositional variability
(Tardy and Fritz, 1981; May et al., 1986; Giiven, 1988; Ransom and Helgeson, 1993).
To accurately determine the role that clay minerals play in mineral reactions and in
controlling solution chemistry, a broadly applicable method of obtaining their
thermodynamic properties must be utilized. Two methods have been applied to account
for the compositional variations in clays; (1) thermodynamic properties are calculated
from experimental solubility data (Kittrick, 1 97 1 ; Routson and Kittrick, 1 97 1 ; Weaver et
a1 ., 197 1 ) or estimated using chemical analogues for specific compositions (Tardy and
Garrels, 1974; Nriagu, 1975; Chennak and Rimstidt, 1989); and (2) using mixing
equations that consider clay minerals as solid solutions of end-member components
(Tardy and Fritz, 1981 ; Aagard and Helgeson, 1983; Garrels, 1984; Tardy et al., 1987).
Using specific compositions is limited as a rather large data set would be required to fully
describe the range in chemical composition of clay minerals. On the other hand, mixing
models allow for greater applicability because of the generality of solid solution models
and the ability to constrainend member thermodynamic data.

14
The method used in this study utilizes a solid solution model that assumes ideal mixing
on homological sites based on the procedure defined by Aagard and Helgeson (1983).
Chemically complex smectites can be depicted on mineral stability diagrams by
calculation of the activities of the thermodynamic components that make up the smectite
solid solution. The thermodynamic components used are those recommended by Aagard
and Helgeson (1983) and Ransom and Helgeson (1993; 1995). The smectites are
represented by the stoichiometric thermodynamic components pyrophyllite, muscovite,
paragonite and two fictive calcium and magnesium components that are structural
analogues to the potassium and sodium micas. The mixing on sites model of Aagard and
Helgeson (1 983) takes into account independent and coupled substitution on tetrahedral,
octahedral, and exchange sites. This method differs from those of Tardy and Garrels
(1 974), Tardy and Fritz (1 98 1 ), Tardy et al. (1 987), Tardy and Duplay (1 992) in that it
does not involve the use of cation exchange coefficients. Although the amount of
experimental data on cation exchange in soils and clays is quite large, the values for clay
minerals display considerable scatter (Bruggenwert and Kamphorst, 1982). Tardy and
Gmels ( 1992) report the variability of exchange coefficients results in an up to I Okllmol
difference in the calculated Free energy of exchange. Although Tardy and Garrels (1 992)
dismiss the difference as insignificant, a lOkJ/mol change in free energy of a phase will
result in a considerable shift in equilibrium curves on a mineral stability diagram.

15
The practical application of the Aagard and Helgeson (1983) method is that on an
activity-activity diagram the stability curves between the end-member components
represent equilibrium for clay minerals and coexisting aqueous solution. Plotting the
smectite end-rnember components using activities calculated with the Aagard and
Helgeson (1 983) solid solution model at the temperature and pressure of the coexisting
aqueous solution essentially defines a stability field of smectite. If the aqueous solution
compositional data plot within the stability field, then equilibrium between water and
smectite can be assumed. The problem with this technique is that the composition of the
clay mineral has to be known. Smectite clays display limited variability of the
octahedral, tetrahedral and interlayer site charges (Aagard and Helgeson, 1983; Ransom
and Helgeson, 1993). Aluminum occupancy on octahedral and tetrahedral sites shows a
narrow range for natural smectites, and tetrahedral site occupancy itself defines smectites
from illites. (Ransom and Helgeson, 1993). The narrow range in tetrahedral and
octahedral site occupancy suggests that it may be possible to use a smectite
compositional analogue for which only the exchangeable cation composition needs to be
determined if no clay mineral compositional data exists.
The method of Aagard and Helgeson (1983) requires knowledge of the clay mineral
composition, in particular the mole fraction of each of the exchangeable cations. The
composition of the clay minerals for the Sawtooth, Lower Mamville and Upper

16
Mannville clastic resemoirs is not known. The relatively low abundance of clay minerals
(generally less than 3-5%) makes compositional analyses difficult and XRD techniques
require the separation of the fine fraction using distilled water which wiil alter the
exchangeable cation composition to favour calcium and magnesium over sodium and
potassium because of exchange site preference at low ionic strengths (Appello and
Postma, 1 993). Instead, the Belle Fourche montmorillonite (Kittrick, 1 97 1 ) was chosen
as a representative compositional analogue for the aluminum and silicon tetrahedral and
octahedral site occupancy. Knowledge of the mole fiaction of each of the major cations
on the exchange site is also required to complete the calculation. End member activities
were determined by calculating the clay mineral exchangeable cation composition in
equilibrium with each sampled water using the chemical modeling program PHREEQC.
The program models ion exchange as ion association reactions in the form of half
reactions. The Na-Ca exchange reaction:
M C U ~ + + N ~ - X + $ C C ~ - X, + ~ a +
gives two half reactions:
cu2+ +2X 0 CaX, Kcax2
Na' +A- c? RraX K N d i
Where X represents the exchangeable cation site, and CaX, and NaX are the
exchangeable cations occupying the sites. The PHREEQC database contains association

17
constants relative to KN, (i.e. K, -m=(&a,Na~~N~2) where the exchange coefficient &, ,
is derived fiom the Literature. The composition of exchangeable cations of a clay mineral
in equilibrium with an aqueous solution can then be determined. Calculated paragonite
and pyrophyilite activities for a number of smectite mineral compositions are given in
Table 2.1.
Calculation of thermodynamic properties
The stability of mineral phases and coexisting aqueous solutions is often represented
using activity diagrams. Solution compositions plotted on these diagrams can be used to
interpret mineralogical controls on the dissolved constituents. If chemical equilibrium
between fluids and minerals is achieved, measured values of fluid composition calculated
as activities plot on the stability curves of the mineral phases. Phase diagrams are
calculated using thermodynamic properties of the mineral, water, and aqueous species
involved in the equilibria. A number of thermodynamic databases exist that can be
applied to this purpose (Robie et al., 1978; Helgeson et al., 1978, 198 1; Berman 1988;
Johnson et al., 1992). The databases contain thermodynamic data determined fiom
experimental work and calculated using equations of state for a large

Table 2.1. Calculated activities of the thermodynamic components Paragonite and Pyrophyllite for different smectite compositions
Mole fraction of the exchangeable cation on the exchange site Mica co~nponent activities
Na Montana LT-42 8.22E-01 Wyoming 8.22E-01 Belle Fourche 8.22E-01 Upton 8.22E-01 Chambers 8.22E-01 Lo rena 8.22E-01 Wyomlng Clay Spur 8.22E-01
sum 1 .oo 1 .oo 1 .oo 1 .OO 1 .oo 1 .OO 1 .oo
Paragonite 0.06 0.00 0.02 0.03 0.04 0.04 0.02
log a (Parag) -1.28 -1.24 -1.73 -1.58 -1.37 -1.38 -1.70
Pyrophyllite 0.24 0.34 0.39 0.37 0.28 0.32 0.38
Smectlte compositions from Tardy and Fritz (1981) and Ransom and Helgeson (1983)

19
number of stoichiometric minerals. Nonstoichiometric minerals like the clay minerals
illite and smectite are generally not included because of variation in composition.
Srnectite thermodynamic behavior can be l l l y determined when regarded as a regular
solid solution described in terms of nine thermodynamic components (Ransom and
Helgeson, 1993). Ransom and Helgeson (1993, 1994, 1995) recommend a number of
stoichiometric and fictive thermodynamic components to account for the compositional
and octahedral site variations in smectites. Of these, four provide explicitly for the
contribution of the interlayer cations sodium, potassium, calcium and magnesium. The
stoichiometric minerals paragonite and muscovite account for sodium and potassium and
the fictive components C~,Al,Si,0,,(OH)2 and M~.,Ai3Si30,,(OH), describe the calcium
and magnesium contribution (Ransom and Helgeson, 1993, 1994).
The use of fictive components requires calculation of the thermodynamic properties
needed to portray the phase on an activity diagram. A number of techniques exist for
estimating thermodynamic properties (Nriagu, 1 975; Tardy and Garrels, 1974, 1 976,
1977; Helgeson et al., 1978; Robinson and Haas, 1983; Berman and Brown, 1985;
Chermak and Rimstidt, 1989). The methods of Helgeson et al. (1978), Berrnan and
Brown (1985) and Chemak and Rimstidt (1989) were used to calculate the Gibbs free
energy and enthalpy of formation, third law entropy, volume and heat capacity of the

20
fictive thennodynamic components. The thermodynamic databases of Berman et al.
(1985) and Berman (1988) were used in all of the calculations.
Table 2.2. Thermodynamic properties of the fictive smectite end-member components
Ca-Mica and Mg-Mica, calculated using the methods of Helgeson et a!. (1 978), Cherrnak
and Rimstidt (I989), and Berman anci Brown (1 985).
The Gibbs free energy of formation was estimated using the method of Chermak and
Rimstidt ( 1989). The technique involves summing the polyhedral contributions of the
different oxide and hydroxide components. Estimated values for the micas muscovite,
pyrophyllite and paragonite are within 0.1 % of the Bennan ( 1988) database values. The
polyhedral contribution of MgO in 8-fold coordination was not determined by Chermak
and Rimstidt (1989) and had to be calculated separately using a multiple regression
technique. A total of 11 minerals were used following structural sites outlined by
25"C, 1 bar
Ca,,,Al,Si,OdOH)z
M~,A1,SilO,O(OH)z
AGO, Od/mol)
-5583 -3 1
-5530.83
AH0, Od/mol)
-5959.48
-5907.32
So (Jlmol)
262.18 1
256.63 1
VO (Jlbar)
12.906
12-63 1

21
Robinson and Haas (1983) and Chemak and Rimstidt (1983) to calculate the MgO
contribution. The kee energy of the 8-fold coordinated MgO polyhedral unit was
estimated to be -605.00 kJ/mol.
Molar volumes and third law entropies were calculated following the structural analogue
algorithm of Helgeson et al. (1978). The structural analogues used were muscovite and
paragonite. Estimated volumes and entropies using this procedure for micas are accurate
to within 1 % (Ransom and Helgeson, 1994).
Enthalpies of formation were calculated using the Gibbs f?ee energy of formation, third
law entropies, and entropies of formation from the elements. Heat capacities were
estimated using the method of Beman and Brown (1985). Summation of the tabulated
oxide component heat capacity coefficients results in calculated heat capacities within
2% of measured values (Berman and Brown, 1985).
Expansivity and compressibility was not determined as pressure and temperatures in the
system under study do not exceed 200 bar and 80°C, and effects of pressure and
temperature changes on volume are expected to be small.
The Berman (1988) thermodynamic database does not contain data for anhydrite and
Simpson (1999) suggests the Berman (1988) calcite and dolomite thermodynamic data
are not representative for complex aqueous solutions like natural waters. Simpson (1 999)
found the thermodynamic data for calcite and dolomite of Harvie et aI. ( 1984) to be more

22
consistent with aqueous solution chemistry and mineral saturation states than that of
Berman (1988). In this study, the thennodynamic data for anhydrite, calcite and dolomite
is that of Harvie et al. (1984), this data is the same as that listed in the appendix of
Nordstrom and Munoz ( 1 996). The anhydrite, calcite and dolomite thermodynamic data
are not used when considering silicate mineral stability and thus do not introduce any
problems with internal consistency of the database.
Methods
The regional chemical data used in this study were extracted from the Alberta Energy and
Utilities Board (AEUB) database of chemical analyses for waters collected from drill
stem tests (DST), production tests and surface facilities. The data were made available in
digitized form by the Geological Survey of Canada and Rakhit Petroleum Consulting Ltd.
The AEUB chemical analyses primarily report K, Ca, Mg, C1, total alkalinity as HCO,,
C03 , SO4 and Na, where N a is either determined directly, or calculated by difference to
achieve charge balance. Some analyses report a combination of the univalent cations Na
and K as Na by calculation where charge balance is assumed.

23
Data Culling
The AEUB water analyses are subject to a number of potential inaccuracies and those
analyses must be identified and removed (Bachu et al., 1987; Hitchon and Brulette,
1984). contamination associated with drilling, completion and production methods,
incorrect sampled intervals, multiple tested intervals, data entry errors, and multiple
entries are the most common forms of error. The following culling methods are modified
fiom those described by Bachu et al. (1987). Analyses missing any of the major ions Na,
C1, Ca and alkalinity, were deleted, as well as those collected fiom production locations
down-stream of the separators (facilities where water-oil or water-gas mixtures are
separated). Waters with densities less than I , pH less than 4 or greater than 10, and those
with lab analysis dates more than 1 month after sample collection dates were also culled.
Data entry error was removed by calculating charge balance, with imbalances of greater
than 5% being culled. Contamination by drilling mud, acid washes or washes kern
cement jobs was determined by cross-plotting the major cations and anions and by
reviewing the recovery descriptions, waters indicating contamination were removed.
Duplicate analyses, and analyses from larger test intervals, multiple intervals, and
incorrect intervals were removed by scrutinizing the individual well samples. The
resulting regional distributions of water chemistry can then be considered as
representative, although not rigorously precise.

24
In total, 708 Devonian NisWArcs Formation, 4597 Mississippian, 1244 Jurassic
Sawtooth Formation, 4529 Lower Mannville, 2133 Upper Mannville, and 3458
VikingIBow Island Formation water chemical analyses were obtained fkom the database.
After culling, the numbers were reduced to 184 Devonian NisWArcs Formation (26%),
876 Mississippian (1 9%), 426 Jurassic Sawtooth Formation (34%), 1040 Lower
Mannville (23%), 559 Upper Mannville (26%) and 1 161 VikingJBow Island Formation
(3 4%).
In addition to the regional bulk chemical analyses a number of wells were selected for
controlled sampling for high quality chemical analyses, including major cations and
anions, isotopes of carbon, oxygen, hydrogen and sulfur and organic acids. Water
samples were collected from wells that had not been exposed to water flood or other
forms of contamination. Gas wells were generally avoided, but some waters were
collected from production tests on gas wells and fiom separators on high water content
gas wells. In total 137 samples were collected from the Nisku/Arcs, Mississippian,
Sawtooth, Upper and Lower Mannville and Viking/Bow Island resewoirs. The waters
were sampled and preserved following procedures based on those developed and used by
the United States Geological Survey (Lico et al., 1982).
A field laboratory was used to measure and record pH and alkalinity and to preserve the
samples for later laboratory analyses. Water and oil-water emulsions were collected fiom

25
high water cut (>30% water) wells and water source wells. Samples were collected in
clean 9 litre Nalgene carboys and emulsions were allowed to separate. Temperature and
pH were immediately recorded and two small (125 ml) aliquots were collected for
alkalinity measurement and sulfide preservation. Conductivity was measured using a
portable conductivity meter and alkalinity titrations were performed in the field. Sulfide
was preserved using 5050 water-sulfide anti-oxidant buffer (SAOB) mixture. The
remaining water sample was filtered through a prefilter and a 0.45 p filter using a N2
pressure driven filtration device. Samples were preserved for various analyses using the
following methods. A 125 ml aliquot for cation analyses was acidified to a pH of 2 using
nitric or hydrochloric acid. 30 ml was collected for short chain aliphatic acids in amber
glass bottles containing a small quantity of sodium azide as bactericide. In a 60 ml
Nalgene bottle, a 10 ml aliquot was diluted to 60 ml with doubly distilled water and
sealed for subsequent silica analysis. An uncoated Vacutainefi containing
approximately 2 ml of NH,OH solution saturated with SrCI, (ammoniacal strontium
chloride) was filled with filtered water to precipitate SrC03 for "C isotopic analyses. To
preserve for sulfur isotopes, two dark flint glass bottles were filled with filtered water. In
one, BaC12 was added to precipitate sulfate as BaSO,. In the other, cadmium acetate
(CdCH,COOH) was added to precipitate dissolved sulfide as CdS. Water for "0 and D
analyses was collected in two separate vacutainers.

26
Cation concentrations were measured by Atomic Absorption spectrometry on a Perkin
Elmer 5000 AA spectrophotometer. Filtered unacidified samples were used for anion
analysis on a Watersm ion liquid chromatograph using a Waters" anion column.
Dissolved sulfide determinations were made using Orion" sulfide specific and double
junction electrodes.
Stable isotopes of water (180 and D), total dissolved carbonate (I%), and dissolved sulfate
and sulfide ("s) were analyzed in the Stable Isotope Laboratory of Dr. H.R. Krouse,
Department of Physics and Astronomy, University of Calgary. Oxygen isotopic
measurements of water were made by equilibrating CO,(g) with water at 25'C (Epstein
and Mayeda, 1953). The ''01~~0 ratio of the CO,(g) was then measured on a Micromass
MS903 mass spectrometer and the 6"0 reported as %O relative to Vienna Standard Mean
Ocean Water (V-SMOW) with an error of k0.2Oh. 6D of HzO was measured following
the Zn reduction procedures outlined in Coleman et al. (1982). The produced hydrogen
gas was analyzed on a Micromass 602 mass spectrometer with the 6D reported as %o
relative to V-SMOW. Error is estimated to be 5 2 % ~ ~ Carbon isotopic composition was
measured on the dissolved carbonate species precipitated as SrCO,. Dried SrCO, was
dissolved in orthophosphoric acid and the evolved CO,,, was collected in glass tubes.
The 6''~ of the CO,,,, was determined using a Micromass MS903 mass spectrometer.
The carbon isotopic composition was reported as %O relative to the PeeDee Belemnite

(PDB) standard. Error is estimated to be 9 3 % 0 . The isotopic composition of the sulfate
and sulfide was determined on a Micromass 602 mass spectrometer using the methods
described by Thode (1954). The sulfur isotopic composition is reported in 960 units
relative to the Canyon Diablo Triolite (CDT) standard with estimated error of & 1 YM.
The geochemical modeling program SOLMINEQ (Kharaka et al., 1987) was used to
compute the aqueous species distribution and mineral saturation states. The program
calculates activity coefficients of charged species using the Helgeson (1969) B-dot
method or the Pitzer ion-interaction method. The B-dot equation is considered reliable
up to stoichiometric ionic strengths of 2 molal, although it can be effective at 1 4 . 5 molal
(Langmuir, 1997). Solutions with stoichiometric ionic strengths of >Z mold are better
modeled using the Pitzer equation which was formulated specifically for concentrated
aqueous electrolyte solutions. Formation water in Mississippian and younger rocks has
stoichiometric ionic strengths less than 1.5 molal and speciation was carried out using the
B-dot equation. Ionic strengths in excess of 2 required aqueous speciation and mineral
saturation states for the Devonian NiskuIArcs formation waters to be calculated using the
Pitzer ion-interaction equation.
Ail sampling took place at the well head making sampling conditions problematic for
obtaining an accurate pH determination. Degassing due to pressure release and oxidation
of iron and sulfide can result in changes in pH. Measured pH typically reflects the

28
surface pressure and temperature conditions so in-situ pH must be determined through
modeling. In-situ pH was calculated in SOLMINEQ by assuming equilibrium with
calcite. Comolly et al. (1990) provide justification for the calcite equilibration
assumption on the following grounds: (1) rapid equilibration between carbonates and
aqueous solutions compared to the residence time of the formation waters; and (2) the
ubiquitous occwrence of calcite in the Paleozoic carbonates and calcite cements in the
Mesozoic clastic rocks, especially as late stage authigenic phases, imply calcite saturation
is likely.
Results
Locations, chemical compositions, calculated pH, densities, temperatures, pressures, and
depths of the sampled wells are summarized in Table 2.3. Analyzed waters have a
charge balance error of <+/-5%, as determined from analyses. Stable isotope
composition and acid gas partial pressures are given in Table 2.4.
Piper Plots
The water chemical composition of the AEUB data for each of the intervals are presented
as trilinear diagrams in a Piper plot format (Figures 2.3,2.4,2.5, 2.6, 2.7, and 2.8). The
diagrams are drawn by plotting, in rnilli-equivalents, the relative proportions of the major


Trbk r.5, walnw. . . . , . . , . . , d . . ,
OLI wlbn , Oprntor , pool , depth [m) . Plald , Danalty , t , P (kPm), HC03, H , , K . YO . S t L I , Yn h IU 8102 CI 8W4 8 r 8 . pH CO2 pW cr (dm O~ / l l . ~o . l ) . 13W , m- , 1016 . l lul lq , 1.0118 . 30 . iOt00 , 1831 , 82 t1 , 39 . 110. 04 . 7.80 . 694 ,0.0?, 0.58. 0 0 0 338 8088 . 131 , 14 79.1 . 8 15 . 6 54
I.#.lo.tW . Qmcm , mr*nm, , 11 19 , , 1 022 . 38 . 11100 . 8241 . 11360, I 0 , 107 , 70 . WOO A 5.35.0.01. 0 0 5 . 16 00 21.8 13803 3 9 9 8 , 8.03 8 32 Il.a4.10.L4WI , , ! ioes , sultw , 1 0104 , 30 . 1 1 2 ~ 8 . 2840, 10310, $32 , ?a + 95 , 54 ~0 . 4.31 .ooe. 0.55. 0.00. ZJ 1 1 5 ~ s ~ 324 . 7 , 81 5 4 a 41
6~O!tS:IoW. I m~y*rr.) lp44 , tom^( , 101s . 3 7 , ga48 , P I ~ O . O M ~ . I ~ Z 10 O . ~ ~ . W . Z . ~ ~ O . ~ ~ . O ~ ~ . ~ . J O , ~ O . ~ IPOZI ~ r r t r r 54.1 1 0 s 0 3 0 fi.)W.m , ~Fw : L m m ; I r a . RL* . t 010 . 04 . 10540 . 4208 . u e z ? . 10. R e o , 164 , m . 5 0 . t0.w. 4.3?. 0.14 . rr iurr . r 2 e o . l s J 554
o . n . & 4 . ~ ~ 4 , , C u # a n w , W M , 2192 . . 1035 . 08 . 20500 . 402 . 17990. 002 I 0 4 , l ? 9 . 08.70. 1.32 , l . t t . 0 2 3 . . 43.4 282W 1040 4.W . 821 1!!36!a+.##*4 , , L O M ~ I 2100 . . 1 .m . 05 . i 7 i w . az4ot32g3i , 1572 , 910 , 301 . 15000: 21 00.1.24. 0 . w . 01 o sa878 810 281.0 8 w 5.01
0 m . ) 4 ~ t a l W 4 , - . mMunr.r 800 . PI* , 1015 . 50 . 10TW . 8001 , 8195, 817 . 69 45 . . 2.m .O.?l. 1.30. O W . 28.R 12995. 321 0 0 8 5 8 . * I ? ?.O(.*##W( , w M , Iq(MF(rrlk . 2105 , . 104 . 88 , 183W . 1005.33425, I 5 1 4 , 005 . 388 , 143 W.21.2Q.1.20. 0 00 I . 0 53?W 0 0 8 . 201 0 5 84 . 507 ?.1).#?.~(1 ; QL~= , L O M w , 100s . HHOIQ* 1018 31 . 0311 , 2400. 8338 30 33 31 12.40 1 4 0 . 1 4 5 . 8 4 0 . 8 W , 23 1 8250 40 0 2 712 603
I).lO.l)f.WW4 , M . WklynrCI , 1306 .WyfU-b: I 0 1 0 . 44 . 10200 . 3111 . 7360 41 43 . I 0 : 31.00, 1 70 022 . 1 0 1 . 3 8 70. 220 10031 . 0 0 , 874 . 0 b 8.#(.#pI#W , Cm(tR*OwQ( . LorHUmrl , lO?a , (Itnmon , 101 . 41 , 0300 . ,148. 8663. 5 1 35 40 . 780 1 30 , 0 4 0 . 0.80. 0 0 0 2 ? 0 9201 1 2 5 . 0 1 5 0 7 1
l@: t+ . )~ ) : . T M ~ W : a.100111 : 1180 . ~nl#nca : 8.0024 . 40 1 1 3 ~ : 3395: 1600: a# : 38 : 10 : 3 15 . t 84 :O.OJ: 0.10: 1 75 : 10 554 110 . 1 2 5 ' 8 4 : 4 8 1
14.)4a.I(w , w m , , 911 , 1415103 . 1003 . 32 , OW6 3444 1903 P2 , 19 , 1 1 2 W . 1.01 OW, 0.04. 2 $ 4 , 100 1224 10 0 I 1 2 8 12 0 0 1
l)-1)+.)1W4 , RCYk(l#E- , M- , W I , . 1.001 . 33 . 10300 ' 23l3 : $181 ' 8i) . 55 . 30 1 60 . 1 SO : 0 10, 1.00. 0 8 0 28.7 730 49 02.5 . 3.88 8 SO g.g.t.[4~4 , ~ R ) ~ O U C I , MM . 044 . WORLII . I.OQ24 . 31 , OW0 . 3181. 1538. 57 , 52 . I 8 . ?.I8 . 1.30.0.00. 0.08. 038 193 . 185 16 . 2 W.4 . 8.1 6 31
( ( . ~ . t . ) t ~ m w , , 1010 . T-8 , 1.004 . 34 , 10200 . 1504. 2155, 65 . 08 . 40 , 454 . 2 4 0 .0.00, 0 21 . 9.88. 35.9 . 1545 . 85 8 14.7 5.3 . 0 4 8 . - , (I(- , 917 . O I C I w , 1.0024 . 32 . 10400 . 3450, 1002. 52 , 41 . I 1 . 9.70 , 1-54 .O.OI. 0.02. . 2 . 1 . 54 . J t 4 0 . 5 8 . 634
([email protected]?W4# -w u m , i w ? . rr#ts i . w e . s t . rrsps 3244 moo 63 40 28 10.68 t o ? o w O.o? 1 s 3 i . o r . o 1180 , , t o . ? . 5 1 8 . 0.47
0*[email protected]$W4 -Wlpr f . 017 . solrl#&nd f 1.0041 , 34 : 103p0 : 1844 : I011 : 30 : 10 : 11 : 1.27 : 1.35 '0.00: 0.08 : 2 31 25.1 1038 . 20 3 115.9 5 W 6 18 OU144 10 !5W4 . 1.10. . 13.0 , 1178 . 0 . 45 , 1 3 3 J . 5 6 6 . 9 1 0 rw,;l.cw i -2- i 2s : ::: : &?g :'= : :: : ':A? : :f: : :% : : :: : :: : 1.10 . 1 73 :0.03. O W . 2.45, 10.5 , 1 , ~ 40 , 73.3 . 008 . 8 8 8 . , , I- . i t 0 9 . rucr, , 1015 . 34 ; i15oo . lore. 4 ~ 5 . 101 . l e a . $4 , 3.81 6.80 , 003 , 0.11. I 9 4 , 22.0 4030 142 10 08.4 5 . m . 0.11 pja.ji.jw +
, 1 ~ 0 s , fum , 1.01 . 35 , ~ZQOO . IWO. 5 ~ 8 4 , $35 . i b r $7 , @.to . 8 .60 .150 , o.10, 2 .44 , 18.0 . 4049 , 70 11 75.4 5 73 . s w OWM:11.J8W4 , m g n * o ) , U- . 071 , m 1 005 . 31 . ioiw . 4ss1 , . ) i t s , r e . r s 20 . . 2.80 , o . w . 1.80. 4 4 0 , 24.4 2011 . 1 1 0 . 1e.o . 5.8 8 63
,.9.l(.- i RU(l- , I- I 1188 . LolpCalr ; 1027 . 41 , 12800 , 8328.13279. 103 , 188, 110 19 10 10 18.009. 0.18. 0 0 5 . 193 98185 239 9 3 5.58 . 8.27
114t .10.f (~4 , MAl#wF l r Mw I 0 , 1 . 1014 2 , 0 , 0 7 3 3 0 , 85 I 15 , 0 4 . 3 0 0 3 7 , 1 8 . 5 9 . 5 , 2 , 5 . . 718 . . . j o . ~ p ! ~ ~ . ~ a . ~ . .r m- / . or? . m t w . i 014 . sz . l o t s . r w s , 7534, 12 . so , r o . no.59. 3,ao .o,os, 0 2 4 . 11.w. 180 , ass1 . o . 0 1 , e , 1.01 0 a 1 t o . j a . l g ~ g a ~ ~ i , , \.rsi . mom , i . o i r . 40 . ibroo , T ~ S Z , ojso, 117 . 3x1 . 11 , 3.81 , ~o.?o.o.ot, 0.95, 0.1s. 41.9 . WJS . 1237, 47 37.3 , 5 r i . 8.1
~ ~ l ( ( d i HCU 1 1385 , EWN , 1.00t . $0 , 11047 , 3090, 7 ~ t , 075 ,1005, 275, 20 .10~ 1.34 ,o.M, 0.02. 0.00, 0,6 . 7255 5550, 20 . ~ 4 3 . 0 , 5 . 5.51 4 . , &I ($10 . EnOvn , t.011 . SO , tZO85 , 4875. t W 5 , 160 . 760 ; 251 i 10.10 . lS.20.0 15; 0.2% , 0.66 . tB.6 , 0688 . 7939. 64 , 80.0 , 5.19 . 5.58
O U ) . I ) . ~ . ~ ~ T ~ ~ o # @ ~ , , a , 1.017 , 88 . 14T4S , 1902 , 0250 , 1370, T41 , $81. 38.70 ,12.30,0.05, 0.90 . 0.00. 41.3 , 81612, 3102. , 03.0 . 4 39 , 1 00 #.j#md(w I I*(I*. 1 , f + J @ ; 0 . , . 4 0 . 1 I 5 4 3 4 4 4 I I . o w . I . t i . I , rrr . 4 rr . 5 r
OMtlSrtQtOl WI I - *I , (748 ,~..rr-: 1.02s . 02 . 1 4 ~ ~ + 1459. we.. 1147 I HS , 3.0 , 172 . l o 40. , 1 n . . m o . 1807% .on . . a1,4 . 4 55 . 8 87
, I / , I , /

Table 24. Stable Isotope wmporrrtlon of the sampled waters and acid gas partial pressures.
Formation
wng b b & n a Mcine VBdne wng Bwbland mng mng v- wng Vlknp
Oaucaritic uw- Upper MamviPe Upper Mamvate
LF upper- Waucautic
upper- upper-
UpperMamvllh
Upper Manmrilb MaMvioe UpperMemvlae Glauamdic uppar-
Mammlle Cutbenk LawarManmriDe Sunburst Lower Manmrille h e r Mannvilla Taber Lower Manmnlk Lowar Manmnile Lower Manmntle MaMvme Mannvllle Lower M d e Lower MaMvllle Lower Manmrine Lower MannviUe Lower MamviPt Lorwer MaMvilk Lower Mannvilla Lowerh&nnwe Lower MaMvlUe Lower MaMvik L o w w ~ l e Lower Mamviae Lower Mamde Lower hAanmMe Lower MarInviae Lower ManmriUe Lower MannviUe Lower Menmrillft Lower Manmilk,

Table 2.4. Continued.
DLS Location Formation
LararMemvilb LomrrMamviPa m M s m v i l b LowsrMamvJk Sunkrm LawerMamvilb Lower MamviDa
ksalMaMvilh
Osweod BasalQualQ BesalQualQ BBsalQuartz Lower MamrW BasalQuartz Lower MamvJla Basal Quartz LovverMamvilk
1 623 414 lam 1m la22 383
2098 42 554 559 63
3195 50 m 252 346 rim
4 64 91
m Ans - AIcs FliJko Nisku Ares Nisku wku mku Fiisku Nisku Nisku Nisku Nisku Nisku Wabamun

33
cations and anions on ternary diagrams and by combining the two on a quadrilateral
diagram. Piper plots provide a visual method of classifying water into types based on the
dominant ions (for example Na-Cl or Na-HCO,). The Piper plot can provide the ability
to determine if a series of waters are mixtures of end-members. A two end-member
mixture results in a straight line on the diagram although straight tines are not
unequivocal proof that mixing is the controlling process. The following describe each
series of waters with some of the distinctions between waters of a particular unit being
made partially on the basis of location.
The AEUB database waters from the Devonian NiskuIArcs Formations have total
dissolved solid (TDS) content that varies from 8,000 to 242,000 mg/l. Compositions
range from Na-CI to Na-SO, (up to SO, = 85 % anions meqll) dominated. The Na-SO,
waters have higher HCO, content with increasing SO, (Figure 2.3). The highest TDS
waters are of the Na-Cl type and have an increasing Ca and Mg content that correlates
with CI. There appear to be two clusters of data for the Devonian aquifer:
1. High C1, plotting in a linear trend in all three diagrams.
2. Moderate to high SO, and HCO,, plotting in linear trends in the ternary diagrams but
scattered in the quadrilateral diagram.

Figure 2.3. Nisku/Arcs aquifer water Piper plot. The two different groups, Na-CI and Na-SO4 are highlighted.

35
In distinct contrast to the Nisku/Arcs aquifer is the carbonate-hosted Mississippian
aquifer (Figure 2.4). TDS range tiom 4,000 to 104,000 mfl. The dominant water types
are Na-Cl, and Na-KO,-CI (HCO, > 10% anions). SO, contents do not exceed 25%
(meqA) and display little correlation with other cations or anions. Like the Nisku/Arcs
hosted waters, high TDS correlates with Na-CI type water and increasing Ca and Mg.
Three clusters are differentiated for the Mississippian hosted waters:
1. High C1, plotting as a cluster in the anion ternary diagram and as a linear trend in the
cation ternary and in the quadrilateral diagram.
2. Na-HC0,-Cl type waters with variable Ca, Mg, and SO, and plotting over a broad
range of HCO, compositions.
3. Na-CI waters that cluster in the region of chloride and sulfate (80:20). This grouping
is made partially based on the map location of these data (see next section).
TDS values of the Jurassic Sawtooth aquifer waters range from 4,600 to 34,000 mgfl.
The waters are predominately of the Na-HC0,-Cl type similar to group 2 of the
Mississippian aquifer (Figure 2.5). The more chloride-rich waters have the highest TDS
and contain higher sulfate content. Two distinct groupings are recognized:
1. Na-HC0,-Cl waters with relatively higher C1 and SO, content.
2. Na-HC0,-CI waters with variable Ca, and Mg.

% m e q / l Cations Anions
Figure 2.4. Mississippian aquifer water Piper plot. The three different groups, Na-CI, Na-HC03-CI and Na-CI-SO4 are highlighted.

%rneq/ i Cations Anions
Figure 2.5. Sawtooth aquifer water Piper plot. The two different groups, Na-HC03-CI, Na-HC03-CI-SO4 are highlighted.

38
The Lower Mannville aquifer waters plot in a very similar manner to those of the
Mississippian (Figure 2.6). TDS ranges from 4,000 to 91,000 mg/l. The Na-CI waters
have the highest TDS and display increasing Ca and Mg content with increasing Cl. The
three clusters of data defined for the Mississippian aquifer waters are also observed in the
Lower Mannville aquifer, although the high sulfate group is less apparent on the Piper
diagram.
The Upper Mamville aquifer water compositions are also very similar to the
Mississippian and the Lower Mannville (Figure 2.7). The TDS contents range fiom
3,400 to 6 1,000 mfl. Observations made for the Mississippian and Lower Mannville
aquifers apply equally to the Upper Mannville although, like the Lower Mannville, the
higher sulfate waters are not as well separated on this diagram compared to the waters in
Mississippian strata.
Waters sampled fiom the Viking/Bow Island aquifer have considerably different
compositional variations than those of the underlying units (Figure 2.8). TDS contents
range fiom 3,500 to 30,000 mgfl. The waters are dominated by Na-CI and Na-CI-HCO,.
The higher TDS waters correspond to the highest C1 content waters, which also display
the highest Ca and Mg. The Viking/Bow Island aquifer waters can be divided into two
groups:

%meq/ t Cations Anions
Figure 2.6. Lower Mannville aquifer water Piper plot. The three differ- ent groups, Na-CI, Na-HC03-CI and Na-CI-SO4 are highlighted.

Xmeq/ !
Cations Anions Figure 2.7. Upper Mannville aquifer water Piper plot. The three differ- ent groups, Na-CI, Na-HCG-CI and Na-CI-SO4 are highlighted.


42
1. Na-Cl waters plotting as a cluster on the anion ternary diagram and as linear trends on
the cation ternary and quadrilateral diagram.
2. Na-Cl-HCO, waters plotting as linear trends on all three diagrams.
Regional variations in chemical composition
Devonian NiskdArcs Aquifer
The distribution of C1, HCO,, and SO, for the NiskdArcs aquifer is illustrated in Figure
2.9,2.10 and 2.11. Chloride concentration increases from 1,150 mgfl in the south, to in
excess of 149.000 mg/I in the more deeply buried western portion of the study area. A
second C1 low occurs in the northeast with chloride content at <I 5,000 mfl. East of
approximately 1 12.5OW, values do not exceed 25,000 mgll and there is a relatively
shallow concentration gradient. In comparison, the concentration gradient in regions of
C1 contents greater than 25,000 mgA is quite steep.
Concentration of bicarbonate ranges from 161 mg/l to greater than 6,300 mgll. The highs
occur in the central region with lows in the southeast, north and west Lows in the west
correspond to high C1 concentrations.
Sulfate concentration ranges from 152 mg/l to 13.300 mgll. Highs generally correspond
to those of bicarbonate and lows correspond to high C1.

Bicarbonate in mgll
>4m <4m <3500 ~3000 ~ 2 5 0 0 <2ooo 4 5 0 0 < I 000 <500
J . ,OON

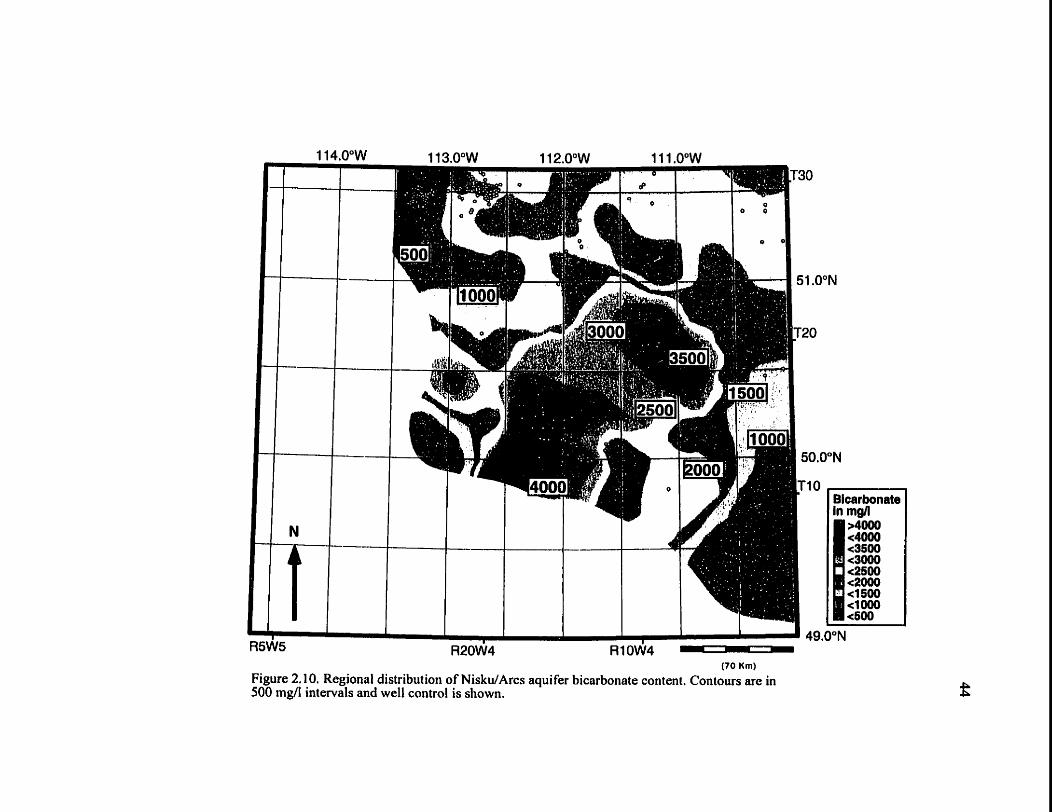
Mississippian Aquifer
Regional variations in C1, HCO,, and SO, distribution of Mississippian hosted waters are
illustrated in Figures 2.12,2.13, and 2.14. Chloride concentration ranges fiom 500 mg/l
to 62,000 mgll. In the southeast, concentration is low (6,000 mg/l) and the
concentration gradient is relatively shallow. Toward the west and northwest the
concentrations increase and a steeper concentration gradient is observed. Two areas
show a lesser change in concentration gradient. The smaller region, centered on 50°N
and 113OW, extends northward and westward. TI..e larger of the two extends north and
west of 5 1"N and 1 10.5"W.
Bicarbonate concentration ranges fiom less than 1 10 mg/l to 1 1,688 mgl. Highs occur as
a broad northeast trending band in the central area with lows in the south, north and west.
Lows in the north and west correspond to highs in C1 concentration.
The concentration of sulfate ranges fiom 0 mg/I to 41 00 mg/l. Highs are restricted to the
north and northeast, and the southwest. High C1 areas tend to correspond to low HCO?
and SO,, and high HCO, correspond to low SO,.


~ 5 W 5 ~ 2 0 ~ 4 (70 Km)
Figure 2.1 3 Map of the distribution of Mississippian aquifer bicarbonate content. Con- tours are in 2,000 mg/1 intervals and well control is shown.


50
Jurassic Aquifer
The distributions of C1, and HCO, content of the Sawtooth aquifer are illustrated in
Figures 2.15, and 2.16. The concentration of chloride ranges from 630 mg/l to 12,400
mg/l. On the map, two Iows, divided by a band of higher C1, are recognized. The low in
the southwest is centred on 49.5"N by 1 12*W, and the other low occurs in the
southeastern comer. Highs are observed in the northwestern extent of the Sawtooth
Formation and coincide with a rapid increase in depth.
Bicarbonate content ranges from 2,203 mg/l to 10,000 mg/l. The distribution of
bicarbonate mirrors that of chloride with highs in the west, and Iows in the south-central
and southeast. A map of the sulfate distribution is not included as the sulfate
concentrations are low and quite variable although the highest sulfate contents occur in
the northwest.


(70 Km) Figure 2.1 6 Regional distribution of Jurassic Sawtooth aquifer bicarbonate content. Contours are in 500 mg/l intervals and well control is shown

Lower Mannville Aquifer
The regional variations in C1, HCO,, and SO, are mapped in Figures 2.17, 2.18, and
2.19. Chloride concentrations range from 545 mg/l to 55,000 mg/l. Lows in chloride
concentration occur in the south and east, and highs occur in the northwest. The
concentration gradient is low in the south and increases towards the northwest. The
change in the concentration gradient mimics that of the Mississippian waters, including
the two regions recognized above which display an initially gradual gradient increase.
The only major difference between the Lower Mannville and the Mississippian occurs
between 49.5" and 50S0 west of 112.5". The chloride content of the Lower Mannville,
above the Jurassic aquitard, increases from south to north then decreases as the subcrop
edge is approached (Figure 2.20). Values north of 49.6" are similar to those of the
underlying Mississippian (Figure 2.21).
Bicarbonate concentration ranges from 29 rng to 12,041 mg/l. Lows are in the north
and west and highs occur in the south and central regions of the study area. The highs
coincide with those observed in the Mississippian and the overall distribution mirrors that
of the Mississippian.
The concentration of sulfate ranges from 0 mg/l to 4,800 mg/l. The highest sulfate
content is in the northeast. The high west of 50.5' by 1 12.5' correlates with highs
observed in the Jurassic and Mississippian.

~ 5 ~ 5 R20W4 (70 Km)
Figure 2.17. Map of the Lower Mannviile aquifer chloride distribution. Chloride contours are in 5,000 mg/l contour intervals and well control is shown. The rectangle demarks the rapid increase in C1 gradient interpreted to be a narrow mixing zone.

~ 5 ~ 5 ~ 2 0 ~ 4 ~ 1 0 ~ 4 - (70 Krn)
Figure 2.18 Map of the distribution o f Lower Mannville aquifer bicarbonate content. Contours are in 2,000 mgfl intervals and well control is shown


Chloride (mgll)
Figure 2.20. Plot of the Lower Mannville chloride content vs latitude. The CI content increases from 490N and decreases at approximately 49.6N.

Chloride (mgll) Figure 2.21. Plot of the Mississippian aquifer chloride content vs latitude. The CI content increases steadily from 49oN. The CI content at 49.60N is the same as that of the Lower Mannville

59
Upper Mamville Aquifer
Regional variations in the distribution of C1, HCO,, and SO, for the Upper Mannville
aquifer are illustrated in Figures 2.22, 2.23, and 2.24. Chloride concentration ranges
from 650 mgfl to 35,000 rng. Chloride concentration is low in the south with the lows
extending up dong the eastern edge of the study area. Highs occur in the west and a
steeper concentration gradient demarks the salinity change. The 10,000 mgA contour
coincides with that of the Lower Mannville and Mississippian aquifers.
The concentration of bicarbonate ranges fiom 140 mg/l to 1 1,250 mg/l. A broad band of
high bicarbonate content water extends across the study area, coinciding with similar
highs in the Lower Mannville and Mississippian. Lows occur in the north and west.
Sulfate content ranges from 0 mg/l to 3000 mgfl.
High sulfate content correlates with highs observed in the Mississippian and Lower
Mannville. The sulfate highs approximately correspond to bicarbonate highs in the
region between 1 12" and 1 13O.


(70 K r n )
Figure 2.23. Regional distribution of Upper Mannville aquifer bicarbonate content. Contours are in 500 mg/l intervals and well control is shown

l Sulfate

63
VikingIBow Island Aquifer
Regional variations in the Viking/Bow Island aquifer C1, and HCO, content are illustrated
in Figures 2.25 and 2.26. Chloride concentration ranges fiom 1370 mgll to 18.000 mg/l.
The regional lows occur in the south. A second low is also present in the northwest. A
broad band of higher C1 water extends fiom the west-central portion of the study area to
the northeast. The concentration of bicarbonate ranges fiom 30 rngA to 4150 mg/l.
Isolated highs are widely distributed except in the west where the highest concentrations
occur. The lowest bicarbonate contents occur in the northeast. Sulfate concentrations in
the Viking/Bow Island culled data are low, typically less than 200 mg/l. The narrow
range in data limits the practical application of sulfate distribution and the map of sulfate
is not included.
Discussion
Chemical trends
The compositional evolution during evaporation of seawater is well documented and
generally follows a predictable pathway (Carpenter, 1978; McCafiey et a!., 1987). Plots
of the variation in the major cations and anions in relation to chloride concentration for
each of the aquifer units are given in the following figures. Included in the diagrams is
the composition of present-day seawater, and the dilution and the evaporation up to Mg-


R5W5 ~ 2 0 ~ 4 (70 Km)
Figure 2.26. Regional distribution of Viking/Bow lsland aquifer bicarbonate content. Con- tours are in SO0 mg/l intervals and well control is show11

66
sulfate precipitation curves derived fiom diluting seawater and by concentrating seawater
through subaerial evaporation (Carpenter, 1978). The range of concentrations of the
dissolved constituents of the culled database and sampled waters coincide, indicating that
the culling methods were effective in removing the majority of the analyses in the AEUB
database that were not representative of formation waters. Some of the data for K, Mg,
and Ca fiom the AEUB database fall below the general trends observed and are obviously
inaccurate but these were not discarded, as the C1 content, used to show regional
variations on the map scale, appear to be reasonably accurate.
Devonian NiskufArcs Aquifer
Variations in cation composition
The NiskdArcs aquifer water sodium and potassium contents show a strong linear
correlation with chloride (Figure 2.27a). Sodium data plot above the evaporation-
dilution (E-D) curve at less than 30,000 mg/l C1 and below the curve at greater than
30,000 rng/l. The high C1(>30,000 mg/L) portion of the sodium trend would intersect the
E-D curve at a point beyond halite saturation and precipitation. The majority of the
potassium data lie above the seawater evaporation-dilution curve (Figure 2.27b). Above
20,000 mgA, potassium concentration varies linearly with chloride concentration. Below
20,000 m a K displays considerable scatter but, in general, displays a continuation of the


68
trend for higher C1. The decrease in sodium and increase in potassium relative to the
seawater E-D curve is consistent with dilution by meteoric water of seawater evaporated
beyond halite saturation.
Calcium contents plot above the seawater evaporation-dilution curve indicating that there
is addition of calcium relative to that expected during seawater evaporation (Figure
2.27~). Two trends are apparent, one at higher than 15,000-20,000 mgfl concentration
and the other at lower concentrations. The magnesium data generally plots below the E-
D curve (Figure 2.27d). The same two trends observed for Ca are evident for Mg. The
lower chloride waters correspond to the Na-SO, dominated waters identified in the Piper
diagram and the higher C1 corresponds to the Na-Cl group.
The concentration of bicarbonate is highest at low chloride concentrations and decreases
considerably at C1 concentrations greater than 20,000 mg/l (Figure 2.27e). Sulfate
content decreases with increasing chloride content (Figure 2.270. There appears to be a
change in the slope of the curve at approximately 20,000 mgA. Sulfate contents lie both
above and below seawater composition and the slope is opposite to that expected with
evaporation-dilution.


V - 0 - S s p

71
Mineralogical controls on solution composition
Significant changes in the concentrations of calcium, magnesium, bicarbonate and sulfate
relative to chloride occur at approximately 15,000-20,000 mgfl CI. Uniike sod im and
potassium, dilution does not seem to be the only factor controlling the concentrations of
these ions. Thermodynamic controls on the composition of aqueous solutions can be
investigated by evaluating saturation states of mineral phases and through diagrams that
show mineral stability relative to the activity of aqueous components.
High sulfate content occurs in a relatively localized area in the Devonian Nisku/Arcs
aquifer. Anhydrite occurs throughout the region of high sulfate content (Slingsby and
fissingly, 1992). The localized occurrence and the relatively dilute formation waters
suggest the increase in sulfate content reflects dissolution of anhydrite. Anhydrite
saturation indices indicate the waters are saturated with respect to anhydrite. The
anhydrite dissolution reaction:
CaSO, * ca2+ + sq2-
releases an equal molar amount of calcium and sulfate into solution. An increase of
4,000 mg/l sulfate should result in an increase of over 1,600 mgA in calcium. However,
calcium concentrations are generally less than 1,000 mg/l at low chloride, high sulfate
concentrations. Inspection of Figures 2.27~ and 2.27d shows that at low chloride
concentrations, the calcium and magnesium concentrations are higher than expected

relative to the trend of the data at C1>20,000 mgA. Calcium content is approximately
500 to 1000 mg/l higher and magnesium is 1 00 to 200 rnd higher. The 500 to 1,000 mg/l
increase in calcium does not hl ly compensate for the 4,000 to 6.000 mg/l increase in
sulfate from anhydrite dissolution. These lower than expected (from anhydrite
dissolution) calcium concentrations indicate removal of Ca. Some other process must
account for the lower calcium content.
Two reactions have the potential to reduce Ca in solution, precipitation of calcite and
reaction of dolomite with Ca2+ to produce calcite. The reactions with are:
ca" + KO,- o CaCO, + 2
Calcite precipitation results in a decrease in calcium, bicarbonate and pH. The number
of moles of Ca and Mg added to the system using 1000 mgll Ca andl 00 mg/l Mg from
above for a 4000 mg/l sulfate increase is insufficient (25 mmol + 4 mmol vs 42 mmol
sulfate) to account for all of the Ca that would be added by anhydrite dissolving. Some of
the calcium (in this example 13 mmol) must be removed by precipitation of calcite.
The possibility of the equilibria 1+2 and 1+3 controlling the chemistry can be tested by
plotting activity diagrams. Figures 2.28,2.29 show the equilibrium for the reactions:
CaSO, + K O 3 - H CaCO, + H+ + SO,'- 4

at temperatures of 40°C and 80°C. Note that reactions 4 and 5 do not contain H', so the
assumption of calcite equilibrium to estimate pH does not influence the plotted position
of water compositions. The water data plot on o r close to the calcite-anhydrite
equilibrium curve at low temperatures (Figure 2.28). The curve shifts an insignificant
amount at higher temperatures and the higher T water data plot in the calcite stability
field. This suggests that at low temperature, reaction between calcite and anhydrite may
be influencing the water composition and approaching equilibrium. In Figure 239, the
water data plot on or near the equilibrium curves for most of the samples at formation
temperature, except the most saline waters. The implication is that a reaction among
calcite-dolomite-anhydrite may be close to equilibrium and influencing warer
compositions throughout the temperature range of the sampled water. A plot of the
calcite-dolomite equilibrium (Figure 2.30) for the temperature range of the data indicates
that the ratio of calcium to magnesium is controlled by the calcite-dolomite reaction.
Origin of the Devonian NiskuIArcs aquifer waters
A mass balance calculation was undertaken to determine the origin of the formation
waters and the potential reactions influencing water chemistry. Spencer (1987)
determined that the majority of Devonian-hosted formation waters consist of residual

0 ] 1 I I I I - 5 - 4 - 3 - 2 - 1 0
log a (SO,,2-)
Anhydrit e + Dolomite
.
Calci t e
log a (S042-ICaZ+)
Figures 2.28 and 2.29. Log activity-activity plots of Nisku/Arcs aquifer waters showing the stability of calcite and anhydrite (2.28) and calcite, dolomite and anhydrite (2.29) at temperatures and pressures of 40.C and 100 bar (solid line), and 70.C and 200 bar (dashed line). Low temperature waters appear to reflect equilibrium between calcite and anhydrite but high T
waters do not (high T curve in 2.28 is virtually unchanged from the low T curve). The water composition may also be influenced by equilibrium between calcite-dolomite-anhydrite through the range in temperatures.

6 8 10 12
log a (Mg2+/(H+)*)
Figures 2.30. Log activity-activity plot showing the stability of calcite and
dolomite at temperatures and pressures of 40°C and 100 bar (solid line),
and 700C and 200 bar (dashed line). Triangles represent the Nisku/Arcs
aquifer water composition. Calcite-dolomite equilibrium appears to be influencing the the ratio of calcium to magnesium in the waters.

76
evaporite brines diluted by meteoric water. Ratios of cations and anions to bromide were
used to determine the extent of evaporation, dilution, and water-rock interaction
(Spencer, 1987). In this study, analytical difficulties in establishing accurate bromide
concentrations made a calculation similar to Spencer ( 1987) impractical.
A mass balance calculation based on establishing the chloride concentration of the brine
end-member, and through that the concentration of Ca, Mg and SO, in the evaporite
brine, was attempted. Table 2.5 summarizes the results of the mass balance approach.
The seawater evaporation curves of Carpenter ( 1978) were used for the calculation. The
first step is to determine the chloride composition of the brine end-member. The linear
correlation of sodium and potassium with chloride suggests that dilution of the residual
evaporite brine is the dominant factor in the compositional variation of Na and K.
Calculation of the chloride content at the intersection of a linear regression of the sodium
data and the E-D curve past halite precipitation gives 185,973 mgll C1 for the AEUB
database and L 87,4 17 mgA C1 for the samples collected in this study. Similar calculations
for potassium are in close agreement with the sodium calculation (1 85,788 and 185,574
mg/l respectively for the AEUB and samples collected in this study). A value of 186,000
mg/l chloride was chosen as the composition of the evaporated brine end-member.
Calcium and magnesium content at 186,000 mgll Cl determined from linear regression of
the >30,000 mg/l chloride waters are listed in Table 2.5. The composition of evaporite

Table 2.5. Mass balance calculations used to determine the origin of NlskUArcs tormation water.
Devonian Linear regression E-D curve int. Concentration at Ilrtne concentratlon
Data Source AEUB
Sampled AEUB
Sampled AEUB
Sampled AEUB
Sampled
Data Range >30,000 mgh CI >30,000 mgh CI >30,000 mgh CI >30,OOO mgN CI >30,000 rngh CI >30,000 mgh CI >30,000 rngh CI >30,000 mgh CI

78
brine with a C1 content of 186,000 mg/l produced by seawater evaporated beyond halite
saturation was also calculated. The calcium, magnesium and sulfate contents determined
by extrapolating the AEUB data to a chloride content of 186,000 mgfl are listed in the
column titled "Brine concentration at C1 186,000 rngT"' The results as mmoM are also
listed. The magnesium and sulfate in the evaporated brine would result in dolomitization
and anhydrite precipitation when in contact with calcite. Dolomitization would produce
calcium and reduce magnesium at a 1:l ratio, and precipitation of anhydrite would
remove calcium and sulfate at a 1 : 1 ratio. The amount of magnesium would be reduced
by: (1) the amount of calcium in the formation water at 1 86,000 mg/l Cl minus the
calcium in the residual evaporite brine; (2) the amount of sulfate in the residual evaporite
brine minus the sulfate in the formation water at 186,000 mgA C1; and (3) the amount of
magnesium in the formation water at 186,000 mgfl Cl. The mass balance equation for 1
liter of water is:
~ g i ~ ; ~ ~ - (caj..warer - caiinc) - - ''4;i.kflfcr) - ~g;L.mtr
Inserting the numbers from Table 2.5 gives:
1,400 - (735 - 0) - (468 - 1) - 188 = 8rnrnol
The residual of 8mrnoM is insignificant to the overall calculation. The mass balance
indicates that there is sufficient magnesium in the evaporated brine to account for the
calcium content in the formation water and the loss of sulfate fiom the brine.

79
Tbese results are not being proposed as a model for the extensive dolornitization of the
Nisku/Arcs Formation. They merely reflect the water-rock reactions required to account
for the present day composition of the fluids through reaction with an evaporated brine
end-member.
The net change in porosity due to dolomitization and anhydrite precipitation can also be
determined. One liter of brine would result in the production of 83cc of dolomite and the
precipitation of 1 8 . 5 ~ ~ of anhydrite. The resultant porosity change in a limestone with
10% porosity would be +12cc for the calcite-dolomite reaction and -1 8.5cc for the
anhydrite precipitation giving a net change of - 6 . 5 ~ ~ or a decrease in porosity from 10%
to 9.35%.
Spencer (1987) applied a mass balance approach to determine the origin of Devonian
brines in central and northern Alberta. He interpreted the brines as being residual
evaporative brines modified by albitization, dolomitization, and gypsum or anhydrite
precipitation, followed by dilution with meteoric water (Spencer, 1 987). The Devonian
Nisku/Arcs Formation waters in southern Alberta appear to have a similar origin.
Seawater evaporated beyond halite precipitation is interpreted to be the precursor brine.
Spencer (1987) assumes bromide and chloride behave conservatively during mixing and
uses the CI/Br ratio to determine the extent of evaporation. Decreases in sodium content
and increases in potassium content in formation water relative to the diluted evaporative

80
brine were attniuted to albitization (Spencer, 1987). In southern Alberta, it appears that
potentially, sodium and potassium have not been influenced by interaction with sialic
rocks. Modification of calcium, magnesium and sulfate content reflects the process of
dolomitization and anhydrite precipitation as described by Spencer ( 1987) and there may
be sufficient magnesium in the evaporite brine to filly account for the high in calcium
and low sulfate observed in the formation waters. Subsequent to the dolomitization and
anhydrite precipitation, the formation waters have been diluted to varying degrees by
meteoric water and dissolution of anhydrite and precipitation of calcite have further
modified the composition.
Mississippian, Jurassic Sawtooth, Lower Mannville and Upper Mannville Aquifers
Variations in cation composition
The Mississippian, Sawtooth, Lower Mannville and Upper Mannville aquifers display
similar compositions and regional distributions of dissolved constituents and will be
treated as a single hydrostratigraphic group. The plots of sodium versus chloride content
for the aquifm display three distinct trends recognized by a change in slope of the Na vs
Cl data: Trend I lies on or near the seawater evaporation dilution curve and extends from
C1 = 5,000 mg/l to >60,000 mgA; Trend 11 has chloride values of 5,000 to 20,000 mgA
with higher Na concentrations; and Trend 111 displays high Na and low C1 (300 to 5,000

81
mgn) (Figures 2.31% 2.31b, 2 3 1 q and 2316). The linear nature of these trends
indicates simple mixing dominates the sodium and chloride composition of the formation
waters. Trend I represents the more saline waters in the west and north. The low
chloride values of trend 1 are from the northeastern region, north of 5 lo (Figures 2.13,
2.17, and 2.22). Trend III waters are from the southern portion of the study area and
trend I1 represents the narrow mixing zone between low chloride waters in the south and
higher chloride waters in the north and west as seen on the chIoride distribution maps.
Intermediate data on the chloride diagrams (lower Na values than trend 111 between C1
1,000 and 5,000 mg/l and waters with Na values that lie between trend I1 and trend I for
C1 <20,000 mgA) represent mixing between the lower C1 portion of trend I with waters
fi-om trend 111.
The calcium, magnesium, and potassium contents, although quite variable, show several
distinct features. Above 20,000 mg/l Cl, calcium is enriched relative to the seawater E-D
curve (Figure 232a-d). Below 20,000 mg/l C1, the calcium data lie above and below the
E-D line. There is large decrease in Ca with decreasing chloride at less than10,OOO mg/l
C1 and an increase in Ca below 2,000-3,000 mgA C1. The majority of the magnesium
values are below the seawater curve (Figure 233a-d). The magnesium content decreases
linearly with decreasing chloride above 5,000-6,000 mg/l C1 and has a lower positive
slope below 5,000 mgA C1. Potassium displays a similar trend with a steep positive slope

1 OOOOOO 1 OOOOOO
a. b.
1oooOO 1 OOOOO
s loooo E V
s 10WO E V
3 Q Z
1000 1000
100 100
10 1000
10 100 loo00 100000 1OOOOOO 100 1000 10000 1oOOOO 1 OOOOOO
(mst!) (mdl)
Figure 2.3 1a,b. Plot of the Mississippian (a) and Sawtooth (b) sodium vs chloride. The three trends, identified by slope
changes, are indicated. The data point that lies close to the Seawater composition in b) is fiom west of 1 130 and corresponds to
trend 1 waters. Data includes that of Hitchon et al. (197 1 ) and Cody and Hutcheon (1 994). The E-D curve is the seawater
evaporation-dilution curve of Carpenter ( 1978). H marks the points at which halite saturation and precipitation initiates.

Figure 2.3 1 c,d. Plot of the Lower (a) and Upper (b) Mannville sodium vs chloride. The three trends, identified by slope changes, are indicated. Data includes that of Hitchon et al. (197 1 ) and Cody and Hutcheon (1994). The E-D curve is the seawater evaporation-dilution curve of Carpenter ( 1978). H marks the points at which halite saturation and precipitation
initiates.

10000 1 OOOO
a. b.
1 ow 1000
s f Y
s f w
5 loo 0 (P roo
10 10
1 100 loo0 1OOOo 1OOOw tOOOOOO 100 1000 1 OOOO 10OOO0 1 woo00
1
(msn) CI (men) Figure 2.32a,b. Plot of the Mississippian (a) and Sawtooth (b) calcium vs chloride. Note the sharp decrease in calcium at C1
between 2,000 and1 0,000- 1 1,000 mdl in (a). Data includes that o f Hitchon et al. ( 1 97 1 ) and Cody and Hutcheon ( 1 994). The E-D curve is the seawater evaporation-dilution curve of Carpenter ( 1 978). G marks the points at which gypsum saturation and precipitation initiates.


Figure 2.33a,b. Plot of the Mississippian (a) and Sawtooth (b) magnesium vs chloride. The dashed line marks the 5,000 mg.1
CI content where a change in slope o f the data is interpreted to occur. Data includes that of Hitchon et al. (1971) and Cody and
Hutcheon (1 994). The E-D curve is the seawater evaporation-dilution curve of Carpenter (1 978). H marks the points at which halite saturation and precipitation initiates.

Figure 2.33c,d. Plot of the Lower (c) and Upper (d) Mannville magnesium vs chloride. The dashed line marks the 5,000 mg/l C1 content where a change in slope of the data is interpreted to occur. Data includes that of Hitchon et al. (197 1) and Cody and
Hutcheon ( 1 994). The E-D curve is the seawater evaporation-dilution curve o f Carpenter ( 1978). H marks the points at which halite saturation and precipitation initiates.
88
at high chloride concentrations (> 20,000 m@) and a lower slope at lower C1 (Figure
234a-d). The potassium data also lie above the seawater curve at lower Cl and below at
higher. The variations in calcium, magnesium and potassium with chloride are
complicated considerably by their aerial distribution. Trend I waters have high Ca, Mg,
and K in the west and much lower values in the north, east of 113". The result is
considerable scatter on the diagrams depending on whether Trend I mixes with Trend I11
along the Trend 11 curve or below it. Mixing lines drawn on the potassium vs. chloride
diagram (Figure 2.34a-d) suggest that potassium does behave conservatively in the
context of the regional distribution whereas calcium and magnesium are subject to
lithologic controls as well. Potassium content shows variations that can be explained by
3 end-member mixing. The mixing relations are perhaps best illustrated in Figure 234b
where the Jurassic Sawtooth Formation does not display the low potassium content
attributed to the north of 5 l o mixing because the unit subcrops south of 51 ". The
different mixing lines suggest that more than one event of meteoric water intrusion has
occurred and waters in the north (Cl>-5,000 mg) reflect an earlier event while waters
in the south reflect present day meteoric recharge.
The variations in Ca are more likely the result of water-rock interaction and are perhaps
better understood in relation to the distribution of bicarbonate. At low chloride content,
bicarbonate concentrations are high and increase nearly linearly with Cl. Trend I1 and 111

t ' ' . " " ' ' ' - . " " " . ' - v - - * - l - ' - . - ' - '
A SampW 0 Seawater
, I
7
> South Mxing North
I . . . . .... 1 . . . . ,... 1 1 . . . . ...
k . - . ."." . . ' . ' ' . . I . . ' . - . ' . l . . . - - . - . 4 A Sampled 0 Seawater
East north of 6 1
I . . . . . ... 1 . . . . . . . . I . . . . . ..&
Figure 2.34a,b. Plot of the Mississippian (a) and Sawtooth (b) potassium vs chloride. Included in the plots are mixing lines
showing the effect of 3 end-member mixing. Waters in the northeast tend to have lower K at higher CI than those of the south,
the result is distinct east-west and north-south compositional variations. The Sawtooth Formation subcrops in the south so only
the east-west mixing for south of 5 l o is observed. Data includes that of Hitchon et al. ( 1 97 1 ) and Cody and Hutcheon (1994).
The E-D curve is the seawater evaporation-dilution curve of Carpenter ( 1 978). H marks the points at which halite saturation
and precipitation initiates.

. . - . . - ' - l . . ......' . . ' . . ' . . .=- I
- South Mixing North
L . - - . . . . - ' . . . . . - . * ' . . . - - - . . ' . . . ..-A
' . ' " " I . ' . . " " I ' ' " . -
' East south ol 5 f'
b Soul h Mxing Nort h
1 . . . . . . . . . . . . . -- 1 1 100 loo0 loo00 1OOOOO l o o m 100 loo0 1OOOOO 1 0 m
cyrngl, (msn) Figure 2.34c,d. Plot of the Lower (c) and Upper (d) Mannville potassium vs chloride. Included in the plots are mixing lines
showing the effect of 3 end-member mixing. Waters in the northeast tend to have lower K at higher C1 than those of the south,
the result is distinct east-west and north-south compositional variations. Data includes that of Hitchon et al. (1971) and Cody and Hutcheon (1 994). The E-D curve is the seawater evaporation-dilution curve of Carpenter (1 978). H marks the points at
which halite saturation and precipitation initiates.

91
waters all display high bicarbonate content and Trend I waters have intermediate to low
values. Bicarbonate content decreases significantly above 10,000 mg/l C1 along two
paths, one at lower C1, and the other at higher (Figure 235a,c,d). The lower HC0,-Cl
curve reflects the broad region of low CL concentration gradient in the northern portion of
the study area and the higher C1 trend reflects the region in the central and western
portions of the area. The highest bicarbonate corresponds to Trend I1 on sodium versus
chloride plot. The increase in bicarbonate observed on both the map and the
concentration plot indicates that bicarbonate has been added to the formation water. The
effect on calcium content is apparent fiom the concentration plots and Table 2.3 with the
lowest calcium corresponding to the highest bicarbonate concentrations. The sulfate
plotted against chloride diagram illustrates the lack of correlation between sulfate and
chloride observed on the maps (Figure 2.36a-d). All of the sampled waters are
undersaturated with respect to anhydrite.

a. 0 Seawater
I I Trend 2
Trond 3 10000.
Q E
b
Y
6 A 0 z
rn i /
IOOO - A /
1 I
A Sampled 0 Seawaler
I I Trend 2
Trend 3 0
4
/ /
/ /
3
0 i I
Figure 2.35a,b. Plot of the Mississippian (a) and Sawtooth (b) bicarbonate vs chloride. The trends defined in the Na vs Cl plot
can be recognized on the bicarbonate vs chloride diagrams. Increasing bicarbonate with chloride in the Trend 3 waters, high
bicarbonate at higher CI in the trend 2 waters and decreasing bicarbonate with CI in the trend I waters is shown. The decrease
in calcium between 2,000 and 1 1,000 mg/l CI is related to the increase in bicarbonate. The high and low CI regions defined in a) are from lower CI waters in the north of the study area and higher Cl waters in the central and western regions. Data includes that of Hitchon et al. (1 97 1 ) and Cody and Hutcheon ( 1994).

1 I
A Sampled
I I Trend 2
r
,
l m . rn
8
0 I I
I
4 A Sampbb
I I Trend 2
Trend 3 1 I
a
h
I l
0 L I
Figure 2.35c,d. Plot of the Lower (c) and Upper (d) Mannville bicarbonate vs chloride. The trends defined in the Na vs CI plot
can be recognized on the bicarbonate vs chloride diagrams. lncreasing bicarbonate with chloride in the Trend 3 waters, high
bicarbonate at higher C1 in the trend 2 waters and decreasing bicarbonate with C1 in the trend I waters is shown. The decrease in calcium between 2,000 and 1 1,000 mg/l CI is related to the increase in bicarbonate. The high and low C1 regions are not as
well defined as in the Mississippian, but are From similar locations. Data includes that of Hitchon et al. (1 97 1) and Cody and
Hutcheon (1 994).

I 1 . - . . . . - . . . a . . . . . ... 4 . . . . . . . . I 100 1000 IOOOOO 10-
1 100 loo0 liqarngll) l o r n 1OOOOOO Ayrn~,
Figure 2.36a,b. Plot of the Mississippian (a) and Sawtooth (b) sulfate vs chloride. There is no correlation between sulfate and
chloride except for in a) at high C1. The high sulfate group identified in the Piper plot of the Sawtooth are also well detined.
Data includes that of Hitchon et al. ( 197 1) and Cody and Hutcheon ( 1994). The E-D curve is the seawater evaporation-dilution
curve of Carpenter ( 1 978). G and H mark the points at which gypsum and halite saturatioi~ and precipitation initiate.

d * loo
Figure 2.36c,d. Plot of the Lower (c) and Upper (d) Mannville sulfate vs chloride. There is no correlation between sulfate and
chloride. Data includes that of Hitchon et al. ( 197 1 ) and Cody and Hutcheon ( 1994). The E-D curve is the seawater evaporation-dilution curve of Carpenter (1978). G and H mark the points at which gypsum and halite saturation and precipitation initiate.

96
Mineralogical controls on sointion composition
The change in lithology from the Mississippian carbonate to the Jurassic and Lower
Cretaceous clastic rocks introduces the possibility of chemical variations that relate to
interaction between fluids and duminosilicates. By plotting mineral stability diagrams
that include clay minerals and feldspars, the potential for water-rock interaction can be
tested. The following diagrams include clay mineral-fluid equilibria calculated following
the procedure of Aagard and Helgeson (1983) as described in the introduction to this
chapter. It must be reiterated that the lines separating the fields for muscovite,
paragonite, Ca-mica, or Mg-mica, and pyrophyllite, represent contours along which an
aqueous solution coexists with smectite that has a fixed log ((~i~2/(~ymphyeite)3) (where a
represents activity).
The reaction involving the muscovite and pyrophyllite end members is:
ZKA12(AiSi30,,)(OH), + 2r + 6Si@,,, = 3AI,Si,01,(OH), + 2K' 6
(muscovite) ( pyroph ylli te)
The equation for equilibrium (6) on an activity-activity diagram is given by:
log(a,. / a,. ) = 3 logaso2,,, + log a,,, - I .s loga,ro,,,l. - 0.5 logK
where K is the equilibrium constant for equilibrium (6). Changes in the activities of
muscovite or pyrophyllite and the effect of temperature on K result in changes in the y-
intercept and a corresponding up or down shift in the curve. In the following diagrams,

97
the activity of pyrophyllite is set by the smectite analogue chosen. Mica activities are
determined using the smectite exchangeable cation composition calculated using the
program PHREEQC, as desmied in the introduction. The diagrams contain two smectite
curves, the first is calculated at 2S°C and pressure according to the measured reservoir
pressures at the lowest temperatures, and the second is at the highest temperature and
pressure for the sampled waters. Calcium, magnesium and potassium mica activities at
low temperatures were found to show a range of up to an order of magnitude because of
variations in the composition of the water. At a given temperature, the exchangeable
cation composition is dependent on the concentration of the cation in the aqueous phase
and on the total concentration of the aqueous solution (Appelo and Postma, 1996). A
water with similar NdK ratios but with different ionic strengths will result in different
exchangeable cation compositions of the clay mineral (or exchanger) because of the
selectivity of the exchanger is greater at low total concentrations. There is also a
difference in the exchangeable cation composition of an exchanger for waters with
differing cation ratios but similar ionic strengths. The mica activities show a range in
values because of this dependence of the exchanger composition on the composition and
ionic strength of the water.
The value selected for the activity-activity diagram is either the lowest or the highest
mica activity for the low temperature samples. On a phase diagram, a decrease in the

98
activity of a component in a phase results in an increase in the size of the stability field of
the phase. An example of the low and high activity effects at 25OC on the equilibrium
curve is given in Figure 2.37. The result is that the water data, if in equilibrium with
smectite of similar octahedral and tetrahedral site occupancy as the analogue, should plot
on or below the curve when the highest mica activity was chosen and on or above the
curve when the lowest mica activity was chosen (the equilibrium curves essentially
define a "stability field" of the smectite at a particular temperature). In general, the
highest activity was used for the cation-hydrogen activity ratio vs dissolved silica
diagrams so the data should plot on or below the curve. The highest temperature samples
should plot on or near the high temperature curves.
Laumontite was chosen as the calcium aluminosilicate phase over anorthite h r two
reasons: (1) laumontite and plagioclase are difficult to distinguish in thin section and
laumontite has been recognized in Mannville Formation equivalent rocks (Ghent and
Miller, 1974); and (2) anorthite as a component in the plagioclase solid solution can be
represented using the activity of the component, and even at very low activity (a=105)
does not plot on the activity diagrams.
The relationship between the aqueous solutions and aluminosilicates is illustrated in
Figures 2.38-2.42. The carbonate hosted Mississippian aquifer waters (Figure 2.38) do
not show a significant correlation to the aluminosilicate mineral phase stability

Muscovite , log activity=-2.9
Kaolinite log activity=-0.41
I I
log a (90,)
Figures 2.37. An example of a log activity-activity plot showing the stability
of smectite, kaolinite and IS-feldspar at 25.C and 100 bar. The diagram
shows the change in the muscovite stability field as the calculated muscovite
activity varies when the exchangeable cation composition of the smectite
analogue varies. The highest muscovite activity (-2.9) is represented by the
solid line and the lowest activity is the dashed line. A series of water data,
used to calculate the exchangeable cation composition and therefore the mica
activity, in equilibrium with smectite at 25C, should fall on or between the
lines. In the diagrams used below, the highest mica activity will generally be
used so water data should plot on or below the line marking pyrophyllite
stability (in this case musc. log a = -2.9).


102
boundaries in the diagrams. The Mississippian aquifer consists predominantly of
carbonates and anhydrite with few silicate minerals and equilibrium with aluminosilicate
mineral phases is not expected. Moreover, the srnectite analogue is Cretaceous in age
and it cannot be expected to be representative of detrital clay in Mississippian-aged rocks.
The waters hosted in clastic rocks appear to display a close relationship to the clay
mineral stability boundaries. The data &om the waters collected in this study fall on, or
below, the 2S°C curves and the high temperature data are reasonably close to the high T
curves. The implication is that a clay mineral of composition similar to the Belle Fourche
montrnorillonite analogue may be in equilibrium with the water. This implies that
smectite is present in the rocks and has come to metastable equilibrium with the pore
waters.
Visual inspection of Jurassic Sawtooth, Lower Mamville and Upper Mannville thin
sections and data from James (1 985): Wood ( 1990), and Cody (1 993) indicate that clay
minerals do occur (4 -5%) predominantly as smectite and mixed layer smectite-illite
with minor amounts of kaolinite. There appears to be equilibrium between kaolinite,
smectite and the fluid in some of the samples (data that plot near the kaolinite stability
field). Kaolinite is observed in a number of thin sections but, as the water data impiy,
does not occur in the majority of the samples. Relatively little feldspar is recognized in
the Sawtooth, Lower Mannville and Upper Mannville Glauconitic aquifers of southern

103
Alberta (Potocki and Hutcheon, 1992; Cody, 1993). The majority of water data in
figures 2.39-2.41 do not plot close to the smectite-feldspar, smectite-laumontite or
smectite-talc-chlorite phase boundaries, and it can be assumed that these phases do not
react significantly with pore waters to influence solution chemistry. Figure 2.42
illustrates the relationship between the water composition and the albite-K-feldspar
stability boundaries. At low T and high T the data do not plot near the smectite-feldspar
boundaries.
If the dominant control on cation content is mixing with dilute meteoric waters then from
equation 6, clay minerals may exert some control on the pH and silica activity. A plot of
silica activity versus temperature (Figure 2.43) shows that silica content does not fall on
the saturation curves of quartz, chalcedony or alpha-cristobalite. The silica activities are
generally higher than silica polymorph saturation for many of the samples and fall
between chalcedony and amorphous silica saturation. The highest silica activities are
from the western portion of the study area at high (>6S°C) and lower (35°C)
temperatures. The elevated silica activities fit the prediction of the smectite solid solution
equilibrium model both through the effect of temperature and compositional changes.
Equation 6 indicates that as the cation activity increases, the pyrophyllite activity and pH
should decrease and mica and silica activity should increase. The mica activities are 1.5
to 2.5 orders of magnitude lower than the pyrophyllite activity, thus only a very small

-5 -4 -3 t -4
log a (S i4 ) Figures 2.39a,b. Log activity-activity plots showing the stability of aluminosilicate phases at temperatures and pressures of
25.C and 100 bar (solid line), and 45.C and 120 bar (dashed line). The triangles represent the Sawtooth aquifer waters. The majority of data plot within the range defined by the low T and high T smectite stability boundaries. Some of the data plot
2
on or near to the smectite-kaolinite phase boundary suggesting equilibrium between smectite and kaolinite is influencing the
@ I I I I I I
b
I I
water composition.
-5 -4 -3 -2 log a (SO2)


Kaolinite -- - - - - r - . r . - . , , , . , - - -P- - -" ,..,.,,a
2
, 1 A krophy l l l t e 1 1 -5 -4 -3 -2
log a (Si02)
8
a.
n 6 - f: z z u
0
0 - 4 -
2 -5
Figures 2.40a,b. Lop activity-activity plots showing the stability of aluminosilicate phases at temperatures and pressures of 2542 and 100 bar (solid line), and 7OC and 200 bar (dashed line). The triangles represent the Lower Mannville aquifer
waters. The Lower Mannville data fall on or near the smectite analogue stability boundaries at low and high temperatures.
log a (S i4 )
Paragonite
Some of the data lie near the albite-smectite, K-feldspar-smectite and laumontite-smectite as well as the kaolinite-smectite
b- . . - - . . - - - - . - . . - . . - . . - - - - - . " - . . - - - a
Kaolinite
phase boundaries.
I I High T I I I
i qrrophyllit e I I I I I I I I 8 I I
I I
I -4 -3 -2


- 5 -4 - 3 -2
log a (Si02) log a (Si4)
Figures 2.41 a,b. Log activity-activity plots showing the stability of aluminosilicate phases at temperatures and pressures of
25.C and 1 00 bar (solid line), and 50.C and 1 30 bar (dashed line). The triangles represent the Upper Mannville aquifer
waters. The data correlate reasonably well with the smectite analogue stability boundaries. The high T data do not plot near the high T curve, but the majority of the waters plot within the range of mica activities at reservoir temperature.


L
Albite
e
e
e
t e e
I - e
e
I
e
a I Muscovite i e e
e
e
e
e
I
e
e
e e
e
I
e
e
e
e
I
1
e
e
8
e
8
e
e
I
I
I
I
I
e
e
e
I
e
I
e I I I
I I I
log a (K+/A+)
Figures 2.42. Plot of the log activity (Na+/H+) vs log activity (K+RI+) for
the aluminosilicate phases shown at 25C, 1 00 bar (solid line) and 7 K .
200 bar (dashed line). Water data is from the Lower Mannville aquifer.
The waters do not plot near the feldspar stability boundaries in this
diagram and the data plot over a wider range than that defined by the
albi te-K- feldspar equilibrium between 25 and 70°C. The highest T samples
(T given on the diagram) plot well below the stability boundaries. The data
do, however plot in the area defined by the smectite analogue coexisting
with an aqueous solution. Log activities used in the diagram are at 25C
Paragonite==- 1.7, Muscovite=3 -4, Silica43.4 and at 709: Paragonite=- 1 -8,
Muscovite=-2.9, Silica=-2.7

25 4 -3 -2
log a (Si4) Figures 2.43. Temperature vs log activity of dissolved silica plot. The majority
- ----- Chalcedony
---------- Alpha-Cristobaiite
- - Amorphous Silica
NiskutArcs
0 Mississippian
0 Jurassic
v Lower Mannville
A Upper Mannviile
+ Viking/Bow Island
I I
I i i i i I
I
I
of the data plot between alpha-cristabalite and amorphous silica saturation. It can be seen from this diagram that the silicaactivity of the clastic-hosted waters tend to be higher than those of the carbonate-hosted waters.

I12
change in the pyrophyllite activity is required to compensate for changes in the cation and
silica content observed. Silica activities in excess of quartz saturation in marine
sediments containing smectite and K-feldspar have long been recognized (Tardy and
Garrels, 1974). Mackenzie and Garrels (1 965) measured elevated silica activities in
experiments in which different clay minerals were submersed in seawater and allowed to
equilibrate over an extended period of time. In fact the silica content of seawater in
contact with montmorillonite was 4 to 8 times greater that of than kaolinite, chlorite,
illite, or muscovite after only 6 months (Mackenzie and Garrels, 1965). Aagard and
Helgeson (1983) used phase relations to determine that at temperatures below 200°C,
smectite is not stable in aqueous solutions that are saturated with respect to quartz.
Abercrombie et al. (1 994) propose that the smectite to illite reaction may in fact be the
result of the reduction in silica activity as the quartz Si02 polymorph becomes stable.
Using a number of data sources they point out that at low temperatures in the presence of
smectite, aqueous silica activities are high and choosing a silica polymorph to define the
aqueous silica activity is problematic. The results of this study and Abercrombie et al.
(1994) indicate that at low temperatures, silica activity may be largely controlled by the
presence of smectite.
The relationship between the calcium and magnesium content of the Mississippian to
Upper Mannville aquifers can be determined by plotting activity diagrams similar to

113
those plotted for the Devonian aquifer. Formation waters are undersaturated with respect
to anhydrite, therefore only the dolomite reaction needs to be taken into consideration.
Figure 2.44~-d shows the relationship between fluid composition and calcium-
magnesium mineral equilibria. The majority of the Mississippian data plot on the calcite-
dolomite curve (Figure 2.44a). The data that plot below the curve are fiom the mixing
zone between low and higher C1 waters (Figure 2.13). Precipitation of calcite is the most
likely process to account for the decrease in calcium. In carbonate host rocks, the
addition of CO, to the aqueous phase results in calcite dissolution due to the decrease in
pH. However, mixing of bicarbonate-rich, low calcium waters with higher calcium, low
bicarbonate fluids can produce oversaturation and precipitation of calcite (Runnels,
1969). The mixing zone in the study area represents just such an environment.
Formation water with high calcium content mixes with bicarbonate-rich water. The net
result is that in carbonates some calcite precipitation occurs as evidenced fiom Figure
2.32 and 2.35. In the clastic aquifers (Figures 2A4b,c,d) the majority of the data plot
below the calcite-dolomite equilibrium curve. Calcite precipitation through mixing may
also be taking place, however reactions between the silicate minerals and an aqueous
solution can buffer pH (Smith and Ehrenberg, 1989; Hutcheon and Abercrombie, 1990;
Hutcheon et aL, 1993) and have to be considered Hutcheon and Abercrombie (1 990)

114
suggest the reaction between kaolinite and smectite regulates the a,va. la,. of a fluid via
the equilibrium:
Na' + kaolinite a Na - smectite + kl+ 7
The activity diagrams (Figures 2.39-2.41) indicate that equilibrium between smectite and
kaolinite in several of the samples exists, suggesting pH may be buffered by an
equilibrium similar to equation 7. In samples where kaolinite is not noted to occur,
equation 6 indicates that with dilution, pH should increase as the smectite end-member
reaction favours the right hand side as the cation (Na, K, Ca, Mg) activity decreases. I f
pH is increased by aluminosilicate equilibria, calcite precipitation will result. In clastic
rocks containing clay minerals or other pH buffers, calcite will precipitate until
equilibrium at the buffered pH is reached. Waters in the Jurassic, Lower Mannville, and
Upper Mannville aquifers are interpreted to have migrated into the units from the
Mississippian. The majority of sampled waters from the Mississippian aquifer indicate
that calcite-dolomite equilibrium is being approached and is influencing the water
chemistry. It can be assumed that prior to flow into the clastic aquifers, waters had
calcium to magnesium activity ratios that reflected calcite-dolomite equilibrium.
Equilibria like 6 and 7 are potential pH buffers in the clastic aquifers and decreases in
calcium activity relative to the calcite-dolomite equilibrium curve are interpreted to be
the result of calcite precipitation in a pH buffered system.

12
a. - K(‘MIS'1C / ;.*' --*..*--. KrM 75-T' -. .L- < . - l )?S1 lC , </*' - - . C-1)75"<' Ca-mica
Sa~rlplcd
r 10-
Mg-mica
I 1 6
I 8 10 1 2
log a (Mg2+/(H+)2) 6' s' 1b 1'2
log a (MgZ+/(Ht)*) Figures 2.44a,b. Log activity-activity plots showing the stability of aluminosilicate phases and calcite-dolomite at temperatures shown. The triangles represent the Mississippian aquifer waters in (a), Sawtooth aquifer waters in (b), Lower
Mannville aquifer waters in (c) and Upper Mannville aquifer waters in (d). KCM refers to the kaoliniteCa mica-Mg mica
phase boundaries at the given T, and C-D refers to the calcite-dolomite boundary at the given T. The C-D lines are the
diagonal lines that span the diagram and the calcite and dolomite stability fields encompass the upper and lower portions of
the diagram respectively.


117
Origin of Mississippian to Upper MannviIle aquifer waters
Chloride content in excess of seawater indicates two possible sources for the high salinity
waters. Halite dissolution would result in high sodium and chloride content but the high
potassium content at greater than seawater chloride and the lack of proximal halite
deposits makes this unlikely. An evaporative marine brine origin, similar to that
suggested for waters in the Devonian, is more probable. There are several possible
compositions of the brine end member. A potential restriction on the degree to which
evaporation proceeded is that the sodium data lie on the evaporation-dilution curve, and
halite saturation may not have been achieved. Unfortunately, mass balance does not
provide any other constraints on the Mississippian- to Lower Cretaceous-hosted brine
end-member. However, the regional geology does perhaps allow for a qualitative
interpretation. The Mississippian strata of southern Alberta was extensively eroded prior
to deposition of the Jurassic and again prior to and during deposition of the Lower
Cretaceous. It is unlikely that formation waters present prior to the erosion events would
have survived a near complete flushing of the system by freshwater. The underlying
Devonian aquifers do contain saline brines and the brine end-member of the
Mississippian and younger units may be related to the Devonian hosted brines. Comolly
et al. (1 990b) interpreted the saline formation waters of Mississippian, Jurassic and

118
Lower Cretaceous aquifers of central Alberta to be genetically related to Devonian
formation waters. It appears that a similar conclusion is valid for southern Alberta.
VikinglBow Island Aquifer
Variations in major ion composition
The Na-CI data for the VikingBow Island aquifer lie on the seawater evaporation-
dilution curve (Figure 2A5a). The linear correlation of sodium with chloride suggests
that mixing between seawater and dilute meteoric water is the dominant control on
sodium content. Calcium content ranges from compositions approximating seawater to
below the seawater curve at lower C1 (Figure 2.45b). The data display a steeper slope at
higher Cl (> 8,000 mgA) and a lesser slope at lower C1 concentrations. Magnesium and
potassium data display trends similar to calcium, but plot well below the seawater curve
(Figure 2.45c, d). Bicarbonate content decreases with increasing chloride following two
trends that reflect the regional variations in composition (Figure 2.45e). There is no
correlation in sulfate to chloride content (Figure 2.4Sf).

Figure 2.45a,b. Plots of the VikindBow lsland sodium and calcium vs chloride. A good linear correlation of sodium with chloride is apparent. The calcium data displays a change in slope at approximately 8,000 mg/l CI. Data includes that of Hitchon et al. (197 1 ). The E-D curve is the seawater evaporation-dilution curve of Carpenter ( 1 978).

Figure 2.45c,d. Plots of the VikinglBow Island magnesium and potassium vs chloride. Both potassium and magnesium data
display relatively smooth curves (especially for the sampled analyses) suggesting a mineralogical influence on water
composition. Data includes that of Hitchon et al. (1 97 1 ) . The E-D curve is the seawater evaporation-dilution curve of
Carpenter ( 1 978).

Figure 2.45e,f. Plots of the VikingfBow Island bicarbonate and sulfate vs chloride. The two groups identified in e) reflect the regional distribution of bicarbonate and chloride. Data includes that of Hitchon et al. ( 1 971). The E-D curve is the
seawater evaporation-dilution curve of Carpenter ( 1978).

122
Mineralogical controls on solution composition
Plots of cation to hydrogen ion ratios versus dissolved silica show no consistent
relationship between the waters and the smectite analogue (Figure 2.46). The Belle
Fourche smectite may be an inappropriate analogue to use for evaluating the Viking/Bow
Island formation water chemistry. However, figures 2.46 b and d show water data
plotting near to the muscovite-pyrophyllite and Mg-mica-pyrophyllite boundary
suggesting potassium and magnesium to hydrogen activity ratios may be influenced by
the presence of mectite. There appears to be some indication that equilibrium between
smectite and potassium feldspar, and smectite and chlorite is being approached for some
of the samples. Chlorite and K-feldspar have been identified in the Viking/Bow Island
by Longstaffe and Ayalon ( 1987) and McLellan ( 1 995). The sodium data plot near to the
mectite-albite stability boundary suggesting the smectite-albite reaction is approaching
equilibrium and pH and silica activity may reflect a mineralogical control. Whether there
is equilibrium between laumontite and smectite is difficult to determine, the data plot
along the Ca-mica-laumontite boundary but the interpretation is equivocal. Mixed layer
illite/smectite clays occur in the Vikinoow Island Formation sands but may not be
exerting an strong influence on fluid composition, or are metastable relative to other
mineral phases that are controlling the solution composition. Petrologic observations
indicate that precipitation of authigenic K-feldspar overgrowths and
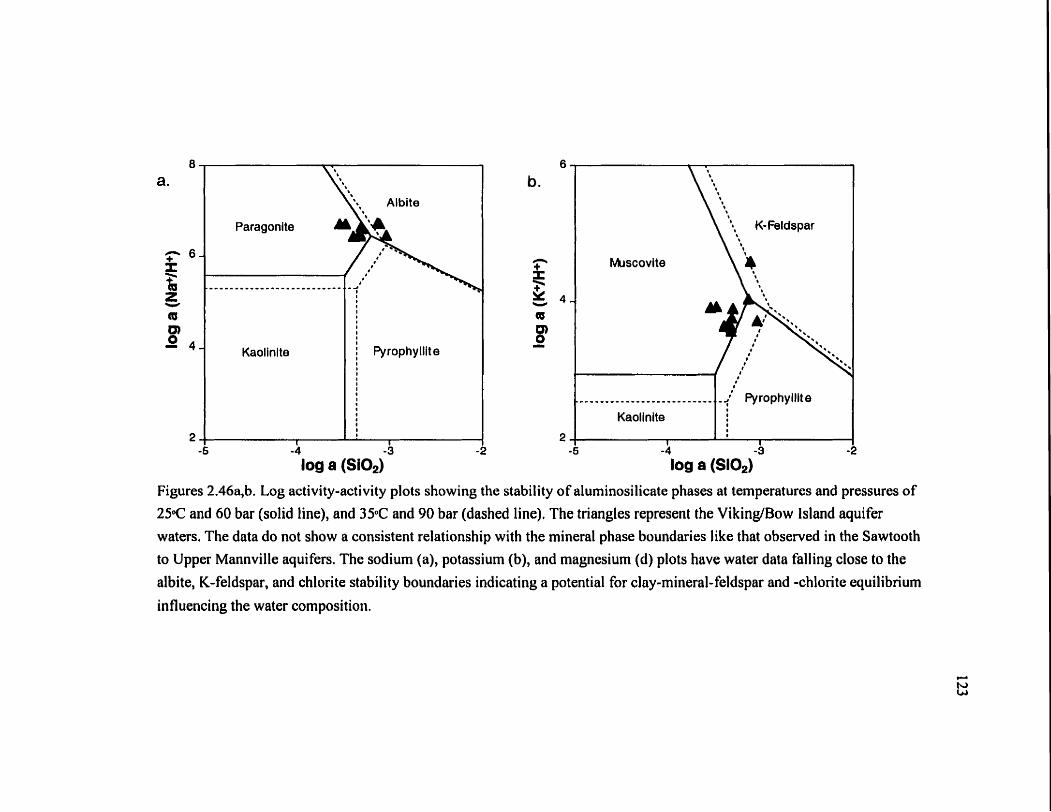
log a (S i4 )
-
-
-5 log a (S i4 )
Figures 2.46a,b. Log activity-activity plots showing the stability of aluminosilicate phases at temperatures and pressures of
2 5 C and 60 bar (solid line), and 35.C and 90 bar (dashed line). The triangles represent the VikingIBow Island aquifer
Paragonite
waters. The data do not show a consistent relationship with the mineral phase boundaries like that observed in the Sawtooth
.---------*------------
Kaolinite
1
to Upper Mannville aquifers. The sodium (a), potassium (b), and magnesium (d) plots have water data falling close to the
I I I 1 1 I I I I 1
1 I I 4 I I I I 8 I I I I I I
1
albite, K-feldspar, and chlorite stability boundaries indicating a potential for clay-mineral-feldspar and -chlorite equilibrium
-4 - 3 -2
influencing the water composition.


125
dissolution of plagioclase has occurred (McLellan, 1995). The small change in potassium
(400 mgll) would result in a very small increase in sodium (60 mg/l) and could not be
recognized within the scatter of sodium data.
A plot of calcium versus magnesium shows a strong correlation to calcite-dolomite
equilibrium (Figure 2.47). The samples that fall off of the curve show a calcium
decrease relative to magnesium, probably due to calcite precipitation. The samples that
fall off the curve are from mixing zone areas where low chloride bicarbonate-rich
meteoric waters mix with higher chloride waters. Authigenic dolomite and calcite were
observed in thin section and have been reported to occur in VikingIBow Island
sandstones from within and to the north of the study area (Foscolos et al., 1982;
Longstaffe and Ayalon, 1987; McLellan, 1995). The dolomite is interpreted to be of
early to mid-stage diagenesis and calcite precipitation occurs as an early phase and/or
later in the paragenetic sequence (Longstaffe and Ayalon, 1987). The calcium-
magnesium relationship may reflect early dolomitization and dolomite precipitation
followed by dilution with meteoric water and calcite precipitation.
Origin of the VikinglBow Island Formation water
The sodium vs chloride data suggests that the VikingIBow Island Formation water
originated as seawater. Calcium and magnesium contents reflect dolornitization of calcite
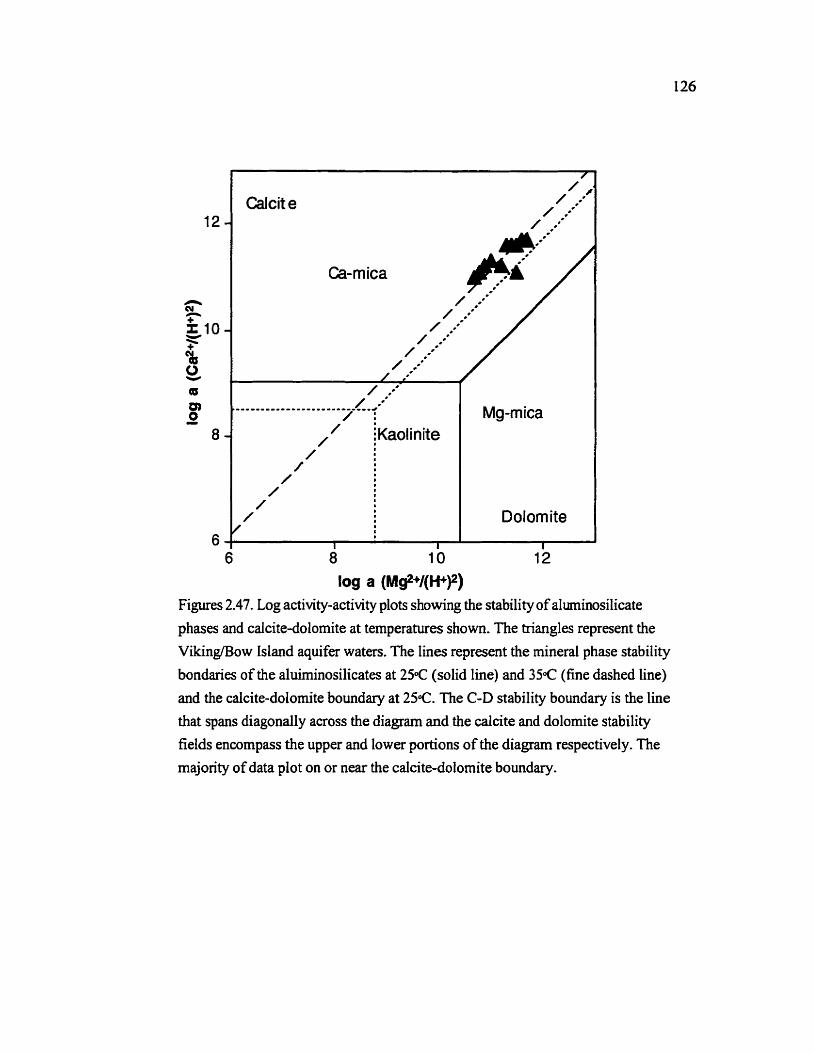
I
-
-
Figures 2.47. Log activity-activity plots showing the stability of aluminosilicate
6 6
phases and calcite-dolomite at temperatures shown. The triangles represent the
8 10 12
/
/ i Calcite 1 *-•
Viking/Bow Island aquifer waters. The lines represent the mineral phase stability
bondaries of the aluiminosilicates at 25.C (solid line) and 35C (fine dashed line)
and the calcite-dolomite boundary at 25.C. The C-D stability boundary is the line
log a (M~~+I(H+)~)
/ ,*=
/ ** .--------------------------.a
/ I / / iKaolinite
/ I I
f I 8 I
/ I
I
/ I I I
/ I I
/ I I
I I
I I
that spans diagonally across the diagram and the calcite and dolomite stability
Mg-mica
Dolomite
fields encompass the upper and lower portions of the diagram respectively. The
1 I I
majority of data plot on or near the calcite-dolomite boundary.

127
and loss of potassium is attributed to feldspar overgrowth precipitation. Subsequent
dilution by meteoric water has modified the composition.
Origin of high bicarbonate waters
Elevated bicarbonate concentrations in regionally restricted areas are observed in all of
the aquifers (Figures 2.10, 2.13, 2.16, 2.18, 2.23 and 2.26). A common source of
bicarbonate in formation waters at low temperatures (<80°C) is the bacterially mediated
oxidation of organic matter (Bailley et al., 1973; Orr, 1977; C o ~ a n , 1984). The majority
of high bicarbonate waters have measurable amounts of dissolved H,S and elevated CO,
in the gas phase. High CO, partial pressures and the presence of dissolved sulfide (Table
2.3 and 2.4) may be the result of bacterial sulfate reduction (BSR) (Om, 1977: Bemer
1985; Machel et al., 1995; Cody and Hutcheon, 1999). A simplified reaction equation
describing anaerobic destruction of an alkane hydrocarbon can be written as (from Rueter
et al., 1994):
C,,H7, -- + 7.75sG- + 5 . 5 s 3 H,O + 7.75f?,S + IOHCO; 7
BSR requires a source of sulfate, hydrocarbons, and the presence of bacteria. Production
fluids From oil wells have been shown to contain sulfate reducing bacteria (Olson et al.,
1981; Stetter et al., 1993). Evidence of the anaerobic degradation of crude oils in

I28
hydrocarbon reservoirs was, until recently, largely circumstantial. Experimental work in
the last few years has demonstrated that sulfate reducing bacteria can directly utilize
hydrocarbons (Rueter et d., 1994; Caldwell et al., 1998).
Hydrocarbon reservoirs in southern Alberta show appreciable biodegradation,
particularly in the areas that correspond to the bicarbonate-rich fluids of this study
(Karavas, 1998; Manzano et al., 2000). The s u l h isotopic composition of sulfate and
sulfide and the low temperature of the reservoirs (Tables 2.3, 2.4) indicate the most
likely process is bacterial sulfate reduction. Sulfate and sulfide sulfur isotopes in the
NisWArcs formation show a shift of -7% to -20% (Table 2.4) consistent with open-
system BSR. The isotopic composition of sulfate is similar to anhydrite sulfate
composition in Devonian aged rocks (Krouse et al., 1988) and the abundance of anhydrite
results in an easily utilized source of sulfate.
The sulfur isotopic composition of sulfate and sulfide are more variable in the
Mississippian and younger aquifers (Table 2.4). Anhydrite is far less common in the
Mississippian carbonates and the majority of the waters are undersaturated with respect to
anhydrite indicating a system where the sulfate supply is restricted. The variable and
often large difference in sulfur isotopic values for aqueous sulfate and sulfide are
indicative of BSR. Equally compelling is the observation that regionally, high
bicarbonate contents coincide with low sulfate content. According to equation 7, sulfate

129
is removed from the system and bicarbonate is produced. Without a local source of
sulfate, there should be low concentrations of sulfate in areas of high bicarbonate. Cody
and Hutcheon (1994) and Cody et al. (1999) attribute high C 0 2 and H,S content and
sulfur isotopic compositional variations in produced waters to BSR in Mannville
reservoirs. The results of this study are consistent with their (Cody and Hutcheon, 1994;
Cody et al., 1999) interpretation and extend the data down into the Mississippian and
Devonian.
Sulfide content is generally much lower than bicarbonate in all of the sampled waters and
C02 partial pressures are typically an order of magnitude higher than H,S partial
pressures in the associated gas phase (Tables 2.3, 2.4). The BSR reaction (equation 7)
produces sulfide and bicarbonate at a ratio of 7.75: 10 and, written in other forms, at ratios
of 1 :2. Sulfide must be consumed by some reaction to account for the discrepancy. Cody
and Hutcheon (1 994) observed large quantities of pyrite in the Mannville reservoir mcks
and attribute the loss of sulfide to pyrite precipitation. Pyrite is observed in all of the
aquifers and iron contents in waters are typically low (Table 2.3). Whether sufficient
iron is available to account for the difference in bicarbonate and dissoIved sulfide is not
known. A simple mass balance calculation indicates that for a 6,000 mgll increase in
bicarbonate, approximately 15 rnrnol of iron would completely precipitate out the sulfide
produced by BSR (using the sulfate1 :2 bicarbonate ratio) as pyrite. Potential sources of

130
iron include ankerite, siderite and magnetite along with a host of other phases that contain
iron in trace amounts. In a rock containing 10% porosity, dissolution of less than 1 cc (or
0.01 volume %) of any of the above minerals would provide sufficient iron to precipitate
the suifide.
Variations in the carbon isotopic composition of bicarbonate are considerable, indicating
that a number of processes are in effect. Carbon isotope values range from -16%~ to
+2 1%0 PDB (Table 2.4). The majority of waters indicate carbon isotope equilibrium with
carbonates of the Mississippian and Devonian with values of 0+/-2%0. Whether values
reflect carbonate dissolution or temperature-isotopic equilibrium cannot be determined
f?om these data. BSR results in little carbon isotope fractionation between the organic
matter and bicarbonate. Values should fall in the range of -1 8 to -33%0 depending on the
isotopic composition of the precursor hydrocarbon (Carothers and Kharaka, 1980).
Reduction of dissolved COz by methanogenic bacteria produces a positive shift in carbon
isotopic composition (Whiticar et al., 1986). Positive 6 " ~ values can generally be
attributed to methanogenesis (Carothers and Kharaka, 1980). The wide range in isotopic
compositions observed in this study suggests interpretation of the source of carbon is not
possible from carbon isotopes alone.

Conclusions
1 . Formation waters of the Devonian NiskdArcs aquifer in southern Alberta are
comprised of Na-CI dominated and Na-HC0,-SO, dominated components. The
regional distribution of chloride indicates mixing with fresher water in the east. The
influx of low salinity water has resulted in the dissolution of anhydrite and BSR,
producing high bicarbonate contents associated with high sulfate.
2. Calcium, magnesium, and sulfate contents reflect equilibrium between calcite,
dolomite and anhydrite. At low temperatures (<50°C) the waters are also in
equilibrium with calcite and anhydrite, independently of dolomite, and high sulfate
with low calcium contents reflect anhydrite dissolution and calcite precipitation. The
composition of sodium and potassium appear to reflect the original brine composition
and have not been modified extensively by water-rock interactions.
3 . The NiskdArcs Formation waters of southern Alberta originated as seawater
evaporated beyond halite precipitation, compatible with the conclusions of Spencer
(1987) and Connolly (1991) for Devonian hosted waters in central and northern
Alberta. Subsequent reaction of the brine with calcite resulted in dolornitization and
anhydrite precipitation significantly altering the brine composition.
4. The Mississippian to Upper Mannville aquifers show similar distributions of chemical
composition. The formation waters are of three recognizable types, Na-Cl, Na-

132
KO,-Cl, and Na-Cl-SO, whose distniution reflects mixing with meteoric water and
perhaps, bacterial sulfate reduction.
5. The Mississippian to Upper Mannville aquifer waters originated as a marine
evaporative brine, probably related to brines in Devonian-aged aquifers. The waters
show considerable dilution by meteoric water, particularly in the south and east. The
unconformity bounded contact between the Mississippian and overlying units, the
southeast to northwest regional orientation of the Lower and Upper Mannville, and
similarities in fluid composition indicate that cross-formational flow From the
Mississippian up into the Jurassic Sawtooth and Lower Cretaceous Mannville
controls the chemical composition of waters in the clastic units. Two distinct groups
of waters are present on a regional basis, with a narrow mixing zone separating them.
Sodium and potassium mix conservatively, however differences in regional
composition suggest that more than one mixing event has occurred.
6. The clastic hosted waters have compositions that are suggest equilibrium with clay
minerals, particularly smectite and in some cases smectite and kaolinite. Silica
activities and pH reflect mineralogical control consistent with the presence of
smectite. Calcium and magnesium content in the Mississippian to Upper Mannville
aquifers reflects control by dolomitization, although calcite precipitation has
subsequently decreased the calcium content in many of the waters. The processes

133
that have resulted in calcite precipitation are mixing of high CaMCO, fluids with low
CaRICO, fluids and CO, addition to systems in which pH is buffered by clay
minerals.
7. Two Viking/Bow Island water compositional types are recognized, Na-Cl and Na-Ci-
HCO,. Variations in chloride content reflect mixing with dilute meteoric water.
Although the Viking/Bow Island formation waters display a complex regional
pattern, the waters appear to have originated as seawater.
8. Activity diagrams indicate that smectite is present but does not exert a dominant
influence on the solution chemistry. Sodium, calcium and magnesium activity ratios
plot near the feldspar, laumontite, and chlorite/talc stability fields and fluid
compositions may reflect mineralogical control of pH and dissolved silica.
Dolomitization and dolomite precipitation has resulted in calcium and magnesium
contents that reflect calcite-doiomite equilibrium. The potassium content differs
appreciably from the conservative mixing curve suggesting loss of potassium.
Feldspar overgrowths are observed in thin section indicating the decrease in
potassium content may reflect K-feldspar precipitation.
9. High bicarbonate contents and trace amounts of hydrogen sulfide indicate bacterial
mediated sulfate reduction has occurred in a large but aerially restricted region.
Stable isotopes of sulfur support BSR as the most likely source of the sulfide.

134
However the source of bicarbonate is more ambiguous. A lack of correlation between
bicarbonate and dissolved sulfide content and variable carbon stable isotope
compositions may indicate some of the bicarbonate is tiom dissolution of calcite
although low calcium contents would require some other sink for calcium such as Ca-
smectite of laumontite.
10. The use of a smectite compositional analogue has proven to be an effective method to
evaluate mineralogical controls on fluid composition in a system where no clay
mineral compositional data is available. The Aagard and Helgeson (1983) solid
solution model for approximating the thermodynamic behavior of smectite is shown
to have applicability for a sedimentary basin system displaying a moderate range in
temperature, pressure and aqueous solution composition.

Chapter 3
Fluid Flow
Introduction
Migrating groundwater acts as a medium of mass transport that chemically and thermally
alters the sediments through which it flows. Evidence that fluids migrate distances of
meters to hundreds of kilometers can be found throughout sedimentary basins as ore
deposits and oil pools. Numerous numerical modeis utilizing basic flow and transport
equations have been generated to describe the conditions leading to fluid migration and
the resultant ore deposits and hydrocarbon accumulations (Cathles and Smith, 1983;
Bethke, 1985; Garven, 1985, 1989; Deming et al. 1990; Deming and NUM, 199 1 ; Ge and
Garven, 1994). As well, current flow regimes have been extensively studied and
described for the WCSB (Hitchon 1969a,b; Schwartz et al, 198 1 ; Toth and Corbet, 1987;
Toth, 1989; Hitchon et al,, 1990; Bachu and Underschultz, 1993; Cody and Hutcheon,
1994; McClellan 1995; Bachu, 1995, and Bachu and Underschultz, 1995). These studies
indicate that although models may describe the possible mechanisms that create flow
potentials, the basins and the sediments uitkii, dictate how that flow is manifested.
The present-day patterns of fluid flow in the basin reflect hydraulic head gradients
produced by both elevation differences and pressure differences caused by erosional

136
rebound (Bachu, 1995). The Alberta basin has been divided into two hydrostratigraphic
systems based on water chemistry, lithology and hydrologic parameters: the post-Jurassic
hydrostratigraphic group; and the pre-Cretaceous hydrostratigraphic group (Bachu,
1995).
In southern Alberta, the post-Jurassic hydrostratigraphic group consists of predominantly
shales alternating with thin sandstones. Salinities are low and reflect periodic flushing by
fresher waters (Hitchon, 1969a,b). Flow systems are largely driven by local topography
in the shallow aquifers (Toth and Corbet, 1987). In deeper aquifers flow is transient,
driven by the erosional rebound of the shale sequences causing inward lateral flow from
the permeable boundaries (Neuzil and Pollock, 1982). The flow is fiom the south and
east towards the fold and thrust belt, opposing the topography (Toth and Corbet, 1987;
Bachu and Underschultz, 1 995).
The pre-Cretaceous hydrostratigraphic group waters in southern Alberta have high
salinities except in the proximity of recharge areas in the south (Schwartz et ai., 198 1 ;
Bachu and Underschultz, 1995) and in the northeast where aquifers subcrop and waters
from overlying formations mix with the pre-Cretaceous waters (Hitchon et al., 1990;
Bachu and Underschultz, 1993). The high salinities of these waters suggest that
Laramide induced flushing was incomplete (Bachu, 1995) and there is no isotopic
evidence of Tertiary meteoric fluids even entering the Devonian strata (Nesbitt and

137
Muehlenbachs, 1994), suggesting that Laramide induced flushing may never have taken
place. Flow is fiom the south towards the northeast, with recharge in Montana along the
margin of the Sweetgrass Arch (Hitchon, 1969 a, b; Schwartz et aL, 1981). Flow does
not appear to be fed by topographic recharge in the fold and thrust belt possibly due to
the overlying thick Cretaceous shale sequences (Bachu, 1995). Eastward flow appears to
be a remnant of tectonic compression with high density fluids retarding flow resulting in
long residency times for the tectonically expelled waters (Bachu, 1995).
The present-day patterns of fluid flow in the Western Canada Sedimentary Basin describe
a complex three dimensional flow system that bears little resemblance to those predicted
by simple flow models. Flow driving mechanisms are operative to varying degrees
throughout the basin but to understand the nature of the flow, models must be constrained
by the available geochemical and hydrologic data. Integration of measurable
geochemical data, including chemical and isotopic composition of waters and fluid
inclusions, with hydrologic data like hydraulic head, permeabilities, and temperatures
may make it possible to understand the present-day flow regime. By understanding the
mechanisms of the present-day flow regime we might open a window on to paleoflow
systems.
138
The objective of this chapter is to examine the salinity variation and flow paths of
formation waters in the southern part of the Western Canada Sedimentary Basin (WCSB)
(Figure 3.1). To do this, chemical and isotopic compositions of formation waters, the
oxygen isotopic composition of rocks and minerals, and the fluid potentiometric data are
combined. Fluid flow in the southern part of the WCSB has been examined by (Hitchon,
1969a,b; Schwartz et a!., 198 1; Hitchon, 1984; Toth and Corbet, 1987a,b; Corbet and
Bethke, 1992; Bachu and Underschultz, 1995; Cody, 1993; Cody and Hutcheon, 1994;
McLellan, 1995), primarily using potentiometric data Some studies (Schwartz et af.,
198 1 ; Cody, 1993; Cody and Hutcheon, 1994) report variations in salinity related to the
flow paths interpreted from potentiometric data. This approach is taken one step further,
showing in detail how the spatial distribution of salinity is related to the potentiometric
surfaces and fluid flow pathways. Further, the oxygen isotopic data for formation waters
are integrated with that for rocks and minerals to examine the possibility that some areas
have experienced more fluid flow than others.
Flow models
The four principle mechanisms for fluid flow are: topography induced flow;
compaction/decompaction ; buoyancy; and tectonics (Garven, 1995).

Figure 3.1 Map of the study area including the major structural features. Contours are of the sub-Mannville unconformity surface relative to sealevel given at 100 meter intervals.

140
Topography driven flow results from hydraulic head gradients caused by variations in
elevation of the water table. Erosionally sculptured land forms exhibit considerable
influence on local flow systems and intermediate flow systems of over 1 km depth
depending on the permeability (Toth and Corbet, 1987). On a regional scale, topography
driven flow systems are mechanistically linked to orogenic activity (Hitchon, 1 969a,b).
Fresh water infiltrates in elevated areas, acquiring heat and dissolved constituents as it
moves downward. Eventually the fluid encounters a permeable aquifer and flows
laterally and upward to the basin edge (Hitchon 19694b). The controlling factor on
water volume is the rate of recharge in the elevated areas, resulting in a potentially
unlimited supply.
Equivalent freshwater head is commonly used in the modeling of groundwater flow in
systems that display considerable variations in fluid density. It is generally assumed that
fluid flow in nearly horizontal aquifers is approximately horizontal and that density
related gravity effects and spatial variations in density are negligible (Bachu. 1995). The
assumption of constant density allows the use of the concept of a potential field described
by a potentiometric surface. The use of a potentiometric surface in analytical and
numerical methods coupled with isotropic rock properties allows for the representation,
analysis and simulation of a number of hydrogeological problems. However, studies in
contaminant hydrogeology, hazardous waste disposal, and petroleum reservoir

141
hydrogeology indicate that assumption of constant density is not valid in some situations
(Bachu, 1995b). Variable density waters introduce a vertical component to fluid flow.
Flow patterns of variable density fluids cannot be accurately determined from equivalent
freshwater pressure or head gradients because a single potential field does not exist under
these conditions. The relative significance of this vertical force can be determined using
an equation for the driving force ratio, an expression of the relative magnitude of a
density related error term to the magnitude of the equivalent freshwater head. Numerical
simulations of fluid flow in variable density systems can indicate changes in flow
patterns induced by buoyancy. In simple models, flow can be effectively represented but
complex models are hindered by uncertainties caused by heterogeneity and anisotropy in
the calculated and measured parameters and in the selection of boundary conditions.
Davies ( 1987) investigated the relative importance of density related effects on fluid flow
and defined the dimensionless driving force ratio (DFR) as:
The DFR is the ratio of the buoyancy component of flow to the pressure component of
flow. Buoyancy drives flow in the maximum direction of VE (gradient in elevation),
which corresponds to the greatest dip of the confining surface. Driving forces, as
expressed by o h , , drive the flow in the direction of the maximum hydraulic gradient.
Davies (1987) determined that DFR values greater than 0.5 indicate flow in which

142
significant error can be introduced if buoyancy is neglected. The DFR illustrates that
even when the dip of an aquifer is small, dense fluids may retard or even reverse flow if
the calculated fkeshwater head gradient is small.
Stable isotopes of oxygen and hydrogen
The use of stable isotopes in groundwater hydrology has proven effective because of the
conservative behavior of the isotopes of water in low temperature (<5O0C) systems where
residence times of the fluid are small relative to the kinetics of isotope exchange reactions
between water and minerals (Whelan, 1987). Gat ( 198 1 ) defined three categories of
subsurface waters based on the isotopic composition and origin: 1) Meteoric waters that
reflect modern precipitation; 2) Older meteoric waters that reflect meteorological or
recharge conditions different from the current regime; 3) Formation waters that have,
over long periods of time and/or at elevated temperatures, had water-rock interaction
result in non-conservative behavior of the oxygen and hydrogen isotopes. Studies of the
stable isotopes of oxygen and deuterium of saline waters in sedimentary basins have
proven to be effective in the interpretation of fluid origins (Clayton et al., 1966; Hitchon
and Friedman, 1969; Kharaka and Carothers, 1986). Clayton el al. (1 966) determined
that formation waters of the Illinois and Michigan basins are predominantly of meteoric
origin, and variations in the deuterium content did not reflect exchange or fractionation

143
processes while oxygen content was subject to considerable exchange with the
surrounding aquifer rocks. Hitchon and Friedman (1969) used the stable isotopes of
hydrogen and oxygen in the WCSB to interpret the origin and geochemistry of formation
waters. Salinity variations were related to the movement of fresh water through the basin
and mixing with diagenetically modified seawater (Hitchon and Friedman, 1969). The
oxygen isotopic composition was interpreted to reflect exchange of oxygen isotopes
between water and carbonate minerals that was dependent on the relative amount of
carbonate available.
Hydrostratigraphy
The Upper Devonian to Lower Cretaceous succession in southern Alberta can be
described within a hydrostratigraphic framework that relates to the hydraulic properties
of the rock. Relatively permeable sandstones and carbonates are identified as aquifers and
less permeable shales and carbonates are identified as aquitards (Schwartz et al., 198 1;
Toth and Corbet, 1987). A hydrostratigraphic unit consists of a single layer, formation,
or group of formations, that display similar hydraulic properties. A hydrostratigraphic
group is made up of a series of hydrostratigraphic units and may be termed an aquifer or
aquitard, depending on the ability to display flow on a regional scale, even if the unit
contains both aquifers and aquitards.

144
The Upper Devonian to Upper Cretaceous strata of southern Alberta have been
subdivided into hydrostratigraphic units and groups by Schwartz et al., (1981), Toth and
Corbet (1987), and Bachu and Underschultz, (1995) (Figure 3.2). The NiskdArcs
Formation is the basal aquifer in this study because it is the lowest unit From which
abundant chemical and hydrologic data was available in the database. The overlying
CalmarICrowfoot to Exshaw and Lower Banff Formations form an aquitard. The upper
portions of the karsted, truncated Mississippian carbonates and the lowermost Jurassic
sandstone, the Sawtooth Formation, form a regional aquifer system. In the southern and
western portions of the study area shales of the Jurassic Rierdon Formation behave as an
aquitard. The overlying Lower Mamville forms an aquifer system, however, the
southeast-northwest trend (Fashori and Hopkins, 1989; Zaitlin, 1997) of the sand
channels limits the lateral (east-west) continuity of the aquifer. The Upper Mannville
consists of an aquifer unit at the base, the Glauconitic sandstone, that is not well
developed in the southern portion of the study area, but forms distinct southeast-
northwest trending sandstone channels in the central and northern regions (Hopkins et al.,
1982; Wood and Hopkins, 1992; Karvonen and Pemberton, 1997). Like the Lower
Mannville, east-west hydraulic continuity in the Upper Mannville is limited. The
Mississippian to Lower Cretaceous Upper Mannville aquifers form a single
hydrostratigraphic group (Schwartz et al., 1981; Toth and Corbet, 1986; Bachu and


146
Underschultz, 1995). The remainder of the Upper Mannville forms an aquitard system.
Overlying the Upper Mannville is the thick, predominantly shaley Colorado Group,
which forms the Colorado aquitard. The Viking/Bow Island Formation, near the base of
the Colorado Group, is defined as an aquifer.
Results
6"O-6D composition of the formation water
Values of 6"0 of water from the study area range fiom -16.5Yih to +4%0 (V-SMOW) and
-1 30966 to 48%0 V-SMOW for deuterium (Table 3.1, Figure 3.3). The data follow the
general trend for Alberta basin waters observed by Hitchon and Friedman (1969)-
Comolly et al. (1990), Cody and Hutcheon (1994), and Simpson (1999). A linear
regression intersects the global meteoric water line (GMWL, Craig, 196 1 ) at 6180=- 1 7%
and 6D= - I29%60, similar to values of local surface water in southern Alberta (- 1 6.S%o
and - 141 Yi respectively, Hitchon and Friedman, 1 969). Most of the waters plot below
the meteoric water line indicating a large enrichment in "0 and comparatively smaller
enrichment of D relative to meteoric water. Waters that deviate considerably from this
trend may reflect some production-related contamination such as water flood or
introduction of water condensed from the gas phase. The data imply meteoric water
forms a significant component of formation water fiom southern Alberta. Mixing of

Table 3.1. Well location. formation name, chloride content and isotopic composition of sampled waters.
Fonnat ion
vdung Bawtdand VJmg v w Vhg BowLPland **ng 'AmJ v*ne v w v i g
Qauwube GlaucDnrbc Glauconmc Cjrautonmc Uwer M e Upper Mamvlla w r Mamnnle Upper MannvlCe GlauconrbE Upper ManmM taatmmc GlauwrubE Glaucorua: Upper Mannnlkt U m r ManmnIe Upper Manmrdh Ghuconne lbuer Manmle Gbu#nmc Upper Marrnvdle Mamvlne Upper- - Upper-
Mamvllle Cutbenk Lower Marude Sunkrrst Lower MennvJlt, Lormr ManmMe Taber Lower Marun& Lower Mannvlle Lcwer MaMvdle Manmd8 ManrnnPe Ldwer M m B e Lower ManmnUe Lower MaMnDe Lower MaMvSe tower MaMvge Lower MaMvlle LDwsr Lower Manmnlle Lower Manmnlfe Lower M a m b Lower ManmUe Lower MaMvlle Lower Mamvdle Iswer Mannvlle Uwar Mamvlle L o w e r m l e Lower Manmnle towar Mamnss Lower Manmile W r MannwUe Lnver Mannv~lls Lower M a m d e Lower Mannvdle sunburn Lower MaMMDe
Chloride @'O% 8-
VSMOW 4700 4.8
12971 4.7 -5 -6.6 531 o a1 a 1 0 -6.0 4200 4.6 9136 4.7 6744 -5. r 6085 -55
12199 6 7 9001 -7.5
VSMOW -79 -78 -77 -TI 40 -n -76 61 -79 -78 45
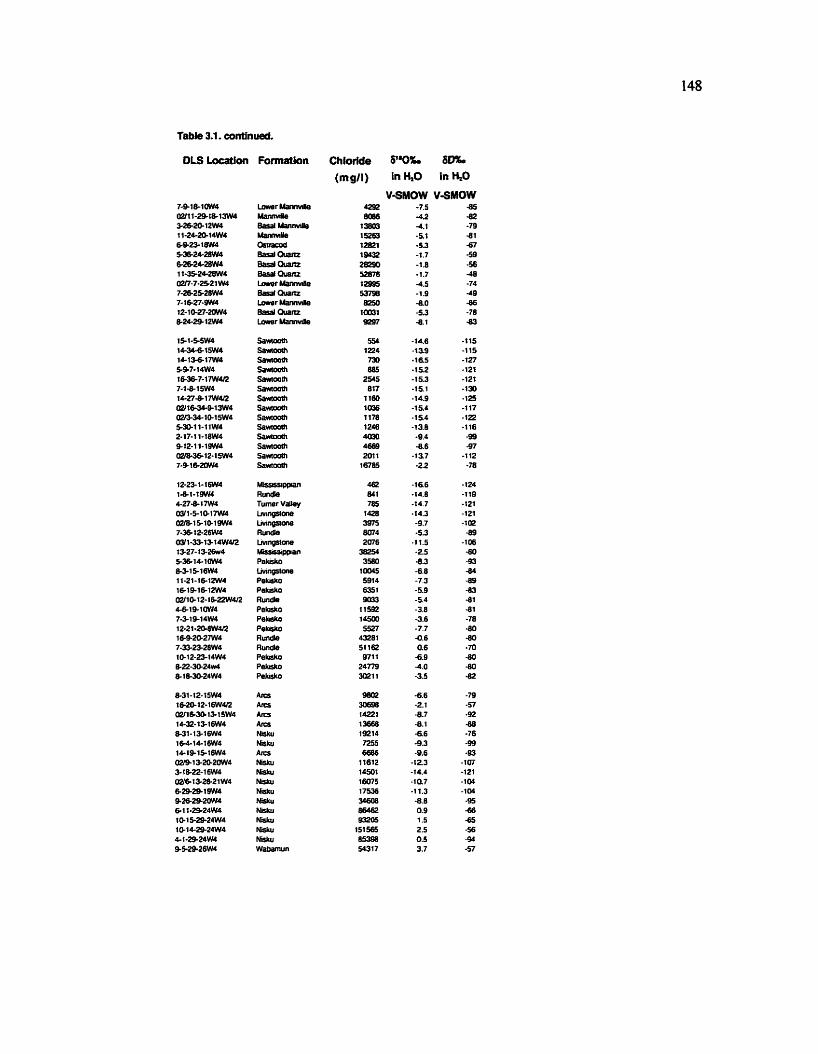
Tabk 3.1. continued.
OLS Location Formation
Mamwne WmAamWue Manrnnlla QmaEod BasdQuara BasdOuartz BardQuant ~ower Mamde BBsdcaJiuQ LcmerManmde W Q u a r r z Lower k m d e
Sawcoolh Ssurcoom Samoom Sawcaom Sawcoolh sawoom Sawtaolh Sawcoom sawroam Sawlooch S a m Sarvtoam Sawtocm SaMwlh
-ppan R u d e Turner VaUey - LMfigstone RwKna Lwfio*- -man Pekoko hostone Pekdro PeJlnko Rundle Pelusko Pekarco PekakO RunQe Rundl9 Pekoko Pelcsho Pekako
Ans Arcs A115 w Nnku N&J Arrs P(isku
Nisku Nisku Nbku Mku NwuJ Nisku Ndur Nwul Wabamn
Chloride 6'0%
V-SMOW V-SMOW 4292 -7.5 85 8006 42 -@
13803 4.1 -79 1 5 2 8 -51 -81 12821 -53 67 14032 -1.7 -59 28290 -t.B -56 52876 -1.7 4 1 2995 4.5 -74 53798 -1.9 -49 8250 -a0 -06
10031 -5.3 -78 9297 -8.1 63

Lower Mararvillc
Figure 3.3. Plot of the oxygen and deuterium isotopic composition of formation waters. GMWL is the Global Meteoric Water Line of Craig(1961). Data fall on the trend observed by Hitchon and Friehan ( 1969) for formation waters of the Alberta basin.

150
meteoric water with isotopically evolved water results in the compositional variations
observed on the 6D vs 6180 (Hitchon and Friedman, 1969; Comolly et aL, 1990; Cody
and Hutcheon, 1994; and Simpson, 1999). The following sections will investigate the
distribution of the freshwater hydraulic head, chloride composition, and isotopic
composition of the waters and relate these to the fluid flow regime.
Regional distribution of freshwater hydraulic head, chloride composition, and 6I8O
values
The potential for fluid flow can be represented by mapping the distribution of fieshwater
hydraulic head determined from pressure and elevation data derived fiom drill stem tests
(DST) and production tests. Freshwater hydraulic head was calculated fiom A and B
quality coded drillstem tests. Table 3.2 summarizes the criteria used by the American
Institute of Formation Evaluation (AIFE) for the quality coding. The A and B data are
fiom the highest quality tests, but DST and production induced inconsistencies required a
culling procedure to remove inaccurate data. Culling was accomplished through removal
of tests that showed a large test interval (>50m) or the testing of more than one aquifer.
The removal of tests displaying production induced drawdown was achieved by
scrutinizing the data based on testing and production dates and distance to nearest

151
neighbour producing wells. After culling, 25 1 Nisku/Arcs, 679 Mississippian, 966
Lower Mannville, 458 Upper Mannville and 2356 Vikinwow Island wells remained.
Table 3.2. American Institute of Formation Evaluation (AIFE) Quality Coding System Criteria for Coding A Code - Best Quality 1. Test mechanically sound 2. Recorder used - chart good 3. Flow pressures verify recoveries and/or flow rates 4. Bottom packer held on straddle tests 5. Recorder depths given 6. Recorder within the tested interval 7. IS1 stabilized, or near stabilization with increments 8. Preflow time long enough to release hydrostatic head 9. KB elevation given 10. Two good shut-ins required 1 1. PMAX range of approximately 7 to 69 kPa &om read shut-in pressure 12. Fluid to surface on flows 13. Flow incremented B Code - Nearing stabilization 1. Slight mechanical difficulties, but does not affect the test 2. Shut-ins not fully stabilized 3. Recorder pressures disagree fiom 7 to 1 3 1 kPa after recorder drag and depth
difference 4. PMAX range of approximately 1 3 8 to 24 1 kPa f7om read shut-in pressure 5. Flow pressures do not verify recoveries 6. Plugging, fluid to surface, resets on flows (flow irregularities) 7. Flows incremented
Freshwater equivalent hydraulic head was calculated using:

152
where z is elevation of the tested interval relative to sea level, P is pressure in kPa, p is
ti-eshwater density (1,000 kg/m3), and g is the acceleration due to gravity (9.8 m/s2).
Contours generated from the distribution of freshwater hydraulic head describe the
potentiometric surface. A potentiometric surface is defined as "an imaginary surface, the
topography of which reflects the fluid potential of the formation water from place to
place within a subsurface reservoir in terms of the elevation to which a column of water
would rise above a reference datum within a vertical tube" (Dahlberg, 1982). Two
restrictions on evaluating a potentiometric surface are that the aquifer be horizontal and
confined. If constant density is assumed, the potential for flow is fiom areas of high head
to areas of low head.
A number of different factors may affect the shape of the potentiometric surface.
Changes in permeability are indicated by changes in the distance between contours. A
decrease in permeability results in an abrupt decrease in the slope (steeper slope) of the
potentiometric surface (Dahlberg, 1982). Density variations in the fluid also affect the
head or height of the water column. Heavier, or more dense fluids require lower head
values to equilibrate a pressure, thus changes in fluid density may also result in changes
in the slope of the potentiometric surface. If the fluid densities are known, a simple
calculation can determine the effect, if any, of changes in fluid density on Freshwater
equivalent head values.

153
Another factor which may affect the interpretation of flow within an aquifer is the
presence of fluids of different densities in a sloping aquifer. Gravity will add a
downward component to flow for variable density fluids. The relative significance of this
vertical force can be determined using an equation for the driving force ratio (DFR,
equation 3.1), an expression of the relative magnitude of a density related error term to
the magnitude of the equivalent fi-eshwater head.
On the accompanying maps, the potentiometric surfaces are overlain on the chloride and
6180 ratio distributions in order to differentiate potential for flow from actual evidence of
flow as described by transport or displacement of dissolved species and recharge by
meteoric waters. Chloride is chosen as it behaves as a conservative species at C1
<180,000 mgll and the chloride content of recharge waters (precipitation) is low.
Conservative behavior occurs if halite (or other C1 bearing salts) is not encountered along
a flow path and increases in chloride content occur only through mixing. Undersaturation
of the waters with respect to halite (CI <180,000 mgll) suggests that halite is not
contributing to the chloride content, thus, mixing is assumed to be the dominant control
on chloride content The chloride distribution can be used as a proxy for density, as
increasing chloride content corresponds to increasing density. The oxygen isotopic
composition reflects the origin and the extent to which dilution by meteoric water and

1 54
water-rock isotope exchange has occurred. tn particular, the regional distribution of 6j80
ratios is useful in recognizing meteoric water input and flow paths.
NiskdArcs aquifer fluid flow paths
The freshwater equivalent hydraulic head map overlain on the C1 and 6"0 distribution
for the NisMArcs aquifer is given in Figure 3.4. High head values occur in the
southwest, northwest and southeast. A regional low can be found in the north, centered
between 112.5" and 11 3OW and 5I0N. Potential for flow is fiom regions of higher head
to regions of lower head, suggesting that possible flow directions described by the
potentiometric surface are from the southwest and southeast towards the north, towards
the west, north of 50°, and fiom west to east, west of 1 13O. Driving force ratios of 1.5 to
2 were calculated for the region west of 113" and north of 51'. The DFR are
significantly greater than 0.5 suggesting updip flow potential is considerably decreased
by a density-driven downdip component. The steep gradients observed in the west may
also reflect permeability changes that result fiom a lack of hydraulic continuity of the
aquifer. The change in head gradient and DFR values in the west, and the widely spaced
contours in the east, are interpreted to describe flow in the Devonian Nisku/Arcs aquifer
as dominated by a south to north component in the eastern half of the study area. The

I Chloride l a m &
H5W5 ~ 2 0 ~ 4 (70 Km)
Figure 3.4. NiskujArcs potentiometric surface (labelled solid contour lines) overlain on the chloride (coloured contours 5,000 mgll) and 6180 distribution (shown as numbers). Arrows show the interpreted flow paths.

156
distribution of chloride corresponds to the flow directions defined by the potentiometric
surface indicating transport and flow directions coincide. The regional distribution in
oxygen isotopic composition does not show a consistent relationship with chloride
content. South of 50.S0, values increase with increasing chloride. The 6180 ratios
north of 50.S0 are lower at higher C1(-14 to -1 I%o at C1> 10,000 to 30,000 m@l) than in
the south and decrease to the west.
Mississippian aquifer fluid flow paths
The map of the potentiometric surface overlain on the chloride and oxygen isotope
content distribution for the Mississippian aquifer is shown in Figure 3.5. Freshwater
equivalent head varies from 1650 m to less than 400 m. The southwestern and
northwestern regions display steep head gradients. East of 1 1 3.4" W, head gradients are
less steep with widely spaced contours in the south and more tightly spaced contours
north of 50S0. The potential for flow as described by the potentiometric surface is from
the south towards the northeast and northwest. The shallow head gradient roughly
corresponds to low chloride concentrations (<5,000 m@). The increase in head gradient
coincides with an increase in the salinity gradient defined in the previous chapter as a
narrow mixing zone between low chloride (<5,000 mg) water with higher chloride
(5,000-1 5,000 mg/l C1) water. The change in chloride content and steeper head gradient

Figure 3.5. Mississippian aquifer potentiometric surface (labelled solid contour lines) overlain on the chloride (coloured contours 5,000 mg/l) and 6180 distribution (shown as numbers). Arrows show the interpreted flow paths. Oxygen isotope data includes that of Hitchon and Friedman ( 1 969).

I58
suggest a decrease in the permeability or continuity of the aquifer. A decrease in
permeability would result in reduced flow producing the rapid increase in the chloride
content as the dilution effect of the meteoric water is diminished. Density effects are
minimal as head values recalculated to higher salinity do not significantly change the
contours. Areas in the south- and northwest, where the head gradient is very steep, may
be due to a lack of hydraulic continuity.
The 6j80 values are lowest in the south and increase to the north. Values in the south are
consistent with meteoric recharge waters and the increase in 6"0 coincides with
increasing chloride content. Chloride content and oxygen isotopic composition suggest
recharge from the south and flow directions corresponding to those described by the
potentiometric surface with restricted flow in areas where the head contours are closely
spaced. In the north (north of 5 lo) there appears to be a westward component to the flow
towards the regional low.
Jurassic aquifer fluid flow paths
The map of the Sawtooth aquifer potentiometric surface, overlain on the chloride and
oxygen isotope content distributions, indicates high fluid potential in the southeast and
southwest centred on the chloride lows (Figure 3.6). Low freshwater

(70 Km)
Figure 3.6. Sawtooth aquifer potentiometric surface (labelled solid contour lines) overlain on the chloride (coloured contours 1,000 mg/l) and 6180 distribution (shown as numbers). Arrows show the interpreted flow paths. Oxygen isotope data includes that of Cody and Hutcheon (1 994).

160
values of hydraulic head occur in the north and northwest. The potential for flow
suggests north and northwestward directed flow paths issuing from the high in the
southeast, and northwest to east-northeast flow fiom the high in the southwest. Chloride
content is lowest in the southeast and in the area centered on 49.5"N and 1 12"W, highs
are in the northwest. An increase then decrease in the chloride content fiom southeast to
northwest is observed, perhaps indicating sluggish flow or restricted flow paths. The
6"0 distribution indicates meteoric recharge in the regions of chloride lows. Ar, increase
in 6"0 values occurs towards the north and northwest, The distribution in chloride
content and 6180 values is consistent with flow directed fiom the southwest to the north
and northeast, issuing from the 950m contour between 49.4" and 49.7"N and west of
1 1 2 O , and suggests relatively little contribution to regional flow from the southeast.
Lower Manaville aquifer fluid flow paths
The map of the potentiometric surface of the Lower Mannville aquifer, overlain on C1
distribution, is given in Figure 3.7. High head values occur in the south and northwest
and a regional low occurs in the northwest between 1 13" and 1 1 3.7". North of the

(70 Km)
Figure 3.7. Lower Mannville aquifer potentiometric surface (labelled solid contour lines) overlain on the chloride (coloured contours 5,000 mg/l) and 6180 distribution (shown as numbers). Arrows show the interpreted flow paths. Oxygen isotope data includes that o f Hit- chon and Friedman ( 1 969), and Cody and Hutcheon ( 1 994).

162
Jurassic subcrop edge, head values are similar to those found in the underlying
Mississippian aquifer (Figure 3.5). In the south and east, head contours are widely
spaced suggesting reservoir continuity. An increase in the head gradient that roughly
coincides with the increasing C1 content occurs north of 50.3" indicating that, like the
Mississippian, flow is reduced by a loss of reservoir permeability or continuity. The flow
paths described by the potentiometric surface are &om south to north towards the
regional low and from west to east in the region west of 1 13.5" and north of 50.5". A
small, northwest directed component to flow is recognized east of 1 12" and north of 50°.
Chloride content is low in the south and displays a narrow mixing or transition zone at C1
>5,000 mg/! between 1 13" and 1 1 1 OW.
The 6 ' 8 ~ values increase fiom south to north and east to west except south of 50'. The
flow, as defined by head and chemical composition, is directed fiom the south (north of
49.S0 and east of 1 12') towards the northeast with a small component of flow towards the
northwest as described above.
Upper MannviLle aquifer fluid flow paths
The distribution of freshwater equivalent head for the Upper Mamville aquifer is
overlain on a map of the chloride concentration and values in Figure 3.8. The
highest head values (>950 m) occur in the south. The regional low lies in the north, just

(70 Km)
Figure 3.8. Upper Mannville aquifer potentiometric surface (labelled solid contour lines) overlain on the chloride (coloured contours 5,000 mgll) and 6180 distribution (shown as numbers). Arrows show the interpreted flow paths. Oxygen isotope data includes that of Cody and Hutcheon ( 1 994).

164
west of 113". The potenbiometric surface coincides with those of the Lower Maonville
and Mississippian with a broad, low head gradient in the south and east alternating to a
steeper gradient towards the northwest. The change in head gradient roughly coincides
with the increasing chloride concentration gradient The values of 6180 increase from
south to north and east to west. The potential flow direction is from the south towards the
north and northeast and towards the regional low. Fluid flow paths, in terms of head
distribution and water chemistry, extend from the southwest to the north and northeast.
Flow is redirected towards the low in the northwest, north of 50.7". Lack of reservoir
continuity south of 49S0 strongly suggests recharge from the underlying aquifers.
VikinglBow Island aquifer fluid flow paths
Figure 3.9 illustrates the potentiornetric surface of the VikinglBow Island aquifer. A
regional high occurs in the south with values in excess of 850 m. Lows occur along the
western margin of the map area. Freshwater equivalent hydraulic head contours are
widely spaced in the east indicating hydraulic connectivity. West of 112.5" the head
gradient increases, particularly in the south. The potentiornetric surface indicates a fl3w

(70 Km)
Figure 3.9. VikingIBow Island aquifer potentiometric surface (labelled solid contour lines) overlain on the chloride (coloured contours 2,000 mg/l) and 6180 distribution (shown as numbers). Arrows show the interpreted flow paths. Oxygen isotope data includes that of Hit- chon and Friedman ( 1 969).

1 66
potential from the south to the northeast and northwest. The salinity and head gradients
south of 51" roughly coincide, indicating transport and flow potential may be related.
The distribution of oxygen isotope composition correlates with chloride content in the
southern half of the study area but shows no relation in the north. 6180 ratios are lower at
higher C1 in the north than in the south. Variations in chloride content, used in
conjunction with head contours, suggest south to northeast flow with a small component
of northwest directed flow, west of 1 1 1 .So.
Pressure - Depth plots
Pressure - depth plots were generated for each of the aquifen (Figures 3.10,3.11, 3.12,
3.13,3.14, and 3.15). Overlain on each plot are pressure gradients based on fresh water
(hydrostatic 1,000 kg/m3), rock (lithostatic 2,600 k&), oil (oil 870 kg/m3), and gas (gas
120 kg/m3).

Pressure (kPa) Figure 3.10. Nisku/Arcs aquifer pressure-depth plot The P-D gradients reflect
compartments that are recognised regionally on the potentiometric surface and
chloride distribution maps. Group I occurs in the north, east of the
potentiometric low in the north. Group 2 occurs in the south, east of 112.8"W.
Group 3 occurs west of 1 12.8OW. Group 4 corresponds to the potentiometric low
in the north. Note the gas pressure gradient connection Group 1 and 2 with
Group 3.

Pressure (kPa) Figure 3.1 1. Mississippian aquifer pressure-depth plot. The P-D gradients reflect compartments that are recognised regionally on the potentiometric surface and chloride distribution maps. Group 1 occurs in the north, east of the
potentiometric low in the north. Group 2 occurs in the south, east of 1 12.8"W
and corresponds to the low chloride (~10,000 mg/l) region. Group 3 occurs west
of 1 12.8"W. Group 4 corresponds to the regional potentiometric low in the north.
Note the gas pressure gradient connection Group 2 with Group 3.

- - Gas
Pressure (kPa) Figure 3.12. Sawtooth aquifer pressure-depth plot. The P-D gradients reflect compartments that are recognised regionally on the potentiometric surface and chloride distribution maps. Group 1 occurs in the southeast. Group 2 occurs east
of 112.8"W and west of I 1 IOW. Group 3 occurs west of 1 12.8"W. Note the gas
pressure gradient connection Group 2 with Group 3.

Pressure (kPa) Figure 3.13. Lower Mannville aquifer pressure-depth plot. The P-D gradients reflect compartments that are recognised regionally on the potentiometric surface
and chloride distribution maps. Group 1 occurs east of I 1 1°W in the northeast
and southeast. Group 2 occurs east of 1 12.g0W and west of 1 1 I O W south of the
change in head gradient observed on the potentiometric surface map. Group 3
occurs west of 1 1 2.S0W. Group 4 corresponds to the region of potentiometric
lows in the north. Note the gas pressure gradient connection Group 2 with Group 3.
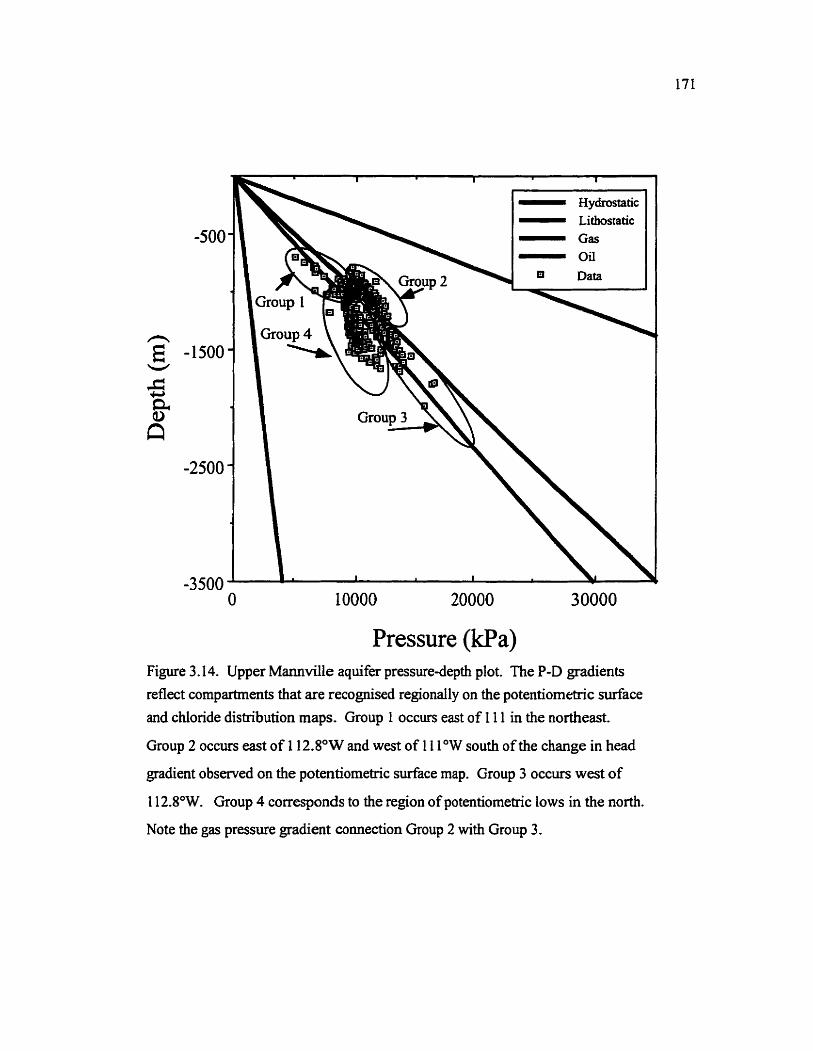
Pressure (kPa) Figure 3.1 4. Upper Mannville aquifer pressure-depth plot. The P-D gradients reflect compartments that are recognised regionally on the potentiometric surface and chloride distribution maps. Group 1 occurs east of 1 1 1 in the northeast.
Group 2 occurs east of 1 12.8"W and west of 1 1 1°W south of the change in head
gradient obsened on the potentiometric surface map. Group 3 occurs west of
1 12.8OW. Group 4 corresponds to the region of potentiometric lows in the north.
Note the gas pressure gradient connection Group 2 with Group 3.

Pressure (kPa) Figure 3.15. Viking/Bow Island aquifer pressure-depth plot. The P-D gradients reflect compartments that are recognised regionally on the potentiometric surface and chloride distribution maps. Group 1 occurs east of 1 1 1 in the northeast and
southeast. Group 2 occurs east of 1 12.g0W and west of 1 1 low. Group 3 occurs
west of 1 12.5"W.

173
The P-D plots illustrate several key features:
1. Pressure - depth plots display gradients similar to those of fiesh water and gas
controlled systems ( F i e 3.10 to 3.15).
2. Up to four different compartments can be recognized and these compartments
correspond to regions defmed in the potentiornetric surface maps and chloride
distri'butions.
3. Mississippian, Sawtooth, Lower Mannville and Upper Mannville pressure gradients
are similar indicating a single hydrostratigraphic system (Figures 3.11, 3-12, 3.13
and 3.12).
4. A gas induced pressure gradient separates the regional potentiometric low in the north
from surrounding areas (Figures 3.10,3.11,3.12,3.13,3.14, and 3.15).
5. West of approximately 1 1 2.8OW aquifers display an hydrostatic pressure gradient but
they are separated from the eastern region by a gas induced pressure gradient except
for the Viking/Bow Island aquifer in which the western region is under gas density
dependent gradients (Figures 3.10,3.11,3.12,3.13,3.14, and 3.15).
Oxygen isotopic composition and water-rock interaction
Water-rock interactions have been suggested to explain the enrichment of waters in the
heavier isotopes of oxygen and hydrogen (Clayton et al., 1966; Hitchon and Friedman,

1 74
1969; and Longstee, 1986). In particular, oxygen isotopic equilibration between water
and carbonate rocks is important because carbonate minerals are a large reservoir of
easily exchangeable oxygen atoms (Kharaka and Carothers, 1 986). The possibility of
control over the ''0 content of the water by isotope exchange between water and
carbonates is investigated by plotting the 6180 against temperature (Figures 3.16,3.17,
3.18,3.19, 3.20, and 3.21). The diagrams show the temperature equilibrium values of
6'80(~20) for the range of S i 8 0 compositions of calcites or dolomites from the
Mississippian and Nisku/Arcs carbonates and calcite cements of the clastic rocks using
the calcite-water and dolomite-water fiactionation factors of Friedman and O'Neil
(1 977), and two dolomite-water fractionation factors from Land (1 983). Superimposed
on these diagrams are the analyzed 8180 ratios of the waters at reservoir temperature.
The oxygen isotopic composition of Nisku/Arcs dolomite is +26%0 (Hitchon and
Friedman, 1369; Whitaker and Mountjoy, 1996) and calcite in Mississippian limestones
is approximately + 1 9%0 to +2 1 Yi'k (Hitchon and Friedman, 1969; Comolly et a!. , 1990),
and those of calcite cement in Mannville clastic rocks are + 15%0 to +18% (Hitchon and
Friedman, 1969; ComolIy et al., 1990) and +19%0 to +23# for the Viking Formation
(Hitchon and Friedman, 1969; Longstaffe and Ayalon, 1 987; McLellan, 1995).
The majority of the waters sampled from Nisku/Arcs reservoirs are not in temperature
equilibrium with the host rock below 70°C (Figure 3.16). The higher temperature

-20 0 20 40 60 80 1 00
Temperature *C
Figure 3.16. Plot of the relation between NiskdArcs aquifer water and carbonates in the 6140 vs temperature format. The lines represent the oxygen isotopic corn osition of water in equilibrium with dolomite that has 1 180=+26% using the isotope fractionation factors of Friedman and O'Neil(1977) and Land (1 983).
-
-
-
- -
5 a Miss 0 in H20 ............... ..... Calcite dl 80+19
Sampled ......... .........a Frtedmanand O'Nei1+26 %O
"""""I---- /#
Land +26% -.-.-.-.-. Land .t-26%o
*;:,!*,,.."" :::: , :;:3.3:****
**'*:.y* *;\$"
*' "0 *****+'
, *tp'*
t* , *,r" ** ,'
***,.'
I;##' P u
1 I I I I
0 20 40 60 80
Temperature O C
Figure 3.17. Plot of the relation between Mississippian aquifer water and carbonates in the 6180 vs temperature format. The lines Calcite 6180=+ 19%0, and 6160=+2 1 %O
represent the oxygen isotopic composition of water in equilibrium with calcite that has SlaO=+19%0 to +2 1 %O
using the isotope fractionation factor of Friedman and O'Neil(1977).

5 Sampled
-.-.I.-.-. Calcite 6180t19
-20 f I I I I I I I I 0 10 20 30 40 50 60 70 80
Temperature O C
Figure 3.18. Plot of the relation between Sawtooth aquifer water and carbonates in the 6180 vs temperature format. The lines Calcite 6180=+19%, and 6180=+2 l%o represent the oxygen isotopic composition of water in equilibrium with Mississippian calcite that has 6180=+ 19%0 to +2 1 %O using the isotope fractionation factor of Friedman and O'Neil(1977).
5 [71 Lmann 0 in H20 ...... *..1..1....1.. Calcite ti1 80+ t5
0 - """"" Calcite 6' 80+1 8 -.-.-.-.-. Calcite 6 80 + I 9 / * -.-.---
-20 I I I I I I I
0 10 20 30 40 50 60 70 80 Temperature "C
Figure 3.1 9. Plot of the relation between Lower Mannville aquifer water and carbonates in the 6180 vs temperature format. The lines Calcite 6180=+ 19%0, and 6180=+2 1 %O
represent the oxygen isotopic composition of water in equilibrium with Mississippian calcite that has 6180=+ 19%0 to +2 1 %0 and 6180=+ 1 5%0, and &go=+ 1 8%0 represent calcite cement that has 81RO=+ 15%0 to + 18% using the isotope fractionation factor of Friedman and O'Neil (1 977).

r] Samplcd .. ...........,...... Calcite 6IH0+ 15 ---...--.- Colcitc &IH0+18 - # -- Culcire 61n0+19 - . -
C
I I I I I 1 I
0 10 20 30 40 SO 60 70 80 Temperature "C
-20 0 10 20 30 40 50 60 70 80
Temperature OC
-
-
-
-
Figure 3.20. Plot of the relation between Upper Mannville Figure 3.2 1. Plot o f the relation between Viking/Bow aquifer water and carbonates in the 6180 vs temperature Island aquifer water and carbonates in the 6180 vs format. The lines Calcite S l 8 0 = + 19%, and 6 1 8 0 = + 2 1 %O temperature format. The lines Calcite 8180=+19%0, and represent the oxygen isotopic composition of water in 8180=+23%0 represent the oxygen isotopic composition of equilibrium with Mississippian calcite that has 6180=+19%0 water in equilibrium with calcite cement that has to +2 1 %O and 6180=+ 1 5%0, and 6180=+ 1 8%0 represent also=+ 1 9%0 to +23%0 using the isotope Fractionation calcite cement that has 8 1 8 0 = + 15%. to + 18Ym using the factor of Friedman and OfNeil ( 1 977). isotope fractionation factor of Friedman and 0tNeil(1977).
C) Sampled .-• .................... ..--- calcite 6' a~~ 9 -.-** -.---..---
Calcite 6' 'a23 ...- ,*-• .-. ...." ..,."' *.--- *.,..**'
0 - ..I* ,*..*' 0 -
0-• ,..1"
,..***'
.&n,,.**9 ,,,..**g'* ,.*' *.*.
***- ,.*- ...' ...'
4' ...** . ..*** *. ,...I'
I ,,.**"
,.**' ,**'
*.*-* *.*'
..+*'
I 1 I I I I I

178
samples (70 O C and higher) appear to be in isotope equilibrium with dolomite. 6 ' 8 ~
values that are not in isotopic equilibrium with the host rock are interpreted to reflect a
component of the isotopic signature of meteoric water.
The Mississippian to Upper Mannville hydrostratigraphic group diagrams include the
Mississippian calcite-water fractionation curves because of the close hydrologic
relationship between the different aquifers. Figures 3.17,3.18,3.19, and 3.20 illustrate
that many of the low temperature samples are not in isotopic equilibrium with the
Mississippian limestones. The majority of these samples have <5,000 mg/l chloride and
the 6180 values reflect input of meteoric water. A number of samples fall within the
range defined by Lower Mannville and Upper Mannville calcite cements. Of these, two
Lower Mannville (1 6-20- 1 -8 W4,4-7-5-4W4) and two Upper Mannville waters (02/ 1 1 -6-
29-20W4 and 0211 1-6-29-20W4) were collected proximal to the measured calcite data.
The close relationship suggests that the calcite was probably precipitated from the current
fluid and reflects isotopic equilibrium. The remainder of the data plot within or above the
range defined by equilibrium with Mississippian calcite. These data are from waters
collected from within the narrow mixing zone (defined in the chloride maps), and From
the higher chloride waters to the north and west of the mixing zone (Figures 3.5,3.7, and
3.8).

179
The Viking/Bow Island aquifer data cluster in a region defined by the upper and lower
limits of equilibration with coexisting calcite cements (Figure 3.21). Isotopic
equilibrium with a calcite cement in a clastic rock is more likely evidence of precipitation
of the cement from the existing formation water as the mass of water is considerably
greater than the mass of cement. A simple mass balance calculation (moles of 0 in
calcite = moles of 0 in water) requires nearly 2 kg of calcite (or approximately 9%
volume at 10% porosity) per kg of water for the calcite to control the oxygen isotopic
composition of the water. Cements typically make up less than a few percent of the rock
(for porous and permeable rocks) and cannot account for the mass needed. Longstaffe
(1989) lists a number of researchers who have used paragenetic sequences and oxygen
isotopic compositions of authigenic phases to estimate the isotopic composition of
formation waters based on evidence that the authigenic phases were not equilibrated with
current water composition. Their results indicate that diagenetic mineral phases may not
significantly alter the isotopic composition of the water.
Isotopic compositions that fall above the Devonian dolomite and Mississippian calcite
isotope composition-temperature curves may reflect higher temperatures of equilibration.
The current reservoir temperatures are lower than those experienced prior to Late
Oligocene to Miocene erosion in the Alberta basin. The Upper Mamville samples in
particular have a considerable number of analyses that lic above the calcite curve.

t 80
Temperatures calculated to reflect equilibrium with calcite are 5' to lS°C higher than
current reservoir temperatures. There is however, no way of determining accurate
temperatures with this method, as some mixing with meteoric water has occurred.
Comolly et al. (1990) found that the waters in central Alberta are not isotopically
equilibrated with the carbonates in the associated rocks. In this study it appears that
many of the waters are in temperature equilibrium with the carbonates and cements. The
waters in the Upper and Lower Mannville appear to show, with considerable scatter, 6"0
values similar to values for waters in temperature equilibrium with Mississippian
limestone. This may be explained if the waters flowed into the clastic units from the
underlying Mississippian carbonates and have retained the oxygen isotopic composition
of equilibration with the Mississippian calcite.
8'80-C1
Variations in the isotopic composition of formation waters may be the result of mixing or
of water-rock interaction (Kyser, 1 987; Longstaffe, 1 987). Although the 6 "0 content of
waters can be affected by water-rock interaction, if 180 behaves largely conservatively
(extent of water-rock interaction is small), plotting S'*0 values against chloride content
can reveal variations in chemistry due to mixing.

181
The NisWArcs formation water samples (Figure 3.22) generally, have increasing 6180
ratios with increasing chloride. At Cl <30,000 mg/I the oxygen isotopic composition
displays considerable scatter. The lowest chloride content waters have S ' 8 0 ratios of -9
to -10%0 and four of the samples (at 00,000 mgll C1) have lower 6"0 ratios at higher
chloride content. The four samples (0219- 13 -20-20W4, 3- 1 8-22- 1 6W4, 02/6- 1 3-28-
2 1 W4, and 6-29-29-1 9W4) come from wells sampled in the northern part of the study
area (Table 3.1). In the previous chapter it was determined that chloride displays
conservative behavior and mixing of a marine evaporative brine with dilute meteoric
water controls the chloride content. A single mixing event should result in a linear
increase in 6'80 ratios with increasing chloride. The non-linear relationship indicates that
meteoric water has mixed with water of varying chloride content. The variations in
chloride content suggest dilution from an earlier event. The oxygen isotopic data
variations at <30,000 mg/l C1 imply that at least two meteoric incursions have occurred.
The most recent event is represented by the low chloride water in the southeast (Figure
3.4). Samples collected south of 50.5" are located along the western edge of the low
chloride recharge water suggesting that the composition of these waters has been
influenced by the most recent meteoric event.
The S ' * 0 content plotted versus chloride concentration of the Mississippian to Upper
Mannville hydrostratigraphic group show similar patterns for most of the aquifers

182
(Figures 3.23,3.24,3.25, and 3.26). From these diagrams and Table 3.1 several trends
can be distinguished:
1. For chloride concentrations below -5,000 mg/l, 6'80 ratios increase markedly from
-16%0 to -7.5% as CI concentrations increase.
2. Between 5,000 and -10,000 mg/l Cl there is a distinct change in slope with 8'0
values increasing kom -7.S0A to -5%.
3. Above -10,000 mgA, chloride content and 6180 ratios appear to be largely
independent except for the Mississippian where a linear increase is observed.
4. The Lower Mannville and Upper Mannville samples fiom the northeast and Lower
Mannville waters fiom south of the Jurassic subcrop edge have more negative 6 ' 8 ~
ratios at higher chloride contents (Table 3.1, Figures 3.25 and 3.26).
At low chloride content the 6180 values are similar to present-day precipitation. The data
for the <5,000 mgll chloride suggest that the oxygen isotopic composition of these waters
is largely controlled by mixing with meteoric water. Between 5,000 and 10,000 mg/I C1
the change in 6180 ratios reflects a narrow mixing zone of waters with a minor meteoric
contribution and waters that are at, or near, isotopic equilibrium with Mississippian
calcite. Above approximately 10,000 mgA chloride, the data reflect isotopic equilibrium
with Mississippian calcite and do not correlate with chloride content.

-20 0 50000 100000 150000 200000
Cl (mg/l) Figure 3.22. Nisku/Arcs aquifer water 6180 %O vs Cl. Low chloride waters tend to have 8180 values displaying meteoric influence and a non-linear relationship to Cl. At high CI, 6180 values are typical of an evolved brine.
-20 0 10000 20000 30000 40000 50000 60000
Cl (mg/l) Figure 3.23. Mississippian aquifer water 6180 %O vs C1. Low chloride waters show a linear increase in 61d0 values that reflect mixing with meteoric water. A change in slope at -7.5%0 and at -5%0 mark the boundaries of the isotope trends.

-20 0 10000 20000 30000 40000 SO000 60000
c1 (mg/l) Figure 3.24. Sawtooth aquifer water 8180 %O vs CI. Low chloride waters show a linear increase in 6180 values that reflect mixing with meteoric water.
- 7
- - ~t heast
South of Jurassic 8 6-1 5 subcrop edge
Figure 3.25. Lower Man~~ville aquifer water 6180 %O vs CI. Low chloride waters show a linear increase in 6180 values that reflect mixing with meteoric water. A change in slope at approximately -7.5% and at -5%0 mark the boundaries of the isotope trends. Data that do not fit the general trend are from geographically limited areas in the southeast and northeast.

-20 0 10000 20000 30000 40000 50000 60000
(mgll) Figure 3.26. Upper Mannville aquifer water 6180 %O vs C1. Low chloride waters show a linear increase in 6180 values that reflect mixing with meteoric water. A change in slope at approximately -7.5%0 and at -5%0 mark the boundaries of the isotope trends. Data from the northeast have higher Cl content than expected for the 180 content.
Northeast
D
3 -
I i I I I -20 0 t 0000 20000 30000
Cl (mg/l) Figure 3.27. VikindBow Island aquifer water 6180 %O vs C1. At <9,000 mgA Cl, waters show a linear increase in 6180 values that reflect mixing with meteoric water. Above 9,000 mg/l, data are scattered.

186
In the previous chapter, it was determined that, like the NiskdArcs formation water, the
Mississippian to Upper Mannville formation waters originated as residuai evaporite
brines that have been diluted to varying extent by meteoric water. The oxygen isotopic
data suggest that at least two mixing and dilution events must have occurred. The earlier
event had to have taken place prior to the introduction of the waters into the Lower and
Upper Mannville aquifers as the waters appear to have equilibrated with Mississippian
calcite. The current flow regime has resulted in 6"O values that reflect mixing with
present-day meteoric water.
The plot of the VikingBow Island 6'*0 to Cl is consistent with mixing at low Cl(c9,OOO
mg/l), but shows considerable scatter at higher Cl (Figure 3.27). Low chloride waters
are from the south and higher Cl content is in the north (Table 3.1). The waters from the
south appear to reflect mixing with meteoric water, however the intercept with the 6'80
axis is approximately -1 OYib, which is 6%0 higher than present-day precipitation.
6D-C1
Deuterium is considered to behave more conservatively than oxygen in aquifer waters
because the amount of available hydrogen in minerals tends to small relative to the
amount in the water (Longstaffe, 1987). Plotting values of 6D against chloride can be a
useful technique in determining changes in composition of waters due to mixing.

187
Figures 3.28,339,3.30,331,332, and 3.33 illustrate plots of 6D vs CI content. Like
the 6180 vs C1 plots, there is a general increase in 6D with increasing chloride. All of the
aquifers display trends similar to those observed in the 6180 vs C1. At greater than 10,000
mg/l C1 the Lower Mannville and Mississippian are considerably different. Lower
Mannville waters display an enrichment in deuterium with higher chloride whereas the
Mississippian shows little change from those of lower C1.
The origin of this difference is not known, but may reflect a greater availability of
hydrogen in the clastic rocks relative to the carbonates. However, Longstaffe (1989)
points out that most hydrous phases are depleted in deuterium relative to water.
Exchange of hydrogen with mineral phases in the clastic rocks should result in a shift
towards more negative values of 6D at the temperatures experienced by these rocks, not
the more positive values as observed (Figure 331).
Discussion
The Devonian NiskufArcs Formation forms an individual hydrostratigraphic unit.
Freshwater hydraulic head values are lower than the overlying Mississippian to Upper
Mannville except for a tow in the north, and the distribution of chloride shows only a
general correlation. The 6 1 8 ~ ratios of the waters are more negative at higher chloride
content than the overlying units and the regional variation in the oxygen isotopic

-140 0 50000 100000 150000 200000
Cl (mg/l) Figure 3.28. NiskdArcs aquifer water 6D%o vs C1. Low chloride waters tend to have 6D values suggesting the data reflect at least two meteoric tnixing events.
-140 0 10000 20000 30000 40000 50000 60000
Cl (mg/l) Figure 3.29. Mississippian aquifer water 6D% vs C1. Low chloride waters display a linear increase in 6D up to 5,000 mdl CI. At higher Cl, 6D values show little change with increasing C1.

- 140 I I
0 20000 40000 60000 0 10000 20000 30000 40000 50000 60000 Cl (mdl) (mdl)
Figure 3.30. Jurassic Sawtooth aquifer water 6D%o vs C1. Figure 3.3 1 . Lower Mannville aquifer water ~ D % o vs CI. Low chloride waters display a linear increase in 6D Low chloride waters display a linear increase in 6D values up to 5,000 mg/l C1. values up to 5,000 mdl Cl. At higher C1,6D values
show a more gradual increase with C1 and are significantly different from the Mississippian aquifer waters.
rn
-60
3 -80 0 E V;) >-loo 8 o\
C1 CQ
-120
- 140 7
I I I I I

- 140 -'I 0 5000 10000 15000 20000 25000
Imdl) Figure 3.32. Upper Mannvilla aquifer water 6D%o vs Cl. Low chloride waters display a linear increase in SD values up to 5,000 mgA CI. At higher CI, 6D values lie between the Mississippian and Lower Mannville trends.
0 10000 20000 30000 Cl (mdl)
Figure 3.33. Viking/Bow Island aquifer water 6D%o vs Cl. The data all lie at 6D =-80%0 +/-5%0 regardless of Cl content.
191
composition is considerably different. These observations indicate that the NiskuIArcs
aquifer is not in hydraulic communication with the overlying aquifers.
Hitchon (1969a,b) identified the Rocky Mountain foothills, the Sweetgrass arch and the
Cypress Hills as major topographic controls on fluid flow in the southem portion of the
WCSB. Flow, initiated by recharge at the topographic highs, was interpreted to be
directed northward by the highly permeable beds of the Upper Devonian and
Carboniferous (Hitchon, 1969b). Downey ( 1986) determined that Devonian-aged strata
outcropping in Montana and Wyoming provide a conduit for meteoric water and recharge
waters are directed towards the north into the Williston Basin through these conduits.
The southeastern portion of the study area comprises the western extent of the Williston
Basin, suggesting that recharge of the Nisku/Arcs aquifer is related to the topographic
highs in Montana and Wyoming. The correlation between chloride content and
potentiometric surface in the southeast indicates that meteoric recharge waters are related
to the Williston Basin. Freshwater hydraulic head contours and cross sections (Figures
3.5, 3.11-3.15) indicate fluid flow in the NiskuIArcs Formation appears to be directed
from the south towards the north, similar to the conclusions of Hitchon (1969b).
Topography driven flow relating to recharge in the foothills, however, may be impeded
by a strong downslope component of density driven flow. In the west, large increases in
chloride content and hydraulic head coincide with increases in the depth of burial. Along

192
the axis of the hinge zone (Figure 3.1), deep-seated normal faults extending to the
Precambrian basement with throws of up to 30Um were observed in a seismic and
gravimetric study by Paukert (1982). Movement on these faults was interpreted to occur
during Carboniferous and Lower Cretaceous times. The faults have resulted in
considerable offset of the strata (Paukert, 1982) leading to the potential loss of lateral
continuity of reservoir units. The steep salinity and head gradients and the gas induced
pressure gradients separating the more deeply buried western region from the east are
consistent with a lack of reservoir continuity.
The isotopic composition of Nisku/Arcs formation waters does not show a consistent
relationship with chloride content. Hitchon and Friedman (1969) and C o ~ o l l y et al.
(1990b) interpreted variations in the 6"0 and 6D ratios of Devonian formation waters to
be remnants of the effect of the influx of meteoric water subsequent to the Laramide
Orogeny. Positive deviations in the oxygen isotopic composition were interpreted to
reflect exchange with carbonates (Hitchon and Friedman, 1969; Spencer, 1987) and/or
evaporative concentration of the heavier isotope and mixing with fresh water (Connolly
et al., 1990b). Samples from east of 1 13" display 6180 values that reflect mixing with
meteoric water. In the west, the water appears to be in isotopic equilibrium with the host
rock dolomite. The temperature-equilibrium plot indicates that oxygen isotope
equilibration with dolomite at low temperature has not occurred. However, the regional

193
distribution of 6 ' 8 ~ values cannot be reconciled by simple mixing with meteoric water.
Oxygen isotopic compositions of the NisWArcs Formation water in the north tend to be
more negative at higher chloride content than in the south. The difference is interpreted
to be the result of at least two meteoric mixing events. The earlier event (or events)
probably resulted in the extensive dilution of saline brine. The brine was quite likely
displaced to the west and north. The high chloride content in the west reflects the
composition of the displaced water. The later meteoric event appears to originate from
the south and most likely is represented by the < I 0,000 mg/l Cl water observed in Figure
3.4.
Hitchon and Friedman (1 969) proposed the distribution of deuterium in formation waters
is the result of mixing of meteoric water and diagenetically modified seawater. Exchange
with hydrogen sulfide was considered to be insignificant but the effect of membrane
filtration by shales was qualitatively considered possible (Hitchon and Friedman, 1969).
Comolly et al. (1990b) suggest that the shift in deuterium content of formation waters in
the Alberta basin is due to concentration of deuterium during evaporation of seawater.
Membrane filtration was determined to be of minor significance as the pressure
differentials, meant to generate flow through shales, were not high enough to produce
sufficient flow potential (Connolly et a[., 1990b). The results of this study are in

194
agreement with those of Connolly et al. (1990b). The enrichment in deuterium, without
any fMer evidence as to its origin, may be the result of evaporative concentration.
The Mississippian to Upper Mannville aquifers behave as a single hydrostratigraphic
group except in the south where the Jurassic aquitard prevents communication between
the different units and the Upper Mannville consists of discontinuous thin sands. The
chloride and oxygen isotopic composition of the waters for all four aquifers are similar.
Potentiometric surfaces and pressure-depth plots all provide evidence for continuity
between the different aquifers.
The waters in the south are typical of meteoric recharge with low chloride, and oxygen
and deuterium isotopic composition similar to meteoric water. The flow of the low
salinity waters appears to be controlled by the continuity of the aquifer units, both
laterally and vertically. Toth and Corbet ( 1 987) interpreted hydrau!ic head distributions
in the Taber region of southern Alberta to reflect a strong upward component for flow
from Mississippian into Mannville aquifers. Cody (1993) and Cody and Hutcheon
(1999) also suggest cross-formational flow from the Mississippian into the Lower
Cretaceous in southern Alberta. Recharge of meteoric waters is interpreted to be through
the Mississippian and Jurassic Sawtooth Formation and up into the Upper and Lower
Mannville north of the Jurassic subcrop edge, similar to flow paths suggested by Toth
and Corbet (1987). The variations in chloride distribution and hydraulic head for the

195
Mississippian and Jurassic are consistent with recharge by meteoric waters fiom the south
and east. Variations in chloride concentration and oxygen isotope distribution suggest
that south of the Jurassic subcrop edge, flow in the Lower Mannville is sluggish or
stagnant. Chloride and ''0 contents increase from south to north between 49" and 49.6O,
at approximately 49.6O, lower values are observed, which can only be explained by the
introduction of Mississippian- and Jurassic-hosted waters that have chemical and isotopic
signatures similar to the low chloride and negative 6180 waters north of 49.6".
Cody (1993) and Cody and Hutcheon (1994) interpreted variations in water chemistry in
the Mannville Group to be the result of gravity driven, south to north flow of meteoric
recharge waters. In their study, changes in the oxygen isotopic composition of waters
were interpreted to reflect mixing of meteoric water and water enriched in the heavier
isotope (Cody and Hutcheon, 1 994). Schwartz et al. (1 98 1 ) used hydraulic conductivity,
freshwater hydraulic head and water chemistry to interpret flow in Mississippian to
Upper Cretaceous aquifers in southern Alberta. They recognized a pattern of south to
north flow, with permeable units recharged by meteoric water in the south. Flushing of
connate waters, recognized through variations in chemistry, was observed to correlate
with zones of high hydraulic conductivity (Schwartz et al., 198 1). The highest hydraulic
conductivities, found in the deepest aquifers (Mississippian and Jurassic), display more
extensive flushing (Schwartz et a[., 198 1 ). This is consistent with the results in this study,

196
which indicate the Lower Mannville formation waters south of the Jurassic subcrop are
not in good hydraulic communication with those to the north and that flow is focused
through the Mississippian-Jurassic aquifer system.
Flow is directed northward and eastward in the Mississippian and enters in to the
northwest-southeast trending channel sands of the Lower and Upper Mannville where
they cut down into Mississippian strata The lack of east-west continuity of the channels
supports the interpretation of lateral flow being dominated by flow in the Mississippian.
Flow direction changes north and northeast of 50.3" and 1 12.5'. The abrupt change in
chloride content, hydraulic head gradient, pressure gradient, and 6"0 along a northeast
trending line suggests that north-directed flow is impeded, perhaps through permeability
changes and is redirected towards the northeast. The higher chloride water in the north
and west is probably not a mixture of saline water with the meteoric water that is to the
south, otherwise a mixing relationship on the 6"0 vs C1 diagrams of the higher chloride
waters with low chloride waters would be apparent. The only mixing observed is
between the meteoric water and waters with less than 10,000 mg/l C1. The moderately
saline waters that extend out into the central portion of the study area, even down to C1
concentrations of 10,000 mg/l, appear to reflect an older mixing event and are somewhat
isolated from the current flow system of recharge from the south. The oxygen isotopic
compositions are at, or near, temperature equilibration with Mississippian limestone.

I97
This can only be possible if the waters were equilibrated prior to flow into the Lower and
Upper Mannville. The dilute waters, which may have originated from the east, then
equilibrated with the Mississippian limestone and subsequently flowed into the clastic
reservoirs.
The waters to the north and northeast of the 10,000 to 1 5,000 mgfl chloride waters are
also quite distinctive, but fit into the general trend of decreasing chloride content of the
saline waters. The waters have moderate to low salinity, but unlike the low salinity
waters to the south, they have low bicarbonate, and 618U contents that suggest
equilibrium with either the Mannville cements or the Mississippian limestone. These
waters may represent a continuation of the older, more evolved meteoric-saline mixed
water, perhaps by recharge Earn the east during erosion of overlying strata initiated in the
Oligocene (Abercrombie and Fullmer, 1992).
Similar arguments as those made for the NiskuIArcs west-east fluid flow can be used to
interpret flow potential in the Mississippian to Upper Mannville hydrostratigraphic
group. Steep chloride and head gradients in the west and a change in pressure gradient
between the systems suggest a lack of reservoir continuity. Bachu (1995) suggested
topography-driven flow related to recharge in the foothills was insignificant in southern
Alberta and the dominant flow direction was south to north with recharge in the
Sweetgrass Hills in Montana.

198
The south to north flow of the Mississippian to Upper Mannville aquifers appears to be
controlled by structural highs located south of the Canada U.S. border. Hydraulic head
contours and the distribution of chloride suggest that flow follows the Sweetgrass/Bow
Island arch particularly along the northern side (Figure 3.1). Flow appears to be focused
towards the northeast from the central region. The result is an arcuate band of higher
salinity water that closely coincides with the location of the Vulcan Low (Figure 3.1). It
is difficult at this point to speculate as to the cause of the change in flow, the obvious
influence of the SweetgrassIBow Island Arch on flow and the homogeneity of the rock
units suggests a tectonic rather than sedimentary origin. It is possible that faults
associated with movement of the Vulcan Low (Brandley et al. 1993) and the
Sweetgrass/Bow Island Arch (Lorenz, 1982) act as barriers to fluid flow. Movement on
these faults was interpreted to occur during Carboniferous and Late Cretaceous times.
Changes in permeability described above may reflect a lack of continuity of the aquifers.
The Viking/Bow Island aquifer comprises a separate hydrostratigraphic unit. The
distribution of chloride displays lows in the south and northwest with a broad high
extending southwest to northeast Chloride concentrations are lower than the underlying
aquifers and oxygen isotope values have a narrow range. Schwartz el al. (1 98 1)
constructed regional maps of freshwater equivalent hydraulic head, distribution of

199
chloride and oxygen isotopic composition. They interpreted a more limited flow
potential in the Viking/Bow Island based on variations in Cl, 6D, and 6180. A similar
interpretation is evident in this study. The Vikingmow Island waters are relatively dilute
and show a narrow range in composition. The 6180 value increases with increasing C1 at
low C1 concentrations, but comparison with the data of Schwartz er a!. (198 1) indicates
very little change in the isotopic composition except in the extreme southern area where a
rapid increase is observed.
Hitchon and Friedman (1969) suggest that the enrichment of ''0 in the VikingBow
Island formation waters results fiom exchange with carbonate cements. The Viking/Bow
Island formation waters appear to be in temperature equilibrium with authigenic calcite.
The isotopic composition of calcite cement suggests that it was precipitated fiom the
current formation water and the mass of cement is not great enough to alter the
composition of the formation water. Longstaffe and Ayalon ( 1987) determined that the
formation of calcite in the Viking to the northwest of the study area was relatively early,
with calcite precipitation occurring during early burial and deepest burial. If calcite
precipitation took place at similar times in the south, then the waters are relatively
unchanged since the early to mid Tertiary. The majority of calcite cements in the
VikingBow Island Formation in southern Alberta have been interpreted as a late stage
authigenic cement (McLellan, 1995). The results of McLelIan (1995), however, only

200
express the relative timing while those of Longstaffe and Ayalon (1987) are interpreted in
relation to orogenic activity and burial history. The difference between the two
paragenetic sequences may merely be a result of subsequent diagenesis of rocks in the
study area of Longstaffe and Ayalon (1987) and not from the temporal occurrence of the
events. Head values of the Viking/Bow Island are subhydrostatic and a steep gradient is
observed in the south where recharge occurs. Based on the isotopic composition of the
waters in this study and those of Schwartz et a/. (1 98 1 ), flow is interpreted to be sluggish
and variations in the oxygen isotopic composition and chloride content may reflect an
earlier meteoric recharge event.
Conclusions
1 . The present day fluid flow of the Devonian Nisku/Arcs, Mississippian, Jurassic
Sawtooth, Lower Cretaceous Lower Mannville, Upper Mannville and VikingIBow
Island aquifen is dominated by a south to north component and is topography driven.
2. West to east flow resulting from recharge in the Rocky Mountain foothills is
minimized by density-driven flow and decreased hydraulic communication.
3. Water chemistry in the Mississippian to Upper Mannville aquifers is controlled by
flow in the Mississippian, the lateral continuity of the clastic aquifers, and, potentially

201
by structual features like the Sweetgrass/Bow Island arch system and the Vulcan
Low.
4. Extensive mixing and dilution of the formation waters has occurred.
5. At least two mixing and dilution events are recognized for all of the aquifers. The
earlier event appears to have occurred prior to uplift and erosion of the Late
Oligocene.
6. The formation waters of the NiskdArcs, Mississippian, Lower and Upper Mannville
have 6"0 values that reflect a carbonate rock equilibrated system at temperatures of
>3 O°C for the Mississippian and younger aquifers and >70°C for the Nisku/Arcs.
7. Some waters may have 6180 values that reflect isotopic equilibration with carbonates
at higher temperatures and have retained that signature during uplift and erosion.
8. The influx of fi-esh water has resulted in lower chloride content and 8'80 values
consistent with mixing of meteoric water and isotopically modified formation waters.
9. A narrow mixing zone between waters reflecting meteoric recharge and isotopically
modified formation waters is recognized in the Mississippian to Upper Mannville
aquifers.

Future Work
Our understanding of the origin and evolution of WCSB formation waters is constantly
evolving. Meteoric water has had an obvious and considerable influence on the regional
distriiution and chemical composition of the waters. Unfortunately the effect of dilution
has often resulted in changes in composition that obscure the origin of the brine-end
member. Spencer ( 1987) and Comolly et al. ( 1990qb) used bromide content to interpret
the origin of the saline brine end-member. Based on sodium and potassium to bromide
ratios, the evolution of the brine end-member was required to involve some reaction with
rocks containing feldspars or clays. It would be worthwhile to obtain accurate bromide
data to test whether the NisWArcs formation waters in southern Alberta also retain some
evidence of interaction with silicates. As it stands the data indicate no such reaction is
necessary but the additional constraint on composition that bromide could provide would
at the least allow comparison with the waters in the central and northern reaches of the
basin.
Mineralogical control on the composition of water is often quite subtle. Small changes in
pH and dissolved silica activity as solution chemistry changes through physical processes
like mixing, appear to keep the system at or close to equilibrium with respect to the
aluminosilicate phases. At low temperatures do phases other than the silica polymorphs
influence the dissolved silica content? The answer appears to be affirmative and it would

203
be of value to look at dissolved silica content fiom a wider range samples from the
WCSB to see if trends observed by Abercrombie et al. (1994) for data fiom other basins,
can be recognized.
What is the source of the high pCO, and bicarbonate content in southern Alberta.
Certainly BSR contributes to high values, but why is the carbon isotopic composition of
bicarbonate generally close to that of the carbonate rocks? Taking a mass balance
approach to answer this problem may be the most appropriate. How much carbon from
the different sources results in the observed isotopic composition? To what degree does
methanogenesis affect the composition? All of these questions need to be, and can be,
addressed.
Perhaps of interest to hydrogeologists would be to try to accurately determine flux and
flow rates. By how much does the permeability change to result in redirection of flow?
Establishing flow paths using water chemistry and potentiometric surfaces is just the first
step in a long series. Where does all of this water go? For that matter, is it really that
much water? Detailed studies of smaller areas are needed. Perhaps focussing on where
the water is going to would better delineate the flow paths.

General Conclusions
The extent of fluid flow in the southern portion of the Alberta is considerable. It is
questionable as to whether topography-driven recharge in the current flow regime has
extensively modified the formation waters though. Older events appear to dominate the
regional variations in composition.
Mineralogical control on solution composition is subtle at these low temperatures.
Unless of course if salts are being dissolved. Changes in composition are small, the rocks
seem to be content with controlling pH and by doing so the system is controlled.
How much mass can be transported in a system that is close to equilibrium? That
depends on the solubility and the solubility of silicate minerals is low.

205
References Cited
Aagard P. and Helgeson H. C. (1983) Activitylcomposition relations among silicates and
aqueous solutions: 11. Chemical and thermodynamic consequences of ideal mixing
of atoms on homological sites in rnontmorillonites, illites, and mixed-layer clays.
Clays and Clay Minerals 31 (3), 207-2 1 7.
Abercrombie H. I. and Fullmer E. G. (1992) Regional hydrogeology and fluid
geochemistry of the Mannville Group, western Canada sedimentary basin:
Synthesis and reinterpretation. In Water-Rock Interaction, Vol. Volume 2:
Moderate and High Temperature Environments (ed. Y. K. Kharaka and A. S.
Maest), A.A. Balkerna, pp. 1 10 1 - 1 104.
Abercrombie H. J., Hutcheon I. E., Bloch J. D. a., and de Caritat P. (1994) Silica activity
and the smectite-illite reaction. Geology 22,539-542.
Appelo C. A. J. and Postma D. (1996) Geochemistry. Groundwater and Pollution. A.A.
Balkema.
Bachu S. (1995) Synthesis and model of formation-water flow, Alberta basin, Canada.
A.A.P.G. Bulletin 79(8), 1159-1 178.
Bachu S., Sauveplane C. M., Lytviak A. T., and Hitchon B. (1987) Analysis of fluid and
heat regimes in sedimentary basins: techniques for use with large data bases.
A.A. P.G. Bulletin 71(7), 822-843.
Bachu S. and Underschultz J. R. (1993) Hydrogeology of formation waters, northeastern
Alberta basin. A.A. P. G. Bulletin 77( f O), 1 745- 1 768.
Bachu S. and Underschultz J. R. ( 1 995) Large-scale underpressuring in the
Missippippian-Cretaceous succession, southwestern Alberta basin. A.A.P.G.
Bulletin 79(7), 989- 1004.
206
Bailey N. J. L., Krouse H. R., Evans C. R., and Rogers M. A. (1973) Alteration of crude
oil by waters and bacteria - Evidence from geochemical and isotope studies.
AA. P. G. Bulletin 57(7), 1276- 129 1.
Berman R. G. (1988) Internally-consistent thermodynamic data for minerals in the
system N~0-~O-Ca0-Mg0-Fe0-Fe,O3-A1,O3-SiO,-TiO,-H,O-CO,. - - Journal of
PetroIogy 29(2), 445-522.
Berman R. G. and Brown T. H. (1985) Heat capacity of minerals in the system Na,O-
K20-Ca0-Mg0-Fe0-Fe,O,-AI,03-Si0,-Ti0,-H,O-0: - - representation,
estimation, and high temperature extrapolation. Conrributions to Mineralogy and
P e t r o b 89, 168- 1 83.
Berner J. A. (1985) Sulfate reduction, organic matter decomposition and pyrite
formation. Philo. Trans. of the Royal Sociey of London A315,25-38.
Bethke C. M. (1 985) A numerical model of compaction-driven groundwater flow and
heat transfer and its application to the paleohydrology of intracratonic
sedimentary basins. Journal of Geophysical Research 90(B8), 68 1 7-6828.
Billings G. K., Hitchon B., and Shaw D. R. (1969) Geochemistry and origin of formation
waters in the western Canada sedimentary basin. 2. Alkali metals. Chemical
Geology 4,2 1 1-223.
Brandley R.T., Thurston, J., and Krause, F.F., 1993. Basement tectonic controt on
carbonate ramp deposition: Lower Carboniferous Mount Head Formation,
Southwest Alberta and Southeast British Columbia. Alberta Transects Workshop
(March 1-21, Lithoprobe Report #3 1, G.M. Ross (ed.), p. 98- 1 18.
Bruggenwert M. G. M. and Kamphorst A. (1982) Survey of experimental information on
cation exchange in soil systems. In Soil Chemistry, Vol. 5 (ed. G. H. Bolt), pp.
141 -203.

Caldwell M. E., Garrett R. M., Prince R. C., and SufIita J. M. (1998) Anaerobic
biodegradation of long-chain n-alkanes under sulfate reducing conditions.
Environmental Science and Technology 32(14), 2 19 1 -2 1 95.
Carothers W. W. and Kharaka Y. K. (1980) Stasble carbon isotopes of HC03- in oil-field
waters-implications for the origin of CO,. Geochirnica er Cosrnochimica Acta 44,
323-332.
Carpenter A. B. (1 978) Origin and chemical evolution of brines in sedimentary basins.
Oklahoma Geological Survey Circular 79,60-77.
Cathles L. M. and Smith A. T. (1983) Thermal constraints on the formation of
Mississippi Valley-type lead-zinc deposits and their implications for episodic
basin dewatering and deposit genesis. Economic Geology 78,983- 1002.
Chermak J. A. and Rimstidt I. D. (1989) Estimating the thermodynamic properties of
silicate minerals at 298K from the sum of polyhedral contributions. American
Mineralogist 74, 1023-103 1 .
Clayton R. N., Friedman I., Graf D. L., Mayeda T. K., Meents W. F., and Shimp N. F.
(1 966) The origin of saline formation waters 1. Isotopic composition. Journal of
Geophysical Research 71(16), 3869-3882.
Cody J. D. (1993) Geochemistry of Formation Fluids in the Mannville Group (Lwr.
Cret.), Southern Alberta. M.Sc., University of Calgary.
Cody J. D. and Hutcheon I. E. (1994) Regional water and gas geochemistry of the
Mannville Group and associated horizons, southern Alberta. Bulletin of Canadian
Petroleum Geology 42(4), 449-464.
Cody J. D., Hutcheon I. E., and Krouse H. R. (1999) Fluid flow, mixing and the origin of
C02 and H2S by bacterial sulfate reduction in the Mannville Group, southern
Alberta, Canada. Marine and Petrolezrm Geology 16,495-5 10.

208
Coleman M. L., Sheppard T. J., Durham I. J., Rouse J. D., and Moore G. R. (1982)
Reduction of water with zinc for hydrogen isotope analysis. Analytical Chemistry
54,199-260.
Connan I. (1 984) Biodegradation of crude oiIs in reservoirs. In Advances in Petroleum
Geochemistry (ed. J. Brooks and D. H. Welte), Academic Press, pp. 299-335.
Comolly C. A., Walter L. M., Baadsgaard H, and Longstaffe F. I. (1990a) Origin and
evolution of formation waters, Alberta basin, western Canada sedimentary basin.
I. Chemistry. Applied Geochemistry 5,375-395.
Comolly C. A., Walter L. M., Baadsgaard H., and Longstaffe F. J. ( 1990b) Origin and
evolution of formation waters, Alberta basin, western Canada sedimentary basin.
11. Isotope systematics and water mixing. Applied Geochemistry 5,397-4 1 3.
Craig H. (1 96 1) Isotopic variations in meteoric waters. Science 133, 1702- 1703.
Dahlberg E. C. ( 1 9 82) Applied Hydrodynamics in Petroleum @foration. Spring-Verlag,
161 p.
Davies P. B. (1987) Modeling areal, variable-densitry, ground-water flow using
equivalent freshwater head - Analysis of potentially significant errors.
Proceedings of the NWWA Conference on Solving Ground Water Problems with
Models, Denver, Colorado, pp. 888-903.
Deming D. and Nunn J. A. ( 199 1 ) Numerical simulations of brine migration by
topographically driven recharge. ~bzirnal of Geophysical Research 96(B2), 248 5-
2499.
Deming D., Nunn I. A., and Evans D. G. (1990) Thermal effects of compaction-driven
groundwater flow from overthrust belts. Journal of Geophysical Research 95(B5),
6669-6683.

209
Downey J. S. (1 986) Geohydrologv of bedrock aquifers in rhe Northern Great Plains in
parts of Montana. North Dakota. South Dakota. and Wyoming. US GS.
Professional Paper 1402-E
Epstein S. and Mayeda T. (1953) Variation of 018 content of waters from natural sources.
Geochimica et Cosmochimica Acta 4,2 13-224.
Farshori M. 2. and Hopkins J. C. ( 1 989) Sedirnentology and petroleum geology of fluvial
and shoreline deposits of the Lower Cretaceous Sunburst Sandstone Member,
Mannville Group, southern Alberta Bulletin of Canadian Petroleum Geology
37(4), 371-388.
Foscolos A. E., Reinson G. E., and Powell T. G. (1982) Controls on clay-mineral
authigenesis in the Viking Sandstone, central Alberta, 1. Shallow depths.
Canadian Mineralogist 20, 1 4 1 - 1 50.
Friedman I. and O'Neil J. R. (1 977) Compilation of stable isotope fractionation factors of
geochemical interest. In Data of Geochemistry, Vol. Prof. Paper 440-KK (ed. M.
Fleisher). USGS.
Garrels R. M. (1 984) Montmorillonite/illite stability diagrams. Clays and Clay Minerals
32(3), 161-166.
Garven G. (1985) The role of regional fluid flow in the genesis of the Pine Point deposit,
western Canada sedimentary basin. Economic Geology 80,307-324.
Gat J. R. ( 1 98 1 ) Groundwater. In Stable Isotope Hydrology: Deuterium and Oxygen- 18
in the Water Cycle, Vol. Technical Report Series No. 2 10, IAEA. pp. 223-240.
Ge S. and Garven G. (1994) A theoretical model for thrust-induced deep groundwater
expulsion with application ti, the Canadian Rocky Mountains. Journal of
Geophysical Research 99(B7), 13851-13868.

210
Ghent E. D. and Miller B. E. (1974) Zeolite and clay-carbonate assemblages in the
Blainnore Group (Cretaceous), southern Alberta Foothills, Canada. Contributions
to Mineralogy and Petrology 44.3 1 3 -3 29.
Guven N. (1988) Smectites. In Hydrous Phyllosilicates ((exclusive of micas), Vol. 19 (ed.
P. H. Ribbe), MSA Reviews in Mineralogy, pp. 497-560.
Harvie C. E., Moller N., and Weare I. H. ( 1 984) The prediction fo mineral solubilities in
natural waters: The N~-K-M~-C~-H-C~-SOPOH-HCO~-C~~-CO~-H~~ system
to high ionic strengths at 25 C. Geochimica et Cosmochimica Acta 48,723-75 1.
Hayes B. J. R. (1986) Stratigraphy of the basal Cretaceous Lower Mannville formation,
southem Alberta and north-centrai Montana. Bulletin of Canadian Petroleum
Geology 34( 1 ), 3 0-48.
Helgeson H. C. (1969) Thermodynamics of hydrothermal systems at elevated
temperatures and pressures. American Journal of Science 267, 729-804.
Helgeson H. C., Delany J. M., Nesbitt H. W., and Bird D. K. (1978) Summary and
critique of the thermodynamic properties of rock- forming minerals. American
Journal of Science 278A, I -229.
Helgeson H. C., Kirkham D. H., and Flowers G. C. (1 98 1) Theoretical prediction of the
thermodynamic properties of aqueous electrolytes at high temperatures and
pressures. IV. Calculation of activity coefficients, osmotic coefficients. and
apparent mold and standard and relative partial molal properties to 600°C and
5kb. American Journal of Science 281, 1 249- 1 5 16.
Hitchon B. (1 969a) Fluid flow in the western Canada sedimentary basin. 1. Effect of
topography. Water Resources Research 5( 1 ), 1 86- 195.
Hitchon B. (1969b) Fluid flow in the western Canada sedimentary basin. 2. Effect of
geology. Water Resources Research 5(2), 460-469.

21 1
Hitchon B., Bachu S., Lytviak A. T., and Sauveplane C. M. (1986) Integrated
hydrological data bases: Their use and misuse. M A Can-Am Hydroconference
on Hydrology of Sedimentary Basins: Application to Exploration and
Exploitation, 1 1 5- 1 1 7.
Hitchon B., Bachu S., and Underschultz J. R. ( 1 990) Regional subsurface hydrogeology,
Peace River Arch area, Alberta arid British Columbia Bulletin of Canadian
Petroleum Geology 38A, 1 96-2 1 7.
Hitchon B., Billings G. K., and Klovan J. E. (1 97 1) Geochemistry and origin of
formation waters in the western Canada sedimentary basin-- III. Factors
controlling chemical composition. Geochimica et Cosmochimica Acta 35,567-
598.
Hopkins J. C., Hermanson S. W., and Lawton D. C. (1982) Morphologies of channels and
channel-sand bodies in the Glauconitic sandstone member (Upper Mannville),
Little Bow area, Alberta. Bulletin of Canadian Petvoleurn Geology 30(4), 274-
285.
Hubbert M. K. (1 956) Darcy's law and the field equations of the flow of underground
fluids. Darcy Centennial ff vdrology Symposium, 222-239.
Hutcheon I. and Abercrombie H. (1990) Carbon dixide in clastic rocks and silicate
hydroiysis. Geology 18,541 -544.
Hutcheon L, Shevalier M., and Abercrornbie H. J. (1993) pH buffering by metastable
mineral-fluid equilibria and evolution of carbon dixide hgacity during burial
diagenesis. Geochimica et Cosmochimica Acta 57, 10 1 7- 1 027.
James D. P. (1 985) Stratigraphy, Sedimentology, and Diagenesis of Upper Jurassic and
Lower Cretaceous Strata, southwestern Alberta. Ph.D., University of Oxford.

212
Johnson J. W., Oekers E. H., and Helgeson H. C. (1992) SUPCRT92: A software
package for calculating the standard mold thermodynamic properties of minerals,
gases, aqueous species, and reactions from 1 to SO00 bars and 0 to 1000°C.
Computers and Geosciences.
Karavas F. A., Riediger C. L., Fowler M. G., and Snowdon L. R. (1 998) Oil families in
Mannville Group reservoirs of southwestern Alberta, western Canada sedimentary
basin. Organic Geochemistry 29(1-3), 769-754.
Karvonen R. L. and Pernberton S. G. (1 997) The Upper Mannville Group of southeast
Alberta, Canada: An example of multiple incised valley fill deposits. In
Petroleum Geology of the Cretaceous Mannvif fe Group. Western Canada, Vol.
Memoir 18 (ed. S. G. Pernberton and D. P. James), CSPG, pp. 124-1 39.
Kharaka Y. K. (1986) Origin and evolution of water and solutes in sedimentary basins.
Third CanadiadAmerican Confrence on Hydrogeology, 1 73- 195.
Kharaka Y. K. and Carothers W. W. (1 986) Oxygen and hydrogen isotope geochemistry
of deep basin brines. [n Handbook of Environmental Isotope Geochemistry, Vol. 2
(ed. P. Fritz and J. Fontes), pp. 305-360.
Kharaka Y . K., Gunter W. D., Aggarwal P. K., Hull R. W., and Perkins E. H. (1 987)
SOLMNEQ. 8 7: Acomputer program code for geochemical modeling of water-
rock interactions. USGS. Water Resources Investigations Report 87-5082
Kissling D. L. and Slingsby A. (1 992) Depositional , digenetic and reservoir parameters
of the Upper Devonian Nisku Shelf, Alberta and Montana. In CSPG Core
Workshop, pp. 46.
Kittrick I. A. (197 1 ) Stability of montmorillonites: I. Belle Fouche and Clay Spur
montmorillonites. Soil Sci. Soc. Amer. Proc. 35, 140-1 45.

213
kouse H. R., Viau C. A., Eliuk L. S., Ueda A., and Hdas S. (1988) Chemical and
isotopic evidence of thennochemical sulphate reduction by light hydrocarbon
gases in deep carbonate reservoirs. Nature 333(2 June), 41 5-41 9.
Kyser T. K. ( 1987) Equilibrium hctionation factors for stable isotopes. In Stable isotope
chemltry of low temperature processes, Vol. 13 (ed. T. K. Kyser), MAC pp. 1 - 83.
Land L. S. (1 983) The application of stable isotopes to studies of the origin of dolomite
and to problernsof diagenesis of clastic sediments. In Stable Isotopes in
Sedimentmy Geology, Vol. Short Course 10, SEPM, pp. 4.1-4.22.
Langmuir D. (1 997) Aqueous Environmental Geochemistry. Prentice Hall. 600 p.
Lico M. S., Kharaka Y. K., Carothers W. W., and Wright V. A. (1982) Methods of
collection and analysis of geopressured geothermal and oil field warers. United
States Geological Survey. USGS Water Supply Paper 2 194
Longstaffe F. and Ayalon A. (1 987) Oxygen-isotope studies of clastic diagenesis in the
Lower Cretaceous Viking Formation, Alberta: implications for the role of
meteoric water. In Diagenesis of Sedimentary Sequences, Vol. Special Publication
No. 36 (ed. J. D. Marshall), Geological Society, pp. 277-296.
Longstaffe F. J. (1986) Mineralogical and oxygen-isotope studies of clastic diagenesis:
Implications for fluid flow in sedimentary basins. Third CanadiadAmerican
Conf rence on Hydrogeoilogy Hydrogeology of Sedimentary Basins:
Application to Exploration and Exploitation, 204-220.
Longstaffe F. J. (1987) Stable isotope studies in diagenetic processes. In Stable isotope
chemistry of low temperature processes, Vol. 1 3 (ed. T.K. Kyser), MAC, pp. 1 87-
257.

Longstaffe F. J. (1 989) Stable isotopes as tracers in clastic diagenesis. In Burial
Diagenesis, Vol. 15 (ed. I. E. Hutcheon), MAC, pp. 20 1-257.
Lorenz J. C. (1 982) Lithospheric flexure and the histo~y of the Sweetgrass arch
northwestern Montana. Rocky Mountain Association of Geologists 1982
Symposium, 77-89.
Machel H. G., Krouse H. R., and Sassen R. (1995) Products and distinguishing criteria of
bacterial and thermochemical sulfate reduction. Applied Geochemistry 10,373-
389.
Mackenzie F. T. and Garrels R. M. ( 1965) Silicates; reactivity with seawater. Science
150(3692), 57-58.
Manzano B. IS., Riediger C., and Fowler M. (2000) Mesozoic oil families, southern
Alberta: Application of aromatic compounds. CSPG Annual Convention
GeoCanada 2000. Calgary, Alberta, Posters with Abstracts.
May H. M., =burgh D. G., Helmke P. A., and Jackson M. L. (1986) Aqueous
dissolution, solubilities and thermodynamic stabilities of common alurninosilicate
clay minerals: Kaolinite and smectites. Geochimica et Cosmochimica Actu 50,
1667- 1 677.
McCafferey M. A., Lazar B., and Holland H. D. (1987) The evaporation path of seawater
and the coprecipitation of B r and K- with halite. Journal of Sedimentary
Petrology 57,928-93 7.
McLellan S. R. (1 995) Fluid flow, gas isotope geochemistry and diagenesis in the Bow
Island Formation (Lower Cretaceous) of southern Alberta. M.Sc., University of
Calgary.

215
Nesbitt B. E. and Muehlenbachs K. (1994) Paleohydrogeology of the Canadian Rockies
and origins of brines, Pb-Zn depotits and dolomitization in the western Canada
sedimentary basin. Geology 22(March), 243-246.
Neuzil C. E. and Pollock D. W. ( 1982) Erosional unloading and fluid pressures in
hydraulically "tight" rocks. Journal of Geology 91, 1 79- 193.
Nordstrom, D.K. and Munoz, J.L. (1996) Geochemical Thermodynamics (2nd Edition).
Boston. Blackwell Scientific Publications.
Nriagu I. 0. (1975) Thermochernical approximation for clay minerals. American
Mineralogist 60,834-839.
Olson G. I., Dockins W. S., McFeters G. A., and Iverson W. P. (198 1) Sulfate reducing
and methanogenic bacteria from deep aquifers in Montana. Geomicrobiology
Journal 2,327-333.
Orr W. L. (1977) Geological and geochemical controls on the distribution of hydrogen
sulfide in natural gas. In Advances in Organic Geochemistry (ed. R. Campos and
J. Goni), pp. 571-597.
Paukert, G.W., 1982. Geophysical Study of Precambrian Basement Fault Structure and
Related Cretaceous Sratigraphic Variation in Southern Alberta. Unpublished
M.Sc. Thesis, University of Calgary, 1 14 p.
Potocki D. and Hutcheon I. E. (1 992) Lithology and diagenesis of sandstones in the
western Canada foreland basin. In Foreland Basins and Fold Belts, Memoir 55
(ed. R. W. L. Macqueen, D.A.Leckie), A.A.P.G., pp. 229-257.
Poulton, T.P., Christopher, J.E., Hayes, B.I.R., Losert, J., Titternore, J. and Gilchrist,
R.D., 1994, Jurassic and Lowermost Cretaceous Strata of the Western Canada
Sedimentary Basin. In G. D. Mossop and I Shetson (eds.), The Geological Atlas

216
of the Western Canada Sedimentary Basin. Calgary. Canadieq Society of
Petroleum Geologists and Alberta Research Council, p. 297-3 16.
Ransom B. and Helgeson H. C. (1993) Compositional end members and thermodynamic
components of illite and dioctahedral alurninous smectite solid solutions. CIays
and Clay Minerals 41(5), 53 7-550.
Ransom B. and Helgeson H. C. ( 1994) Estimation of the standard mold heat capacities,
entropies, and volumes of 2: 1 clay minerals. Geochimica et Cosmochimica Acra
58(2 1 ), 453 7-4547.
Ransom B. and Helgeson H. C. (1 995) A chemical and thermodynamic model of
dioctahedral2: 1 layer clay minerals in diagenetic processes: Dehydration of
dioctahedral aluminous smectite as a function of temperature and depth in
sedimentary basins. American Journal of Science 295,245-28 1.
Richards, B.C., Barclay, J.E., Bryan, D.. Harting, A*, Henderson, C.M. and Hinds, R.C.,
1994, Carboniferous Strata of the Western Canada Sedimentary Basin. In G. D.
Mossop md I Shetson (eds.), The Geological Atlas of the Western Canada
Sedimentary Basin. Calgary. Canadian Society of Petroleum Geologists and
Alberta Research Council, p. 22 1-250.
Robie R. A., Hemingway B. S., and Fisher J. R. (1978) T~zermodynamicproperties of
rnincruls and related substances at 298. ISK and 1 bar pressure and at higher
temperature. USGS. Bulletin 1452.
Robinson G. R. and Haas Jr. I. L. ( 1983) Keat capacity, relative enthalpy, and
calorimetric entropy of silicate minerals: an empirical method of prediction.
American Mineralogist 68,541 -553.

Ross G. M., Pamsh R P., Villeneuve M. E., and Bowring S. A. (199 1) Geophysics and
geochronology of the crystalline basement of the Alberta basin, westem Canada.
Canadian Joumui of Earth Sciences 28,5 1 2-522.
Routson R C. and Kittrick J. A. (1 97 1 ) Illite solubility. Soil Sci. Soc. Amer. Proc. 35,
714-718.
Rueter P., Rabus R., WiIkes H., Aeckersberg F., Rainey F. A., Jannasch H. W., and
Widdel F. (1994) Anaerobic oxidation fo hydrocarbons in crude oil by new types
of sulfate-reducing bacteria. Nature 372(1 December), 455-458.
Runnels D. D. (1969) Diagenesis, chemical sediments and the mixing of natural waters.
Journal of Sedimentary Petrclogy 39-1 188-1202.
Schwartz F. W., Muehlenbachs K., and Chorley D. W. (1 98 1) Flow-system controls of
the chemical evolution of groundwater. Journal of Hydrology 54,225-243.
Simpson G. P. (1 999) Sulfate reduction and fluid chemistry of the Devonian Leduc and
Nisku Formations in south-central Alberta. Ph.D., University of Calgary.
Smith, D.G., 1994, Paleogeographic Evolution of the Western Canada Foreland Basin. In
G. D. Mossop and I Shetson (eds.), The Geological Atlas of the Western Canada
Sedimentary Basin. Calgary. Canadian Society of Petroleum Geologists and
Alberta Research Council, p. 277-296.
Smith J. T. and Ehrenberg S. N. ( 1989) Correlation of carbon dioxide abundance with
temperature in clastic hyrdocarbon reservoirs: relationship to inorganic chemical
equilibrium. Marine and Petroleum Geology 6,129- 13 5 .
Spencer R. J. (1987) Origin of Ca-C1 brines in Devonian formations, western Canada
sedimentary basin. Applied Geochemistry 2,3 73-3 84.

218
Tardy Y. and Duplay J. (1992) A method of estimation the Gibbs fiee energies of
formation of hydrated and dehydraed clay minerals. Geochimica et Cosmochimica
Acta 56(8), 3007-3029.
Tardy Y., Duplay J., and Fritz B. (1987) Stability fields of smectites and illites as a
function of temperature and chemical composition. Inti- Mtg. on Geochemistry of
the Earth Surjiuce and Processes of Mnerd Fornation, 46 1-494.
Tardy Y. and Fritz B. (1981) An ideal solid solution model for calculating solubility of
clay minerals. Clay Minerals 16,36 1 -3 73.
Tardy Y. and Garrels R. M. (1 974) A method of estimation the Gibbs energies of
formation of layer silicates. Geochimica et Cosmochimica rictcl38, 1 1 0 1 - 1 1 16.
Tardy Y. and Garrels R. M. (1 976) Prediction of Gibbs energies of formation-1.
Relationships among Gibbs energies of formation of hydroxides, oxides, and
aqueous solutions. Geochimica et Cosmochimica Acta 40, 105 1 - 2 056.
Tardy Y. and Garrels R. M. ( 1977) Prediction of Gibbs energies of formation of
compounds fiom the elements-11. Monovalent and divalent metal silicates.
Geochimica et Cosmochimica Acta 41,87-92.
Thode H. G., Wanless R. K., and Wallouch R. (1 954) The origin of native sulfur deposits
fiorn isotope fkactionation studies. Geochimica et Cosmochimica Acta 5,286-298.
Toth J. (1989) Large-scale characteristics of pore-fluid potential fields in the Alberta
basin, Car.ada. Eus October 24, 1096,
Toth J. and Corbet T. (1987) Post-Paleocene evolution of regional groundwater flow
systems and their relation to petroleum accumulations, Taber area, southern
Alberta, Canada. In Fluid Flow in Sedimentary Basins and Aquifers, Vol.
Geological Society Special Publication No. 34 (ed. J. C. Goff and B. P. I.
Williams), Blackwell Scientific Publications, pp. 45-77.
219
Weaver R. M., Jackson M. L., and Syers J. K. (1 971) Magnesium and silicon activities in
matrix solutions of montmorillonite-containing sols in relation to clay mineral
stability. Soil Sci. Soc. Arner. Proc. 35, 823-830.
Whelan J. A. (1 987) Stable isotope hydrology. In Stable isotope chernisty of low
temperature processes, Vol. 1 3 (ed. T. K. Ky ser), MAC, pp. 1 59- 1 60.
Whiticar M. I., Faber E., and Schoell M. ( 1986) Biogenic methane formation in marine
and freshwater environments: C 0 2 reduction vs. acetate fermentation-Isotope
evidence. Geochimica et Cosmochimica Acta 50,693-709.
Whittaker S. G. and Mountjoy E. W. ( 1 996) Diagenesis of an Upper Devonian carbonate-
evaporite sequence: Birdbear Formation, southern interior plains, Canada. Jounal
of Sedimentary Research 66(5), 965-975.
Wood J. M. (1 990) Sequence stratigraphy, sedimentology and petroleum geology of the
Glauconitic and adjacent strata, Lower Cretaceous Mannville Group, southern
Alberta. Ph-D., University of Calgary.
Wood J. M. and Hopkins J. C. (1992) Traps associated with paleovalleys and interfluves
in an unconformity bounded sequence: Lower Cretaceous Glauconitic member,
southern Alberta, Canada. A.A.P.G. Bulletin 76(6), 904-926.
Wright, C.N., McMechan, M.E. and Potter, D.E.G., (1 994). Structure and Architecture
of the Western Canada Sedimentary Basin. In G. D. Mossop and I Shetson (eds.),
The Geological Atlas of the Western Canada Sedimentary Basin. Calgary.
Canadian Society of Petroleum Geologists and Alberta Research Council, p. 25-
40.
Zaitlin B. A. (1 997) The stratigraphic organization of incised-valley systems:
Implications for exploration and exploitation in the western Canada sedimentary
basin. CSPG Reservoir and Noon Hour Talk 24(6), 3 -6.