COMPOSITION, PHYSICOCHEMICAL AND …epubs.surrey.ac.uk/806549/1/Composition, physicochemical...
35
1 COMPOSITION, PHYSICOCHEMICAL AND 1 RHEOLOGICAL PROPERTIES OF FRESH BIGEYE 2 SNAPPER FISH (PRIACANTHUS HAMRUR) MINCE 3 4 A.O. DILEEP 1 , B.A. SHAMASUNDAR 1,* , P.K. BINSI 1 , F. BADII 2 , N.K. HOWELL 2 5 1. Department of Fish Processing Technology, Karnataka Veterinary, Animal and 6 Fisheries Sciences University, Bidar, College of Fisheries, Mangalore- 575 002. 7 India 8 2. Division of Nutrition and Food safety, School of Biomedical and Molecular 9 Sciences, University of Surrey, Guildford, United Kingdom, GU2 7X4. 10 11 12 13 14 15 * Corresponding Author: 16 B. A. Shamasundar 17 Karnataka Veterinary, Animal and Fisheries Sciences University 18 Department of Fish Processing Technology 19 College of Fisheries, Mangalore, INDIA – 575 002. 20 Telephone: + 91-824-2427899 21 Fax: + 91-824-2248366 22 Email: [email protected] 23 24 Properties of fresh bigeye fish mince 25 26
Transcript of COMPOSITION, PHYSICOCHEMICAL AND …epubs.surrey.ac.uk/806549/1/Composition, physicochemical...
1
COMPOSITION, PHYSICOCHEMICAL AND 1
RHEOLOGICAL PROPERTIES OF FRESH BIGEYE 2
SNAPPER FISH (PRIACANTHUS HAMRUR) MINCE 3
4
A.O. DILEEP1, B.A. SHAMASUNDAR
1,*, P.K. BINSI
1, F. BADII
2, N.K. HOWELL
2
5
1. Department of Fish Processing Technology, Karnataka Veterinary, Animal and 6
Fisheries Sciences University, Bidar, College of Fisheries, Mangalore- 575 002. 7
India 8
2. Division of Nutrition and Food safety, School of Biomedical and Molecular 9
Sciences, University of Surrey, Guildford, United Kingdom, GU2 7X4. 10
11
12
13
14
15
* Corresponding Author: 16
B. A. Shamasundar 17
Karnataka Veterinary, Animal and Fisheries Sciences University 18
Department of Fish Processing Technology 19
College of Fisheries, Mangalore, INDIA – 575 002. 20
Telephone: + 91-824-2427899 21
Fax: + 91-824-2248366 22
Email: [email protected] 23
24
Properties of fresh bigeye fish mince 25
26

2
ABSTRACT 27
Composition and properties of fresh bigeye snapper fish (Priacanthus hamrur) mince 28
has been investigated. The protein content of fish mince was 16.71g/100 g mince. Amino 29
acid analysis revealed higher proportion of glutamic acid, alanine, lysine and leucine. 30
Fatty acid profile indicated higher proportion of EPA and DHA content. Gel filtration 31
profile of total proteins from fresh bigeye fish mince revealed a major peak (high 32
molecular weight component) and a few minor peaks, which was further confirmed by 33
SDS-PAGE pattern. The differential scanning calorimetry profile of fresh bigeye fish 34
mince revealed transitions at 38.35oC, 47.72
oC and 63.02
oC indicating denaturation 35
temperature of different protein fractions. Gel forming ability of fresh bigeye fish mince 36
was evaluated by both small strain and large strain tests. The flow behaviour of total 37
protein solution from fresh bigeye fish mince as a function of protein concentration and 38
temperature showed pseudoplastic behavior. 39
40
Key words: Bigeye fish mince, amino acid composition, differential scanning 41
calorimetry, rheology 42
43
44
45
46
47
48
49
3
PRACTICAL APPLICATIONS 50
51
The properties of fish mince including amino acid and fatty acid profile will be critical in 52
deciding the nature of processed products to be prepared. Due to lesser catch of bigeye 53
snapper in earlier days, this fish was not commonly available and hence it has been 54
regarded as a nonconventional marine fishery resource. Recently it has assumed 55
significance as an important species in the commercial landings. In the present 56
investigation composition, thermal and rheological properties of fresh bigeye snapper 57
have been assessed. High proportion of omega 3 fatty acids shows the nutritional 58
importance of this fish whereas its gel forming ability shows the potential to be utilized 59
as raw material in surimi industry. Establishing thermal denaturation profile, 60
measurement of dynamic viscoelstic behavior and assessing flow behavior of proteins 61
from bigeye snapper will aid in appropriate processing and design in formulating mince 62
based products.63
4
INTRODUCTION 64
The bigeye snapper (Priacanthus spp) fish is regarded as one of the non conventional 65
marine fishery resources, due to its lesser availability in commercial fish landings in 66
earlier days. However, the species recently assumed significance as an important species 67
in the commercial fish landings on quantity basis. Being non conventional resource, the 68
precise catch statistics is not available, however, during the year 2001 the total quantity 69
landed was 103,102 t (FAO 2002). In India, the catches of bigeye snapper (also refereed 70
as ‘Bulls eye’) is showing increasing trend and constitutes 1-3% of total marine landings 71
during 1997-2002 (Sivakami et al. 2003). The potential yield in the Indian Exclusive 72
Economic Zone in the depth range of 30 – 150 m is estimated to be 54,800 t 73
(Somavamshi, 2001). The species available in abundance in Indian waters is Priacanthus 74
harmur. The abundance of bigeye snapper has been reported from South China Sea 75
(Morrissey and Tan 2000). 76
The consumer acceptance of fresh bigeye snapper is limited because of appearance, 77
thick skin and meat color. It is mainly used for the preparation of surimi (separated meat 78
water washed, partially dehydrated, mixed with cryoprotectants, frozen and frozen stored) 79
and surimi based products (Benjakul et al. 2002). The textural and sensory characteristics 80
of surimi and surimi based products depend on the ability to form gel. The gel forming 81
ability of bigeye snapper has been rated as high (Morrissey and Tan 2000) and therefore 82
used as raw material for surimi manufacture. Among different Priacanthus spp, the gel 83
forming ability of P. tayenus was found to be superior (Benjakul et al. 2002). The 84
textural properties surimi or fish mince based products are controlled by the internal 85
structure of the gel which is mainly made of myofibrillar proteins (Ko et al. 2007). 86

5
It is important to have details on amino acid profile and fatty acid composition of big 87
eye snapper so as to have complete nutritional details of the prepared products. Further, 88
the literature on rheological properties of bigeye snapper mince and the prepared gel is 89
lacking. Rheology is defined as the study of deformation and flow of matter (Barnes 90
2000). The rheological behavior of fish mince is of special importance when they are 91
used to modify textural attributes. It is also well recognized that rheological properties 92
play a role in process design, evaluation and modeling. These properties are sometimes 93
measured as an indicator of product quality (e.g. indication of total solids or change in 94
molecular size). Rheological data are required for calculation in any process involving 95
fluid flow (e.g. pump sizing, extraction, filtration, extrusion, purification) and play an 96
important role in the analyses of flow conditions in food processes such as pasteurization, 97
evaporation, drying and aseptic processing. Thus rheological measurements can yield 98
information relating both to acceptability of product texture and the chemical mechanism 99
operating under the various processing conditions. 100
With this rationale the present investigation was undertaken to elucidate a) the amino 101
acid and fatty acid profile of fresh big eye snapper (Priacanthus harmur), b) the dynamic 102
viscoelastic behavior of fish paste c) rheological characterization of heat set gel c) shear 103
stress sweep (flow properties) of proteins as a function of protein concentration and 104
temperature for predicting the behavior. 105
MATERIAL AND METHODS 106
Material 107
Fresh bigeye fish (Priacanthus hamrur) caught by trawl net along the West coast of 108
India, Mangalore, was used for the study. The length of fish used was 25-30 cm, 109
6
weighing 350-400g. Immediately after harvest, the fish were washed in chilled fresh 110
water and iced in the ratio of 1:1 (fish: ice) and transported to the laboratory for analysis. 111
Methods 112
Proximate composition of bigeye snapper fish mince 113
Meat was separated manually and macerated well for 5 minutes at 4oC using a pestle 114
and mortar. The macerated meat was used for proximate composition analyses. Moisture, 115
crude protein, fat and ash content in the mince were determined by the AOAC (2006) 116
method. All the analyses were carried out in triplicate. 117
Non-protein nitrogen content and pH 118
Non-protein nitrogen (NPN) content of bigeye snapper fish mince was determined by 119
the method as described by Velankar and Govindan (1958), using trichloroacetic acid 120
(TCA) extract and was expressed as mg/100 g of mince. About 3.0 g of mince was 121
macerated with 15 ml of 15ml/100 ml TCA for 5 minutes using a dried pestle and mortar. 122
The homogenate was allowed to stand at 4oC for 30 minutes. The slurry was filtered and 123
made up to 50 ml with distilled water and 5 ml of aliquot was taken for nitrogen 124
estimation using the Kjeldhal method. Analyses were carried out in triplicate. 125
The pH of bigeye snapper fish mince samples was measured using a pH meter 126
(Systronic 324 pH meter, Ahemdabad, India). Five grams of mince was macerated for 5 127
minutes with 45 ml distilled water and the pH was measured. 128
Amino acid composition 129
Amino acid composition of fresh bigeye snapper fish mince was determined after 130
derivatization with phenylisothiocyanate (PITC), according to the Waters Pico-Tag 131
method as described by Bidlingmeyer and others (1984) using the Waters Pico-Tag 132
7
HPLC amino acid analyzer (Water Model 712 WISP, Waters, Watford, Herts., UK). The 133
amino acid content was expressed as percentage of total amino acids. 134
Fatty acid composition 135
Fatty acid composition of fat extracted from bigeye snapper fish mince was 136
determined. Transesterification was performed according to Schmarr, Gross, and 137
Shabamoto (1996). The prepared fatty acid methyl esters (1 µl) were then injected into a 138
Varian gas chromatograph, (Series 3600, Walton-on-Thames, UK) with a hydrogen flame 139
ionization detector using helium as a carrier gas. An initial temperature of 180oC for 4 140
minutes was raised to 250oC at a rate of 4
oC/minute. Chromatography of standard 141
reference fatty acids were also carried out to identify the individual fatty acids. 142
Sodium Dodecyl Sulphate-Polyacrylamide Gel Electrophoresis (SDS-PAGE) 143
Sodium dodecyl sulphate - polyacrylamide gel electrophoresis (SDS-PAGE) was 144
performed as described by Laemmli (1970). The concentration of acrylamide was 145
10ml/100 ml of double distilled water. The thickness of the gel was 0.75mm. 146
Electrophoresis was carried out at a constant current mode in a vertical slab gel 147
electrophoresis apparatus (Hoefer –Pharmacia Biotech Inc., SE –50, San Francisco, 148
Calif., U.S.A.). A standard marker protein mixture of high range molecular weight 149
obtained from Sigma Chemicals, St Louis, MO, USA, was loaded into a separate well. 150
The molecular weight of the protein bands obtained in the sample was approximated by 151
measuring the relative mobility of the standard protein molecular weight markers. 152
Gel filtration profile 153
Gel filtration profile of total proteins extracted using extraction buffer (EB) was 154
carried out on a Sepharose 6B gel packed in a column of 1.5 x 80 cm (diameter x height) 155

8
at ambient temperature (27oC). The eluant used was EB. Total bed volume of the column 156
was 150 ml and the void volume determined by using blue dextran was found to be 50 157
ml. A protein concentration of 4 mg/ml was loaded on to the column and elution was 158
carried out at a flow rate of 30 ml/h. Fractions (3 ml) were collected manually and the 159
concentration of the eluant was determined by measuring the absorbance at 280 nm (A280) 160
using a spectrophotometer (Bausch and Lomb, Model 21-UVD, Austin, Texas, USA). A 161
plot of A280 nm against elution volume was obtained to get gel filtration profile. 162
Differential Scanning Calorimetry (DSC) 163
The thermodynamic parameters of the bigeye snapper fish mince were examined 164
using a DSC VII calorimeter (Setaram, Lyon, France). Fish mince was prepared by 165
macerating 5 g of meat for 5 minutes using a pestle and mortar. Water was kept as 166
reference for all the samples. Heating rate employed was 0.5oC/min from 10
oC to 90
oC. 167
Heat absorbed or released by the sample results in either endothermic or exothermic 168
peaks as function of temperature. From the thermogram, parameters such as To (onset 169
temperature) and Tm (denaturation temperature) for fish mince were obtained. The energy 170
required to denature the sample, the enthalpy change (ΔH), was measured by integrating 171
the area under the peak using the Setaram DSC software. 172
Preparation of heat induced gel 173
The bigeye fish meat (100g) was ground manually with 2.5g of Sodium chloride in a 174
pre-chilled pestle and mortar for 10 min. The resulting paste was packed in krehalon 175
(krehalon is the trade mark of Kureha Chemical Industry Co., Ltd., Japan) casing (260 176
mm long, 48 mm diameter and 200 gauge thickness) without air pockets, using a hand 177
stuffer. Prior to stuffing of paste into the casing, one end of the casing was sealed and 178

9
after stuffing the other end was sealed. The sealing was done with aluminium wire using 179
a clipping machine. The sealed casings were heated at 90° 2°C for 45 min in a water 180
bath (Haake, model K10, Germany) and cooled in chilled water (5-6oC) for 20 min. The 181
gel was kept in a refrigerator (6-8oC) overnight. 182
Gel strength measurement (Large strain test) 183
The gel strength measurement was carried out using an Okada gellometer (Saitama 184
Keki Seisa Kuso Co. Ltd., Tokyo, Japan) as described by Suzuki (1981) after keeping at 185
ambient temperature for 1hr. Analysis was carried out in triplicate. 186
Dynamic viscoelastic behaviour 187
Dynamic viscoelastic behaviour (DVB) of fresh bigeye fish mince in the temperature 188
range of 30o-90
oC was measured using a Carri Med Controlled Stress Rheometer (CSR-189
500, Carri-Med, Surrey, UK) under oscillatory mode, using a 4 cm parallel plate 190
measuring geometry. Fish meat devoid of connective tissue, fins and scales was 191
macerated well using pestle and mortar. About 4 g of macerated mince was mixed with 192
sodium chloride at a concentration of 2.5 % of mince (w/w) and macerated thoroughly to 193
get a fine ground paste. The fish paste obtained was used for DVB measurement. The gap 194
between measuring geometry and peltier plate was adjusted to 2000 µm at 80oC manually 195
using the micrometer provided at the base of the rheometer. The applied stress of 500 Pa 196
was within the viscoelastic region. The linear viscoelastic region was determined by a 197
torque sweep with a frequency of 1 Hz. Measurements were made by applying a small 198
displacement amplitude oscillation (0.0005 Rad) with a frequency of 1 Hz. A heating rate 199
of 1oC/min was achieved through peltier plate of rheometer. Applied stress was compared 200
with the resultant strain. The results of such measurements were expressed as the storage 201
10
modulus (G′) and loss modulus (G′′). An average of three replicates was used for plotting 202
the results. 203
The gels obtained after temperature sweep were subjected to frequency sweep as well 204
as torque sweep at 30oC. Frequency was varied from 0.5 Hz to 5.5 Hz. Storage and loss 205
modulus (G’ and G’’) were obtained as a function of frequency. The slope of the 206
regression of log G’ and log G’’ with change in frequency were obtained in order to 207
assess the viscoelastic nature of the sample. In the case of torque the critical stress values 208
at which there was a sudden drop in G’ values were noted which is also accompanied 209
with a sharp rise in Tan values. 210
Flow profile measurements (shear stress sweep) 211
The flow properties of protein solutions from fresh bigeye fish mince were measured 212
as a function of temperature using a Controlled Stress Rheometer (CSR Carri-Med model 213
CSL 500, Surrey, UK) with flow software. Extraction buffer was used as the solvent for 214
protein extraction. The concentrations of protein in the samples were 5, 10 and 20 mg/ml 215
and the measurements were made at 30o and 40
oC. The sample was equilibrated for 5 min 216
before the shearing experiment was started. The measuring geometry used was a 4 cm 217
cone and plate with a truncation of 59µm. The range of stress applied varied between 4 to 218
5 Pa depending on the angular velocity in the preshear experiment. The ascent and 219
descent time were 2 min each. Shear rate sweeps of the protein solutions at 30o
and 40oC 220
were performed in triplicate and average values were taken for plotting. A flow curve was 221
obtained by plotting log10 viscosity and log10 shear rate values. 222
223
224
11
RESULTS AND DISCUSSION 225
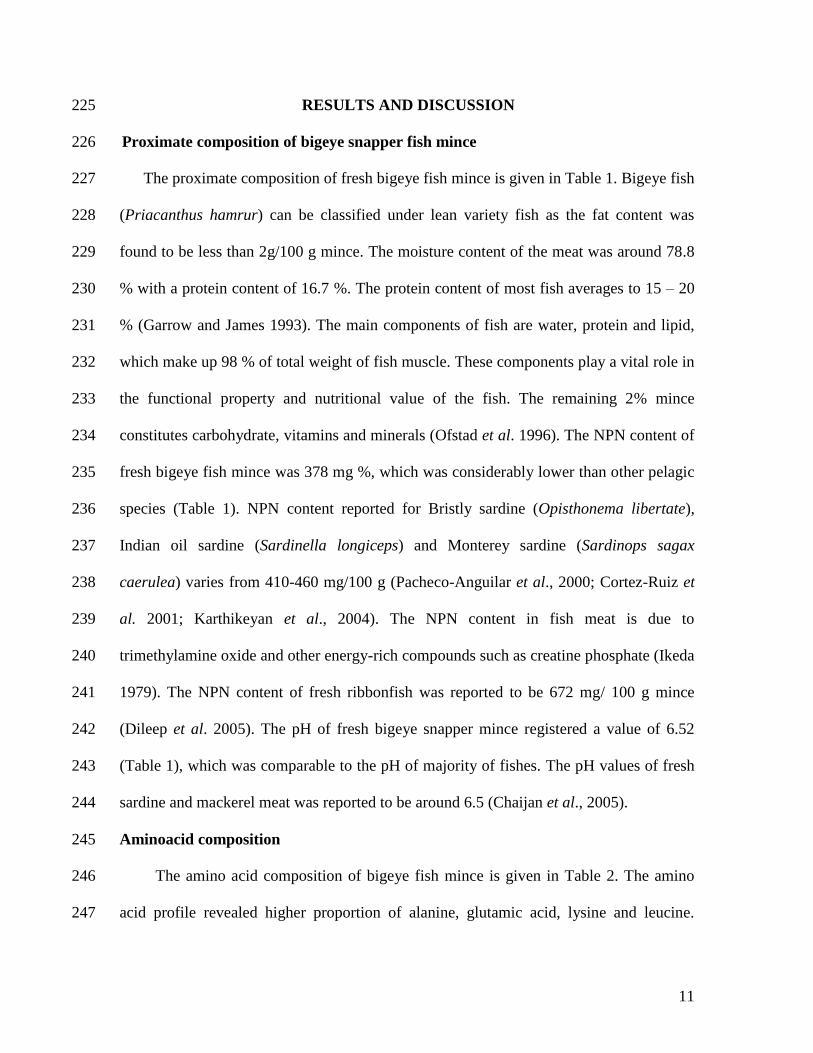
Proximate composition of bigeye snapper fish mince 226
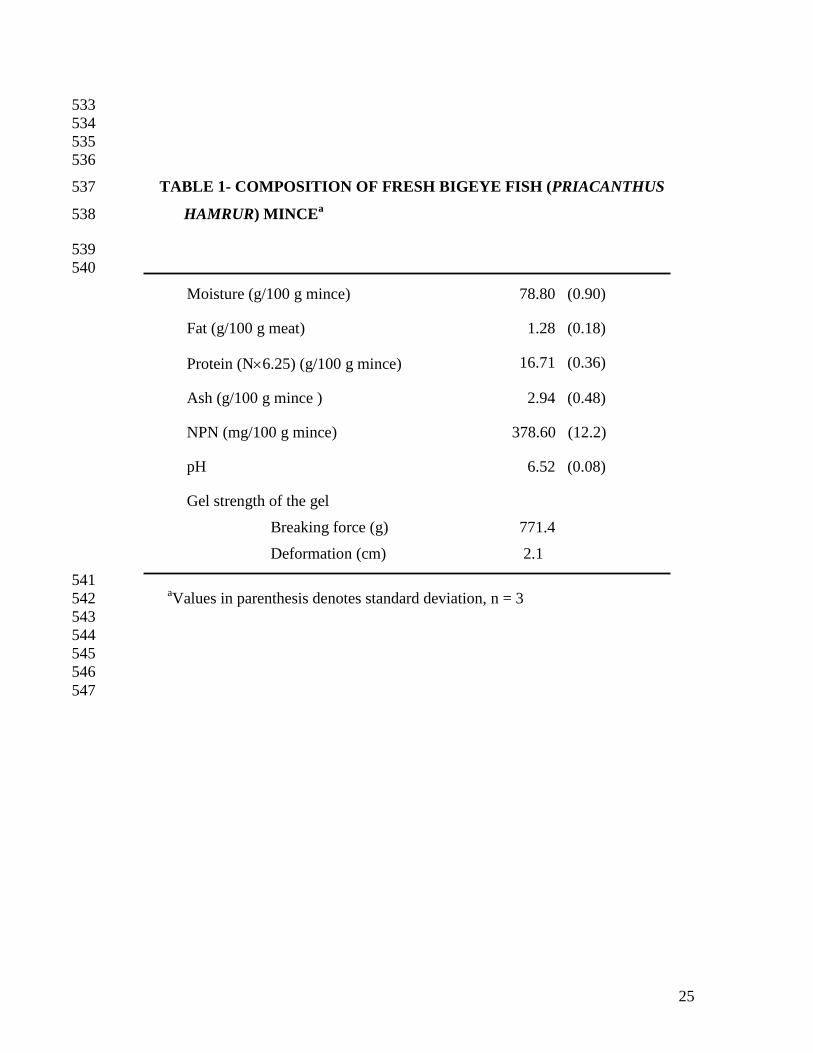
The proximate composition of fresh bigeye fish mince is given in Table 1. Bigeye fish 227
(Priacanthus hamrur) can be classified under lean variety fish as the fat content was 228
found to be less than 2g/100 g mince. The moisture content of the meat was around 78.8 229
% with a protein content of 16.7 %. The protein content of most fish averages to 15 – 20 230
% (Garrow and James 1993). The main components of fish are water, protein and lipid, 231
which make up 98 % of total weight of fish muscle. These components play a vital role in 232
the functional property and nutritional value of the fish. The remaining 2% mince 233
constitutes carbohydrate, vitamins and minerals (Ofstad et al. 1996). The NPN content of 234
fresh bigeye fish mince was 378 mg %, which was considerably lower than other pelagic 235
species (Table 1). NPN content reported for Bristly sardine (Opisthonema libertate), 236
Indian oil sardine (Sardinella longiceps) and Monterey sardine (Sardinops sagax 237
caerulea) varies from 410-460 mg/100 g (Pacheco-Anguilar et al., 2000; Cortez-Ruiz et 238
al. 2001; Karthikeyan et al., 2004). The NPN content in fish meat is due to 239
trimethylamine oxide and other energy-rich compounds such as creatine phosphate (Ikeda 240
1979). The NPN content of fresh ribbonfish was reported to be 672 mg/ 100 g mince 241
(Dileep et al. 2005). The pH of fresh bigeye snapper mince registered a value of 6.52 242
(Table 1), which was comparable to the pH of majority of fishes. The pH values of fresh 243
sardine and mackerel meat was reported to be around 6.5 (Chaijan et al., 2005). 244
Aminoacid composition 245
The amino acid composition of bigeye fish mince is given in Table 2. The amino 246
acid profile revealed higher proportion of alanine, glutamic acid, lysine and leucine. 247
12
Bigeye fish meat was having higher proportion of white / light meat. The red meat of fish 248
has more glycine, leucine, arginine and phenylalanine whereas; white / light meat has 249
more lysine, aspartic acid and glutamic acid (Garrow and James 1993). The major amino 250
acids present in blue whiting and codfish were glutamic acid, aspartic acid, lysine and 251
leucine (Dagbjartsson 1975). Fish contains significant amounts of all essential amino 252
acids, particularly lysine. The lysine content of bigeye fish mince was 9.79 as percentage 253
of amino acids. Fish protein can be used therefore to complement the amino acid pattern 254
and improve the overall protein quality of a mixed diet. 255
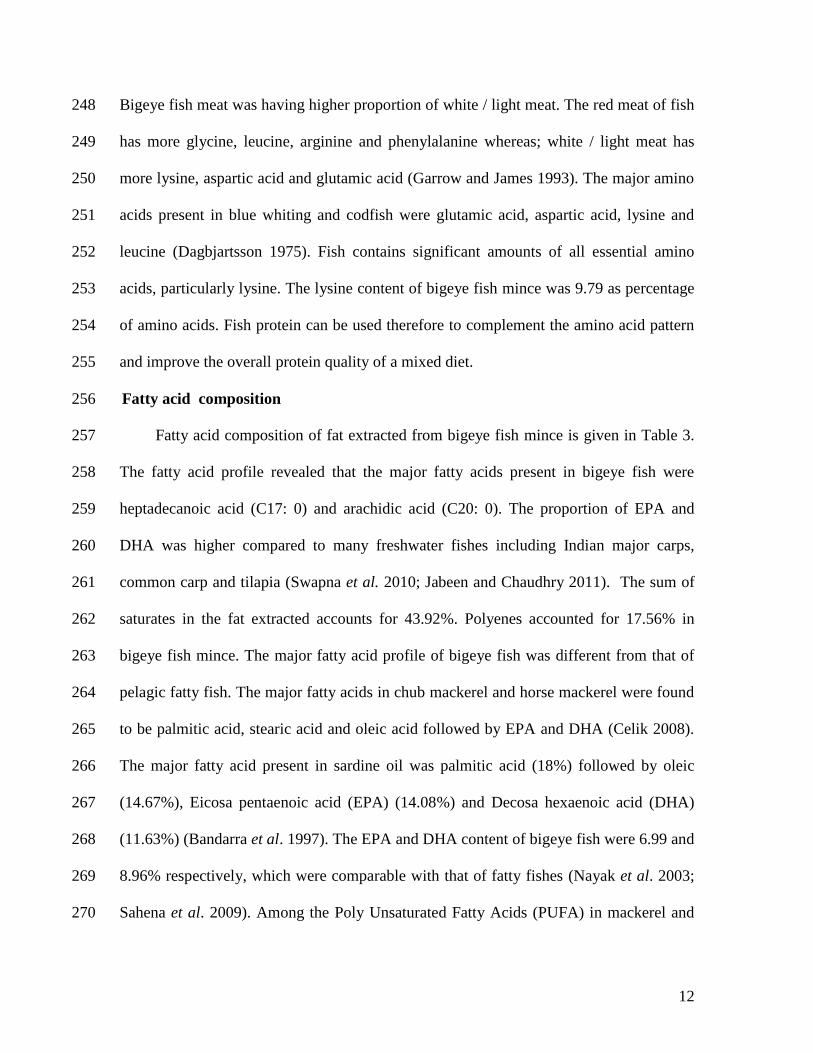
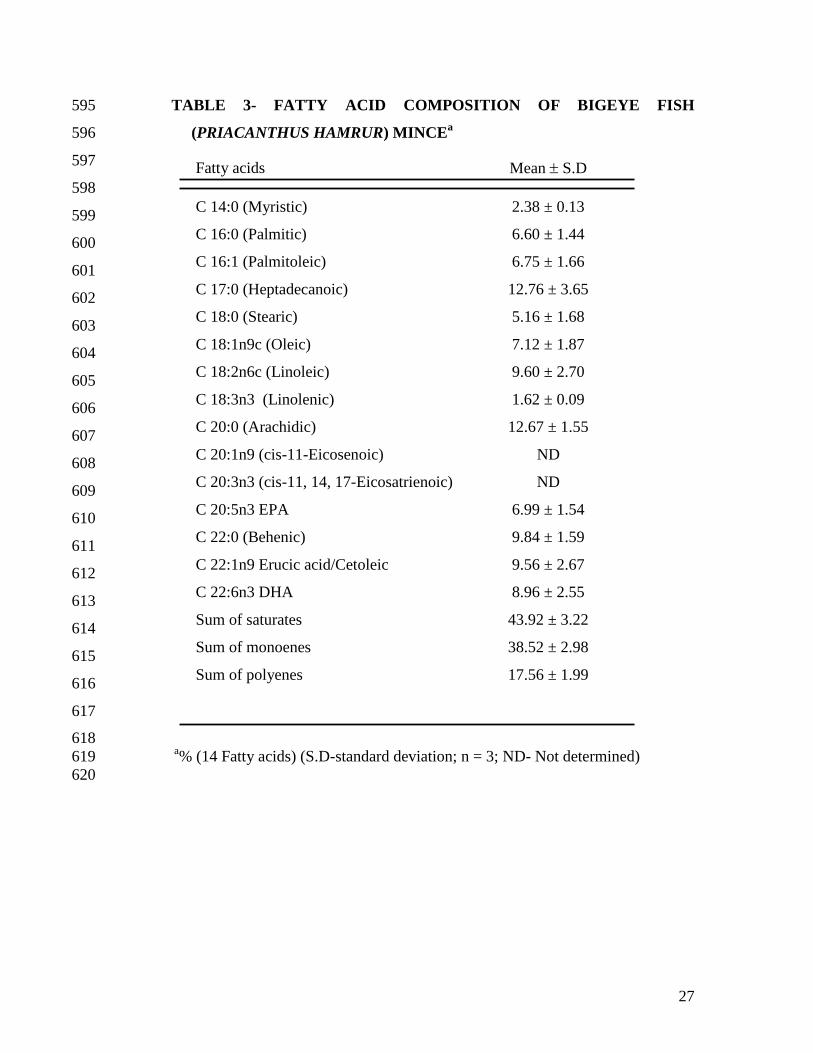
Fatty acid composition 256
Fatty acid composition of fat extracted from bigeye fish mince is given in Table 3. 257
The fatty acid profile revealed that the major fatty acids present in bigeye fish were 258
heptadecanoic acid (C17: 0) and arachidic acid (C20: 0). The proportion of EPA and 259
DHA was higher compared to many freshwater fishes including Indian major carps, 260
common carp and tilapia (Swapna et al. 2010; Jabeen and Chaudhry 2011). The sum of 261
saturates in the fat extracted accounts for 43.92%. Polyenes accounted for 17.56% in 262
bigeye fish mince. The major fatty acid profile of bigeye fish was different from that of 263
pelagic fatty fish. The major fatty acids in chub mackerel and horse mackerel were found 264
to be palmitic acid, stearic acid and oleic acid followed by EPA and DHA (Celik 2008). 265
The major fatty acid present in sardine oil was palmitic acid (18%) followed by oleic 266
(14.67%), Eicosa pentaenoic acid (EPA) (14.08%) and Decosa hexaenoic acid (DHA) 267
(11.63%) (Bandarra et al. 1997). The EPA and DHA content of bigeye fish were 6.99 and 268
8.96% respectively, which were comparable with that of fatty fishes (Nayak et al. 2003; 269
Sahena et al. 2009). Among the Poly Unsaturated Fatty Acids (PUFA) in mackerel and 270
13
horse mackerel DHA was found to be predominant. This may be due to the type of food 271
intake available to these species (Bandarra et al. 2001). The EPA and DHA content of 272
Atlantic mackerel were nearly 6.23 and 14.19% respectively (Leu et al. 1981; Soriguer et 273
al. 1996). Fatty fish like mackerel contains a high percentage of PUFA, where the sum of 274
saturates will be usually less than 30% (Leu et al. 1981). 275
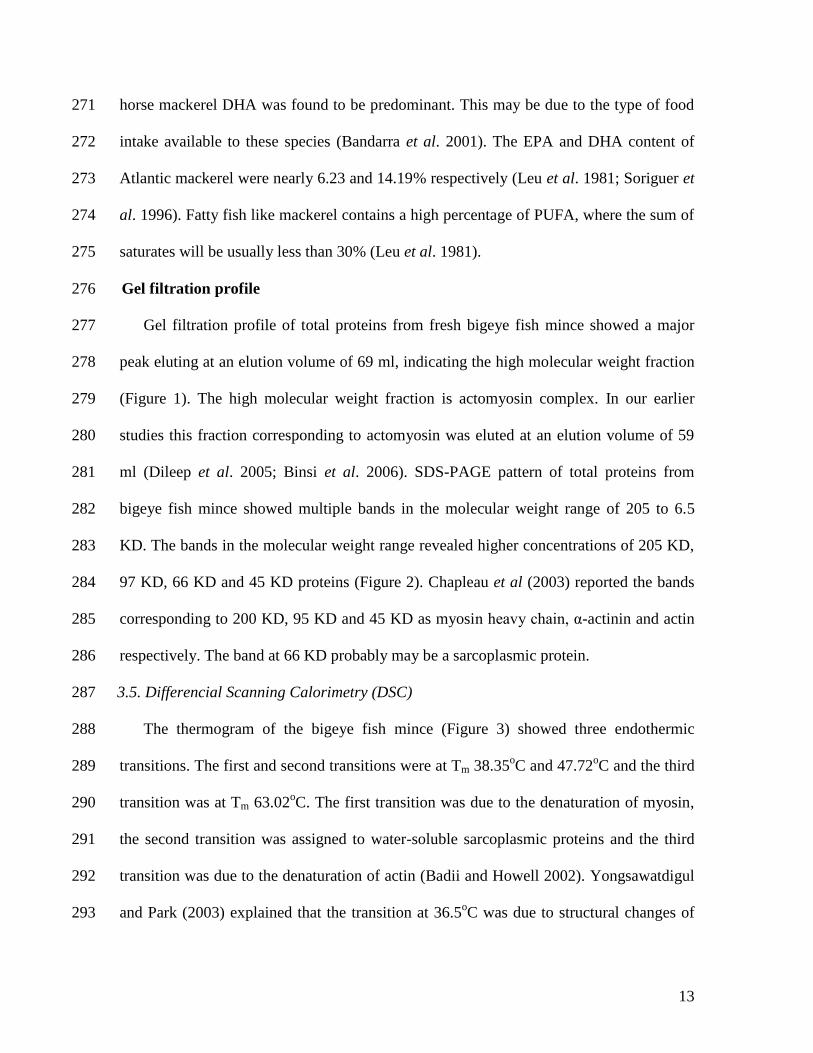
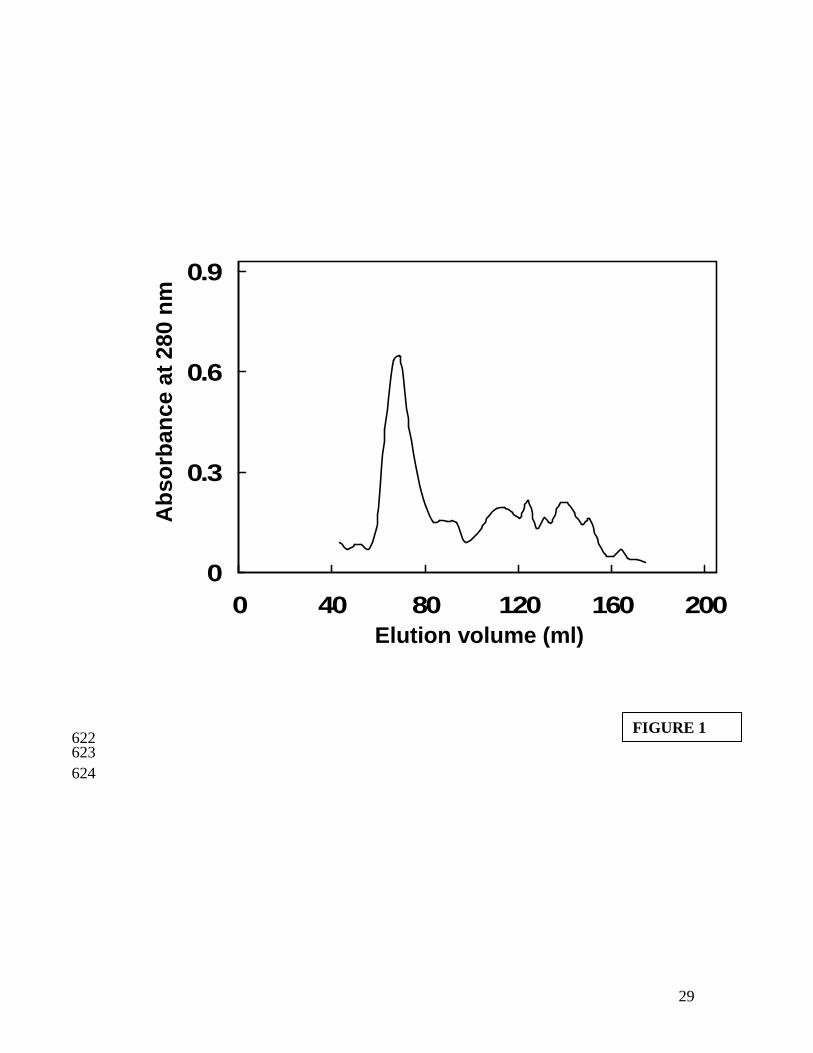
Gel filtration profile 276
Gel filtration profile of total proteins from fresh bigeye fish mince showed a major 277
peak eluting at an elution volume of 69 ml, indicating the high molecular weight fraction 278
(Figure 1). The high molecular weight fraction is actomyosin complex. In our earlier 279
studies this fraction corresponding to actomyosin was eluted at an elution volume of 59 280
ml (Dileep et al. 2005; Binsi et al. 2006). SDS-PAGE pattern of total proteins from 281
bigeye fish mince showed multiple bands in the molecular weight range of 205 to 6.5 282
KD. The bands in the molecular weight range revealed higher concentrations of 205 KD, 283
97 KD, 66 KD and 45 KD proteins (Figure 2). Chapleau et al (2003) reported the bands 284
corresponding to 200 KD, 95 KD and 45 KD as myosin heavy chain, α-actinin and actin 285
respectively. The band at 66 KD probably may be a sarcoplasmic protein. 286
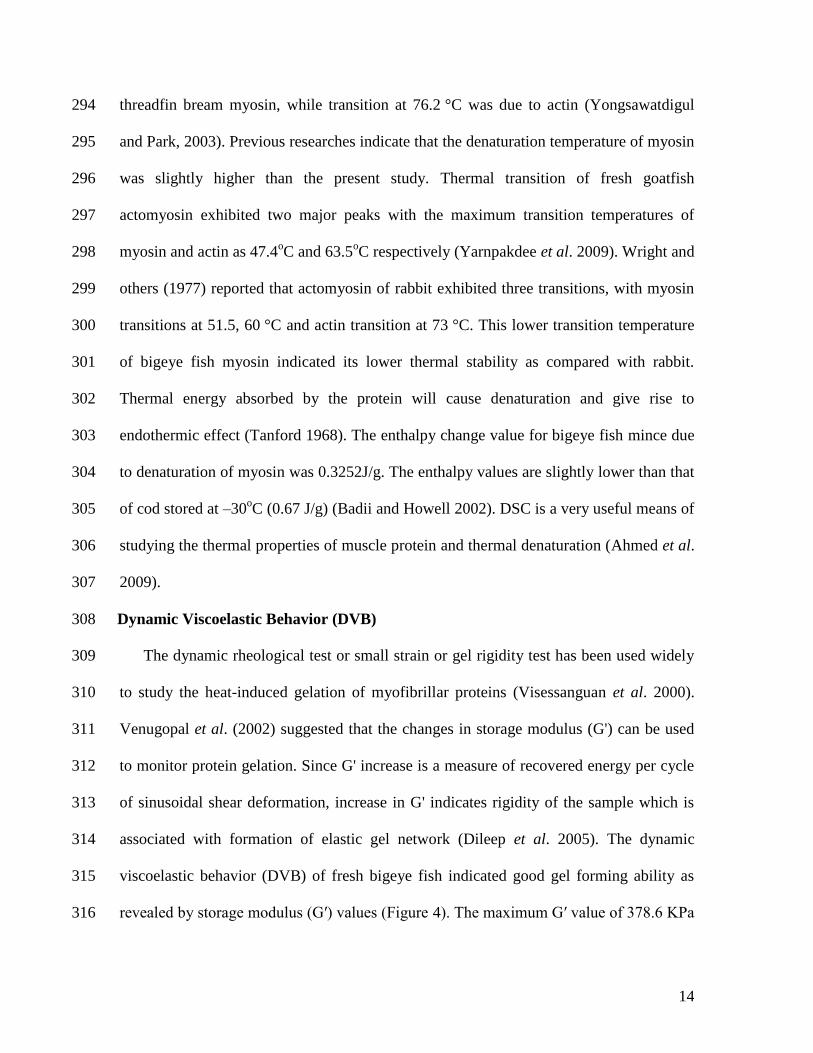
3.5. Differencial Scanning Calorimetry (DSC) 287
The thermogram of the bigeye fish mince (Figure 3) showed three endothermic 288
transitions. The first and second transitions were at Tm 38.35oC and 47.72
oC and the third 289
transition was at Tm 63.02oC. The first transition was due to the denaturation of myosin, 290
the second transition was assigned to water-soluble sarcoplasmic proteins and the third 291
transition was due to the denaturation of actin (Badii and Howell 2002). Yongsawatdigul 292
and Park (2003) explained that the transition at 36.5oC was due to structural changes of 293
14
threadfin bream myosin, while transition at 76.2 °C was due to actin (Yongsawatdigul 294
and Park, 2003). Previous researches indicate that the denaturation temperature of myosin 295
was slightly higher than the present study. Thermal transition of fresh goatfish 296
actomyosin exhibited two major peaks with the maximum transition temperatures of 297
myosin and actin as 47.4oC and 63.5
oC respectively (Yarnpakdee et al. 2009). Wright and 298
others (1977) reported that actomyosin of rabbit exhibited three transitions, with myosin 299
transitions at 51.5, 60 °C and actin transition at 73 °C. This lower transition temperature 300
of bigeye fish myosin indicated its lower thermal stability as compared with rabbit. 301
Thermal energy absorbed by the protein will cause denaturation and give rise to 302
endothermic effect (Tanford 1968). The enthalpy change value for bigeye fish mince due 303
to denaturation of myosin was 0.3252J/g. The enthalpy values are slightly lower than that 304
of cod stored at –30oC (0.67 J/g) (Badii and Howell 2002). DSC is a very useful means of 305
studying the thermal properties of muscle protein and thermal denaturation (Ahmed et al. 306
2009). 307
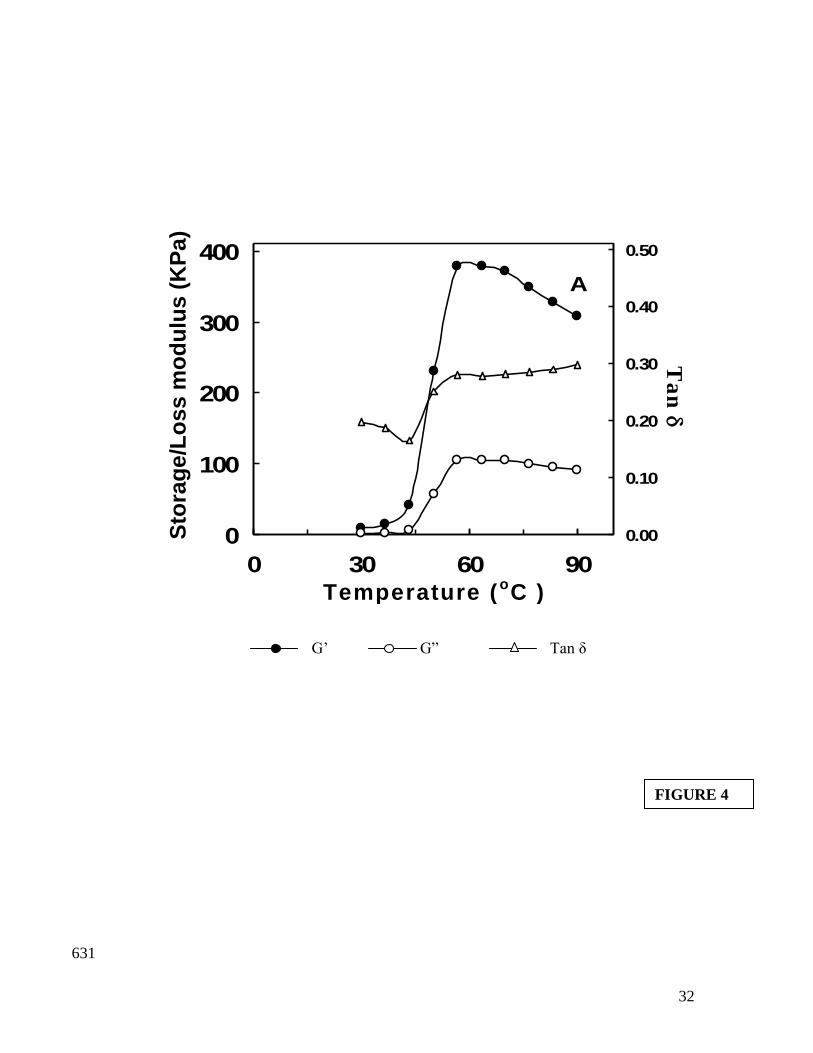
Dynamic Viscoelastic Behavior (DVB) 308
The dynamic rheological test or small strain or gel rigidity test has been used widely 309
to study the heat-induced gelation of myofibrillar proteins (Visessanguan et al. 2000). 310
Venugopal et al. (2002) suggested that the changes in storage modulus (G') can be used 311
to monitor protein gelation. Since G' increase is a measure of recovered energy per cycle 312
of sinusoidal shear deformation, increase in G' indicates rigidity of the sample which is 313
associated with formation of elastic gel network (Dileep et al. 2005). The dynamic 314
viscoelastic behavior (DVB) of fresh bigeye fish indicated good gel forming ability as 315
revealed by storage modulus (G′) values (Figure 4). The maximum G′ value of 378.6 KPa 316

15
was attained at 63.6oC and two transitions were evident at 43.3
oC and 63.6
oC 317
respectively. This further confirms the transition temperatures of different fractions 318
obtained from DSC. The loss modulus (G′′) value also increased during heating; 319
however, the magnitude was less than that of G′ values. This is an indication of the 320
formation of a viscoelastic gel network. The maximum rate of increase in G′ values were 321
found in the temperature range of 43.3o to 56.7
oC. The maximum rate of increase in G’ 322
value below 60°C is likely to involve protein unfolding and formation of disulfide and 323
hydrophobic interaction (Niwa 1992). 324
The gelation process was also monitored by measuring changes in stress-strain phase 325
angle during oscillatory test and indicates the temperature at which transition from sol-gel 326
took place. The tan δ values were obtained by taking a ratio of G′′/G′ during isothermal 327
heating. This transition for fresh bigeye fish meat occurred at 43.3oC and 63.6
oC (Figure 328
4). The first transition has been attributed to the tail of myosin molecule and the transition 329
at higher temperature to that of head of myosin molecule (Sano et al. 1988; Sano et al. 330
1990). 331
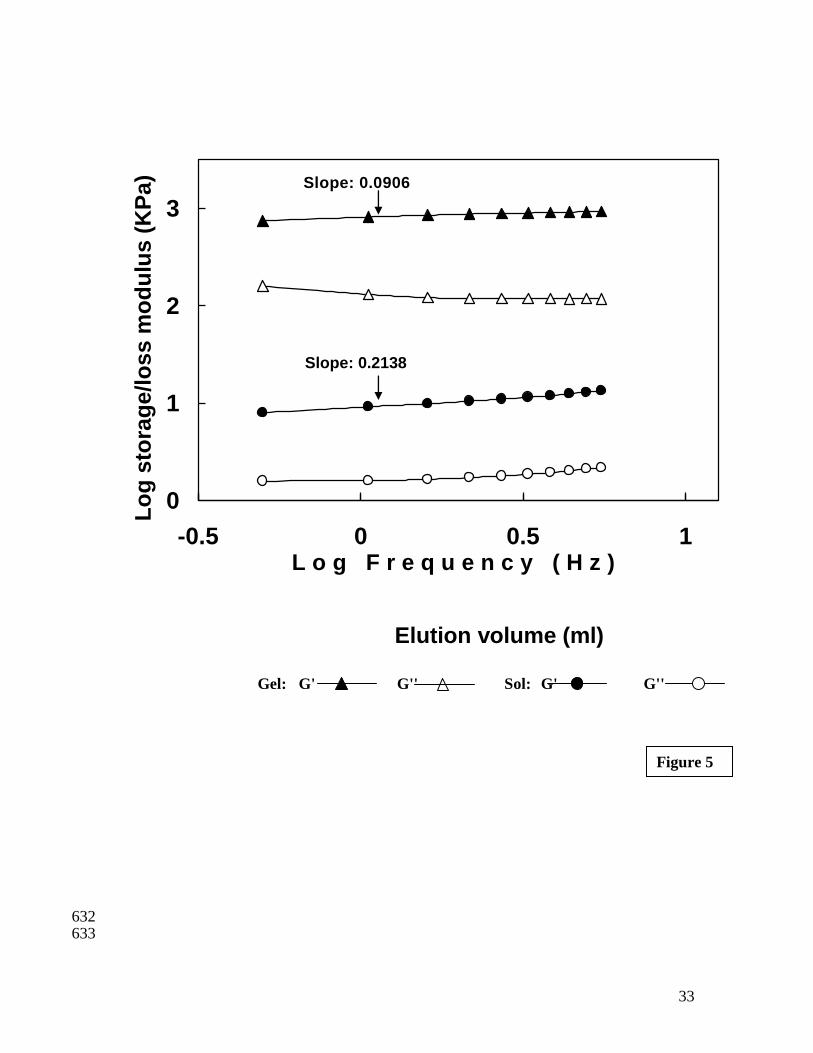
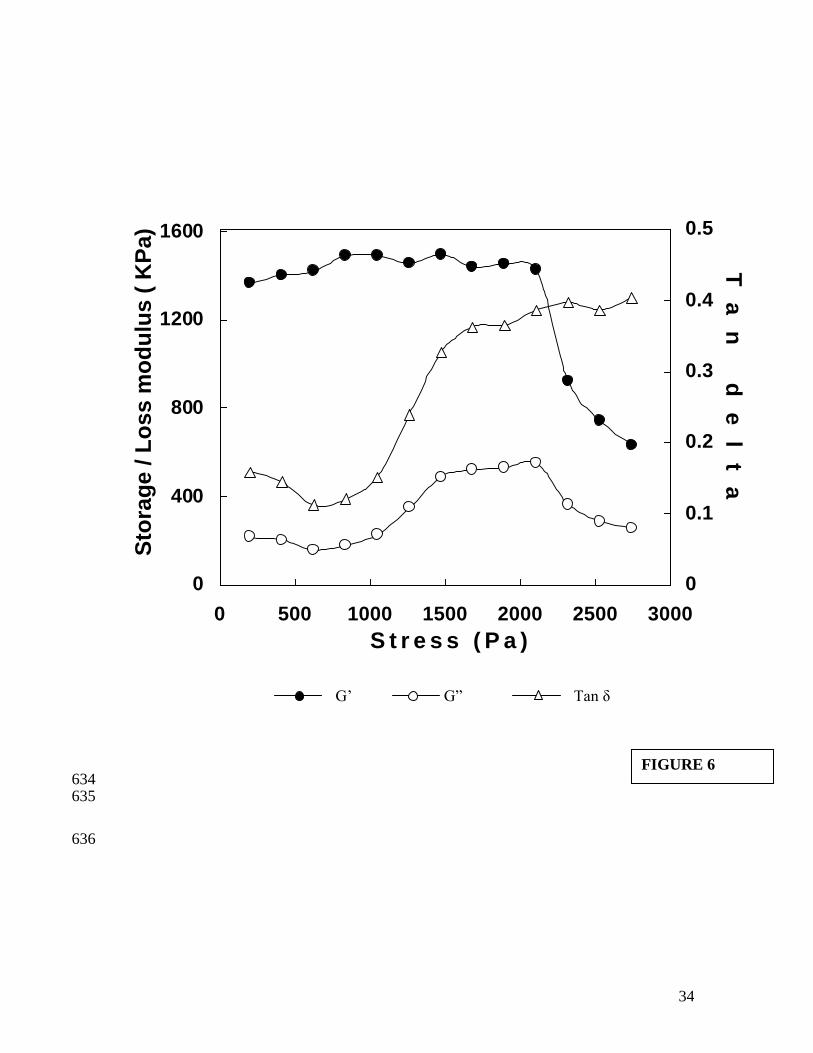
The slope of regression of G' values of gel obtained after temperature sweep is given 332
in Figure 5. A lower value of the slope (0.0906) in the frequency sweep can be taken as 333
an index of better gel formation (Dileep et al. 2005; Kim et al. 2005). This was further 334
confirmed by performing a torque sweep, which indicated a maximum stress tolerance 335
limit of 1259 Pa (Figure 6). At a stress value of 1259 Pa there was a sharp increase in Tan 336
values indicating a more viscous nature than elastic. The gel strength of gel as 337
measured by large strain test was 771.4 g (breaking force) at a deformation of 2.1 cm 338
16
(Table 1). The frequency sweep, torque sweep and large strain test data clearly 339
demonstrates the higher gelling ability of bigeye snapper fish. 340
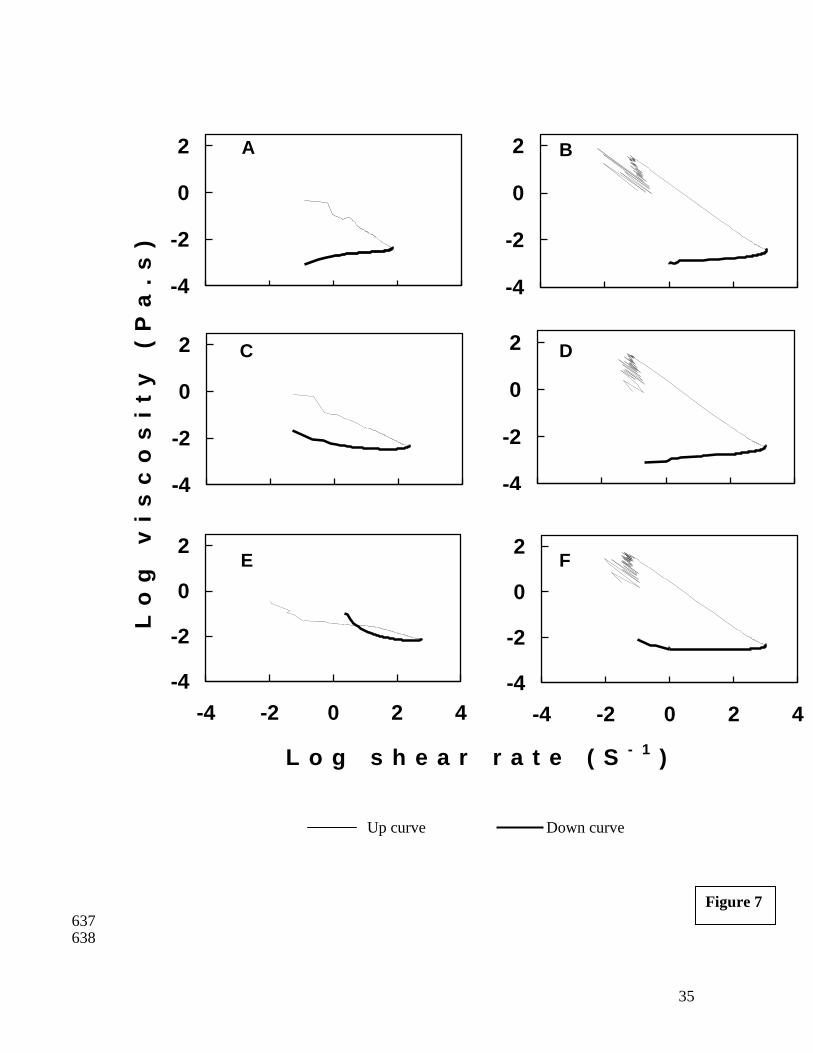
3.7. Flow profile measurements (shear stress sweep) 341
The flow profile of the myofibrillar proteins at specific temperature provides 342
information on resistance to shearing thereby indicating any structural impairment. Shear 343
stress and shear rate data were determined for total proteins from bigeye fish for protein 344
concentration of 5, 10 and 15 mg/ml at 30oC and 40
oC. The flow behavior of total 345
proteins from fresh bigeye fish mince at all the concentrations and temperatures revealed 346
pseudoplastic behavior (Figure 7). A decrease in thixotropic area with increase in protein 347
concentration was evident at both the temperatures studied; however, it was more 348
prominent at 30oC. Minimum thixotropic area was recorded at 30
oC for a concentration 349
of 15 mg/ml indicating minimum damage to the structure of protein due to shearing. At 350
40oC higher degree of structure impairment of molecules was evident at all the protein 351
concentrations studied as revealed from larger thixotropic area. The shear stress sweep of 352
acidified shark gel dispersion at a protein concentration of 6.8 mg/ml showed large 353
thixotropic area at 40o, 50
o and 60
oC (Venugopal et al. 2002). In the present study flow 354
measurements could not be carried out at above 50oC, as there was extensive coagulation 355
and difficulty in shearing the sample was experienced. 356
All the samples exhibited shear thinning behavior as indicated by shear stress - shear 357
rate data. The maximum stress applied for shearing the sample was 5Pa. Protein solutions 358
at all concentration and temperatures exhibited a yield stress value and thereafter showing 359
shear thinning / pseudoplastic behavior. It has been recognized that pseudoplasticity 360
represents an irreversible structural breakdown and the decrease in viscosity occurs as a 361

17
result of molecular alignment (Liu et al. 2008). The flow profile at 40°C showed a 362
different behavior (Figure 7B, 7D and 7F) showing an upswing in viscosity at lower shear 363
rate values. This may be due to higher protein-protein interaction at 40oC as also evident 364
from DSC and DVB data. The upswing in viscosity values at low shear rates is also been 365
explained as indicative of an apparent yield stress (Rao and Tattiyakul 1999). 366
4. Conclusion 367
With the recent increase in bigeye snapper fish catch in commercial fish landing, it 368
becomes inevitable to improve its utilization for better economic returns. Utilization of 369
fish meat depends on the understanding of its composition and properties of the meat. 370
Higher content of essential amino acids especially lysine along with the presence of 371
higher proportion of EPA and DHA make this fish ideal in nutritional point of view. 372
Results obtained from small and large scale deformation analysis revealed that fresh 373
bigeye fish has good gel forming ability. Therefore bigeye snapper fish can be considered 374
as a suitable species for surimi production and also can be used in many formulated 375
products. Further studies are required to determine the influence of water washing on 376
enhancing the functionality of bigeye snapper fish mince. 377
Acknowlegements 378
The authors gratefully acknowledge the funding received from European 379
Commission, Brussels, under contract no.ICA4-CT-2001-10032 for carrying out this 380
work. 381
382
383
384
18
References 385
1. AHMED, J., VARSHNEY, S.K. and RAMASWAMY, H.S. 2009. Effect of high 386
pressure treatment on thermal and rheological properties of lentil flour slurry. 387
LWT-Food Sci. Technol. 42(9), 1538-44. 388
2. AOAC, 2006. Official Methods of Analysis of AOAC International. 18th
Edition. 389
Conniff, P. (Ed.). Association of Official and Analytical Chemists International, 390
Virginia, USA 391
3. BADII, F. and HOWELL, N.K. 2002. Changes in the texture and structure of cod 392
and haddock fillets during frozen storage. Food Hydrocol. 16, 313-319. 393
4. BANDARRA, N.M., BATISTA, I., NUNES, M.L. and EMPIS, J.M. 2001. 394
Seasonal variation in the chemical composition of horse mackerel (Trachurus 395
trachurus). Euro. Food Research Technol. 212, 535-39. 396
5. BANDARRA, N.M., BATISTA, I., NUNES, M.L., EMPIS J.M. and CHRISTIE, 397
W.W. 1997. Seasonal changes in lipid composition of sardine Sardine pilchardus. 398
J. Food Sci. 62 (1), 40-43. 399
6. BARNES, H.A. 2000. Shear thinning liquids. In A handbook of elementary 400
rheology (H.A. Barnes, ed) pp. 55-60, University of Wales Institute of Non- 401
Newtonian fluid mechanics, Aberystwyth, Wales. 402
7. BENJAKUL, S., VISESSANGUAN, W., RIEBROY, S., ISHIZAKI, S. and 403
TANAKA, M. 2002. Gel-forming properties of surimi produced from bigeye 404
snapper, Priacanthus tayenus and Priacanthus macracanthus, stored in ice. J. Sci. 405
Food Agric. 82, 1442–51. 406

19
8. BIDLINGMEYER, B.A., COHEN, S.A. and TARVIN, T.L. 1984. Rapid analysis 407
of amino acids using pre-column derivatization. J. Chromatography. 336, 93-104. 408
9. BINSI, P.K., SHAMASUNDAR, B.A. and DILEEP, A.O. 2006.Some physic-409
chemical and functional properties of actomyosin from green mussel (Perna 410
viridis). Food Res. Int. 39,992-1001. 411
10. Celik, M. 2008. Seasonal changes in the proximate chemical compositions and 412
fatty acids of chub mackerel (Scomber japonicus) and horse mackerel (Trachurus 413
trachurus) from the north eastern mediterranean sea. Inter. J. Food Sci. Technol. 414
43, 933-38. 415
11. CHAIJAN, M., BENJAKUL, S., VISESSANGUAN, W. and FAUSTMAN, C. 416
2005. Changes of pigments and color in sardine (Sardinella gibbosa) and 417
mackerel (Rastrelliger kanagurta) muscle during iced storage. Food Chem. 93, 418
607-617. 419
12. CHAPLEAU, N., MARIE, I. AND DE LAMBALLERIE-ANTON, M. 2003. 420
Changes in myofibrillar proteins interactions and rheological properties induced 421
by high-pressure processing. Eur. Food Res.Technol. 216, 470-476. 422
13. CORTES-RUIZ, J.A., PACHECO-AGUILLAR, R., GARCIA-SANCHEZ, G. 423
and LUGO-SANCHEZ, M.E. 2001. Functional characterization of a protein 424
concentrate from bristly sardine made under acidic conditions. J. Aquat. Food 425
Prod. Technol. 10, 5–23. 426
14. DAGBJARTSSON, B. 1975. Utilization of blue whiting, Micromesistius 427
poutassou, for human consumption. J. Fish. Res. Board Can. 32 (6), 747-51. 428

20
15. DILEEP, A.O., SHAMASUNDAR, B.A., BINSI, P.K., BADII, F. and HOWELL, 429
N.K. 2005. Effect of ice storage on the physicochemical and dynamic viscoelastic 430
properties of ribbonfish (Trichiurus spp.) meat. J. Food Sci. 70(9), 537-45 431
16. FAO. 2002. FAO Yearbook of fishery statistics. Vol 92/1. 432
17. GARROW, J.S., JAMES, W.P.T. 1993. Human Nutrition and Dietetics. 433
Livingstone, London: Churchill 434
18. GLICKSMAN, M.1969. Gum Technology in the Food Industry. Academic Press 435
New York and London. p 359-397. 436
19. IKEDA, S. 1979. Other organic components and inorganic components. In 437
Advances in fish science and technology (J.J. Connell, ed.) pp. 111–112, Fishing 438
News Books, London. 439
20. JABEEN, F. and CHAUDHRY, A.S. 2011.Chemical compositions and fatty acid 440
profiles of three freshwater fish species. Food Chem.125, 991-996. 441
21. KARTHIKEYAN, M., SHAMASUNDAR, B.A., MATHEW, S., RAMESH 442
KUMAR, P. and PRAKASH, V. 2004. Physico-chemical and functional 443
properties of proteins from pelagic fatty fish (Sardinella longiceps) as a function 444
of water washing. International journal of food properties. 7(3): 353-365. 445
22. KIM, B, PARK, J.W. and YOON, W.B. 2005. Rheology and texture properties of 446
surimi gels. In Surimi and surimi seafood (J.W. Park, ed.) pp. 451–576. CRC 447
Press, taylor & Francis Group, Boca Raton.. 448
23. KO, W.C., YU, C.C. and HSU, K.C. 2007. Contribution of hydrophobicity, net 449
charge, and sulfhydryl groups to thermal properties of ovalbumin. LWT-Food Sci 450
Technol. 40, 1316-20. 451
21
24. LAEMMLI, U.K. 1970. Cleavage of structural proteins during the assembly of the 452
head of bacteriophage T4. Nature 227, 680–85. 453
25. LEU, S.S., JHAVERI, S.N., KARAKOLTSIDIS, P.A. and CONSTANTINIDES, 454
S.M.1981. Atlantic mackerel (Scomber scombrus): Seasonal variation in 455
proximate composition and distribution of chemical nutrients. J. Food. Sci. 49, 456
1635-38. 457
26. LIU, R., ZHAO, S., XIONG, S., QIU, C. and XIE, B. 2008. Rheological 458
properties of fish actomyosin and pork actomyosin solutions. J Food Eng. 85(2), 459
173-179. 460
27. MORRISSEY, M.T. and TAN, S.M. 2000. World resources of surimi. In, editor. 461
Surimi and Surimi Seafood (J. Park, ed.) pp. 1-21, Marckel Decker, New York. 462
28. NAYAK, J., NAIR, P.G.V., AMMU, K. AND MATHEW, S. Lipase 463
activity in different tissues of four species of fish: rohu (Labeo rohita 464
Hamilton), oil sardine (Sardinella longiceps Linnaeus), mullet (Liza 465
subviridis Valenciennes) and Indian mackerel (Rastrelliger kanagurta 466
Cuvier). J.Sci.Food Agric.83, 1139-1142. 467
29. NIWA, E. 1992. Chemistry of surimi gelation. In Surimi technology (T.C. Lanier, 468
C.M. Lee, eds) pp. 389–427, Marcel Dekker, New York 469
30. OFSTAD, R., EGELANDSDAL, B., KIDMAN, S., MYKLEBUST, R., OLSEN, 470
R.L. and HERMANSSON, A.M. 1996. Liquid loss as affected by post mortem 471
ultra structural changes in fish muscle: cod (Gadus morhua L) and salmon (Salmo 472
salar). J. Sci. Food Agric. 71, 301-12. 473

22
31. PACHECO-AGUILLAR, R., LUGO-SANCHEZ, M.E. and 474
ROBBLESBURGUENO, M.R. 2000. Postmortem biochemical and functional 475
characteristic of Monterey sardine muscle stored at 0°C. J. Food Sci. 65, 40–47. 476
32. RAO, M.A. and TATTIYAKUL, J. 1999. Granule size and rheological behavior 477
of heated tapioca starch dispersions. Carbohydr Polym 38: 123–32. 478
33. SAHENA, F., ZAIDUL, I.S.M., JINAP, S., YAZID, A.M., KHATIB, A. and 479
NORULAINI, N.A.N. 2010. Fatty acid compositions of fish oil extracted from 480
different parts of Indian mackerel (Rastrelliger kanagurta) using various 481
techniques of supercritical CO2 extraction. Food Chem. 120 , 789-885. 482
34. SANO, T., NOGUCHI, S.F., MATSUMOTO, J.J. and TSUCHIYA, T. 1990. 483
Thermal gelation characteristics of myosin sub fragments. J. Food Sci. 55, 55-58. 484
35. SANO, T., NOGUCHI, S.F., TSUCHIYA, T. and MATSUMOTO, J.J. 1988. 485
Dynamic viscoelastic behaviour of natural actomyosin and myosin during thermal 486
gelation. J. Food Sci. 53, 924-28. 487
36. SCHMARR, H.G., GROSS, H.B. and SHABAMOTO, T. 1996. Analysis of polar 488
cholesterol oxidation products, evaluation of a new method involving 489
transesterification, solid phase extraction and gas chromatography. J Agric. Food 490
Chem. 44, 512-17. 491
37. SIVAKAMI, S., VIVEKANANDAN, E., RAJE, S.G., SHOBHA, J.K. and 492
RAJKUMAR, U. 2003. Lizardfishes, Pomfrets and Bullseye. In Status of 493
exploited marine fishery resources of India (M.M. Joseph, A.A. Jayaprakash, 494
eds.) pp. 141-57, Central Marine Fisheries Research Institute, Kochi. 495
23
38. SOMVANSHI, V.S. 2001. Problems and prospects of deepsea and far sea fishing. 496
In Sustainable Indian fisheries (T.J. Pandian, ed.) pp. 71-87, National Academy of 497
Agricultural Sciences, New Delhi. 498
39. SORIGUER, F., SERNA, S., VALVERDE, E., HERNANDO, J., MARTIN 499
REYES, A., SORIGUER, M., PAREJA, A., TINAHONES, F. and ESTEVA, I. 500
1996. Fat, protein and caloric content of different fish, seafood and mollusks, 501
Atlantic and Mediterranean habitually consumed in the south of Spain. Nutrition 502
Hospitalaria. 11 (4), 245-57. 503
40. SUZUKI T. 1981. Fish and krill protein: processing technology. UK: Applied 504
Science Publication. 260 p. 505
41. SWAPNA, H. C., RAI, A. K., BHASKAR, N. and SACHINDRA, N. M. 2010. 506
Lipid classes and fatty acid profile of selected Indian freshwater fishes . J. Food 507
Sci. Technol. 47, 394-400. 508
42. TANFORD, C. 1968. Protein denaturation. Part B. The transition from native to 509
denatured state. In Advances in Protein Chemistry, pp. 251, Academic Press, New 510
York. 511
43. VELANKAR, N.L. and GOVINDAN, TK. 1958. A preliminary study of the 512
distribution of non protein nitrogen in some marine fishes and invertebrates. Proc. 513
Indian Acad. Sci. 47, 202–9. 514
44. VENUGOPAL, V., KAKATKAR, A., BONGIRWAR, D.R., KARTHIKEYAN, 515
M., MATHEW, S. and SHAMASUNDAR, B.A. 2002. Gelation of shark meat 516
under mild acidic conditions: physicochemical and rheological characterization of 517
the gel. J. Food Sci. 67, 2681–86. 518

24
45. VISESSANGUAN, S., OGAWA, M., NAKAI, S. and AN, H. 2000. 519
Physiological changes and mechanism of heat induced gelation of arrowtooth 520
flounder. J. Agri. Food Chem. 48, 1016–23. 521
46. WRIGHT, D.J, LEACHM, I.B. and WILDING, P. 1977. Differential scanning 522
calorimetric studies of muscle and its constituent proteins. J. Sci. Food Agric. 28: 523
557-64. 524
47. YARNPAKDEE, S., BENJAKUL, S., VISESSANGUAN, W. and 525
KIJROONGROJANA, K. 2009. Thermal properties and heat-induced aggregation 526
of natural actomyosin extracted from goatfish (Mulloidichthys martinicus) muscle 527
as influenced by iced storage. Food Hydrocol. 23(7): 1779-84. 528
48. YONGSAWATDIGUL, J. and PARK, J.W. 2003. Thermal denaturation and 529
aggregation of threadfin bream actomyosin. Food Chem. 83, 409-16. 530
531
532
25
533
534
535
536
TABLE 1- COMPOSITION OF FRESH BIGEYE FISH (PRIACANTHUS 537
HAMRUR) MINCEa 538
539
540
Moisture (g/100 g mince) 78.80 (0.90)
Fat (g/100 g meat) 1.28 (0.18)
Protein (N6.25) (g/100 g mince) 16.71 (0.36)
Ash (g/100 g mince ) 2.94 (0.48)
NPN (mg/100 g mince) 378.60 (12.2)
pH 6.52 (0.08)
Gel strength of the gel
Breaking force (g)
Deformation (cm)
771.4
2.1
541 aValues in parenthesis denotes standard deviation, n = 3 542
543
544
545
546
547

26
TABLE 2- AMINO ACID COMPOSITION OF BIGEYE FISH MINCEa 548
549
550
551
552
553
554
555
556
557
558
559
560
561
562
563
564
565
566
567
568
569
570
571
572
573
574
575
576
577
578
579
580
581
582
583
584
585
586
587
588
589 590
591
a% Amino acids in fish (S.D – standard deviation, n = 3) 592
593
594
Amino acids
Bigeye fish (Priacanthus spp.)
Mean S.D
Asp 7.96 0.50
Glu 11.84 0.34
h. pro 0.29 0.10
Ser 4.42 0.08
Gly 7.51 0.34
His 0.45 0.05
Arg 5.79 0.02
Thr 5.14 0.16
Ala 13.04 0.41
Pro 1.80 0.46
Tyr 3.37 0.07
Val 6.48 0.20
Met 1.96 0.54
Cys 0.53 0.06
I leu 4.63 0.02
Leu 8.70 0.10
Phe 3.30 0.03
Trp 2.97 0.45
Lys 9.79 0.76
27
TABLE 3- FATTY ACID COMPOSITION OF BIGEYE FISH 595
(PRIACANTHUS HAMRUR) MINCEa 596
597
598
599
600
601
602
603
604
605
606
607
608
609
610
611
612
613
614
615
616
617
618 a% (14 Fatty acids) (S.D-standard deviation; n = 3; ND- Not determined) 619
620
Fatty acids Mean S.D
C 14:0 (Myristic) 2.38 ± 0.13
C 16:0 (Palmitic) 6.60 ± 1.44
C 16:1 (Palmitoleic) 6.75 ± 1.66
C 17:0 (Heptadecanoic) 12.76 ± 3.65
C 18:0 (Stearic) 5.16 ± 1.68
C 18:1n9c (Oleic) 7.12 ± 1.87
C 18:2n6c (Linoleic) 9.60 ± 2.70
C 18:3n3 (Linolenic) 1.62 ± 0.09
C 20:0 (Arachidic) 12.67 ± 1.55
C 20:1n9 (cis-11-Eicosenoic) ND
C 20:3n3 (cis-11, 14, 17-Eicosatrienoic) ND
C 20:5n3 EPA 6.99 ± 1.54
C 22:0 (Behenic) 9.84 ± 1.59
C 22:1n9 Erucic acid/Cetoleic 9.56 ± 2.67
C 22:6n3 DHA 8.96 ± 2.55
Sum of saturates 43.92 ± 3.22
Sum of monoenes 38.52 ± 2.98
Sum of polyenes 17.56 ± 1.99
28
LEGEND TO FIGURES
FIGURE 1: GEL FILTRATION PROFILE OF TOTAL PROTEINS FROM FRESH
BIGEYE SNAPPER FISH (PRIACANTHUS HAMRUR) MINCE
FIGURE 2: SDS-PAGE PATTERN OF TOTAL PROTEINS FROM FRESH
BIGEYE SNAPPER FISH (PRIACANTHUS HAMRUR) MINCE.
LANE 1: PROTEIN SAMPLE FROM FRESH FISH; LANE 2:
DUPLICATE OF LANE 1; LANE 3: STANDARD MARKER
FIGURE 3: DSC PROFILE OF BIGEYE SNAPPER FISH MINCE. THE
EXPERIMENT WAS CARRIED OUT AT A HEATING RATE OF
0.5OC/MIN.
FIGURE 4: DYNAMIC VISCOELASTIC BEHAVIOR OF FRESH BIGEYE
SNAPPER FISH MINCE IN THE TEMPERATURE RANGE OF 30o-
90oC.
FIGURE 5:
FREQUENCY SWEEP OF FRESH BIGEYE SNAPPER FISH MINCE
(SOL AND GEL) AT 30OC. THE GEL OBTAINED AFTER
TEMPERATURE SWEEP IS USED FOR FREQUENCY SWEEP.
FIGURE 6:
TORQUE SWEEP OF GEL FROM FRESH BIGEYE SNAPPER FISH
MINCE. TORQUE SWEEP WAS CARRIED OUT AT 30oC
FIGURE 7:
SHEAR STRESS SWEEP OF PROTEIN SOLUTION FROM FRESH
BIGEYE SNAPPER FISH MINCE. THE PROTEINS WERE
EXTRACTED IN EXTRACTION BUFFER. THE SHEAR STRESS
SWEEP WAS CARRIED AS A FUNCTION OF PROTEIN
CONCENTRATION AND TEMPERATURE.
A: 5 mg/ml at 30oC B: 5 mg/ml at 40
oC C: 10 mg/ml at 30
oC
D: 10 mg/ ml at 40oC E: 15 mg/ml at 30
oC F: 15 mg/ml at 40
oC
621
29
0
0.3
0.6
0.9
0 40 80 120 160 200
Ab
so
rban
ce
at
28
0 n
m
Elution volume (ml)
FIGURE 1 622
623
624

30
205 KD
97 KD
66 KD
43 KD
29 KD
20 KD
6.5 KD
1 2 3
FIGURE 2 625
626
627

31
20 40 60 80 100
-0.8
-0.4
0.0
0.4
0.8
Endothermic
Temperature (oC)
Heat
flo
w (
mW
)
FIGURE 3 628
629
630
32
0
100
200
300
400
0 30 60 90
0.00
0.10
0.20
0.30
0.40
0.50
A
Temperature (
oC )
Ta
n
Sto
rag
e/L
os
s m
od
ulu
s (
KP
a)
FIGURE 4
G’ G” Tan δ
631
33
Elution volume (ml)
0
1
2
3
-0.5 0 0.5 1
Slope: 0.0906
Slope: 0.2138
L o g F r e q u e n c y ( H z )
Lo
g s
tora
ge/lo
ss m
od
ulu
s (
KP
a)
Figure 5
Gel: G' G'' Sol: G' G''
632 633
34
0
400
800
1200
1600
0 500 1000 1500 2000 2500 3000
0
0.1
0.2
0.3
0.4
0.5
S t r e s s ( P a )
Sto
rag
e / L
oss m
od
ulu
s (
KP
a)
Ta
n
de
lt
a
FIGURE 6
G’ G” Tan δ
634 635
636
35
Elution volume (ml) S t r e s s ( P a )
-4
-2
0
2
-4 -2 0 2 4
-4
-2
0
2
-4 -2 0 2 4
-4
-2
0
2
-4 -2 0 2 4
-4
-2
0
2
-4 -2 0 2 4
-4
-2
0
2
-4 -2 0 2 4
-4
-2
0
2
-4 -2 0 2 4
L o g s h e a r r a t e ( S- 1
)
Lo
g
vi
sc
os
it
y
(P
a.
s)
A
F E
D C
B
Figure 7
Up curve Down curve
637 638