Composition of Natural Gas and Crude Oil Produced … of Natural Gas and Crude Oil Produced From 10...
34
Composition of Natural Gas and Crude Oil Produced From 10 Wells in the Lower Silurian “Clinton” Sandstone, Trumbull County, Ohio By Robert C. Burruss and Robert T. Ryder Chapter G.7 of Coal and Petroleum Resources in the Appalachian Basin: Distribution, Geologic Framework, and Geochemical Character Edited by Leslie F. Ruppert and Robert T. Ryder Supersedes USGS Open-File Report 98–799 Professional Paper 1708 U.S. Department of the Interior U.S. Geological Survey
-
Upload
vuongquynh -
Category
Documents
-
view
217 -
download
0
Transcript of Composition of Natural Gas and Crude Oil Produced … of Natural Gas and Crude Oil Produced From 10...

Composition of Natural Gas and Crude Oil Produced From 10 Wells in the Lower Silurian “Clinton” Sandstone, Trumbull County, Ohio
By Robert C. Burruss and Robert T. Ryder
Chapter G.7 ofCoal and Petroleum Resources in the Appalachian Basin: Distribution, Geologic Framework, and Geochemical CharacterEdited by Leslie F. Ruppert and Robert T. Ryder
Supersedes USGS Open-File Report 98–799
Professional Paper 1708
U.S. Department of the InteriorU.S. Geological Survey

Suggested citation:Burruss, R.C., and Ryder, R.T., 2014, Composition of natural gas and crude oil produced from 10 wells in the Lower Silurian “Clinton” Sandstone, Trumbull County, Ohio, chap. G.7 of Ruppert, L.F., and Ryder, R.T., eds., Coal and petroleum resources in the Appalachian basin; Distribution, geologic framework, and geochemical character: U.S. Geological Survey Professional Paper 1708, 30 p., http://dx.doi.org/10.3133/pp1708G.7. (Chapter G.7 supersedes USGS Open-File Report 98–799.)

iii
Contents
Abstract ...........................................................................................................................................................1Introduction.....................................................................................................................................................1Sample Locations...........................................................................................................................................2Sampling and Analytical Methods ..............................................................................................................2Results .............................................................................................................................................................2
Natural Gases ........................................................................................................................................2Crude Oils ...............................................................................................................................................3
Discussion .......................................................................................................................................................3Conclusions.....................................................................................................................................................3Acknowledgments .........................................................................................................................................4References Cited............................................................................................................................................4
Figures[Figures follow References Cited]
1. Map showing the distribution of the Lower Silurian regional oil and gas accumulation in the Appalachian basin and the location of the study area, cross sections, and well locations ............................................................................................7
2–11. Whole-oil, saturated-hydrocarbon-fraction, and aromatic-hydrocarbon-fraction gas chromatograms—
2. Sample 97MCR3, No. 1 Governor well ...............................................................................9 3. Sample 97MCR4, No. 1 Wargo well ..................................................................................11 4. Sample 97MCR5, No. 1 Baker well ...................................................................................13 5. Sample 97MCR6, No. 2 Clemens well ..............................................................................15 6. Sample 97MCR7, No. 2 Krantz well ..................................................................................17 7. Sample 97MCR8, No. 1 Rhine well ....................................................................................19 8. Sample 97MCR9, No. 1 Gowdy well .................................................................................21 9. Sample 97MCR10, No. 2 Redmond well ...........................................................................23 10. Sample 97MCR11, No. 7 Consumer well ..........................................................................25 11. Sample 97MCR12, No. 3 Consumer well ..........................................................................27 12. Biomarker mass fragmentograms, sample 97MCR5, No. 1 Baker well .............................28
Tables[Tables follow figures]
1. Wells sampled for gas and oil in Trumbull County, Ohio ......................................................29 2. Molecular and isotopic composition of gas samples ...........................................................29 3. Properties of whole crude oil and crude oil fractions ..........................................................30 4. Properties of the saturated hydrocarbon fraction of the crude oils ..................................30

iv
Conversion Factors
Multiply By To obtain
Length
foot (ft) 0.3048 meter (m)mile (mi) 1.609 kilometer (km)
micrometer (µm) 0.000039 inch (in.)millimeter (mm) 0.03937 inch (in.)meter (m) 3.281 foot (ft)
Area
square mile (mi2) 2.590 square kilometer (km2) Volume
cubic foot (ft3) 0.02832 cubic meter (m3) Velocity
centimeters per second (cm/sec) 0.3937 inches per second (in./sec)
Temperature in degrees Celsius (°C) may be converted to degrees Fahrenheit (°F) as follows:
°F=(1.8×°C)+32
Gas is measured in cubic feet using the following terms and abbreviations, which are commonly used in the oil-and-gas industry: standard cubic feet (SCF), million cubic feet (MMCF), and trillion cubic feet (TCF).
The isotopic composition of carbon (carbon 13, 13C) in methane is reported as the deviation (expressed as δ13C) in units of parts per thousand (per mil) relative to the Vienna Peedee belemnite (VPDB) standard.
The isotopic composition of hydrogen (deuterium, 2H) in methane is reported as the deviation (expressed as δ2H) in per mil relative to the Vienna standard mean ocean water (VSMOW).

Composition of Natural Gas and Crude Oil Produced From 10 Wells in the Lower Silurian “Clinton” Sandstone, Trumbull County, Ohio
By Robert C. Burruss1 and Robert T. Ryder1
accumulation containing an estimated 30 trillion cubic feet (TCF, a standard abbreviation used in the oil and gas indus-try) of recoverable gas covers an area of 17,000 square miles (mi2) in a band that stretches from western New York through western Pennsylvania and eastern Ohio to northernmost West Virginia (Ryder and others, 1996). The gas accumulation occurs in rocks of low permeability, usually 0.1 millidarcies (mD) or less, downdip of more permeable, water-saturated rocks. The rocks updip from the continuous-type gas accumu-lation contain accumulations of oil and gas that have charac-teristics of both continuous-type (unconventional) and discrete (conventional) accumulations (Ryder, 1998).
In the continuous-type part of the accumulation, individ-ual wells ultimately produce between 50 to 450 million cubic feet (MMCF, an oil and gas industry abbreviation) of natural gas. In addition to gas, many wells produce variable amounts of brine and crude oil. The gas-to-fluid ratio is variable but generally high, on the order of 50,000 to 500,000 standard cubic feet (SCF, an oil and gas industry abbreviation) of gas per barrel of oil or brine. The amount of oil and brine pro-duced affects the economics of individual wells because of the cost incurred to dispose of brine or the value added through the sale of oil. In general, the best gas producers are those wells that produce the least oil and brine.
To better understand the origin of the gas within the “Clinton” sandstone and Medina Group sandstones in the northern Appalachian basin, we are investigating the geochem-istry of the gas and the co-produced oil. This report documents 10 oil samples and 3 gas samples from 10 wells producing from “Clinton” sandstone in Trumbull County, Ohio. Future work will focus on samples from both shallower and greater burial depths, allowing study of the range in geochemical properties of the produced hydrocarbons as a function of depth and thermal history of the reservoir rocks.
Previous workers have published analyses of crude oils and natural gases from Silurian reservoirs in the northern Appalachian basin (Barker and Pollock, 1984; Powell and others, 1994; Cole and others, 1987; Jenden and others, 1993; Drozd and Cole, 1994; Laughrey and Baldassare, 1998). Cole and others (1987) suggest that most of the oil in Silurian
AbstractNatural gases and associated crude oils in the “Clinton”
sandstone, Medina Group sandstones, and equivalent Tusca-rora Sandstone in the northern Appalachian basin are part of a regional, continuous-type or basin-centered accumulation. The origin of the hydrocarbon charge to regional continuous-type accumulations is poorly understood. We have analyzed the molecular and stable isotopic composition of gases and oils produced from 10 wells in the “Clinton” sandstone in Trumbull County, Ohio, in an initial attempt to identify the characteristics of the accumulated fluids. The analyses show that the fluids have remarkably uniform compositions that are similar to previously published analyses of oils (Cole and others, 1987) and gases (Laughrey and Baldasarre, 1998) in Early Silurian reservoirs elsewhere in Ohio; however, geo-chemical parameters in the oils and gases suggest that the fluids have experienced higher levels of thermal stress than the present-day burial conditions of the reservoir rocks. The crude oils have an unusual geochemical characteristic: they do not contain detectable levels of sterane and triterpane biomarkers. The origin of these absences is unknown.
IntroductionIn the northern Appalachian basin, the “Clinton” sand-
stone (usage of Ryder, 20002) Medina Group sandstones, and equivalent Tuscarora Sandstone of Early Silurian age are the reservoirs for a regional accumulation of natural gas and oil. A continuous-type (basin-centered) part of this regional
1U.S. Geological Survey, Reston, Va.2The “Clinton” sandstone in Ohio was miscorrelated by drillers with strata
in the type Clinton Group of New York when in fact it is equivalent to the underlying type Medina Group of New York. Although this miscorrelation has caused confusion in nomenclature, the term continues to be used widely in the literature and by the oil and gas industry. Early drillers correctly identified the informal Medina sandstone in Ohio as a partial equivalent of the type Medina Group of New York.

2 Coal and Petroleum Resources in the Appalachian Basin
reservoirs in Ohio was generated from marine black shale of Devonian age. Most oil in the Lower Silurian “Clinton” sandstone may have been generated from Middle Ordovician black shale (Drozd and Cole, 1994; Ryder and others, 1998). Molecular and isotopic data on natural gas from Silurian reservoirs in western and central Pennsylvania (Laughrey and Baldassare, 1998) are not as diagnostic of the source sedi-ments for that gas as are the geochemical parameters measured in oil samples. The general conclusion of the work on gases from reservoirs in the “Clinton” sandstone is that they were derived from thermally mature, marine organic matter and that they were probably generated from strata older than Silurian.
Sample LocationsThe wells sampled are all within 10 miles (mi) of the
southern end of Mosquito Creek Lake, Trumbull County, Ohio, as shown on figure 1. With the exception of two wells sampled for oil in Weathersfield Township, the locations of all samples are within 5 mi of stratigraphic cross section D–D′ of Keighin (1998) through the “Clinton” sandstone interval. The position of the cross section is shown in figure 1. Selected information on the wells sampled is listed in table 1. Three of the wells in this study were included in a separate report on the potential impact of oil and gas development on water quality in Trumbull County (Barton and others, 1998).
Sampling and Analytical MethodsAll oil and gas samples for this study were obtained with
the assistance of operating companies’ field personnel from the wellhead or from the oil and gas separator of individual wells. Gas was sampled at the pressure-gauge port on the production tubing using evacuated stainless-steel cylinders supplied by Isotech Laboratories, Inc., Champaign, Ill. Oil was sampled, where possible, at the drain for the fluid-level sight glass on the oil and gas separator. The oil is initially saturated with gas at the separator pressure and foams from exsolution of the gas as it exits the sight glass drain. As noted in table 1, two samples could not be obtained this way, and the oil was sampled either from the flow line to the stock tank or from the drain valve at the bottom of the stock tank. The latter sample was relatively heavy oil with some brine.
All samples were analyzed by standard analytical methods. Natural-gas samples were analyzed for molecular composition by gas chromatography and for stable isotopic composition by isotope-ratio mass spectrometry at Isotech Laboratories, Inc. Carbon isotopic composition was deter-mined for methane (C1), ethane (C2), and propane (C3), and hydrogen isotopic composition was determined for methane. Carbon (13C) isotope ratios are reported in standard parts per thousand (per mil) notation relative to the Vienna Peedee belemnite (VPDB) standard, and hydrogen (2H) isotope ratios
are reported relative to the Vienna standard mean ocean water (VSMOW) for both gases and oils. Nitrogen (15N) isotope ratios are reported relative to atmospheric nitrogen.
Crude oil samples were analyzed by the U.S. Geo-logical Survey (USGS) in Denver, Colo. The American Petroleum Institute (API) gravity (equivalent to density) of the oil samples was determined gravimetrically using the API standard method. Oils were fractionated by dilution in n-heptane to remove asphaltenes. A concentrate of the solution was further fractionated by column chromatography on silica gel by successive elution with heptane, benzene, and benzene-methanol (1:1 volume-to-volume (v/v) concentration ratio) to collect the saturated hydrocarbon, aromatic hydrocarbon, and resin (nitrogen-, sulfur-, oxygen- (NSO-) bearing compounds) fractions, respectively. The carbon stable-isotope composition of an aliquot (a representative sample) of the saturated and aromatic hydrocarbon fractions was determined on a Micro-mass Optima isotope-ratio mass-spectrometry system.
Gas chromatography of the whole oil and of the saturated and aromatic hydrocarbon fractions was performed with a Hewlett Packard Model 6890 (HP6890) gas chromatograph with a 60 meter (m) × 0.32 millimeter (mm) × 0.25 micro-meter (µm) HP-1 fused silica capillary column and a flame ionization detector (FID). The oven was programmed from 50°C to 330°C at 4.5°C per minute and held isothermally at 330°C for 15 minutes with a helium carrier-gas flow rate at 35 centimeters per second (cm/sec). Gas chromatography-mass spectrometry (GCMS) of the saturated hydrocarbon fraction of one oil sample was performed with a HP6890-JEOL GCMate system in selective ion-monitoring mode to identify steranes and terpanes in the fraction.
Results
Natural Gases
The molecular and isotopic compositions of natural gas from three wells are presented in table 2. All three gas samples were rich in methane (about 90 mole percent) with low concentrations of hydrocarbons that have more than three carbon atoms. All samples contained a trace of helium and between 2.5 and 2.8 mole percent nitrogen. The gas composi-tions of these samples are consistent with those reported for the “Clinton” sandstone in Ohio by the U.S. Bureau of Mines (Moore, 1982).
The carbon isotopic composition of methane, ethane, and propane in all samples is within 1 per mil for all three compo-nents. The variation in the hydrogen isotopic composition of methane in the samples is only slightly larger at about 3 per mil. In all three samples, the content of carbon dioxide was so low (0.01 percent or less) that the carbon isotopic composition in the carbon dioxide could not be determined (indicated by “n.a.” in table 2).

Chapter G.7 Composition of Natural Gas and Crude Oil, Trumbull County, Ohio 3
Crude Oils
Bulk parameters and selected molecular parameters of the crude oil samples are listed in table 3. The API gravity of 9 of the 10 samples was near 40° or greater. The exception, 37° API for the No. 7 Consumer well, was measured on a sample obtained from the stock tank instead of the separator. The oils were uniformly high (86 to 90 weight percent) in saturated hydrocarbons and contained 9 percent or less aromatic hydro-carbons. Carbon isotopic compositions of the saturated and aromatic hydrocarbon fractions showed small ranges of 0.6 per mil and 0.7 per mil, respectively.
Gas chromatograms of the whole oil, the saturated hydrocarbon fraction, and aromatic hydrocarbon fraction for samples from the 10 wells are shown in figures 2A, 2B, and 2C, respectively, through figures 11A, 11B, and 11C. The saturated hydrocarbon gas chromatograms have characteristics similar to those of the “Clinton” sandstone reported by Cole and others (1987). Molecular parameters derived from the gas chromatograms of the saturated hydrocarbon fractions are listed in table 4. In general, all the gas chromatographic data show that these oil samples are remarkably uniform in com-position. The whole-oil chromatograms for samples from the No. 1 Wargo, No. 1 Rhine, No. 1 Gowdy, and No. 7 Consumer wells show depletion in the low-carbon number range (lower than n-C10), which suggests that the lighter n-alkanes were lost by evaporation. The pristine-to-phytane (pr:ph) ratios are given as quotients in table 4 and range from 1.07 to 1.63. The lowest value appears to be an artifact from the software that calculates these properties. This low value is not apparent from the relative peak heights in the gas chromatogram in fig-ure 7B; however, two groups of oils apparently can be defined on the basis of the pr:ph ratio, one with pr:ph of about 1.6 and another with pr:ph about 1.3. Whether or not this difference is significant will require analysis of additional samples to iden-tify the full range of variation in this property of oils produced from the “Clinton” sandstone and Medina Group sandstones.
Mass fragmentograms derived from gas chromatogra-phy-mass spectrometry (GCMS) studies of crude oil sample 97MCR5 from the No. 1 Baker well are shown in figure 12. The most striking feature of all four fragmentograms is that no ions were detected for the triterpane, sterane, hopane, or aromatized equivalent biomarkers, an indication that this oil has an unusual composition with no detectable biomarkers. All the other oils were examined in a reconnaissance mode, and no biomarkers were detected.
DiscussionThe data shown in the tables and the gas chromatograms
demonstrate that these gases and oils have a remarkably uni-form composition. Two of the oils that show evaporative loss of low-molecular-weight hydrocarbons, from the No. 1 Wargo and No. 7 Consumer wells, were obtained from the flow line
to the stock tank or from the stock tank itself. These oils were open to the atmosphere prior to sampling, and evaporative loss is expected. The other oils with evidence of loss of low-molec-ular-weight compounds, No. 1 Rhine and No. 1 Gowdy, were sampled from the separator and analyzed at the same time as the other samples. Different amounts of evaporative loss from individual samples during analysis are unlikely, and the cause of this aspect of the oils is unknown.
The possible grouping of the oils based on a small distinction in the pristane-to-phytane ratio needs further examination with other geochemical parameters. The fact that the anomalously low pristane-to-phytane ratio in one sample appears to be an artifact of the software that calculates this parameter suggests that small variations in this parameter must be evaluated carefully.
All the oil samples have a slight odd-carbon-number pref-erence (average 1.05, based on the carbon preference index (CPI) reported in table 4). This preference is similar to the odd-carbon-number preference in oil samples from Ordovician reservoirs in Ohio reported by Ryder and others (1998).
The most unusual feature of the oil samples is the absence of common biomarker compounds. The fragmento-grams in figure 12 show a baseline response with no detect-able compounds that yield ions for terpanes (m/z = 191), steranes and hopanes (m/z = 217), or the aromatized equiva-lents of these compounds (m/z = 231 and 253, respectively). Normal alkanes are present in the molecular weight range of the biomarkers (C21 to C35), demonstrating that no physical fractionation process (such as phase separation) has removed all the compounds in this molecular weight range. Tests were performed on the analytical method to ensure that no problems occurred during sample preparation. As a final test, the sample was sent to another laboratory outside of the U.S. Geological Survey. This laboratory could not detect biomarkers in the oil (J. David King, U.S. Geological Survey, written and oral com-munications, 1997).
The absence of biomarkers in these oil samples is puz-zling. A combination of the following three factors could lead to the development of an oil with no biomarkers: (1) some lower Paleozoic source rocks generate oils with low concen-trations of biomarkers, (2) experimental studies demonstrate that most biomarkers are released from the source during the early stages of generation, and (3) biomarkers can be cracked thermally and eliminated from an oil at high levels of thermal maturity. There are, however, no examples documented in the literature.
ConclusionsThe 10 oils and 3 natural gases sampled from 10 wells
producing from the “Clinton” sandstone in Trumbull County, Ohio, are remarkably uniform in composition. The oils are similar in composition to other Lower Silurian oils from Ohio reported by Cole and others (1987), and the gases are similar

4 Coal and Petroleum Resources in the Appalachian Basin
to gases in Lower Silurian reservoirs in Ohio reported by Laughrey and Baldassare (1998). The isotopic composition of the gases and the chemical composition of the oils suggest that they experienced high levels of thermal maturity, possibly greater than those of the present-day burial conditions of the reservoir rocks.
AcknowledgmentsRick Liddle, Lomak Petroleum, Inc., and Loren Smith,
Loma Enterprises, Inc., enthusiastically gave permission and made arrangements for us to sample the wells. Assistance with field sampling was kindly and patiently provided by R. Pet-tanati, Loma Enterprises, Inc., and J. Frederick, Lomak Petro-leum, Inc. The opportunity to combine our sampling activities with field work and collaborative research with Gary Barton, Water Resources Division, USGS, was a delightful bonus.
References Cited
Barker, J.F., and Pollock, S.J., 1984, The geochemistry and origin of natural gases in southern Ontario: Bulletin of Canadian Petroleum Geology, v. 32, no. 3, p. 313–326.
Barton, G.J., Burruss, R.C., and Ryder, R.T., 1998, Water quality in the vicinity of Mosquito Creek Lake, Trumbull County, Ohio, in relation to the chemistry of locally occur-ring oil, natural gas, and brine: U.S. Geological Survey Water-Resources Investigations Report 98–4180, 46 p.
Cole, G.A., Drozd, R.J., Sedivy, R.A., and Halpern, H.I., 1987, Organic geochemistry and oil-source correlations, Paleozoic of Ohio: American Association of Petroleum Geologists Bulletin, v. 71, no. 7, p. 788–809.
Drozd, R.J., and Cole, G.A., 1994, Point Pleasant-Brassfield(!) petroleum system, Appalachian Basin, U.S.A., in Magoon, L.B., and Dow, W.G., eds., The petroleum system—From source to trap: American Association of Petroleum Geolo-gists Memoir 60, p. 387–398.
Jenden, P.D., Drazan, D.J., and Kaplan, I.R., 1993, Mixing of thermogenic natural gases in northern Appalachian basin: American Association of Petroleum Geologists Bulletin, v. 77, no. 6, p. 980–998.
Keighin, C.W., 1998, Depositional dip-oriented cross-section through the Lower Silurian “Clinton” sands and Medina
Group in northeastern Ohio and western Pennsylvania: U.S. Geological Survey Open-File Report 98–500, 1 sheet.
Laughrey, C.D., and Baldassare, F.J., 1998, Geochemistry and origin of some natural gases in the Plateau province, central Appalachian basin, Pennsylvania and Ohio: American Association of Petroleum Geologists Bulletin, v. 82, no. 2, p. 317–335.
Lewan, M.D., and Buchardt, B., 1989, Irradiation of organic matter by uranium decay in the Alum Shale, Sweden: Geo-chimica et Cosmochimica Acta, v. 53, no. 6, p. 1307–1322.
Moore, B.J., 1982, Analysis of natural gases, 1917–1980: U.S. Bureau of Mines Information Circular 8870, 1055 p.
Powell, T.G., Macqueen, R.W., Barker, J.F., and Bree, D.G., 1984, Geochemical character and origin of Ontario oils: Bulletin of Canadian Petroleum Geology, v. 32, no. 3, p. 299–312.
Ryder, R.T., 1998, Characteristics of discrete and basin-centered parts of the Lower Silurian regional oil and gas accumulation, Appalachian basin; preliminary results from a data set of 25 oil and gas fields: U.S. Geological Survey Open-File Report 98–0216, 71 p. (Also available online at http://pubs.usgs.gov/of/1998/of98-216/.)
Ryder, R.T., 2000, Stratigraphic framework and depositional sequences in the Lower Silurian regional oil and gas accu-mulation, Appalachian basin; from Jackson County, Ohio, through northwestern Pennsylvania, to Orleans County, New York: U.S. Geological Survey Geologic Investigations Series Map I–2726, 2 sheets, pamphlet, 8 p. (Also available online at http://pubs.usgs.gov/imap/i-2726.)
Ryder, R.T., Aggen, K.L., Hettinger, R.D., Law, B.E., Miller, J.J., Nuccio, V.F., Perry, W.J., Jr., Prensky, S.E., SanFilipo, J.R., and Wandrey, C.J., 1996, Possible continuous-type (unconventional) gas accumulation in the Lower Silurian “Clinton” sands, Medina Group, and Tuscarora Sandstone in the Appalachian basin; a progress report of 1995 project activities: U.S. Geological Survey Open-File Report 96–42, 82 p. (Also available online at http://pubs.usgs.gov/of/1996/of96-042/.)
Ryder, R.T., Burruss, R.C., and Hatch, J.R., 1998, Black shale source rocks and oil generation in the Cambrian and Ordo-vician of the central Appalachian basin, USA: American Association of Petroleum Geologists Bulletin, v. 82, no. 3, p. 412–441.

Figures 1–12 and Tables 1–4

6 Coal and Petroleum Resources in the Appalachian Basin
82° 80° 78°
Lake Erie
D
D'
CANADA
UNITED STATES
NEW YORK
OHIO
PENNSYLVANIA
MARYLAND
WEST VIRGINIA
42°
38°
40°
Trumbull County
HC BC
Oil
Gas
Approximate boundary between basin-center (BC) and hybrid-conventional (HC) parts of the regional accumulation
EXPLANATION
HCBC
0 50 MILES25
A

Chapter G.7 Composition of Natural Gas and Crude Oil, Trumbull County, Ohio 7
Bazetta Township Fowler Township Hartford Township
Johnston Township
Weathersfield Township
D'
D
Mosquito Creek Lake
0 3 MILES
EXPLANATION
Location of well control along the line ofcross section D-D’
Wells sampled for oil and natural gas with permit numbers (for full APInumbers, see table 1)
81°00' 81°30'41°30'
41°00'
No. 2 Clemens 2194
No. 2 Krantz 3561
No. 1 Governor3382
No. 1 Rhine2822
No. 1 Gowdy 849
No. 3 Consumer1932
No. 7 Consumer 2217
No. 2 Redmond1340
No. 1 Baker 3292
No. 1 Wargo2914
B
Figure 1 (facing page and this page). Maps of the study area. A, Map showing distribution of the regional, continuous-type accumulation of gas and oil in the Lower Silurian “Clinton” sandstone, the location of Trumbull County, Ohio, and the regional cross section D–D′ of Keighin (1998). B, Sketch map showing well locations along cross section D–D′ of Keighin (1998) in Trumbull County, Ohio.

8 Coal and Petroleum Resources in the Appalachian Basin
0 10 20 30 40 50 60 70RETENTION TIME, IN MINUTES
A
pr
ph
METHYLCYCLOHEXANE
DETE
CTOR
RES
PON
SEDE
TECT
OR R
ESPO
NSE
B
10 20 30 40 50 60 70RETENTION TIME, IN MINUTES
n-C17
n-C10
n-C30
n-C7

Chapter G.7 Composition of Natural Gas and Crude Oil, Trumbull County, Ohio 9
10 20 30 40 50 60 70RETENTION TIME, IN MINUTES
C
DETE
CTOR
RES
PON
SE
Figure 2 (facing page and this page). Gas chromatograms for sample 97MCR3, No. 1 Governor well, Trumbull County, Ohio. American Petroleum Institute (API) gravity is 40.9°. A, Whole-oil gas chromatogram, where n-Cx indicates a normal alkane with x number of carbons. B, Saturated-hydrocarbon-fraction gas chromatogram. C, Aromatic-hydrocarbon-fraction gas chromatogram. Abbreviations are as follows: pr, pristine; ph, phytane.

10 Coal and Petroleum Resources in the Appalachian Basin
B
10 20 30 40 50 60 70RETENTION TIME, IN MINUTES
DETE
CTOR
RES
PON
SEDE
TECT
OR R
ESPO
NSE
0 10 20 30 40 50 60 70RETENTION TIME, IN MINUTES
A
prph
METHYLCYCLOHEXANE
n-C17
n-C10
n-C30
n-C7

Chapter G.7 Composition of Natural Gas and Crude Oil, Trumbull County, Ohio 11
10 20 30 40 50 60 70RETENTION TIME, IN MINUTES
C
DETE
CTOR
RES
PON
SE
Figure 3 (facing page and this page). Gas chromatograms for sample 97MCR4, No. 1 Wargo well, Trumbull County, Ohio. American Petroleum Institute (API) gravity is 40.5°. A, Whole-oil gas chromatogram, where n-Cx indicates a normal alkane with x number of carbons. B, Saturated-hydrocarbon-fraction gas chromatogram. C, Aromatic-hydrocarbon-fraction gas chromatogram. Abbreviations are as follows: pr, pristine; ph, phytane.

12 Coal and Petroleum Resources in the Appalachian Basin
A
prph
METHYLCYLCOHEXANE
0 10 20 30 40 50 60 70RETENTION TIME, IN MINUTES
RETENTION TIME, IN MINUTESB
10 20 30 40 50 60 70
DETE
CTOR
RES
PON
SEDE
TECT
OR R
ESPO
NSE
n-C17
n-C10
n-C30
n-C7

Chapter G.7 Composition of Natural Gas and Crude Oil, Trumbull County, Ohio 13
C
10 20 30 40 50 60 70RETENTION TIME, IN MINUTES
DETE
CTOR
RES
PON
SE
Figure 4 (facing page and this page). Gas chromatograms for sample 97MCR5, No. 1 Baker well, Trumbull County, Ohio. American Petroleum Institute (API) gravity is 43.9°. A, Whole-oil gas chromatogram, where n-Cx indicates a normal alkane with x number of carbons. B, Saturated-hydrocarbon-fraction gas chromatogram. C, Aromatic-hydrocarbon-fraction gas chromatogram. Abbreviations are as follows: pr, pristine; ph, phytane.

14 Coal and Petroleum Resources in the Appalachian Basin
B
10 20 30 40 50 60 70
RETENTION TIME, IN MINUTES
n-C17
n-C10
n-C30
n-C7
RETENTION TIME, IN MINUTESA
prph
METHYLCYCLOHEXANE
0 10 20 30 40 50 60 70
DETE
CTOR
RES
PON
SEDE
TECT
OR R
ESPO
NSE
Chapter G.7 Composition of Natural Gas and Crude Oil, Trumbull County, Ohio 15
C
10 20 30 40 50 60 70RETENTION TIME, IN MINUTES
DETE
CTOR
RES
PON
SE
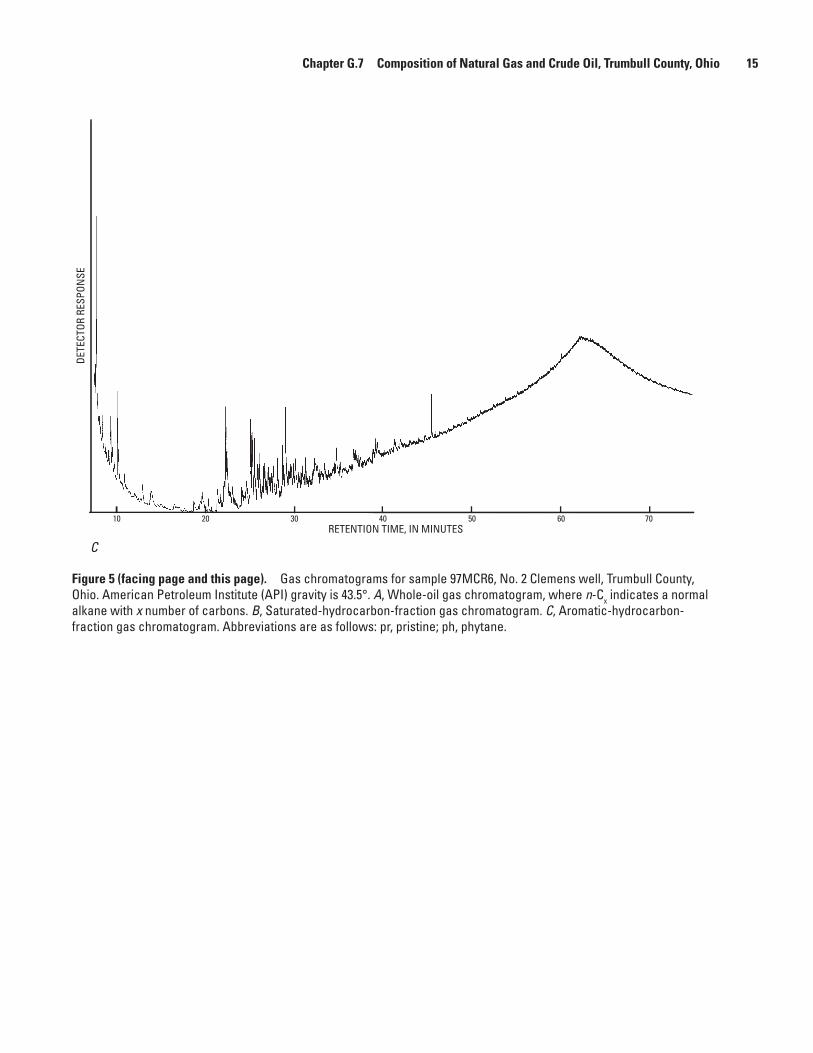
Figure 5 (facing page and this page). Gas chromatograms for sample 97MCR6, No. 2 Clemens well, Trumbull County, Ohio. American Petroleum Institute (API) gravity is 43.5°. A, Whole-oil gas chromatogram, where n-Cx indicates a normal alkane with x number of carbons. B, Saturated-hydrocarbon-fraction gas chromatogram. C, Aromatic-hydrocarbon-fraction gas chromatogram. Abbreviations are as follows: pr, pristine; ph, phytane.

16 Coal and Petroleum Resources in the Appalachian Basin
7010 20 30 40 50 60RETENTION TIME, IN MINUTES
B
prph
METHYLCYCLOHEXANE
0 10 20 30 40 50 60 70RETENTION TIME, IN MINUTES
A
DETE
CTOR
RES
PON
SEDE
TECT
OR R
ESPO
NSE
n-C17
n-C10
n-C30
n-C7

Chapter G.7 Composition of Natural Gas and Crude Oil, Trumbull County, Ohio 17
C
10 20 30 40 50 60 70RETENTION TIME, IN MINUTES
DETE
CTOR
RES
PON
SE
Figure 6 (facing page and this page). Gas chromatograms for sample 97MCR7, No. 2 Krantz well, Trumbull County, Ohio. American Petroleum Institute (API) gravity is 43.2°. A, Whole-oil gas chromatogram, where n-Cx indicates a normal alkane with x number of carbons. B, Saturated-hydrocarbon-fraction gas chromatogram. C, Aromatic-hydrocarbon-fraction gas chromatogram. Abbreviations are as follows: pr, pristine; ph, phytane.

18 Coal and Petroleum Resources in the Appalachian Basin
n-C17
n-C10
n-C30
n-C7
B
10 20 30 40 50 60 70RETENTION TIME, IN MINUTES
A
pr
ph
METHYLCYCLOHEXANE
0 10 20 30 40 50 60 70RETENTION TIME, IN MINUTES
DETE
CTOR
RES
PON
SEDE
TECT
OR R
ESPO
NSE

Chapter G.7 Composition of Natural Gas and Crude Oil, Trumbull County, Ohio 19
C
10 20 30 40 50 60 70RETENTION TIME, IN MINUTES
DETE
CTOR
RES
PON
SE
Figure 7 (facing page and this page). Gas chromatograms for sample 97MCR8, No. 1 Rhine well, Trumbull County, Ohio. American Petroleum Institute (API) gravity is 43.1°. A, Whole-oil gas chromatogram, where n-Cx indicates a normal alkane with x number of carbons. B, Saturated-hydrocarbon-fraction gas chromatogram. C, Aromatic-hydrocarbon-fraction gas chromatogram. Abbreviations are as follows: pr, pristine; ph, phytane.

20 Coal and Petroleum Resources in the Appalachian Basin
B10 20 30 40 50 60 70
RETENTION TIME, IN MINUTES
A
pr
ph
METHYLCYCLOHEXANE
0 10 20 30 40 50 60 70RETENTION TIME, IN MINUTES
DETE
CTOR
RES
PON
SEDE
TECT
OR R
ESPO
NSE
n-C17
n-C10
n-C30
n-C7

Chapter G.7 Composition of Natural Gas and Crude Oil, Trumbull County, Ohio 21
C
10 20 30 40 50 60 70RETENTION TIME, IN MINUTES
DETE
CTOR
RES
PON
SE
Figure 8 (facing page and this page). Gas chromatograms for sample 97MCR9, No. 1 Gowdy well, Trumbull County, Ohio. American Petroleum Institute (API) gravity is 39.7°. A, Whole-oil gas chromatogram, where n-Cx indicates a normal alkane with x number of carbons. B, Saturated-hydrocarbon-fraction gas chromatogram. C, Aromatic-hydrocarbon-fraction gas chromatogram. Abbreviations are as follows: pr, pristine; ph, phytane.

22 Coal and Petroleum Resources in the Appalachian Basin
B
10 20 30 40 50 60 70RETENTION TIME, IN MINUTES
A
prph
METHYLCYCLOHEXANE
0 10 20 30 40 50 60 70RETENTION TIME, IN MINUTES
DETE
CTOR
RES
PON
SEDE
TECT
OR R
ESPO
NSE
n-C17
n-C10
n-C30
n-C7

Chapter G.7 Composition of Natural Gas and Crude Oil, Trumbull County, Ohio 23
C10 20 30 40 50 60 70
RETENTION TIME, IN MINUTES
DETE
CTOR
RES
PON
SE
Figure 9 (facing page and this page). Gas chromatograms for sample 97MCR10, No. 2 Redmond well, Trumbull County, Ohio. American Petroleum Institute (API) gravity is 44.3°. A, Whole-oil gas chromatogram, where n-Cx indicates a normal alkane with x number of carbons. B, Saturated-hydrocarbon-fraction gas chromatogram. C, Aromatic-hydrocarbon-fraction gas chromatogram. Abbreviations are as follows: pr, pristine; ph, phytane.

24 Coal and Petroleum Resources in the Appalachian Basin
B10 20 30 40 50 60 70
RETENTION TIME, IN MINUTES
A
pr
ph
METHYLCYCLOHEXANE
0 10 20 30 40 50 60 70RETENTION TIME, IN MINUTES
DETE
CTOR
RES
PON
SEDE
TECT
OR R
ESPO
NSE
n-C17
n-C10
n-C30
n-C7

Chapter G.7 Composition of Natural Gas and Crude Oil, Trumbull County, Ohio 25
C RETENTION TIME, IN MINUTES10 20 30 40 50 60 70
DETE
CTOR
RES
PON
SE
Figure 10 (facing page and this page). Gas chromatograms for sample 97MCR11, No. 7 Consumer well, Trumbull County, Ohio. American Petroleum Institute (API) gravity is 37.3°. A, Whole-oil gas chromatogram, where n-Cx indicates a normal alkane with x number of carbons. B, Saturated-hydrocarbon-fraction gas chromatogram. C, Aromatic-hydrocarbon-fraction gas chromatogram. Abbreviations are as follows: pr, pristine; ph, phytane.

26 Coal and Petroleum Resources in the Appalachian Basin
B10 20 30 40 50 60 70
RETENTION TIME, IN MINUTES
A
pr
ph
METHYLCYCLOHEXANE
n-C17
n-C10
n-C30
n-C7
0 10 20 30 40 50 60 70RETENTION TIME, IN MINUTES
DETE
CTOR
RES
PON
SEDE
TECT
OR R
ESPO
NSE

Chapter G.7 Composition of Natural Gas and Crude Oil, Trumbull County, Ohio 27
C10 20 30 40 50 60 70
RETENTION TIME, IN MINUTES
DETE
CTOR
RES
PON
SE
Figure 11 (facing page and this page). Gas chromatograms for sample 97MCR12, No. 3 Consumer well, Trumbull County, Ohio. American Petroleum Institute (API) gravity is 42.6°. A, Whole-oil gas chromatogram, where n-Cx indicates a normal alkane with x number of carbons. B, Saturated-hydrocarbon-fraction gas chromatogram. C, Aromatic-hydrocarbon-fraction gas chromatogram. Abbreviations are as follows: pr, pristine; ph, phytane.

28 Coal and Petroleum Resources in the Appalachian BasinDETECTOR RESPONSE
51025 20 153545 40 30
2025
3035
4045
5055
6065
70RE
TEN
TION
TIM
E, IN
MIN
UTES
TERP
ANES
(M/Z
=191
)
STER
ANES
AN
D HO
PAN
ES(M
/Z=2
17)
AROM
ATIZ
ED E
QUIV
ALEN
T OF
TER
PAN
ES(M
/Z=2
31)
AROM
ATIZ
ED E
QUIV
ALEN
T OF
STE
RAN
ES A
ND
HOPA
NES
(M/Z
=253
)
Figu
re 1
2.
Mas
s fra
gmen
togr
ams
for b
iom
arke
rs in
sam
ple
97M
CR5,
No.
1 B
aker
wel
l. m
/z, m
ass
to c
harg
e ra
tio. m
/z=1
91, t
erpa
nes;
m/z
=217
, ste
rane
s an
d ho
pane
s;
m/z
=231
and
m/z
=253
, aro
mat
ized
equi
vale
nts
of th
ese
com
poun
ds, r
espe
ctiv
ely.

Chapter G.7 Composition of Natural Gas and Crude Oil, Trumbull County, Ohio 29
Table 1. Wells sampled for gas and oil in Trumbull County, Ohio.
[Abbreviations are as follows: API, American Petroleum Institute; Inc., Incorporated; ft, feet. Note: API number is a unique identification number assigned to each oil and gas well. The rightmost four or five digits are the well permit number used to identify wells in figure 1B]
U.S. Geological Survey sample identification
number
Well name Operator API numberOhio
townshipProducing formation
Perforation depthTotal depth
(ft)
Sample type
Oil sample pointTop
(ft)Bottom
(ft)
97MCR3 No. 1 Governor Loma Enterprises, Inc. 34–155–23382 Bazetta "Clinton" sandstone 4,372 4,432 4,602 Gas, oil Sight glass
97MCR4 No. 1 Wargo Loma Enterprises, Inc. 34–155–22914 Weathersfield "Clinton" sandstone 4,746 4,786 5,006 Oil Flow line
97MCR5 No. 1 Baker Loma Enterprises, Inc. 34–155–23292 Weathersfield "Clinton" sandstone 4,612 4,686 4,825 Oil Sight glass
97MCR6 No. 2 Clemens Lomak Petroleum, Inc. 34–155–22194 Bazetta "Clinton" sandstone 4,252 4,318 4,472 Gas, oil Sight glass
97MCR7 No. 2 Krantz Lomak Petroleum, Inc. 34–155–23561 Bazetta "Clinton" sandstone 4,356 4,397 4,600 Gas, oil Sight glass
97MCR8 No. 1 Rhine Lomak Petroleum, Inc. 34–155–22822 Fowler "Clinton" sandstone 4,560 4,620 4,821 Oil Sight glass
97MCR9 No. 1 Gowdy Lomak Petroleum, Inc. 34–155–20849 Fowler "Clinton" sandstone 4,627 4,677 4,854 Oil Sight glass
97MCR10 No. 2 Redmond Lomak Petroleum, Inc. 34–155–21340 Johnston "Clinton" sandstone 4,450 4,496 4,685 Oil Sight glass
97MCR11 No. 7 Consumer Lomak Petroleum, Inc. 34–155–22217 Hartford "Clinton" sandstone 4,545 4,599 4,767 Oil Stock tank
97MCR12 No. 3 Consumer Lomak Petroleum, Inc. 34–155–21932 Hartford "Clinton" sandstone 4,600 4,628 4,798 Oil Sight glass
Table 2. Molecular and isotopic composition of gas samples.
[Abbreviations are as follows: n.d., not detected; n.a., not analyzed; +, C6 and higher hydrocarbon numbers]
U.S. Geological Survey sample identification
number97MCR7 97MCR3 97MCR6
Well name No. 2 Krantz No. 1 Governor No. 2 Clemens
Molecular analysis, in mole percent
Methane 89.34 90.33 90.64Ethane 5.11 4.64 4.48Ethylene n.d. n.d. n.d.Propane 1.65 1.47 1.32iso-Butane 0.22 0.2 0.18n-Butane 0.4 0.38 0.31iso-Pentane 0.11 0.11 0.085n-Pentane 0.11 0.13 0.096Hexane+ 0.12 0.14 0.12Helium 0.091 0.089 0.099Hydrogen 0.0013 0.0024 n.d.Argon n.d. n.d. n.d.Oxygen n.d. n.d. n.d.Nitrogen 2.84 2.5 2.67Carbon dioxide 0.01 0.01 n.d.
Isotopic analysis, per mil
Methane, δ13C –37.49 –37.20 –37.40Hydrogen (deuterium), δ2H –168.5 –166.6 –165.7Ethane, δ13C –35.29 –34.88 –34.67Propane, δ13C –30.94 –30.58 –30.40Carbon dioxide, δ13C n.a. n.a. n.a.

30 Coal and Petroleum Resources in the Appalachian Basin
Table 3. Properties of whole crude oil and crude oil fractions.
[Abbreviations are as follows: API, American Petroleum Institute]
U.S. Geological Survey sample identification
number
Well nameAPI
gravity (degrees)
Petroleum fractions (weight percent) Isotopic composition (per mil)
Saturated hydrocarbons
Aromatic hydrocarbons
Nitrogen-, sulfur-, and oxygen-bearing
organicsAsphaltenes
Saturated hydrocarbons
(δ13C)
Aromatic hydrocarbons
(δ13C)
97MCR3 No. 1 Governor 40.9 86.7 8.6 3.2 1.6 –29.80 –28.96
97MCR4 No. 1 Wargo 40.5 89.2 7.2 2.4 1.3 –29.73 –28.68
97MCR5 No. 1 Baker 43.9 90.5 6.3 2.2 1.0 –29.76 –28.90
97MCR6 No. 2 Clemens 43.5 87.3 8.5 3.4 0.8 –29.61 –29.08
97MCR7 No. 2 Krantz 42.2 89.3 7.6 1.8 1.3 –29.66 –28.86
97MCR8 No. 1 Rhine 43.1 85.7 9.2 3.8 1.3 –29.50 –28.92
97MCR9 No. 1 Gowdy 39.7 88.9 7.7 2.7 0.7 –29.71 –29.19
97MCR10 No. 2 Redmond 44.3 88.8 7.8 2.5 0.9 –30.05 –29.23
97MCR11 No. 7 Consumer 37.3 90.9 6.8 2.3 0.9 –29.76 –28.55
97MCR12 No. 3 Consumer 42.6 89.4 7.0 2.4 1.1 –29.59 –28.87
Table 4. Properties of the saturated hydrocarbon fraction of the crude oils.
[Abbreviations are as follows: pr, pristane; ph, phytane. The condensate index (defined by Lewan and Buchardt, 1989) was calculated as the percent of n-C11 in n-C10 to n-C30]
U.S. Geological Survey sample identification
numberWell name
Saturated hydrocarbon characteristics
pr:ph pr/n-C17 ph/n-C18
Carbon preference index
n-alkanes (percent)
Condensate index
97MCR3 No. 1 Governor 1.57 0.41 0.33 1.09 37.50 9.64
97MCR4 No. 1 Wargo 1.61 0.38 0.29 1.06 39.65 8.08
97MCR5 No. 1 Baker 1.63 0.41 0.32 1.04 38.03 9.30
97MCR6 No. 2 Clemens 1.63 0.40 0.31 1.04 38.89 8.93
97MCR7 No. 2 Krantz 1.35 0.38 0.33 1.04 39.64 8.41
97MCR8 No. 1 Rhine 1.07 0.32 0.33 1.01 42.41 8.44
97MCR9 No. 1 Gowdy 1.27 0.34 0.31 1.03 43.10 7.44
97MCR10 No. 2 Redmond 1.32 0.33 0.30 1.04 40.53 7.97
97MCR11 No. 7 Consumer 1.24 0.32 0.30 1.06 41.12 9.05
97MCR12 No. 3 Consumer 1.58 0.34 0.27 1.08 41.58 7.84