Composition and Mass of Peptides Released during Tryptic ... · PDF fileComposition and Mass...
13
THE JOURNAL cm Bro~oo~ca~ CHEMISTRY Vol. 242, No. 6, Issue of March 25, pp. 1241-1262, 1967 Printed in U.S.A. Composition and Mass of Peptides Released during Tryptic and Chymotryptic Hydrolysis of Myosin* (Received for publication, October 17, 1966) DAVID M. SEGAL,~ SYLVIA HIMMELFARB, AND WILLIAM F. HARRINGTON From the McCollum-Pratt Institute, The Johns Hopkins University, Baltimore, Maryland 21218 SUMMARY Peptides released during the early stages of digestion of myosin by trypsin and chymotrypsin have been isolated and their amino acid compositions determined as a function of the extent of proteolysis. The fractions of the myosin mass released as low molecular weight peptides at various times of digestion are reported. A comparison of the composition of the peptides released by both enzymes indicates that the rates of release of certain of the amino acids (lysine and arginine in the trypsin studies, and phenylalanine and tyro- sine in the chymotrypsin studies) are direct reflections of the enzyme specificities. On the other hand, both enzymes release unusually high concentrations of proline residues in the early stages of digestion, and this behavior appears to be related to the conformational state of the proline-containing regions of the native molecules. Results suggest that the proline residues act to open a segment of the a-helical con- formation in the myosin rod and to render this local region more susceptible to proteolytic attack. The mass of this region has been estimated at 75,000 to 95,000 g per mole. The use of proteolytic enzymes as structural probes has proved in recent years to be one of the most effective approaches to the elucidation of the molecular properties of myosin. It is well known that tryptic digestion of myosin releases two relatively homogeneous, high molecular weight particles, light meromyosin and heavy meromyosinl (2-5). In addition, a small fraction of the mass is liberated during proteolysis as low molecular weight peptides. The physical and chemical properties of the high molecular weight fragments have been well characterized over the past few years. LMM2 is a rod-like particle of uniform diameter, and present evidence indicates that the polypeptide *This work was supported by United States Public Health Service Research Grant AM 04349. This paper is Contribution 493 from the McCollum-Pratt Institute, The Johns Hopkins University. $ Recipient of United States Public Health Service Predoctoral Fellowship l-F2-GM-20,77. The work reported is taken from a thesis submitted in partial fulfillment of the requirements for the Ph.D. degree in biology, The Johns Hopkins University. 1 E. Mihalyi, quoted in Reference 1. * The abbreviations used are: LMM, light meromyosin; HMM, heavy meromyosin. chains in this segment of the myosin molecule are arranged in a super coil of (Y helices (6-12). The HMM particle is a globular structure with a short, rod-like appendage (11-14). Hydrody- namic and electron microscopic evidence (11, 12, 15-17) indicate that the topology of myosin is closely represented by a long rod which terminates in a globular region, and it is therefore apparent that the two fragments, HMM and LMM, are produced by a transverse cleavage through the rod segment of the native mole- cule. A remarkable feature of the enzymatic degradation of myosin is that several enzymes of widely differing specificities appear to induce cleavage in the same region of the molecule in the early stages of digestion (1, 2, 18-21); all yield LMM and HMM frag- ments which are indistinguishable in their physicochemical properties. Thus it appears that this unusual proteolytic be- havior is derived from the local structure of the myosin molecule in this region rather than from the enzymatic specificity of the protease. These observations have led to the suggestion in earlier work (18) that the proteolysis-sensitive region is an un- folded polypeptide segment embedded within the predominantly a-helical rod of myosin. Assuming this proposal to be correct, we would expect the conformational state of the polypeptide chains to be a reflection of some feature of the primary structure which differentiates this region from its adjoining a-helical neigh- bors. In the present study we have therefore investigated the amino acid composition of peptides released during the formation of the proteolytic fragments, LMM and HMM, in an attempt to obtain information pertaining to this question. MATERIALS AND METHODS Rabbit myosin was prepared by the method of Kielley and Bradley (22), except that in some preparations the pH of the extracting buffer was 6.5 instead of 8.9. In all cases the 40 to 50 y0 ammonium sulfate fraction was used. Light meromyosin Fr. I was prepared according to the method of Szent-Gyorgyi (5) and Szent-Gyorgyi, Cohen, and Philpott (7). In this preparation myosin was digested at 25” in the pH- stat with a ra.tio of trypsin to myosin of 1:250, w/w. When 45 bonds were cleaved per myosin molecule (assuming a pK of 7.85 for a-amino groups (18)), the reaction was terminated by the addition of a 2-fold excess (w/w) of soybean trypsin inhibitor. Heavy meromyosin was prepared from two myosin digests. One was the digest described above, in which 45 bonds per mole- cule had been hydrolyzed, and the other was a sample which had been digested for 75 set with a ratio of trypsin to myosin of 1:250, 1241 by guest on May 20, 2018 http://www.jbc.org/ Downloaded from
Transcript of Composition and Mass of Peptides Released during Tryptic ... · PDF fileComposition and Mass...

THE JOURNAL cm Bro~oo~ca~ CHEMISTRY Vol. 242, No. 6, Issue of March 25, pp. 1241-1262, 1967
Printed in U.S.A.
Composition and Mass of Peptides Released during Tryptic and
Chymotryptic Hydrolysis of Myosin*
(Received for publication, October 17, 1966)
DAVID M. SEGAL,~ SYLVIA HIMMELFARB, AND WILLIAM F. HARRINGTON
From the McCollum-Pratt Institute, The Johns Hopkins University, Baltimore, Maryland 21218
SUMMARY
Peptides released during the early stages of digestion of myosin by trypsin and chymotrypsin have been isolated and their amino acid compositions determined as a function of the extent of proteolysis. The fractions of the myosin mass released as low molecular weight peptides at various times of digestion are reported. A comparison of the composition of the peptides released by both enzymes indicates that the rates of release of certain of the amino acids (lysine and arginine in the trypsin studies, and phenylalanine and tyro- sine in the chymotrypsin studies) are direct reflections of the enzyme specificities. On the other hand, both enzymes release unusually high concentrations of proline residues in the early stages of digestion, and this behavior appears to be related to the conformational state of the proline-containing regions of the native molecules. Results suggest that the proline residues act to open a segment of the a-helical con- formation in the myosin rod and to render this local region more susceptible to proteolytic attack. The mass of this region has been estimated at 75,000 to 95,000 g per mole.
The use of proteolytic enzymes as structural probes has proved in recent years to be one of the most effective approaches to the elucidation of the molecular properties of myosin. It is well known that tryptic digestion of myosin releases two relatively homogeneous, high molecular weight particles, light meromyosin and heavy meromyosinl (2-5). In addition, a small fraction of the mass is liberated during proteolysis as low molecular weight peptides. The physical and chemical properties of the high molecular weight fragments have been well characterized over the past few years. LMM2 is a rod-like particle of uniform diameter, and present evidence indicates that the polypeptide
*This work was supported by United States Public Health Service Research Grant AM 04349. This paper is Contribution 493 from the McCollum-Pratt Institute, The Johns Hopkins University.
$ Recipient of United States Public Health Service Predoctoral Fellowship l-F2-GM-20,77. The work reported is taken from a thesis submitted in partial fulfillment of the requirements for the Ph.D. degree in biology, The Johns Hopkins University.
1 E. Mihalyi, quoted in Reference 1. * The abbreviations used are: LMM, light meromyosin; HMM,
heavy meromyosin.
chains in this segment of the myosin molecule are arranged in a super coil of (Y helices (6-12). The HMM particle is a globular structure with a short, rod-like appendage (11-14). Hydrody- namic and electron microscopic evidence (11, 12, 15-17) indicate that the topology of myosin is closely represented by a long rod which terminates in a globular region, and it is therefore apparent that the two fragments, HMM and LMM, are produced by a transverse cleavage through the rod segment of the native mole- cule.
A remarkable feature of the enzymatic degradation of myosin is that several enzymes of widely differing specificities appear to induce cleavage in the same region of the molecule in the early stages of digestion (1, 2, 18-21); all yield LMM and HMM frag- ments which are indistinguishable in their physicochemical properties. Thus it appears that this unusual proteolytic be- havior is derived from the local structure of the myosin molecule in this region rather than from the enzymatic specificity of the protease. These observations have led to the suggestion in earlier work (18) that the proteolysis-sensitive region is an un- folded polypeptide segment embedded within the predominantly a-helical rod of myosin. Assuming this proposal to be correct, we would expect the conformational state of the polypeptide chains to be a reflection of some feature of the primary structure which differentiates this region from its adjoining a-helical neigh- bors.
In the present study we have therefore investigated the amino acid composition of peptides released during the formation of the proteolytic fragments, LMM and HMM, in an attempt to obtain information pertaining to this question.
MATERIALS AND METHODS
Rabbit myosin was prepared by the method of Kielley and Bradley (22), except that in some preparations the pH of the extracting buffer was 6.5 instead of 8.9. In all cases the 40 to 50 y0 ammonium sulfate fraction was used.
Light meromyosin Fr. I was prepared according to the method of Szent-Gyorgyi (5) and Szent-Gyorgyi, Cohen, and Philpott (7). In this preparation myosin was digested at 25” in the pH- stat with a ra.tio of trypsin to myosin of 1:250, w/w. When 45 bonds were cleaved per myosin molecule (assuming a pK of 7.85 for a-amino groups (18)), the reaction was terminated by the addition of a 2-fold excess (w/w) of soybean trypsin inhibitor.
Heavy meromyosin was prepared from two myosin digests. One was the digest described above, in which 45 bonds per mole- cule had been hydrolyzed, and the other was a sample which had been digested for 75 set with a ratio of trypsin to myosin of 1:250,
1241
by guest on May 20, 2018
http://ww
w.jbc.org/
Dow
nloaded from
1242 Peptides Released during Hydrolysis of Myosin Vol. 242, No. 6
w/w, at 25” and pH 6.5. The HMM isolation followed the pro- cedure of Young, Himmelfarb, and Harrington (lo), which includes gel filtration through a Sephadex G-200 column to re- move trypsin and inhibitor. All steps in the purification of the 75-set digests were carried out in the presence of 0.1 M P-mer- captoethanol in order to minimize the formation of high molecular weight aggregates. The purified HMM was concentrated by sedimentation at 50,000 rpm in a Spinco model L ultracentrifuge for 12 hours. All protein solutions were dialyzed exhaustively against water prior to amino acid analysis.
Trypsin (recrystallized twice), soybean trypsin inhibitor (re- crystallized three times), and cY-chymotrypsin (recrystallized three times) were purchased from Worthington. The trypsin was treated with L-(l-tosylamido-2-phenyl)ethyl chlormethyl ketone (Cycle Chemical Corporation, Los Angeles) according to the procedure of Schoellmann and Shaw (23) to remove con- taminating chymotryptic activity; chymotrypsin was pretreated with 1-chloro-3-tosylamido-7-amino-2-heptamine HCl (Cycle Chemical Corporation) according to the procedure of Shaw, Mares-Guia, and Cohen (24) to remove contaminating tryptic activity. Phenyl methyl sulfonyl fluoride was also purchased from the Cycle Chemical Corporation.
Tryptic Digestion of Xyosin
Digestion of &fyosin in 1 M Ammonium Acetate-In some studies the volatile buffer, 1 M ammonium acetate (at pH 7.5), was used in order to eliminate a desalting step. In these diges- tions trypsin was added to myosin at 25” (trypsin to myosin, 1:250, w/w) and the reaction was terminated at various time intervals by the addition of a 2-fold excess (w/w) of soybean trypsin inhibitor to trypsin.
When relatively small yields of peptides were anticipated, as in samples digested for short times, a large amount of myosin (200 mg) was digested and then precipitated by bringing the pH down to 5 with glacial acetic acid. To insure complete precipita- tion of protein the resulting solution was heated for 20 min at 60”. The precipitate was removed by centrifugation (30 min at 37,000 x g) and was washed several times to remove trapped peptides. The supernatants were dried by either lyophilization or flash evaporation, and the peptides were redissolved in 2 ml of water. These samples were then applied to a Sephadex G-75 column (1.7 x 45 cm) equilibrated with 0.1 M ammonium bicar- bonate. Fronting material, which included any unprecipitated protein, was discarded, and peptides were collected in about 2 column volumes, pooled, and lyophilized. Other samples, which were digested for longer periods of time in 1 M ammonium acetate, were applied directly to the column without prior precipitation of the protein. In the latter case 20 to 25 mg of myosin digest were used and the column was pre-equilibrated with 1 M am- monium acetate.
Digestion of M2/osin in 0.5 nc KC&In most of our digestion experiments proteolysis of myosin in 0.5 M KC1 was followed in the pa-stat and the reaction was terminated at various levels of peptide bond cleavage. The pH-stat used in our experiments has been described by Mihalyi and Harrington (18). The titrim- eter was standardized against pH 4.00 and pH 6.86 National Bureau of Standards buffers, and the sodium hydroxide titrating agent was standardized by titrating to neutrality a known vol- ume of a gravimetric dilut.ion of constant boiling HCl. The con- centration of the myosin solutions was determined spectrophoto- metrically with the use of an extinction coefficient for myosin of
543 cm2 per g (X = 279 mp) (25). Solutions were weighed into a water-jacketed cell (volumes were determined by dividing the weight by the density of the solution) and brought to 25” and pH 8.6 by addition of 1.0 N NaOH. Trypsin (in 0.001 M HCl) was then added to the myosin solution, and digestion was allowed to proceed to a predetermined number of bonds cleaved per molecule, assuming a pK for the liberated a-amino groups at 25” of 7.85 (18) and a molecular weight for myosin of 6.0 x lo5 (15, 16). Prepurified nitrogen gas was passed over the protein solu- tion to exclude CO*. The reaction was terminated by the addi- tion of a 2-fold excess of soybean trypsin inhibitor.
Protein was removed from the digests either by precipitation at pH 5 and 60” for 20 min or by gel filtration of 8 ml of a 1.22y0 myosin digest solution on a Sephadex G-75 column (100 x 3.5 cm) in 1 M ammonium bicarbonate. Supernatant solutions from the precipitated samples were further fractionated by gel filtra- tion on a Sephadex G-75 column (1.8 X 45 cm) in 0.1 M ammo- nium bicarbonate. Pooled peptide samples were concentrated by lyophilization or flash evaporation. The peptides were then desalted on a Sephadex G-10 column (130 x 1.5 cm) in 0.1 M
pyridinium acetate, pH 5.0. Buffer was pumped through the column at about 3 ml per min, and the salt peak was identified by adding 0.1 to 0.2 ml from each tube to 0.1 ml of 0.1 M AgN03.
To facilitate the interpretation of the composition studies we have determined the kinetic parameters for proteolysis of myosin under the same conditions as those used for preparation of the peptide samples. A stock solution of myosin (about 1.27, myo- sin in 0.5 M KCl) was prepared and the concentration was deter- mined by both micro-Kjeldahl and spectrophotometric analyses (the concentrations estimated by the two methods differed by less than lyO). Weighed samples of the stock solution were digested with a ratio of protease to myosin of 1:250, w/w, for approximately 300 min, and the pH-stat curves were analyzed as described under “Results.”
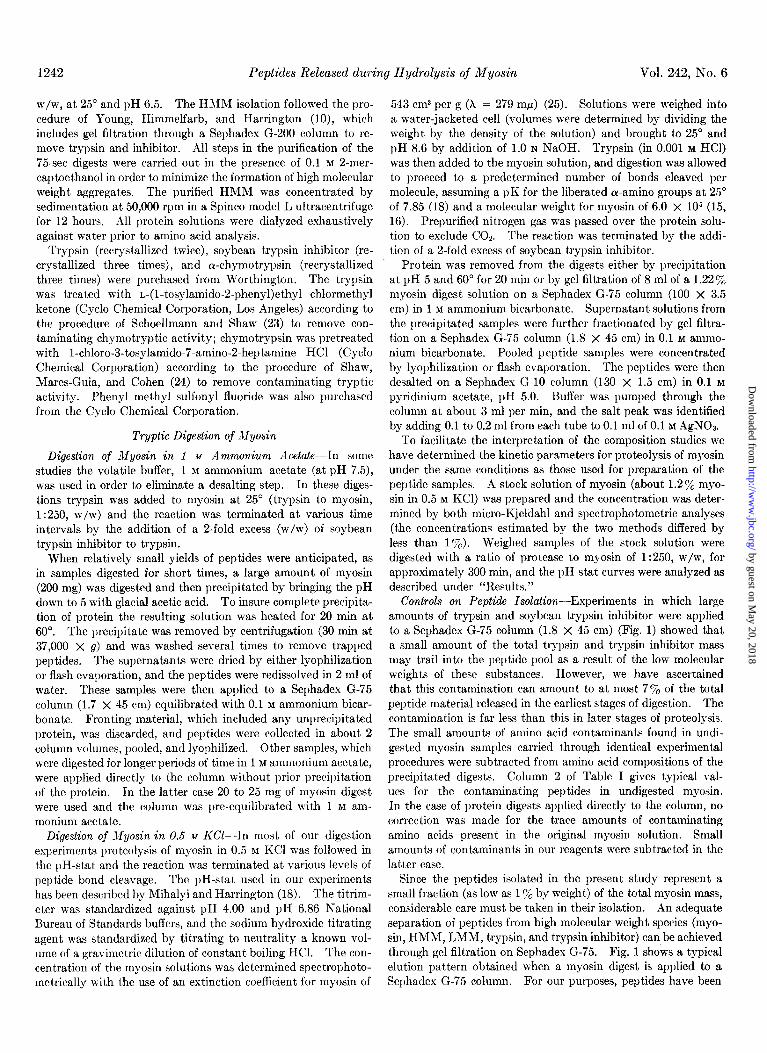
Controls on Peptide Isolation-Experiments in which large amounts of trypsin and soybean trypsin inhibitor were applied to a Sephadex G-75 column (1.8 x 45 cm) (Fig. 1) showed that a small amount of the total trypsin and trypsin inhibitor mass may trail into the peptide pool as a result of the low molecular weights of these substances. However, we have ascertained that this contamination can amount to at most 7% of the total peptide material released in the earliest stages of digestion. The contamination is far less than this in later stages of proteolysis. The small amounts of amino acid contaminants found in undi- gested myosin samples carried through identical experimental procedures were subtracted from amino acid compositions of the precipitated digests. Column 2 of Table I gives typical val- ues for the contaminating peptides in undigested myosin. In the case of protein digests applied directly to the column, no correction was made for the trace amounts of contaminating amino acids present in the original myosin solution. Small amounts of contaminants in our reagents were subtracted in the latter case.
Since the peptides isolated in the present study represent a small fraction (as low as 1 y0 by weight) of the total myosin mass, considerable care must be taken in their isolation. An adequate separation of peptides from high molecular weight species (myo- sin, HMM, LMM, trypsin, and trypsin inhibitor) can be achieved through gel filtration on Sephadex G-75. Fig. 1 shows a typical elution pattern obtained when a myosin digest is applied to a Sephadex G-75 column. For our purposes, peptides have been
by guest on May 20, 2018
http://ww
w.jbc.org/
Dow
nloaded from
Issue of March 25, 1967 Segal, Himmeljarb, and Harrington 1243
defined as the fraction eluted from 80 to 200 ml. Since Sephadex G-75 has an exclusion limit molecular weight of roughly 50,000, any peptides that contain more than about 450 residues will be included in the protein peak. From the molecular weights of myosin, LMM, and HMM (8, 10, 15, 16, 26, 27), it would seem unlikely that peptides of this molecular weight are released upon digestion.
Comparison of Digestion of Myosin in Ammonium Acetate with Digestion in KC&The rates of proteolysis of myosin in 1 M am- monium acetate or in 1 M KC1 were followed by viscometry at 25” with an Ostwald-type viscometer of 2 ml volume with an average shear gradient of 300 set-I for water. The amounts of undigested myosin at various times were calculated from the relative viscosities by the technique of Mihalyi (28). Log differ- ence plots according to the method of Guggenheim (29) showed that the over-all process was first order in protein concentration over most of the reaction. The rate of digestion of N-benzoyl- n-arginine ethyl ester (Worthington Determatube) was followed at 253 rnp at 25” in a Cary model 14 spectrophotometer. Myosin which had been digested in 1 M ammonium acetate and in 1 M
KC1 was examined in a Spinco model E ultracentrifuge equipped with a schlieren optical system.
It was found that digestion in 1 M ammonium acetate pro- ceeded at about one-half to one-t.hird the rate found in 1 M KCl, in the presence and in the absence of 0.05 M phosphate, pH 7.5. Since the rate of digestion of N-benzoyl-L-arginine ethyl ester by trypsin is virtually unaffected by the presence or absence of 1 M
ammonium acetate, it appears that this salt exerts its effect
0.9
0.8
0.7
75 2
E 0.6
_o
g 0.5
6 d " 0.4
L 5 m 0.3 0
0.2
0.1
,C
I-
0.6
ml
20 40 60 80 100 I20 140 ml
FIG. 1. Elution pattern of myosin from a Sephadex G-75 column (1.8 X 45 cm). Myosin was digested for 3 min at 25” with a ratio of trypsin to myosin (w/w) of 1:306 prior to application. The column was pre-equilibrated with 0.5 M KCI, and 1.5 ml of 0.91% protein was eluted at room temperature. 0, biuret optical den- sity; q , ninhydrin assay of peptides. Inset, elution pattern of 1 ml of a mixture of 0.5% trypsin and 1% soybean trypsin inhibi- tor on the same column.
TABLE I
Controls showing the amount of contamination present in a typical peptide fractionation (Columns 1 and 2), and the simi- larity of amino acid compositions of digests after precipitation and gel filtration (Column 3) and after gel filtration only (Column
4).
Amino acid 6 bondsa 0 bonds* 16.9 bondsC 16.9 bondsd
residues/100 residues
Lysine Histidine Arginine . . . . Aspartic acid. Threonine Serine............ Glutamic acid. . Proline. Glycine Alanine Valine. Methionine. Isoleucine Leucine Tyrosine . . . . Phenylalanine
Jmdes pmoles
0.218 0.002 0.031 0 0.129 0 0.108 0.003 0.049 0.001 0.159 0.003 0.224 0.004 0.098 0 0.057 0.009 0.164 0.003 0.122 0 0.024 0 0.051 0.001 0.051 0.001 0.014 0 0.052 0
14.5 14.1 2.5 2.2 8.2 7.3 7.4 8.5 3.1 3.8 8.5 6.7
18.0 16.7 5.1 5.1 4.4 5.9 9.7 8.6 6.6 5.9 1.2 1.8 2.8 3.1 5.8 6.7 0.6 1.1 2.2 3.0
Total. . . . . 1.499 0.027
a The quanity of amino acids released when an average of 6 bonds per myosin molecule are cleaved in 0.5 M KCl. Peptides were isolated by the precipitation procedures described in the text.
* The quanity of amino acid contaminants present when un- digested myosin is subjected to the same procedure as in Columnl.
c The amino acid composition of tryptic peptides released from myosin when an average of 16.9 bonds per molecule are hydro- lyzed. Peptides were isolated by the precipitation procedure described in the text, and were desalted before analysis
d The same digest as in Column 3, applied directly (without precipitation) to a Sephadex G-75 column, 100 X 3.5 cm. Pooled peptides were desalted and analyzed (see text).
primarily through an interaction with the myosin molecule rather than an interaction with trypsin. Nevertheless, we be- lieve that the digestion of myosin in 1 M ammonium acetate proceeds by a mechanism similar to that found in 0.5 M KCl, since the sedimentation patterns and the amino acid composition of the rapidly released peptides (see below) were essentially the same, independent of the solvent used for the digestion.
Chymotryptic Digestion of Myosin
Myosin in 0.5 M KC1 was digested in the pH-stat to a predeter- mined number of bonds cleaved per molecule with a ratio of chymotrypsin to myosin of 1:250 (w/w). The procedure used was similar to that used in the trypsin studies, except that the digestion reaction was terminated by making the solution 1O-3 M
in phenyl methyl sulfonyl fluoride (30).
Amino Acid Analysis
Peptides from all digestions were repeatedly washed and dried in test tubes by evaporation on a Buchler rotary Evapo-Mix, and finally in a vacuum oven at 50” over Paa. Two milliliters of 6 N HCl were added to each sample, and the test tubes were evacuated and sealed. Hydrolyses were carried out for 24 hours
by guest on May 20, 2018
http://ww
w.jbc.org/
Dow
nloaded from
Peptides Released during Hydrolysis of Myosin Vol. 242, No. 6
at 110”. Hydrolysates were then analyzed for amino acid com- position by the method of Spackman, Stein, and Moore (31) on a Spinco model 120B amino acid analyzer. Cysteine was deter- mined as cysteic acid by the method of Moore (32) with performic acid oxidation. Corrections for incomplete hydrolysis and destruction of amino acids during hydrolysis, as described by Moore and Stein (33), were applied in some cases. These cor- rections were found to be negligibly small in our experiments, and were therefore neglected in the majority of the analyses. A comparison of the amino acid analysis of myosin determined in the present study with that reported earlier by Lowey and Cohen (9) is shown in Table IV. The two analyses are in excel- lent agreement.
Determination of Released Mass
The fraction of the total myosin mass released at various stages of digestion was determined from the total peptide nitrogen and the amino acid composition as follows. Myosin was digested in the pH&at to a given number of bonds cleaved per molecule with a ratio of trypsin to myosin of 1:400 (w/w). Approxi- mately 12 ml (300 mg of protein) of these digests were weighed into Spinco Polyallomer centrifuge tubes, the pH was lowered to 5 with glacial acetic acid, and the samples were heated for 20 min at 60”. Precipitates were removed by centrifuging the tubes for I2 hours at 40,000 rpm, and the supernatant solution was lyoph- ilized, quantitatively redissolved in water, and placed on a Sephadex G-75 column (1.8 x 45 cm) which had been equili- brated with 0.05 M KCl. Fronting material was discarded, and peptides were pooled and lyophilized. The lyophilized material was redissolved in a known volume of water, and the micromolar concentration of nitrogen of each sample was determined in triplicate by micro-Kjeldahl analysis (34).
A portion of each of these samples was desalted and the amino acid composition was determined. The total mass of released peptides was calculated from the amino acid composition and the total number of micromoles of nitrogen released by tryptic diges- tion and compared with the original mass of myosin as estimated from the concentration and volume. The small amount of nitrogen released from an aliquot of the same myosin preparation undigested and carried through the above procedure was sub- tracted from the experimental points. Controls in which known amounts of peptides were added to myosin samples were carried through the complete experimental procedure and analyzed for percentage recovery. The average recovery was 80%, with the lowest value being 70%.
A number of the tryptic peptide pools on which nitrogen analy- ses were performed were dried at pH 10 to remove ammonia contaminants and were redigested to completion with n-(l-tosyl- amido-2-phenyl)ethyl chlormethyl ketone-treated trypsin for 5 hours at 25”, pH 7 (the weight ratio of trypsin to peptides was 1: 100; the system was buffered with phosphate). The ninhydrin color of the digested sample (determined by the method of Rosen (35)) was then compared with that of its undigested control. The concentration of peptides in each sample was determined from the micro-biuret absorption, and the ninhydrin color incre- ment per micromole of residue was calculated. The extinction coefficient used in the ninhydrin analyses was determined from the ninhydrin color increment of a complete tryptic digest of reduced carboxymethylated ribonuclease. With this extinction coefficient, the ninhydrin color increment, and the amino acid composition of each peptide pool, the number of a-amino groups released per lysine plus arginine residue was calculated.
RESULTS
In the present study we have taken advantage of the unusually high proteolytic susceptibility of certain peptide bonds of myosin to gain structural information about the regions containing them.
When a proteolytic enzyme is used as a structural probe, a certain ambiguity arises from the specificity of the enzyme. Ideally, the proteolytic enzyme should be completely nonspecific with regard to the primary structure of the protein substrate and yet should be markedly sensitive to the local conformational state of the polypeptide chain. Since such an enzyme is not available, we have used two proteolytic enzymes of well known specificity (trypsin and chymotrypsin) to separate those factors related to the specificity of the enzyme from those related to the local conformation of the protein.
Amino Acid Composition of Tryptic Pepticles Released at Vari- ous Stages of Proteolysis-Tables II and III present amino acid compositions of the low molecular weight peptide mixtures isolated at various stages of digestion. In our early experiments the digestions were carried out in the volatile buffer, 1 M am- monium acetate, in order to minimize the difficulties in desalting the peptide mixture prior to amino acid analysis. However, this procedure had two inherent disadvantages. For one, the precise number of peptide bonds cleaved at a given stage of diges- tion could not be monitored in the pH-stat because of the buffer- ing effect of the salt. (The extent of digestion was, however, qualitatively ascertained from an estimate of the LMM and HMM peak areas observed from the ultracentrifuge schlieren patterns.) Furthermore, determinations of the nonprotein nitro- gen as well as the amide nitrogen in amino acid analyses were frustrated by the presence of residual traces of ammonium ace- tate. In later studies we found that desalting of the peptides could be readily effected by the use of Sephadex G-10 columns, thus allowing us to carry out our digestions in 0.5 M KC1 in the pH-stat. In fact, the course of tryptic digestion, as measured by the composition of the released peptides, was comparable at equivalent levels of digestion in both salt systems, as seen in Tables II and III.
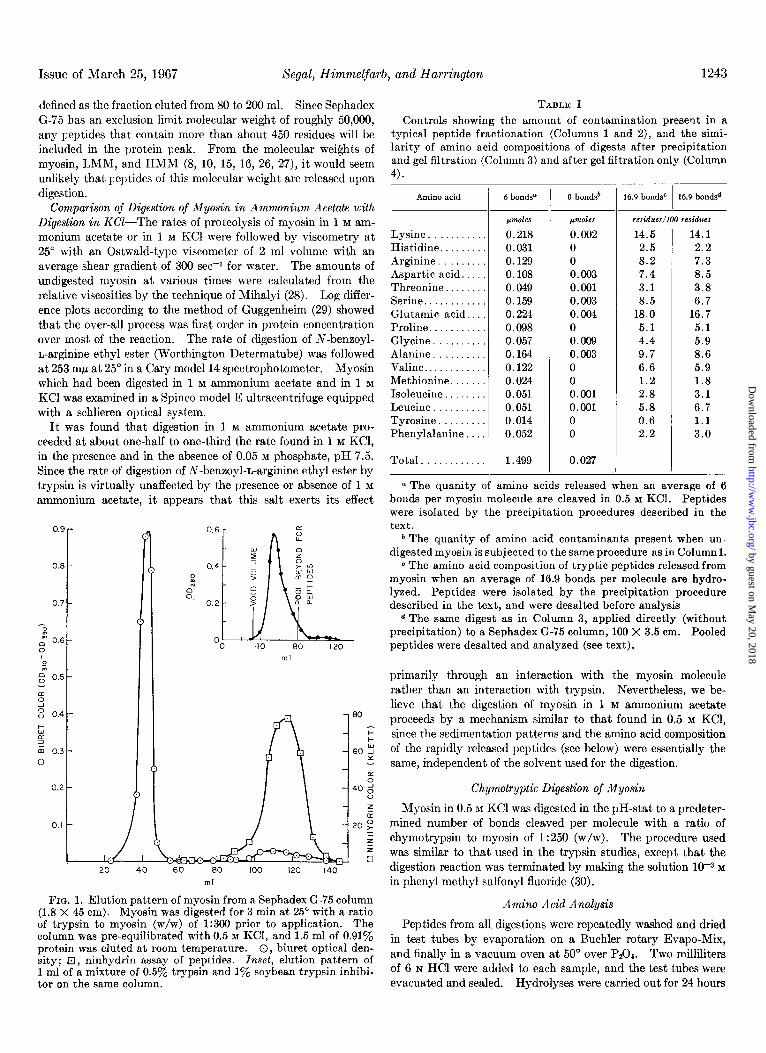
At early stages of tryptic digestion the amino acid composition of released peptides is strikingly different from either LMM, HMM, or myosin (see Table IV). The amino acids which exhibit the largest differences are lysine, arginine, glutamic acid, proline, serine, valine, and leucine. Of these lysine, arginine, proline, serine, and valine are all appreciably more abundant than in LMM, HMM, or myosin, while leucine and glutamic acid are present in much smaller amounts. Perhaps the most notable feature is the unusually high proline content in the pep- tides produced by limited proteolysis. When 7.5 bonds have been cleaved, the isolated peptides contain about 7 proline resi- dues per 100 total residues. This value should be contrasted to that observed for the fully a-helical segment, LMM, which is essentially zero, and to that observed for myosin, which contains about 2.4 proline residues per 100 total residues. The proline contents of released peptides, plotted as a function of degree of digestion, are shown in Fig. 2A, along with the proline content of myosin and the tryptic fragments, LMM and HMM.
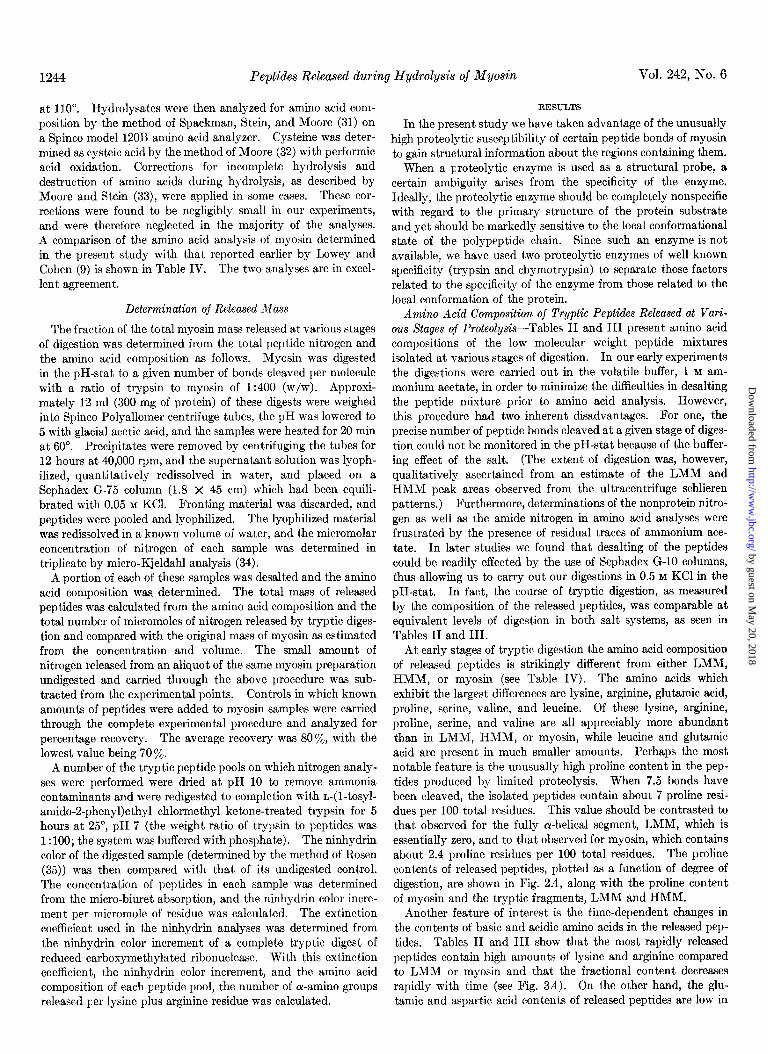
Another feature of interest is the time-dependent changes in the contents of basic and acidic amino acids in the released pep- tides, Tables II and III show that the most rapidly released peptides contain high amounts of lysine and arginine compared to LMM or myosin and that the fractional content decreases rapidly with time (see Fig. 3A). On the other hand, the glu- tamic and aspartic acid contents of released peptides are low in
by guest on May 20, 2018
http://ww
w.jbc.org/
Dow
nloaded from

Issue of March 25, 1967 Segal, Himmelfarb, and Hawington
TABLE II
Amino acid compositions of tryptic peptides released from myosin at various stages of proteolysis in 0.6 M KC1
1245
- Amino acid
-
6
--
bonds’” 1 - - 1 8.2 12.2
bonds’= bondsC
- I 16.9
bondsC
- I - 45.0 60.0
bond? bonds” 89.7
bonds” 180 298
bonds“ bond?
residues/l00 residues
14.7 15.6 15.6 14.6 15.3 14.3 15.0 13.9 13.2 13.5 13.0 12.5 12.3 12.4 2.1 3.6 2.2 2.5 2.8 2.8 2.1 2.4 2.4 2.9 2.2 2.1 1.8 1.6 8.8 9.3 8.9 7.7 9.3 9.3 7.4 10.1 8.1 8.6 9.2 8.5 7.2 6.7 7.1 7.5 7.4 7.8 7.0 7.7 7.7 7.1 8.1 7.9 7.8 8.4 8.6 9.3 3.3 3.4 3.1 3.1 2.9 2.7 3.0 3.0 3.1 3.4 3.6 3.9 4.5 4.3
10.6 9.7 10.2 8.8 9.2 8.6 7.9 9.4 7.7 7.7 7.6 6.9 6.3 5.3 14.9 14.5 15.5 16.7 17.7 18.8 18.3 19.0 18.6 20.0 19.7 20.1 21.7 22.1
6.7 7.0 6.1 6.0 4.2 4.1 5.5 3.3 4.3 3.3 3.1 2.4 2.0 1.9 3.1 2.8 2.2 3.7 2.1 2.5 3.8 2.4 3.5 3.0 3.2 3.6 3.6 3.9
10.9 8.9 9.3 10.9 10.2 9.6 10.2 9.7 10.5 9.5 9.0 9.6 9.9 10.2 8.3 8.0 6.9 7.0 7.3 7.4 6.1 6.7 6.1 5.9 5.4 4.9 5.4 4.4 1.6 1.1 1.3 1.0 1.0 0.8 1.2 1.2 1.4 1.5 2.0 1.9 1.8 2.1 3.4 3.4 3.1 3.2 3.1 2.8 3.0 3.0 3.1 2.8 2.9 3.0 2.9 3.3 3.4 3.6 3.6 4.7 4.8 5.5 6.1 6.0 6.8 7.7 8.1 8.8 9.1 9.5 1.0 0 1.0 0 0.5 1.8 0.4 0.4 0.2 0.6 0.9 0.7 1.0 1.0 3.5 1.8 3.6 2.5 2.3 1.9 2.4 2.5 2.7 2.5 2.3 2.8 2.0 1.9 d d d d 0.3 d d d d d d d d d
- - - a Protein precipitated prior to chromatography on a Sephadex G-75 column (1.8 X 45 cm) equilibrated with 0.05 M KCl. Ratio
of trypsin to myosin, 1:400 (w/w). b No precipitation of protein; digests chromatographed directly on a Sephadex G-75 column (100 X 3.5 cm) equilibrated with 1 M
(NHJHCOa. Ratio of trypsin to myosin, 1:250 (w/w). c Protein precipitated prior to chromatography on a Sephadex G-75 column (1.8 X 45 cm) equilibrated with0.1 M (NHJHCOa. Weight
ratio of trypsin to myosin, 1: 250 (w/w). d Not determined.
Lysine ................ Histidine. ............. Arginine .............. Aspartic acid .......... Threonine ............. Serine ................. Glutamic acid ......... Proline. ............... Glycine ............... Alanine ................. Valine ................. Methionine. ........... Isoleucine ............. Leucine ............... Tyrosine .............. Phenylalanine ......... Half-cysteine. .........
TABLE III TABLE IV
Amino acid composition of peptides released during tryptic digestion Amino acid composition of myosin, LMM Fr. I, HMM, and HMM of yosin in 1 x ammonium acetate Fr. I mj
1
1 tiyosina f
- -
IC
10.7 1.9 5.0 9.8 5.1 4.5
18.2 2.6 4.6 9.0 5.0 2.7 4.9 9.4 2.3 3.4 1.0
Amino acid
dues/l00 residues
10.2 13.0 10.8 10.4 2.1 1.7 1.5 1.6 6.4 4.8 3.2 4.0
10.1 8.9 10.4 10.2 4.0 4.4 5.6 5.5 5.0 4.7 4.9 4.5
24.7 23.3 17.0 17.0 0.5 0.9 3.6 2.8 2.5 3.2 5.5 6.6
10.0 8.7 8.7 8.7 4.6 3.1 4.7 5.4 2.3 3.4 3.6 2.2 4.3 4.8 4.8 5.1
10.7 11.2 8.8 8.8 1.1 1.2 1.9 2.2 0.9 2.4 4.0 4.3 0.7 0.4 1.0 0.7
residues/100 residues
Lysine.
@ Ratio of trypsin to myosin is 1:250 (w/w) at 25”. Protein
.......... Histidine
was precipitated by heating at pH 5.0 prior to Sephadex G-75
........ Arginine ......... Aspartic acid .... Threonine ....... Serine ........... Glutamic acid. .. Proline. ......... Glycine .......... Alanine .......... Valine ........... Methionine ...... Isoleucine ....... Leucine. ......... Tyrosine. ........ Phenylalanine ....
16.8 2.5 8.2 7.4 3.3 7.9
14.2 7.1 6.3 8.6 6.1 1.8 3.3 4.2 0.6 1.7
16.4 2.6 8.1 7.3 3.3 8.4
15.1 6.2 5.7 9.3 6.7 1.5 3.0 4.4 0.3 1.6
15.6 2.6 8.0 7.8 3.3 8.4
15.5 5.9 5.4 8.2 6.7 1.7 3.1 5.4 0.3 2.3
13.7 1.2 6.9 8.4 4.0 8.3
18.1 4.0 3.5 9.3 6.4 1.9 3.2 8.0 0.6 2.7
12.6 2.5 6.0 8.4 4.3 6.5
19.2 3.1 4.2
10.1 5.4 2.2 3.2 9.0 0.7 2.6
11.7 2.0 6.5 7.9 3.9 6.4
19.7 2.6 4.3
10.9 5.3 2.3 3.7 9.4 0.7 2.6
12.6 2.2 6.6 8.3 4.3 6.4
19.4 2.9 3.8
10.3 5.2 2.7 3.7 8.7 0.7 2.3
Lysine.
Phenylalanine . .
.......... 10.3
3.2
Histidine.
Half-cysteine..
........
0.8
1.9 Arginine ......... 4.9 Aspartic acid ..... 9.8 Threonin ......... 5.1 Serine. ........... 4.7 Glutamic acid .... 18.9 Proline ........... 2.3 Glycine. ......... 4.7 Alanine. ......... 9.0 Valine ............ 5.2 Methionine. ...... 3.1 Isoleucine ........ 4.8 Leucine. ......... 9.5 Tyrosine ......... 2.0
chromatography. * Ratio of trypsin to myosin is 1:300 (w/w) at 25”. Digest,
was applied directly to a Sephadex G-75 column equilibrated with 1 M (NHd)HCOa.
Q Lowey and Cohen (9). b Lowey (36).
constant, the net charge per residue is initially highly positive, the initial stages of reaction but increase rapidly with further in contrast to the high negative charge found in LMM, and de digestion (Fig. 3B). Although amino acid analyses indicate that creases monotonically with proteolysis. the amide content of the released peptides is low (about 25% of In an earlier study, Middlebrook (37) has reported that the aspartic and glutamic acid residues exist in the amide form) and amino acid composition of trichloracetic acid-soluble tryptic
by guest on May 20, 2018
http://ww
w.jbc.org/
Dow
nloaded from
1246 Peptides Released during Hydrolysis of Myosin Vol. 242, No. 6
D 3 I- ?
Lz
LMM
0 30 60 90 I20 150 180 210 240 270 300 330
A TOTAL BONDS CLEAVED PER MYOSIN MQLECULE
L 2t 0 1
- J 0 30 60 90 120 150 180 210 240 270 300 330
B TOTAL BONDS CLEAVED PER MYOSIN MOLECULE
FIG. 2. Residues of proline released per 100 total residues as a function of the number of bonds cleaved per myosin molecule A, by trypsin and B, by chymotrypsin in 0.5 M KC1 at 25”. Hori- zontal lines indicate the proline content of HMM (75-min digest), myosin, and LMM Fr. I. See legends to Tables II and V for details.
peptides from a myosin digest is very similar to that of the pa.rent molecule. These peptides were produced, however, by rather extensive proteolysis. The reaction was terminated when ap- proximately 70% of the myosin had been converted to HMM and LMM, and we estimate that 45 to 60 bonds had been cleaved per myosin molecule at this stage of proteolysis. Consequently, there is no real inconsistency between the two sets of data. In this regard, it is pertinent that Middlebrook also finds that the tryptic peptides are rich in serine, lysine, and arginine, and defi- cient in leucine compared to myosin.
Amino Acid Composition of Chymotryptic Peptides Released at Various Stages of Proteolysis-The amino acid compositions of peptides released at various stages of proteolysis by chymotrypsin are summarized in Table V. As in the trypsin studies, the most striking aspect of the results is the high concentration of proline (5.4%) in the peptides released in the initial stages of proteolysis. In the early stages of digestion, at comparable numbers of bonds cleaved, the fractional proline content is somewhat lower than that observed in the tryptic peptides, while at later stages just
the reverse is true. It will also be noted from Table V that the leucine content of released peptides shows a marked increase with number of bonds cleaved, similar to that observed in the trypsin studies. The serine content of released chymotryptic peptides is appreciably higher than that of LMM, HMM, and myosin, as in the tryptic studies, but in this case shows only a small change with proteolysis. In contrast to the high fractional contents of lysine and arginine in the peptides derived from tryptic digestion, the chymotryptic peptides have lysine and arginine contents similar to that of the parent myosin molecule. On the other hand, the chymotryptic peptides show very large and constant amounts of the aromatic amino acids (tyrosine and phenylalanine) throughout the digestion process. These find- ings are relevant to the specificities of the two enzymes, and will be considered further in the discussion.
Fraction of Myosin Mass Released as Peptides by Trypsin and
0 IO 20 30 40 50 60 70 80 90 A
TOTAL BONDS CLEAVED PER MYOSIN MOLECULE
r LMM (fr 0 .-.-. - .-. - -.-.-.-_---.-
34
t 32
t
3oc
- MYOSIN --_-_-_-_-_----- ---- fl
28 - ,---o---
2oO I II I I I I , , , ( ( , ] , , , ( , IO B 20 30 40 50 60 70 80 90
TOTAL BONDS CLEAVED PER MYOSIN MOLECULE
FIG. 3. Residues of A, lysine and arginine, and B, glutamic plus aspartic acids released as a function of the number of bonds cleaved per myosin molecule during tryptic digestion. to Table II for details.
See legend
by guest on May 20, 2018
http://ww
w.jbc.org/
Dow
nloaded from

Issue of March 25, 1967 Segal, Himmelfarb, and Harrhgton
TABLE V
Amino acid compositions and masses of chymolryptic peptides released from myosin at various stages of proteolysis
1247
1 3 bonds / 6 bonds 1 14 bonds 1 25 bonds / 30 bonds j 45 donds 1 61 bonds 1 90 bonds 1 118 bonds 1 151 bonds 1 243 bonds I-
Amino acid
Lysine................... 8.1 9.0 8.9 10.1 10.5 Histidine 2.3 2.6 3.1 2.7 2.5 Arginine . 6.4 6.0 6.1 6.0 6.3 Aspartic acid.. 9.6 9.5 10.4 10.1 10.5 Threonine.. 3.4 3.2 3.2 3.8 3.4 Serine 8.5 8.7 7.1 7.5 7.4 Glutamic acid. 14.0 14.8 15.8 16.7 17.6 Proline. 5.4 4.6 3.8 3.7 3.3 Glycine 5.9 6.7 6.3 5.5 5.2 Alanine................... 13.3 12.1 10.6 10.5 10.1 Valine 6.3 7.1 6.7 6.2 6.4 Methione 2.3 1.8 1.0 1.1 1.4 Isoleucine 3.8 3.6 4.0 3.7 4.1 Leucine. 4.0 4.8 5.0 5.9 6.0 Tyrosine.................. 2.0 1.7 2.6 2.1 1.6 Phenylalanine.. . 4.9 4.7 5.4 4.4 3.9
Mass released per 6 X 10⁶ g of myosin.
Average peptide mass. 4,620 5,800 1,900 14,500 22,900 39,700 44,800 71,000 83,000 103,000 1,540 970 832 589 753 888 738 789 689 690
residues/100 residues
9.9 10.9 10.2 10.5 10.7 11.0 2.2 2.2 1.9 2.0 2.2 2.1 5.4 5.9 5.3 5.6 5.7 5.5
10.1 10.6 9.8 9.7 9.6 9.5 4.0 4.1 4.1 4.4 4.8 4.9 7.4 6.8 6.3 6.2 5.8 5.2
17.9 19.3 19.3 18.8 18.5 17.9 2.7 1.5 2.2 1.9 2.6 2.7 5.5 5.6 5.9 5.3 4.8 5.1
10.4 10.7 10.5 10.3 9.6 9.2 5.9 8.1 5.8 5.7 5.6 5.8 1.7 0 1.8 1.9 2.4 2.5 3.5 2.0 3.6 3.7 3.7 4.0 7.2 7.4 7.7 8.0 8.3 8.5 2.0 0 1.8 2.1 1.9 2.3 4.3 4.2 3.6 3.8 3.9 4.0
1
-
176,000 705
- -
Chymotrypsin-The fraction of the myosin mass released by TABLE VI each enzyme at various stages of digestion was determined by Some properties of peptides released at various stages of tryptic
digestion of myosin digesting approximately 250 mg of myosin (0.5 M KCl) in sepa- rate pH-stat experiments. The peptides were isolated quantita- tively as described under “Materials and Methods,” and the total mass was determined from micro-Kjeldahl analysis based on the amino acid composition of each peptide sample. Flesults are summarized in Table VI (trypsin) and Table V (chymotryp- sin).
With trypsin, where the specificity is well defined, the mass, M, of peptides released per mole of myosin can also be estimated from the total number of bonds cleaved, the lysine plus arginine content of these peptides, and the mean residue weight. This calculation assumes (a) that all lysine plus arginine residues are cleaved in the isolated peptide mixture and (b) that every split releases a peptide. Then
-7 Non-COOH-terminal
lysine + arginine 2. Mass
released per 6 X 10’ g of
myosin
4. Peptide mass from lysine + arginine”
3. Average peptide sizea 6. From
mmpari- son of
%E
% d
68 53 50 45 d
37 23 28 20 d
d
5. From inbydrin
% d
69 40 11 33 d
52 15 13 6
d
d
-
6.0 7,200 1,200 3,000 8.2 12,000 1,460 3,800
11.1 10,800 980 5,100 14.8 13,800 930 6,900 19.6 17,400 890 9,5cJo 25.4 20,400 800 12,209 29.6 24,009 810 15,290 45.0 30,409 680 23,500 60.0 43,000 720 31,200 89.7 61,000 680 49,000
180 119,000 660 105,090 298 187,000 625 178,009
(1) 2M = (4 OfR WI
f
where n is the total number of bonds cleaved per mole of myosin, A4RW the mean residue weight of the peptide mixture, and f the ratio of the number of lysine plus arginine residues to the total number of residues released. The estimated average molecular weight of the peptides is given in Column 4 of Table VI.
I f some peptides remain bound to the high molecular weight fragments following proteolysis, then the total mass of the re- leased peptides should be lower than the values estimated from Equation 1. However, just the converse is seen (Table VI, Columns 2 and 4). The peptide mass measured by direct nitro- gen analysis is well over twice the value calculated from Equation 1 at early stages of digestion, and approaches the estimate of Equation 1 only in the late stages of digestion. This suggests that the peptides released initially contain appreciable numbers of interior (i.e. non-COOH-terminal) lysine and arginine resi- dues. That this is, in fact, the case is shown by experiments in which peptide mixtures isolated at various stages of digestion
L
a The peptide mass divided by the number of bonds cleaved per myosin molecule.
* The peptide mass calculated from the number of bonds cleaved per molecule, the number of lysine plus arginine residues per 100 residues, and the mean residue weight (Equation 1, see text).
0 Isolated peptide samples were subjected to further tryptic digestion and released a-amino groups estimated calorimetrically according to the ninhydrin procedure (see text).
d Not determined.
were again exposed to the action of trypsin (for approximately 5 hours with 1: 100, w/w, trypsin to peptide ratio). Peptide bond cleavage in these experiments was estimated calorimetrically with ninhydrin (see “Materials and Methods”). Further tryptic
by guest on May 20, 2018
http://ww
w.jbc.org/
Dow
nloaded from

1248 Peptides Released during Hydrolysis of Myosin Vol. 242, No. 6
digestion was observed in all of the peptide mixtures, the extent of peptide cleavage being greatest in the samples isolated at early stages of digestion. The results of these experiments are pre- sented in Column 5 of Table VI and are expressed as the per- centage of the total lysine plus arginine residues in a given peptide sample which are interior residues. The expected interior frac- tion of lysine plus arginine residues calculated from the differ- ence between Columns 2 and 4 is presented in Column 6 of Table VI. Although the values given in Column 5 show appreciable scatter as a result of the high ninhydrin blanks of the peptides, it seems clear that there is a definite trend and that a real corre- spondence between the two estimates exists. The major conclu- sion, then, of this analysis is that relatively large peptides con- taining a high content of proline and the basic residues, lysine plus arginine, are released into solution soon after initiation of tryptic attack. These peptides, freed from the protein, are eventually degraded by subsequent proteolysis.
Equation 1 was also used to estimate the fractional mass of myosin released as peptides through cleavage by chymotrypsin. In this calculation we have defined f as the ratio of the number of tyrosine plus phenylalanine residues to the total number of residues released. The calculated mass, M, in this case was ob- served to be much higher (about a-fold) than that determined by direct nitrogen analysis. The observed difference is probably a result of two factors, (a) chymotrypsin hydrolyzes peptide nkages at residues other than tyrosine and phenylalanine, and b) a significant amount of peptide material remains bound to
-; 2.5 As = 332 BONDS / MOLECULE
t f 2.4
k, = 6.4 x IO-’ MIN-’
Af=116 BONDS MOLECULE
kf=6.Sx 10-2MIN-’
1.7
16 t ,a,, , , , ,
I 20 40 60 80 100 120 140 160 180 200 220 240 260 260
A TIME (MINUTES1
the high molecular weight fragments following digestion by chymotrypsin.
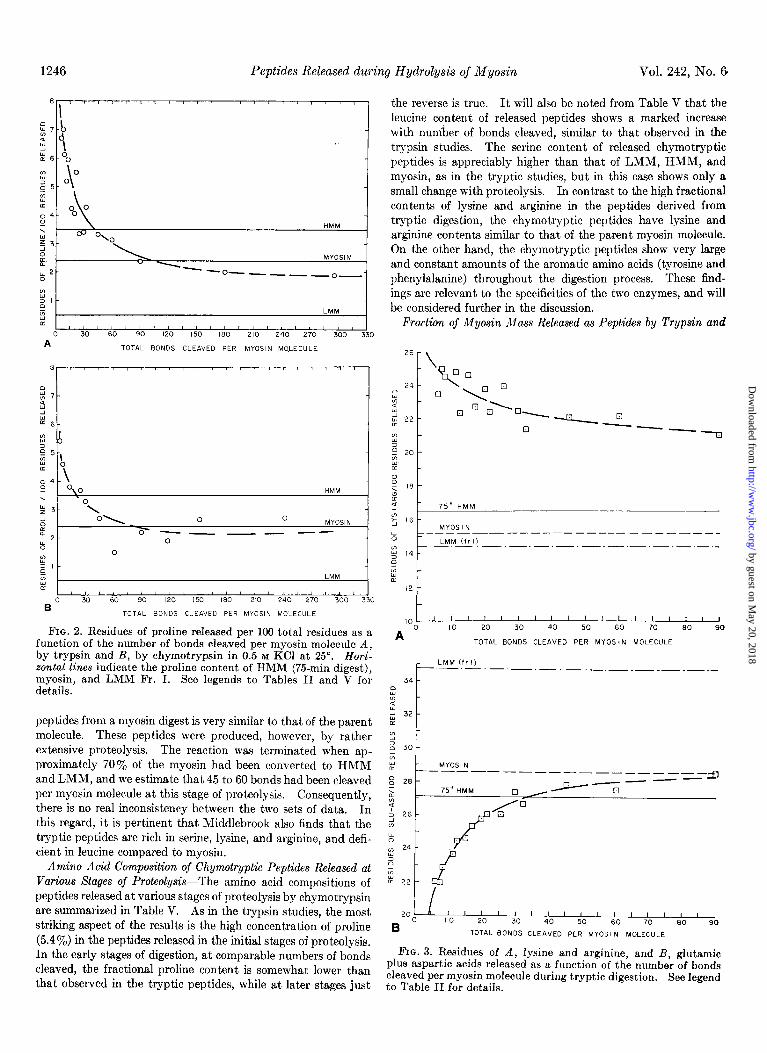
Kinetic.’ Analysis of Tryptic and Chymotryptic Digestions of Myosin-The kinetics of the trypsin-catalyzed peptide bond cleavage of myosin has been investigated in detail in earlier pH- stat (18) studies leading to the conclusion that the over-all process follows the sum of two parallel first order reactions of markedly diiering rates. In the present study different conditions both for the isolation of myosin and for peptide bond cleavage were used (a weight ratio of 1:250, trypsin to myosin, was used in the present study, compared to 1: 125 in the earlier work) and it was therefore important to redetermine the kinetic parameters under the conditions used for the preparation of peptide samples. The pH-stat curves were approximated as a sum of first order re- actions by the method of Prony (see Hildebrand (38)) with the aid of an IBM 7094 digital computer. This method gives a more accurate estimate of the kinetic parameters of fast reactions than the commonly used log difference plots, since slow reactions are not subtracted from the over-all process when the fast reaction constants are derived. In all pH-stat experiments only two first order reactions were required to fit the data, in agreement with the earlier studies of Mihalyi and Harrington (18). When attempts were made to fit the experimental curve with more than two exponential terms, it was found that the additional terms were of negligible magnitude. Analysis of three identical experiments gave 114 f 8 and 392 LIZ 6 bonds cleaved per myosin molecule for the fast and the slow reactions, respec-
At = 77 BONDS MOLECULE
kf = 570 x IO-‘MIN-’
16 , , , , ( , , , , , , , ,
440 / I1 / I1 1
Of”’ a r 1 r 11 2 ’ 11 20 40 60 80 100 120 140 160 180 200 220 240260 iB0 300 320
B TIME (MINUTES)
FIG. 4. Kinetic analyses of pH-stat curves for the digestion of myosin by trypsin (A) and by chymotrypsin (I?). Upper, resolution of experimental curves into the fast df) and slow (s) first order reactions; lower, reconstruction of experimental pa-stat curves with parameters derived from the kinetic analyses. 0, data from pH-stat tracings; 0, calculated values. For conditions of experiments, see “Materials and Methods.”
by guest on May 20, 2018
http://ww
w.jbc.org/
Dow
nloaded from

Issue of March 25, 1967 Segal, Himmelfarb, and Hawington 1249
0
TOTAL BONDS CLEAVED PER MYOSIN MOLECULE
FIG. 5. Number of bonds cleaved in the fast cf) reaction of tryptic and chymotryptic digestions of myosin plotted as a function of the total number of bonds cleaved (fast plus slow reactions) per myosin molecule. Kinetic parameters used in the calculation are the average values reported under “Results.”
tively. The first order rate constants for these reactions were 6.4 f 0.7 x lo* per min, and 6.2 f 0.5 X 10e3 per min, at 25”. The magnitudes of the kinetic classes derived in the present study are appreciably higher than those obtained by Mihalyi and Harrington (93 (fast) and 340 (slow) per 600,000 g of myo- sin), but agree well with the values reported by Young, Him- melfarb, and Harrington (10) and Bfr6 and Balint (39).
Proteolysis of myosin by chymotrypsin shows similar behavior. Although the kinetic analysis of the chymotryptic digestion shows the over-all process to be closely approximated by the sum of two parallel first order reactions (with rate constants diiering by a factor of ZO), experiments in which the digestion was fol- lowed in the pH-stat for long periods of time ( >300 min) indi- cated that the slow reaction, unlike that of tryptic digestion, does not follow simple first order kinetics in the late stages of proteoly- sis. We believe that this behavior is related to the broad specific- ity of chymotrypsin. The apparent complexity in the slow reaction process does not, however, affect the kinetic analysis at earlier stages of proteolysis. In the present study 69 f 6 and 476 f 30 bonds were estimated (from three identical pH-stat experiments) for the fast and slow reactions, respectively, with rate constants of 6.5 ZIZ 0.9 x lo* per min and 3.4 f 0.8 X 10m3 per min, at 25”. As in tryptic digestion, sedimentation patterns and accompanying viscosity studies during hydrolysis by chymo- trypsin reveal that the meromyosin fragments are released during the course of the fast reaction.
Fig. 4 illustrates graphically the resolution of the pH-stat diges-
tion curves into the two reaction classes for both trypsin (Fig. 4A) and chymotrypsin (Fig. 4B). This figure also shows that the log difference analysis yields results closely similar to those obtained by the method of Prony. An estimate of the ratio of bonds cleaved in the fast reaction to the total bonds cleaved at any stage of digestion can be obtained from the kinetic parameters describing the over-all digestion process. As will be seen from Fig. 5, about 70% of the total bonds hydrolyzed origi- nate from the fast reaction in the initial stages of tryptic di- gestion. This fraction decreases gradually to about 63% at 90 bonds cleaved (total), and thereafter falls rapidly with further digestion. Thus, making the reasonable assumption that the mass released per bond cleaved is about the same for both the fast and the slow reaction, it follows that in our trypsin studies the major fraction of each peptide sample pro- duced by limited proteolysis (90 or fewer bonds hydrolyzed) of myosin originates from the fast reaction, and that in this range the size of the fraction is relatively independent of the extent of di- gestion. On the other hand, in those samples produced by more extensive proteolyses (180 and 300 bonds hydrolyzed), peptides characteristic of the slow reaction predominate. In the chymo- trypsin studies the situation is qualitatively similar, except that in this case slow reaction peptides predominate at a lower total number of bonds cleaved per myosin molecule.
The rate of production of LMM and HMM was also followed viscometrically under the same conditions of ionic strength, temperature, and enzyme to substrate ratio as in the pH-stttt
by guest on May 20, 2018
http://ww
w.jbc.org/
Dow
nloaded from
1250 Peptides Released during Hydrolysis of Myosin Vol. 242, No. 6
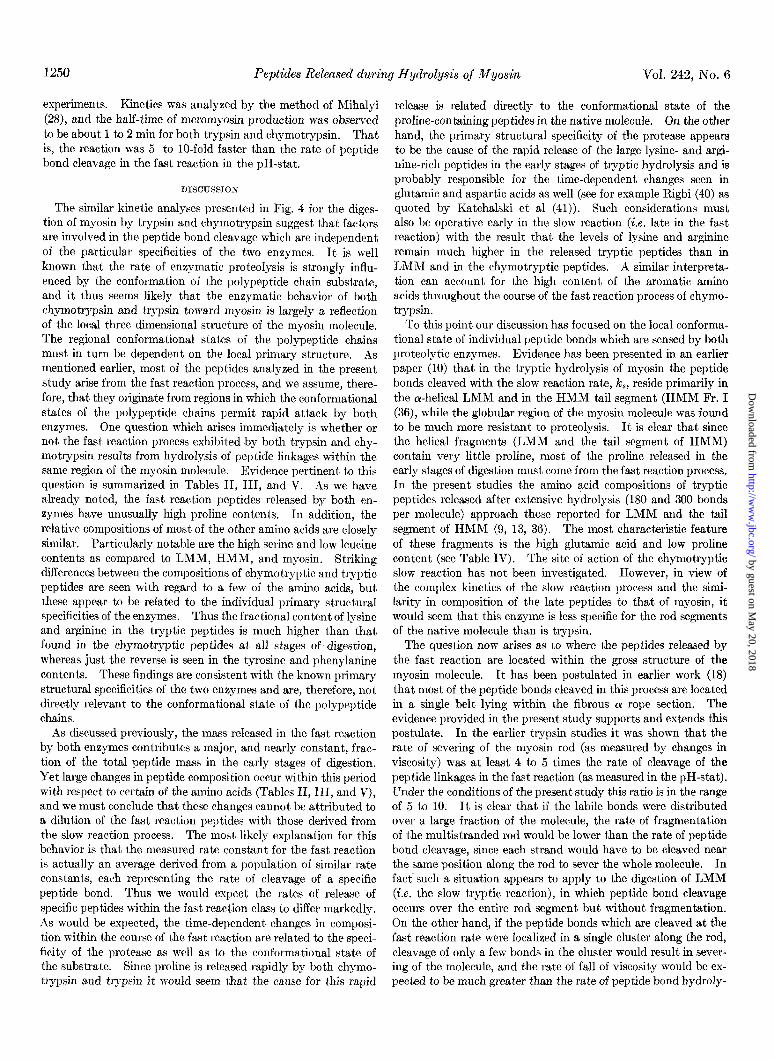
experiments. Kinetics was analyzed by the method of Mihalyi (28), and the half-time of meromyosin production was observed to be about 1 to 2 min for both trypsin and chymotrypsin. That is, the reaction was 5- to lo-fold faster than the rate of peptide bond cleavage in the fast reaction in the pa-stat.
DISCUSSION
The similar kinetic analyses presented in Fig. 4 for the diges- tion of myosin by trypsin and chymotrypsin suggest that factors are involved in the peptide bond cleavage which are independent of the particular specificities of the two enzymes. It is well known that the rate of enzymatic proteolysis is strongly influ- enced by the conformation of the polypeptide chain substrate, and it thus seems likely that the enzymatic behavior of both chymotrypsin and trypsin toward myosin is largely a reflection of the local three dimensional structure of the myosin molecule. The regional conformational states of the polypeptide chains must in turn be dependent on the local primary structure. As mentioned earlier, most of the peptides analyzed in the present study arise from the fast reaction process, and we assume, there- fore, that they originate from regions in which the conformational states of the polypeptide chains permit rapid attack by both enzymes. One question which arises immediately is whether or not the fast reaction process exhibited by both trypsin and chy- motrypsin results from hydrolysis of peptide linkages within the same region of the myosin molecule. Evidence pertinent to this question is summarized in Tables II, III, and V. As we have already noted, the fast reaction peptides released by both en- zymes have unusually high proline contents. In addition, the relative compositions of most of the other amino acids are closely similar. Particularly notable are the high serine and low leucine contents as compared to LMM, HMM, and myosin. Striking differences between the compositions of chymotryptic and tryptic peptides are seen with regard to a few of the amino acids, but these appear to be related to the individual primary structural specificities of the enzymes. Thus the fractional content of lysine and arginine in the tryptic peptides is much higher than that found in the chymotryptic peptides at all stages of digestion, whereas just the reverse is seen in the tyrosine and phenylanine contents. These findings are consistent with the known primary structural specificities of the two enzymes and are, therefore, not directly relevant to the conformational state of the polypeptide chains.
As discussed previously, the mass released in the fast reaction by both enzymes contributes a major, and nearly constant, frac- tion of the total peptide mass in the early stages of digestion. Yet large changes in peptide composition occur within this period with respect to certain of the amino acids (Tables II, III, and V), and we must conclude that these changes cannot be attributed to a dilution of the fast reaction peptides with those derived from the slow reaction process. The most likely explanation for this behavior is that the measured rate constant for the fast reaction is actually an average derived from a population of similar rate constants, each representing the rate of cleavage of a specific peptide bond. Thus we would expect the rates of release of specific peptides within the fast reaction class to differ markedly. As would be expected, the time-dependent changes in composi- tion within the course of the fast reaction are related to the speci- ficity of the protease as well as to t,he conformational state of the substrate. Since proline is released rapidly by both chymo- trypsin and trypsin it would seem that the cause for this rapid
release is related directly to the conformational state of the proline-containing peptides in the native molecule. On the other hand, the primary structural specificity of the protease appears to be the cause of the rapid release of the large lysine- and argi- nine-rich pept,ides in t,he early stages of tryptic hydrolysis and is probably responsible for the time-dependent changes seen in glutamic and aspartic acids as well (see for example Rigbi (40) as quoted by Katchalski et al (41)). Such considerations must also be operative early in the slow reaction (i.e. late in the fast reaction) with the result that the levels of lysine and arginine remain much higher in the released tryptic peptides than in LMM and in the chymotryptic peptides. A similar interpreta- tion can account for the high content of the aromatic amino acids throughout the course of the fast reaction process of chymo- trypsin.
To this point our discussion has focused on the local conforma- tional state of individual peptide bonds which are sensed by both proteolytic enzymes. Evidence has been presented in an earlier paper (10) that in the tryptic hydrolysis of myosin the peptide bonds cleaved with the slow reaction rate, k,, reside primarily in the a-helical LMM and in the HMM tail segment (HMM Fr. I (36), while the globular region of the myosin molecule was found to be much more resistant to proteolysis. It is clear that since the helical fragments (LMM and the tail segment of HMM) contain very little proline, most of the proline released in the early stages of digestion must come from the fast reaction process. In the present studies the amino acid compositions of tryptic peptides released after extensive hydrolysis (180 and 300 bonds per molecule) approach those reported for LMM and the tail segment of HMM (9, 13, 36). The most characteristic feature of these fragments is the high glutamic acid and low proline content (see Table IV). The site of action of the chymotryptic slow reaction has not been investigated. However, in view of the complex kinetics of the slow reaction process and the simi- larity in composition of the late peptides to that of myosin, it would seem that this enzyme is less specific for the rod segments of the native molecule than is trypsin.
The question now arises as to where the peptides released by the fast reaction are located within the gross structure of the myosin molecule. It has been postulated in earlier work (18) that most of the peptide bonds cleaved in this process are located in a single belt lying within the fibrous ar rope section. The evidence provided in the present study supports and extends this postulate. In the earlier trypsin studies it was shown that the rate of severing of the myosin rod (as measured by changes in viscosity) was at least 4 to 5 times the rate of cleavage of the peptide linkages in the fast reaction (as measured in the pH-stat). Under the conditions of the present study this ratio is in the range of 5 to 10. It is clear that if the labile bonds were distributed over a large fraction of the molecule, the rate of fragmentation of the multistranded rod would be lower than the rate of peptide bond cleavage, since each strand would have to be cleaved near the same position along the rod to sever the whole molecule. In fact’ such a situation appears to apply to the digestion of LMM (i.e. the slow tryptic reaction), in which peptide bond cleavage occurs over the entire rod segment but without fragmentation. On the other hand, if the peptide bonds which are cleaved at the fast reaction rate were localized in a single cluster along the rod, cleavage of only a few bonds in the cluster would result in sever- ing of the molecule, and the rate of fall of viscosity would be ex- pected to be much greater than the rate of peptide bond hydroly-
by guest on May 20, 2018
http://ww
w.jbc.org/
Dow
nloaded from

Issue of March 25, 1967 Xegal, Himmelja.d, and Harrington 1251
sis. This in fact is observed. This argument does not rule out (42), these authors found values in the range, 380,000 to 400,000 the possibility that some of the peptide bonds of the fast reaction for HMM. Based on these studies and the present estimate of are located in other regions of the myosin molecule, but it does the mass released as peptides, the molecular weight of the native suggest that a large number of these bonds are located within myosin molecule would lie somewhere between 565,000 and the cluster jcining the LMM and HMM segments. 645,000 g per mole.
Similar considerations apply to the chymotryptic digestion of The length of the LMM particle has been established at 600 to myosin. Here again the viscosity falls at a-rate which is much 700 A by electron microscopic and hydrodynamic measurements more rapid than the rate of cleavage of the peptide bonds of the (g-12). Thus, one edge of the rapidly digested region lies fast reaction. roughly 600 A from the ta.il end of the native molecule. The
Since the evidence suggests that the rapidly cleaved bonds length of the rapidly digested region would be 340 to 420 A for a
form a cluster within the predominantly a-helical rod segment completely a-helical structure, assuming a 3 stranded cr rope of myosin, we may ask what special feature of this segment (10). Because of the presence of proline residues we expect this renders it particularly susceptible to proteolytic attack. Our to be a minimum length. present evidence, when taken in conjunction with earlier studies, The function of the protease-sensitive structural region within suggest that this unusual sensitivity to enzymatic attack is pri- the predominantly a-helical tail segment is not understood at the marily dependent on the presence of an appreciable number of present time. In view of its location within the rod segment of proline residues which are concentrated within a narrow belt of myosin, it is possible that the region may play a role in the pack- the rod-like tail portion of the molecule. By virtue of their stereo- ing of the relatively stiff myosin molecules into the helical array chemistry these residues would tend to interrupt the folded of the thick filament. a-helical conformation common to each polypeptide chain within the myosin tail segment. In view of the rapid release of proline in the early stages of the fast reaction, it seems likely that the nonhelical regions in the vicinity of these residues are the points of initial attack by both trypsin and chymotrypsin. Since proline residues are released throughout the course of the fast reaction, we suggest that these residues are distributed over the protease-labile belt.
REFERENCES
An estimate of the mass released by the fast reaction can be ob- tained from the average size of the peptides and the total number of bonds cleaved in this process. The average peptide size was determined from samples obtained in the later stages of the fast reaction process (45 to 180 bonds cleaved). Column 3 of Table VI shows that the average peptide mass in this range is virtually constant at about 680 grams per mole of myosin. In view of the close agreement between Columns 2 and 4 of Table VI, it appears that every bond cleaved releases a single peptide in the late stages of the fast reaction (45 to 180 bonds). Since 114 bonds are cleaved in the fast reaction, the total mass released is 78,000 g per mole of myosin. This value must be considered minimal, since an average of 20% of the peptide mass is lost in the isolation procedure (see “Materials and Methods”). Thus, assuming that all of the peptide bonds cleaved in the fast reaction are located in the protease-sensitive belt, our best estimate of the size of this region is 78,000 to 97,000 g per mole. A similar calculation based on the chymotrypsin results is not possible in view of the probable absence of a one-to-one correspondence between bonds cleaved and the number of peptides released.
2. 3. 4.
5. 6.
7.
SZENT-GYORGYI, A., Discussions Faraday Sot., 11, 213 (1951). GERGELY, J., F~der&ion Proc., 9, 176 (1950). GERGELY, J., J. Biol. Chem., 200, 543 (1953). MIHALYI, E., AND SZENT-GYORGYI, A. G., J. Biol. Chem.. 201.
189 (1953): SZENT-GYORGYI, A. G., Arch. Biochem. Biophys., 42,305 (1953). COHEN, C., AND SZENT-GYORGYI, A. G.. J. Am. Chem. Sot.. 79. I
248 (1957).
8.
9. 10.
11.
QZENT-GYORGYI, A. G., COHEN, C., AND PHILPOTT, D. E., J. Mol. Biol., 2, 133 (1960).
LOWEY, S., AND HOLTZER, A., Biochim. Biophys. Acta, 34, 470 (1959).
LOWEY, S., AND COHEN, C., J. Mol. Biol.. 4. 293 (1962). YOUNG; L). M., HIMM~LF~RB, S., AND HARRIN~TON; W. F.,
J. Biol. Chem.. 239. 2822 (1964). RICE, R. V., in j. G&ELy‘(Editor), Biochemistry of muscle
contraction, Little, Brown and Company, Boston, 1964, p. 41.
12. 13.
14. 15.
HUXLEY, H. E., J. Mol. Biol., 7, 281 (1963). YOUNG, D. M., HIMMELFAR~, S., AAD HARRINGTON, W. F.,
J. Biol. Chem.. 240.2428 (1965). MUELLER, H., A&D PERRY,‘~. VI, Biochem. J., 86,431 (1962). KIELLEY, W. W., AND HARRINGTON, W. F., Biochim. Biophys.
Acta, 41, 401 (1960). 16. WOODS, E. F., HIMMELFARB, S., AND HARRINGTON, W. F.,
J. Biol. Chem., 238, 2374 (1963). ZOBEL, C. R., AND CARLSON, F. D., J. Mol. Biol., 7, 78 (1963). MIHALYI, E., AND HARRINGTON, W. F., Biochim. Biophys.
Ada, 36, 447 (1959).
It is clear that in the evaluation of the molecular weight of the parent myosin molecule based on the molecular weights of the LMM and HMM fragments, the total mass of low molecular weight peptides must be taken into account. Two different laboratories have recently published extensive molecular weight studies on the meromyosins as a function of protein concentra- tion, and report closely similar values. From Archibald ap- proach to equilibrium sedimentation experiments, Mueller (26) has obtained infinite dilution molecular weights of 151,000
17. 18.
19.
20. 21.
22.
GERGELY, J., GOUVEA, M. A., AND KARIBIAN, D., J. Biol. Chem., 212, 165 (1955).
23. 24.
MIDDLEBROOK, W. R., Science, 130, 621 (1959). KOMINZ, D. R., MITCHELL, E. R., NIHEI, T., AND KAY, C. M.,
Biochemistry, 4,2373 (1965). KIELLEY, W. W., AND BRADLEY, L. B., J. Biol. Chem., 218,
653 (1956). SCHOELLMANN, G., AND SHAW, E., Biochemisfry, 2, 252 (1963). SHAW, E., MARES-GIJIA, M., AND COHEN, W., Biochemistry,
4, 2219 (1965). 25. GELLERT, M., AND ENGLANDER, S. W., Biochemistry, 2, 39
(1963). 26. MUELLER, H., J. Biol. Chem., 239, 797 (1964).
(LMM) and 350,000 (HMM). Young, Himmelfarb, and Har- 27. TONOMURA, Y., APPEL, P., AND MORALES, M., Biochemistry, rington (10, 13) have obtained values between 146,000 and 6, 515 (1966).
162,000 g per mole (LMM) and 362,000 g per mole (HMM) from 28. MIHALYI, E., J. Biol. Chem., 291, 197 (1953).
short column low speed sedimentation equilibrium studies. 29. GUGGENHEIM, E. A., Phil. Mag., 2, 538 (1926).
With the high speed meniscus depletion technique of Yphantis 30. FAHRNEY, D. E., AND GOLD, A. M., J. Am. Chem. Sot., 86,
997 (1963).
by guest on May 20, 2018
http://ww
w.jbc.org/
Dow
nloaded from

1252 Peptides Released during Hydrolysis of Myosin Vol. 242, No. 6
31. SPACKMAN, D. H., STEIN, W. H., AND MOORE, S., Anal. Chem., of muscle contraction, Little, Brown and Co., Boston, 1963, 20, 1190 (1958). p. 27.
32. MOORE, S., J. Biol. Chem., 236, 235 (1963). 33. MOORE, S., AND STEIN, W. H., in S. P. COLOWICK AN,? N. 0.
KAPLAN (Editors), Methods in enzymology, Vol. VI, Aca- demic Press, New York, 1963, p. 819.
34. MILLER, R. L., AND HOUQHTON, J. A., J. Biol. Chem., 169, 373 (1945).
38. HILDEEIRAND, F. B., Introduction to numerical, analysis, Mc- Graw-Hill Book Company, Inc., New York, 1966, p. 378.
39. Bf~6, N. A., AND B~LINT, M., Acta Biochim. Biophys. Acad. Sci. Hung., 1, 13 (1966).
35. ROSEN, H., Arch. Biochem. Biophys., 67, 10 (1957). 36. LOWEY, S., Science, 146, 597 (1964). 37. MIDDLEBROOK, W. R., in J. GERQELEY (Editor), Biochemistry
40. RIGBI, M., Ph.D. thesis, Hebrew University, Jerusalem, 1957. 41. KATCHALSKI, E.; SELA, M., SILMAN, H. I., AND BERGER, A.,
in H. NEURATH (Editor), The proteins, VoZ. ZZ, Academic Press, New York, 1963, p. 406.
42. YPHANTIS, D. A., Biochemistry, 3, 297 (1964).
by guest on May 20, 2018
http://ww
w.jbc.org/
Dow
nloaded from

David M. Segal, Sylvia Himmelfarb and William F. HarringtonHydrolysis of Myosin
Composition and Mass of Peptides Released during Tryptic and Chymotryptic
1967, 242:1241-1252.J. Biol. Chem.
http://www.jbc.org/content/242/6/1241Access the most updated version of this article at
Alerts:
When a correction for this article is posted•
When this article is cited•
to choose from all of JBC's e-mail alertsClick here
http://www.jbc.org/content/242/6/1241.full.html#ref-list-1
This article cites 0 references, 0 of which can be accessed free at
by guest on May 20, 2018
http://ww
w.jbc.org/
Dow
nloaded from