Composites Market Report 2015 · 24 The GRP market in Europe 2015 ... the composites market report...
44
September 21 st 2015 page 1/44 Composites Market Report 2015 Market developments, trends, outlook and challenges The global CRP-Market – Thomas Kraus, Michael Kühnel (CCeV) The GRP-Market Europe – Dr. Elmar Witten (AVK) September 2015
Transcript of Composites Market Report 2015 · 24 The GRP market in Europe 2015 ... the composites market report...
September 21st 2015 page 1/44
Composites Market Report 2015 Market developments, trends, outlook and challenges The global CRP-Market – Thomas Kraus, Michael Kühnel (CCeV) The GRP-Market Europe – Dr. Elmar Witten (AVK)
September 2015

September 21st 2015 page 2/44
Content
The global CRP-Market 2015 General ..................................................................... 4
General ...................................................................................................................... 4
Explanation of terms ................................................................................................ 5
The global Carbon fiber market ............................................................................... 6
By manufacturer ................................................................................................... 7 By region .............................................................................................................. 8 By application ....................................................................................................... 9
The global Carbon Composites market ................................................................ 12
By matrix ............................................................................................................ 13 By manufacturing process .................................................................................. 14 By region ............................................................................................................ 16 By application ..................................................................................................... 17
Trends and outlook ................................................................................................ 19
By region (CF) .................................................................................................... 19 By application (CC) ............................................................................................ 20 Comparison with Composites Germany market survey...................................... 22
Final observations .................................................................................................. 23
Literature ................................................................................................................. 24 The GRP market in Europe 2015 ........................................................................... 27
The market under review ....................................................................................... 28
GRP production in 2015: overall development .................................................... 29
Development tendencies of processes/parts ....................................................... 31
Duroplastic materials .......................................................................................... 32 Thermoplastic materials ..................................................................................... 35
Application industries at a glance ........................................................................ 37
GRP production in 2015: By countries ................................................................. 38
Other composite materials .................................................................................... 40
Outlook .................................................................................................................... 41

September 21st 2015 page 3/44 Thomas Kraus, Michael Kühnel
The global CRP-Market 2015
CCeV and the Authors
Thomas Kraus and Michael Kühnel are project architects at Carbon Composites e.V.
(CCeV) and have created the CCeV Market report since 2014.
Carbon Composites e.V. (CCeV) is a network of Companies and Research institutes,
which cover the entire value chain of high performance fiber composite materials.
CCeV links research and business in Germany, Austria and Switzerland.
CCeV sees itself as a competence network to promote the application of fiber
composite materials. The activities of the CCeV are directed towards the marketable
high performance fiber composite structures product group. The focus points lie on
fiber composite structures with plastic matrixes as familiar to the general public from
a range of applications, as well as on fiber composite structures with ceramic
matrixes with their high resistance to temperature and wear and on high performance
fiber composite materials for the construction industry.

September 21st 2015 page 4/44 Thomas Kraus, Michael Kühnel
The global CRP-Market 2015 General
General
Now in its sixth issue, the composites market report from CCeV and AVK has been
published yearly since 2010 and in the meantime has been attracting more and more
attention and recognition, also outside the German language spectrum. With a total
of 272 members (Status September 2015) CCeV represents a significant number of
companies, research institutes and other sundry organisations in the Carbon Fiber
and Carbon Composite markets in Germany, Austria and Switzerland.
Almost 63% (a figure of 79,200 tonnes) of the worldwide production in 2014 of
Carbon Fibers came from the CCeV members SGL, Toray, TohoTenax, Cytec and
Hexcel which underlines the international relevance of the globally active CCeV
membership. As part of our contribution our members prepared information and data
and also with the help of current market data from among others, Lucintel [1], [2] and
Acmite [3] were able to check and complement said information. With regards to
structure, the current market report follows that of last year in order to bring you the
familiar format and allow for easy comparisons.

September 21st 2015 page 5/44 Thomas Kraus, Michael Kühnel
Explanation of terms
Because some reports make no mention of how the reported growth rates are
calculated, or indeed that these are sometimes mixed up, both of the most prevalent
growth rates as well as their calculation, are listed below:
• Averaged Annual Growth Rate (AAGR) = Arithmetic Mean Return (AMR) =
Arithmetic Mean from n annual growth rates (AGR):
𝐴𝐴𝐺𝑅(𝑡1, 𝑡𝑛) =𝐴𝐺𝑅(𝑡1) + 𝐴𝐺𝑅(𝑡2) + ⋯+ 𝐴𝐺𝑅(𝑡𝑛)
𝑛=
1𝑛�𝐴𝐺𝑅(𝑡𝑖)𝑛
𝑖=1
• Compound Annual Growth Rate (CAGR) = annual growth rate between n
years assuming a constant growth in percentage terms: 𝐶𝐴𝐺𝑅(𝑡1, 𝑡𝑛) =
�𝐴(𝑡𝑛)𝐴(𝑡1)�
1𝑛 − 1 ↔ 𝐴(𝑡𝑛) = 𝐴(𝑡1)(1 + 𝐶𝐴𝐺𝑅)𝑛
This market report calculates growth rates exclusively on the basis of the CAGR as
this better represents exponential growth rate relationships when we have constant
market growth rates. The represented trend lines in the following diagrams are based
on exponential curves also for this reason.

September 21st 2015 page 6/44 Thomas Kraus, Michael Kühnel
The global Carbon fiber market
The global requirement for Carbon fiber of roughly 53,000 tonnes in 2014, slightly
exceeds the expected figures from last year’s report. This represents a growth of
14% over the previous year (46,500 tonnes) and when the years after the financial
crisis 2009 (26,500 tonnes) are compared, then requirement has doubled. The
annual growth rate, taking 2008 as a starting point (31,500 tonnes) is 9.1%, and
when 2009 is taken (26,500 tonnes), it is 14.9%.
Total turnover achieved worldwide with CF makes up around 1.98 billion US$ for
2014. When one compares the figure of 1.77 billion US$ (2013), we see a growth
rate of 11.9 %.
On a whole the demand for carbon fiber has shown steady growth since the general
economic recession of 2009 (see Figure 1). The initial strong annual growth rates of
over 20% seen after 2009 have reduced over the following years to a normal growth
rate of 6.9% for 2013. From 2013 to 2014 we are again seeing a marked increase in
the annual growth rate of 14%. With a view to the coming years, it can be assumed
that a further slight increase in the annual growth rates will be seen, levelled off at
around 12% so that we could break through the 100,000 tonnes of carbon fibers
demand mark already in 2020.
Figure 1: Global demand for Carbon fiber in 1,000 tonnes 2009 to 2021 (* Estimates).
27 33
39 44 47 53
58 65
92
116
0
20
40
60
80
100
120
140
2009 2010 2011 2012 2013 2014 2015* 2016* 2019* 2021*

September 21st 2015 page 7/44 Thomas Kraus, Michael Kühnel
By manufacturer
The takeover of Zoltek by Toray is certainly the most notable change in the overview
of the ten leading carbon fiber producers (see Figure 2). The planned acquisition was
already public at the end of 2013 and was executed last year. In 2014, the two firms
together had a yearly production capacity of 44,500 tonnes of carbon fiber. Toray
increased its capacity by 6,000 tonnes to 27,100 tonnes in 2014. [4] [5] With an
estimated total global capacity of 125,000 tonnes of carbon fiber on the basis of
Polyacrylnitrile (PAN) and Pitch, this encompasses around one third of the global CF
market.
Other fiber manufacturers have also increased their CF production capacities, or
have an increase planned. Mitsubishi Chemical Holdings Corporation announced that
their two subsidiaries Mitsubishi Rayon (MRC) and Mitsubishi Plastics (MPI) will in
the future operate together in the carbon fiber business. MRC produces PAN based
Carbon fibers, MRC Pitch based fibers. [6] The CF capacity of MRC has been newly
evaluated at 11,100 tonnes and a further expansion of the production capacity in
Sacramento (USA) has been announced. [7] SGL and BMW have installed two
further production lines in Moses Lake with a capacity of 3,000 tonnes in a
cooperation already mentioned in last year’s report. [8]
Figure 2: CF capacity by manufacturer in 1,000 tonnes. (2014)
21,1
9,0 11,5 11,1 8,8 7,2 4,0 1,8 9,2
6,0
3,0 -2,4
4,0 1,7 3,0
6,2
17,4
0,05,0
10,015,020,025,030,035,040,045,0
Yearly CF capacity 2013 Growth 2014 Zoltek

September 21st 2015 page 8/44 Thomas Kraus, Michael Kühnel
AKSA has doubled its capacity with a second production line and a small expansion
of its existing line. [9] Toho Tenax ended its CF production in the USA in 2014; the
annual CF capacity therefore was reduced by the 2,400 tonnes lost in the USA, to
11,500 tonnes in total. New entries to the top ten are the Chinese firms Zhongfu-
Shenying and Hengshen Fibre Material with 4 resp. 3 thousand tonnes production
capacity.
A relatively large growth can also be observed among the smaller producers
summarised under the "others" tag, above all in China (Dalian Xingke Carbon Fiber
or Yingyou Group Corp.), South Korea (Hyosung), Russia (Composite Holding Co.,
Alabuga-Fibre LLC) and India (Kemrock Industries and Exports Ltd.) with production
capacities under 3 thousand tonnes. Saudi Arabia is also attempting to gain a
foothold in the Carbon fiber market with Saudi Basic Industries Corp. (SABIC). A
factory complex with a planned yearly capacity of 2 to 3 thousand tonnes CF should
come into operation in 2015.
In total the ten leading fiber manufacturers make up almost 88% of the global Carbon
fiber capacity and are still the dominant forces. When one considers the CF demand
from 2014, then over capacity is still lying at around 42%.
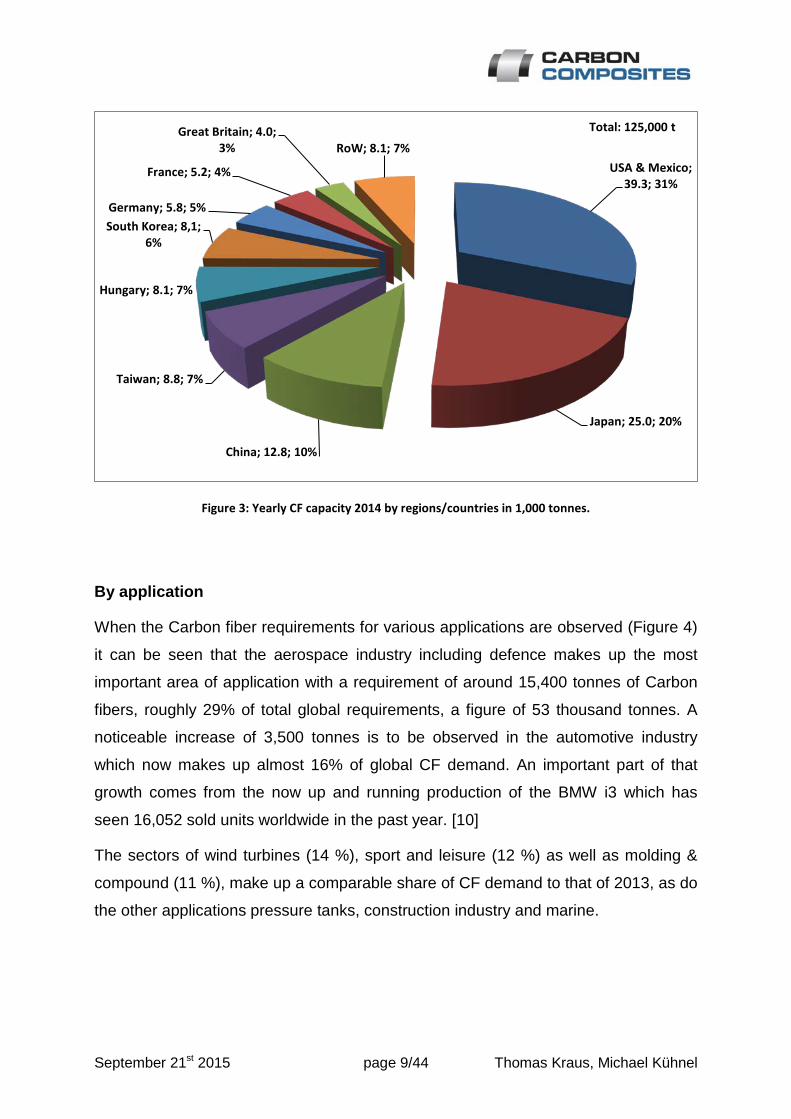
By region
The yearly production capacity of 125 thousand tonnes divided up among the various
regions resp. countries can be seen in Figure 3. As in previous years the most
important regions are in Asia incl. the Pacific area with 47%, North American with
31% and Europe with around 20% of the global capacity in tonnage. In particular the
Japanese based market leading fiber producers Toray, MRC and Toho account for
the high percentage of capacity in the Asian sector. China is also building up its
production capacity and has achieved a total of roughly 13 thousand tonnes for 2014
or resp. 10% of global CF capacity. Germany, France and Great Britain remain
mostly unchanged and therefore make up a share of 5%, 4% and 3%.
September 21st 2015 page 9/44 Thomas Kraus, Michael Kühnel
Figure 3: Yearly CF capacity 2014 by regions/countries in 1,000 tonnes.
By application
When the Carbon fiber requirements for various applications are observed (Figure 4)
it can be seen that the aerospace industry including defence makes up the most
important area of application with a requirement of around 15,400 tonnes of Carbon
fibers, roughly 29% of total global requirements, a figure of 53 thousand tonnes. A
noticeable increase of 3,500 tonnes is to be observed in the automotive industry
which now makes up almost 16% of global CF demand. An important part of that
growth comes from the now up and running production of the BMW i3 which has
seen 16,052 sold units worldwide in the past year. [10]
The sectors of wind turbines (14 %), sport and leisure (12 %) as well as molding &
compound (11 %), make up a comparable share of CF demand to that of 2013, as do
the other applications pressure tanks, construction industry and marine.
USA & Mexico; 39.3; 31%
Japan; 25.0; 20%
China; 12.8; 10%
Taiwan; 8.8; 7%
Hungary; 8.1; 7%
South Korea; 8,1; 6%
Germany; 5.8; 5%
France; 5.2; 4%
Great Britain; 4.0; 3% RoW; 8.1; 7%
Total: 125,000 t

September 21st 2015 page 10/44 Thomas Kraus, Michael Kühnel
Figure 4: Global CF demand in 1,000 tonnes by application (2014).
When analysing carbon fiber revenues by application for 2014 (Figure 5) it must be
taken into account that there are differences between the sectors in terms of the
standard manufacturing processes and quality requirements.
In the segment "Aerospace & Defence" for example a figure of 29% of CF
manufactured generates 48% of worldwide revenues. Especially in the aerospace
industry, in addition to high quality demands, come high costs due to approval
processes and material controls. In all the other application segments, the
percentage share is lower than the produced amount; apart from sport and leisure
the order is comparable to that in Figure 4.
As seen already from the CF demand, the segment of automobile construction has
witnessed a notable increase when it comes to revenues, and has pushed itself
slightly ahead of the segments sport and leisure, wind turbines and molding &
compound. Otherwise there are no major changes in comparison with the turnover
from 2013, at least with regards to the percentage share.
Aerospace & Defence; 15.4; 29%
Automotive; 8.5; 16%
Wind Turbines; 7.4; 14%
Sport & Leisure, 6.4, 12%
Molding & Compound; 5.8;
11%
Pressure Vessels; 2.7; 5%
Civil Engineering; 2.3; 4% Marine; 0.8; 2%
Others; 3.7; 7%
Total: 53,000 t

September 21st 2015 page 11/44 Thomas Kraus, Michael Kühnel
Figure 5: Global CF turnover in US$ million by application (2014).
Aerospace & Defence; 950.4; 48%
Automotive; 217.8; 11%
Sport & Leisure; 205.9; 10%
Wind Turbines; 170.3; 9%
Molding & Compound; 142.6;
7%
Pressure Vessels; 79.2; 4%
Civil Engineering; 75.2; 4%
Marine; 19.8; 1% Others; 118.8; 6% Total: US$ 1.98 billion

September 21st 2015 page 12/44 Thomas Kraus, Michael Kühnel
The global Carbon Composites market
The majority of manufactured carbon fiber is further processed to carbon composites,
which is carbon fiber embedded in a matrix. The CC market is developing more or
less analogue to the CF market, however because of the matrix component, the
amounts mentioned below will be significantly higher.
Figure 6 shows the development of global CRP demand referring to the produced
amount in tonnes. From 2013 to 2014 we can see growth of around 15 % from
72,000 to 83,000 tonnes. An annual growth rate of 11% is assumed for further
development so in 2021 we see a CRP demand of 175,000 tonnes as being possible
to achieve. The European regulations for the reduction of CO2 emissions, together
with the efforts in the USA to achieve more efficient fuel consumption with lightweight
construction are the keys to an increasing share of CRP in the aerospace industry
and especially in automobile construction. Both applications are seen as the driving
forces behind growth over the next years.
Figure 6: Global CRP demand in 1,000 tonnes 2009–2021 (*estimates).
41 51
59 66
72 83
91 101
140
175
0
20
40
60
80
100
120
140
160
180
200
2009 2010 2011 2012 2013 2014 2015* 2016* 2019* 2021*

September 21st 2015 page 13/44 Thomas Kraus, Michael Kühnel
By matrix
Carbon fiber is used almost exclusively to strengthen various matrices. Alongside
carbon, ceramic and metal for materials used in special applications, the following
shall focus mainly on carbon fiber reinforced plastics (CRP). Total revenues for
carbon composites in 2014 were 16.6 billion US$, of which CRP accounted for 10.6
billion US$ (Figure 7). Composites based on a polymer matrix accounted for 64% of
the total revenue achieved with CC in 2014, which is on a par with 2013. [3]
Figure 7 7: CC revenues in US$ billion by matrix material (2014).
The matrix polymers used in CRP production can be further divided into
thermoplastics and thermosetting plastics (see pie chart right Figure 7).
Thermosetting plastics continue to be the most commonly used polymer matrix for
carbon fiber. This is also reflected in the revenue shares of these two polymer types
in the total CRP revenues. The reasons behind the establishment of the use of
thermosetting plastics are for example:
• good mechanical properties
• temperature resistance
• low moisture absorption
• lower material costs for the user (less added value for the material
manufacturer)
• large choice of matrix systems, material producers and production processes
Carbon; 2.24; 13%
Ceramic; 1.66; 10%
Metal; 1.24; 8%
Hybrid; 0.84; 5%
Thermoplastic; 2.55; 15%
Thermoset; 8.08; 49% Polymer;
10.63; 64%
Total: US$ 16.6 billion

September 21st 2015 page 14/44 Thomas Kraus, Michael Kühnel
Thermoplastics on the other hand have advantages which will probably see them
being more widely used in the future, like:
• short processing times (no chemical reaction required as with thermosetting
plastics)
• impact resistence, high damage tolerance
• easily formed and welded
• problem free storage
• easily recyclable
Elastomer matrices are not in common use at the moment, however they may have
more acceptance in the future for e.g. elastic hingeless shaft connections in
mechanical engineering applications.
The authors would like to address the often-put question about the sustained high
prices for "ready-to-use" CRP components in connection with growth in the sector:
If one divides the revenues achieved with CRP of 10.6 billion US$ by the worldwide
demand in 2014 of 83,000 tonnes, one can infer an "imaginary" (averaged over all
branches and applications) price per kilo of 128 US$. Even if this figure has not a
high significance in reality, it does demonstrate that despite on-going calls for ever
cheaper kilo prices particularly from the automotive industry for finished consolidated
and bordered CRP components (partly 25US$/kg and less) that the sizeable average
of the branch lies over this figure and that the market is still showing constant two
digit growth rates. The branch-wide cheapest achievable kilo price is only the edge of
the Gaussian distribution. Even when reduced process costs continue to fall, the
branch average for finished components will continue to lie well above this figure in
the future. But this has not caused any problems to the notable developments of the
past 5 years (demand doubled).
By manufacturing process
A variety of different production processes are used in the manufacture of CRP
materials/components (see Figure 8). When compared to last year’s market report,
Layup processes using prepregs have seen a notable increase from 37% to 45% in
market share. At the same time pultrusion and winding processes have dwindled
from 40% to 26%. These changes can partly be attributed to the increased

September 21st 2015 page 15/44 Thomas Kraus, Michael Kühnel
application of thermoset prepreg material in fiber placement as well as tape laying
processes especially in civil aviation construction (above all A350 and B787).
Additionally one should be careful when comparing the figures with last year's report
as then the figures were referring to CRP revenues in US$, whereas this year on
account of changed databases in production processes, they refer to CRP demand in 1,000 tonnes. A correlation between various production processes regarding
amounts produced and the turnover created, is not familiar to these authors.
This effect is overlain by the various groupings of manufacturing processes through
differing sources (Acmite und Lucintel amongst others). There are several winding
processes e.g. for pressure tanks in the aerospace sector or mechanical engineering,
which use thermoset prepregs. The winding bodies will be compacted in a
subsequent heating process (not autoclave) through a vacuum build up as well as
thermic expansion of the winding spindle. This sample process should demonstrate
the difficulty and uniqueness of categorising some of the many production processes
and their modifications.
Wet lamination and infusion processes have maintained their figure of 11% and are
playing a continued important role in small and minimum series production for small
and medium sized companies. Pressing and injection processes have gained in
Figure 8: Deployment of production processes CRP in 1,000 tonnes (2014).
Prepreg layup process
with/without autoclave; 37.8;
45%
Pultrusion and winding; 21.6; 26%
wet lamination & infusion processes;
8.7; 11%
Press and injection processes; 8.3; 10%
Others; 6.6; 8% Total: 83,000 t

September 21st 2015 page 16/44 Thomas Kraus, Michael Kühnel
importance with a figure of 10% which has justified the expectations of market
analysts, like RTM, through the increase in production of the BMW i3.
By region
Figure 9 shows the demand in tonnes for Carbon Composites by region. The lion's
share of global CC demand lies once more in North America and in the USA in
particular with 38% or 40,000 tonnes resp. Driven by the aerospace and defence
sectors, North America represents the most important economic zone. Next comes
Europe with 35 %, where in addition to aerospace, the wind turbine, automotive and
mechanical engineering sectors dominate the market. Alongside the Japanese fiber
producers Toray, MRC and Toho, the Asian region including the Pacific region is
carried by the emergent wind turbine sector. In India they are continuing with the
initiation of a home produced airplane and China is also forcing its way onto the
market through the Commercial Aircraft Corporation of China (Comac) and is
attempting to compete with the A320 and B737 with their C919. In total, Asia and the
Pacific region account for 23% of global demand.
Figure 9: CC demand in 1,000 tonnes by region (2014).
North America; 40.0; 38%
Europe; 36.8; 35%
Asia & Pacific; 24.2; 23%
RoW; 4.2; 4% Total: 105,200 t

September 21st 2015 page 17/44 Thomas Kraus, Michael Kühnel
By application
Similar to the CF market, the most important market segment in the CC market is
aerospace including defence with about 31% of global CC demand at 105,200
tonnes. (Figure 10) Commercial aviation above all showed a steady growth rate of
7% over the past year in supplied units. Boeing delivered 114 B787s in 2014, almost
double the figure of the previous year.
Airbus is completing 25 to 30 units of their A380 yearly and have 150 orders still
open. A major component of both models are composite structures, accounting for
28% in the A380 and around 50% in the 787.
The automotive sector has the second largest percentage with 21% or almost 22,000
tonnes CC. As announced, BMW has increased production of the i3 over the course
of 2014 to about 100 units per day; the sports car i8 is also on the increase with 10
cars per day being produced and an upward trend reported. [11] The cooperation
with SGL to expand the production capacity of CF in Moses Lake emphasises that
the Bavarian car manufacturer sees a high potential in lightweight construction with
Carbon Composites and is sounding out the market for electric or hybrid sports cars
with its i-projects as well as striving to gain experience in their dealings with carbon
fiber composite materials. Next in importance are wind turbines and sport and leisure
with 12% each, civil engineering with 5% and marine with 1%.
Figure 11 shows the same breakdown, however by revenues in billion US$. It should
be considered that for the subdivision of turnover by application, the various areas of
application are differentiated with regards to standard production processes or quality
requirements. 62% of worldwide revenues with 31% of total CC tonnage came from
the sectors of aerospace including defence, but on account of the high quality
demands amongst other factors, costs are incurred for approvals and material
testing. In all other application areas the revenue share is reduced, the order
however remains the same as that of CC demand.
If one is to calculate an "imaginary" branch specific kilo price from CC revenues and
CC demand, then the results would be as follows:
Aerospace & Defence: 317 US$/kg Wind turbines: 98 US$/kg
Automotive: 87 US$/kg Sport & Leisure: 91 US$/kg

September 21st 2015 page 18/44 Thomas Kraus, Michael Kühnel
While it was to be expected that aerospace and defence would have the highest
price it is somewhat surprising that the average value for automotive lies in a region
which is far removed from the minimum demanded in the branch. Of course this can
be partly explained by sports and premium applications in automotive construction.
However the suspicion remains that, as mentioned in the chapter “By matrix”, the
expected minimum values represent only the lowest limit of what will be a broad
spectrum, also in the future. These figures should also be treated with caution, even
if they provide for optimism, about the price segment prevalent within the industry.
Figure 10: CC demand in 1,000 tonnes by application (2014).
Figure 11: CC demand in US$ billion by application (2014).
Aerospace & Defence; 32.2; 31%
Automotive; 21.8; 21%
Wind Turbines; 13.2; 12%
Sport & Leisure; 13.2; 12%
Civil Engneering; 5.0; 5%
Marine; 1.4; 1% Others; 18.5; 18% Total: 105,200 t
Aerospace & Defence; 10.2; 62%
Automotive; 1.9; 11%
Wind Turbines; 1.3; 8%
Sport & Leisure; 1.2; 7%
Civil Engineering; 0.4; 2%
Marine; 0.1; 1% Others; 1.5; 9%
Total: US$ 16.6 billion

September 21st 2015 page 19/44 Thomas Kraus, Michael Kühnel
Trends and outlook
The global Carbon fiber market has been showing an excellent, stable growth rate
since 2009 and indeed the development over the past year has been better than
expected (Figure 1). For this reason the average annual growth rate of 12% has
been assumed for the next few years. In 2020 we can break through the 100,000
tonne mark for CF demand. Revenues from CF came to almost 2 billion US$ in 2014
and we are also assuming a growth rate of 11% here, which means that in 2021 a
global figure of 4.3 billion US$ can be achieved
By region (CF)
These positive developments are being supported by the investment plans and
cooperation’s of many fiber producers:
• SGL and BMW have already increased the annual production capacity in the
plant in Moses Lake from 3,000 to 6,000 tonnes. In the medium term a third
expansion step will raise the capacity to 9,000 tonnes. [8]
• Mitsubishi Rayon will increase its production capacity in its CF Sacramento, California plant by the middle of 2016 by 2,000 tonnes, thereby doubling its
total capacity. [12]
• Zoltek is planning to double its global production capacity by 2020. In April
2016 its plant in Guadalajara, Mexico will double its capacity to 5,000 tonnes.
[13]
• Ford and DowAKSA have agreed a cooperation to drive the cost effective
production of CC components through joint research and development. This
should occur under the framework of the “Institute for Advanced Composites
Manufacturing Innovation” (IACMI) which is based in welches in Knoxville, Tennessee. [14]
• Hexcel is investing 250 million US$ in the construction of a new factory for CF
production in Roussillon, France. The construction will begin in September
2015 and should be completed in 2018. They are also investing 22 million in
their nearby plants for weaving and production of prepregs between now and
2018. [15]

September 21st 2015 page 20/44 Thomas Kraus, Michael Kühnel
Unfortunately the authors have no comprehensive figures available to enable them to
create a graphic representation of the global situation. It is however clear that the CF
and CC "hot-spots" in the USA and Europe would be well advised to equip
themselves for competition from their growing rivals from Asia in the future,
particularly as major state subsidies have been recently announced or are expected
for the CC and CF sectors.
By application (CC)
A similarly notable growth has been seen in the Carbon Composites market with
total revenues in 2014 of 16.6 billion US$, wherein the lion's share comes from CRP
with 10.6 billion US$ or 84,000 tonnes. The main drivers of these markets are,
alongside aerospace and wind turbines, the growing applications of CRP in the
automotive sector and industry. Market analyses are predicting a yearly growth rate
of around 10.6 %, resulting in CC revenues of 33.6 billion US$ in 2021. Based on a
similar proportional growth by matrix, the revenues from CRP will increase to 21.5
billion US$ resp. 175,000 tonnes annual production by 2021. This corresponds to a
CRP kilo price of 123 US$/kg when averaged over all branches and applications
which underlines the authors assumptions in the chapter “The global Carbon
Composites market – By matrix”, as well as the strict differentiation between a
"cheapest achievable" price and CRP price averaged from all the branches.
The application of CC in the aerospace and defence sector will also show strong
yearly growth rates of up to 13%. The future projects like A350XWB, which will be
constructed with a Composite share of 53 % [9] or the Boeing 777X with CC wings
[10] show that both producers are planning for increased future demand after the
lifetime of the A380 or the 787.
The establishment of high performance carbon composite materials in the automotive
market sector depends in the main on whether an automated highly efficient
production of CC components will result in prices cheap enough for the wider
application in middle class cars and not as present only in the luxury and sport cars
segment.

September 21st 2015 page 21/44 Thomas Kraus, Michael Kühnel
That is why the technical objective (among others) of the top cluster project "MAI
Carbon" is the reduction of process costs by 90% in comparison with a state-of-the-
art aerospace approved hand rest process from 2010, reducing the material costs by
50% as well as reducing the cycle times to under a minute. [16] As soon as these
very ambitious targets can be reached a comprehensive application of CC in the
automotive, mechanical engineering and plant construction industries is to be
expected. BMW has taken on a leading role with their i-project, however the other
leading automotive manufacturers are somewhat reserved in their enthusiasm.
Figure 12 shows a prediction of CC demand in thousand tonnes up to 2021, by
application. It is expected that in summary a markedly higher share of CC will be
used in automotive construction and that by 2020 a higher percentage will be used in
this industry than in aerospace and defence. With a predicted total demand of
220,000 tonnes by 2021, one third will be for automotive construction, one quarter for
aerospace incl. defence, followed by the other applications wind turbines, sport and
leisure, construction (civil engineering) and marine with similar percentage shares as
in 2014. (Figure 10)
Figure 12: Predicted CC demand in 1,000 t by application up to 2021.
32.2
60.3
21.8
65.5
25.9
13.2 19.6
5.0 10.8
1.4 3.1
18.5
34.8
0
10
20
30
40
50
60
70
2014 2015 2016 2017 2018 2019 2020 2021
CC d
eman
d in
1,0
00 t Aerospace & Defence
Automotive
Wind Turbines
Sport & Leisure
Civil Engineering
Marine
Others
Total 2021: 220,000 t
Total 2014: 105,200 t

September 21st 2015 page 22/44 Thomas Kraus, Michael Kühnel
Comparison with Composites Germany market survey
A very positive market outlook can be inferred from the twice-yearly market survey
carried out by the four largest organisations from the composites industry in
Germany, AVK, CCeV, CFK Valley Stade and VDMA Forum Composite Technology
under the umbrella of Composites Germany since 2013 among their members.
Following on from the positive trend determined in the survey from the second half of
2014, the results for the first 6 months of 2015 show once again a positive evaluation
of the business situation. 90% of those surveyed pronounced the worldwide business
outlook as either "mostly positive" or "very positive" (this was 2/3rds in the previous
survey). Europe was positively evaluated as a business region by over 80% of those
surveyed with CRP as the growth driver among the composite materials. [17]
This trend fits very well into the picture of positive outlook found in this report and
provides hope that the two digit growth rates of 2014 can be sustained for the future
and indeed even exceeded.
Figure 13: Evaluation of the current business outlook (worldwide). [17]
1%
23%
73%
3%
2nd half-year 2014
10%
77%
13%
1st half-year 2015
very negative
rather negative
rather positiv
very positive

September 21st 2015 page 23/44 Thomas Kraus, Michael Kühnel
Final observations
After the years of recovery from the financial crisis were marked by an above
average growth rate of 25% (CF demand 20092010) this went steadily downhill to
7% (CF demand 20122013), but 2014 bucked the trend: the global carbon fiber
market showed growth of 14% in CF demand, which is a much higher rate than in
recent years. Demand was 53,000 tonnes of carbon fiber and revenues of almost 2
billion US$.
This strong growth is also evident in the CRP market with 83,000 tonnes produced
and a turnover of 10.6 billion US$ in 2014. When one takes the entire Carbon
Composites Market, total revenues are 16.6 billion US$. A stable growth rate of 11%
per annum is expected over the next few years. The sectors of aerospace including
defence, automotive, wind turbines and sport and leisure are the major driving forces
behind this growth.
The automotive branch shows enormous growth potential, as long as the mass
introduction and establishment of Carbon Composites actually occurs. The strong
growth in demand expected could exceed that of the aerospace and defence sector
by 2020. The most important criteria here are the price developments of CF and CC
as well as the reduction of process cycle times. This uncertainty makes the forecast
of future CF/CC demand as well as the revenues in the automotive sector a less than
exact science.
Even conservative estimates predict an extremely vibrant future market. However the
industry must also overcome a number of hurdles for example in automation, cost
cutting and the development of manufacturing processes suitable for mass
production. The price-performance ratio will then decide which materials or
combinations of materials will be adopted in which application areas. Ecological
aspects (if these are demanded by lawmakers or are not economically
disadvantageous) are likely to assume greater importance than pure economic
considerations in the future.

September 21st 2015 page 24/44 Thomas Kraus, Michael Kühnel
Literature
[1] Lucintel LLC, „Assessment of Global Carbon Fiber and Carbon Composites Market,“ 2015.
[2] Lucintel LLC, Growth Opportunities in Global Carbon Fibre Market: 2014-2019, Irving, USA, 2014.
[3] Acmite Market Intelligence e.K., Market Report: Global Carbon Fiber Composite Market, Ratingen, 2014.
[4] Toray Global, „Production Capacity Toray Group,“ 04 2015. [Online]. Available: http://www.toray.com/ir/management/man_010.html. [Zugriff am 31 08 2015].
[5] Toray Global, „Press Releases Toray Group,“ 09 03 2012. [Online]. Available: http://www.toray.com/news/crb/nr120309.html. [Zugriff am 31 08 2015].
[6] Mitsubishi Plastics, Inc., Mitsubishi Rayon Co., Ltd., „News Release: Enhancement of the Carbon Fiber Business,“ 07 01 2015. [Online]. Available: http://www.mpi.co.jp/english/news/201501070751.html. [Zugriff am 13 08 2015].
[7] Mitsubishi Rayon, „Mitsubishi Rayon Pressroom,“ 30 06 2014. [Online]. Available: https://www.mrc.co.jp/english/pressroom/detail/pdf/20140630192937.pdf. [Zugriff am 28 07 2015].
[8] BMW Group, „BMW Group PresseClub Deutschland,“ 09 05 2014. [Online]. Available: https://www.press.bmwgroup.com/deutschland/pressDetail.html?title=bmw-group-und-sgl-group-verdreifachen-produktionskapazit%C3%A4t-im-karbonfaserwerk-moses-lake&outputChannelId=7&id=T0179312DE&left_menu_item=node__4088. [Zugriff am 07 07 2014].
[9] CompositesWorld, „CompositesWorld Industry News,“ Gardner Business Media, Inc., 20 12 2010. [Online]. Available: http://www.compositesworld.com/news/aksa-adds-second-carbon-fiber-production-line. [Zugriff am 28 07 2015].
[10] BMW Group, „BMW Group PressClub Deutschland,“ 09 01 2015. [Online]. Available: https://www.press.bmwgroup.com/deutschland/pressDetail.html?title=bmw-group-verkauft-2014-mehr-als-zwei-mio-fahrzeuge&outputChannelId=7&id=T0199942DE&left_menu_item=node__804. [Zugriff am 13 08 2015].
[11] A. Tauber, „Die Welt,“ 02 06 2014. [Online]. Available: http://www.welt.de/wirtschaft/article128632098/Der-erste-Blick-in-BMWs-neue-Superfabrik.html. [Zugriff am 06 09 2015].
[12] Mitsubishi Rayon Co., Ltd., „https://www.mrc.co.jp,“ 30 06 2014. [Online]. Available:
September 21st 2015 page 25/44 Thomas Kraus, Michael Kühnel
https://www.mrc.co.jp/english/pressroom/detail/pdf/20140630192937.pdf. [Zugriff am 08 08 2014].
[13] Zoltek, „Zoltek Press Releases,“ 07 05 2015. [Online]. Available: http://zoltek.com/zoltek-de-mexico-to-expand/. [Zugriff am 06 09 2015].
[14] Ford Motor Company, „Ford - News,“ 17 04 2015. [Online]. Available: https://media.ford.com/content/fordmedia/fna/us/en/news/2015/04/17/ford--dowaksa-to-jointly-develop-carbon-fiber-for-high-volume-au.html. [Zugriff am 06 09 2015].
[15] Hexcel Corporation, „News Hexcel Corporation,“ 21 05 2015. [Online]. Available: http://www.hexcel.com/news/market-news/news-20150521. [Zugriff am 06 09 2015].
[16] M·A·I Carbon — Die Spitzencluster-Initiative 2015, „MAI Carbon - Ziele des Clusters,“ [Online]. Available: http://www.mai-carbon.de/index.php/de/mai-carbon/ziele. [Zugriff am 06 09 2015].
[17] D. E. Witten, „Composites Germany Composites-Markterhebung,“ Composites Germany, [Online]. Available: http://www.composites-germany.org/index.php/de/news/pressemitteilungen/239-ergebnis-der-aktuellen-composites-markterhebung-zum-ersten-halbjahr-2015-liegt-vor. [Zugriff am 06 09 2015].

September 21st 2015 page 26/44 Dr. Elmar Witten
The European GRP-market 2015
Author
Dr. Elmar Witten is Managing Director of the AVK - Industrievereinigung Verstärkte Kunststoffe e.V. (Federation of Reinforced Plastics). The AVK, as the German professional association for fibre composite plastics/composites, represents the interests of producers and processors of reinforced plastics/composites on a national and a European level.
Its services include organisation of task forces, seminars and conferences as well as providing market relevant information (www.avk-tv.de).
The AVK is one of the four national pillars of the GKV – Gesamtverband Kunststoffverarbeitende Industrie and an international member of the European composites confederation EuCIA – the European Composites Industry Association.
The AVK is a foundation member of Composites Germany.

September 21st 2015 page 27/44 Dr. Elmar Witten
The GRP market in Europe 2015
Steady growth in production volume is continuing
Europe’s production volume in glass fibre reinforced plastics (GRP) is continuing its steady growth in 2015 at a rate of 2.5%. Having reached 1.069 megatonnes, the production volume is now at its highest level in eight years.
On aggregate, the development of the previous year is continuing in all the European countries. This development is largely following the general economic trend in Europe as a whole and particularly in two areas of application which are the most important for the use of GRP: transport and construction. However, the situation differs from one country to another: Germany and the Eastern European countries under review recorded above-average growth. In Southern Europe, on the other hand, the GRP volume is growing only slightly or even stagnating. In Scandinavia we can even observe a downturn.
The development is similarly heterogeneous for the various processing methods that are used in the production of GRP components. Production has been high above average where it involves the use of RTM and particularly thermoplastic fibre reinforced plastics and composite materials.
The European GRP volume is growing more slowly than the global composites industry and also short fibre reinforced thermoplastics. Although the latter are composites, they are not explicitly included here. The European composite share – currently 25% of the world’s total production – is set to drop even further. However, this does not necessarily apply to value creation, which differs according to the product, method and material (mix). Above-average growth potential can also be observed in European high-wage countries where it is in fact a specific feature. This is due, in particular, to specialisation, automation and adherence to a marked culture of innovation.

September 21st 2015 page 28/44 Dr. Elmar Witten
The market under review
As in previous years, this 2015 GRP Market Report is based on a survey and covers
all the European countries whose production volumes could be recorded with valid
figures. The volume in Turkey has also been considered, but continues to be listed
separately as it lacks long-term comparability.
GRP refers to all glass fibre reinforced plastics with duroplastic matrices as well as
glass mat reinforced thermoplastics (GMT) and long fibre reinforced thermoplastics
(LFT). Another type that belongs into this group is that of continuous fibre reinforced
thermoplastics, which are not covered separately here. The European production
volume of short fibre reinforced thermoplastics is only available as a total volume and
is therefore listed separately.
Carbon fibre reinforced plastics (CRP) will be considered separately in part two of
this market report.

September 21st 2015 page 29/44 Dr. Elmar Witten
GRP production in 2015: overall development
The development of the GRP production volume in the second half of last year, 2014,
was somewhat weaker than during the first half. The first half of 2015 met the
expectations of most market players, and forecasts for the second half appear to be
equally positive, so that we can expect continuous growth for the entire European
GRP production volume. It is estimated that the overall European market has
increased by 2.5%, to 1.069 megatonnes (see Fig. 1).
Fig. 1: GRP production volume in Europe since 2005 (in kilotonnes) (2015* = estimated figure)
The main customer industries for GRP components are transport and construction,
i.e. two sectors with relevance to the wider national economy. This is one reason
why, under a long-term view, the production of GRP tends to follow general
economic developments. Europe’s decreasing share in the global gross domestic
product (GDP) is paralleled by its steadily decreasing share in the global production
volume of GRP, even though its volume is actually rising in absolute terms.
1.065 1.132
1.195
1.058
815
1.015 1.049 1.010 1.020 1.043 1.069
0
200
400
600
800
1.000
1.200
1.400
2005 2006 2007 2008 2009 2010 2011 2012 2013 2014 2015*

September 21st 2015 page 30/44 Dr. Elmar Witten
In particular, there has been a clear shift towards Asia and America in the production
of commodities (i.e. standard products) over the last few years, especially in the
BRIC countries (Brazil, Russia, India and China) with their above-average positive
growth. However, in view of the current economic downturn, decreasing economic
forecasts and the presence of environmental issues, particularly in industry, it is
difficult to forecast forthcoming developments on those markets. Yet despite all
insecurities, it is still true to say that the GRP volume in Europe is heading for growth,
although its volumes will probably lag behind global developments.
Thanks to sustained growth, the 2015 production level will have been the highest
since 2008.
Although a glance at a cumulative value for the European production volume
provides an initial idea about the development of the market, it may sometimes give a
false impression of what is actually happening. To obtain a genuinely meaningful
picture of individual submarkets in the composites industry – an industry which is
extremely heterogeneous – we need to break down market developments according
to the processing methods used in GRP manufacturing and also according to
requirements in each of the application industries and indeed separately for each
European country. The following breakdown is therefore extremely necessary for us
to derive any meaningful statement on developments in Europe.

September 21st 2015 page 31/44 Dr. Elmar Witten
Development tendencies of processes/parts
Fig. 2: GRP production volumes in Europe by processes/parts
(kt = kilotonnes, 2015* = estimated figure)
2012 2013 2014 2015* kt kt kt kt SMC 188 184 190 191 BMC 70 71 74 74
∑ SMC/BMC 258 255 264 265 Hand lay-up 145 142 138 139 Spray-up 90 90 94 96
∑ Open mould 235 232 232 235 RTM 120 126 132 137 Sheets 78 84 84 86 Pultrusion 47 47 48 49
∑ Continuous processing 125 131 132 135 Filament winding 80 78 79 80 Centrifugal casting 67 66 66 68
∑ Pipes and tanks 147 144 145 148 GMT/LFT 108 114 121 132 Others 17 18 17 17 Total: 1,010 1,020 1,043 1,069

September 21st 2015 page 32/44 Dr. Elmar Witten
Duroplastic materials
SMC/BMC:
The production of SMC (sheet moulding compound) and BMC (bulk moulding
compound) parts makes for a quarter of the overall European volume, so that it is still
the biggest segment in GRP production, although its growth has been the weakest
(below 1%). SMC is turned into components in a press-moulding process, and BMC
in an injection-moulding process. Both methods have been used successfully for
many years now, even in large series, showing that composites are perfectly capable
of meeting the specific requirements that characterise large quantities. At nearly
45%, the electrical and electronics industries are the biggest area of application for
both SMC and BMC. They allow for a broad spectrum of applications, due to their
many positive qualities, such as dimensional stability, high thermal resistance,
excellent insulation properties and good climate resistance. Applications range from
cable distribution cabinets, through housings and panels, to covers, switches and
parts of switches as well as control cabinets and connection boxes in buildings.
Alongside the electronics and electrical industries, the automotive industry is the
second biggest area, with just over 40% for SMC and just under 40% for BMC. In
BMC the best-known end products are probably headlamp reflectors made in large
series. SMC components can be found in cars, commercial vehicles and public
transport. Typical components are, for instance, boot lids, spoilers, panelling and
cabinet parts, as well as oil tanks, covers and micro-components.
But SMC components are also used in construction. Typical applications include
cable ducts, manhole covers, light shafts and formwork.
The biggest market in the automotive industry, both for SMC and BMC, is France –
even before Germany, followed by Italy.
In the electronics industry Germany comes before France for SMC, followed by Italy,
whereas for BMC Germany is just ahead of Italy, followed by France.
It is worth noting that the market for the relatively few European SMC/BMC
manufacturers is currently showing various shifts and displacements, there are
growing endeavours to focus on specialities.
September 21st 2015 page 33/44 Dr. Elmar Witten
SMC and BMC are partly competing with thermoplastic materials which are being
used more and more widely, especially in the automotive industry. Moreover, it is not
possible to develop new markets with new applications within a short period of time.
This is a major future challenge for all manufacturers of such products.
Open Mould / Open Processing:
The manufactured volume with its so-called Open Processing – i.e. hand lay-up and
fibre spray-up – is the second biggest on the GRP market. Following a downturn in
2012 and 2013 and then stagnation last year, we can expect to see some small
growth in 2015, just above 1%.
The overall picture of a highly heterogeneous GRP market can also be observed in
the Open Processing segment. In this segment both the company size and the
manufactured parts can differ greatly in relation to the sizes of production batches
and of the components and also the level of complexity.
Open Processing is mostly used where the manufactured components are very large
and/or complex or indeed where only a small number of components is to be
manufactured. In addition, Open Processing is often suitable in cases where complex
layer structures are required.
Typical applications are, for instance, swimming pools, boat hulls, wind turbine shells,
mould construction, shafts, bodyworks for camper vans and trailers, special designs
in motor sports, etc.
With Open Processing it is often possible to work very flexibly, to keep mechanical
work to a minimum and to use a large variety of different materials. This high level of
flexibility means that such processing – which has many of the qualities of
craftsmanship – will always have its place in the composites industry.

September 21st 2015 page 34/44 Dr. Elmar Witten
RTM:
Growth in previous years is also being repeated in the production of RTM (resin
transfer moulding) components, with a robust above-average increase of nearly 4%.
This volume covers all (infusion and injection-moulding) processes where an
enclosed form is applied – processes which can be highly diverse. It follows that this
segment covers a very wide range in terms of different processes. In the automotive
industry, in particular, a substantial amount of work is currently taking place on the
further development of processes – not just on the processes themselves but also
the material. The resulting output ranges from small production runs to serial
production. Compared with other processes, the benefits are, for instance,
differentiated variation options for the process parameters and the possibility of using
a variety of raw materials, sandwich materials and indeed (dry) semifinished products
and preforms. Moreover, it is possible to apply correspondingly coloured gelcoat
surfaces. Also, different processes make it possible to achieve levels of automation
which can often be very high while at the same time keeping the cycle time low and
complying with tight manufacturing tolerances.
Products can be found in nearly all the relevant areas of application. This includes
vehicle construction, wind turbines, boat and shipbuilding, mechanical engineering as
well as sanitary engineering, aerospace, sports and leisure.
Continuous Processing:
This year is seeing further growth in so-called Continuous Processing.
For many years panels have been made above all for vehicles, e.g. for truck side
panels, for caravan bodies and in the conversion of commercial vehicles. Here, too,
there is a major move to be innovative. This includes, for instance, the panelling of
operating theatres, using suitable antiseptic laminates, and the production of skis,
wakeboards and longboards.
The most important applications for GRP pultrusion profiles can be found in the
construction sector, e.g. in the production of bridge elements, railing and ladder
systems and in plant construction.

September 21st 2015 page 35/44 Dr. Elmar Witten
In bridge construction, in particular, “serial application” is prevented by the need for
official permits and the lack of standardisation.
The market segments for Continuous Processing have relatively high levels of
automation. Yet the processes used by the manufacturers – of whom there are
relatively few – differ substantially, as they are adapted, from case to case, to the
specific needs of companies, while also being marked by proprietary developments.
Pipes and tanks:
GRP pipes and tanks made under centrifugal casting and filament winding processes
are primarily used in the oil/gas and chemical industries as well as in plant
construction. The European market has been growing slightly this year, by 2%. It is
dominated by a small number of large manufacturers, partly due to relatively large
volumes per order and also the enormous administrative and licensing work that
often accompanies each order. Nevertheless, the potential continues to be very high
as nearly always large volumes are involved, especially in pipeline construction.
Suitable GRP systems are almost consistently competing on a major scale with other
groups of materials. In the water supply and wastewater disposal sectors, in
particular, they are still rather a niche product. If markets can be further penetrated
through licences and standardisation activities over the next few years, it will be
possible to achieve a large amount of growth.
Thermoplastic materials
GMT/LFT:
Like in previous years, glass mat reinforced thermoplastics (GMT) and long fibre
reinforced thermoplastics (LFT) have experienced above-average growth in 2015,
reaching more than 9%. Of the total European volume (132 kt), nearly two thirds was
LFT and one third GMT. Two-digit growth stimuli are coming from LFT products and
from the automotive industry, in particular.

September 21st 2015 page 36/44 Dr. Elmar Witten
According to a market survey conducted by AVK this year, the future use of LFT in
the transport sector will be influenced, above all, by cost requirements.
Moreover, this is a segment where companies are expecting to see a price drop in
the currently used process technologies. Other important market drivers are the
requirement to reduce weight and the need for specific material properties.
Applications in the automotive industry are generally very diverse. The relatively
broad product spectrum is expected to generate considerable growth over the next
few years, e.g. in seat structures, underbody protection and shock absorbers. It is
also believed that more natural and carbon fibres will be used as materials by 2020.
Research is focusing not only on the development of new products, such as so-called
organo sheets, but also – within thermoplastic systems – on so-called multimaterial
systems. This includes combinations of different plastics – reinforced and
unreinforced – and combinations of metal and plastic systems. Another research
focus is the potential application of composite systems in structural components.
Whereas for many years projects largely concentrated on reducing cycles in
component manufacturing, a range of other issues are currently becoming central.
These include material developments and, above all, measures to ensure continuous
quality assurance and optimisation as well as measures to develop integrated
manufacturing solutions. Especially in the automotive industry challenges can be also
found during the utilisation phase.
Short fibre reinforced thermoplastics:
In addition to the GMT/LFT volumes, which are included in the GRP figures of this
market report, there is the large segment of short fibre reinforced thermoplastics. The
European market for glass fibre reinforced thermoplastic compounds amounted to
about 1,250 kilotonnes in 2014 and was thus somewhat bigger than the GRP market
(duroplastic materials plus GMT/LFT) which was reviewed during the same period.
With a volume increase of approx. 7% per year, this segment – which is marked by a
high level of automation (injection-moulding processes) – delivers far stronger growth
stimuli (source: AMAC). The largest number of applications can be found in transport,
followed by the electrics, electronics, sports and leisure segments.

September 21st 2015 page 37/44 Dr. Elmar Witten
Application industries at a glance
Despite the different developments on the various markets shown here for each
manufacturing process, the share of the big GRP application industries has remained
constant in Europe. A third of the entire production volume is manufactured for
transport, and another third for the construction industry. Other areas of application
are electrics, electronics, sports and leisure (see Fig. 3).
Transport covers the vehicle industry (cars and commercial vehicles) and also
locomotives and rolling stock, boats and aircraft. The production of components for
wind turbines forms part of the construction industry.
Fig. 3: Breakdown of GRP production in Europe by application industries (year: 2015)
35%
15%
34%
15% 1%
TransportElectro / ElectronicConstructionSports & Leisure

September 21st 2015 page 38/44 Dr. Elmar Witten
GRP production in 2015: By countries
As well as taking a differentiated look at the overall European GRP volume by
different processes/parts, we need to consider developments in different countries,
as this is another area where potential differences become apparent.
The countries / groups of countries with the highest growth rates continue to be
Germany, the UK / Ireland, and the Eastern European countries. Germany – the
biggest European GRP/composites country has had the highest growth rate
(6%) in 2015 compared with the previous year and a total volume of 212 kilotonnes.
The Eastern European countries under review are developing at a rate of over 4%,
and the UK / Ireland at nearly 3%.
The only countries with decreasing volumes are currently Scandinavia, while other
groups – albeit at low absolute levels – are remaining stable (Austria / Switzerland) or
are growing slightly (Benelux states).
Southern Europe is continuing the development of the previous year: Spain/Portugal
and Italy display a small amount of growth, while the production volume is still
stagnating in France. These shifts within markets are due to Developments in the
various core industries in these countries, such as the automotive and boatbuilding
sectors and also construction and infrastructure. The small beginnings of economic
growth will impact the GRP industry as well.
For the last few years suitable surveys have also been available for the Turkish
composites market. Compared with the European countries covered in this report,
this is the biggest GRP market. For the first time, however, its growth has been
slightly weaker in 2015 compared with previous years. This market, has been
included in the (separate) survey since 2011. According to the Turkish Composites
Manufacturers’ Association (TCMA), it has grown by about 2%. (Source: TCMA).
The biggest growth potential – with a volume share of nearly 50% – continues to be
seen in GRP pipes and tanks for infrastructure projects, which is still far the biggest

September 21st 2015 page 39/44 Dr. Elmar Witten
application industry. This is an area where the potential continues to be high,
especially for new equipment. Alongside CRP applications, another major growth
driver in this area is the automotive and transport sector with a (relatively small) 20%
share of the total GRP market.
Fig. 4: GRP production volumes in Europe and Turkey by countries / groups of countries
(kt = kilotonnes / 2015* = estimated figure / Eastern Europe** = Poland, Czech Republic, Hungary, Romania, Serbia, Croatia, Macedonia, Latvia, Lithuania, Slovakia and Slovenia / Turkey*** = source: TCMA)
2012 2013 2014 2015* kt kt kt kt UK / Ireland7 134 140 146 150 Belgium / Netherlands / Luxembourg 43 42 43 44 Finland / Norway / Sweden / Denmark 44 44 42 39 Spain / Portugal 160 152 154 156 Italy 152 146 148 150 France 117 112 108 108 Germany 182 192 200 212 Austria / Switzerland 17 17 18 18 Eastern Europe** 161 175 184 192 Total: 1,010 1,020 1,043 1,069 Turkey*** 195 214 245 250

September 21st 2015 page 40/44 Dr. Elmar Witten
Other composite materials
Although a different impression may be gained from current media reporting and from
many conventions and trade shows, GRP continues to be by far the biggest material
group in the composites industry. Glass fibres are used for reinforcement in over
95% of all composites (short and long fibres, rovings, mats, etc.).
Of the 8.8 megatonnes of composites produced globally in 2014 (source: JEC
Composites), 2.3 megatonnes of glass fibre reinforced plastics was produced in
Europe.
Of this volume, 1.04 megatonnes accounted for the market which has been shown
here in detail for 2014, while short fibre reinforced thermoplastics were 1.25
megatonnes.
The global requirement for carbon fibre reinforced plastics (CRP) has been estimated
as 91.000 tonnes in 2015 (see also part two of this market report).
No current market figures are available for components made from natural fibre
reinforced plastics (NRP), compared with last year’s market report. Used primarily in
the automotive sector, 92,000 tonnes of NRP was produced in the EU in 2012, with
Germany being by far the biggest market (source: nova-Institut GmbH).

September 21st 2015 page 41/44 Dr. Elmar Witten
Outlook
Composites and GRP are construction materials of the future. This is often
emphasised in the (trade) media and many different events.
From the perspective of companies in the composites value chain, it can be seen as
totally positive that there should currently be such great interest in future markets,
both among the media and in the industry. There are, however, numerous challenges
which need to be handled within the composites industry and also by working
together outside the industry.
Hybrid and multimaterial systems vs. single material mindset
Quite often we can find rather an insular mindset within the composites industry. A
major distinction is made between the individual material groups, e.g. duroplastics,
thermoplastics, GRP, CRP, NRP, long fibres, short fibres, etc., though also in relation
to different manufacturing processes. The relevant players and interest groups often
emphasise the application options of the material or complex of materials on which
they focus their attention. When we look at the underlying idea, then this is perfectly
understandable. However, in view of competing systems and/or certain specified
material properties, this can become a problem.
Take the automotive industry, for instance, it is easy enough to see that composites
generally have enormous potential in lightweight construction. Any one-sided focus
on a single material solution (e.g. LFT, SMC, CRP or other options) while neglecting
other alternatives can ultimately mean that a manufacturing company is not using the
best solution for its purpose. In the long term, this will lead to loss in credibility, lack
of trust in the material group in general and ultimately losses in market shares.
Instead, it would be good to work together on an expansion of the market, across
material boundaries. This also means that if there are any doubts, it is good to
abandon one’s “own” solutions and, where necessary, to pursue different options.
In fact, it is the only way to obtain long-term market shares and to continue
establishing composites as construction materials.

September 21st 2015 page 42/44 Dr. Elmar Witten
Enforced standardisation and market access
Companies are often rather reluctant to face the idea of standardisation. It is often
seen as unnecessary red tape and is therefore avoided wherever possible, only
applying the necessary standards where they are expressly required by a customer.
Such companies, however, tend to forget that standardisation does not just cost
money and resources, but it can also decide on access and/or barriers to a given
market. For many years Germany and Europe have had a leading role in matters of
standardisation and have therefore been also able to establish their standards in the
international arena. The world and, above all, trade are becoming more and more
international. Particularly in Asia the response to this development has not been
simply to set up trade barriers – which are often rather difficult to enforce anyway –
but to step up their standardisation work.
By enforcing one’s own standards, Asian countries can streamline access to its
market or at least have some control over it. European industry is currently losing a
good deal of influence on international standardisation and is therefore becoming a
“recipient” of the corresponding requirements.
Unfortunately, however, this link is hardly ever perceived by the industry as a
challenge or as anything that can be impacted. A company can only specify and
insist on its own standards if it makes an active contribution to the formulation of
standards on a wider platform.
Practical suitability and feasibility
In recent years there has been quite an increase in composite research activities,
particularly in the lightweight construction segment. Both in government-sponsored
and industrial projects an enormous amount of new knowledge is being generated,
covering the complete value chain and also potential options of application.
Like the media interest mentioned earlier, this must be seen as highly positive, as the
insights generated in this way benefit both the parties who are involved and the entire
industry. Suitable lighthouse projects with a focus on gaining fundamental insights
are of major importance to the industry.

September 21st 2015 page 43/44 Dr. Elmar Witten
Yet it would be desirable if technical considerations could also concentrate more
clearly on economic aspects. It would also be good if publications could put more
emphasis on business plans, financing models and the actual implementation in
industry.
If this aspect is lost or if it recedes too much into the background, then potential
customers, who may not know the various materials in detail, will distance
themselves even further from those materials. A wrong image is sometimes
presented, and it is often falsely believed that enormous costs are involved in terms
of raw material, procurement and production. As a result, the materials are
sometimes avoided, even though a given solution may actually be rather attractive
from an economic perspective.
Daily business vs. future
Composites only unfold their full “power” when products are designed with a view to
the loads they need to bear. Yet this factor is only one among many specific features
of composites and is communicated within the industry quite naturally. What may not
be quite so natural – though it happens frequently – is that the specific knowledge
which is needed in order to use composites for design purposes is not yet “generally”
available. After all, composites are still being treated as marginal at universities,
colleges and vocational schools, while other groups of materials are given far more
attention. Yet it is today’s junior talent pool that will eventually make decisions on the
use of materials one day. The students of today – with their questions and concerns
– are often the potential customers or clients of tomorrow.
Ambition vs. reality
At the beginning of this report we mentioned SMC/BMC materials. These have been
used in large-scale automotive manufacturing for many years now. Pultrusion and
filament winding are Continuous Processing methods which sometimes involve high-
tech equipment. Yet even today we often come across articles and presentations
encouraging us to work on solutions to “manufacture composites in large
quantities/series”.

September 21st 2015 page 44/44 Dr. Elmar Witten
Seen against the background described above, such work should actually be
superfluous, as serial manufacturing is already in existence and indeed well
established. Although there are many endeavours with regard to the serial production
of high-performance composites, in particular, it is worth pointing out that they
concern specific subsectors of the composites industry. Other materials can be
serialised without any problem. To remain competitive, this should be communicated
very clearly.
Forecasts vs. development
It is impossible to predict the future, and for centuries now it has been a well-known
fact that nothing is as permanent as change. This is also very true indeed for
composites. The composites market has been growing steadily over the past few
years, even though its growth has not been the same in all segments and regions. It
is impossible to predict any detailed growth figures for the next few years. The fact is
that composites offer a wide range of options and that their potential often has not
been fully developed or is still waiting to be used more fully. Nevertheless, together
with all our partners along the entire value chain, we can look forward to a large
number of options which, hopefully, will be used in the future. Ultimately, the
prevailing material will be the one that offers the best long-term prospects for a given
application. This may not necessarily be a composite, but it may well be.