Composite Solid Polymer Electrolytes Based on Pluronics: Does … · 2017-02-03 · Composite Solid...
8
Composite Solid Polymer Electrolytes Based on Pluronics: Does Ordering Matter? Lyudmila M. Bronstein,* ,† Robert L. Karlinsey, § Zheng Yi, ‡ John Carini, ‡ Ulli Werner-Zwanziger, | Peter V. Konarev, ⊥,# Dmitri I. Svergun, ⊥,# Angelica Sanchez, ∇ and Saad Khan ∇ Departments of Chemistry and Physics, Indiana UniVersity, Bloomington, Indiana 47405; Indiana Nanotech, Indianapolis, Indiana 46202; Department of Chemistry and Institute for Research in Materials, Dalhousie UniVersity, Halifax NS B3H 4J3, Canada; EMBL, Hamburg Outstation, Notkestrasse 85, D-22603 Hamburg, Germany; Institute of Crystallography, Russian Academy of Sciences, Leninsky pr. 59, 117333 Moscow, Russia; and Department of Chemical and Biomolecular Engineering, North Carolina State UniVersity, Raleigh, North Carolina 27695 ReceiVed August 7, 2007. ReVised Manuscript ReceiVed October 5, 2007 Composite solids polymer electrolytes (SPEs) based on Pluronic block copolymers, PEO x -b-PPO y -b- PEO x , and silicate organic–inorganic component (OIC) formed in situ have been synthesized and characterized using solid-state NMR, Raman spectroscopy, differential scanning calorimetry (DSC), small- angle X-ray scattering (SAXS), rheology, and electrochemical measurements. Raman spectroscopy, DSC, and rheological data reveal that the block copolymer and OIC are intermixed in the composite SPEs, and the degree of intermixing determines the SPE properties. Comparison of the SAXS and electrochemical results leads us to conclude that ordering in block copolymer-based composite SPEs is not a crucial parameter for the improved conductivity, while the combination of the ratios of the SPE components and their intermixing gives rise to extended interfaces that control the electrochemical performance. 1. Introduction One of the modern trends in development of solid polymer electrolytes (SPEs) based on “salt-in-polymer” (normally poly(ethylene oxide) {PEO} + Li salt) systems is strength- ening the material either through cross-linking 1,2 or by incorporating an inorganic component. 1,3–25 Several advan- tages can be expected from introduction of an inorganic component. While the primary advantage of introducing an inorganic component is the increased strength of the polymer composite, other benefits include the possibility to influence the degree of crystallinity of the PEO, by changing conditions for polymer chain arrangement, and the electrochemical properties of the SPEs. Recently, a new family of organic– inorganic composites (OICs) which includes mesoporous aluminosilicate 26–29 or silicate 30 with attached polyether chains has been developed. The attached polyether chains * To whom correspondence should be addressed. E-mail: lybronst@ indiana.edu. † Department of Chemistry, Indiana University. ‡ Department of Physics, Indiana University. § Indiana Nanotech. | Dalhousie University. ⊥ EMBL. # Russian Academy of Sciences. ∇ North Carolina State University. (1) Meyer, W. H. AdV. Mater. 1998, 10, 439. (2) Zhang, Z.; Lyons, L. J.; Amine, K.; West, R. Macromolecules 2005, 38, 5714. (3) Giannelis, E. P. AdV. Mater. 1996, 8, 29. (4) Croce, F.; Appetecchi, G. B.; Persi, L.; Scrosati, B. Nature (London) 1998, 394, 456. (5) Appetecchi, G. B.; Croce, F.; Persi, L.; Ronci, F.; Scrosati, B. Electrochim. Acta 2000, 45, 1481. (6) Lemmon, J. P.; Wu, J.; Oriakhi, C.; Lerner, M. M. Electrochim. Acta 1995, 40, 2245. (7) Kurian, M.; Galvin, M. E.; Trapa, P. E.; Sadoway, D. R.; Mayes, A. M. Electrochim. Acta 2005, 50, 2125. (8) Hutchison, J. C.; Bissessur, R.; Shriver, D. F. Chem. Mater. 1996, 8, 1597. (9) Scrosati, B. Nature (London) 1995, 373, 557. (10) Nookala, M.; Kumar, B.; Rodrigues, S. J. Power Sources 2002, 111, 165. (11) Wang, C.; Xia, Y.; Koumoto, K.; Sakai, T. J. Electrochem. Soc. 2002, 149, A967. (12) Persi, L.; Croce, F.; Scrosati, B.; Plichta, E.; Hendrickson, M. A. J. Electrochem. Soc. 2002, 149, A212. (13) Li, Q.; Imanishi, N.; Takeda, Y.; Hirano, A.; Yamamoto, O. Ionics 2002, 8, 79. (14) Digar, M.; Hung, S.-L.; Wen, T.-C. J. Appl. Polym. Sci. 2001, 80, 1319. (15) Wieczorek, W.; Lipka, P.; Zukowska, G.; Wycislik, H. J. Phys. Chem. B 1998, 102, 6968. (16) Best, A. S.; Adebahr, J.; Jacobsson, P.; MacFarlane, D. R.; Forsyth, M. Macromolecules 2001, 34, 4549. (17) Marcinek, M.; Bac, A.; Lipka, P.; Zalewska, A.; Zukowska, G.; Borkowska, R.; Wieczorek, W. J. Phys. Chem. B 2000, 104, 11088. (18) Adebahr, J.; Best, A. S.; Byrne, N.; Jacobsson, P.; MacFarlane, D. R.; Forsyth, M. Phys. Chem. Chem. Phys. 2003, 5, 720. (19) Cheung, I. W.; Chin, K. B.; Greene, E. R.; Smart, M. C.; Abbrent, S.; Greenbaum, S. G.; Prakash, G. K. S.; Surampudi, S. Electrochim. Acta 2003, 48, 2149. (20) Sadoway, D. R.; Huang, B. Y.; Trapa, P. E.; Soo, P. P.; Bannerjee, P.; Mayes, A. M. J. Power Sources 2001, 621, 97–98. (21) Soo, P. P.; Huang, B. Y.; Jang, Y. I.; Chiang, Y. M.; Sadoway, D. R.; Mayes, A. M. J. Electrochem. Soc. 1999, 146, 32. (22) Capiglia, C.; Mustarelli, P.; Quartarone, E.; Tomasi, C.; Magistris, A. Solid State Ionics 1999, 118, 73. (23) Kumar, B.; Rodrigues, S. J.; Scanlon, L. G. J. Electrochem. Soc. 2001, 148, A1191. (24) Morita, M.; Fujisaki, T.; Yoshimoto, N.; Ishikawa, M. Electrochim. Acta 2001, 46, 1565. (25) Sun, H. Y.; Sohn, H.-J.; Yamamoto, O.; Takeda, Y.; Imanishi, N. J. Electrochem. Soc. 1999, 146, 1672. (26) Ulrich, R.; Zwanziger, J. W.; De Paul, S. M.; Richert, R.; Wiesner, U.; Spiess, H. W. Polym. Mater. Sci. Eng. 1999, 80, 610. (27) Templin, M.; Wiesner, U.; Spies, H. W. AdV. Mater. 1997, 9, 814. (28) Bronstein, L. M.; Joo, C.; Karlinsey, R.; Ryder, A.; Zwanziger, J. W. Chem. Mater. 2001, 13, 3678. 6258 Chem. Mater. 2007, 19, 6258–6265 10.1021/cm7022218 CCC: $37.00 2007 American Chemical Society Published on Web 11/15/2007
Transcript of Composite Solid Polymer Electrolytes Based on Pluronics: Does … · 2017-02-03 · Composite Solid...

Composite Solid Polymer Electrolytes Based on Pluronics: DoesOrdering Matter?
Lyudmila M. Bronstein,*,† Robert L. Karlinsey,§ Zheng Yi,‡ John Carini,‡
Ulli Werner-Zwanziger,| Peter V. Konarev,⊥ ,# Dmitri I. Svergun,⊥ ,# Angelica Sanchez,∇ andSaad Khan∇
Departments of Chemistry and Physics, Indiana UniVersity, Bloomington, Indiana 47405;Indiana Nanotech, Indianapolis, Indiana 46202; Department of Chemistry and Institute for Research in
Materials, Dalhousie UniVersity, Halifax NS B3H 4J3, Canada; EMBL, Hamburg Outstation, Notkestrasse85, D-22603 Hamburg, Germany; Institute of Crystallography, Russian Academy of Sciences, Leninsky pr.59, 117333 Moscow, Russia; and Department of Chemical and Biomolecular Engineering, North Carolina
State UniVersity, Raleigh, North Carolina 27695
ReceiVed August 7, 2007. ReVised Manuscript ReceiVed October 5, 2007
Composite solids polymer electrolytes (SPEs) based on Pluronic block copolymers, PEOx-b-PPOy-b-PEOx, and silicate organic–inorganic component (OIC) formed in situ have been synthesized andcharacterized using solid-state NMR, Raman spectroscopy, differential scanning calorimetry (DSC), small-angle X-ray scattering (SAXS), rheology, and electrochemical measurements. Raman spectroscopy, DSC,and rheological data reveal that the block copolymer and OIC are intermixed in the composite SPEs, andthe degree of intermixing determines the SPE properties. Comparison of the SAXS and electrochemicalresults leads us to conclude that ordering in block copolymer-based composite SPEs is not a crucialparameter for the improved conductivity, while the combination of the ratios of the SPE components andtheir intermixing gives rise to extended interfaces that control the electrochemical performance.
1. Introduction
One of the modern trends in development of solid polymerelectrolytes (SPEs) based on “salt-in-polymer” (normallypoly(ethylene oxide) {PEO} + Li salt) systems is strength-ening the material either through cross-linking1,2 or byincorporating an inorganic component.1,3–25 Several advan-
tages can be expected from introduction of an inorganiccomponent. While the primary advantage of introducing aninorganic component is the increased strength of the polymercomposite, other benefits include the possibility to influencethe degree of crystallinity of the PEO, by changing conditionsfor polymer chain arrangement, and the electrochemicalproperties of the SPEs. Recently, a new family of organic–inorganic composites (OICs) which includes mesoporousaluminosilicate26–29 or silicate30 with attached polyetherchains has been developed. The attached polyether chains
* To whom correspondence should be addressed. E-mail: [email protected].
† Department of Chemistry, Indiana University.‡ Department of Physics, Indiana University.§ Indiana Nanotech.| Dalhousie University.⊥ EMBL.# Russian Academy of Sciences.∇ North Carolina State University.
(1) Meyer, W. H. AdV. Mater. 1998, 10, 439.(2) Zhang, Z.; Lyons, L. J.; Amine, K.; West, R. Macromolecules 2005,
38, 5714.(3) Giannelis, E. P. AdV. Mater. 1996, 8, 29.(4) Croce, F.; Appetecchi, G. B.; Persi, L.; Scrosati, B. Nature (London)
1998, 394, 456.(5) Appetecchi, G. B.; Croce, F.; Persi, L.; Ronci, F.; Scrosati, B.
Electrochim. Acta 2000, 45, 1481.(6) Lemmon, J. P.; Wu, J.; Oriakhi, C.; Lerner, M. M. Electrochim. Acta
1995, 40, 2245.(7) Kurian, M.; Galvin, M. E.; Trapa, P. E.; Sadoway, D. R.; Mayes, A. M.
Electrochim. Acta 2005, 50, 2125.(8) Hutchison, J. C.; Bissessur, R.; Shriver, D. F. Chem. Mater. 1996, 8,
1597.(9) Scrosati, B. Nature (London) 1995, 373, 557.
(10) Nookala, M.; Kumar, B.; Rodrigues, S. J. Power Sources 2002, 111,165.
(11) Wang, C.; Xia, Y.; Koumoto, K.; Sakai, T. J. Electrochem. Soc. 2002,149, A967.
(12) Persi, L.; Croce, F.; Scrosati, B.; Plichta, E.; Hendrickson, M. A. J.Electrochem. Soc. 2002, 149, A212.
(13) Li, Q.; Imanishi, N.; Takeda, Y.; Hirano, A.; Yamamoto, O. Ionics2002, 8, 79.
(14) Digar, M.; Hung, S.-L.; Wen, T.-C. J. Appl. Polym. Sci. 2001, 80,1319.
(15) Wieczorek, W.; Lipka, P.; Zukowska, G.; Wycislik, H. J. Phys. Chem.B 1998, 102, 6968.
(16) Best, A. S.; Adebahr, J.; Jacobsson, P.; MacFarlane, D. R.; Forsyth,M. Macromolecules 2001, 34, 4549.
(17) Marcinek, M.; Bac, A.; Lipka, P.; Zalewska, A.; Zukowska, G.;Borkowska, R.; Wieczorek, W. J. Phys. Chem. B 2000, 104, 11088.
(18) Adebahr, J.; Best, A. S.; Byrne, N.; Jacobsson, P.; MacFarlane, D. R.;Forsyth, M. Phys. Chem. Chem. Phys. 2003, 5, 720.
(19) Cheung, I. W.; Chin, K. B.; Greene, E. R.; Smart, M. C.; Abbrent, S.;Greenbaum, S. G.; Prakash, G. K. S.; Surampudi, S. Electrochim. Acta2003, 48, 2149.
(20) Sadoway, D. R.; Huang, B. Y.; Trapa, P. E.; Soo, P. P.; Bannerjee,P.; Mayes, A. M. J. Power Sources 2001, 621, 97–98.
(21) Soo, P. P.; Huang, B. Y.; Jang, Y. I.; Chiang, Y. M.; Sadoway, D. R.;Mayes, A. M. J. Electrochem. Soc. 1999, 146, 32.
(22) Capiglia, C.; Mustarelli, P.; Quartarone, E.; Tomasi, C.; Magistris,A. Solid State Ionics 1999, 118, 73.
(23) Kumar, B.; Rodrigues, S. J.; Scanlon, L. G. J. Electrochem. Soc. 2001,148, A1191.
(24) Morita, M.; Fujisaki, T.; Yoshimoto, N.; Ishikawa, M. Electrochim.Acta 2001, 46, 1565.
(25) Sun, H. Y.; Sohn, H.-J.; Yamamoto, O.; Takeda, Y.; Imanishi, N. J.Electrochem. Soc. 1999, 146, 1672.
(26) Ulrich, R.; Zwanziger, J. W.; De Paul, S. M.; Richert, R.; Wiesner,U.; Spiess, H. W. Polym. Mater. Sci. Eng. 1999, 80, 610.
(27) Templin, M.; Wiesner, U.; Spies, H. W. AdV. Mater. 1997, 9, 814.(28) Bronstein, L. M.; Joo, C.; Karlinsey, R.; Ryder, A.; Zwanziger, J. W.
Chem. Mater. 2001, 13, 3678.
6258 Chem. Mater. 2007, 19, 6258–6265
10.1021/cm7022218 CCC: $37.00 2007 American Chemical SocietyPublished on Web 11/15/2007

make this composite intimately compatible with PEO, whilethe inorganic component provides a stabilizing structure.31,32
In a previous work we characterized the structure, mobility,and conductivity of such hybrid SPEs and the effects of theseproperties on PEO molecular weight, material composition,and some other parameters.28–30,33 In this study we elucidatethe influence of the polymeric component structure andordering on the properties of composite SPEs.
Previously, we reported composite SPEs where PEO wasreplaced with low molecular weight block copolymers suchas polystyrene-block-poly(ethylene oxide) (PS10-b-PEO23) andpolyethylene-block-poly(ethylene oxide) (PE16-b-PEO41).34 Inthe case of PS10-b-PEO23, the PEO phase of the composite SPEdisplayed higher glass transition temperature (Tg) than thatof the SPEs based on analogous PEO homopolymer and alsoreduced conductivity. For the PE16-b-PEO41, both Tg andconductivity slightly increased, but the latter still did notexceed 10-5 S/cm. We believe that the mediocre propertiesof the SPEs based on PS10-b-PEO23 are due to the lowmobility of the PS block. We found that the Tg of very shortPS blocks is still above room temperature,35 which affectsthe mobility of the PEO blocks. Soo et al. showed that whenboth blocks of phase-separated block copolymer are in therubbery state (Tgs are well below room temperature), thesematerials exhibit improved conductivities over those ofglassy–rubbery block copolymer systems.21 Indeed, in PE16-b-PEO41 with both blocks having low Tg values (accordingto ref 36 the Tg of amorphous PE is -128 °C), the mobilityis not impeded, leading to higher conductivity.34 The small-angle X-ray scattering (SAXS) examination of this SPEshowed that the system is mainly disordered; the lack ofordering was attributed to a comparatively short hydrophobicand hydrophilic blocks.
Kao et al.37 recently reported improved electrochemicalproperties of composite polymer electrolytes based onPluronic F127 (PEO105-b-PPO70-b-PEO105, Mw ) 12 600,BASF) and silicate for [O]/[Li] ) 16. They suggested thatblock copolymer ordering allows enhanced conductivity(3.17 × 10⁻⁵ S/cm), while for disordered composites at[O]/[Li] ) 32 and [O]/[Li] ) 8, the conductivities aremuch lower.37
In order to better understand the effects of ordering ofPluronic-based composites on their electrochemical prop-erties, we synthesized hybrid composite SPEs based onPluronics (PEOn-b-PPOm-b-PEOn) of different composi-tions at [O]/[Li] ) 14, which was found to be the optimal
ratio for these particular systems.28,38 The OIC is com-posed of tetramethoxysilane (TMOS) to form a stabletridimensional structure, (3-glycidylpropyl)trimethoxysi-lane (GLYMO) to provide good miscibility with PEO-containing block copolymer, and 0.65 mol % Al(tri-sec-butoxide) (AB) to ensure full polymerization of the GLYMOglycidyl groups and chemical stability of the SPEs synthe-sized. Here we report on synthesis and properties of theseSPE systems using solid-state NMR, Raman spectroscopy,differential scanning calorimetry (DSC), small-angle X-rayscattering (SAXS), rheology, and electrochemical measure-ments. In particular, we investigate the effect of the SPEordering on their electrochemical properties.
2. Experimental Part
2.1. Materials. Poly(ethylene glycol) (PEG) with a molecularweight of 600 Da was purchased from Aldrich and used as received.The Pluronics L64, F68, F88, and F108 (Table 1) were obtainedfrom BASF and used without purification. Li triflate (LiTf),tetrahydrofuran (THF), aluminum(tri-sec-butoxide) (AB), tet-ramethoxysilane (TMOS) (Aldrich), chloroform (EM Ind., Inc.),and (3-glycidylpropyl)trimethoxysilane (GLYMO, Fluka) were usedwithout further purification. Water was purified with a “BarnsteadNANOpure water” purification system.
2.2. Synthesis. Synthesis of the organic–inorganic compositeSPEs based on block copolymers and silicate OIC was carried outby a procedure published elsewhere.30 In a typical experiment, 0.5 g(9 mmol of PEO) of F108 in 5 mL of chloroform was mixed with0.1.g (0.64 mmol) of Li triflate in 5 mL of THF. After 30 minstirring, the solution was set aside. The inorganic part of thecomposite was prepared by a sol–gel reaction of a mixture ofGLYMO with TMOS in a molar ratio of 80:20 with addition of acatalytic amount of AB. For this, the weighed vial with a stir barwas charged with 2.66 g (11.25 mmol) of GLYMO, 0.426 g (2.81mmol) of TMOS, and 0.02 g (0.08 mmol) of AB. The hydrolysis
(29) Bronstein, L. M.; Karlinsey, R. L.; Ritter, K.; Joo, C.-G.; Stein, B.;Zwanziger, J. W. J. Mater. Chem. 2004, 14, 1812.
(30) Bronstein, L. M.; Karlinsey, R.; Stein, B.; Zwanziger, J. W. Solid StateIonics 2005, 176, 559.
(31) Templin, M.; Franck, A.; Du Chesne, A.; Leist, H.; Zhang, Y.; Ulrich,R.; Schadler, V.; Wiesner, U. Science 1997, 278, 1795.
(32) De Paul, S. M.; Zwanziger, J. W.; Ulrich, R.; Wiesner, U.; Spiess,H. W. J. Am. Chem. Soc. 1999, 121, 5727.
(33) Bronstein, L. M.; Karlinsey, R. L.; Stein, B.; Yi, Z.; Carini, J.;Zwanziger, J. W. Chem. Mater. 2006, 18, 708.
(34) Bronstein, L. M.; Karlinsey, R.; Ryder, A.; Joo, C.-G.; Zwanziger,J. W. Polym. Mater. Sci. Eng. 2001, 85, 615.
(35) Bronstein, L. M.; Khotina, I. A.; Chernyshov, D. M.; Valetsky, P. M.;Timofeeva, G. I.; Dubrovina, L. V.; Stein, B.; Karlinsey, R.; Triolo,A.; Weidenmann, A.; Lo Celso, F.; Triolo, R.; Khokhlov, A. R. J.Colloid Interface Sci. 2006, 299, 944.
(36) Cowie, J. M. G.; McEwen, I. J. Macromolecules 1977, 10, 1124.(37) Kao, H.-M.; Chen, C.-L. Angew. Chem., Int. Ed. 2004, 43, 980.(38) Ulrich, R.; Zwanziger, J. W.; De Paul, S. M.; Reiche, A.; Leuninger,
H.; Spies, H. W.; Wiesner, U. AdV. Mater. 2002, 14, 1134.
Table 1. Composition, Thermal Properties, and Conductivities of SPEs Based on Silicate OIC and Block Copolymersa
Pluronicnotation block copolymer structure sample notation Tg, °C Tm, °C ∆H,b J/g σ,c S/cm
L64 PEO13-b-PPO31-b-PEO13 Pl-L64-SiO2/Al -55 (-67)d no peak (20) no peak (23.0) 2.3 × 10⁵
F68 PEO75-b-PPO31-b-PEO75 Pl-F68-SiO2/Al -43 (-63) 35 (51) 0.42 (87.3) 4.6 × 10⁻⁵
F88 PEO109-b-PPO41-b-PEO109 Pl-F88-SiO2/Al -40 (-65) 41 (57) 0.49 (92.5) 3.0 × 10⁻⁵
F108 PEO136-b-PPO52-b-PEO136 Pl-F108-SiO2/Al -41 (-66) 42 (55) 0.67 (99.5) 2.5 × 10⁻⁵
PEO14 (600 MW) PEG600-SiO2/Al -57 2.8 × 10⁻⁵
a Amount of inorganic precursor in SPEs is 55% (calculated toward the PEO phase only). b ∆H is the specific enthalpy. c σ is the conductivity atroom temperature. d For Tg, Tm, and ∆H, the numbers in parentheses are for the corresponding block copolymer.
6259Chem. Mater., Vol. 19, No. 25, 2007Composite Solid Polymer Electrolytes

was initiated by adding 15% of equimolar amount (0.12 mL) ofwater containing HCl (0.01 M solution). After 30 min stirring atroom temperature, the reaction mixture was charged with the residueof the 0.01 M HCl solution (0.64 mL) and stirred for 40 min. Thenthe reaction temperature was raised to 50 °C, the vial was opened,and stirring continued for 15 min. After weighing the vial, thecalculated amount of the precondensed silicate sol was added tothe solution containing block copolymer and Li salt and stirred for1 h. The added amount (0.452 g) was determined as 55 wt % OICin SPE. The reaction solution was spun (or cast) on a Teflon dishand heated at 60 °C for 2 h to allow for solvent evaporation andOIC condensation. The solid film was treated at 130 °C in vacuumfor 1 h to complete condensation. Films were easily removed fromthe dish and ready for examination. Samples were sealed and keptin a desiccator. As shown in ref 28, weight loss from apparent water(up to 150 °C) did not exceed 0.5%.
2.3. Characterization. Differential scanning calorimetry (DSC)was performed using a Q10 TA calorimeter operating in low-temperature mode with liquid nitrogen as the coolant. The samplesconsisting of 5–12 mg were hermetically sealed in aluminum pans.Dynamic heating scans between -100 and +150 °C at a rate of 10°C/min were run under a nitrogen atmosphere. Glass transitionregions were then determined using the fictive temperaturemethod.39 Indium and cyclohexane were used as reference standards.
Raman spectra were acquired on a Renishaw RM2000 Ramanmicroscope using a 785 nm diode laser for excitation. The Ramanspectra were averaged from several scans. A total acquisition timefrom 30 min to 1 h was used.
Solid-state 13C and 29Si NMR spectra were acquired on a BrukerDSX Avance spectrometer using a 9.4 T magnet, magic anglespinning (MAS), and cross-polarization (CP) from protons. The13C CP/MAS NMR spectra were recorded using rotors of 4 mmdiameter and spinning up to 11 kHz. The 29Si CP/MAS NMRexperiments were performed using rotors of 7 mm diameter. Thespinning speeds were varied up to 6.00 kHz to distinguish spinningsidebands from the center band.
Ac impedance spectroscopy was used to measure conductivityand dielectric constants of cast films. To obtain excellent elec-trode–electrolyte contact, gold electrodes of a known area (0.0647cm2) were directly attached to the film by sputter-coating, using aPolaron E5100 sputter-coater. Films were then placed in a home-built temperature-controlled cell for measurements using a HP4192A impedance analyzer and a Quantum Design digital RGbridge (model 1802, to measure and control the cell temperature).The admittance response of the material was measured in two ways.At a fixed or controlled temperature, data were collected bysweeping the frequencies from 5 Hz to 10 MHz with a 1 V signal(to improve the response from thick films). Bulk conductances werethen extrapolated by modeling the admittance of the sample atmedium to high frequencies. Alternately, during continuous heating,cooling, or annealing runs, the frequency was kept fixed at 50 kHz,and the conductance value at that frequency was used as the bulkvalue. (This agrees within 20% of the value obtained from modelingthe frequency response.) Both silicon and (PEO)14LiO3SCF3 wereused as reference materials for conductivity. Dielectric constantswere obtained by taking the minimum in a capacitance versusfrequency curve. Pure PEO (εr ∼ 5)40 was used as a referencematerial.
Variable temperature (VT) conductivity measurements werecarried out using the following protocol. First, room temperatureconductivity of the sample was measured using the HP impedance
analyzer. Then the sample was cooled to -50 °C while continuouslymeasuring the sample admittance at 50 kHz. After that the samplewas heated in 10 deg steps back to room temperature, measuringthe ac admittance from 5 Hz to 10 MHz at -50, -40, . . ., 20 °C.Then the sample was heated from room temperature to 80 °C in10 deg steps, measuring the ac admittance from 5 Hz to 10 MHzat 30, 40, . . ., 80 °C. At this point the conductivity is in a nearly“as delivered” state from -50 to 80 °C. The sample was held at80 °C for several hours while measuring the sample admittance at50 kHz continuously (until the conductivity stops decreasing). Thenthe sample was cooled back to room temperature, and the sampleadmittance at 50 kHz was measured continuously. Finally, thesample was held for 4 days at room temperature and conductivitywas measured.
The rheology experiments were performed in a stress-controlledrheometer, TA AR2000 at 25 °C, using an 8 mm parallel plategeometry. The procedure employed to make and load the sampleswas as follows. The samples were cut into 8 mm diameter diskswith a razor blade. Each disk was handled with tweezers at all times.The disks were loaded in the rheometer, and the plates were broughttogether until the normal force indicated 2–3 N. The samples weresolidlike, and no relaxation occurred before starting the experiments;thus, the results reported here were run under this compressioncondition.
The stress sweeps were done at 1 rad/s between 10 and 106 Pa,and the frequency sweeps were run between 0.1 and 100 rad/s. Inthe frequency sweep experiments, the wave shape was alwayssinusoidal, indicating that neither wall slip nor nonlinear behaviorwas observed.
The synchrotron radiation X-ray scattering (SAXS) data werecollected on the X33 beamline of the EMBL at the storage ring DORISIII (DESY, Hamburg, Germany).41 The data were recorded using twolinear multiwire proportional gas detectors, at the sample–detectordistances of 2.4 and 1.0 m and a wavelength λ ) 0.15 nm, coveringrange of momentum transfer 0.13 < s < 3.3 nm-1 for the first detectorand 2.5 < s < 9.0 nm-1 for the second detector (s ) 4π sin θ/λ,where 2θ is the scattering angle). The powder samples (SPE filmswere ground with mortar and pestle) were loaded into a silver cellwith mica windows, a cell volume of 100 µL, and an optical pathlength of 1 mm. The measurements were done at room temperature.The focusing geometry and narrow wavelength band-pass (∆λ/λ ≈0.005) resulted in negligible smearing effects. To check for radiationdamage, the data were collected in five successive 1 min frames; noradiation effects were observed. The data were averaged afternormalization to the intensity of the incident beam and corrected forthe detector response. All data manipulations were performed usingthe program package PRIMUS.42 The structural parameters wereestimated using program PEAK.42 The long-range order dimension(L) estimating the size of the quasi-crystalline zones in the samplesand the degree of disorder in the system (∆/dj) were determined fromthe following expressions:43
L) λ�s cos θ
(1)
∆ ⁄ d̄) 1π√�sd̄
λ(2)
where �s is the full width at half-maximum intensity of the peak(in radians) observed at a mean scattering angle of 2θ, dj ) 2π/smax
(39) Schawe, J. E. K. J. Polym. Sci., Part B 1998, 36, 2165.(40) McCrum, N. G.; Read, B. E.; Williams, G. Inelastic and Dielectric
Effects in Polymeric Solids; Dover: New York, 1967.
(41) Boulin, C. J.; Kempf, R.; Gabriel, A.; Koch, M. H. J. Nucl. Instrum.Methods 1988, 269, 312.
(42) Konarev, P. V.; Petoukhov, M. V.; Volkov, V. V.; Svergun, D. I.J. Appl. Crystallogr. 2006, 39, 277.
(43) Vainshtein, B. K. Diffraction of X-rays by Chain Molecules; ElsevierPublishing Co.: Amsterdam, 1966.
6260 Chem. Mater., Vol. 19, No. 25, 2007 Bronstein et al.
is the characteristic size (periodicity or spacing) of the diffractingstructure corresponding to the peak position smax, and ∆ is the mean-square deviation of the distance between neighboring layers.
3. Results and Discussion
3.1. Local Structure by NMR. The local structure of thecomposite SPEs was studied with 13C and 29Si CP/MASNMR. The carbon and silicon spectra are shown in Figure 1for a representative material F108-SiO2/Al, based on PluronicF108. Other materials show similar spectra. The carbonspectrum shows major resonances, assigned to the CH groupof PPO at 75.5 ppm, the –CH2–O– linkages of PPO (73.5ppm) and PEO (70.4 ppm) groups,44 –CH2– groups of reactedGLYMO (26.1 and 23.4 ppm), the CH3 group of PPO (17.8ppm), and –C–Si– units (9 ppm).28 The absence of twosignals at 44 and 51 ppm characteristic of the glycidyl groupof GLYMO suggests that this group fully reacts during theSPE formation.27
The 29Si CP MAS NMR spectrum contains six signals:T1 {C–SiO(OH)2}, T2 {C–SiO2(OH)}, T3 {C–SiO3}, Q2
{SiO3(OH)2}, Q3{SiO3(OH)}, and Q4 {SiO4}. The T2 andQ3 species prevail, illustrating a significant but incompletedegree of cross-linking.30
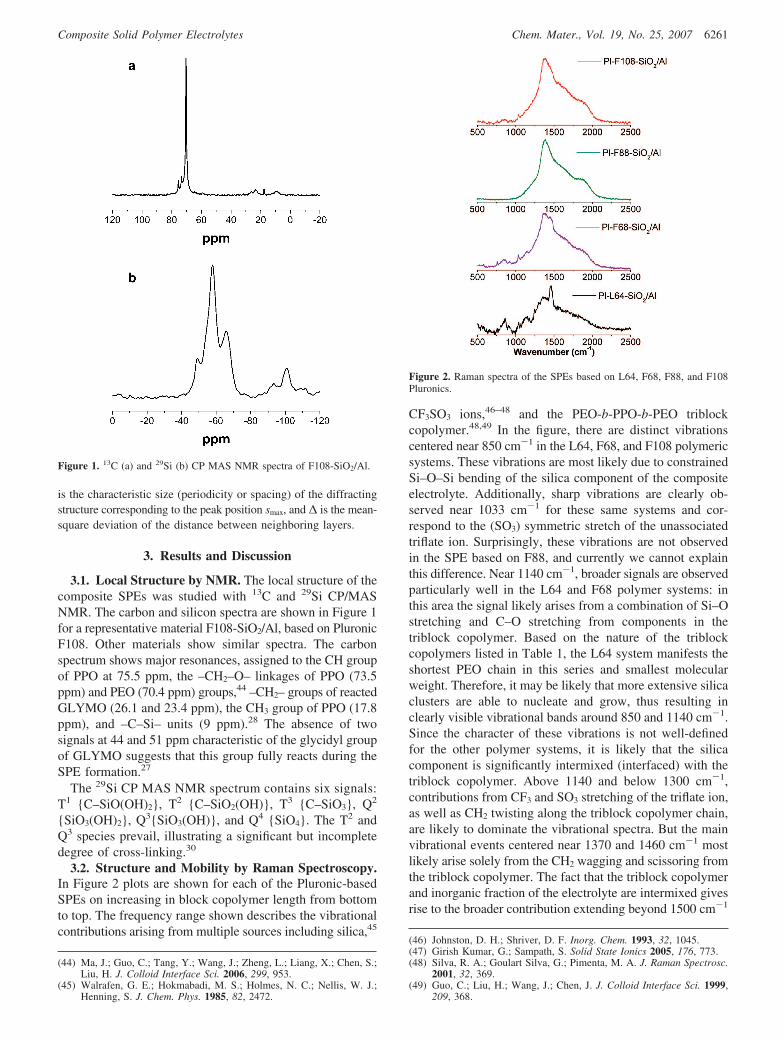
3.2. Structure and Mobility by Raman Spectroscopy.In Figure 2 plots are shown for each of the Pluronic-basedSPEs on increasing in block copolymer length from bottomto top. The frequency range shown describes the vibrationalcontributions arising from multiple sources including silica,45
CF3SO3 ions,46–48 and the PEO-b-PPO-b-PEO triblockcopolymer.48,49 In the figure, there are distinct vibrationscentered near 850 cm-1 in the L64, F68, and F108 polymericsystems. These vibrations are most likely due to constrainedSi–O–Si bending of the silica component of the compositeelectrolyte. Additionally, sharp vibrations are clearly ob-served near 1033 cm-1 for these same systems and cor-respond to the (SO3) symmetric stretch of the unassociatedtriflate ion. Surprisingly, these vibrations are not observedin the SPE based on F88, and currently we cannot explainthis difference. Near 1140 cm-1, broader signals are observedparticularly well in the L64 and F68 polymer systems: inthis area the signal likely arises from a combination of Si–Ostretching and C–O stretching from components in thetriblock copolymer. Based on the nature of the triblockcopolymers listed in Table 1, the L64 system manifests theshortest PEO chain in this series and smallest molecularweight. Therefore, it may be likely that more extensive silicaclusters are able to nucleate and grow, thus resulting inclearly visible vibrational bands around 850 and 1140 cm-1.Since the character of these vibrations is not well-definedfor the other polymer systems, it is likely that the silicacomponent is significantly intermixed (interfaced) with thetriblock copolymer. Above 1140 and below 1300 cm-1,contributions from CF3 and SO3 stretching of the triflate ion,as well as CH2 twisting along the triblock copolymer chain,are likely to dominate the vibrational spectra. But the mainvibrational events centered near 1370 and 1460 cm-1 mostlikely arise solely from the CH2 wagging and scissoring fromthe triblock copolymer. The fact that the triblock copolymerand inorganic fraction of the electrolyte are intermixed givesrise to the broader contribution extending beyond 1500 cm-1
(44) Ma, J.; Guo, C.; Tang, Y.; Wang, J.; Zheng, L.; Liang, X.; Chen, S.;Liu, H. J. Colloid Interface Sci. 2006, 299, 953.
(45) Walrafen, G. E.; Hokmabadi, M. S.; Holmes, N. C.; Nellis, W. J.;Henning, S. J. Chem. Phys. 1985, 82, 2472.
(46) Johnston, D. H.; Shriver, D. F. Inorg. Chem. 1993, 32, 1045.(47) Girish Kumar, G.; Sampath, S. Solid State Ionics 2005, 176, 773.(48) Silva, R. A.; Goulart Silva, G.; Pimenta, M. A. J. Raman Spectrosc.
2001, 32, 369.(49) Guo, C.; Liu, H.; Wang, J.; Chen, J. J. Colloid Interface Sci. 1999,
209, 368.
Figure 1. 13C (a) and 29Si (b) CP MAS NMR spectra of F108-SiO2/Al.
Figure 2. Raman spectra of the SPEs based on L64, F68, F88, and F108Pluronics.
6261Chem. Mater., Vol. 19, No. 25, 2007Composite Solid Polymer Electrolytes

to about 2000 cm-1. These high-energy vibrations suggestthe methyl wagging along the triblock copolymer chain isconstrained heavily by the inorganic component. The SPEbased on the shortest triblock copolymer system, L64, doesnot reveal relatively prominent vibrational shoulders withinthis vibrational range relative to the SPEs based on largertriblock copolymers. Additionally, the clear distinction ofthe 1460 cm-1 CH2 scissoring suggests the entire triblockcopolymer retains a significant level of flexibility althoughthe growth of additional CH2 peaks at increased chain lengthsboth above and below 1460 cm-1, however, suggests theconstraints of the composite electrolyte system.
3.3. Polymer Mobility by DSC. To estimate mobility ofthe polymer chains and their crystallization in the constrainedenvironment of the composite SPEs, we carried out calo-rimetry measurements (Table 1). It is well established thatPEO-b-PPO-b-PEO block copolymers show only one transi-tion about -70 °C, but this temperature can be lowerdepending on the block length.50 From Table 1 one can seethat the glass transition temperatures of all composite SPEsare higher than those of the corresponding block copolymerprecursors, suggesting a decrease of mobility due to attach-ment of block copolymer chains to silicate particles.30,51
Needless to say, the lowest Tg (highest mobility) is observedfor the SPE based on L64 block copolymer with the shortestblocks. These data corroborate the Raman spectroscopy data.
A representative DSC trace (for Pl-F108-SiO2/Al) ispresented in Figure 3. The traces of other SPEs look similarexcept the one for Pl-L64-SiO2/Al where no melting eventis observed. This is not surprising because this SPE is basedon the shortest block copolymer whose DSC trace showsthe lowest fraction of a crystalline phase. In all other samplesthe crystallinity is decreased by at least 2 orders of magnitude(judging by the specific enthalpy of melting), indicating thatthe silicate network largely disrupts the PEO crystallization.
3.4. Room Temperature Conductivity. From Table 1one can see that conductivity values for all the samplesexcept Pl-F68-SiO2/Al are nearly the same (2 × 10⁻⁵–3 ×10⁻⁵ S/cm) and inconsistent with Tg or crystallinity changes.The highest conductivity (4.6 × 10⁻⁵ S/cm) at room tem-perature is achieved for Pl-F68-SiO2/Al. This was sur-
prising considering that the polymer mobility here is lowerthan that of Pl-L64-SiO2/Al, and some (remnant) crystallinityis present. We think that the highest conductivity of Pl-F68-SiO2/Al is due to an optimal balance of polymer mobilityand interconnectivity with the silicate network.
3.5. Structure by SAXS. Ordering in the SPEs based onPluronics was characterized using SAXS. The structuralparameters obtained from SAXS patterns (Figure 4) arepresented in Table 2. As follows from the SAXS data pre-sented in Figure 4 and Table 2, increase of block length ofthe PEO-b-PPO-b-PEO block copolymers results in a largershort-range period (d), which is consistent with the increaseof the block copolymer size. One can also see a trend of theincrease of long-range order, suggesting larger size of orderedareas for larger block copolymers. The higher degree ofordering (∆/d) is observed for the Pl-F108-SiO2/Al systembased on the block copolymer with the highest molecularweight while other systems are mostly disordered. A systemis considered poorly ordered at a ∆/dj value of 0.15. (as apoint of reference, the Bragg peaks nearly disappear when∆/dj > 0.25).43
Following the conclusions of ref 37 and assuming that thehigher ordering should lead to higher conductivity, we triedto increase the degree of ordering in the ordered Pl-F108-SiO2/Al system by annealing at 60 °C (above melting ofcrystalline phase)52 or in the THF (solvent) atmosphere.53,54
The data presented in Figure 5 illustrate that the heating for5 h at 60 °C did not influence the type or degree of blockcopolymer ordering. Similar results were obtained for the
(50) Van Der Schuur, M.; Gaymans, R. J. J. Polym. Sci., Part A 2006, 44,4769.
(51) Maitra, P.; Wunder, S. L. Chem. Mater. 2002, 14, 4494.
(52) Zhang, Y.; Wiesner, U.; Yang, Y.; Pakula, T.; Spiess, H. W.Macromolecules 1996, 29, 5427.
(53) Kim, S. H.; Misner, M. J.; Yang, L.; Gang, O.; Ocko, B. M.; Russell,T. P. Macromolecules 2006, 39, 8473.
(54) Liang, C.; Hong, K.; Guiochon, G. A.; Mays, J. W.; Dai, S. Angew.Chem., Int. Ed. 2004, 43, 5785.
Figure 3. DSC trace of Pl-F108-SiO2/Al under heating. Figure 4. SAXS profiles of the SPEs based on Pluronics with differentblock length.
Table 2. SAXS Structural Parameters of the SPEs Based onPluronicsa
sample notation L, nm d, nm ∆/d
Pl-L64-SiO2/Al 32.3 8.1 0.159Pl-F68-SiO2/Al 42.6 10.6 0.159Pl-F88-SiO2/Al 45.6 10.9 0.156Pl-F108-SiO2/Al 93.3 15.1 0.128
a L is the long-range order, d is the Bragg spacing, and ∆/d is thedegree of disorder.
6262 Chem. Mater., Vol. 19, No. 25, 2007 Bronstein et al.

samples annealed in the THF atmosphere. Additionally, thestructure was not altered when Pl-F108-SiO2/Al was heatedat 80 °C during SAXS measurements directly in theinstrument. (This temperature was chosen to compare withthe data on variable temperature conductivity; see below.)These data reveal that the structure and ordering of Pl-F108-SiO2/Al cannot be further improved and are permanentlyfixed even in the conditions when the precursor blockcopolymer is fully disordered. We believe that this is due tointermixing and interconnectivity of OIC and triblockcopolymer in the composite SPE as indicated by Ramanspectroscopy. On the other hand, comparison of the datapresented in Tables 1 and 2 clearly shows that degree ofordering does not influence the electrochemical performanceof these SPEs.
Here the comparison is due with the improved electro-chemical performance described in ref 37 for the compositeSPE based on Pluronic F127. We believe that enhancedconductivity of 3.17 × 10⁻⁵ S/cm37 for this sample is dueto close to optimal ratio [O]/[Li] ) 16. At higher and lowerratios, either there are not enough charge carriers (at lowconcentration of Li ions) or ordered PEO/Li domains areformed (at high concentration of Li ions) impeding Li iontransport.55–57 Apparently, the exact optimal concentrationof Li ions is specific for each SPE system.55–57 For the F127-based composite SPEs reported in ref 37, the unfavorable[O]/[Li] ratios also result in disordering of the blockcopolymer component, allowing one to conclude that order-ing is a key factor in the increased conductivity. However,comparing the conductivity of the F127-based SPE reportedin ref 37 (3.17 × 10⁻⁵ S/cm) with the comparable or higherconductivity values of the F68- and F88-based SPEs reportedhere (Table 1) suggests that ordering in the block copolymer-based SPEs is not an essential parameter for the improvedconductivity while an optimal structure (ratio of the com-ponents, intermixing, extended interfaces, etc.) controls theelectrochemical performance.
3.6. Variable Temperature Conductivity. In this workwe continued our studies to better understand the structure–
property relationship for these composite SPEs. Earlier wereported unusual thermal behavior of composite single-ionsolid polymer electrolytes.33 As we illustrate here for Pl-F68-SiO2/Al as an example, the thermal behavior of SPEsbased on block copolymers is similar to that of earlierreported composite SPE. As delivered, the room temperature(23 °C) conductivity for the sample was 4.6 × 10⁻⁵ S/cm.When heated (1, red triangles), the conductivity increasesfairly rapidly up to 50 °C, and after this the conductivityfirst levels off and then decreases (Figure 6). If one waitsabout 5 h at 80 °C (2), the conductivity reaches a newequilibrium. Subsequent cooling from 80 °C to room tem-perature (3, green circles) causes the conductivity to decreasemonotonically, reaching a room temperature value of about7.5 × 10-6 S/cm (or about a factor of 6 lower than before).Upon cooling immediately below room temperature (4a,green circles) the conductivity continues to drop. If insteadthe sample is held at 25 °C overnight or longer (4b), theconductivity starts to rise; at some time between about 15 hand 4 days later, it returns to a value close to the originalstate. From here it can be heated again (5a, blue diamonds)or cooled reversibly (5b, black diamonds). The heating datain Figure 6 were taken after a shorter waiting period at 25°C, so it was slightly lower than the as-delivered curve.
Combining the as-delivered data (up to 50 °C) and thedata after supposed recrystallization from -50 to 20 °C, anArrhenius behavior is approximately applicable with anactivation temperature of 7514 K, corresponding to activationenergy of 62.5 kJ/mol (Figure 7). This activation energy isonly slightly higher than that (∼55 kJ/mol) of the compositeSPEs reported by us earlier,29 suggesting no difference inthe conductivity mechanism. It is noteworthy that theactivation energy reported here is intermediate between thoseof the composite SPE containing clay particles (11.7 kcal/mol)58 and of the PEO + Li triflate SPE (108 kJ/mol).59
The data obtained (Table 1) show that all the samplesbased on block copolymers and silicate OIC possess con-
(55) Gray, F. M.; Vincent, C. A.; Kent, M. J. Polym. Sci., Part B 1989,27, 2011.
(56) Fu, Y.; Pathmanathan, K.; Stevens, J. R. J. Chem. Phys. 1991, 94,6323.
(57) Gupta, S.; Shahi, K.; Binesh, N.; Bhat, S. V. Solid State Ionics 1993,67, 97.
(58) Vaia, R. A.; Vasudevan, S.; Krawiec, W.; Scanlon, L. G.; Giannelis,E. P. AdV. Mater. 1995, 7, 154.
(59) Robitaille, C. D.; Fauteux, D. J. Electrochem. Soc. 1986, 133, 315.
Figure 5. SAXS profiles of the Pl-F108-SiO2/Al film before (red) and after(black) thermal treatment at 60 °C for 5 h.
Figure 6. Dependence of conductivity on thermal history of the Pl-F68-SiO2/Al sample recorded at 50 kHz.
6263Chem. Mater., Vol. 19, No. 25, 2007Composite Solid Polymer Electrolytes

siderably high conductivities (especially Pl-F68-SiO2/Al).However, the change of conductivity depending on the thermalhistory of the sample (Figure 6) seems to be counterintuitive.Indeed, if the change would be determined by melting of thePEO crystallites at 50–60 °C, at 80 °C in fully amorphousSPE the conductivity should increase, not decrease. Furthercooling below crystallization temperature (50–60 °C) shouldresult in higher conductivity values than those obtained uponheating, since recrystallization is normally delayed in hybridSPE. The complex temperature dependence and restorationof higher conductivity value after storage at room temperaturesuggest that this sample might possess some favorablestructure/ordering allowing higher conductivity. At 80 °Cthis structure is destroyed while after prolonged storage atroom temperature it is restored. However, the SAXSmeasurements carried out at 80 °C show that the structure/ordering remains unchanged under heating. Taking intoaccount these facts and the reasoning in ref 33, we suggestthat unusual thermal behavior should be attributed to acomposite nature of these SPEs and, in particular, reversiblechanges of the intermixed OIC and a polymer phase.
3.7. Rheology. Rheological measurements were carriedout on two block copolymer-based SPEs: Pl-F68-SiO2/Al andPl-F108-SiO2/Al. For comparison, we also used two SPEsbased on 600 MW PEO and the OIC: in one case, thematerial contained silicate and a similar amount of silicateto that of block copolymer-based samples (designatedPEG600-55%-SiO2/Al),30 and in the other case, the samplecontained a similar amount of alumosilicate OIC (designatedPEG600-55%-AlSi).28 The last two samples were chosen ascontrol and to understand the influence of microphaseseparation (or ordering for Pl-F108-SiO2/Al) of a polymericcomponent (block copolymer vs homopolymer) and of theOIC composition (silica vs aluminosilica).
The results indicate in all cases the elastic modulus ishigher than the viscous modulus and frequency independent(see Figure 8); this suggests that the samples are solidlike atroom temperature, revealing that in all the materials the OICcomponents reinforce the polymeric phase (note that L64 isa liquid at room temperature). The material containing Pl-F108-SiO2/Al showed the highest elastic modulus followedby PEG600-55%-SiO2/Al, Pl-F68-SiO2/Al, and PEG600-55%-AlSi which can be attributed to several factors such asthe difference in molecular weights, the degree of OIC cross-linking, and the degree of intermixing. The elastic moduli
of these materials are comparable to or higher than those ofvarious polymers filled with precipitated silica.60
The stress sweeps (Figure 9) show that PEG600-55%-AlSican be deformed to a larger stress values than the rest of thematerials. This is more evident in Figure 10 where the elasticstress is plotted against the strain.61 This type of plot is usefulto determine the yield stress of a material. In this case, theelastic stress plot indicates that PEG600-55%-AlSi has thehighest yield stress and the highest yield strain. Pl-F108-
(60) Phewthongin, N.; Saeoui, P.; Sirisinha, C. J. Appl. Polym. Sci. 2006,100, 2565.
(61) Walls, H. J.; Caines, S. B.; Sanchez, A. M.; Khan, S. A. J. Rheol.2003, 47, 847.
Figure 7. Variable temperature conductivity and Arrhenius plots (red) ofthe Pl-F68-SiO2/Al sample.
Figure 8. Frequency sweep of the SPEs based on two Pluronics and PEO.
Figure 9. Stress sweep of the SPEs based on two Pluronics and PEO.
Figure 10. Elastic stress vs strain of the SPEs based on two Pluronics andPEO.
6264 Chem. Mater., Vol. 19, No. 25, 2007 Bronstein et al.

SiO2/Al and PEG600-55%-SiO2/Al do not seem to show abig difference in yield stress. We believe that PEG600-55%-AlSi based on aluminosilicate is the strongest because ofhigher degree of cross-linking in alumosilicate compared tothat of silicate in other samples.30
Pl-F68-SiO2/Al shows the lowest yield stress and strain.Note that this material shows the highest conductivity amongthe SPEs studied; however, currently there are not enoughdata to support a relationship between the strain–stressproperties and electrochemical performance in these par-ticular systems. Remember that conductivities of PEG600-55%-AlSi,28 Pl-F108-SiO2/Al, and PEG600-55%-SiO2/Al arenearly the same, while mechanical properties differ. For PEO/LiTFSI systems,62 the higher the crystallinity, the higher themodulus of the composite and the lower the ionic conductiv-ity. This is, however, not the case for the materials reportedhere as PEG600-55%-AlSi28 and PEG600-55%-SiO2/Al30 arefully amorphous, while Pl-F108-SiO2/Al and Pl-F68-SiO2/Al have similar and very low degree of crystallinity.Additionally, the presence of the PPO block could havecontributed to the increase in elasticity of the material. Thiseffect is only noticeable in PlF108-SiO2/Al because of thelower block copolymer molecular weight of PlF68-SiO2/Al.
Comparison of the stress–strain data on PL-F108-SiO2/Al and PEG600-55%-SiO2/Al shows that block copolymerstructure/ordering hardly influences the mechanical propertiesof the material, while the OIC material (better cross-linked
alumosilicate vs silicate) has a noticeable influence onmechanical properties.
4. Conclusion
We have demonstrated that composite SPEs based onPluronics and silicate OIC exhibit enhanced conductivity upto ∼5 × 10⁻⁵ S/cm with improved mechanical propertieswhen compared to pure PEO-based SPEs. Analysis of theRaman spectroscopy data reveals that there is intermixingbetween polymeric and OIC components in SPEs; the degreeof intermixing is dependent on the block copolymer length.The DSC data indicate decreased mobility of the blockcopolymer component supporting the Raman data on inter-mixing. Variable temperature conductivity measurementsdemonstrate unusual thermal behavior of these SPEs whichshould be attributed to their composite nature or likely toreversible interfacial changes of the mingled OIC andpolymer chains. The rheology data indicate that these SPEsare solidlike at room temperature, which suggests that theinorganic phase reinforces the polymeric matrix. The SAXSdata clearly demonstrate that block copolymer ordering inthe composite SPEs does not lead to enhanced conductivitywhile the extended interfaces due to intermixing are likelyto be responsible for improved electrochemical performance.
Acknowledgment. The authors thank NASA (grant NAG3-2588) and EMBL (grant SAXS-06-29) for financial support ofthis project.
CM7022218(62) Li, Y.; Yerian, J. A.; Khan, S. A.; Fedkiw, P. S. J. Power Sources
2006, 161, 1288.
6265Chem. Mater., Vol. 19, No. 25, 2007Composite Solid Polymer Electrolytes


![Virus-AssembledFlexibleElectrode-ElectrolyteInterfacesfor ...€¦ · electrolytes [3–7]. Polymer-based electrolytes can be readily processed to produce thin films that can be](https://static.fdocuments.in/doc/165x107/5f738c548da176309a37dcff/virus-assembledflexibleelectrode-electrolyteinterfacesfor-electrolytes-3a7.jpg)