Composite of Nano-TiO with Cellulose Acetate Membrane from ... · F. Rahmawati*, I. Fadillah, M....
9
JMES, 2017, 8 (2), pp. 389-397 389 JMES, 2017 Volume 8, Issue 2, Page 389-397 1. Introduction Photocatalytic degradation with titanium dioxide, TiO 2 , recently known as an alternative for waste water treatment or a photocatalytic treatment of some organic contaminants such as dyes, hydrocarbon, pesticide and also pathogenic microbe[1]. Titanium dioxide also a promising photocatalyst for textile waste watertreatment. Dyes from textile industries is a non biodegradable contaminant, which is consist of azo compounds (-N=N) and its derivative with benzene molecules. One of the azo compounds is methyl orange. It is known as carsinogenic and mutagenic compounds[2]. Therefore, an effort to degrade that dye is important to reduce the hazardous of textile waste water. TiO 2 is a material with high photocatalytic activity and good chemical stability even under extreme condition [3,4]. In addition, TiO 2 is non-toxic, inexpensive and has electrochemical ability to oxidize some organic pollutants and also reduce some metallic ions in wastewater [5]. Some efforts to engineer the TiO 2 have been conducted to enhance their performance as a catalyst, such as reduce the TiO 2 particle size into a nano-size particle [6]. It is known that the reduction of particle size capable of increasing the catalytic performance due to high surface area of interaction. However, TiO 2 powder form a colloid when dispersed in water [7]. It could become a disadvantage especially on recovering process. It must be conducted by ultrafiltration or centrifugation [8]. Therefore, some researchers on immobilization of TiO 2 on some substrate have been conducted, such as on graphite [9], on titanium foil [10], carbon doped-nano TiO 2 [11]. An effort to impregnate TiO 2 on cellulose producing cellulose-TiO 2 nano- composite also has been conducted [12]. The resultingproof the feasibility of TiO 2 immobilization in porous Journal of Materials and Environmental Sciences ISSN : 2028-2508 Copyright © 2017, University of Mohammed Premier Oujda Morocco Composite of Nano-TiO 2 with Cellulose Acetate Membrane from Nata de Coco (Nano-TiO 2 /CA(NDC)) for Methyl Orange Degradation F. Rahmawati * , I. Fadillah, M. Mudjijono Research Group of Solid State Chemistry & Catalysis, Chemistry Department, Sebelas Maret University, Jl. Ir. Sutami 36 A, Kentingan Surakarta, Indonesia 57126 Abstract Composite of nano-TiO 2 with cellulose acetate (CA) has been prepared in this research. The composite then was used as photocatalyst for methyl orange degradation. The cellulose acetate was produced from Nata de Coco (NDC). Immobilization of nano TiO 2 on the CA(NDC) membraneaims to increase the separation ability of photocatalyst after the degradation. TiO 2 nanoparticles were synthesized byalkaline destruction method with NaOH and it was followed by calcination at 450 o C. The membrane photocatalyst nano TiO 2 -CA(NDC) was prepared by phase inversion method by mixing TiO 2 nanoparticles with the CA casting solution. Analysis by Scanning Electron Microscopy (SEM) indicates that nano TiO 2 has been successfully synthesized, and the average diameter are 88.63 nm 4.37. The X-ray diffraction pattern (XRD)of nano TiO 2 shows anatase TiO 2 as a major component. Photodegradation of methyl orange solution was conducted with nano-TiO 2 and nano TiO 2 -CA(NDC) at various times of 10, 20, 30, 40, and 50 minutes. Degradation was conducted by the batch system with UV light with 8 watts of power. The result shows that photodegradation reaction followed the second order. The rate constant of methyl orange degradation with nano TiO 2 -CA(NDC) is 0.01±0.002 ppm.min -1 . Eventhough, the rate constant value is lower than the methyl orange degradation with nano-TiO 2 powder, however, the immobilized form offers an advantage of separation process from the treated solution. Statistical analysis also found that the difference in the rate constant is not siginificant. It means that the immobilization of nano-TiO 2 into a CA(NDC) membrane will not reduce the photocatalytic activity of TiO 2 , even it will reduce the application cost due totheelimination of separation treatment. Received 01 Mar 2016, Revised 08 Aug 2016, Accepted 01 Sept 2016 Keywords Photocatalysis; Biodeterioration, PET, PMMA, Contact angle, plastics [email protected] Phone:+62 271663375 Fax: +62 271663375 http://www.jmaterenvironsci.com/
-
Upload
truongnhan -
Category
Documents
-
view
217 -
download
0
Transcript of Composite of Nano-TiO with Cellulose Acetate Membrane from ... · F. Rahmawati*, I. Fadillah, M....
JMES, 2017, 8 (2), pp. 389-397 389
JMES, 2017 Volume 8, Issue 2, Page 389-397
1. Introduction Photocatalytic degradation with titanium dioxide, TiO2, recently known as an alternative for waste water
treatment or a photocatalytic treatment of some organic contaminants such as dyes, hydrocarbon, pesticide and
also pathogenic microbe[1]. Titanium dioxide also a promising photocatalyst for textile waste watertreatment.
Dyes from textile industries is a non biodegradable contaminant, which is consist of azo compounds (-N=N) and
its derivative with benzene molecules. One of the azo compounds is methyl orange. It is known as carsinogenic
and mutagenic compounds[2]. Therefore, an effort to degrade that dye is important to reduce the hazardous of
textile waste water.
TiO2 is a material with high photocatalytic activity and good chemical stability even under extreme condition
[3,4]. In addition, TiO2 is non-toxic, inexpensive and has electrochemical ability to oxidize some organic
pollutants and also reduce some metallic ions in wastewater [5]. Some efforts to engineer the TiO2 have been
conducted to enhance their performance as a catalyst, such as reduce the TiO2 particle size into a nano-size
particle [6]. It is known that the reduction of particle size capable of increasing the catalytic performance due to
high surface area of interaction.
However, TiO2 powder form a colloid when dispersed in water [7]. It could become a disadvantage especially
on recovering process. It must be conducted by ultrafiltration or centrifugation [8]. Therefore, some researchers
on immobilization of TiO2 on some substrate have been conducted, such as on graphite [9], on titanium foil
[10], carbon doped-nano TiO2 [11]. An effort to impregnate TiO2 on cellulose producing cellulose-TiO2 nano-
composite also has been conducted [12]. The resultingproof the feasibility of TiO2 immobilization in porous
Journal of Materials and Environmental Sciences ISSN : 2028-2508
Copyright © 2017,
University of Mohammed Premier
Oujda Morocco http://www.jmaterenvironsci.com/
Composite of Nano-TiO2 with Cellulose Acetate Membrane from Nata de
Coco (Nano-TiO2/CA(NDC)) for Methyl Orange Degradation
F. Rahmawati
*, I. Fadillah, M. Mudjijono
Research Group of Solid State Chemistry & Catalysis, Chemistry Department, Sebelas Maret University, Jl. Ir.
Sutami 36 A, Kentingan Surakarta, Indonesia 57126
Abstract
Composite of nano-TiO2 with cellulose acetate (CA) has been prepared in this research. The
composite then was used as photocatalyst for methyl orange degradation. The cellulose acetate
was produced from Nata de Coco (NDC). Immobilization of nano TiO2 on the CA(NDC)
membraneaims to increase the separation ability of photocatalyst after the degradation. TiO2
nanoparticles were synthesized byalkaline destruction method with NaOH and it was followed
by calcination at 450 oC. The membrane photocatalyst nano TiO2-CA(NDC) was prepared by
phase inversion method by mixing TiO2 nanoparticles with the CA casting solution. Analysis
by Scanning Electron Microscopy (SEM) indicates that nano TiO2 has been successfully
synthesized, and the average diameter are 88.63 nm 4.37. The X-ray diffraction pattern
(XRD)of nano TiO2 shows anatase TiO2 as a major component. Photodegradation of methyl
orange solution was conducted with nano-TiO2and nano TiO2-CA(NDC) at various times of 10,
20, 30, 40, and 50 minutes. Degradation was conducted by the batch system with UV light with
8 watts of power. The result shows that photodegradation reaction followed the second order.
The rate constant of methyl orange degradation with nano TiO2-CA(NDC) is 0.01±0.002
ppm.min-1
. Eventhough, the rate constant value is lower than the methyl orange degradation
with nano-TiO2 powder, however, the immobilized form offers an advantage of separation
process from the treated solution. Statistical analysis also found that the difference in the rate
constant is not siginificant. It means that the immobilization of nano-TiO2 into a CA(NDC)
membrane will not reduce the photocatalytic activity of TiO2, even it will reduce the
application cost due totheelimination of separation treatment.
Received 01 Mar 2016,
Revised 08 Aug 2016,
Accepted 01 Sept 2016
Keywords
Photocatalysis;
Biodeterioration,
PET,
PMMA,
Contact angle,
plastics
Phone:+62 271663375
Fax: +62 271663375
http://www.jmaterenvironsci.com/

JMES, 2017, 8 (2), pp. 389-397 390
cellulose for UV-activated dye degradation. Cellulose acetate, CA, is a promising candidate due to their high
toughness, high biocompatibility, good desalting properties, high flux properties and also inexpensive. The CA
membrane also has high hydrophilicity, in which this property is important in order to minimize fouling [13].
Theless fouling possibility has been proven through morphological analysis before and after permeability test
[14].The CA membrane with TiO2 nanoparticles inside also can be prepared easily by phase inversion method
by dispersing the nanoparticles in the CA casting solution [15].
This research studies the application of CA membrane as a medium for nano TiO2. Nata de Coco, NDC was
used as raw material for CA production. CA membrane from NDC is known to have strong and flexibility
properties. Aminzadeh et al. [16] found that the Thermogravimetric analysis, TGA, on CA and TiO2 provide the
similar degradation pattern. It indicates that CA may not affect the physical character of nano TiO2. Therefore,
in this research, the CA membrane from NDC was used as a medium for nano TiO2. The photocatalytic
performance of nano TiO2-CA(NDC) was studied through its application in a Methyl Orange degradation in a
batch reactor with ultraviolet light as a photon source.
2. Experimental Chemicals used in this research were pro analysis grade, and those were used without further treatment. The
chemicals were TiO2 A-100 anatase (98%, Japan) , Ammonium sulphate (Merck), Sodium Hydroxide (Merck),
acetic acid glacial (Merck), anhydrous acetate (98 %, Merck), sulphuric acid (Merck), Poly Ethylene Glycol
1000 (Merck), Methyl Orange (Merck), Acetone (Merck). Other components were coconut water, Acetobacter
xylinum, nata de coco gel, and distilled water.
2.1 Synthesis of nano-TiO2
The synthesis of nano-TiO2 was conducted through destruction method with conventional heating under air
atmosphere. 2 grams of anatase TiO2 was mixed with 17.5 mL of 10 M NaOH [17]. The mixture was sonicated
for 5 minutes then was put into Teflon tube and was heated on a hot plate at 150 oC for 24 hours. The result was
washed with deionized water and continued with 0.1 M HCl solution. The washing treatment was conducted at
the pH of the mixture was neutral. The mixture then was heated and calcined at 450 oC for 2 hours.
2.2. Preparation of cellulose acetate membrane from nata de coco (NDC)
Some sheets of NDC withathickness of 0.5 – 0.7 cm were dipped in a 4% NaOH solution for 24 hours to
remove the bacteria remains. The sheets then were neutralized by soaking in a 4% of acetic acid glacial for 24
hours. Natalia[18] found that the 4% of NaOH solution and the 4% of acetic acid glacial solution were
succesfully produce the cellulose acetate from NDC. In order to reduce the acid content in the sheets, those were
soaked in a distilled water for 24 hours and followed by washing for many times until the color was back to
white. The treated NDC sheets then were dried under sunlight for 3-4 days to produce dry NDC sheets. The
dried NDC sheets then were blended to produce NDC powder.
The cellulose acetate, CA, was produced through 4 steps including swelling, acetylation, hydrolisis and
purification [19]. The swelling step was a step in activation, in which the cellulose fibres were inflated
withtheaddition of 64 mL of glacial acetate in every 8 grams of cellulose powder. The sweeling form would
allowreagents to penetrate easier into cellulose fibres and it leads to the exchange of hydroxylation groups in the
cellulose molecules with the acetyl groups in the anhydrous acetate. These are named as acetylation process to
produce cellulose acetate [20]. The acetylaton process was conducted under 18 oC, because the reaction between
the anhydrous acetate with the swelled cellulose was an exothermic process. Meanwhile, the hydrolisis process
was the next step to eliminate the crystallinity of cellulose. The 67% oftheacetic acid solution was used for
hydrolisis. The last step wasapurification, which was conducted thourgh centrifugation until a white sediment
was formed in the bottom oftheflask. The white sediment was then washed with deionized water and was dried
to produce the cellulose acetate powder.
2.3 Preparation of nano-TiO2-CA(NDC) membrane
The membrane of nano TiO2-CA(NDC) was synthesized by phase inversion method [15,21]. The cellulose
acetate membrane was prepared from nata de coco, a natural product from coconut water.The phase inversion
occurred between three phases that presence in the system, i.e., the polymer, solvent and non-solvent [15, 17].
The membrane was produced with the composition of polymer: acetone (as solvent) at a ratio of 17.5: 82.5
(weight %). The composition of the polymer was CA-NDC: nano TiO2 at a ratio of 80:20 (weight %). This ratio
was chosen as the optimum weight ratio of nano TiO2 powder that can be mixed with CA-NDC powder. The

JMES, 2017, 8 (2), pp. 389-397 391
mixture still can be casted and peeled out without any cracks. The nano-TiO2 powder was dispersed in aceton
and stirred for 4 hours. The dispersion then was sonicated for 10 minutes. Meanwhile, the prepared cellulose
acetate, CA, was mixed with poly ethylene glycol, PEG, ataratio of CA:PEG 18:5 (weight %, the weight % was
calculated from total solution). The mixture then was stirred for 24 hours. The membrane was molded in a glass.
After being cast on the molding glass, the glass was then poured immediately into coagulation bath which was
filled with non-solvent, which is distilled water, at 9 oC. The membrane formed than was washed with distilled
water until reach neutral pH and then was dried.
2.4 The analysis of materials and Methyl Orange degradation
The prepared material was analyzed with XRD (Shimadzu 6000 at 2 of 10 o – 80
o at 40 mA and 40 kV).
Morphological analysis was conducted by Scanning Electron Microscopy,SEM analysis (FEI Type INSPECT-
s50). The optical properties were analyzed through UV-Vis reflectance spectrum using spectrometer HR 4000
CG-
UV-Vis-NIR Ocean Optics.
The photocatalytic degradation on Methyl orange was conducted by applying nano TiO2 powder and nano TiO2-
CA(NDC). The degradation used UV light at various times of 0, 10, 20,30, 40 and 50 minutes. The UV light
was analyzed the spectrum range through UV Vis spectrometer scanning. In addition, a standard curve of
methyl orange solution was prepared by measure the absorbance of various methyl orange concentrations. The
standard curve was used to provideaconcentration of methyl orange based on its absorbance value after
degradation. 10 mL of methyl orange solution(15 mg/L) was soaked with 0.167 g of the prepared photocatalyst
and was illuminated by UV light which was set up at 12 cm distance from the methyl orange solution.The
experimental setup is described in Figure 1. The same method also carried out by using the nano-TiO2-
CA(NDC) sheet. Each degradation test was conducted twice. Standard deviation of rate constant was drawn
from the values calculated from those duplet data.
Figure 1. The experimental setup of Methyl Orange degradation
3. Results and discussion 3.1 The reaction to form cellulose acetate
The reaction between cellulose with anhydrous acetate produced cellulose triacetate and acetic acid as it is listed
in equation(1). The reaction is called as acetylation. Meanwhile, during hydrolisis reaction, the cellulose
triacetic react with water molecules to form cellulose diacetic and acetic acid. The formation of cellulose acetate
was analyzed by FT-IR and produce spectrum depicted in Figure 2. The FT-IR spectrum of cellulose acetate is
compared to the initial material, i.e. nata de coco. The FT-IR spectrum in Figure 2(a) shows a characteristic
broad peak of OH streching at wavenumber 3485.52 cm-1
. It indicates the presence of hydrogen bonding
between hydroxyl group in the cellulose network and also the surface OH groups. A peak of C-Ostretching
present at 1052.21 cm-1
. Meanwhile, the produced cellulose acetate spectrum (Figure 2(b)) provides a new peak
at 1751.44 cm-1
which are indicated as acarbonyl group, C=O stretching, and a sharp peak at 1240.28 cm-1
indicating the presence of acetyl C-O. The presence of acetyl C-O indicates that the OH group in cellulose
molecules has been substituted by =CO group producing the cellulose acetate.

JMES, 2017, 8 (2), pp. 389-397 392
COOH3CH])(OOCCHOH[CCOOCOCH3CH)OH(C 3n33276
H
33n5106
(1)
Cellulose anhydrous acetate cellulose triacetate acetic acid
Figure 2. FT-IR spectrum of Nata de Coco (NDC) (a) and the prepared cellulose acetate (b).
Morphological analysis of the prepared nano TiO2 with SEM analysis resulted in SEM images as described in
Figure 3. The particle size which was estimated by MeasureIT program (the free edition) shows that the average
diameter of the initial anatase TiO2 is 207.39 nm 19.73. The initial TiO2 was procured as anatase TiO2 (98%,
Japan). Meanwhile, the average diameter of the prepared nano-TiO2 is 88.63 nm 4.37. The result shows that
the destruction process with sodium hydroxide successfully reduced the particle size into nanosize particles. It is
in agreement with the previous research by Rajabzadeh et al.[24].It also proves that the alkaline destruction
might become an alternative way instead of other processes such as the hydrothermal method [25]. The alkaline
destruction shows many advantages i.e. it is not expensive, no requirements on a specific equipment and high
temperature. During destruction process, The Ti-O-Ti bonding was broken to form the Ti-O-Na and Ti-O-OH.
The new Ti-O-Ti bondings were then formed during calcination at 450 oC [26].
Figure 3. SEM images of the initial TiO2 (A) and the TiO2 after destruction process (B)
Image of the prepared nano TiO2-CA(NDC) is described in Figure 4(a). The membrane has a white
color, shiny and rigid. The thickness is 43.7 µm with porous surface morphology as described in Figure 4(b and
A

JMES, 2017, 8 (2), pp. 389-397 393
c). The previous result withthesame method of preparation found the membrane thickness of 42.9 µm, also with
the porous surface [17].
X –ray diffraction patterns in Figure 5 shows the change of TiO2peaks, in which the peaks are sharp at
initial to become broaden after destruction process with NaOH. The broad peaks represent small particle size
and the material became amorphous. In the nano-TiO2 diffraction pattern there are new peaks at 2 of 31.825o
and 45.63o which are identified as NaCl, as it was confirmed with standard diffraction of NaCl ICSD # 18189.
The peak of NaCl also found in the previous research [17], as the reaction product between the remained sodium
ions with chlorine ions during acid washing. The main peak of anatase TiO2stillexists at 25.37 o, which is in
agreement with standard diffraction of anatase TiO2 ICDS #24276. It indicates that the destruction process did
not change the phase of TiO2 but it decreased the particle size and the crystallinity which was shown by broad
peaks. The high peaks at 2 less than 25o refer to cellulose acetate, as it were confirmed by standard diffraction
of cellulose acetate JCPDS#03-0021.Elemental analysis by EDX (Figure 6) shows that a 12.21 % of Ti are
present in the prepared composite.
Figure 4. The images of membranenano TiO2-CA(NDC) (a) the cross section SEM image (b)and its porous
surface morphology
Figure 5. The diffraction pattern of the initial anatase TiO2, the prepared nano TiO2 and the prepared composite
of nano TiO2-CA(NDC). The sign o refers to the characteristic peak of NaCl.
JMES, 2017, 8 (2), pp. 389-397 394
Figure 6. EDX analysis of TiO2/CA
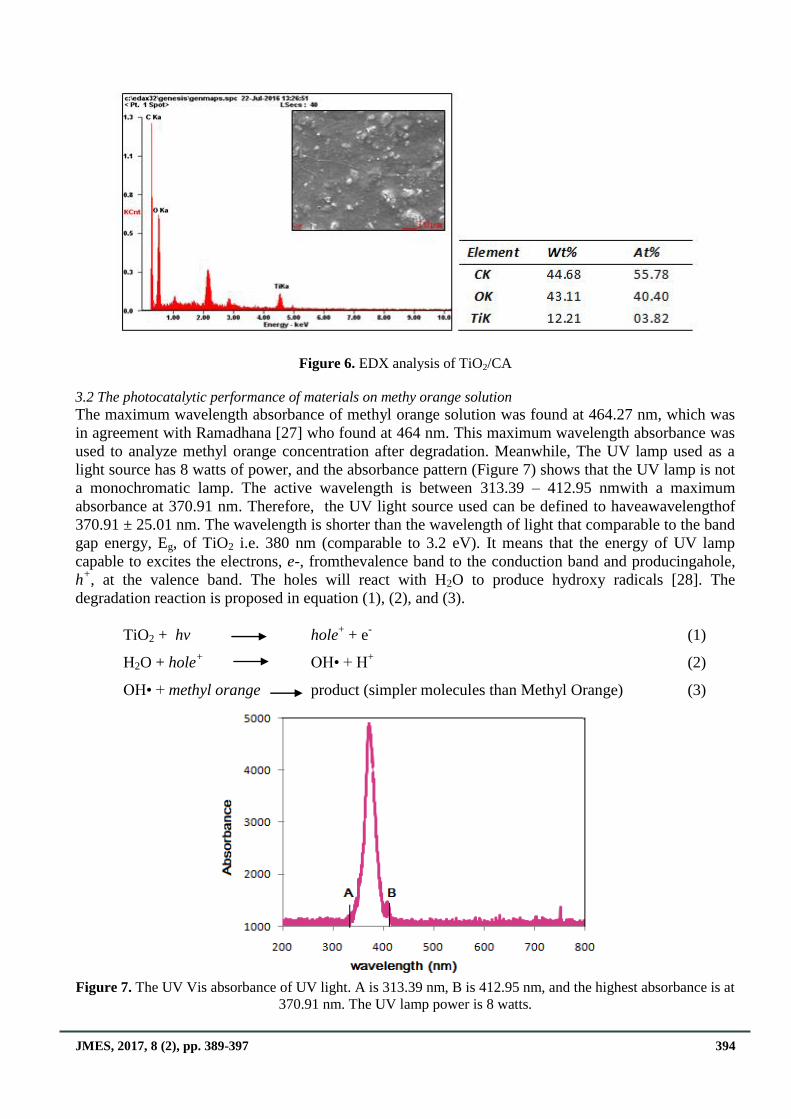
3.2 The photocatalytic performance of materials on methy orange solution
The maximum wavelength absorbance of methyl orange solution was found at 464.27 nm, which was
in agreement with Ramadhana [27] who found at 464 nm. This maximum wavelength absorbance was
used to analyze methyl orange concentration after degradation. Meanwhile, The UV lamp used as a
light source has 8 watts of power, and the absorbance pattern (Figure 7) shows that the UV lamp is not
a monochromatic lamp. The active wavelength is between 313.39 – 412.95 nmwith a maximum
absorbance at 370.91 nm. Therefore, the UV light source used can be defined to haveawavelengthof
370.91 ± 25.01 nm. The wavelength is shorter than the wavelength of light that comparable to the band
gap energy, Eg, of TiO2 i.e. 380 nm (comparable to 3.2 eV). It means that the energy of UV lamp
capable to excites the electrons, e-, fromthevalence band to the conduction band and producingahole,
h+, at the valence band. The holes will react with H2O to produce hydroxy radicals [28]. The
degradation reaction is proposed in equation (1), (2), and (3).
TiO2 + hv hole+ + e
- (1)
H2O + hole+
OH• + H+
(2)
OH• + methyl orange product (simpler molecules than Methyl Orange) (3)
Figure 7. The UV Vis absorbance of UV light. A is 313.39 nm, B is 412.95 nm, and the highest absorbance is at
370.91 nm. The UV lamp power is 8 watts.

JMES, 2017, 8 (2), pp. 389-397 395
Kinetics plots of methyl orange degradation (Figure 8 and 9) show that the photocatalytic
degradation with nano-TiO2 and TiO2-CA(NDC) able to decrease methyl orange concentration.
Meanwhile, the adsorption and photolysis method provided anonly small decrease in methyl orange
concentration. It indicates that the TiO2-CA(NDC) only has low adsorption capability, with arate
constant of 0.0013 ppm.min-1
. Meanwhile, the UV radiation without the present of photocatalyst also
only reduce the methyl orange concentration at a rate constant of 0.0009 ppm.min-1
.The
photodegradation using nano-TiO2 and TiO2-CA(NDC) have higher linear regression constant, R2, at
second order kinetics than the first order kinetics, indicates that the photodegradation prefers to follow
second order kinetics.The result is different with the other result on methyl orange degradation with
TiO2 P25 Degussa asaphotocatalyst that follows first order [29]. It is probably because of the dynamics
of reaction that varies depent on the reaction system. Beside of the fact that photocatalytic process are
very complex, and some aspect of the reaction mechanism and reaction kinetics are unclear [30]
This research found that the rate constant of degradation using nano-TiO2-CA(NDC) is
0.01±0.002 ppm.min-1
. The value is lower than the rate constant of degradation using nano-TiO2
powder asacatalyst, i.e. 0.015±0.003 ppm.min-1
. The rate constant valueof degradation with nano-TiO2
powder is actually higher than the degradation of methyl orange solution with a composite of TiO2-
zeolite, in which the rate constant value is 0.009 ppm.min-1
[27].However, after the nano-TiO2 is
embedded in a CA membrane, the rate constant value decrease and it is comparable tothe degradation
using TiO2-zeolite. The rate constant value shows that the immobilization of nano-TiO2 into CA(NDC)
decrease the photocatalytic activity of the catalyst. The CA membrane itself might inhibites the
radiation of UV light to TiO2 molecules. When the data was analyzed by statistical method i.e. the T
analysis, it is known that the different on the rate constant values are not significant. It means that in
the point of view of statistical analysis, the photocatalytic activity of the nano-TiO2 powder and its
immobilized form in CA(NDC) membrane is similar. However, the immobilized form offers the
advantage on eliminating the separation process from the treated solution. It will reduce a significant
large cost when it is applied to a large scale. A half time of degradation, t1/2
, that representthetime
required to degrade the half number of methyl orange molecules is also calculated by applying
equation (5) :
t1/2
2-order = 1
𝑘 𝐴 𝑜 (5)
[A]o is the initial absorbance of the treated solution. It means that the initial concentration affects the
half time parameter. High concentration will lead to a smaller value t1/2
. Calculation found that the t1/2
is 77 minutes when the degradation used nano-TiO2 powder as acatalyst, and the t1/2
is 115 minutes
when the nano-TiO2 is immobilized into CA(NDC). However, the half time will reduce significantly
when the composite nano-TiO2-CA(NDC) is used to degrade a high concentrate of methyl orange.
Figure 8. First order kinetics plots of methyl orange photodegradation with nano-TiO2 powder and TiO2-CA(NDC) in
comparison with the adsorption performance of TiO2-CA(NDC) and the photolysis under UV irradiation.

JMES, 2017, 8 (2), pp. 389-397 396
Figure9. Kinetics of the second order of methyl orange photodegradation with nano-TiO2 as photocatalyst and
nano-TiO2-CA(NDC) as aphotocatalyst, in comparison with the adsorption performance of TiO2-CA(NDC) and
the photolysis under UV light irradiation.
This research also analyzes the change in surface morphology after degradation, as described in Figure
10. At initial, the surface morphology of nano-TiO2-CA(NDC) is not homogeneus by presenting a coral like a
form of CA membrane (Figure 10(a)). After being used for methyl orange degradation, the surface morphology
change to become more homogeneus than the initial morphology, as described in Figure 10(b). It indicates that
during degradation process, the energy of UV light also capable ofdegrading the cellulose acetate molecules in
the host membrane. It also means that this composite photocatalyst has a limited life on applications. The EDX
analysis on the photocatalyst at before and after degradation also show the change in composition, especially the
decrease of C content. It indicates that cellulose might undergo self degradation during photocatalytic process.
An investigation on this cellulose degradation will be interesting to understand the cycling ability of the TiO2-
CA(NDC) in terms of its substrate stability. Meanwhile, the EDX analysis shows that TiO2, the photo-active
material is fully recovered by the membrane or the substrate.
Figure10. SEM images of membrane before and after degradation and the EDX result of membrane at before
(a) and after degradation (b)
JMES, 2017, 8 (2), pp. 389-397 397
Conclusions The immobilized nano-TiO2 in a cellulose acetate (CA) from nata de coco (NDC) show a photocatalytic activity
on methyl orange degradation with the rate constant of 0.01±0.002 ppm.min-1
. Eventhough, the rate
constant value is lower than the methyl orange degradation with nano-TiO2 powder, however, the
immobilized form offers an advantage of separation process from the treated solution. Statistical
analysis also found that the difference in the rate constant is not siginificant. It means that the
immobilization of nano-TiO2 into a CA(NDC) membrane will not reduce the photocatalytic activity of
TiO2. The positive impact is it will reduce the application cost due totheelimination of separation
treatment.
Acknowledgments-This research was funded by PNBP Sebelas Maret University 2015 and 2016. Authors express gratitude for
the financial support.
References 1. Znaidi L., Seraphimova R., Bocqouet J.F., Colbeau-Justin C., Pommier C., Mat.Res. Bull. 36 (2001) 811-
825.
2. Christina M., Mu’nisatun S., Saptaji R., Marjanto D., Jurnal Forum Nuklir. 1 (2007) 31-44.
3. Sopyan I., Mitsuru W., Sadao M., Chem. Lett. (1996) 69-70.
4. Xu N., Sui Z., Yigun F., Ing. Eng. Chem. Re.s, 38 (1999) 375-379.
5. Rajh T., J. Phys. Chem. 100 (1996)4538-4545.
6. Chen Y., Xiong X-P., Yang G., Zhang L-N., Lei, S-L., Liang H., Chinese J. Polym. Sci. 20 (2002) 369-37
7. Kolar M., Ankova H.M., Jirkovsky J., Heyrovsky M., Subrt J. Langmuir. 22(2006) 598.
8. Lee S.H., Kang M., Cho S.M., Han G.Y., Kim B.Y., Yon K.J., Chung C.H., J. Photochem. Photobiol. A:
Chem. 146(2001)121-128.
9. Rahmawati F., Kusumaningsih T., Hapsari A.M., Hastuti A., Chem. Paps.64(5) (2010)557-565.
10. Huang C-W, Liao C-H, Wu J.C.S., J. of Clean En. Tech.1(1) (2013)1-5.
11. Park J.H., Kim S., Bard A.J. Nano Letters. 6(1)(2006)24-28.
12. Wittmar A., Thierfeld H., K¨ochera S., Ulbricht M., RSC Adv. 5 (2015) 35866–35873.
13. Zularisam A.W., Ismaila A.F., Salimc M.R., Sakinaha M., Ozakid H., Desalination, 212 (2007) 191-208.
14. Zhou W., He J., Cui S., Gao W., The Open. Mat. Sci. J. 5 (2011) 51-55.
15. Abedini R., Mousavi S.M., Aminzadeh R., Desalination 277(2011)40-45
16. Aminzadeh R., Mousavi S.M., Abedini R., Chem. Indust. Chem. Eng. Quart. 18(2012) 385-398.
17. Ernia R., Mudjijono, Saraswati T., Alchemy. 11(2015) 90-101.
18. Natalia V. Karakterisasi TiO2 struktur nano pada selulosa asetate nata de coco. Thesis. Universitas
Sebelas Maret.(2013).
19. Radiman C.L., Yuliani G., Polym. Int. 57(2008) 502-508.
20. Desiyarni, Perancangan proses pembuatan selulosa asetat dari sellulosa mikrobial untuk membrane
ultrafiltrasi, Thesis, Institut Pertanian Bogor (2006).
21. Bhongsuwan D., Bhongsuwan T., Kasetsart. J. (Nat.Sci.). 42(2008) 311-317.
22. Bydson J.A. Plastic Materials, London, Butterworth-Heinemann (1995)
23. Kuo C.M., Bogan R.T., Process for the manufacture of cellulose acetate, US Patent. 5(1997) 1-8.
24. Rajabzadeh G.H., Firuzian A., Hamzelahdeh P., Polym. Int. 57 (2008) 502-508.
25. Sikhwivhilu L.M., Mpelane S., Moloto N. Ray S.S., Council Sci. Indust. Res. 3 (2010)1-5.
26. Cui L., Hui K.N., Hui K.S., Lee S.K., Zhou W., Wan Z.P., Ha-Thuc C.N., Materials Letters, 75 (2012)
175-178.
27. Ramadhana, Al Kautsar K., Wardhani S., Purwonugroho D., Student J. 1 (2013) 168-174.
28. Hoffmann M.R., Martin S.T., Choi W., Bahnaman D.W., Chem. Rev. 95 (1995) 69-96.
29. Rashed M.N., El-Amin A.A. Int. J. of Phys. Sci. 2(2007)073-081.
30. Yan L., Cheng Y., Yuan S., Yan X., Hu X., Oh K., Res Chem Intermed. 39 (2013) 1673-1684
(2017) ; http://www.jmaterenvironsci.com