COMPNAY REPORTS - ChangeWave Alliance > · Web view14-27 Inch Direct View Regular TV 70%...
36
ChangeWave Research: Television and Home Entertainment Benchmark Survey ChangeWave Research Report: Television & Home Entertainment Benchmark Survey HDTV Heating Up; LCD TVs the Top Pick for 2004 Companies: Sony (SNE), JVC (MC), Zenith (LGE), RCA (TMSPR), Samsung Overview In recent ChangeWave surveys, Alliance members have shown a willingness to increase spending on home entertainment during 2004 if new services and products become available. Big-screen televisions, in particular, are a focal point. During the week of February 9-13, 2004, we surveyed Alliance members on their television and home entertainment preferences, including current ownership and purchasing behavior, as well as plans for this year. The benchmarked results provide a wealth of consumer data useful for future surveys. A total of 761 members participated. Key Findings A. High-Definition Television (HDTV) High-Definition TV (HDTV) Gaining Ground. A total of 17% of respondents currently own HDTV equipped television sets. However, HDTV is fast becoming the standard choice. Seventy- nine percent (79%) of respondents said it is likely that the next television they buy will be an HDTV set. HD Ready Sets vs. Integrated HDTVs. Currently, by nearly a 5-to-1 margin (14% to 3%) respondents own HD-Ready sets (which require an HD tuner to decode signals) as opposed to Copyright © 2004 ChangeWave Research All rights reserved. March 12, 2004
Transcript of COMPNAY REPORTS - ChangeWave Alliance > · Web view14-27 Inch Direct View Regular TV 70%...
ChangeWave Research: Television and Home Entertainment Benchmark Survey
ChangeWave Research Report:Television & Home Entertainment Benchmark SurveyHDTV Heating Up; LCD TVs the Top Pick for 2004
Companies: Sony (SNE), JVC (MC), Zenith (LGE), RCA (TMSPR), Samsung
Overview
In recent ChangeWave surveys, Alliance members have shown a willingness to increase spending on home entertainment during 2004 if new services and products become available. Big-screen televisions, in particular, are a focal point.
During the week of February 9-13, 2004, we surveyed Alliance members on their television and home entertainment preferences, including current ownership and purchasing behavior, as well as plans for this year. The benchmarked results provide a wealth of consumer data useful for future surveys. A total of 761 members participated.
Key Findings
A. High-Definition Television (HDTV)
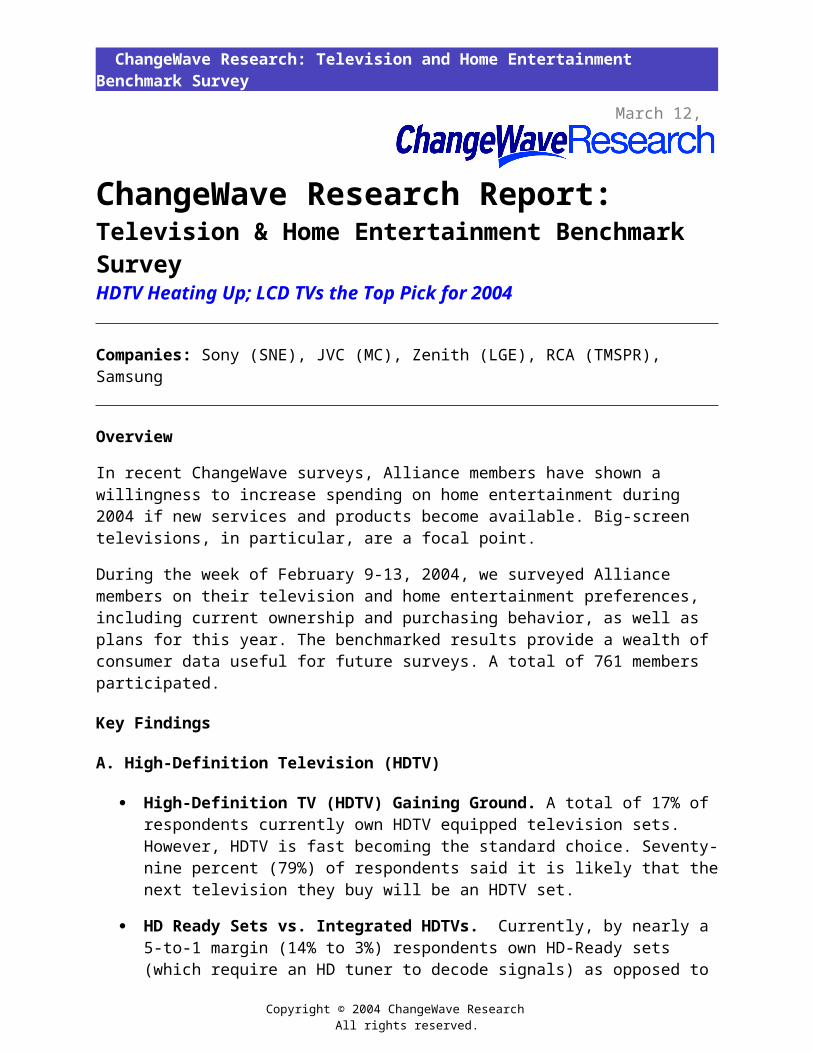
High-Definition TV (HDTV) Gaining Ground. A total of 17% of respondents currently own HDTV equipped television sets. However, HDTV is fast becoming the standard choice. Seventy-nine percent (79%) of respondents said it is likely that the next television they buy will be an HDTV set.
HD Ready Sets vs. Integrated HDTVs. Currently, by nearly a 5-to-1 margin (14% to 3%) respondents own HD-Ready sets (which require an HD tuner to decode signals) as opposed to Integrated HDTVs. However, the future clearly lies with Integrated HDTVs. Nearly half (48%) of the respondents said they are more likely to buy an Integrated HDTV, while only 19% said an HD-Ready Set.
B. Current Television Market
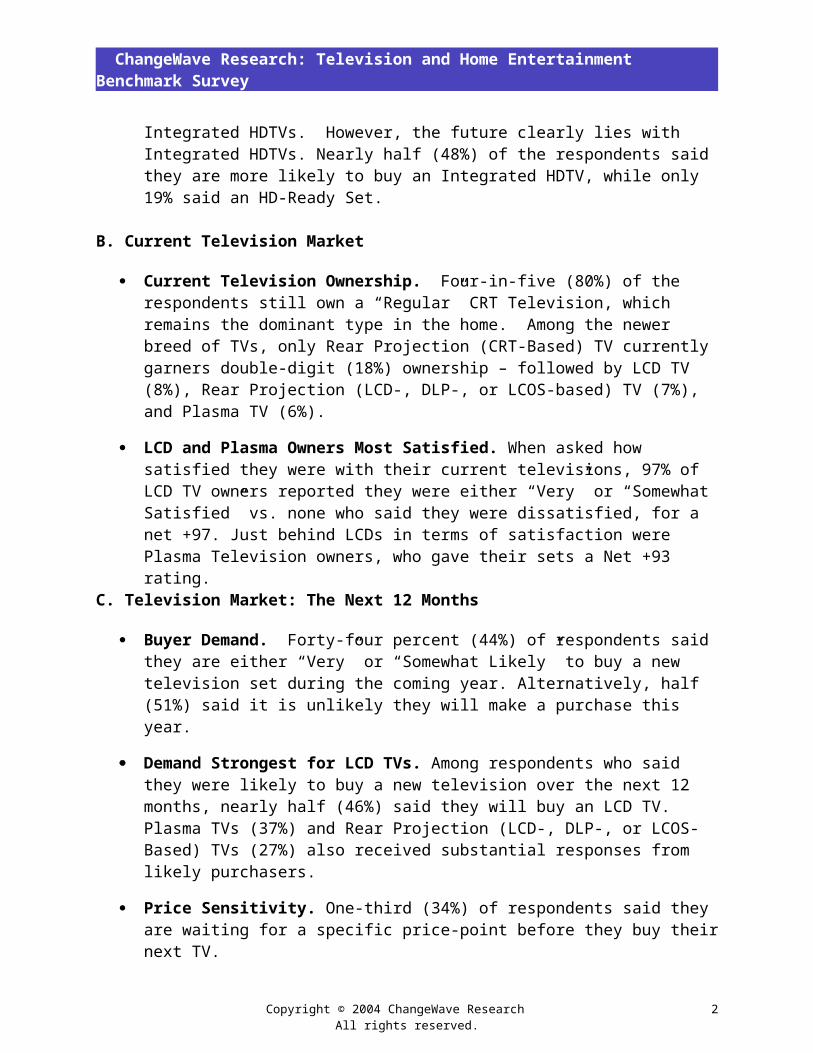
Current Television Ownership. Four-in-five (80%) of the respondents still own a “Regular” CRT Television, which remains the dominant type in the home. Among the newer breed of TVs, only Rear Projection (CRT-Based) TV currently garners double-digit (18%) ownership – followed by LCD TV (8%), Rear Projection (LCD-, DLP-, or LCOS-based) TV (7%), and Plasma TV (6%).
LCD and Plasma Owners Most Satisfied. When asked how satisfied they were with their current televisions, 97% of LCD TV owners reported they were either “Very” or “Somewhat Satisfied” vs. none who said they were dissatisfied, for a net +97. Just behind LCDs in terms of satisfaction were Plasma Television owners, who gave their sets a Net +93 rating.
Copyright © 2004 ChangeWave ResearchAll rights reserved.
March 12, 2004
ChangeWave Research: Television and Home Entertainment Benchmark Survey
C. Television Market: The Next 12 Months
Buyer Demand. Forty-four percent (44%) of respondents said they are either “Very” or “Somewhat Likely” to buy a new television set during the coming year. Alternatively, half (51%) said it is unlikely they will make a purchase this year.
Demand Strongest for LCD TVs. Among respondents who said they were likely to buy a new television over the next 12 months, nearly half (46%) said they will buy an LCD TV. Plasma TVs (37%) and Rear Projection (LCD-, DLP-, or LCOS-Based) TVs (27%) also received substantial responses from likely purchasers.
Price Sensitivity. One-third (34%) of respondents said they are waiting for a specific price-point before they buy their next TV.
Strongest and Weakest TV Brands: We compared currently-owned TV brands with the brands that our respondents said they prefer to purchase in 2004. Relatively Strongest: Sony by a wide margin. Also worth noting – Samsung had relatively high “Prefer to Purchase in 2004” demand among respondents in comparison to its “Currently-Owned” level. Relatively Weakest: RCA, Zenith and JVC showed dramatic plunges when comparing “Prefer to Purchase in 2004” demand with “Currently-Owned” levels.
D. Home Entertainment Services and Devices
We compared the home entertainment services and devices currently used by respondents vs. those they plan on adding in the next 12 months:
Home Entertainment Services on the Rise. HDTV is the biggest overall winner among home entertainment services for the coming year. Other services with a solid outlook are TiVo/Replay TV, Satellite Radio and Digital Video Recorders.
Services That Have Reached Saturation. The services that have clearly reached full saturation are Regular Cable TV, Regular Over-the-Air-Broadcasting and Pay-per-view. Also, Cable Internet Service shows little room for growth.
Home Entertainment Devices on the Upswing. High-end Theater/Home Audio-Video Systems are the biggest overall winner among home entertainment devices for the coming year. Other devices with a good upside are HD Decoders, Satellite Radio Receivers and Cable TV Set Top Boxes with DVR.
Cable Boxes Minus DVR are Old News. The one device that has clearly reached almost total saturation is the Cable TV Set Top Box – without DVR.
The ChangeWave Alliance is a group of 4,000 highly qualified business, technology, and medical professionals in leading companies of select industries—credentialed professionals who spend their everyday lives working on the frontline of technological change. ChangeWave surveys its Alliance members on a range of business and investment research and intelligence topics, collects feedback from them electronically, and converts the information into proprietary quantitative and qualitative reports.
Helping You Profit From A Rapidly Changing World ™www.ChangeWaveResearch.com
Copyright © 2004 ChangeWave Research All rights reserved.
2
ChangeWave Research: Television and Home Entertainment Benchmark Survey
Table of Contents
Summary of Key Findings.............................................................................................4
The Findings...................................................................................................................5
High-Definition Television (HDTV)..............................................................................5
Current Television Market...........................................................................................6
Television Market: The Next 12 Months....................................................................10
Home Entertainment Services and Devices..............................................................17
ChangeWave Research Methodology........................................................................22
About ChangeWave Research....................................................................................23
Copyright © 2004 ChangeWave Research All rights reserved.
3

ChangeWave Research: Television and Home Entertainment Benchmark Survey
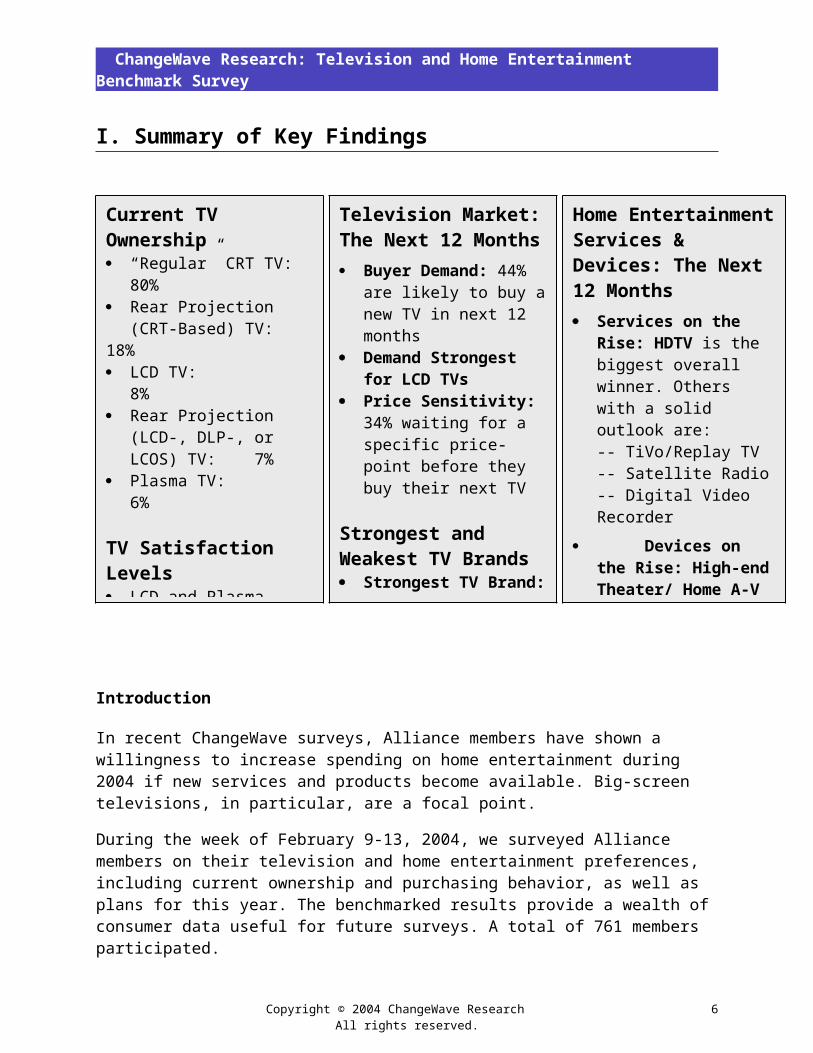
I. Summary of Key Findings
Introduction
In recent ChangeWave surveys, Alliance members have shown a willingness to increase spending on home entertainment during 2004 if new services and products become available. Big-screen televisions, in particular, are a focal point.
During the week of February 9-13, 2004, we surveyed Alliance members on their television and home entertainment preferences, including current ownership and purchasing behavior, as well as plans for this year. The benchmarked results provide a wealth of consumer data useful for future surveys. A total of 761 members participated.
The four key areas of focus are:
High-Definition Television (HDTV) Current Television Market Television Market: The Next 12 Months Home Entertainment Services and Devices
Copyright © 2004 ChangeWave Research All rights reserved.
4
Current TV Ownership “Regular” CRT TV: 80% Rear Projection
(CRT-Based) TV: 18% LCD TV: 8% Rear Projection (LCD-,
DLP-, or LCOS) TV: 7% Plasma TV: 6%
TV Satisfaction Levels LCD and Plasma Owners
are Most Satisfied:LCD: Net +97Plasma: Net +93
High-Definition TV 17% currently own
HDTV-equipped TV sets 79% say it is likely their
next TV will be an HDTV
Home Entertainment Services & Devices: The Next 12 Months Services on the Rise:
HDTV is the biggest overall winner. Others with a solid outlook are:-- TiVo/Replay TV-- Satellite Radio-- Digital Video Recorder
Devices on the Rise: High-end Theater/ Home A-V Systems are big overall winners. Others with upside are:--HD Decoders--Satellite Radio Receivers--Cable TV Set Top Box with DVR
Television Market: The Next 12 Months Buyer Demand: 44% are
likely to buy a new TV in next 12 months
Demand Strongest for LCD TVs
Price Sensitivity: 34% waiting for a specific price-point before they buy their next TV
Strongest and Weakest TV Brands Strongest TV Brand:
--Sony Weakest TV Brands:
--RCA--Zenith--JVC
ChangeWave Research: Television and Home Entertainment Benchmark Survey
II. The Findings
A. High-Definition Television (HDTV)
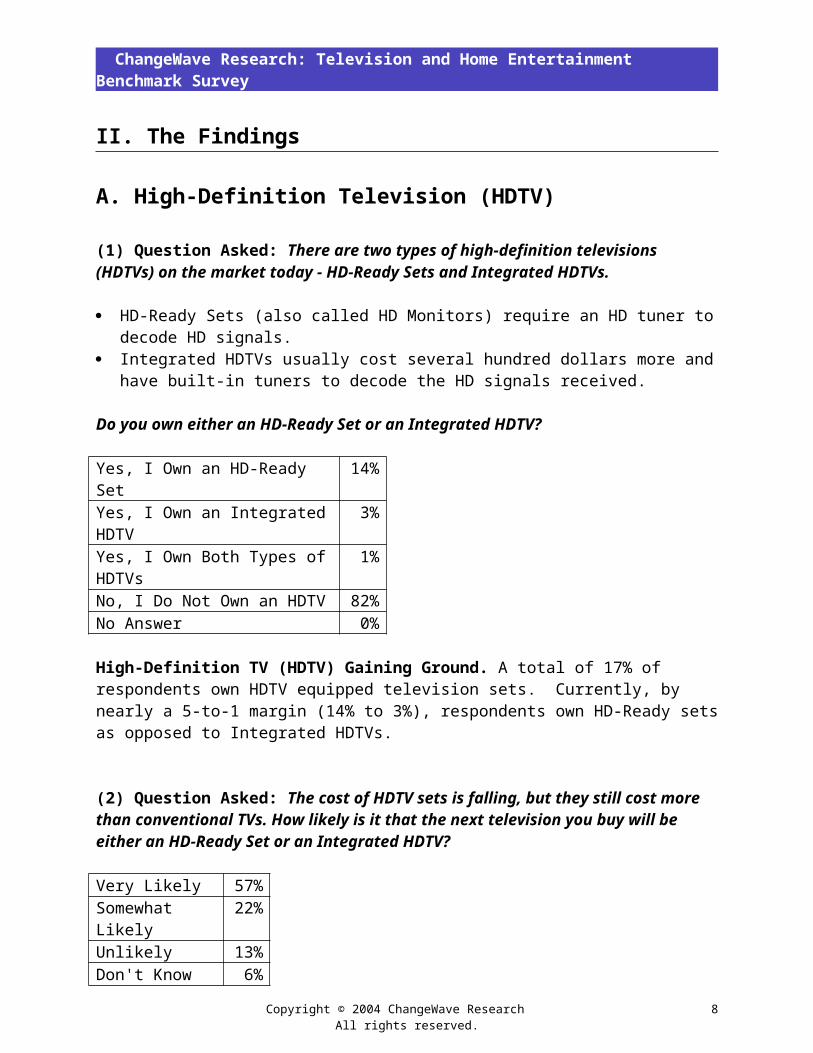
(1) Question Asked: There are two types of high-definition televisions (HDTVs) on the market today - HD-Ready Sets and Integrated HDTVs.
HD-Ready Sets (also called HD Monitors) require an HD tuner to decode HD signals.
Integrated HDTVs usually cost several hundred dollars more and have built-in tuners to decode the HD signals received.
Do you own either an HD-Ready Set or an Integrated HDTV?
Yes, I Own an HD-Ready Set 14%Yes, I Own an Integrated HDTV 3%Yes, I Own Both Types of HDTVs 1%No, I Do Not Own an HDTV 82%No Answer 0%
High-Definition TV (HDTV) Gaining Ground. A total of 17% of respondents own HDTV equipped television sets. Currently, by nearly a 5-to-1 margin (14% to 3%), respondents own HD-Ready sets as opposed to Integrated HDTVs.
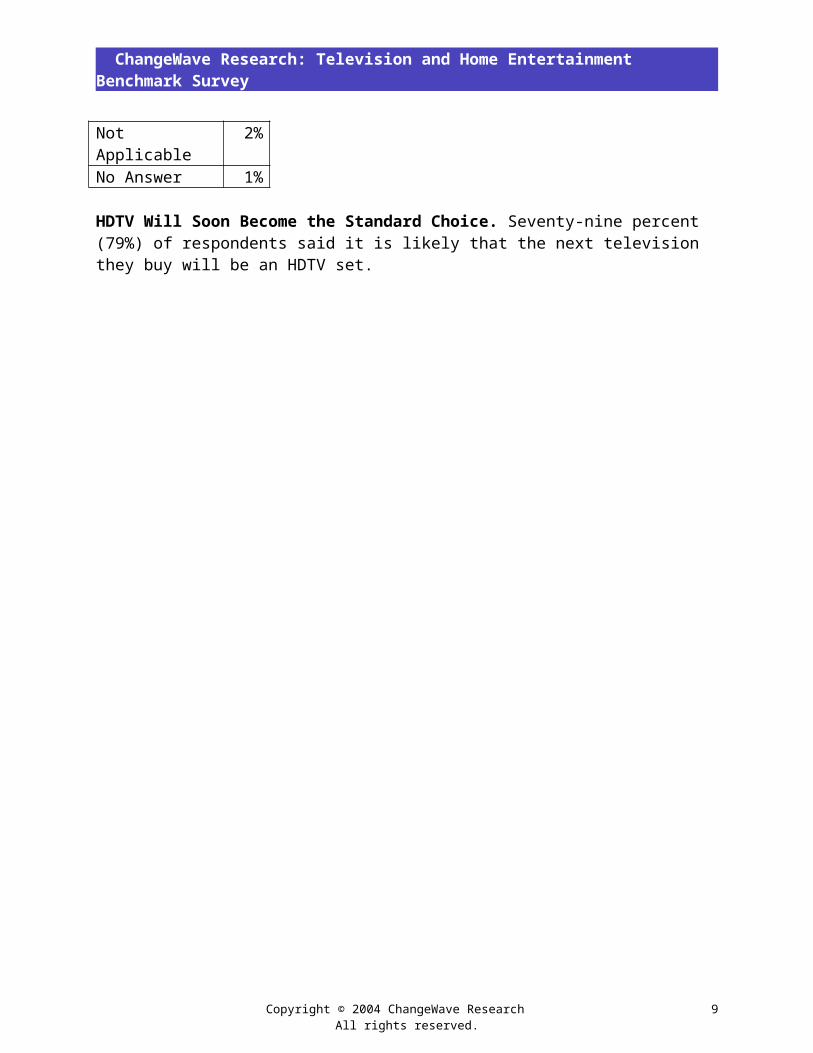
(2) Question Asked: The cost of HDTV sets is falling, but they still cost more than conventional TVs. How likely is it that the next television you buy will be either an HD-Ready Set or an Integrated HDTV? Very Likely 57%Somewhat Likely 22%Unlikely 13%Don't Know 6%Not Applicable 2%No Answer 1%
HDTV Will Soon Become the Standard Choice. Seventy-nine percent (79%) of respondents said it is likely that the next television they buy will be an HDTV set.
Copyright © 2004 ChangeWave Research All rights reserved.
5
ChangeWave Research: Television and Home Entertainment Benchmark Survey
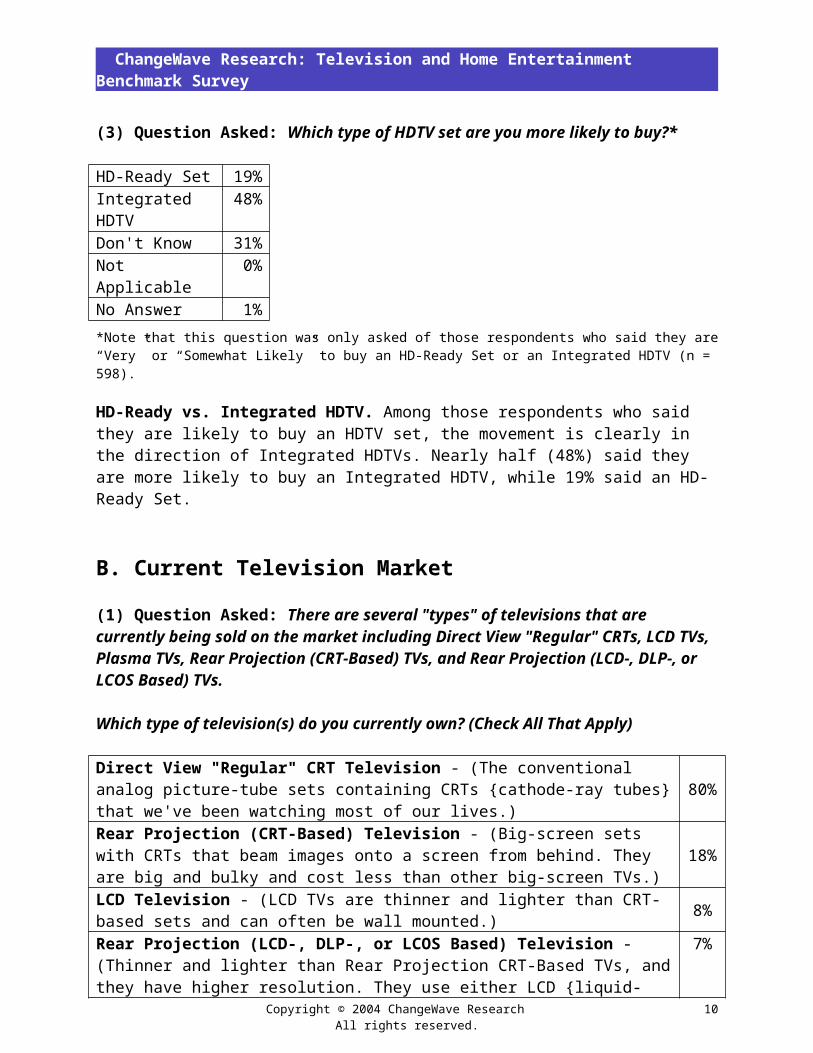
(3) Question Asked: Which type of HDTV set are you more likely to buy?*
HD-Ready Set 19%Integrated HDTV 48%Don't Know 31%Not Applicable 0%No Answer 1%*Note that this question was only asked of those respondents who said they are “Very” or “Somewhat Likely” to buy an HD-Ready Set or an Integrated HDTV (n = 598).
HD-Ready vs. Integrated HDTV. Among those respondents who said they are likely to buy an HDTV set, the movement is clearly in the direction of Integrated HDTVs. Nearly half (48%) said they are more likely to buy an Integrated HDTV, while 19% said an HD-Ready Set.
B. Current Television Market (1) Question Asked: There are several "types" of televisions that are currently being sold on the market including Direct View "Regular" CRTs, LCD TVs, Plasma TVs, Rear Projection (CRT-Based) TVs, and Rear Projection (LCD-, DLP-, or LCOS Based) TVs.
Which type of television(s) do you currently own? (Check All That Apply)
Direct View "Regular" CRT Television - (The conventional analog picture-tube sets containing CRTs {cathode-ray tubes} that we've been watching most of our lives.)
80%
Rear Projection (CRT-Based) Television - (Big-screen sets with CRTs that beam images onto a screen from behind. They are big and bulky and cost less than other big-screen TVs.)
18%
LCD Television - (LCD TVs are thinner and lighter than CRT-based sets and can often be wall mounted.) 8%
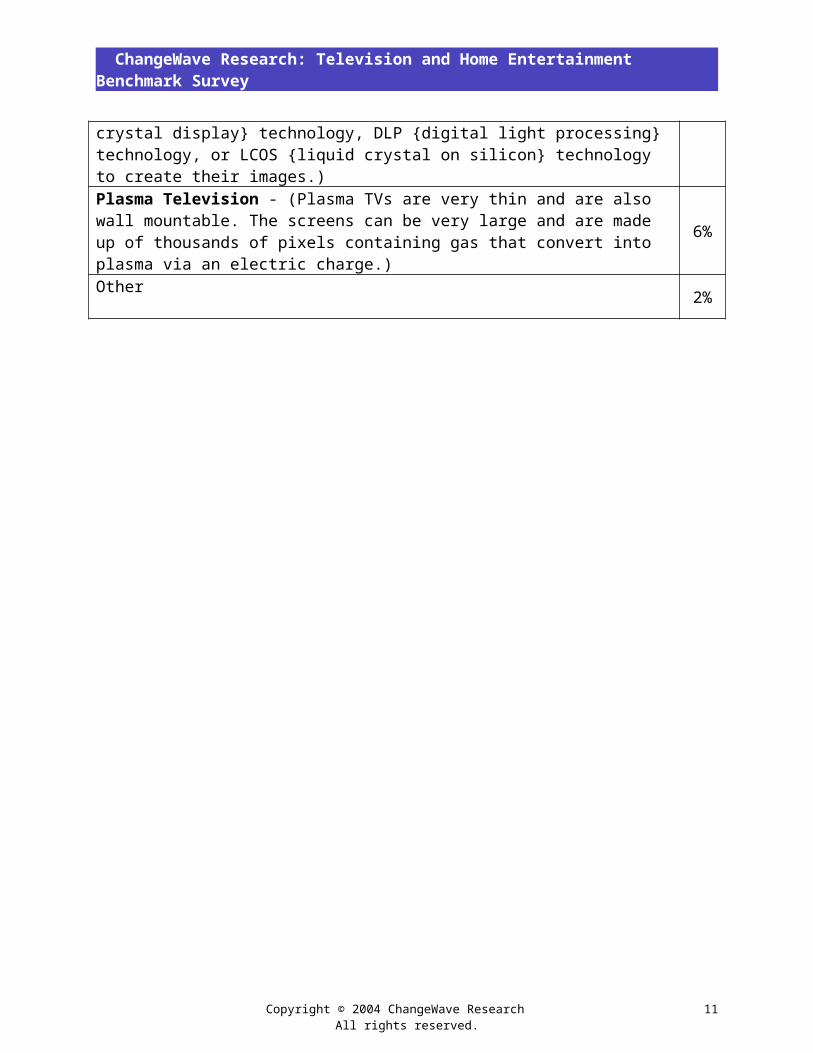
Rear Projection (LCD-, DLP-, or LCOS Based) Television - (Thinner and lighter than Rear Projection CRT-Based TVs, and they have higher resolution. They use either LCD {liquid-crystal display} technology, DLP {digital light processing} technology, or LCOS {liquid crystal on silicon} technology to create their images.)
7%
Plasma Television - (Plasma TVs are very thin and are also wall mountable. The screens can be very large and are made up of thousands of pixels containing gas that convert into plasma via an electric charge.)
6%
Other 2%
Copyright © 2004 ChangeWave Research All rights reserved.
6
ChangeWave Research: Television and Home Entertainment Benchmark Survey
Current Television Ownership. 4-in-5 (80%) of respondents still own a “Regular” CRT Television, which remains the dominant type in the home.
Among the newer breed of televisions, only Rear Projection (CRT-Based) Television currently garners double-digit (18%) ownership – followed by LCD Television (8%), Rear Projection (LCD-, DLP-, or LCOS-based) Television (7%), and Plasma Television (6%).
(2) Question Asked: What sizes are your current television(s)? (Check All That Apply)
Direct View "Regular" CRT Television14-27 Inch Direct View Regular TV
70%
32-Inch Direct View Regular TV 37%36-Inch Direct View Regular TV 26%
LCD Television14-30 Inch LCD TV 80%31-49 Inch LCD TV 20%Greater Than 49 Inch LCD TV 0%
Plasma Television32-42 Inch Plasma TV 50%Greater Than 42 Inch Plasma TV 50%
Rear Projection (CRT-Based) Television42-49 Inch Rear Projection (CRT-Based) TV 26%50-57 Inch Rear Projection (CRT-Based) TV 58%Greater Than 57 Inch Rear Projection (CRT-Based) TV
16%
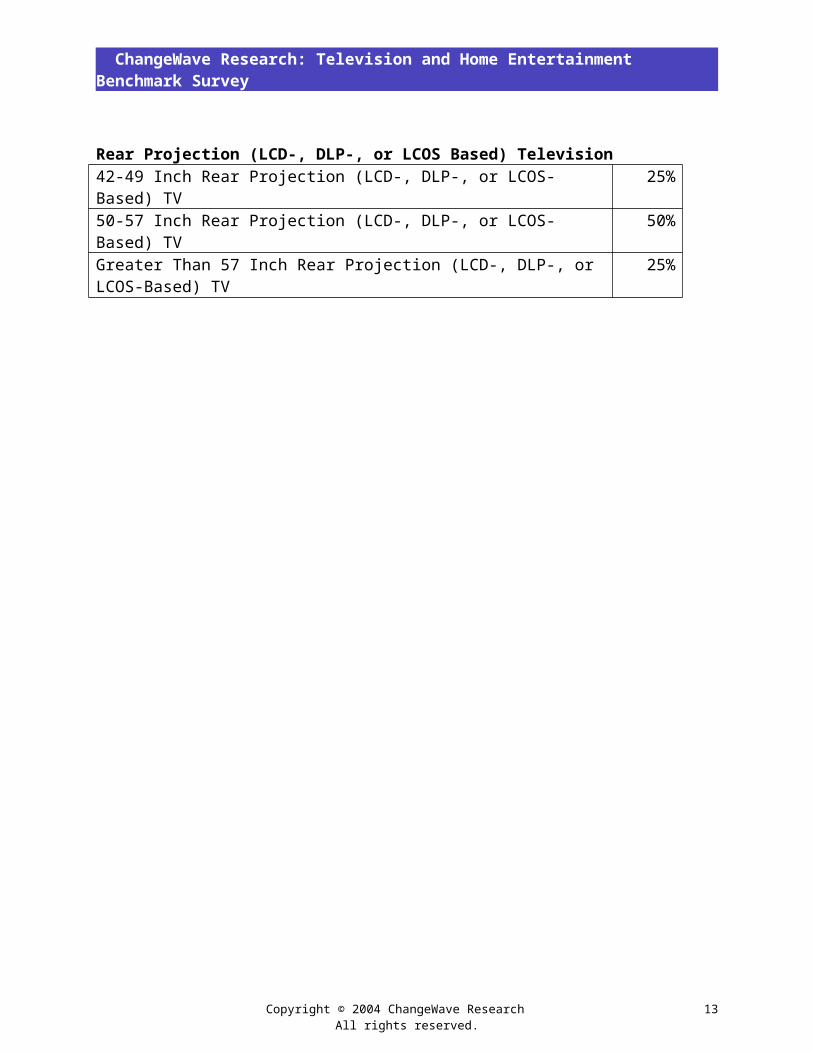
Rear Projection (LCD-, DLP-, or LCOS Based) Television42-49 Inch Rear Projection (LCD-, DLP-, or LCOS-Based) TV 25%50-57 Inch Rear Projection (LCD-, DLP-, or LCOS-Based) TV 50%Greater Than 57 Inch Rear Projection (LCD-, DLP-, or LCOS-Based) TV
25%
Copyright © 2004 ChangeWave Research All rights reserved.
7
ChangeWave Research: Television and Home Entertainment Benchmark Survey
Copyright © 2004 ChangeWave Research All rights reserved.
8
ChangeWave Research: Television and Home Entertainment Benchmark Survey
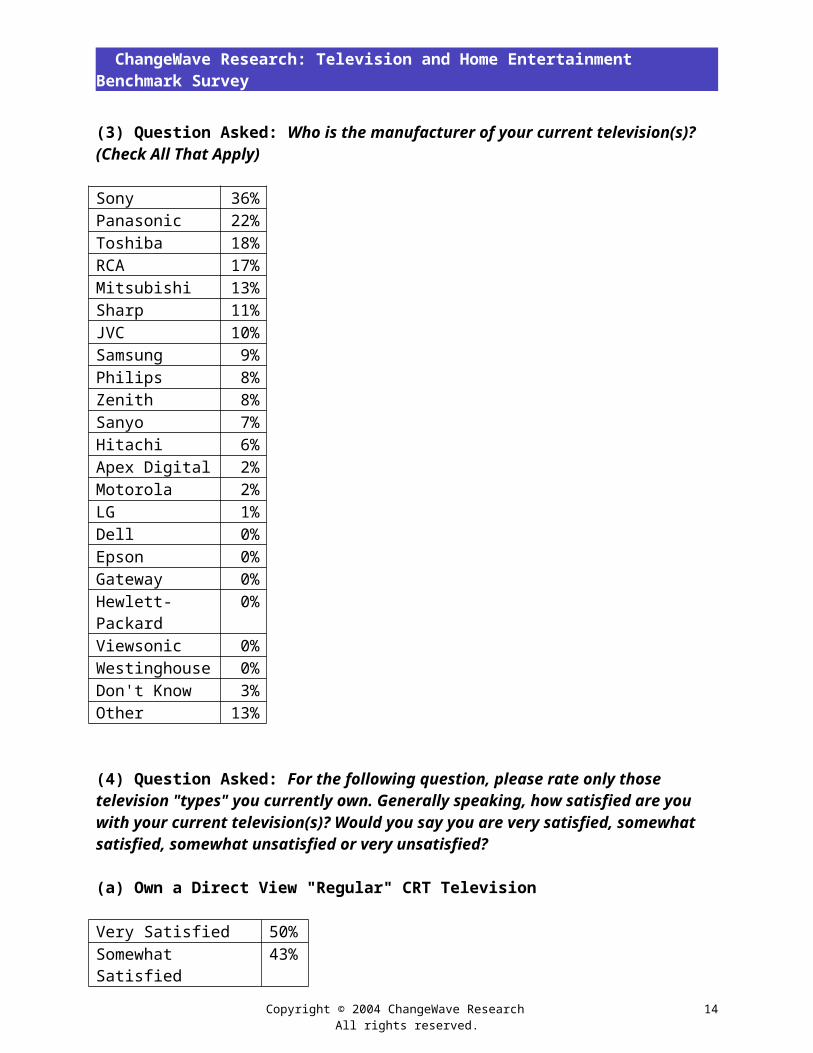
(3) Question Asked: Who is the manufacturer of your current television(s)? (Check All That Apply) Sony 36%Panasonic 22%Toshiba 18%RCA 17%Mitsubishi 13%Sharp 11%JVC 10%Samsung 9%Philips 8%Zenith 8%Sanyo 7%Hitachi 6%Apex Digital 2%Motorola 2%LG 1%Dell 0%Epson 0%Gateway 0%Hewlett-Packard 0%Viewsonic 0%Westinghouse 0%Don't Know 3%Other 13%
(4) Question Asked: For the following question, please rate only those television "types" you currently own. Generally speaking, how satisfied are you with your current television(s)? Would you say you are very satisfied, somewhat satisfied, somewhat unsatisfied or very unsatisfied?
(a) Own a Direct View "Regular" CRT Television Very Satisfied 50%Somewhat Satisfied 43%Somewhat Unsatisfied 7%Very Unsatisfied 1%No Answer 0%
(b) Own an LCD Television
Very Satisfied 64%Somewhat Satisfied 33%Somewhat Unsatisfied 0%Very Unsatisfied 0%No Answer 2%
Copyright © 2004 ChangeWave Research All rights reserved.
9
ChangeWave Research: Television and Home Entertainment Benchmark Survey
(c) Own a Plasma Television
Very Satisfied 63%Somewhat Satisfied 33%Somewhat Unsatisfied 3%Very Unsatisfied 0%No Answer 0%
(d) Own a Rear Projection (CRT-Based) Television
Very Satisfied 50%Somewhat Satisfied 40%Somewhat Unsatisfied 4%Very Unsatisfied 4%No Answer 2%
(e) Own a Rear Projection (LCD-, DLP-, or LCOS Based) Television
Very Satisfied 59%Somewhat Satisfied 30%Somewhat Unsatisfied 5%Very Unsatisfied 3%No Answer 3%
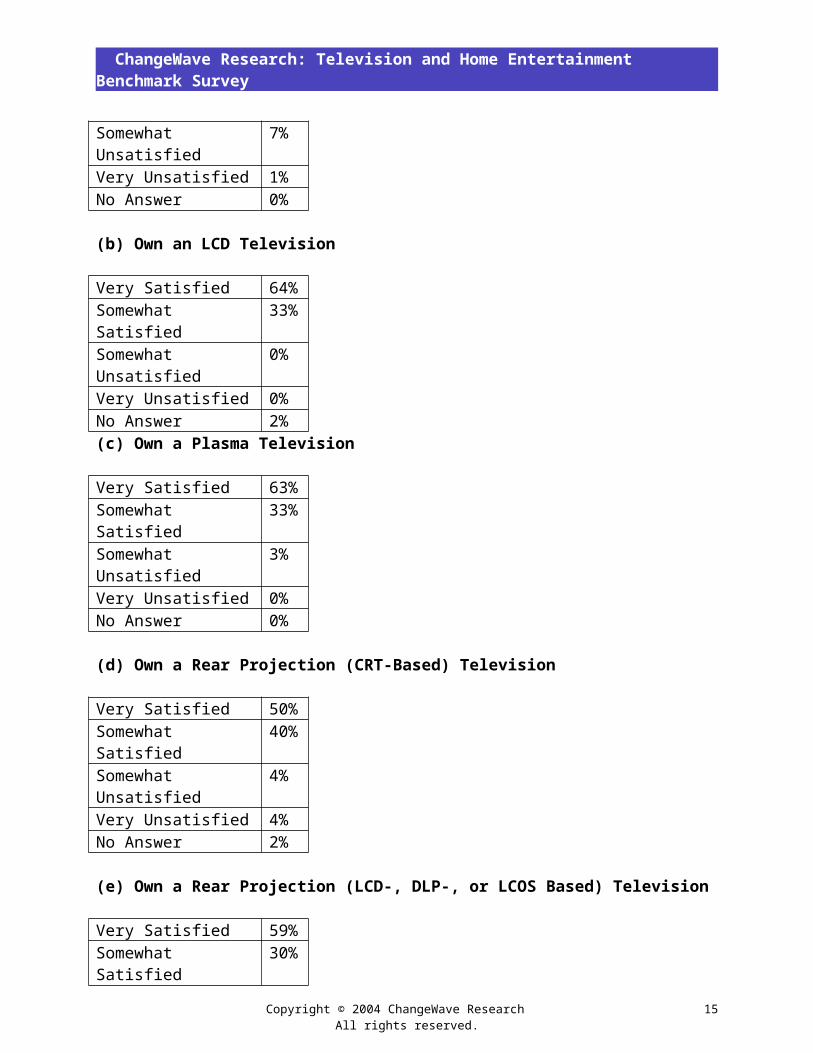
LCD and Plasma Owners Most Satisfied. When asked how satisfied they were with their current televisions, 97% of LCD Television owners reported they were either “Very” or “Somewhat Satisfied” versus none who said they were dissatisfied, for a net +97. Just behind in terms of satisfaction were Plasma Television owners, who gave their sets a net +93 rating.
Rear Projection sets (both CRT-based and LCD-, DLP-, or LCOS-based) did not fare quite as well in terms of customer satisfaction, scoring net +82 and net +81 respectively.
(5) Question Asked: How familiar are you with the technology differences and relative merits between LCD TVs, Plasma TVs, Rear Projection (CRT-Based) TVs, and Rear Projection (LCD-, DLP-, or LCOS Based) TVs?
Very Familiar 17%Somewhat Familiar
61%
Unfamiliar 21%No Answer 1%
Early Adopters are in the Know. More than three-quarters (78%) of our respondents said they were either “Very Familiar” (17%) or “Somewhat Familiar” (61%) with the technologies and relative merits of the various new types of televisions.
Copyright © 2004 ChangeWave Research All rights reserved.
10
ChangeWave Research: Television and Home Entertainment Benchmark Survey
(6) Question Asked: Is familiarity with the technology differences and relative merits critical to your TV purchase decisions?
Yes, knowing all the technology differences and relative merits is critical to my TV purchase decision 41%
Yes, knowing all the technology differences and relative merits is important but not absolutely necessary to my TV purchase decision 45%
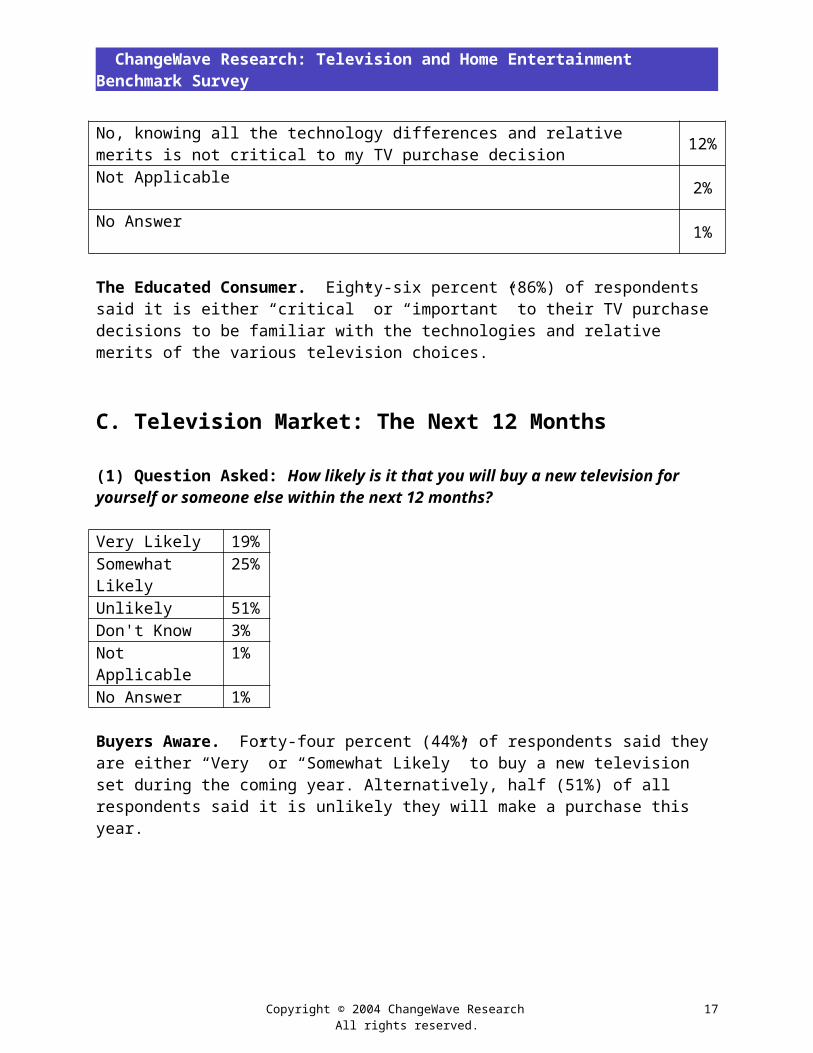
No, knowing all the technology differences and relative merits is not critical to my TV purchase decision 12%
Not Applicable 2%
No Answer 1%
The Educated Consumer. Eighty-six percent (86%) of respondents said it is either “critical” or “important” to their TV purchase decisions to be familiar with the technologies and relative merits of the various television choices.
C. Television Market: The Next 12 Months
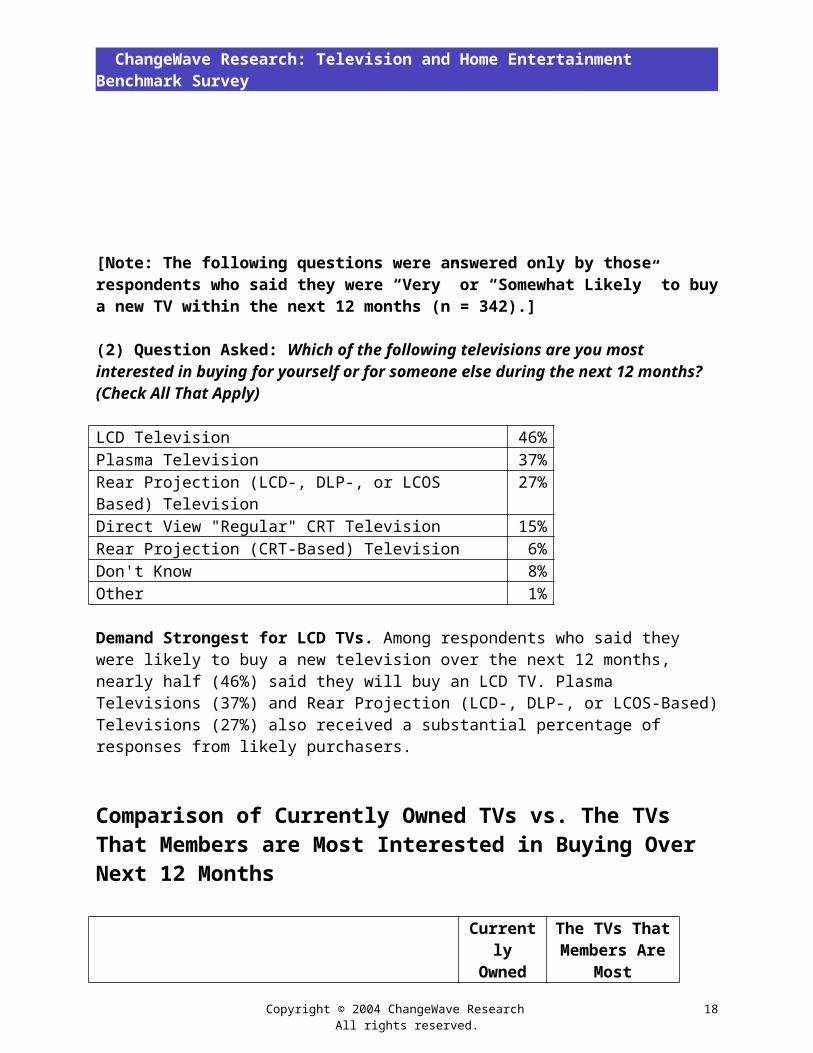
(1) Question Asked: How likely is it that you will buy a new television for yourself or someone else within the next 12 months?
Very Likely 19%Somewhat Likely 25%Unlikely 51%Don't Know 3%Not Applicable 1%No Answer 1%
Buyers Aware. Forty-four percent (44%) of respondents said they are either “Very” or “Somewhat Likely” to buy a new television set during the coming year. Alternatively, half (51%) of all respondents said it is unlikely they will make a purchase this year.
Copyright © 2004 ChangeWave Research All rights reserved.
11
ChangeWave Research: Television and Home Entertainment Benchmark Survey
[Note: The following questions were answered only by those respondents who said they were “Very” or “Somewhat Likely” to buy a new TV within the next 12 months (n = 342).]
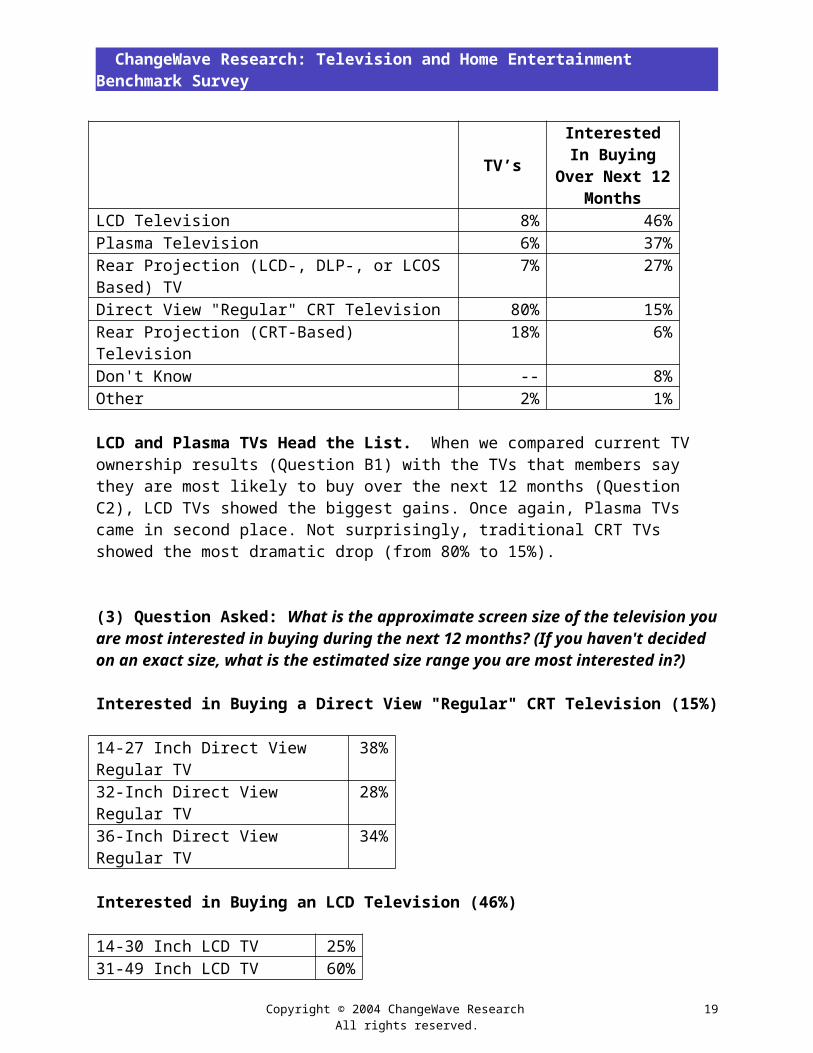
(2) Question Asked: Which of the following televisions are you most interested in buying for yourself or for someone else during the next 12 months? (Check All That Apply)
LCD Television 46%Plasma Television 37%Rear Projection (LCD-, DLP-, or LCOS Based) Television 27%Direct View "Regular" CRT Television 15%Rear Projection (CRT-Based) Television 6%Don't Know 8%Other 1%
Demand Strongest for LCD TVs. Among respondents who said they were likely to buy a new television over the next 12 months, nearly half (46%) said they will buy an LCD TV. Plasma Televisions (37%) and Rear Projection (LCD-, DLP-, or LCOS-Based) Televisions (27%) also received a substantial percentage of responses from likely purchasers.
Comparison of Currently Owned TVs vs. The TVs That Members are Most Interested in Buying Over Next 12 Months
CurrentlyOwned
TV’s
The TVs That Members Are
Most InterestedIn Buying Over Next 12 Months
LCD Television 8% 46%Plasma Television 6% 37%Rear Projection (LCD-, DLP-, or LCOS Based) TV 7% 27%Direct View "Regular" CRT Television 80% 15%Rear Projection (CRT-Based) Television 18% 6%Don't Know -- 8%Other 2% 1%
LCD and Plasma TVs Head the List. When we compared current TV ownership results (Question B1) with the TVs that members say they are most likely to buy over the next 12 months (Question C2), LCD TVs showed the biggest gains. Once again, Plasma TVs came in second place. Not surprisingly, traditional CRT TVs showed the most dramatic drop (from 80% to 15%).
Copyright © 2004 ChangeWave Research All rights reserved.
12
ChangeWave Research: Television and Home Entertainment Benchmark Survey
(3) Question Asked: What is the approximate screen size of the television you are most interested in buying during the next 12 months? (If you haven't decided on an exact size, what is the estimated size range you are most interested in?) Interested in Buying a Direct View "Regular" CRT Television (15%)
14-27 Inch Direct View Regular TV
38%
32-Inch Direct View Regular TV 28%36-Inch Direct View Regular TV 34%
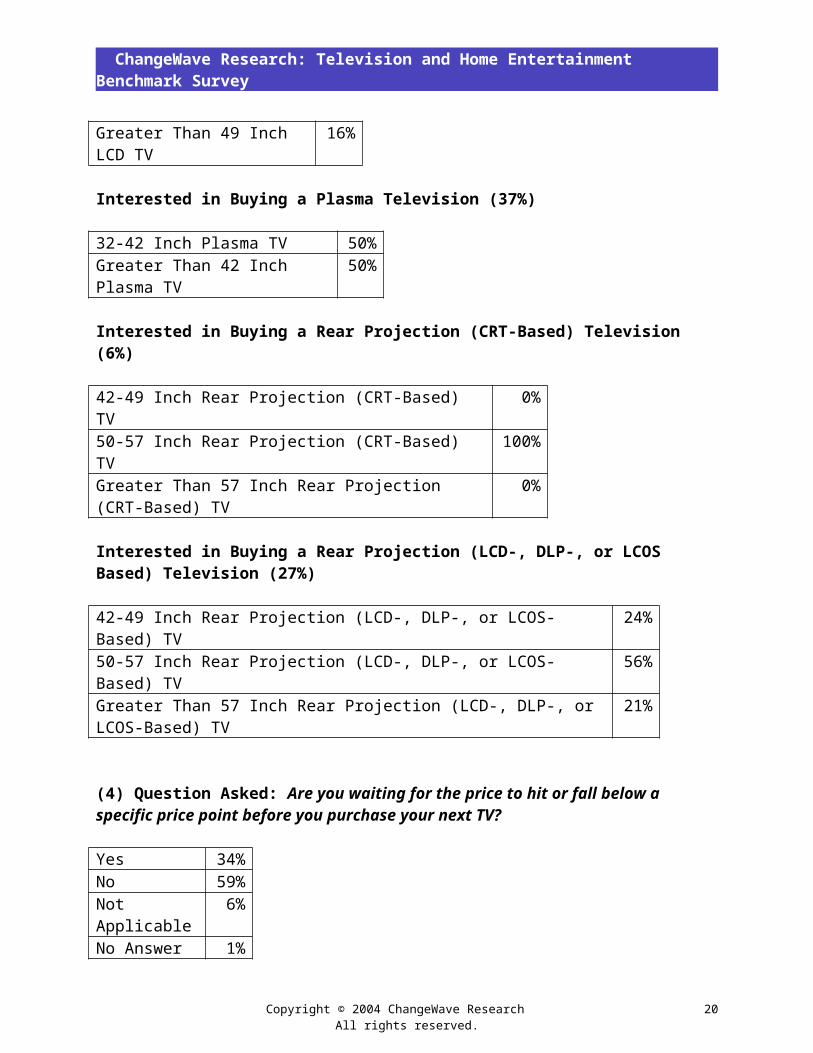
Interested in Buying an LCD Television (46%)
14-30 Inch LCD TV 25%31-49 Inch LCD TV 60%Greater Than 49 Inch LCD TV 16%
Interested in Buying a Plasma Television (37%)
32-42 Inch Plasma TV 50%Greater Than 42 Inch Plasma TV 50%
Interested in Buying a Rear Projection (CRT-Based) Television (6%)
42-49 Inch Rear Projection (CRT-Based) TV 0%50-57 Inch Rear Projection (CRT-Based) TV 100%Greater Than 57 Inch Rear Projection (CRT-Based) TV
0%
Interested in Buying a Rear Projection (LCD-, DLP-, or LCOS Based) Television (27%)
42-49 Inch Rear Projection (LCD-, DLP-, or LCOS-Based) TV 24%50-57 Inch Rear Projection (LCD-, DLP-, or LCOS-Based) TV 56%Greater Than 57 Inch Rear Projection (LCD-, DLP-, or LCOS-Based) TV
21%
(4) Question Asked: Are you waiting for the price to hit or fall below a specific price point before you purchase your next TV?
Price Sensitivity. One-third (34%) of respondents said they are waiting for a specific price-point before they buy their next TV.
Copyright © 2004 ChangeWave Research All rights reserved.
Yes 34%No 59%Not Applicable 6%No Answer 1%
13
ChangeWave Research: Television and Home Entertainment Benchmark Survey
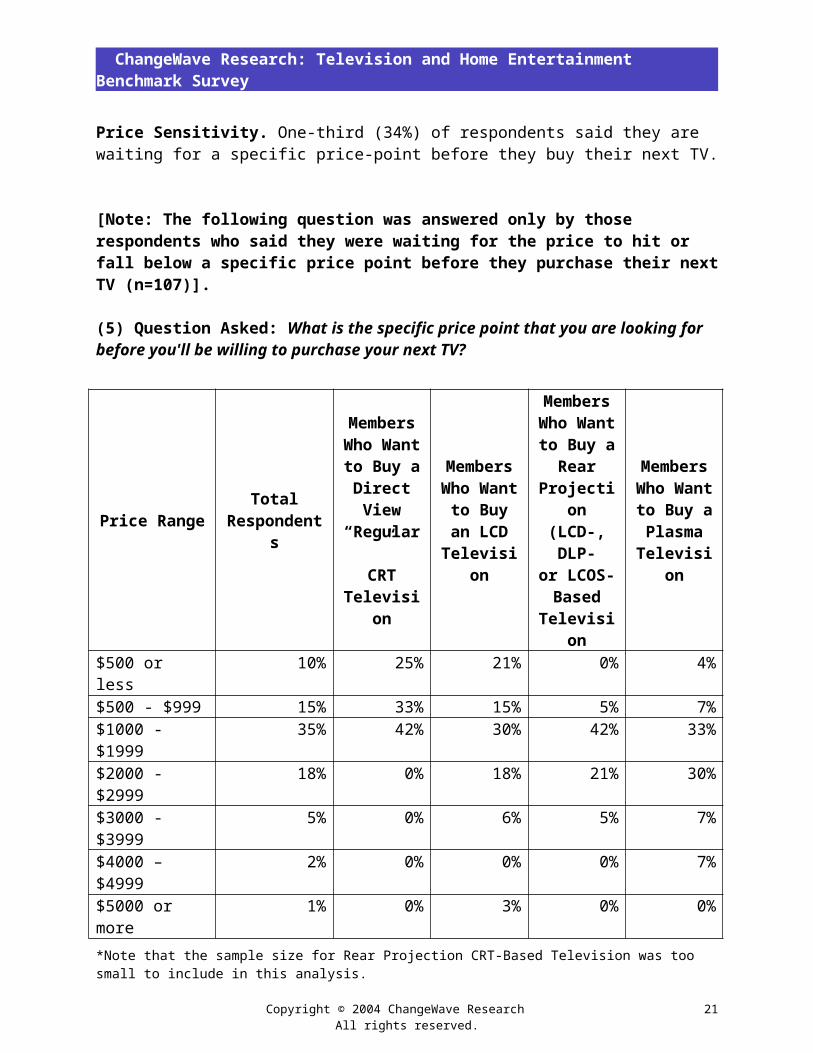
[Note: The following question was answered only by those respondents who said they were waiting for the price to hit or fall below a specific price point before they purchase their next TV (n=107)].
(5) Question Asked: What is the specific price point that you are looking for before you'll be willing to purchase your next TV?
Price Range TotalRespondents
MembersWho Wantto Buy aDirectView
“Regular”CRT
Television
MembersWho Want
to Buyan LCD
Television
MembersWho Wantto Buy a
RearProjection
(LCD-,DLP-
or LCOS-Based
Television
MembersWho Wantto Buy aPlasma
Television
$500 or less 10% 25% 21% 0% 4%$500 - $999 15% 33% 15% 5% 7%$1000 - $1999 35% 42% 30% 42% 33%$2000 - $2999 18% 0% 18% 21% 30%$3000 - $3999 5% 0% 6% 5% 7%$4000 – $4999 2% 0% 0% 0% 7%$5000 or more 1% 0% 3% 0% 0%*Note that the sample size for Rear Projection CRT-Based Television was too small to include in this analysis.
Copyright © 2004 ChangeWave Research All rights reserved.
14
ChangeWave Research: Television and Home Entertainment Benchmark Survey
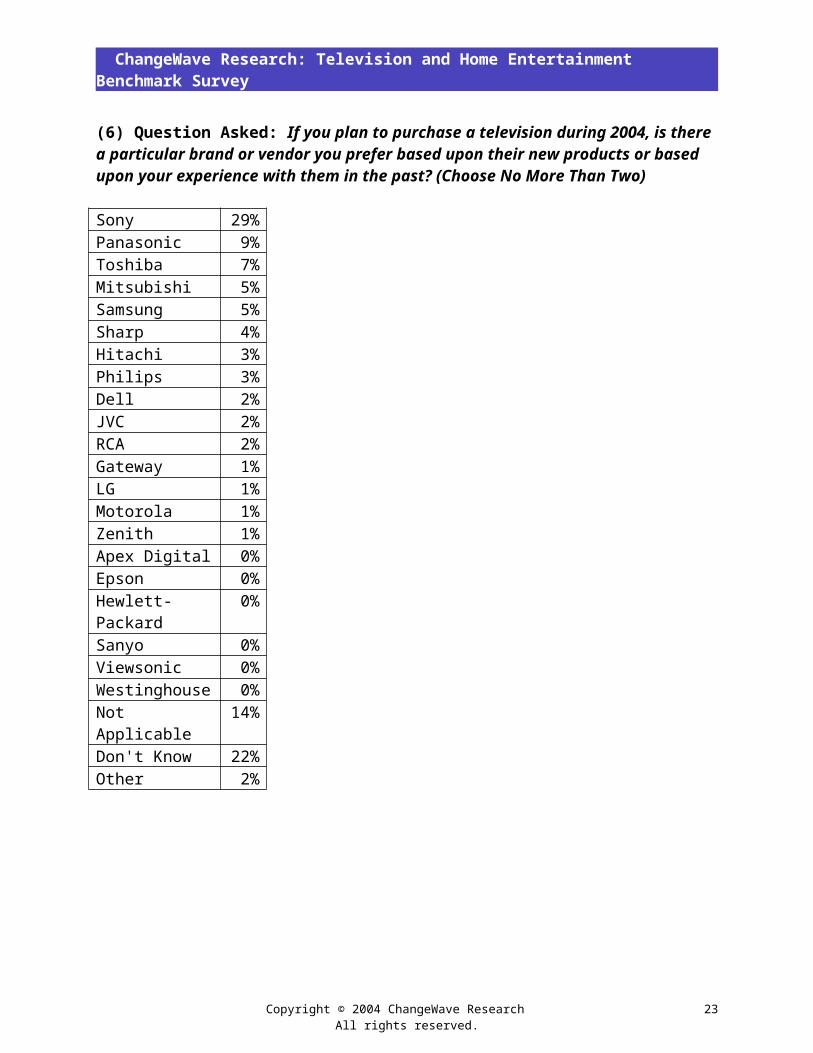
(6) Question Asked: If you plan to purchase a television during 2004, is there a particular brand or vendor you prefer based upon their new products or based upon your experience with them in the past? (Choose No More Than Two)
Sony 29%Panasonic 9%Toshiba 7%Mitsubishi 5%Samsung 5%Sharp 4%Hitachi 3%Philips 3%Dell 2%JVC 2%RCA 2%Gateway 1%LG 1%Motorola 1%Zenith 1%Apex Digital 0%Epson 0%Hewlett-Packard 0%Sanyo 0%Viewsonic 0%Westinghouse 0%Not Applicable 14%Don't Know 22%Other 2%
Copyright © 2004 ChangeWave Research All rights reserved.
15
ChangeWave Research: Television and Home Entertainment Benchmark Survey
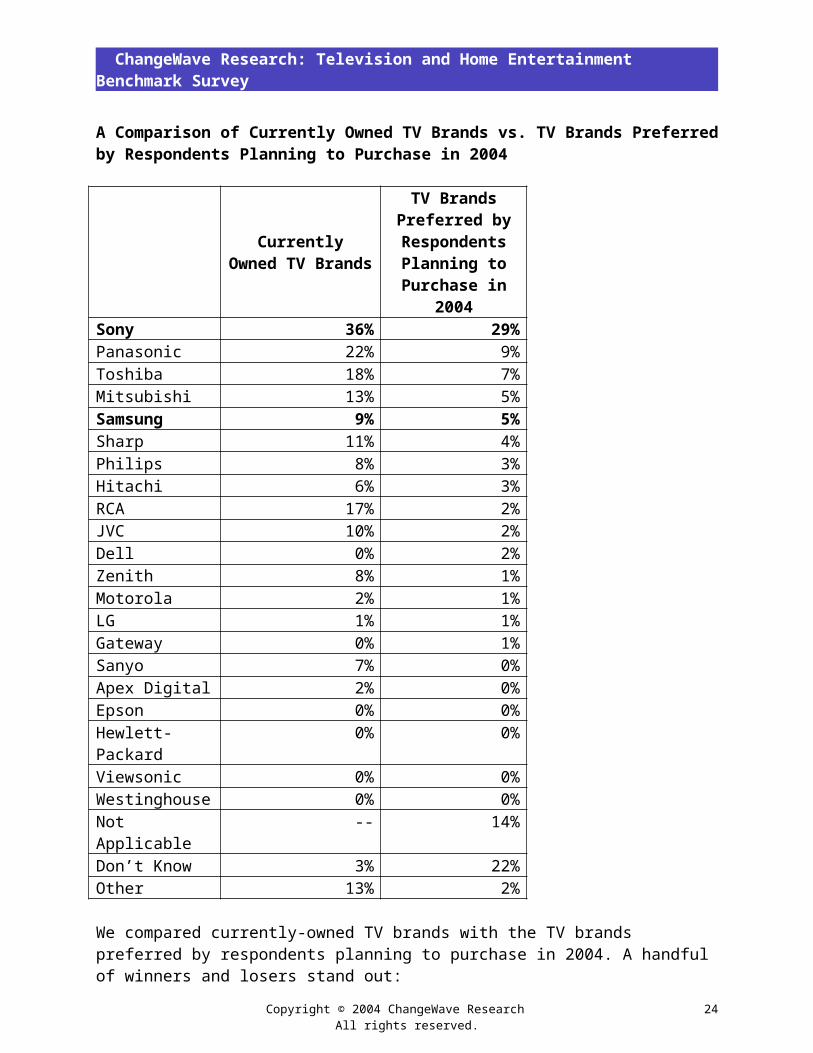
A Comparison of Currently Owned TV Brands vs. TV Brands Preferred by Respondents Planning to Purchase in 2004
CurrentlyOwned TV Brands
TV Brands Preferred by Respondents Planning to
Purchase in 2004Sony 36% 29%Panasonic 22% 9%Toshiba 18% 7%Mitsubishi 13% 5%Samsung 9% 5%Sharp 11% 4%Philips 8% 3%Hitachi 6% 3%RCA 17% 2%JVC 10% 2%Dell 0% 2%Zenith 8% 1%Motorola 2% 1%LG 1% 1%Gateway 0% 1%Sanyo 7% 0%Apex Digital 2% 0%Epson 0% 0%Hewlett-Packard 0% 0%Viewsonic 0% 0%Westinghouse 0% 0%Not Applicable -- 14%Don’t Know 3% 22%Other 13% 2%
We compared currently-owned TV brands with the TV brands preferred by respondents planning to purchase in 2004. A handful of winners and losers stand out:
Relatively Strongest: Sony by a wide margin. Also worth noting – Samsung had relatively high “Prefer to Purchase in 2004” demand among respondents in comparison to its “Currently-Owned” level.
Relatively Weakest: RCA, Zenith and JVC showed dramatic plunges when comparing “Prefer to Purchase in 2004” demand with “Currently-Owned” levels (e.g., RCA falls from 17% “Currently” to 2% “Prefer to Purchase in 2004”).
Copyright © 2004 ChangeWave Research All rights reserved.
16
ChangeWave Research: Television and Home Entertainment Benchmark Survey
(7) The Super Bowl is considered an important motivator for sales of big-screen TVs. Do you personally know anyone who was motivated enough to recently go out and purchase a big-screen TV so they'd have it in time to see this year's Super Bowl? (Check All That Apply) No, I Do Not Know Anyone Who Recently Purchased a Big-Screen TV So They'd Have it in Time for the Super Bowl 89%
Yes, I Myself Recently Purchased a Big-Screen TV So I'd Have it in Time for the Super Bowl 0%
Yes, I Know Someone Else Who Purchased a Big-Screen TV So They'd Have it in Time for the Super Bowl 9%
Yes, I Know Several People Who Purchased a Big-Screen TV So They'd Have it in Time for the Super Bowl 1%
(8) The 2004 Summer Olympics will begin this August. Do you personally know anyone who has said they're going to purchase a big-screen TV so they'll have it in time to see the Summer Olympics? (Check All That Apply)
No, I Do Not Know Anyone Who is Going to Purchase a Big-Screen TV So They Have it in Time for the Summer Olympics 94%
Yes, I Myself Will Be Purchasing a Big-Screen TV So I Have it in Time for the Summer Olympics 1%
Yes, I Know Someone Who Will Be Purchasing a Big-Screen TV So They Have it in Time for the Summer Olympics 3%
Yes, I Know Several People Who Will Be Purchasing a Big-Screen TV So They Have it in Time for the Summer Olympics 0%
Copyright © 2004 ChangeWave Research All rights reserved.
17
ChangeWave Research: Television and Home Entertainment Benchmark Survey
D. Home Entertainment Services and Devices
Services
(1) Question Asked: Which of the following services do you currently use in your home? (Check All That Apply) Regular Over-the-Air Broadcasting (TV Antenna) 27%Satellite Television 27%HD Television 6%Voom HD Television 0%Regular Cable Television 45%Digital Cable Television 28%Video-on-Demand 8%Pay-per-view 22%Cable Internet Service 45%DSL Internet Service 27%Satellite Internet Service 2%Digital Video Recorder Service (DVR) Through Cable Provider 3%TiVo/Replay TV/Other TiVo-like Digital Video Service 9%Satellite Radio Service (For Home or Car) 4%Music Download Service (i.e., iTunes, Rhapsody) 9%Photo Download Service (i.e., Ofoto, Snapfish) 8%Other 2%
(2) Question Asked: Which of the following services do you plan on adding in the next 12 months? (Check All That Apply)
Regular Over-the-Air Broadcasting (TV Antenna) 1%Satellite Television 6%HD Television 14%Voom HD Television 0%Regular Cable Television 1%Digital Cable Television 7%Video-on-Demand 2%Pay-per-view 1%Cable Internet Service 5%DSL Internet Service 7%Satellite Internet Service 3%Digital Video Recorder Service (DVR) Through CableProvider
5%
TiVo/Replay TV/Other TiVo-like Digital Video Service 9%Satellite Radio Service (For Home or Car) 8%Music Download Service (i.e., iTunes, Rhapsody) 3%
Copyright © 2004 ChangeWave Research All rights reserved.
18
ChangeWave Research: Television and Home Entertainment Benchmark Survey
Photo Download Service (i.e., Ofoto, Snapfish) 1%Other 2%A Comparison of Current Services vs. Planning to Add Services in the Next 12 Months
CurrentServices
Planning toAdd
Servicesin Next
12 MonthsHD Television 6% 14%TiVo/Replay TV/Other TiVo-like Digital Video Service 9% 9%Satellite Radio Service (For Home or Car) 4% 8%Digital Cable Television 28% 7%DSL Internet Service 27% 7%Satellite Television 27% 6%Cable Internet Service 45% 5%Digital Video Recorder Service (DVR) Through Cable Provider 3% 5%Music Download Service (i.e., iTunes, Rhapsody) 9% 3%Satellite Internet Service 2% 3%Video-on-Demand 8% 2%Regular Cable Television 45% 1%Regular Over-the-Air Broadcasting (TV Antenna) 27% 1%Pay-per-view 22% 1%Photo Download Service (i.e., Ofoto, Snapfish) 8% 1%Voom HD Television 0% 0%
We compared the home entertainment services currently used by respondents versus those they plan on adding in the next 12 months, and identified the services with the best and worst outlook:
Home Entertainment Services on the Rise. HD Television is the biggest overall winner among home entertainment services for the coming year. Other services with a solid outlook are TiVo/Replay TV, Satellite Radio and Digital Video Recorders.
Several Services Have Reached Saturation. The services that have clearly reached full saturation are Regular Cable Television, Regular Over-the-Air-Broadcasting and Pay-per-view. In addition, Cable Internet Service shows only a little room for growth.
Copyright © 2004 ChangeWave Research All rights reserved.
19
ChangeWave Research: Television and Home Entertainment Benchmark Survey
Devices
(3) Question Asked: Which of the following devices do you currently have in your home? (Check All That Apply) Cable TV Set Top Box (I lease it) 27%High-end Home Theater/Home Audio-Video System 26%Satellite TV Receiver (I own it) 24%Dedicated Entertainment Media Center Located in the Entertainment Area
10%
Cable TV Set Top Box (I own it) 8%Satellite TV Receiver (I lease it) 4%Satellite Radio Receiver (For your home or your car) 4%Audio/Digital Jukebox with 20GB Hard Drive or Larger 4%Microsoft Media Center Software 4%HD Decoder 3%Cable TV Set Top Box with DVR (I own it) 1%Cable TV Set Top Box with DVR (I lease it) 1%Wireless DVD-R That Can Send Content to Other TVs 0%Other 2%*Note that the results for the category “Regular DVD-R” are not included. The wording created confusion among respondents as to whether we were asking about “Regular DVD Players” or “DVD-Rs.”
(4) Question Asked: Which of the following devices do you plan on adding in the next 12 months? (Check All That Apply) High-end Home Theater/Home Audio-Video System 8%HD Decoder 7%Satellite Radio Receiver (For your home or your car) 6%Satellite TV Receiver (I own it) 4%Wireless DVD-R That Can Send Content to Other TVs 4%Dedicated Entertainment Media Center Located in the Entertainment Area
4%
Cable TV Set Top Box with DVR (I lease it) 3%Audio/Digital Jukebox with 20GB Hard Drive or Larger 3%Satellite TV Receiver (I lease it) 2%Microsoft Media Center Software 2%Cable TV Set Top Box (I own it) 1%Cable TV Set Top Box (I lease it) 1%Cable TV Set Top Box with DVR (I own it) 1%Other 3%*Note that the results for the category “Regular DVD-R” are not included. The wording created confusion among respondents as to whether we were asking about “Regular DVD Players” or “DVD-Rs.”
Copyright © 2004 ChangeWave Research All rights reserved.
20
ChangeWave Research: Television and Home Entertainment Benchmark Survey
A Comparison of Current Devices vs. Planning to Add Devices in the Next 12 Months
CurrentDevices
Planning toAdd Devices
in Next12 Months
High-end Home Theater/Home Audio-Video System 26% 8%HD Decoder 3% 7%Satellite Radio Receiver (For your home or your car) 4% 6%Satellite TV Receiver (I own it) 24% 4%Wireless DVD-R That Can Send Content to Other TVs 0% 4%Dedicated Entertainment Media Center Located in the Entertainment Area
10% 4%
Cable TV Set Top Box with DVR (I lease it) 1% 3%Audio/Digital Jukebox with 20GB Hard Drive or Larger 4% 3%Satellite TV Receiver (I lease it) 4% 2%Microsoft Media Center Software 4% 2%Cable TV Set Top Box (I own it) 8% 1%Cable TV Set Top Box (I lease it) 27% 1%Cable TV Set Top Box with DVR (I own it) 1% 1%
We compared the home entertainment devices currently used by respondents versus those they plan to add in the next 12 months, and identified the devices with the best and worst outlook:
Home Entertainment Devices on the Upswing . High-end Theater/Home Audio-Video Systems are the biggest overall winner among home entertainment devices for the coming year. Other devices with a good upside are HD Decoders, Satellite Radio Receivers and Cable TV Set Top Boxes with DVR.
Cable Boxes Minus DVR are Old News. The one device that has clearly reached almost total saturation is the Cable TV Set Top Box – without DVR.
(5) Question Asked: If offered in your service area, would you consider using your cable company as a supplier of a Digital Video Recorder (DVR) service with TiVo-like capability? Yes 34%No 40%Don't Know 24%No Answer 2%
Copyright © 2004 ChangeWave Research All rights reserved.
21

ChangeWave Research: Television and Home Entertainment Benchmark Survey
(6) Question Asked: What price would a Cable/DVR set top box have to hit for you to buy it rather than lease it by the month from your cable company? $750-$1,000
1%
$500-$749 4%$300-$499 14%$199-$299 37%<$199 40%
(7) Question Asked: Finally, if the cable set top box evolved to include a number of features which cost extra money, what would your preferred choice be? Pay extra per month for services (TiVo type services, music download, video on demand services) but pay once and buy hardware from a retailer/online store 32%
Pay extra per month for services (e.g., TiVo type services, music download, video on demand services) but pay once and buy hardware from my cable/satellite company
11%
Pay extra per month to my cable/satellite company for services and per month for hardware 11%
Don't Know / No Answer 47%Other 3%
Copyright © 2004 ChangeWave Research All rights reserved.
22
ChangeWave Research: Television and Home Entertainment Benchmark Survey
III. ChangeWave Research Methodology This report summarizes the findings of a February 9-13, 2004 survey of Alliance members on their television and home entertainment preferences, including current ownership and purchasing behavior, as well as plans for this year. A total of 761 members participated.
The Alliance’s proprietary research and business intelligence gathering system is based upon the systematic gathering of valuable business and investment information directly over the Internet from accredited members.
ChangeWave surveys its Alliance members on a range of business and investment research and intelligence topics, collects feedback from them electronically, interprets and reconciles the information in a cohesive manner and converts the information into valuable quantitative and qualitative reports. The Alliance has assembled its membership team from senior technology and business executives in leading companies of select industries. Nearly 3 out of every 5 members (58%) have advanced degrees (e.g., Master’s or Ph.D.) and 94% have at least a four-year bachelor’s degree.
The business and investment intelligence provided by the Alliance provides a real-time view of companies, technologies and business trends in key market sectors, along with an in-depth perspective of the macro economy – well in advance of other available sources.
Copyright © 2004 ChangeWave Research All rights reserved.
23
ChangeWave Research: Television and Home Entertainment Benchmark Survey
IV. About ChangeWave Research
ChangeWave Research, of Phillips Investment Resources, Inc. is a market research intelligence network powered by thousands of accredited and organized front-line professionals – the ChangeWave Alliance.
ChangeWave is the alternative to traditional “sell-side” investment research. The company publishes ChangeWave Investing, the investment advisory service for individual investors dedicated to researching and discovering growth stocks that profit from radical change, and Weekly WaveWire, a free e-mail newsletter distributed to nearly 200,000 investors.
ChangeWave has a very unique asset in its 4,000-member Alliance. We have assembled our membership team from a broad cross section of more than 20 vertical markets such as Internet e-commerce, semiconductors, data storage, and biotechnology, along with a wide range of professional disciplines including CIOs, IT managers, executive management, scientists, engineers and sales personnel.
The ChangeWave Alliance is composed of senior technology and business executives in leading companies – credentialed professionals who spend their everyday lives working on the frontline of technological change.
ChangeWave Research Reports provide a real-time view of companies, technologies and business trends in key market sectors along with an in-depth perspective of the macro economy – well in advance of other available sources. ChangeWave surveys its 4,000 Alliance members on a wide range of investment research topics and converts the findings into valuable investment and business intelligence reports. ChangeWave delivers its products and services on the Web at www.ChangeWaveResearch.com
ChangeWave Research does not make any warranties, express or implied, as to results to be obtained from using the information in this report. Investors should obtain individual financial advice based on their own particular circumstances before making any investment decisions based upon information in this report.
For More Information:
ChangeWave Research Telephone: 301-279-42009420 Key West Avenue, 4th Floor Fax: 301-610-5206Rockville, MD 20850 www.ChangeWaveResearch.comUSA [email protected]
Helping You Profit From A Rapidly Changing World ™www.ChangeWaveResearch.com
Copyright © 2004 ChangeWave Research All rights reserved.
24


![Operating Instructions LED TV - Panasonic · LED TV 50-inch model 58-inch model 65-inch model 75-inch model. 2 English For information about the trademarks, refer to [eHELP] (Search](https://static.fdocuments.in/doc/165x107/5bb6b05509d3f20c668c808e/operating-instructions-led-tv-panasonic-led-tv-50-inch-model-58-inch-model.jpg)