Compliation of Legal Momentum Single Mother Reports
22
COMPILATION OF R ECENT LEGAL MOMENTUM SINGLE MOTHER R EPORTS Low Wage Rates and Low Income Very Common for Employed Single Mothers (July 2012) http://www.legalmomentum.org/our-work/women-and-poverty/resources-- publications/low-wage-rates-and-low-income.pdf . Single Motherhood in the United States – A Snapshot (2012) (March 2012), http://www.legalmomentum.org/our-work/women-and-poverty/resources-- publications/single-mothers-snapshot.pdf . Single Mother Poverty in the United States in 2010 (Sept. 2011), http://www.legalmomentum.org/our-work/women-and-poverty/resources-- publications/single-mother-poverty-2010.pdf Poverty Rates for Single Mothers Are Higher in the U.S. than in Other High-Income Countries (June 2011), http://www.legalmomentum.org/our-work/women-and-poverty/resources-- publications/single-mothers-poverty-higher-us.pdf Single Mother Poverty Rates Remain Exceptionally High Even When Food Stamps and Earned Income Credits Are Counted (June 2011) http://www.legalmomentum.org/our- work/women-and-poverty/resources--publications/single-mother-poverty-fs-eic.pdf Harmful House Food Stamp Proposal Poses an Especially Grave Threat to Single Mothers and Their Children (May 2011), http://www.legalmomentum.org/our- work/women-and-poverty/resources--publications/house-food-stamps.pdf . http://www.legalmomentum.org/our-work/women-and-poverty/resources-- publications/house-food-stamps.pdf Single Mothers Since 2000: Falling Farther Down (January 2011) http://www.legalmomentum.org/our-work/women-and-poverty/resources-- publications/single-mothers-since-2000.pdf . (July 2012)
-
Upload
legal-momentum -
Category
Documents
-
view
216 -
download
0
Transcript of Compliation of Legal Momentum Single Mother Reports

7/30/2019 Compliation of Legal Momentum Single Mother Reports
http://slidepdf.com/reader/full/compliation-of-legal-momentum-single-mother-reports 1/22
COMPILATION OF R ECENT LEGAL MOMENTUM SINGLE MOTHER R EPORTS
Low Wage Rates and Low Income Very Common for Employed Single Mothers (July 2012)http://www.legalmomentum.org/our-work/women-and-poverty/resources--
publications/low-wage-rates-and-low-income.pdf .
Single Motherhood in the United States – A Snapshot (2012) (March 2012),
http://www.legalmomentum.org/our-work/women-and-poverty/resources--
publications/single-mothers-snapshot.pdf .
Single Mother Poverty in the United States in 2010 (Sept. 2011),
http://www.legalmomentum.org/our-work/women-and-poverty/resources-- publications/single-mother-poverty-2010.pdf
Poverty Rates for Single Mothers Are Higher in the U.S. than in Other High-Income Countries
(June 2011), http://www.legalmomentum.org/our-work/women-and-poverty/resources-- publications/single-mothers-poverty-higher-us.pdf
Single Mother Poverty Rates Remain Exceptionally High Even When Food Stamps and Earned
Income Credits Are Counted (June 2011) http://www.legalmomentum.org/our-work/women-and-poverty/resources--publications/single-mother-poverty-fs-eic.pdf
Harmful House Food Stamp Proposal Poses an Especially Grave Threat to Single Mothers and Their Children (May 2011), http://www.legalmomentum.org/our-
work/women-and-poverty/resources--publications/house-food-stamps.pdf .
http://www.legalmomentum.org/our-work/women-and-poverty/resources-- publications/house-food-stamps.pdf
Single Mothers Since 2000: Falling Farther Down (January 2011)http://www.legalmomentum.org/our-work/women-and-poverty/resources--
publications/single-mothers-since-2000.pdf .
(July 2012)
7/30/2019 Compliation of Legal Momentum Single Mother Reports
http://slidepdf.com/reader/full/compliation-of-legal-momentum-single-mother-reports 2/22
395 Hudson Street New York, NY 10014 T 212.9
Legal Momentum is the nation’s oldest legal defense and educ
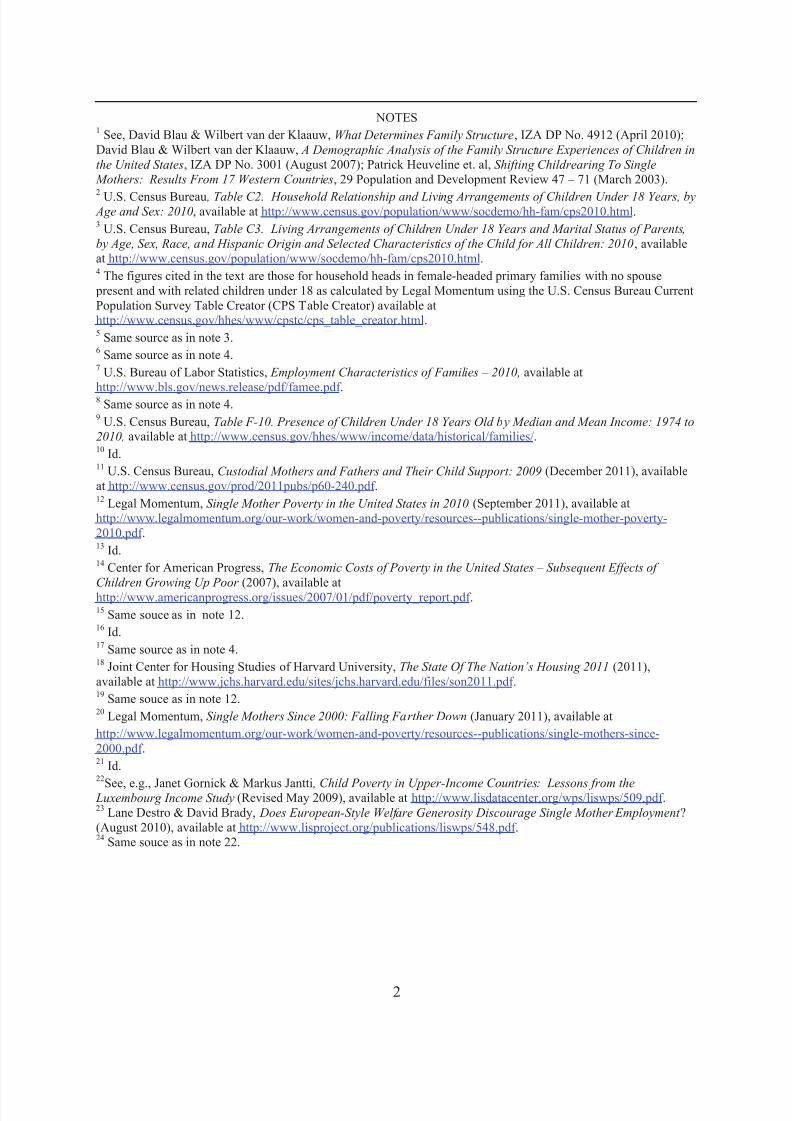
Low Wage Rates and
A recent study by econo
low income work in the United
“low-wage” as an hourly wage l
income” as a family income less
during these 30 years, 34% of e
a family with a low income. Th12.5% rate for all employed pers
fathers. In 2009, the last year co
low-wage work, and 36% of em
There were similar findi
federal government.3 This study
work in 1996 defined by the stu
(July 2012. Contact Timothy Ca
1 Albelda, Randy and Michael Carr.Boston, MA: University of Massachttp://scholarworks.umb.edu/cgi/vi2 Personal communication from Ra
3 Schochet, Peter and Anu Rangaraj Market Experiences: Evidence froInc. to Office of the Assistant Secre
Human Services. Available at http:
5.6635 F 212.226.1066 www.legalmomentum.org
tion fund dedicated to advancing the rights of all women and girls.
ow Income Very Common for Emplo
Mothers
ists at the University of Massachusetts examin
tates over the thirty year period 1979-2009.1 T
ss than two-thirds of the state median hourly w
than 200% of the official poverty level. The st
ployed single mothers were both working at a l
34% rate for employed single mothers was alons, and almost double the 18% rate for emplo
vered by this study, 39% of employed single m
loyed single mothers were both low-wage and
gs in an earlier study of low wage work commi
found that 44% of employed single mothers w
y as an hourly wage less than $7.50.
sey, [email protected], for further in
2012. Low-Wage and Low-Income Workers In thehusetts, Center for Social Policy, Working Paper 20wcontent.cgi?article=1059&context=csp_pubs.
dy Albelda.
an. 2004. Characteristics of Low-Wage Workers athe Mid-to Late 1990s. Submitted by Mathematica
tary for Planning and Evaluation, U.S. Department
//aspe.hhs.gov/hsp/low-wage-workers04/report.pdf .
ed Single
d low-wage and
is study defined
age, and “low
udy found that
ow-wage and in
ost triple theed single
thers were in
ow income.2
sioned by the
re in low-wage
formation.)
U.S., 1979-2009. 12-1. Available at
nd Their Labor Policy Research,f Health and

7/30/2019 Compliation of Legal Momentum Single Mother Reports
http://slidepdf.com/reader/full/compliation-of-legal-momentum-single-mother-reports 3/22
Single Motherhood in the United States – A Snapshot (2012)
Prevalence: Single motherhood is very common. Around half of today’s mothers will spend atleast some time as the sole custodial parent.1 At any one time, almost one quarter of mothers aresingle mothers.2
Characteristics: Around 45% of single mothers have never married, around 55% are divorced,separated or widowed.3 Half have one child, 30% have two.4 About two fifths are White, onethird Black, one quarter Hispanic.5 One quarter have a college degree, one sixth have notcompleted high school.6
Employment: At any one time, about two thirds of single mothers are also working outside thehome, a slightly greater share than the share of married mothers who are also working outsidethe home.7 However, only two fifths of single mothers are employed full-time the entire year,and a quarter are jobless the entire year.8
Income: Half of single mother families have an annual income less than $25,000.9 Medianincome for single mother families is only one third the median for married couple families.10 Only one third of single mothers receive any child support, and the average amount thesemothers receive is only about $300 a month.11
Poverty: Two fifths of single mother families are poor, triple the poverty rate for the rest of the population.12 The majority of poor children are in single mother families.13 Child poverty islinked to school dropout; to negative adult outcomes including joblessness and ill health; and toreduced economic output estimated to be about 4% of Gross Domestic Product.14
Hardship: Two fifths of single mother families are “food insecure,”15 one seventh use food pantries,16 one fifth have no health insurance,17 one third spend more than half their income onhousing.18 Three quarters of homeless families are single mother families.19
Welfare & Food Stamp Receipt: Although two fifths of all single mothers are poor, only onetenth of all single mothers receive cash welfare assistance.20 Two fifths of all single mothersreceive Food Stamps.21
Compared to Single Mothers in Peer Countries: The single mother poverty rate in the U.S. isfar above the average in high income countries22 even though the single mother employment ratein the U.S. is also above the average.23 Less generous income support programs in the U.S. helpexplain the exceptionally high poverty rate for single mother families in the U.S.24
(March 2012). (For further information, contact Timothy Casey, [email protected])
This report supported in part by a grant from the Open Society Foundations.
7/30/2019 Compliation of Legal Momentum Single Mother Reports
http://slidepdf.com/reader/full/compliation-of-legal-momentum-single-mother-reports 4/222
NOTES
1 See, David Blau & Wilbert van der Klaauw, What Determines Family Structure, IZA DP No. 4912 (April 2010);David Blau & Wilbert van der Klaauw, A Demographic Analysis of the Family Structure Experiences of Children in
the United States, IZA DP No. 3001 (August 2007); Patrick Heuveline et. al, Shifting Childrearing To Single Mothers: Results From 17 Western Countries, 29 Population and Development Review 47 – 71 (March 2003).
2 U.S. Census Bureau , Table C2. Household Relationship and Living Arrangements of Children Under 18 Years, by Age and Sex: 2010, available at http://www.census.gov/population/www/socdemo/hh-fam/cps2010.html.3 U.S. Census Bureau, Table C3. Living Arrangements of Children Under 18 Years and Marital Status of Parents,
by Age, Sex, Race, and Hispanic Origin and Selected Characteristics of the Child for All Children: 2010, availableat http://www.census.gov/population/www/socdemo/hh-fam/cps2010.html.4 The figures cited in the text are those for household heads in female-headed primary families with no spouse present and with related children under 18 as calculated by Legal Momentum using the U.S. Census Bureau CurrentPopulation Survey Table Creator (CPS Table Creator) available athttp://www.census.gov/hhes/www/cpstc/cps_table_creator.html.5 Same source as in note 3.6 Same source as in note 4.7 U.S. Bureau of Labor Statistics, Employment Characteristics of Families – 2010, available at
http://www.bls.gov/news.release/pdf/famee.pdf .8 Same source as in note 4.9 U.S. Census Bureau, Table F-10. Presence of Children Under 18 Years Old by Median and Mean Income: 1974 to2010, available at http://www.census.gov/hhes/www/income/data/historical/families/.10 Id.11 U.S. Census Bureau, Custodial Mothers and Fathers and Their Child Support: 2009 (December 2011), availableat http://www.census.gov/prod/2011pubs/p60-240.pdf .12 Legal Momentum, Single Mother Poverty in the United States in 2010 (September 2011), available athttp://www.legalmomentum.org/our-work/women-and-poverty/resources--publications/single-mother-poverty-2010.pdf .13 Id.14 Center for American Progress, The Economic Costs of Poverty in the United States – Subsequent Effects of
Children Growing Up Poor (2007), available athttp://www.americanprogress.org/issues/2007/01/pdf/poverty_report.pdf .15 Same souce as in note 12.16 Id.17 Same source as in note 4.18 Joint Center for Housing Studies of Harvard University, The State Of The Nation’s Housing 2011 (2011),available at http://www.jchs.harvard.edu/sites/jchs.harvard.edu/files/son2011.pdf .19 Same souce as in note 12.20 Legal Momentum, Single Mothers Since 2000: Falling Farther Down (January 2011), available at
http://www.legalmomentum.org/our-work/women-and-poverty/resources--publications/single-mothers-since-2000.pdf .21 Id.22
See, e.g., Janet Gornick & Markus Jantti , Child Poverty in Upper-Income Countries: Lessons from the Luxembourg Income Study (Revised May 2009), available at http://www.lisdatacenter.org/wps/liswps/509.pdf .23 Lane Destro & David Brady, Does European-Style Welfare Generosity Discourage Single Mother Employment ?(August 2010), available at http://www.lisproject.org/publications/liswps/548.pdf .24 Same souce as in note 22.
7/30/2019 Compliation of Legal Momentum Single Mother Reports
http://slidepdf.com/reader/full/compliation-of-legal-momentum-single-mother-reports 5/22
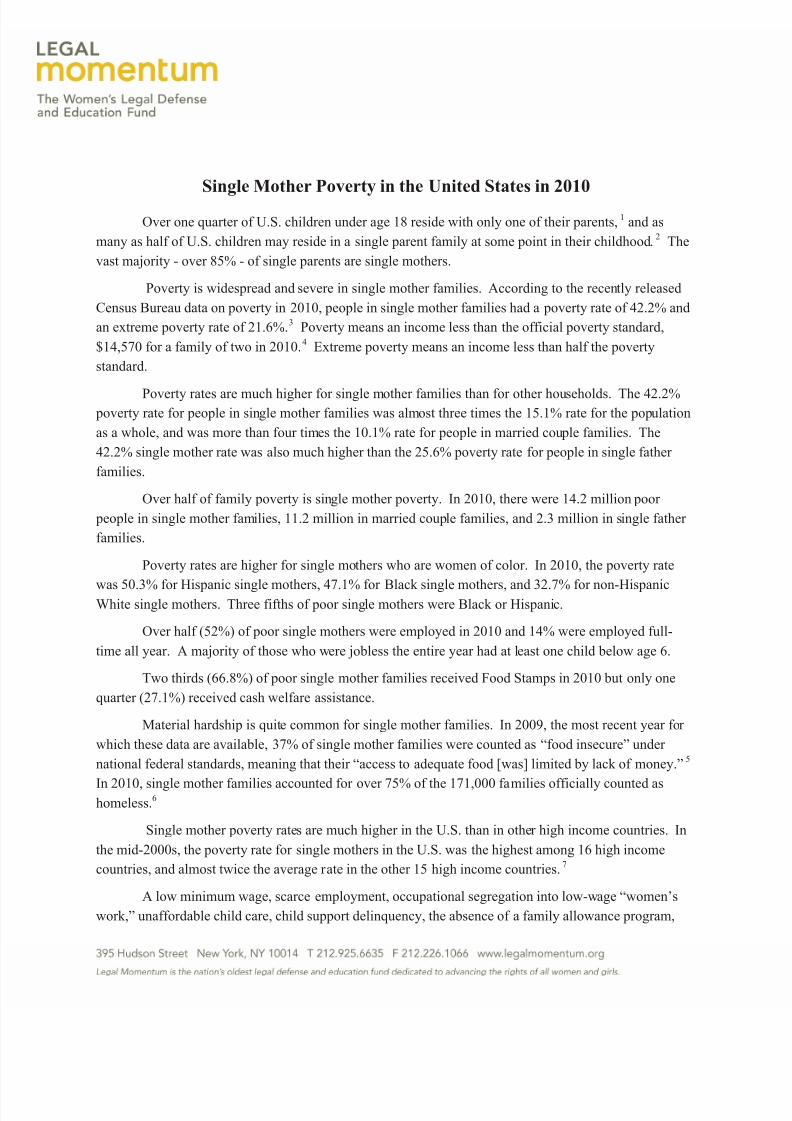
Single Mother Poverty in the United States in 2010
Over one quarter of U.S. children under age 18 reside with only one of their parents,1 and as
many as half of U.S. children may reside in a single parent family at some point in their childhood.2 The
vast majority - over 85% - of single parents are single mothers.
Poverty is widespread and severe in single mother families. According to the recently released
Census Bureau data on poverty in 2010, people in single mother families had a poverty rate of 42.2% and
an extreme poverty rate of 21.6%.3 Poverty means an income less than the official poverty standard,
$14,570 for a family of two in 2010.4 Extreme poverty means an income less than half the poverty
standard.
Poverty rates are much higher for single mother families than for other households. The 42.2% poverty rate for people in single mother families was almost three times the 15.1% rate for the population
as a whole, and was more than four times the 10.1% rate for people in married couple families. The
42.2% single mother rate was also much higher than the 25.6% poverty rate for people in single father
families.
Over half of family poverty is single mother poverty. In 2010, there were 14.2 million poor
people in single mother families, 11.2 million in married couple families, and 2.3 million in single father
families.
Poverty rates are higher for single mothers who are women of color. In 2010, the poverty rate
was 50.3% for Hispanic single mothers, 47.1% for Black single mothers, and 32.7% for non-HispanicWhite single mothers. Three fifths of poor single mothers were Black or Hispanic.
Over half (52%) of poor single mothers were employed in 2010 and 14% were employed full-
time all year. A majority of those who were jobless the entire year had at least one child below age 6.
Two thirds (66.8%) of poor single mother families received Food Stamps in 2010 but only one
quarter (27.1%) received cash welfare assistance.
Material hardship is quite common for single mother families. In 2009, the most recent year for
which these data are available, 37% of single mother families were counted as “food insecure” under
national federal standards, meaning that their “access to adequate food [was] limited by lack of money.”5
In 2010, single mother families accounted for over 75% of the 171,000 families officially counted ashomeless.6
Single mother poverty rates are much higher in the U.S. than in other high income countries. In
the mid-2000s, the poverty rate for single mothers in the U.S. was the highest among 16 high income
countries, and almost twice the average rate in the other 15 high income countries.7
A low minimum wage, scarce employment, occupational segregation into low-wage “women’s
work,” unaffordable child care, child support delinquency, the absence of a family allowance program,

7/30/2019 Compliation of Legal Momentum Single Mother Reports
http://slidepdf.com/reader/full/compliation-of-legal-momentum-single-mother-reports 6/222
and a weak unemployment insurance system all contribute to the exceptionally high U.S. single mother
poverty rate. Another important factor is our restrictive and stingy welfare program.8 Since the 1996
enactment of federal “welfare reform” legislation, welfare program enrollment has plummeted among
poor families.9 Likewise, welfare benefit amounts are far below the average in other high income
countries, and in virtually every state have fallen to less than 50% of the poverty standard.10
(September 15, 2011. For further information contact Timothy Casey, [email protected].)
This report supported in part by a grant from the Open Society Foundations.
ENDNOTES
1U.S. Census Bureau , “Table C2. Household Relationship and Living Arrangements of Children Under
18 Years, by Age and Sex 2010,” available at http://www.census.gov/population/www/socdemo/hh-fam/cps2010.html.
2 See, Slade, Alexander & Andrea Beller, The Importance Of Duration Of Family Structure In The Production of Health by Gender (2011), available athttp://paa2011.princeton.edu/download.aspx?submissionId=111092; Antecol, Heather & Kelly Bernard, Does Single Parenthood Increase The Probability Of Teenage Promiscuity, Substance Use, And Crime?,20 Journal of Population Economics 55-71 (2007); Graefe, D.R. and D.T. Lichter, Life CourseTransitions of American Children: Parental Cohabitation, Marriage, and Single Motherhood , 36Demography 205–17 (1999); Moffitt, R.A. and M.S. Rendall, Cohort Trends in the Lifetime Distribution
of Female Family Headship in the United States, 1968–1985, 32 Demography 32:407–24 (1995).3 Except as otherwise indicated, the poverty figures cited in this report are taken from the detailed CensusBureau poverty data for 2010 available athttp://www.census.gov/hhes/www/cpstables/032011/pov/toc.htm.4
Higher amounts apply to larger family sizes.5 The rate cited in the text is the food insecurity rate for households with children under 18 years with afemale head with no spouse present as reported by USDA in the annual publication “Household FoodSecurity in the United States 2009,” available athttp://www.ers.usda.gov/Publications/ERR108/ERR108.pdf .6 U.S. Department of Housing and Urban Development, The 2010 Annual Homeless Assessment Report toCongress (2010), available at http://www.hudhre.info/documents/2010HomelessAssessmentReport.pdf .7 Legal Momentum, Poverty Rates for Single Mothers Are Higher in the U.S. than in Other High-IncomeCountries (2011), available at http://www.legalmomentum.org/our-work/women-and-poverty/resources-- publications/single-mothers-poverty-higher-us.pdf .8 See Legal Momentum, Welfare Reform at Age 15: A Vanishing Safety Net for Women and Children
(2011), available at http://www.legalmomentum.org/our-work/women-and-poverty/resources-- publications/welfare-reform-15.pdf .9 Legal Momentum, Single Mothers Since 2000: Falling Farther Down (2011), available athttp://www.legalmomentum.org/our-work/women-and-poverty/resources--publications/single-mothers-
since-2000.pdf .10 Legal Momentum, Welfare Benefits and Child Poverty: A Cross-Country Comparison (2009), availableat http://www.legalmomentum.org/assets/pdfs/welfare-benefits-and-child.pdf .

7/30/2019 Compliation of Legal Momentum Single Mother Reports
http://slidepdf.com/reader/full/compliation-of-legal-momentum-single-mother-reports 7/22
POVERTY RATES FOR SINGLE MOTHERS ARE HIGHER IN THE U.S THAN IN
OTHER HIGH INCOME COUNTRIES
Legal Momentum’s recent report Single Mothers Since 2000: Falling Farther Down1
detailed high and rising poverty rates for single mothers in the United States between 2000 and2010. Comparing the U.S. rates to poverty rates for single mothers in other high incomecountries shows that poverty rates for single mothers are exceptionally high in the U.S.
Table OnePOVERTY RATES FOR CHILDREN IN SINGLE MOTHER FAMILIES IN THE U.S. AND 15 OTHER HIGH INCOME
COUNTRIES IN THE MID-2000'S
DENMARK 8%SWEDEN 10%
FINLAND 11%
NORWAY 14%
AUSTRIA 18%
SWITZERLAND 18%
HOLLAND 22%
LUXEMBOURG 29%
SPAIN 30%
ITALY 30%
UNITED KINGDOM 32%
AUSTRALIA 35%
IRELAND 39%GERMANY 42%
CANADA 48%
15 COUNTRY AVERAGE 26%
UNITED STATES 49%
Ratio of U.S. rate to averagerate in other 15 countries 1.88
Table One lists the poverty rates for children in single mother families reported by the
Luxembourg Income Study (LIS)2
for the U.S. and for 15 other high income countries. The ratesare for 2004 except for Australia (2003) and Sweden (2005). The 49% U.S. rate was the highestrate and almost twice the 26% average rate in the other 15 high income countries.
The LIS poverty rates are based on a poverty standard that defines poverty as an incomeless than 50% of median income adjusted for household size. Using the official U.S. povertystandard, the poverty rate was 42% in 2004 for children in single mother families.3
7/30/2019 Compliation of Legal Momentum Single Mother Reports
http://slidepdf.com/reader/full/compliation-of-legal-momentum-single-mother-reports 8/222
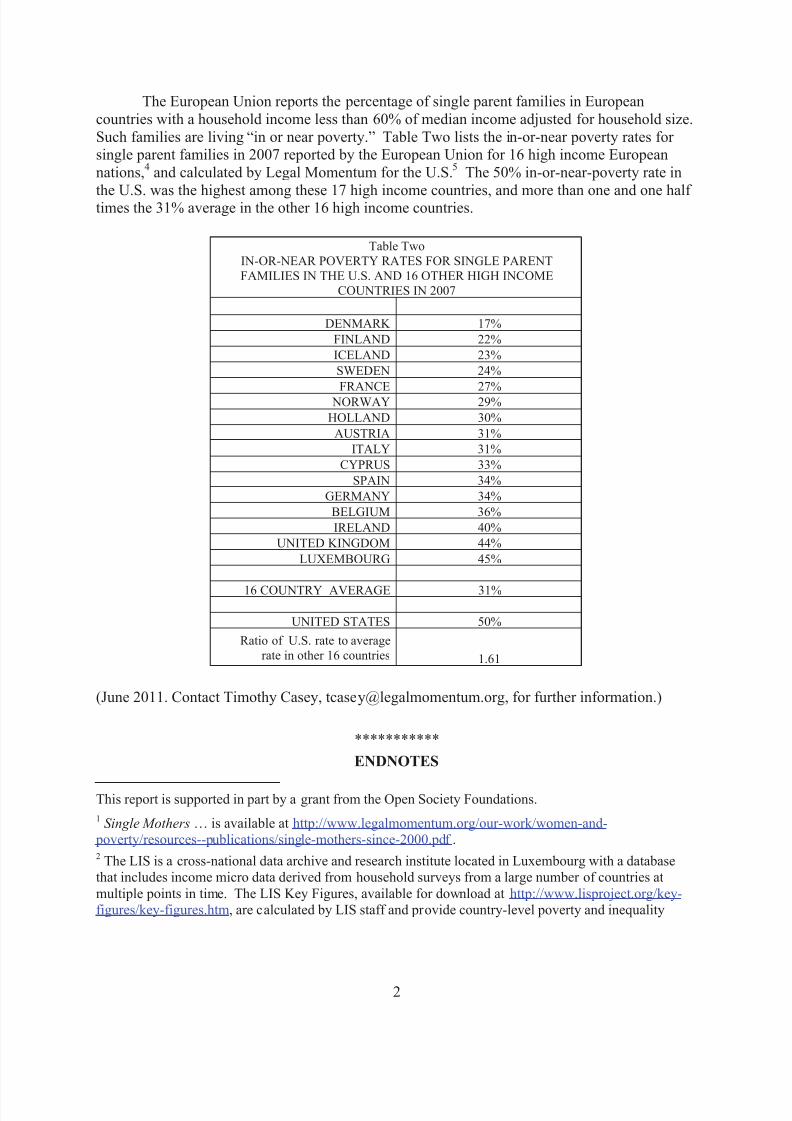
The European Union reports the percentage of single parent families in Europeancountries with a household income less than 60% of median income adjusted for household size.Such families are living “in or near poverty.” Table Two lists the in-or-near poverty rates for single parent families in 2007 reported by the European Union for 16 high income Europeannations,4 and calculated by Legal Momentum for the U.S.5 The 50% in-or-near-poverty rate in
the U.S. was the highest among these 17 high income countries, and more than one and one half times the 31% average in the other 16 high income countries.
Table TwoIN-OR-NEAR POVERTY RATES FOR SINGLE PARENTFAMILIES IN THE U.S. AND 16 OTHER HIGH INCOME
COUNTRIES IN 2007
DENMARK 17%
FINLAND 22%
ICELAND 23%
SWEDEN 24%
FRANCE 27% NORWAY 29%
HOLLAND 30%
AUSTRIA 31%
ITALY 31%
CYPRUS 33%
SPAIN 34%
GERMANY 34%
BELGIUM 36%
IRELAND 40%
UNITED KINGDOM 44%
LUXEMBOURG 45%
16 COUNTRY AVERAGE 31%
UNITED STATES 50%
Ratio of U.S. rate to averagerate in other 16 countries 1.61
(June 2011. Contact Timothy Casey, [email protected], for further information.)
***********
ENDNOTES
This report is supported in part by a grant from the Open Society Foundations.
1 Single Mothers … is available at http://www.legalmomentum.org/our-work/women-and- poverty/resources--publications/single-mothers-since-2000.pdf .2 The LIS is a cross-national data archive and research institute located in Luxembourg with a databasethat includes income micro data derived from household surveys from a large number of countries atmultiple points in time. The LIS Key Figures, available for download at http://www.lisproject.org/key-figures/key-figures.htm, are calculated by LIS staff and provide country-level poverty and inequality
7/30/2019 Compliation of Legal Momentum Single Mother Reports
http://slidepdf.com/reader/full/compliation-of-legal-momentum-single-mother-reports 9/223
indicators. Legal Momentum downloaded the rates on May 17, 2011 and rounded each rate to the nearer full percentage point.3 U.S. Census Bureau, Table “POV03: People in Families with Related Children Under 18 by FamilyStructure, Age, and Sex, Iterated by Income-to-Poverty Ratio and Race: 2004 Below 100% of PovertyAll Races,” available at http://pubdb3.census.gov/macro/032005/pov/new03_100_01.htm.4 European Union, Combating Poverty and Social Exclusion A Statistical Portrait of the European Union2010 at Table 3-2 (2010), available at http://epp.eurostat.ec.europa.eu/cache/ITY_OFFPUB/KS-EP-09-001/EN/KS-EP-09-001-EN.PDF. The European Union refers to these rates as the “at-risk-of-poverty”rates. In the European Union, about seven out of every eight single parents are single mothers. SeeEurostat News Release, Women and Men in the EU Seen Through Figures (March 4, 2011), available athttp://epp.eurostat.ec.europa.eu/cache/ITY_PUBLIC/1-04032011-AP/EN/1-04032011-AP-EN.PDF.5 Legal Momentum calculated the in-or-near-poverty rate for persons in the U.S. in primary single parentfamilies with children below age 18 using the U.S. Census Bureau CPS Table Creator II, available athttp://www.census.gov/hhes/www/cpstc/apm/cpstc_altpov.html. In the U.S., about four out of every fivesingle parents are single mothers.
7/30/2019 Compliation of Legal Momentum Single Mother Reports
http://slidepdf.com/reader/full/compliation-of-legal-momentum-single-mother-reports 10/22
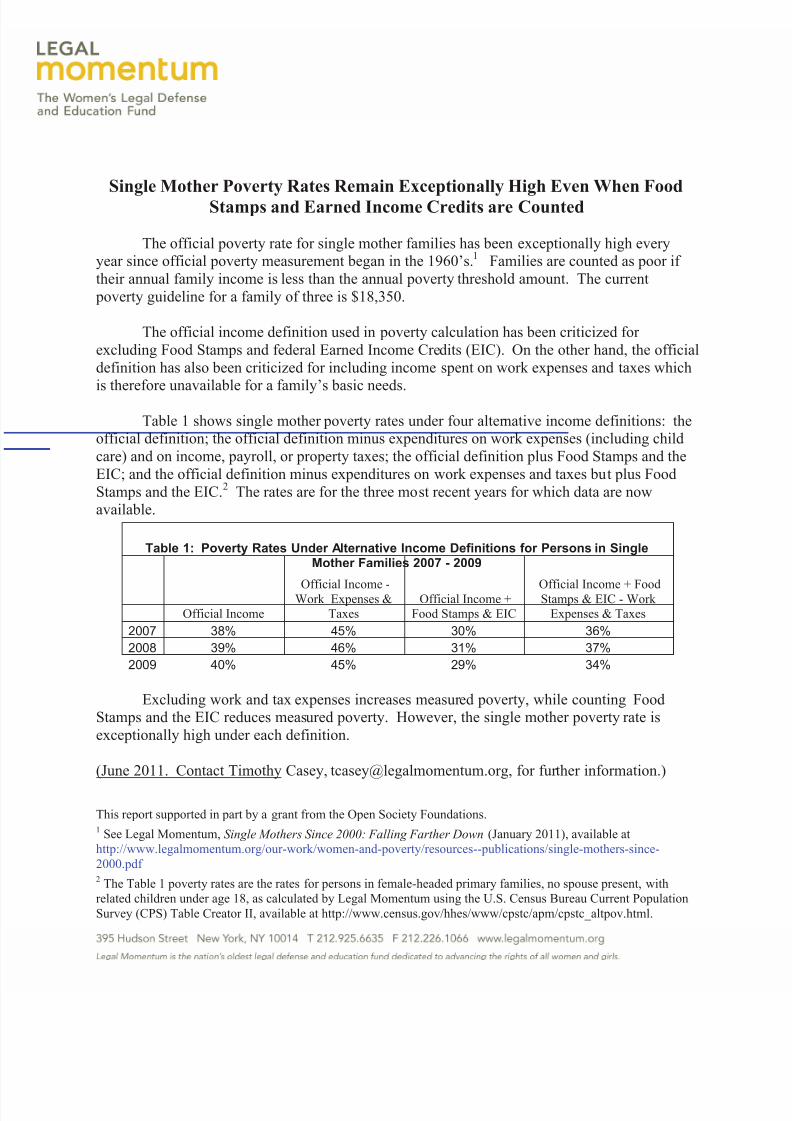
Single Mother Poverty Rates Remain Exceptionally High Even When Food
Stamps and Earned Income Credits are Counted
The official poverty rate for single mother families has been exceptionally high everyyear since official poverty measurement began in the 1960’s.1 Families are counted as poor if their annual family income is less than the annual poverty threshold amount. The current poverty guideline for a family of three is $18,350.
The official income definition used in poverty calculation has been criticized for excluding Food Stamps and federal Earned Income Credits (EIC). On the other hand, the officialdefinition has also been criticized for including income spent on work expenses and taxes which
is therefore unavailable for a family’s basic needs.
Table 1 shows single mother poverty rates under four alternative income definitions: theofficial definition; the official definition minus expenditures on work expenses (including childcare) and on income, payroll, or property taxes; the official definition plus Food Stamps and theEIC; and the official definition minus expenditures on work expenses and taxes but plus FoodStamps and the EIC.2 The rates are for the three most recent years for which data are nowavailable.
Table 1: Poverty Rates Under Alternative Income Definitions for Persons in SingleMother Families 2007 - 2009
Official Income
Official Income -Work Expenses &Taxes
Official Income +Food Stamps & EIC
Official Income + FoodStamps & EIC - Work Expenses & Taxes
2007 38% 45% 30% 36%
2008 39% 46% 31% 37%
2009 40% 45% 29% 34%
Excluding work and tax expenses increases measured poverty, while counting FoodStamps and the EIC reduces measured poverty. However, the single mother poverty rate isexceptionally high under each definition.
(June 2011. Contact Timothy Casey, [email protected], for further information.)
This report supported in part by a grant from the Open Society Foundations.1 See Legal Momentum, Single Mothers Since 2000: Falling Farther Down (January 2011), available athttp://www.legalmomentum.org/our-work/women-and-poverty/resources--publications/single-mothers-since-2000.pdf 2 The Table 1 poverty rates are the rates for persons in female-headed primary families, no spouse present, withrelated children under age 18, as calculated by Legal Momentum using the U.S. Census Bureau Current PopulationSurvey (CPS) Table Creator II, available at http://www.census.gov/hhes/www/cpstc/apm/cpstc_altpov.html.
7/30/2019 Compliation of Legal Momentum Single Mother Reports
http://slidepdf.com/reader/full/compliation-of-legal-momentum-single-mother-reports 11/22
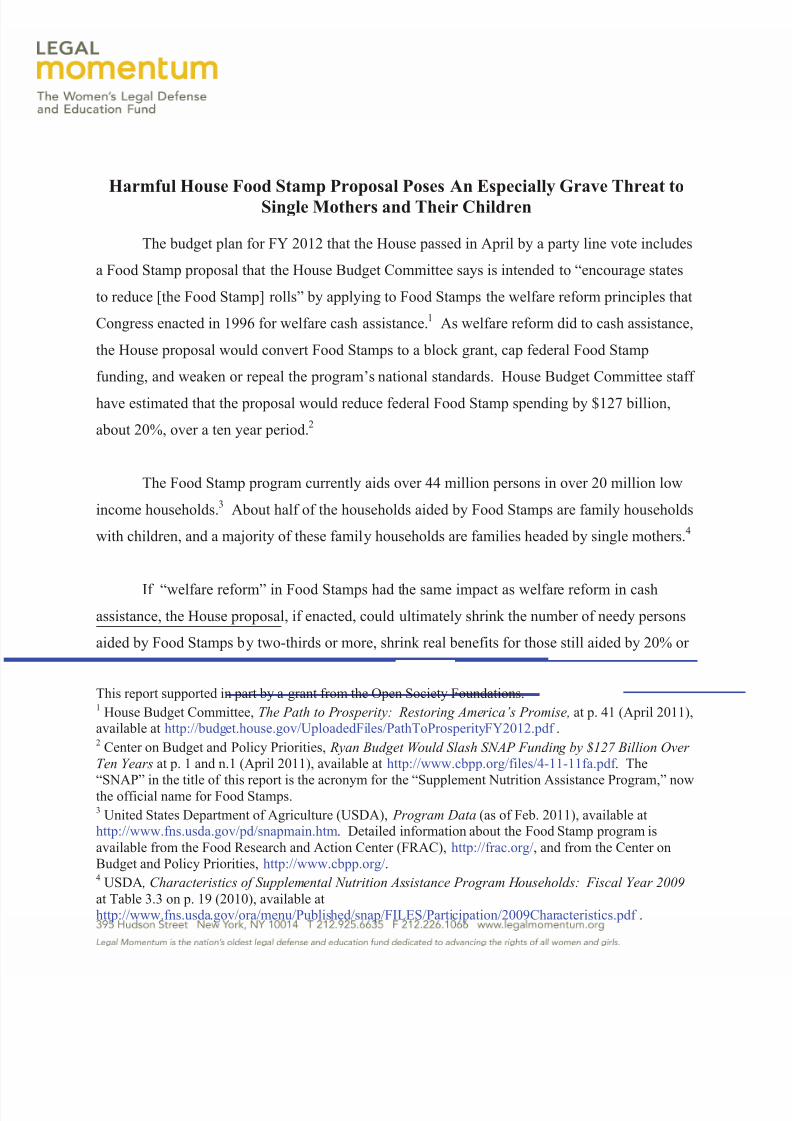
Harmful House Food Stamp Proposal Poses An Especially Grave Threat to
Single Mothers and Their Children
The budget plan for FY 2012 that the House passed in April by a party line vote includes
a Food Stamp proposal that the House Budget Committee says is intended to “encourage states
to reduce [the Food Stamp] rolls” by applying to Food Stamps the welfare reform principles that
Congress enacted in 1996 for welfare cash assistance.1 As welfare reform did to cash assistance,
the House proposal would convert Food Stamps to a block grant, cap federal Food Stamp
funding, and weaken or repeal the program’s national standards. House Budget Committee staff
have estimated that the proposal would reduce federal Food Stamp spending by $127 billion,
about 20%, over a ten year period.2
The Food Stamp program currently aids over 44 million persons in over 20 million low
income households.3 About half of the households aided by Food Stamps are family households
with children, and a majority of these family households are families headed by single mothers.4
If “welfare reform” in Food Stamps had the same impact as welfare reform in cash
assistance, the House proposal, if enacted, could ultimately shrink the number of needy persons
aided by Food Stamps by two-thirds or more, shrink real benefits for those still aided by 20% or
This report supported in part by a grant from the Open Society Foundations.1 House Budget Committee, The Path to Prosperity: Restoring America’s Promise, at p. 41 (April 2011),available at http://budget.house.gov/UploadedFiles/PathToProsperityFY2012.pdf .2 Center on Budget and Policy Priorities, Ryan Budget Would Slash SNAP Funding by $127 Billion Over Ten Years at p. 1 and n.1 (April 2011), available at http://www.cbpp.org/files/4-11-11fa.pdf . The
“SNAP” in the title of this report is the acronym for the “Supplement Nutrition Assistance Program,” nowthe official name for Food Stamps.3 United States Department of Agriculture (USDA), Program Data (as of Feb. 2011), available athttp://www.fns.usda.gov/pd/snapmain.htm. Detailed information about the Food Stamp program isavailable from the Food Research and Action Center (FRAC), http://frac.org/, and from the Center onBudget and Policy Priorities, http://www.cbpp.org/.4 USDA , Characteristics of Supplemental Nutrition Assistance Program Households: Fiscal Year 2009
at Table 3.3 on p. 19 (2010), available athttp://www.fns.usda.gov/ora/menu/Published/snap/FILES/Participation/2009Characteristics.pdf .

7/30/2019 Compliation of Legal Momentum Single Mother Reports
http://slidepdf.com/reader/full/compliation-of-legal-momentum-single-mother-reports 12/222
more, and shrink the current 86% participation rate5 for eligible family households to 40% or
less.
Welfare reform in cash assistance reduced the number of families aided from 80% of
poor families in 1995 in the pre-reform Aid to Families with Dependent Children (AFDC)
program, to 27% of poor families in 2009 in the post-reform Temporary Assistance for Needy
Families (TANF) program that replaced AFDC.6 Welfare reform also reduced the participation
rate for eligible families from 84% in AFDC in 1995 to 40% in TANF in 2005, the most recent
year for which the federal TANF agency has reported this rate.7 Under TANF, benefits have
declined in real value in all but three states and by 20% or more in over 30 states.8 Benefits are
now below the poverty level in every state and less than five dollars a person a day in most
states. Though TANF benefits are, in theory, supposed to suffice for all basic needs except
health care, in a substantial majority of states the TANF benefit for a family with no income is
now less than the Food Stamp benefit for a family with no income.
Due to the contraction of cash assistance, the Food Stamp program now aids several
times as many needy families as TANF does. In an average month in FY 2009, Food Stamps
aided 7.5 million families with children while TANF aided only 1.8 million.
The House proposal poses an especially grave threat to single mother families for whom
the contraction of cash assistance has made Food Stamps increasingly indispensable. In 2009,
5 USDA, Trends in Supplemental Nutrition Assistance Program Participation Rates: 2001-2008 at TableA.2 on p. 22 (2010), available athttp://www.fns.usda.gov/ora/menu/Published/snap/FILES/Participation/Trends2001-2008.pdf . The 86%figure is the rate for 2008, the most recent available.
6 See Legal Momentum, Welfare Reform at Age 15: A Vanishing Safety Net for Women and Children(April 2011), available at http://www.legalmomentum.org/our-work/women-and-poverty/resources-- publications/welfare-reform-15.pdf 7Id.8 Center on Budget Policy and Priorities, TANF Benefits Are Low And Have Not Kept Pace With Inflation(2010), available at http://www.cbpp.org/files/10-14-10tanf.pdf ; see also, Legal Momentum, Meager And
Diminishing Welfare Benefits Perpetuate Widespread Material Hardship For Poor Women And Children(2009), available at http://www.legalmomentum.org/assets/pdfs/tanf-meager-benefits.pdf .
7/30/2019 Compliation of Legal Momentum Single Mother Reports
http://slidepdf.com/reader/full/compliation-of-legal-momentum-single-mother-reports 13/223
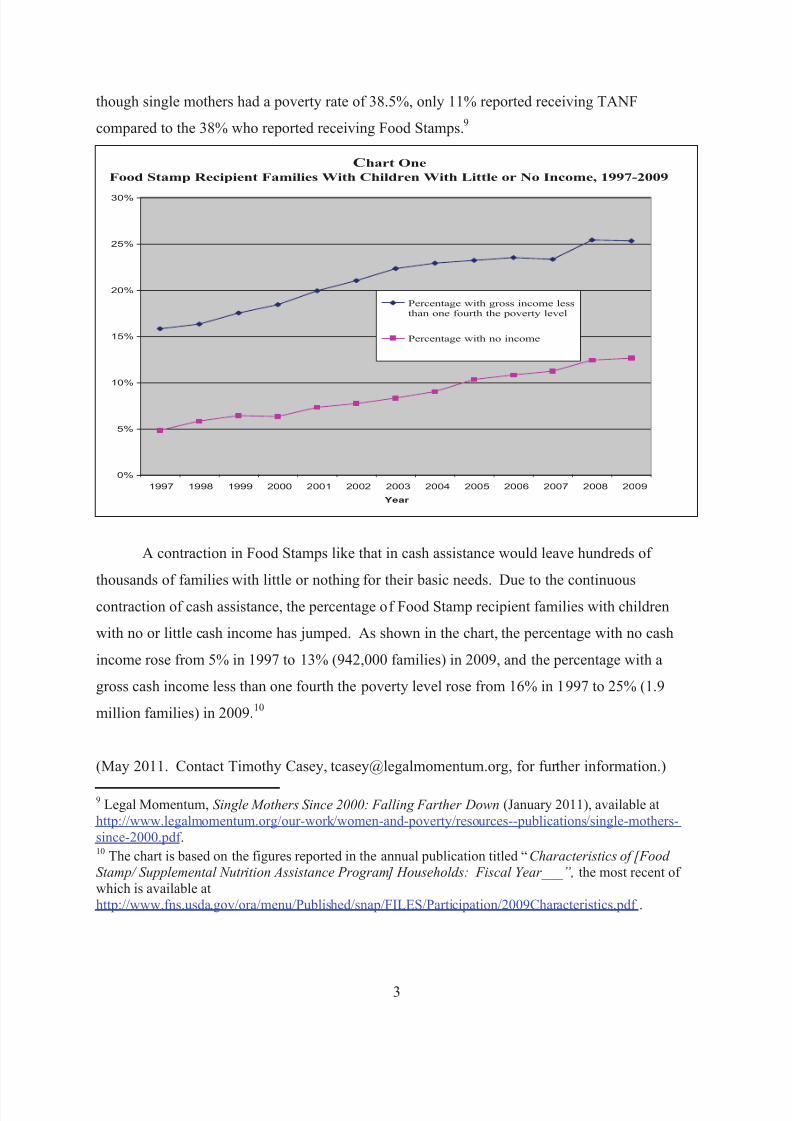
though single mothers had a poverty rate of 38.5%, only 11% reported receiving TANF
compared to the 38% who reported receiving Food Stamps.9
Chart One
Food Stamp Recipient Families With Children With Little or No Income, 1997-2009
0%
5%
10%
15%
20%
25%
30%
1997 1998 1999 2000 2001 2002 2003 2004 2005 2006 2007 2008 2009
Year
Percentage with gross income lessthan one fourth the poverty level
Percentage with no income
A contraction in Food Stamps like that in cash assistance would leave hundreds of
thousands of families with little or nothing for their basic needs. Due to the continuous
contraction of cash assistance, the percentage of Food Stamp recipient families with children
with no or little cash income has jumped. As shown in the chart, the percentage with no cash
income rose from 5% in 1997 to 13% (942,000 families) in 2009, and the percentage with a
gross cash income less than one fourth the poverty level rose from 16% in 1997 to 25% (1.9
million families) in 2009.10
(May 2011. Contact Timothy Casey, [email protected], for further information.)
9 Legal Momentum, Single Mothers Since 2000: Falling Farther Down (January 2011), available athttp://www.legalmomentum.org/our-work/women-and-poverty/resources--publications/single-mothers-since-2000.pdf .10 The chart is based on the figures reported in the annual publication titled “Characteristics of [Food Stamp/ Supplemental Nutrition Assistance Program] Households: Fiscal Year___”, the most recent of which is available athttp://www.fns.usda.gov/ora/menu/Published/snap/FILES/Participation/2009Characteristics.pdf .

7/30/2019 Compliation of Legal Momentum Single Mother Reports
http://slidepdf.com/reader/full/compliation-of-legal-momentum-single-mother-reports 14/22
SINGLE MOTHERS SINCE 2000: FALLING FARTHER DOWN1
For the one in four U.S. families who are single mother families, the ‘Great Recession’ of
2008-2009 exacerbated a period of losing ground that had started around 2000. From 2000 to
2009, joblessness increased for single mothers at the same time that “welfare reform” was
making welfare less accessible to single mother families in need. In 2009, over a quarter of
single mothers were jobless the entire year, a third were jobless in an average month, and less
than half were employed full-time year-round.
Increased joblessness and decreased access to welfare combined to increase poverty and
hardship. Between 2000 and 2009, the percentage of single mothers with an income less than the
poverty level rose from 33% to 38.5%, the percentage with an income less than half the poverty
level rose from 14% to 19%, the percentage counted as “food insecure” rose from 31% to 37%,
and the percentage turning to food pantries to feed their families rose from 8.6% to 13.7%. One
fifth of single mother families now live doubled up in someone else’s home. Family
homelessness has increased and the vast majority of homeless families are single mother
families.
EMPLOYMENT RATES HAVE FALLEN
The percentage of single mothers employed in an average month fell from 76% in 2000
to 73% in 2007, and to 68% in 2009.2
The percentage of single mothers employed full-time year-round fell from 51% in 2002
to 49% in 2007, and to 45% in 2009.3
1 This report supported in part by a grant from the Open Society Foundations.2 The rates cited in the text are the rates reported by the U.S. Bureau of Labor Statistics (BLS) for mothersin families maintained by women with own children under 18 in the annual publication “EmploymentCharacteristics of Families – (year),” most recent edition available athttp://www.bls.gov/news.release/pdf/famee.pdf .
3 The rates cited in the text are the rates for household heads in female-headed primary families with nospouse present and with related children under 18 as calculated by Legal Momentum using the U.S.Census Bureau Current Population Survey Table Creator (CPS Table Creator) available at

7/30/2019 Compliation of Legal Momentum Single Mother Reports
http://slidepdf.com/reader/full/compliation-of-legal-momentum-single-mother-reports 15/222
The percentage of single mothers never employed at any time in the year rose from 21%
in 2002 to 23% in 2007, and to 27% in 2009.4
UNEMPLOYMENT RATES HAVE CLIMBED
The official statistics count non-employed persons as “unemployed” only if they are
actively searching for employment. Most jobless single mothers are not counted as unemployed
because they are not actively seeking employment due to lack of child care, ill health, or other
reasons.
The official unemployment rate is calculated by dividing the number unemployed by the
sum of the number employed and the number unemployed. For single mothers, the average
monthly unemployment rate rose from 7.5% in 2000 to 8.0% in 2007, and to 13.6% in 2009.5
MEDIAN INCOME HAS DECLINED
Median annual income (in 2009 dollars) for single mother families fell from $27,296 in
2000 to $25,809 in 2007, and to $25,172 in 2009.6
POVERTY RATES HAVE INCREASED
The official poverty rate for single mother families rose from 33% in 2000 to 37% in
2007, and to 38.5% in 2009.7
http://www.census.gov/hhes/www/cpstc/cps_table_creator.html. 2002 is the earliest year covered by theCPS Table Creator.
4 Id.
5 The rates cited in the text are the rates reported by BLS for women in families with own children under 18 and with no spouse present in the annual publication “Employment Characteristics of Families – (year),” most recent edition available at http://www.bls.gov/news.release/pdf/famee.pdf .
6 The amounts cited in the text are the amounts reported by the Census Bureau for families with a femalehouseholder with related children under 18 and no spouse present in “Table F-10. Presence of ChildrenUnder 18 Years Old by Median and Mean Income: 1974 to 2009,” available athttp://www.census.gov/hhes/www/income /data/historical/families/index.html.
7 The rates cited in the text are the rates reported by the Census Bureau for families with a femalehouseholder with related children under 18 and no spouse present in “Tabel 4. Poverty Status of Families, by Type of Family, Presence of Related Children, Race, and Hispanic Origin: 1959 to 2009,”available at http://www.census.gov/hhes/www/poverty/data/historical/families.html.
7/30/2019 Compliation of Legal Momentum Single Mother Reports
http://slidepdf.com/reader/full/compliation-of-legal-momentum-single-mother-reports 16/223
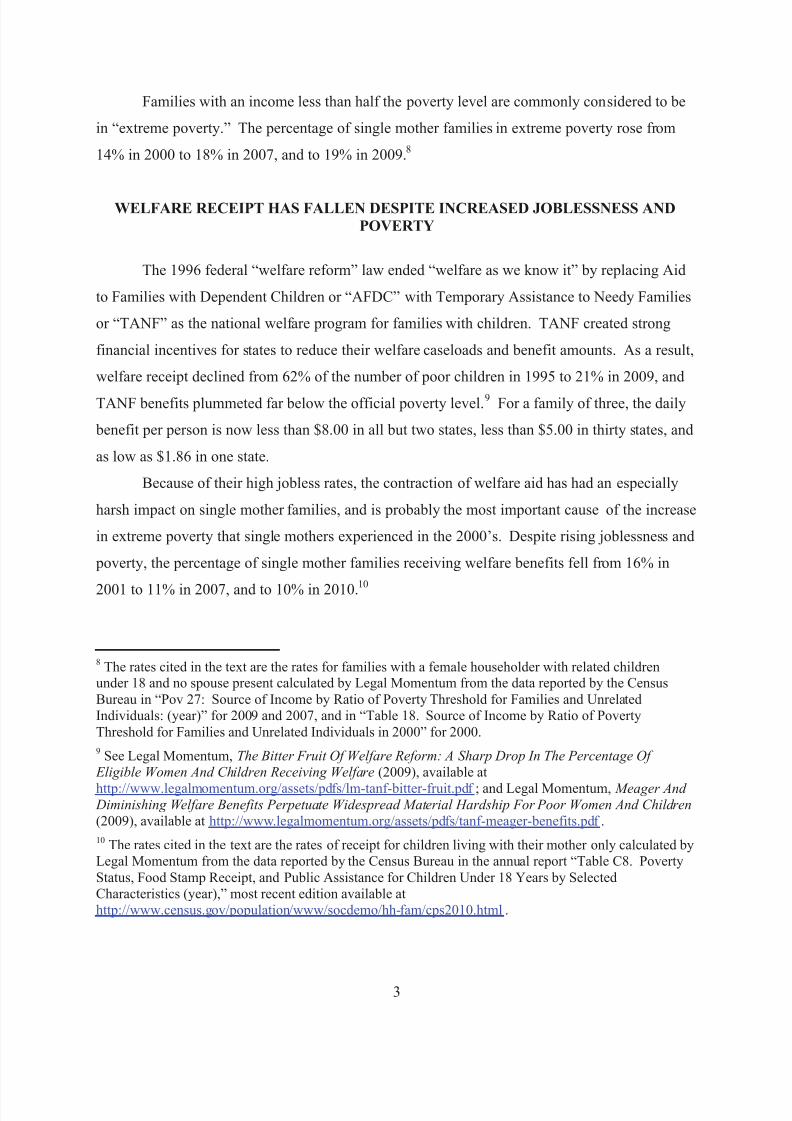
Families with an income less than half the poverty level are commonly considered to be
in “extreme poverty.” The percentage of single mother families in extreme poverty rose from
14% in 2000 to 18% in 2007, and to 19% in 2009.8
WELFARE RECEIPT HAS FALLEN DESPITE INCREASED JOBLESSNESS AND
POVERTY
The 1996 federal “welfare reform” law ended “welfare as we know it” by replacing Aid
to Families with Dependent Children or “AFDC” with Temporary Assistance to Needy Families
or “TANF” as the national welfare program for families with children. TANF created strong
financial incentives for states to reduce their welfare caseloads and benefit amounts. As a result,
welfare receipt declined from 62% of the number of poor children in 1995 to 21% in 2009, and
TANF benefits plummeted far below the official poverty level.9 For a family of three, the daily
benefit per person is now less than $8.00 in all but two states, less than $5.00 in thirty states, and
as low as $1.86 in one state.
Because of their high jobless rates, the contraction of welfare aid has had an especially
harsh impact on single mother families, and is probably the most important cause of the increase
in extreme poverty that single mothers experienced in the 2000’s. Despite rising joblessness and
poverty, the percentage of single mother families receiving welfare benefits fell from 16% in
2001 to 11% in 2007, and to 10% in 2010.10
8 The rates cited in the text are the rates for families with a female householder with related childrenunder 18 and no spouse present calculated by Legal Momentum from the data reported by the CensusBureau in “Pov 27: Source of Income by Ratio of Poverty Threshold for Families and UnrelatedIndividuals: (year)” for 2009 and 2007, and in “Table 18. Source of Income by Ratio of PovertyThreshold for Families and Unrelated Individuals in 2000” for 2000.
9 See Legal Momentum, The Bitter Fruit Of Welfare Reform: A Sharp Drop In The Percentage Of Eligible Women And Children Receiving Welfare (2009), available at
http://www.legalmomentum.org/assets/pdfs/lm-tanf-bitter-fruit.pdf ; and Legal Momentum, Meager And Diminishing Welfare Benefits Perpetuate Widespread Material Hardship For Poor Women And Children(2009), available at http://www.legalmomentum.org/assets/pdfs/tanf-meager-benefits.pdf .
10 The rates cited in the text are the rates of receipt for children living with their mother only calculated byLegal Momentum from the data reported by the Census Bureau in the annual report “Table C8. PovertyStatus, Food Stamp Receipt, and Public Assistance for Children Under 18 Years by SelectedCharacteristics (year),” most recent edition available athttp://www.census.gov/population/www/socdemo/hh-fam/cps2010.html.
7/30/2019 Compliation of Legal Momentum Single Mother Reports
http://slidepdf.com/reader/full/compliation-of-legal-momentum-single-mother-reports 17/224
FOOD STAMP RECEIPT HAS INCREASED
Food Stamp receipt, like welfare receipt, plunged in the second half of the 1990’s as a
result of “welfare reform.” Unlike with welfare, however, in the early 2000’s the federal
government responded to this plunge by adopting new Food Stamp policies aimed at increasing
participation among eligible families. The subsequent Food Stamp participation expansion was
particularly beneficial to single mother families for the same reason that the welfare contraction
was particularly harmful. The percentage of single mother families receiving Food Stamp
benefits increased from 29% in 2001 to 33% in 2007 and to 41% in 2010.11
HOMELESSNESS AND DOUBLE-UPS HAVE INCREASED
For the past three years the U.S. Department of Housing and Urban Development has
counted the number of homeless persons in emergency shelters at any time in the year and the
number of persons homeless (both sheltered and unsheltered) on one given day. The number of
families using emergency shelters rose from 130,968 in 2007 to 159,142 in 2008, and to 170,129
in 2009, with single mother families accounting each year for between 75% and 80% of the total
number of homeless families.12 Single mother families probably also accounted for most of the
17,675 homeless families without shelter on a given day in 2009.
Economic necessity forces many low income families to double up in another person’s or
family’s household. Doubling up is often a precursor to homelessness. The percentage of single
mother families doubled up in another person’s household declined from 18.4% in 2001 to
18.2% in 2007, but rose to 20.3% in 2010.13
11 Id.
12 U.S. Department of Housing and Urban Development, The 2009 Annual Homeless Assessment Report to Congress (2010), at p. 43 & 51, available athttp://www.hudhre.info/documents/5thHomelessAssessmentReport.pdf .
13 The rates cited in the text are the rates for children living with their mother but not their father in ahousehold in which the mother is not the householder calculated by Legal Momentum from the datareported by the Census Bureau in the annual report “Table C2. Household Relationship and LivingArrangements of Children Under 18 Years, by Age and Sex (year),” most recent edition available athttp://www.census.gov/population/www/socdemo/hh-fam/cps2010.html.
7/30/2019 Compliation of Legal Momentum Single Mother Reports
http://slidepdf.com/reader/full/compliation-of-legal-momentum-single-mother-reports 18/225
FOOD INSECURITY AND FOOD PANTRY USE HAVE INCREASED
The U.S. Department of Agriculture (USDA) issues annual studies on household food
security and food insecurity, with “food insecurity” described by USDA as meaning that “access
to adequate food is limited by lack of money and other resources.” The food insecurity rate for
single mother families declined from 31% in 2000 to 30% in 2007, but then jumped to 37% in
2009.14
These same USDA studies also report on the numbers of persons who turn to food
pantries for emergency food assistance. The percentage of single mothers using a food pantry
rose from 8.6% in 2000 to 10.6% in 2007, and to 13.7% in 2009.15
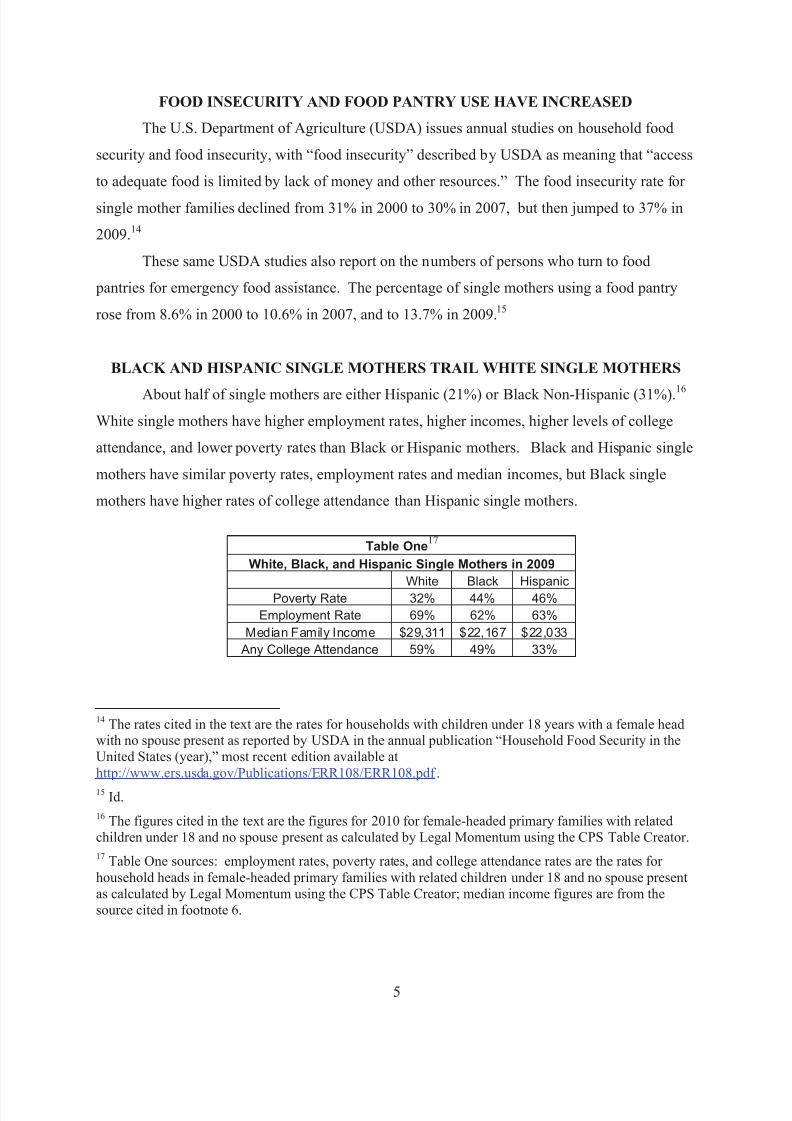
BLACK AND HISPANIC SINGLE MOTHERS TRAIL WHITE SINGLE MOTHERS
About half of single mothers are either Hispanic (21%) or Black Non-Hispanic (31%).16
White single mothers have higher employment rates, higher incomes, higher levels of college
attendance, and lower poverty rates than Black or Hispanic mothers. Black and Hispanic single
mothers have similar poverty rates, employment rates and median incomes, but Black single
mothers have higher rates of college attendance than Hispanic single mothers.
Table One17
White, Black, and Hispanic Single Mothers in 2009
White Black Hispanic
Poverty Rate 32% 44% 46%
Employment Rate 69% 62% 63%
Median Family Income $29,311 $22,167 $22,033
Any College Attendance 59% 49% 33%
14 The rates cited in the text are the rates for households with children under 18 years with a female headwith no spouse present as reported by USDA in the annual publication “Household Food Security in theUnited States (year),” most recent edition available athttp://www.ers.usda.gov/Publications/ERR108/ERR108.pdf .
15 Id.
16 The figures cited in the text are the figures for 2010 for female-headed primary families with relatedchildren under 18 and no spouse present as calculated by Legal Momentum using the CPS Table Creator.
17 Table One sources: employment rates, poverty rates, and college attendance rates are the rates for household heads in female-headed primary families with related children under 18 and no spouse presentas calculated by Legal Momentum using the CPS Table Creator; median income figures are from thesource cited in footnote 6.
7/30/2019 Compliation of Legal Momentum Single Mother Reports
http://slidepdf.com/reader/full/compliation-of-legal-momentum-single-mother-reports 19/226
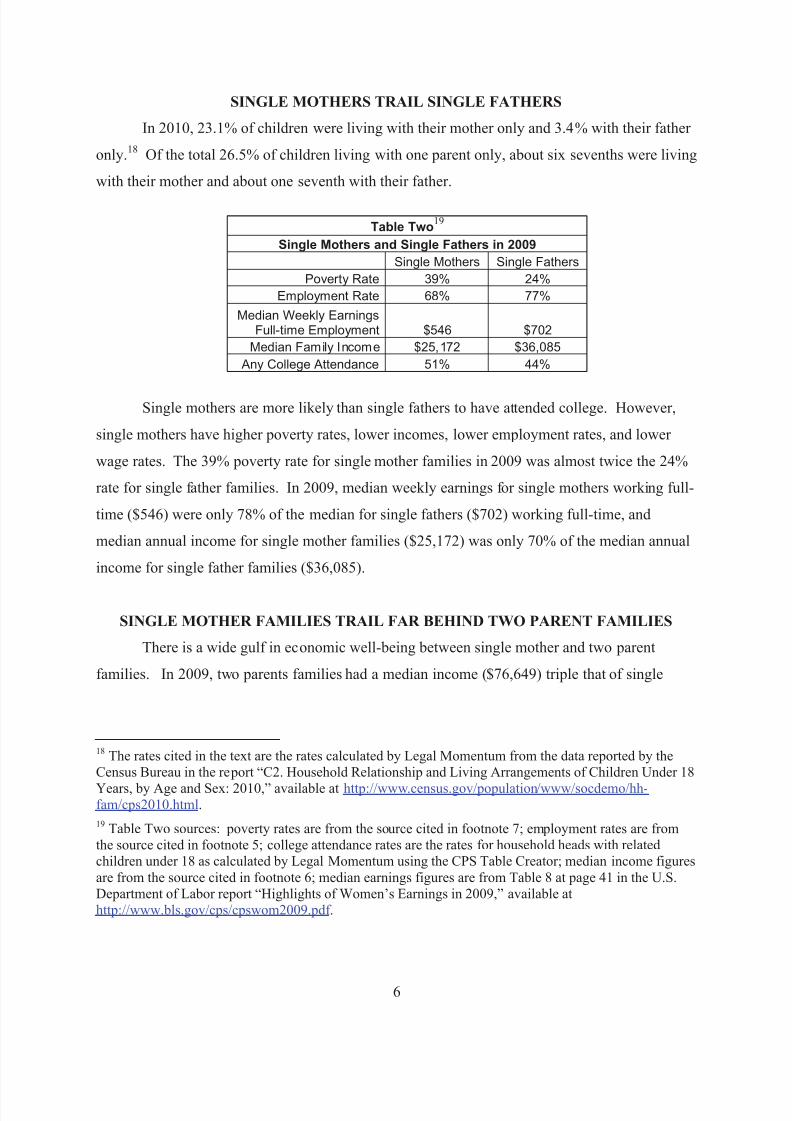
SINGLE MOTHERS TRAIL SINGLE FATHERS
In 2010, 23.1% of children were living with their mother only and 3.4% with their father
only.18 Of the total 26.5% of children living with one parent only, about six sevenths were living
with their mother and about one seventh with their father.
Table Two19
Single Mothers and Single Fathers in 2009
Single Mothers Single Fathers
Poverty Rate 39% 24%
Employment Rate 68% 77%
Median Weekly EarningsFull-time Employment $546 $702
Median Family Income $25,172 $36,085
Any College Attendance 51% 44%
Single mothers are more likely than single fathers to have attended college. However,
single mothers have higher poverty rates, lower incomes, lower employment rates, and lower
wage rates. The 39% poverty rate for single mother families in 2009 was almost twice the 24%
rate for single father families. In 2009, median weekly earnings for single mothers working full-
time ($546) were only 78% of the median for single fathers ($702) working full-time, and
median annual income for single mother families ($25,172) was only 70% of the median annual
income for single father families ($36,085).
SINGLE MOTHER FAMILIES TRAIL FAR BEHIND TWO PARENT FAMILIES
There is a wide gulf in economic well-being between single mother and two parent
families. In 2009, two parents families had a median income ($76,649) triple that of single
18 The rates cited in the text are the rates calculated by Legal Momentum from the data reported by theCensus Bureau in the report “C2. Household Relationship and Living Arrangements of Children Under 18
Years, by Age and Sex: 2010,” available at http://www.census.gov/population/www/socdemo/hh-fam/cps2010.html.
19 Table Two sources: poverty rates are from the source cited in footnote 7; employment rates are fromthe source cited in footnote 5; college attendance rates are the rates for household heads with relatedchildren under 18 as calculated by Legal Momentum using the CPS Table Creator; median income figuresare from the source cited in footnote 6; median earnings figures are from Table 8 at page 41 in the U.S.Department of Labor report “Highlights of Women’s Earnings in 2009,” available athttp://www.bls.gov/cps/cpswom2009.pdf .

7/30/2019 Compliation of Legal Momentum Single Mother Reports
http://slidepdf.com/reader/full/compliation-of-legal-momentum-single-mother-reports 20/227
mother families ($25,172), and a poverty rate (8%) one fifth that of single mother families
(39%).
Table Three20
Single Mothers Compared With Married Mothers and Fathers in 2009
SingleMothers
MarriedMothers
MarriedFathers
Poverty Rate 39% 8% 8%
Employment Rate 68% 66% 88%
Employed Full-time Full-year 45% 42% 75%
Median Weekly Earnings Full-time Employment $546 $705 $939
Median Family Income $25,172 $76,649 $76,649
Any College Attendance 50% 65% 61%
Bachelors Degree or more 16% 37% 35%
Employment rates for single mothers are about the same as for married mothers but far
below those for married fathers. In an average month in 2009, there was no employed parent in
32% of single mother families but in only 4%21 of two parent families (not shown in table). The
percentage of two parent families with both parents employed (59%)22 (not shown in table) was
almost as large at the percentage (68%) of single mother families with an employed mother.
Wage rates for single mothers are far below those for married mothers and even farther
below those for married fathers. In 2009, median weekly earnings for single mothers working
full-time ($546) were only 77% of the median for married mothers ($705) working full-time, andonly 58% of the median for married fathers ($939) working full-time.
SINGLE MOTHERS NEED CHILD CARE SUBSIDIES AND EQUAL WAGES
Single mothers need steady full-time employment to achieve even a modest level of
economic well-being. Joblessness imperils their economic security and thrusts many into deep
poverty.
20 Table Three sources: employed full-time full-year rates calculated by Legal Momentum using the CPSTable Creator; for other variables, same sources as for Table Two.
21 The source for the 4% figure cited in the text is Table 4 in “Employment Characteristics of Families – 2009,” available at http://www.bls.gov/news.release/pdf/famee.pdf
22 The source for the 59% figure cited in the text is the same source cited in footnote 21.

7/30/2019 Compliation of Legal Momentum Single Mother Reports
http://slidepdf.com/reader/full/compliation-of-legal-momentum-single-mother-reports 21/228
Single mothers need more than a low official unemployment rate to achieve high
employment rates. In 2000, the monthly employment rate for single mothers was only 76% even
though the monthly unemployment rate (for all persons) was just 4%, the lowest rate in at least
the last forty years.
Single mothers must also have affordable child care to achieve high employment rates.
The lack of affordable child care probably accounts for much if not most of the large gap in
employment rates between single mothers and married fathers.
For many single mothers, potential earnings are too low to pay for child care. A recent
study found that in 2009 the average cost for infant center care ranged from 26% to 67% of the
state median income for single mother families.23 The average child care cost for two children in
care, one an infant and one four years old, ranged from 48% to 114% of the state median income
for single mother families.24
For many single mothers employment is therefore impossible unless child care cost is
subsidized. A substantial number of single mothers do participate in child care subsidy programs
and research has confirmed that these programs do raise employment rates for single mothers.25
However, public subsidy funding is sufficient to reach only a small fraction of those eligible.26
Raising wages for singles mothers to the same level as for single fathers could also
increase single mothers’ employment rates. Research has shown that higher wages increase
single mothers’ employment rates probably at least in part by making child care more
affordable.27 Single fathers’ higher wage rates contributes to their higher employment rates
relative to single mothers.
23 National Association of Child Care Resources & Referral Agencies, Parents and the High Cost of Child Care 2010 Update, available at http://www.naccrra.org/docs/Cost_Report_073010-final.pdf .
24Id.
25See, e.g., Chris Herbst, The Labor Supply Effects of Child Care Costs and Wages in the Presence of Subsidies and the Earned Income Tax Credit , 8 Rev. Econ. Household 199 – 230 (2010), available athttp://www.springerlink.com/content/m614275597461577/fulltext.pdf .
26 See Testimony of Helen Blank for the Subcommittee on Children and Families of the Senate Health,Education Labor and Pensions Committee Hearing On “The State of the American Child: Securing Our Children’s Future” (Nov. 18, 2010), available at http://help.senate.gov/imo/media/doc/Blank1.pdf .
27 Herbst, footnote 25 supra.

7/30/2019 Compliation of Legal Momentum Single Mother Reports
http://slidepdf.com/reader/full/compliation-of-legal-momentum-single-mother-reports 22/22
SINGLE MOTHERS NEED A HUMANE SAFETY NET
The lack of jobs and the lack of affordable child care force many single mothers to turn to
the national safety net system to meet their families’ basic needs. While the Food Stamp
program does reach a good fraction of single mother families, Food Stamps at most suffice for
food and can not be used for rent, utilities, clothing or other important needs.
Jobless single mothers necessarily must turn to TANF for their other needs. However, as
already explained, TANF now aids only a small fraction of poor single mothers and TANF
benefits are disgracefully inadequate.
CHALLENGES AHEAD
New policies to improve the economic well-being of single mothers and their families are
imperative but efforts to achieve them face many challenges. The non-partisan Congressional
Budget Office projects that unemployment rates will remain above pre-recession levels at least
through 2014.28 Progress in reducing the gender wage gap has halted in recent years.29 To
obtain new federal funds for child care and TANF, it will be necessary to address the deficit
concerns expressed by both parties and the pledges by the new Republican House leadership to
reduce federal domestic spending. Due to reduced revenue and other factors, many states are
now considering and some have recently enacted new TANF cuts. While these are daunting
challenges, nevertheless the growing awareness of single mothers’ economic distress provides an
opportunity to mobilize support for the new policies that are needed.
(January 2011) (For further information contact Timothy Casey, [email protected].)
28 Congressional Budget Office, The Budget and Economic Outlook: An Update (August 2010), availableat http://www.cbo.gov/doc.cfm?index=11705.
29 See Institute for Women’s Policy Research, The Gender Wage Gap: 2009 (updated September 2010),available at http://www.iwpr.org/pdf/C350.pdf .