Complex Networks Perspectives towards Accelerated Bridge ...
26
1 Complex Networks Perspectives towards Accelerated Bridge Construction (ABC) Quarterly Progress Report For the period ending May 2020 Submitted by: PI- Arif Mohaimin Sadri, Ph.D. Co-PI- Armin Mehrabi, Ph.D. Graduate Student- Md Ashraf Ahmed Affiliation: Moss Department of Construction Management Florida International University Submitted to: ABC-UTC Florida International University Miami, FL
Transcript of Complex Networks Perspectives towards Accelerated Bridge ...

1
Complex Networks Perspectives towards Accelerated Bridge Construction
(ABC)
Quarterly Progress Report
For the period ending May 2020
Submitted by:
PI- Arif Mohaimin Sadri, Ph.D.
Co-PI- Armin Mehrabi, Ph.D.
Graduate Student- Md Ashraf Ahmed
Affiliation: Moss Department of Construction Management
Florida International University
Submitted to:
ABC-UTC
Florida International University
Miami, FL

2
1. Background and Introduction Accelerated Bridge Construction (ABC) employs precast bridge elements moved to the bridge
location and installed in place. Although ABC advances the life cycle cost (while using new
materials and methods), reduce construction time, and result in higher quality of elements,
nevertheless many cast-in-place activities need to be undertaken. As such, despite the fact that
ABC reduces many uncertainties associated with construction processes and performance during
service life, ABC related activities can create impacts on the road network carrying regular traffic.
The problem may get escalated during major natural extreme events (hurricane, wildfire). As such,
network positions or credentials of bridges based on their topography or connectivity need to be
assessed to prioritize or stage ABC activities. There have been limited investigations by many
states to monitor the effects on traffic due to ABC related activities and to identify more efficient
strategies to pursue such activities while reducing overall system-wide impact. ABC-UTC is
planning to embark on a coordinated and extensive network experiments at different geographic
scales to apply complex network science principles to the study of bridge networks and ABC
related activities. The research will use GIS modeling along with FDOT bridge and road network
data to run network experiments and prioritize certain bridges based on their network credentials.
Essentially, it will be attempted to establish relationships between bridge topography with their
functional behavior. The research will provide new insights into ABC activities and scheduling
based on the topography of vulnerable bridges and monitoring system-wide cascading effects. The
results will be compiled and published on ABC-UTC website and will become available to outside
users and researchers. The study will develop an approach and tool that states, municipalities and
other transportation authorities can use to select the proper actions for repair and replacement of
exiting bridges by implementing ABC methods of choice and on a risk-based maintenance
strategy.
2. Problem Statement Conceptual and methodological developments in network analysis have furthered our
understanding of the effects of individuals’ interpersonal environment on normative social
influence and social engagement. Network data offers better insights related to an individual's
abilities, aspirations, attitudes, behaviors, and interpersonal environment. The complex topology
of real networks allows its actors to change their functional behavior. Network models provide
better understanding of the evolutionary mechanisms being accountable for the growth of such
networks by capturing the dynamics in the ways network agents interact and change their behavior.
Considerable amount of research efforts is required for developing novel network modeling
techniques to understand the structural properties such networks, reproducing similar properties
based on empirical evidence, and designing such networks efficiently.
ABC project applications are categorized in 6 tiers based on the project mobility/traffic impact
time ranging from 1 day (Tier 1) to several months (Tier 6), with considerable reduction of time
from the conventional option. For example, a project for which the entire superstructure has been
assembled off-line and moved in place within just 24 hours will be specified as Tier 1 (Shane
2018). Tier 6 will include impacting for example a statewide bridge replacement program by
months or years through implementing Tier 1 to 5 projects for individual bridges in the network.
However, these options may translate to variable costs normally higher costs for shorter duration.
Consequently, selection of the ABC method will impact the cost according to the advantage it

3
offers for time. This trend is one of the factors to be considered on the network analysis for ABC
options along with others.
Identifying the vulnerable sections and cascading effects in the bridge network system can be quite
challenging. Potential failure in a bridge network system is often over-looked, but the consequence
can be catastrophic as it can adversely affect the mobility of people. Therefore, addressing the
vulnerabilities is very complicated in large cities. While there have been studies that discussed the
necessity of developing framework for measuring resilience, a systematic approach to improving
resiliency through vulnerability assessment is lacking. The objective of this study is to present
method for assessing the vulnerability of a bridge network system and a strategy for improving its
resiliency. With a growing attention to risk-based inspection and maintenance of infrastructure,
an accurate knowledge of the vulnerabilities and importance, as well as consideration of
interrelation among bridges in a network becomes crucial. The bridge network system in the state
of Florida, USA will be used as a case study in this project.
The vulnerability and resilience of the Florida bridge network will be analyzed based on network
science principles and graph theory. For example, a small portion (Miami-Dade) of the Florida
road and bridge network is shown in Figure 1. The bridge connectivity will be treated as a network
to assess the interdependence between the connectivity of the system components and their
functional behavior (Newman 2003). In accordance with the network science literature, these
network links and nodes can be analyzed with respect to the resilience metrics to determine the
critical components of a bridge network system that are more susceptible to external shocks. Once
the vulnerabilities have been identified, priorities will be set to improve the different vulnerable
sections of the bridge network system. Furthermore, a plan will be developed, to improve the
resiliency of all the different components of the bridge network systems. A preliminary literature
review is provided in section 4.2 to motivate how network science principles can be applied to the
study of bridge networks and Accelerated Bridge Construction (ABC) activities.
Figure 1 Examples of Miami-Dade county road and bridge network. (a) Road network, (b)
Bridge network, (c) Superimposed road and bridge network.

4
3. Objectives and Research Approach ABC-UTC is planning to embark on a coordinated and extensive network experiments at different
geographic scales to apply complex network science principles to the study of bridge networks
and ABC related activities. The research will use GIS modeling along with FDOT bridge and road
network data to run network experiments and prioritize certain bridges based on their network
credentials. Essentially, it will be attempted to establish relationships between bridge topography
with their functional behavior. The specific objectives of the proposed project include (a)
investigation on the resiliency and vulnerability of road-bridge networked systems, (b)
development of a framework for analysis of such networks and their topology with functional
behavior, (c) incorporation of the analysis method in a user friendly tool for use by bridge owners
and consultants for decision making on maintenance of the infrastructure, and (d) incorporation
of complex network analysis with ABC options and features
The research will provide new insights into ABC activities and scheduling based on the topography
of vulnerable bridges and monitoring system-wide cascading effects. By applying network science
principles, most important (higher degree and more central) bridges among the bridge network
will be identified. We can then suggest ABC to put more emphasize (maintenance, retrofitting) on
those bridges; which can facilitate recovery of bridge networks after an extreme event, hence
ensuring resiliency. Similar context can be applied to new ABC activities. The results will be
compiled and published on ABC-UTC website and will become available to outside users and
researchers. The study will develop an approach and tool that states, municipalities and other
transportation authorities can use to select the proper actions for repair and replacement of exiting
bridges by implementing ABC methods of choice and on a risk-based maintenance strategy.
4. Description of Research Project Tasks
The following is a description of tasks carried out to date.
Task 1 – Comprehensive Literature Review
A comprehensive literature review has been completed in this quarter which is detailed below:
Transportation infrastructure forms the mainstay of the economy and typically requires huge
amount of annual investments which are mainly for maintenance, rehabilitation, and replacement
of the assets of the transportation infrastructure. The overall expenditures are expected to increase
due to infrastructure aging, increased frequency and intensity of severe weather, and increasing
traffic loads. More than 685,000 bridges in the United States are no exception to these conditions.
The vitality of the bridge network to the transportation network and to economic development, the
large investments in their repair and replacement, and the impact of their closures on the socio-
economic prosperity of the society, inspires the implementation of new construction techniques,
planning approaches, and policies for their management. One of the main challenges facing
transportation asset managers is the need to cost-effectively prioritize the repair and replacement
of the large inventory of deteriorating bridges considering the ever-increasing budgetary
constraints. The indirect costs (such as traffic delay) associated with the closure times during these
activities exacerbates the decision-making processes (Alice Alipour 2018).

5
As an alternative to conventional construction, Accelerated Bridge Construction (ABC) techniques
are gradually gaining acceptance to reduce construction duration and minimize the impact of
closures at the network level. There are different types of ABC and each technique has its
limitations and speed of completion. The choice of using a specific ABC depends on a host of
different factors including its applicability to specific bridge site, criticality of the bridge to the
network, and availability of capital funds for its implementation. Some of these factors tend to
have contradicting affects, as a faster ABC technique often entails higher investment levels; on the
other hand, a faster technique for a bridge with high criticality to the network may result in large
savings in user costs (Alice Alipour 2018).
Alice et al. aims to address the aspects through a review of the available literature and having
interview with a few states that have implemented ABC at different levels. The results showed that
the major aspects impacting the timelines for ABC projects are the impacts the closures might have
on the socio- economic aspects of the community. Hence, most states acknowledge the importance
of indirect costs, except for some, there is no mathematical formulation to account for them in the
final decision making. Most of decisions are made based on the qualitative input from districts and
through public discussions with the public. For the establishment of incentives, similar procedure
as those for the conventional construction and following the FHWA guidelines is suggested by
most of the states (Shane 2018).
To support resilience planning for roadway networks, Zhang et al. introduces a new stage-wise
decision framework regarding pre-disaster mitigation (Stage I), post-disaster emergency response
(Stage II) and long-term recovery (Stage III). These decision metrics are first defined, based on a
derivation of the number of independent pathways (IPW) within a roadway system, to measure the
performance of a network in term of its robustness, redundancy, and recoverability, respectively.
In Phase I, a prioritization approach for temporary repairs to facilitate immediate post-disaster
emergency responses in Phase II, and a methodology for scheduling network-wide repairs during
the long-term recovery of the roadway system in Phase III. Using the three IPW-based decision
metrics, a stage-wise decision process is then formulated as a stochastic multi-objective
optimization problem, which includes a project ranking mechanism to identify pre-disaster
network retrofit projects. Finally, this stage-wise decision framework is applied to the roadway
network of Shelby County, TN, USA subjected to seismic hazards, to illustrate its implementation
in supporting community network resilience planning (Zhang 2018).
Machado et al explains community resilience which depends on the resilience of the lifeline
infrastructure and the performance of the disaster-related functions of local governments. This
study summarizes the metrics used to assess the resilience of the transportation system and a
categorization of the assessment approaches at three levels of analysis (the asset, network, and
systems levels). State and federal resilience plans and guidelines acknowledge the importance of
the transportation system as a critical lifeline in planning for community resilience and in helping
local governments to set recovery goals. However, a widely accepted definition of the resilience
of the transportation system and a structure for its measurement are not available. Furthermore,
this paper ties these metrics to relevant dimensions of community resilience. This work addresses
a key first step required to enhance the efficiency of planning related to transportation system
resilience by providing (a) a standard terminology with which efforts to enhance the resilience of
the transportation system can be developed, (b) an approach to organize planning and research

6
efforts related to the resilience of the transportation system, and (c) identification of the gaps in
measurement of the performance of the resilience of the transportation system (Machado-León
2017).
Sun et al states that the transportation infrastructure plays an important role in ensuring the well-
being of its citizenry and for supporting the national economy. There is an increasing number of
studies focusing on the resilience analysis of the transportation infrastructure to support planning
and design and to optimize emergency management and restoration schedules. Extreme events
(including both natural hazards and man-made disasters) have caused terrible physical damages to
the transportation infrastructure, long-term socioeconomic impacts, and psychological damages.
This study covers functionality metrics, functionality-based resilience metrics and socio-economic
resilience metrics. The study also revealed that there are still fundamental challenges to
comprehensively evaluate the resilience of the transportation infrastructure, especially due to two
main sources of complexity: uncertainties and interdependencies. Besides, the validations of
resilience assessments are limited due to the general scarcity of data, which may hinder the
practical applications (Sun 2018).
4.1 Resiliency of Bridge Network
Alice et al develops a mixed-integer programming model that provides a balanced portfolio of
construction techniques on bridge sites over a prioritization process for bridges at the network
level. A project-level scheme accordingly is conducted to optimize the choice of accelerated
construction techniques for this purpose, while a network-level scheme is used to select the bridges
for rapid replacement based on their criticalities to the network, To account for the effects of
different accelerated construction techniques, the costs associated with each replacement technique
is calculated including direct costs from the actual replacement of bridges and indirect costs
experienced by network users due to the bridge closure during the maintenance period (Alice
Alipour 2018).
Twumasi et al. explains hazard impacts on regional network infrastructures and identifying
significantly affected areas are important for communicating the need for building resilient
infrastructure by describing the comprehension of network-level consequences resulting from
disruptive events is a main gray area in the evaluation of transportation network resilience at the
regional level. High-impact-zone location identification metrics were developed and implemented
in preliminarily identifying areas affected by bridge closures. This study presents a framework for
assessing the regional network resilience by leveraging scenario-based traffic modeling and GIS
techniques Resilience was estimated, and an index developed by utilizing practical functionality
metrics based on vehicle distance and hours traveled. These are illustrated for the Tampa Bay,
Florida, area. Findings for 10 bridge closure scenarios and recovery schemas indicated significant
regional resilience losses. The I-275 bridge closure indicated the highest functional loss to the
regional network: the aggregated resilience index below 0.5 reflects severe network performance
deficit and mobility limitations (Twumasi-Boakye 2018).
Zhang et al. presents a methodology systematically incorporates network topology, redundancy,
traffic flow, damage level and available resources into the stochastic processes of network post-
hazard recovery strategy optimization. A novel resilience-based framework is developed here to
optimize the scheduling of the post-disaster recovery actions for road-bridge transportation

7
networks. Two metrics are proposed for measuring rapidity and efficiency of the network
recovery: total recovery time (TRT) and the skew of the recovery trajectory (SRT). The TRT is
the time required for the network to be restored to its pre-hazard functionality level, while the SRT
is a metric defined for the first time in this study to capture the characteristics of the recovery
trajectory that relates to the efficiency of those restoration strategies considered. To illustrate the
proposed methodology, a genetic algorithm is used to solve the restoration schedule optimization
problem for a hypothetical bridge network with 30 nodes and 37 bridges subjected to a scenario
seismic event. Based on the two-dimensional metric, a restoration scheduling method is proposed
for optimal post-disaster recovery planning for bridge-road transportation networks. A sensitivity
study using this network illustrates the impact of the resourcefulness of a community and its time-
dependent commitment of resources on the network recovery time and trajectory (Zhang 2017).
Frangopol et al. claims that the most earthquake damage prone components of a transportation
network are certainly its bridges; therefore, the proposed approach focuses on bridge rehabilitation
interventions. This study deals with the concept of “resilience” and proposes its use as optimization
criterion for the rehabilitation of a transportation network subject to earthquake. The design
variables of the optimization problem are the application times and durations of the interventions
on bridges of the network. These durations are determined by the amount of funding invested on
each bridge. Hence, the proposed methodology provides the optimal rehabilitation schedule and
cost breakdown for all the bridges of the network. A numerical application is presented to illustrate
the proposed approach and to show its capabilities (Frangopol 2011).
Bocchini et al. describes that the development of tools for the assisted decision making during the
disaster management is the most promising fields where the concept of resilience is applied to
engineering practice. The proposed technique involves a completely new formulation of the
optimization problem, with new design variables, additional objectives, and constraints. This new
technique for the optimal disaster management is presented here that provides bridge restoration
sequences which maximize the network resilience and minimize the time to connect critical
locations. The purpose of these modifications is to generate an automated procedure that mimics
better the decision process currently used by disaster managers. Two numerical examples are
presented: the first one is meant to validate and demonstrate the proposed approach, whereas the
second proves its applicability to a network with a larger number of bridges. In this latter example
the input data have been filtered by random factors to make the data more realistic (Bocchini 2013).
Karamlou et al. indicates transportation networks as necessary infrastructure elements to provide
supports to impacted areas after the occurrence of a disaster. Recovering without functional roads,
other damaged facilities and lifelines would be slow and difficult. Therefore, restoring the damages
of transportation networks, specifically bridges as their most vulnerable elements, is among the
first priorities of disaster management officials. This study develops a new methodology for the
restoration of damaged bridges scheduling by developing an algorithm which is providing a
practical restoration plan to be used by decision makers at the time of an event, yet based on solid
computations rather than mere engineering judgment. The problem is formulated as a multi-
objective combinatorial optimization solved by Genetic Algorithms, which minimizes the time to
connect the selected critical locations and maximizes the resilience of the transportation network.
The algorithm is examined with a numerical example. The presented algorithm can be considered
as the enhancement of previous work performed at Lehigh University. The results show that the
8
new optimization setup improved the solution quality and efficiency compared to the previous
techniques (Karamlou 2014).
Banerjee et al. provided an organized and wide-ranging review on bridge and bridge network
resilience assessment under single hazard and multi-hazard conditions. Resilience assessment for
engineered systems in recent years has attracted considerable attention from the engineering
community. It has resulted in a large body of literature that focuses on relevant areas of resilience.
Authors mentioned not that much work has yet been done on multi-hazard bridge resilience,
relevant aspects are discussed, including combinations of multiple hazards for bridge performance
assessment, loss assessment methods, and post-event recovery approaches. In addition,
maintenance is a key component when a life-cycle framework evaluates resilience. Accessible
maintenance plans and strategies are discussed as well as their likely applications for bridges and
bridge networks. The article ends with a debate on the need for more work in the focus area and
the challenges associated with it (Banerjee 2019).
Domaneschi et al. stated that structural management systems can make a significant contribution
to reducing the impact of extreme events in areas affected by the earthquake, thus improving
structural resilience. In addition, as structural conditions change due to local failures, the inherent
advantage of some control systems, which can adjust to various loading rates, can be exploited.
This happens by changing the control system's working parameters in real time or over the period
between two seismic events, even if very short. This research deals with the durability of cable-
stayed bridge seismic control solutions through a case study defined by a standard literature bridge
control benchmark. Authors introduced a technique to restore the optimum bridge configuration
after a damaging incident. Emphasis is placed on the time interval between the occurrence of
damage and the recovery, which is the essential aspect of the resilient actions. Ultimately, in the
sense of multiple hazards, the development of a robustness index and general procedures indicating
how to measure durability for the cable-stayed bridge control system is discussed (Domaneschi
2015).
Bocchini et al. discussed an optimization method for the reconstruction activities associated with
the bridges of an earthquake-seriously damaged transportation network. The development
variables are (i) the time periods between the occurrence of the distress and the start of the
interventions on each network bridge; and (ii) the rate of reconstruction of the interventions, which
is a measure of the funding allocated to each bridge. The optimization goals were to optimize the
efficiency of the network, reduce the time required to reach a target level of functionality, and
minimize the total cost of restoration activities. Since the first two goals obviously clash with the
last, the optimization approach does not provide a unique solution, but a whole array of Pareto
solutions. The capabilities of the proposed methodology are illustrated by a numerical example
involving a complex, existing transport network in Santa Barbara, California (Frangopol 2012).
Apostolopoulou et al. explained that sustainable monument conservation requires the use of
performing materials that are at the same time compatible with the historical building materials of
the monument to ensure structural integrity, sufficient structural quality in earthquake strain, and
stability of both reconstruction and historical materials. It refers in particular to cultural heritage
properties that have suffered major damage, requiring extensive restoration. After a heavy rainfall
in 2015, the Plaka Bridge in Epirus, Greece, partly collapsed. It was a supreme example and an

9
important symbol of the region's typical stone bridge architecture. In this study, through a variety
of laboratory techniques, a potential restoration stone from a nearby quarry was examined in terms
of compatibility with the bridge's dominant historical building stone, as well as in terms of
mechanical performance. Furthermore, criteria for the restoration of mortars were set, taking into
account the characteristics of the historical materials as well as the bridge environment. The results
of the study on restoration stone and mortars were presented and evaluated to select the most
suitable restoration materials for Plaka Bridge in its upcoming reconstruction, with the goal of
improving the structure's overall resilience (Apostolopoulou 2019).
Setunge et al. stated that the road networks and critical road systems such as bridges, culverts and
floodways play a vital role in increasing the risk of the area being served before, during and after
extreme events. The research presented a detailed analysis of the Lockyer Valley region of
Australia's case study of 2013 floods to identify critical failure mechanisms of road bridge
structures exposed to flood events. 43 out of 46 bridges in the region have been damaged as a result
of the 2013 flood. Major bridge structure failure mechanisms are described as scouring of piers
and abutments, damage to bridge decks due to impact of urban debris, and severe damage to bridge
approach ramps. A methodology is proposed for vulnerability modeling of bridges for an extreme
event, consisting of a combination of the definition of fault tree system and harm index (Setunge
2014).
Karamlou et al. presented a new scheduling methodology to restore damaged bridges. The problem
is formulated as a multi-objective combinatorial optimization solved by Genetic Algorithms which
minimizes the time to connect the critical locations selected and maximizes the transport network's
resilience. The main purpose of designing the algorithm was to provide a restore strategy that is
realistic to be used at the time of an incident by decision-makers, but based on solid computations
rather than pure judgment of technology. A statistical example explores the algorithm. The results
show that, compared to previous approaches, the current optimization system improved the quality
and efficiency of the solution (Karamlou 2014).
Zhang et al. proposed a new resilience-based framework for street-bridge transport networks to
optimize the scheduling of post-disaster recovery actions. Systematically, the approach integrates
network topology, reliability, traffic flow, damage level and available resources into the design of
the post-hazard recovery strategy network stochastic processes. Two metrics were proposed to
calculate network recovery speed and efficiency: total recovery time (TRT) and the skew of the
recovery trajectory (SRT). The TRT is the time required to restore the network to its pre-hazard
level of functionality, while the SRT is a metric established for the first time in this study to capture
the characteristics of the recovery path that are linked to the efficiency of those strategies
considered for restoration. A sensitivity study using this network illustrates the impact on the
network recovery time and trajectory of a community's resourcefulness and its time-dependent
resource commitment. A restore scheduling method for optimal post-disaster recovery planning
for bridge-road transport networks is proposed based on this two-dimensional metric. A genetic
algorithm is used to solve the problem of restore schedule optimization for a hypothetical bridge
network with 30 nodes and 37 bridges subjected to a seismic scenario case to explain the suggested
technique (Weili Zhang 2017).

10
Tao et al. described that bridge quality can deteriorate due to aging, traffic-induced fatigue, and
environmental corrosion throughout their lifetime. Structural instability in earthquake-prone areas
raises bridge seismic vulnerability, which means an increase in potential future economic and
social losses. Therefore, determining the optimum maintenance strategies with regard to bridge
deterioration is of critical importance. To this end, the present paper proposes an infinite-horizon
hybrid Markov decision process model in which both the occurrence of earthquake and structural
deterioration processes are integrated into a unified Markovian framework. A Markov chain is
modeled on the structural deterioration process and a simplified earthquake-induced probability
transition matrix is adopted. The proposed model is applied to a simple case study for
demonstration purposes (Tao 2019).
Pritchard (2013) identified a range of issues that have been encountered as a result of the floods
and cyclone events from 2011 to 2012 in Queensland, Australia. These included timber bridge
destruction, pier settlement, abutment scouring, and the loss of road approaches to bridges. The
AS 5100 Bridge Design Code is assumed to have been written primarily for traditional rural
applications. In addition, this paper discusses the specific loads to which urban bridges are subject,
including floating debris such as shipping containers, vehicles and river-craft (e.g. 300 t vessels)
to be included in future revisions of AS 5100. Bridge design codes were suggested to consider the
context and location of bridges for accessibility and usability after catastrophe in the future. It is
recommended that such training be considered and implemented in accordance with suggested
changes to the AS 5100 Bridge Design Code for new bridges and remedial works (Pritchard 2013).
All the reviewed papers are associated with the resiliency of bridge network, which are providing
meaningful insights for both response and recovery phases of a disaster. Single hazard and multi-
hazard resiliency assessment for highway bridge network highlighted the importance of bridge
maintenance work. For cable stayed bridges, a robustness index and general procedures are
developed to measure durability during an earthquake event. Markovian framework is proposed
for optimum maintenance of deteriorating bridges and a multi-criteria intervention optimization
process is formulated for restoration of bridge networks in earthquake-prone areas. Besides, an
evaluation of new building materials for its restoration is discussed for the Plaka bridge in Epirus.
A framework for vulnerability bridge modeling for an extreme flood is proposed, consisting of a
combination of the defect tree structure description and the harm list. As consequences for flood
and cyclone events; timber bridge destruction, pier settlement, abutment scouring, and the loss of
road approaches to bridges are identified. Then, a new scheduling methodology is introduced to
restore damaged bridges to optimize bridge restoration sequence for resilient transportation
networks. Two metrics are proposed to calculate network recovery speed and efficiency: total
recovery time (TRT) and the skew of the recovery trajectory (SRT). These important metrics can
influence the criterions for planning, evaluation and rebuilding guidelines of bridge network.
4.2 Review of Network Science Literature
Many new network concepts, properties and measures have been developed by running
experiments on large-scale real networks. A number of statistical properties and unifying
principles of real networks have been identified from these studies. Significant amount of research
efforts have helped to develop new network modeling tools, reproduce the structural properties
observed from empirical network data, and design such networks efficiently with a view to
obtaining more advanced knowledge of the evolutionary mechanisms of network growth (Hasan

11
and Ukkusuri 2011). Many real networks possess interesting properties unlike random graphs
indicative of possible mechanisms guiding network formation and ways to exploit network
structure with specific objectives (Newman 2003). Some of these properties, common across many
real networks, are described below:
Small-world Property
This property refers to the existence of relatively short paths between any pair of nodes in most
networks despite their large size. The existence of this property is evident in many real networks
(Milgram 1967, Travers and Milgram 1969, Watts and Strogatz 1998). The small-world effect has
important implications in explaining dynamics of processes occurring on real networks. In case of
spreading information or ideas through a network, the small-world property suggests that the
propagation will be faster on most real world networks because of short average path lengths
(Newman 2003). Three important measures to explain this property are eccentricity, radius and
diameter. While the eccentricity of a node in a graph is the maximum distance (number of steps or
hops) from that node to all other nodes; radius and diameter are the minimum and maximum
eccentricity observed among all nodes, respectively.
Degree Distributions
The degree of a node (𝑘) is the number of direct links to other nodes in a graph. The degree
distribution 𝑃(𝑘) in real networks (probability that a randomly chosen node has degree 𝑘,
issignificantly different from the Poisson distribution, typically assumed in the modeling of
random graphs. In fact, real networks exhibit a power law (or scale-free) degree distribution
characterized by higher densities of triangles (cliques in a social network, for example) (Barabási
and Albert 1999). In addition, many real networks also exhibit significant correlations in terms of
node degrees or attributes. This scale-free property validates the existence of hubs, or a few nodes
that are highly connected to other nodes in the network. The presence of large hubs results in a
degree distribution with long tail (highly right-skewed), indicating the presence of nodes with a
much higher degree than most other nodes. For an undirected network, the degree distribution
𝑃𝑑𝑒𝑔𝑟𝑒𝑒(𝑘) can be written as follows:
𝑃𝑑𝑒𝑔𝑟𝑒𝑒(𝑘) ∝ 𝑘−𝛾 (1)
where 𝛾 is some exponent and 𝑃𝑑𝑒𝑔𝑟𝑒𝑒(𝑘) decays slowly as the degree 𝑘 increases, increasing the
probability of obtaining a node with a very high degree. Networks with power-law distributions
are called scale-free networks (Albert and Barabási 2002) that holds the same functional form
(power laws) at all scales. The power law 𝑃𝑑𝑒𝑔𝑟𝑒𝑒(𝑘) remains unchanged (other than a
multiplicative factor) when rescaling the independent variable 𝑘 by satisfying:
𝑃𝑑𝑒𝑔𝑟𝑒𝑒(𝑥𝑘) = 𝑥−𝛾 𝑃𝑑𝑒𝑔𝑟𝑒𝑒(𝑘) (2)
The presence of hubs that are orders of magnitude larger in degree than most other nodes is a
characteristic of power law networks. In this study, we test the scale free property both for the
activity frequency of all active nodes and the degree distribution of subgraphs being active at
different activity levels.

12
Transitivity
This property is a distinctive deviation from the properties of random graphs. Network transitivity
implies that two nodes are highly likely to be connected in a network, given each of the nodes are
connected to some other node. This is indicative of heightened number of triangles that exist in
real networks (sets of three nodes each of which is connected to each of the others) (Newman
2003). The existence of triangles can be quantified by Clustering Coefficient. C:
𝐶 = 3∗ 𝑁𝑢𝑚𝑏𝑒𝑟 𝑜𝑓 𝑡𝑟𝑖𝑎𝑛𝑔𝑙𝑒𝑠 𝑖𝑛 𝑡ℎ𝑒 𝑛𝑒𝑡𝑤𝑜𝑟𝑘
𝑁𝑢𝑚𝑏𝑒𝑟 𝑜𝑓 𝑐𝑜𝑛𝑛𝑒𝑐𝑡𝑒𝑑 𝑡𝑟𝑖𝑝𝑙𝑒𝑠 𝑜𝑓 𝑛𝑜𝑑𝑒𝑠 (3)
A connected triple refers to a single node with links running to an unordered pair of others. In case
of social networks, transitivity refers to the fact that the friend of one’s friend is likely also to be
the friend of that person. Another important notion is Network Density, frequently used in the
sociological literature (Scott 2012). The density is 0 for a graph without any link between nodes
and 1 for a completely connected graph.
Network Resilience
This property, related to degree distributions, refers to the resilience of networks as a result of
removing random nodes in the network and the level of resilience to such vertex removal varies
across networks depending on the network topology (Newman 2003). Networks in which most of
the nodes have low degree have less disruption since these nodes lie on few paths between others;
whereas removal of high degree nodes in a large real network can result in major disruption. The
usual length of these paths will increase if nodes are removed from a network, resulting in
disconnected pairs of nodes and making it more difficult for network agents to communicate.
Node-level Properties
Node Degree
The node degree is the number of edges adjacent to that node (𝑑𝑒𝑔𝑖). In-degree is the number of
edges pointing in to the node (𝑖𝑛_𝑑𝑒𝑔𝑖) and out-degree is the number of edges pointing out of the
node (𝑜𝑢𝑡_𝑑𝑒𝑔𝑖). Average neighbor degree refers average degree of the neighborhood (𝑧𝑛,𝑖) of
each node 𝑖 is:
𝑧𝑛,𝑖 = 1
|𝑁𝑖| ∑ 𝑧𝑗𝑗 ∈ 𝑁𝑖
(4)
where, 𝑁(𝑖) are the neighbors of node 𝑖 ; 𝑧𝑗 is the degree of node 𝑗 that belongs to 𝑁𝑖. In case of
weighted graphs, weighted degree of each node can be used (Barrat, Barthelemy et al. 2004).
Clustering Coefficient
In case of an unweighted graph, the clustering coefficient (𝑐𝑐𝑖) of a node 𝑖 refers to the fraction of
possible triangles that exist through that node:
𝑐𝑐𝑖 = 2 𝑇𝑖
𝑑𝑒𝑔𝑖∗[𝑑𝑒𝑔𝑖−1] (5)
where, 𝑇𝑖 is the number of triangles that exist through node 𝑖 and 𝑑𝑒𝑔𝑖 is the degree of node 𝑖. In
case of weighted graphs, this clustering coefficient can be defined as the geometric average of the
sub-graph edge weights (Saramäki, Kivelä et al. 2007). The eccentricity of node 𝑖 is the maximum
distance from node 𝑖 to every other nodes in the graph 𝐺 (𝑒𝑐𝑐𝑖).

13
Betweenness Centrality
Out of a number centrality measures, betweenness centrality (𝐵𝐶𝑖) of node 𝑖 is the sum of the
fraction of all-pairs of shortest path that pass through node 𝑖:
𝐵𝐶𝑖 = ∑𝜃(𝑥,𝑦 | 𝑗)
𝜃(𝑥,𝑦)𝑥,𝑦 ∈ 𝑉 (6)
where, 𝑉 is the set of nodes in 𝐺, 𝜃(𝑥,𝑦) is the number of shortest (𝑥, 𝑦) paths, and 𝜃(𝑥,𝑦 | 𝑗) is the
number of paths that pass through some node 𝑗 other than (𝑥, 𝑦). Please refer to (Brandes 2001,
Brandes and Pich 2007, Brandes 2008) for more details.
Closeness Centrality
The closeness centrality (𝐶𝐶𝑖) of node 𝑖 is the reciprocal of the sum of the shortest path distances
from node 𝑖 to all (𝑛 − 1) other nodes in the graph 𝐺:
𝐶𝐶𝑖 = 𝑛−1
∑ 𝜃(𝑗,𝑖)𝑛−1𝑗=1
(7)
where, 𝜃(𝑗,𝑖) is the shortest path distance between node 𝑗 and node 𝑖 and 𝑛 is the number of total
nodes in graph 𝐺. Closeness is normalized by the sum of minimum possible distances of (𝑛 − 1)
since the sum of the distances depend on the number of nodes in the graph. Higher values of
closeness imply higher centrality. Please refer to (Freeman 1978) for details.
Eigenvector Centrality
The eigenvector centrality (𝐸𝐶𝑖) computes the centrality for a node 𝑖 based on the centrality of its
neighbors. The eigenvector centrality for node 𝑖 is:
𝐴 𝑥 = 𝜆 𝑥 (8)
where 𝐴 is the adjacency matrix of the graph 𝐺 with eigenvalue 𝜆. Perron–Frobenius theorem
suggests that there is a unique and positive solution if 𝜆 is the largest eigenvalue associated with
the eigenvector of the adjacency matrix 𝐴 (Bonacich 1987, Newman 2010). Finally, degree
centrality for a node is just the fraction of nodes it is connected to.
Other Network Properties
Some other common properties are observed in many real networks such as mixing patterns
(selective linking), network homophily or similarity, degree correlations, preferential attachment,
community structure, network navigation, size of giant components among others (Newman
2003).
Edge-level Properties
Edge Betweenness Centrality
Compute betweenness centrality for edges. Betweenness centrality of an edge is the sum of the
fraction of all-pairs shortest paths that pass through :
where is the set of nodes, `sigma(s, t)` is the number of shortest -paths, and is
the number of those paths passing through edge (Brandes 2008)

14
Edge Current-flow Betweenness Centrality
Compute current-flow betweenness centrality for edges. Current-flow betweenness centrality uses
an electrical current model for information spreading in contrast to betweenness centrality which
uses shortest paths. Current-flow betweenness centrality is also known as random-walk
betweenness centrality (M. E. J. Newman 2005)
Edge Load Centrality
Compute load centrality for edges. The load centrality of a node is the fraction of all shortest paths
that pass through that edge.
Task 2 – Obtain Accurate FDOT Road and Bridge Network Data
4.3 What is GIS Modeling?
Geographic Information System (GIS) is a software designed to capture, store, manipulate,
analyze, manage, and present spatial or geographic data. It can convert statistical data, such as
accident and geographic (road and bridge locations) data into meaningful information for spatial
analysis and mapping (Ziari 2005). The GIS data model is a mathematical construct for the
representation of geographic objects or surfaces as data. For example, the vector data model
represents geography as a collection of dots, lines and polygons; the raster data model represents
geography as a cell matrix that stores numeric values; and the TIN data model represents
geography as a set of contiguous, non-overlapping triangles (Wade 2006). There are several
software to perform GIS modeling, such as QGIS, ArcGIS among others. QGIS is a professional
GIS application that is built as an open source software and supports numerous vector, raster, and
database formats and functionalities (QGIS 2020). Besides, ArcGIS offers unique capabilities and
flexible licensing for applying spatial analytics to gain greater insights using contextual tools to
visualize and analyze big data by collaborating and sharing maps, apps, dashboards and reports
(ArcGIS 2020). In ArcGIS, a data model defines the thematic layers used in the applications (e.g.
hamburger stands, highways, and counties); their spatial representation (e.g. point, line, or
polygon); their attributes; their rules of fairness and relationships (e.g. counties must nest inside
states); their cartographic representation; and their metadata specifications (Wade 2006). The data
models are stored in a shape file format, which is compatible with all GIS software. In this report,
the road shape file and the bridge location shape file of Miami-Dade County will be modeled to
perform the combined road-bridge network analysis.
4.4 Challenges in GIS Modeling
Increasingly, GIS is used in many disciplines to provide valuable insights into problems from
estimating the shortest path of a specific origin-destination to identifying the most influential link
of the road network. GIS software helps professionals make better use of GIS modeling when
evaluating locations or analyzing movement. Location analysis focuses on the common analysis
of suitability, used to address questions such as where the next store will be located, as well as
inadequacy analysis— analysis that determines places to be avoided as they have greater potential
for danger from threats such as flooding or fire. Study of movement involves not only humans or
animals, which requires a certain degree of decision-making, but also the movement of objects
such as water, which follows the path of least resistance. In either case, travel is modeled as a cost
surface and the analysis determines the least cost path, whether in terms of energy, time, distance
or some other metric. The analytical method is complicated since the questions posed are of a

15
subjective nature. It includes the concept of what the correct site is or which metric is most suitable
for cost calculation. Such decisions may be based on the modeler's own professional knowledge
of a particular topic, criteria or published work in that discipline, or on a consensus of experts in
the area (Mitchell 2012).
Tansel et al. utilized ArcGIS to develop and visualize an integrated network methodology to
identify the possible interactions between transportation infrastructure systems and pipeline
systems for water and sewer services (Tansel 2014). The researchers reported that about 3.15
square miles in downtown Miami is considered vulnerable for service interruptions which will
affect traffic flow significantly. Ziari and Khabiri developed a GIS model that generates contour
maps and identifies hot spots of pedestrians and bicyclists crash occurrence. The study presents
the development and findings of police reporting crash data and how they are used in the
Geographic Information System (GIS). Authors analyzed the crash information in towns,
provinces started with the Inner Ministry Traffic Organization considering access controls on
functionally categorized roads. Safety is prioritized here as a driving factor in the management of
access and crash reports are considered as the best indicator of the lack of safe routes (Ziari 2005).
4.5 Steps involved in Obtaining Shape Files
In this project, the Florida road and bridge network shape file is obtained from Florida Department
of Transportation (FDOT) websites’ Transportation Data and Analytics/GIS section (Figure 3).
Another source of road shape file is the Open Data Hub of Miami Dade county-GIS section (MDC
2020) as shown in Figure 2.
Figure 2 Open Data Hub of FDOT GIS section- Miami road network shape file source
16
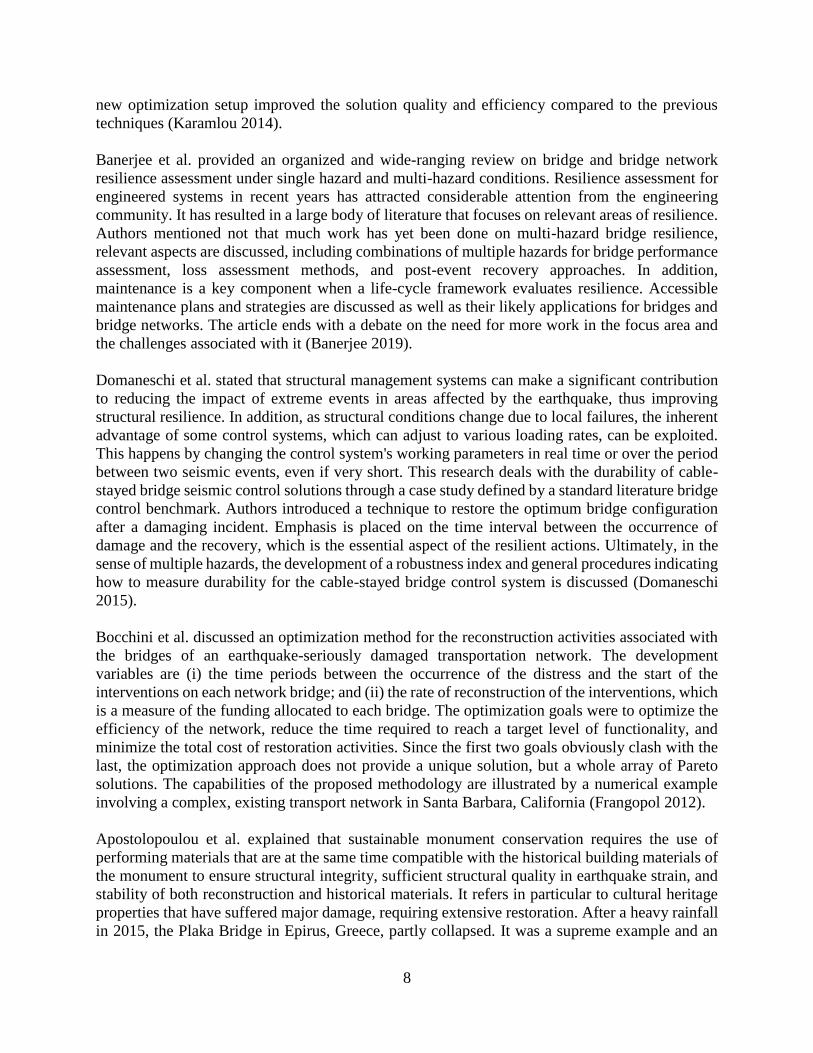
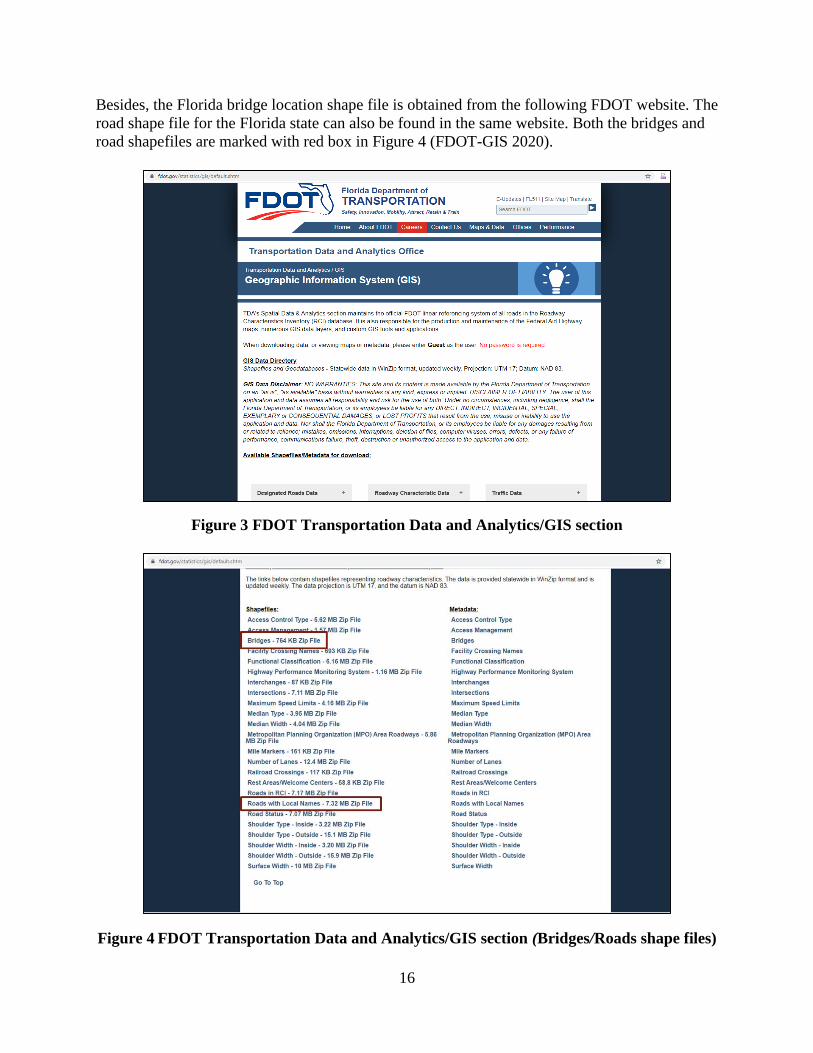
Besides, the Florida bridge location shape file is obtained from the following FDOT website. The
road shape file for the Florida state can also be found in the same website. Both the bridges and
road shapefiles are marked with red box in Figure 4 (FDOT-GIS 2020).
Figure 3 FDOT Transportation Data and Analytics/GIS section
Figure 4 FDOT Transportation Data and Analytics/GIS section (Bridges/Roads shape files)

17
4.6 Steps involved in Converting Shape Files to Network Readable Files
The shapefile is converted to network readable file by using a library of python programming
language named NetworkX. NetworkX is a python package for the creation, manipulation, and
study of the structure, dynamics, and functions of complex networks (NetworkX 2019).
The key steps involved in converting shape files to network readable file are summarized below-
At first, the road and bridge shape files of the State of Florida are superimposed to create
the combined road-bridge network shape file.
Then, python programming language is used to convert the shape file to network readable
file for network analysis.
NetworkX library in python language is used to convert the shape files.
NetworkX library converts the geolocation information of the road-bridge network
shapefile to a network graph, which contains the roads starting and end point information
by specific labelling.
This network graph is internally created within the python code; it is not necessary to
import the network graph as NetworkX library can directly analyze the graph.
Task 3 – Identify the Scale and Scope of the Bridge Network to be Inspected
4.7 Data Description
The shape file for the road network of Florida consist of all the freeways, highways and state roads
of the state. Besides, the Florida bridge location shape file covers all the bridges on these highways,
state roads and local roads. The scaling of the road-bridge network analysis with these shape files
will be done in three steps as following order-
1. Miami Beach bridge network
2. Miami-Dade County bridge network
3. State of Florida bridge network
Florida Road Network Shape file
The Florida road network shape file is a polyline shape file and contains very useful and authentic
information about the roadways of the whole State of Florida. All the information is stored in a
database which is accessible through the Attribute Table. From the Figure 5, it can be observed
that the roadway names are available according to the road location and local place. Besides, the
roadway numbers, assigned by FDOT are also available along with the county name, ZIP code and
roadway direction (eastbound, westbound, southbound and northbound).

18
Figure 5 Florida Road Network
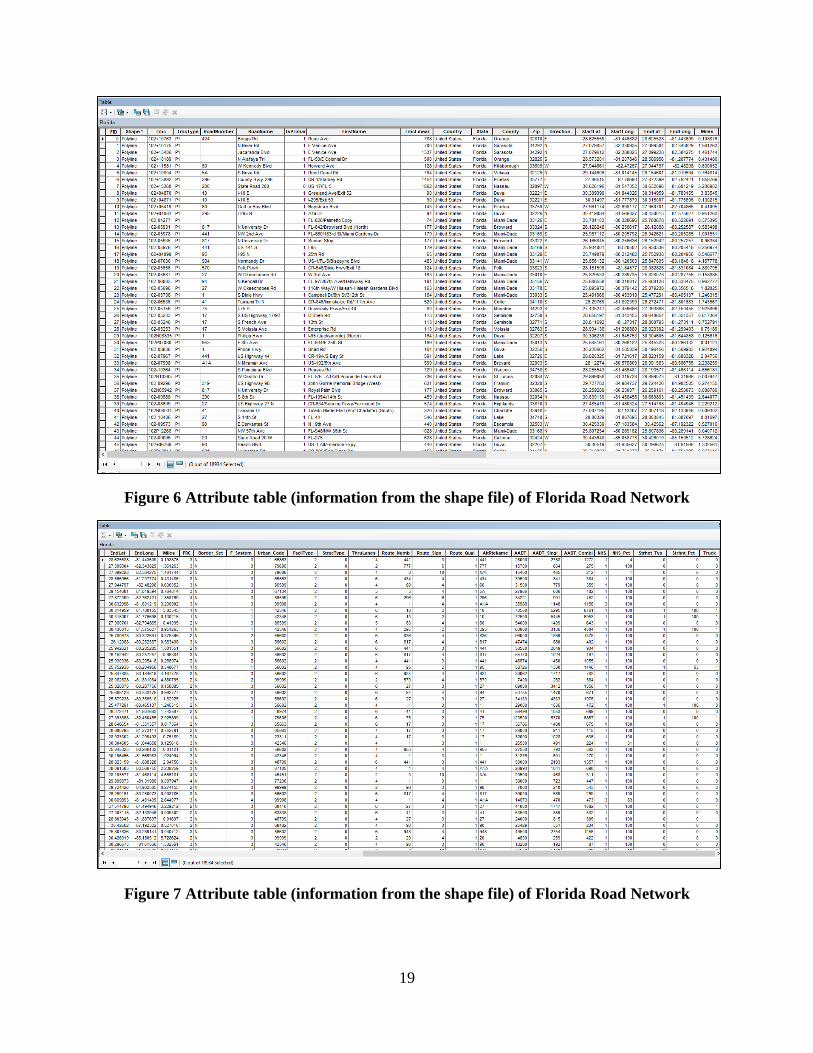
The most important information for the road and bridge network analysis is the specific
geolocations (coordinates) of the starting point and end point of each roadway segment, which is
available with the length of these segments. From the Figure 6 and Figure 7, it is found that there
are approximately 19,000 roadway segment information is existing in the shape file. Then, the
route number (for an example the name of the 8th street is US 41 according to the route number),
number of lanes and Average Annual Daily Traffic (AADT) counts are also obtainable from the
attribute table of the shape file.
19
Figure 6 Attribute table (information from the shape file) of Florida Road Network
Figure 7 Attribute table (information from the shape file) of Florida Road Network
20
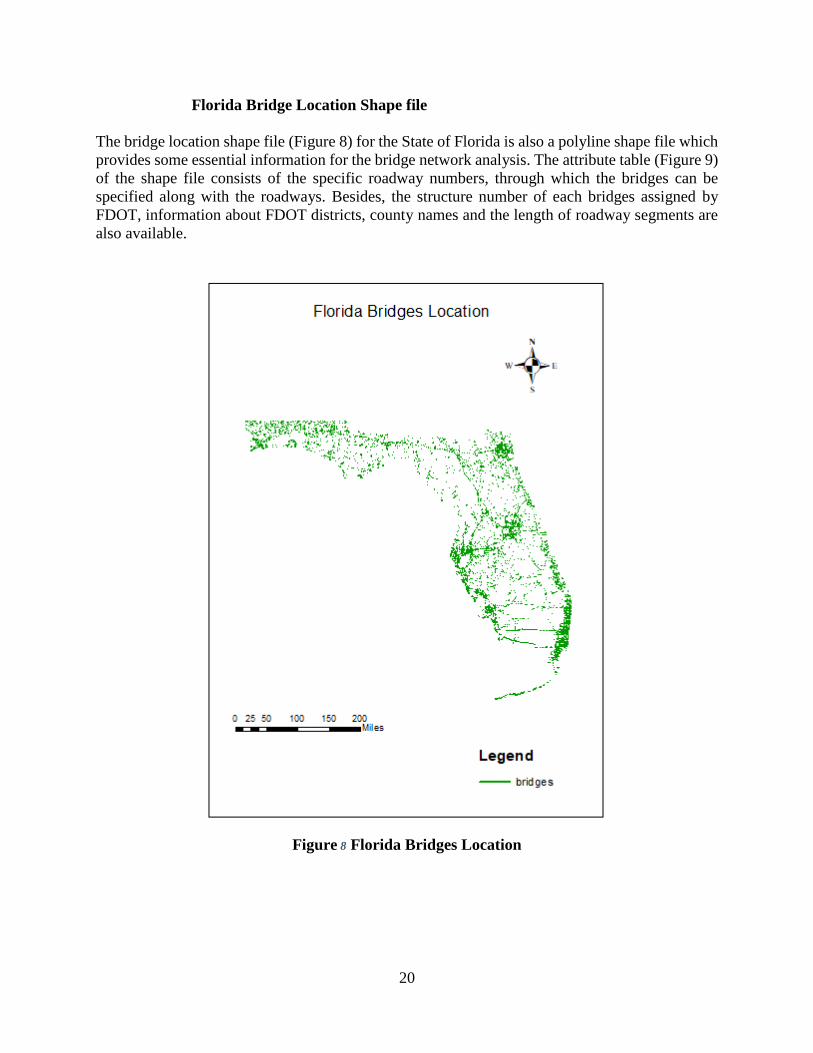
Florida Bridge Location Shape file
The bridge location shape file (Figure 8) for the State of Florida is also a polyline shape file which
provides some essential information for the bridge network analysis. The attribute table (Figure 9)
of the shape file consists of the specific roadway numbers, through which the bridges can be
specified along with the roadways. Besides, the structure number of each bridges assigned by
FDOT, information about FDOT districts, county names and the length of roadway segments are
also available.
Figure 8 Florida Bridges Location

21
Figure 9 Attribute table (information from the shape file) of Florida Bridge Location
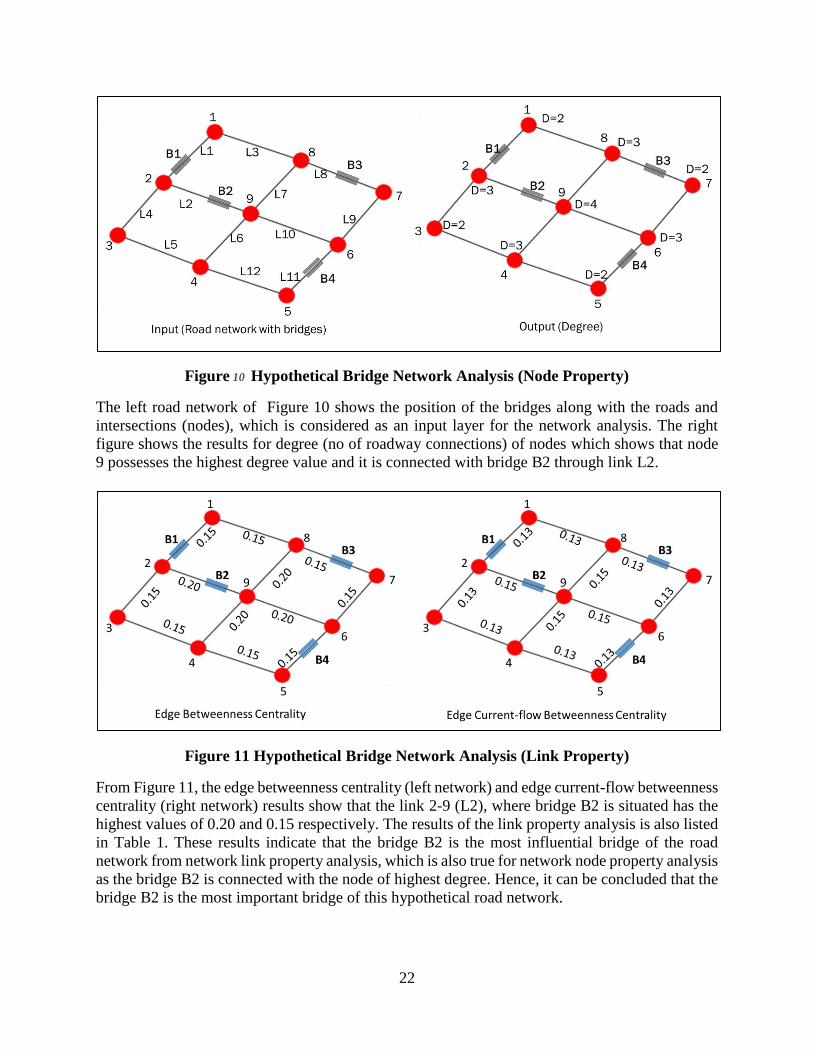
4.8 Hypothetical Bridge Network Analysis
To understand the essence of bridge network analysis through different network parameters
(degree, centrality) explained before, a hypothetical road-bridge network is considered here as
shown in Figure 10. The road-bridge network is a 3x3 network with 9 nodes (roadway
intersection), 12 links or roadways (L1-L12) and 4 bridges (B1-B4). The main objective of this
sample analysis is to find the most influential bridge by analyzing node and link properties of this
road network. The higher the values of node (degree) and link properties (edge betweenness
centrality and edge current-flow betweenness centrality) of the bridge, the more influential it is for
the whole network.
22
Figure 10 Hypothetical Bridge Network Analysis (Node Property)
The left road network of Figure 10 shows the position of the bridges along with the roads and
intersections (nodes), which is considered as an input layer for the network analysis. The right
figure shows the results for degree (no of roadway connections) of nodes which shows that node
9 possesses the highest degree value and it is connected with bridge B2 through link L2.
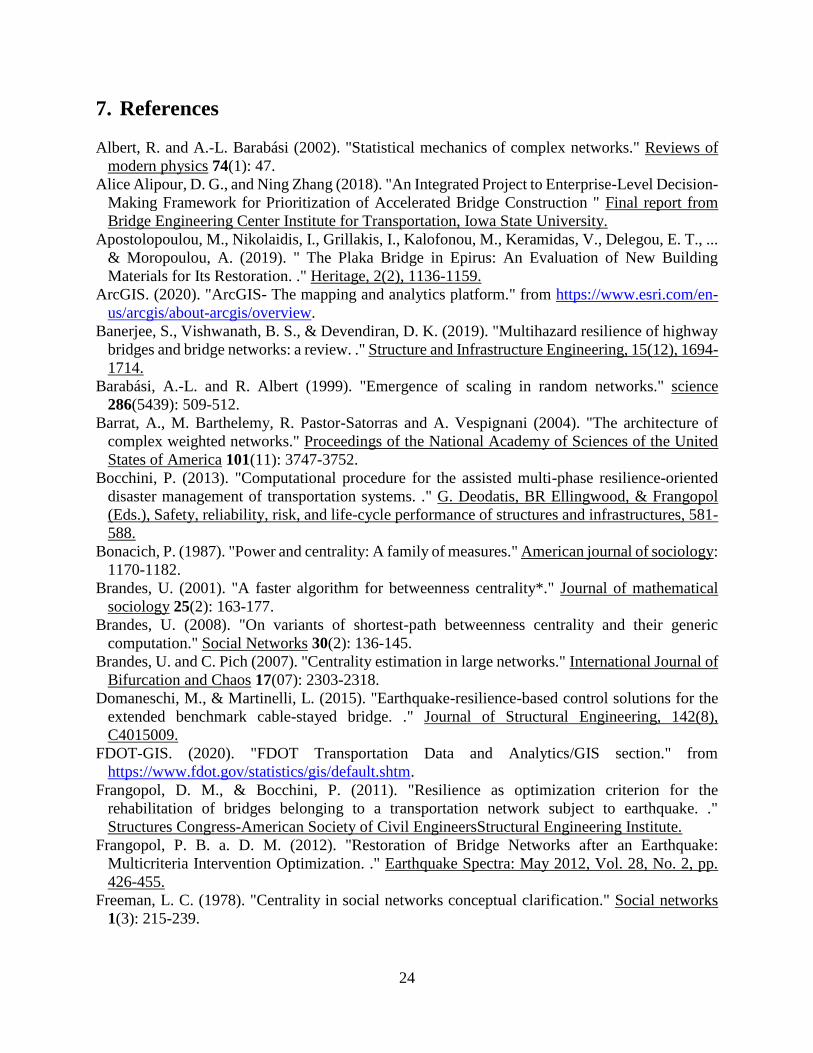
Figure 11 Hypothetical Bridge Network Analysis (Link Property)
From Figure 11, the edge betweenness centrality (left network) and edge current-flow betweenness
centrality (right network) results show that the link 2-9 (L2), where bridge B2 is situated has the
highest values of 0.20 and 0.15 respectively. The results of the link property analysis is also listed
in Table 1. These results indicate that the bridge B2 is the most influential bridge of the road
network from network link property analysis, which is also true for network node property analysis
as the bridge B2 is connected with the node of highest degree. Hence, it can be concluded that the
bridge B2 is the most important bridge of this hypothetical road network.

23
Table 1 Results of Hypothetical Bridge Network Link Property Analysis
Link Bridge Edge betweenness
centrality
Edge current-flow
betweenness centrality
1-2 (L1) B1 0.15 0.13
2-3 (L4) 0.15 0.13
3-4 (L5) 0.15 0.13
4-5 (L12) 0.15 0.13
5-6 (L11) B4 0.15 0.13
6-7 (L9) 0.15 0.13
7-8 (L8) B3 0.15 0.13
8-1 (L3) 0.15 0.13
2-9 (L2) B2 0.20 0.15
4-9 (L6) 0.20 0.15
6-9 (L10) 0.20 0.15
8-9 (L7) 0.20 0.15
5. Expected Results and Specific Deliverables
We plan to complete Task 3 in the next deliverable and finalize the scale and scope of the bridge
network to be inspected to conduct preliminary network analysis. We will also conduct the network
analysis for small networks and interpret the results. The expected future tasks are listed below:
Task 1 – Literature Review
Task 2 – Obtain Accurate FDOT Road and Bridge Network Data
Task 3 – Identify the Scale and Scope of the Bridge Network to be Inspected
Task 4 – Perform Network Experiments and Analyses
Task 5 – Compilation of Results and Reporting
6. Schedule Progress of tasks in this project is shown in the table below.
Item % Completed
Percentage of Completion of this project to Date 45
Task No. Task Description
O N D J F M A M J J A S O N D J F M
Task 1 Comprehensive Literature Review
Task 2 Obtain Accurate FDOT Road and Bridge Network Data
Task 3 Identify the Scale and Scope of the Bridge Network to be Inspected
Task 4 Perform Network Experiments and Analyses
Task 5 Compilation of Results and Reporting
Work Performed
Work to be Performed
2019 2020 2021
24
7. References
Albert, R. and A.-L. Barabási (2002). "Statistical mechanics of complex networks." Reviews of
modern physics 74(1): 47.
Alice Alipour, D. G., and Ning Zhang (2018). "An Integrated Project to Enterprise-Level Decision-
Making Framework for Prioritization of Accelerated Bridge Construction " Final report from
Bridge Engineering Center Institute for Transportation, Iowa State University.
Apostolopoulou, M., Nikolaidis, I., Grillakis, I., Kalofonou, M., Keramidas, V., Delegou, E. T., ...
& Moropoulou, A. (2019). " The Plaka Bridge in Epirus: An Evaluation of New Building
Materials for Its Restoration. ." Heritage, 2(2), 1136-1159.
ArcGIS. (2020). "ArcGIS- The mapping and analytics platform." from https://www.esri.com/en-
us/arcgis/about-arcgis/overview.
Banerjee, S., Vishwanath, B. S., & Devendiran, D. K. (2019). "Multihazard resilience of highway
bridges and bridge networks: a review. ." Structure and Infrastructure Engineering, 15(12), 1694-
1714.
Barabási, A.-L. and R. Albert (1999). "Emergence of scaling in random networks." science
286(5439): 509-512.
Barrat, A., M. Barthelemy, R. Pastor-Satorras and A. Vespignani (2004). "The architecture of
complex weighted networks." Proceedings of the National Academy of Sciences of the United
States of America 101(11): 3747-3752.
Bocchini, P. (2013). "Computational procedure for the assisted multi-phase resilience-oriented
disaster management of transportation systems. ." G. Deodatis, BR Ellingwood, & Frangopol
(Eds.), Safety, reliability, risk, and life-cycle performance of structures and infrastructures, 581-
588.
Bonacich, P. (1987). "Power and centrality: A family of measures." American journal of sociology:
1170-1182.
Brandes, U. (2001). "A faster algorithm for betweenness centrality*." Journal of mathematical
sociology 25(2): 163-177.
Brandes, U. (2008). "On variants of shortest-path betweenness centrality and their generic
computation." Social Networks 30(2): 136-145.
Brandes, U. and C. Pich (2007). "Centrality estimation in large networks." International Journal of
Bifurcation and Chaos 17(07): 2303-2318.
Domaneschi, M., & Martinelli, L. (2015). "Earthquake-resilience-based control solutions for the
extended benchmark cable-stayed bridge. ." Journal of Structural Engineering, 142(8),
C4015009.
FDOT-GIS. (2020). "FDOT Transportation Data and Analytics/GIS section." from
https://www.fdot.gov/statistics/gis/default.shtm.
Frangopol, D. M., & Bocchini, P. (2011). "Resilience as optimization criterion for the
rehabilitation of bridges belonging to a transportation network subject to earthquake. ."
Structures Congress-American Society of Civil EngineersStructural Engineering Institute.
Frangopol, P. B. a. D. M. (2012). "Restoration of Bridge Networks after an Earthquake:
Multicriteria Intervention Optimization. ." Earthquake Spectra: May 2012, Vol. 28, No. 2, pp.
426-455.
Freeman, L. C. (1978). "Centrality in social networks conceptual clarification." Social networks
1(3): 215-239.
25
Hasan, S. and S. V. Ukkusuri (2011). "A threshold model of social contagion process for
evacuation decision making." Transportation research part B: methodological 45(10): 1590-
1605.
Karamlou, A., & Bocchini, P. (2014). " Optimal bridge restoration sequence for resilient
transportation networks. ." In Structures congress (Vol. 2014, pp. 1437-1447).
Karamlou, A., & Bocchini, P. (2014). "Optimal bridge restoration sequence for resilient
transportation networks." In Structures Congress 2014 (pp. 1437-1447).
M. E. J. Newman (2005). "A measure of betweenness centrality based on random walks, Social
Networks 27, 39-54."
Machado-León, J. L., & Goodchild, A. (2017). " Review of Performance Metrics for Community-
Based Planning for Resilience of the Transportation System. ." Transportation Research Record,
2604(1), 44-53.
MDC. (2020). "Open Data Hub." from https://gis-
mdc.opendata.arcgis.com/datasets/8bc234275dc749329c4e242abcfc5a0f_0?geometry=-
82.781%2C25.163%2C-78.213%2C26.030.
Milgram, S. (1967). "The small world problem." Psychology today 2(1): 60-67.
Mitchell, A. (2012). "GIS Modeling Explained and Explored
Modeling Suitability, Movement, and Interaction
", from https://www.esri.com/news/arcuser/1012/gis-modeling-explained-and-explored.html.
NetworkX. (2019). "NetworkX- Software for complex networks." from
https://networkx.github.io/.
Newman, M. (2010). Networks: an introduction, Oxford university press.
Newman, M. E. (2003). "The structure and function of complex networks." SIAM review 45(2):
167-256.
Pritchard, R. W. (2013). "2011 to 2012 Queensland Floods and Cyclone Events: Lessons Learnt
for Bridge Transport Infrastructure, ." Australian Journal of Structural Engineering, 14:2, 167-
176, DOI: 10.7158/13287982.2013.11465130.
QGIS. (2020). "Discover QGIS." from https://www.qgis.org/en/site/about/index.html.
Saramäki, J., M. Kivelä, J.-P. Onnela, K. Kaski and J. Kertesz (2007). "Generalizations of the
clustering coefficient to weighted complex networks." Physical Review E 75(2): 027105.
Scott, J. (2012). Social network analysis, Sage.
Setunge, S. a. L., Weena and Mohseni, Hessam and Karunasena, Warna (2014). "Vulnerability of
road bridge infrastructure under extreme flood events. ." AFAC and Bushfire and Natural
Hazards CRC Conference 2014, 2-5 Sept 2014, Wellington, New Zealand.
Shane, A. A. a. J. ( 2018). "Development of Guidelines to Establish Effective and Efficient
Timelines and Incentives for ABC; ." Final report from Bridge Engineering Center Institute for
Transportation, Iowa State University.
Sun, W., Bocchini, P., & Davison, B. D. (2018). "Resilience metrics and measurement methods
for transportation infrastructure: the state of the art. ." Sustainable and Resilient Infrastructure,
1-32.
Tansel, B., Shams, K., Jin, X., & Gan, A. (2014). "Interactive Vulnerability of Transportation and
Pipeline Networks: GIS-Based Quantitative Risk Assessment (No. 14-1430).".
Tao, W., & Wang, N. (2019). " A Novel Markovian Framework for Optimum Maintenance of
Deteriorating Bridges in Earthquake-prone Areas." 13th International Conference on
Applications of Statistics and Probability in Civil Engineering(ICASP13), Seoul, South Korea,
May 26-30, 2019.

26
Travers, J. and S. Milgram (1969). "An experimental study of the small world problem."
Sociometry: 425-443.
Twumasi-Boakye, R., & Sobanjo, J. O. (2018). "Resilience of Regional Transportation Networks
Subjected to Hazard-Induced Bridge Damages. ." Journal of Transportation Engineering, Part A:
Systems, 144(10), 04018062.
Wade, T. a. S., S. eds. (2006). A to Z GIS.
Wade, T. S., Shelly, eds. (2006). "A to Z GIS: An Illustrated Dictionary of Geographic Information
Systems (2nd ed.). ." Redlands, Calif: Esri Press. ISBN 9781589481404.
Watts, D. J. and S. H. Strogatz (1998). "Collective dynamics of ‘small-world’networks." nature
393(6684): 440-442.
Weili Zhang, N. W. C. N. (2017). "Resilience-based post-disaster recovery strategies for road-
bridge networks." Structure and Infrastructure Engineering, 13:11, 1404-1413, DOI:
10.1080/15732479.2016.1271813.
Zhang, W., Wang, N., & Nicholson, C. (2017). "Resilience-based post-disaster recovery strategies
for road-bridge networks. ." Structure and Infrastructure Engineering, 13(11), 1404-1413.
Zhang, W., Wang, N., Nicholsonc, C., & Tehrani, M. H. (2018). "A Stage-wise Decision
Framework for Transportation Network Resilience Planning. ." arXiv preprint
arXiv:1808.03850.
Ziari, H., & Khabiri, M. M. (2005). " Applied GIS software for improving pedestrian & bicycle
safety. ." Transport, 20(4), 160-164.