Completion Report - Asian Development Bank · CBM – community-based management ... RAC –...
107
Completion Report Project Number: 32176 Loan Number: 1962-INO (SF) November 2012 Indonesia: Coral Reef Rehabilitation and Management Project Phase II
-
Upload
vuongtuyen -
Category
Documents
-
view
218 -
download
3
Transcript of Completion Report - Asian Development Bank · CBM – community-based management ... RAC –...
Completion Report
Project Number: 32176 Loan Number: 1962-INO (SF) November 2012
Indonesia: Coral Reef Rehabilitation and Management Project Phase II

CURRENCY EQUIVALENTS
Currency Unit – Rupiah (Rp)
At Appraisal At Project Completion (31 October 2002) (6 July 2012)
Rp1.00 = $0.000108 $0.000107 $1.00 = Rp9,240 Rp9,380
ABBREVIATIONS
ADB – Asian Development Bank AIG – alternative income generation BAPPEDA – Badan Perencanaan Pembangunan Daerah (Regional Development Planning Agency) BAPPENAS – Badan Perencanaan Pembangunan Nasional (National Development Planning Agency) BME – benefit monitoring and evaluation CBM – community-based management CBO – community-based organization COREMAP – coral reef rehabilitation and management CPUE – catch per unit effort CREEL – coral reef fish biomass, biodiversity, and fishing effort CRITC – coral reef information and training center CRMP – coral reef management plan CTI – Coral Triangle Initiative DGMCSI – Directorate General of Marine, Coastal, and Small Islands DIPA – Daftar Isian Pelaksanaan Anggaran
(List of Items for Budget Implementation) EIRR
EMMP FIRR
– _ –
economic internal rate of return environment management and monitoring plan financial internal rate of return
GIS – geographic information system ha – hectare HRD – human resource development IEC – information, education, and communication LIPI – Lembaga Ilmu Pengetahuan Indonesia (Indonesian Institute of Sciences) LPSTK – Lembaga Pengelola Sumberdaya Terumbu Karang (Coral Reef Management Body) MCS – monitoring, control, and surveillance MMA – marine management area MMAF – Ministry of Marine Affairs and Fisheries MOF – Ministry of Finance MPA – marine protected area NGO – nongovernment organization NPV – net present value NSC – national steering committee PCR – project completion review PIU – project implementing unit PMC – project management consultant

PMO – project management office PPMS – project performance monitoring system RAC – regional advisory committee RCU – regional coordinating unit RMMA – regional marine management area SDR – special drawing rights SOE – statement of expenditures
GLOSSARY
dinas Kelautan Dan Perikanan
– provincial/district Marine Affairs and Fisheries Service
mulok – guidebook with local content pokmas – village group pokmaswas – surveillance group
NOTES
(i) The fiscal year (FY) of the government ends on 31 December.
(ii) In this report, ―$‖ refers to US dollars. Vice-President S. Groff, Operations 2 Director General K. Senga, Southeast Asia Department (SERD) Director J. H. Mir, Environment, Natural Resources, and Agriculture Division
(SEER) Team leader M. Nasimul Islam, Water Resources Specialist, SEER Team member E. T. Tayao-Castro, Project Analyst, SEER
In preparing any country program or strategy, financing any project, or by making any designation of or reference to a particular territory or geographic area in this document, the Asian Development Bank does not intend to make any judgments as to the legal or other status of any territory or area.
CONTENTS
Page
BASIC DATA iii
I. PROJECT DESCRIPTION 1
II. EVALUATION OF DESIGN AND IMPLEMENTATION 1
A. Relevance of Design and Formulation 1 B. Project Outputs 2 C. Project Costs 6 D. Disbursements 7 E. Project Schedule 7 F. Implementation Arrangements 8 G. Conditions and Covenants 8 H. Consultant Recruitment and Procurement 9 I. Performance of Consultants, Contractors, and Suppliers 9 J. Performance of the Borrower and the Executing Agency 10 K. Performance of the Asian Development Bank 10
III. EVALUATION OF PERFORMANCE 11
A. Relevance 11 B. Effectiveness in Achieving Outcome 11 C. Efficiency in Achieving Outcome and Outputs 12 D. Preliminary Assessment of Sustainability 12 E. Impact 12
IV. OVERALL ASSESSMENT AND RECOMMENDATIONS 13
A. Overall Assessment 13 B. Lessons 14 C. Recommendations 14
APPENDIXES 1. Project Performance against Initial Design Framework 16 2. Strategic Plans and Regulations on Coral Reef Management 36 3. Coral Reefs and Associated Ecosystems in Marine Management Areas by District 37 4. Summary of Research Conducted Under COREMAP II 38 5. Summary of Training Participants Under COREMAP II 40 6. Summary of LPSTK Management and Recipients of Alternative Livelihood Projects by Gender 41 7. Social Infrastructure Facilities Provided Under COREMAP II 43 8. Alternative Income-Generating Projects 44 9. Trend of Average Household Income by District 47 10. Appraisal Estimates and Actual Costs 48 11. Planned and Actual Disbursement 50 12. Funds Flow Arrangement 51 13. Planned and Actual Implementation Schedule 52 14. Project Organization 55

ii
15. Status of Compliance with Loan Covenants 56 16. Percent Live Coral Cover by District 73 17. Catch per Unit Effort by District 74 18. Trend of Average Income Per Capita by District 75 19. Financial and Economic Analyses 76 20. Project Overall Assessment 95
iii
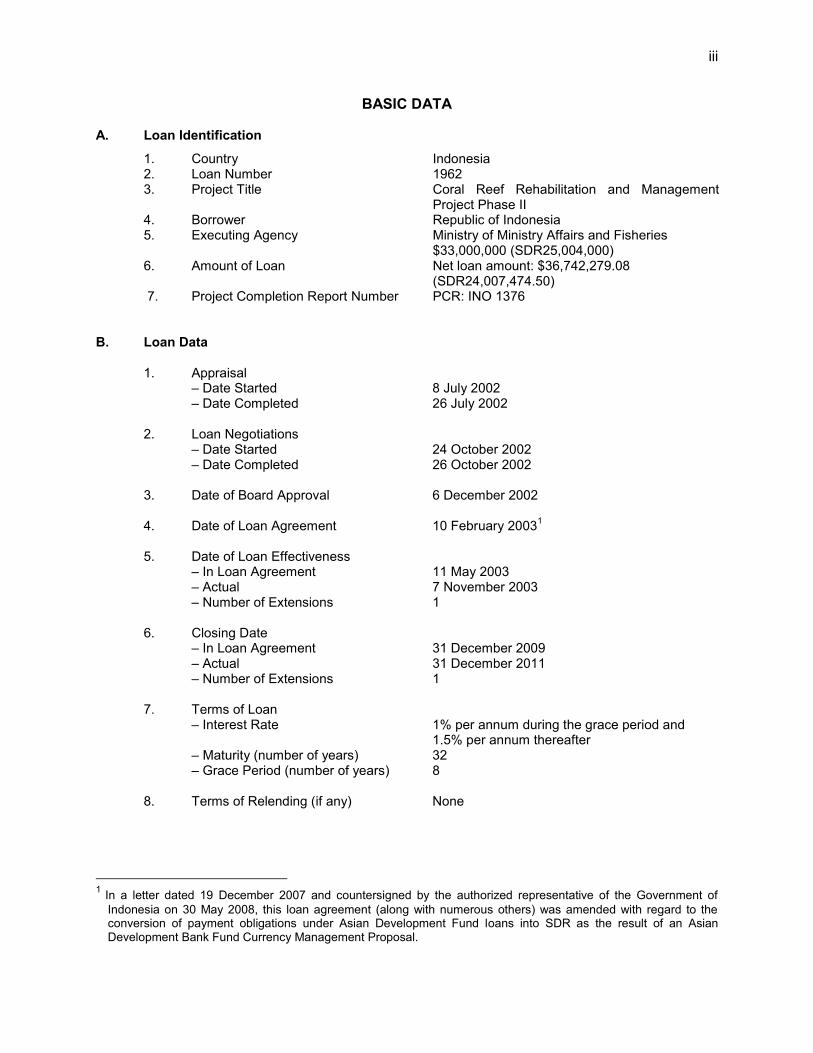
BASIC DATA
A. Loan Identification
1. Country 2. Loan Number 3. Project Title 4. Borrower 5. Executing Agency 6. Amount of Loan 7. Project Completion Report Number
Indonesia 1962 Coral Reef Rehabilitation and Management Project Phase II Republic of Indonesia Ministry of Ministry Affairs and Fisheries $33,000,000 (SDR25,004,000) Net loan amount: $36,742,279.08 (SDR24,007,474.50) PCR: INO 1376
B. Loan Data 1. Appraisal – Date Started – Date Completed 2. Loan Negotiations – Date Started – Date Completed 3. Date of Board Approval 4. Date of Loan Agreement 5. Date of Loan Effectiveness – In Loan Agreement – Actual – Number of Extensions 6. Closing Date – In Loan Agreement – Actual – Number of Extensions 7. Terms of Loan – Interest Rate – Maturity (number of years) – Grace Period (number of years) 8. Terms of Relending (if any)
8 July 2002 26 July 2002 24 October 2002 26 October 2002 6 December 2002 10 February 20031
11 May 2003 7 November 2003 1 31 December 2009 31 December 2011 1 1% per annum during the grace period and 1.5% per annum thereafter 32 8 None
1 In a letter dated 19 December 2007 and countersigned by the authorized representative of the Government of
Indonesia on 30 May 2008, this loan agreement (along with numerous others) was amended with regard to the conversion of payment obligations under Asian Development Fund loans into SDR as the result of an Asian Development Bank Fund Currency Management Proposal.

iv
9. Disbursements a. Dates Initial Disbursement
25 March 2004
Effective Date
7 November 2003
Effective Date
7 November 2003
Final Disbursement
1 August 2012
Original Closing Date
31 December 2009
Revised Closing Date
31 December 2011
Time Interval
102 months
Time Interval
75 months
Time Interval
99 months
b. Amount ($) Cat. Original Last Revised Amount Amount No. Description Allocationa Allocation Canceledb Disbursed 01 Civil Works 5,469,794 2,804,350 2,665,444 2,804,350
01A Civil Works (in Mentawai) 0 283,176 (283,176) 283,176
02 Materials 2,924,538 4,947,328 (2,022,790) 4,947,328 03 Studies and Surveys 4,157,206 5,777,657 (1,620,451) 5,777,657 04A Vehicles 493,067 362,818 130,249 362,818
04B Office and Field Equipment 2,771,471 2,631,507 139,964 2,631,507
04C Patrol Boats (MCS/CBM) 1,118,883 598,636 520,247 598,636
05A Consulting Services (PMO Consultants) 2,565,575 3,201,702 (636,127) 3,201,702
05B Consulting Services (CRITC Consultants) 923,824 700,676 223,148 700,676
06A Overseas Training 327,808 409,763 (81,955) 409,763 06B In-country Training 4,670,591 5,444,348 (773,757) 5,444,348 07 Extension Services 2,585,893 4,909,072 (2,323,179) 4,909,072
08 NGO and Academic Institution Contracts 1,315,297 1,570,772 (255,475) 1,570,772
09 Interest Charge 697,609 788,811 (91,202) 788,811 10 Unallocated 3,848,362 0 3,848,362 0 11 Tsunami Assistance 0 2,311,664 (2,311,664) 2,311,664 Total 33,869,918 36,742,280 (2,872,362) 36,742,280 a Original Allocation figures were based on Controller‘s memo dated 21 January 2003 from Loan Financial
Information System – Loan Profile. b The only partial cancellation was SDR996,525.50 ($1,505,162.08 equivalent) on 1 August 2012.

v
(in SDR) Cat. Original Last Revised Amount Amount No. Description Allocation Allocation Canceleda Disbursed 01 Civil Works 4,038,000 1,792,972 2,245,028 1,792,972 01A Civil Works (in
Mentawai) 0 180,964 (180,964) 180,964 02 Materials 2,159,000 3,185,208 (1,026,208) 3,185,208 03 Studies and Surveys 3,069,000 3,781,867 (712,867) 3,781,867 04A Vehicles 364,000 244,555 119,445 244,555 04B Office and Field
Equipment 2,046,000 1,754,475 291,525 1,754,475 04C Patrol boats (MCS/CBM) 826,000 390,883 435,117 390,883 05A Consulting Services
(PMO Consultants) 1,894,000 2,106,518 (212,518) 2,106,518 05B Consulting Services
(CRITC Consultants) 682,000 472,200 209,800 472,200 06A Overseas Training 242,000 268,161 (26,161) 268,161 06B In-country Training 3,448,000 3,551,386 (103,386) 3,551,386 07 Extension Services 1,909,000 3,170,576 (1,261,576) 3,170,576 08 NGO and Academic
Institution Contracts 971,000 1,028,956 (57,956) 1,028,956 09 Interest Charge 515,000 515,000 0 515,000 10 Unallocated 2,841,000 0 2,841,000 0 11 Tsunami Assistance 0 1,563,752 (1,563,752) 1,563,752 Total 25,004,000 24,007,473 996,527 24,007,473 a The only partial cancellation was SDR996,525.50 ($1,505,162.08 equivalent) on 1 August 2012.
10. Local Costs (Financed) - Amount ($) 27,367,369 - Percent of Local Costs 96.72% - Percent of Total Cost 72.65% C. Project Data
1. Project Cost ($‘000) Cost Appraisal Estimate Actual
Foreign Exchange Cost 8,270 9,375 Local Currency Cost 32,980 28,296 Total 41,250 37,671
2. Financing Plan ($‘000)
Cost Appraisal Estimate Actual Implementation Costs Borrower-Financed 8,250 929 ADB-Financed 32,320 35,953 Other External Financing 0 0 Total 40,570 36,882 IDC Costs Borrower-Financed 0 0 ADB-Financed 680 789 Other External Financing 0 0 Total 41,250 37,671
vi
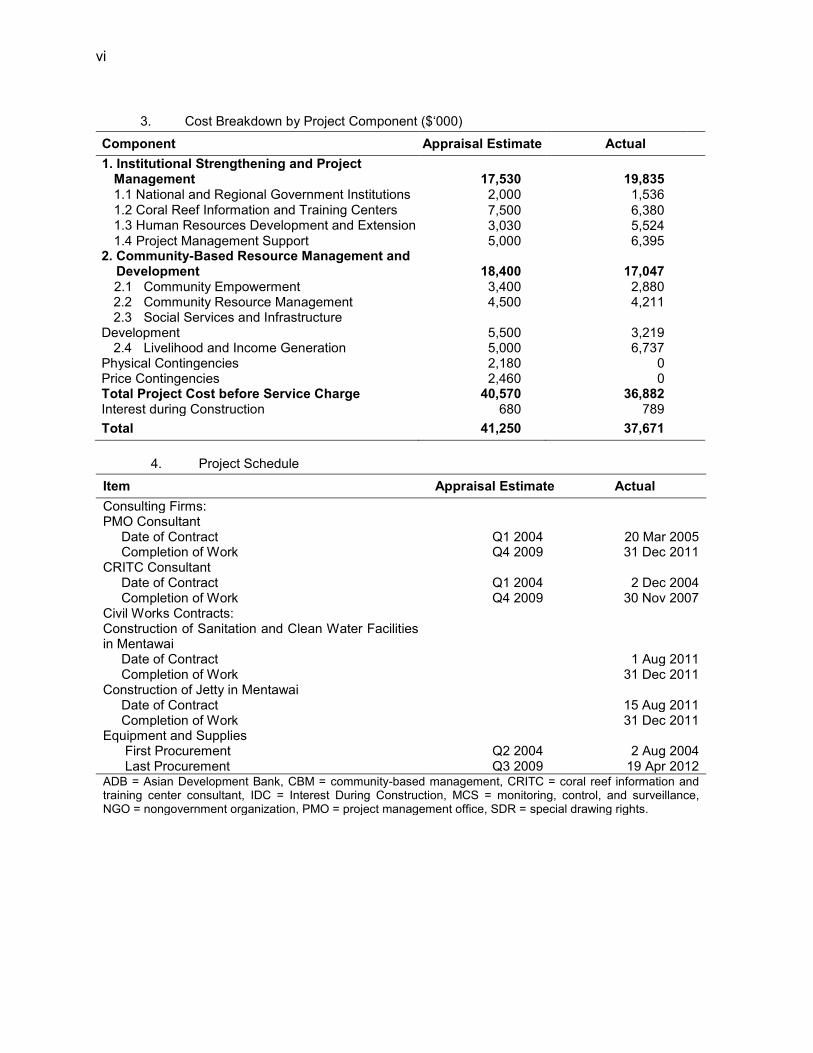
3. Cost Breakdown by Project Component ($‘000)
Component Appraisal Estimate Actual 1. Institutional Strengthening and Project
Management 17,530 19,835
1.1 National and Regional Government Institutions 2,000 1,536 1.2 Coral Reef Information and Training Centers 1.3 Human Resources Development and Extension
7,500 3,030
6,380 5,524
1.4 Project Management Support 5,000 6,395 2. Community-Based Resource Management and Development 18,400 17,047
2.1 Community Empowerment 2.2 Community Resource Management 2.3 Social Services and Infrastructure
Development 2.4 Livelihood and Income Generation
3,400 4,500
5,500 5,000
2,880 4,211
3,219 6,737
Physical Contingencies 2,180 0 Price Contingencies 2,460 0 Total Project Cost before Service Charge 40,570 36,882 Interest during Construction 680 789 Total 41,250 37,671
4. Project Schedule
Item Appraisal Estimate Actual Consulting Firms: PMO Consultant Date of Contract
Q1 2004
20 Mar 2005
Completion of Work Q4 2009 31 Dec 2011 CRITC Consultant Date of Contract Q1 2004 2 Dec 2004 Completion of Work Q4 2009 30 Nov 2007 Civil Works Contracts: Construction of Sanitation and Clean Water Facilities in Mentawai
Date of Contract 1 Aug 2011 Completion of Work 31 Dec 2011 Construction of Jetty in Mentawai Date of Contract 15 Aug 2011 Completion of Work 31 Dec 2011 Equipment and Supplies First Procurement Q2 2004 2 Aug 2004 Last Procurement Q3 2009 19 Apr 2012 ADB = Asian Development Bank, CBM = community-based management, CRITC = coral reef information and training center consultant, IDC = Interest During Construction, MCS = monitoring, control, and surveillance, NGO = nongovernment organization, PMO = project management office, SDR = special drawing rights.

vii
5. Project Performance Report Ratings Implementation Period
Ratings
Development Objectives
Implementation Progress
31 December 2002 to 31 July 2003 31 August 2003 to 30 November 2003 31 December 2003 to 31 December 2011
Satisfactory Satisfactory Satisfactory
Satisfactory Unsatisfactory
Satisfactory D. Data on Asian Development Bank Missions
Name of Mission
Date
No. of Persons
No. of Person-Days
Specialization of Membersa
Inception 5–12 Dec 2003 2 16 a, b Loan Review No. 1 18–29 Oct 2004 2 24 c, d Loan Review No. 2 30 Jan–9 Feb 2006 2 22 b, e Loan Review No. 3 19 Feb–2 Mar 2007 2 24 f, g Midterm Review 11–22 Feb 2008 3 33 f, g, h Loan Review No. 4 27 Oct–7 Nov 2008 2 24 f, g Loan Review No. 5 15–25 Nov 2009 2 22 f, j Loan Review No. 6 12–23 Apr 2010 3 28 f, i, j Loan Review No. 7 18–30 Nov 2010 2 26 i, k Loan Review No. 8 12–31 Mar 2011 2 40 i, k Loan Review No. 9 17–31 Oct 2011 2 23 i, k Project Completion Review 6 Jun–6 Jul 2012 4 47 g, k, l, m Total 329 a a = senior agriculture and natural resource management specialist, b = national officer , c = agriculture and natural
resource management specialist, d = assistant project analyst, e = environment specialist, f = project officer, g = environmental engineer, h = staff consultant, i = water resources management specialist, j = director, k = project analyst, l = international staff consultant, m = national staff consultant.

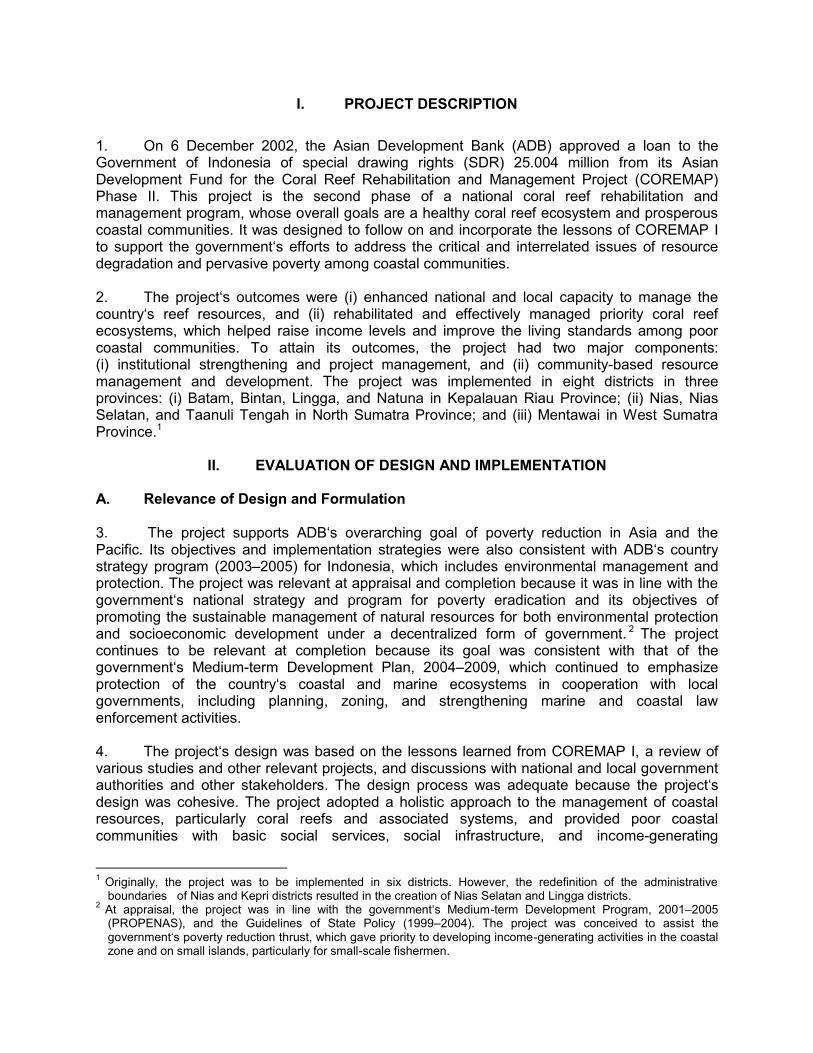
I. PROJECT DESCRIPTION 1. On 6 December 2002, the Asian Development Bank (ADB) approved a loan to the Government of Indonesia of special drawing rights (SDR) 25.004 million from its Asian Development Fund for the Coral Reef Rehabilitation and Management Project (COREMAP) Phase II. This project is the second phase of a national coral reef rehabilitation and management program, whose overall goals are a healthy coral reef ecosystem and prosperous coastal communities. It was designed to follow on and incorporate the lessons of COREMAP I to support the government‘s efforts to address the critical and interrelated issues of resource degradation and pervasive poverty among coastal communities. 2. The project‘s outcomes were (i) enhanced national and local capacity to manage the country‘s reef resources, and (ii) rehabilitated and effectively managed priority coral reef ecosystems, which helped raise income levels and improve the living standards among poor coastal communities. To attain its outcomes, the project had two major components: (i) institutional strengthening and project management, and (ii) community-based resource management and development. The project was implemented in eight districts in three provinces: (i) Batam, Bintan, Lingga, and Natuna in Kepalauan Riau Province; (ii) Nias, Nias Selatan, and Taanuli Tengah in North Sumatra Province; and (iii) Mentawai in West Sumatra Province.1
II. EVALUATION OF DESIGN AND IMPLEMENTATION A. Relevance of Design and Formulation 3. The project supports ADB‘s overarching goal of poverty reduction in Asia and the Pacific. Its objectives and implementation strategies were also consistent with ADB‘s country strategy program (2003–2005) for Indonesia, which includes environmental management and protection. The project was relevant at appraisal and completion because it was in line with the government‘s national strategy and program for poverty eradication and its objectives of promoting the sustainable management of natural resources for both environmental protection and socioeconomic development under a decentralized form of government. 2 The project continues to be relevant at completion because its goal was consistent with that of the government‘s Medium-term Development Plan, 2004–2009, which continued to emphasize protection of the country‘s coastal and marine ecosystems in cooperation with local governments, including planning, zoning, and strengthening marine and coastal law enforcement activities. 4. The project‘s design was based on the lessons learned from COREMAP I, a review of various studies and other relevant projects, and discussions with national and local government authorities and other stakeholders. The design process was adequate because the project‘s design was cohesive. The project adopted a holistic approach to the management of coastal resources, particularly coral reefs and associated systems, and provided poor coastal communities with basic social services, social infrastructure, and income-generating
1 Originally, the project was to be implemented in six districts. However, the redefinition of the administrative
boundaries of Nias and Kepri districts resulted in the creation of Nias Selatan and Lingga districts. 2 At appraisal, the project was in line with the government‘s Medium-term Development Program, 2001–2005
(PROPENAS), and the Guidelines of State Policy (1999–2004). The project was conceived to assist the government‘s poverty reduction thrust, which gave priority to developing income-generating activities in the coastal zone and on small islands, particularly for small-scale fishermen.
2
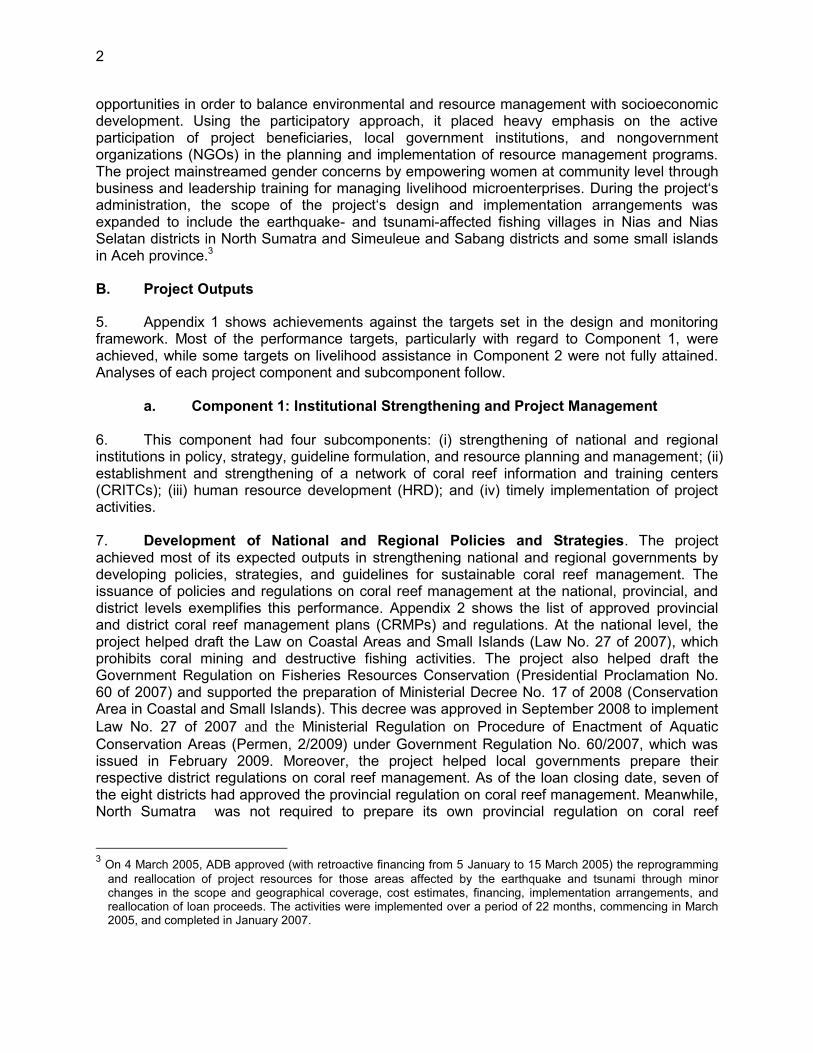
opportunities in order to balance environmental and resource management with socioeconomic development. Using the participatory approach, it placed heavy emphasis on the active participation of project beneficiaries, local government institutions, and nongovernment organizations (NGOs) in the planning and implementation of resource management programs. The project mainstreamed gender concerns by empowering women at community level through business and leadership training for managing livelihood microenterprises. During the project‘s administration, the scope of the project‘s design and implementation arrangements was expanded to include the earthquake- and tsunami-affected fishing villages in Nias and Nias Selatan districts in North Sumatra and Simeuleue and Sabang districts and some small islands in Aceh province.3 B. Project Outputs
5. Appendix 1 shows achievements against the targets set in the design and monitoring framework. Most of the performance targets, particularly with regard to Component 1, were achieved, while some targets on livelihood assistance in Component 2 were not fully attained. Analyses of each project component and subcomponent follow.
a. Component 1: Institutional Strengthening and Project Management 6. This component had four subcomponents: (i) strengthening of national and regional institutions in policy, strategy, guideline formulation, and resource planning and management; (ii) establishment and strengthening of a network of coral reef information and training centers (CRITCs); (iii) human resource development (HRD); and (iv) timely implementation of project activities. 7. Development of National and Regional Policies and Strategies. The project achieved most of its expected outputs in strengthening national and regional governments by developing policies, strategies, and guidelines for sustainable coral reef management. The issuance of policies and regulations on coral reef management at the national, provincial, and district levels exemplifies this performance. Appendix 2 shows the list of approved provincial and district coral reef management plans (CRMPs) and regulations. At the national level, the project helped draft the Law on Coastal Areas and Small Islands (Law No. 27 of 2007), which prohibits coral mining and destructive fishing activities. The project also helped draft the Government Regulation on Fisheries Resources Conservation (Presidential Proclamation No. 60 of 2007) and supported the preparation of Ministerial Decree No. 17 of 2008 (Conservation Area in Coastal and Small Islands). This decree was approved in September 2008 to implement Law No. 27 of 2007 and the Ministerial Regulation on Procedure of Enactment of Aquatic Conservation Areas (Permen, 2/2009) under Government Regulation No. 60/2007, which was issued in February 2009. Moreover, the project helped local governments prepare their respective district regulations on coral reef management. As of the loan closing date, seven of the eight districts had approved the provincial regulation on coral reef management. Meanwhile, North Sumatra was not required to prepare its own provincial regulation on coral reef
3 On 4 March 2005, ADB approved (with retroactive financing from 5 January to 15 March 2005) the reprogramming
and reallocation of project resources for those areas affected by the earthquake and tsunami through minor changes in the scope and geographical coverage, cost estimates, financing, implementation arrangements, and reallocation of loan proceeds. The activities were implemented over a period of 22 months, commencing in March 2005, and completed in January 2007.
3
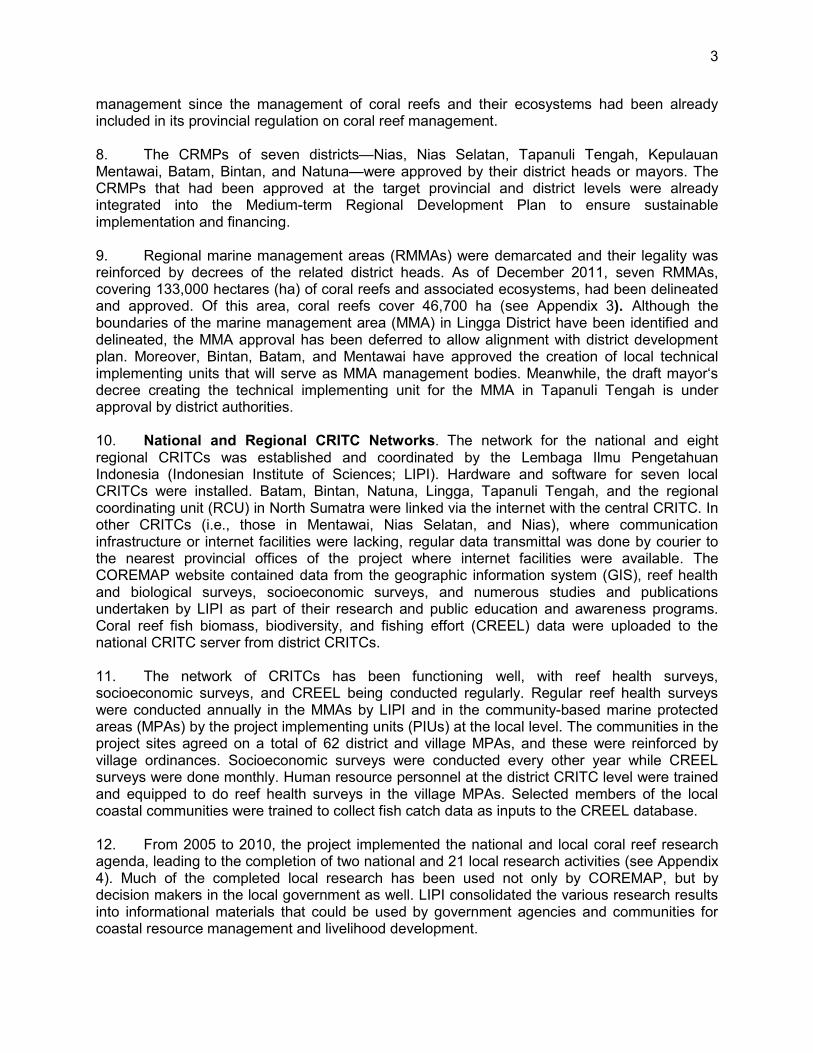
management since the management of coral reefs and their ecosystems had been already included in its provincial regulation on coral reef management. 8. The CRMPs of seven districts—Nias, Nias Selatan, Tapanuli Tengah, Kepulauan Mentawai, Batam, Bintan, and Natuna—were approved by their district heads or mayors. The CRMPs that had been approved at the target provincial and district levels were already integrated into the Medium-term Regional Development Plan to ensure sustainable implementation and financing. 9. Regional marine management areas (RMMAs) were demarcated and their legality was reinforced by decrees of the related district heads. As of December 2011, seven RMMAs, covering 133,000 hectares (ha) of coral reefs and associated ecosystems, had been delineated and approved. Of this area, coral reefs cover 46,700 ha (see Appendix 3). Although the boundaries of the marine management area (MMA) in Lingga District have been identified and delineated, the MMA approval has been deferred to allow alignment with district development plan. Moreover, Bintan, Batam, and Mentawai have approved the creation of local technical implementing units that will serve as MMA management bodies. Meanwhile, the draft mayor‘s decree creating the technical implementing unit for the MMA in Tapanuli Tengah is under approval by district authorities. 10. National and Regional CRITC Networks. The network for the national and eight regional CRITCs was established and coordinated by the Lembaga Ilmu Pengetahuan Indonesia (Indonesian Institute of Sciences; LIPI). Hardware and software for seven local CRITCs were installed. Batam, Bintan, Natuna, Lingga, Tapanuli Tengah, and the regional coordinating unit (RCU) in North Sumatra were linked via the internet with the central CRITC. In other CRITCs (i.e., those in Mentawai, Nias Selatan, and Nias), where communication infrastructure or internet facilities were lacking, regular data transmittal was done by courier to the nearest provincial offices of the project where internet facilities were available. The COREMAP website contained data from the geographic information system (GIS), reef health and biological surveys, socioeconomic surveys, and numerous studies and publications undertaken by LIPI as part of their research and public education and awareness programs. Coral reef fish biomass, biodiversity, and fishing effort (CREEL) data were uploaded to the national CRITC server from district CRITCs.
11. The network of CRITCs has been functioning well, with reef health surveys, socioeconomic surveys, and CREEL being conducted regularly. Regular reef health surveys were conducted annually in the MMAs by LIPI and in the community-based marine protected areas (MPAs) by the project implementing units (PIUs) at the local level. The communities in the project sites agreed on a total of 62 district and village MPAs, and these were reinforced by village ordinances. Socioeconomic surveys were conducted every other year while CREEL surveys were done monthly. Human resource personnel at the district CRITC level were trained and equipped to do reef health surveys in the village MPAs. Selected members of the local coastal communities were trained to collect fish catch data as inputs to the CREEL database. 12. From 2005 to 2010, the project implemented the national and local coral reef research agenda, leading to the completion of two national and 21 local research activities (see Appendix 4). Much of the completed local research has been used not only by COREMAP, but by decision makers in the local government as well. LIPI consolidated the various research results into informational materials that could be used by government agencies and communities for coastal resource management and livelihood development.
4
13. Human Resources Development and Extension. Performance targets for HRD and extension programs were met, including training 1,537 national and regional staff of the Ministry of Marine Affairs and Fisheries (MMAF), LIPI, and other government agencies; 234 staff from NGOs; and 1,123 personnel from the private sector (see Appendix 5). The project also provided two-year scholarships to 25 personnel to pursue Master‘s degrees to enhance the technical capability of select staff at the central and regional field offices, who were expected to assist in project implementation after their graduation. 14. Implementation of the project‘s extension program was done through the NGOs and extension workers in all of the 57 coastal villages covered under the project. The regional PIUs were responsible for coordinating the delivery of extension services by personnel from the dinas Kelautan Dan Perikanan (provincial and district Fisheries and Marine Affairs Service) and other regional government agencies, with the assistance of NGOs involved in community empowerment activities.
15. Community development specialists, extension workers, and regional advisers were the major contributors in improving the awareness of coastal communities in coral reef management. A total of 56 information centers were constructed in the eight project districts. In addition, guidebooks with local content (mulok), developed by CRITC-LIPI, were provided to more than 70,000 students in 372 schools to enrich their knowledge and awareness of coral reef resource management. More than 300 teachers participated in the training of trainers (TOT) on the proper use of these guidebooks. Results of the survey conducted in August 2011 showed that 91% of the respondents have increased awareness of coral reef management, particularly of the importance of coral reefs as marine habitats, the need for their protection, and the role of the communities in their management. This exceeds the target of 70% increased awareness on the part of government personnel and coastal communities in the project areas. 16. Program Management and Coordination. The project management office (PMO), national PIU of LIPI, RCUs, and regional PIUs were established at the commencement of project implementation and have been operating ever since. The PMO was provided with adequate resources, office and communication equipment, and vehicles. Consultative meetings were conducted annually to coordinate project activities. The RCUs provided coordination functions at the provincial level. The PMO, RCUs, and PIUs were staffed with seconded and full-time technical and administrative staff. However, the districts of Nias, Nias Selatan and Lingga were subdivided resulting in increase in project activities and impacting project‘s coordination at national and local levels.
17. The CRITC consultant was mobilized in February 2005 and the project management consultant (PMC) in April 2005. The PMC contract was amended six times to modify consultant services according to the project‘s needs. The regional PIUs contracted the services of NGOs from 2005 to 2009 to assist in organizing, training, and empowering the local communities at the project sites for coral reef management and social and livelihood development. An inventory of equipment and vehicles that were purchased using project funds was conducted twice a year to ensure proper documentation and transparent accountability on the receipt and use of vehicles and equipment purchased. All COREMAP II assets both at the provincial and district levels were filed using the State-owned Property Accounting System. Since 2004, counterpart funding exclusive of in-kind government contributions has been provided by local governments. However, the release of the counterpart funds was delayed in some years, such as in 2004 and 2005. The project performance monitoring system (PPMS) for monitoring of financial performance and physical progress was installed and operational in all PIUs and RCUs, but its

5
establishment in 2008 was late. Software of the PPMS, together with an implementation manual, was prepared to consolidate all information needed to monitor the project‘s performance.
b. Component 2: Community-based Resource Management and Development
18. This component involved four subcomponents: (i) community empowerment, (ii) community resource management, (iii) community social services and infrastructure development, and (iv) community livelihood and income generation. 19. Community Empowerment. The NGOs organized community groups (pokmas) jointly with extension workers and provided them with training and technical and administrative support to develop their capacity to administer coastal resource management and livelihood activities. A total of 769 pokmas, under 53 Coral Reef Management Bodies (Lembaga Pengelola Sumberdaya Terumbu Karang; LPSTKs) with 8,200 members, were formed in coastal villages, with each of them taking the lead in preparing their respective village-level CRMPs through a participatory approach (see Appendix 6). The project thus exceeded the target number of coastal community groups to be formed (i.e., 45). More than 8,500 people from these pokmas participated in formal training on coral reef management conducted by the PMO, PIUs, and RCUs, while 7,200 people received training on livelihood development. In addition to these, coastal communities were provided formal training by NGOs (800 people) and LIPI (150 people). The total number of people trained by the project on coastal resource management and livelihood, however, was short of the target (8,500 people, as opposed to the target of 10,000). 20. Community Resource Management. Community-based monitoring, control, and surveillance (MCS) activities were conducted to protect portions of the MMAs, particularly those within the village waters, and the MPAs. Community-based MCS groups (pokmaswas) were organized, trained, and provided with patrol boats and communication equipment to conduct surveillance activities. The project trained about 2,000 members of the pokmaswas and deputized 20 civilian employees to investigate illegal and destructive fishing activities. Increased public awareness and law enforcement were the major factors that contributed to the reduction in destructive fishing activities in the project areas. Overall, the frequency of practices destructive to coral reefs in the sampled project sites decreased by 71% compared with 2004. This accomplishment exceeds the target of 50% reduction in illegal fishing activities. 21. Social Infrastructure Development. The project aimed to provide social infrastructure facilities and amenities in 45 communities. This target was achieved through the provision of 298 social infrastructure facilities in the 57 project villages, with most of them receiving three to four types of facilities (see Appendix 7). The specific social infrastructure facilities and amenities that were provided to the target villages depended on the identified needs of the local communities, as gathered through socioeconomic and needs assessments conducted by the NGO contractors. The most common facilities provided by the project included village information centers (56), MCS patrol boats (58), a clean water supply (43), sanitation facilities (42), and jetty wharfs (39). Traditional boats were provided to each pokmaswas and four MCS boats to the regional governments. 22. Enhancement of Community Welfare and Incomes/Livelihood. Alternative income generation (AIG) activities were initially piloted in 2006 in four districts: Nias, Tapanuli Tengah, Mentawai, and Batam. Starting from 2007, the AIG projects were implemented through a community contract system. The AIG beneficiaries were provided input assistance using ADB

6
loan proceeds.4 Through NGOs and extension workers, technical, financial, and marketing assistance were provided to the pokmas. The performance target for technical and financial assistance was 10,000 persons. At loan closing date, 7,300 persons had been covered, indicating underachievement of the target. 23. About 50% of the microenterprises established were successful. The major factors that contributed to the success of some livelihood enterprises were cooperation among the pokmas members and the PIUs and NGOs, good technical skills, extension services, and management, including transparent bookkeeping. Furthermore, livelihood enterprises were found to be successful in the project areas where the LPSTK‘s leadership was active, technical and marketing support provided by the extension workers and the local government was strong, and where feasibility studies of project proposals were properly and thoroughly conducted. On the other hand, business failures were caused by (i) improper site selection, (ii) the poor quality of the project feasibility study, (iii) marketing problems, (iv) high mortality rate of fingerlings, (v) fish diseases, (vi) climatic changes, and (vii) the high cost of commercial feed and fish as raw materials for fish cracker processing. 24. The project aimed to increase the average household income of its beneficiaries by 20% in real terms by the end of the project. However, CRITC-LIPI socioeconomic data from 2005 to 2011 show that the overall average increase in household income throughout the project sites was 12.55%, lower than the performance target. Of the 19 project locations covered in the socioeconomic surveys, only four attained the target (see Appendix 9). The average household income of the project‘s beneficiaries in two project locations on the east coast of Sumatra, Natuna (Bunguran Timur) and Bintan (Malang Rapat), increased by 23.06% and 59.58% per year, respectively. On the west coast of Sumatra, two project locations showed an increasing trend in average household income, Mentawai (Samukap), with 29.66%, and Nias (Hinako), with 69.45%. The rest did not meet the target. C. Project Costs 25. At appraisal, the total project cost, inclusive of taxes, project related category specific costs, physical contingencies, and service charges, was estimated at $41.25 million, comprising $17.53 million for Component 1, $18.40 million for Component 2, and about $5.32 million for contingencies and interest charges during construction. It included the ADB loan of $33.00 million, government counterpart funds of $6.60 million, and beneficiaries providing about $1.65 million in the form of labor, local materials, and other in-kind contributions. The actual project cost at loan closing was $37.671 million or about 8.7% lower than the overall appraisal estimate primarily due to the depreciation of the rupiah against the dollar. On average, the actual costs by component increased to about 2.6% from the base cost, mainly due to the inflation of goods and services. ADB financing for the project was $36.742 million, about 10.18% higher than the appraisal estimate. This was due to the additional budget item for tsunami assistance, which was not included in the original cost category. Beneficiaries contributed $0.624 million, about 62.18% lower than the appraisal estimate. Likewise, government counterpart funds were $0.305 million, about 95.38% lower than the appraisal estimate because of the reduction in the allotted budget contribution of the regional government in West Sumatra and the failure of Nias Selatan District to provide its counterpart budget allocation. Also, there were delays in the approval of 4 Essential equipment was allocated to qualified and approved candidates on condition that they return one set of
equipment (or products of equivalent value) for transfer to other beneficiaries. The items involved in this input assistance scheme varied from site to site. Some of these items were insulated fish boxes for fish transport, solar driers, pindang boilers, hand casts, pearl or seaweed rafts, and fish cages. Other inputs provided included seeds, feed, and other materials. Input assistance was provided only for the first production cycle.
7
the local counterpart budget in the initial years, resulting in limited use of local counterpart budgets during project implementation. In 2010, a regional policy to reduce its counterpart contribution was implemented in West Sumatra as a result of the series of earthquakes that caused heavy damage in the province. In Nias Selatan, counterpart funds could not be provided due to (i) conflict between the district head and the district House of Representatives, (ii) low district income, and (iii) more priority given by the district government to infrastructure development and education. Appendix 10 presents the details of the budget and actual cost of the project. D. Disbursements 26. Appendix 11 presents the detailed plan and actual disbursements by year and by financier. Appendix 12 shows the fund flow management of the project from various financiers. The loan proceeds were disbursed in accordance with ADB‘s Loan Disbursement Handbook (2007, as amended from time to time). During the project‘s inception in 2003, the executing agency was in the process of establishing a special account to expedite disbursement of loan proceeds, particularly for small expenditures, but due to changes in the government‘s financing policy as a result of its decentralization process, the project awaited final approval from the Ministry of Finance (MOF) to set it up. Initially, to support key project activities in 2003, MMAF/LIPI allocated Rp3.1 billion. As of December 2011, the total loan disbursement in SDR was SDR24.234 million (including interest charges amounting to SDR515,000), 96.92% of the total loan of SDR25.004 million. The project consistently met the disbursement targets during project implementation, with about 99% utilization of loan funds until the loan closing date, except for the start-up period and in the first two years of project implementation, when utilization and disbursement rates were low as a result of the delay in loan effectiveness and project implementation was slow partly because of the late recruitment of the PMC. Other factors that adversely affected loan disbursement were (i) a delay in the approval of an adequate counterpart budget at the PIU level, resulting in lower utilization of the budget for the construction of social infrastructure facilities; and (ii) the late issuance of revised government budgets. Nevertheless, the project was able to overcome these problems. Based on the 2010 evaluation of the National Development Planning Agency (Badan Perencanaan Pembangunan Nasional; BAPPENAS), the marine resource projects in Indonesia (and primarily this project) had the highest disbursing efficiency in Indonesia among ADB‘s subsector projects that were evaluated (ADB Country Portfolio Review Mission Report and BAPPENAS, 2010). E. Project Schedule 27. The loan became effective on 7 November 2003, but implementation did not begin until 13 May 2004, 14 months after the signing of the loan agreement. The project was originally scheduled to be implemented over 6 years and the loan to close on 31 December 2009. However, since the time required to achieve performance targets specified in the design and monitoring framework was insufficient, the loan closing date was extended to 30 December 2011 to allow the project more time to move toward the goal of institutionalization and further capacity building at the district level in order to ensure project sustainability. The factors that contributed to an extended implementation period included (i) late effectivity of the loan; (ii) delayed release of the corresponding circular from the MOF; (iii) the slow start-up activities during the first two years of project implementation; (iv) delayed mobilization of NGOs for community organizing and socializing works due to the lengthy bidding process and the scarcity of qualified NGOs; (v) slippage in the progress of project implementation caused by local political conditions such as electoral exercises, changes in local government officials and project management officers, and redefinition of political and administrative boundaries at the district
8
and village levels; (vi) delays in the establishment of MMAs in certain districts and carrying out benefit monitoring and evaluation (BME) due to insufficient local budgets; (vii) delays in the approval of counterpart funds; (viii) personnel replacement; (ix) a delay in the issuance of DIPA (Daftar Isian Pelaksanaan Anggaran; List of Items for Budget Implementation) and DASK (the local government budget) and DIPA revisions due to changes in the field requirements and specifications; (x) a lengthy process in the enactment of regional regulations and strategic plans and reservation of MMAs; (xi) MOF‘s reduction of travel expenditures at both the national and local levels by 20% of the 2007 budgeted funds; and (xii) a delay in the awarding of contracts, commissioning of patrol boats, and procurement of MCS equipment due to the revision of ADB‘s procurement guidelines that stipulates the replacement of the international shopping method by a national competitive bidding procedure. Appendix 13 shows the project implementation schedule at project appraisal compared with the actual schedule. F. Implementation Arrangements
28. Appendix 14 shows the project‘s organizational chart. The MMAF, through the Directorate General of Marine, Coastal, and Small Islands (DGMCSI), was the project‘s executing agency, with overall responsibility for its coordination, supervision, and implementation. A PMO was set up within the DGMCSI to oversee the project‘s day-to-day implementation. LIPI was the national implementing agency, responsible for the overall coordination of the project‘s research information and monitoring and training activities. Other implementing agencies included the provincial and district government agencies in the project areas, specifically the provincial planning and development offices (BAPPEDAs); and three provincial and eight district Fisheries and Marine Affairs Service offices. A national steering committee (NSC), chaired by BAPPENAS, was established to guide the overall direction of the project and ensure overall coordination of activities between the project and other government programs and projects. A regional advisory committee (RAC) was also established in each of the project provinces, headed by the chairperson of the Provincial Fisheries and Marine Affairs Service, to oversee project coordination between various implementing agencies at the local level and liaise with the NSC and PMO, as required. Most of the RACs met at least twice a year to oversee coordination of participating agencies. Despite the fact that the RACs‘ involvement was not optimal as evident from the limited number of RAC meetings held annually due to budget release delays, RAC members frequently coordinated on important implementation issues that needed immediate attention. The technical coordination and consultative meetings, which were spearheaded by the PMO at the national level and the RACs at the provincial level, were very useful in setting the direction of project implementation, securing project inputs from the team of consultants, and establishing close coordination and a synergistic relationship among the project‘s management, the team of consultants, PIU-LIPI, regional PIUs, and NGOs. PIU-LIPI is at national level and regional PIUs are at district level. 29. Overall, the PMO, PIU-LIPI, and the regional PIUs implemented their functions satisfactorily and the activities were mostly accomplished despite some delays. In general, implementation arrangements between the executing agency and implementing agencies and institutions were adequate to deliver project outputs The executing agency was able to establish close and effective coordination with other relevant agencies (e.g., the MOF, LIPI, BAPPENAS, BAPPEDA, the local Fisheries and Marine Affairs Service, the Indonesian Navy, and the maritime police) as well as with the district governments. All the district heads worked hard to set up all the necessary local implementation arrangements.
9
G. Conditions and Covenants 30. None of the major covenants were modified, suspended, or waived, as most conditions and covenants were relevant and realistic about the project‘s needs. The executing agency complied with most of the loan covenants, but some were late due to delays in the establishment and full operation of the PPMS, loan effectiveness, hiring of consultants, the fielding of NGOs, and submission of quarterly progress reports and the project completion report (see Appendix 15). Some covenants were partially complied with, since the required number of RAC and NSC meetings per year was not met. The executing agency met all the financial, social, and environmental requirements in project planning, design, and implementation. Audit reports on project financial statements were rated highly satisfactory. The government‘s audit agency prepared financial accounts on time and no significant anomalies or discrepancies were noted. Transactions were adequately supported by relevant transaction documents. H. Consultant Recruitment and Procurement
31. The project engaged two groups of consultants to assist the PMO and LIPI in project management and CRITC operation. A total of 534 person-months of consultancy services for both groups were allocated at project appraisal, consisting of 480 person-months of national consultants and 54 person-months of international consultants (Appendix 16). The project used a total of 729.66 person-months of consultancy services, comprised of 675.66 person-months of national consultants and 54 person-months of international consultants, thus exceeding the allocation at appraisal by 185.66 person-months. This was due to the need to increase the person-months of the international team leader as a result of the project‘s extension and the additional services of national consultants needed by the project, such as the regional advisors and the project management specialist. The executing agency engaged international and national consultants following the quality- and cost-based selection method in accordance with ADB‘s Guidelines on the Use of Consultants (2010, as amended from time to time). NGOs were also awarded contracts on a competitive basis in accordance with procedures acceptable to ADB. Effective in 2008, a multi-year contract was adopted with ADB approval in renewing the contract of well-performing NGOs, thus shortening the contract renewal process. Contracts were also awarded to other contractors for civil works, surveys, and other services required by the project in accordance with ADB‘s Procurement Guidelines (2010, as amended from time to time). 32. The PMO, PIU-LIPI, and PIUs were responsible for the procurement of all goods and related services and civil works in their respective areas of supervision. All services, supplies, and equipment financed by ADB were procured in accordance with Procurement Guidelines (2010, as amended from time to time). ADB has approved various procurements of vehicles, office and communication materials, and services. The individual value of most of these contracts was below $100,000 and was paid by ADB through reimbursement or statement of expenditure procedures, as specified in the loan agreement. Individual issuance of a no-objection letter and Procurement Contract Summary Sheet (PCSS) was therefore not required. Since 2006, the elimination of the requirement of PCSS issuance for every submitted contract facilitated disbursement procedures and resulted in a remarkable improvement in utilization of loan funds. ADB also approved the community participation method of procurement to allow the participation of local communities and NGOs, and use of local knowledge and materials as well as labor intensive and native technologies. Both the PMO and the PIUs demonstrated good performance capacity since procurements were completed within the predicted periods (e.g., all shopping procurements were completed within a month). The dedicated procurement committee
10
at the PMO level and the availability of an adequate number of certified procurement members expedited the procurement process. I. Performance of Consultants, Contractors and Suppliers 33. The executing agency, in general, and the PMO did not encounter major problems with the services provided by the consultants, civil works contractors, equipment suppliers, and NGOs. The overall performance of the PMC was satisfactory. The PMC team was the executing agency‘s partner in project implementation, providing expert advice and hands-on coaching both at the PMO and at RCUs and PIUs in the field. The regional advisors were particularly useful in guiding the PIUs in project implementation and in bridging the gap in human resources. Their effectiveness improved substantially when one regional advisor was assigned to only one PIU, rather than three. Moreover, the NGOs‘ performance in terms of fulfilling their responsibilities ranged from acceptable to satisfactory. J. Performance of the Borrower and the Executing Agency
34. On account of delays in loan effectiveness, signing of grant agreements between the MMAF and the district governments, and the recruitment of consultant and NGO services, the project‘s performance was constrained in the first two years of implementation. The delay in the project‘s start-up was eventually overcome and the executing agency made timely adjustments and substantial improvements to address implementation problems and concerns. Thus, the executing agency was able to catch up as a result of good management and operation, implementation efficiency, and effectiveness. Overall, the executing agency did not encounter significant problems in following ADB guidelines and procedures. The overall performance of the government and the executing agency was satisfactory in achieving the project‘s development objectives. This rating is supported by the project performance ratings given during the review missions (Basic Data C.5). As reported in the ADB review mission report dated 4 May 2010, the executing agency demonstrated good leadership and strong institutional capacity in implementing the project. K. Performance of the Asian Development Bank
35. ADB consistently provided timely advice and assistance during project implementation and monitored the project closely from the start, fielding an inception mission, nine regular project review missions, a midterm review mission, and a project completion review mission, and involving 689 person-days of staff and consultant services (Basic Data D). To facilitate the executing agency‘s compliance with ADB‘s accounting and auditing regulations, ADB also provided the executing agency with manuals on its policies and regulations on procurement of equipment and services and awarding of contracts. The review missions were useful in recommending to the executing agency time-bound actions to improve project implementation. Further, ADB acted promptly on the government‘s requests for the implementation of a multi-year NGO contract extension; provision of additional extension workers to replace NGOs during the extension period, when NGO services had already been terminated; elimination of counterpart funds for earthquake and tsunami response activities in Kepulauan Mentawa; contract variations in consultancy services; and the extension of the project implementation period and loan closing date, among others. Overall, based on the executing agency‘s assessment, ADB‘s performance in administering the project was satisfactory.

11
III. EVALUATION OF PERFORMANCE
A. Relevance
36. The project is rated as ―highly relevant‖ at both appraisal and completion. At appraisal, the project was in line with ADB‘s country strategy program in Indonesia and was consistent with Indonesia‘s policy and national strategy for drastic poverty reduction and sustainable coral reef management. The project continues to be relevant at completion because its goal was consistent with that of the government‘s Medium-term Development Plan, 2004–2009 (para. 3), and the objective of the country‘s Long-term Development Plan to increase the capacity of local governments in the preparation of policies, strategies, and guidelines for sustainable coral reef management. The participation of the project in formulating national policies and legislation and issuing provincial and district regulations on the conservation and management of marine resources to back up these policies increased the project‘s relevance. Law No. 27 of 2007, which was drafted with input from the project, is currently the umbrella law for marine and coastal resource management in Indonesia. Furthermore, district decrees, which were formulated project assistance, reinforced the RMMAs. B. Effectiveness in Achieving Outcome
37. The project is assessed ―effective‖ in meeting most of its outcomes. The overarching goal of the project was to rehabilitate, protect, and manage coral reefs and associated ecosystems in the project sites. The performance target for this goal was to increase live coral cover by 2% per year. The project exceeded this target as evident from the overall average annual growth rate in live coral cover of 9.4%. Appendix 17 shows that live coral cover in the project sites either improved or generally maintained its condition compared to that in 2004. The optimum level of about 50% (good) live coral cover has been maintained on the eastern side of Sumatra. From 2007 to 2010, a few years after many corals were destroyed on the western side of Sumatra by the tsunami and earthquake-related calamities that occurred in 2004–2005, live coral cover in Nias, Nias Selatan, and Mentawai improved steadily by 2.5% per year. Meanwhile, live coral cover in Tapanuli Tengah has been maintained at 40–50%, which is the optimum level for sites near a mainland. The average catch per unit effort (CPUE) per day in most of the districts shows increasing trends from 2008 to 2011, consistent with the improvements in live coral cover (Appendix 18). 38. Another outcome of the project was to lower incidences of poverty in coastal communities. Socioeconomic assessments from 2005 to 2011 show that the average growth rate of per capita income for the whole project was 5.33% per year ( as compared to appraisal target of 2% per year in real terms. Nevertheless, annual growth rates of per capita income varied greatly among the project sites (Appendix 19). 39. The project attained its objective of enhancing national and local capacity to effectively manage coral reef resources and priority reef areas. This is evidenced by the drafting of national, provincial, and district decrees on coral reef management through the assistance of the project, the formulation of CRMPs at the provincial and district levels (seven district strategic plans have been integrated into the Medium-term Regional Development Plan), and the active participation and collaboration between the pokmaswas, the community, the Indonesian Navy, the maritime police, and other agencies involved in community-based MCS activities. However, the project‘s outcome of increasing the average income of 10,000 households in coastal communities by 20% was not met, since the actual average growth in household income of 12.55% was lower than the target (para. 24).
12
C. Efficiency in Achieving Outcome and Outputs
40. The project is assessed as ―efficient‖ because most of the target project outputs and outcomes were attained at a project cost 8.7% lower than the appraisal estimate. The project‘s re-evaluated economic internal rate of return (EIRR) as a whole is 29.3% (as compared to appraisal estimate of 19%). At a social discount rate of 12%, the resulting positive net present value (NPV) for the 28-year period indicates that the project is expected to generate Rp643.11 billion (SDR69.60 billion). See Appendix 19. 41. As of 31 December 2011, overall progress had reached 96.5%, against the time elapsed at 100% since the loan approval date of 7 February 2003. The percentages of implementation progress of each component are as follows: (i) the institutional strengthening and project management component: 39.6 % out of the target of 40%, and (ii) the community-based resource management component: 56.9% out of the target of 60%. D. Preliminary Assessment of Sustainability
42. The project‘s sustainability is assessed as ―likely‖ because both central and local government has shown commitment to provide continuous financial support to project activities. Both the Government of Indonesia and ADB are currently working together in the preparation of the third phase of the project known as COREMAP-CTI 5 which aims to institutionalize COREMAP Phase II activities. Some indications of the institutionalization process have begun to emerge in a few project districts (e.g., volunteer labor to maintain social infrastructure facilities, use of LPSTK financial resources to procure materials, innovative business like renting boats, equipment provided by the project, and purchase of generators to sell electricity to communities). Of the 119 households that received technical and input assistance, 48 households or 40% of the beneficiaries expanded their businesses using their own savings. 43. Although most project target outputs were met and project performance was satisfactory in most project districts, the performance quality in three of the eight project districts, Nias, Lingga, and Nias Selatan, was less than optimal due to the division of these project districts during the project implementation period; their remote location, and due to lack of strong political will. COREMAP-CTI project aims to sustain, strengthen, and institutionalize the initiatives of COREMAP Phase II beyond the project implementation period. In addition, to enhance, sustain and institutionalize benefits from investments in COREMAP Phase II, the COREMAP-CTI project is intended to achieve Government of Indonesia‘s national programmatic target of effectively managing 20 million hectares of MMA‘s by 20/20 and aligning project activities with the national plan of action (NPOA) of Indonesia for CTI.6
E. Impact 44. In general, the project had positive economic, social, institutional, and environmental impacts. The economic impacts include (i) more diverse sources of alternative income and employment from fishing and non-fishing enterprises; (ii) improved household and per capita incomes; (iii) increased opportunities for women to increase their incomes from livelihood 5 COREMAP-CTI is the proposed follow on project of COREMAP Phase II that is being prepared by ADB under
RETA 7813: Coastal Marine Resources Management in the Coral Triangle Southeast Asia approved in 2011. 6 The CTI is a multilateral partnership of six countries (Indonesia, Malaysia, Philippines, Papua New Guinea,
Solomon Islands and Timor-Leste) formed in 2007 to address the urgent threats facing the coastal and marine resources of one of the most biologically diverse and ecologically rich regions on earth.
13
enterprises; and (iv) increased savings of the household beneficiaries, pokmas, and LPSTKs, which were re-invested in their existing livelihood businesses or in other income-generating projects. The project‘s spillover effect was also reported by project beneficiaries in Tapanuli Nauli I in terms of spreading the economic benefits from their catfish culture business to 20 non-COREMAP beneficiaries. 45. The project‘s most significant social impact was the empowerment of fishing households and women. Apart from the income opportunities that they enjoyed as a result of the project, women have substantially benefited in terms of empowerment. This empowerment is evidenced by their membership in pokmas, their participation in training activities, and, to a large extent, in the management of the LPSTKs. Women made up 28% of the total membership in pokmas and accounted for 15% of the total number of LPSTK officers (Appendix 21). Women participated in village organizations and pokmas mostly as treasurers and secretaries. About 24% of the training participants were women. More than 30% of the leaders in PMOs, PIUs and LIPI were women. 46. The PCR mission‘s interaction with various stakeholders suggests that the project‘s institutional impact is significant in terms of strengthened institutions. The institutional capacity of the MMAF, LIPI, and the district governments, with the assistance of NGOs and extension workers, to execute and implement the project was enhanced. The project also enhanced the capacities of the central and local governments to draft national and local laws and regulations on coral reef management. Moreover, the project brought about closer collaboration and coordination among implementing agencies from the national to the district levels as well as other agencies and stakeholders (i.e., the Indonesian Navy, the maritime police, local legislative body, etc.). In addition, district personnel and fishing communities in the project areas were empowered to conduct reef health monitoring and CREEL. 47. Data obtained from CREEL, reef health, and socioeconomic surveys reveal that the project‘s environmental impact was positive as a result of the MCS, training and extension, and resource enhancement activities. These included (i) a decreased incidence of illegal fishing activities, (ii) an increase in live coral cover in most project locations, (iii) an increase in fish catch rates, and (iv) the reappearance of commercially important reef resources.
IV. OVERALL ASSESSMENT AND RECOMMENDATIONS
A. Overall Assessment 48. The PCR mission team rated this project‘s overall performance ―successful‖ because it was consistent with the government‘s and ADB‘s policy of reducing poverty and promoting sustainable natural resource management through environmental protection; ―effective‖ in meeting most of the indicators set in the design and monitoring framework; and ―likely sustainable‖ after project completion with continuous support from the local governments (Appendix 21). Overall, the reevaluated EIRR of 29.3% ( as compared appraisal estimate of 19%) indicates that the project is economically feasible. Despite initial implementation problems, the project met most of the intended outputs and outcomes in most project sites as well as the targets set for impact (Appendix 1). Good coordination and teamwork among national, provincial, and district governments, the PMO, NGOs, extension workers, and community groups; the PMO‘s and PIUs‘ good facilitation and leadership skills; and the executing agency‘s strong institutional capacity were the major factors that contributed to the project‘s success. Based on the evaluation executing agencies performance of ADB‘s Indonesian projects by BAPPENAS in 2010, the project contributed as one of the best disbursing project in ADB‘s Indonesia portfolio

14
(para. 26). The project was also considered the flagship project in marine and coastal resource management in Indonesia and a foundation for Indonesia‘s participation in the Coral Triangle Initiative. B. Lessons
49. The following lessons were learned through the project: (i) close coordination and cooperation among the district governments, the Indonesian Navy, the maritime police, MMAF, District Fisheries and Marine Affairs Services, and fishing communities is crucially important during the early period of project implementation to ensure their continuous support in MCS activities; (ii) the integration of the district CRMPs into the district development plans and the Mid-term Regional Development Plan with budgetary allotments is a constructive way to engage district governments in maintaining coral reef management sustainability and providing continuous financial support; (iii) obtaining the full support and cooperation of the regional legislators and local officials is necessary to fast-track the legislative approval process and budget support; (iv) multi-stakeholder involvement is critical to successful implementation and sustainability of coral reef programs; (v) the links between a bottom-up and top-down approach are key in formulating policy and providing a better foundation for law enforcement; (vi) the preparation of sound project feasibility studies requires a wide range of specific skills (e.g., in market and financial analysis) that need to be developed within the cadre of extension workers, PIUs, and NGO staff. Extension workers should not only have a technical background in fisheries, but must also have business management skills. A well-prepared project feasibility study increases the likelihood of success of a livelihood project; (vii) human resource capability and the institutional strength of local governments should be considered before expensive hardware is provided; (viii) empowered communities with a high level of awareness are effective in reducing destructive fishing practices; and (ix) gender mainstreaming, particularly in the implementation of livelihood projects, is an effective strategy for empowering women. C. Recommendations
50. The recommendations in Table 1 are based on evaluation of the performance and the lessons learned from the implementation of the Project. 51. Timing of the project performance evaluation report. The project performance evaluation review mission may be fielded in 2014, about three years after project completion. This will allow time for livelihood projects and resource enhancement activities with long gestation periods to have significant impacts in coastal communities. .
15
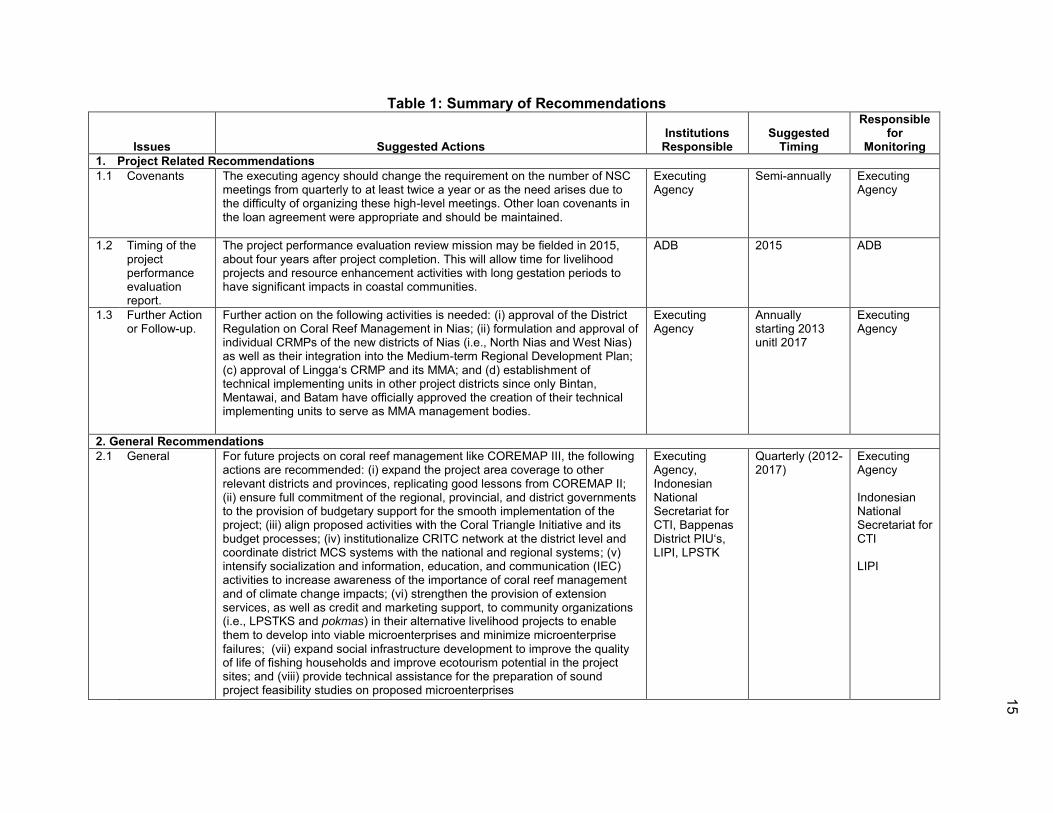
Table 1: Summary of Recommendations
Issues Suggested Actions Institutions
Responsible Suggested
Timing
Responsible for
Monitoring 1. Project Related Recommendations 1.1 Covenants The executing agency should change the requirement on the number of NSC
meetings from quarterly to at least twice a year or as the need arises due to the difficulty of organizing these high-level meetings. Other loan covenants in the loan agreement were appropriate and should be maintained.
Executing Agency
Semi-annually Executing Agency
1.2 Timing of the project performance evaluation report.
The project performance evaluation review mission may be fielded in 2015, about four years after project completion. This will allow time for livelihood projects and resource enhancement activities with long gestation periods to have significant impacts in coastal communities.
ADB 2015 ADB
1.3 Further Action or Follow-up.
Further action on the following activities is needed: (i) approval of the District Regulation on Coral Reef Management in Nias; (ii) formulation and approval of individual CRMPs of the new districts of Nias (i.e., North Nias and West Nias) as well as their integration into the Medium-term Regional Development Plan; (c) approval of Lingga‘s CRMP and its MMA; and (d) establishment of technical implementing units in other project districts since only Bintan, Mentawai, and Batam have officially approved the creation of their technical implementing units to serve as MMA management bodies.
Executing Agency
Annually starting 2013 unitl 2017
Executing Agency
2. General Recommendations 2.1 General For future projects on coral reef management like COREMAP III, the following
actions are recommended: (i) expand the project area coverage to other relevant districts and provinces, replicating good lessons from COREMAP II; (ii) ensure full commitment of the regional, provincial, and district governments to the provision of budgetary support for the smooth implementation of the project; (iii) align proposed activities with the Coral Triangle Initiative and its budget processes; (iv) institutionalize CRITC network at the district level and coordinate district MCS systems with the national and regional systems; (v) intensify socialization and information, education, and communication (IEC) activities to increase awareness of the importance of coral reef management and of climate change impacts; (vi) strengthen the provision of extension services, as well as credit and marketing support, to community organizations (i.e., LPSTKS and pokmas) in their alternative livelihood projects to enable them to develop into viable microenterprises and minimize microenterprise failures; (vii) expand social infrastructure development to improve the quality of life of fishing households and improve ecotourism potential in the project sites; and (viii) provide technical assistance for the preparation of sound project feasibility studies on proposed microenterprises
Executing Agency, Indonesian National Secretariat for CTI, Bappenas District PIU‘s, LIPI, LPSTK
Quarterly (2012-2017)
Executing Agency Indonesian National Secretariat for CTI LIPI

16 A
ppendix 1 PROJECT PERFORMANCE AGAINST INITIAL DESIGN FRAMEWORK
Design Summary Performance
Indicators/Targets Monitoring
Mechanisms Assumptions and
Risks PCR Assessment of Accomplishments/
Achievements Development Goals: (i) Coral reefs and associated ecosystems rehabilitated, protected, and well managed.
Live coral cover increased by 2% per year.
National reef BME system; CREEL survey reports
Assumption Population immigration to project areas and community basic costs do not increase substantially Risk Coral reefs and associated ecosystems are not damaged by severe climate change or natural processes
The overall average annual growth in live coral cover, considering all project sites, is 9.4%, which is higher than the target of 2% per year. Live cover in the project sites either improved or generally maintained its condition (with the exception of Lingga and Mentawai) compared to that in 2004. Live coral cover in Tapanuli Tengah has been maintained at 40–50%, which is the optimum level for sites near a mainland. The optimum level of about 50% (good) live coral cover has been maintained on the eastern side of Sumatra, despite the dramatic decrease in live coral cover in Lingga from 56.4% (good) in 2010 to about 36.6% (fair) in 2011. The decrease in live cover in Lingga could be attributed to bauxite mining activities and illegal fishing in the district. From 2007 to 2010, a few years after many corals were destroyed on the western side of Sumatra due to the tsunami and earthquake-related calamities that occurred in 2004–2005, live coral cover in Nias, Nias Selatan, and Mentawai increased steadily, but the coral cover still remained in fair to poor condition. Live coral cover in Mentawai improved until 2010 and then decreased from 25% (fair) in 2010 to 18% (poor) in 2011 due to the tsunami calamity in Bosua in 2010 and the recent increase in coral damage due to dropping of anchors by yachts bringing wind surfers around the island.
Triennial socioeconomic surveys
The average CPUE per day for six of the eight districts shows increasing trends consistent with the improvements in live coral cover. With the exception of Nias and Lingga, the CPUE

A
ppendix 1 17
Design Summary Performance
Indicators/Targets Monitoring
Mechanisms Assumptions and
Risks PCR Assessment of Accomplishments/
Achievements using hook and line increased from 2008 to 2011 in the project sites. The increase in the average CPUE ranged from 2.34% per year in Nias Selatan to 75.16% per year in Tapanuli Tenggah. On average, CPUE using hook and line declined by approximately 12% in Nias and 1% per year in Lingga. Meanwhile, except for Natuna, Lingga, and Nias, which exhibited a decreasing trend in CPUE per day using nets in the same period, all the other project districts exhibited positive growth rates in CPUE per day, ranging from 2.31% per year in Batam to 126.56% per year in Mentawai.
Lower incidence of poverty in coastal communities.
Average per capita income in target coastal communities increased by 2% per year in real terms.
Socioeconomic assessments from 2005 to 2011 show that the average growth rate of per capita income for the whole project was 5.33% per year, indicating that the target was met by the project.
Project Purposes: (i) Enhanced national and local capacity to manage coral reef resources and effectively managed priority reef areas
Main coral reef management issues in six districts in three provinces effectively addressed
Evaluation reports PMO progress and annual reports PCR Coral reef assessment reports Monitoring and evaluation reports
Assumption Management measures will be widely applicable and replicable.
The project has attained its objective of enhancing national and local capacity to effectively manage coral reef resources and priority reef areas. This is evidenced by the drafting of national, provincial, and district decrees on coral reef management with the project‘s assistance; the formulation of plans on coral reef management at the provincial and district levels, seven of which have been integrated into the Medium-term Regional Development Plan; and the active participation of and collaboration between the pokmaswas, (community-based law enforcement group), the community, the Indonesian Navy, the maritime police, and other agencies in community-based MCS activities to protect portions of the MMAs, particularly those within the village waters and the MPAs. The main coral reef management issues effectively addressed by the project
18 A
ppendix 1
Design Summary Performance
Indicators/Targets Monitoring
Mechanisms Assumptions and
Risks PCR Assessment of Accomplishments/
Achievements include dynamite fishing and coral mining,
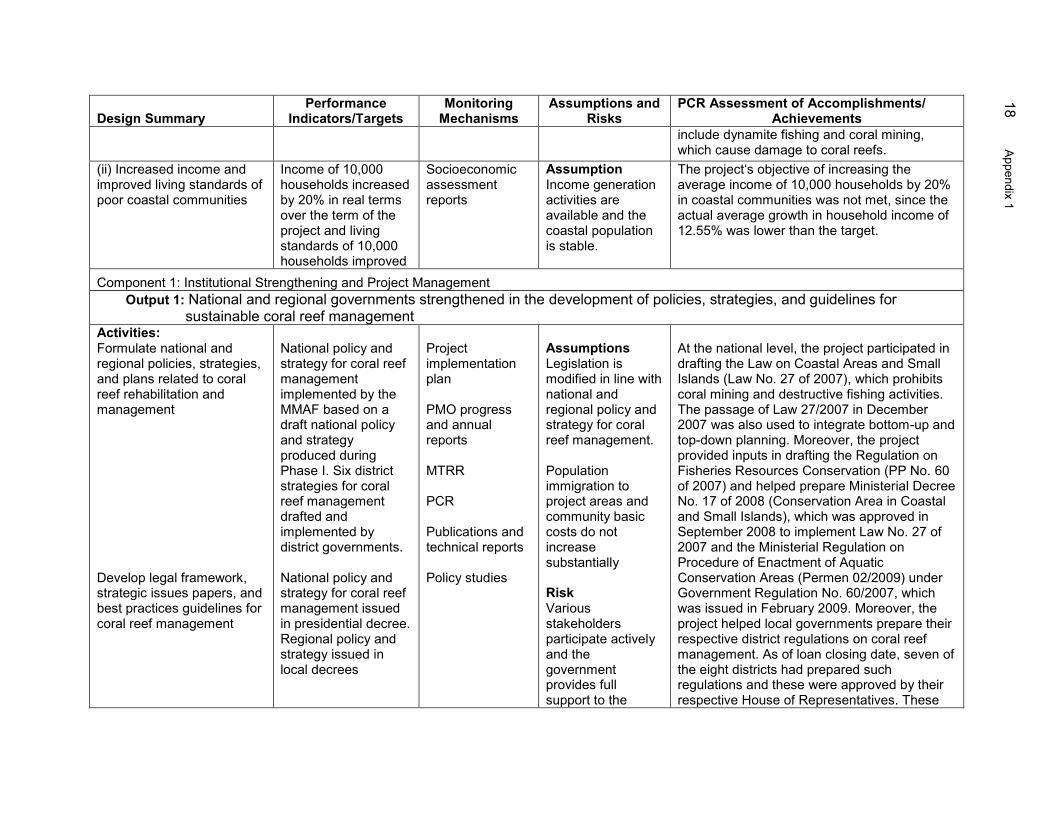
which cause damage to coral reefs. (ii) Increased income and improved living standards of poor coastal communities
Income of 10,000 households increased by 20% in real terms over the term of the project and living standards of 10,000 households improved
Socioeconomic assessment reports
Assumption Income generation activities are available and the coastal population is stable.
The project‘s objective of increasing the average income of 10,000 households by 20% in coastal communities was not met, since the actual average growth in household income of 12.55% was lower than the target.
Component 1: Institutional Strengthening and Project Management Output 1: National and regional governments strengthened in the development of policies, strategies, and guidelines for
sustainable coral reef management Activities: Formulate national and regional policies, strategies, and plans related to coral reef rehabilitation and management Develop legal framework, strategic issues papers, and best practices guidelines for coral reef management
National policy and strategy for coral reef management implemented by the MMAF based on a draft national policy and strategy produced during Phase I. Six district strategies for coral reef management drafted and implemented by district governments. National policy and strategy for coral reef management issued in presidential decree. Regional policy and strategy issued in local decrees
Project implementation plan PMO progress and annual reports MTRR PCR Publications and technical reports Policy studies
Assumptions Legislation is modified in line with national and regional policy and strategy for coral reef management. Population immigration to project areas and community basic costs do not increase substantially Risk Various stakeholders participate actively and the government provides full support to the
At the national level, the project participated in drafting the Law on Coastal Areas and Small Islands (Law No. 27 of 2007), which prohibits coral mining and destructive fishing activities. The passage of Law 27/2007 in December 2007 was also used to integrate bottom-up and top-down planning. Moreover, the project provided inputs in drafting the Regulation on Fisheries Resources Conservation (PP No. 60 of 2007) and helped prepare Ministerial Decree No. 17 of 2008 (Conservation Area in Coastal and Small Islands), which was approved in September 2008 to implement Law No. 27 of 2007 and the Ministerial Regulation on Procedure of Enactment of Aquatic Conservation Areas (Permen 02/2009) under Government Regulation No. 60/2007, which was issued in February 2009. Moreover, the project helped local governments prepare their respective district regulations on coral reef management. As of loan closing date, seven of the eight districts had prepared such regulations and these were approved by their respective House of Representatives. These

A
ppendix 1 19
Design Summary Performance
Indicators/Targets Monitoring
Mechanisms Assumptions and
Risks PCR Assessment of Accomplishments/
Achievements project
districts include Natuna, Tapanuli Tengah, Bintan, Kepuluauan Mentawai, Batam, Nias Selatan, and Lingga. The ratification of the district regulations took a long time due to such problems as the lengthy discussion pertaining to the revision of spatial planning in Batam and the conflict between the legislative and executive branches in Lingga. Only Nias District does not have an approved district regulation on coral reef management. This was due to administrative management problems that arose as a result of subdividing Nias District into three districts and one municipality. At the provincial level, West Sumatra and Kepulauan Riau have approved a provincial regulation on coral reef management. Meanwhile, North Sumatra did not prepare a similar regulation since the management of coral reefs and their ecosystems had already been included in its Provincial Regulation on Coral Reef Management.
Formulate and implement appropriate mechanisms for interagency coordination for effective regulation, law enforcement, and resource allocation in target districts
.
Surveillance at the district/municipality level was coordinated by the PIU and conducted by a joint patrol group involving the maritime police, the Indonesian Navy, the LPSTK, the pokmaswas, and the communities. At the provincial level, surveillance was coordinated by the RCU. In North Sumatra and Kepulauan Riau, the joint patrol group was composed of the maritime police, the LPSTK, the Indonesian Navy, the district attorney, the PIU, and the community.

20 A
ppendix 1
Design Summary Performance
Indicators/Targets Monitoring
Mechanisms Assumptions and
Risks PCR Assessment of Accomplishments/
Achievements Prepare CRMPs to guide resource allocation in the target districts
Detailed CRMPs prepared by six target district governments
The CRMPs of seven districts, Nias, Nias Selatan, Tapanuli Tengah, Kepulauan Mentawai, Batam, Bintan, and Natuna, were approved by their district heads/mayors. However, the Nias CRMP could no longer be implemented because this district was subdivided into three new districts. As of loan closing date, the district head had not yet approved the draft Lingga CRMP. At the provincial level, only Kepulauan Riau has an approved CRMP. The governors of North Sumatra and West Sumatra had not yet approved CRMPs as of loan closing date. In the case of West Sumatra, the cause of the delay in the approval of its CRMP was the election of a new governor, while the reason for the delay in North Sumatra was the management‘s lack of understanding that the governor had to approved the strategic plan. The CRMPs that had been approved at the target provincial and district levels were already integrated into the Medium-term Regional Development Plan to ensure sustainable implementation and financing.

A
ppendix 1 21
Design Summary Performance
Indicators/Targets Monitoring
Mechanisms Assumptions and
Risks PCR Assessment of Accomplishments/
Achievements Marine management
areas established and implemented in three to six target districts
Regional Marine Management Areas (RMMAs) were reserved and reinforced by decree of the related district heads. As of December 2011, eight RMMAs, covering more than 133,000 ha of coral reefs and associated ecosystems, had been delineated and seven RMMAs had been approved. Although the boundaries of the MMA in Lingga District had been identified and delineated, the mayor asked to review the boundaries to consider the district‘s other development plans of. As of December 2011, the district head had not yet approved the Lingga District MMA. Bintan, Batam, and Mentawai have approved the creation of their respective local technical implementing units, which will serve as MMA management bodies. Funds from the local budget had been allocated to make these technical implementing units operational within 2011. Meanwhile, the draft mayor‘s decree creating the technical implementing unit for the MMA in Tapanuli Tengah was submitted to the district secretary.
Conduct monitoring, control, and surveillance interventions, including local patrols and reef watchers, and establish MMAs for coral reef conservation in target districts
Locally initiated monitoring, control, and surveillance program for coral reef management established and implemented in three to six target districts
Coordination with the Navy and the MCS units at the national and district levels has been on-going. Community-based MCS groups have been organized and trained in all project villages. Most of these groups are patrolling regularly.
Output 2: Network of CRITCs established Activities: Strengthen and expand the network of CRITCs established in Phase I in new project districts
A network with centrally and regionally operated CRITCs established, developed, and
Institutional assessment reports Monitoring and
Assumption Adequate technical assistance is provided and the staff have a strong commitment to the
LIPI established and coordinated a network for the national and eight regional CRITCs . Hardware and software for seven local CRITCs were installed.
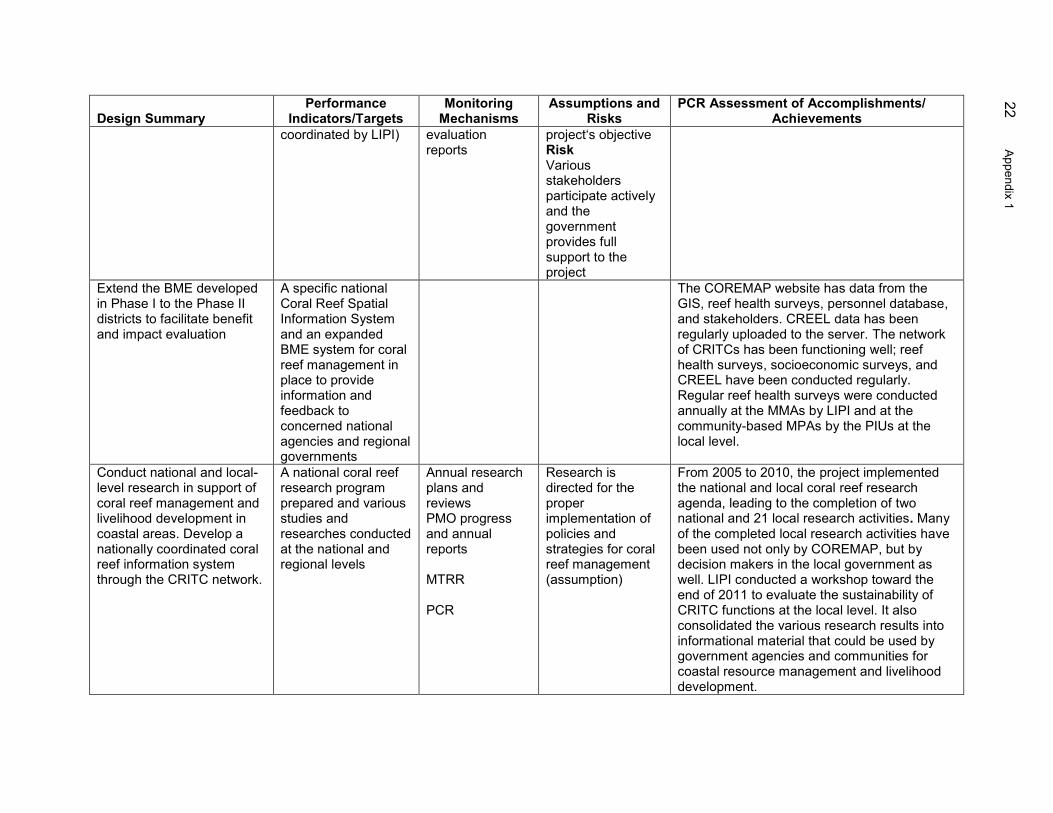
22 A
ppendix 1
Design Summary Performance
Indicators/Targets Monitoring
Mechanisms Assumptions and
Risks PCR Assessment of Accomplishments/
Achievements coordinated by LIPI)
evaluation reports
project‘s objective Risk Various stakeholders participate actively and the government provides full support to the project
Extend the BME developed in Phase I to the Phase II districts to facilitate benefit and impact evaluation
A specific national Coral Reef Spatial Information System and an expanded BME system for coral reef management in place to provide information and feedback to concerned national agencies and regional governments
The COREMAP website has data from the GIS, reef health surveys, personnel database, and stakeholders. CREEL data has been regularly uploaded to the server. The network of CRITCs has been functioning well; reef health surveys, socioeconomic surveys, and CREEL have been conducted regularly. Regular reef health surveys were conducted annually at the MMAs by LIPI and at the community-based MPAs by the PIUs at the local level.
Conduct national and local-level research in support of coral reef management and livelihood development in coastal areas. Develop a nationally coordinated coral reef information system through the CRITC network.
A national coral reef research program prepared and various studies and researches conducted at the national and regional levels
Annual research plans and reviews PMO progress and annual reports MTRR PCR
Research is directed for the proper implementation of policies and strategies for coral reef management (assumption)
From 2005 to 2010, the project implemented the national and local coral reef research agenda, leading to the completion of two national and 21 local research activities. Many of the completed local research activities have been used not only by COREMAP, but by decision makers in the local government as well. LIPI conducted a workshop toward the end of 2011 to evaluate the sustainability of CRITC functions at the local level. It also consolidated the various research results into informational material that could be used by government agencies and communities for coastal resource management and livelihood development.
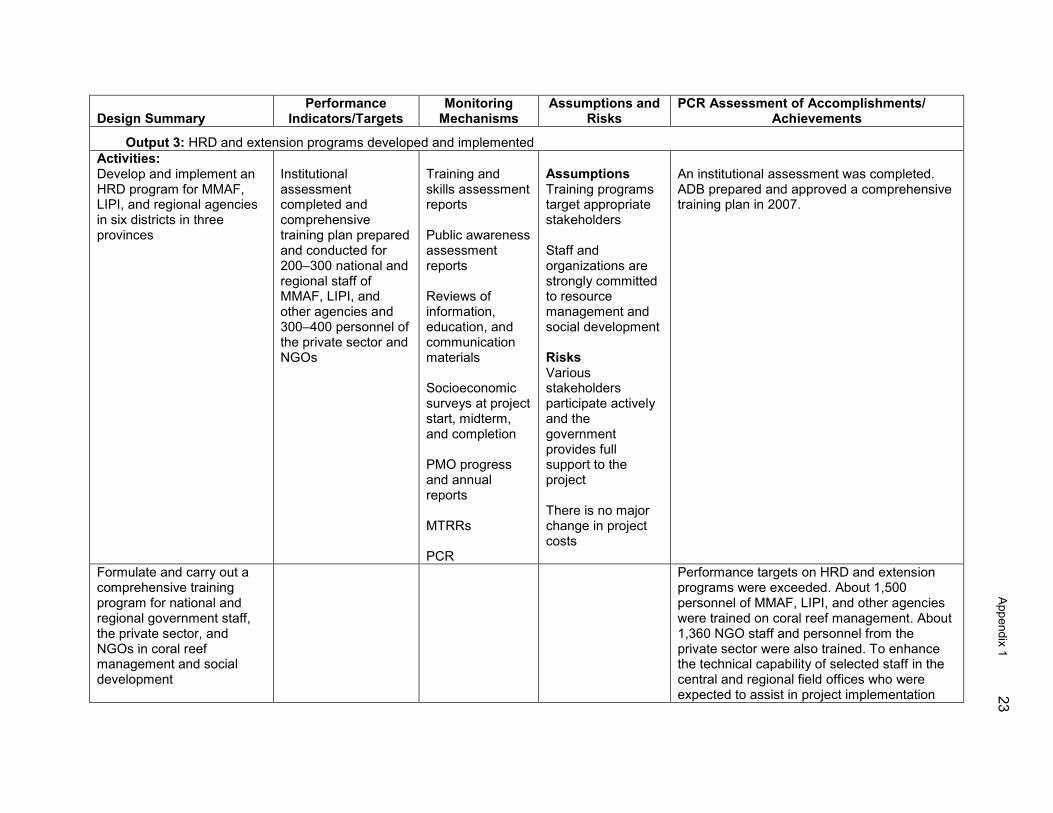
A
ppendix 1 23
Design Summary Performance
Indicators/Targets Monitoring
Mechanisms Assumptions and
Risks PCR Assessment of Accomplishments/
Achievements
Output 3: HRD and extension programs developed and implemented Activities: Develop and implement an HRD program for MMAF, LIPI, and regional agencies in six districts in three provinces
Institutional assessment completed and comprehensive training plan prepared and conducted for 200–300 national and regional staff of MMAF, LIPI, and other agencies and 300–400 personnel of the private sector and NGOs
Training and skills assessment reports Public awareness assessment reports Reviews of information, education, and communication materials Socioeconomic surveys at project start, midterm, and completion PMO progress and annual reports MTRRs PCR
Assumptions Training programs target appropriate stakeholders Staff and organizations are strongly committed to resource management and social development Risks Various stakeholders participate actively and the government provides full support to the project There is no major change in project costs
An institutional assessment was completed. ADB prepared and approved a comprehensive training plan in 2007.
Formulate and carry out a comprehensive training program for national and regional government staff, the private sector, and NGOs in coral reef management and social development
Performance targets on HRD and extension programs were exceeded. About 1,500 personnel of MMAF, LIPI, and other agencies were trained on coral reef management. About 1,360 NGO staff and personnel from the private sector were also trained. To enhance the technical capability of selected staff in the central and regional field offices who were expected to assist in project implementation

24 A
ppendix 1
Design Summary Performance
Indicators/Targets Monitoring
Mechanisms Assumptions and
Risks PCR Assessment of Accomplishments/
Achievements after their graduation, the project also provided two-year scholarships to 25 personnel (15 from the regional field offices and 10 from the central office) to pursue Master‘s degrees under a sandwich system. Personnel at the central and field offices who received scholarships were reassigned to positions where they could assist in the implementation of COREMAP. These include key positions in PMO, Bintan, Batam, and Mentawai.
Develop and conduct a comprehensive extension program to equip local resource users in each project district in coral reef management
Comprehensive extension program developed and implemented based on resource and socioeconomic surveys to assist 40–45 coastal communities in sustainable use of coral reef resources and livelihood activities
ADB submitted and approved the proposed extension program. NGOs and extension workers implemented the project in all 57 coastal villages under the project. The RPIUs were responsible for coordinating the delivery of extension services by personnel from the dinas Kelautan Dan Perikanan and other regional government agencies, with the assistance of NGOs involved in community empowerment activities.
Conduct an IEC program to raise pubic awareness about coral reef conservation at the national and local levels
Comprehensive IEC program prepared and conducted to increase awareness of 70% of government personnel and coastal communities in project areas
The project conducted various IEC and socialization activities annually (e.g., radio programs in radio stations operated by the youth, annual coral ambassador and community level competitions, a coral reef symposium, and a forum of journalists) on the different aspects of coral reef management. A total of 56 information centers were constructed throughout the eight project districts. In addition, CRITC-LIPI prepared guidebooks with local content (mulok) on the management of coral reefs and other ecosystems for elementary and high school students. A total of 372 schools received mulok guidebooks to develop a paradigm shift of the

A
ppendix 1 25
Design Summary Performance
Indicators/Targets Monitoring
Mechanisms Assumptions and
Risks PCR Assessment of Accomplishments/
Achievements younger generation in protecting the coral reefs. The mulok books were provided to more than 70,000 students in these schools to enrich their knowledge and awareness of coral reef resources management. However, the total number of books distributed by 2011 was insufficient. More than 300 teachers participated in the TOT on the proper use of these guidebooks. The plan to integrate coral reef concepts into the guidebook or mulok in the school curriculum did not materialize in most project sites due to a lack of teachers who had adequate knowledge on how to use the guidebook, since most of the trained teachers were not able to re-echo to other teachers what they learned during the TOT. Results of the survey conducted in July–August 2011 showed that 91% of respondents in the coastal communities have increased awareness about coral reef management, particularly on the importance of coral reefs as marine habitat, the need for their protection, and the role of the communities in their management. This exceeds the target of 70% increased awareness of government personnel and coastal communities in the project areas.
Output 4: Project activities implemented on time Activities: Establish a PMO and PIUs and hire competent project staff
PMO established in MMAF, national PIU in LIPI, and six regional PIUs in project districts to effectively coordinate project activities
PPRs PMO progress and annual reports MTRR PCR
Assumption Adequate technical assistance is provided and staff has a strong commitment to project objectives Risk There is no major
The PMO, national PIU-LIPI, RCUs, and PIUs have been established and operating since the commencement of project implementation. The PMO was provided with adequate resources, office and communication equipment, and vehicles. Consultative meetings were conducted annually to coordinate project activities.

26 A
ppendix 1
Design Summary Performance
Indicators/Targets Monitoring
Mechanisms Assumptions and
Risks PCR Assessment of Accomplishments/
Achievements Financial and disbursement reports
change in project costs and the government provides full support to the project.
Provincial role as coordinator needs to be established. Competent project director, seven PIU managers, and a group of professional and supporting staff further developed and trained in program coordination and project management.
The RCUs provided coordination at the provincial level. The PMO, RCUs, and PIUs were staffed with seconded and full-time staff. In Nias Selatan, however, project implementation was beset by lack of qualified and committed personnel. The subdivision of Nias into one city and two districts in November 2008 created implementation problems. To address this problem, the executing agency temporarily transferred the implementation of project activities to the RCU of North Sumatra in 2009.
Hire consultants
The CRITC consultant was mobilized in February 2005 and the PMC team in April 2005. Three junior consultants were also hired to assist with monitoring and evaluation, institutional development and marine management, and community-based resource management. The PMC contract was amended six times to modify consultant services according to the needs of the project. The latest amendment was issued an NOL on 28 December 2009 to assist the PMO during the project extension period.
Award contracts for community organizing, training, surveys, civil works, and other services required by the project
Contracts were awarded in accordance with ADB‘s Procurement Guidelines (2010, as amended from time to time).
Conduct training, workshops, seminars, study tours, etc.
Various overseas and in-country trainings have been conducted annually.
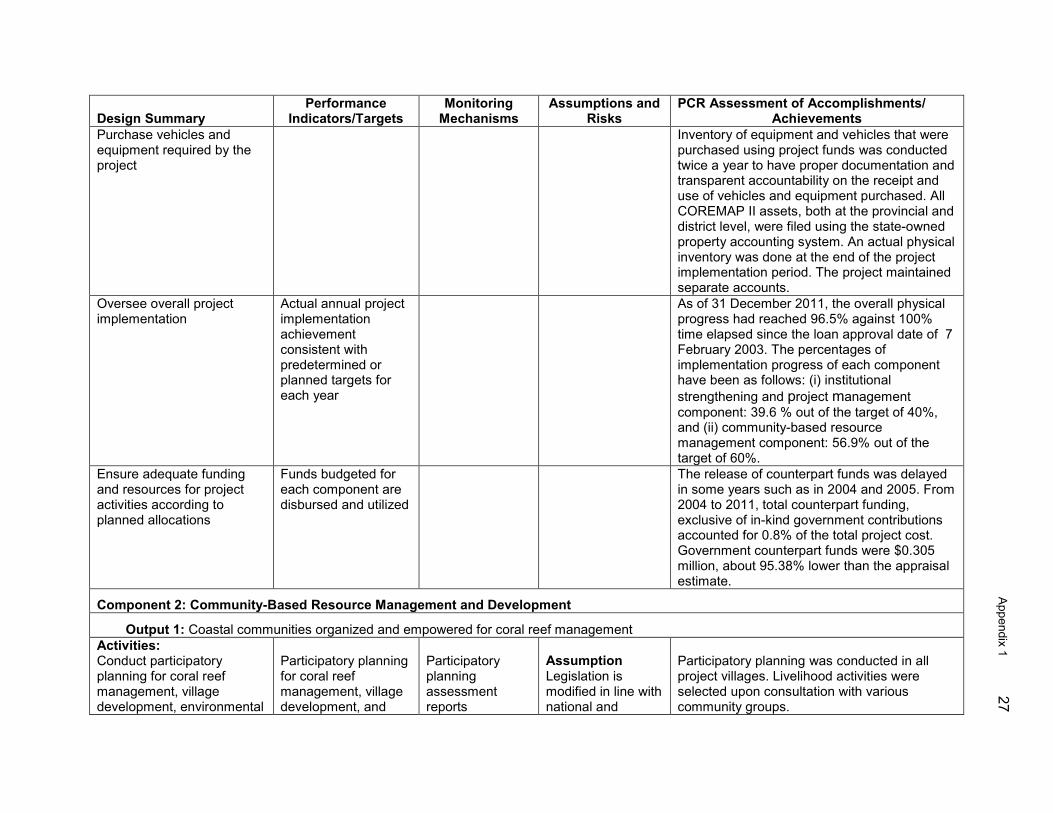
A
ppendix 1 27
Design Summary Performance
Indicators/Targets Monitoring
Mechanisms Assumptions and
Risks PCR Assessment of Accomplishments/
Achievements Purchase vehicles and equipment required by the project
Inventory of equipment and vehicles that were purchased using project funds was conducted twice a year to have proper documentation and transparent accountability on the receipt and use of vehicles and equipment purchased. All COREMAP II assets, both at the provincial and district level, were filed using the state-owned property accounting system. An actual physical inventory was done at the end of the project implementation period. The project maintained separate accounts.
Oversee overall project implementation
Actual annual project implementation achievement consistent with predetermined or planned targets for each year
As of 31 December 2011, the overall physical progress had reached 96.5% against 100% time elapsed since the loan approval date of 7 February 2003. The percentages of implementation progress of each component have been as follows: (i) institutional strengthening and project management component: 39.6 % out of the target of 40%, and (ii) community-based resource management component: 56.9% out of the target of 60%.
Ensure adequate funding and resources for project activities according to planned allocations
Funds budgeted for each component are disbursed and utilized
The release of counterpart funds was delayed in some years such as in 2004 and 2005. From 2004 to 2011, total counterpart funding, exclusive of in-kind government contributions accounted for 0.8% of the total project cost. Government counterpart funds were $0.305 million, about 95.38% lower than the appraisal estimate.
Component 2: Community-Based Resource Management and Development
Output 1: Coastal communities organized and empowered for coral reef management Activities: Conduct participatory planning for coral reef management, village development, environmental
Participatory planning for coral reef management, village development, and
Participatory planning assessment reports
Assumption Legislation is modified in line with national and
Participatory planning was conducted in all project villages. Livelihood activities were selected upon consultation with various community groups.
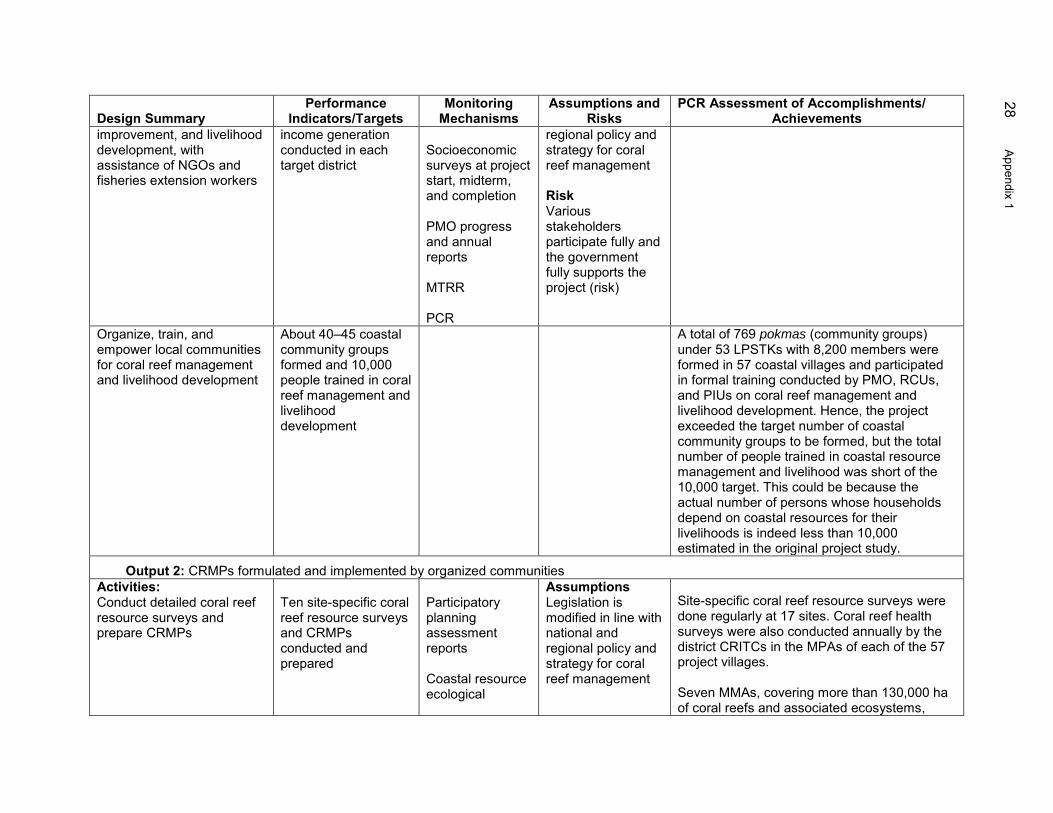
28 A
ppendix 1
Design Summary Performance
Indicators/Targets Monitoring
Mechanisms Assumptions and
Risks PCR Assessment of Accomplishments/
Achievements improvement, and livelihood development, with assistance of NGOs and fisheries extension workers
income generation conducted in each target district
Socioeconomic surveys at project start, midterm, and completion PMO progress and annual reports MTRR PCR
regional policy and strategy for coral reef management Risk Various stakeholders participate fully and the government fully supports the project (risk)
Organize, train, and empower local communities for coral reef management and livelihood development
About 40–45 coastal community groups formed and 10,000 people trained in coral reef management and livelihood development
A total of 769 pokmas (community groups) under 53 LPSTKs with 8,200 members were formed in 57 coastal villages and participated in formal training conducted by PMO, RCUs, and PIUs on coral reef management and livelihood development. Hence, the project exceeded the target number of coastal community groups to be formed, but the total number of people trained in coastal resource management and livelihood was short of the 10,000 target. This could be because the actual number of persons whose households depend on coastal resources for their livelihoods is indeed less than 10,000 estimated in the original project study.
Output 2: CRMPs formulated and implemented by organized communities Activities: Conduct detailed coral reef resource surveys and prepare CRMPs
Ten site-specific coral reef resource surveys and CRMPs conducted and prepared
Participatory planning assessment reports Coastal resource ecological
Assumptions Legislation is modified in line with national and regional policy and strategy for coral reef management
Site-specific coral reef resource surveys were done regularly at 17 sites. Coral reef health surveys were also conducted annually by the district CRITCs in the MPAs of each of the 57 project villages. Seven MMAs, covering more than 130,000 ha of coral reefs and associated ecosystems,

A
ppendix 1 29
Design Summary Performance
Indicators/Targets Monitoring
Mechanisms Assumptions and
Risks PCR Assessment of Accomplishments/
Achievements Implement planned coral reef management programs
60,000 ha of coral reefs and related ecosystems protected by organized coastal communities and district governments
assessment reports Socioeconomic survey reports at project start, midterm, and completion Environmental monitoring reports PMO progress and annual reports MTRR PCR
Population immigration to project areas and community basic costs do not increase substantially Risks Various stakeholders participate fully and the government fully supports the project Financing is provided by another government institution, resulting in excess budgeting
were established by bupati (district head) decree. Moreover, management plans have been prepared for these MMAs. Community-based MCSs are protecting portions of these MMAs, particularly those within the village waters and in the MPAs.
Conduct community-based MCS; rehabilitate damaged coral reef areas; and reduce destructive and illegal fishing effort
Community-based compliance and enforcement conducted by community groups in 10 sites in six districts; 60,000 ha of coral reefs rehabilitated; and illegal fishing reduced by 40–50% in the project areas.
Community-based MCS groups (pokmaswas) were organized, trained, and provided with patrol boats and communications equipment. The project trained about 2,000 members of pokmaswas and deputized 20 civilian employees to investigate illegal and destructive fishing activities. Most of the MCS groups conducted regular patrols. About 54% of the pokmas respondents claimed that fishing with the use of explosives declined, 53% reported that fishing with the use of poison declined, 17% indicated that trawl fishing decreased, and 37% mentioned that coral mining declined. The data generated from the July–August 2011 survey show that the frequency of incidence of
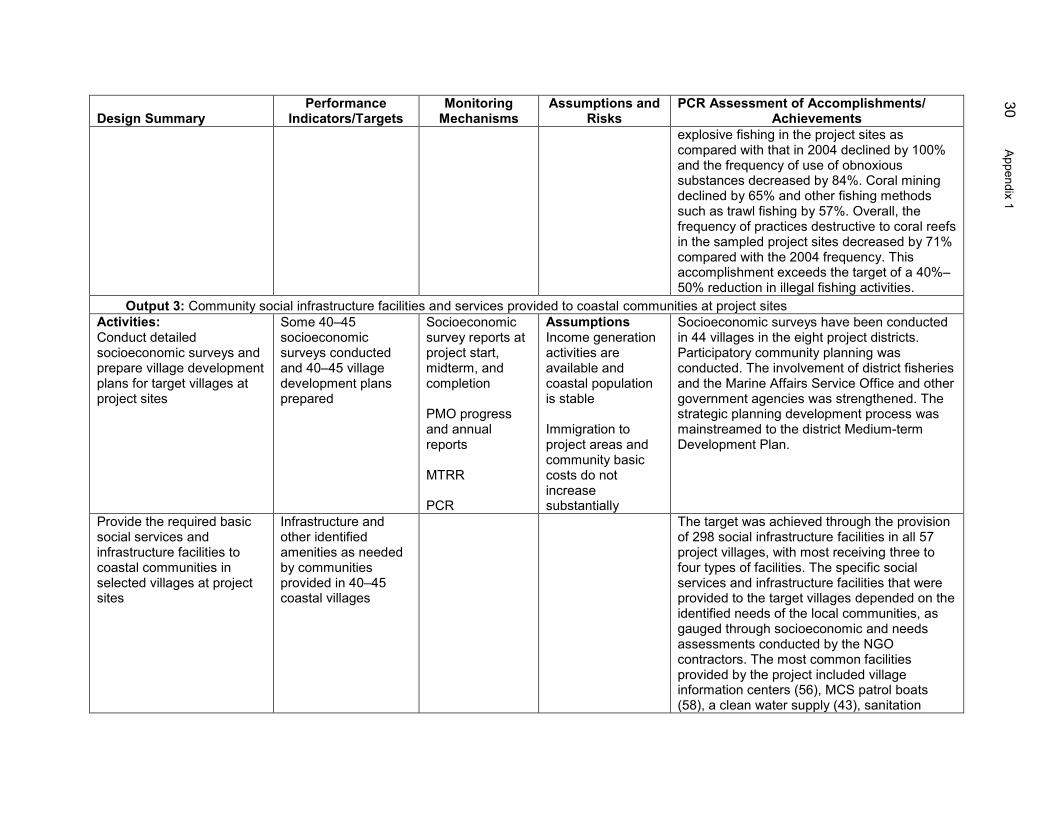
30 A
ppendix 1
Design Summary Performance
Indicators/Targets Monitoring
Mechanisms Assumptions and
Risks PCR Assessment of Accomplishments/
Achievements explosive fishing in the project sites as
compared with that in 2004 declined by 100% and the frequency of use of obnoxious substances decreased by 84%. Coral mining declined by 65% and other fishing methods such as trawl fishing by 57%. Overall, the frequency of practices destructive to coral reefs in the sampled project sites decreased by 71% compared with the 2004 frequency. This accomplishment exceeds the target of a 40%–50% reduction in illegal fishing activities.
Output 3: Community social infrastructure facilities and services provided to coastal communities at project sites Activities: Conduct detailed socioeconomic surveys and prepare village development plans for target villages at project sites
Some 40–45 socioeconomic surveys conducted and 40–45 village development plans prepared
Socioeconomic survey reports at project start, midterm, and completion PMO progress and annual reports MTRR PCR
Assumptions Income generation activities are available and coastal population is stable Immigration to project areas and community basic costs do not increase substantially
Socioeconomic surveys have been conducted in 44 villages in the eight project districts. Participatory community planning was conducted. The involvement of district fisheries and the Marine Affairs Service Office and other government agencies was strengthened. The strategic planning development process was mainstreamed to the district Medium-term Development Plan.
Provide the required basic social services and infrastructure facilities to coastal communities in selected villages at project sites
Infrastructure and other identified amenities as needed by communities provided in 40–45 coastal villages
The target was achieved through the provision of 298 social infrastructure facilities in all 57 project villages, with most receiving three to four types of facilities. The specific social services and infrastructure facilities that were provided to the target villages depended on the identified needs of the local communities, as gauged through socioeconomic and needs assessments conducted by the NGO contractors. The most common facilities provided by the project included village information centers (56), MCS patrol boats (58), a clean water supply (43), sanitation

A
ppendix 1 31
Design Summary Performance
Indicators/Targets Monitoring
Mechanisms Assumptions and
Risks PCR Assessment of Accomplishments/
Achievements facilities (42), and jetty wharves (39). The benefits that communities obtained from these facilities are evident from the extent to which these social infrastructure facilities were put to use. For example, more than 8,000 households used the meeting places, 7,000 families used the solid waste management facilities, 4,000 households benefited from the clean water supply system, and 5,000 households used the jetties. Hence, these social infrastructures have improved the living standards in coastal communities.
Output 4: Livelihood and income-generating activities established and operated by coastal communities in target areas Activities: Identify and screen microenterprise and livelihood opportunities and conduct feasibility studies of selected enterprises
Livelihood opportunities identified and subjected to feasibility study in 40–45 villages
Socioeconomic surveys at project start, midterm, and completion PMO progress reports MTRR PCR
The initial phase for identification of participants for livelihood opportunities started in late 2006 and was completed by early 2007. Renewed interest in alternative livelihoods (fish cracker processing, coconut oil processing, handicraft making, fish cage culture, goat raising, etc) were pursued as regards to market linkage, food sanitation, and environmental protection. Project feasibility studies of some livelihood enterprises were of poor quality, resulting in business failure.
Provide technical, marketing, and financial assistance to organized community groups to operate feasible livelihood activities
Technical and financial assistance provided to 10,000 people
Technical and input assistance has been provided to more than 7,300 persons. A survey conducted in May 2011 indicated that the total number of fishing households in the project areas was estimated at about 8,167 households. Assuming that one member per household will be provided with technical and financial assistance, the maximum number that the project could attain is 8,167 persons. Hence, the project was only 967 persons short of the target.
Establish, operate, and sustain livelihood and income generation activities.
Livelihood activities established and income of these
A micro-enterprise development plan was prepared. The AIG enterprises were diverse, consisting of non-fisheries and fisheries
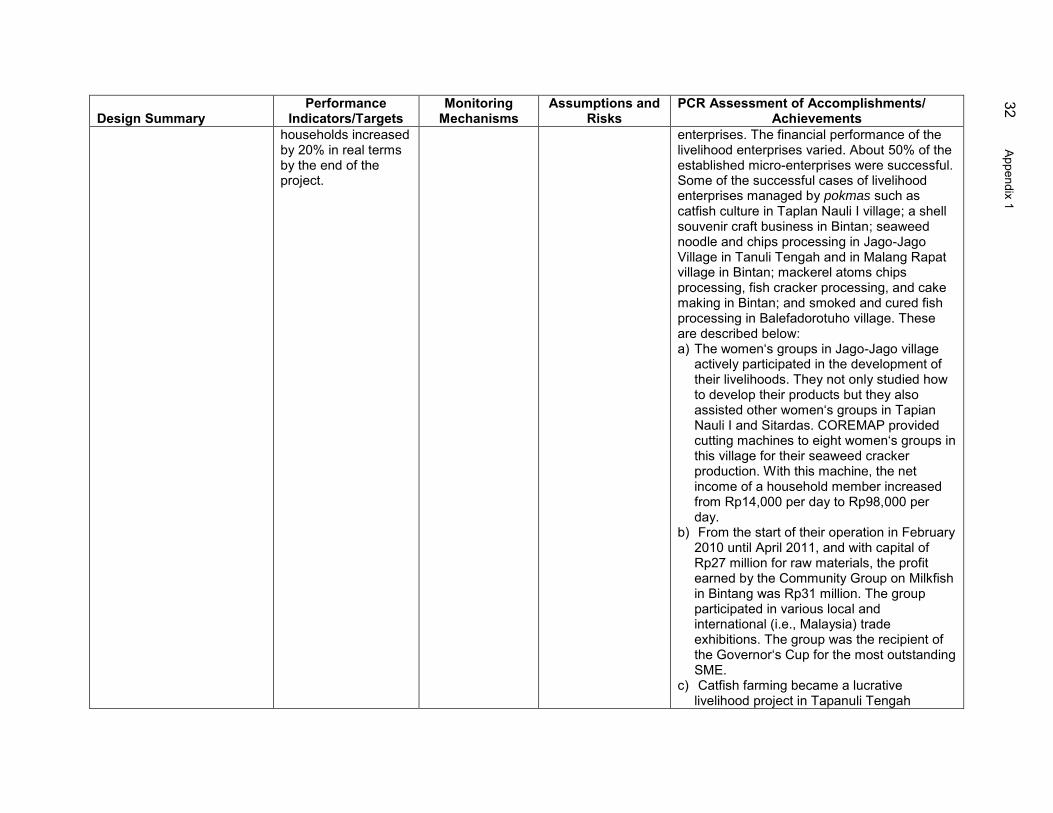
32 A
ppendix 1
Design Summary Performance
Indicators/Targets Monitoring
Mechanisms Assumptions and
Risks PCR Assessment of Accomplishments/
Achievements households increased by 20% in real terms by the end of the project.
enterprises. The financial performance of the livelihood enterprises varied. About 50% of the established micro-enterprises were successful. Some of the successful cases of livelihood enterprises managed by pokmas such as catfish culture in Taplan Nauli I village; a shell souvenir craft business in Bintan; seaweed noodle and chips processing in Jago-Jago Village in Tanuli Tengah and in Malang Rapat village in Bintan; mackerel atoms chips processing, fish cracker processing, and cake making in Bintan; and smoked and cured fish processing in Balefadorotuho village. These are described below: a) The women‘s groups in Jago-Jago village
actively participated in the development of their livelihoods. They not only studied how to develop their products but they also assisted other women‘s groups in Tapian Nauli I and Sitardas. COREMAP provided cutting machines to eight women‘s groups in this village for their seaweed cracker production. With this machine, the net income of a household member increased from Rp14,000 per day to Rp98,000 per day.
b) From the start of their operation in February 2010 until April 2011, and with capital of Rp27 million for raw materials, the profit earned by the Community Group on Milkfish in Bintang was Rp31 million. The group participated in various local and international (i.e., Malaysia) trade exhibitions. The group was the recipient of the Governor‘s Cup for the most outstanding SME.
c) Catfish farming became a lucrative livelihood project in Tapanuli Tengah
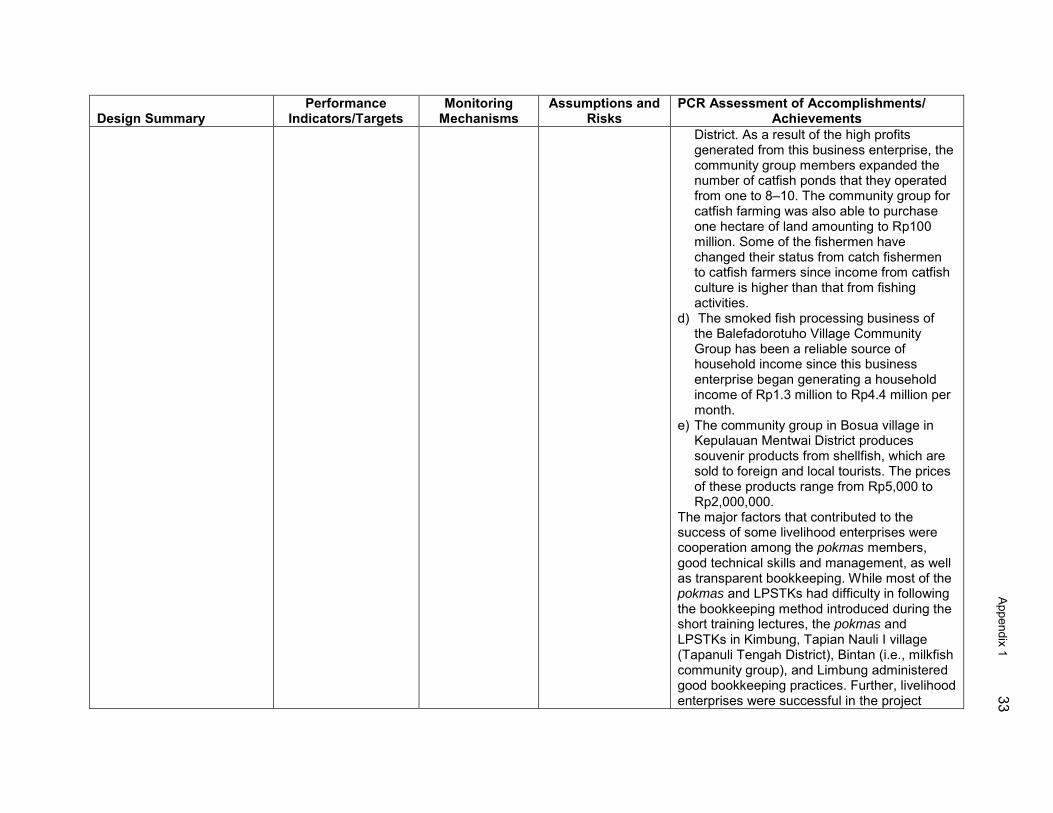
A
ppendix 1 33
Design Summary Performance
Indicators/Targets Monitoring
Mechanisms Assumptions and
Risks PCR Assessment of Accomplishments/
Achievements District. As a result of the high profits generated from this business enterprise, the community group members expanded the number of catfish ponds that they operated from one to 8–10. The community group for catfish farming was also able to purchase one hectare of land amounting to Rp100 million. Some of the fishermen have changed their status from catch fishermen to catfish farmers since income from catfish culture is higher than that from fishing activities.
d) The smoked fish processing business of the Balefadorotuho Village Community Group has been a reliable source of household income since this business enterprise began generating a household income of Rp1.3 million to Rp4.4 million per month.
e) The community group in Bosua village in Kepulauan Mentwai District produces souvenir products from shellfish, which are sold to foreign and local tourists. The prices of these products range from Rp5,000 to Rp2,000,000.
The major factors that contributed to the success of some livelihood enterprises were cooperation among the pokmas members, good technical skills and management, as well as transparent bookkeeping. While most of the pokmas and LPSTKs had difficulty in following the bookkeeping method introduced during the short training lectures, the pokmas and LPSTKs in Kimbung, Tapian Nauli I village (Tapanuli Tengah District), Bintan (i.e., milkfish community group), and Limbung administered good bookkeeping practices. Further, livelihood enterprises were successful in the project

34 A
ppendix 1
Design Summary Performance
Indicators/Targets Monitoring
Mechanisms Assumptions and
Risks PCR Assessment of Accomplishments/
Achievements areas where the LPSTKs were active, extension workers provided technical and marketing support, the local government was strong, and where feasibility studies on project proposals were properly and thoroughly conducted. On the other hand, business failures were caused by (i) improper site selection (ii) poor quality of project feasibility study; (iii) marketing problems such as lack of market outlets; (iii) high mortality rate of fingerlings; (iv) fish diseases; (v) climatic changes; and (v) high cost of commercial feed and fish as raw materials (for fish cracker processing). CRITC-LIPI socioeconomic data from 2005 to 2011 show that the overall average increase in household income throughout the project sites was 12.55%. This was relatively lower than the performance target of 20%. Among the 19 project locations covered in the socioeconomic surveys, only four locations attained the target. The average household income of the project beneficiaries in two project locations on the east coast of Sumatra, Natuna (Bunguran Timur) and Bintan (Malang Rapat), increased by 23.06% and 59.58% per year, respectively. On the west coast of Sumatra, two project locations also show an increasing trend in average household income, Mentawai (Samukap) with 29.66% and Nias (Hinako) with 69.45%. Although 10 project locations exhibited increasing average household incomes in the same period, their average annual growth rates were less than 20%. Negative growth rates in household income were reported in five project locations.

A
ppendix 1 35
Activities/Inputs: ($ million) PPR ($ million) National and regional government institutions Coral reef information and training centers Human resources development and extension Project management Community empowerment
2.00 7.50 3.00 5.00 3.40
1.365 6.454 4.905 8.594 2.729
Community resource management Social services and infrastructure development Livelihood and income generation
4.50 5.50 5.00
3.983 3.135 5.717
Subtotal 35.93 36.882 Physical contingencies Price contingencies
2.18 2.46
Subtotal 40.57 Service charge 0.68 0.789
Total 41.25 37.671 ADB = Asian Development Bank; AIG = alternative income generating; BME = benefit, monitoring and evaluation; bupati = district head; COREMAP = coral reef management project; CPUE = catch per unit effort; CREEL = coral reef fish biomass, biodiversity, and fishing effort; CRITC = coral reef information and training center; CRMP = coral reef management plan; Dinas erikanan (provincial/district Marine and Fisheries Affairs Service); GIS = geophysical information system; ha = hectare; HRD = human resource development; IEC = information, education, and communication; LIPI = Lembaga Imu Pengetahuan Indonesia (Indonesian Institute of Sciences); LPSTK = Lembaga Pengelola Sumberdaya Terumbu Karang (Coral Reef Management Body); MCS = monitoring, control, and surveillance; MMA = marine management area; MMAF = Ministry of Marine Affairs and Fisheries; MPA = marine protected area; MTRR = midterm review report; NGO = nongovernment organization; NOL = no-objection letter; PCR = project completion report; PIU = project implementing unit; PMC = project management consultant; PMO = project management office; pokmas = village group; pokmaswas = community-based law enforcement group; PPR = project performance report; RCU = regional coordinating unit; RMMA = regional marine management area; RPIU = regional project implementing unit; SME = small- and medium-sized enterprise; TOT = training of trainers. Sources: ADB. 2002. Report and Recommendation of the President to the Board of Directors: Proposed Loan to Indonesia for the Coral Reef Rehabilitation and Management Project Phase II. Manila; and back-to-office reports of project review missions.

36 Appendix 2
STRATEGIC PLANS AND REGULATIONS ON CORAL REEF MANAGEMENT
Table A2: List of District Strategic Plans and Regulations on Coral Reef Management
District Strategic Plan on Coral Reef Management
District Regulation on Coral Reef Management
Nias Bupati Decree No. 20/2007, dated 22 Nov 2007
Could not be enacted because Nias was further subdivided into two districts and one city. The local governments of these new districts were newly elected by the time the project ended. It took 4 to 6 years to follow all the processes in order to get the approval of a local parliament for a district regulation.
Nias Selatan Bupati Decree No. 523/ 136/P/2007, dated 30 May 2007
Has been approved by the DPRD Parliament and has been submitted to the governor for notification
Tapanuli Tengah Bupati Decree No. 10/2006, dated 28 December 2006
Issued by bupati and Parliament on 5 December 2007 through joint decrees of Bupati No. 05/KPTS/HKM/Th 2007 and Parliament No. 032/KPTS/DPRD/2007
Mentawai Bupati Decree No.188.45–179, dated 5 July 2010
Enacted on 19 December 2008 (Number 19, Year 2008)
Batam Walikota Decree No. 27/2011, dated 6 October 2011
Enacted on 25 August 2009, (Number 7, Year 2009)
Bintan Bupati Decree No. 13/II/2009, dated 5 February 2009
Enacted on 19 August 2008, (Number 12, Year 2008)
Natuna Bupati Decree No. 346/2007, dated 15 Nov. 2007
Enacted on 1 September 2007, (Number 1, Year 2007)
Lingga Draft has been prepared and submitted to BAPPEDA for review by District Legal Bureau prior to approval by bupati
Draft RANPERDA has been submitted to the DPRD. A committee has been created to review the draft and has listed the item as No. 4 in the Parliament's legislative agenda.
BAPPEDA = Badan Perencanaan Pembangunan Daerah (Regional Development Planning Agency), bupati = district head, DPRD = Dewan Perwakilan Rakyat Daerah (regional Parliament), RANPERDA = local regulation. Source: Ministry of Marine Affairs and Fisheries.
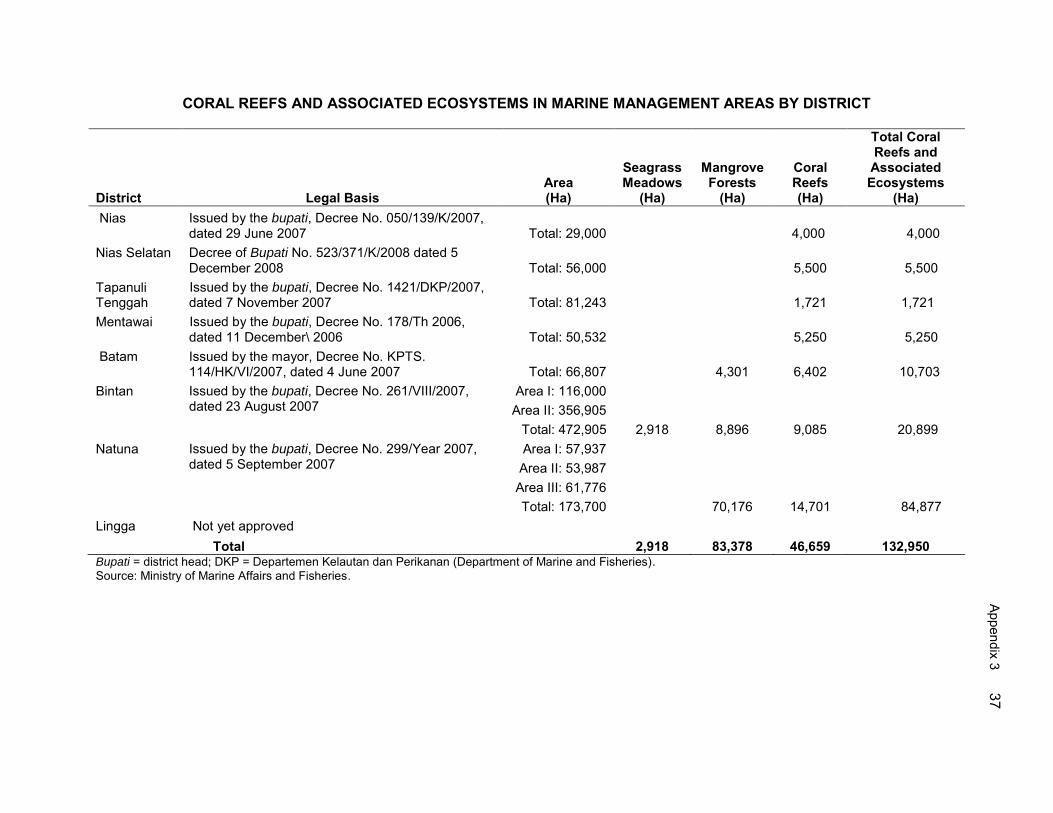
Appendix 3 37
CORAL REEFS AND ASSOCIATED ECOSYSTEMS IN MARINE MANAGEMENT AREAS BY DISTRICT
District
Legal Basis
Area (Ha)
Seagrass Meadows
(Ha)
Mangrove Forests
(Ha)
Coral Reefs (Ha)
Total Coral Reefs and Associated Ecosystems
(Ha) Nias Issued by the bupati, Decree No. 050/139/K/2007,
dated 29 June 2007 Total: 29,000 4,000 4,000 Nias Selatan Decree of Bupati No. 523/371/K/2008 dated 5
December 2008 Total: 56,000 5,500 5,500 Tapanuli Tenggah
Issued by the bupati, Decree No. 1421/DKP/2007, dated 7 November 2007 Total: 81,243 1,721 1,721
Mentawai Issued by the bupati, Decree No. 178/Th 2006, dated 11 December\ 2006 Total: 50,532 5,250 5,250
Batam Issued by the mayor, Decree No. KPTS. 114/HK/VI/2007, dated 4 June 2007 Total: 66,807 4,301 6,402 10,703
Bintan Issued by the bupati, Decree No. 261/VIII/2007, dated 23 August 2007
Area I: 116,000 Area II: 356,905
Total: 472,905 2,918 8,896 9,085 20,899 Natuna
Issued by the bupati, Decree No. 299/Year 2007, dated 5 September 2007
Area I: 57,937 Area II: 53,987 Area III: 61,776 Total: 173,700 70,176 14,701 84,877
Lingga Not yet approved Total 2,918 83,378 46,659 132,950 Bupati = district head; DKP = Departemen Kelautan dan Perikanan (Department of Marine and Fisheries). Source: Ministry of Marine Affairs and Fisheries.
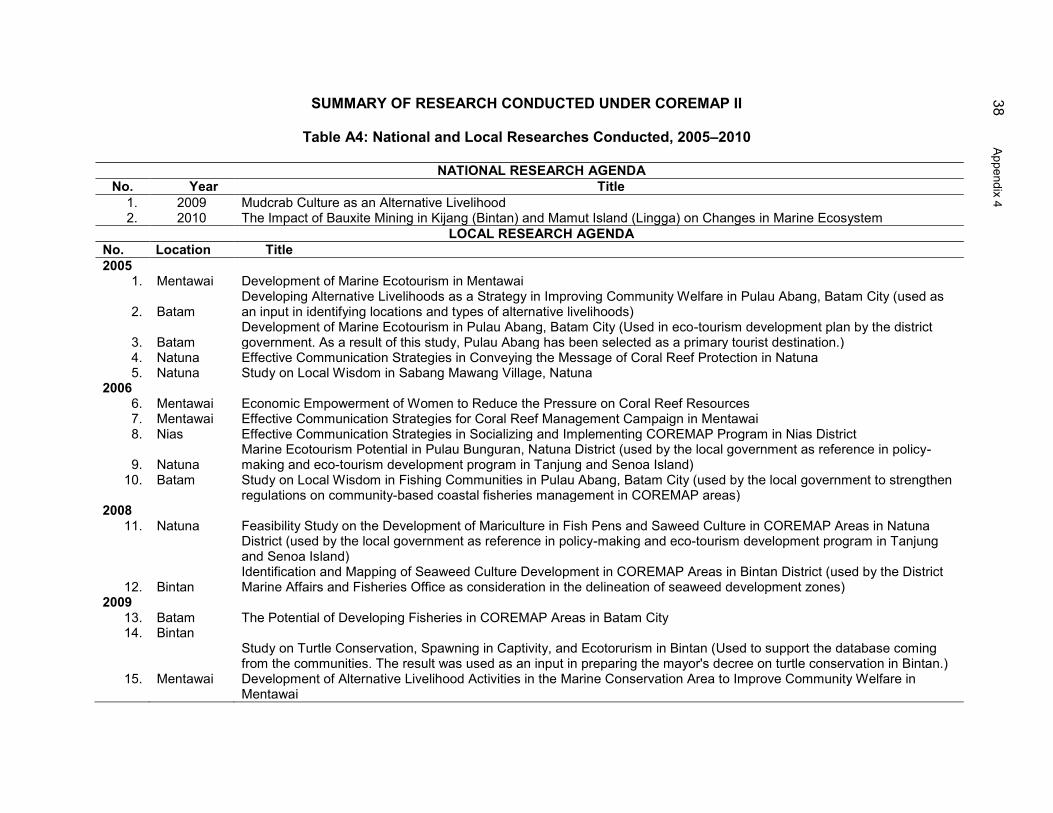
38 A
ppendix 4 SUMMARY OF RESEARCH CONDUCTED UNDER COREMAP II
Table A4: National and Local Researches Conducted, 2005–2010
NATIONAL RESEARCH AGENDA
No. Year Title 1. 2009 Mudcrab Culture as an Alternative Livelihood 2. 2010 The Impact of Bauxite Mining in Kijang (Bintan) and Mamut Island (Lingga) on Changes in Marine Ecosystem
LOCAL RESEARCH AGENDA No. Location Title 2005
1. Mentawai Development of Marine Ecotourism in Mentawai
2. Batam Developing Alternative Livelihoods as a Strategy in Improving Community Welfare in Pulau Abang, Batam City (used as an input in identifying locations and types of alternative livelihoods)
3. Batam Development of Marine Ecotourism in Pulau Abang, Batam City (Used in eco-tourism development plan by the district government. As a result of this study, Pulau Abang has been selected as a primary tourist destination.)
4. Natuna Effective Communication Strategies in Conveying the Message of Coral Reef Protection in Natuna 5. Natuna Study on Local Wisdom in Sabang Mawang Village, Natuna
2006 6. Mentawai Economic Empowerment of Women to Reduce the Pressure on Coral Reef Resources 7. Mentawai Effective Communication Strategies for Coral Reef Management Campaign in Mentawai 8. Nias Effective Communication Strategies in Socializing and Implementing COREMAP Program in Nias District
9. Natuna Marine Ecotourism Potential in Pulau Bunguran, Natuna District (used by the local government as reference in policy-making and eco-tourism development program in Tanjung and Senoa Island)
10.
Batam
Study on Local Wisdom in Fishing Communities in Pulau Abang, Batam City (used by the local government to strengthen regulations on community-based coastal fisheries management in COREMAP areas)
2008 11.
Natuna
Feasibility Study on the Development of Mariculture in Fish Pens and Saweed Culture in COREMAP Areas in Natuna District (used by the local government as reference in policy-making and eco-tourism development program in Tanjung and Senoa Island)
12. Bintan Identification and Mapping of Seaweed Culture Development in COREMAP Areas in Bintan District (used by the District Marine Affairs and Fisheries Office as consideration in the delineation of seaweed development zones)
2009 13. Batam The Potential of Developing Fisheries in COREMAP Areas in Batam City 14.
Bintan
Study on Turtle Conservation, Spawning in Captivity, and Ecotorurism in Bintan (Used to support the database coming from the communities. The result was used as an input in preparing the mayor's decree on turtle conservation in Bintan.)
15.
Mentawai
Development of Alternative Livelihood Activities in the Marine Conservation Area to Improve Community Welfare in Mentawai

Appendix 4 39
No. Location Title 16.
Tapanuli Tengah
Study on the Potential of Selected Marine Commodities in the Waters of Tapanuli Tengah (Implemented by the district government outside of the COREMAP II sites. The study has been very useful in preparing the Agromarinepolitan plan in Tapanuli Tengah, which will be implemented with funding support from the provincial government of North Sumatra.)
17. Lingga Identification and Mapping of Seaweed Culture Development in COREMAP Areas in Lingga District (used as reference in policy-making and economic development outside of COREMAP II)
2010 18.
Batam
COREMAP Areas as Center of Fisheries in Batam City (used as one of the bases in designing the fisheries development plan in the district Marine Affairs Coastal and Small Islands)
19. Bintan Marine Ecotourism as an Alternative Livelihood for the Coastal Communities in Bintan District 20. Lingga Distribution and Exploitation of Gonggong Seashells (Strombus sp) in COREMAP Areas in Lingga 21. Natuna Development and Application of Fish Smoking Techniques of Tuna-like Species in Natuna District
Source: Ministry of Marine Affairs and Fisheries.
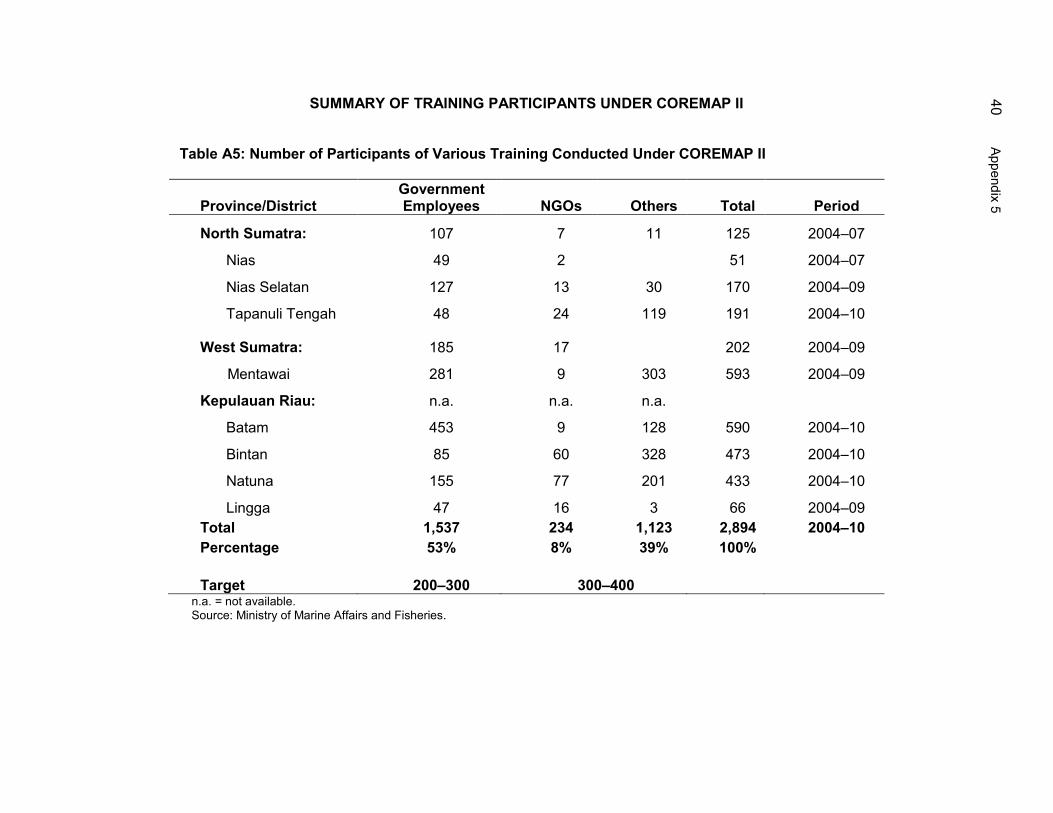
40 Appendix 5
SUMMARY OF TRAINING PARTICIPANTS UNDER COREMAP II
Table A5: Number of Participants of Various Training Conducted Under COREMAP II
Province/District Government Employees NGOs Others Total Period
North Sumatra: 107 7 11 125 2004–07
Nias 49 2 51 2004–07
Nias Selatan 127 13 30 170 2004–09
Tapanuli Tengah 48 24 119 191 2004–10 West Sumatra: 185 17 202 2004–09
Mentawai 281 9 303 593 2004–09
Kepulauan Riau: n.a. n.a. n.a.
Batam 453 9 128 590 2004–10
Bintan 85 60 328 473 2004–10
Natuna 155 77 201 433 2004–10
Lingga 47 16 3 66 2004–09 Total 1,537 234 1,123 2,894 2004–10 Percentage 53% 8% 39% 100%
Target 200–300 300–400 n.a. = not available. Source: Ministry of Marine Affairs and Fisheries.

Appendix 6 41
SUMMARY OF LPSTK MANAGEMENT AND RECIPIENTS OF ALTERNATIVE LIVELIHOOD PROJECTS BY GENDER
Table A6.1: Number of LPSTKs and LPSTKs Officers by Gender as of December 2011
No. Province/District
Total Number of
LPSTK
Total Officers of
LPSTK
Number of Male
Officers % of Male Members
Number of Female
Members
% of Female
Members
1. Nias 10 30 30 100 0 0
2. Nias Selatan 6 18 13 72 5 28
3. Tapanuli Tengah 3 9 9 100 0 0
4. Mentawai 6 62 52 84 10 16
5. Batam 7 21 19 90 2 10
6. Bintan 9 27 25 93 2 7
7. Natuna 9 51 41 80 10 20
8. Lingga 7 42 33 79 9 21
Total 57 260 222 85 38 15 LPSTK = Lembaga Pengelola Sumberdaya Terumbu Karang (Coral Reef Management Body)
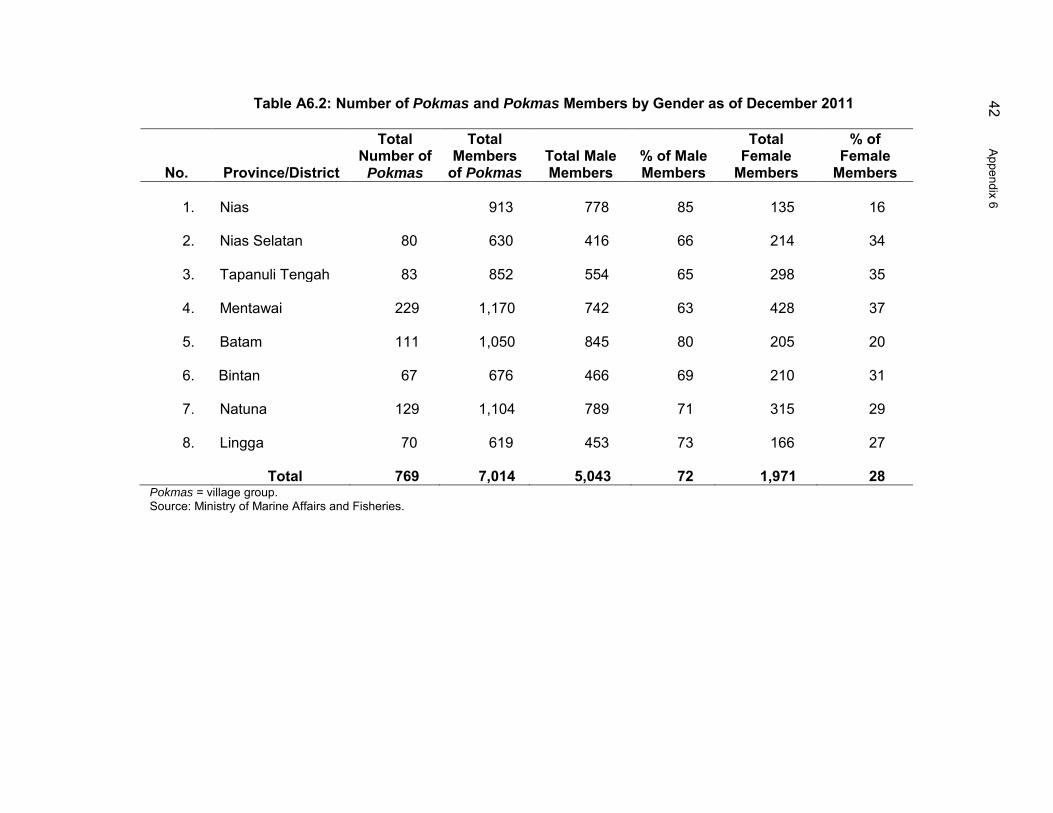
42 A
ppendix 6 Table A6.2: Number of Pokmas and Pokmas Members by Gender as of December 2011
No. Province/District
Total Number of
Pokmas
Total Members
of Pokmas Total Male Members
% of Male Members
Total Female
Members
% of Female
Members
1. Nias 913
778 85
135 16
2. Nias Selatan
80
630
416 66
214 34
3. Tapanuli Tengah
83
852
554 65
298 35
4. Mentawai
229
1,170
742 63
428 37
5. Batam
111
1,050 845 80
205 20
6. Bintan
67
676
466 69
210 31
7. Natuna
129
1,104
789 71
315 29
8. Lingga
70
619
453 73
166 27
Total
769
7,014
5,043 72
1,971 28
Pokmas = village group. Source: Ministry of Marine Affairs and Fisheries.

Appendix 7 43
SOCIAL INFRASTRUCTURE FACILITIES PROVIDED UNDER COREMAP II
Table A7: Social Infrastructure Facilities Provided under COREMAP II by District
Type of Social Infrastructure Facility
Nias
Nias Selatan
Tapanuli Tenggah
Mentawai
Batam
Bintan
Natuna
Lingga
Total
Traditional MCS Boat 10 6 3 6 7 10 9 7 58 Information Center 8 6 6 6 7 7 9 7 56 Jetty Wharf 3 3 3 6 6 5 7 6 39 Sanitation Facilities 4 3 3 6 9 0 9 8 42 Clean Water Supplies 10 4 3 4 7 2 11 2 43 Village Roads 2 2 2 2 0 1 1 3 13 Breakwater 0 0 1 0 6 0 2 0 9 Solid Waste Disposal 0 0 3 0 5 9 0 0 17 Fish Landing 0 0 0 0 0 1 0 0 1 Traditional Market 0 0 0 1 0 0 1 0 2 Reef Watcher's Post 0 0 0 6 0 1 0 0 7 Village Clinic 0 0 0 3 0 0 1 0 4 Rooms for Preschoolers 0 0 0 0 0 0 7 0 7 Total 37 24 24 40 47 36 57 33 298
Source: Ministry of Marine Affairs and Fisheries.
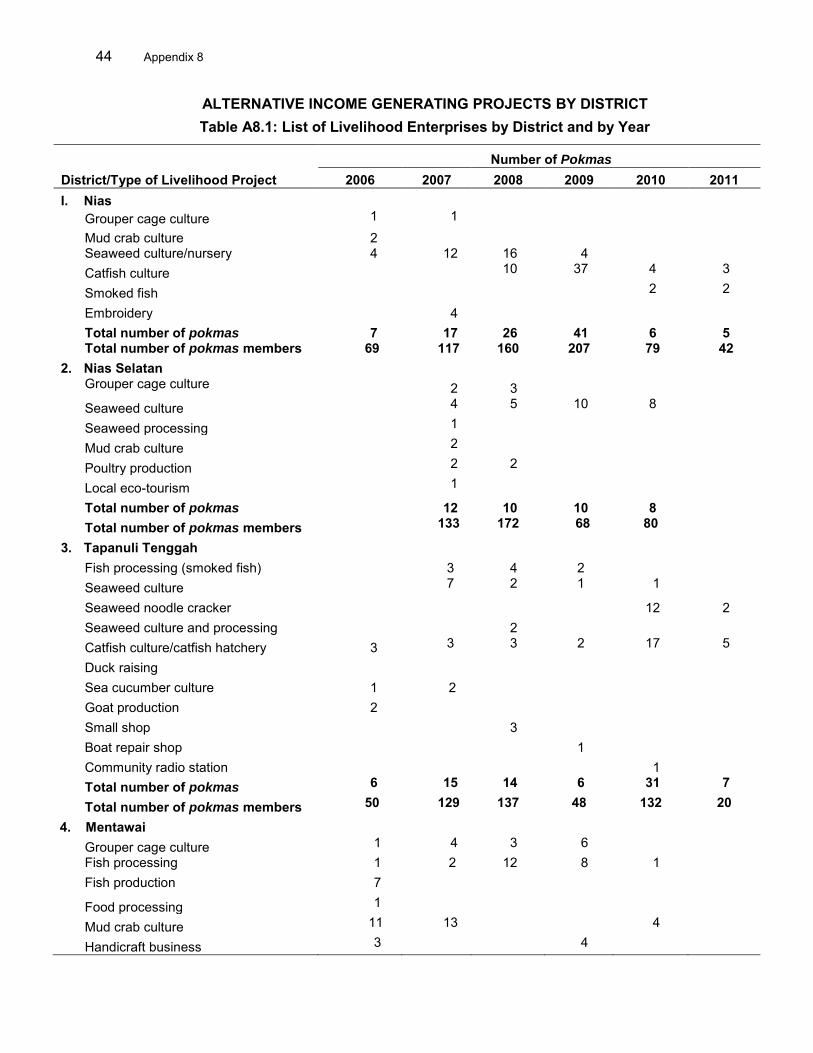
44 Appendix 8
ALTERNATIVE INCOME GENERATING PROJECTS BY DISTRICT
Table A8.1: List of Livelihood Enterprises by District and by Year
Number of Pokmas District/Type of Livelihood Project 2006 2007 2008 2009 2010 2011 I. Nias
Grouper cage culture 1 1 Mud crab culture 2 Seaweed culture/nursery 4 12 16 4 Catfish culture 10 37 4 3
Smoked fish 2 2
Embroidery 4 Total number of pokmas 7 17 26 41 6 5 Total number of pokmas members 69 117 160 207 79 42
2. Nias Selatan Grouper cage culture 2 3 Seaweed culture 4 5 10 8 Seaweed processing 1 Mud crab culture 2 Poultry production 2 2 Local eco-tourism 1 Total number of pokmas 12 10 10 8 Total number of pokmas members 133 172 68 80
3. Tapanuli Tenggah Fish processing (smoked fish) 3 4 2 Seaweed culture 7 2 1 1 Seaweed noodle cracker 12 2 Seaweed culture and processing 2 Catfish culture/catfish hatchery 3 3 3 2 17 5
Duck raising Sea cucumber culture 1 2 Goat production 2 Small shop 3 Boat repair shop 1 Community radio station 1 Total number of pokmas 6 15 14 6 31 7
Total number of pokmas members 50 129 137 48 132 20
4. Mentawai Grouper cage culture 1 4 3 6 Fish processing 1 2 12 8 1 Fish production 7 Food processing 1 Mud crab culture 11 13 4 Handicraft business 3 4

Appendix 8 45
Appendix 7 45
Number of Pokmas District/Type of Livelihood Project 2006 2007 2008 2009 2010 2011
Coconut oil processing 3 Seaweed culture 21 22 1 Village general store/small shop 1 7 Small-scale agriculture 2 Fishing 2 Ice making 1 Duck raising 6 Brick making 2 Transportation service business 9 Threrapeutic oil production 1 0 Total number of pokmas 33 47 45 47 6 Total number of pokmas members 311 331 248 253 27
5. Batam Grouper culture 11 10 23 23 35 Milkfish culture 1 Poultry 4 Small-scale agriculture 3 Fabrication of fish aggregating device 1 Handicraft/souvenir making 1 1 1 1 Fish cracker processing 12 7 2 Goat 3 Small gasoline refilling station 2 Seaweed culture 2 8 4 Seaweed processing 8 Salted fish processing 1 1 6 1
Salted egg production 1 Multi-enterprise 2 1
Total number of pokmas 35 31 32 31 45 2 Total number of pokmas members 405 424 299 187 160 10
6. Bintan Grouper/fish cage culture 1 5 8 Fish cracker processing 5 1 Fish cracker and handicraft 1 Fish processing and handicraft 1 Seaweed processing 1 1 Seaweed processing and handicraft 1 Mud crab culture 1 1 1 Handicraft making Ship workshop/body repair 1 Fish processing (salted) 4

46 Appendix 8
Number of Pokmas District/Type of Livelihood Project 2006 2007 2008 2009 2010 2011
Crab processing 2 Cake home industry 4 Seaweed culture 4 2 Maritime eco-tourism 1 Total number of pokmas 12 21 13 Total number of pokmas members 115 236 114
7. Natuna Grouper/fish cage culture 4 16 14 7 Fish cracker processing 7 Salted fish/anchovy production 8 6 2 Embroidery 3 Handicraft making 8 Coconut oil processing 6 Seaweed culture 5 10 9 Village general store/small shop 1 1 Total number of pokmas 38 17 34 18 Total number of pokmas members 233 148 266 115
8. Lingga Grouper cage/floating cage culture 14 24 62 51
Total number of pokmas 14 24 62 51
Total number of pokmas members 141 172 543 460 Pokmas = village group. Source: Ministry of Marine Affairs and Fisheries.

Appendix 9 47
Appendix 7 47
TREND OF AVERAGE HOUSEHOLD INCOME BY DISTRICT
Table A9: Trend of Average Household Income by District, 2005–2011
Location
Reached the
Target
(Household Income
Increased by
20 Percent Per
Year)
Did Not Reach the Target
(Positive Trend
of Household
Income)
Did Not Reach
the Target
(Negative
Trend of
Household
Income)
East Coast of Sumatra
Natuna (Pulau Tiga) -6.79%
Natuna (Bunguran Timur) 59.58%
Batam (Pulau Abang) 3.14%
Batam (Pulau Karas) 16.49%
Bintan (Mapur) 18.13%
Bintan (Malang Rapat) 23.06%
Bintan (Tambelang) 2.67% 2.67%
Lingga (Sekanah) -4.11%
Lingga (Limbung) 2.16%
West Coast of Sumatra
Mentawai (Tua Pejat) 10.48%
Mentawai (Sikakap) 16.34%
Mentawai ( Katurai) 4.32%
Mentawai (Samukap dan Saliguma) 29.66%
Nias (Lahewa) 2.73%
Nias (Sawo) -4.63%
Nias (Hinako) 69.45%
Nias Selatan (Botohilitano) 11.30%
Nias Selatan (Pulau Batu) -1.90%
Source: Ministry of Marine Affairs and Fisheries.

48 A
ppendix 10
APPRAISAL ESTIMATES AND ACTUAL COSTS Table A10.1: Appraisal Estimates ($‘000)
Component ADB MMAF LIPI Provinces Districts Beneficiaries Total
A. Base Cost 1. Institutional Strengthening and Project Management
1.1 National and Regional Government Institutions
1,810 290 90 20 50 0 2,260
1.2 Coral Reef Information and Training Centers
7,000 230 1,130 60 30 30 8,480
1.3 Human Resources Development and Extension
2,820 320 170 30 60 20 3,420
1.4 Project Management Support
4,070 1,130 340 30 60 30 5,660
Subtotal (1) 15,700 1,970 2,800 140 200 80 19,820 2. Community-Based Resource
Management and Development
2.1 Community Empowerment
2,940 90 190 100 240 270 3,830
2.2 Community Resource Management
4,070 280 150 80 110 400 5,090
2.3 Social Services and Infrastructure Development
5,090 230 0 110 340 450 6,220
2.4 Livelihood and Income Generation
4,520 230 0 70 380 450 5,650
Subtotal (2) 16,620 830 340 360 1,070 1,570 20,790 B. Subtotal (1+2) 32,320 2,800 3,140 500 1,270 1,650 40,610 C. Interest Charges during Implementation
680 680
Total 33,000 2,800 3,140 500 1,270 1,650 41,290

Appendix 10 49
Table A10.2: ACTUAL COSTS ($‘000)
Component ADB MMAF LIPI Provinces Districts Beneficiaries Total A. Base Cost
1. Institutional Strengthening and Project Management
1.1 National and Regional Government Institutions
1,525.0 7.0 3.0 0.3 0.7 0.0 1,536.0
1.2 Coral Reef Information and Training Centers
6,306.0 0.0 73.0 0.4 0.7 0.0 6,380.1
1.3 Human Resources Development and Extension
5,502.0 14.0 0.1 2.0 6.0 0.0 5,524.1
1.4 Project Management Support
6,262.0 81.0 14.0 7.0 31.0 0.0 6,395.0.
Subtotal (1) 19,595.0 102.0 90.1 9.7 38.4 0.0 19,835.2 2. Community-Based Resource
Management and Development
2.1 Community Empowerment
2,835.0 10.0 0.3 2.7 3.0 29.0 2,880.0
2.2 Community Resource Management
3,990.0 5.0 0.2 8.0 4.0 204.0 4,211.2
2.3 Social Services and Infrastructure Development
3,141.0 1.0 5.0 0.3 8.0 64.0 3,219.3
2.4 Livelihood and Income Generation
6,392.0 10.0 0.8 2.5 4.0 327.0 6,737.3
Subtotal (2) 16,358.0 26.0 6.3 13.5 19.0 624.0 17,046.8 B. Subtotal (1+2) 35,953.0 128.0 96.4 23.3 57.4 624.0 36,882.0 C. Interest Charges during
Implementation 789.0 789.0
Total 36,742.0 128.0 96.4 23.3 57.4 624.0 37,671.0
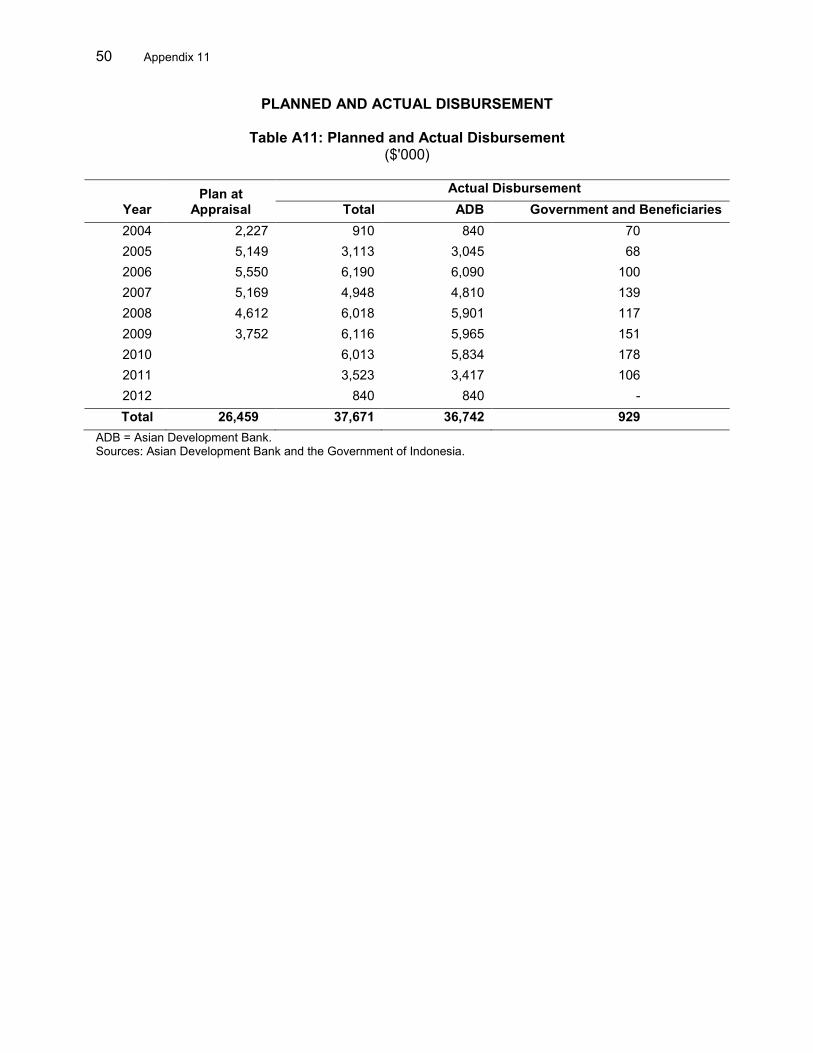
50 Appendix 11
PLANNED AND ACTUAL DISBURSEMENT
Table A11: Planned and Actual Disbursement ($'000)
Year Plan at
Appraisal Actual Disbursement
Total ADB Government and Beneficiaries 2004 2,227 910 840 70 2005 5,149 3,113 3,045 68 2006 5,550 6,190 6,090 100 2007 5,169 4,948 4,810 139 2008 4,612 6,018 5,901 117 2009 3,752 6,116 5,965 151 2010 6,013 5,834 178 2011 3,523 3,417 106 2012 840 840 - Total 26,459 37,671 36,742 929
ADB = Asian Development Bank. Sources: Asian Development Bank and the Government of Indonesia.
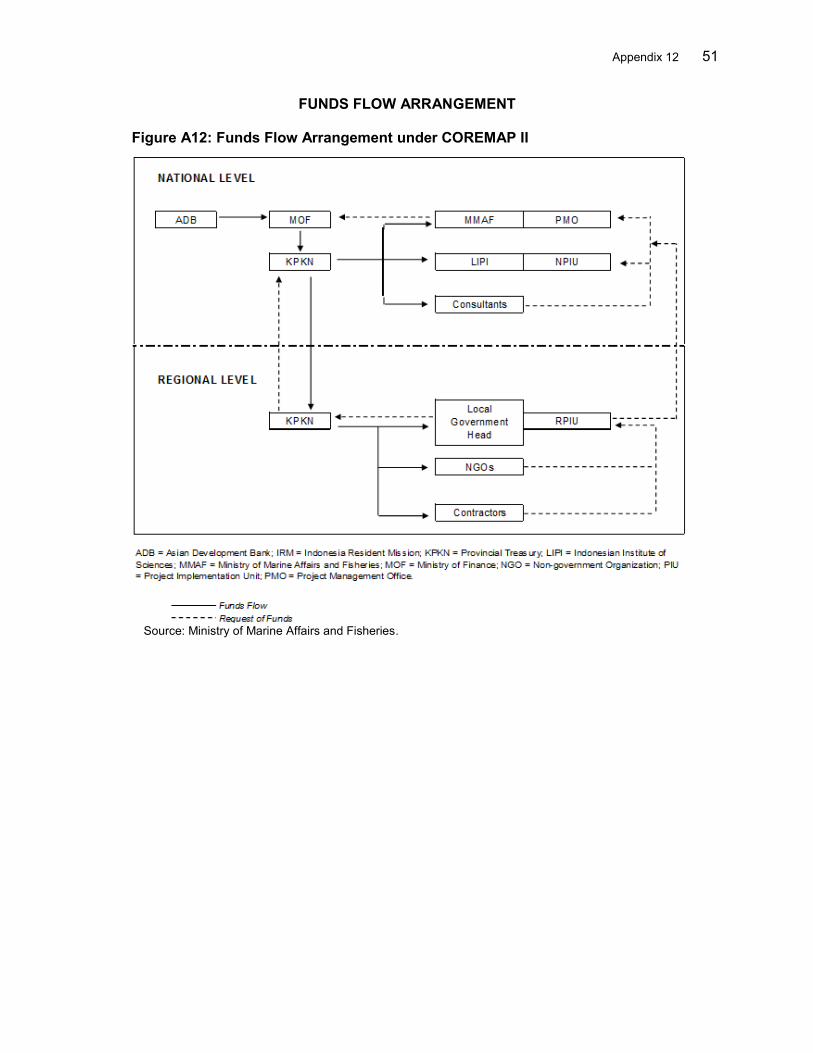
Appendix 12 51
FUNDS FLOW ARRANGEMENT
Figure A12: Funds Flow Arrangement under COREMAP II
Source: Ministry of Marine Affairs and Fisheries.
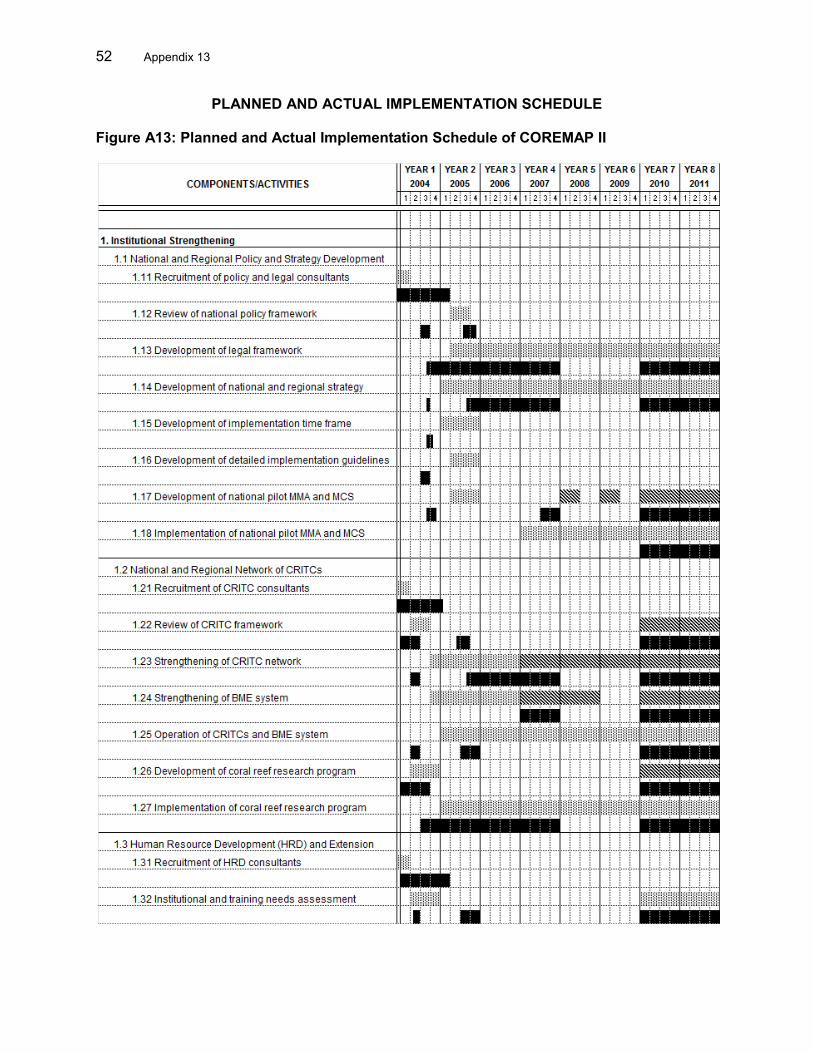
52 Appendix 13
PLANNED AND ACTUAL IMPLEMENTATION SCHEDULE
Figure A13: Planned and Actual Implementation Schedule of COREMAP II
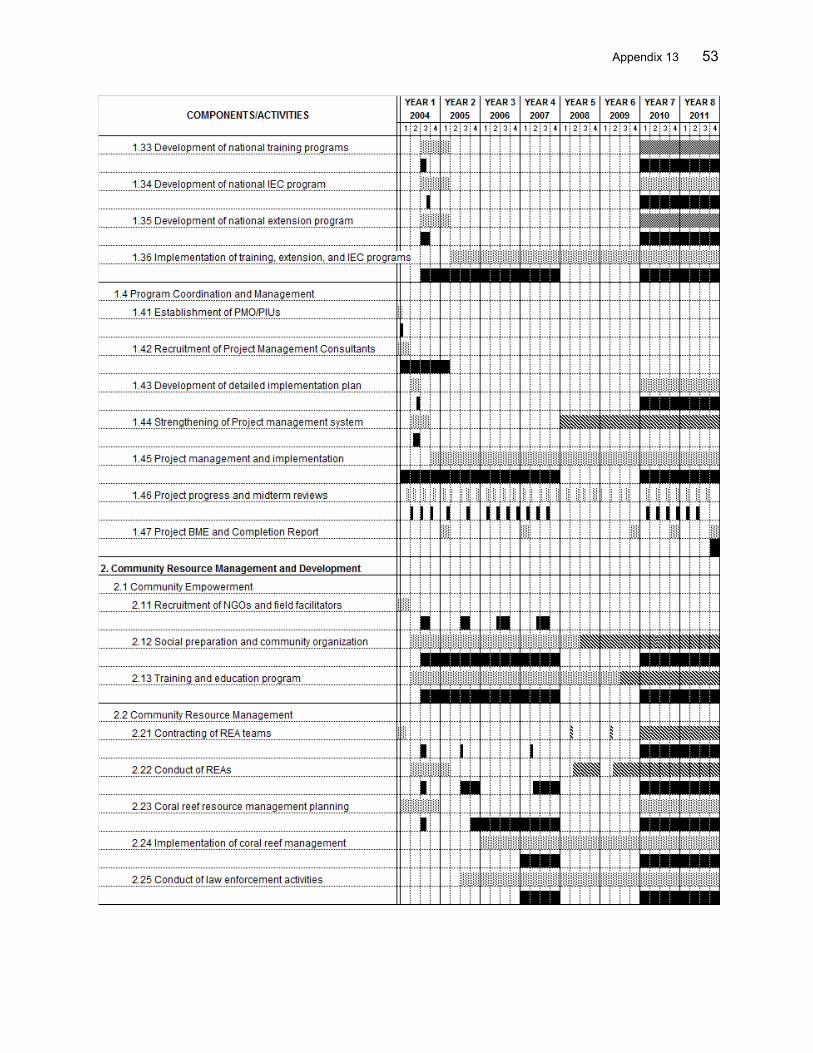
Appendix 13 53

54 Appendix 13
CRITC = coral reef information and training center; HRD = human resource development; IEC = information, education, and communication; MCS = monitoring, control, and surveillance; MPA = marine protected area; NGO = nongovernment organization; REA = resource and ecological assessment; SEA = socioeconomic assessment.
Original Plan
Revised Plan
Actual
Source: Ministry of Marine Affairs and Fisheries.
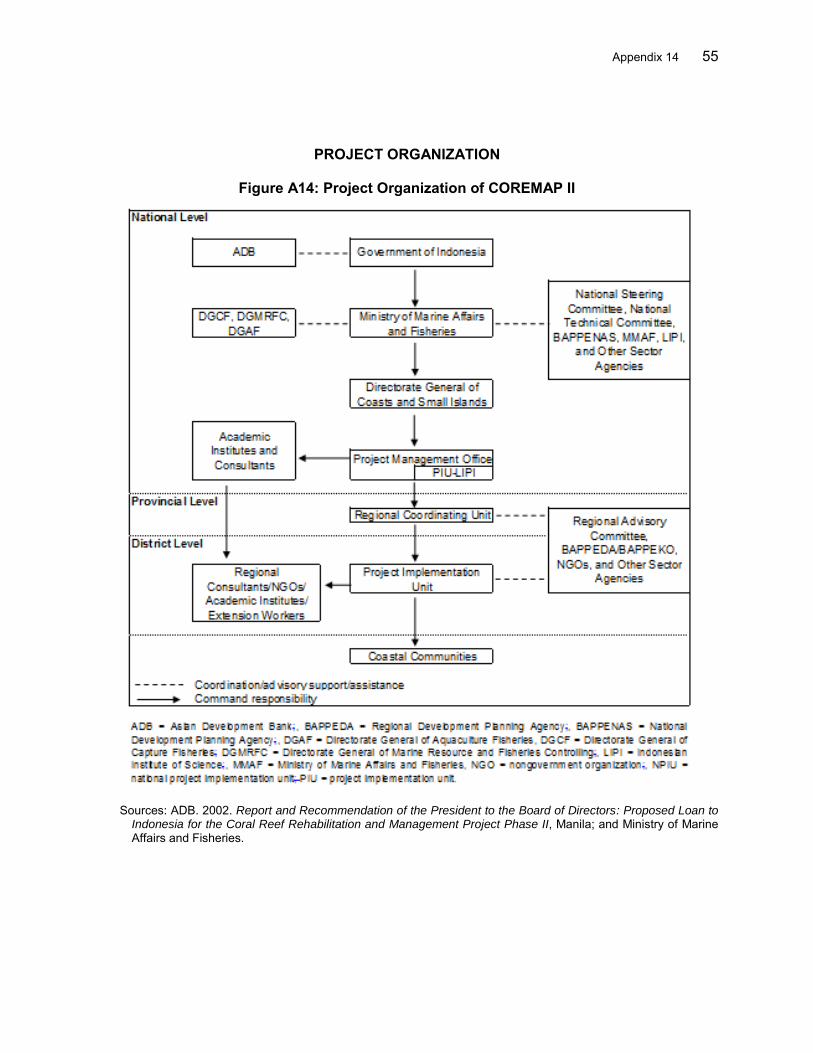
Appendix 14 55
PROJECT ORGANIZATION
Figure A14: Project Organization of COREMAP II
Sources: ADB. 2002. Report and Recommendation of the President to the Board of Directors: Proposed Loan to
Indonesia for the Coral Reef Rehabilitation and Management Project Phase II, Manila; and Ministry of Marine Affairs and Fisheries.
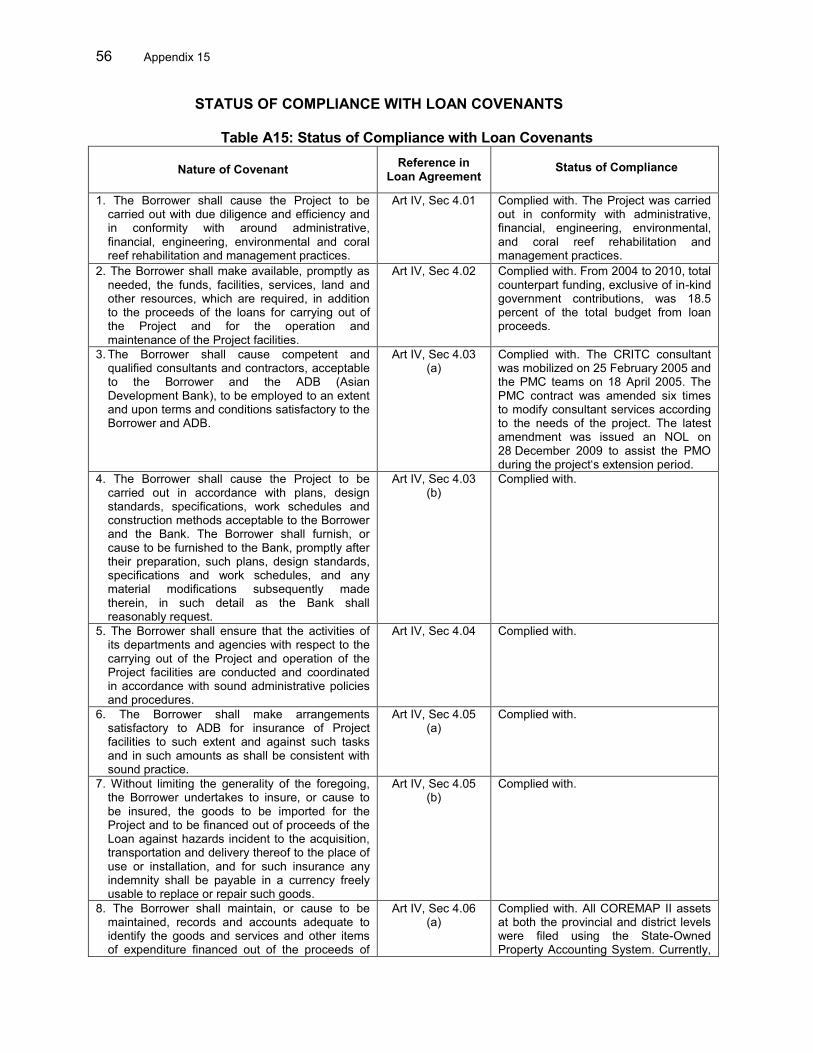
56 Appendix 15
STATUS OF COMPLIANCE WITH LOAN COVENANTS
Table A15: Status of Compliance with Loan Covenants
Nature of Covenant Reference in Loan Agreement
Status of Compliance
1. The Borrower shall cause the Project to be carried out with due diligence and efficiency and in conformity with around administrative, financial, engineering, environmental and coral reef rehabilitation and management practices.
Art IV, Sec 4.01 Complied with. The Project was carried out in conformity with administrative, financial, engineering, environmental, and coral reef rehabilitation and management practices.
2. The Borrower shall make available, promptly as needed, the funds, facilities, services, land and other resources, which are required, in addition to the proceeds of the loans for carrying out of the Project and for the operation and maintenance of the Project facilities.
Art IV, Sec 4.02 Complied with. From 2004 to 2010, total counterpart funding, exclusive of in-kind government contributions, was 18.5 percent of the total budget from loan proceeds.
3. The Borrower shall cause competent and qualified consultants and contractors, acceptable to the Borrower and the ADB (Asian Development Bank), to be employed to an extent and upon terms and conditions satisfactory to the Borrower and ADB.
Art IV, Sec 4.03 (a)
Complied with. The CRITC consultant was mobilized on 25 February 2005 and the PMC teams on 18 April 2005. The PMC contract was amended six times to modify consultant services according to the needs of the project. The latest amendment was issued an NOL on 28 December 2009 to assist the PMO during the project‘s extension period.
4. The Borrower shall cause the Project to be carried out in accordance with plans, design standards, specifications, work schedules and construction methods acceptable to the Borrower and the Bank. The Borrower shall furnish, or cause to be furnished to the Bank, promptly after their preparation, such plans, design standards, specifications and work schedules, and any material modifications subsequently made therein, in such detail as the Bank shall reasonably request.
Art IV, Sec 4.03 (b)
Complied with.
5. The Borrower shall ensure that the activities of its departments and agencies with respect to the carrying out of the Project and operation of the Project facilities are conducted and coordinated in accordance with sound administrative policies and procedures.
Art IV, Sec 4.04
Complied with.
6. The Borrower shall make arrangements satisfactory to ADB for insurance of Project facilities to such extent and against such tasks and in such amounts as shall be consistent with sound practice.
Art IV, Sec 4.05 (a)
Complied with.
7. Without limiting the generality of the foregoing, the Borrower undertakes to insure, or cause to be insured, the goods to be imported for the Project and to be financed out of proceeds of the Loan against hazards incident to the acquisition, transportation and delivery thereof to the place of use or installation, and for such insurance any indemnity shall be payable in a currency freely usable to replace or repair such goods.
Art IV, Sec 4.05 (b)
Complied with.
8. The Borrower shall maintain, or cause to be maintained, records and accounts adequate to identify the goods and services and other items of expenditure financed out of the proceeds of
Art IV, Sec 4.06 (a)
Complied with. All COREMAP II assets at both the provincial and district levels were filed using the State-Owned Property Accounting System. Currently,
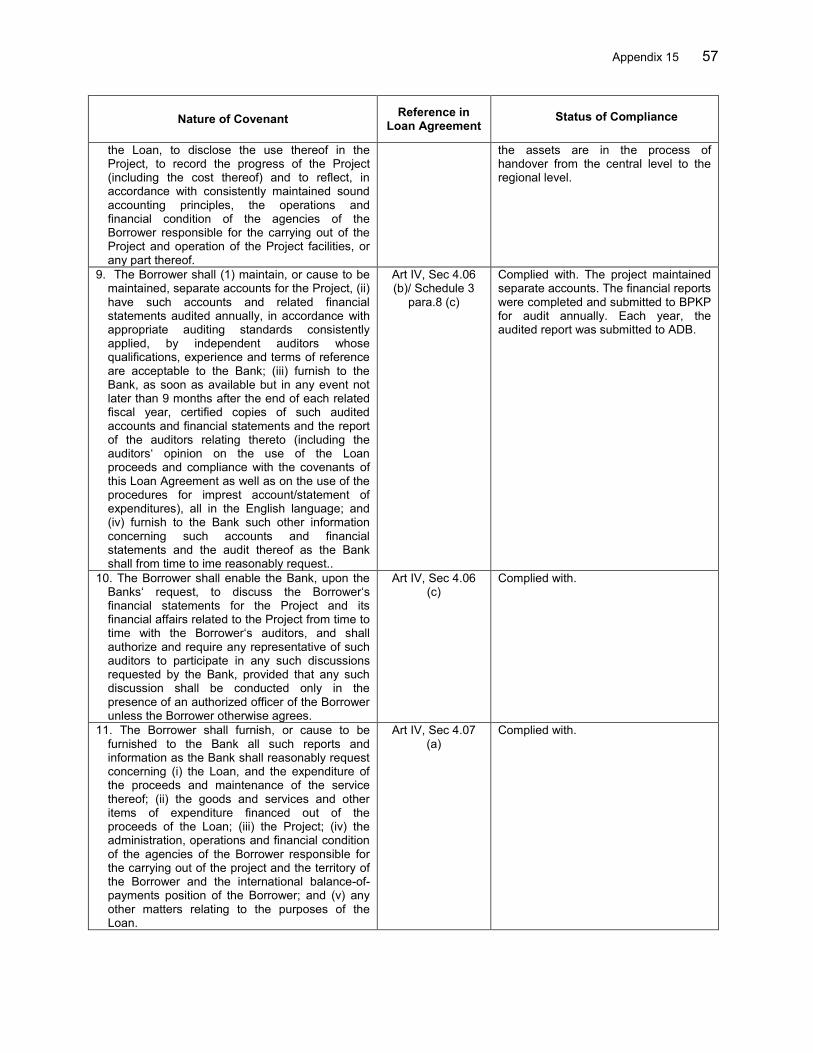
Appendix 15 57
Nature of Covenant Reference in Loan Agreement
Status of Compliance
the Loan, to disclose the use thereof in the Project, to record the progress of the Project (including the cost thereof) and to reflect, in accordance with consistently maintained sound accounting principles, the operations and financial condition of the agencies of the Borrower responsible for the carrying out of the Project and operation of the Project facilities, or any part thereof.
the assets are in the process of handover from the central level to the regional level.
9. The Borrower shall (1) maintain, or cause to be maintained, separate accounts for the Project, (ii) have such accounts and related financial statements audited annually, in accordance with appropriate auditing standards consistently applied, by independent auditors whose qualifications, experience and terms of reference are acceptable to the Bank; (iii) furnish to the Bank, as soon as available but in any event not later than 9 months after the end of each related fiscal year, certified copies of such audited accounts and financial statements and the report of the auditors relating thereto (including the auditors‘ opinion on the use of the Loan proceeds and compliance with the covenants of this Loan Agreement as well as on the use of the procedures for imprest account/statement of expenditures), all in the English language; and (iv) furnish to the Bank such other information concerning such accounts and financial statements and the audit thereof as the Bank shall from time to ime reasonably request..
Art IV, Sec 4.06 (b)/ Schedule 3
para.8 (c)
Complied with. The project maintained separate accounts. The financial reports were completed and submitted to BPKP for audit annually. Each year, the audited report was submitted to ADB.
10. The Borrower shall enable the Bank, upon the Banks‘ request, to discuss the Borrower‘s financial statements for the Project and its financial affairs related to the Project from time to time with the Borrower‘s auditors, and shall authorize and require any representative of such auditors to participate in any such discussions requested by the Bank, provided that any such discussion shall be conducted only in the presence of an authorized officer of the Borrower unless the Borrower otherwise agrees.
Art IV, Sec 4.06 (c)
Complied with.
11. The Borrower shall furnish, or cause to be furnished to the Bank all such reports and information as the Bank shall reasonably request concerning (i) the Loan, and the expenditure of the proceeds and maintenance of the service thereof; (ii) the goods and services and other items of expenditure financed out of the proceeds of the Loan; (iii) the Project; (iv) the administration, operations and financial condition of the agencies of the Borrower responsible for the carrying out of the project and the territory of the Borrower and the international balance-of-payments position of the Borrower; and (v) any other matters relating to the purposes of the Loan.
Art IV, Sec 4.07 (a)
Complied with.

58 Appendix 15
Nature of Covenant Reference in Loan Agreement
Status of Compliance
12. Without limiting the generality of the foregoing, the Borrower shall furnish, or cause to be furnished, to the Bank quarterly reports on the carrying out of the Project and on the operation and management of the Project facilities. Such reports shall be submitted in such form and in such detail and within such a period as the Bank shall reasonably request, and shall indicate, among other things, progress made and problems encountered during the quarter under review, steps taken or proposed to be taken to remedy these problems, and proposed program of activities and expected progress during the following quarter.
Art IV, Sec 4.07 (b)
Complied with.
13. Promptly after physical completion of the Project, but in any event not later than three (3) months thereafter or such later date as may be agreed for this purpose between the Borrower and the Bank, the Borrower shall prepare and furnish to the Bank a report, in such form and in such detail as the Bank shall reasonably request, on the execution and initial operation of the Project, including its cost, the performance by the Borrower of its obligations under this Loan Agreement and the accomplishment of the purposes of the Loan.
Art IV, Sec 4.07 (c)
Partly complied with and late. Draft PCR submitted to ADB in late June 2012, but the final English version of the report has not yet been submitted.
14. The Borrower shall enable the Bank‘s representative to inspect the Project, the goods financed out of the proceeds of the loan, and any relevant records and documents.
Art IV, Sec 4.08
Complied with.
15. The Borrower shall ensure that the Project facilities are operated, maintained and repaired in accordance with sound administrative, financial, engineering, environmental, and coral reef rehabilitation and management maintenance and operational practices.
Art IV, Sec 4.09
Complied with.
16. It is the mutual intention of the Borrower and the Bank that no other external debt owed a creditor other than the Bank shall have any priority over the Loan by way of a lien on the assets of the Borrower. To that end, the Borrower undertakes (i) that, except as the Bank may otherwise agree, if any lien shall be created on any assets of the Borrower as security for any external debt, such lien will ipso facto equally and ratably secure the payment of the principal of, and interest charge and any other charge on, the Loan; and (ii) that the Borrower, in creating or permitting the creation of any such lien, will make express provision to that effect.
Art IV, Sec 4.10 (a)
Complied with.
17. The provisions of paragraph (a) of this Section shall not apply to (i) any lien created on property, at the time of purchase thereof, solely as security for payment of the purchase price of such property; or (ii) any lien arising in the ordinary course of banking transactions and securing a debt maturing not more than one year after its date.
Art IV, Sec 4.10 (b)
Complied with.
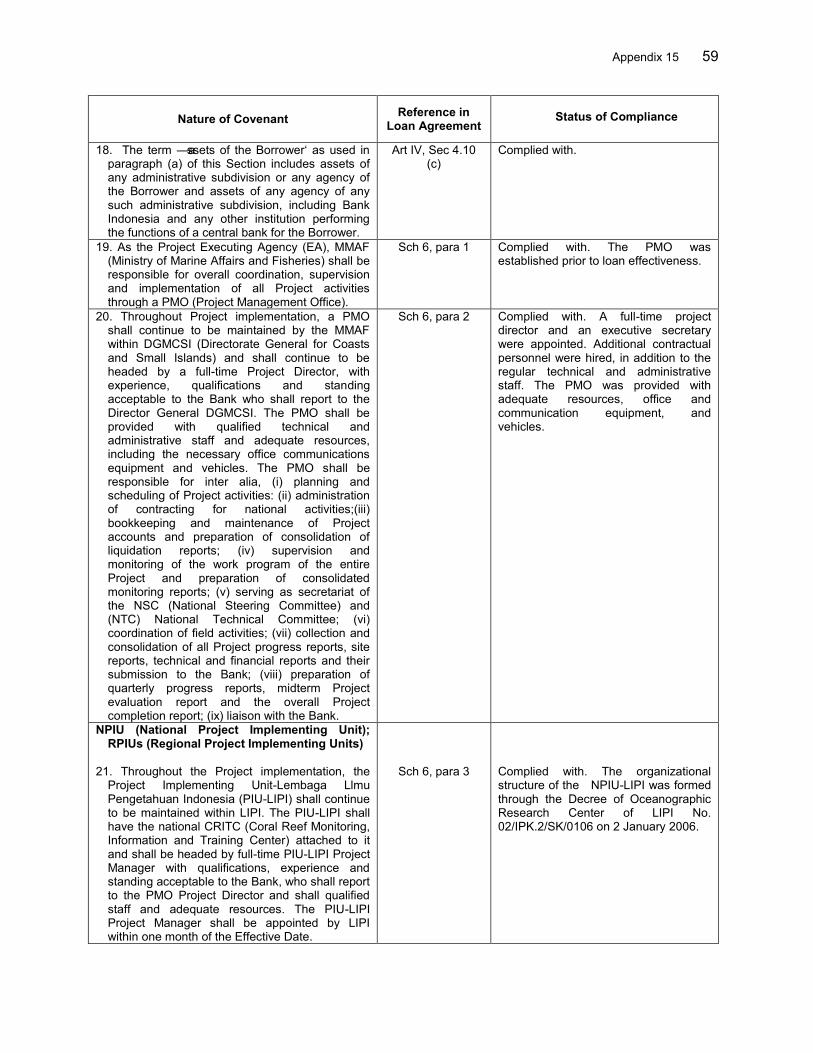
Appendix 15 59
Nature of Covenant Reference in Loan Agreement
Status of Compliance
18. The term ―assets of the Borrower‘ as used in paragraph (a) of this Section includes assets of any administrative subdivision or any agency of the Borrower and assets of any agency of any such administrative subdivision, including Bank Indonesia and any other institution performing the functions of a central bank for the Borrower.
Art IV, Sec 4.10 (c)
Complied with.
19. As the Project Executing Agency (EA), MMAF (Ministry of Marine Affairs and Fisheries) shall be responsible for overall coordination, supervision and implementation of all Project activities through a PMO (Project Management Office).
Sch 6, para 1
Complied with. The PMO was established prior to loan effectiveness.
20. Throughout Project implementation, a PMO shall continue to be maintained by the MMAF within DGMCSI (Directorate General for Coasts and Small Islands) and shall continue to be headed by a full-time Project Director, with experience, qualifications and standing acceptable to the Bank who shall report to the Director General DGMCSI. The PMO shall be provided with qualified technical and administrative staff and adequate resources, including the necessary office communications equipment and vehicles. The PMO shall be responsible for inter alia, (i) planning and scheduling of Project activities: (ii) administration of contracting for national activities;(iii) bookkeeping and maintenance of Project accounts and preparation of consolidation of liquidation reports; (iv) supervision and monitoring of the work program of the entire Project and preparation of consolidated monitoring reports; (v) serving as secretariat of the NSC (National Steering Committee) and (NTC) National Technical Committee; (vi) coordination of field activities; (vii) collection and consolidation of all Project progress reports, site reports, technical and financial reports and their submission to the Bank; (viii) preparation of quarterly progress reports, midterm Project evaluation report and the overall Project completion report; (ix) liaison with the Bank.
Sch 6, para 2
Complied with. A full-time project director and an executive secretary were appointed. Additional contractual personnel were hired, in addition to the regular technical and administrative staff. The PMO was provided with adequate resources, office and communication equipment, and vehicles.
NPIU (National Project Implementing Unit); RPIUs (Regional Project Implementing Units)
21. Throughout the Project implementation, the
Project Implementing Unit-Lembaga Llmu Pengetahuan Indonesia (PIU-LIPI) shall continue to be maintained within LIPI. The PIU-LIPI shall have the national CRITC (Coral Reef Monitoring, Information and Training Center) attached to it and shall be headed by full-time PIU-LIPI Project Manager with qualifications, experience and standing acceptable to the Bank, who shall report to the PMO Project Director and shall qualified staff and adequate resources. The PIU-LIPI Project Manager shall be appointed by LIPI within one month of the Effective Date.
Sch 6, para 3
Complied with. The organizational structure of the NPIU-LIPI was formed through the Decree of Oceanographic Research Center of LIPI No. 02/IPK.2/SK/0106 on 2 January 2006.

60 Appendix 15
Nature of Covenant Reference in Loan Agreement
Status of Compliance
22. Throughout the Project implementation, a RPIU shall continue to be maintained in each of the Project Districts. Each RPIU, which shall be maintained at the Dinas Kelautan Dan Perikanan by the concerned Bupati (Mayor) or Walikota, shall have a regional CRITC attached to it. Where there is an existing PIU at the BAPPEDA (Badan Perencanaan Pembanguhan Daerah) under the COREMAP (Coral Reef Management Project) I Loan, that PIU shall continue as a RPIU at the BAPPEDA. Each RPIU shall be headed by a full-time RPIU Project Manage, with qualifications, experience and standing acceptable to the Bank, who shall report to the PMO Project Director. ALL RPIU Project Mangers shall be appointed by the Bupati or Wlikota within one month after the Effective Date. Each RPIU shall be staffed with qualified staff seconded from the BAPPEDAs, the Dinas Kelautan Dan Perikanan, and other relevant district agencies involved in coastal resource management. The RPIUs shall also as be staffed as needed, by qualified personnel from the private sector, who may be recruited from contractual employees of the RPIU. The PRIUs shall coordinate with, inter alia, the Bureau of Walikota, Bupati‘s or Walikota‘s staff, BAPPEDAs, Dinas Kelautan Dan Perikanan and village government heads at the project sites.
Sch 6, para 4
23. The Implementing Units shall be responsible for overseeing and coordinating the implementation of Project activities in the field, including, (i) planning the work program, administering contracting services, maintaining Project accounts for monitoring Project expenses, and preparing liquidation reports; (ii) supervising and maintaining the work program for specific components and activities; (iii) preparing local progress reports and monitoring reports for submission to the PMO, including Project progress, technical and financial reports covering the specific activities, and field data and feedback from local participating agencies; (iv) providing technical advice and assistance to local government agencies on the technical aspects of the Project; and (v) coordinating the specific national and local activities of the different project implementers.
Sch 6, para 5
Complied with.
NSC (National Steering Committee); RAC (Regional Advisory Committee)
24. The Borrower shall ensure that a national-level
interagency NSC shall continue to be maintained to, inter alia, guide the overall direction of the Project, ensure overall coordination of the Project and other Borrower programs and projects, follow up on implementation impediments and provide policy guidance as needed. The NSC shall be chaired by the Deputy Chairman, Natural
Sch 6, para 6
Partly complied with. The NSC and NTC were formed through MMAF Decree No. KEP.11 /MEN/2005, dated 24 June 2005. The NTC and NSC met only 3 three times during the project implementation period.
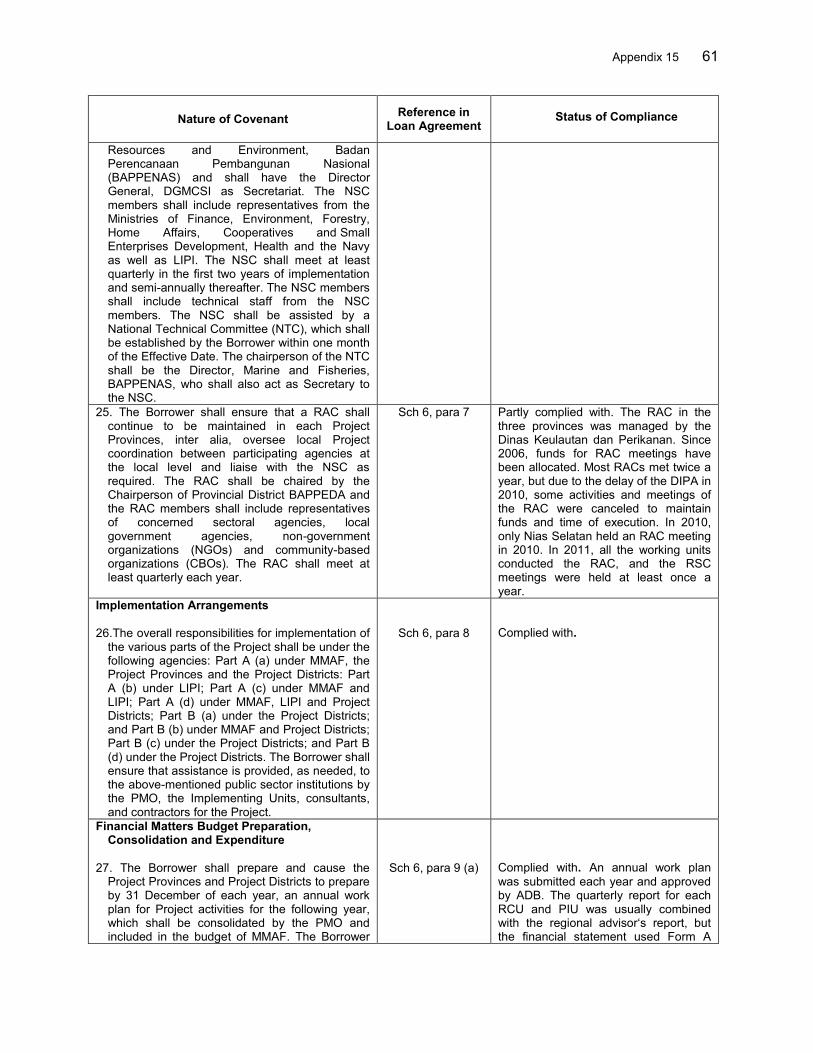
Appendix 15 61
Nature of Covenant Reference in Loan Agreement
Status of Compliance
Resources and Environment, Badan Perencanaan Pembangunan Nasional (BAPPENAS) and shall have the Director General, DGMCSI as Secretariat. The NSC members shall include representatives from the Ministries of Finance, Environment, Forestry, Home Affairs, Cooperatives and Small Enterprises Development, Health and the Navy as well as LIPI. The NSC shall meet at least quarterly in the first two years of implementation and semi-annually thereafter. The NSC members shall include technical staff from the NSC members. The NSC shall be assisted by a National Technical Committee (NTC), which shall be established by the Borrower within one month of the Effective Date. The chairperson of the NTC shall be the Director, Marine and Fisheries, BAPPENAS, who shall also act as Secretary to the NSC.
25. The Borrower shall ensure that a RAC shall continue to be maintained in each Project Provinces, inter alia, oversee local Project coordination between participating agencies at the local level and liaise with the NSC as required. The RAC shall be chaired by the Chairperson of Provincial District BAPPEDA and the RAC members shall include representatives of concerned sectoral agencies, local government agencies, non-government organizations (NGOs) and community-based organizations (CBOs). The RAC shall meet at least quarterly each year.
Sch 6, para 7
Partly complied with. The RAC in the three provinces was managed by the Dinas Keulautan dan Perikanan. Since 2006, funds for RAC meetings have been allocated. Most RACs met twice a year, but due to the delay of the DIPA in 2010, some activities and meetings of the RAC were canceled to maintain funds and time of execution. In 2010, only Nias Selatan held an RAC meeting in 2010. In 2011, all the working units conducted the RAC, and the RSC meetings were held at least once a year.
Implementation Arrangements 26.The overall responsibilities for implementation of
the various parts of the Project shall be under the following agencies: Part A (a) under MMAF, the Project Provinces and the Project Districts: Part A (b) under LIPI; Part A (c) under MMAF and LIPI; Part A (d) under MMAF, LIPI and Project Districts; Part B (a) under the Project Districts; and Part B (b) under MMAF and Project Districts; Part B (c) under the Project Districts; and Part B (d) under the Project Districts. The Borrower shall ensure that assistance is provided, as needed, to the above-mentioned public sector institutions by the PMO, the Implementing Units, consultants, and contractors for the Project.
Sch 6, para 8
Complied with.
Financial Matters Budget Preparation, Consolidation and Expenditure
27. The Borrower shall prepare and cause the
Project Provinces and Project Districts to prepare by 31 December of each year, an annual work plan for Project activities for the following year, which shall be consolidated by the PMO and included in the budget of MMAF. The Borrower
Sch 6, para 9 (a)
Complied with. An annual work plan was submitted each year and approved by ADB. The quarterly report for each RCU and PIU was usually combined with the regional advisor‘s report, but the financial statement used Form A

62 Appendix 15
Nature of Covenant Reference in Loan Agreement
Status of Compliance
shall ensure that the Ministry of Finance shall approve the annual expenditure plan for the Project and shall provide each level of the Project management structure, namely, the PMO, PIU-LIPI, and RPIUs, with an annual spending target for their respective Project activities.
from the MCSI. The MOF approved Annual expenditure plans for the project during the implementation period
28. The Borrower shall ensure and cause to ensure that the budget preparation and consolidation process for the Project under para. 9(a) of this Schedule shall, (i) obtain timely and regular inputs from defined levels of Project management, namely the PMO, PIU-LIPI and RPIUs; and (ii) be consistent with the Project‘s overall project procurement plan, which shall identify procurement activities of each level of Project.
Sch 6, para 9 (b)
Complied with. Annual spending plan for each year was discussed with the RCUs, PIUs, and PMO.
29. The Borrower shall ensure that by April 2003, (i) the PMO, in consultation with LIPI and the Project provinces, shall nominate authorized signatories at each level of the Project management; and (ii) the copy of the authorized signatories and approved DIP shall be sent by the Ministry of Finance to the respective Project District Treasury Offices of the Ministry of Finance known as Kantor Perbendaharaan Dan Kas Negara (KPKNs). The Borrower shall cause the system of authorized signatories to be established at each level of the Project management in accordance with paragraph 9 of this Schedule to ensure access to and management of Project funds through KPKN operating accounts within the allocated budget without requiring approval from the PMO for each expenditure.
Sch 6, para 9 (c)
Slightly delayed compliance. Signatories were nominated. For 2011, the Minister of MMAF signed ministerial decrees authorizing various signatories KPA for COREMAP transactions at different levels of management.
Counterpart Funds 30. The Borrower shall ensure that during each
year of Project implementation adequate budgetary allocation of all necessary counterpart funds shall be provided in a timely manner and, to such end, the Borrower shall make timely submissions of annual budgetary appropriation requests, including funding for annual operations and maintenance expenditure required after Project completion. The Borrower shall further take all necessary or appropriate measures for prompt disbursement of appropriate funds on a timely and regular basis to the PMO, PIU-LIPI and RPIUs during each year of Project implementation.
Sch 6, para 10
Complied with late in some years. Counterpart funds for FY2004 and 2005 were adequate, but provided late. Counterpart funds for PMO and PIU-LIPI in 2006 and 2007 were adequate. Counterpart funds for RCUs and PIUs were approved by their local parliaments and local DIPAS were issued. The 2008 counterpart fund for project districts and provinces was adequate and approved by their respective parliaments. Counterpart budgets in 2009, 2010, and 2011 were considered adequate in most districts except West Sumatra and Nias Selatan.
Earmarked Funds 31. Except as the ADB may otherwise agree, and
without limitation to the generality of Section 4.02 of this Loan Agreement, the Borrower shall ensure that, throughout the period of Project implementation, the proceeds of the loan, and
Sch 6, para 11
Complied with. The DIPAs of PMO, NPIU-LIPI, RCUs, and PIUs for 2010 were approved on various dates from December. Official transfer to PMO and the various implementing units was

Appendix 15 63
Nature of Covenant Reference in Loan Agreement
Status of Compliance
the corresponding amounts of necessary counterpart funds, shall be disbursed to the PMO, PIU-LIPI and to the RPIUs for the respective Project Districts, by budgetary transfer of funds earmarked for such purpose.
issued in January 2011.
32. The Borrower shall ensure that the provision of funds from the proceeds of the Loan, and the corresponding counterpart contributions, necessary for financing Project activities shall continue throughout the period of Project implementation notwithstanding, (i) any reallocation of authority or responsibility for channeling of external assistance, and for the provision of corresponding counterpart contributions between the Borrower, the PIU-LIPI, Project Provinces, and Project Districts; or (ii) any requirement for the provision of matching counterpart contributions for funding Project activities from Project Provinces or Project Districts arising out of the implementation of Laws 22 and 25, unless otherwise agreed by the ADB.
Sch 6, para 12
Complied with. Counterpart fund contributions at the provincial and district levels were used for MCS operation (e.g., training of community groups and security personnel), BME activity, hiring or recruitment of additional personnel, and AIG activities, among others.
33. The Borrower shall ensure that upon the completion of the Project, the Project activities shall be sustained and, inter alia, incorporated into the planning and budgetary processes of the Borrower, the Project Provinces and Project Districts, and shall receive adequate budgetary allocations, infrastructure and qualified staff.
Sch 6, para 13
Complied with. Sustainability workshops were conducted with various local governments to get their commitment and draw approaches on how to sustain the project upon loan closing date. After the termination of COREMAP II, each PIU in seven districts with the exception of Nias Selatan provided funds for MCS operation, hiring of a CREEL enumerator, and operation of regional MMAs, among others. Moreover, most of the strategic plans for coral reef management have been included in the local medium-term development plans or RPJM.
Microenterprises and Income-Generating Activities
34. The Borrower shall ensure, or shall cause the Project Provinces and Project Districts to ensure, that Loan proceeds under Part B(d) [Community Livelihood and Income Generation] of the Project shall not directly finance or provide grants to microenterprises and income-generating activities, but shall, inter alia, finance social preparation activities through village development plans. The Borrower shall further ensure, or cause the Project Provinces and Project Provinces to ensure, that income-generation activities under the Project shall only be conducted in communities into which the Project is invited
Sch 6, para 14
Complied with. Support to microenterprises was provided through community contracts with LPSTKs, which provided input and technical assistance to the pokmas. Income-generating activities were in accordance with the RPTKs or CRMPs prepared by the communities.
Gender 35. The Borrower shall ensure, or shall cause the
Project Provinces and Project Districts to ensure,
Sch 6, para 15
Complied with. Women were always represented in pokmas, training

64 Appendix 15
Nature of Covenant Reference in Loan Agreement
Status of Compliance
that the gender action plan developed for the Project is complied with, so that there shall be (i) equal opportunity for men and women in Project activities, including community resource management, income-generation and community livelihood programs and micro-financing schemes under Part B of the Project; (ii) formation and strengthening of CBOs under the Project with equal opportunity for men and women to be members and assume leadership functions; (iii) to prioritize appointment of women as managerial staff to the PMO, PIU-LIPI and RPIUs; (iv) to prioritize fielding of women as facilitators and community organizers by NGOs under the Project; (v) inclusion of women in national and regional public sector institutions participating in the Project in training programs under Part A(c) of the Project; and (vi) preference for women Project beneficiaries in microenterprise training, with inclusion of access to women as a criterion for all training courses under the Project.
activities, and in the management of LPSTKs and community groups. Of the 7,014 members, about 28% were women. Women accounted for 25% of the total number of training participants. In addition, 28% of women were involved in Input Assistance for Livelihood Development. Even in the LPSTKs, 15% of the LPSTK officers were women. There were 15 women managers or leaders of community groups in Nias District and 28 in Tapanuli Tengah District. Women participated in village organizations and pokmas mostly as treasurer and secretary. More than 30% of leader organizations in PMOs, PIUs, LIPI, and RPIUs were women. Women have flexibility to perform alternative livelihood activities so as not to sacrifice their responsibilities at home.
Indigenous Peoples 36. The Borrower shall ensure, or shall cause the
Project Provinces and Project Districts to ensure, that all necessary measures shall be taken under the Project with regard to indigenous people in accordance with the Indigenous Peoples Development Plan Framework (IPDF) for the Project, and the ADB‘s Indigenous Peoples‘ Policy.
Sch 6, para 16
Complied with. The PMO included Tambelan Islands for indigenous people in Laut and Salibi Samukop, and Saliguma in Siberut Island for indigenous people in Mentawai District. The indigenous people were involved in project activities in these project sites.
37. The Borrower shall ensure, or shall cause the Project Provinces and Project Districts to ensure, that the PMO and concerned RPIUs shall develop and monitor mechanisms for consultation with and participation of indigenous people beneficiaries in Project activities, under Part B including community empowerment and development, resource management, community based law-enforcement and microenterprise training.
Sch 6, para 17
Complied with. Monitoring mechanisms included consultation, participation, and empowerment of indigenous people beneficiaries in project activities, including community-based enforcement and microenterprise training.
38. The Borrower shall ensure, or shall cause the Project ensure that, (a) Project implementation shall be carried out in Provinces and Project Districts to accordance with the environmental laws, regulations, and standards of the Borrower and the Bank‘s environmental procedures, requirements and guidelines, as amended from time to time; (b) all monitoring and mitigation measures outlined in the Initial Environmental Examination (IEE) shall be undertaken for the Project; (c) an Environmental Management and Monitoring Plan (EMMP) shall be prepared by the PMO, with the assistance of an environmental specialist, within the first year of Project implementation, and shall include an outline of the guidelines and procedures for
Sch 6, para 18
Complied with. The project prepared two compilations of environmental compliance reports. One covered activities from 2004 to 2006, and another was prepared in 2007, covering activities in Nias. Both reports indicated that the impact of project activities is generally minimal and that they do not warrant the preparation of an EIA. Initially, some PIUs prepared an EMMP report in accordance with issued instructions, but later on, they no longer did so because it was found that project activities had minimal impact on the environment. The EMMPs that were originally prepared were submitted to
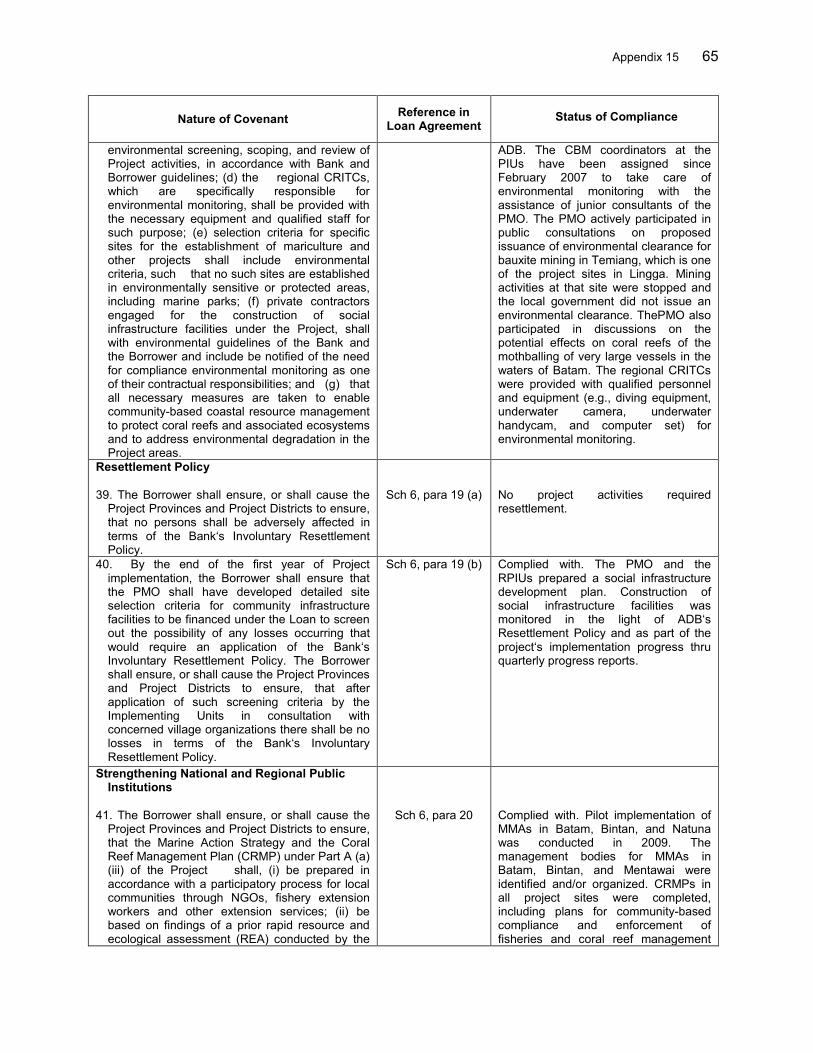
Appendix 15 65
Nature of Covenant Reference in Loan Agreement
Status of Compliance
environmental screening, scoping, and review of Project activities, in accordance with Bank and Borrower guidelines; (d) the regional CRITCs, which are specifically responsible for environmental monitoring, shall be provided with the necessary equipment and qualified staff for such purpose; (e) selection criteria for specific sites for the establishment of mariculture and other projects shall include environmental criteria, such that no such sites are established in environmentally sensitive or protected areas, including marine parks; (f) private contractors engaged for the construction of social infrastructure facilities under the Project, shall with environmental guidelines of the Bank and the Borrower and include be notified of the need for compliance environmental monitoring as one of their contractual responsibilities; and (g) that all necessary measures are taken to enable community-based coastal resource management to protect coral reefs and associated ecosystems and to address environmental degradation in the Project areas.
ADB. The CBM coordinators at the PIUs have been assigned since February 2007 to take care of environmental monitoring with the assistance of junior consultants of the PMO. The PMO actively participated in public consultations on proposed issuance of environmental clearance for bauxite mining in Temiang, which is one of the project sites in Lingga. Mining activities at that site were stopped and the local government did not issue an environmental clearance. ThePMO also participated in discussions on the potential effects on coral reefs of the mothballing of very large vessels in the waters of Batam. The regional CRITCs were provided with qualified personnel and equipment (e.g., diving equipment, underwater camera, underwater handycam, and computer set) for environmental monitoring.
Resettlement Policy 39. The Borrower shall ensure, or shall cause the
Project Provinces and Project Districts to ensure, that no persons shall be adversely affected in terms of the Bank‘s Involuntary Resettlement Policy.
Sch 6, para 19 (a)
No project activities required resettlement.
40. By the end of the first year of Project implementation, the Borrower shall ensure that the PMO shall have developed detailed site selection criteria for community infrastructure facilities to be financed under the Loan to screen out the possibility of any losses occurring that would require an application of the Bank‘s Involuntary Resettlement Policy. The Borrower shall ensure, or shall cause the Project Provinces and Project Districts to ensure, that after application of such screening criteria by the Implementing Units in consultation with concerned village organizations there shall be no losses in terms of the Bank‘s Involuntary Resettlement Policy.
Sch 6, para 19 (b)
Complied with. The PMO and the RPIUs prepared a social infrastructure development plan. Construction of social infrastructure facilities was monitored in the light of ADB‘s Resettlement Policy and as part of the project‘s implementation progress thru quarterly progress reports.
Strengthening National and Regional Public Institutions
41. The Borrower shall ensure, or shall cause the
Project Provinces and Project Districts to ensure, that the Marine Action Strategy and the Coral Reef Management Plan (CRMP) under Part A (a) (iii) of the Project shall, (i) be prepared in accordance with a participatory process for local communities through NGOs, fishery extension workers and other extension services; (ii) be based on findings of a prior rapid resource and ecological assessment (REA) conducted by the
Sch 6, para 20
Complied with. Pilot implementation of MMAs in Batam, Bintan, and Natuna was conducted in 2009. The management bodies for MMAs in Batam, Bintan, and Mentawai were identified and/or organized. CRMPs in all project sites were completed, including plans for community-based compliance and enforcement of fisheries and coral reef management

66 Appendix 15
Nature of Covenant Reference in Loan Agreement
Status of Compliance
NPIU or other research or academic institutions; and (iii) include community-based compliance and enforcement to address illegal fishing.
regulations. Pokmaswas were also organized at the project sites.
42. The Borrower shall ensure, or shall cause the Project Provinces and Project Districts to ensure, that Marine Management Areas (MMAs) under Part A(a)(iv) of the Project shall: (i) be co-management areas which manage issues such as sand mining, trawling and biodiversity conservation, common to various neighboring villages; (ii) extend to no more than 25,000 hectares; (iii) be identified, delineated and pilot-tested in all target districts selected by the Borrower and Project Provinces; (iv) be supervised, organized and managed by the MMAF, Project Provinces and RPIUs; and (v) receive assistance from regional CRITCs and/or MMAF in the conduct of field assessment activities and liaison between the region communities, MMA training, technical advice, and organization of MCS (monitoring, control and surveillance) al public sector institutions and local activities, including joint local patrols and reef watchers.
Sch 6, para 21
Complied with. As of December 2011, the MMAs of seven project districts (i.e., Batam, Mentawai, Bintan, Natuna, Nias, Tapanuli Tengah, and Nias Selatan) had been approved by their respective district heads. The MMA of Lingga Dstrict has been prepared, but the district head has not yet approved it. Detailed management plans for the MMAs of Tapanulit Tengah, Mentawai, Batam, Bintan, and Natuna were completed by December 2009. Pilot implementation of MMAs in Batam, Bintan, and Natuna was conducted in 2009.
43. The Borrower shall ensure, or shall cause the Project Provinces and Project Districts to ensure, that under Part A(b)(ii) of the Project (i) community-based BME surveys, including quarterly CREEL surveys, semiannual reef health surveys, and socioeconomic surveys shall be conducted every three years; (ii) selected data shall be aggregated by the national CRITC so as to provide a report card on the state of coral reef ecosystems and resource use activities every three years; (iii) regional CRITCs shall carry out BME activities, including maintenance of local information management systems for BME, establishment and development of BME for Project field operations and associated coral reef management information system (CRMIS), and technical advice and training to local agencies in use of such systems, and (iv) BME shall be operated at community-based management (CBM) core sites by regional CRITCS with local participation, including NGOs, village groups and local public sector institutions.
Sch 6, para 22
Complied with. The network of CRITCs was functioning well with reef health, socioeconomic, and CREEL surveys being conducted regularly. Human resource managers at the CRITC district level were trained and equipped to conduct reef health surveys in the village marine protected areas. Selected members of the local coastal communities were also trained to collect fish catch data as inputs to CREEL. CRITC also implemented the national and local research agenda leading to the completion of two national and 21 local research activities. CRMIS has been fully functional in Batam, Bintan, and Tapanuli Tengah. Other PIUs encountered difficulty fully operating CRMIS due to a lack of internet connectivity in their districts. However, uploading of data to the system was done at the national CRITC with data from the field being sent through couriers or the nearest internet facilities.
44. By the start of the second year of Project implementation, the Borrower shall ensure, or shall cause the Project Provinces and Project Districts to ensure, that under Part A(b)(iii) of the Project an Information Unit shall be established at each regional CRITC to house a library and documentation center.
Sch 6, para 23 Complied with. Since 2005, training on data filing and database management have been conducted. The RCUand PIU managed library, whose holdings included books, scientific magazines, popular magazines on marine resources and fisheries, and regional CRITC documentation.
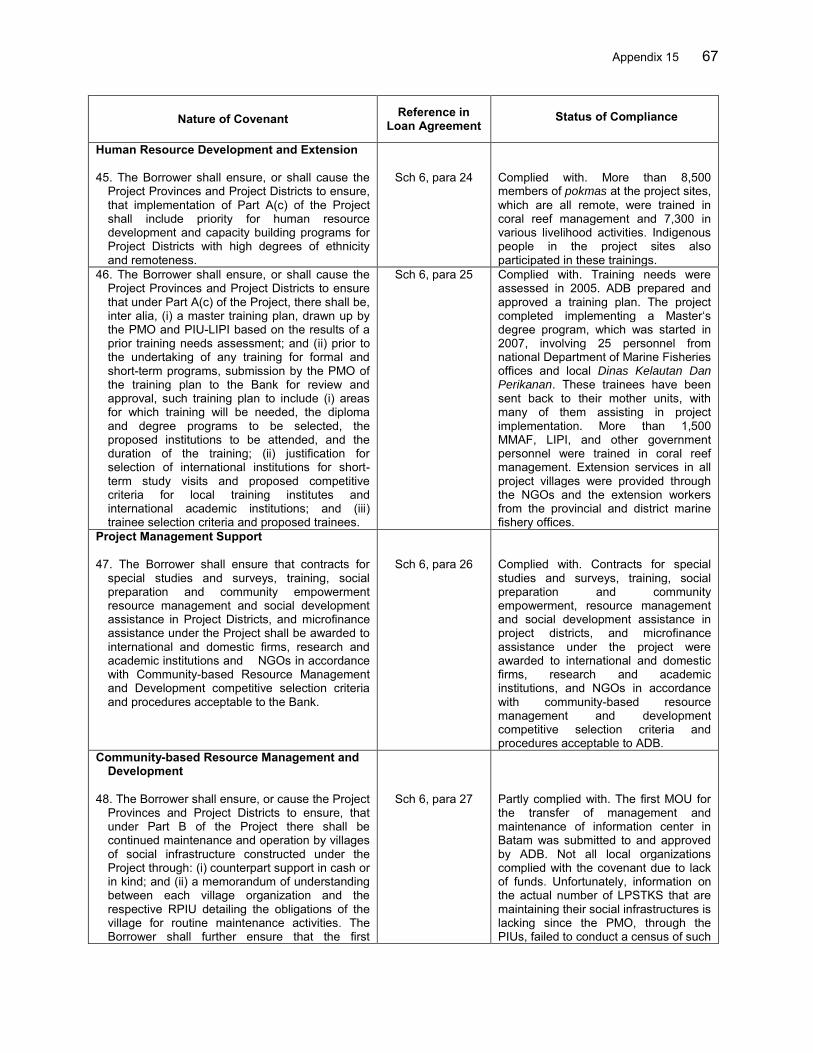
Appendix 15 67
Nature of Covenant Reference in Loan Agreement
Status of Compliance
Human Resource Development and Extension 45. The Borrower shall ensure, or shall cause the
Project Provinces and Project Districts to ensure, that implementation of Part A(c) of the Project shall include priority for human resource development and capacity building programs for Project Districts with high degrees of ethnicity and remoteness.
Sch 6, para 24
Complied with. More than 8,500 members of pokmas at the project sites, which are all remote, were trained in coral reef management and 7,300 in various livelihood activities. Indigenous people in the project sites also participated in these trainings.
46. The Borrower shall ensure, or shall cause the Project Provinces and Project Districts to ensure that under Part A(c) of the Project, there shall be, inter alia, (i) a master training plan, drawn up by the PMO and PIU-LIPI based on the results of a prior training needs assessment; and (ii) prior to the undertaking of any training for formal and short-term programs, submission by the PMO of the training plan to the Bank for review and approval, such training plan to include (i) areas for which training will be needed, the diploma and degree programs to be selected, the proposed institutions to be attended, and the duration of the training; (ii) justification for selection of international institutions for short-term study visits and proposed competitive criteria for local training institutes and international academic institutions; and (iii) trainee selection criteria and proposed trainees.
Sch 6, para 25 Complied with. Training needs were assessed in 2005. ADB prepared and approved a training plan. The project completed implementing a Master‘s degree program, which was started in 2007, involving 25 personnel from national Department of Marine Fisheries offices and local Dinas Kelautan Dan Perikanan. These trainees have been sent back to their mother units, with many of them assisting in project implementation. More than 1,500 MMAF, LIPI, and other government personnel were trained in coral reef management. Extension services in all project villages were provided through the NGOs and the extension workers from the provincial and district marine fishery offices.
Project Management Support 47. The Borrower shall ensure that contracts for
special studies and surveys, training, social preparation and community empowerment resource management and social development assistance in Project Districts, and microfinance assistance under the Project shall be awarded to international and domestic firms, research and academic institutions and NGOs in accordance with Community-based Resource Management and Development competitive selection criteria and procedures acceptable to the Bank.
Sch 6, para 26
Complied with. Contracts for special studies and surveys, training, social preparation and community empowerment, resource management and social development assistance in project districts, and microfinance assistance under the project were awarded to international and domestic firms, research and academic institutions, and NGOs in accordance with community-based resource management and development competitive selection criteria and procedures acceptable to ADB.
Community-based Resource Management and Development
48. The Borrower shall ensure, or cause the Project
Provinces and Project Districts to ensure, that under Part B of the Project there shall be continued maintenance and operation by villages of social infrastructure constructed under the Project through: (i) counterpart support in cash or in kind; and (ii) a memorandum of understanding between each village organization and the respective RPIU detailing the obligations of the village for routine maintenance activities. The Borrower shall further ensure that the first
Sch 6, para 27
Partly complied with. The first MOU for the transfer of management and maintenance of information center in Batam was submitted to and approved by ADB. Not all local organizations complied with the covenant due to lack of funds. Unfortunately, information on the actual number of LPSTKS that are maintaining their social infrastructures is lacking since the PMO, through the PIUs, failed to conduct a census of such

68 Appendix 15
Nature of Covenant Reference in Loan Agreement
Status of Compliance
memorandum of understanding shall be subject to prior review and approval by the Bank.
LPSTKs. The PMO reported some examples of compliance, however. According to the PMO, LPSTKs in many villages at the project sites, except in Nias Selatan and Nias, are maintaining their social infrastructure facilities using funds generated by contributions of the member pokmas for maintenance of infrastructure facilities. Using its own funds, the LPSTK in Limbung, Lingga, has also been operating and maintaining its patrol boat for surveillance operations. The LPSTK in this project area was able to generate its financial resources from the contributions of various livelihood enterprises of the pokmas members, and from the lease of its assets, such as the patrol boats and fish processing equipment, when they were not in use. Likewise, people in Sitardas, Tapanuli Tengah, have been involved in maintaining the social infrastructure facilities provided to them by the project. They added another 15 meters to the village road to have better access to the other side of the community. The jetty, together with the information center and meeting hall, which were damaged by the elements and strong winds, were repaired by the LPSTK using a combination of their own finances for the materials and volunteers for labor. As a pilot village in waste management, the level of public awareness about maintaining cleanliness in Jago Jago village also changed significantly. The village, which was formerly filled with garbage, now begins to be clean and to increase public awareness about the importance of maintaining cleanliness. The LPSTK in Natuna has also started to fund maintenance of social infrastructure facilities and has generated funds for the purchase of construction materials. In North Sumatra, maintenance costs of some social infrastructure items were also charged to the regional budget.
Midterm Review 49. At the start of the fourth year of Project
implementation, the Borrower shall undertake, jointly with the Bank, a midterm review (MTR) of the Project to make adjustments, as necessary, to subsequent Project implementation, including technical and budgetary changes requested or arising from considering PPMS findings, inclusion of additional activities at any of the field sites or
Sch 6, para 28
Complied with late. The provisions in this loan covenant were met, but the compliance was late. The conduct of the midterm review was slightly delayed to allow for full project readiness during the review. It was carried out from 11–22 February 2008 instead of in November 2007. An assessment of

Appendix 15 69
Nature of Covenant Reference in Loan Agreement
Status of Compliance
expansion of activities or sites over the remaining Project period.
project implementation was also done after the MTR. ADB approved recommendations for reallocation of loan categories and extension of the project implementation period on 2 December 2009.
Project Performance Management System (PPMS)
50. Within one year of the Effective Date, the
Borrower, acting through MMAF and LIPI, shall establish a PPMS in the PMO, in accordance with the Bank‘s PPMS Handbook, for monitoring and evaluating the performance of agencies and institutions involved in the Project and the benefits obtained from the Project, including the establishment of benchmark information and data. Following the establishment of PPMS it shall, inter alia: (i) monitor physical and financial progress and economy and efficiency of key Project activities such as recruitment of consultants, procurement, training arrangements, conduct of surveys and special studies, policy development, and the drafting of implementation guidelines; (ii) monitor the level and adequacy of participation of various stakeholders, including local communities in Project activities; (iii) monitor the Project‘s financial, social, economic and environmental impact; (iv) assess the effectiveness and utilization of the CRITC networking; and (v) develop a mechanism for incorporating lessons learned from similar projects in the sector into Project planning.
Sch 6, para 29
Complied with late. The methodologies for socioeconomic studies, reef health surveys, and CREEL were put in place. The PPMS for monitoring of the financial performance and physical progress of the PMO, PIU-LIPI, and the PIUs was operational, but its establishment in 2008 was late. Software for the PPMS, together with an implementation manual, were prepared to consolidate all information needed to monitor project performance. The PIUs of Tapanuli Tenggah, Batam, Bintan, and Natuna and the RCUs of West Sumatra and Kepri entered their past data into the system and have been using the system to generate reports and provide data for project management. However, the PIUs of Nias, Nias Selatan, Mentawai, and Lingga were not able to do any data entry because of a lack of human resources. Moreover, the management of the whole system was transferred to PMO staff with occasional technical assistance from the junior. consultant on M&E. The report was submitted to the PMO.
51. The Borrower shall ensure that the PPMS baseline survey shall be designed and repeated at midterm and at Project completion, in order to provide the information necessary to evaluate the financial, economic, social and environmental impacts of the Project.
Sch 6, para 30
Complied with. Baseline data were collected for reef health and socioeconomic surveys. New data sets had been compiled through surveys before the MTR. CREEL data were collected. Other performance monitoring data, particularly those related to the performance targets in the project framework were reported on a quarterly basis. The project conducted an evaluation survey in 2011 to collect data on public awareness, reduction of destructive fishing, income, fishery-dependent households, live coral cover, and CREEL, among others deemed necessary to assess program impacts.

70 Appendix 15
Nature of Covenant Reference in Loan Agreement
Status of Compliance
52. The Borrower shall ensure: (i) introduction of participatory monitoring and evaluation at the community level; (ii) special studies, as needed, to investigate the impacts of Project implementation; (iii) development and incorporation into the regular reporting system of key periodic monitoring indicators; (iv) regular field site visits by PMO staff to monitor progress; and (v) evaluation of impacts of the Project in accordance with a schedule and terms of reference to be agreed by the Borrower and the Bank.
Sch 6, para 31
Complied with. Under the community participation contracts, the proponent pokmas were made responsible for the implementation of the project under the supervision of their LPSTK. LPSTKs were required to call general meetings at least once a month to report on the status of activities of the various pokmas, including summaries of financial reports of completed projects. Representatives from other stakeholders, village councils, NGOs, and PIUs were invited to attend these meetings. From the field visits of the PMO and PMC, the various pokmas and LPSTKs have so far been able to show reports of meetings and finances. As regards the development and incorporation into the regular reporting system of key periodic monitoring indicators, BME indicators were periodically monitored by LIPI, and physical and financial targets were monitored on a quarterly basis by PIUs and the PMO. With regard to special studies to investigate the impacts of project implementation, LIPI made regularly monitored socioeconomic conditions in the coastal communities, coral cover, and CPUE at the project sites. In addition, the PMO contracted studies and surveys on (i) impacts on public awareness, (ii) community participation in coastal resource management, and (iii) the status and impacts of livelihood activities. The PMO and PMC staff (especially the site advisers) made regular site visits to monitor the project‘s progress.
53. Without limitation to the generality of Section 4.06(b) of this Loan Agreement, for purpose of audit of accounts and financial statements of the Project, the Borrower shall ensure that any independent auditors shall be selected and engaged in accordance with competitive selection procedures acceptable to the Bank.
Sch 6, para 32
Complied with. Done for 2009 Financial Reports.
54. The Borrower shall ensure the timely submission of Project accounts in accordance with the Bank‘s Guidelines for the Financial Governance and Management of Investment Projects financed by the Asian Development Bank, dated November 2001, as amended from time to time.
Sch 6, para 33 Complied with. The financial report for 2010 was completed and reported to BPKP for audit. The audit report was submitted on time to ADB in December 2010.
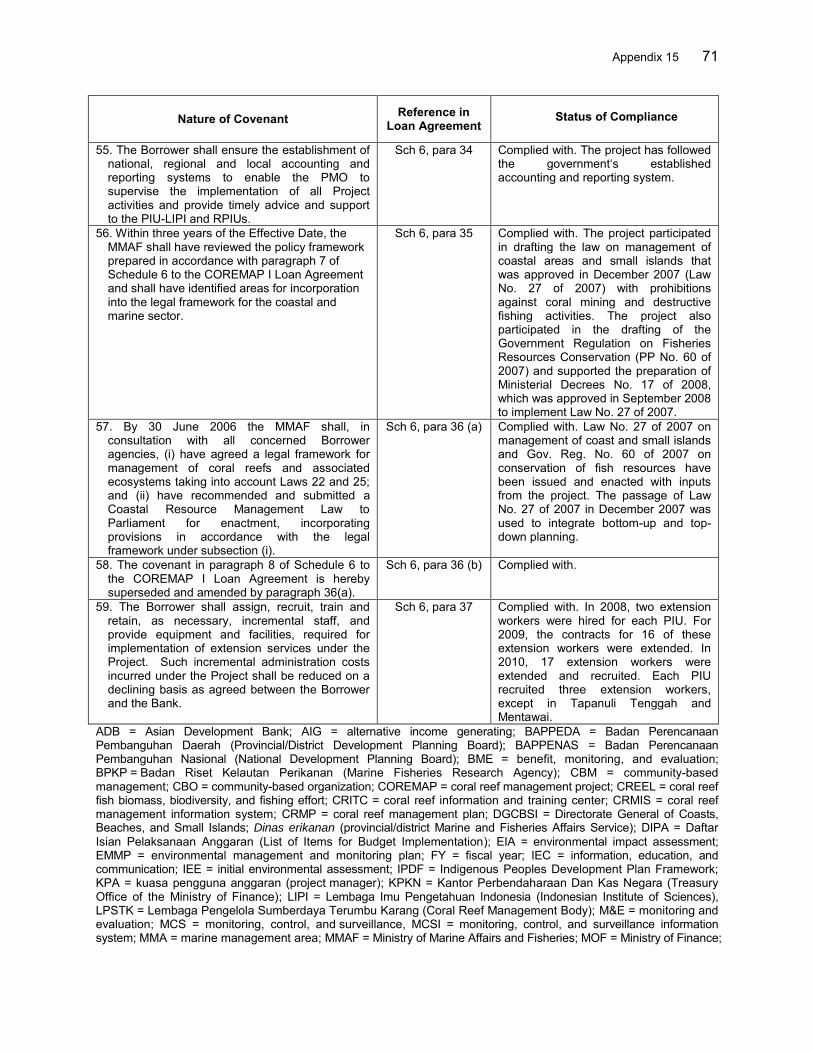
Appendix 15 71
Nature of Covenant Reference in Loan Agreement
Status of Compliance
55. The Borrower shall ensure the establishment of national, regional and local accounting and reporting systems to enable the PMO to supervise the implementation of all Project activities and provide timely advice and support to the PIU-LIPI and RPIUs.
Sch 6, para 34 Complied with. The project has followed the government‘s established accounting and reporting system.
56. Within three years of the Effective Date, the MMAF shall have reviewed the policy framework prepared in accordance with paragraph 7 of Schedule 6 to the COREMAP I Loan Agreement and shall have identified areas for incorporation into the legal framework for the coastal and marine sector.
Sch 6, para 35 Complied with. The project participated in drafting the law on management of coastal areas and small islands that was approved in December 2007 (Law No. 27 of 2007) with prohibitions against coral mining and destructive fishing activities. The project also participated in the drafting of the Government Regulation on Fisheries Resources Conservation (PP No. 60 of 2007) and supported the preparation of Ministerial Decrees No. 17 of 2008, which was approved in September 2008 to implement Law No. 27 of 2007.
57. By 30 June 2006 the MMAF shall, in consultation with all concerned Borrower agencies, (i) have agreed a legal framework for management of coral reefs and associated ecosystems taking into account Laws 22 and 25; and (ii) have recommended and submitted a Coastal Resource Management Law to Parliament for enactment, incorporating provisions in accordance with the legal framework under subsection (i).
Sch 6, para 36 (a) Complied with. Law No. 27 of 2007 on management of coast and small islands and Gov. Reg. No. 60 of 2007 on conservation of fish resources have been issued and enacted with inputs from the project. The passage of Law No. 27 of 2007 in December 2007 was used to integrate bottom-up and top-down planning.
58. The covenant in paragraph 8 of Schedule 6 to the COREMAP I Loan Agreement is hereby superseded and amended by paragraph 36(a).
Sch 6, para 36 (b) Complied with.
59. The Borrower shall assign, recruit, train and retain, as necessary, incremental staff, and provide equipment and facilities, required for implementation of extension services under the Project. Such incremental administration costs incurred under the Project shall be reduced on a declining basis as agreed between the Borrower and the Bank.
Sch 6, para 37 Complied with. In 2008, two extension workers were hired for each PIU. For 2009, the contracts for 16 of these extension workers were extended. In 2010, 17 extension workers were extended and recruited. Each PIU recruited three extension workers, except in Tapanuli Tenggah and Mentawai.
ADB = Asian Development Bank; AIG = alternative income generating; BAPPEDA = Badan Perencanaan Pembanguhan Daerah (Provincial/District Development Planning Board); BAPPENAS = Badan Perencanaan Pembanguhan Nasional (National Development Planning Board); BME = benefit, monitoring, and evaluation; BPKP = Badan Riset Kelautan Perikanan (Marine Fisheries Research Agency); CBM = community-based management; CBO = community-based organization; COREMAP = coral reef management project; CREEL = coral reef fish biomass, biodiversity, and fishing effort; CRITC = coral reef information and training center; CRMIS = coral reef management information system; CRMP = coral reef management plan; DGCBSI = Directorate General of Coasts, Beaches, and Small Islands; Dinas erikanan (provincial/district Marine and Fisheries Affairs Service); DIPA = Daftar Isian Pelaksanaan Anggaran (List of Items for Budget Implementation); EIA = environmental impact assessment; EMMP = environmental management and monitoring plan; FY = fiscal year; IEC = information, education, and communication; IEE = initial environmental assessment; IPDF = Indigenous Peoples Development Plan Framework; KPA = kuasa pengguna anggaran (project manager); KPKN = Kantor Perbendaharaan Dan Kas Negara (Treasury Office of the Ministry of Finance); LIPI = Lembaga Imu Pengetahuan Indonesia (Indonesian Institute of Sciences), LPSTK = Lembaga Pengelola Sumberdaya Terumbu Karang (Coral Reef Management Body); M&E = monitoring and evaluation; MCS = monitoring, control, and surveillance, MCSI = monitoring, control, and surveillance information system; MMA = marine management area; MMAF = Ministry of Marine Affairs and Fisheries; MOF = Ministry of Finance;
72 Appendix 15
MOU = memorandum of understanding; MTR = midterm review; NGO = nongovernment organization; NOL = no-objection letter; NPIU = national project implementing unit; NTC = national technical committee; PIU = project implementing unit; PME = project monitoring and evaluation; PMO = project management office; pokmas = village group; pokmaswas = community-based law enforcement group; PPMS = project performance monitoring system; PSC = project steering committee; RAC = regional advisory committee, RCU = regional coordinating unit; REA = rapid resource and ecological assessment; RPIU = regional project implementing unit; RPJM = Rencana Pembangunan Jangka Menengah (Medium-term Development Plan), RPTK = Rencana Pengelolaan Terumbu Karang (Coral Reef Management Plan). Sources: ADB. 2012. Report and Recommendation of the President to the Board of Directors: Proposed Loan to
Indonesia for the Coral Reef Rehabilitation and Management Project Phase II. Manila; and back-to-office reports of project review missions.
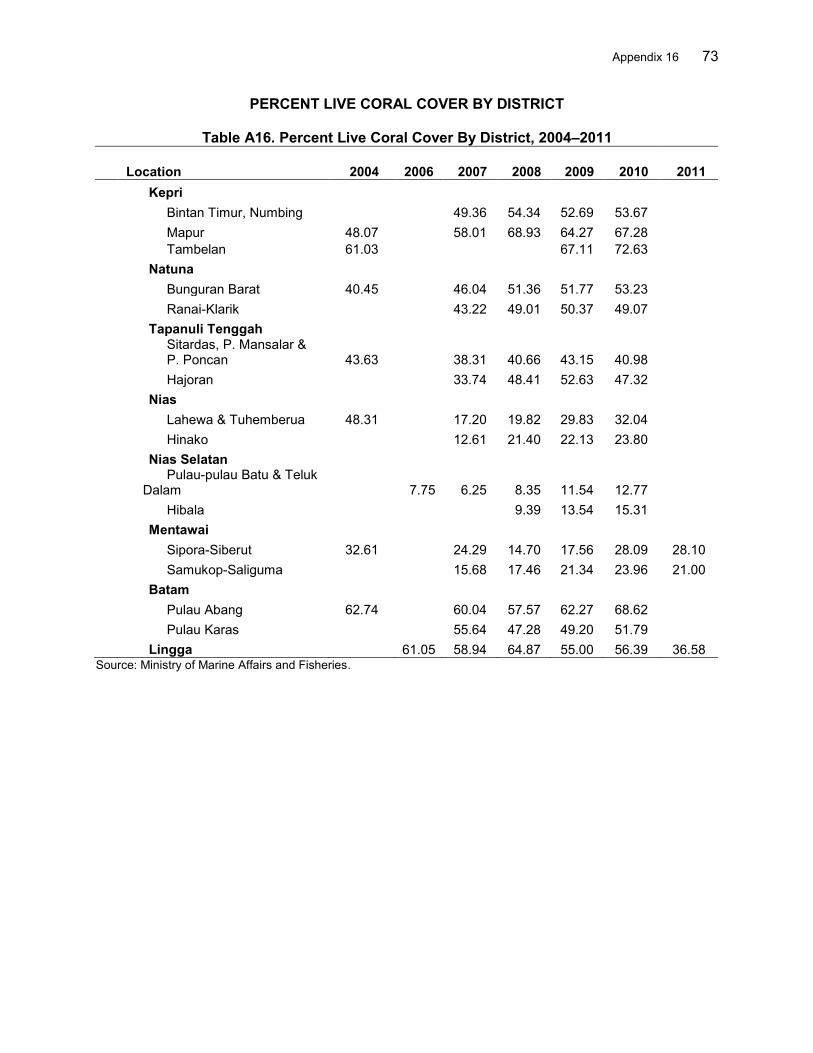
Appendix 16 73
PERCENT LIVE CORAL COVER BY DISTRICT
Table A16. Percent Live Coral Cover By District, 2004–2011
Location 2004 2006 2007 2008 2009 2010 2011 1 Kepri Bintan Timur, Numbing 49.36 54.34 52.69 53.67 Mapur 48.07 58.01 68.93 64.27 67.28 Tambelan 61.03 67.11 72.63 2 Natuna Bunguran Barat 40.45 46.04 51.36 51.77 53.23 Ranai-Klarik 43.22 49.01 50.37 49.07 3 Tapanuli Tenggah
Sitardas, P. Mansalar & P. Poncan 43.63 38.31 40.66 43.15 40.98
Hajoran 33.74 48.41 52.63 47.32 4 Nias Lahewa & Tuhemberua 48.31 17.20 19.82 29.83 32.04 Hinako 12.61 21.40 22.13 23.80 5 Nias Selatan
Pulau-pulau Batu & Teluk
Dalam 7.75 6.25 8.35 11.54 12.77 Hibala 9.39 13.54 15.31 6 Mentawai Sipora-Siberut 32.61 24.29 14.70 17.56 28.09 28.10 Samukop-Saliguma 15.68 17.46 21.34 23.96 21.00 7 Batam Pulau Abang 62.74 60.04 57.57 62.27 68.62 Pulau Karas 55.64 47.28 49.20 51.79 8 Lingga 61.05 58.94 64.87 55.00 56.39 36.58
Source: Ministry of Marine Affairs and Fisheries.
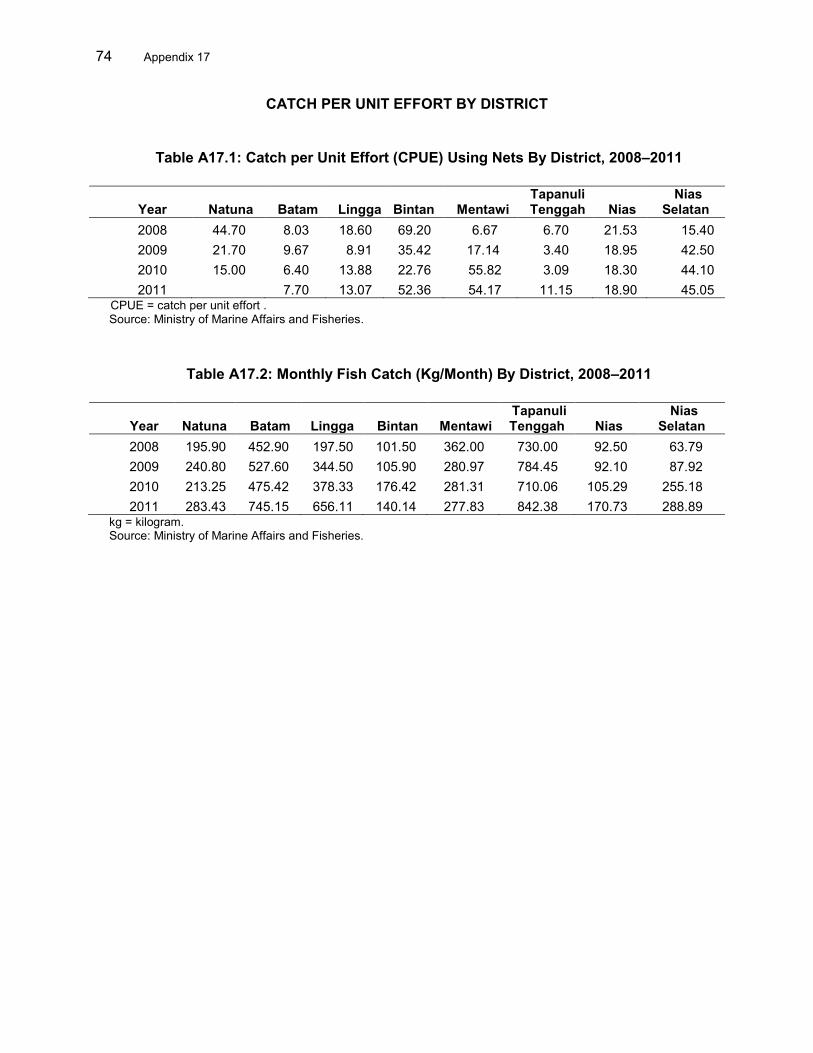
74 Appendix 17
CATCH PER UNIT EFFORT BY DISTRICT
Table A17.1: Catch per Unit Effort (CPUE) Using Nets By District, 2008–2011
Year Natuna Batam Lingga Bintan Mentawi Tapanuli Tenggah Nias
Nias Selatan
2008 44.70 8.03 18.60 69.20 6.67 6.70 21.53 15.40 2009 21.70 9.67 8.91 35.42 17.14 3.40 18.95 42.50 2010 15.00 6.40 13.88 22.76 55.82 3.09 18.30 44.10 2011 7.70 13.07 52.36 54.17 11.15 18.90 45.05
CPUE = catch per unit effort . Source: Ministry of Marine Affairs and Fisheries.
Table A17.2: Monthly Fish Catch (Kg/Month) By District, 2008–2011
Year Natuna Batam Lingga Bintan Mentawi Tapanuli Tenggah Nias
Nias Selatan
2008 195.90 452.90 197.50 101.50 362.00 730.00 92.50 63.79 2009 240.80 527.60 344.50 105.90 280.97 784.45 92.10 87.92 2010 213.25 475.42 378.33 176.42 281.31 710.06 105.29 255.18 2011 283.43 745.15 656.11 140.14 277.83 842.38 170.73 288.89
kg = kilogram. Source: Ministry of Marine Affairs and Fisheries.

Appendix 18 75
TREND OF AVERAGE INCOME PER CAPITA BY DISTRICT
Table A18: Trend of Average Household Income by District, 2005–2011
Location Reached the Target
(Per Capita Income Increased by 2
Percent Per Year
Did Not Reach The Target
(Positive Trend of Per Capita Income)
Did Not Reach the Target
(Negative Trend of Per Capita Income)
East Coast of Sumatra Natuna (Pulau Tiga) -4.43% Natuna (Bunguran Timur) 10.80%
Batam (Pulau Abang) 1.75% Batam (Pulau Karas) 16.89% Bintan (Mapur) 17.80% Bintan (Malang Rapat) 35.07% Bintan (Tambelang) -0.37% Lingga (Sekanah) -4.03% Lingga (Limbung) 13.00% West Coast of Sumatra Mentawai (Tua Pejat) 21.10% Mentawai (Sikakap) 21.23% Mentawai ( Katurai) 2.00% Mentawai (Samukap dan Saliguma)
-19.19%
Nias (Lahewa) 3.83% Nias (Sawo) -3.04% Nias ( Hinako) 17.16% Nias Selatan (Botohilitano) -19.51%
Nias Selatan (Pulau Batu) 1.41%
Source: Ministry of Marine Affairs and Fisheries.
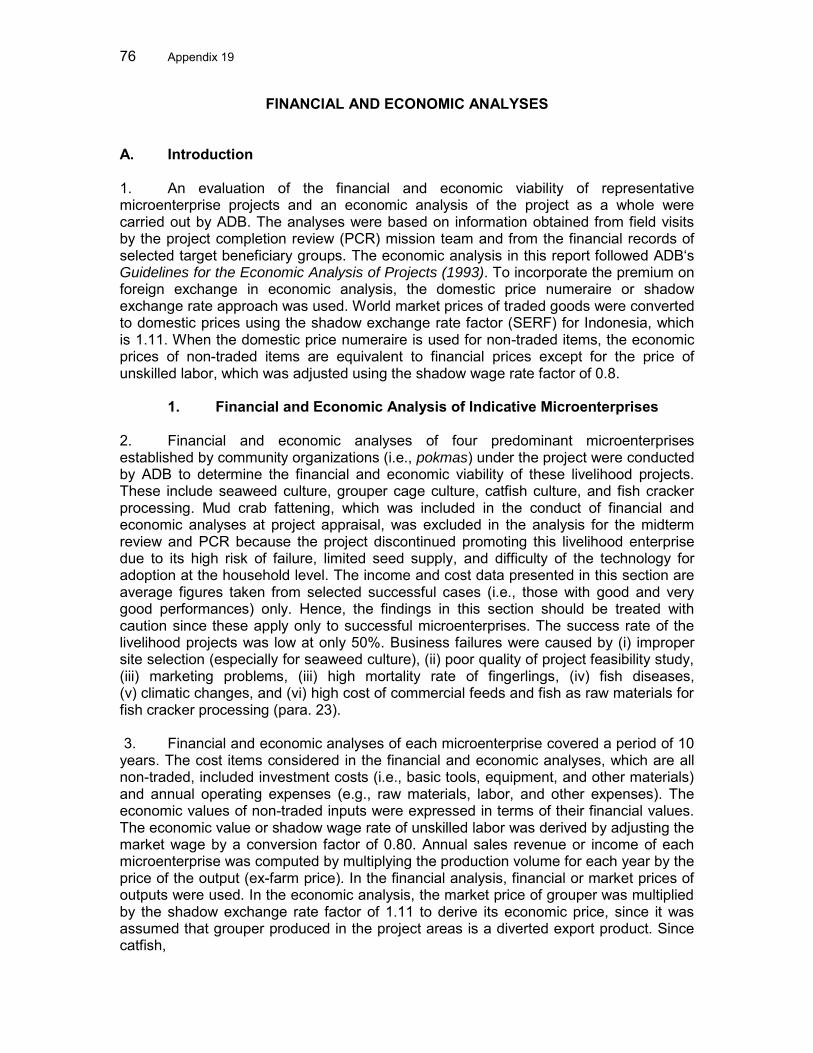
76 Appendix 19
FINANCIAL AND ECONOMIC ANALYSES
A. Introduction 1. An evaluation of the financial and economic viability of representative microenterprise projects and an economic analysis of the project as a whole were carried out by ADB. The analyses were based on information obtained from field visits by the project completion review (PCR) mission team and from the financial records of selected target beneficiary groups. The economic analysis in this report followed ADB‘s Guidelines for the Economic Analysis of Projects (1993). To incorporate the premium on foreign exchange in economic analysis, the domestic price numeraire or shadow exchange rate approach was used. World market prices of traded goods were converted to domestic prices using the shadow exchange rate factor (SERF) for Indonesia, which is 1.11. When the domestic price numeraire is used for non-traded items, the economic prices of non-traded items are equivalent to financial prices except for the price of unskilled labor, which was adjusted using the shadow wage rate factor of 0.8.
1. Financial and Economic Analysis of Indicative Microenterprises 2. Financial and economic analyses of four predominant microenterprises established by community organizations (i.e., pokmas) under the project were conducted by ADB to determine the financial and economic viability of these livelihood projects. These include seaweed culture, grouper cage culture, catfish culture, and fish cracker processing. Mud crab fattening, which was included in the conduct of financial and economic analyses at project appraisal, was excluded in the analysis for the midterm review and PCR because the project discontinued promoting this livelihood enterprise due to its high risk of failure, limited seed supply, and difficulty of the technology for adoption at the household level. The income and cost data presented in this section are average figures taken from selected successful cases (i.e., those with good and very good performances) only. Hence, the findings in this section should be treated with caution since these apply only to successful microenterprises. The success rate of the livelihood projects was low at only 50%. Business failures were caused by (i) improper site selection (especially for seaweed culture), (ii) poor quality of project feasibility study, (iii) marketing problems, (iii) high mortality rate of fingerlings, (iv) fish diseases, (v) climatic changes, and (vi) high cost of commercial feeds and fish as raw materials for fish cracker processing (para. 23). 3. Financial and economic analyses of each microenterprise covered a period of 10 years. The cost items considered in the financial and economic analyses, which are all non-traded, included investment costs (i.e., basic tools, equipment, and other materials) and annual operating expenses (e.g., raw materials, labor, and other expenses). The economic values of non-traded inputs were expressed in terms of their financial values. The economic value or shadow wage rate of unskilled labor was derived by adjusting the market wage by a conversion factor of 0.80. Annual sales revenue or income of each microenterprise was computed by multiplying the production volume for each year by the price of the output (ex-farm price). In the financial analysis, financial or market prices of outputs were used. In the economic analysis, the market price of grouper was multiplied by the shadow exchange rate factor of 1.11 to derive its economic price, since it was assumed that grouper produced in the project areas is a diverted export product. Since catfish,

Appendix 19 77
fish cracker, and dried seaweed are non-traded outputs, their economic prices are the same as their financial prices. Both the annual cost and income figures were expressed in 2012 constant prices. For each representative enterprise, financial and economic cash flow statements were prepared to generate the financial and economic indicators (Tables A19.1–A19.8).

78 A
ppendix 19 Table A19.1: Financial Analysis of Seaweed Culture (500 sq m module) in Constant 2012 Prices
Item Year 1 Year 2 Year 3 Year 4 Year 5 Year 6 Year 7–10 Gross income at farmgate (Rp‘000) 70,000 70,000 70,000 70,000 70,000 70,000 70,000 Investment (Rp‘000) 1,555 Production cost (Rp‘000) 20,400 20,400 20,400 20,400 20,400 20,400 20,400 Total cost (Rp‘000) 21,955 20,400 20,400 20,400 20,400 20,400 20,400 Net cash flow (Rp‘000) 48,045 49,600 49,600 49,600 49,600 49,600 49,600 NPV @ 10% (Rp‘000) 303,357 Assumptions: Fixed Capital Investment Cost: 5m × 6 m (2 units), 10 years useful life Number of crops per year 10 Unit Price Value Annual production (kg) 10,000 Unit Quantity Rp‘000 Rp‘000 Unit price of dried seaweed (Rp/kg) 7,000 Boat 1 1,000 1,000 Gross revenue (Rp‘000) 70,000 Sinkers pcs 16 50 800 Strings 5 mm kg 50 25 1,250 Strings PE 10 mm kg 3 65 195 Anchor strings 24 × 12 m 268 5 1,340 Plastic anchor 24 5 120 Postharvest Handling: Drying shelves units 2 325 650 Sieving materials (nets) 50 sq m 25 5 125 Scales pc 2 55 110 Knives pc 2 15 30 Plastic bags pc 320 2 640 Total 1,555 Production Cost Unit Quantity Unit Price (Rp ‗000) Rp‘000 Seedlings kg 2,500 2 5,000 Strings balls 80 30 2,400 Labor cost for planting, maintenance, harvesting, sorting, drying, 13,000 Total 20,400 kg = kilogram, m = meter, mm = millimeter, NPV = net present value, Rp = rupiah, sq m = square meter. Sources: Consultant‘s field interviews and estimates.

Appendix 19 79
Table A19.2: Financial Analysis of Grouper Cage Culture in Constant 2012 Prices
Item Year 1 Year 2 Year 3 Year 4 Year 5 Year 6 Year 7–10 Gross income at farmgate (Rp‘000) 44,800 44,800 44,800 44,800 44,800 44,800 Investment (Rp‘000) 10,420 4,570 10,420 4,570 Production cost (Rp‘000) 42,224 42,224 42,224 42,224 42,224 42,224 Total cost (Rp‘000) 10,420 42,224 42,224 42,224 42,224 42,224 42,224 Net cash flow (Rp‘000) -10,420 2,576 2,576 2,576 2,576 2,576 2,576 FIRR 19.89% NPV @ 10% (Rp‘000) 4,014 Assumptions Initial investment Cost Net cages: 3 cages (Rp) 10,420,000 Number of croppings per year = 1 Materials: Production period per cropping: 10 months
Rp Useful Life Production: 448 ks @ Rp100,000/kg Gross income at farmgate (Rp) 44,800,000
Fish nets (120kg @ Rp45,000/kg) 5,400,000 4 yrs Lumber (50 pcs @ Rp10,000/pc) 500,000 2 yrs Palm lumber (150 pcs @
Rp25,000/pc) 3,750,000 2 yrs Nails (12 kg @ Rp10,000/kg) 120,000 2 yrs Production Costs (Rp) Strings (25 kg@ RP18,000/kg) 450,000 4 yrs Seeds (1,200 fish fry) @ Rp19,500/pc 23,400,000 Nets (2 pcs @ Rp100,000/pc) 200,000 2 yrs Feed, 2,688 kg @ Rp3,420/kg 8,924,160 Total 10,420,000 Drugs and chemicals 900,000
Total 42,224,160 Note: Feed conversion ratio: 6 kg of feed for every 1 kg of output
FIRR = financial internal rate of return, kg = kilogram, NPV= net present value, pc = piece. Sources: Consultant‘s field interviews and estimates.

80 A
ppendix 19 Table A19.3: Financial Analysis of Catfish Culturea in Constant 2012 Prices
Item Year 1 Year 2 Year 3 Year 4 Year 5 Year 6 Year 7 Year 8 Year 9 Year 10 Gross income at farmgate (Rp‘000) 5,824 5,824 5,824 5,824 5,824 5,824 5,824 5,824 5,824 5,824 Investment (Rp‘000) 4,995 Production costb (Rp‘000) 3,243 3,243 3,243 3,243 3,243 3,243 3,243 3,243 3,243 3,243 Total cost (Rp‘000) 8,238 3,243 3,243 3,243 3,243 3,243 3,243 3,243 3,243 3,243 Net cash flow (Rp‘000) -2,414 2,581 2,581 2,581 2,581 2,581 2,581 2,581 2,581 2,581 FIRR 106.77% NPV @ 10% (Rp‘000) 11,318
FIRR = financial internal rate of return, LPSTK = Lembaga Pengelola Sumberdaya Terumbu Karang (Coral Reef Management Body), pokmas = community organization, NPV= net present value. aAverage of two pokmas in Tapanuli Tenggah. bLPSTK‘s share. Sources: Consultant‘s field interviews and estimates.
Table A19.4: Financial Analysis of Fish Cracker Processing in Constant 2012 Prices
Item Year 1 Year 2 Year 3 Year 4 Year 5 Year 6 Year 7 Year 8 Year 9 Year 10 Gross income (Rp‘000) 142,500 142,500 142,500 142,500 142,500 142,500 142,500 142,500 142,500 142,500 Investment (Rp‘000) 26,662 157 245 157 245 1,605 245 157 245 157 Production cost (Rp‘000) 91,974 91,974 91,974 91,974 91,974 91,974 91,974 91,974 91,974 91,974 Total cost (Rp‘000) 118,636 92,131 92,219 92,131 92,219 93,579 92,219 92,131 92,219 92,131 Net cash flow (Rp‘000) 23,864 50,369 50,281 50,369 50,281 48,921 50,281 50,369 50,281 50,369 NPV @ 10% (Rp‘000) 284,380 FIRR = financial internal rate of return, NPV= net present value. aAverage of three pokmas in Bintan, Tapanuli Tenggah, and Natuna districts. Sources: Consultant‘s field interviews and estimates.
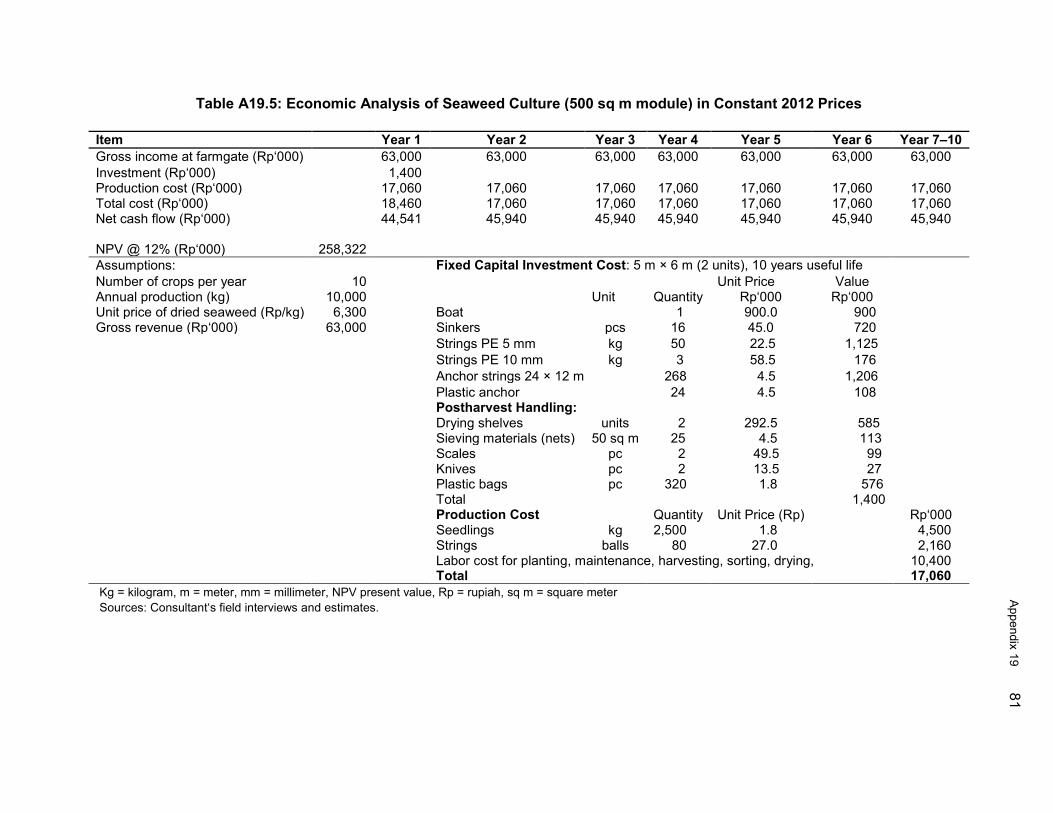
Appendix 19 81
Table A19.5: Economic Analysis of Seaweed Culture (500 sq m module) in Constant 2012 Prices
Item Year 1 Year 2 Year 3 Year 4 Year 5 Year 6 Year 7–10 Gross income at farmgate (Rp‘000) 63,000 63,000 63,000 63,000 63,000 63,000 63,000 Investment (Rp‘000) 1,400 Production cost (Rp‘000) 17,060 17,060 17,060 17,060 17,060 17,060 17,060 Total cost (Rp‘000) 18,460 17,060 17,060 17,060 17,060 17,060 17,060 Net cash flow (Rp‘000) 44,541 45,940 45,940 45,940 45,940 45,940 45,940 NPV @ 12% (Rp‘000) 258,322 Assumptions: Fixed Capital Investment Cost: 5 m × 6 m (2 units), 10 years useful life Number of crops per year 10 Unit Price Value Annual production (kg) 10,000 Unit Quantity Rp‘000 Rp‘000 Unit price of dried seaweed (Rp/kg) 6,300 Boat 1 900.0 900 Gross revenue (Rp‘000) 63,000 Sinkers pcs 16 45.0 720 Strings PE 5 mm kg 50 22.5 1,125
Strings PE 10 mm kg 3 58.5 176
Anchor strings 24 × 12 m 268 4.5 1,206
Plastic anchor 24 4.5 108 Postharvest Handling: Drying shelves units 2 292.5 585 Sieving materials (nets) 50 sq m 25 4.5 113 Scales pc 2 49.5 99 Knives pc 2 13.5 27 Plastic bags pc 320 1.8 576 Total 1,400 Production Cost Quantity Unit Price (Rp) Rp‘000 Seedlings kg 2,500 1.8 4,500 Strings balls 80 27.0 2,160 Labor cost for planting, maintenance, harvesting, sorting, drying, 10,400 Total 17,060 Kg = kilogram, m = meter, mm = millimeter, NPV present value, Rp = rupiah, sq m = square meter Sources: Consultant‘s field interviews and estimates.
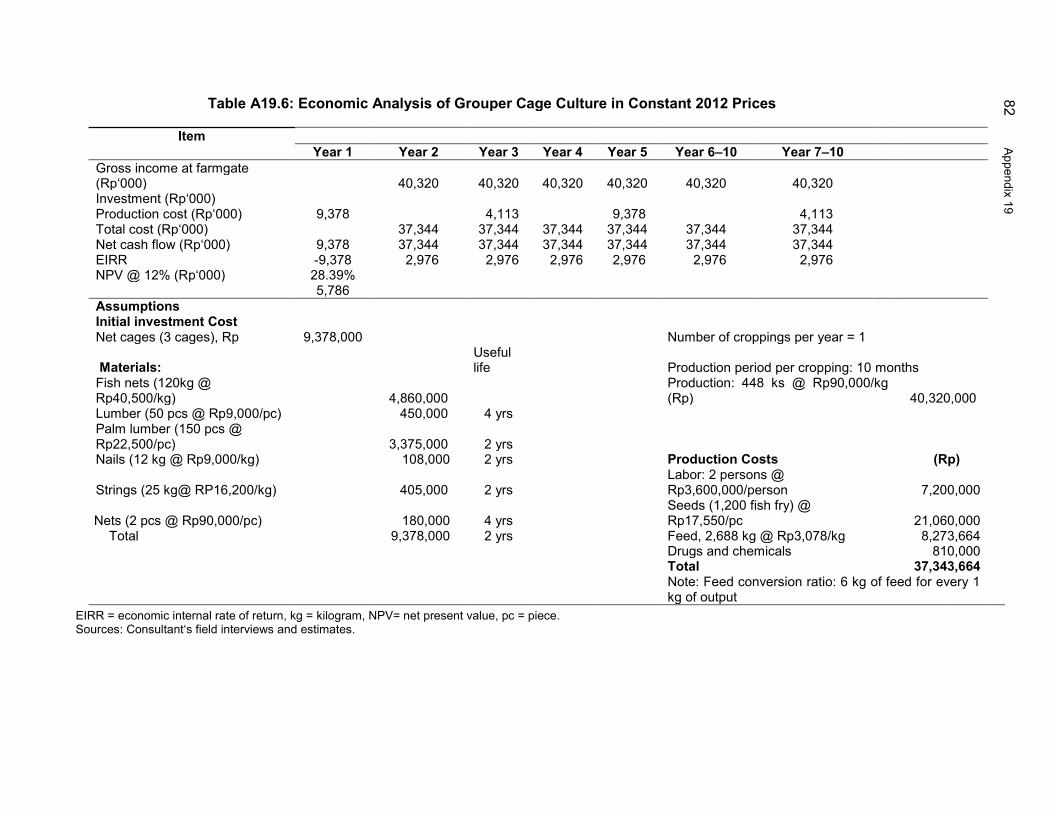
82 A
ppendix 19 Table A19.6: Economic Analysis of Grouper Cage Culture in Constant 2012 Prices
Item
Year 1 Year 2 Year 3 Year 4 Year 5 Year 6–10 Year 7–10 Gross income at farmgate (Rp‘000) 40,320 40,320 40,320 40,320 40,320 40,320 Investment (Rp‘000) Production cost (Rp‘000) 9,378 4,113 9,378 4,113 Total cost (Rp‘000) 37,344 37,344 37,344 37,344 37,344 37,344 Net cash flow (Rp‘000) 9,378 37,344 37,344 37,344 37,344 37,344 37,344 EIRR -9,378 2,976 2,976 2,976 2,976 2,976 2,976 NPV @ 12% (Rp‘000) 28.39% 5,786 Assumptions Initial investment Cost Net cages (3 cages), Rp 9,378,000 Number of croppings per year = 1
Materials: Useful life Production period per cropping: 10 months
Fish nets (120kg @ Rp40,500/kg) 4,860,000
Production: 448 ks @ Rp90,000/kg (Rp) 40,320,000
Lumber (50 pcs @ Rp9,000/pc) 450,000 4 yrs Palm lumber (150 pcs @ Rp22,500/pc) 3,375,000 2 yrs Nails (12 kg @ Rp9,000/kg) 108,000 2 yrs Production Costs (Rp)
Strings (25 kg@ RP16,200/kg) 405,000 2 yrs Labor: 2 persons @ Rp3,600,000/person 7,200,000
Nets (2 pcs @ Rp90,000/pc) 180,000 4 yrs Seeds (1,200 fish fry) @ Rp17,550/pc 21,060,000
Total 9,378,000 2 yrs Feed, 2,688 kg @ Rp3,078/kg 8,273,664 Drugs and chemicals 810,000 Total 37,343,664
Note: Feed conversion ratio: 6 kg of feed for every 1 kg of output
EIRR = economic internal rate of return, kg = kilogram, NPV= net present value, pc = piece. Sources: Consultant‘s field interviews and estimates.
Appendix 19 83
Table A19.7: Economic Analysis of Catfish Culturea in Constant 2012 Prices
Item Year 1 Year 2 Year 3 Year 4 Year 5 Year 6 Year 7 Gross income at farmgate (Rp‘000) 5,242 5,242 5,242 5,242 5,242 5,242 5,242 Investment (Rp‘000) 4,496 Production costb (Rp‘000) 2,919 2,919 2,919 2,919 2,919 2,919 2,919 Total cost (Rp‘000) 7,414 2,919 2,919 2,919 2,919 2,919 2,919 Net cash flow (Rp‘000) -2,173 2,323 2,323 2,323 2,323 2,323 2,323 EIRR 106.77% NPV @ 12% (Rp‘000) 9,111
a Average of two pokmas in Tapanuli Tenggah. b LPSTK‘s share. EIRR = economic internal rate of return, LPSTK = Lembaga Pengelola Sumberdaya Terumbu Karang (Coral Reef Management Body), pokmas = community organization, NPV= net present value. Sources: Consultant‘s field interviews and estimates.
Table A19.8: Economic Analysis of Fish Cracker Processing in Constant 2012 Prices
Item Year 1 Year 2 Year 3 Year 4 Year 5 Year 6 Year 7–10 Gross income (Rp‘000) 128,250 128,250 128,250 128,250 128,250 128,250 128,250 Investment (Rp‘000) 23,995 141 220 141 220 1,445 220 Production cost 82,777 82,777 82,777 82,777 82,777 82,777 82,777 Total cost 106,772 82,918 82,997 82,918 82,997 84,221 82,997 Net cash flow 21,478 45,332 45,253 45,332 45,253 44,029 45,253 FIRR (%) NPV @ 10% (Rp‘000) 255,942 NPV = net present value. a Average of three pokmas in Bintan, Natuna, and Tapanuli Tenggah. Sources: Consultant‘s field interviews and estimates.

84 Appendix 19
4. The results of the financial analysis of four representative livelihood projects operated by selected successful pokmas show that these projects are financially viable with net present values (NPVs) ranging from Rp4.04 million to Rp303.36 million, using a 10% discount rate. Likewise, all these projects exhibited positive NPVs, ranging from Rp5.78 million to Rp258.32 million at a social discount rate of 12%. Seaweed culture was found to be the most financially and economically viable, followed by fish cracker processing and catfish culture. Grouper cage culture was the least profitable. 5. Sensitivity analysis was undertaken to determine the effects of (i) a 10% increase in total cost, and (ii) a 10% decrease in gross revenue on the financial viability of the microenterprises. The estimated sensitivity indicators are all greater than 1.0 for grouper cage culture, catfish culture, and fish cracker processing, suggesting that the NPVs of these microenterprises are highly sensitive to changes in total cost and gross revenue (Table A19.9). For seaweed culture, the sensitivity indicator for a 10% increase in project cost is 0.94, or less than 1.0, indicating that the NPV of this microenterprise is less sensitive to a change in total cost. However, the sensitivity indicator for a 10% decrease in gross revenue of this livelihood enterprise is 4.26, or greater than 1.0. This means that the NPV of seaweed culture is very sensitive to a change in gross revenue. The higher sensitivity indicators for the 10% change in gross revenue as compared to the same percentage change in total cost indicate that the NPV of each microenterprise project is more sensitive to a reduction in gross revenue than to an increase in total production cost. 6. Applying the switching values technique in sensitivity analysis, Table A19.9 shows that compared to seaweed culture, smaller changes in total cost and gross revenues from grouper cages will allow this enterprise to maintain a financial internal rate of return (FIRR) equal to 10% (or NPV = 0). Switching values for grouper cage indicates that the total cost would have to increase by 2.05% or the benefits to decrease by 1.04% before the FIRR declines to 10%, the financial cost of capital in Indonesia.
Table A19.9: Results of Sensitivity Analysis by Type of Microenterprise NPV Sensitivity Indicator Switching Value
Item (Rp’000) (SI) (%) Seaweed Culture Base Case 320,741 10% Increase in Total Cost 290,681 0.94 10% Decrease in Gross Revenue 184,120 4.26 % Increase in Total Cost 106.70 % Decrease in Gross Revenue 23.48 Grouper Cage Culture Base Case 4,917 48.72 10% Increase in Total Cost -19,040 96.43 10% Decrease in Gross Revenue -42,495 % Increase in Total Cost 2.05 % Decrease in Gross Revenue 1.04 Fish Cracker Processing Base Case 284,380 2.04 10% Increase in Total Cost 226,379 8.38 10% Decrease in Gross Revenue 46,143 % Increase in Total Cost 49.03 % Decrease in Gross Revenue 11.94

Appendix 19 85
NPV ensitivity Indicator Switching Value Item (Rp’000) (SI) (%)
Catfish Culture Base Case 13,045 3.20 10% Increase in Total Cost 8,872 4.06 10% Decrease in Gross Revenue 6,966 % Increase in Total Cost 31.26 % Decrease in Gross Revenue 21.46 Note: The switching value is the percentage change in the tested value that will reduce the FIRR to the
opportunity cost of capital (i.e., 16%). 2. Economic Analysis of the Project as a Whole 7. Economic analysis was conducted for a period of 28 years, starting in 2004, using a social discount rate of 12%. All project benefits and costs were expressed in Indonesian rupiah in constant 2012 prices. A. Project Costs 8. All project investment and operating costs were disaggregated into their foreign and local currency components. Taxes and interest payments considered as transfer payments were excluded in economic analysis. The project‘s economic investment costs were calculated as the total base cost without physical contingencies, estimated in 2012 constant rupiah. The actual dollar and local cost streams were first adjusted to constant 2012 base prices using the dollar deflator (manufactures unit value index or MUV obtained from the World Bank) and a domestic deflator (General Consumer Price Index or CPI in Indonesia), respectively. The adjusted foreign exchange cost components expressed in constant 2012 prices were then converted to local currency using the annual shadow exchange rates for each of the years covered in the 2004 to 2011 period. The shadow exchange rate for each year was computed by multiplying the official exchange in each year by the shadow exchange rate factor (1.11). All local currency costs were economic values following their financial values, except for unskilled labor utilized in microenterprises whose wages were adjusted by a conversion factor of 0.80. Projected dollar and local cost streams from 2013 to 2028 were expressed in constant 2012 prices. In the analysis, it was assumed that the Government of Indonesia and the local district units would continue providing funds for the operation and maintenance (O&M) of social infrastructure facilities, office equipment, patrol boats, and other civil works after the project terminated. Ten percent of the cumulative investment cost from 2004 to 2011 was computed as annual maintenance cost after the end of the project. The summary of annual economic costs by type and source of financing is presented in Table A19.10.
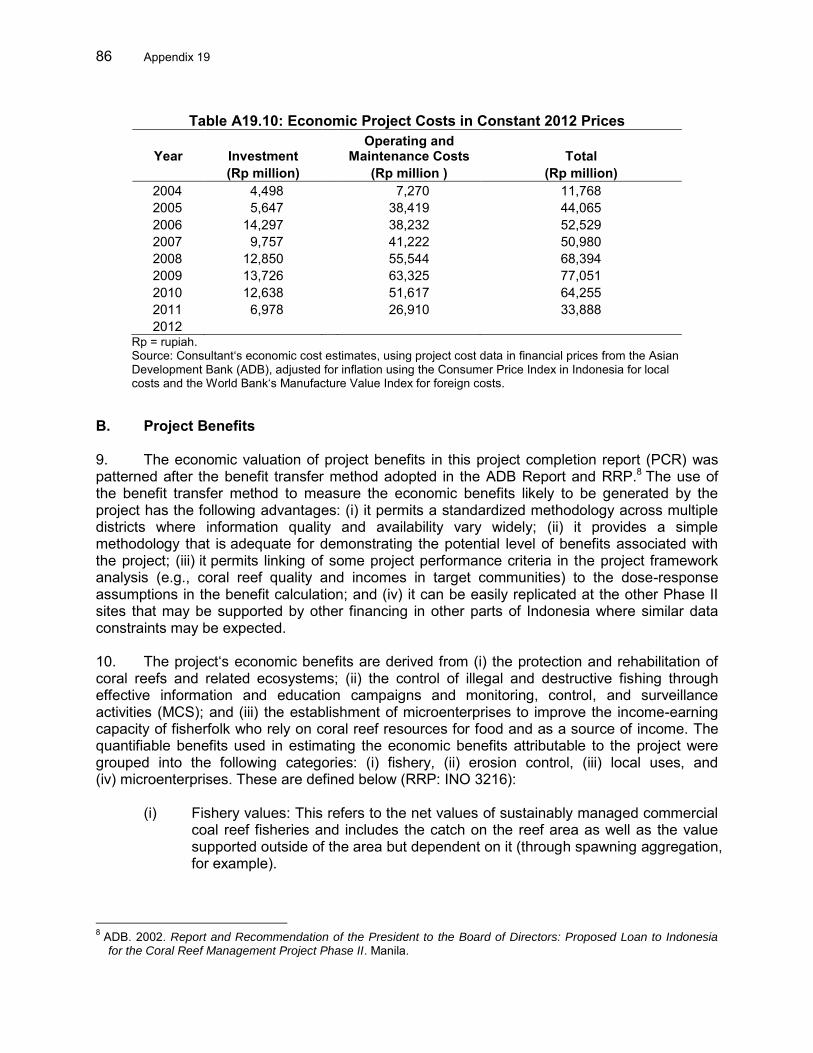
86 Appendix 19
Table A19.10: Economic Project Costs in Constant 2012 Prices
Year Investment Operating and
Maintenance Costs Total (Rp million) (Rp million ) (Rp million)
2004 4,498 7,270 11,768 2005 5,647 38,419 44,065 2006 14,297 38,232 52,529 2007 9,757 41,222 50,980 2008 12,850 55,544 68,394 2009 13,726 63,325 77,051 2010 12,638 51,617 64,255 2011 6,978 26,910 33,888 2012
Rp = rupiah. Source: Consultant‘s economic cost estimates, using project cost data in financial prices from the Asian Development Bank (ADB), adjusted for inflation using the Consumer Price Index in Indonesia for local costs and the World Bank‘s Manufacture Value Index for foreign costs.
B. Project Benefits 9. The economic valuation of project benefits in this project completion report (PCR) was patterned after the benefit transfer method adopted in the ADB Report and RRP.8 The use of the benefit transfer method to measure the economic benefits likely to be generated by the project has the following advantages: (i) it permits a standardized methodology across multiple districts where information quality and availability vary widely; (ii) it provides a simple methodology that is adequate for demonstrating the potential level of benefits associated with the project; (iii) it permits linking of some project performance criteria in the project framework analysis (e.g., coral reef quality and incomes in target communities) to the dose-response assumptions in the benefit calculation; and (iv) it can be easily replicated at the other Phase II sites that may be supported by other financing in other parts of Indonesia where similar data constraints may be expected. 10. The project‘s economic benefits are derived from (i) the protection and rehabilitation of coral reefs and related ecosystems; (ii) the control of illegal and destructive fishing through effective information and education campaigns and monitoring, control, and surveillance activities (MCS); and (iii) the establishment of microenterprises to improve the income-earning capacity of fisherfolk who rely on coral reef resources for food and as a source of income. The quantifiable benefits used in estimating the economic benefits attributable to the project were grouped into the following categories: (i) fishery, (ii) erosion control, (iii) local uses, and (iv) microenterprises. These are defined below (RRP: INO 3216):
(i) Fishery values: This refers to the net values of sustainably managed commercial coal reef fisheries and includes the catch on the reef area as well as the value supported outside of the area but dependent on it (through spawning aggregation, for example).
8 ADB. 2002. Report and Recommendation of the President to the Board of Directors: Proposed Loan to Indonesia
for the Coral Reef Management Project Phase II. Manila.
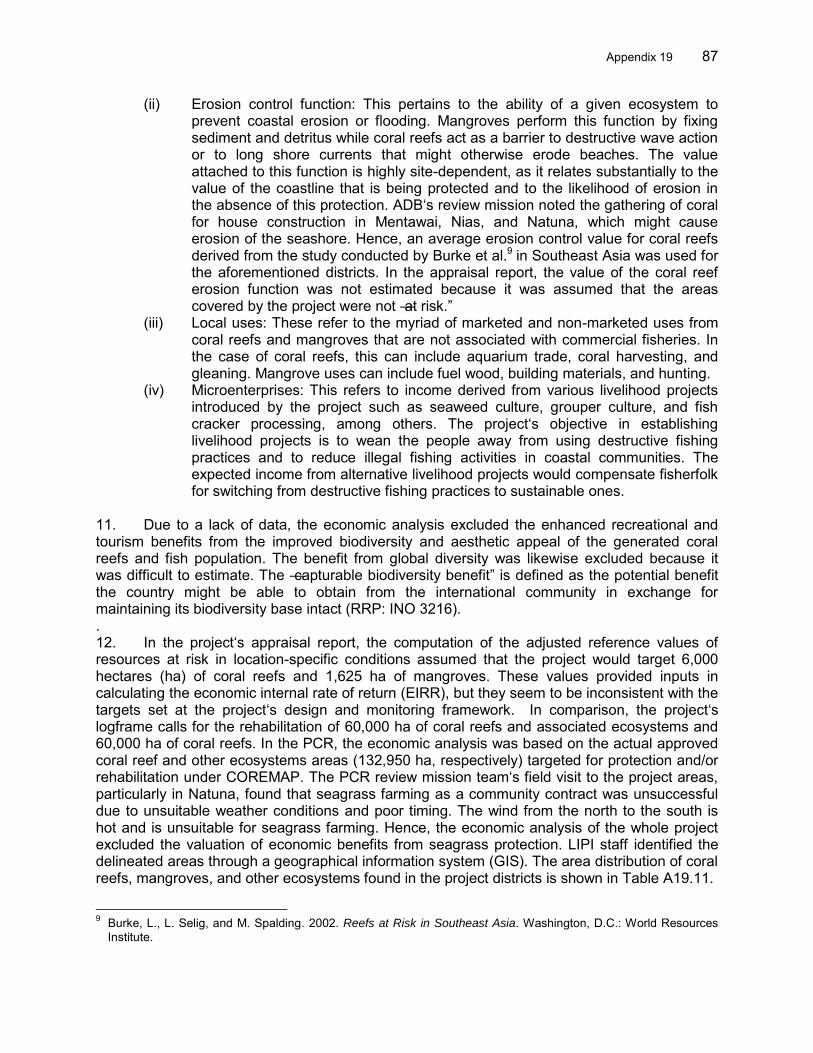
Appendix 19 87
(ii) Erosion control function: This pertains to the ability of a given ecosystem to prevent coastal erosion or flooding. Mangroves perform this function by fixing sediment and detritus while coral reefs act as a barrier to destructive wave action or to long shore currents that might otherwise erode beaches. The value attached to this function is highly site-dependent, as it relates substantially to the value of the coastline that is being protected and to the likelihood of erosion in the absence of this protection. ADB‘s review mission noted the gathering of coral for house construction in Mentawai, Nias, and Natuna, which might cause erosion of the seashore. Hence, an average erosion control value for coral reefs derived from the study conducted by Burke et al.9 in Southeast Asia was used for the aforementioned districts. In the appraisal report, the value of the coral reef erosion function was not estimated because it was assumed that the areas covered by the project were not ―at risk.‖
(iii) Local uses: These refer to the myriad of marketed and non-marketed uses from coral reefs and mangroves that are not associated with commercial fisheries. In the case of coral reefs, this can include aquarium trade, coral harvesting, and gleaning. Mangrove uses can include fuel wood, building materials, and hunting.
(iv) Microenterprises: This refers to income derived from various livelihood projects introduced by the project such as seaweed culture, grouper culture, and fish cracker processing, among others. The project‘s objective in establishing livelihood projects is to wean the people away from using destructive fishing practices and to reduce illegal fishing activities in coastal communities. The expected income from alternative livelihood projects would compensate fisherfolk for switching from destructive fishing practices to sustainable ones.
11. Due to a lack of data, the economic analysis excluded the enhanced recreational and tourism benefits from the improved biodiversity and aesthetic appeal of the generated coral reefs and fish population. The benefit from global diversity was likewise excluded because it was difficult to estimate. The ―capturable biodiversity benefit‖ is defined as the potential benefit the country might be able to obtain from the international community in exchange for maintaining its biodiversity base intact (RRP: INO 3216). . 12. In the project‘s appraisal report, the computation of the adjusted reference values of resources at risk in location-specific conditions assumed that the project would target 6,000 hectares (ha) of coral reefs and 1,625 ha of mangroves. These values provided inputs in calculating the economic internal rate of return (EIRR), but they seem to be inconsistent with the targets set at the project‘s design and monitoring framework. In comparison, the project‘s logframe calls for the rehabilitation of 60,000 ha of coral reefs and associated ecosystems and 60,000 ha of coral reefs. In the PCR, the economic analysis was based on the actual approved coral reef and other ecosystems areas (132,950 ha, respectively) targeted for protection and/or rehabilitation under COREMAP. The PCR review mission team‘s field visit to the project areas, particularly in Natuna, found that seagrass farming as a community contract was unsuccessful due to unsuitable weather conditions and poor timing. The wind from the north to the south is hot and is unsuitable for seagrass farming. Hence, the economic analysis of the whole project excluded the valuation of economic benefits from seagrass protection. LIPI staff identified the delineated areas through a geographical information system (GIS). The area distribution of coral reefs, mangroves, and other ecosystems found in the project districts is shown in Table A19.11.
9 Burke, L., L. Selig, and M. Spalding. 2002. Reefs at Risk in Southeast Asia. Washington, D.C.: World Resources
Institute.
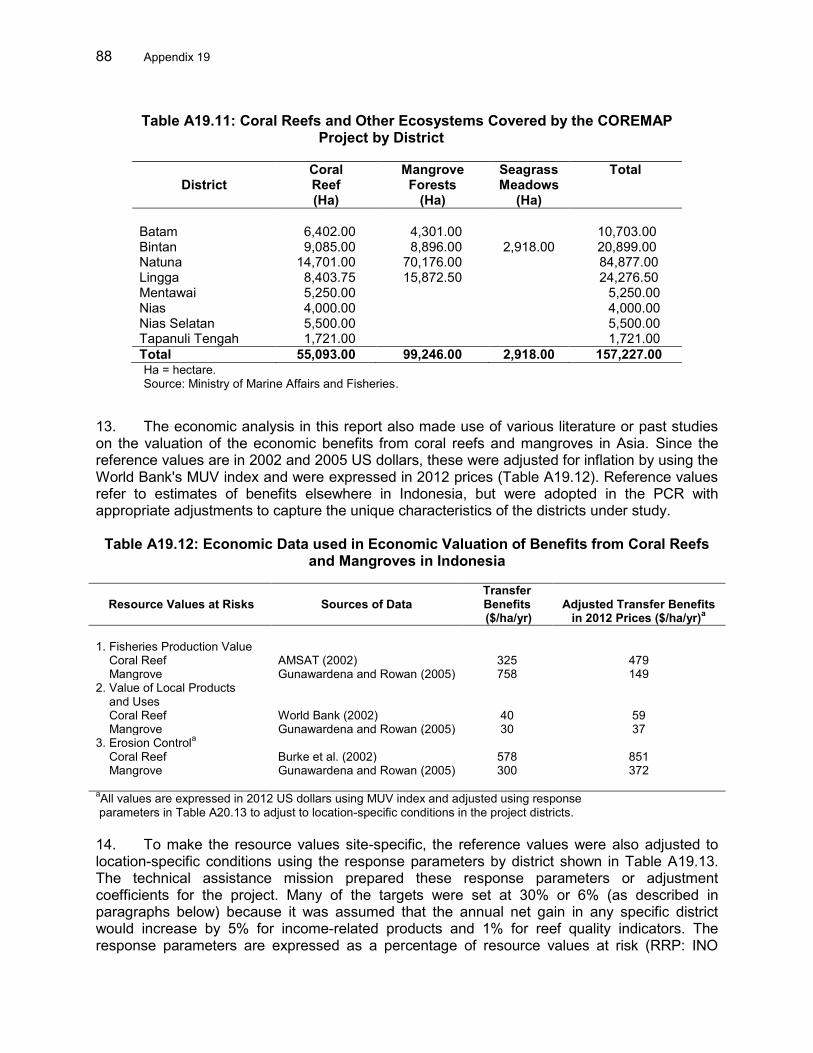
88 Appendix 19
Table A19.11: Coral Reefs and Other Ecosystems Covered by the COREMAP
Project by District Coral Mangrove Seagrass Total
District Reef Forests Meadows (Ha) (Ha) (Ha) Batam 6,402.00 4,301.00 10,703.00 Bintan 9,085.00 8,896.00 2,918.00 20,899.00 Natuna 14,701.00 70,176.00 84,877.00 Lingga 8,403.75 15,872.50 24,276.50 Mentawai 5,250.00 5,250.00 Nias 4,000.00 4,000.00 Nias Selatan 5,500.00 5,500.00 Tapanuli Tengah 1,721.00 1,721.00 Total 55,093.00 99,246.00 2,918.00 157,227.00 Ha = hectare. Source: Ministry of Marine Affairs and Fisheries.
13. The economic analysis in this report also made use of various literature or past studies on the valuation of the economic benefits from coral reefs and mangroves in Asia. Since the reference values are in 2002 and 2005 US dollars, these were adjusted for inflation by using the World Bank's MUV index and were expressed in 2012 prices (Table A19.12). Reference values refer to estimates of benefits elsewhere in Indonesia, but were adopted in the PCR with appropriate adjustments to capture the unique characteristics of the districts under study.
Table A19.12: Economic Data used in Economic Valuation of Benefits from Coral Reefs and Mangroves in Indonesia
Resource Values at Risks Sources of Data Transfer Benefits Adjusted Transfer Benefits
($/ha/yr) in 2012 Prices ($/ha/yr)a 1. Fisheries Production Value Coral Reef AMSAT (2002) 325 479 Mangrove Gunawardena and Rowan (2005) 758 149 2. Value of Local Products and Uses Coral Reef World Bank (2002) 40 59 Mangrove Gunawardena and Rowan (2005) 30 37 3. Erosion Controla Coral Reef Burke et al. (2002) 578 851 Mangrove Gunawardena and Rowan (2005) 300 372 aAll values are expressed in 2012 US dollars using MUV index and adjusted using response parameters in Table A20.13 to adjust to location-specific conditions in the project districts.
14. To make the resource values site-specific, the reference values were also adjusted to location-specific conditions using the response parameters by district shown in Table A19.13. The technical assistance mission prepared these response parameters or adjustment coefficients for the project. Many of the targets were set at 30% or 6% (as described in paragraphs below) because it was assumed that the annual net gain in any specific district would increase by 5% for income-related products and 1% for reef quality indicators. The response parameters are expressed as a percentage of resource values at risk (RRP: INO

Appendix 19 89
32176). For instance, if the project maintains incomes and those incomes would have declined by 30% in the absence of the fishery intervention, then the incremental benefit would be 30% of the resource value at risk. 15. Using the adjusted transfer benefits and the response parameters as well as the data on the area of coral reefs and mangroves by district, the weighted average net benefits per hectare for fisheries, local products and uses, and erosion control were computed. The values of the weighted average net benefits were then used to derive the project‘s estimated annual financial benefits by multiplying these values by the area of their impact in each district. The financial project benefits were multiplied by the shadow exchange rate factor of 1.11 to express them in their economic values.
Table A19.13: Estimates of Long-term Changes or Adjustments in Resource Values Response Parameters (%)
District Fisheries Local Products Erosion & Uses Control 1. Coral Reefs Batam 30 30 6 Bintan 30 30 6 Natuna 30 30 6 Mentawai 30 30 6 Lingga 30 30 6 Nias 30 30 6 Nias Selatan 30 30 6 Tapanuli Tengah 30 30 6 2. Mangroves Batam 30 6 6 Bintan 30 6 6 Natuna 30 6 6 Mentawai 30 6 6 Lingga 30 6 6 Nias 30 6 6 Nias Selatan 30 6 6 Tapanuli Tengah 30 6 6 Source: ADB, RRP: INO 32176.
16. The reef health surveys showed that reefs in the eight districts varied enormously in their coral cover. With the exception of Mentawai, live coral cover in districts on the western side of Sumatra (e.g., Nias Selatan and Nias) generally increased by 2.5% per year from 2007 to 2011, but remained in poor or fair condition. Live coral cover in Mentawai improved until 2010 and then decreased from 25% (fair) in 2010 to 18% (poor) in 2011 due to the tsunami calamity in Bosua in 2010 and the recent increase in coral damage resulting from the dropping of anchors by yachts bringing wind surfers around the island. On the eastern side of Sumatra, live coral cover increased from 2004 to 2011 in Natuna, Bintan, and Batam and has remained in good condition (i.e., > 50%), while there was a dramatic decrease in live coral cover in Lingga from 56.39% (good) in 2010 to about 36.58% (fair) in 2011. The decrease in live cover in Lingga could be attributed to bauxite mining activities and illegal fishing in the district. Meanwhile, live coral cover in Tapanuli Tengah has been maintained at 40–50%, which is the optimum level for
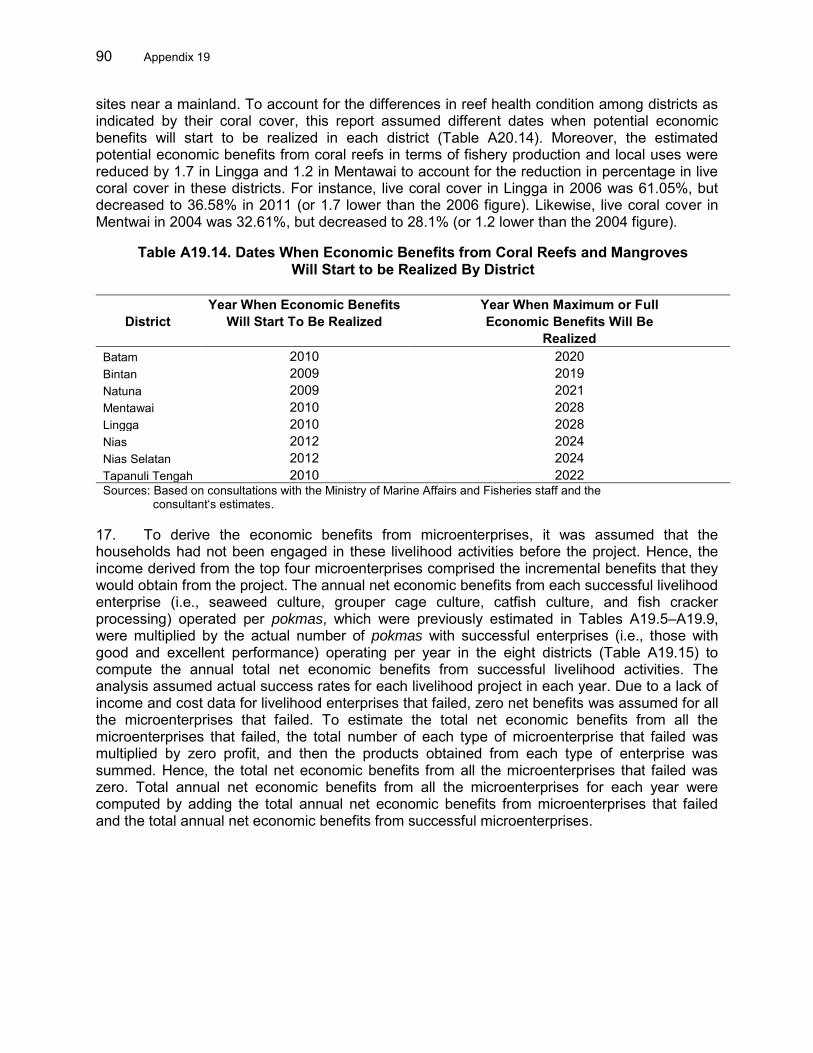
90 Appendix 19
sites near a mainland. To account for the differences in reef health condition among districts as indicated by their coral cover, this report assumed different dates when potential economic benefits will start to be realized in each district (Table A20.14). Moreover, the estimated potential economic benefits from coral reefs in terms of fishery production and local uses were reduced by 1.7 in Lingga and 1.2 in Mentawai to account for the reduction in percentage in live coral cover in these districts. For instance, live coral cover in Lingga in 2006 was 61.05%, but decreased to 36.58% in 2011 (or 1.7 lower than the 2006 figure). Likewise, live coral cover in Mentwai in 2004 was 32.61%, but decreased to 28.1% (or 1.2 lower than the 2004 figure).
Table A19.14. Dates When Economic Benefits from Coral Reefs and Mangroves
Will Start to be Realized By District Year When Economic Benefits Year When Maximum or Full
District Will Start To Be Realized Economic Benefits Will Be Realized
Batam 2010 2020 Bintan 2009 2019 Natuna 2009 2021 Mentawai 2010 2028 Lingga 2010 2028 Nias 2012 2024 Nias Selatan 2012 2024 Tapanuli Tengah 2010 2022 Sources: Based on consultations with the Ministry of Marine Affairs and Fisheries staff and the consultant‘s estimates.
17. To derive the economic benefits from microenterprises, it was assumed that the households had not been engaged in these livelihood activities before the project. Hence, the income derived from the top four microenterprises comprised the incremental benefits that they would obtain from the project. The annual net economic benefits from each successful livelihood enterprise (i.e., seaweed culture, grouper cage culture, catfish culture, and fish cracker processing) operated per pokmas, which were previously estimated in Tables A19.5–A19.9, were multiplied by the actual number of pokmas with successful enterprises (i.e., those with good and excellent performance) operating per year in the eight districts (Table A19.15) to compute the annual total net economic benefits from successful livelihood activities. The analysis assumed actual success rates for each livelihood project in each year. Due to a lack of income and cost data for livelihood enterprises that failed, zero net benefits was assumed for all the microenterprises that failed. To estimate the total net economic benefits from all the microenterprises that failed, the total number of each type of microenterprise that failed was multiplied by zero profit, and then the products obtained from each type of enterprise was summed. Hence, the total net economic benefits from all the microenterprises that failed was zero. Total annual net economic benefits from all the microenterprises for each year were computed by adding the total annual net economic benefits from microenterprises that failed and the total annual net economic benefits from successful microenterprises.
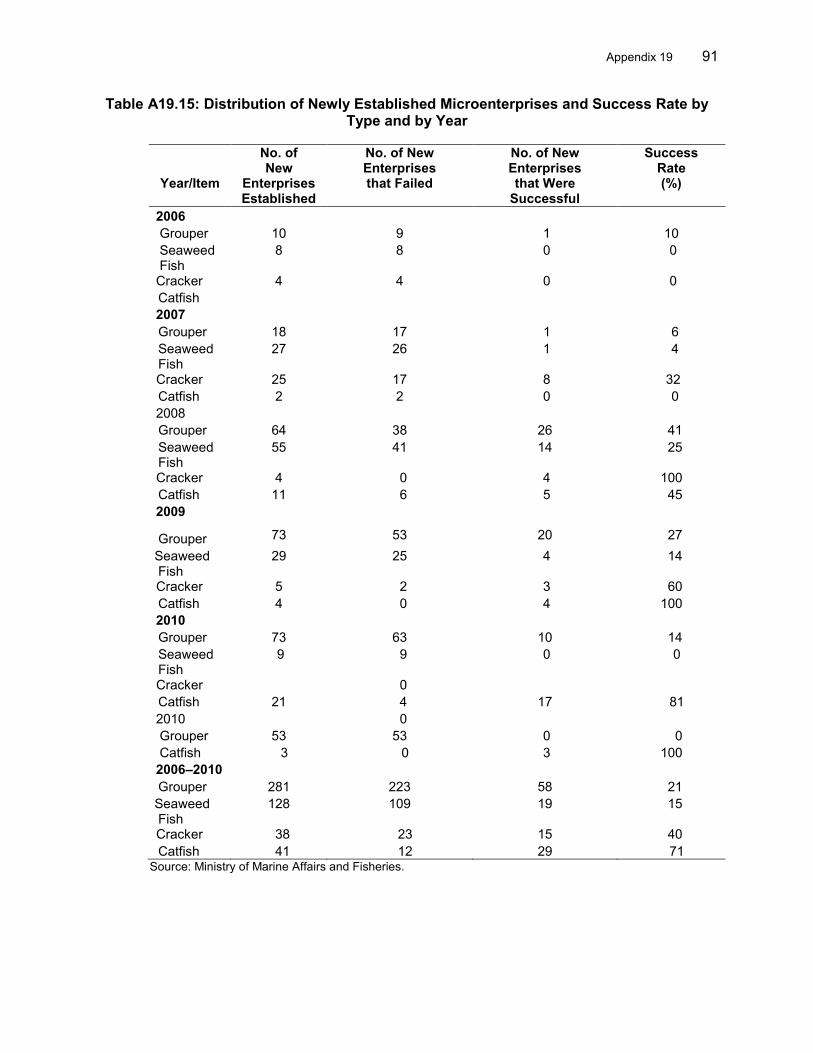
Appendix 19 91
Table A19.15: Distribution of Newly Established Microenterprises and Success Rate by Type and by Year
Year/Item
No. of New
Enterprises Established
No. of New Enterprises that Failed
No. of New Enterprises that Were
Successful
Success Rate (%)
2006 Grouper 10 9 1 10 Seaweed 8 8 0 0 Fish Cracker 4 4 0 0 Catfish 2007 Grouper 18 17 1 6 Seaweed 27 26 1 4 Fish Cracker 25 17 8 32 Catfish 2 2 0 0 2008 Grouper 64 38 26 41 Seaweed 55 41 14 25 Fish Cracker 4 0 4 100 Catfish 11 6 5 45 2009
Grouper 73 53 20 27 Seaweed 29 25 4 14 Fish Cracker 5 2 3 60 Catfish 4 0 4 100 2010 Grouper 73 63 10 14 Seaweed 9 9 0 0 Fish Cracker 0 Catfish 21 4 17 81 2010 0 Grouper 53 53 0 0 Catfish 3 0 3 100 2006–2010 Grouper 281 223 58 21 Seaweed 128 109 19 15 Fish Cracker 38 23 15 40 Catfish 41 12 29 71
Source: Ministry of Marine Affairs and Fisheries.

92 Appendix 19
18. As shown in Table A19.16, the project is economically viable since the estimated EIRR under the base situation is 29.3%, which is above the social opportunity cost of capital (12%). This is also higher than the EIRR of 19% estimated at project appraisal. The difference in the EIRR estimates between the project appraisal report and the PCR is attributed to the larger coral reef and mangrove areas used in the latter analysis. While the logframe developed at project appraisal indicates a target of 60,000 ha of coral reefs and related ecosystems and 60,000 ha of coral reef areas to be rehabilitated, the project appraisal report only considered 6,000 ha of coral reefs and 1,625 ha of mangroves in the economic analysis, which is inconsistent with the targets set in the logframe. The PCR based its analysis on the actual approved coral reef areas of 46,659 ha and mangrove areas of 83,373 ha in the project districts. At a social discount rate of 12%, the resulting positive NPV for the 28-year period indicates that the project is expected to generate Rp643.11 billion (SDR69.60 billion). The sensitivity analysis of the project also shows that it would take more than a 100% increase in project cost and 70.43% decrease in project benefits for the EIRR to decline to the cutoff level of 12% or the social opportunity cost of capital or for the NPV to be equal to zero.
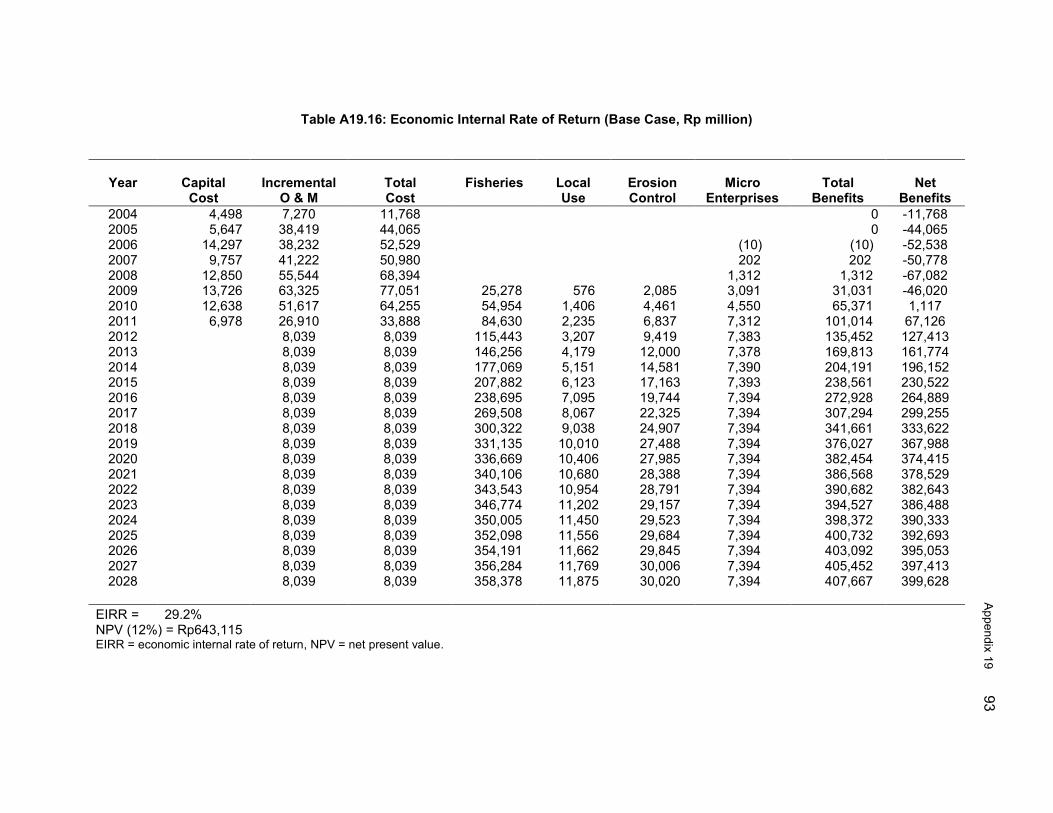
Appendix 19 93
Table A19.16: Economic Internal Rate of Return (Base Case, Rp million)
Year Capital Incremental Total Fisheries Local Erosion Micro Total Net Cost O & M Cost Use Control Enterprises Benefits Benefits
2004 4,498 7,270 11,768 0 -11,768 2005 5,647 38,419 44,065 0 -44,065 2006 14,297 38,232 52,529 (10) (10) -52,538 2007 9,757 41,222 50,980 202 202 -50,778 2008 12,850 55,544 68,394 1,312 1,312 -67,082 2009 13,726 63,325 77,051 25,278 576 2,085 3,091 31,031 -46,020 2010 12,638 51,617 64,255 54,954 1,406 4,461 4,550 65,371 1,117 2011 6,978 26,910 33,888 84,630 2,235 6,837 7,312 101,014 67,126 2012 8,039 8,039 115,443 3,207 9,419 7,383 135,452 127,413 2013 8,039 8,039 146,256 4,179 12,000 7,378 169,813 161,774 2014 8,039 8,039 177,069 5,151 14,581 7,390 204,191 196,152 2015 8,039 8,039 207,882 6,123 17,163 7,393 238,561 230,522 2016 8,039 8,039 238,695 7,095 19,744 7,394 272,928 264,889 2017 8,039 8,039 269,508 8,067 22,325 7,394 307,294 299,255 2018 8,039 8,039 300,322 9,038 24,907 7,394 341,661 333,622 2019 8,039 8,039 331,135 10,010 27,488 7,394 376,027 367,988 2020 8,039 8,039 336,669 10,406 27,985 7,394 382,454 374,415 2021 8,039 8,039 340,106 10,680 28,388 7,394 386,568 378,529 2022 8,039 8,039 343,543 10,954 28,791 7,394 390,682 382,643 2023 8,039 8,039 346,774 11,202 29,157 7,394 394,527 386,488 2024 8,039 8,039 350,005 11,450 29,523 7,394 398,372 390,333 2025 8,039 8,039 352,098 11,556 29,684 7,394 400,732 392,693 2026 8,039 8,039 354,191 11,662 29,845 7,394 403,092 395,053 2027 8,039 8,039 356,284 11,769 30,006 7,394 405,452 397,413 2028 8,039 8,039 358,378 11,875 30,020 7,394 407,667 399,628
EIRR = 29.2% NPV (12%) = Rp643,115 EIRR = economic internal rate of return, NPV = net present value.
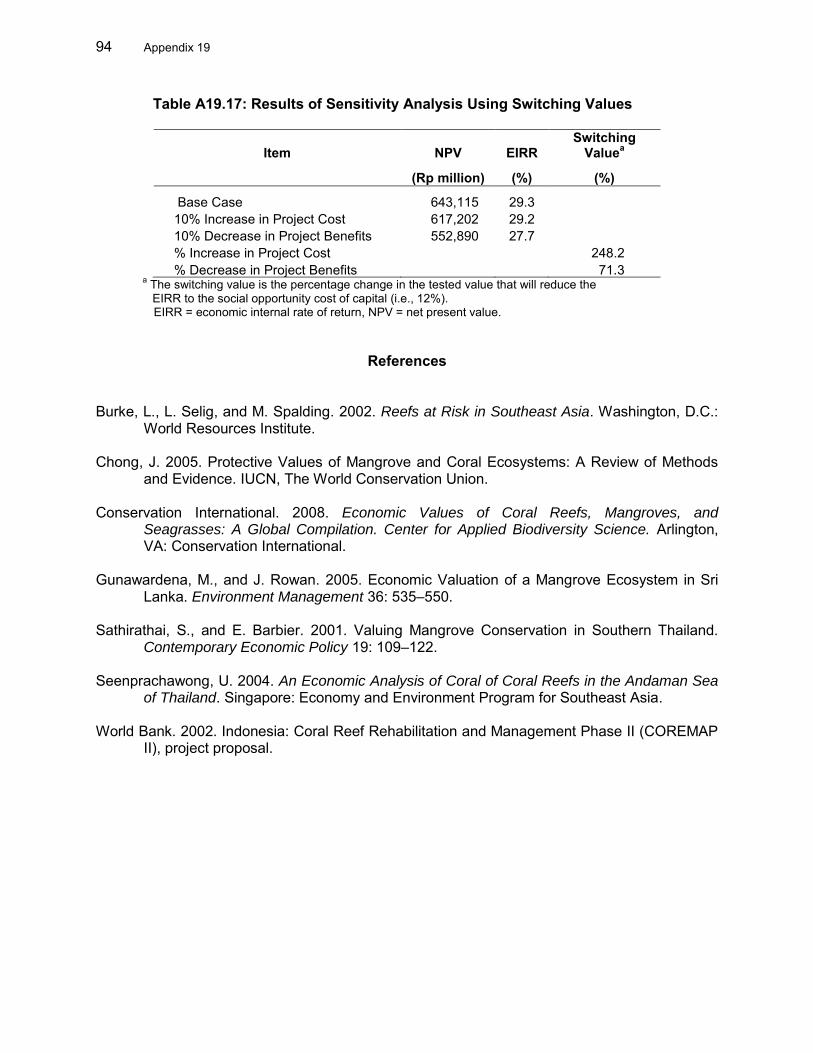
94 Appendix 19
Table A19.17: Results of Sensitivity Analysis Using Switching Values
Item NPV EIRR Switching
Valuea
(Rp million) (%) (%)
Base Case 643,115 29.3 10% Increase in Project Cost 617,202 29.2 10% Decrease in Project Benefits 552,890 27.7 % Increase in Project Cost 248.2 % Decrease in Project Benefits 71.3
a The switching value is the percentage change in the tested value that will reduce the EIRR to the social opportunity cost of capital (i.e., 12%). EIRR = economic internal rate of return, NPV = net present value.
References Burke, L., L. Selig, and M. Spalding. 2002. Reefs at Risk in Southeast Asia. Washington, D.C.:
World Resources Institute. Chong, J. 2005. Protective Values of Mangrove and Coral Ecosystems: A Review of Methods
and Evidence. IUCN, The World Conservation Union. Conservation International. 2008. Economic Values of Coral Reefs, Mangroves, and
Seagrasses: A Global Compilation. Center for Applied Biodiversity Science. Arlington, VA: Conservation International.
Gunawardena, M., and J. Rowan. 2005. Economic Valuation of a Mangrove Ecosystem in Sri
Lanka. Environment Management 36: 535–550. Sathirathai, S., and E. Barbier. 2001. Valuing Mangrove Conservation in Southern Thailand.
Contemporary Economic Policy 19: 109–122. Seenprachawong, U. 2004. An Economic Analysis of Coral of Coral Reefs in the Andaman Sea
of Thailand. Singapore: Economy and Environment Program for Southeast Asia.
World Bank. 2002. Indonesia: Coral Reef Rehabilitation and Management Phase II (COREMAP II), project proposal.
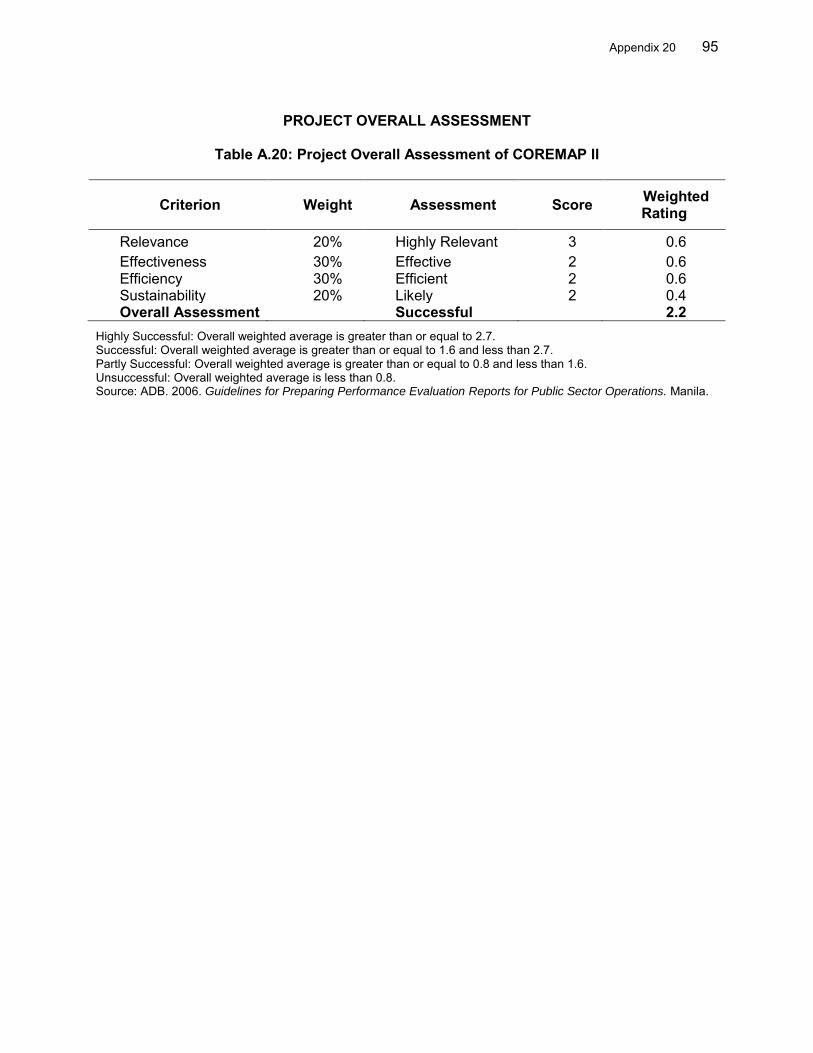
Appendix 20 95
PROJECT OVERALL ASSESSMENT
Table A.20: Project Overall Assessment of COREMAP II
Criterion Weight Assessment Score Weighted Rating
Relevance 20% Highly Relevant 3 0.6 Effectiveness 30% Effective 2 0.6 Efficiency 30% Efficient 2 0.6 Sustainability 20% Likely 2 0.4 Overall Assessment Successful 2.2
Highly Successful: Overall weighted average is greater than or equal to 2.7. Successful: Overall weighted average is greater than or equal to 1.6 and less than 2.7. Partly Successful: Overall weighted average is greater than or equal to 0.8 and less than 1.6. Unsuccessful: Overall weighted average is less than 0.8. Source: ADB. 2006. Guidelines for Preparing Performance Evaluation Reports for Public Sector Operations. Manila.