Complete College and Other Challenges TACHE November 10, 2011 John G. Morgan, TBR 1.
15
Complete College and Other Challenges TACHE November 10, 2011 John G. Morgan, TBR 1
-
Upload
aldous-paul -
Category
Documents
-
view
217 -
download
1
Transcript of Complete College and Other Challenges TACHE November 10, 2011 John G. Morgan, TBR 1.

Complete College and Other Challenges
TACHENovember 10, 2011
John G. Morgan, TBR
1

2
Revenues and Expenditures in Tennessee, 1978 Base
$0
$1,000
$2,000
$3,000
$4,000
$5,000
$6,000
$7,000
$8,000
$9,000
$10,000
$11,000
$12,000
$13,000
$14,000
78 79 80 81 82 83 84 85 86 87 88 89 90 91 92 93 94 95 96 97 98 99 00 01 02 03 04 05 06 07 08 09 10
Rev
enu
es a
nd
Exp
end
itu
res
(mil
lio
ns)
$0
$17,000
$34,000
$51,000
$68,000
$85,000
$102,000
$119,000
$136,000
$153,000
$170,000
$187,000
$204,000
$221,000
Perso
nal In
com
e (millio
ns)
Tax Financed Expenditures Adjusted Revenues Personal Income

Tennessee Higher Education Commission
Higher Education RevenuesHigher Education Revenues
Total Revenue per FTE - UniversitiesInflation Adjusted
$12,707$13,309
$12,285
$13,960
$0
$2,000
$4,000
$6,000
$8,000
$10,000
$12,000
$14,000
1998-99 1999-00 2000-01 2001-02 2002-03 2003-04 2004-05 2005-06 2006-07 2007-08 2008-09 2009-10
StAppr
StFees
Total
3

Tennessee Higher Education Commission
Higher Education RevenuesHigher Education Revenues
Total Revenue per FTE - Community CollegesInflation Adjusted
$7,529 $7,546$8,078
$8,586
$0
$1,000
$2,000
$3,000
$4,000
$5,000
$6,000
$7,000
$8,000
$9,000
1998-99 1999-00 2000-01 2001-02 2002-03 2003-04 2004-05 2005-06 2006-07 2007-08 2008-09 2009-10
StAppr
StFees
Total
4

Change in Total Funding FY 2008 to FY 2012Universities
Assumes fee increases of 8.8% at APSU, ETSU, and TSU; 9.8% at MTSU and TTU; and 11.0% at UOM

Change in Total Funding FY 2008 to FY 2012Community Colleges
Assumes a fee increase of 9.5%

Educational Attainment and Rank Among States Tennessee, 2006 (Percent)
Source: U.S. Census Bureau, 2006 ACS
7.8
23.4
6.5
85.0
82.1
0 10 20 30 40 50 60 70 80 90
Age 25-64 with Graduate/ Prof. Degree
Age 25-64 with Bachelor's or Higher
Age 25-64 with Associate Degree
Age 25-64 with HS Diploma
Age 18-24 with HS Diploma 28th
38th
48th
42nd
40th
7
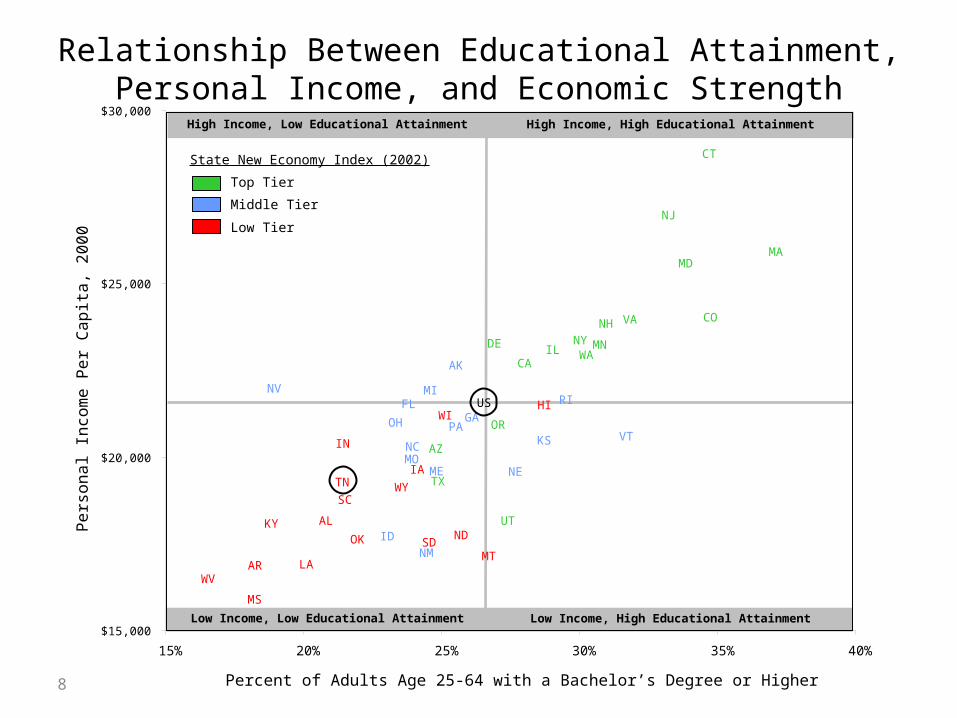
Relationship Between Educational Attainment, Personal Income, and Economic Strength
8
AL
AZ
AR
CA
CO
CT
DE IL
IN
IA
KY
LA
MDMA
MS
NJ
NY
NDOK
OR
SC
SD
UT
VA
WAMN
NH
TN TX
WV
WI
WY
$15,000
$20,000
$25,000
$30,000
15% 20% 25% 30% 35% 40%
Pers
onal In
com
e P
er
Capit
a,
20
00
Percent of Adults Age 25-64 with a Bachelor’s Degree or Higher
MT
HI
AK
GA
KS
ME NE
NV
NC
OH PAVT
ID
MI
MO
NM
RIFL US
Low Income, High Educational AttainmentLow Income, Low Educational Attainment
High Income, High Educational AttainmentHigh Income, Low Educational Attainment
State New Economy Index (2002)
Top Tier
Middle Tier
Low Tier

9
Fraction happy about life by years of completed schooling before and after conditioning on income
0.95
0.90
0.85
0.800–11 13–15 16+12
Years of schooling
Fra
ctio
n ha
ppy
No income controls Conditional on income
Source: Oreopoulos, P. & Salvanes, K.G., “Priceless: The Nonpecuniary Benefits of Schooling,” Journal of Economic Perspectives, Vol. 25, No.1.

10
Job satisfaction and years of completed schooling before and after conditioning on income
Source: Oreopoulos, P. & Salvanes, K.G., “Priceless: The Nonpecuniary Benefits of Schooling,” Journal of Economic Perspectives, Vol. 25, No.1.
0.88
0.86
0.84
0.800–11 13–15 16+12
Years of schooling
Fra
ctio
n o
f re
spo
nd
en
ts
Before conditioning on income After conditioning on income
0.82
Are you satisfiedwith your job?

11
Self-assessed health status and years of completed schooling before and after conditioning on income
Source: Oreopoulos, P. & Salvanes, K.G., “Priceless: The Nonpecuniary Benefits of Schooling,” Journal of Economic Perspectives, Vol. 25, No.1.
0.50
0.40
0.30
0.20
0–11 13–15 16+12Years of schooling
Fra
ctio
n o
f re
spo
nd
en
ts
Before conditioning on income After conditioning on income
Fraction reportingVery Good Health

12
Do you believe people can be trusted?
Source: Oreopoulos, P. & Salvanes, K.G., “Priceless: The Nonpecuniary Benefits of Schooling,” Journal of Economic Perspectives, Vol. 25, No.1.
0.60
0.50
0.30
0–11 13–15 16+12Years of schooling
Fra
ctio
n o
f re
spo
nd
en
ts
Before conditioning on income After conditioning on income
0.40

13
Likelihood of divorce or separation
Source: Oreopoulos, P. & Salvanes, K.G., “Priceless: The Nonpecuniary Benefits of Schooling,” Journal of Economic Perspectives, Vol. 25, No.1.
0.15
0.10
00–11 13–15 16+12
Years of schooling
Fra
ctio
n o
f re
spo
nd
en
ts
Before conditioning on income After conditioning on income
0.05

14
Time preferences for today or the future: Do you live for today?
Source: Oreopoulos, P. & Salvanes, K.G., “Priceless: The Nonpecuniary Benefits of Schooling,” Journal of Economic Perspectives, Vol. 25, No.1.
0.55
0.50
0.45
0.30
0–11 13–15 16+12Years of schooling
Fra
ctio
n o
f re
spo
nd
en
ts
Before conditioning on income After conditioning on income
0.35
0.40
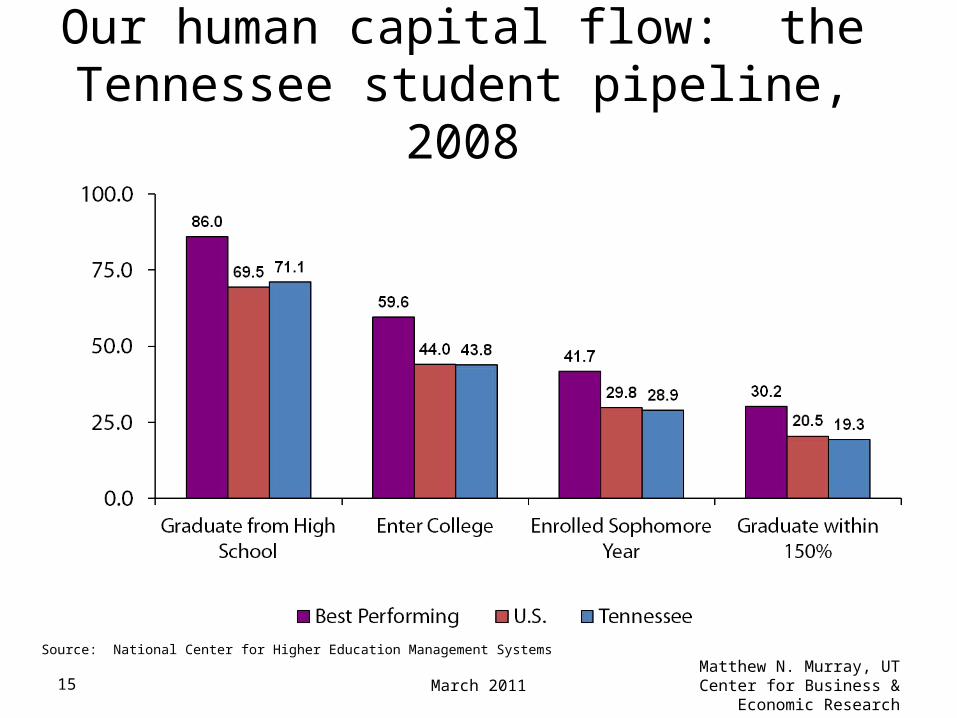
15 March 2011Matthew N. Murray, UT
Center for Business & Economic Research
Our human capital flow: the Tennessee student pipeline, 2008
Source: National Center for Higher Education Management Systems


![The RIVERA (TM) Tube Rack Series Stereo Amplifiers · 2010-02-15 · The RIVERA (TM) Tube Rack Series Stereo Amplifiers Models: TBR-1, TBR-2, TBR-3 (HAMMER [TM] 120), TBR-5 (HAMMER](https://static.fdocuments.in/doc/165x107/5f69e58a30b75209be206ce2/the-rivera-tm-tube-rack-series-stereo-amplifiers-2010-02-15-the-rivera-tm.jpg)