Compiled by Marju Aamisepp, Eduard Matveev
99
Transcript of Compiled by Marju Aamisepp, Eduard Matveev

Compiled by Marju Aamisepp, Eduard Matveev
Translated by Anneli Saluste
Cover Picture: Richard Uutmaa, View on Ottepää (1958), oil on canvas, Art Museum of Estonia, collection number: M 4257, the picture has been cropped
Compiled by Rural Economy Research Centre 73602 Jäneda, Lääne-Viru county, Estonia www.maainfo.ee
ISSN 1736-4590 Copyright: Rural Economy Research Centre 2011 This publication has been compiled at the request of the Ministry of Agriculture of the Republic of Estonia Please refer to the source when using the data of this publication

Contents NOVEMBER 2012 – AGRICULTURAL SECTOR HAS GAINED A REPUTATION FOR INNOVATION .................. 8 1. THE IMPORTANCE OF AGRICULTURAL AND FOOD SECTOR IN ESTONIAN ECONOMY .......................... 9
Russia and WTO ...................................................................................................................................... 15 1.1. Results of the Agricultural Census .................................................................................................. 17 2011 and 2012 Mark the Development of a New European Union Common Agricultural Policy ......... 23 1.2. Economic situation of the agricultural sector ................................................................................. 26
2. FROM THE PRODUCER TO THE CONSUMER......................................................................................... 332.1. Plant production ............................................................................................................................. 33
2.1.1. Cereals and field crops ............................................................................................................... 34 Use of Plant Protection Products in Estonia .......................................................................................... 36
2.1.2. Oilseed rape ............................................................................................................................... 37 2.1.3. Potatoes and vegetables ............................................................................................................ 38 2.1.4. Fruits and berries ....................................................................................................................... 40
Management of Land Improvement Systems – Forgot but Still Actual ................................................. 43 2.2. Livestock production ....................................................................................................................... 45
2.2.1. Milk Production .......................................................................................................................... 45 Strategic Overview of Dairy .................................................................................................................... 48
2.2.2. Meat production ........................................................................................................................ 50 2.2.3. Egg production ........................................................................................................................... 52 2.2.4. Honey production ...................................................................................................................... 53
The Future of Cooperation Lies in Concentration .................................................................................. 54 2.3. Organic farming ............................................................................................................................... 56 Development of Organic Farming in Estonia ......................................................................................... 59 2.4. Food Industry .................................................................................................................................. 60 Increasing Prices Frighten Both Manufacturers and Consumers ........................................................... 62
3. RURAL LIFE............................................................................................................................................ 653.1. Rural entrepreneurship and social environment of rural areas ..................................................... 65 3.2. Results of the implementation of the measures of the Rural Development Plan 2007-2013 ........ 70
3.2.1. Results of the implementation of the measures of Axis 1 and 3 of the RDP ............................. 71 3.2.2. Results of the implementation of the measures of Axis 2 ......................................................... 77
3.3. Impact of research and development on the development of the agricultural and food sector ... 81 3.4. Overview of the preparations for the RDP 2014-2020 ................................................................... 81 OECD Indicators at the Service of Efficient Agricultural Policy .............................................................. 87
ANNEXES .................................................................................................................................................... 89 Annex 1. Crop area of agricultural crops, 2004–2011 ............................................................................ 89 Annex 2. Production of agricultural crops, 2004–2011 .......................................................................... 90 Annex 3. Average yields of agricultural crops, 2004–2011 .................................................................... 91 Annex 4. Organic crop production and livestock production, 2004–2011 ............................................ 92 Annex 5. Economic accounts for agriculture, 2004–2011 ...................................................................... 93 Annex 6. Agricultural input price index, 2004–2011 .............................................................................. 94 Annex 7. Agricultural output price index, 2004–2011 ........................................................................... 94 Annex 8. Support paid for the agriculture and rural development, 2004–2011 ................................... 95 Annex 9. Support paid for the agriculture and rural development by counties, 2011 .......................... 96 Annex 10. Payments under Rural Development Plan 2007–2013, 2011 ............................................... 97 Annex 11. Unit rates of direct payments and complementary direct payments, 2004–2011 ............... 98 Annex 12. General data on land improvement systems by counties .................................................... 99 Annex 13. Agricultural holdings, 2010 ................................................................................................... 99

List of Figures
Figure 1. The share of agriculture and food sector in the creation of GDP, 2005–2011 ................................... 9 Figure 2. Total agricultural output and employment 2005–2011 ...................................................................... 9 Figure 3. Share of employed in agriculture in the total working-age population, 2005–2011 ........................ 10 Figure 4. Foreign trade of agricultural products, 2005–2011 .......................................................................... 11 Figure 5. Structure of export of agricultural products by countries, 2004 and 2011 ...................................... 12 Figure 6. Structure of import of agricultural products by countries, 2004 and 2011 ...................................... 12 Figure 7. Structure of export and import by product categories, 2011 ........................................................... 13 Figure 8. Direct payments and complementary direct payments, 2004–2011 ................................................ 14 Figure 9. Direct payments and complementary direct payments by counties, 2011 ...................................... 14 Joonis 10. Distribution of agricultural holdings and total standard output by economic size classes, 2010 ... 19 Figure 11. Distribution of agricultural holdings and total standard output by type of farming, 2010 ............ 20 Figure 12. Managers of holdings by age and gender, 2010 ............................................................................. 21 Figure 13. Representativeness of agricultural holdings, 2010 ......................................................................... 27 Figure 14. NVA per Annual Work Unit by types of farming, 2006–2011 ......................................................... 28 Figure 15. NVA per Annual Work Unit by economic size classes, 2006–2011 ................................................. 28 Figure 16. Ratio of total output to total inputs by types of farming, 2006–2011 ............................................ 29 Figure 17. Ratio of total output to total inputs by economic size classes, 2006–2011 .................................... 29 Figure 18. Investments per hectare by general types of farming, 2006–2011 ................................................ 30 Figure 19. Investments per hectare by economic size classes, 2006–2011 ..................................................... 30 Figure 20. Value of total assets per hectare by types of farming, 2006–2011 ................................................ 31 Figure 21. Value of total assets per hectare by economic size classes, 2006–2011 ........................................ 31 Figure 22. Share of holdings with positive Family Farm Income by types of farming, 2006–2011 ................. 32 Figure 23. Share of holdings with positive Family Farm Income by economic size classes, 2006–2011 ......... 32 Figure 24. Structure of the crop area of field crops, 2011 ............................................................................... 33 Figure 25. Crop area of cereals and number of producers, 2001–2011 .......................................................... 34 Figure 26. Crop area of cereals, 2005–2011 ..................................................................................................... 34 Figure 27. Production and yield of cereals in Estonia, 2001–2011 .................................................................. 35 Figure 28. Yield of cereals, 2001–2011 ............................................................................................................. 35 Figure 29. Use of pesticides in agricultural holdings, 2001–2011 ................................................................... 37 Figure 30. Crop area of oilseed rape, 2001–2011 ............................................................................................ 37 Figure 31. Yield of oilseed rape, 2001–2011 ................................................................................................... 37 Figure 32. Production of oilseed rape per capita, 2005–2011 ......................................................................... 38 Figure 33. Level of self-sufficiency of oilseed rape, 2000–2011 ...................................................................... 38 Figure 34. Crop area of potatoes and outdoor vegetables, 2001–2011 .......................................................... 38 Figure 35. Yield of potatoes and outdoor vegetables, 2001–2011 .................................................................. 38 Figure 36. Crop area of fruits, 2001–2011 ....................................................................................................... 40 Figure 37. Yield of fruits, 2001–2011 ............................................................................................................... 40 Figure 38. Buying-up prices of cereals, protein crops and oilseed rape, 2005–2011 ...................................... 42 Figure 39. Share of drained land of total agricultural area by counties, 2011 ................................................. 44 Figure 40. Number of livestock as at 31 December, 2001–2011 ..................................................................... 45 Figure 41. Milk production in Estonia in 2001–2011 ....................................................................................... 46 Figure 42. Change in the number of herds and cows, 2001–2011 ................................................................... 46 Figure 43. Production and buying up milk, 2005–2011 ................................................................................... 47 Figure 44. Buying-up price of milk, 2005–2011 ................................................................................................ 47 Figure 45. Cow milk production per capita, 2001–2011 .................................................................................. 47
4
Figure 46. Level of self-sufficiency in milk production, 2005–2011 ................................................................. 47 Figure 47. Buying in prices of pigmeat and beef, 2005–2011 .......................................................................... 51 Figure 48. Level of self-sufficiency in meat production, 2005–2011 ............................................................... 52 Figure 49. Egg production per capita, 2001–2011 ........................................................................................... 52 Figure 50. Level of self-sufficiency in egg production, 2005–2011 .................................................................. 52 Figure 51. Production of honey per capita, 2001–2011 ................................................................................... 53 Figure 52. Importance of organic farmland in the total utilized agricultural area, 2000–2011 ....................... 56 Figure 53. Number of organic farmers in Estonia, 2001–2011 ........................................................................ 57 Figure 54. Organic farmland and the number of acknowledged organic producers by counties, 2011 .......... 57 Figure 55. Structure of land use, 2011 ............................................................................................................. 58 Figure 56. Share of organic farmland in the total utilized agricultural area in the EU, 2010 ........................... 58 Figure 57. Share of food industry in manufacturing industry, 2005–2011 ...................................................... 60 Figure 58. Number of enterprises in food industry, 2005–2011 ...................................................................... 60 Figure 59. Food industry output index, 2001–2011 ......................................................................................... 60 Figure 60. Foreign food trade, 2005–2011 ....................................................................................................... 61 Figure 61. Foreign drink trade, 2005–2011 ...................................................................................................... 61 Figure 62. Structure of food industry by categories, 2005 and 2010 ............................................................... 61 Figure 63. Net internal migration rate in local communities, 2006–2010 ....................................................... 65 Figure 64. Number of people employed in rural areas by sectors, 2001–2011 ............................................... 66 Figure 65. People employed in rural areas by the location of their main workplace, 2001–2011 .................. 67 Figure 66. Number of economically active entrepreneurs, 2004–2011 .......................................................... 68 Figure 67. Regional distribution of economically active entrepreneurs .......................................................... 68 Figure 68. Total support granted in the programming period, 2009–2011 ..................................................... 71 Figure 69. Cumulative number of submitted applications, 2007–2011 ........................................................... 71 Figure 70. Number of approved applications and number of beneficiaries by measures, 2007–2011 ........... 72 Figure 71. Share of approved applications in total submitted applications, 2007–2011 ................................ 72 Figure 72. Number of beneficiaries compared to the RDP target level, 2007–2011 ....................................... 73 Figure 73. Total funding allocation and the average amount granted per beneficiary, 2007–2011 ............... 73 Figure 74. Share of expenditure of the overall allocation by measures .......................................................... 74 Figure 75. Total funding allocation by counties ............................................................................................... 74 Figure 76. Total funding allocation by hectare of eligible area ........................................................................ 74 Figure 77. Total funding allocation by beneficiary ........................................................................................... 75 Figure 78. Comparison of the economic results of the beneficiaries with the average for the sector ........... 76 Figure 79. Share of organic producers in the total number of beneficiaries ................................................... 77 Figure 80. Payments for supporting agriculture and rural development, 2005–2011 .................................... 77 Figure 81. Structure of payments for supporting agriculture and rural development, 2011 .......................... 77 Figure 82. Distribution of payments under Axis 2, 2011 .................................................................................. 78 Figure 83. Progress on implementation of target levels of Axis 2 of the RDP 2007–2013, 2011 .................... 78 Figure 84. The area covered by support, 2011 ................................................................................................. 78 Figure 85. Nitrogen leaching from water monitoring fields in the background of the data on hydrochemical monitoring of rivers ................................................................................................................. 80 Figure 86. Rural development policy as a part of the Common Strategic Framework .................................... 82 Figure 87. The EU funding allocation for Estonian rural development since 2000 .......................................... 83 Figure 88. Stages of drafting the RDP 2014–2020 ............................................................................................ 84 Figure 89. Relation of the RDP 2014–2020 objectives to the EU rural development priorities and CAP general objectives ............................................................................................................................................ 86
5
List of Tables
Table 1. Crop area and yield of field crops, 2009–2011 ............................................................................ 33 Figure 2. Production of potatoes and outdoor vegetables per capita, 2007–2011 .................................. 39 Table 3. Crop area and yield of vegetables, 2009–2011 ........................................................................... 39 Table 4. Crop area and yield of fruit and berry orchards, 2009–2011 ...................................................... 40 Table 5. Production of fruit and berry orchards per capita, 2007–2011 .................................................. 41 Table 6. Producer prices of cereals and oilseed in the EU, 2011 .............................................................. 41 Table 7. Buying-up prices of cereals, protein crops and oilseed rape, 2001–2011 .................................. 41 Table 8. Number of herds by size groups, 2005-2011 ............................................................................... 46 Table 9. Meat production, 2001–2011 ...................................................................................................... 51 Table 10. Meat production per capita, 2001–2011 ................................................................................... 51 Table 11. Number of bee colonies and production of honey, 2001–2011 ............................................... 53 Table 12. Producer prices of livestock products in the EU, 2011 .............................................................. 53
6
Abbreviations
AB Agricultural Board ARC Agricultural Research Centre ARIB Estonian Agricultural Registers and Information Board CAP Common Agricultural Policy CF Cohesion Fund CODEX Codex Alimentarius Commission DG AGRI Directorate-General for Agriculture and Rural Development EAFRD European Agricultural Fund for Rural Development EAGF European Agricultural Guarantee Fund EARC Estonian Animal Recording Centre EMKF European Maritime and Fisheries Fund ENRD European Network for Rural Development ERF European Regional Development Fund ESF European Social Fund EU European Union EULC Estonian University of Life Sciences EUROSTAT Statistical Office of the European Union FADN FADN – Farm Accountancy Data Network FAO Food and Agriculture Organization of the United Nations GVA Gross Value Added IPPC International Plant Protection Convention LEADER Liaison entre Actions de Developpement de l’Economie Rurale RDP 2007–2013 Axis 4 LFA Less Favoured Area MoA Ministry of Agriculture NVA Net Value Added OECD Organisation for Economic Co-operation and Development OIE World Organization for Animal Health RDP Rural Development Plan SAP Single Area Payment SAPARD Special Accession Programme for Agriculture and Rural Development SE Statistics Estonia SWOT Strengths, Weaknesses, Opportunities and Threats analysis VFB Veterinary and Food Board WTO World Trade Organization
7

November 2012 – Agricultural Sector has Gained a Reputation for Innovation Helir-Valdor Seeder, Minister of Agriculture
In November 2012 we can say that Estonian agriculture is heading in a positive direction. Challenging weather conditions this year ranged from favourable growth period in spring to extremely wet autumn with harvest being both late and interrupted by rain. However, the results of the annual farming com-petition show that record-breaking yields were harvested from a large number of fields. Milk produc-tion has demonstrated the highest growth over the past years achieved as a result of increase in effi-ciency.
Estonian food industry and food export have demonstrated growth. New manufacturing facilities have been opened in the agricultural sector and there are more to be launched. Our agricultural producers have made smart decisions – invested in new technologies both to increase the efficiency and eco-friendliness of production. Agricultural enterprises are among the top Estonian enterprises and this has been achieved not only as a result of supports but also to devoted work. I am happy to see that there are more young farmers among agricultural producers – it is a sign of generation change.
Drafting of dairy strategy was a remarkable achievement bringing together producers, manufacturers and the Ministry to jointly discuss all the stages of milk production and manufacturing to propose solu-tions for overcoming bottlenecks. Such integrated approach to the supply chain involving representa-tives of producers and manufacturers as equal partners is innovative in Estonia. It is particularly re-markable that the dairy sector itself initiated the development of the strategy. By signing the memo-randum of collaboration the parties committed themselves to jointly contribute to achieving the agreed objectives according to their possibilities.
The Rural Development Plan 2014-2020 is actively being drafted. 29 different organizations are partici-pating in the work, thus covering the whole area of rural development from agriculture, food supply chain, research, environment, entrepreneurship to local initiative. Together we are focusing on envi-ronmental conservation more than ever before and looking for the best possibilities for the reduction of the environmental impact of agriculture, thereby preserving our land. We are seeking to ensure that agriculture provides us with food and thousands of people with employment for a long time to come.
Agriculture as a basis for food production is a strategic economic sector. We will make sure that sus-tainable development of agriculture has a promising future. There is an old Estonian saying “Food is more than just us.”
8

1. The importance of agricultural and food sector in Estonian economy Illar Lemetti, Deputy Secretary General for Agricultural and Rural Life Policies of the Ministry of Agriculture
Mai Talvik, Liina Jürgenson, Kadri Rand, Marii Maiste, Veronika Vallner-Kranich, Agricultural Market Organization Department of the Ministry of Agriculture
Marje Mäger, Trade and Agro-Food Department of the Ministry of Agriculture
In Estonia Agricultural Census is conducted every ten years. Agricultural Census 2010 was carried out from 1 September to 15 November. Agricul-tural Census gives a detailed overview of agricul-ture, in addition to agricultural activities other gainful activities are mapped. This time Agricul-tural Census also focused on production methods and environmental impact and agricultural activi-ties on the level of local governments. A publica-tion on Agricultural Census data was issued in September 2010.
Results of the Agricultural Census show that Es-tonian agriculture is concentrating in large agri-cultural holdings. Also, a significant share of agri-cultural land is rented. According to the data of Agricultural Census there were 19,613 agricul-tural holdings in Estonia in 2010 whereas 5% of these holdings accounted for three quarters of the total agricultural output of Estonia. In 2007 there were 23,257 agricultural holdings, thus in three years the number of holdings had de-creased 16%.
According to the data of Agricultural Census 2010, 940,930 hectares of agricultural area was in the possession of agricultural holdings in Esto-nia. More than half of the agricultural area (55%) and 83% of livestock production was in the pos-session of approximately 900 agricultural hold-ings. In 2010 11,000 persons had a full-time job in large holdings and the value of agricultural out-put was ca 41,000 euros per Annual Work Unit.
In 2010 there were 10,687 small agricultural holdings of less than 10 ha accounting for 55% of the total number of agricultural holdings. There were 1,724 holdings of over 100 ha of agricultural area accounting for 9% of the total of agricultural holdings. An agricultural holding possessed 48 ha of agricultural area on average showing a 23% rise in comparison with the data three years ago
and a twofold rise on 2003. Thus, reditribution of land between holdings of different size classes can be observed.
Figure 1. The share of agriculture and food sec-tor in the creation of GDP, 2005–2011
Figure 2. Total agricultural output and employ-ment 2005–2011
In 2010 the number of holdings of livestock type of farming was 9,679 (49% of the total number of holdings) showing a decline of 30% in comparison with 2007. At the same time the number of cattle decreased only 5%. The average number of live-stock and poultry has significantly increased in agricultural holdings, also, the importance of
1,0%
1,5%
2,0%
2,5%
3,0%
3,5%
2005 2006 2007 2008 2009 2010 2011
Source: SE
Agriculture, forestry and fisheries
Food sector
60
80
100
120
140
160
2005 2006 2007 2008 2009 2010 2011Source: SE
Employment
Total output
2005=100
9

large holdings in livestock production has grown. There were 52 cattle, 45 sheep, 6 goats, 251 pigs and 390 poultry per agricultural holding on aver-age. Milk cows were breeded in every fifth hold-ing, however, 76% of the dairy herd (70% in 2007) was reared in holdings of 100 or more milk cows (218 holdings). The majority of pigs (91%) were produced in holdings of 2,000 or more pigs (80% in 2007, respectively).
Figure 3. Share of employed in agriculture in the total working-age population, 2005–2011
Crop production
In 2011 crop production accounted for 46% of gross agricultural production. Cereal production as the main supplier of livestock production sec-tor contributed for 37% of the total crop produc-tion, followed by forage crops with 19%, oilseed (oliseed rape, turnip rape, flax) 19%, vegetables 14%, potatoes 8% and other crops of minor im-portance.
Estonia is self-sufficient in cereal production, the crop area of cereals is 300,000 ha and cereal pro-duction 700,000 tonnes a year.
The yield for cereals in Estonia is still low when compared to other European Union Member States. In 2011 the cereal yield in the EU was 5.6 t/ha on average, in Estonia it was only 2.60 t/ha. The main reasons for the low yield are the weather, investments (agricultural machinery, fertilizers, plant production products etc) and the ratio of winter and summer cereals (winter cere-als are of bigger yield potential and cultivation of winter cereals is more common in Europe). Al-though the average yield for cereals is low in Es-tonia as a whole, there are producers capable of harvesting yields similar to the average yields of the Europe Union.
It is necessary to increase the yield per hectare to ensure economically sustainable development of
cereal production. However, it requires applica-tion of modern agrotechnical means and prac-tices. This, in turn requires considerable invest-ments and provision of agricultural producers with the latest information and knowledge by means of organizing seminars and trainings. An-other restriction to an abrupt increase in the yield is environmental requirements in Estonia; thus, there is an increasing need for the applica-tion of production methods and technologies in which case the environmental status can be taken into consideration.
In addition to cereal production, cultivation of oilseed rape and turnip rape has become very popular in Estonia reflected by a fivefold increase in the crop area of oilseed rape and turnip rape over the past 15 years. The main reason for the rise in cultivation of oilseed rape is a rise in buy-ing-up prices because oilseed rape as an oilseed crop is an alternative energy source. The crop area of oilseed rape cannot be endlessly in-creased; therefore, more attention should be paid to increasing the average yield of oilseed rape (currently 1.6 t/ha in Estonia and 2,9 t/ha in the EU on average). In Estonia mostly summer oilseed rape has been cultivated. Our winters are not favourable for the wintering of winter oilseed rape with high yield potential.
In 2011 the gross value of vegetable production accounted for 13% of the gross value of crop production, remaining stagnant at 2010 level. At the same time the area of outdoor vegetables inreased 7% to 2,981 hectares. The area of ma-ture apple and pear orchads was 3,329 ha in 2011 remaining stagnant at 2010 level. In 2011 the gross value of fruit production was 1.5% of the gross value of crop production showing a 0.4% decrease on 2010.
Since 2010 the producers of fruits and vegetables have had a possibility to market fruits and vege-tables within the school fruit scheme supported by the EU. In schoolyear 2012/2013 kindergarten children and the 5th forms in school were also included in the target group of fruit support to promote the use of fruits and vegetables, im-prove the eating habits and increase the con-sumption of healthy food.
Livestock production
In 2011 gross value of livestock production ac-counted for 54% of the gross value of total agri-cultural production. The basis for the calculation of the gross value of livestock production is the
0%
3%
6%
9%
12%
15%
2005 2006 2007 2008 2009 2010 2011Source: Eurostat
Latvia
Estonia
Finland
Lithuania
10

live weight of slaughtered animals, liveweight gain, livestock products and complementary di-rect payments for production. Milk accounted for more than a half (54%) of the gross value of live-stock production, followed by pigs 22%, cattle 11%, poultry 6% and eggs 3%.
According to the data of Agricultural Census 49% of agricultural holdings are engaged in livestock production. Comparison with the previous years shows that the number of livestock and poultry in agricultural holdings has significantly increased, as well as the importance of large holdings in livestock production.
In the past years the total number of cattle has increased as a result of an increase in the number of beef cattle. The number of milk cows has de-creased, but as a result of increased productivity milk production has increased. In 2011 milk pro-duction reached 7,168 kg per cow on average, exceeding the EU average milk production per cow.
In 2011 5,200 tonnes more meat was produced than in 2010. Pigmeat accounted for 61%, poultry 21% and beef for 15% of the total meat produc-tion (83,000 tonnes). In 2011 60 kg of meat per capita was produced, however, 94 kg of meat was consumed. Therefore, despite of an increase in meat production it does not cover the needs of the domestic market. The internal market is self-sufficient only in pigmeat consumption. The level of self-sufficiency in poultrymeat, which is the second favourite type of meat of Estonians, was only 58% in 2011.
Manufacturing
The importance of food industry (incl drink indus-try) has declined in the past twenty years, also, the share of food industry in manufacturing in-dustry has decreased. Despite of these trends food industry with its long traditions has been one of the most important sectors of Estonian manufacturing industry; it is the main industry buying up and addind value to agricultural prod-ucts. Similar to other economic sectors, the year 2011 marked a period of recovery from the crisis. In 2011 food industry contributed to approxi-mately 2% of the Estonian GDP and 8% of the export of industrial production. Food sector em-ployed 14 % of the labour force of the manufac-turing sector.
In 2010 food industry contributed to 16% of the total output of the Estonian manufacturing sec-
tor, in 2011 the share dropped to 14%. However, decline in the importance of food industry was less significant in the period of economic regres-sion when compared to a number of other sec-tors of industry. The situation in other sectors has improved but the share of food industry is still decreasing. Dairy products account for one third of the total output of food industry, followed by meat products, drinks and bread and baking products.
Trade
Production exceeds the demand of the domestic market, therefore, development of food industry is greatly dependant on the ability of the industry to increase the export volume and enter new markets. The adventage of Estonian export lies in its long traditions in food manufacturing and use of natural and organic raw materials. In 2011 the export of and import of agricultural products increased 22% and 21%, respectively, when com-pared to last year. Negative foreign trade balance increased 17%.
Figure 4. Foreign trade of agricultural products, 2005–2011
The main export partners of Estonia are the neighbouring countries – Russia, Latvia, Finland and Lithuania. Export to these countries ac-counted for 65% of total export of agricultural products in 2011.
Small production capacity is the main obstacle to the development of export in Estonia. It is related to a big number of industries and dependence on markets of intervention products and over-orientation to the sale of raw material. Taking into account remarkable fluctuations in prices of raw materials (particularly milk powder, butter and pizza cheese) on the world market resulting in unstable income of producers, it would be more beneficial to focus on finding markets for
200
400
600
800
1 000
1 200
1 400
2001 2003 2005 2007 2009 2011Source: SE
Import
Export
mln euros
11

manufactured products. Dairy sector is focused on export more than any other sector of Estonian food industry. In 2011 approximately 40% of the output of milk was exported.
Dairy products of the value of 168 million euros were exported in 2011. Despite of a sharp decline in Russian export, total export increased 14%. The increase is related to other export markets important for Estonia, particularly Latvia and Lithuania. The latter are overcoming the eco-nomic crisis and increasing the demand for im-ported milk. The biggest export articles in mone-tary value were cheese and curds accounting for 35% of the total export. The importance of milk and cream was also significant – 26%. The share of other product categories was less than 10%. The export value of butter increased most of all (+30%) and the export value of milk powder de-creased most sharply (-27%). Over half of the milk products were exported to the EU market: in 2011 76% of the milk products were exported to
the EU market and 21% to Russia. The export capacity of the dairy industry is significantly af-fected by the price level of dairy products on the world market.
In the period 2008 to 2009 the price level on the world market dropped significantly, however, from August 2009 the price started to increase rapidly. Price fluctuations on the markets of higher value added products have not been as remarkable as on the markets of raw material. Decrease in the prices on the markets important for manufacturers results in a decline of the price of crude milk paid to the producer. The position of producers in price negotiations could be im-proved by more active concentration of produc-ers in producer groups, cooperation in marketing of their products, increased participation in manufacturing; also, enhanced cooperation and trust between producers and manufacturers could be a benefit.
Figure 5. Structure of export of agricultural products by countries, 2004 and 2011
Figure 6. Structure of import of agricultural products by countries, 2004 and 2011
Lithuania17%
Latvia16% Finland
11%
Russia10%
Sweden3%
Denmark3%
Other EU states
9%
Other states14%
2004
Source: SE
Germany6%
Netherlands11%
Russia20%
Finland17%
Latvia16%
Lithuania11%
Sweden4%
Denmark4%Other EU
states7%
Other states15%
2011
Germany 6%
Finland15%
Lithuania12%
Latvia8%
Poland6%
Denmark5%
Sweden4%
Other EU states18%
Other states13%
2004
Source: SE
Germany 10%
Netherlands9%
Latvia18%
Finland12% Lithuania
12%
Poola7%
England6%Denmark
5%
Other EU states17%
Other states
7%
2011
Germany 8%
Netherlands8%
12

On the domestic market the position of Estonian food industry is rather favourable. Development of food industry is inhibited by small domentic market and the increasing influence of super-market chains (international chains buy products from different countries across the distribution network by means of underbidding, and sell the products as own-label products all over their trade network), as well as relatively low purchas-ing power of consumers. In general, Estonian people have preferred food products of domestic origin, however, rapid rise in prices has increased the number of these buyers who do not consider the country of origin of products important. In 2011 60% of the consumers preferred domestic food products. Within a year the share of con-
sumers preferring domestic food products dropped 6%. Food products have become anonymous, it is difficult to find information about the country of origin and therefore, it is difficult for the consumer to prefer domestic products. To date the sale success has mostly been ensured by good price and quality ratio of the products. Price growth affects the popularity of domestic food products. In the retail trade concentration and constantly increasing pressure from large supermarket chains on the assortment and prices can be observed. Estonian producers have to ensure stable quality and a competitive price for their products in order to maintain the market share of domestic products.
Figure 7. Structure of export and import by product categories, 2011
Direct payments and complementary direct payments
Direct payments from the EU budget and com-plementary direct payments from Estonian state budget are paid to agricultural producers to sup-port their income. Single Area Payment has been granted for maintaining agricultural area in good condition since 2004.
According to the Common Agricultural Policy the main aim of the allocation of direct payments is to increase the competitiveness of the agricul-tural sector and the income level of agricultural producers, as well as remove the link between the receipt of a direct payment and the produc-tion of a specific product. The objective of Single Area Payment Scheme as an area-based support decoupled from the production of a specific crop is to partially compensate for the producer the minimum cost of the maintenance of agricultural areas. It contributes to preserving the fertility of these agricultural areas and ensures easier trans-
fer to the utilization of these agricultural areas for production purposes if need be.
The level of the unit rate of SAP is obtained by dividing the country's annual financial envelope by the number of hectares of eligible agricultural land kept in good agricultural and environmental condition in the year of applying.
Special support in dairy sector initiated in 2010 is targeted at small dairy herds of up to 100 cows and dairy herds on small islands. The aim of the support is to preserve the milk production level in economically vulnerable enterprises and re-gions (islands). Ca 1.2 million euros of special support for the dairy sector are paid annually.
Complementary direct payments are equally im-portant for agricultural producers. The objective of these payments is to support different produc-tion sectors in crop and livestock production (milk production, field crops production, beef,
Other products
32%
Soft and alcoholic
drinks17%
Cereals6%
Export
Source: SE
Milk and milk products
17%
Fish and fish products
16%
Meat and meat products
7%
Live animals4%
Other products
34%Soft and alcoholic
drinks22%
Import
Milk and milk products
4%
Fish and fish products
9%
Meat and meat products
9%
Sugar and cocoa products
7%
Vegetables and fruits
4%
13
suckler cow, sheep production). In most cases complementary direct payments are paid as a support decoupled from production (except complementary direct payments for ewes and suckler cows). These payments contribute to supporting the stability of income of producers and making production decisions according to the market demand. According to the application of the Republic of Estonia the European Commis-sion adopted a decision on defining the comple-mentary direct payments and their ceilings until the year 2010. According to the accession agreement complementary direct payments for agricultural producers will be removed in 2012. In order to ensure more smooth transfer of the ag-ricultural producers to the new direct payments system in the EU new financing period (2014-2020) the Council Regulation on direct payments was amended proving a possibility for granting transfer payments from the 2013 state budget.
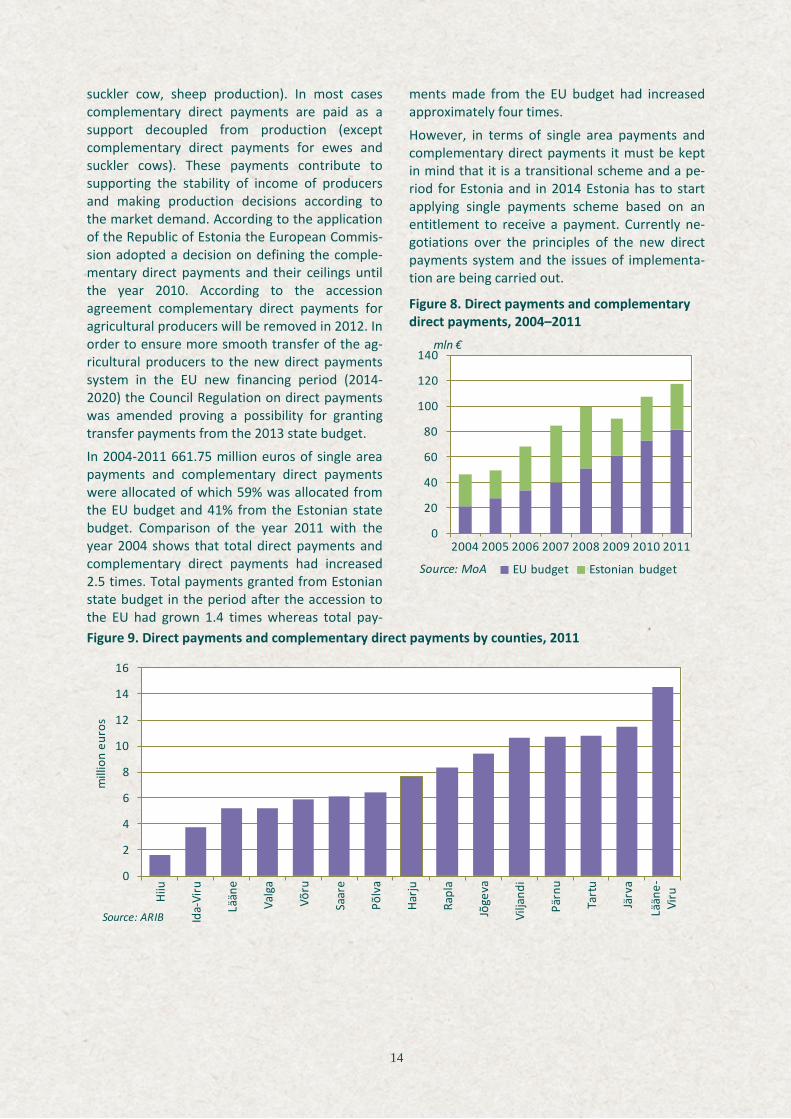
In 2004-2011 661.75 million euros of single area payments and complementary direct payments were allocated of which 59% was allocated from the EU budget and 41% from the Estonian state budget. Comparison of the year 2011 with the year 2004 shows that total direct payments and complementary direct payments had increased 2.5 times. Total payments granted from Estonian state budget in the period after the accession to the EU had grown 1.4 times whereas total pay-
ments made from the EU budget had increased approximately four times.
However, in terms of single area payments and complementary direct payments it must be kept in mind that it is a transitional scheme and a pe-riod for Estonia and in 2014 Estonia has to start applying single payments scheme based on an entitlement to receive a payment. Currently ne-gotiations over the principles of the new direct payments system and the issues of implementa-tion are being carried out.
Figure 8. Direct payments and complementary direct payments, 2004–2011
Figure 9. Direct payments and complementary direct payments by counties, 2011
0
20
40
60
80
100
120
140
2004 2005 2006 2007 2008 2009 2010 2011
EU budget Estonian budgetSource: MoA
mln €
0
2
4
6
8
10
12
14
16
Hiiu
Ida-
Viru
Lään
e
Valg
a
Võru
Saar
e
Põlv
a
Harju
Rapl
a
Jõge
va
Vilja
ndi
Pärn
u
Tart
u
Järv
a
Lään
e-Vi
ru
mill
ion
euro
s
Source: ARIB
14
Russia and WTO Kristina Uibopuu, European Union and Foreign Affairs Department of the MoA, Permanent Representation of Estonia in Geneva The accession negotiations between Russia and the WTO lasted 18 years. There are very few countries having held so lengthy negotiations. The package of documents on Russia’s accession to the WTO is one of the most voluminous sets of documents; the chapter on agriculture is without doubt the longest in the WTO accession history. The European Union with its 27 Member States was one of the most active parties of the negotiations. It is no wonder as the EU is Russia’s largest trading partner among the WTO member countries. The European Commission negotiated on behalf of the EU Member States. The European Commission represents the EU Member States in the WTO with one vote and coordinates the position of the Member States before speaking for the EU. Russia, Kazakhstan and Belarus established a Customs Union 1 January 2010, thus making the WTO accession negotiations much more complicated and for a time being, they got stuck. The main problem was how the Customs Union would relate to the WTO. If the three countries eliminate customs duties and other principles of free trade are applied how can Russia ensure that in case of accession to the WTO the tariff agreements and other non-tariff rules will be implemented, when at the same time, Russia has concluded special agreements with Belarus and Kazakhstan? Russia promised to ensure commitment to fully apply all WTO provisions, thus, the negotiations were continued. The WTO countries kept an eye on the process of the adoption of the acts of the Customs Union as a number of issues concerning foreign trade had moved from the internal competence of Russia to the competence of the Customs Union. Establishment of the Customs Union was an extremely extensive process and a number of totally new regulations had to be adopted. The WTO accession process became very complicated. Before the adoption of an act the legislative process had to get approval not only from the Russian Parliament, but above all, from the Customs Union. The process is still continuing and Russia has to adopt a number of legal acts without any delay in order to ensure conformity to the WTO requirements. The negotiations on the terms of accession were concluded in autumn 2011. The European Commission gave an overview of the effect of the accession of Russia to the WTO on the EU estimating that the total export from the EU to Russia will grow by 3.9 billion euros (after the end of certain transition periods when the final bound rates will be applied). A great part of the estimate is based on the prerequisite that in addition to tariff cuts (a part of the final bound rates will be implemented on the date of accession, the other after the transition period), Russia is going to reform the trade legislation to ensure that application of laws, regulations and other measures affecting trade are in conformity with relevant WTO standards. Also, Russia is expected to remove the market distorting measures such as discriminative price practices and non-tariff trade barriers. From the date of accession to the WTO the average new tariff rate for agricultural products shall be 10.8 % comparing with the current 13.2 %. The tariff rate for dairy products that is important for Estonia will be 14.9% comparing with the current 19.9% (according to the estimates of the EU the value added in export shall be approximately 45 million euros per year). A favourable agreement for the EU was reached in terms of tariff rate quotas of meat in which case the in-quota tariff rates shall be applied. It means that meat products entering the Russian market within the quota will face the following lower tariffs: 1. The in-quota tariff rate for beef 15%, the quota for fresh and chilled beef 29,000 tonnes a year
and frozen beef 60 000 tonnes a year (out of quota tariff rate 55%). 2. The in-quota tariff rate for poultry 25%, EU quota 80,000 tonnes a year. 3. The in-quota tariff rate of zero per cent for pork (400,000 tonnes a year), it is an exemption for
the EU and the lower tariff rate is valid until the end of 2019, thereafter the tariff rate quota for pork will be replaced by a flat top rate of 25%.
15
Most of the lower tariff rates were applied from the date of accession of Russia to the WTO and increase in volumes of products exported to Russia has already been observed. The quota tariff rates of some of the meat products have a transitional period (eg poultrymeat, the tariff rate drops from 80% to 25%, thus, Russia was granted an eight year transitional period for lowering the tariff rate). National supports in Russia (agricultural subsidies for farmers, various market price supports) and export competition. From the date of accession, Russia has committed to fully apply all WTO provisions and eliminate all export subsidies currently applied in Russia. The total trade distorting agricultural support would not exceed USD 9 billion in 2012 and would be gradually reduced to USD 4.4 billion by 2018. What does it mean for an Estonian agricultural producer? We are competing on the same markets; thus, competition will become more equal. The EU is reforming the Common Agricultural Policy (CAP) and the support policy takes into consideration the WTO regulations; therefore, it is important that Russia would do the same. In a wider context it is also important in terms of multilateral trade. In order to ensure more equal competition the task of the WTO is to monitor and control that all domestic agricultural supports of its member countries are distorting the market in the least possible way. The WTO has always kept an eye on the EU CAP and the US Farm Bill. The EU has updated the CAP throughout a number of reforms; as a result, it is more liberal now. At the same time, the WTO had no information about Russian agricultural policy until now. As a member of the WTO Russia is not allowed to impose specific customs procedures on countries – all importers either from Estonia or Argentina have to be treated equally. In the course of negotiations the WTO countries highlighted the problems concerning the administrative regulations adopted by the Federal Customs Service of Russia (FCS) directly affecting exporters. However, the FCS has given insufficient information or no information at all. Upon the request of the WTO, Russia has developed a web page where the latest information about the customs procedures must be available (http://eng.customs.ru). Also, Russia has to ensure a harmonized VAT rate for domestic and imported goods. China joined the WTO more than ten years ago but is still a problematic member in this regard because it has been heard that China is still applying different rates of the VAT. The WTO countries have strongly disapproved of the behaviour of China and called for the harmonization of the application of VAT with the WTO regulations. Hopefully, Russia will not follow the bad example of the Republic of China. As mentioned before, a great part of the trade restrictions countries are trying to apply in one way or another, are related to non-tariff trade restrictions. These restrictions are often related to sanitary and phytosanitary requirements (SPS agreement) for the transport of goods. Countries can impose such restrictions only in accordance to the WTO SPS agreement in case of a serious risk to the health of a person, animal and plant. A great part of the WTO SPS agreements are related to the regulations adopted by international organizations responsible for drafting food safety, animal and plant health standards. Therefore, it is important that Russia respects the standards of these organizations (CODEX, OIE, IPPC). Russia has banned the import of live animals from the EU and this ban is still in force. According to the opinion of the EU countries and the EC it is in conflict with the WTO regulations and the commitments Russia has taken upon the accession to the WTO. No actual danger has been detected and Russia has not provided any scientifically based explanation about the necessity of the restriction. If there is a risk to the health of a person (or the health of an animal or plant as provided in the WTO SPS agreement) a WTO country has the right to implement relevant import bans. It is important that restrictions are proportional to the level of risk and the country imposing restrictions (in this case Russia) provides a scientifically based explanation of the measures. Also, Russian interpretation about the grounds for entering the exporting countries in relevant lists is a topic of discussions. Russia is no longer willing to use the former guarantees of the exporting country as a basis for the so-called listing but requires audits to be carried out in relevant enterprises. The issue is problematic not only for the EU but also for the USA and Norway enterprises exporting to Russia. The EU and other countries have raised the issue at the WTO SPS
16
1.1. Results of the Agricultural Census Eve Valdvee, Agricultural Census Department of Statistics Estonia
According to the recommendation of the interna-tional Food and Agriculture Organization (FAO) Agricultural Census is conducted every ten years in a number of countries all over the world. In the European Union Agricultural Census is conducted in all Member States, as the data is necessary for the development of Common Agricultural Policy. The 2010 Agricultural Census was the sixth cen-sus in Estonia, the second after the restoration of independence. The survey included all agricul-tural holdings where there was at least one hec-tare of utilized agricultural area or where agricul-tural products were produced mainly for sale.
Number and size of agricultural holdings
According to the final results of the Agricultural Census there were 19,613 agricultural holdings in Estonia in 2010 including 3,500 holdings where only maintenance mowing was performed. There were 5,890 so-called semi-subsistence agricul-tural holdings that consumed more than half of their produced agricultural production. The num-ber of such holdings has decreased almost three times within five years, however, the number of holdings that produce mainly for sale has not changed substantially. In terms of legal form of ownership of the holdings an increasing number of holdings prefer to operate as legal persons.
The number of holdings of legal persons (limited liability companies, public limited companies) has increased twice.
In terms of the number and size of agricultural holdings clear regional differences can be ob-served. The share of small holdings is the largest in South Estonia (in Võru, Valga and Põlva coun-ties, also in Ida-Viru county and on islands (see the distribution of holdings on the map in the annex). At the same time the share of large hold-ings is the biggest in Lääne-Viru, Järva and Vil-jandi counties. Consequently, the average size of holdings differs by counties. In Järva and Lääne-Viru counties characterized by a bigger share of large holdings and a smaller share of small hold-ings, the average size of a holding is considerably larger than in other counties – 88 and 82 hec-tares, respectively, exceeding the average of Es-tonia (48 ha) almost twice. The average size of a holding is significantly smaller in South Estonia and on islands, the smallest in Võru county – 24 hectares, ie twice less than the average of Esto-nia.
Land use and livestock farming
In 2010 940,930 hectares of utilized agricultural area was in the possession of agricultural hold-
plenary session. As SPS trade discussions are always very detailed and discussions are often prolonged because of different interpretation of the agreement, solutions for the disputes between the WTO countries have never been proposed overnight. The same applies to Russia. Special formal WTO Committees have been set up for solving specific trade problems. WTO countries address their problems to the Committee and the country imposing restrictions has to give a response to the problem. In addition, there is an unofficial format for solving problems – bilateral negotiations. The Trade Directorate of the EC has actively used this possibility for finding solutions for specific trade problems and is currently negotiating with Russia. The last and evidently the least pleasant format is the Dispute Settlement Body (DSB) set up by the WTO for resolving trade quarrels. It is also called the WTO Court. A dispute arises when a member government believes that another member government is violating an agreement or a commitment that it has made in the WTO and no agreement has been reached as an outcome of the negotiations. Then one member country shall appeal another member country to the Dispute Settlement Body. The process may take several years before a decision is made. In this stage negotiations are not usually held any longer. DSB is a case-law type of law in order to avoid similar situations in the future. As the EU foreign trade policy has been delegated to Brussels, the European Commission, i.e Directorate General for Trade participates in the disputes on behalf of the EU Member States in the WTO.
17

ings, 69,700 hectares more than at the time of last agricultural census. It shows that together with the disappearance of smaller holdings, the land not used has been taken into use by larger holdings. 68% of the agricultural area was arable land, almost 32% accounted for permanent grass-land, 0.3% permanent crops and 0.2% kitchen gardens. 40% of the permanent grassland, i.e. 12% of the total agricultural area was maintained as permanent grassland not used for production purposes. The most important arable crops were cereals and protein crops (30% of the agricultural area), forage crops on arable land (22%) and in-dustrial crops (11%). Compared to 2001, the area of industrial crops (mainly oilseed rape) has in-creased 2.5 times from 28,000 hectares to 71,000 hectares. At the same time the area of potatoes in agricultural holdings has decreased from 16,000 hectares to 6,000 hectares. Together with the disappearance of smaller holdings there has also been a decline in the area of kitchen gar-dens, where vegetables, fruits and berries are grown mainly for own consumption (from 12,600 hectares to 1,700 hectares).
The share of rented land has increased from 45% to 53% and both the share of land in the owner-ship and other tenure has decreased. Distribution of the agricultural area by form of ownership differs substantially in case of large and smaller holdings. If in case of holdings with less than ten hectares the majority of agricultural area, i.e. 89% is in the ownership and in case of holdings with 50–100 hectares ownership accounts for almost a half (the rest is rented land), then in case of holdings with at least 1,000 hectares the land in the ownership accounts only for 28% and the majority of the agricultural area is rented land.
When compared to 2001, the number of agricul-tural holdings with livestock has decreased more than threefold from 32,400 to 9,400. However, the number of livestock units has decreased only by 7%. As at 1 September 2010 there were 241,000 cattle in agricultural holdings, including 96,300 dairy cows, 389,000 pigs, 87,000 sheep, 1.9 million poultry, 3,700 goats, 22,000 beehives, 3,400 female rabbits and 6,700 horses. Decrease in livestock units when compared to the previous census is a result of the decrease in the number of cattle (14%), particularly in smaller holdings. Hence a decrease in dairy cows (25%) and an increase in other beef animals are particularly conspicuous. Decrease in the number of cattle is
partly compensated by an increase in the number of pigs 18%, as well as twofold increase in the number of sheep. The number of poultry has decreased 12%, also, changes have occurred in the structure of poultry breeding by species – the number of broilers has increased 1.7 times (by 426,000), the number of other hens and cocks has decreased 1.8 times (by 699,000).
Similarily to regional differences in the number and size of households, clear differences by coun-ties can also be observed in terms of land use and livestock farming. In Tartu, Järva and Lääne-Viru counties the share of agricultural land and per-manent crops accounts for over 80% whereas on islands the share is less than 40% (in Hiiu county even less than 30%). At the same time the share of arable land and permanent crops in agricul-tural area shows roughly the efficiency of the use of the agricultural area as income from perma-nent grassland is always smaller. The share of permanent grassland not used for production is the largest in Ida-Viru and Harju counties (24% and 19%, respectively). Järva county with its more than 30,000 cattle is the county with the largest number of cattle, Saare county with 16,200 sheep is predominantly the sheep breed-ing county and Viljandi county with 122,300 pigs (according to the data of production statistics) is the pig breeding county. Harju county can be pointed out as the poultry breeding county con-centrating 76% of Estonian poultry production.
Distribution of agricultural holdings by Total Standard Output and type of farming
On the basis of the results of the 2010 Agricul-tural Census Total Standard Output of agricul-tural holdings was 594.4 million euros accounting for a 21% rise on 2007. Total Standard Output is the monetary value of gross agricultural produc-tion at average farm-gate price. It aggregates the monetary value of crop and livestock farming. 900 large agricultural holdings (Total Standard Output of 100,000 euros or over) gave three quarters of Total Standard Output whereas al-most three quarters of the holdings are small agricultural holdings (with Total Standard Output of less than 8,000 euros) and account only for 5% of Total Standard Output. This distribution shows the high level of concentration of agricultural production. Concentration has significantly grown compared to the previous Agricultural Census.
18

Joonis 10. Distribution of agricultural holdings and total standard output by economic size classes, 2010
The average area of large holdings is 585 ha. The average area of smaller holdings accounting for three quarters of the holdings in Estonia is only slightly less than 10 ha. Medium-size holdings (Total Standard Output 8,000–100,000 euros) have 63 hectares of utilized agricultural area on average. In large holdings the major part (80%) of the utilized agricultural area is arable land with intensive production whereas in smaller holdings half of the agricultural area is permanent grass-land not used for production purposes but still regularly mowed in order to maintain the land-scape. Smaller holdings have 2.5 hectares of ar-able land per holding on average. In terms of arable crops small holdings account for a signifi-cant share in potato production, as well as in kitchen gardens and fruit and berry production. Production of industrial crops, cereals and forage crops on arable land has concentrated in large holdings.
Also, pig, poultry and livestock production has concentrated in large holdings. 97% of pigs, 94% of poultry and 78% of livestock are produced in large holdings, other species account for less than 20% of the production. Smaller holdings have found their niche in goat, beehive and fe-male rabbit farming.
The average Total Standard Output per agricul-tural holding in Estonia was 30,300 euros whereas the average Total Standard Output per holding in Järva and Lääne-Viru counties (mostly
large holdings) was 59,200 and 55,500 euros, respectively (almost twice as much as the aver-age of Estonia). In Järva and Lääne-Viru counties large holdings (with Total Standard Output of at least 100,000 euros) produce 84% and 83% of the Total Standard Output, respectively whereas in Hiiu and Võru counties large holdings contribute to 47% and 55% of Total Standard Output.
Holdings are also classified by type of farming (field crops, horticulture, permanent crops, graz-ing livestock, granivores) based on the share of Total Standard Output received from different activities. If the share of one activity is at least 2/3 of the holding’s Total Standard Output, the holding is considered to be a specialist holding; otherwise, it is a holding engaged in mixed farm-ing.
Holdings with no Total Standard Output (the holding only has maintained permanent grass-land, fallow land or a kitchen garden) are consid-ered to be non-classifiable holdings. The share of specialist holdings is very large in Estonia – 65% of holdings are specialist holdings and produce 88% of Total Standard Output. Holdings of field crops type of farming (35%) and holdings of graz-ing livestock type of farming account for the big-gest share in the total holdings, 35% and 24%, respectively. Also, holdings of grazing livestock and field crops type of farming produce the big-gest share of Total Standard Output, 48% and 22%, respectively.
44%
15% 14%9%
5% 5% 4% 3% 1% 1%1% 1% 3% 3% 3% 6%8%
13%10%
52%
0%
10%
20%
30%
40%
50%
60%
0-<2 2-<4 4-<8 8-<15 15-<25 25-<50 50-<100 100-<250 250-< 500 >=500Number of holdings Total Standard OutputSource: SE
19

Figure 11. Distribution of agricultural holdings and total standard output by type of farming, 2010
Labour force and the efficiency of the use of labour force
When compared to the previous Agricultural Census both the number of persons engaged in farm work, as well as their labour input have de-creased proportionally to the decrease in the number of holdings, almost 60%. In 2001 140,600 persons were engaged in farm work in agricul-tural holdings whereas in 2010 the respective number was 57,800. Most of them (39,700) were family labour force, 12,900 were regular employ-ees and 5,200 non-regular employees who were only temporarily involved in seasonal or other temporary work. Thus, family labour force, regu-lar employees and non-regular employees ac-count for 69%, 22% and 9% of the persons en-gaged in farm work, respectively. As a result of the decrease in the number of holdings family labour force has decreased almost threefold (by 70,000 persons). At the same time, the number of regular employees has decreased only by a quarter (by 4,400 persons).
In a number of European countries the majority of agricultural labour force is male whereas in Estonia the dominance of men is not so clear. In Estonia 55% of permanent labour force are men and 45% are women. However, the dominance of men has slightly increased when compared to 2001 (52% of men and 48% of women). Among regular employees the dominance of men is slightly higher (58%).
Although the number of persons in family labour force is continuously big, family members are very often involved in work with a small number of working hours and therefore, family labour force accounts only for 53% of the farm work (72% in 2001). At the same time, regular employ-ees account for 45% of labour input. The rest of farm work is done by non-regular employees or
by contractors. The share of labour input of regu-lar employees has steadily increased. It can be said the EU agriculture is mostly based on family labour force, however, it is not the case in Esto-nia any longer. Also, it is different by regions. In Järva, Harju, Jõgeva and Lääne-Viru counties where large holdings are dominant, most of the farm work is already done by regular employees whereas in Hiiu county and South Estonia agricul-tural production is still mostly based on family labour force.
Labour input in holdings varies a lot and is higher in holdings of horticulture and milk type of farm-ing. Two thirds of agricultural holdings in Estonia are so small that they provide farm work for less than one person. Slightly less than half of the holdings (44%) provide farm work for less than half of the Annual Work Unit. In these holdings agriculture is not the main area of activity and there are other sources of income. A quarter of the holdings are traditional family farms provid-ing full-time work for at least one but less than two persons – mostly for the holder assisted by other family members. More than half (nearly 60%) of the farm work is done in 12% of the hold-ings providing work for a third of the total agri-cultural labour force. 35% of farm work is done in 1% of large holdings.
Slightly more than a quarter of all persons en-gaged in agricultural holdings (28%, i.e 14,700 persons) have a full-time job in the holding. 9,100 persons, i.e 62% are full-time regular farm work-ers and the rest is full-time family labour. Other persons engaged in farming work part-time.
The working time of a very large share of the regular labour force – 32,600 persons, i.e 62% account for less than 50% of full time work (the
35%
3% 2%
24%
2%
17% 18%22%
5%
48%
13% 12%
0%
10%
20%
30%
40%
50%
60%
Field crops Horticulture Permanent cops
Grazing livestock
Granivores Mixed Non classifiable
Number of holdings Total Standard OutputSource: SE
20

working time of 48% of farm workers is even less than 25% of full time work).
As a large proportion of farm work is done in smaller holdings with low efficiency and the number of these holdings has decreased several times when compared to the previous Agricul-tural Census, the labour input per utilized agricul-tural area has also decreased. In 2001 the labour input per 100 hectares of utilized agricultural area was almost 7 annual work units whereas in 2010 it was 2.7, almost three times less. It is still better to estimate the efficiency of the use of labour force by Total Standard Output that aggregates in monetary value both the output from crop and livestock production. Total Stan-dard Output per labour input has increased by 55% in three years on average. On the one hand the labour input has decreased (78% of the labour input in 2007) and on the other hand the value of production has increased (121% of Total Standard Output in 2007). At the same time considerable increase in efficiency can be observed in case of large holdings of Total Stan-dard Output of at least 100,000 euros (37%), medium-sized holdings of Total Standard Output of 8,000–1,000 euros (25%) and small holdings of Total Standard Output of less than 8,000 euros (19%). Thus, Total Standard Output per labour input is almost 12 times smaller in small holdings than in large holdings and six times smaller than in medium-sized holdings. It is the result of low work efficiency in semi-subsistence agricultural holdings, also it is related to the fact that land not used for production purposes but only maintained in good agricultural and environmental conditions, as well as theproduc-tion of kitchen gardens is not taken into account when calculating Total Standard Output.
Managers of holdings
Managers of holdings are quite old, only a quar-ter of them are less than 54 years of age and 52% are more than 55 years of age (of which 28% are more than 65 years of age, i.e. in pension-age). At the same time the age of managers is also related to the size of a holding - the larger the holdings, the smaller the number of pension-aged manag-ers and the higher the number of managers within the age group 35–54. In small holdings a third of the managers are at least 65 years old, in large holdings their share is only 8%.
In terms of labour, predominance of men is small whereas in terms of manages, men are dominant.
64% of managers are male and 36% female. Men are predominant in the age group 35-54.
Distribution of managers by gender depends largely on the size of a holding. Women manage mainly smaller holdings – in smaller holdings the share of female managers is 40% whereas in me-dium-sized holdings and large holdings the share of female managers is 27% and 13%, respectively. Agricultural output of the holdings with female managers accounts only for 13% of the total agri-cultural output in monetary value.
Figure 12. Managers of holdings by age and gender, 2010
Most of the managers of holdings (65%) do not have any special agricultural education. 23% of the managers have undertaken formal agricul-tural training, i.e. agricultural higher education (incl applied higher educational establishments and technical high schools) and 14% of managers have completed basic agricultural training. Like the age of managers, the qualification in agricul-ture also varies a lot by the economic size of a holding. 70% of the managers of small holdings have only practical experience whereas almost 60% of the managers of large holdings have at-tained some type of formal agricultural qualifica-tion and 28% of the managers of these holdings rely only on practical experience. Additionally, it has to be taken into account that there are very large units among large holdings where the man-ager is not directly engaged in agriculture any longer and managers of subdivisions have at-tained an agricultural qualification.
23% of the managers participated in vocational training in 2010. 40% of managers with formal agricultural education participated in vocational training whereas the participation rate of man-agers with basic agricultural training or without special agricultural training in vocational training was almost two times lower (24% and 16%, re-spectively). On the other hand, vocational train-
40% 20% 0% 20% 40%
Over 65
55-64
45-54
35-44
25-34
Under 25
Source: SE
MaleFemale
21
ing is more important for the managers of larger holdings of Total Standard Output of over 100,000 euros. In this size group the rate of par-ticipation of managers in vocational training was 70%.
Other gainful activities and rural development
Farm labour force can be engaged also in other gainful activities in their own holding or outside. Other gainful activity can be also agricultural ac-tivity outside the holding. Although other gainful activities of farm labour force are surveyed only in holdings where the holder is also the manager, it does not affect the results because in most cases in holdings of natural persons the holder is also the manager (95%). As an exception, the spouse of the holder not participating in farm work of the holding and regular workers engaged only in gainful activities directly related to the holding are taken into account when surveying other gainful activities.
In 2010 19,479 farmers were engaged in gainful activities other than their farm work in 2010. 6,995 were holders, 5,705 spouses of holders, 6,750 other family members of the holders and 29 regular workers. Thus, almost half of family labour force was engaged in gainful activities. In line with significant decline in the number of holdings the number of family labour force en-gaged in gainful activities has also considerably decreased, however, their importance has slightly increased. Other gainful activities of the majority of family labour force engaged in gainful activities (95%) were not directly related to the holding, thus, only 5% of other gainful activities were directly related to the holding. The more so, 84% of the family labour force engaged in other gainful activities had other gainful activities as his or her major occupation and farming as his/her subsidiary occupation.
In addition to working outside the holding, addi-tional income can be earned through diversifica-tion of the activity of the holding into non-agricultural fields, using land, buildings and equipment of the holding). In that case someone of the farm labour force is partly engaged in non-agricultural activity of the holding.
In 2010, 2,647 agricultural holdings were en-gaged in diversification. The share of holdings engaged in diversification has risen from 7.5% to 13.5% when compared to 2003 when diversifica-tion was first surveyed. Most common non-agricultural activities of the holdings are agricul-
tural contracting (includes both non-agricultural and agricultural contracting) and forestry. 317 holdings, ie 12% are engaged in tourism activi-ties. 534 holdings are engaged in more than one non-agricultural activity. Unlike in Europe, proc-essing of agricultural products is not very popular in our country. On the one hand it is possible that other gainful activities of our relatively large holdings are often registered as individual enter-prises, therefore, their activities are not regis-tered as other gainful activities of the holding. On the other hand in the EU the holdings engaged in processing of their own products are often those specializing in permanent crops and their share is insignificant in our country.
As the number of small holdings is the largest, small holdings engaged in other gainful activities are more numerous. At the same time, engage-ment in other gainful activities directly related to the holding is more common in case of larger holdings. The share of the smallest holdings en-gaged in other gainful activities is 8%, whereas 47% of the holdings of Total Standard Output of 250,000–500,000 euros are engaged in other gainful activities. The most popular non-agricultural activity – agricultural contracting is more common in large holdings as they have an advantage in the form of machinery available in their own holdings. Other popular gainful activi-ties – forestry and tourism are more common in smaller holdings.
Most holdings engaged in non-agricultural activi-ties (42%) receive less than 10% of their total output from other gainful activities. 32% of hold-ings get 10–50% of farm income and 26% get their main farm income, i.e at least 50% of total output from non-agricultural activities. The larger the economic size of a holding, the smaller the share of farm income received from non-agricultural activities. 43% of the holdings of the smallest size group receive major farm income from other gainful activities, whereas holdings of the economic size group of at least 500,000 euros only 2%. Holdings not producing agricultural products, but only maintaining their land in good agricultural and environmental condition and are granted agricultural supports receive the main farm income from non-agricultural activities.
The results of Estonian Agricultural Census 2010 are published on the webpage of Statistics Esto-nia www.stat.ee, more detailed information is available in the tables.
22

2011 and 2012 Mark the Development of a New European Union Common Agricultural Policy Kaul Nurm, member of the European Economic and Social Committee, Estonian Farmers Federation 2012 marks the 50th anniversary of the implementation of the Common Agricultural Policy (CAP). The Treaty of Rome provided for the establishment of a Common Agricultural Policy in 1962 and it has been an inseparable part of the EU treaties since then. Over the years the objectives of the CAP have been revised according to the expectations and needs of the society. The primary objectives of the CAP were modernization of the agriculture of the Member States and assuring the availability of food supplies. Later environmental and rural development measures were added.
Different instruments have been used for the implementation of the CAP objectives. The primary instruments were Common Customs Tariffs for the protection of the internal market and other market regulation instruments. Thirty years later the share of market measures were considerably decreased resulting in the decline of the income of the producers. The latter were compensated for by means of direct payments, also, being applied today. The level of direct payments is different by Member States, regions or areas of production. At the beginning cereal producers gained most of all, as reductions in income were most considerable in the cereal sector. These policy instruments have been concentrated under Pillar I of the CAP and account for about 80% of the CAP funding and for 50% of the relevant Estonian national budget. Environmental and rural development policy instruments have been concentrated under Pillar II of the CAP and account for 20% of the EU CAP budget and for 50% of the relevant Estonian national budget.
In general, CAP is stable in the long term, however, occasionally reforms are being introduced. The practice of the past years shows that reorganization is initiated within the development of the new seven-year financial framework of the EU.
First, discussions on the CAP reform were held and the positions were developed in the Council of the European Union and the European Parliament, which, according to the Lisbon Treaty have the decisive role in the adoption of legal acts.
In 2011 new objectives of the CAP were defined by the European Commission, in 2012 debates over these objectives are being carried out. The European Economic and Social Committee and the Committee of the Regions are consultative assemblies, issuing opinions to the Council, the Commission and the European Parliament. Discussions were also held in these committees. The European Court of Auditors has also given its opinion. In the Council of the European Union mostly the interests of the Member States are focused on. In the European Parliament and the Committee of the Regions the interests of the fractions are considered above all whereas in the background each member of the European Parliament stands for the interests his/her member country. At the same time in the European Economic and Social Committee the interests of the organisations representing different sectors and through them the interests of the European citizens are in the forefront.
In addition to the institutions of the European Union various umbrella organizations, i.e lobby organizations, including agricultural producers’ organizations, food manufacturing, environmental or consumer organizations representing the interests of their members, are also participating in the discussions on CAP. Thus, it all demonstrates the scope of the discussions on the CAP reform and evidently adoption of decisions is not easy in this situation.
I will present the opinion of the European Economic and Social Committee (EESC) on the CAP re-form below. As a member of the EESC I have also contributed to the development of the opinion.
23
Opinion of the European Economic and Social Committee on the CAP reform proposals The EESC has repeatedly stated that the future CAP must be driven by a determination to defend the European agricultural model, which is based on the principles of food sovereignty, sustainability and responsiveness to the real needs of farmers and consumers. The present financial and economic crisis, climate changes and markets put farmers under increasing pressure leading to the abandonment of entire regions in Europe. Therefore, more than ever before, the European agricultural model is indispensable. The EESC calls for the Parliament, the Council and the Commission for the EU budget allocated to the CAP to be maintained. In addition to food production agriculture delivers different services to society, such as safeguarding viable rural communities and infrastructure, balanced regional development and rural employment, maintenance of traditional landscapes, national heritage and traditions, biodiversity, protection of the environment, and highest standards of animal welfare and food safety. As European farmers and foresters provide these multifunctional services for the benefit of society as a whole, often incurring additional costs without a compensating market return, it is necessary and justified to reward them through public intervention. The European agricultural model cannot operate at world market prices and conditions and does not come free of charge. Any policy that promotes European agricultural model thus requires sufficient financial resources and market regulation instruments.
Direct payments The EESC supports the moving away from the historical reference period initiated within the CAP reform of 1992 but recommends provision of the member states with certain flexibility and a longer transition period in the application of new support rates. Also, the EESC welcomes the efforts to close the gap between the level of support received by farmers in the different Member States. Therefore, the Committee recommends that the main features for the future CAP in terms of the redistribution of financial resources among Member States should be balance, fairness and pragmatism. It is important that the redistribution process should reflect sensitively the problems of farmers both from old and new member states. That is why the EESC recommends redistribution of national direct payment envelopes based on objective, non-discriminatory criteria. The goal is to ensure that no country's direct payments would be under 90% of the average of the 27 EU Member States at the end of the financial framework for the period 2014-2020. The EESC notes that the uneven level distorts competition between Member States resulting in economic and social consequences, especially for the Baltic countries, hence, it is important to state that the Economic and Social Committee is the only official EU institution that has presented such objective and the EESC members of the Baltic countries have a significant role in defining the objective. The CAP payments under Pillar I should be targeted at active farmers. Clear definitions of agricultural activity, eligible land and active farmer, as well as better links between payments and activity should be established in order to avoid a limited budget being consumed by unfarmed land and non-agricultural activities. Also, closer connection between supports and agricultural activities should be established. The EESC endorses the decision to introduce a simplified support scheme for small farmers, but doubts whether the support rates proposed by the Commission will be high enough to promote the development of small agricultural holdings. The EESC supports a phased-in reduction by capping direct payments. Unused direct payments should remain in the Member State's envelope and be used to support weaker agricultural sectors at national level through Pillar I or Pillar II to be decided at Member State level. This is a proposal to differentiate direct payments. Estonian Farmers Federation made a similar proposal in Estonia already in 1999. This good idea has not been implemented because of the confrontation of politicians who act in the interest of large producers. However, it would contribute to the balancing of competition conditions for the producers of different scale and restrict the concentration of agriculture in a small number of producers.
24

The greening component is a way of creating a stronger and more visible link between direct payments and the environmental public goods produced by farming. The EESC believes that this system should be kept simple, and should ensure environmental outcomes from all farmers across the EU. The measure for "ecological focus areas" should be implemented in a manner that avoids agricultural land being taken out of production. It should be possible to take into account the specific features of Less Favoured Areas when determining payments. Also, EESC supports the CAP payments under Pillar I for young farmers.
Market instruments The EESC considers that the Commission proposals are insufficient to meet the challenge of increasing market volatility and the problems resulting from it. The CAP objective of stabilising agricultural markets, as set out in the Lisbon Treaties, is not addressed by the legislative proposals. As mentioned before, it is not possible to protect the European agricultural model in the situation of world market prices. Therefore, market-regulating instruments are important. They are particularly important for Estonia as Estonia is situated in the Northern areas where, because of the natural conditions inputs per product unit are bigger than in case of agricultural producers located good natural conditions both in Europe and elsewhere in the world. Therefore, we cannot create an illusion that Estonia would be competitive in a world without supports and market instruments. It is vital to strengthen the position of farmers and their organisations in the food supply chain in order to secure a better return from the markets. The EESC welcomes the extension of product coverage for recognition of producer organisations, their associations, and inter-branch organisations. It is also of paramount importance for EU competition rules to be adjusted to allow producer organisations and cooperatives to strengthen their positions on the market. In order to strengthen the bargaining power of farmers within the food production chain, the EESC also considers it necessary to create conditions for developing short supply chains managed directly by farmers. Also, more attention has to be paid to encouraging local and regional initiatives such as farmers markets and direct marketing. Since 77% of the EU-27 food market is already controlled by only fifteen commercial chains, the Committee feels that efforts are needed to balance commercial supply against the power of the distribution market and that consideration should be given to whether competition law is enough to prevent the emergence of market dominance and questionable contractual practices. The EESC believes that the Globalisation Adjustment Fund should be used primarily to provide support for agricultural producers made redundant as a result of major structural changes in world trade due to globalisation.
Rural development The EESC considers Pillar II to be the key tool to ensure the preservation of the European agricultural model. Rural development policies should be geared primarily towards the innovation and competitiveness of farm businesses in keeping with the European agricultural model. It is necessary to support farm investments, promote generational renewal, support the development of supply chain integration measures, improve relations between farm businesses and the food processing industry, support environment and climate-friendly measures and processes. The EESC welcomes the proposed closer alignment of the CAP with the EU 2020 strategy and the sustainability strategy for rural development, with particular emphasis on research, innovation, training and advice. The EESC agrees with the introduction of the European Innovation Partnership in the context of rural development policies. The EESC believes this tool will primarily promote and support research activities designed to foster the productivity and sustainability of agriculture and forestry, to ensure the efficient use of environmental resources, to enhance the contribution of agriculture and forestry to the struggle against climate change, to improve quality and safety at work in agriculture and forestry, to ensure the safety and health of consumers, to encourage the
25
1.2. Economic situation of the agricultural sector Marju Aamisepp and Eduard Matveev, Department of Economic Analysis of Agricultural Sector of the Rural Economy Research Centre
According to the results of the Agricultural Census carried out by Statistics Estonia in 2010 there were 19,613 agricultural holdings in Esto-nia. Agricultural holdings with over 1 ha of utilized agricultural area or holdings where agricultural output was produced for sale were included. There are a number of farms producing too little to be considered as agricultural holdings. Since 2010 the economic size of the holding is measured as Total Standard Output of the holding expressed in euros based on crop area and number of livestock in the holding. In Estonia the minimum Economic Size Class2 of the holding is the value of Total Standard Output of EUR 4,000. The holdings below the minimum economic size are very small, although to some extent they are engaged in farming, their production output is so small that it is rather a way of living or a hobby.
When excluding the smallest holdings it can be stated that there are 8,074 agricultural holdings in Estonia forming the field of survey of agricultural holdings. The field of survey covers 41% of the total number of agricultural holdings, 98% of the Total Standard Output of agricultural production, 89% of the crop area and 99% of the number of livestock (calculated as animal units). The following analysis describes the economic results of the field of survey of agricultural holdings in 2006-2011.
Agricultural holdings in the field of survey have been divided into three groups according the economic size of holdings: small holdings (the value of Total Standard Output is € 4,000 – 25,000), medium-sized holdings (€ 25,000 – 100,000 €) and large holdings (over € 100,000).
1 According to the data of Farm Accountancy Data Network (FADN) (2006–2011). 2 Since 2012 the economic size is defined as total standard output per agricultural holding. Total Standard Output is deter-
mined on the basis of Standard Output coefficients calculated as an average over a period of five years according to the yield and productivity indicators, as well as the prices in the years of observation. Direct payments are not included in the stan-dard output coefficients.
testing of innovative farming and forestry techniques, to improve transport and logistics of food products and to single out eco-friendly food products packaging. In addition, the EESC urges to consider framing an integrated EU protein strategy in order to safeguard the supply of animal feed and reduce dependence on protein imports. Today livestock production in Europe is highly dependent on the forage imported from South America that has mostly been manufactured from genetically modified plants. In addition to self-sufficiency in food supply, it is important to achieve self-sufficiency in forage supply.
The EESC considers that Member States should be given certain flexibility in terms of allocation of funds between CAP pillars to allow Member States to shift a limited amount of resources from Pillar I into Pillar II and the other way round (10% of the budget of the pillars).
In conclusion, it can be stated that the opinion of the European Economic and Social Committee is a good input for the discussions of the European Parliament and the Council. In general, the opinion of the EESC supports all the positions that are important for Estonia in terms of the CAP reform proposals. I hope that the decisions adopted in the European Parliament and the Council will contribute to the development of European, as well as Estonian rural life and agriculture.
1
26

According to the Agricultural Census and the afore mentioned classification there are 5,518 small holdings (28% of the total number of hold-ings) utilizing 14% of the crop area, 9% of Total Standard Output and 7% of the number of live-stock (calculated in animal units). There were 1,656 medium-sized holdings (8% of the total number of holdings) utilizing 20% of the crop
area, accounting for 14% of Total Standard Out-put and producing 9% of the number of livestock. There were only 893 large holdings (5% of the total number of holdings), however, they utilized 55% of the crop area, accounted for 43% of Total Standard Output and produced 83% of the num-ber of livestock.
Figure 13. Representativeness of agricultural holdings, 2010
As a result of the defined minimum economic size, 59% of the holdings (11,539 semi-subsistence farms) are excluded from the field of survey of agricultural holdings. However, the ac-tivities of semi-subsistence farms cover only 11% of the agricultural area, 2% of Total Standard Output and 1% of the number of livestock (calcu-lated in animal units). The main types of farming in the field of survey of agricultural holdings are field crops (32% of the holdings in the field of survey), grazing livestock (mostly beef cattle and sheep production, 24%), mixed (20%) and dairy cows (18%). Only a few holdings in the field of survey belong to the hold-ings of horticulture, permanent crops and granivores type of farming (4%, 0.4% and 1.3%, respectively).
In 2011 an Estonian agricultural holding occupied 116 ha of utilized agricultural area on average of which 62% was rented. Since 2006 the share of rented utilized agricultural area has remained more or less on the same level. In terms of eco-nomic size class it can be stated that the larger
the holding the more significant the share of rented utilized agricultural area – in 2011 small holdings rented 37% of the total utilized agricul-tural area whereas the share of rented utilized agricultural area of holdings of larger economic size classes accounted for 71%.
In 2011 58 ha of utilized agricultural area was calculated per Annual Work Unit (AWU3) on av-erage. It is 17 ha more when compared to 2006. Thus, the intensity of the use of labour has in-creased by 41% over the past six years.
Farm Net Value Added (FNVA4) is an important indicator for the assessment of the economic situation of the holding. In 2011 NLV was 32,868 euros per holding and 16,5376 euros per Annual Work Unit on average. In the past five years FNVA per Annual Work Unit has shown signifi-cant fluctuation, reflecting clearly the situation in agriculture in that period. The indicator reflects fluctuations in the yield, buying in prices affected by the market situation and changes in the prices of inputs.
3Estimated Annual Work Unit (AWU) is 2,200 working hours per year. 4Farm Net Value Added (FNVA) is calculated as follows: value of total output plus direct subsidies (excl subsidies on invest-
ment) minus specific costs and overheads and depreciation of capital assets.
0%
20%
40%
60%
80%
100%
Number of holdings UAA (ha) Livestock (au) Total Standard Output
Labour costs (AWU)
Semi-subsistence farms Small holdings Medium holdings Large holdingsSource: SE
27
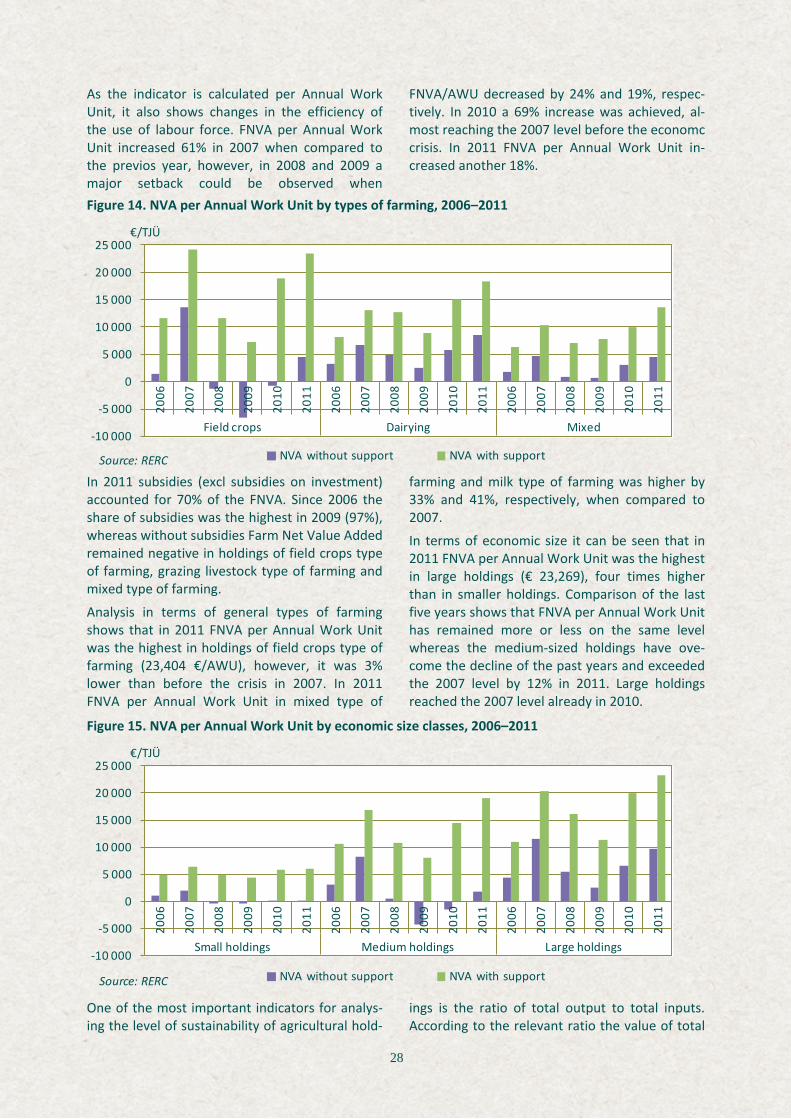
As the indicator is calculated per Annual Work Unit, it also shows changes in the efficiency of the use of labour force. FNVA per Annual Work Unit increased 61% in 2007 when compared to the previos year, however, in 2008 and 2009 a major setback could be observed when
FNVA/AWU decreased by 24% and 19%, respec-tively. In 2010 a 69% increase was achieved, al-most reaching the 2007 level before the economc crisis. In 2011 FNVA per Annual Work Unit in-creased another 18%.
Figure 14. NVA per Annual Work Unit by types of farming, 2006–2011
In 2011 subsidies (excl subsidies on investment) accounted for 70% of the FNVA. Since 2006 the share of subsidies was the highest in 2009 (97%), whereas without subsidies Farm Net Value Added remained negative in holdings of field crops type of farming, grazing livestock type of farming and mixed type of farming.
Analysis in terms of general types of farming shows that in 2011 FNVA per Annual Work Unit was the highest in holdings of field crops type of farming (23,404 €/AWU), however, it was 3% lower than before the crisis in 2007. In 2011 FNVA per Annual Work Unit in mixed type of
farming and milk type of farming was higher by 33% and 41%, respectively, when compared to 2007.
In terms of economic size it can be seen that in 2011 FNVA per Annual Work Unit was the highest in large holdings (€ 23,269), four times higher than in smaller holdings. Comparison of the last five years shows that FNVA per Annual Work Unit has remained more or less on the same level whereas the medium-sized holdings have ove-come the decline of the past years and exceeded the 2007 level by 12% in 2011. Large holdings reached the 2007 level already in 2010.
Figure 15. NVA per Annual Work Unit by economic size classes, 2006–2011
One of the most important indicators for analys-ing the level of sustainability of agricultural hold-
ings is the ratio of total output to total inputs. According to the relevant ratio the value of total
-10 000
-5 000
0
5 000
10 000
15 000
20 000
25 000
2006
2007
2008
2009
2010
2011
2006
2007
2008
2009
2010
2011
2006
2007
2008
2009
2010
2011
Field crops Dairying Mixed
NVA without support NVA with supportSource: RERC
€/TJÜ
-10 000
-5 000
0
5 000
10 000
15 000
20 000
25 000
2006
2007
2008
2009
2010
2011
2006
2007
2008
2009
2010
2011
2006
2007
2008
2009
2010
2011
Small holdings Medium holdings Large holdings
NVA without support NVA with supportSource: RERC
€/TJÜ
28

output in euro produced per euro spent on in-puts can be estimated. When the ratio of total output to total inputs is less than euro it shows that the value of output of the current year does not cover the cost of inputs.
In the past six years the ratio of total output to total inputs was positive only in 2007 when the indicator was 1.08. Inclusion of subsidies in the value of total outputs (except for subsidies on investment) gave the ratio over 1.00 for all the years under survey being the highest in 2007 (1.33). Thus, the value of output covered the cost
of inputs only in the year 2007, however, thanks to subsidies farmers managed to get positive results also in other years of the survey.
Comparison of the ratio of total output to total inputs without subsidies by main types of farming in the period under consideration shows that the indicator has been the highest, as well as the lowest in holdings of field crop type of farming (in 2007 and 2009 1.30 and 0.73, respectively). The indicator with subsidies was the highest in hold-ings of field crop type of farming (1.65) and the lowest in holdings of milk type of farming (0.99).
Figure 16. Ratio of total output to total inputs by types of farming, 2006–2011
By economic size classes the ratio of total output to total inputs has been relatively higher in hold-ings of small size class. Smaller holdings have not usually included labour input and when calculat-ing family labour input on average level of salary the indicator would be much lower. Also, there are a number of organic producers among small and medium-sized holdings and their level of
support is higer than in case of conventional holdings. Therefore, in 2008-2011 the ratio of total output to total inputs without subsidies was more or less the same – less than one in all eco-nomic size classes. However, the ratio of total output to total inputs with subsidies of large holdings was significantly lower than in holdings of smaller economic size classes.
Figure 17. Ratio of total output to total inputs by economic size classes, 2006–2011
0,4
0,6
0,8
1,0
1,2
1,4
1,6
1,8
2006
2007
2008
2009
2010
2011
2006
2007
2008
2009
2010
2011
2006
2007
2008
2009
2010
2011
Field crops Dairying Mixed
Without support With supportSource: RERC
0,4
0,6
0,8
1,0
1,2
1,4
1,6
1,8
2006
2007
2008
2009
2010
2011
2006
2007
2008
2009
2010
2011
2006
2007
2008
2009
2010
2011
Small holdings Medium holdings Large holdings
Without support With supportSource: RERC
29
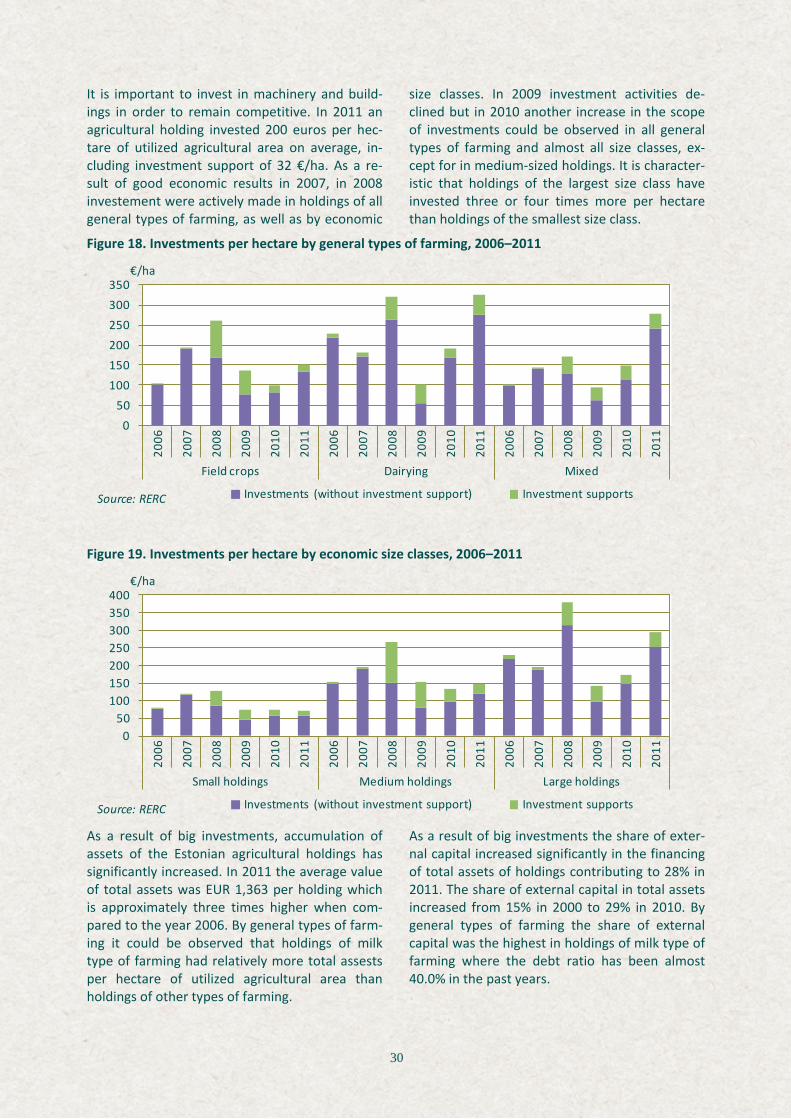
It is important to invest in machinery and build-ings in order to remain competitive. In 2011 an agricultural holding invested 200 euros per hec-tare of utilized agricultural area on average, in-cluding investment support of 32 €/ha. As a re-sult of good economic results in 2007, in 2008 investement were actively made in holdings of all general types of farming, as well as by economic
size classes. In 2009 investment activities de-clined but in 2010 another increase in the scope of investments could be observed in all general types of farming and almost all size classes, ex-cept for in medium-sized holdings. It is character-istic that holdings of the largest size class have invested three or four times more per hectare than holdings of the smallest size class.
Figure 18. Investments per hectare by general types of farming, 2006–2011
Figure 19. Investments per hectare by economic size classes, 2006–2011
As a result of big investments, accumulation of assets of the Estonian agricultural holdings has significantly increased. In 2011 the average value of total assets was EUR 1,363 per holding which is approximately three times higher when com-pared to the year 2006. By general types of farm-ing it could be observed that holdings of milk type of farming had relatively more total assests per hectare of utilized agricultural area than holdings of other types of farming.
As a result of big investments the share of exter-nal capital increased significantly in the financing of total assets of holdings contributing to 28% in 2011. The share of external capital in total assets increased from 15% in 2000 to 29% in 2010. By general types of farming the share of external capital was the highest in holdings of milk type of farming where the debt ratio has been almost 40.0% in the past years.
050
100150200250300350
2006
2007
2008
2009
2010
2011
2006
2007
2008
2009
2010
2011
2006
2007
2008
2009
2010
2011
Field crops Dairying Mixed
Investments (without investment support) Investment supportsSource: RERC
€/ha
050
100150200250300350400
2006
2007
2008
2009
2010
2011
2006
2007
2008
2009
2010
2011
2006
2007
2008
2009
2010
2011
Small holdings Medium holdings Large holdings
Investments (without investment support) Investment supportsSource: RERC
€/ha
30

Figure 20. Value of total assets per hectare by types of farming, 2006–2011
In 2011 total assets per hectare of agricultural area was EUR 1,767 whereas total assets were more or less on the same level in case of small and large holdings (1,817 and 1,897 €/ha, respec-tively). Total assets of medium-sized holdings were 1,423 €/ha on average.
The share of external capital in total assests in smaller holdings dropped from 14% in 2010 to 6% in 2011. The same indicator in medium-sized
holdings dropped from 28% in 2007 to 19% in 2011. The share of external capital in total assests is the biggest in large holdings where ex-ternal capital accounts for about 40% of total assests. The share of external capital in total assests of large holdings was the highest in 2009 (44%) when large holdings were active in making investments.
Figure 21. Value of total assets per hectare by economic size classes, 2006–2011
In 2011 92% of holdings ended the accounting year with positive Family Farm Income5. In 2006 the indicator was 94% whereas in 2008 the share of holdings with positive Family Farm Income started to decrease reaching 84% in 2009. When looking at the same indicator without subsidies it
can be seen that 63% of the holdings ended the year 2007 with positive Family Farm Income, whereas by 2010 the indicator had dropped to 44% showing an increasing trend again in 2011 (47%).
5 Family Farm Income can be calculated by adding investment grants and subsidies to farm net value added and subtracting
0%
10%
20%
30%
40%
50%
0
500
1 000
1 500
2 000
2 50020
06
2007
2008
2009
2010
2011
2006
2007
2008
2009
2010
2011
2006
2007
2008
2009
2010
2011
Field crops Dairying Mixed
Total capital assets per ha Share of external capitalSource: RERC
€/ha
0%
10%
20%
30%
40%
50%
0
500
1 000
1 500
2 000
2 500
2006
2007
2008
2009
2010
2011
2006
2007
2008
2009
2010
2011
2006
2007
2008
2009
2010
2011
Small holdings Medium holdings Large holdings
Total capital assets per ha Share of external capitalSource: RERC
€/ha
31

external factors (such as wages paid, rent and interest paid) By general types of farming holdings of field crops type of farming showed the lowest results in 2009 when 72% of the holdings ended the ac-counting year with positive Family Farm Income and without subsidies only 38% of the holdings were able to demonstrate positive results. Hold-ings of milk type of farming were most stable in terms of positive Family Farm Income whereas
only half of the holdings of milk type of farming managed to end the year with positive Family Farm Income when subsidies were not taken into account. In 2011 the indicator of holdings of mixed type of farming was 95% whereas without subsidies the share of holdings with positive Fam-ily Farm Income was about 60%.
Figure 22. Share of holdings with positive Family Farm Income by types of farming, 2006–2011
In terms of economic size classes the share of holdings with positive Family Farm Income was on the same level in all size classes (90%) in 2011. The situation is the same in case subsidies are excluded from Family Farm Income. In 2009 only 60% of holdings of the large economic size class
ended the accounting year with positive Family Farm Income and without subsidies the indicator was even 26%. In the past five years small and medium-sized holdings have been more depend-ant on subsidies than large holdings.
Figure 23. Share of holdings with positive Family Farm Income by economic size classes, 2006–2011
Agriculture has undergone major development within the period of 2006-2011 – favourable eco-nomic conditions contributed to an increase in income and created good possibilities for invest-ments. This, in turn, increased the importance of external capital and imposed liabilities on hold-ings to be met in due time. The economc regres-
sion starting in 2008 and reaching the bottom in 2009 created a very difficult situation for agricul-tural holdings. They had to increase the cost-efficiency in the situation of decreased income and Farm Net Value Added and find possibilities to pay for the input, including external capital.
0%
20%
40%
60%
80%
100%
2006
2007
2008
2009
2010
2011
2006
2007
2008
2009
2010
2011
2006
2007
2008
2009
2010
2011
Field crops Dairying Mixed
Without support With supportSource: RERC
0%
20%
40%
60%
80%
100%
2006
2007
2008
2009
2010
2011
2006
2007
2008
2009
2010
2011
2006
2007
2008
2009
2010
2011
Small holdings Medium holdings Large holdingsWithout support With supportSource: RERC
32

2. From the producer to the consumer Marju Aamisepp and Eduard Matveev, Department of Economic Analysis of Agricultural Sector of the Rural Economy Research Centre
2.1. Plant production According to the data 2011 of Statistics Estonia there were a total of 946,000 ha of utilized agri-cultural area and the land not used for agricul-tural production but maintained in good agricul-tural and environmental condition in Estonia of which 802,000 ha were utilized agricultural area and 144,000 ha were the land maintained in good condition.
In 2011 the area of field crops occupied 585,000 ha. The area of field crops decreased by 17,000 ha when compared to 2010, decrease in the area of forage crops was the main reason for that trend.
In 2011 297,000 ha of cereals (incl summer cereal 226,000 ha), 175,000 ha of forage crops, 90,000 ha of industrial crops and 23,000 ha of other crops were cultivated. Cereals account for half and fodder crops for one third of the total area of field crops.
Figure 24. Structure of the crop area of field crops, 2011
Table 1. Crop area and yield of field crops, 2009–2011
Other field crops
4%Forage crops
30%
Oilseed rape15%
Cereals51%
Source: SE
Area Produc Yield Area Produc Yield Area Produc Yieldthous ha thous kg/ha thous ha thous kg/ha thous ha thous kg/ha
Wheat 114 343 3 015 119 328 2 744 128 360 2 805 Rye 15 39 2 555 13 25 1 983 13 31 2 325 Barley 141 377 2 679 105 255 2 431 118 295 2 494 Oats 36 87 2 394 30 55 1 790 28 63 2 211 Other cereals 11 28 2 654 8 17 2 037 9 23 2 628 Protein crops 5 8 1 547 7 13 1 713 9 16 1 811 Potatoes 9 139 15 275 9 163 17 456 9 165 17 836 Oilseed rape 82 136 1 657 98 131 1 334 89 144 1 620 Vegetables grown outdoors 3 59 21 446 3 59 21 166 3 74 24 865 Forage crops 150 208 178 Other field crops 1 1 1 Total field crops 567 602 585 Source: SE
2009 2010 2011
33

2.1.1. Cereals and field crops The area of field crops increased by 8% when compared to 2010 whereas the area of summer cereals increased by 9% and winter cereals by 4%. As to summer cereals, only the area of oats decreased (7%); the area of barley increased most significantly (14%). As to winter cereals, the crop area of triticale decreased most considera-bly (13%), the crop area of winter barley de-creased by 70%. The area of field crops has re-mained stable since 2001, however, the number of field crop producers has decreased over three-fold.
According to the provisional data 2012 of Statis-tics Estonia the area of field crops occupied 309,000 ha accounting for a 4% increase when compared to 2011 whereas the crop area of summer cereals decreased by 3% and the area of winter cereals increased by 27%. According to the provisional data the area of winter cereals increased even up to 29% of the total area of field crops.
Figure 25. Crop area of cereals and number of producers, 2001–2011
The share of winter cereals of the total area of field crops has remained stable at about 20-25%. Winter wheat occupied the biggest crop area in 2011 (53,000 ha). New crops, winter barley and triticale were also cultivated. Winter barley occu-pied the biggest area in 2009 (1,400 ha), how-ever, by the year 2011 the crop area of winter barley had decreased to 300 ha. The crop area of triticale decreased from 8,000 ha in 2009 to 4,500 ha in 2011.
In 2011 53,000 ha of winter wheat was sown for the production of 2012 accounting for a 13% de-crease compared with the 2010 sowing, also, the crop areas of winter barley and triticale de-creased by 62% and 32%, respectively. Poor win-tering of the winter barley can be considered one reason for the derease in the crop area, there-fore, several holdings have given up several years’ testing of winter barley.
In 2011 the total cereal production was 772,000 tonnes, i.e almost 14% more than in 2010. Barley
accounted for the biggest share of the total ce-real production (38%).
In 2010 the average yield of cereals was 2,598 kg/ha, the indicator was the highest in 2007 (3,009 kg/ha). In 2011 576 kg of cereals were produced per capita (506 kg in 2010).
Figure 26. Crop area of cereals, 2005–2011
0
3 500
7 000
10 500
14 000
17 500
21 000
24 500
0
50
100
150
200
250
300
350
2001 2002 2003 2004 2005 2006 2007 2008 2009 2010 2011
Num
ber o
f pro
duce
rs
Crop
are
a, t
hous
and
ha
Crop area Number of producersSource: SE
0%
3%
6%
9%
12%
15%
2005 2006 2007 2008 2009 2010 2011Source: Eurostat
Latvia
Estonia
Finland
Lithuania
34

Figure 27. Production and yield of cereals in Estonia, 2001–2011
Figure 28. Yield of cereals, 2001–2011 (kg/ha)
In 2011 forage crops were cultivated on 178,000 ha (incl 2,400 ha of seed cultivation). The area of forage crops decreased by 30 thousand ha, i.e 14% when compared to 2010. According to the
provisional results of 2012 annual and perennial forage crops were cultivated on 177,000 ha (incl 2,200 ha of seed cultivation).
0
500
1 000
1 500
2 000
2 500
3 000
3 500
0
150
300
450
600
750
900
1 050
2001 2002 2003 2004 2005 2006 2007 2008 2009 2010 2011
Yiel
d, k
g/ha
Prod
uctio
n, t
hous
and
tonn
es
Production YieldSource: SE
1 500
2 000
2 500
3 000
3 500
4 000
2001 2003 2005 2007 2009 2011
Wheat
1 500
2 000
2 500
3 000
3 500
4 000
2001 2003 2005 2007 2009 2011
Barley
Source: SE
1 500
2 000
2 500
3 000
3 500
4 000
2001 2003 2005 2007 2009 2011
Rye
1 500
2 000
2 500
3 000
3 500
4 000
2001 2003 2005 2007 2009 2011
Oats
35

Use of Plant Protection Products in Estonia Jan-Roland Raukas, Plant Protection Department of the Agricultural Board
Different from other products a plant protection product may be placed on the market and used in those EU Member States where authorization for placing the plant protection product on the market has been granted. For placing a plant protection product on the market or for the use of a plant protection product an application for granting an authorization shall be submitted to all these Member States on which territory the product shall be used or placed on the market. A plant protection product can only be used in case of these plants the authorization has been granted for in the Member State concerned. Although Estonian market of plant production products is relatively small and placing plant protection products on the market is related to additional costs and the procedures plant production manufacturers are often not interested in, the nomenclature of registered plant protection products has significantly grown in the past years. The Agricultural Board is responsible for authorizing the placing of plant protection products on the market. In order to place a plant protection product on the market an application shall be submitted to the Plant Protection
Department of the Agricultural Board according to the Regulation (EC) No 1107/2009 of the European Parliament and of the Council. The application procedure includes the assessment of the product in question in terms of effectiveness of the product, as well as posing risk to the environment and human health (both an harmful effect of the manufactured product on the health of consumers and the effect of the use of the product on the health of the workers exposed to the product). If the assessment of the plant production product shows that the product does not pose unacceptable risk to the environment and human health in relation to the proposed uses and it is more effective than the previous analogous product which has already been placed on the market, an authorization for placing the plant protection product on the market shall be granted.
In Estonia an authorization for placing a plant protection product on the market shall be granted for about 30-40 new plant protection products and about ten products are removed from the list. Thus, the list of products having been granted an authorization for the use and placing on the market is constantly increasing. As at 25 September 2012 317 different plant protection products consisting of 160 different active substances were registered in Estonia (authorization for the use and placing on the market).
Herbicides and fungicides, including seed dressing preparations accounted for the biggest number of registered plant protection products, 139 and 117, respectively. 37 insecticides, 13 plant growth regulators, 5 molluscides and 4 desiccants (fumigants) and 2 repellents were registered in Estonia. More detailed overview of the products granted an authorization for the use and placing on the market is given on the webpage of the Agricultural Board at www.pma.agri.ee.
The use of plant protection products has not changed significantly in Estonia over the past years. The figure shows that the use of plant protection products has sharply increased since 2006, however, as a result of changing the selected monitoring methods the data are not comparable to the earlier data any longer. In 2011 the data on seed dressing preparations have not presented as separate figures any longer and are included in the list of fungicides or herbicides depending of the active substances.
Less active use of plant protection products in 2009 is related to the economic regression – producers had insufficient operating assets for the procurement of necessary plant protection products. The use of plant protection products is also related to the weather conditions, thus in 2012 the use of products, particularly in terms of fungicides, increased as a result of the wet weather.
36

2.1.2. Oilseed rape In 2011 the crop area of oilseed rape was 89,000 ha showing a decline of 9% on 2010. Also, the crop area of summer oilseed rape, as well as win-ter oilseed rape increased. The total production of oilseed rape was 144,000 tonnes contributing to a 10% rise on 2010. The crop area was smaller, thus, increase in the total production was a result of the higher yield (1,620 kg/ha accounting for a 21% rise on 2010).
The provisional data 2012 show that the crop area of oilseed rape decreased again (87,000 ha). It is suggested to cultivate oilseed rape on the same field in 4-5 years, thus, the maximum crop area of oilseed rape in Estonia can be up to 120,000 ha. The price of oilseed rape has been significantly higher when compared to cereals, however, it has to be considered that oilseed rape requires more fertile soil, also, inputs per hectare are significantly higher than in case of cereals. In the past years the importance of win-ter oilseed rape has increased: 21,000 ha of win-ter oilseed rape was sown for the 2012 produc-tion showing a twofold increse in the area of 2011. It is very risky to cultivate winter oilseed rape as the winter species of oilseed rape are very sensitive to the weather and the time of sowing. At the same time winter oilseed rape is a good crop to be sown before winter cereals be-
cause it ripens early and can be harvested earlier, too. Also, when the growing conditions are fa-vourable, the yield of winter oilseed rape is higher than the yield of summer oilseed rape.
Figure 30. Crop area of oilseed rape, 2001–2011
Figure 31. Yield of oilseed rape, 2001–2011
0
20
40
60
80
100
120
2001 2003 2005 2007 2009 2011Source: SE
thousand ha
1 000
1 200
1 400
1 600
1 800
2 000
2001 2003 2005 2007 2009 2011
kg/ha
Source: SE
In Estonia herbicides are the most widely used plant protection products, other types of plant protection products are used in smaller volumes. Although the use of fungicides is expensive and does not always give direct economic effect, in the past years the use of fungicides has grown in order to improve the quality of yield.
Figure 29. Use of pesticides in agricultural holdings, 2001–2011
0
200
400
600
800
1 000
2001 2002 2003 2004 2005 2006 2007 2008 2009 2010 2011
Thou
sand
kg
Herbicides Fungicides Insecticides Plant growth regulaors Seed treatments Desiccants Source: SE
37

Figure 32. Production of oilseed rape per capita, 2005–2011
Figure 33. Level of self-sufficiency of oilseed rape, 2000–2011
2.1.3. Potatoes and vegetables Since 2008 the crop area of potatoes has re-mained stable at 9,000 ha. In 2011 9,200 ha of potatoes were grown. The crop area has de-creased more than threefold when compared to 2000. In 2011 the total potato production was 165,000 tonnes and the average yield 17.8 t/ha. 123 kg of potatoes per capita were produced.
According to the provisional data for 2012 the crop area of potatoes has remained static at 9,200 ha. The crop area was the biggest in Tartu county (801 ha) and the smallest in Hiiu county (36 ha). Cultivation of potatoes was late because of cold spring. The weather in the growth period was relatively favourable, however, distribution of precipitation was uneven. Excessive moisture created favourable conditions for the develop-ment of diseases affecting the crops. In the past years the distribution area and population of Colorado beetle has increased. As a result of un-fabourable weather conditions and excessive moisture, potatoe harvesting has been more dif-ficult, particularly in Lääne county and North Es-tonia.
In 2011 the crop area of outdoor vegetables oc-cupied 3,000 ha showing no change over the past years. However, the total area devoted to out-door vegetables has decreased by a third when compared to 2000.
Carrots (622 ha) and cabbages (599 ha) occupied the largest area accounting for approximately half of the crop area (41%) of outdoor vegeta-bles. Other vegetables were cultivated on smaller areas. In 2011 a total of 88,000 tonnes of vegeta-bles were produced of which 74,000 tonnes (84%) outdoors.
Figure 34. Crop area of potatoes and outdoor vegetables, 2001–2011
Figure 35. Yield of potatoes and outdoor vege-tables, 2001–2011
70
90
110
130
150
2005 2006 2007 2008 2009 2010 2011
kg
Source: SE
50%
100%
150%
200%
250%
300%
00/01 02/03 04/05 06/07 08/09 10/11Source: SE
0
5
10
15
20
25
2001 2003 2005 2007 2009 2011Potatoes Open-field vegetables
Source: SE
thousand ha
5 000
10 000
15 000
20 000
25 000
2001 2003 2005 2007 2009 2011
kg/ha
Potatoes Open-field vegetablesSource: SE
38
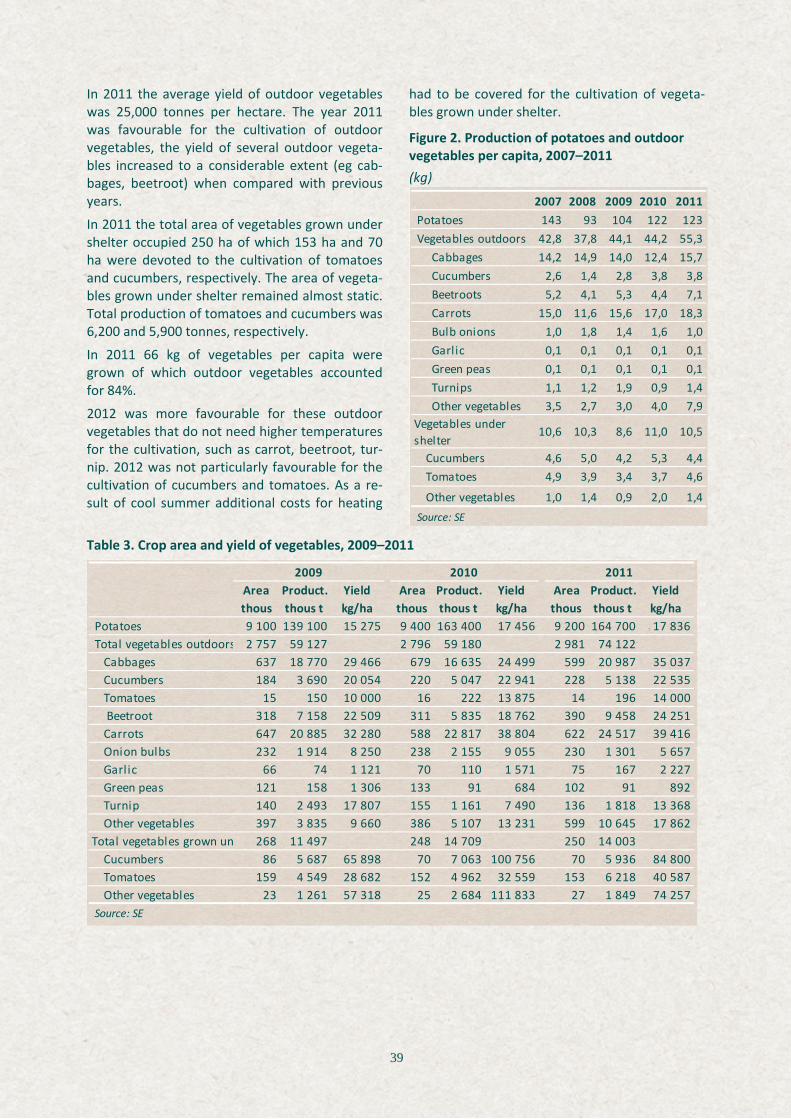
In 2011 the average yield of outdoor vegetables was 25,000 tonnes per hectare. The year 2011 was favourable for the cultivation of outdoor vegetables, the yield of several outdoor vegeta-bles increased to a considerable extent (eg cab-bages, beetroot) when compared with previous years.
In 2011 the total area of vegetables grown under shelter occupied 250 ha of which 153 ha and 70 ha were devoted to the cultivation of tomatoes and cucumbers, respectively. The area of vegeta-bles grown under shelter remained almost static. Total production of tomatoes and cucumbers was 6,200 and 5,900 tonnes, respectively.
In 2011 66 kg of vegetables per capita were grown of which outdoor vegetables accounted for 84%.
2012 was more favourable for these outdoor vegetables that do not need higher temperatures for the cultivation, such as carrot, beetroot, tur-nip. 2012 was not particularly favourable for the cultivation of cucumbers and tomatoes. As a re-sult of cool summer additional costs for heating
had to be covered for the cultivation of vegeta-bles grown under shelter.
Figure 2. Production of potatoes and outdoor vegetables per capita, 2007–2011 (kg)
Table 3. Crop area and yield of vegetables, 2009–2011
2007 2008 2009 2010 2011 Potatoes 143 93 104 122 123 Vegetables outdoors 42,8 37,8 44,1 44,2 55,3 Cabbages 14,2 14,9 14,0 12,4 15,7 Cucumbers 2,6 1,4 2,8 3,8 3,8 Beetroots 5,2 4,1 5,3 4,4 7,1 Carrots 15,0 11,6 15,6 17,0 18,3 Bulb onions 1,0 1,8 1,4 1,6 1,0 Garlic 0,1 0,1 0,1 0,1 0,1 Green peas 0,1 0,1 0,1 0,1 0,1 Turnips 1,1 1,2 1,9 0,9 1,4 Other vegetables 3,5 2,7 3,0 4,0 7,9Vegetables under shelter
10,6 10,3 8,6 11,0 10,5
Cucumbers 4,6 5,0 4,2 5,3 4,4 Tomatoes 4,9 3,9 3,4 3,7 4,6
Other vegetables 1,0 1,4 0,9 2,0 1,4 Source: SE
Area Product. Yield Area Product. Yield Area Product. Yieldthous thous t kg/ha thous thous t kg/ha thous thous t kg/ha
Potatoes 9 100 139 100 15 275 9 400 163 400 17 456 9 200 164 700 17 836 Total vegetables outdoors 2 757 59 127 2 796 59 180 2 981 74 122 Cabbages 637 18 770 29 466 679 16 635 24 499 599 20 987 35 037 Cucumbers 184 3 690 20 054 220 5 047 22 941 228 5 138 22 535 Tomatoes 15 150 10 000 16 222 13 875 14 196 14 000 Beetroot 318 7 158 22 509 311 5 835 18 762 390 9 458 24 251 Carrots 647 20 885 32 280 588 22 817 38 804 622 24 517 39 416 Onion bulbs 232 1 914 8 250 238 2 155 9 055 230 1 301 5 657 Garlic 66 74 1 121 70 110 1 571 75 167 2 227 Green peas 121 158 1 306 133 91 684 102 91 892 Turnip 140 2 493 17 807 155 1 161 7 490 136 1 818 13 368 Other vegetables 397 3 835 9 660 386 5 107 13 231 599 10 645 17 862Total vegetables grown un 268 11 497 248 14 709 250 14 003 Cucumbers 86 5 687 65 898 70 7 063 100 756 70 5 936 84 800 Tomatoes 159 4 549 28 682 152 4 962 32 559 153 6 218 40 587 Other vegetables 23 1 261 57 318 25 2 684 111 833 27 1 849 74 257 Source: SE
2009 2010 2011
39

2.1.4. Fruits and berries
In 2011 the crop area of fruit and berry orchards was a total of 6,442 ha showing a decline of 62 ha on previos year. Mostly the crop area of fruits and berries was reduced, particularly the crop area of red, white and black currants and rasber-ries.
In 2011 the average yield of fruits and berries was generally higher than in 2010, only the yield of cherry, gooseberry and rasberry orchards showed some decline. Total of 4,500 tonnes of fruits and berries were produced, the estimated amount per capita is 3.4 kg.
In 2011 599 ha of strawberries were cultivated contributing to an increase of 10 ha compared to the previous year. Total of 1,300 tonnes of strawberries were produced – one kilogramme per capita.
Comparison of the last five years shows that 2009 was the best year for fruit and berry production when 6.0 kg of fruits and berries and 1.3 kg of strawberries per capita were produced.
Figure 36. Crop area of fruits, 2001–2011
Figure 37. Yield of fruits, 2001–2011
Table 4. Crop area and yield of fruit and berry orchards, 2009–2011
02468
1012
2001 2003 2005 2007 2009 2011Apples and pears Cherries and plums
Source: SE
thousand ha
0
500
1 000
1 500
2 000
2001 2003 2005 2007 2009 2011
kg/ha
Apples and pears Cherries and plumsSource: SE
Area Product Yield Area Product Yield Area Product Yieldthous thous t kg/ha thous thous t kg/ha thous thous t kg/ha
Total fruit and berry orchard 7 678 7 983 6 504 3 796 6 442 4 542 Apples and pears 4 222 5 446 1 333 3 319 1 983 615 3 329 2 702 840 Plums 540 686 1 309 449 251 577 441 266 617 Cherries 338 108 322 276 126 458 275 105 395 Red and white currants 402 511 1 274 384 134 350 347 291 839 Black currants 558 401 830 596 402 749 560 489 935 Gooseberries 231 117 506 183 147 803 183 141 770 Rasberries 219 213 1 014 266 282 1 085 245 160 708 Others 1 168 501 1 031 471 1 062 388 Strawberry production 597 1 790 3 163 589 1 275 2 245 599 1 292 2 456 Source: SE
2009 2010 2011
40
Table 5. Production of fruit and berry orchards per capita, 2007–2011 (kg)
In 2011 the buying-up price of cereals and oilseed continued the increasing trend which started in 2010, reaching the highest level since 2001. The buying-up price of protein crops was the highest in 2007 (242€/t). After a two-year decline the buying-up price of protein crops reached the level of 205 €/t in 2011.
Table 6. Producer prices of cereals and oilseed in the EU, 2011 (€/t)
Table 7. Buying-up prices of cereals, protein crops and oilseed rape, 2001–2011 (€/t)
2007 2008 2009 2010 2011Fruit and berry orchards
3,8 3,0 6,0 2,8 3,4
Apples and pears 3,0 1,7 4,1 1,5 2,0 Plums 0,0 0,1 0,5 0,2 0,2 Cherries 0,1 0,1 0,1 0,1 0,1 Red and white currants Black currants 0,1 0,2 0,3 0,3 0,4 Gooseberries 0,1 0,1 0,1 0,1 0,1 Rasberries 0,2 0,2 0,2 0,2 0,1 Other 0,1 0,3 0,4 0,4 0,3 Strawberries 1,1 1,1 1,3 1,0 1,0 Source: SE
0,2 0,4 0,4 0,1 0,2
Country Wheat Rye Barley Oats Rape Estonia 187 176 181 154 439 Latvia 197 170 168 134 415 Lithuania 206 175 179 159 422 Finland 197 187 … 166 422 Czech Republic Denmark 193 172 196 175 419 Spain 212 184 195 182 283 Luxembourg 182 155 161 153 390 Hungary 183 165 178 167 427 Poland 199 181 184 158 446 Sweden 199 184 176 153 429 Slovenia 193 194 181 … 422 Slovakia 179 171 190 170 461 Bulgaria 167 141 160 165 412 Source: EUROSTAT, SE
456205 192 180 241
Year Cereal Wheat Rye Barley Oats Triticale Cereal Legumes Rape2001 101 116 94 105 82 .. 91 159 …2002 100 103 96 100 86 97 92 155 2542003 103 114 87 97 78 93 100 159 2462004 107 112 109 103 89 97 107 147 2212005 94 98 93 91 82 99 97 154 2172006 105 112 108 101 87 99 104 188 2592007 169 183 173 154 140 154 149 185 3192008 145 155 126 137 110 141 164 242 3292009 98 104 78 98 70 87 101 168 2752010 145 162 129 123 108 128 117 177 3502011 183 187 176 181 154 169 173 205 439
Source: SE
41
Figure 38. Buying-up prices of cereals, protein crops and oilseed rape, 2005–2011 (€/t)
50
75
100
125
150
175
200
2005 2006 2007 2008 2009 2010 2011
Wheat
50
75
100
125
150
175
200
2005 2006 2007 2008 2009 2010 2011
Rye
50
75
100
125
150
175
200
2005 2006 2007 2008 2009 2010 2011
Triticale
Source: SE
Mixed
50
75
100
125
150
175
200
2005 2006 2007 2008 2009 2010 2011
Barley
50
75
100
125
150
175
200
2005 2006 2007 2008 2009 2010 2011
Oats
100
150
200
250
300
350
400
450
500
2005 2006 2007 2008 2009 2010 2011
Protein crops
Rapeseed
42

Management of Land Improvement Systems – Forgot but Still Actual Heiki Pajur, Land Improvement Department of the Agricultural Board
Over 30% of the territory of Estonia is covered with land improvement systems. Visible ditches and drainage pipes inside the land are inseparable parts of the land. Drainage and irrigation systems create a prerequisite for better management of agricultural or forest land. Landowners often do not know that drainage systems are located in their land and maintenance of drainage systems is their responsibility. Landowners have no idea where to turn for advice when problems arise. Land improvement systems may locate on the land of several owners and the interests of different landowners might not be the same in terms of the maintenance of the system. However, agreement on the activities concerning the maintenance of a drainage system is almost the only way to ensure proper functioning of the system. According to the Land Improvement Act a possessor of land shall not hinder the flow of water in the land improvement system or cause damage by other actions to other possessors of land by performing work to manage the land improvement system or by not performing it.
In the years of high level of precipitation such as 2012, users of drained land have problems mostly at the time of harvesting – fields are too wet for heavy machinery. Excess water brings out the weak spots of land improvement systems. Taking into consideration the age of land improvement systems (most of them have been constructed more than 30 years ago) and the extent of the systems (there are approximately 640,000 ha of drained agricultural land and 700,000 ha of drained forest land in Estonia), the economic damage caused by insufficient drainage is considerable. Erosion and congestions of land improvement systems caused by ordinary obstructions of water flow in artificial recipients (ditches and streams) are very common It is not always necessary to make big investments in land improvement systems in order to avoid such situation. It is often enough when trees or other minor objects that have fallen into artificial recipients, are removed. However, a small obstruction can cause a lot of trouble in a large area.
An obstruction in a watercourse creates unwanted barrage, the flow slows down and the water level rises. Sediments begin to accumulate. The barrage creates possibilities for saturation of the surface on the banks of the water conduit and favourable conditions for slope erosion. In addition, other accidental materials accumulate behind the obstruction of the flow. In the area under the influence of the barrage conditions for thriving of water plants are created. It increases the roughness of the slope of the water conduit and contributes to slowing down of the flow and fosters sedimentation. Originally little obstruction will soon become a major barrage. Branches, fallen trees, plastic bags, tufts dropped off the slopes into the water conduit are a real risk to the functioning of the land improvement system. Such congestions and barrages are favourite places for beavers building barrages according to their construction rules and it is very inconvenient to remove these barrages.
Culverts in artificial recipients impose particular risk and are sensitive to barrage. Even the most trivial obstructions that concentrate in front of a culvert create permanent barrages in case the water flow increases and may result in damaging the culvert. The first frosts make flow obstructions even more persistent as slowly flowing water tends to freeze first and melt last. In case of high water level the freezing water causes damage to the flooded slopes and may be a cause for a landslide, which, in turn can obstruct the water flow.
As a result of all these circumstances the drainage regime may deteriorate in a large territory of the catchment area because the barrage affects ditches and drains within several kilometres depending on the decline of the water conduit. Conditions for the transfer of excess water from the drainage network deteriorate in a large area of land improvement systems affected by the barrage. Also, drainage causes more considerable rise in capillary water level than planned hinde-ring land use and accessibility of roads.
43
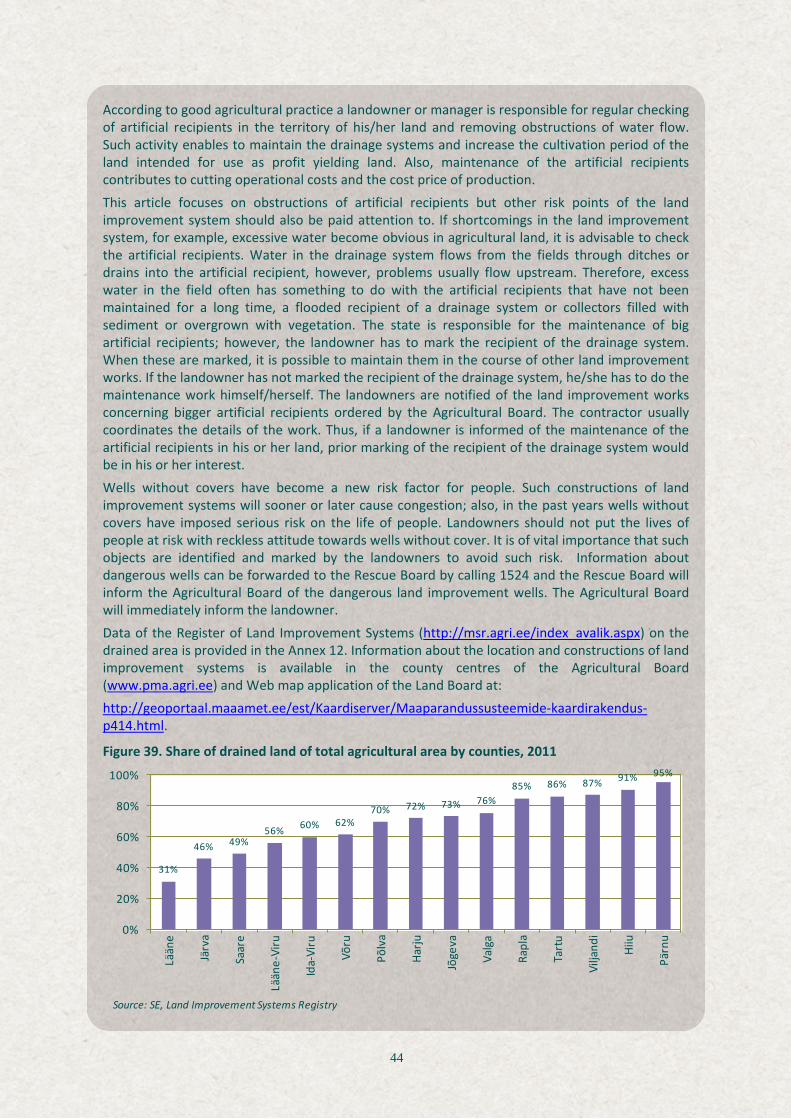
According to good agricultural practice a landowner or manager is responsible for regular checking of artificial recipients in the territory of his/her land and removing obstructions of water flow. Such activity enables to maintain the drainage systems and increase the cultivation period of the land intended for use as profit yielding land. Also, maintenance of the artificial recipients contributes to cutting operational costs and the cost price of production. This article focuses on obstructions of artificial recipients but other risk points of the land improvement system should also be paid attention to. If shortcomings in the land improvement system, for example, excessive water become obvious in agricultural land, it is advisable to check the artificial recipients. Water in the drainage system flows from the fields through ditches or drains into the artificial recipient, however, problems usually flow upstream. Therefore, excess water in the field often has something to do with the artificial recipients that have not been maintained for a long time, a flooded recipient of a drainage system or collectors filled with sediment or overgrown with vegetation. The state is responsible for the maintenance of big artificial recipients; however, the landowner has to mark the recipient of the drainage system. When these are marked, it is possible to maintain them in the course of other land improvement works. If the landowner has not marked the recipient of the drainage system, he/she has to do the maintenance work himself/herself. The landowners are notified of the land improvement works concerning bigger artificial recipients ordered by the Agricultural Board. The contractor usually coordinates the details of the work. Thus, if a landowner is informed of the maintenance of the artificial recipients in his or her land, prior marking of the recipient of the drainage system would be in his or her interest. Wells without covers have become a new risk factor for people. Such constructions of land improvement systems will sooner or later cause congestion; also, in the past years wells without covers have imposed serious risk on the life of people. Landowners should not put the lives of people at risk with reckless attitude towards wells without cover. It is of vital importance that such objects are identified and marked by the landowners to avoid such risk. Information about dangerous wells can be forwarded to the Rescue Board by calling 1524 and the Rescue Board will inform the Agricultural Board of the dangerous land improvement wells. The Agricultural Board will immediately inform the landowner. Data of the Register of Land Improvement Systems (http://msr.agri.ee/index_avalik.aspx) on the drained area is provided in the Annex 12. Information about the location and constructions of land improvement systems is available in the county centres of the Agricultural Board (www.pma.agri.ee) and Web map application of the Land Board at: http://geoportaal.maaamet.ee/est/Kaardiserver/Maaparandussusteemide-kaardirakendus-p414.html.
Figure 39. Share of drained land of total agricultural area by counties, 2011
31%
46% 49%56% 60% 62%
70% 72% 73% 76%85% 86% 87% 91% 95%
0%
20%
40%
60%
80%
100%
Lään
e
Järv
a
Saar
e
Lään
e-Vi
ru
Ida-
Viru
Võru
Põlv
a
Harju
Jõge
va
Valg
a
Rapl
a
Tart
u
Vilja
ndi
Hiiu
Pärn
u
Source: SE, Land Improvement Systems Registry
44

2.2. Livestock production According to Statistics Estonia as at 31 December 2011 238,000 cattle (incl 96,000 milk cows), 366,000 pigs, 88,000 sheep and goats and 2.033 million poultry were recorded in Estonia. The number of cattle has decreased by 16,000, incl dairy cows by 19,000 when compared to the year 2001. The number of cattle has increased to some extent when compared to 2010. Increase in live cattle export observed in the past years is one of the reasons for an increase in the number of cattle.
The number of milk cows is constantly decreas-ing. This decline is mainly driven by a consider-able amount of small producers abandoning milk production. Milk production is most widely spread in Järva, Lääne-Viru and Pärnu counties, production of beef cattle is popular in Lääne and Saare counties.
The number of poulty, which started to decrease in 2005, exceeded two million again in 2010 and 2011.
The number of pigs has remained stagnant since 2001 – about 35,000. Pig production increased in 2007 thanks to the growth in demand on the Eastern market.
There are 2.6 times more sheep and goats than ten years ago. The number of sheep and goats has been increasing since 2004 when allocation of payments for ewes production and organic sheep production (over half of the sheep are rec-ognized as organic sheep) was initiated in Esto-nia. Sheep production is most widely spread in
Saare county, goat production in Pärnu county.
According to the data of Statistics Estonia as at 30 June 2012 249,000 cattle, 374,000 pigs, 105,000 sheep and goats and 1,971,000 poultry were recorded in Estonia. While the number of cattle grows year by year, the number of cattle breeders has decreased. As at 30 June 4,594 cat-tle breeders were registered in ARIB showing a decline of 20 producers in three months. While the number of dairy cow producers dropped by 47 in three months, the number of beef cattle producers increased by 63 in the same period. The number of producers of sheep and goats is also increasing.
Figure 40. Number of livestock as at 31 Decem-ber, 2001–2011 (thousand heads)
2.2.1. Milk Production
According Statistics Estonia 695,000 tonnes of milk was produced and the average milk produc-tion per cow was 7,136 kg/year. Although the number of herds, as well as dairy cows has de-creased year by year, total milk production has increased as a result of growth in productivity of dairy cows, except in the year 2009 when the number of cows and total milk production dropped as a result of low buying-up prices.
In 2011 89,000 dairy cows in 879 herds were reg-istered in the Estonian Animal Recording Centre. Registration of cows in the Estonian Animal Re-cording Centre has improved year by year ac-
counting for 94% of the total number of cows in 2011. The majority of registered dairy cows were of Estonian Holstein breed (78%) and of Estonian Red breed (21%). There were 465 cows of Esto-nian Native breed accounting for 0.6% of the cows in milk recording. According to the 2011 data of the Estonian Animal Recording Centre milk production of cows was 7,756 kg/year per cow showing a growth of 143 kg compared to 2010. Milk production of the cows of Estonian Holstein breed, Estonian Red breed and Estonian Native breed was 7,926, 7,268 and 4,461 kg/year, respectively.
Year Cattle Dairy cows
Pigs Sheep and goats
Poultry
2001 261 129 345 32 2 2952002 254 116 341 34 2 0962003 257 117 345 34 1 9452004 250 117 340 41 2 1832005 250 113 347 52 1 8792006 245 108 346 66 1 6392007 241 103 379 76 1 4782008 238 100 365 82 1 7572009 235 97 365 80 1 7922010 236 97 372 83 2 046
2011 238 96 366 88 2 033 Source: SE
45
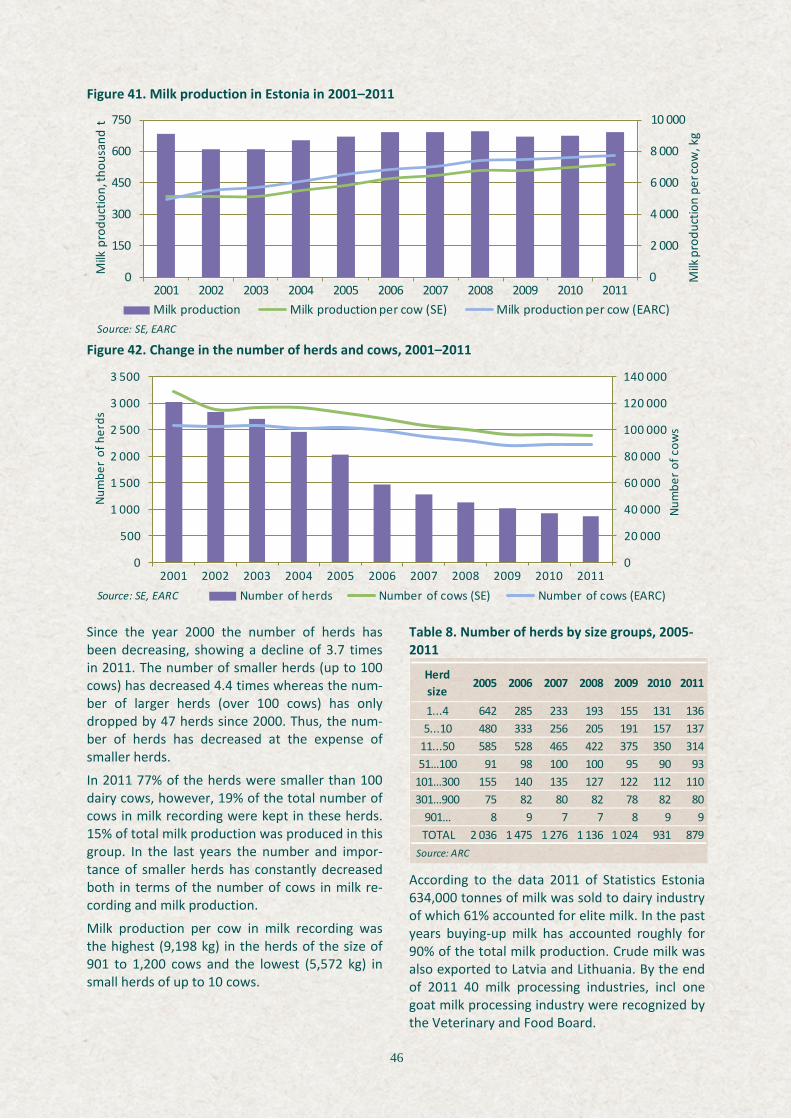
Figure 41. Milk production in Estonia in 2001–2011
Figure 42. Change in the number of herds and cows, 2001–2011
Since the year 2000 the number of herds has been decreasing, showing a decline of 3.7 times in 2011. The number of smaller herds (up to 100 cows) has decreased 4.4 times whereas the num-ber of larger herds (over 100 cows) has only dropped by 47 herds since 2000. Thus, the num-ber of herds has decreased at the expense of smaller herds.
In 2011 77% of the herds were smaller than 100 dairy cows, however, 19% of the total number of cows in milk recording were kept in these herds. 15% of total milk production was produced in this group. In the last years the number and impor-tance of smaller herds has constantly decreased both in terms of the number of cows in milk re-cording and milk production.
Milk production per cow in milk recording was the highest (9,198 kg) in the herds of the size of 901 to 1,200 cows and the lowest (5,572 kg) in small herds of up to 10 cows.
Table 8. Number of herds by size groups, 2005-2011
According to the data 2011 of Statistics Estonia 634,000 tonnes of milk was sold to dairy industry of which 61% accounted for elite milk. In the past years buying-up milk has accounted roughly for 90% of the total milk production. Crude milk was also exported to Latvia and Lithuania. By the end of 2011 40 milk processing industries, incl one goat milk processing industry were recognized by the Veterinary and Food Board.
0
2 000
4 000
6 000
8 000
10 000
0
150
300
450
600
750
2001 2002 2003 2004 2005 2006 2007 2008 2009 2010 2011
Milk
pro
duct
ion
per c
ow, k
g
Milk
pro
duct
ion,
thou
sand
t
Milk production Milk production per cow (SE) Milk production per cow (EARC)Source: SE, EARC
0
20 000
40 000
60 000
80 000
100 000
120 000
140 000
0
500
1 000
1 500
2 000
2 500
3 000
3 500
2001 2002 2003 2004 2005 2006 2007 2008 2009 2010 2011
Num
ber o
f cow
s
Num
ber
of h
erds
Number of herds Number of cows (SE) Number of cows (EARC)Source: SE, EARC
Herd size
2005 2006 2007 2008 2009 2010 2011
1...4 642 285 233 193 155 131 1365...10 480 333 256 205 191 157 137
11...50 585 528 465 422 375 350 31451…100 91 98 100 100 95 90 93
101…300 155 140 135 127 122 112 110301…900 75 82 80 82 78 82 80
901… 8 9 7 7 8 9 9 TOTAL 2 036 1 475 1 276 1 136 1 024 931 879
Source: ARC
46

In 2011 the average buying-up price of milk was 323 €/t accounting for a 16% rise on 2010. The buying-up price of milk increased considerably in the last quarter of 2007 and continued to in-crease in the first quarter of 2008. Thereafter a sharp decline in the buying-up prices occurred. The price continued decreasing up to July 2009 – since then the buying-up price of milk has dem-onstrated a growing trend. Since May 2012 the buying-up price of milk has remained stagnant under 300 €/t and the data of nine months show that the buying-up price of milk is 7% lower in comparison with the same period in 2011.
The EU production quotas impose certain restric-tions on milk production volumes. By the end of the quota year 31 March 2011 milk producers had delivered 601,000 tonnes of milk to the dair-ies and sold 5,500 thousand tonnes directly to the end-consumer. Despite of an increase in total milk production Estonia has not reached close to fulfilling the EU milk quota implemented with the aim of restricting milk production because the quota has also been regularly increased. Estonian milk quota in the quota year which started 1 April 2012 is 685,065 tonnes of which 678,900 tonnes is the delivery quota and 7,200 tonnes the direct sales quota.
In 2011 517 kg of milk per capita was produced in Estonia showing an increase of 13 kg in compari-son with 2010. Comparison of the years 2001-2011 shows that the indicator was the highest in 2008 (518 kg) and the lowest in 2002 (450 kg).
In Estonia more milk is produced than demanded on the internal market and the indicator has in-creased year by year. In 2011 the level of self-sufficiency was 167%.
Figure 43. Production and buying up milk, 2005–2011
Figure 44. Buying-up price of milk, 2005–2011
Figure 45. Cow milk production per capita, 2001–2011
Figure 46. Level of self-sufficiency in milk pro-duction, 2005–2011
500
550
600
650
700
750
2005 2006 2007 2008 2009 2010 2011Source: SE
Production
Buying-up
thousand t
150
200
250
300
350
2005 2006 2007 2008 2009 2010 2011
€/t
Source: SE
400
420
440
460
480
500
520
540
2001 2003 2005 2007 2009 2011
kg
Source: SE
120%
130%
140%
150%
160%
170%
2005 2006 2007 2008 2009 2010 2011Source: SE
47

Strategic Overview of Dairy Tiina Saron, Estonian Dairy Association Dairy is an interesting sector often given as a positive or a negative example in describing different aspects of life. Success stories of agriculture and positive foreign trade balance are examples of success of the sector; milk price for the producer and consumer is a topic evoking negative rather than positive emotions. Opinions of and attitudes to the healthiness of milk and milk products have been floating alongside the currents of different trends, given at one time or another as an example of a fat-free product or an example of healthy food. One thing is clear – dairy is still one of the strongest pillars of our agriculture, therefore, development of the sector as a whole should be of concern for the state. Policy makers cannot ignore dairy and projections of future trends of the sector are being discussed at the meetings in Brussels. It is known that milk production quotas will be removed in 2015 and this will create a new situation on the dairy market. Today self-sufficiency in milk production is over 100% in twelve Member States out of 27. Estonia is the fourth in the ranking after Ireland, Denmark and the Netherlands whereas France, Luxembourg and Germany are following us. All Member States are preparing for the opening of new opportunities. According to the estimates of different analysts the global demand is growing, thus, there should be room for everyone on the market. At the same time, we cannot ignore the economic crisis and unexpectedness of the nature having direct effect on agriculture, including dairy. Therefore, countries where dairy plays an important role in the economy, are preparing strategic measures for meeting the challenges and maximize their potential in the new situation. Four years ago in relation to the economic crisis the current status and the outlook of dairy sector were taken in the spotlight. On the initiative of the Estonian Dairy Association the Ministry of Agriculture was made a proposal to develop a strategy for the dairy sector. Availability of a good production structure of raw material is a sound argument for an increase in milk production potential. It is possible to improve the efficiency of milk processing by means of suitable investments and increase the production of high value added products through research and development. Also, more efficient dissemination of information could contribute to an increase in domestic consumption and export stimulation measures would encourage a raise in the share of high value added products in total export of dairy products. The more so, there was an urgent need for introducing a risk management system. The Ministry of Agriculture set up a working group for the development of the strategy in 2009. The working group included representatives of agricultural producers and manufacturers of different size groups. As a result of three years of discussions and debates common agreement on the vision of Estonian dairy sector and the possibilities for implementing these visions was reached at the beginning of 2012. The strategy document of Estonian dairy is above all an agreement of the stakeholders signed by the Minister of Agriculture, representatives of the Estonian Farmers Union, Central Union of Estonian Farmers and the Estonian Chamber of Agriculture and Commerce.
Estonian Dairy 2020 vision (Extract from the strategy document) Estonian sustainable and competitive dairy is driven by the market demand and focusing on manufacturing of high value added milk products (including increased volumes of organic products), as well as on export, and is based on vertical and horizontal collaboration. According to the Estonian dairy 2020 vision the dairy sector is cooperation- oriented creating high value added (including health biotechnological products), the export share in the dairy sector is high and the share of farm dairies and organic production in dairy shows an increasing trend. Milk production has maintained a priority in the agricultural sector. Alongside with an increase in the efficiency of production and manufacturing the competitiveness of the sector has increased, regional and structural balance and environmentally friendly production methods ensure sustainability of the dairy sector. Employment rate in the sector is high and production and manufacturing efficiency is increasing as a result of application of innovative technologies and knowledge.
48

A system for in-service training and retraining of the employees of the dairy sector has been developed and implemented. Educational establishments providing relevant education and qualifications have high quality educational facilities and are popular among the young. A crisis management system has been developed to respond to crisis and epidemic situations.
The following prerequisites regarding the situation in 2020 were taken as a basis for drafting the vision: 1. As a result of increase in the global population and change in the eating habits and greater
openness to world markets demand for milk products is increasing, at the same time the purchasing power and consumption in the domestic market is also improving.
2. Milk production quotas do not exist in the EU, the EU and national payments (including export support) have been significantly decreased or removed, an EU and national crisis management system (incl insurance system, measures for the prevention of and protection against epidemics) have been developed to be prepared for responding to market failures and economic crisis.
3. Climate change has an adverse effect on food production in several regions of the world and may affect the conditions of Estonian agricultural production to a certain extent.
4. Estonia is moving towards the environmentally friendly production (including organic farming) and the popularity of organic products and market is increasing.
5. Attractiveness of urbanisation in Estonia is declining, a part of the urban population is returning to the rural areas but the majority of them will not be engaged in agriculture. The number of people directly engaged in milk production or processing is probably dropping.
6. The most important market is still the EU internal market (including Estonia). Russia as an export market is of the biggest potential, however, possibilities for exporting to the third countries have improved.
7. A prerequisite for the success of the dairy sector is balanced and sustainable development of the entire supply chain rather than continuing concentration of the dairy sector.
Strategic objectives
1. Increasing milk production, production efficiency and number of milk cows: to ensure supply chain sustainability via maintaining milk production in the short term and increasing annual milk production by one third in the long term by means of increasing the number of herds of milk cows and the efficiency of milk production. Sustainability, efficiency and growth is achieved by means of reconstruction of livestock buildings, increasing the utility rate of cowsheds, energy efficiency and applying research collaboration in improving the genetic material and forage of cows, as well as increasing the period of keeping livestock in herds in an environmentally friendly way taking into consideration the regional and structural balance.
2. Increasing milk processing efficiency and export orientation: to increase milk processing efficiency through considerable increase in support for the concentration of larger dairy industries and technical modernization of processing capacities, application of innovative solutions and energy efficiency measures maximizing export orientation of the manufacturing industry and balancing export markets and exported products.
3. Creating a higher value added dairy: to increase the share of products of high value added, including the share of functional products both in production and export using possibilities in product development based on the established technology platforms (eg European Technology Platform for Food for Life).
4. Preservation of small-scale production and processing, traditional agricultural landscapes and clean environment: to contribute to the preservation of rural population; to maintain and support small-scale production and processing as a part of food security (security guarantee); to support the development of short supply chains and direct marketing contributing to the
49

2.2.2. Meat production In 2011 80,600 tonnes of meat (deadweight) was produced showing an increase of 7% on 2011. Pigmeat accounted for 62%, poultry 22%, beef 15% and sheep and goatmeat only for 1% of the total meat production. Since 2009 more poultry than beef has been produced. Production vol-umes of sheep and goatmeat and the share of sheep and goatmeat in total meat production have been declining since 2009.
In 2008-2010 pigmeat production remained static at 46,000 tonnes whereas in 2011 an increase in the production was observed. As at end of 2011 42 slaughterhouses for the production of pigmeat were approved by the Veterinary and Food Board. In 2012 a ban to export live animals to Russia was introduced affecting pig production; also, export of pigs (deadweight) to Russia having shown an increase in the past years was termi-nated 20 March. The more so, an increase in for-age cereal prices has affected pig production.
In 2011 the total number of cattle increased by 1% whereas beef production in deadweight de-creased by 6%. At the end of 2011 32 slaughter-houses were approved by the Veterinary and Food Board for the production of beef. 32,800 cattle were slaughtered in these slaughterhouses. The number of cattle slaughtered in approved meat-processing industries decreased by 5,800. Meat production dropped by 1,400 tonnes in comparison with 2010.
In the first quarter of 2012 decline in the produc-tion of beef continued. According to the cattle trade statistics the import of beef exceeded ex-port threefold: in five months in 2012 2.3 tonnes of beef was imported and 830 tonnes of beef was exported. Beef is mostly imported from Latvia (33% of the total import) and Poland (24%) and exported to Finland (38% of total export) and the Netherlands (32%).
organic products, thereby supplying consumers with sufficient selection of distinctive products and increasing the competitiveness of small producers and manufactures; to contribute to the preservation of traditional agricultural landscapes and clean environment by means of traditional farming.
5. Development of cooperation and vertical collaboration: to support the development of favourable conditions for the enhancement of cooperation and vertical collaboration paying more attention to the development of different possibilities of cooperative milk processing, including cooperation of business and cooperative enterprises. At the same time, negotiation capacity of different parts of food chain should be balanced to improve access to the markets.
6. Increasing the consumption of milk: to increase the consumption of milk by means of supporting and increasing the efficiency of the awareness rising of the consumers about local high quality products of high added value.
7. Ensuring security and stability of the sector: to highlight the importance of the dairy sector and protect the interests of the sector; to develop a crisis management system to ensure the stability of the sector during a crisis situation (including alleviation of the loan pressure).
In conclusion, it can be said that our prospects for the implementation of the strategic objectives are rather good. The prerequisites for the production of milk in Estonia are good and it is possible to considerably increase the competitiveness of the sector when introducing innovations wisely. In the last years our agricultural holdings have made considerable investments in the modernization of production facilities and they are using the latest milking, feeding and livestock keeping technology. In collaboration with universities specific functional milk products have been developed and the importance of these products in consumption is increasing. However, it must be admitted that processing of valuable raw milk has not been modernized at the same pace and quick application of modern technology is of paramount importance. Collaboration between all parties involved in the supply chain is of equal importance, however, a constructive dialogue between the parties is a prerequisite for defining and implementing common objectives.
50
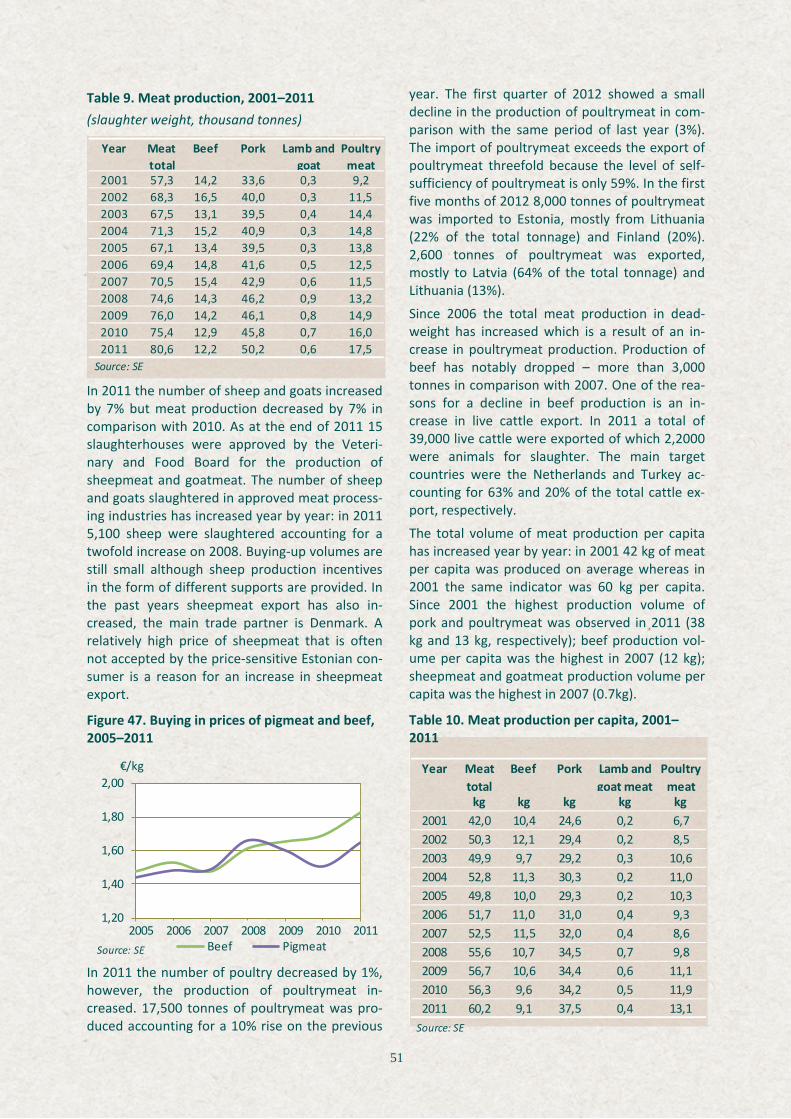
Table 9. Meat production, 2001–2011 (slaughter weight, thousand tonnes)
In 2011 the number of sheep and goats increased by 7% but meat production decreased by 7% in comparison with 2010. As at the end of 2011 15 slaughterhouses were approved by the Veteri-nary and Food Board for the production of sheepmeat and goatmeat. The number of sheep and goats slaughtered in approved meat process-ing industries has increased year by year: in 2011 5,100 sheep were slaughtered accounting for a twofold increase on 2008. Buying-up volumes are still small although sheep production incentives in the form of different supports are provided. In the past years sheepmeat export has also in-creased, the main trade partner is Denmark. A relatively high price of sheepmeat that is often not accepted by the price-sensitive Estonian con-sumer is a reason for an increase in sheepmeat export.
Figure 47. Buying in prices of pigmeat and beef, 2005–2011
In 2011 the number of poultry decreased by 1%, however, the production of poultrymeat in-creased. 17,500 tonnes of poultrymeat was pro-duced accounting for a 10% rise on the previous
year. The first quarter of 2012 showed a small decline in the production of poultrymeat in com-parison with the same period of last year (3%). The import of poultrymeat exceeds the export of poultrymeat threefold because the level of self-sufficiency of poultrymeat is only 59%. In the first five months of 2012 8,000 tonnes of poultrymeat was imported to Estonia, mostly from Lithuania (22% of the total tonnage) and Finland (20%). 2,600 tonnes of poultrymeat was exported, mostly to Latvia (64% of the total tonnage) and Lithuania (13%).
Since 2006 the total meat production in dead-weight has increased which is a result of an in-crease in poultrymeat production. Production of beef has notably dropped – more than 3,000 tonnes in comparison with 2007. One of the rea-sons for a decline in beef production is an in-crease in live cattle export. In 2011 a total of 39,000 live cattle were exported of which 2,2000 were animals for slaughter. The main target countries were the Netherlands and Turkey ac-counting for 63% and 20% of the total cattle ex-port, respectively.
The total volume of meat production per capita has increased year by year: in 2001 42 kg of meat per capita was produced on average whereas in 2001 the same indicator was 60 kg per capita. Since 2001 the highest production volume of pork and poultrymeat was observed in 2011 (38 kg and 13 kg, respectively); beef production vol-ume per capita was the highest in 2007 (12 kg); sheepmeat and goatmeat production volume per capita was the highest in 2007 (0.7kg).
Table 10. Meat production per capita, 2001–2011
2001 57,3 14,2 33,6 0,3 9,22002 68,3 16,5 40,0 0,3 11,52003 67,5 13,1 39,5 0,4 14,42004 71,3 15,2 40,9 0,3 14,82005 67,1 13,4 39,5 0,3 13,82006 69,4 14,8 41,6 0,5 12,52007 70,5 15,4 42,9 0,6 11,52008 74,6 14,3 46,2 0,9 13,22009 76,0 14,2 46,1 0,8 14,92010 75,4 12,9 45,8 0,7 16,02011 80,6 12,2 50,2 0,6 17,5
Source: SE
Poultry meat
Year Meat total
Beef Pork Lamb and goat
1,20
1,40
1,60
1,80
2,00
2005 2006 2007 2008 2009 2010 2011
€/kg
Beef PigmeatSource: SE
Year Meat total
Beef Pork Lamb and goat meat
Poultry meat
kg kg kg kg kg2001 42,0 10,4 24,6 0,2 6,72002 50,3 12,1 29,4 0,2 8,52003 49,9 9,7 29,2 0,3 10,62004 52,8 11,3 30,3 0,2 11,02005 49,8 10,0 29,3 0,2 10,32006 51,7 11,0 31,0 0,4 9,32007 52,5 11,5 32,0 0,4 8,62008 55,6 10,7 34,5 0,7 9,82009 56,7 10,6 34,4 0,6 11,12010 56,3 9,6 34,2 0,5 11,92011 60,2 9,1 37,5 0,4 13,1
Source: SE
51

Estonian internal market is self-sufficient only in pig production – since 2009. In 2011 self-sufficiency in beef and poultry production was 80% and 59%, respectively. The level of self-sufficiency in beef production was the highest in 2010 reaching 93%. Self-sufficiency in poultry production has shown an increase since 2008.
In 2011 the average buying-up price of beef was 1,831 €/t accounting for a 8% increase in com-parison with last year and showing the highest level since 2005. The average buying-up price of pork was 1,650 €/t reflecting a 9% rise on last year. The average buying-up price of pork was the highest in 2008 (1,660 €/t). In the first half-year of 2012 the buying-up prices of beef and
pork have increased by 16% and 7%, respectively, when compared with the same period of 2011.
Figure 48. Level of self-sufficiency in meat pro-duction, 2005–2011
2.2.3. Egg production In 2011 185 million eggs were produced in Esto-nia showing a 2% rise on 2010. The average egg production per hen was 268 eggs. After a decline in production in 2008 as a result of the outbreak the Newcastle disease in two major poultry pro-duction industries egg production has shown a steady increase again since 2009. In 2011 137 eggs per capita were produced. Egg production volume was the highest in 2001 when 204 eggs per capita were produced and the lowest in 2008 (109 eggs per capita).
Harju, Põlva and Valga counties account for over 90% of total egg production, egg production vol-ume is the lowest in Järva county (0.1% of total egg production). In 2011 there were 10 egg pack-aging centres and a manufacturer of egg prod-ucts approved by the Veterinary and Food Board in Estonia. Two egg packaging centres were ap-proved for packaging of quail eggs.
Self-sufficiency in egg production has remained stagnant at 67-68% in past three years. Most imortant trading partners for eggs are Latvia, Lithuania and Finland. In the period of January to May 2012 egg export to Latvia and Finland ac-counted for 60% and 23%, respectively, and im-port from Latvia and Lithuania for 35% and 31%, respectively.
Figure 49. Egg production per capita, 2001–2011
Figure 50. Level of self-sufficiency in egg produc-tion, 2005–2011
40%
60%
80%
100%
120%
2005 2006 2007 2008 2009 2010 2011Source: SE
Poultrymeat
Beef
Pigmeat
7090
110130150170190210230
2001 2003 2005 2007 2009 2011
pieces
Source: SE
50%
60%
70%
80%
90%
2005 2006 2007 2008 2009 2010 2011Source: SE
52

2.2.4. Honey production In 2011 there were 26,400 bee colonies and 694 tonnes of honey was produced in Estonia. The number of bee colonies has dropped by almost two thousand beehives whereas honey produc-tion has increased by 13 tonnes. 26 kg of honey was collected per beehive on average showing a rise of over 9% in comparison with 2010. In 2011 the buying-up price of honey was 6.69 EUR/t con-tributing to a 4% rise when compared to last year. In the past ten years the price of honey has increased more than twice.
Figure 51. Production of honey per capita, 2001–2011
Table 11. Number of bee colonies and produc-tion of honey, 2001–2011
In 2011 520 g of honey per capita was produced, honey production has remained static when compared to 2010. The level of honey production was the highest in 2006 when 770 g of honey per capita was produced. In the past years self-sufficiency in honey has been at the level of 70-77%.
Table 12. Producer prices of livestock products in the EU, 2011 (per kilo of live weight, except milk, honey and eggs)
0,00,10,20,30,40,50,60,70,80,9
2001 2003 2005 2007 2009 2011
kg
Source: SE
Year Bee colonies Pricethous hives t kg/hive €/kg
2001 47,50 291 6,1 3,132002 50,50 771 15,3 3,152003 34,50 535 15,5 4,122004 32,70 555 17,0 3,502005 33,00 638 19,3 3,532006 38,00 1 033 27,2 3,742007 29,70 756 25,5 5,762008 24,80 501 20,2 5,562009 27,50 575 20,9 6,482010 28,30 681 24,1 6,462011 26,40 694 26,3 6,69
Source: SE
Honey production
Country Calves Young cattle
Heifers Cows Pigs (light)
Sheep Chickens Fresh eggs
Raw cows milk
Honey
€/kg €/kg €/kg €/kg €/kg €/kg €/kg €/tk €/kg €/kg Bulgaria 1,28 1,15 0,87 0,73 1,13 0,97 0,96 0,07 … 2,63 Czech Republic 2,35 2,32 1,29 1,12 1,17 0,53 0,90 0,06 … 3,66 Denmark … 1,71 1,38 0,96 0,96 0,17 0,88 0,06 0,36 … Greece 2,55 … … 1,35 2,10 1,36 1,50 0,17 0,43 5,85 Spain 2,07 2,25 1,70 1,21 1,23 0,43 1,15 0,07 0,31 3,10 Latvia 0,96 1,03 0,94 0,94 1,17 1,02 … 0,06 … 4,36 Lithuania 1,95 1,46 1,14 0,94 1,17 1,87 0,93 0,06 0,29 2,46 Luxembourg 3,59 2,08 1,89 1,72 … … 3,31 0,15 0,33 9,50 Hungary 2,79 … … 1,82 1,18 1,91 0,89 0,10 0,31 2,60 Austria 3,25 1,97 1,63 1,21 1,24 0,59 0,93 0,13 0,35 7,20 Poland 2,16 1,35 … … … 1,82 0,90 0,04 0,29 2,54 Portugal 2,69 … 2,00 1,75 … 0,25 0,53 0,07 0,31 3,51 Romania 1,27 1,68 1,12 0,95 1,26 1,45 0,99 0,07 0,25 2,36 Slovenia 2,19 1,74 1,48 1,01 1,78 … 1,09 0,10 0,31 3,68 Slovakia 2,19 1,26 1,30 0,87 1,21 0,81 0,91 0,07 0,32 … Source: EUROSTAT
53

The Future of Cooperation Lies in Concentration Üllas Hunt, Central Union of Estonian Farmers More attention has to be paid to the growth of return from the market. Therefore, concentration on possibilities and solutions contributing to an increase in market power of the primary level producers and participation in food supply chain is of great importance. Also, it is essential to organize procurements of major inputs to save significant resources. The actors of the agricultural sector are interested in the strategies and activities contributing not only to survival but also to the development and improvement of the quality of life in rural areas. One of the most serious problems for the primary level producers is their modest role in the supply chain where profit margins are distributed according to the behaviour of the party having a stronger position. For example, the share of profit margin of agricultural producers of the EU-25 states has dropped from 31% to 24% in 1995-2005 whereas the share of trade has increased from 27% to 30% (EU KLEMS, EUROSTAT 2009). Also, we cannot ignore great volatility of buying-up prices of agricultural products, which has particularly adverse effect on small-size/low liquidity enterprises. In addition, escalation of the market power of trade expressed in rapid concentration, is affecting more and more seriously the buying up and supply policy. For example, the share of top five su-permarket chains account for 90% of the market share in Finland, 82% in Sweden, 82% in Slovenia, 81% in Ireland, 79% in Estonia, 79% in Austria and 70% in Germany (Global Retail Concentration, Planet Retail, 2006). Cooperation is one of the possibilities for agricultural producers to enhance sustainability of their economic activities. All forms of cooperation in terms of supply, processing and procurement of agricultural products, as well as provision of services to the producer are suitable. The objective is to concentrate producers of different economic capability and size and help them to cope better with market risks and earn bigger income by means of common activities. Cooperative enterprises play an important role in the world and European economy. There are 250,000 cooperative enterprises in the European Union owned by 163 million people (every third resident of the EU!) employing 5.4 million people. Cooperatives are also recognised on the global level demonstrated by the fact that the United Nations has declared 2012 the International Year of Cooperatives. The role of cooperatives is particularly significant in agriculture (83% of gross agricultural production in the Netherlands, 79% in Finland, 55% in Italy and 50% in France), also in forestry (60% of the market share in Sweden and 31% in Finland) banking (50% in France, 37% in Cyprus, 35% in Finland, 31% in Austria and 21% in Germany). In the past years cooperatives have also been established in other sectors such as education, transport, energy supply etc. In Estonia cooperatives were vigorously developed in the twenties and thirties in the 20th century. In 1940 there were 140,000 farms in Estonia that belonged to over 3,000 cooperatives. The Esto-nian nation owned cooperative banks and insurance associations. Also, after regaining independence, a lot of cooperatives were set up. According to the data of the commercial register there were 288 commercial associations of agricultural producers registered in the period of 1995-2011. Most of them were agricultural units formed at the time of reforms, however, a number of them terminated their activities (went into bankruptcy) some time later or their economic activities ceased and they were left in the register as “dead” souls. In general it can be said that in Estonia the number of agricultural cooperative enterprises is small and they are scattered. The data of annual reports 2009 show that there were only 96 economically active (earning sales revenue) cooperative enterprises in Estonia. Comparison of the data of sales revenue of agricultural cooperative enterprises of different areas of activity with the total sales revenue of the relevant sector shows that the share of cooperative enterprises is very small and it has dropped in terms of production of agricultural products (5.9%-4.9%) as well as processing (7.2%-5.7%) over the past five years (according to the data of the survey Overview of
54

Agricultural Cooperative Enterprises in Estonia 2005-2009). However, the share of agricultural cooperative enterprises in the wholesale of agricultural products is quite significant (within the range 65.4%-43.3%); also, wholesale showed an upward trend in 2009. Dairy cooperatives are currently playing and probably will play in the future an important role in the wholesale of milk. According to the above named survey of the Ministry of Agriculture the share of sales revenue of the cooperative enterprises in dairy sector in the sales revenue of the total agricultural cooperative enterprises contributed to 80% in 2009. The share of cereal and meat cooperative enterprises is minor. However, we have to keep in mind that these ratios reflect the sum of economic activities of cooperatives operating individually; there is no cooperation between them (no joint sales). Thus, the contrast with Scandinavian cooperatives is quite drastic because today the share of a larger dairy cooperative in the raw material market in Estonia could be estimated up to 15%. The market power of the cooperatives of older EU Member States in terms of market share or turnover/sales revenue is considerably higher (the market share of raw milk of Valio Ltd in Finland is estimated 86%, the turnover 1.8 million euros in 2010. Arla Foods controls 95% of the Danish and 65% of the Swedish dairy market, the turnover was 6.5 billion euros in 2010). As a result of consolidation of regional cooperatives of older Member States (eg 18 regional cooperatives are the owners of Valio Ltd), they have enough market power and they are competitive on foreign markets. This, in turn is a result of the capacity of the cooperative enterprise of making focused investments in manufacturing, i.e production of value added. In Es-tonia the volume of agricultural production is small when compared to the level of the EU; therefore, consolidation is of utmost importance. In order to be able to compete on (foreign) markets it is necessary to provide volume, quality and production efficiency. Concentration requires compromises, but this is the path towards the management of sufficient and secured raw material flows, as well as financing, including the ability to win the trust of the banks. Thus, when speaking about cooperation, it is necessary to be aware of the actual market power of agricultural cooperative enterprises in terms of marketing of raw materials or manufactured goods or carrying out procurements. The development capacity of the sector is concentration of current cooperatives with the aim of increasing joint supply and procurement volumes rather than increase in the number of cooperatives based on primary level producers. Establishment of central cooperatives concentrating regional cooperative enterprises would contribute to the strengthening of agricultural cooperative enterprises. The strategy of these central cooperatives has to be targeted at the coordination of the production of small enterprises (their members), joint marketing and product development, also, big investments. In earlier years there have been attempts to set up central cooperatives in the dairy and cereal sector, but unfortunately, these have not been successful. Currently the role of a central cooperative in dairy sector is to some extent is played by the cooperative enterprise EPIKO (established in 2008, the members are agricultural producers and regional cooperative enterprises). It takes time to increase joint sales volumes, however, an unreasonable restriction has been imposed by the EU Regulation of the Parliament and the Council providing that milk volumes to be negotiated on shall not exceed 33% of the total production volume of the state (Council Regulation (EC) No 1234/2007). At the same time these restrictions are not applied in case of the states where the negotiated volumes (market shares) are considerably bigger (Finland, Sweden). Cooperative enterprise Farm IN (established in 2011, members are other cooperative enterprises) was set up for buying in production inputs. The question is about the possibilities of more rapid development of central cooperatives. The current central cooperatives evidently continue their activities on their own and keep looking for partners. However, it would only be reasonable to expect that resources for the support of the activities of central cooperatives, development of cooperation between the parties of food supply chain and investments are made available within the framework of the RDP 2014-2020.
55

2.3. Organic farming Organic farming has developed actively over the past years In Estonia. Availability of support allo-cated for organic farming certainly has a role in it compensating for the lower income resulting from the specific nature of production. In Estonia organic production was first supported in 2000 when granting of hectare-based support for or-ganic farming was initiated within the framework of agri-environmental supports.
Since 2004 support for organic farming has been paid from the Estonian Rural Development Plan (ERDP). Total of EUR 44.6 million has been paid for supporting organic production within the pe-riod of 2004 – 2010. 80% of the funding has been allocated from the EU budget and 20% from the budget of the Government of Estonia.
Since the introduction of the support for organic production, the area of organic farmland has grown, also, the share of organic farmland in to-tal utilized agricultural area has constantly been increasing. In 2011 the area of organic farmland was 134,000 ha contributing to 14% of the total
utilized agricultural area. Since 2001 the area of organic farmland has increased almost seven times. The number of organic producers has also increased year by year. According to the Organic Farming Register 1,431 organic producers were registered as at the end of 2011 showig almost a fourfold increase on 2001.
Figure 52. Importance of organic farmland in the total utilized agricultural area, 2000–2011
0%2%4%6%8%
10%12%14%16%
2001 2003 2005 2007 2009 2011Source: SE, AB
It is highly relevant to support the start-up of cooperative enterprises. At the same time, it is necessary to draw attention to the structures that are about to overcome the conflicts created by weak cooperative enterprises competing with each other. These structures have proved to be viable and in the current situation they provide their members of the primary level with a cooperation format that ensures the best economic outcome, security and provision of diverse services.
The world is globalizing very rapidly: today we are already talking about the Baltic Market and the more so – milk as a very sensitive product is moving in concentrated form within a radius of several thousand kilometres, not to mention other raw or manufactured products. Trade is concentrating – the ordered production volumes and requirements for the quality grow. We are facing the removal of milk quota resulting in more tense competition on the raw milk market. Uncertain future of the financial markets will add risks. We have to create conditions for a change in the food supply chain and strengthen the position of the producer of raw material – the agricultural producer. Single weak cooperatives should be replaced by a central structure – a central cooperative representing the sector and concentrating regional cooperatives. It is the path leading to more efficient investments and providing possibilities for getting higher returns on sales on the markets. This idea has proved to work successfully in the practice of the old EU countries.
Useful links:
http://www.makefruitfair.org.uk/sites/default/files/eu_retail_briefing_web_final_2.pdf
http://ec.europa.eu/enterprise/policies/sme/promoting-entrepreneurship/social-economy/co-operatives/index_en.htm
http://www.agri.ee/public/Tulundusuhistud_2011.pdf
56

Figure 53. Number of organic farmers in Estonia, 2001–2011
In terms of counties the area of organic farmland in 2011 was the largest in Saare and Tartu county (15,193 and 13,810 ha, respectively) and the smallest in Põlva and Järva county (4,052 and
4,520, respectively). The number of acknowl-edged organic producers was the biggest in Võru county (169 producers) and the smallest in Ida-Viru county (32 producers).
Figure 54. Organic farmland and the number of acknowledged organic producers by counties, 2011
In 2011 the area of annual and perennial grass accounted for the majority of the area of organic farmland, i.e 85,200 ha. Organic cereals occupied 20,500 thousand ha and other organic farmland 28,400 ha. Since 2004 the area of organic cereals has grown four times, incl the area of organic wheat and organic oats 5.1 and 4.3 times, respec-tively, and the area of annual and perennial grass three times.
The structure of the use of organic farmland is significantly different from the structure of the use of conventional farmland. In 2011 various grasslands accounted for 81% of the total area of organic farmland whereas the share of grassland was only 46% in case of conventional agricultural holdings. Cereal cultivation in conventional hold-ings accounts for 35% of the total utilized agricul-
tural area whereas the area occupied by cereals accounts for only one tenth in organic farms. According to the data of the year 2011 organic farms occupied 64% of the total area of grass-lands in Estonia, incl annual and perennial grass (53%), natural grassland and (5%) and nature conservation area (6%).
As at the end of 2011 Estonian organic livestock producers had 28,700 cattle (incl 3,250 dairy cows and 21,176 beef cattle), 46,500 sheep, 1,300 pigs and 12,900 poultry. The number of organic rabbits and bee colonies increased by 30% and 27%, respectively, the number of beef cattle and pigs increased by 20% and the number of goats and poultry by 18% when compared to 2010. Only the number of dairy cattle and other cattle decreased to some extent. Since 2004 the
0
20
40
60
80
100
120
140
160
0
200
400
600
800
1 000
1 200
1 400
1 600
2001 2002 2003 2004 2005 2006 2007 2008 2009 2010 2011
Org
anic
farm
land
, tho
usan
d ha
Num
ber o
f hol
ding
s
Organic farmland Acknowledged holdingsSource: AB
020406080100120140160180
0
2
4
6
8
10
12
14
16
Põlv
a
Järv
a
Jõge
va
Lään
e-Vi
ru
Ida-
Viru
Harju
Valg
a
Hiiu
Pärn
u
Rapl
a
Lään
e
Võru
Vilja
ndi
Tart
u
Saar
e
Num
ber o
f hol
ding
s
Org
anic
farm
land
, tho
usan
d ha
Organic farmland Acknowledged holdingsSource: AB
57

number of organic cattle has increased a total of 2.8 times, including beef cattle showing an in-crease of 7.2 times. The number of organic sheep
has increased 4.3 times, pigs 3.3, goats 2.7 and poultry 2.6 times.
Figure 55. Structure of land use, 2011
1GAEC - area not utilizsed for agricultural production but only maintained in good agricultural and environmental condition. Source: SE, AB
According to the data of EUROSTAT 2010 the share of organic farmland of the total utilized agricultural area was the highest in Austria (17%) and Sweden (14%). In terms of the indicator Es-tonia was ranking the third (13%). Comparison of all 27 EU member states shows that organic
farmland accounts for 5% of the total utilized agricultural area on average whereas the share of organic farmland in the total utilized agricultural area was the lowest in Malta andf Bulgaria (less than 1%).
Figure 56. Share of organic farmland in the total utilized agricultural area in the EU, 2010
Despite of the fact that organic production has expanded over the past years, processing and marketing of organic products has not pro-gressed in the same pace, in most cases organi-cally produced products are sold as regular prod-ucts or used for the consumption of the family.
Therefore, organic producers have not succeeded in getting a higher price for organic products. Most of the acknowledged organic producers are small producers who are not even trying to mar-ket their products.
Other7%
GAEC1
7% Natural grassland
6%
Annual and perennial grass
69%
Cereals11%
Organic land(134 000 ha)
0,2%
0,5% 1,
1% 1,3% 2,
4%
2,5% 2,8%
2,8%
2,9% 3,3% 3,6% 4,1% 5,
2% 5,8%
5,9%
6,1% 6,4% 6,7% 7,
4% 8,4%
8,6% 9,
1%
9,2%
12,4
%
12,8
% 14,3
% 17,2
%
0%
5%
10%
15%
20%
Mal
taBu
lgar
iaIre
land
Rom
ania
Hung
ary
Net
herla
nds
Cypr
osLu
xem
bour
gFr
ance
Pola
ndBe
lgiu
mG
reat
Brit
ain
Lithu
ania
Port
ugal
Ger
man
yDe
nmar
kSl
oven
iaSp
ain
Finl
and
Gre
ece
Italy
Slov
akia
Latv
iaCz
ech
Repu
blic
Esto
nia
Swed
enAu
stria
EU-15 EU-10 EU-2
EU-27 (5,1%)
Source: EUROSTAT
Other19%
GAEC1
17%
Natural grassland
19%
Annual and perennial grass
10%
Cereals35%
Non-organic land(812 000 ha)
58
Development of Organic Farming in Estonia Egon Palts, Organic Farming Department of the Agricultural Board
The development of Estonian organic farming began in 1989. The first Estonian Organic Farming Act was adopted in 1997. Organic farmers were concentrated in two organizations, the Estonian Biodynamic Association and NGO South East Estonian Bios. These organizations provided organic farmers with advice and controlled the implementation of the requirements.
In 2001 a new act was enforced introducing transfer to a state control system. The Plant Production Inspectorate was assigned to exercise state supervision; currently the state supervision is exercised by the Agricultural Board. As at the end of 2001 369 holdings were registered in the Register of Organic Farming and the organically managed area was over 20,000 ha. Ten years later, as at the end of 2011, 1,431 enterprises had been entered in the Register.
1,416 enterprises are engaged in plant production and 899 in livestock production. The total area of organic farmland is 134,057 ha; the area has increased seven times when compared to 2001.
Development of organic farming in Estonia has shown a dynamic growing trend. Since 2004 organic farming has been supported from the EU funds enhancing rapid development of organic farming. In the past three years (2009-2011) the area of organic farmland has increased by 54%, accounting for about 14% of the total utilized agricultural area of the Republic of Estonia.
According to the 2011 data the average area of an organic farm is 93 ha. The largest organic hol-ding (1,450 ha) is in Saare county. There are six organic farms of over 1000 ha.
Grassland contributes to the biggest share (over 77%) of the total organic farmland. Cereals occupy 15% of the area. As the area of grasslands is large, organic livestock production, particularly beef cattle and sheep production is developing fast. As at 2011 there were over 28,000 organic cattle of which 3,250 were milk cows and over 47,000 were sheep and goats. It shows a more extensive trend of livestock production. Organic pig and poultry farming is less developed.
Manufacturing is one of the most important factors in organic farming. As at the end of 2011 126 food manufacturers had been entered in the Register of Organic Farming, including 22 acknowledged enterprises and one manufacturer of organic forages. In 2011 over 23,000 tonnes of organic cereals were produced of which only 3% were organically manufactured. Large volumes were exported to the EU as raw material. The same situation is characteristic of milk production where over 13 tonnes of organic milk was produced of which only 1.1% was organically manufactured.
In conclusion, it can be said that Estonian agricultural producers are more and more interested in organic farming. However, in order to get access to healthy food in stores, more attention must be paid to manufacturing of organic agricultural products.
59

2.4. Food Industry Food industry is one of the most important branches in the manufacturing industry in Esto-nia. It accounts for nearly 2% of the GDP employ-ing about 3.5% of the labour force. The impor-tance of food industry has decreased both in GDP and in manufacturing industry over the past two decades.
According to the provisional data of SE there were 419 food manufacturing enterprises in Es-tonia employing 13,400 persons. The number of enterprises has increased by 8% and the number of employees dropped by 3% in comparison with 2010. The number of enterprises was the biggest in the baking industry (111) whereas the number of oil and fat enterprises was the smallest. Since 2005 the number of food manufacturing enter-prises was the biggest in 2007 (455) whereas the number of employees was the biggest in 2005 (17.3 thousand).
Although the total production volume of food industry has significantly increased, the number of employed persons has decreased as a result of production modernization and closing down of less competitive enterprises year by year.
In 2011 food and drink industry accounted for 13% and 2%, respectively, of the total volume of manufacturing industry. Since 2005 the share of food industry in manufacturing industry was the highest in 2009 (17%), in the same period the share of drink industry was about 2-3%.
According to the short-term statistics of SE the total output of the enterprises of food industry was 1,186 million euros showing a fall of 6% on 2010. Dairy, meat and drink manufacturing ac-count for the biggest share in Estonian food in-dustry. Comparison of the structure of food in-dustry in 2010 with the year 2005 by categories shows no major changes in that period.
In 2011 food and drink industry output index increased as a result of an increase in export and domestic food consumption. Increase in food and drink industry output was decelerated by rapid increase in prices of food products as a result of increase in input prices.
Figure 57. Share of food industry in manufactur-ing industry, 2005–2011
Figure 58. Number of enterprises in food indus-try, 2005–2011
Figure 59. Food industry output index, 2001–2011
0%
5%
10%
15%
20%
2005 2006 2007 2008 2009 2010 2011
Manufacture of beverages
Manufacture of food
1
Source: SE 1 short-term statistics
340
360
380
400
420
440
460
2005 2006 2007 2008 2009 2010 2011Source: SE 1 short-term statistics
1
80
100
120
140
160
180
2001 2003 2005 2007 2009 2011Source: SE
Manufacture of beverages
Manufacture of food
2001=100
60

Food industry output exceeds domestic demand in Estonia, therefore, export production volume has to be increased and possibilities for entering new markets to ensure development have to be found. Food export increased from 2005 to 2009 following a sharp drop when compared with the previous year (14%). Again, the year 2010 wit-nessed upward movement exceeding the level before the crises. In 2011 the export volume was 431 million euros accounting for a 36% share in the sales volume.
In 2011 the import of food industry increased to a record level (373 million euros) as a result of an increase in prices of raw materials and goods on the EU and world market.
Figure 60. Foreign food trade, 2005–2011
Increase in productivity is the main prerequisite for the improvement of the competitiveness of food industry and economic growth. According to the provisional data 2011 236 million euros of Net Value Added were produced in food industry showing an 11% drop on 2010. First and fore-most, a reason for the drop was an increase in inputs such as labour cost, also, raw material, energy and fuel.
Value Added per employee created in Estonian food industry has significantly risen in the past years, however, there is still much room for de-velopment as it only accounts for 50% of the EU average. In 2011 the average Value Added per employee in food industry was 17,600 euros. Comparison by sector demonstrates that Value Added per employee was the highest in drink industry (37,000 euros per employee).
According to the data of SE short-term statistics 63 million euros of investments were made in 2011 of which 67% were investments in machin-ery and equipment. Comparison with 2010 shows that investments in assets decreased by 11 mil-lion euros within a year. Investment volumes declined in all areas, except the means of trans-port. In terms of sectors the level of investment was the highest in dairy products manufacturing (33%), baking and pasta products manufacturing (15%) and drinks manufacturing (14%).
Figure 61. Foreign drink trade, 2005–2011
Figure 62. Structure of food industry by categories, 2005 and 2010
0
100
200
300
400
500
2005 2006 2007 2008 2009 2010 2011Export ImportSource:SE
million euros
0
20
40
60
80
100
2005 2006 2007 2008 2009 2010 2011
Export ImportSource: SE
million euros
2005
Meat industry18%
Other food industry
18%
Drink industry
18%
Baking industry
10%
Dairy industry27%
Fishing industry
10%Source: SE
2010
Meat industry19%
Other food industry
21%
Drink industry
14%Baking
industry10%
Dairy industry27%
Fishing industry
10%
61

Increasing Prices Frighten Both Manufacturers and Consumers Sirje Potisepp, Association of Estonian Food Industry
In 2011 food industry was a great deal affected by almost invisible growth in the income of consumers, high unemployment rate and increasing prices of raw materials and energy. Production volumes grew to the level of pre-crisis period but low level of internal consumption forced industries to expand their export and make investments in additional production capacity and product development. Price sensitivity of consumers hit hard the producers’ trademark loyalty. Only those enterprises that were smart enough to find resources for marketing got an advantage. Increase in prices stabilized at the beginning of 2012, but in summer information about new rise in raw material, fuel and electricity price and employees demanding better salary from employers reached the producers. Thus, once again, all prerequisites forcing prices up have been created.
Price rise hinders domestic consumption, export comes to the rescue In 2011 the most important key word was “rising food prices”. Food price is formed in the supply chain: a producer, manufacturer, trade and consumer. The higher the prices of raw material, the higher the food prices in stores – last but one in the food chain. At the same time, price rise never contributes to an increase in consumption and thus, in addition to domestic market new opportunities for export are sought. Production exceeds the need of the domestic market and thus, new export possibilities are sought. In 2011 food industry exported products worth around 400 million euros. It accounted for 32% of the total production, a 9% rise on 2010. Food export contributed to 7% of the total export of industry. Major exporters were food industry (EUR 168 million) and fishing industry (EUR 159 million). This year has shown export growth but at more modest pace. Finding new markets and/or cooperation partners is not easy – export growth of the nine months of 2012 has demonstrated a rise of 7% when comparing with the same period last year. The most important export partner was certainly the EU market as a whole, however, the most significant target countries were the same - Russia (20%), followed by Finland (17%) and Latvia (16%), Lithuania, Sweden. In 2011 export to Germany and Denmark increased. At the same time, export to Russia dropped significantly – by a third in a year. One of the reasons was the establishment of the Customs Union Russia-Belarus-Kazakhstan and thus, the production of the members of the Customs Union was preferred. Accession of Russia to the WTO will hopefully result in a breakthrough for us, in fact, it has already been confirmed this year. Transition periods in some cases are long but there is security in terms of harmonized trade conditions. It can be said that after the crisis the old member states where the economic regression was not that significant became more important for us; also, our neighbouring countries after they had overcome the economic crisis. The ability to expand export to Germany is worth acknowledgement. Germany is considered the future leading EU member state; Germany is close to Estonia and there are plenty of financially sound and knowledgeable consumers. However, projections about the economy of the EU countries coming to a standstill create concern among Estonian producers because dependence on the neighbouring countries in terms of export is significant.
Devastating effect of cheap prices Consumers have changed their behaviour – their purchase decision is made on the basis of price, consumers are not loyal to one supermarket chain any longer, they are looking for lower prices in several stores; thus, supermarkets are increasing pressure on shaping the purchase selection of consumers. Also, competition between supermarket chains is getting tighter and therefore, the actual consumer purchase preferences have been left in the background. Estonian retail trade is concentrating in five big supermarket chains: Selver, Maxima, ETK Grupp, Rimi (incl Säästumarket) and Prisma. It means that competition in the retail sector is tight (contrary to Finland where 80% of the retail market belongs to two big supermarket chains).
62

In addition to consumer sensitivity, possibilities of food industry are restricted by the competition between the supermarket chains (eg price of milk in plastic bag) and increase in the share of private label goods. Although the sale of private label goods has dropped in certain product categories (eg juice and ice-creams) as a result of deliberate choices of the customers and the preference for domestic goods, most consumers are still very price sensitive; thus, discount prices are used to attract them. Industries would rather expect cooperation with supermarket chains and more personal approach, as well as more knowledgeable planning of product categories. This is called category management and the final objective is a satisfied and knowledgeable consumer who buys more and is also willing to pay a higher price. What does the consumer buy and why? This should be found out in collaboration with the trade and producers as all the parties in the supply chain are related and every party should be left with some resources for the development. Cheap price offered to the client may not necessarily beat the product quality and value added. At the same time, in the past years the surveys show that, in addition to a good location of the su-permarket and good service standards, consumers also consider diverse assortment of products in stores quite important.
Consumption habits Food industry is related to the purchasing power of consumers more than any other sector of industry. It is possible to increase the salary of employees and earn profit provided we are able to preserve and increase the number of workplaces, make smart management decisions, provide employees with a good qualification, keep up with product and technology developments and produce the right kind of food with a suitable price for the consumer. Unfortunately, there are climate-related risks increasing the price of raw material, volatility of heat energy and oil prices, purchasing power of consumers, as ell as economic well-being of export countries that will always affect food industries. At the same time, we expect an increase in domestic demand as the use of inputs and security of customers is growing and unemployment is showing a declining trend. However, the number of households living on the budget is increasing and therefore, we cannot anticipate a very rapid rise in the domestic demand – in terms of food it will probably remain at 5% this year. Industries would rather see that customers make more knowledgeable choices and prefer products from domestic producers.
State marketing campaign would be welcome In order to be able to compete with big world industry groups our food industries need to keep making investments to bring high value added products to the market and increase their export capacity. According to the data of Statistics Estonia food industries invested EUR 62 million in 2011, mostly in machinery and equipment. The biggest investments were made by dairy industries (EUR 19 million) and bread and baking industries (EUR 9 million). Unpredictable need for high value added products, limited purchasing power of consumers and maximum support rate of 50% of eligible expenses of the investment restricted the volume of investments. However, it can be stated that product development has never stopped in food industry and a number of new products were taken to market by meat, dairy, drink and baking industries last year. Product development is more and more targeted at healthy products – decreasing the amount of food additives and replacing them with natural compounds, reducing excessive amount of salt, sugar and fat. As the awareness of the consumers is growing, the words “ecological” and “organic” can be more often used as sales arguments. The country of origin of food products plays an important role in the customer’s preference, thus, drawing attention to the fact that a product has been produced in Estonia, is an essential aspect for a customer who wants to contribute to the maintaining of local enterprises and workplaces. When preferring imported products, the customer supports the economy and development of other countries. Products of small producers are now available to the customers through super-market chains, organic food shops and markets; these products make the selection of products of large and well-known food industries richer and more diverse. However, we expect the state to
63

make a contribution in the form of marketing campaigns such as Estonian Food to remind people of the importance of domestic food products. Also, provision of enterprises with support for encouraging export and entering in export markets would be of help. We hope that in the EU financial framework 2014-2020 supports will be maintained and targeted at more competitive enterprises with export and growth potential, as well as the enterprises interested in development and expansion.
Challenges for food sector Food producers have to implement two main tasks: feed the population of their country and satisfy the needs and demands of the customer. However, Estonian food industries, among others, have to meet the following requirements:
· First and foremost, food security has to be ensured, this is directly related to the health of the population.
· Environmental impact must be reduced being important for sustainable production. · Despite of the pressure of rising prices enterprises must be able to manufacture products that
are affordable for the customers. · In the situation of concentration of production and trade the impact of trade is growing and
the share of primary producers is decreasing, thus, today the manufacturer capable of producing products of the highest value added and selling them, is the winner.
· Results of research and science should be taken to the product level as the demand for functional products is growing and customers want food products that are useful to the body and health.
Monitoring and following the above named trends demand investments and knowledge about legislation and customer preferences. At the same time the following global challenges create opportunities for Estonian producers and manufacturers, among others in the world:
· Food security. The world population is growing and the need for food is also increasing, particularly in developing countries. For example, 40% more food supplies will be needed globally by 2030, whereas the estimates show that by 2020 the consumption of meat will increase 32% and the consumption of milk 35%. In addition, it is necessary to increase production efficiency to produce more at lower cost.
· Climate change. We are familiar with droughts and excessive moisture. Climate is considered to be the best helper of agricultural producers. In order to cope in the situation of climate change it is necessary to focus on the development of new plant varieties and animal breeds. These areas are already being targeted at, however, changes require major resources.
· Scarcity of resources. We do not often think about issues such as water, soil and forest, these come naturally to us. We understand that we are dependent on fuels and energy and realize that these resources can be depleted. One possibility is biofuel, however cereals are used for the production of biofuel and as a result, the amount of food cereals is decreasing.
· The role of trade and wasting food. More decisions are made by a smaller number of purchasing managers and consumers cannot buy food that is not available on the shelves of the stores. At the same time, some of the food is wasted - it is the resource to be used for planning purchases and visiting the supermarkets that provide a suitable choice for you as the consumer.
· Expectations of consumers. People are moving to towns, their knowledge and needs are increasing. Functional food is playing more important role in the nutrition of people. Good examples of functional food in Estonia are the product category with ME3 bacteria and Heart Cheese. Similar products can be found in every product category. Although customers value above all the good taste of food and pleasure from eating, they also want to buy food in comfortable and easily handled packages.
· The impact of media cannot be ignored. It is very important what kind of attitude media has created towards domestic producers and industry and what kind of information is delivered to the consumer and how reliable it is. Unfortunately, there are plenty of negative examples.
64

3. Rural life 3.1. Rural entrepreneurship and social environment of rural areas Marko Gorban, Rural Development Department of the Ministry of Agriculture
We are used to the idea that agriculture is the backbone of our rural economy. Throughout cen-turies agriculture has provided the population with food while employing an essential part of the rural population. Over the past years agricul-ture has undergone significant technological de-velopment, as a result, the same amount of work is done by smaller labour force participation. On the one hand, it means that, in addition to agri-culture, other areas of activity start playing more significant role in rural development. Also, these developments are reflected in agriculture and its multifunctional character becomes more obvi-ous.
These developments have been included in the Common Agricultural Policy (CAP). Rural devel-opment policy has been an independent pillar of
the CAP in several consecutive programming pe-riods focusing on various rural development as-pects of agriculture such as competitiveness, natural resources and living environment. Also, development of agricultural policy enables agri-culture and related areas of rural economy to be developed in a more integrated way. Both agri-cultural products and natural resources managed in the course of agricultural production are im-portant inputs for several other sectors. Without doubt, the activities supporting living in rural areas are equally important. In addition to a workplace, rural people need different services onsite in order to be able to live in rural areas. Also, possibilities for contributing to the devel-opment of their community are not of minor im-portance.
Figure 63. Net internal migration rate in local communities, 2006–2010
Source: SA – Regional development in Estonia 2011
65
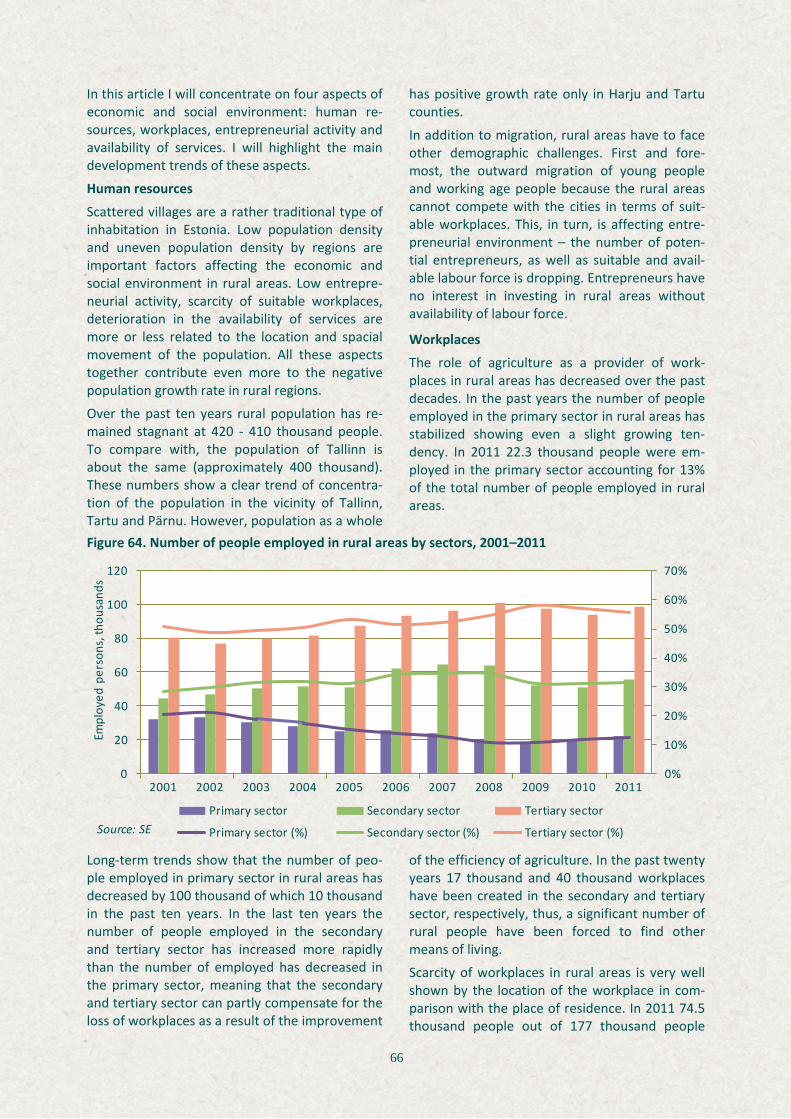
In this article I will concentrate on four aspects of economic and social environment: human re-sources, workplaces, entrepreneurial activity and availability of services. I will highlight the main development trends of these aspects.
Human resources
Scattered villages are a rather traditional type of inhabitation in Estonia. Low population density and uneven population density by regions are important factors affecting the economic and social environment in rural areas. Low entrepre-neurial activity, scarcity of suitable workplaces, deterioration in the availability of services are more or less related to the location and spacial movement of the population. All these aspects together contribute even more to the negative population growth rate in rural regions.
Over the past ten years rural population has re-mained stagnant at 420 - 410 thousand people. To compare with, the population of Tallinn is about the same (approximately 400 thousand). These numbers show a clear trend of concentra-tion of the population in the vicinity of Tallinn, Tartu and Pärnu. However, population as a whole
has positive growth rate only in Harju and Tartu counties.
In addition to migration, rural areas have to face other demographic challenges. First and fore-most, the outward migration of young people and working age people because the rural areas cannot compete with the cities in terms of suit-able workplaces. This, in turn, is affecting entre-preneurial environment – the number of poten-tial entrepreneurs, as well as suitable and avail-able labour force is dropping. Entrepreneurs have no interest in investing in rural areas without availability of labour force.
Workplaces
The role of agriculture as a provider of work-places in rural areas has decreased over the past decades. In the past years the number of people employed in the primary sector in rural areas has stabilized showing even a slight growing ten-dency. In 2011 22.3 thousand people were em-ployed in the primary sector accounting for 13% of the total number of people employed in rural areas.
Figure 64. Number of people employed in rural areas by sectors, 2001–2011
Long-term trends show that the number of peo-ple employed in primary sector in rural areas has decreased by 100 thousand of which 10 thousand in the past ten years. In the last ten years the number of people employed in the secondary and tertiary sector has increased more rapidly than the number of employed has decreased in the primary sector, meaning that the secondary and tertiary sector can partly compensate for the loss of workplaces as a result of the improvement
of the efficiency of agriculture. In the past twenty years 17 thousand and 40 thousand workplaces have been created in the secondary and tertiary sector, respectively, thus, a significant number of rural people have been forced to find other means of living.
Scarcity of workplaces in rural areas is very well shown by the location of the workplace in com-parison with the place of residence. In 2011 74.5 thousand people out of 177 thousand people
0%
10%
20%
30%
40%
50%
60%
70%
0
20
40
60
80
100
120
2001 2002 2003 2004 2005 2006 2007 2008 2009 2010 2011
Empl
oyed
per
sons
, tho
usan
ds
Primary sector Secondary sector Tertiary sector
Primary sector (%) Secondary sector (%) Tertiary sector (%)Source: SE
66

employed (42%) in rural areas worked in the rural municipality of their place of residence. The fig-ure shows a steady decrease in the number of people working and living in the same rural mu-nicipality. The turning point was 2005 when the
number of people whose workplace was outside the rural municipality of their place of residence exceeded those working in the rural municipality of their place of residence.
Figure 65. People employed in rural areas by the location of their main workplace, 2001–2011
Structural unemployment is another problem in addition to the scarcity of workplaces. It shows that vocational qualification and education of employees are not in confirmity with the actual needs of employers. In general, it is more difficult for people with lower educational level or people without vocational or professional qualification to find a job. Lack of qualified workforce in rural areas is a result of the againg of the labour force and access of the working-age population to ob-taining a qualification. The educational level of 27.3 thousand working age people in rural areas is below upper secondary education, the educa-tional level of 115.7 thousand people is upper secondary education and 57.1 thousand people have obtained tertiary education (vocational courses after secondary education and higher education) of which 20.4 thousand, 102.6 thou-sand and 54.1 thousand are employed, respec-tively. These numbers show very clearly that scarcity of labour force has become a challenge for rural entrepreneurship.
Creation of workplaces is important in terms of development of rural areas; therefore, complex
approach has to be taken by investing in human resources and providing incentives fostering en-trepreneurial activity and diversity. The Ministry of Agriculture has made a contribution in the development of human resources and entrepre-neurship through different rural development action plans and is planning to continue doing so in next programming period.
Rural entrepreneurship
Analysis of entrepreneurship shows that the de-velopment is similar to the population trends – entreprises are concentrating in the cities, pre-liminarily in the region of the capital city. Almost 100 thousand economically active entrepreneurs in Estonia are located in Tallinn and a third in the rural areas. However, the importance of rural entrepreneurs has remained relatively stagnant over the years. In 2004 there were 19.5 thousand economically active entrepreneurs in rural areas whereas by 2011 their number had increased twofold to 36 thousand economically active en-trepreneurs.
-10%
0%
10%
20%
30%
40%
50%
60%
70%
2001 2002 2003 2004 2005 2006 2007 2008 2009 2010 2011
Same municipality as place of residence TownOther municipality than place of residence TallinnRural settlement
Source: SE
67
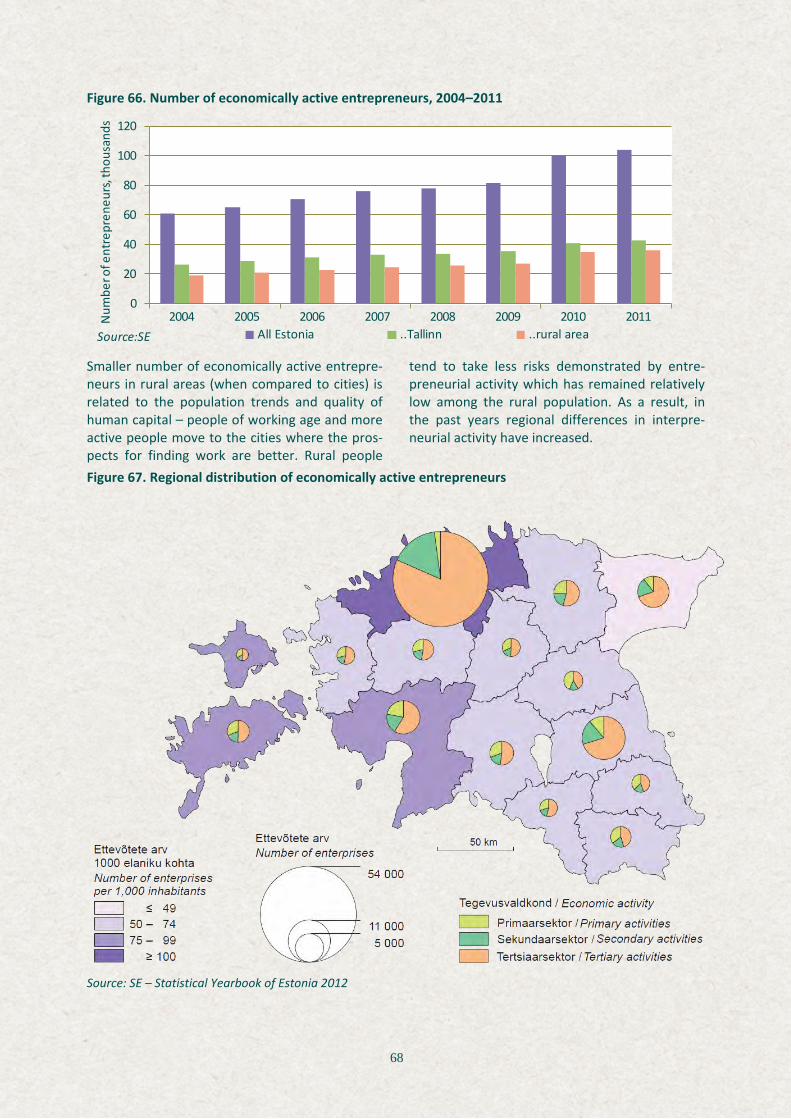
Figure 66. Number of economically active entrepreneurs, 2004–2011
Smaller number of economically active entrepre-neurs in rural areas (when compared to cities) is related to the population trends and quality of human capital – people of working age and more active people move to the cities where the pros-pects for finding work are better. Rural people
tend to take less risks demonstrated by entre-preneurial activity which has remained relatively low among the rural population. As a result, in the past years regional differences in interpre-neurial activity have increased.
Figure 67. Regional distribution of economically active entrepreneurs
Source: SE – Statistical Yearbook of Estonia 2012
0
20
40
60
80
100
120
2004 2005 2006 2007 2008 2009 2010 2011All Estonia ..Tallinn ..rural areaSource:SE
Num
ber o
f ent
repr
eneu
rs, t
hous
ands
68

Similarily to employment the number of non-agricultural enterprises has increased accounting for almost two thirds of the active enterprises in rural areas. Employment data by sectors have been given above. The number of people em-ployed in the secondary and tertiary sector has considerably increased over the past years, con-tributing to 88% of all areas of activity in rural areas in 2010. However, employment in the ser-vice economy has grown at the fastest pace, which is a positive trend as the service sector has a bigger potential for creating attractive work-places.
Agricultural producers are also diversifying into non-agricultural activities more actively. In 2007 8% of the agricultural holdings were engaged in non-agricultural activities in addition to agricul-ture whereas by 2010 the relevant indicator had increased to 13%. Diversification is a good oppor-tunity for an agricultural holding to increase the competitiveness of the holding, reduce risks and create additional income.
In rural areas diversification is supported by natu-ral resources and cultural heritage and entrepre-neurs should make better use of these competi-tive advantages. Taking into consideration the global trends of consumption and changes in the behavior of people and an increasing demand for food, it is evident that agriculture, as well as other areas based on sustainable use of natural resources and value added eco-friendly products and networking in these areas, have got future. Also, it is important to mobilize available konowl-edge and competence and make use of the com-petitive advantage of each region.
Availablity of services
It was mentioned before that the total popula-tion of rural areas is almost the same as in Tal-linn. Access to services is directly related to the trends of population density and spacial move-ment of people, therefore, it is more complicated to maintain access to and the quality of services in sparsly populated areas. Thus, provision of services in remote areas is decreasing.
The State Audit Office has stated in an audit on availability of public services that the services provided in county centres are not easily accessi-ble to about 300 thousand people all over Esto-nia. One of the problems is poor connection be-tween centres and hinterlands, a result of weak capacity to provide services, transport, work-places etc. Weak capacity may result in a de-
crease in the role of traditional centres in terms of its hinterland, which has already been con-firmed by population trends.
Conclusions provided in the summary of the thematic planning of social infrastructure of the counties drafted by the Ministry of Interior show that availability of basic services in rural areas, particuilarly in remote areas has significantly de-creased. Remote areas are characterized by sparsely populated areas, ageing population, small number of service users and long distance from the places where services are provided. In fact, these are the same factors that make provi-sion of services more complicated and expensive. The same summary shows that access to child minding service, community centre, upper sec-ondary education and cash dispenser are the most problematic issues.
The results of a survey on the population of Esto-nian rural areas and social infrastructure services carried out by Geomedia in 2011 showed that 75% of rural centres had a community centre (clubhouses, civic and village centres etc) whereas only 22% of the remote areas had a community centre. The survey points out (as do a number of other surveys of the same type) that it is important to use the potential of community centres as service providers which means that additional functions have to be found for these centres. Ministry of Agriculture has contributed to this area through village renewal and devel-opment measure introduced in different pro-grammes. In the new programming period com-munity centres will be developed by means of community-based initiatives within the frame-work of the Rural Development Plan. The LEADER experience has demonstrated that local needs can be best targeted on local level, thus, solu-tions that work best for a particular region can be assessed locally.
E- services are an alternative to community ser-vices as the high rate of Broadband Internet con-nection and availability of the majority of public services on the Internet are the prerequisites for the provision of E- services as an alternative to community services. Internet creates better pos-sibilities for teleworking. In the situation where more than half of the people employed in rural areas do not work in the place of residence, teleworking is an option to save time and money, which normally would be spent on commuting. Instead, people can use their spare time for par-
69
ticipating in the activities of the community. Strong community and social participation are equally important prerequisites for rural devel-opment contributing to the preservation of valu-able human resources.
What are the main factors that make rural areas attractive enough to live there? First, possibilities to meet the basic needs such as workplace, edu-cation etc. However, additional values that make the rural environment pleasant – closeness to the nature and strong community are equally impor-tant. The above described aspects of entrepre-neurship and social environment have a long-term impact on the development of rural areas.
The Rural Development Report drafted by Esto-nian University of Life Sciences demonstrates that decrease in population, limited availability of economic possibilities and social services are rea-sons for leaving the rural areas, which in turn has an adverse impact on the competitiveness of rural areas. Provision of services becomes more expensive and access to services even more lim-ited, thus, more people are forced to leave the rural areas.
The population and economic services are con-centrating in larger centres. Is this inevitable or can it be avoided? What are the main instru-ments for halting the process? The main starting point has to be the people. It is necessary to have a workplace to earn sufficient income. It means that human resources have to be available to develop entrepreneurship and provide enter-prises with good quality labour.
Several resources are available that can be used more efficiently in economic activities in rural areas; however, it requires cooperation between different sectors and diversification of rural en-trepreneurship. It is important not to confront different components of rural development but find a balance between them.
These principles will form the basis for drafting the Rural Developmenent Plan of the program-ming period 2014-2020. The plan will concen-trate on the development of human resources, entrepreneurship and local communities. Unfor-tunately, rural development policy cannot solve all the above described problems, however, it will hopefully trigger the development of rural areas.
3.2. Results of the implementation of the measures of the Rural Development Plan 2007-2013 Mati Mõtte, Department of Rural Economy Research of Estonian University of Life Sciences
Last year of the implementation of the Estonian Rural Development Plan is about to begin. Axis 1 measures of the RDP are targeted at improving the competitiveness of the agricultural and for-estry sector, Axis 2 funding is aimed at improving the environment and the countryside and Axis 3 allocations are targeted at improving the quality of life in rural areas and diversification of the rural economy. Axis 4 measure of the RDP – LEADER approach is aimed at covering the re-gional needs through local action groups addi-tionally contributing to the implementation of the objectives of the measures of Axis I and III. The LEADER approach support scheme provides a possibility to apply for support from all the axes of the RDP.
In 2012 the RDP was amended for the sixth time. In the past years modifications have made in terms of measures, also, new sub-measures have been added. Based on the experience gained
within the five years of implementation of the RDP, the following modifications were made in 2012: the funding of the measures 1.1, 1.2, 1.3, 1.7 and 1.8 of Axis 1 was reallocated; funding allocation for measure 2.7 of Axis 2 - Natura 2000 support for private forest land was decreased and a new sub-measure 3.1.3 Investments in bio-energy production was included. In addition, im-plementation criteria and reference levels of output and result indicators were modified. The objective of modifications was to adjust the RDP to ensure suitability of the measures for meeting the defined objectives in the changed situation.
The total funding allocation of the RDP 2007-2013 is EUR 925,26 million. The funding alloca-tion for the Axes is EUR 887,14 million. The budget for technical assistance is EUR 38.12 mil-lion. The RDP 2007–2013 funding is co-financed from the EU Agricultural Fund of Rural Develop-ment (EAFRD) with overall budget allocation of
70
EUR 714.65 million and from the Estonian state budget with a total funding allocation of EUR 210.2 million.
As at 31.12.2011 EUR 259.95 million, 157.85 mil-lion and 109.48 million have been granted under Axes 1, 2 and 3, respectively; EUR 61.51 million has been granted for the LEADER approach. In 2011 spending of the total support granted under Axes 1, 2 and 3 and LEADER approach increased 34%.
In 2011 a total of EUR 51.54 million was paid to the beneficiaries under Axis 1 accounting for a 42% rise in comparison with 2010. A total of EUR 56.05 million including the funding of the RDP 2004-2006 from the EAFRD was paid to the bene-ficiaries under Axis 2 showing no change when compared to 2010. A total of EUR 23.05 million was paid to the beneficiaries under Axis 3 dem-onstrating a 28% rise on 2010. In 2011 a total of EUR 14.08 million was paid under LEADER ap-
proach accounting for a 42% increase on 2010. Implementation of the RDP has reached an active stage of spending.
Figure 68. Total support granted in the pro-gramming period, 2009–2011
3.2.1. Results of the implementation of the measures of Axis 1 and 3 of the RDP Risto Räisa, Department of Rural Economy Research of Estonian University of Life Sciences
Agricultural holdings have shown great interest in and need for applying for investment supports. 10,292 entrepreneurs and organiations submit-ted a total of 16,759 applications for the invest-ment support under Axis 1 and Axis 3 of the RDP within the period 2007-2011. The total support applied for was EUR 670.8 million. 78% of the applications for support were submitted under Axis 1 and 22% of the applications were submit-ted for Axis 3 support. The average cost of in-vestment projects of Axis 1 is smaller than the relevant indicator of Axis 3; therefore, 66% of the funding was applied for under Axis 1.
As a result of the activity of applicants and lim-ited funding the number of beneficiaries is sig-nificantly smaller than the number of applicants. In the period 2007-2011 the number of benefici-aries under Axis 1 and 3 measures of the RDP was 6,777 entrepreneurs and organizations (66% of the applicants). The total support granted for the beneficiaries was EUR 364.79 million accounting for 54% of the applied funding.
Figure 69. Cumulative number of submitted ap-plications, 2007–2011
The need of Estonian agricultural holdings for investments is significant, therefore, a number of holdings have been granted support from several measures of repeatedly from the same measure. On average, 36% of the approved applications were repeated applications. It is characteristic of measures 1.1 Training and information activities and 1.9 Setting up and development of producer groups that
0
50
100
150
200
250
300
2009 2010 2011Axis 1 Axis 2 Axis 3 Leader
Source: ARIB, EULS
mln €
0
2 000
4 000
6 000
8 000
10 000
12 000
14 000
2007 2008 2009 2010 2011Axis 1 Axis 3Source: ARIB, EULS
71

a small number of beneficiaries submit an appli-cation for support in several consecutive years. Measure 1.2 Setting up of young agricultural pro-ducers is different from other measures as in case of this measure an application for support can only be submitted once within the program-ming period. The share of repeated applications
account for 24% of the total approved applica-tions on average in case of the most popular measures 1.4.1 Investments into the develop-ment of micro agricultural holdings, 1.4.2 In-vestments in livestock buildings and 3.1 Diversifi-cation of the rural economy.
Figure 70. Number of approved applications and number of beneficiaries by measures, 2007–2011
In 2007-2011 16,759 applications for support were submitted of which 10,512 (63%) were ap-proved. Only 52% of the applications submitted under the investment measures (all measures except measures 1.1 Training and information activities and 1.3 Support for advisory system and services) were approved. The biggest competi-tion in applying for support was observed in case
of 1.5.2 Adding value to forestry products, 1.4.3 Investments in bioenergy production and 1.2 Setting up of young agricultural producers where only 39% of the submitted applications were ap-proved. At the same time all applicants under measure 1.9 and 95% of applicants under meas-ure 1.3 have been granted support.
Figure 71. Share of approved applications in total submitted applications, 2007–2011
The RDP provides target levels indicating the number of agricultural holdings to be supported under the implementation of the measures. In the situation where 2/3 of the time resource has been used, at least 2/3 of the target level of the beneficiaries has been achieved in case of most measures. The level of achievement of the target
level of beneficiaries was low in case of forestry, collaboration and cooperation (measures 1.5, 1.9 and 1.7) and measure 1.4.3. Applying for support and granting of funding under measures 1.6 Add-ing value to agricultural and non-wood forestry products, 3.1 and 1.2 was so active at the begin-
0%
25%
50%
75%
100%
0
1 000
2 000
3 000
4 000
1.3
1.4.
1
3.2
1.5.
1
1.1
3.1
1.2
1.4.
2
1.8
1.6
1.5.
3
1.5.
2
1.4.
3
1.9
1.7
Tota
l
Number of approved applications Number of beneficieries Share of repeated applications, %Source: ARIB, EULS
100%95%
73% 72%
62% 62% 60%55% 52% 48% 45%
41% 41% 39%
29%
63%
0%
20%
40%
60%
80%
100%
1.9
1.3
1.1
1.6
1.4.
1
1.4.
2
1.8
3.2
1.7
1.5.
3
3.1
1.5.
1
1.2
1.4.
3
1.5.
2
Tota
l
Source: ARIB, EULS
72

ning of the programming period that the number of beneficiaries is close to the 2013 target level.
Figure 72. Number of beneficiaries compared to the RDP target level, 2007–2011
In the period 2007–2010 a total of EUR 364.8 million was granted under Axis 1 and 3 measures aimed at making investments of a total of EUR 686.9 million. On average, the funding granted to the beneficiaries accounts for 53% of their total investment. Funding granted to the beneficiaries for investments into the development of micro agricultural
holdings and livestock buildings (measures 1.4.1 and 1.4.2) accounts for the biggest share of the total funding allocation from the RDP. Total funding granted for supporting the implementa-tion of these measures equated to 41% of the funding allocation of the RDP followed by meas-ures 3.1 and 3.2 Village renewal and develop-ment of Axis 3.
Figure 73. Total funding allocation and the average amount granted per beneficiary, 2007–2011
The average funding granted per beneficiary was EUR 53,828. Significant investments were made and thus, considerable funding per entrepreneur has been granted under measure 1.6, measure 1.4.2 and measure 1.7 (development of coopera-tion). The average funding granted per entrepre-neur was the smallest for measure 1.3 Support for advisory system and services and for forestry-related measures 1.5.1 and 1.5.3.
As at 31.12.2011 64% of the overall funding allo-cation totalling EUR 232.6 million has been spent.
Micro agricultural holdings are very active in car-rying out the investments with the help of the support paid out under measure 1.4.1. The share of payments of the funding allocation is most considerable under measure 1.2 Support for set-ting up of young agricultural producers and measure 1.3 Support for advisory system and services. This is related to the specific character of the measures in which case the funding is granted and the payment is made practically si-multaneously. In case of other measures the
0%
20%
40%
60%
80%
100%
0
500
1 000
1 500
2 000
2 500
3 000
3 500
1.6 3.1 1.2 1.4.2 1.3 1.4.1 1.8 1.5.2 1.7 1.5.1 1.5.3 1.9 1.4.3
Num
ber o
f ben
efici
arie
s
Reference level of the beneficiaries Number of beneficiaries Achievement of the reference levelSource: ARIB, EULS
0
100
200
300
400
0
20
40
60
80
1.4.
1
1.4.
2
3.1
3.2
1.6
1.8
1.2
1.5.
1
1.4.
3
1.3
1.5.
2
1.1
1.7
1.9
1.5.
3
Tota
l
Tota
l sup
port
gra
nted
, mill
ion
€
Total support granted Average amount of support per beneficiary Source: ARIB, EULS
Amou
nt o
f sup
port
, tho
usan
d €
73
payment is made after the investment has been implemented. The beneficiaries having been granted funding under measures 1.1, 1.6 and
1.5.3 have been quite slow in terms of carrying out the investments, and thus, payments have been made passively, too.
Figure 74. Share of expenditure of the overall allocation by measures (as at 31.12.2011)
Distribution of funding by counties
There is a total of 0.9 million ha of land eligible for support in Estonia. Agricultural area is the biggest in Lääne-Viru, Pärnu, Viljandi and Tartu counties. Total expenditure for supporting in-vestments in the same counties is also most con-siderable. In this analysis the national projects under measure 1.1 have been excluded as the area of investment cannot be defined, also, in-vestments made under measure 3.2 have not been taken into consideration as in most cases these are not considered as development of en-trepereneurship.
In order to assess the intensity of land use and the volume of support projects in a region, the overall funding allocation is divided by the area eligible for support or the number of beneficiar-ies. When dividing the overall allocation (EUR 295.5 million) by the area eligible for support we get EUR 320 per hectare. In Tartu, Valga and Võru counties the indicator is higher than the average and lower in Hiiu, Rapla and Järva counties.
Funding allocation per beneficiery shows the scope of investments planned by entrepreneurs. The overall funding allocation under the main investment measures is EUR 240 million and the number of beneficiaries is 2,154; thus, the aver-age funding granted for a beneficiery is EUR 11,439. The indicator is higher than the average in Järva, Jõgeva and Lääne-Viry counties and lower in Hiiu, Ida-Viru and Võru counties.
Figure 75. Total funding allocation by counties (million euros)
Figure 76. Total funding allocation by hectare of eligible area (euros)
95%88%
70%61% 60% 57%
51% 50% 49%45%
39% 37% 35%
1%
64%
0%
20%
40%
60%
80%
100%
1.2
1.3
1.4.
1
1.8
1.5.
1
3.2
1.4.
2
1.4.
3
3.1
1.5.
2
1.9
1.6
1.1
1.5.
3
1.7
Tota
l
Source: ARIB
74
Figure 77. Total funding allocation by benefici-ary (measures 1.4, 1.8 and 3.1, thousand euros)
Evaluation of the impact of supports according to the economic indicators of the beneficiaries
As one of the main objectives of the investment support of the RDP is improvement of the com-petitiveness of rural economy, it is important to evaluate the impact of supports on the economic indicators of the holdings. In order to evalute the economic performance of the beneficiaries the financial indicators of the beneficiaries of Axis 1 and Axis 3 of the RDP are compared to the rele-vant indicators of the whole crop production and livestock production sector on the basis of the data of Statistics Estonia. The results of the bene-ficiaries to whom payments had been made as at 31.12.2011 (the investment had been completed already) have been analysed.
Sales revenue, specific costs and overheads and net income are the most important indicators for the assessment of the economic results of an agricultural holding. Gross Value Added is calcu-lated as the difference between the value of total output and that of the intermediate consumption (except labour cost), which in terms of economy expresses directly the cost benefit.
Production should be profitable enough (produce value added) to have money available for cover-ing the cost of labour force, depreciation, as well as new investments and financial costs. If, as a result of investments the value of output in-creases and the specific costs and overheads re-lated to the output remain on the same level, Gross Value Added will increase and thus, en-ables to cover the labour costs and also, earn profit for new investments.
The economic indicators of agricultural holdings are significantly related to the macro economic situation, market prices and the climate condi-tions affecting production. In 2007-2010 the av-erage sales revenue of the beneficiaries, as well as the whole sector decreased by 3% a year on average. The impact of the economic crisis was most significant in 2008 and 2009. If the sales revenue drops abruptly in the situation of eco-nomic recession it would not possible for the holdings to decrease overheads propmtly (some-times it is not rational). In the development stage and the first years of investment the total farm-ing overheads increased, thus, in 2007-2010 the inputs of the beneficiaries increased more than the inputs in the sector on average. Therefore, the Gross Value Added of the beneficiaries dropped by 17% in a year on average in the pe-riod of observation showing a more significant decrease than decline in Gross Value Added in the sector on average. The sales revenue of the beneficiaries, as well as of the sector on average dropped in a situation where inputs had not de-creased at the same pace, therefore, net income of holdings decreased in the period under con-sideration (11% a year in case of beneficiaries and 16% in the whole sector on average). In the years of economic crisis it was more difficult for the beneficiaries to cope when compared to the secor on average whereas in the years before and after the crisis the economic results of the beneficiaries were better than that of the sector on average.
75

Figure 78. Comparison of the economic results of the beneficiaries with the average for the sector
The Gross Value Added of the beneficiaries of Axis 1 and Axis 3 of the RDP were analysed ac-cording to the FADN methodology by type of farming and economic size group. In line with an increase in Total Standard Output, Gross Value Added increases, however, an increase was not reflected in case of smaller holdings. Gross Value Added of seven smaller groups of Total Standard Output (production up to 0.1 million euros) was EUR 24.5 thousand per beneficiary on average and the indicator did not show significant in-crease in line with an increase in Total Standard Output. Gross Value Added started to increase after Total Standard Output had exceeded the level of EUR 0.1 million.
The average Gross Value Added of the holdings under survey was EUR 142,100. Gross Value Added was the highest in holdings of granivores type of farming and the lowest in field crop type of farming. The number of analysed holdings of horticulture and permanent crops type of farm-ing was less than ten; therefore, the results have to be addressed accordingly.
Supporting environmentally friendly manage-ment is one of the priorities of the CAP. As at 31.12.2011 payments had been made to a total
of 6,699 beneficiaries under Axis 1, 3 and 4 of the RDP of which 520 (8%) were approved organic agricultural producers. Organic producers under Axis 1 measures and measure 3.1 accounted for 14% of the total number of beneficiaries. The share of organic producers in the total number of beneficiaries under measures 1.4 and 1.2 was most significant contributing to almost 20% of the total number of beneficiaries.
According to the data of Statistics Estonia as at the end of 2010 there were 19,613 agricultural holdings of which 34% had been made payments under Axis 1, 3, and 4 of the RDP. 36% of the ap-proved organic agricultural producers of the total of 1,431 organic producers had been made pay-ments under Axis 1, 3, and 4 of the RDP. In con-clusion, the share of organic producers in the total number of beneficiaries was moderate, however, the importance of organic producers in the total number of RDP beneficiaries was similar to the importance of organic producers in the total number of agricultural holdings. Funding allocation for organic producers accounted for 7% of the total funding allocation for the benefi-ciaries (EUR 423.2 million).
200 000
250 000
300 000
350 000
400 000
450 000
500 000
2007 2008 2009 2010
Sale
s re
venu
e
50 000
100 000
150 000
200 000
250 000
300 000
2007 2008 2009 2010
Gro
ss V
alue
Add
ed
Beneficiaries of Axis 1 and Axis 3 of the RDP Average for agricultural sector Source: EULS, SE
200 000
250 000
300 000
350 000
400 000
450 000
500 000
2007 2008 2009 2010
Inpu
ts
-20 000
0
20 000
40 000
60 000
80 000
100 000
2007 2008 2009 2010
Net
inco
me
76
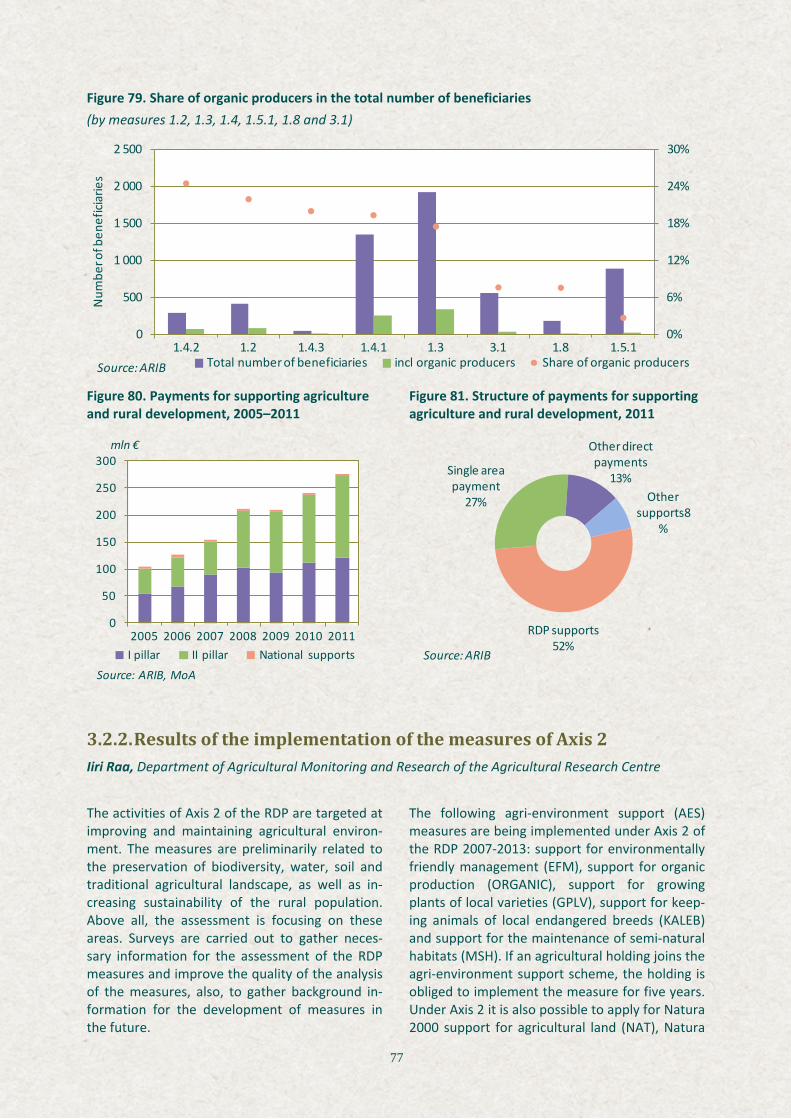
Figure 79. Share of organic producers in the total number of beneficiaries (by measures 1.2, 1.3, 1.4, 1.5.1, 1.8 and 3.1)
Figure 80. Payments for supporting agriculture and rural development, 2005–2011
Figure 81. Structure of payments for supporting agriculture and rural development, 2011
3.2.2. Results of the implementation of the measures of Axis 2 Iiri Raa, Department of Agricultural Monitoring and Research of the Agricultural Research Centre
The activities of Axis 2 of the RDP are targeted at improving and maintaining agricultural environ-ment. The measures are preliminarily related to the preservation of biodiversity, water, soil and traditional agricultural landscape, as well as in-creasing sustainability of the rural population. Above all, the assessment is focusing on these areas. Surveys are carried out to gather neces-sary information for the assessment of the RDP measures and improve the quality of the analysis of the measures, also, to gather background in-formation for the development of measures in the future.
The following agri-environment support (AES) measures are being implemented under Axis 2 of the RDP 2007-2013: support for environmentally friendly management (EFM), support for organic production (ORGANIC), support for growing plants of local varieties (GPLV), support for keep-ing animals of local endangered breeds (KALEB) and support for the maintenance of semi-natural habitats (MSH). If an agricultural holding joins the agri-environment support scheme, the holding is obliged to implement the measure for five years. Under Axis 2 it is also possible to apply for Natura 2000 support for agricultural land (NAT), Natura
0%
6%
12%
18%
24%
30%
0
500
1 000
1 500
2 000
2 500
1.4.2 1.2 1.4.3 1.4.1 1.3 3.1 1.8 1.5.1
Num
ber o
f ben
efici
arie
s
Total number of beneficiaries incl organic producers Share of organic producersSource: ARIB
0
50
100
150
200
250
300
2005 2006 2007 2008 2009 2010 2011I pillar II pillar National supports
Source: ARIB, MoA
mln €
RDP supports52%
Other supports8
%
Other direct payments
13%Single area payment
27%
Source: ARIB
77

2000 support for private forest land (NAF), sup-port for less-favoured areas (LFA), support for animal grazing with one year obligation (AG), support for the establishment and restoration of stonewalls (ERS).
Support for environmentally friendly manage-ment accounted for the most significant share (41%) in the spending under Axis 2 of the RDP, followed almost equally by payments for the support for organic production and support for less-favoured areas (18% and 16%, respectively). The importance of the spending under other measures of Axis 2 of the RDP was less than 10%.
Almost all target levels for the measures of Axis 2 to be met by the end of the programming period have been achieved, in some cases even ex-ceeded (eg the number of beneficiaries of the support for grazing animals). In case of some measures it can already be seen that the target level will not be met (eg support for Sangaste rye under growing plants of local varieties).
In addition to observing the number of benefici-aries, in terms of environment it is even more important to monitor the number of supported livestock, as well as utilized agricultural area and land use regarding the implementation of the requirements of the support. In 2011 the area covered by agri-environment support accounted for 61% of the total area of Single Area Payment (SAP, 893,519 ha).
Under the measure “Support for keeping animals of local endangered breeds” keeping of a total of 2,812 Estonian horses, Tori horses, Estonian heavy draughts and Estonian native cattle was supported. Support for grazing animals was used for the grazing of 123,787 livestock.
In 2007-2011 the area covered by support for environmentally friendly production/manage-ment has decreased, whereas the area of support for organic production has constantly been in-creasing and thus, the total area covered by Agri-environment support (AES) has remained quite stable. The share of AES area in the total SAP area is quite different by counties. The share of total AES area in SAP area is the biggest in Hiiu county (91% of the SAP area) and the smallest in Harju county (44%). Comparison to 2010 shows that the total AES area has decreased in Harju, Ida-Viru and Pärnu counties.
Figure 82. Distribution of payments under Axis 2, 2011
Figure 83. Progress on implementation of target levels of Axis 2 of the RDP 2007–2013, 2011 (target level progression, %)
Figure 84. The area covered by support, 2011
EFM41%
ORG18%
LFA16%SAG
9%
MSH7%
NAF6%
Source: ARIB, ARC
Other supports
3%
0%
20%
40%
60%
80%
100%
120%
140%
LFA NAT NAF EFM ORG MSHBeneficieries Supported areaSource: ARIB, ARC
0
100
200
300
400
500
600
NAT MSH NAF ORG LFA EFM AES
Source: ARIB, ARC
thousand ha
78

The share of the area covered by support for en-vironmentally friendly management (EFM) in the total area of SAP is the biggest in Lääne-Viru, Järva, Jõgeva and Põlva counties and relatively modest in the counties characterized by more extensive production (Saare, Lääne, Hiiu coun-ties) where the area covered by the support for organic production and support for the mainte-nance of semi-natural habitats is larger. The land use analysis shows that the area of utilized agri-cultural area and permanent grassland is almost the same in case of holdings using the support for organic production whereas in case of holdings of EFM support the area of utilized agricultural area is 5.5 times bigger than the area of permanent grassland.
For the evaluation of the support measures dif-ferent environmental aspects are surveyed. Data gathered in the course of different national monitoring programmes and statistics are used for the analyses. Often the data gathered within the national programmes are insufficient, there-fore, the Rural Economy Research Centre as the permanent evaluator of Axis 2 of the RDP has carried out monitoring and research regarding the agri-environment support scheme since 2004 in five main thematic areas (soil, water, biodiver-sity, landscape and social economy). In addition, traditional and agri-environment support prac-tices are compared within the framework of a complex study of scientific experiments. A selec-tion of the results of the studies on soil, water, biodiversity is provided below.
Soil
Soil is an important natural resource and without that resource plant production is impossible. Therefore, it is cruicial to monitor the status of soil and study the impact of agricultural produc-tion on soils in order to prevent negative tenden-cies. The results of the soil fertility study 2010-2011 show that implementation of agri-environment support measures has had a posi-tive effect on the agro-chemical indicators. The final evaluation can be provided after repeated soil sampling and analysis in 2012.
Analysis of the residues of plant protection prod-ucts shows that after three years of use 2/3 of the soils of the fields subject to monitoring con-sist of some type of residue of a plant protection product. In 2011 the presence of fungicide resi-dues increased considerably, also, the content of residues in certain fields was higher than the
relevant target value. In general, concentrations of agents have been quite low in the past years. In 2009-2010 the maximum amount of residues was 0.25 mg/kg, in most cases less than 0.05 mg/kg.
In addition to soil surveys the ARC has analysed soil fertility and the quality of land in terms of different land use. The objective of the survey was to identify the quality of soils and land use on five different land use levels and assess their suitability for agricultural activity. For the identi-fication of possible differences all permanent grasslands were assessed, including those per-manent and natural grasslands the own-ers/managers of which did not have livestock. Assessment of the soil fertility of different land use levels and suitability of soils for agricultural activity shows that 78% of the land covered by SAP was well suited for agricultural activities. The relevant indicator was 90% in case of the fields that participated in the arable soils competition in 2011. 2.5%, i.e 25,000 ha of the land covered by SAP was poorly suited for agricultural activi-ties. The result of the analysis showed that the soils of permanent grassland and so-called fields for biodiversity were considerably more wet in comparison with other type of agricultural area. Soils with moderate moisture were mostly char-acteristic to arable land, also, the area with poor soil structure was smaller in case of these fields.
Water environment
The objective of the survey on the content of plant nutrition elements in drainage water was to assess the impact of the implementation of the environmentally friendly management and or-ganic production measures on water environ-ment. The rate of leaching of nitrogen in water monitoring fields was fluctuating within a wide range in terms of years and fields. The figure shows annual leaching of nitrogen calculated as an annual average of niotrogen leaching from all the water monitoring fields subject to EFP/EFM and SAP support. The columns present relative fluctuations of nitrate ion concentration in 2006-2010 (100% - the basis for calculation is the aver-age of 1992-1994) – it is an extract from the re-sults of hydrochemical monitoring of rivers. As the number of water monitoring fields is very small, statistically reliable correlation is not avail-able. However, the trend is very logical – the big-ger the amount of nitrogen leaching from the fields, the more significant amount of nitrogen
79
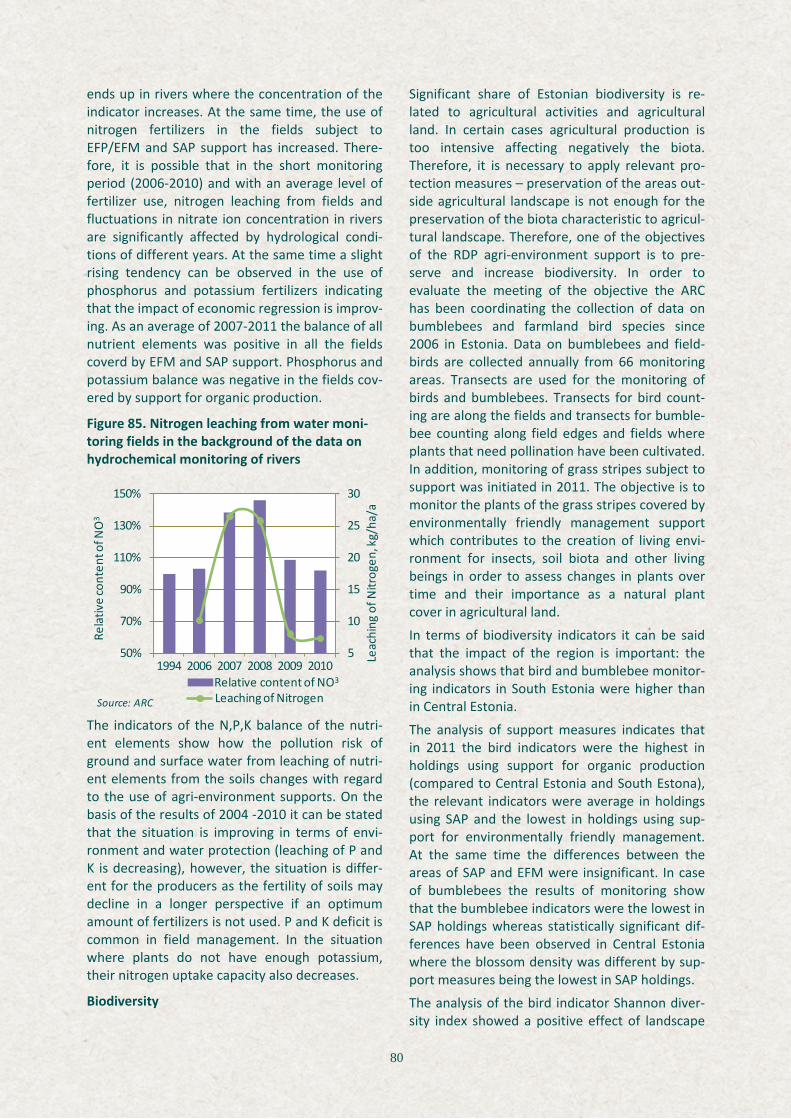
ends up in rivers where the concentration of the indicator increases. At the same time, the use of nitrogen fertilizers in the fields subject to EFP/EFM and SAP support has increased. There-fore, it is possible that in the short monitoring period (2006-2010) and with an average level of fertilizer use, nitrogen leaching from fields and fluctuations in nitrate ion concentration in rivers are significantly affected by hydrological condi-tions of different years. At the same time a slight rising tendency can be observed in the use of phosphorus and potassium fertilizers indicating that the impact of economic regression is improv-ing. As an average of 2007-2011 the balance of all nutrient elements was positive in all the fields coverd by EFM and SAP support. Phosphorus and potassium balance was negative in the fields cov-ered by support for organic production.
Figure 85. Nitrogen leaching from water moni-toring fields in the background of the data on hydrochemical monitoring of rivers
The indicators of the N,P,K balance of the nutri-ent elements show how the pollution risk of ground and surface water from leaching of nutri-ent elements from the soils changes with regard to the use of agri-environment supports. On the basis of the results of 2004 -2010 it can be stated that the situation is improving in terms of envi-ronment and water protection (leaching of P and K is decreasing), however, the situation is differ-ent for the producers as the fertility of soils may decline in a longer perspective if an optimum amount of fertilizers is not used. P and K deficit is common in field management. In the situation where plants do not have enough potassium, their nitrogen uptake capacity also decreases.
Biodiversity
Significant share of Estonian biodiversity is re-lated to agricultural activities and agricultural land. In certain cases agricultural production is too intensive affecting negatively the biota. Therefore, it is necessary to apply relevant pro-tection measures – preservation of the areas out-side agricultural landscape is not enough for the preservation of the biota characteristic to agricul-tural landscape. Therefore, one of the objectives of the RDP agri-environment support is to pre-serve and increase biodiversity. In order to evaluate the meeting of the objective the ARC has been coordinating the collection of data on bumblebees and farmland bird species since 2006 in Estonia. Data on bumblebees and field-birds are collected annually from 66 monitoring areas. Transects are used for the monitoring of birds and bumblebees. Transects for bird count-ing are along the fields and transects for bumble-bee counting along field edges and fields where plants that need pollination have been cultivated. In addition, monitoring of grass stripes subject to support was initiated in 2011. The objective is to monitor the plants of the grass stripes covered by environmentally friendly management support which contributes to the creation of living envi-ronment for insects, soil biota and other living beings in order to assess changes in plants over time and their importance as a natural plant cover in agricultural land.
In terms of biodiversity indicators it can be said that the impact of the region is important: the analysis shows that bird and bumblebee monitor-ing indicators in South Estonia were higher than in Central Estonia.
The analysis of support measures indicates that in 2011 the bird indicators were the highest in holdings using support for organic production (compared to Central Estonia and South Estona), the relevant indicators were average in holdings using SAP and the lowest in holdings using sup-port for environmentally friendly management. At the same time the differences between the areas of SAP and EFM were insignificant. In case of bumblebees the results of monitoring show that the bumblebee indicators were the lowest in SAP holdings whereas statistically significant dif-ferences have been observed in Central Estonia where the blossom density was different by sup-port measures being the lowest in SAP holdings.
The analysis of the bird indicator Shannon diver-sity index showed a positive effect of landscape
5
10
15
20
25
30
50%
70%
90%
110%
130%
150%
1994 2006 2007 2008 2009 2010 Leac
hing
of N
itrog
en, k
g/ha
/a
Rela
tive
cont
ent o
f NO
3
Relative content of NO3Leaching of NitrogenSource: ARC
Relative content of NO3
80

elements in the monitoring area of Central Esto-nia: presence of landscape elements (eg stone heaps, single trees, ditches) in the monitoring area increased the species richness. The analysis indicated that the area of landscape elements in the transects in Central Estonia was smaller than in South Estonia. It probably means that the im-pact of landscape elements on species richness is more significant in Central Estonia where the landscape is more open than in South Estonia where it is more diverse.
The analysis did not show any statistically reliable between-year decrease or increase in bird indica-tors by types of support in any of the support types and monitoring areas. Thus, according to the bird monitoring data 2010-2011 of the Agri-cultural Research Centre the status of birds can be considered stable in all support measures.
For more detailed information about the results of the studies look at the homepage of the Agri-cultural Research Centre http://pmk.agri.ee/pkt.
3.3. Impact of research and development on the development of the agricultural and food sector
3.4. Overview of the preparations for the RDP 2014-2020 Marko Gorban, Rural Development Department of the Ministry of Agriculture
The European Commission published its propos-als on the Common Agricultural Policy (CAP) a year ago. The underlying idea of the proposals of the CAP reform package is to improve the effi-ciency of the current policy to ensure competitive and sustainble agriculture and viable rural areas. Currently the negotiations are being actively held and the first agreements are expected to be con-cluded by the end of 2012.
Simultaneously, development of a new rural de-velopment plan (Rural Development Plan 2014-2020, in short: RDP 2014-2020) has been in pro-gress for one and a half year. A great part of the analytical work and strategical choices have been made. However, a lot is yet to be done, first and foremost, in terms of the content of the meas-ures, also, decisions about supports – areas of activity, eligibility criteria, volumes, forms – are going to be made in the following months.
The following will provide an overview of the most important trends of the rural development policy on the EU level, the current status of nego-tiations and the impact of the process on the development of the RDP 2014-2020. Also, I will describe the process of the development the RDP 2014-2020, the strategic decisions made and the most important activities to be carried out in the nearest future.
Negotiations about the rural development pol-icy on the EU level
The framework foresees that in the EU the CAP should retain its common policy of financing and maintain the two pillar structure with the budget for first CAP pillar covering direct payments and market measures and the second pillar rural de-velopment measures.
One of the most significant developments in the rural development policy in the new program-ming period concerns planning. In line with the proposed EU legal acts the planning of the rural development policy and other policies should become more strategic and stand shoulder to shoulder with one other. The Europe 2020 strat-egy agreed on the EU level, defines the objectives of the new programming period in the area of employment, research, energy, climate and edu-cation and reduction of poverty. This strategy shoud be the basis for the common budget and policies of different areas. In order to increase coherence between rural development policy and other EU policies the strategical parts of the policies will be planned together. Rural develop-ment policy is included in the Common Strategic Framework together with the European Regional Development Fund, the European Social Fund, the Cohesion Fund and the European Maritime
81

and Fisheries Fund. In the course of this process partnership contracts will be negotiated with the European Commision and agreed for each Mem-ber State.
As the needs of the rural areas are considerably wider than the scope and possibilities of the CAP,
the Common Strategic Framework of policies provides a good basis for integrated planning of the state as a whole, including rural areas as one of the most important part of any state.
Figure 86. Rural development policy as a part of the Common Strategic Framework
Source: A short guide to the European Commission’s proposals for EU rural development after 2013, European Commission, DG AGRI, ENRD
The strategic approach of the rural development policy shall be pursued through common priori-ties for rural development policy defined and agreed upon on the EU level which is a combina-tion of the CAP and the Europe 2020 strategy objectives:
• Fostering knowledge transfer and innovation in agriculture, forestry, and rural area;
• Enhancing competitiveness of all types of ag-riculture and enhancing farm viability;
• Promoting food chain organisation and risk management in agriculture;
• Restoring, preserving and enhancing ecosys-tems dependent on agriculture and forestry;
• Promoting resource efficiency and supporting the shift towards a low carbon and climate re-silient economy in agriculture, food and for-estry sectors;
• Promoting social inclusion poverty reduction and economic development in rural areas.
These priorities should be the basis for pro-gramming for the member states. It is character-istic of the rural development policy that a rela-tively significant part of the framework is defined on the EU level, including the measures and gen-eral rules. The current rural development meas-ures defined on the EU level shall be integrated (eg different agricultural investment supports, entrepreneurship supports and forestry sup-ports), thus decreasing the number of these measures. At the same time, the member states are still quite flexible in choosing and designing the measures that suit them best.
The Commission proposals for the new pro-gramming period foresee defining of the areas with specific natural constraints (current LFA) according to new objective criteria. It is a positive development for Estonia meaning an increase in the LFA area, however, several large member states have to consider decrease in or relocation of the LFA areas, therefore, it is one of the most sensitive topics in the negotiations on the EU level and it is difficult to reach an agreement.
Unlike the previous “menu of measures” of the RDP an individual measure has been introduced for organic farming. Agro-environmental support is still obligatory for member states. Risk man-agement instruments have been added to the rural development policy measures. The current cooperation measure has been expanded in terms of the activities and beneficiaries of short-supply chains and direct marketing. Also, LEADER and networking approach play an important role in the development of rural areas. Application of LEADER-approach in the rural development plan is still obligatory for member states; moreover, taking into consideration the positive experience it is possible to extend the use of the method to other funds. The proposals on the reform include European Innovation Partnership targeted at resource efficiency, strengthening the linkages between research and agriculture and fostering innovation.
As it can be understood from above, no major changes in rural development policy have been introduced in terms of the content. However, it is
Common Agricultural policy
Common Strategic Framework
Partnership contract
I pillar (EAGF): Market measures
Other CSF funds: CF, ERDF, ESF, EMFF
II pillar (EAFRD): Rural development policy
82

not exactly the case in financing. According to the initial proposals of the European Commission financing of the rural development policy should generally be maintained in the same scope ac-counting for less than a quarter of the total CAP funding.
At the same time, it has been proposed to reallo-cate rural development resources among mem-ber states to some extent in line with the new priorities. Initially the reallocation scenarios on the negotiations table had a quite negative per-spective for Estonia; however, currently another scenario is being discussed which does not fore-see major reallocation of resources among mem-ber states. Very likely the funds for the member states will not increase or decrease more than 10%.
The EU allocated 50.9 million euros for co-financing of the EU pre-accession programme SAPARD, 206.7 million euros for the Rural Devel-opment Plan 2004-2006 and for the agriculture and rural development priority of the National Development Plan 2004-2006. The funding allo-cation increased to 723.7 million euros for the current period. Therefore, if the rural develop-ment funds are decreased by 10%, for us the funds will still be many times larger than in previ-ous programmes.
However, limited resources mean that clear choices have to be made in terms of supporting the activities. The following will give an overview of the selection process and trends of the RDP 2014-2020
Figure 87. The EU funding allocation for Estonian rural development since 2000
Development progress of the Rural Develop-ment Plan 2014-2020
Drafting of the RDP 2014-2020 was initiated by the Ministry of Agriculture in spring 2011. The
first step of the process was mapping of the im-pact areas of the rural development policy. Next step was compiling of the analysis of the situa-tion in these areas. As soon as it was completed discussions with the partners were initiated in terms of the RDP 2014-2020.
One of the most important components of the RDP 2014-2020 is participation. A steering com-mittee was set up including 29 different organiza-tions representing agriculture, environment, for-estry, entrepreneurship, local municipalities, vil-lage movement, local initiative etc in order to carry out consultations with partners on drafting the the RDP 2014-2020. In addition to participa-tion in the drafting of the RDP 2014-2020, the steering committee also supports the Ministry of Agriculture in forming the positions for the nego-tiations with the EU on rural development policy, as well as gives input for the partnership agree-ment in the areas of agriculture and rural devel-opment.
As a result of descibing and discussing the situa-tion of the RDP 2014-2020 with partners, eight key areas were pointed out to focused on in the development of the RDP 2014-2020:
· Innovation and knowledge transfer; · Competitiveness; · Age structure; · Functioning food chain · Land use; · Environment; · Rural entrepreneurship and workplaces; · Local initiative. Taking into consideration the situation analysis and discussions with social partners on the chal-lenges of the afore named areas the following targets and objectives were defined for the year 2020:
· Strengthening and developing linkages between producers, manufacturers, advisors and scien-tists by promoting knowledge transfer and im-plementing innovation and research results in advisory services and production process
· Increasing competitiveness and resource effi-ciency of agricultural sector targeted at sustain-able food production
· Creating conditions for sustainable age struc-ture in agricultural sector
· Strengthening market position of enterprises engaged in producing and processing of agricul-tural products and improving horizontal and
0100200300400500600700800
2000-2004 2004-2006 2007-2013 2014-2020Source: MoA
mln €+10%
+10%
83

vertical cooperation in producing, processing and marketing of agricultural products
· Guaranteeing agricultural land use, which is purposeful, retains soil fertility, is environmen-tally-friendly and takes into account regional specifities
· Preserving high nature value agriculture and forestry, biodiversity and traditional landscapes through promotion of favourable production methods
· Fostering diversification of agriculture and rural areas providing alternative employment oppor-tunities for people disengaged from agriculture and promoting quality of life
· Promoting local initiative and targeting it to solutions based on local resources and potential in developing local living and enterprise envi-ronment
Today a selection from the “menue of measures” of the EU rural development regulation has been made, thus, measures contributing to the achievement of the RDP 2014-2020 objectives have been identified. Currently the content of the measures is being designed identifying the target groups, eligible activities, selection criteria for the ranking of projects, amounts and rates of support and regions for the application of the funds of the measures. Like all other stages of the drafting of the RDP, elaboration of the content is also based on the participation principle. Partici-pation in the content designing process involves even more resources – in addition to the steering committee, experts and representatives from 30 more organizations are involved. Thus, approxi-mately 60 different organizations are participat-ing either directly or indirectly in the develop-ment of the RDP 2014-2020.
Figure 88. Stages of drafting the RDP 2014–2020
The following section gives an overview of the main focus of the objectives and trends of the measures to be addressed to.
In terms of knowledge transfer the topics to be targeted at are related to low reseach and devel-opment and innovation expenditure, limited co-operation between producers, advisors and sci-entists, as well as access to professional advice. These areas will be addressed through provision of trainings, advisory services and cooperation.
In terms of competitiveness significant invest-ment need (particularly in the areas related to environmental requirements), low adjustment ability of small holdings, limited cooperation and major dependance on input prices are the prob-lems to be tackled. The aim is to continue with the provision of different agricultural investment supports and add a measure for supporting the development of small agricultural holdings. The age structure of agriculture is still not sustainable – there are 4 agricultural producers of 65 years of
age per every agricultural producer of the age under 35. Keeping this in mind, provision of sup-port for young farmers will be continued in the new programming period.
In terms of the functioning of the food supply chain low market power of producers and manu-facturers (compared to more concentrated trade), insufficient attention to product devel-opment and marketing, inadequate cooperation between different parts of the supply chain and low share of value added products in final prod-ucts have to be addressed. These issues will be targeted at by means of participation in quality schemes, establishment of producer groups, co-operation (different activities related to direct marketing and short supply chains) and support-ing investments into processing and marketing.
With regard to land use the status of land im-provement systems is an important problem to be addressed. We are in a situation where more than half of the agricultural land can only be used
Participation
Ex Ante evaluation of the RDP 2014-2020 (incl Strategic Environmental Assessment)
RDP 2014–2020
Description of the situation
RDP 2014–2020
Key areas
RDP 2014–2020 SWOT and objectives
RDP 2014–2020 Selection of
measures
RDP 2014–2020 Designing of
measures
84

with the help of functioning land improvement systems of which 70% were constructed more than 30 years ago. Thus, provision of support for land improvement systems will be continued in the new programming period. Both with regard to the environment and land use, attention has to be paid to the environmental impact of agri-culture (on soil, water, biodiversity) which will be targeted by means of environmental support and support for organic production and animal wel-fare. Several activities aiming at active forest management will be continued.
In terms of rural economy the issues concerning scarcity of people and workplaces, low entrepre-neurial activity and limited availability of services have to be addressed to. The RDP 2014-2020 contributes to these shortcomings by supporting investments into diversification; also, other policy measures play an important role in this area. Improvement of local initiative will be supported by means of LEADER approach.
The end of 2012 is of utmost importance in terms of CAP negotiations. A year after intensive nego-tiations there is readiness for agreements both on the budget and rural development policy,
however, not to the full extent. The date of con-clusion of these agreements will determine the beginning of the new programming period and launching of the new rural development pro-grammes in member states. At the same time, only a general framework can be agreed upon on the EU level, rural development policy in member states will still be implemented through rural development plans and the final content of these plans will be designed by the member states ac-cording to their needs.
We are looking ahead and thus, we have been making preparations for the drafting of the RDP 2014-2020 already for a long time to be ready for the implementation of the RDP 2014-2020 in 2014. At this point we have completed the analy-sis of the situation, SWOT-analysis, defined the objectives and selected the measures. We are working on the details of the measures, which will be outlined by the end of 2012 and beginning of 2013. We consider the dialogue with all rele-vant parties a very important part of the work and expect to reach an agreement on common priorities and solutions to give boost to the de-velopment of rural areas.
85

Figure 89. Relation of the RDP 2014–2020 objectives to the EU rural development priorities and CAP general objectives
CAP objectives CAP II Pillar priorities RDP 2014-2020 objectives
Competitive food production
Sustainable management of
natural resources and climate action
Balanced territorial
development
Fostering knowledge transfer and innovation in
agriculture, forestry and rural areas
Enhancing competitiveness of all types of agriculture and
enhancing farm viability
Promoting food chain organization and risk
management in agriculture
Restoring, preserving and enhancing ecosystems dependent on agriculture
and forestry
Promoting resource efficiency and supporting the
shift towards a low carbon and climate resilient economy
in agriculture, food and forestry sectors
Promoting social inclusion poverty reduction and
economic development in rural areas
Strengthening and developing linkages between producers, manufacturers, advisors and
scientists by promoting knowledge transfer and implementing innovation and research results in
advisory services and production process
Fostering diversification of agriculture and rural areas providing alternative employment
opportunities for people disengaged from agriculture and promoting quality of life
Preserving high nature value agriculture and forestry, biodiversity and traditional
landscapes through promotion of favourable production methods
Guaranteeing agricultural land use, which is purposeful, retains soil fertility,
is environmentally-friendly and takes into account regional specifities
Strengthening market position of enterprises engaged in producing
and processing of agricultural products and improving horizontal and vertical cooperation in producing, processing nd marketing of agricultural products
Creating conditions for sustainable age structure in agricultural sector
Increasing competitiveness and resource efficiency of agricultural sector targeted
at sustainable food production
Promoting local initiative and targeting it to solutions based on local resources and
potential in developing local living and enterprise environment
86

OECD Indicators at the Service of Efficient Agricultural Policy Tiina Vares, European Union and Foreign Affairs Department of the MoA, Permanent Representation of Estonia to the OECD
Estonia became a member of the Organisation for Economic Co-operation and Development (OECD) in December 2010. The headquarters of the OECD are in Paris. OEDC has 34 member countries.
OECD is often referred to as the “rich countries' club”, the aim of the OECD is to strengthen democracy and enhance free market economy across the world. In the last century OECD was mainly focusing on economic policy whereas currently new methods are being explored to measure development, wealth and quality of the living environment.
The areas of activity of the OECD are collection of data, economic analysis, development of outlooks, exchange of information, measuring and comparing the performance of the policies of different sectors. In addition to the Economic Growth Index a number of new indicators have been developed, the combination of which aims at measuring “good life”.
OECD Secretariat is made up independent experts and scientists. Their reports are always waited for in OECD countries as they provide evaluations on the strengths and weaknesses of the applied policies. OECD proposes solutions and new policy guidelines. Member countries take the advice of OECD seriously as the organization has a history of contributing to better governing resulting in constant and measurable improvement of the quality of life. OECD reports include useful comparison tables and analysis contributing to measuring the process and pace of changes, which in turn, helps to lead the policy towards a desired direction.
OECD also provides analysis on the performance of agriculture. OECD has always provided guidelines in agriculture and not only in OECD countries. The OECD methodology is used for measuring the level of market distorting support in the WTO and thus, the methodology is used in all 157 WTO countries.
OECD methodologies define and measure different supports: subsidies, customs tariffs and export support, tax incentives, market price or consumer support, market measures. These indicators are constantly improved in cooperation with member countries. For example, OECD is working on the improvement of the indicators measuring environmental and innovation measures of agricultural support, as well as on recommendations for applying better systems for compensation for the damage of natural disasters. Currently, functioning of global food chain is being surveyed to improve provision of more reliable projections. Among other aspects, the reasons why higher food prices do not reach the pocket of the producer are being investigated. International comparative studies and overviews of different branches of the supply chain, as well as price formation mechanisms are used for presenting the analysis.
Estonia is also contributing to the surveys of OECD with statistics, unfortunately, national monitoring data are not available in all areas. In order to design better agricultural policies it is necessary to regularly collect more data from the agricultural sector and supply chain. This, in turn, means higher reporting load for the agricultural producer, supplier and the state sector. Agricultural policy of OECD countries is aiming at the reduction of supports. The Agricultural Policy Monitoring and Evaluation 2012 shows that the share of supports in the income of agricultural holdings is on the lowest level since OECD began measuring support – 19% on average, whereas supports in Japan account for nearly 60% and in New Zealand only for 2% of the average income of the producer. The structure and nature of supports is very different by countries. The share of production and trade distorting support has come down to 51%. To compare with: it was as high as 86% in 1986–1988.
87

Environmental measures account for a minor share of the total support expenditure. In addition, it has been stated that supports have to be related to the defined (measurable) nature conservation objectives. Also, OECD is criticising the agricultural risk management measures and recommends establishing a more regular and sustainable system for the compensation of the loss as a result of natural disasters (the current system is rather similar to putting out a fire). Since the post war period the productivity in agricultural sector in OECD countries increased approximately 2% a year, but not any more. OECD recommends these countries to increase the scope of investments. On average, public expenditures on agricultural research and development amount to about 1% of the agricultural value added in the OECD area. OECD is of the opinion that governments should support the growth in productivity and stimulate the innovative and financing potential of the private sector. The OECD recommends that future agricultural policy reforms should focus on addressing the policy priorities: pay more attention to the environment and sustainable use of land, water and biodiversity resources. In addition, agricultural policy should ensure farmers have available to them the tools necessary to manage their own farm risks to address unavoidable natural catastrophic losses. The OECD recommends increasing both public support and private incentives for the research and development and innovation systems across agriculture. Although the agricultural outlook is for relatively high food prices, the agricultural policy is facing greater pressure on limited resources compounded by the unpredicted effect of climate change and volatile market changes. At the same time fiscal consolidation across OECD countries stresses the urgency of improving the cost effectiveness of agriculture policies. Agricultural policy is changing at low pace and the results can been seen in a long period. Discussions about the trends of agricultural policy are continuing and the OECD indicators and guidelines will not go unnoticed. Estonia is participating in the work of the OECD agricultural analysis network since 2009. The data of the Estonian Farm Accountancy Data Network (FADN) have been included in the surveys on the risks of agricultural producers and risk management strategies, as well as on distribution of support and income of agricultural producers in selected OECD countries. A voluminous survey on sustainability of agricultural production is being prepared, and an analysis of the dairy sector has been initiated. In conclusion, another example about information: an OECD study on export capacity of agricultural products carried out in 2011 showed that 14 of the 20 most tradable processed agricultural products are made in Estonia. Sauerkraut and gingerbread cookies, among others, have the most rapid export potential. Surprisingly, sauerkraut is with the biggest value added export product in the world. Hopefully, this piece of information gives a good idea for some of our producers, but everyone is free to decide what to do with the information. Without OECD we might never get access to such useful pieces of information. OECD has hundreds and thousands of different bits of advice to be used for the “improvement” of the world. Estonia has not a long history as a member country of the OECD yet, therefore, we have to learn how to collect, disseminate and analyse information more efficiently in order to measurably improve our lives. Read about OECD at: http://www.oecd.org/about/ OECD Economic Surveys, Estonia: http://www.oecd.org/newsroom/estoniamustreformtowardagainstboombustcyclesoecdsays.htm OECD Agricultural Policy Monitoring and Evaluation. Report on estimations of agricultural support for OECD countries: http://www.keepeek.com/oecd/media/agriculture-and-food/agricultural-policy-monitoring-and-evaluation-2012_agr_pol-2012-en OECD Better Life Index, Estonia: http://www.oecdbetterlifeindex.org/countries/estonia/
88

Annexes Annex 1. Crop area of agricultural crops, 2004–2011
Unit 2004 2005 2006 2007 2008 2009 2010 2011 Total field crops 000 ha 495,6 560,7 539,0 579,6 577,4 566,6 602,0 585,3 Cereals 000 ha 261,0 282,1 280,3 292,3 309,3 316,4 275,3 297,0 Winter cereals 000 ha 38,0 33,7 33,9 59,0 70,9 69,7 68,2 70,9 Rye 000 ha 8,1 7,4 7,3 16,8 21,4 15,3 12,6 13,3 Winter wheat 000 ha 23,2 19,6 23,6 36,9 42,8 45,0 50,6 52,8 Winter barley 000 ha 0,2 0,5 0,5 0,9 0,8 1,4 1,0 0,3 Triticale 000 ha 6,5 6,2 2,5 4,4 5,9 8,0 4,0 4,5 Summer cereals 000 ha 223,0 248,4 246,4 233,3 238,4 246,7 207,1 226,1 Summer wheat 000 ha 55,2 65,8 67,3 62,6 64,8 68,6 68,8 75,6 Barley 000 ha 127,0 143,7 141,5 135,2 135,7 139,3 103,8 118,0 Oats 000 ha 35,4 33,7 32,6 31,5 34,2 36,1 30,4 28,4 Cereal mix 000 ha 5,1 4,5 4,9 3,7 3,3 2,6 3,8 3,8 Buckwheat 000 ha 0,3 0,7 0,1 0,3 0,4 0,1 0,3 0,3 Protein crops 000 ha 4,3 4,4 4,6 5,7 4,8 4,9 7,3 8,5 Industrial crops 000 ha 50,6 47,1 62,9 74,7 78,5 83,4 99,3 90,0 Oilseed rape 000 ha 50,4 46,6 62,5 73,6 77,7 82,1 98,2 89,0 Summer oilseed rape 000 ha 48,4 45,4 61,6 70,0 70,4 76,4 85,9 77,9 Winter oilseed rape 000 ha 2,0 1,2 0,9 3,6 7,3 5,7 12,3 11,1 Other industrial crops 000 ha 0,2 0,5 0,4 1,1 0,8 1,3 1,1 1,0 Potatoes 000 ha 16,1 14,0 11,5 11,1 8,7 9,1 9,4 9,2 Forage crops 000 ha 160,0 210,2 176,9 193,0 173,7 150,0 207,9 177,6 Vegetables outdoors ha 3 512 3 006 2 829 2 793 2 426 2 757 2 796 2 981 Cabbages ha 815 808 773 746 599 637 679 599 Cucumbers ha 256 242 218 199 176 184 220 228 Beet roots ha 386 362 302 320 261 318 311 390 Carrots ha 716 565 567 587 538 647 588 622 Bulb onions ha 403 301 249 246 230 232 238 230 Garlic ha 94 92 79 80 77 66 70 75 Green peas ha 152 120 114 102 94 121 133 102 Turnip ha 197 124 121 115 96 140 155 136 Other vegetables ha 493 392 406 398 355 412 402 599 Total vegetables under shelter ha 302 279 258 266 268 268 248 250 Cucumber ha 82 86 77 84 85 86 70 70 Tomatoes ha 197 167 159 159 160 159 152 153 Other vegetables ha 24 26 22 23 23 23 25 27 Total fruit and berry orchards ha 14 595 10 868 8 594 7 927 7 583 7 678 6 504 6 442 Apples and pears ha 8 895 6 538 5 118 4 331 4 039 4 222 3 319 3 329 Plums ha 1 298 836 623 569 538 540 449 441 Cherries ha 846 528 397 350 341 338 276 275 Red and white currants ha 994 671 480 402 446 402 384 347 Black currants ha 1 137 785 553 614 615 558 596 560 Gooseberries ha 589 362 264 230 231 231 183 183 Rasberries ha 382 328 299 210 220 219 266 245 Other ha 454 820 860 1 221 1 153 1 168 1 031 1 062 Strawberry production ha 1 095 865 814 648 564 597 589 599Source: SE
89

Annex 2. Production of agricultural crops, 2004–2011
Unit 2004 2005 2006 2007 2008 2009 2010 2011 Cereals 000 t 608,1 760,1 619,3 879,5 864,2 873,5 678,4 771,6 Winter cereals 000 t 101,1 107,9 89,6 230,6 254,1 209,7 184,6 204,3 Rye 000 t 18,1 20,4 17,8 61,0 65,6 39,1 25,0 31,0 Winter wheat 000 t 66,4 71,4 65,1 151,4 163,8 144,6 148,5 159,0 Winter barley 000 t 0,6 1,1 1,3 2,8 2,9 3,4 2,1 0,7 Triticale 000 t 16,0 15,0 5,4 15,4 21,8 22,6 9,0 13,6 Summer cereals 000 t 507,0 652,2 529,7 648,9 610,1 663,8 493,8 567,3 Summer wheat 000 t 130,2 192,0 154,5 194,4 178,7 197,9 179,1 201,2 Barley 000 t 292,9 365,6 301,4 359,9 346,2 373,6 252,7 294,3 Oats 000 t 72,7 84,2 63,6 85,2 77,5 86,5 54,5 62,8 Cereal mix 000 t 11,1 9,9 10,1 9,1 7,5 5,7 7,4 8,8 Buckwheat 000 t 0,1 0,5 0,1 0,3 0,2 0,1 0,1 0,2 Protein crops 000 t 3,3 5,7 5,5 9,5 3,3 7,6 12,6 15,5 Oilseed rape 000 t 68,6 83,1 84,6 133,3 111,1 136,0 131,0 144,2 Summer oilseed rape 000 t 65,6 80,7 83,1 126,5 97,5 126,5 109,3 124,4 Winter oilseed rape 000 t 3,0 2,4 1,5 6,8 13,6 9,5 21,7 19,8 Potatoes 000 t 166,5 209,8 152,6 191,8 125,2 139,1 163,4 164,7 Forage vegetables 000 t 6,7 3,1 2,0 3,4 0,4 0,7 0,3 0,5 Forage crops 000 t 1 898,9 2 325,6 1 683,2 2 350,1 2 351,1 1 917,2 2 338,5 2 152,0 Vegetables outdoors t 44 067 50 723 48 893 57 386 50 743 59 127 59 180 74 122 Cabbages t 16 586 17 803 19 223 19 095 19 924 18 770 16 635 20 987 Cucumbers t 2 113 4 028 4 370 3 490 1 910 3 690 5 047 5 138 Beetroots t 4 692 6 276 5 648 6 914 5 440 7 158 5 835 9 458 Carrots t 14 623 15 579 13 357 20 126 15 556 20 885 22 817 24 517 Bulb onions t 2 494 2 168 1 994 1 353 2 440 1 914 2 155 1 301 Garlic t 369 273 158 178 165 74 110 167 Green peas t 194 150 218 107 95 158 91 91 Turnips t 1 845 2 267 1 294 1 427 1 612 2 493 1 161 1 818 Other vegetables t 1 151 2 179 2 631 4 696 3 601 3 985 5 329 10 645Vegetables under shelter t 9 536 11 937 12 450 14 187 13 756 11 497 14 709 14 003 Cucumbers t 4 592 5 878 5 183 6 237 6 658 5 687 7 063 5 936 Tomatoes t 4 075 5 105 6 562 6 634 5 257 4 549 4 962 6 218 Other vegetables t 869 954 705 1 316 1 841 1 261 2 684 1 849 Fruit and berry orchards t 5 870 14 475 4 332 5 125 3 974 7 983 3 796 4 542 Apples and pears t 2 159 10 663 2 835 4 087 2 248 5 446 1 983 2 702 Plums t 913 507 282 48 114 686 251 266 Cherries t 96 181 191 108 98 108 126 105 Red and white currants t 366 1 117 139 325 500 511 134 291 Black currants t 738 933 427 158 234 401 402 489 Gooseberries t 487 74 52 69 121 117 147 141 Rasberries t 317 544 236 210 256 213 282 160 Other t 794 456 170 120 403 501 471 388 Strawberries t 2 293 2 323 1 523 1 500 1 512 1 790 1 275 1 292Source: SE
90

Annex 3. Average yields of agricultural crops, 2004–2011 (kilograms per hectare)
2004 2005 2006 2007 2008 2009 2010 2011 Cereals 2 330 2 694 2 210 3 009 2 794 2 761 2 464 2 598 Winter cereals 2 658 3 203 2 645 3 906 3 584 3 010 2 707 2 883 Rye 2 228 2 747 2 449 3 620 3 073 2 555 1 983 2 325 Winter wheat 2 869 3 634 2 763 4 105 3 823 3 216 2 934 3 013 Winter barley 2 867 2 521 2 444 3 018 3 562 2 371 2 210 2 286 Triticale 2 439 2 430 2 152 3 521 3 712 2 834 2 234 3 050 Summer cereals 2 274 2 625 2 150 2 782 2 559 2 690 2 384 2 509 Summer wheat 2 357 2 917 2 296 3 106 2 759 2 883 2 604 2 659 Barley 2 306 2 544 2 130 2 663 2 551 2 683 2 433 2 494 Oats 2 057 2 496 1 953 2 706 2 263 2 394 1 790 2 211 Cereal mix 2 183 2 222 2 071 2 460 2 257 2 234 1 964 2 345 Buckwheat 623 718 659 1 105 506 615 452 732 Protein crops 757 1 282 1 198 1 668 691 1 547 1 713 1 811 Flax stalks 831 1 282 676 1 169 960 742 908 878 Oilseed rape 1 362 1 781 1 354 1 812 1 431 1 657 1 334 1 620 Summer oilseed rape 1 356 1 774 1 349 1 808 1 385 1 657 1 274 1 597 Winter oilseed rape 1 496 2 049 1 743 1 896 1 871 1 659 1 757 1 783 Potatoes 10 342 15 028 13 261 17 195 14 315 15 275 17 456 17 836 Annual forage crops 11 667 11 250 7 935 10 663 12 898 12 620 14 033 17 478 Multiannual forage crops 12 050 11 240 9 832 12 595 13 960 13 149 11 361 12 110
Permanent grassland1 9 004 10 406 8 144 8 799 8 992 8 727 9 121 9 162 Vegetables outdoors 12 548 16 874 17 283 20 546 20 916 21 446 21 166 24 865 Cabbages 20 351 22 033 24 868 25 597 33 262 29 466 24 499 35 037 Cucumbers 8 254 16 645 20 046 17 538 10 852 20 054 22 941 22 535 Beetroots 12 155 17 337 18 702 21 606 20 843 22 509 18 762 24 251 Carrots 20 423 27 573 23 557 34 286 28 914 32 280 38 804 39 416 Bulb onions 6 189 7 203 8 008 5 500 10 609 8 250 9 055 5 657 Garlic 3 926 2 967 2 000 2 225 2 143 1 121 1 571 2 227 Green peas 1 276 1 250 1 912 1 049 1 011 1 306 684 892 Turnips 9 365 18 282 10 694 12 409 16 792 17 807 7 490 13 368 Other vegetables 2 335 5 663 6 315 11 828 10 194 9 660 13 231 17 862Vegetables under shelter 31 576 42 831 48 237 53 334 51 328 42 931 59 406 55 923 Cucumbers 56 137 68 246 67 663 73 042 77 963 65 898 100 756 84 800 Tomatoes 20 738 30 642 41 167 41 549 32 836 28 682 32 559 40 587 Other vegetables 36 667 47 275 33 099 61 784 86 840 57 318 111 833 74 257 Fruit and berry orchards 541 1 473 570 723 588 1 134 625 748 Apples and pears 248 1 701 594 972 569 1 333 615 840 Plums 716 621 466 86 216 1 309 577 617 Cherries 115 347 482 316 291 322 458 395 Red currants and white currants 384 1 896 307 823 1 185 1 274 350 839 Black currants 694 1 458 820 291 485 830 749 935 Gooseberries 841 205 197 300 524 506 803 770 Rasberries 878 2 037 864 1 066 1 261 1 014 1 085 708 Other 2 199 1 243 526 193 668 651 609 441 Strawberries 2 404 2 864 2 124 2 373 2 947 3 167 2 245 2 456 Source: SE1 Since 2003 seeded grassland of over five years is included in permanent grassland.
91

Annex 4. Organic crop production and livestock production, 2004–2011
Unit 2004 2005 2006 2007 2008 2009 2010 2011 CROP PRODUCTION Cereals ha 5 422 6 840 8 520 9 917 11 721 16 279 19 271 20 493 Wheat ha 806 1 076 1 331 1 737 1 983 2 322 2 550 4 099 Rye ha 580 358 652 1 012 1 645 2 252 3 152 2 741 Barley ha 1 384 2 062 2 277 2 682 2 130 3 267 3 696 4 127 Oats ha 1 954 2 449 3 396 3 753 4 981 7 626 8 694 8 353 Cereal mixes ha 378 621 645 456 527 353 566 646 Other cereals ha 320 274 219 276 453 460 613 528 Protein crops ha 254 225 149 135 87 146 339 739 Oilseed rape ha 50 71 283 240 237 436 1 544 1 946 Potatoes ha 281 254 241 213 188 179 183 214 Vegetables grown in the open ha 56 49 58 45 46 63 103 214 Strawberries ha 42 44 37 34 29 23 23 23 Annual and perennial grass ha 28 209 36 673 48 276 54 302 56 609 64 123 77 308 85 161 Herbs and spices ha 36 82 151 138 82 52 82 36 Green manure crops ha 72 108 93 75 890 1 528 1 701 1 212 Agricultural fallows ha 1 482 1 458 1 567 1 310 1 577 3 201 3 459 3 950 Other field crops ha 12 13 36 131 204 237 381 148 Total field crops ha 35 916 45 817 59 413 66 539 71 670 86 268 104 392 114 135 Fruit and berry orchards ha 619 938 1 146 1 202 1 222 1 228 1 205 1 379 Sea buckthorn ha 192 343 523 547 551 551 559 655 Apples ha 150 206 253 251 314 363 Black currents ha 90 118 123 152 88 111 Rasberries ha 15 18 22 25 27 27 Other ha 427 594 367 313 273 249 217 223 Natural grassland ha 8 991 11 722 11 832 11 441 7 693 7 209 7 129 7 453 Set aside agricultural land ha 491 590 497 349 322 461 245 279 Grazed non-agricultural land GAEC ha 850 5 371 6 403 7 240 9 111 Total land ha 46 016 59 742 73 770 81 528 87 347 102 767 121 814 134 056 LIVESTOCK PRODUCTION Cattle heads 10 111 11 916 14 255 15 890 18 215 21 074 25 174 28 701 Dairy cows heads 2 997 3 031 3 230 2 959 2 880 3 054 3 275 3 255 Beef cattle heads 2 927 4 504 6 328 8 351 10 844 13 698 17 590 21 176 Other cattle heads 4 187 4 381 4 697 4 580 4 491 4 322 4 309 4 270 Sheep heads 10 856 16 735 20 723 27 932 33 860 39 374 42 464 46 496 Goats heads 345 447 558 643 680 709 798 940 Horses heads 946 1 309 1 410 1 647 1 708 1 754 1 872 1 987 Pigs heads 398 348 434 278 253 328 1 104 1 327 Poultry heads 4 908 5 704 5 037 4 459 4 410 8 099 10 864 12 863 Rabbits heads 494 562 483 347 269 890 927 1 208 Bees hives 394 333 331 322 306 465 499 632 Source: AB
1 197 1 602 1 699ha 675 883 1 147 1 070
92

Annex 5. Economic accounts for agriculture, 2004–2011 (at current prices, million euros)
2004 2005 2006 2007 2008 2009 2010 2011+ TOTAL OUTPUT 483 543 571 699 668 570 668 811
Total crop output 167 205 211 336 250 227 275 336 Wheat 23 26 31 70 39 36 57 57 Rye 2 2 2 11 8 3 4 5 Barley 32 36 43 68 31 34 38 52 Oats 7 8 8 13 6 5 6 8 Other cereals 3 2 2 5 3 2 2 4 Potatoes 16 31 26 34 18 18 27 26 Oilseed 17 21 25 46 39 40 50 63 Vegetables 18 22 28 34 35 24 37 45 Fruits 6 8 5 5 6 6 5 5 Grass feeds 37 45 33 41 58 52 42 64 Other crop production 6 5 8 10 7 5 6 7 Total l ivestock production 269 278 296 301 342 281 321 388 Cattle 31 28 34 29 35 34 33 41 Pigs 56 59 64 65 77 73 69 87 Poultry 19 17 15 18 23 21 20 23 Sheep and goats 2 2 3 3 3 2 3 3 Milk 147 156 162 167 186 133 175 211 Eggs 10 10 9 9 11 11 12 11 Other l ivestock production 5 7 9 9 7 7 9 13 Other output 47 60 64 62 75 63 72 87
- INTERMEDIATE CONSUMPTION 278 325 335 393 448 394 433 500 Specific costs 189 223 219 257 290 267 250 312 Seeds 6 6 6 8 13 12 15 15 Feed 158 192 186 216 225 212 182 232 Ferti l izers 13 14 15 17 30 24 29 39 Plant protection products 6 6 6 9 13 11 16 16 Other specific costs 5 5 5 6 8 8 9 11 Total farming overheads 89 102 116 137 158 127 182 188 Energy (fuel, electricity etc) 39 45 47 57 61 53 61 74 Maintenance of machinery and buildings Contractual work 9 11 10 11 19 17 18 27 Other overheads 24 28 41 43 44 29 68 49
= GROSS VALUE ADDED 205 218 236 306 220 176 236 310 - Depreciation of capital assets 43 50 59 67 78 83 86 92 = NET VALUE ADDED 162 168 177 239 142 93 150 218 - Salaries, rents, interests 82 96 111 137 155 133 131 137 + Other supports 53 68 77 110 132 125 165 172 + Interest received 4 3 3 3 3 5 1 3 - Taxes 3 3 3 3 3 3 4 4
= FAMILY FARM INCOME 134 140 143 212 119 87 181 252 Source: SE
35 39 17 17 18 25 34 28
93

Annex 6. Agricultural input price index, 2004–2011 (compared with the previous year, %)
Annex 7. Agricultural output price index, 2004–2011 (compared with the previous year, %)
2004 2005 2006 2007 2008 2009 2010 2011 Total 3,2% 4,0% 6,0% 9,0% 10,4% -7,3% 2,0% 11,7% Goods and services currently consumed in agriculture Seeds 1,1% 9,2% 1,2% 1,1% 12,0% -9,5% -12,4% 13,7% Energy, fuel, lubricants 6,4% 14,2% 15,9% 8,3% 17,4% -10,2% 13,1% 14,3% Ferti l isers and soil improvers 3,5% 6,0% 3,9% 4,4% 61,1% 4,8% -11,2% 20,0% Plant protection products and pesticides 5,1% 1,6% 1,2% 0,9% 5,8% 7,1% -1,7% 0,2% Veterinary expenses -0,6% 3,8% 3,5% 4,4% 1,4% 0,3% -0,9% 6,4% Animal feedingstuffs 2,2% 1,9% 3,4% 15,7% 18,6% -17,2% 2,6% 23,3% Maintenance of equipment and materials Maintenance of buildings 6,2% 7,0% 10,4% 13,0% 4,4% -8,7% -2,6% 3,0% Other goods and services 2,0% 2,4% 0,8% 4,5% 5,9% 4,0% 2,6% 0,8% Goods and services contributing to agricultural investment Source: SE
16,5%
5,6%
3,0%
3,1%
6,3%
-0,1%
-10,3%
-1,7%
1,2%
-1,5%
4,2%
5,4% 10,9% 17,8%
6,9%3,5% 2,8%
3,0% 4,7%
6,1%
1,1% 2,2% -0,7% 7,4%
2004 2005 2006 2007 2008 2009 2010 2011TOTAL 10,9% 2,4% 2,5% 16,7% 4,5% -22,4% 20,9% 18,3% Crop production -3,0% -0,1% 13,1% 36,9% -6,6% -26,0% 26,7% 29,8% Cereals (incl seed) -3,4% -7,5% 12,5% 62,6% -16,1% -31,3% 44,1% 25,9% Industrial crops -4,2% -9,8% 19,7% 30,2% 5,3% -24,8% 26,5% 38,9% Vegetables and horticultural products Fresh fruit and berries -6,1% -8,5% -13,6% 78,5% 8,1% -12,4% 1,8% -16,8% Potatoes (incl seed) -4,0% 29,1% 16,3% 13,1% -11,5% -19,7% 7,7% 79,5% Other crop production 2,1% 8,4% 5,8% 5,3% 4,7% -23,0% -8,0% -3,7% Livestock production 17,7% 3,4% -1,6% 7,6% 10,8% -20,6% 18,2% 12,9% Livestock for meat -1,7% 5,1% 1,1% 1,0% 9,8% -2,7% -4,2% 9,4% Livestock products 26,2% 2,8% -2,5% 10,1% 11,1% -26,5% 28,0% 14,0% Milk 29,0% 2,6% -4,4% 10,6% 10,3% -29,5% 31,9% 16,3% Eggs 3,1% 3,7% 9,8% 8,4% 26,3% -13,3% 5,4% -7,8% Other animal products 5,5% 4,7% 24,2% 2,5% 4,3% 16,3% 6,9% 5,4% Sources: SE
12,6% 8,1%0,8% 15,8% 14,6% -4,1% 10,2% -22,3%
94
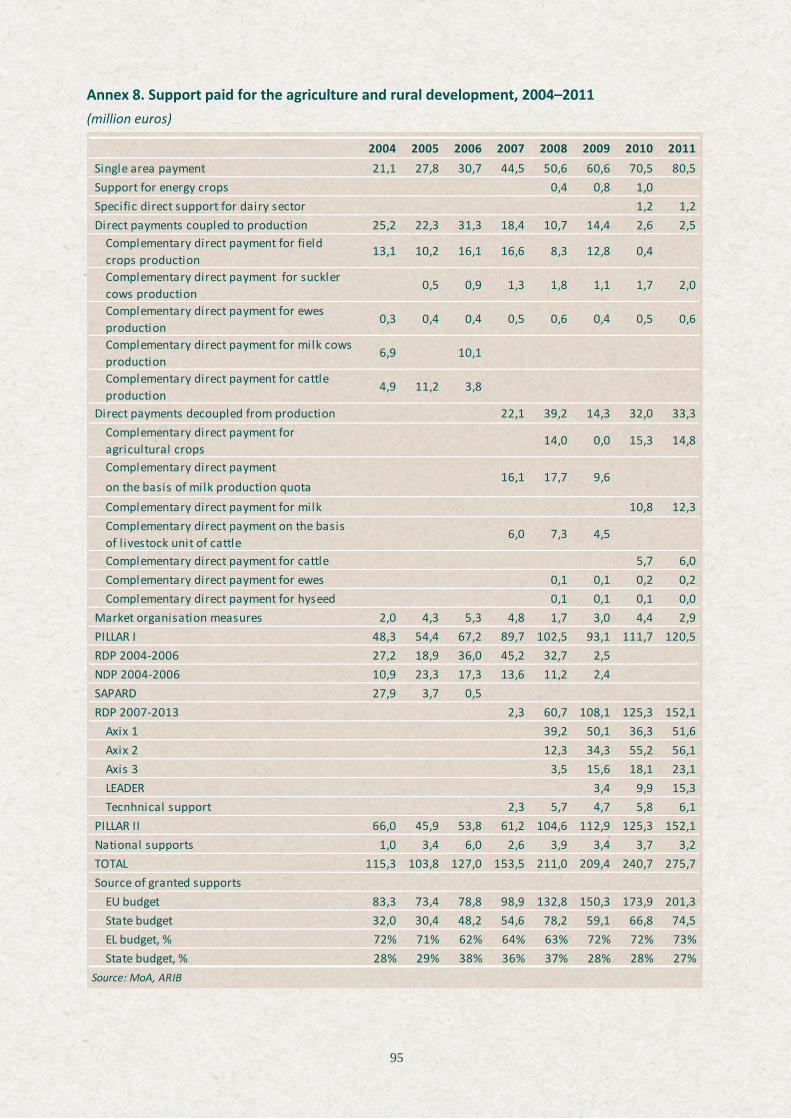
Annex 8. Support paid for the agriculture and rural development, 2004–2011 (million euros)
2004 2005 2006 2007 2008 2009 2010 2011 Single area payment 21,1 27,8 30,7 44,5 50,6 60,6 70,5 80,5 Support for energy crops 0,4 0,8 1,0 Specific direct support for dairy sector 1,2 1,2 Direct payments coupled to production 25,2 22,3 31,3 18,4 10,7 14,4 2,6 2,5
Complementary direct payment for field crops production
13,1 10,2 16,1 16,6 8,3 12,8 0,4
Complementary direct payment for suckler cows production
0,5 0,9 1,3 1,8 1,1 1,7 2,0
Complementary direct payment for ewes production
0,3 0,4 0,4 0,5 0,6 0,4 0,5 0,6
Complementary direct payment for milk cows production
6,9 10,1
Complementary direct payment for cattle production
4,9 11,2 3,8
Direct payments decoupled from production 22,1 39,2 14,3 32,0 33,3Complementary direct payment for agricultural crops
14,0 0,0 15,3 14,8
Complementary direct payment on the basis of milk production quotaComplementary direct payment for milk 10,8 12,3Complementary direct payment on the basis of l ivestock unit of cattle
6,0 7,3 4,5
Complementary direct payment for cattle 5,7 6,0Complementary direct payment for ewes 0,1 0,1 0,2 0,2Complementary direct payment for hyseed 0,1 0,1 0,1 0,0
Market organisation measures 2,0 4,3 5,3 4,8 1,7 3,0 4,4 2,9 PILLAR I 48,3 54,4 67,2 89,7 102,5 93,1 111,7 120,5 RDP 2004-2006 27,2 18,9 36,0 45,2 32,7 2,5 NDP 2004-2006 10,9 23,3 17,3 13,6 11,2 2,4 SAPARD 27,9 3,7 0,5 RDP 2007-2013 2,3 60,7 108,1 125,3 152,1
Axix 1 39,2 50,1 36,3 51,6Axix 2 12,3 34,3 55,2 56,1Axis 3 3,5 15,6 18,1 23,1LEADER 3,4 9,9 15,3Tecnhnical support 2,3 5,7 4,7 5,8 6,1
PILLAR II 66,0 45,9 53,8 61,2 104,6 112,9 125,3 152,1 National supports 1,0 3,4 6,0 2,6 3,9 3,4 3,7 3,2 TOTAL 115,3 103,8 127,0 153,5 211,0 209,4 240,7 275,7 Source of granted supports
EU budget 83,3 73,4 78,8 98,9 132,8 150,3 173,9 201,3State budget 32,0 30,4 48,2 54,6 78,2 59,1 66,8 74,5EL budget, % 72% 71% 62% 64% 63% 72% 72% 73%State budget, % 28% 29% 38% 36% 37% 28% 28% 27%
Source: MoA, ARIB
16,1 17,7 9,6
95

Annex 9. Support paid for the agriculture and rural development by counties, 2011 (thousand euros)
Harju Hiiu Ida-Viru
Jõgeva Järva Lääne Lääne-Viru
Põlva Pärnu Rapla Saare Tartu Valga Viljandi Võru Kõik
Single area payment 5 719 1 115 2 736 6 199 7 156 3 722 9 354 4 270 7 276 5 707 4 242 7 637 3 615 7 350 4 444 80 541 Special support for dairy sector 73 25 31 53 90 54 86 95 173 117 96 77 66 129 73 1 240 Direct payments related to production 139 180 75 80 96 288 202 100 216 232 366 54 157 145 171 2 503
Complementary direct payment for suckler cows production
113 154 60 60 75 258 159 60 185 204 260 28 101 113 122 1 951
Complementary direct payment for ewes production
27 26 14 21 22 30 43 41 31 27 107 26 56 32 49 552
Direct payments decoupled from production 1 708 253 887 3 070 4 122 1 157 4 892 1 967 3 051 2 249 1 417 2 977 1 389 2 972 1 205 33 318Complementary direct payment for fieldcrops
882 104 437 1 052 1 217 593 2 565 756 1 224 943 400 1 568 753 1 733 621 14 848
Complementary direct payment for milk production
517 57 279 1 363 2 169 280 1 572 864 1 270 829 617 979 357 793 313 12 258
Complementary direct payment for cattle production
299 84 167 639 726 275 746 334 544 468 369 408 262 430 257 6 008
Complementary direct payment for ewes production
7 8 4 15 6 7 7 11 10 9 28 8 16 11 14 161
Complementary direct payment for hayseed production
2 1 5 2 2 2 4 1 3 14 1 5 1 44
Market organisation measures 934 9 168 23 53 69 153 38 98 73 50 1 017 50 88 40 2 865 I PILLAR 8 574 1 584 3 896 9 426 11 518 5 290 14 688 6 470 10 816 8 378 6 171 11 762 5 278 10 684 5 933 120 468 RDP 2007-2013 12 516 3 302 5 445 8 859 9 535 9 126 13 493 7 410 13 883 8 038 11 591 16 485 7 256 11 292 7 777 152 088
Axix 1 4 735 489 1 643 3 546 3 455 3 299 5 643 2 311 5 220 2 281 2 848 8 308 2 147 3 623 2 001 51 550Axix 2 3 042 1 529 1 702 3 100 3 961 4 471 4 927 3 012 5 678 4 112 4 995 4 718 2 625 4 313 3 871 56 055Axis 3 3 024 834 908 1 538 947 755 1 249 1 252 2 091 707 2 788 2 125 1 838 1 788 1 211 23 055LEADER 1 714 450 1 193 675 1 171 602 1 674 835 894 938 959 1 334 647 1 568 694 15 348Technical help 6 079
II PILLAR 12 516 3 302 5 445 8 859 9 535 9 126 13 493 7 410 13 883 8 038 11 591 16 485 7 256 11 292 7 777 152 088 National supports 1 044 8 7 77 9 9 23 20 203 945 6 603 27 133 56 3 170 TOTAL 22 134 4 894 9 348 18 362 21 062 14 425 28 204 13 900 24 902 17 361 17 768 28 850 12 561 22 108 13 767 275 726 Source: ARIB, MoA
96

Annex 10. Payments under Rural Development Plan 2007–2013, 2011 (thousand euros)
Axis and measure Total Axis 1: Improving the competitiveness of the agricultural and forestry sector 51 550 1.1 Training and information activities 477 1.2 Setting up of young agricultural producers 4 731 1.3 Support for advisory system and services 809 1.3.1 Use of advisory services by agricultural producers and private forest owners 599 1.3.2 Use of advisory services regarding conformity and occupational health and safety 115 1.3.3 Support for the improvement of availabil ity of advisory service 94 1.4 Modernisation of agricultural holdings 27 651 1.4.1 Investments into the development of micro agricultural holdings 10 071 1.4.2 Investments in l ivestock buildings 16 347 1.4 3 Investments ino the production of bioenergy 1 233 1.5 Improving the economic value of forests and adding value to forestry products 3 193 1.5.1 Improving the economic value of forests 2 183 1.5.2 Adding value to forestry products (implementation of a development project) 927 1.5.3 Restoration of damaged forest and prevention of forest fires 83 1.6 Adding value to agricultural and non-wood forestry products 6 828 1.6.1 Processing of agricultural products and non-wood forestry products 6 828 1.7 Development of new products, processes and technologies in the sectors of agriculture, food and forestry 1.8 Infrastructure of agriculture and forest management 7 247 1.9 Setting up and development of producer groups 312 1.10 Supporting semi-subsistence farming 271 Axis 2: Improving the environment and the countryside 56 055 2.1 Support for less-favoured areas 8 816 2.2 Natura 2000 support for agricultural land 712 2.3 Agri-environmental support 37 524 2.3.1 Environmentally friendly management 22 786 2.3.2 Support for organic production 10 138 2.3.3 Support for keeping animals of local endangered breeds 490 2.3.3.1 Support for Estonian horse 250 2.3.3.2 Support for Estonian native cattle 118 2.3.3.3 Support for Estonian heavy draughts 38 2.3.3.4 Support for Tori horse 84 2.3.4 Support for growing plants of local varieties 20 2.3.5 Support for the maintenance of semi-natural habitats 4 089 2.4 Animal welfare: support for grazing animals 5 186 2.5 Non-productive investments 713 2.5.1 Support for the establishment and restoration of stonewalls 713 2.7 NATURA 2000 support for private forest land 3 104 Axis 3: Quality of l ife in rural areas and diversification of the rural economy 23 055 3.1 Diversification of the rural economy 11 130 3.1.1. Diversification into non-agricultural activities 822 3.1.2 Support for the development of micro enterprises 9 675 3.2 Vil lage renewal and development 11 925 Axis 4: LEADER 15 355 Support for local action groups 2 695 Project support 12 660 Axis 5: Technical assistance 6 079 Total payments RDP 2007–2013 152 095 Source: MoA, ARIB
32
97

Annex 11. Unit rates of direct payments and complementary direct payments, 2004–2011
Unit 2004 2005 2006 2007 2008 2009 2010 2011
Single area payment €/ha 26,5 33,7 42,2 48,6 59,6 70,8 80,9 91,1 Support for energy crops €/ha 31,7 45,0 45,0 Specific direct support €/cow for dairy sector Direct payments coupled to production
Complementary direct paymentfor field crops productionComplementary direct paymentfor suckler cows productionComplementary direct paymentfor ewes productionComplementary direct paymentfor milk cows productionComplementary direct paymentfor cattle production
Direct payments decoupled from productionComplementary direct payment for agricultural cropsComplementary direct payment onthe basis of milk production quotaComplementary direct payment on the basis of l ivestock unitComplementary direct payment €/ewe 3,4 3,3 5,4 4,9for ewesComplementary direct payment €/hafor hayseed
Source: MoA
1 Certified hay seed production: gramineae 48,06 €/ha, protein crops 72,86 €/ha
2 Complementary direct payment for sheep production 2004
3 National scheme, payments before accession 2004
4 since 2010 per payment entitlement
37,0 36,2 37,3 31,7
74,0 81,8
0,0196
82,62
€/ewe
0,02
79,24
11,40
20,93
Type of support
69,28 87,18 114,02 120,73 128,65
€/ha 40,331 30,05 19,94
9,18
53,49
€/cow
48,57
14,00 14,0014,002 13,68 14,14
37,58 34,42
0,0256 0,0281 0,0153
59,99
€/lu
€/ha
€/kg
€/lu 78,61 97,47
49,49 50,61
82,51
10,19
21,95
0,0173
77,54
€/cow 63,76
68,073
18,69 21,78 14,79
65,79
98
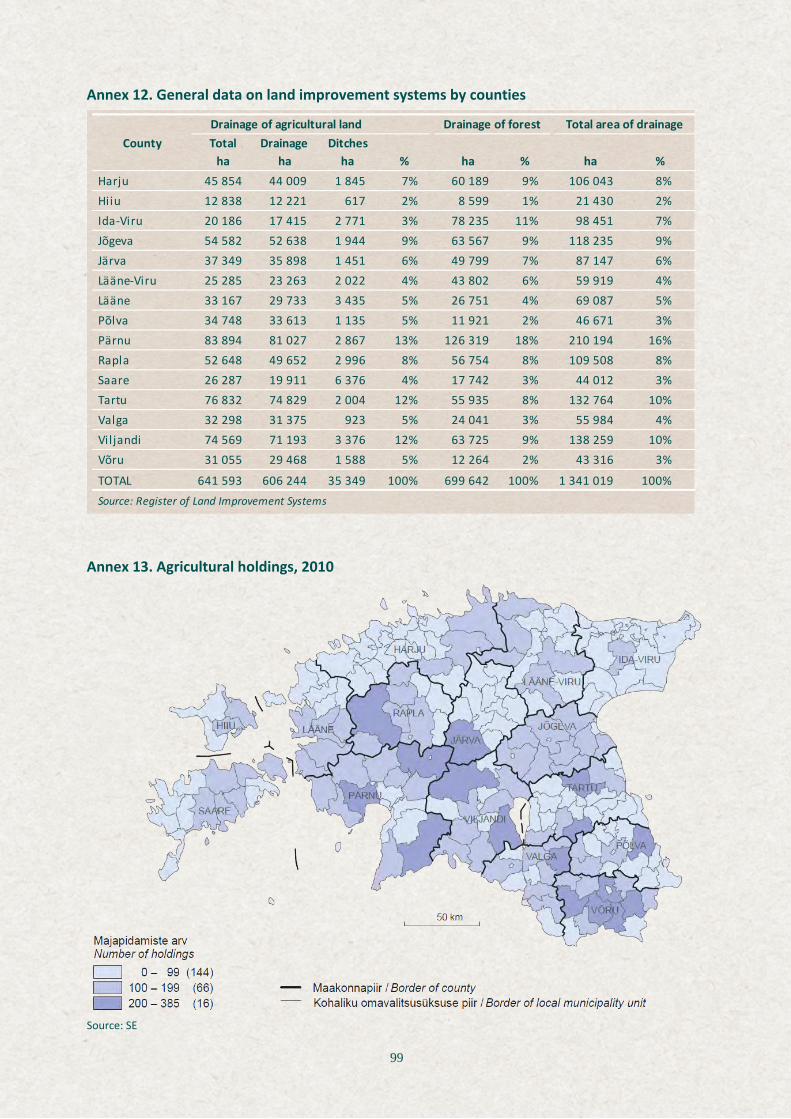
Annex 12. General data on land improvement systems by counties
Annex 13. Agricultural holdings, 2010
Source: SE
Total Drainage Ditchesha ha ha % ha % ha %
Harju 45 854 44 009 1 845 7% 60 189 9% 106 043 8% Hiiu 12 838 12 221 617 2% 8 599 1% 21 430 2% Ida-Viru 20 186 17 415 2 771 3% 78 235 11% 98 451 7% Jõgeva 54 582 52 638 1 944 9% 63 567 9% 118 235 9% Järva 37 349 35 898 1 451 6% 49 799 7% 87 147 6% Lääne-Viru 25 285 23 263 2 022 4% 43 802 6% 59 919 4% Lääne 33 167 29 733 3 435 5% 26 751 4% 69 087 5% Põlva 34 748 33 613 1 135 5% 11 921 2% 46 671 3% Pärnu 83 894 81 027 2 867 13% 126 319 18% 210 194 16% Rapla 52 648 49 652 2 996 8% 56 754 8% 109 508 8% Saare 26 287 19 911 6 376 4% 17 742 3% 44 012 3% Tartu 76 832 74 829 2 004 12% 55 935 8% 132 764 10% Valga 32 298 31 375 923 5% 24 041 3% 55 984 4% Vil jandi 74 569 71 193 3 376 12% 63 725 9% 138 259 10% Võru 31 055 29 468 1 588 5% 12 264 2% 43 316 3%
TOTAL 641 593 606 244 35 349 100% 699 642 100% 1 341 019 100% Source: Register of Land Improvement Systems
CountyDrainage of forest Total area of drainage Drainage of agricultural land
99