Compiled Balance Sheet of Manufacturing Enterprises · Compiled Balance Sheet of Manufacturing...
51
This PDF is a selection from an out-of-print volume from the National Bureau of Economic Research Volume Title: Studies in Income and Wealth Volume Author/Editor: Conference on Research in Income and Wealth. Volume Publisher: NBER Volume ISBN: 0-870-14167-8 Volume URL: http://www.nber.org/books/unkn50-1 Publication Date: 1950 Chapter Title: Compiled Balance Sheet of Manufacturing Enterprises Chapter Author: Martin R. Gainsbrugh, Lucie Krassa Chapter URL: http://www.nber.org/chapters/c3147 Chapter pages in book: (p. 275 - 324)
Transcript of Compiled Balance Sheet of Manufacturing Enterprises · Compiled Balance Sheet of Manufacturing...

This PDF is a selection from an out-of-print volume from the NationalBureau of Economic Research
Volume Title: Studies in Income and Wealth
Volume Author/Editor: Conference on Research in Income and Wealth.
Volume Publisher: NBER
Volume ISBN: 0-870-14167-8
Volume URL: http://www.nber.org/books/unkn50-1
Publication Date: 1950
Chapter Title: Compiled Balance Sheet of Manufacturing Enterprises
Chapter Author: Martin R. Gainsbrugh, Lucie Krassa
Chapter URL: http://www.nber.org/chapters/c3147
Chapter pages in book: (p. 275 - 324)
Compiled Balance Sheetof
Manufacturing Enterprises
Martin R. Gainsbrughand
Lucie KrassaNational Industrial Conference Board
THE ESTIMATES COVER ALL ACTIVE CORPORATE and noncorpo-rate enterprises engaged in manufacturing industries as definedin the Standard Industrial Classification. This classificationwas adopted by the Bureaus of Internal Revenue and of theCensus in 1938 for Statistics of Income and the Census of Man-ufactures.,1 the two main sources used in this paper. However,as the industrial classification in Statistics of Income is basedon the predominant business of the corporations filing incometax returns, the 'manufacturing' group does not contain cor-porations engaged solely in manufacturing, owing to the diver-sified industrial activities of many corporations.2 Inactive cor-porations, i.e., those that did not report income or balancesheet data to the Bureau of Internal Revenue, are not covered.Establishments that were idle throughout the year or thatmanufactured products valued at less than $5,000 (the latter arenegligible) are not included in the Census of Manufactures.8
Statistics of Income embraces the forty-eight states, the Dis-trict of Columbia, Alaska, and Hawaii. We deducted assetsowned by manufacturing enterprises in Alaska and Hawaii sothat our estimates cover only the continental United States.As the data include the American assets of resident foreigncorporations, i.e., foreign corporations engaged in trade or1 Data for 1929 were adjusted accordingly. No changes in industrial classifica-tion affecting the 'manufacturing' group as a whole were made between 1938and 1944.2 The industrial classification in Statistics of Income for 1929 and 1944 is basedupon the predominant business of groups of corporations filing a single con-solidated return.B In the earlier quinquennial censuses, establishments with products valued at$500 or more were included. The difference in coverage, in terms of value ofproduct, was 0.3 percent in 1921 (Census of Manufactures, 1939, I, pp. 1-2). In1929 and 1939 the importance of establishments with products valued at lessthan $5,000 was presumably even smaller. Establishments with products valuedat $5,000-20,000 produced only 1.1 percent of the total annual product in 1929and 0.9 percent in 1937 (Solomon Fabricant, Output of Manufacturing Indus-tries, 1899-1937; 1940; p. 329).
The definition of 'establishment' was modified in 1937. Prior to that year onereturn was usually counted as representing one establishment, although itmight cover two or more plants operated under the same management. In 1939the number of establishments represented by a return depended upon thenumber of plants covered by it.
276
BALANCE SHEET OF MANUFACTURING ENTERPRISES 277business or having an office or place of business in the UnitedStates, domestic manufacturing assets cannot be strictly segre-gated on the basis of the residence of their owners or of thelocation of physical assets.
The estimates must be used with caution for the followingreasons: Data in Statistics of Income for 1929 and 1944 wereadjusted to represent a situation as if the privilege of filingconsolidated returns had not existed in 1929 and 1944 (seeApp. C). Hence the estimates for 1929 and 1944 are only ap-proximately correct. In comparing data for 1929, 1939, 1944,and 1946, it must be kept in mind that mergers of parent com-panies and their subsidiaries and mergers generally during thisperiod cannot be accurately evaluated.
Because Census data for years later than 1939 are lacking,estimates for the noncorporate sector in 1944 are highly tenta-tive. All estimates of inventories for 1946 are also highly ten-tative since the basic statistical material is not yet available.
The corrections for changes in the price level between 1929and 1939, 1939 and 1944, and 1939 and 1946 are extremelyrough, reflecting trends rather than absolute levels.
A CHANGES IN THE PRIcE LEVEL AND THE MEANINGOF BOOK VALUES
Comparisons of balance sheet data for different years cannotbe meaningful—especially in periods of rapid and substantialprice changes—unless amounts in current dollars are reducedto an approximately uniform price level. This task is highlycomplicated for several reasons:1) Changes in prices are not isolated phenomena. Influenc-ing the development of prices while being influenced by it, theproduction and supply of goods change, as well as the charac-ter of the demand. This is particularly true for the transitionfrom a peace to a war economy, and vice versa.4 In the whole-4 For a discussion of these and related problems see Carl Shoup, Principles ofNational Income Analysis (Houghton Muffin, 1947), pp. 216-21, and the litera-ture cited there. See also Simon Kuznets, National Product, War and Prewar

278 PART II
sale price index of the Bureau of Labor Statistics, the pricefor each commodity is usually weighted by a factor represent-ing the average quantity of the commodity marketed in1929-31. In addition, for some goods no price quotations wereavailable during the war, and new goods were added duringthe period examined.2) Price indexes are inadequate also as a measure of actualprices paid. The wholesale price indexes of the Bureau of La-bor Statistics are usually based on prices for certain standardgrades of articles; hence they do not provide complete coverage.3) The date of the price index to be applied is uncertain, assome balance sheets are not drawn as of December 31. A con-siderable number of fiscal year companies reported in 1929 aswell as in 1939 and 1944. Their importance cannot be evalu-ated for the manufacturing group. For all industry groups, theincome tax paid by fiscal year companies amounted to about17 percent of the income tax paid by all corporations in 1939,for example. In our estimates the December index was usuallytaken.4) Balance sheet figures are not stated in current prices, butare rather the result of special handling of book values in ac-cordance with established accounting practice. The followinggroups of balance sheet items may be distinguished:
a) Cash and deposits in banks, receivables, investments ingovernment obligations, notes and accounts payable, and otherdebt, as entered in the books, may be considered to fluctuatein value with the purchasing power of the currency. Thewholesale price index of the Bureau of Labor Statistics for allcommodities (December) was applied to transform these bal-ance sheet items into units of constant purchasing power.5Three and a half billion dollars in cash and bank deposits ofmanufacturers at the end of 1929 could buy fewer goods thanat the end of 1939. The use of the wholesale price index is
(NBER, Occasional Paper 17, 1944), pp. 6 if., and National Income: a Summaryof Findings (NBER, 1946), pp. 128-34.5 The index was93.3 in December 1929, 79.2 in December 1939, 104.7 in Decem-ber 1944, and 140.9 in December 1946. MOther assets' were deflated similarly.

BALANCE SHEET OF MANUFACTURING ENTERPRISES 279justified for cash and bank deposits as far as they serve to buynew stocks of goods or capital assets.6 The movement of theConference Board wholesale price index for ten industrial rawmaterials (1929, 1939, and 1946) is similar to that of the BLSwholesale price index for all commodities. The index of indus-trial building construction cost (Aberthaw) diverges consider-ably from the wholesale price index for all commodities in1939, but shows a similar relationship between 1929 and 1946.
To the extent that cash is used for paying wages, an indexshowing 'unit labor cost'—the ratio between output per manhour and gross hourly earnings—might be more appropriate.Discrepancies that may have existed between the wholesaleprice index and such a unit labor cost index during the periodexamined were not taken into account.
Obviously, whenever cash or government securities are heldthrough a period of high prices until the turn of the tide, theyrise in value. Such assets, therefore, have a larger value as badweather reserves than would be gathered from the deflatedfigures. Notes and accounts payable in the amount of $10 bil-lion could be more easily paid at the end of 1929 because pricespaid to manufacturers were higher than in 1939. As regardslong term debt, the argument might be advanced that the pur-chasing power of a currency when the debt is due determinesthe true value of the amount owed. However, to the degree thatthe long term debt is of a marketable character, a point may bemade for applying the price index prevailing at the time thebalance sheet is drawn up.
b) Book values for inventories, capital assets, and invest;ments other than in government obligations do not fluctuatewith the purchasing power of the dollar.7
i) Inventories are entered according to various methods:at cost or market, whichever is lower (probably the most exten-sively used method); at cost; at market after deducting a dis-6 It is likewise justified to the extent to which current assets represent depreci-ation reserves.7 See Copeland and Martin, 'The Correction of Wealth and Income Estimatesfor Price Changes', Studies in Income and Wealth, Vol. Two, pp. 88 if.

280 PART II
count. 'At cost' may mean different things depending uponwhether the last-in, first-out method (allowed for tax purposesgenerally since 1939) 8 or another method is used.9 'At cost' isambiguous also in that it depends upon the interval goods areheld in stock, the interval between ordering and receivingthem, and similar factors. 'At market' may mean current re-placement cost or sales price.10
In our estimates amounts for inventories in current dollarswere adjusted in accordance with the price index implied inthe inventory valuation adjustments by the Department ofCommerce for inventories held by manufacturing firms.11 Thisindex was 128.0 in 1929, 100 in 1939, 121.0 in 1944, and 140.1in 1946.
ii) Tangible capital assets except land (plant, machinery,and equipment) are entered at cost in tax reports. Deductionsare made for depreciation, or a depreciation reserve is set up.Usually amounts entered for depreciation do not necessarilyindicate the change in the intrinsic values of the assets. Thus,book values of capital assets, net, show the amount of capitalinvested in fixed assets and not recaptured by depreciationallowances, as permitted by the Bureau of Internal Revenue.The meaning of the book value of capital assets depends uponvarious factors:Method of depreciation. Depreciation is usually on a straightline basis.12Rate of depreciation, computed in a 'liberal' or conservativeway (compare differences in the rates of depreciation in the8 Revenue Act of 1939. According to the Revenue Act of 1938, the LIFO methodwas allowed for tax purposes to tanners and to producers and processors of non-ferrous metals.9 Internal Revenue Code, Sec. 22 (d), and Regulation III, Sec. 29.22 (d), providefor the elective use of 'zany . . . proper method which in the opinion of theCommissioner clearly reflects income," provided it is applied consistently.10 See Simon Kuznets, Commodity Flow and Capital Formation (NBER, 1938),I, 405 if; J. C. Bonbright, Valuation of Property (McGraw.Hill, 1937) II, 1014;C. F. Schiatter, Cost Accounting (Wiley, 1947), pp. 80.1, 232, 618 if.11 Suivey of Current Business, July 1947, Supplement, p. 45, Table 33.12 See Solomon Fabricant, Capital Consumption and Adjustment (NBER, 1938),pp. 66-7, Table 13.
BALANCE SHEET OF MANUFACTURING ENTERPRISES 281
1931 report of the Bureau of Internal Revenue and Bulletin Fof 1942).Volume of maintenance.Differences between original and reproduction cost.Retirement curves involved.'3The stage of the various property groups. Have annual retire-ments and renewals reached an even level, equal to the annualdepreciation reserve credit, so that the situation can be con-sidered stable?Importance of extraordinary obsolescence, which rises in peri-ods of rapid technological changes.Writedowns.15
This brief summary of the factors that determine book val-ues of capital assets makes it appear doubtful whether bookvalues are suitable as a measure of the adequacy of our manu-facturing plant or of its reproduction cost. Economists, inmeasuring capital assets, have often relied solely on book val-ues.'0 Contrariwise, management in many cases has deemedsuch data insufficient. In the last few years, particularly, thepractice seems to have spread among industrial concerns hav-ing large investments in fixed assets to keep property recordswhich, among other things, show reproduction cost as well asoriginal cost and accrued depreciation. Many concerns makeperiodic appraisals of property (say, every five years) and adjust13 See Robley Winfrey and E. B. Kurtz, 'Life Characteristics of Physical Prop-erty', Iowa Engineering Experiment Station Bulletin 103 (1931); Robley Win-frey, Statistical Analyses of Industrial Property Retirements', ibId., 125 (1935);Robley Winfrey, 'Depreciation of Group Properties', ibid., 155 (1942).14 Ibid.15 Such writeups or writedowns are generally not recognized by the Bureau ofInternal Revenue, it is true. In certain cases, however, the basis of depreciableproperty may be lowered. In the case of bankruptcy, for example, the basis ofdepreciable property may be lowered to the fair market value as of the date ofentry of the order confirming the plan or arrangement; Public, No. 699, July 1,1940 (retroactive to June 22, 1939). Similarly, the basis of depreciable propertymay be lowered in certain corporate liquidations; Internal Revenue Code, Sec-tiOn 113 (a) (7) and (18).10 E.g., Slichter for determining the adequacy of capital assets at various pointsin the past seventeen years.

282 PART II
them annually to determine values for fire insurance cover-age.17 Similarly, some manufacturers have applied a dual sys-tem of depreciation rates, especially since 1936. Some firmseven maintain three sets of books: one for cost purposes, onefor tax purposes, and one for appraisal purposes.18
In view of these complex problems, it is doubtful whethercompiled book values of tangible capital assets as based onStatistics of Income can ever be satisfactorily deflated forchanges in the price level. Moreover, "capital assets are rarelyreplaced in kind. Indeed by and large, they are replaced be-cause different and better assets are available." This reducesthe validity of a capital equipment index. As a matter of fact,the Department of Commerce has refrained from publishing acapital equipment index for Accordingly, the De-partment, the Federal Reserve Board, and the SEC give esti-mates of plant and equipment expenditures for the war andpostwar years in current dollars only.21
Fabricant's method of constructing an index of prices under-lying depreciation charges and an index of prices underlyingbook values of capital assets cannot satisfactorily be applied tothe years following 1939 because of the lack of Census data.22In this paper an attempt was made to supplement the data on17 C. V. Armstrong undertook a study in 1939 with the aim of showing that"it is economically feasible for an enterprise having widespread physical prop.erty to establish and maintain property records" Property Recordsfor Accounting and Valuation Uses', 'Iowa Engineering Experiment StationBulletin 160, 1944, p. 6).18 H. G. Avery, Accounting for Depreciable Fixed Assets (Columbia UniversityPress, 1940), p. 106.19 George Terborgh, NICB, Studies in Business Policy, 27 (1948), p. 5.20 The latest figure given by Henry Shavell, 'l'rice Deflators for Consumer Com-modities and Capital Equipment, 1929-42', Survey of Current Business, May1943, pp. 13-21, is for 1942; the latest figure given by Kuznets (National Productsince 1869; NBER, 1946; p. 36) is for 1943. Construction estimates were madealso in 1939 prices (Bureau of Foreign and Domestic Commerce, Constructionand Construction Materials, Industry Report, Statistical Supplement, May 1947,pp. 25 if).21 See, for example, M. L. Merriam, 'Current and Prospective Plant and Equip-ment Expenditures', Survey of Current Business, April 1948, p. 12.22 Capital Consumption and Adjustment, Ch. 10.

BALANCE SHEET OF MANUFACTURING ENTERPRISES 283book values of capital assets with some measures of physicalcapacity.28
iii) Land, like reproducible tangible assets, is entered atcost. But the original capital outlay is usually not written offuntil the property is sold or otherwise disposed of.24 Duringthe war, even land (purchased for the purpose of emergencyfacilities necessary for national defense) could be amortized.
iv) Intangibles are likewise booked at cost. Many firmshave written this item off after 1929.25
v) Investments, other than government obligations. Longterm securities are 'originally booked at cost and not subse-quently altered when market values change. Short term issuesare usually valued at the lower of cost or market.2° Thus longterm investments made in years of low prices (in the 1930's,for example) appear in balance sheets for 1944, for example,at cost.27
In this paper the following compromise was made. Like theother adjustments for changes in the price level, its aim ismerely to present approximately comparable figures for the23 To get consistent estimates in 1939 dollars in Table 1, the book values forcapital assets at the end of 1929 were deflated 3 percent in accordance withShavell's wholesale price index for capital equipment (average of yearly indexesfor 1939 and 1940 on the average of 1929 and 1930 as a base). Book values for1944 and 1946 were not deflated except for the net additions to capital assets(expenditures on plant and equipment minus depreciation) in 1940-44 and1940-46.24 Bonbright, op. cit., p. 904.25 A sample study of the balance sheets of 346 industrial corporations publishedin Moody's Manual of Investments, industrial Securities showed that the bookvalue of intangibles decreased 52.5 percent and the number of firms recordingintangibles at cost decreased 27 percent between 1929 and 1939 (H. G. Avery,'Accounting for Intangible Assets', Accounting Review, 1942, Vol. 17, pp. 354-63). See also W. A. Paton's statement: "In the case of goodwill and alliedintangibles . . . it has long been common practice to write off the total costas soon as this could be done without impairing the showings of income tooseriously, without regard to the actual status of the assets" ('Accounting Pro-cedures and Private Enterprise', Journal of Accountancy, April 1948, p. 282).26 Bonbright, op. cit., pp. 949-50.27 Securities that give a dominant control are sometimes valued at cost plus orminus changes in their share of the surplus of the company that has issuedthem (Bonbright, op. cit., p. 950). But this does not seem to have been doneto an appreciable extent in the 1940's. -

284 PART II
various years, not to get accurate estimates. The item or entry'investment' in 1929 was deflated by the wholesale price indexfor all commodities. Book values of investments for 1944 werenot deflated, except for the increase between 1939 and 1944.Book values of investments, as well as deflated amounts, wereassumed to be the same in 1946 as in 1944.
c) Net worth is here treated as a residual. Ampunts fornet worth in current dollars were not deflated independently;rather net worth in 1939 dollars was automatically determinedas a residual.
Similarly, total assets after adjustment for changes in theprice level are the sum of the various assets adjusted as de-scribed above.
Wages and salaries wereadjusted for changes in the purchas-ing power of the dollar on the basis of the consumer priceindex (annual average) of the National Industrial ConferenceBoard.28
B SUMMARY OF FINDINGS
As shown in Table 1, total assets of American manufacturingenterprises amounted to $72.5 billion at the end of 1929 ($64billion in 1939 prices), $61.5 billion in 1939, $102 billion in1944 ($87 billion in 1939 prices), and approximately $100billion in 1946 ($76 billion in 1939 prices).
Net worth, in current dollars, followed the same trend. Itdropped from $53 billion at the end of 1929 to $46 billion in1939, and rose to almost $67 billion in 1944, and further toabout $73 billion at the end of 1946.
In 1939 dollars net worth followed a somewhat differenttrend. It too was slightly lower in 1939 than in 1929. But whiletotal assets increased nearly 41 percent from 1939 to 1944, networth rose only 31 percent. Contrariwise, total assets decreasedbetween 1944 and 1946, while net worth presumably went upfrom $60 billion to nearly $61 billion.28 The index (1923: 100) was 100.1 for 1929, 84.5 for 1939, 104.6 for 1944, 113.2for 1946.
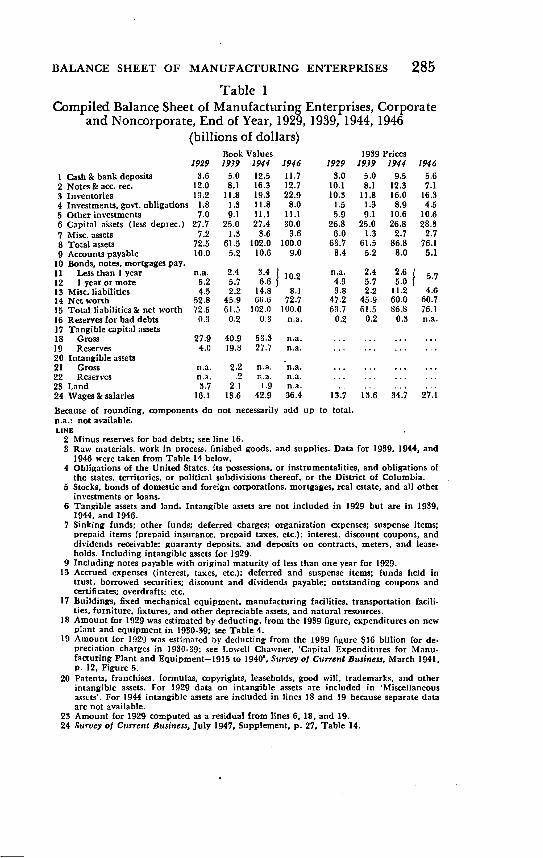
BALANCE SHEET OF MANUFACTURING ENTERPRISES 285Table 1
Compiled Balance Sheet of Manufacturing Enterprises, Corporateand Noncorporate, End of Year, 1929, 1939, 1944, 1946
(billions of dollars)Book Values 1939 Prices
1929 1939 1944 1946 1929 1939 1944 1946
1 Cash&bankdeposits 8.6 5.0 12.5 11.7 3.0 5.0 9.5 5.62 Notes & acc. rec. 12.0 8.1 16.8 12.7 10.1 8.1 12.3 7.1S Inventories 13.2 11.8 19.3 22.9 10.8 11.8 16.0 16.34 Investments, govt. obligations 1.8 1.3 11.8 8.0 1.5 1.3 8.9 4.55 Ocherinvestments 7.0 9.1 11.1 11.1 5.9 9.1 10.6 10.66 Capital a'ssets (less deprec.) 27.7 25.0 27.4 30.0 26.8 25.0 26.8 28.87 Misc, assets 7.2 1.3 3.6 3.6 6.0 1.3 2.7 2.78 Total assets 72.5 61,5 102.0 100.0 63.7 61.5 86.8 76.19 Accounts payable 10.0 5.2 10.6 9.0 8.4 5.2 8.0 5.1
10 Bonds. notes, mortgages pay.11 Lessthanlyear na. 2.4 102 n.a. 2.4 2.612 lyearormore 5.2 5.7 6.6 4.3 5.7 5.013 Misc. liabilities 4.5 2.2 14.8 8.1 8.8 2.2 11.2 4.614 Net worth 52.8 45.9 66.6 72.7 47.2 45.9 60.0 60.715 Total liabilities & net worth 72.5 61.5 102.0 100.0 6!1.7 61.5 86.8 76.116 Reserves for bad debts 0.3 0.2 0.3 n.a. 0.2 0.2 0.3 n.a.17 Tangible capital assets18 Gross 27.9 40.9 53.3 n.a.19 Reserves 4.0 19.8 27.7 n.a.20 Intangible assets21 Gross na. 2.2 n.a. n.a. ...22 Reserves n.a. .2 n.a. n.a. . , ...23 Land 3.7 2.1 1.9 n.a. . . .
24 Wages&salaries 16.1 13.5 42.9 86.4 13.7 13.6 34.7 27.1
Because of rounding, components do not necessarily add up to total.n.a.: not available.LINE
2 Minus reserves for bad debts; see line 16.S Raw materials, work in process, finished goods, and supplies. Data for 1939. 1944, and
1946 were taken from Table 14 below.4 Obligations of the United States, its possessions, or instrumentalities, and obligations of
the states, territories, or political subdivisions thereof, or the District of Columbia.5 Stocks, bonds of domestic and foreign corporations, mortgages, real estate, and all other
investments or loans.6 Tangible assets and land. Intangible assets are not included in 1929 but are in 1939.
1944. and 1946.7 Sinking funds: other funds; deferred charges; organization expenses; suspense items;
prepaid items (prepaid insurance. prepaid taxes. etc.): interest, discount coupons, anddividends receivable: guaranty deposits, and deposits on contracts. meters. and lease.holds. Including intangible assets for 1929.
9 Including notes payable with original maturity of less than one year for 1929.18 Accrued expenses (interest, taxes, etc.); deferred and suspense items; funds held in
trust, borrowed securities; discount and dividends payable; outstanding coupons andcertificates: overdrafts; etc.
17 Buildings, fixed mechanical equipment, manufacturing facilities, transportation facili-ties. furniture, fixtures, and other depreciable assets, and natural resources.
18 Amount for 1929 was estimated by deducting, from the 1939 figure, expenditures on newplant and equipment in 1930-39; see Table 4.
19 Amount for 1929 was estimated by deducting from the 1939 figure $16 billion for de-preciation charges in 1930-39; see Lowell Chawner, 'Capital Expenditures for Manu.facturing Plant and Equipment—l915 to 1940'. Survey of Current Business, March 1941.p. 12, Figure 5.
20 Patents, franchises, formulas, copyrights. leaseholds, good will, trademarks, and otherintangible assets. For 1929 data on intangible assets are included in 'Miscellaneousassets'. For 1944 intangible assets are included in lines 18 and 19 because separate dataare not available.
23 Amount for 1929 computed as a residual from lines 6, 18, and 19.24 Survey of Current Business, July 1947. Supplement, p. 27, Table 14.

286 PART II
1 Balance Sheet Items, 1929 and 1939The summary is divided into two sections because 1939 is thelast year of the peacetime economy and also the last year forwhich complete statistical data are available. Holdings ofliquid assets, as a percentage of total assets, were about the samein 1939 as in 1929. Cash and bank deposits were larger, evenabsolutely, both when amounts in 1929 dollars are deflated forchanges in the price level and when amounts in current dollarsare compared (increase of 67 and 39 percent respectively). Re-ceivables were considerably smaller, reflecting the smaller vol-ume of. business in 1939.29 Corporations held slightly higherreserves for bad debts in 1929 than in 1939 (2.21 and 2.18percent of the respective gross amounts in current dollars).Holdings of government obligations decreased 31 percent (incurrent dollars).
At the end of both 1929 and 1939 inventories were unusuallyhigh. In 1939 prices the increase was 15 percent. However,nearly 47 percent of the amount for 1939 represented stocksof goods held by war industries (Table 2).
Table 2Manufacturers' Inventories, War and Nonwar Industries,
1939 and 1943
(millions of current dollars)
WAR INDUSTRIES NON WAR INDUSTRIESRaw material & Finished Raw material & Finishedwork in process goods work in process goods
Dec. 31, 1939 9,194 1,725 8,120 2,530Sept. 30, 1943 8,130 1,887 5,180 2,522
Survey of Current Business, Jan. 1944, p. 9. Munitions output reached a peakin 1943.
'Other investments', comprising stocks, bonds of domesticand foreign corporations, mortgages, real estate, and otherinvestments, increased considerably, about $2 billion, between1929 and 1939. A group of large manufacturing corporations(representing less than a third of all manufacturing corpora-29 Cf. data on corporate sales, Survey of Current Business, July 1947, Supple-ment, p. 41, Table 29, line 'Manufacturing'.
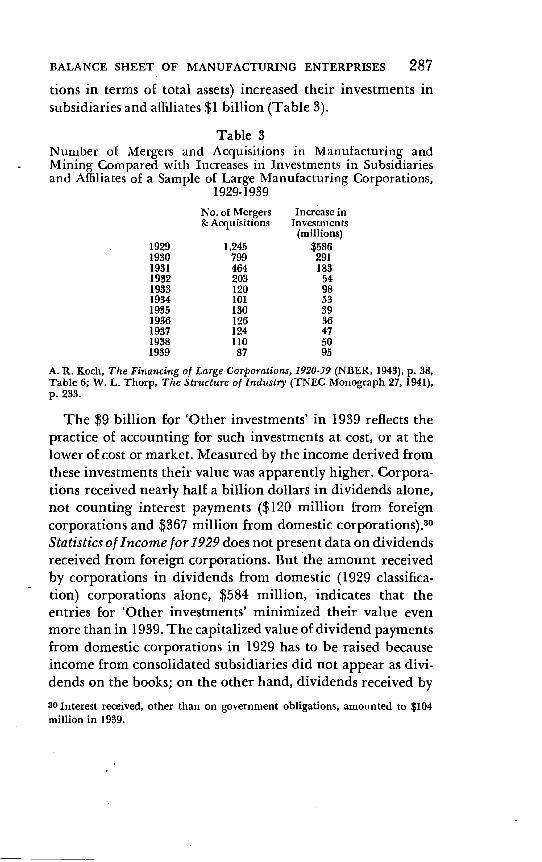
BALANCE SHEET OF MANUFACTURING ENTERPRISES 287tions in terms of total assets) increased their investments insubsidiaries and affiliates $1 billion (Table 3).
Table 3Number of Mergers and Acquisitions in Manufacturing andMining Compared with Increases in Investments in Subsidiariesand Affiliates of a Sample of Large Manufacturing Corporations,
1929-1939No. of Mergers Increase in& Acquisitions Investments
(millions)1929 1,2451930 799 2911931 464 183
1932 203 541983 120 981934 101 531935 130 391936 126 361937 124 47
1938 110 501939 87 95
A. R. Koch, The Financing of Large Corporations, 1920-39 (NBER, 1943), p. 38,
Table 6; W. L. Thorp, The Structure of industry (TNEC Monograph 27, 1941),
p. 233.
The $9 billion for 'Other investments' in 1939 reflects thepractice of accounting for such investments at cost, or at thelower of cost or market. Measured by the income derived fromthese investments their value was apparently higher. Corpora-tions received nearly half a billion dollars in dividends alone,not counting interest payments ($120 million from foreigncorporations and $367 million from domestic corporations).3°Statistics of Income for 1929 does not present data on dividendsreceived from foreign corporations. But the amount receivedby corporations in dividends from domestic (1929 classifica-don) corporations alone, $584 million, indicates that theentries for 'Other investments' minimized their value evenmore than in 1939. The capitalized value of dividend paymentsfrom domestic corporations in 1929 has to be raised becauseincome from consolidated subsidiaries did not appear as divi-dends on the books; on the other hand, dividends received by30 Interest received, other than on government obligations, amounted to $104million in 1939.

288 PART II
subsidiaries not engaged in manufacturing have to be de-ducted. The value of foreign investments at the end of 1939,of course, was affected by the war in Europe, which causedmany companies to write off their European investments inpart (e.g., Eastman Kodak).
The decrease in book values for capital assets (minus depre-ciation), about 16 percent (in current dollars),31 is due, at leastpartly, to the following factors:1) The high book values for capital assets in 1929 were due tolarge additions at relatively high costs during the precedingyears (see' Table 4).31 From the amount in Table 1, line 6, for 1939, In tangible assets, net (line 21minus 22) must be deducted, as 1929 data on capital assets do not include in-tangibles. Note that the depreciation reserves (about $20 billion at the end of1939) were accumulated only in an accounting sense.
Table 4Private Expenditures for New Manufacturing Plant and
Equipment, 1921-1946(millions of dollars)
Current 1939prices prices
1921-24 (4-year total) 6,690 6,7521925-28 (4-year-total) 8,733 8,698
1929 2,739 2,6831980 1,908 2,028
1931-36 (6-year total) 5,997 6,887
1937 2,160 2,1911938 1,393 1,4051939 1,572 1,5721940 2,580 n.a.1941 3,400 n.a.1942 2,760 n.a.1943 2,250 n.a.1944 2,390 n.a.1945 3,210 n.a.1946 5,910 n.a
1921-39: Lowell Chawner, 'Capital Expenditures for Manufacturing Plant andEquipment—1915 to 1940', Survey of Cu'rrent Business, March 1941, pp. 10, 11,Tables 1 and 3; 1940-46: SEC, Statistical Series, Plant and Equipment Expend-itures oE U.S. Business.
The data for the two periods are not strictly comparable in that service,maintenance, selling and other activities are not included in Chawner's series;for other differences, see G. B. Wimsatt, Survey of Current Business, Dec. 1946,p. 20.n.a.: not available.

BALANCE SHEET OF MANUFACTURING ENTERPRISES 2892) During the depression of the 1930's many enterpriseswrote down their fixed-asset values to lower 'going-concern'values or to estimated replacement cost. Actual retirementsseem to have been smaller than depreciation charges. Whenthe value of capital equipment went up again at the end of thedecade, book values of capital assets were not written up. Somestudies have shown that during 1930-33 about 40 percent ofthe companies reporting wrote down their assets.32 Writeupsor writedowns are generally not recognized by the Bureau ofInternal Revenue, as pointed out above. However, exceptionsto the general rule were apparently numerous enough in the1930's to lower appreciably the compiled total for capital assetsof manufacturing corporations as reported in Statistics of In-come for 1939, the basis of our estimates for 1939.3) In the early 1930's "deductions for depreciation claimed[and allowed] in income tax returns were in many instancesexcessive", according to the Commissioner of Internal Reve-nue.33 This was possible under regulations of the Bureau ofInternal Revenue which provided that "deductions will notbe disallowed unless shown by clear and convincing evidenceto be unreasonable".34 Beginning with 1934 the burden ofproof was put upon the taxpayer without any qualification.35This change was expected to reduce total annual depreciationcharges by corporations about one-third.3682 For details, see Avery, Accounting for Depreciable Fixed Assets, p. 142. F. C.Dirks estimated, in 'Postwar Capital Formation and Its Financing in Manufac-turing and Mining Industries' (Federal Reserve Board, Postwar EconomicStudies, 5, Sept. 1946), p. 11, that "the gross value of plant facilities at the begin-fling of 1941 is probably 20 percent or more understated owing to various write-downs . .
33 Annual Report, Fiscal Year ended June 30, 1934, pp. 9.10. This view has beendisputed; see citations in L. H. Kimmel, Depreciation Policy and Postwar Expan-sion (Brookings Institution, 1946), p. 26.34 Regulations 74 and 77, Art. 205.35 Decision 4422, approved February 28, 1934.30 For comment on this change of policy see, for example, E. A. Saliers, Depre-ciation Principles and Application (Ronald Press, 3d ed., 1939), p. 201, andFabricant, Capital Consumption and Adjustment, pp. 85-6. Avery, Accountingfor Depreciable Fixed Assets, p. 14, pointed out that "comparatively little con-sideration was given to the proper accounting of fixed assets in the 1920's andearly 1930's." i.e., before T.D. 4422.

290 PART H
4) The trend in the change of the ratio of expenditures forequipment to total new plant and equipment outlays contin-ued in the 1930's (also in the 1940's). A constantly increasingpercentage of total expenditures has been going into newequipment and a steadily decreasing percentage into newplant.37 By this standard alone, total expenditures for plantand equipment have increasingly become more efficient perdollar value of investment, if changes in the price level arenot considered. The division for 1939 is shown in Table 5.
Table 5Expenditures for Plant and Equipment by Type, 1939
%of$ million total
New construction & major alterations of buildings 391 29New machinery & operations equipment 855 64Plant equipment acquired in a 'used' condition '18 6
Total 1338 100
Census of Manufactures, 1939, 1, 364.LINE
1 Includes other fixed plant and structures.B From other owners and expenditures for land.4 About 1 percent of the total is unclassified.
5) Technological changes in the 1930's were "directed pri-marily at improving the existing industrial technology in con-tradistinction to the earlier changes which tended to make theprevailing techniques and the existing equipment obsolete" 88and, according to this view, brought about a decrease in theneed and demand for new capital assets.37 For manufacturing and mining the average for 1919-21 was 51.0 percent; for1927-29, 59.6 percent; for 1937-39, 64.1 percent (Survey of Current Business,April 1948, p. 14); for manufacturing alone, see Chawner's estimates, Surveyof Current Business, March 1941, pp. 10, 11.88 David Weintraub, 'Effects of Current and Prospective Technological Develop.ments upon Capital Formation', American Economic Review, Vol. 29 (1939),Part 2, pp. 15.32, refers especially to the increasing utilization of large.capacityequipment with resulting lower cost per unit of capacity and smaller floor spacerequired per unit of capacity, the increasing importance of industrial measuringand controlling devices, improvements in the composition of metals, extendingthe life of equipment, chemical advances frequently accomplished without anyor relatively small capital expenditures.

BALANCE SHEET OF MANUFACTURING ENTERPRISES 291
In the light of the above mentioned factors, the decreasein book values for net capital assets between 1929 and 1939takes on a different aspect. Even if depreciation charges couldbe assumed to measure exactly the consumption of capital andif the original cost could be accurately adjusted for changes inthe price level, an intertemporal comparison of the thus ad-justed book values for capital assets, net, has only limited justi-fication. It considers the volume of replacements and additionsto be the decisive criterion. However, in a dynamic economy,'replacement' actually in most cases means not replacement byidentical producer goods, but replacement by producer goodsof higher efficiency.39 This fact is at the bottom of the discrep.-ancy between the picture presented by measures of capacity orproductivity and the one presented by book values.
Measures of productivity, such as horsepower or output perman hour, showed an increase of 25-30 percent between 1929and 1939.Horsepower: Electric motors of all manufacturing establish-ments increased from 34 million horsepower to 45 million;generating capacity similarly rose one-third. Total horsepowerrose from 41.1 million to 50.5 million. Horsepower per 100wage earners increased 30.8 percent.4°Output per manhour. The Federal Reserve Board index of
C
39 For an interesting analysis of the problem, see A. C. Pigou, 'Net Income andCapital Depletion', Economic Journal, Vol. 45 (June 1955), pp. 235-41, at 259:"Will depletion be offset by the manufacture of an element like the originalelement or by the engagement in creating capital of a quantity of resources equalto the quantity that was engaged on the original element? If the cause of thediscarding is a valuation change, there can plainly be no question of reproduc-ing the discarded element. . . . The right solution is . . . as follows. When anydiscarding has in order to make good the depletion of capital impliedin it, that quantity of resources must be engaged which would suffice in actualcurrent condition of technique to reproduce the discarded element. But thedirection in which this quantity of resources is engaged should be determinedwithout reference to what the discarded element has been; it should be sochosen that the maximum possible addition is made to the present value of thestock of capital." a
40 K. C. Stokes, 'Shifts in Installed Horsepower in Manufacturing', Survey ofCurrent Business, Jan. 1943, p. 26.

292 PART II
industrial production for all manufacturing industries de-creased slightly, from 110 in 1929 to 109 in 1939. This de-crease, together with the drop in the number of full-time equiv-alent employees (from 10,428 thousand to 9,967 thousand)and the considerable shortening of the actual work week,42 ex-plains why the index of manhours per unit of output fell 24percent.43 Output per manhour, it is true, is not a perfect yard-stick for measuring the productive capacity of capital stock.Differences in the intensity of work performance have to beconsidered between periods of full employment and of consid-erable unemployment, as well as changes in the educationallevel and the distribution between skilled and unskilled labor.Another important variable is the amount of idle equipmentor the degree of capacity utilization. Improvements in 'man-agerial' techniques also have to be kept in mind.44
Measures of capital in terms of equipment show a differentpicture. Few data on equipment used by manufacturing indus-tries are available. According to the American Machinist,which takes a quinquennial survey of machine tools owned bythe metal working industries, the number of machine tools inplace decreased more than 10 percent between 1930 and 1940,while tools over ten years old increased from 49 percent of thetotal number of tools in 1930 to 72 percent of the total numberin Was the smaller number of tools in place in 194041 Survey of Current Business, July 1947, Supplement, p. 36, Table 24.42 From 48.3 to 37.6 hours for production workers in 25 manufacturing com-panies (NICB, Economic Almanac, 1918, p. 113).43 From 42 in 1929 to 32 in 1939 (Solomon Fabricant, Employment in Manu-facturing, 1899-1939; NBER, 1942; p. 331). The increase in productivity anddecrease in manhours per unit of product varied widely. Output per manhourincreased 229 percent in the rayon industry but only 11 percent in bread andother bakery products (Productivity and Unit Labor Cost in Selected Manu-facturing Industries, 1919-1910; BLS, 1942; pp. 90 and 6).44 On the latter point, see examples given by Weintraub, op. cit., pp. 15-16, 32,at p. 24. Important 'managerial' improvements during the depression broughtabout the reduction of floor space per unit of output or an increase in pro-ductivity with only modest, if any, capital expenditures.45 American Machinist, July 5, 1945, pp. 97-112; Dec. 6, 1945, pp. 105-20.

BALANCE SHEET OF MANUFACTURING ENTERPRISES 293Table 6
Index of Machinery Production and Exports of Machinery,1923-1946
Index of Exports ofmachinery machineryproduction (monthly average;
(1935-39 av: 100) $ million)(1) (2)
1923 86 23.5
1924 81 25.9
1925 89 30.6
1926 102 33.8
1927 99 36.2
1928 106 41.1
1929 130 50.6
1930 100 43.0
1931 66 26.4
1932 43 11.0
1933 50 11.0
1934 69 18.2
1935 83 22.1
1936 105 27.9
1937 126 40.0
1938 82 40.6
1939 104 41.9
1940 136 56.1
1941 221 61.7
1942 340 63.5
1943 443 99.5
1944 439 123.1
1945 843 99.2
1946 240 114.0
Average 1923-29 99 34.5Average 1930-39 83 28.2Average 1940-46 309 88.2
Survey of Current Business, Supplement, 1942, p. 7 (1923-38); Supplement, 1947,pp. 10, 100.
COLUMN1 Includes electrical machinery. The series begins in 1923.
2 Includes agricultural, electrical, metal working and other industrialmachinery. Data in current dollars.
not more efficient than the larger number of tools availablefor 1930, owing to changes in quality? 40
The annual average of machinery supplied in 1930-39 wasabout 16 percent less than in the seven-years 1923-29. For1933-39, the decrease is oniy 11 percent (Table 6). The FRB46 See Andrew T. Court (General Motors Corporation, Labor Economics Sec-tion), in NICB, Studies in Business Poticy, 15, pp. 14-7, at 15: "A . . . majoradvance in metal cutting technology began about 1930 with the introductionof tools tipped with tungsten carbide or similar carbide-composition cuttingedges. Again, these cutting edges required new, more powerful, and more rigid

294 PART II
index for machinery includes machinery other than that usedby manufacturing industries, it is true. Exports likewise wouldhave to be deducted.47 1-lowever, the proportion of total pro-duction going to domestic manufacturing industries presuma-bly did not change sufficiently to affect the validity of the abovecomparison.
Data on the volume of domestic shipments (or similar infor-mation) concerning specific types of manufacturing equipmentare usually not available, most series being given in dollars.The annual average of domestic shipments of industrial elec-tric trucks and tractors, for example, decreased 25 percentbetween 1925-29 and 1935-39 (Table 7).
There was 144 percent more floor space in manufacturingbuildings ten years old or less at the end of than at theend of 1939, according to Chawner's estimates of new floorspace added in Plant expenditures (1939 prices) were78 percent bigger in 1920-29 than in 1930-39 (Table 4).
These data, as well as the decline in the proportion of totalexpenditures (plant and equipment) going into new plants,49clearly show a trend to the more 'intensive' building of fac-tories; in other words, an increase of productive capacity perunit of floor space.
The value of 'Intangibles', including patents, in 1929 and1939 cannot be compared because of lack of data for 1929. Amachine tools. Beginning about 1935, when the price of the new cutting materialhad dropped, many of the machine tools for the mass.production industries werebuilt primarily to take advantage of the full capacity of carbide tips. Theresulting increase in the effective rate of metal cutting probably offset the re-strictive practices introduced by unions . .
According to a survey of machine tool users covering 251 plants employing200,000 workers in 1938, of 11,610 machines purchased in 1936 and 1937, 4,666were acquired for the specific purpose of replacing old ones and were substitutedfor 7,377 machines. As those were years of increasing production the totalcapacity of the machines used for replacement was presumably at least equalto that of the machines scrapped (Weintraub, op. cit., p. 22).47 Exports in 1989 amounted to approximately 10 percent of the value of prod-ucts of the industrial groups 'Electric Machinery' and (exceptElectrical)'.48 Survey of Current Business, March 1941, p. 11, Table 2.49 Ibid., pp. 10, 11, Tables 1 and 3.

BALANCE SHEET OF MANUFACTURING ENTERPRISES 295Table 7
Shipments of Selected Durable Equipment, Number of Units,1929-1946
IndustrialMechanical electric trucks Furnaces, dcc-
MONTHLY stokers & tractors tric, indus-AVERAGE Sales a Domestic Shipments b trial (1,000 kw.) C
1929 n.a. 160 n.a.1930 n.a. 90 n.a.
1931 n.a. 44 n.a.1932 n.a. 20 n.a.1933 143 42 n.a.1934 178 47 n.a.1935 193 71 n,a.1936 281 97 4.71937 274 145 4.11938 201 56 1.41939 261 76 3.61940 235 131 10.1
1941 307 286 15.41942 875 364 40.91943 507 357 13.11944 823 365 10.91945 349 302 8.71946 340 226 6.6
AVERAGE1925-29 n.a. 119 n.a.1933-39 219 76 n.a.1936-89 254 94 3.51940-46 348 283 15.1
Survey of Current Business, Supplement, 1942, p. 145; Supplement, 1947, p. 155.n.a.: not available.
Classes 4 and 5, i.e., for large commercial and high pressure steam plants. Thereporting manufacturers produced approximately 95 percent of the total valueof output of the industry in prewar years; since then nearly 100 percent.b Data cover the entire industry. The series begins in 1925.
Sales, comprising 85 to 95 percent of total sales for industrial purposes.
comparison of compiled book values for intangibles would notbe very meaningful in any event, since many companies wrotedown their intangibles to zero during the 1930's.
The sharp drop in 'Miscellaneous assets' is due mainly to thefact that the returns of corporations became more completewith respect to the definite allocation of their types of assets.5°
As for the liabilities of manufacturing enterprises in 1929and 1939, the amount for accounts and notes payable withinone year decreased substantially, paralleling the decrease50 Intangibles were included in 'Miscellaneous assets' in 1929.

296 PART II
receivables, while long term debt increased about 10 percentin current dollars. The net effect was a decrease in the ratio ofreceivables to payables, from 0.8 to 0.6. Had the 1929 data notbeen deconsolidated—or if figures in Statistics of Income arecompared—it would seem as though accounts and notes pay-able within one year had decreased only slightly.
Net worth decreased about 13 percent between 1929 and1939, when amounts in current dollars are compared. When1929 figures are deflated for changes in the price level, the dropis only about 3 percent. A comparison based on figures for 1929,which are not deconsolidated and reclassified, would obviouslybe erroneous as the raw 1929 figures include the assets of min-ing and trading companies consolidated in the income taxreturns of manufacturing corporations. Such a comparisonwould show a more substantial decrease in net worth.5'
The aggregate market value of the stock of all manufactur-ing corporations cannot be ascertained. A limited sample studyconcerning the ratio of the market value of stock to the bookvalue of the net worth of manufacturing companies in 1939and 1946 showed that the ratio varies considerably as betweentypes of company, depending on size, industry, age, dividendrecord, and other factors.
The price index of 365 industrial stocks was 132.7 in Decem-ber 1929, 97.6 in December 1939, 106.4 in December 1944, and128.9 in December 1946.52
2 Balance Sheet Items, 1939, 1944, 1946Generally all balance sheet items, in current dollars (exceptcapital assets and 'Other investments' which rose less) rose sub-stantially between the end of 1939 and the end of 1944. Whenfigures are deflated and the special character of the book values51 The findings regarding cash, marketable securities, receivables, and payablesare in harmony, as far as trends go, with Koch's findings from his sample oflarge manufacturing corporations (The Financing of Large 'Corporations,1920-39).52 1935-39:100. Standard-Poor's Trade and Securities Statistics, Security Priceindex Record (1948 ccl.), p. 84.

BALANCE SHEET OF MANUFACTURING ENTERPRISES 297for capital assets and 'Other investments' is considered, thetrends are more similar. By the end of 1946 all items (afterdeflation for the continued rise in prices) except inventories,capital assets, and net worth, which continued to rise, hadapparently declined again to an intermediary position betweenthe 1939 and the 1944 level.53
Holdings of liquid assets by manufacturing enterprises as apercentage of total assets were considerably higher in 1944 thanin 1939, but by 1946 had declined to the 1939 level (afterdeflation for changes in the price level).
The increase between 1939 and 1944 was especially markedin the holdings of cash and deposits in banks, and even moreso in investments in government obligations. Large concernsput most of the increase in liquid assets into government obli-gations, the smaller ones into cash. The accrued income taxliability of large, but not of small, concerns was covered byholdings of marketable securities.54 Demand deposits, andpresumably the total of cash and bank deposits, continued torise after 1944, reaching a peak in July 1945; cash and bankdeposits presumably declined to about $12 billion at the endof 1946 (all in current dollars). Investments in governmentobligations declined from nearly $12 billion (current) at theend of 1944 to presumably about $8 billion at the end of 1946,paralleling the decrease in accrued taxes. The increase of notesand accounts receivable between 1939 and 1944 was somewhatmilder, first because a considerable part of the 1944 output wassold to the federal government; secondly, because generallymore cash purchases were made. Between 1944 and 1946 re-ceivables presumably declined proportionately to sales. Tradecredits mounted, it is true, despite the smaller sales, as largeramounts were going to civilians instead of government. On the
Because of lack of data, 'Other investments' were assumed unchanged since1944.54 F. C. Dirks, 'Wartime Financing of Manufacturing and Trade Concerns',Federal Reserve Bulletin, 1945, pp. 313-30; see his Table 8 for the increase innet working capital for all size groups in 1940-43.55 Federal Reserve Bulletin, 1947, p. 691, Table 4.

298 PART II
other hand, these increases were probably offset by paymentsdue from the federal government.56
Inventories were about one-third higher in 1944 than in1939 (after deflation for changes in the price level). More thantwo-thirds of the increase between 1939 and 1943 was due tolarger stocks of goods held by the war industries. Even so,inventories of nonwar industries were nearly 15 percent higherin 1943 than in 1939 (after deflation for changes in the pricelevel) (Table 2). In both 1944 and 1945 there was a decreaseof more than $1 billion (after inventory valuation adjustment),due to the liquidation of war inventories.57 During 1946 stockswere replenished with peacetime goods, so that inventories atthe end of 1946 were about 40 percent higher than at theend of 1939 (in 1939 dollars). In the third quarter of 1946inventories were approximately evenly distributed betweendurable and nondurable goods industries.58
Book values of 'Other investments' increased about 22 per-cent (in current dollars) between 1939 and 1944, half of theincrease occurring in 1944. Interest payments received by cor-porations, other than on government obligations, amountedto $117 million. Dividend payments received in 1944 by cor-porations from domestic corporations amounted to $394 mil-lion, from foreign corporations to $92 The latteramount, even in current dollars, was smaller than the cone-sponding amount for 1939; the decrease was due to war condi-tions. No dividend payments were received in 1944 from cor-porations in Germany, Japan, or enemy-occupied countries.
Tangible capital assets, gross, increased at least $12 billionbetween 1939 and 1944 (Tables 1 and 4).°° Total net capital56 See D. Stevens Wilson, 'Planned Capital Outlays and Financing', Survey ofCurrent Business, July 1945, pp. 15 if., at 17. Receivables all business enter-prises were estimated to have increased considerably in 1946 (Federal ReserveBulletin, 1947, pp.57 Survey of Current Business, July 1947, Supplement, p. 45, Table 53.58 Federal Reserve Bulletin, 1947, p. 490.59 Figures presented in Statistics of Income are not adjusted for the consolidatedcharacter of part of the returns.60 Additions to property account, in 1940-42 especially, were due also to trans-fers from surplus and idle property to active property (e.g., General Motors).
BALANCE SHEET OF MANUFACTURING ENTERPRISES 299assets increased nearly 10 percent.°1 The actual net increase inmanufacturing plant and equipment was much larger. First,most new facilities were built with government funds, onlypart of which appeared on the balance sheets in 1944 or 1946.62Private new industrial construction (excluding land and equip-ment) in 1940-44 amounted to only $2 billion, while publicnew industrial construction amounted to $7 billion.63 Privateexpenditures on new manufacturing plant and equipmentwere about $13 billion (Table 4); expenditures by the govern-ment were about $14 billion (the latter between July 1940 andJune 1945).64 Approximately 75 percent of government ex-penditures went into privately operated plant and equipment,including plants operated on a fee basis by private concerns.
While some of these new facilities will be owned perma-nently by the federal government, others have proved to be ofcommercial value since the war. Contracts for the constructionof such facilities contained an option for their subsequent pur-chase by the private operating concern. Sales of war production(manufacturing) facilities between VE-Day and June 30, 1947amounted to $1.7 billion in cost value, $0.7 billion in terms ofsales price. To this must be added sales to manufacturing enter-prises of goods classified as 'Capital equipment and relateditems', amounting to $300 million or more. These purchasesseem to have been made at prices below current market prices.The process of surplus property disposal was not completed in61 The proportion of cash and other current assets to depreciation reserves wasmore favorable than in 1939; this may indicate that part of the reserves hadbeen accumulated in a real sense.62 General Motors, for example, excluded from its capital assets plant andequipment used in producing war materials, supplied by, or for which thepany was being reimbursed by United States, Canadian, or British governmentagencies. On December 31, 1946 it was custodian of plant facilities in the amountof $88 million, i.e., 14 percent of the capital assets, net, appearing on its balancesheet.03 Bureau of Foreign and Domestic Commerce, 'Construction and ConstructionMaterials', Industry Report, Statistical Supplement, May 1947, pp. 4 and 8.64 Facilities July) 1940-June, 1945 (Civilian Production Administra-tion, Jan. 16, 1946), p. 10, Table 8.

300 PART II
June 1947, when more than $2 billion worth (cost value) ofmanufacturing property remained to be disposed of. Althoughgenerally not or not easily convertible plant, these facilitiesmust be kept in mind when appraising the manufacturingcapacity of the country.65
Secondly, some of the facilities constructed during the warby private companies were depreciated at a considerably higherrate than would have expressed the actual decline in com-mercial value.66 Additions to manufacturing plant and facili-ties constructed or acquired under certificates of necessityamounted to $4.4 billion by June 30, 1945,67 i.e., about 30percent of total private expenditures on manufacturing plantand equipment since 1940. This overstatement of depreciationtends to be offset by two factors: the Bureau of Internal Reve-nue may not have fully recognized the increased activity fac-tor with respect to equipment not specially procured for de-fense production; 68 annual additions to depreciation reservesof prewar assets are understated, or rather insufficient to coverreplacementMost of the new expenditures on plant and equipment
during the war were in the metal, munitions, chemical, ship-building, and aircraft construction industries, which largelycontinue to use the equipment. Differences between the vari-ous industries are due also to the different paces of technologi-cal advance.
Private expenditures for new manufacturing plant andequipment in 1945 and 1946 were more than $9 billion (Table65 J. B. Epstein, 'War Surplus Disposals', Survey of Current Business, Oct. 1947,
p. 15, Tables 6 and 7; also, Federal Reserve Bulletin, 1947, pp. 487-97.66 In some cases adjustments of wartime amortization resulted in a net increasein capital assets, net, of as much as 8 percent; see, for example, Douglas AircraftCompany, Annual Report, 1945, p. 13.67 Civilian Production Administration, 'Facilities Expansion', Jan. 16, 1946, p. 12.68 A maximum increase of 50 percent was granted (Kimmel, p. 32).69 George Terborgh estimates that of $4 billion reported by corporations asdepreciation for tax purposes, $3 billion applies to prewar assets, and thatnual depreciation of these assets is understated by $1.5 billion (NICB, Studiesin Business Policy, 27, p. 17).

BALANCE SHEET OF MANUFACTURING ENTERPRISES 301
4). Private industrial construction (excluding land and equip-ment) cost $2.3 billion.70
The increase in book values of net capital assets 19 39-46 wasabout 20 percent presumably (Table 1, line 6). In evaluatingthis rise two factors in addition to those outlined in the preced-ing pages should be borne in mind:The ratio of equipment expenditures to total new plant andequipment outlays continued to rise. In this way, total expendi-tures for plant and equipment have become even more efficientper dollar value of investment than before the war.7' Duringthe war and immediately after, numerous and highly impor-tant improvements in machinery and production techniqueswere made. The WPB's Office of Production Research andDevelopment listed 800 new methods or improvements thatit disseminated to The significance of thesechanges and improvements for the value of the total stock,including the part acquired before the war, is difficult to ap-praise. The decisive question seems to be whether the majorityof the new methods introduced permit utilization of the oldstock, thereby rendering it more efficient, or whether, on thecontrary, the new inventions made obsolete a large part of theprewar assets. In the opinion of tool engineers, for example,the tools that helped the United States win World War II werealready obsolete by March70 Bureau of Foreign and Domestic Commerce, op. cit., p. 4.71 For manufacturing and mining the ratio was 64.1 percent in 1937-39 and 72.4percent in 1945-47 (Survey of Current Business, April 1948, p. 14).72 See Walker, 'American Productivity', Fortune, Jan. 1946, pp. 150-6, Feb. 1946,pp. 131-3, for a summary of industrially significant inventions.73 New York Times, March 16, 1948, p. 41. For an accountant's view of thematter, see W. H. Franklin, 'Productivity in Relation to Costs', NACA Bulletin,Vol. 28, No. 14 (March 15, 1947), pp. 859-68, at pp. 862-3: "Even though account-ants have tended to use what might be considered high depreciation rates, I donot feel they have been in many cases nearly high enough. We are all of us tooapt to look only at the physical life and discount the vastly more importantprobability, if not certainty, of early obsolescence. It is possible that many facili-ties are in use today, even though obsolete, because a sufficiently high enoughdepreciation rate has not been used."
For the opposite view, see Dirks, 'Postwar Capital Formation and Its Financ-ing in Manufacturing and Mining Industries', Federal Reserve Board, Postwar

302 PART II
The 20 percent rise in net book values between the end of1939 and 1946 compares with indicators of productive capacityas follows:1) The generating capacity of industrial establishments forown use had already risen about 20 percent in beforeexpenditures of $6 billion on new manufacturing plant andequipment in 1946 (Table 4).2) Output per manhour increased about 5 percent on theaverage for all manufacturing industries between 1939 and
The index of manufacturing production rose as muchas 62 percent, it is true. But this rise was accompanied by amore than 40 percent increase in the labor force and a length-ening of the average work week from 37.7 to 40.4 hours.
Especially as concerns 1939-46 it is doubtful that output permanhour is an appropriate index for the productivity of totalcapital stock. Changes in the composition of the labor forceand in labor practices, as well as the accuracy of the index mayaffect the picture.7° Furthermore, surplus property which wasbeing sold to manufacturing industries during 1946 without(or without fully) participating in the manufacturing processin that year is not included in the index. The same is true, ofcourse, for plant facilities under construction during 1946.
According to a survey by McGraw-Hill, manufacturing com-panies had completed 64 percent of their postwar expansionEconomic Studies 5, p. 11: or less offsetting the price consideration is thepossibility that the increased technological effectiveness of new materials andtypes of equipment in many lines may have compensated for changes in thedollar cost of like amounts of physical capacity."74 From 10.6 million kilowatts in 1939 to 12.7 million in 1945 (Statistical Abstractof the United States, 1946, p. 814, Table 931). These data include only establish-ments with capacities of 100 kilowatts or more. In view of the increase in theimportance of small establishments in the 1940's, the change was presumablymuch larger.75 Output per manhour in the rayon industry increased as much as 51 percentbetween 1939 and 1945; in the ice cream industry 53 percent; in several industriesit fell (BLS, Productivity and Unit Labor Cost in Selected Manufacturingtries, 1939-1945, May 1946, pp. 9, 7).76 See Frank R. Garfield, of Industrial Production Since 1939',Journal of the American Statistical Association, Vol. 39 (1944), pp. 439-54, andthe literature he cites on p. 439, n. 1.

BALANCE SHEET OF MANUFACTURING ENTERPRISES 303program by 1948. Under the program as a whole, capacity wasexpected to be 52 percent higher than in3) At the beginning of 1945, 70 percent more machine toolswere used by private metal working industries and owned bythe federal government than at the beginning of 1940.78 Toolsover ten years old declined from 72 percent of the total num-ber of tools in 1940 to 38 percent in 1945 (if tools owned by thefederal government are included); 54 percent (if tools ownedby the federal government are not included). Productionequipment other than machine tools increased 55 percent (in-cluding equipment owned by the federal government). In1940, 65 percent of the equipment was over 10 years old;in 1945, only 39 percent (60 percent if equipment owned bythe federal government is not included).79
The doubling of accounts payable between 1939 and 1944paralleled the increase in production (in current dollars). Theratio of receivables to payables (accounts payable, bonds, andnotes payable) was about the same in 1944 as in 1929 (0.8).Bonds, notes, mortgages payable with a maturity of less thanone year rose more than those with a maturity of more than oneyear. If the higher price level of 1944 is taken into considera-tion, the two items together decreased slightly since 1939. This,of course, reflects the stronger financial position of manufac-turing enterprises in 1944 due to high wartime profits, part ofwhich had been used to retire debt in 1942 and 1943. Between1944 and 1946 accounts payable presumably decreased becauseof the smaller volume of business. Bonds, notes, and mortgagespayable amounted to about $10 billion in 1944 and 1946.80 Theywere at a lower level, in dollars of constant purchasing power,in 1946 than in 1939. All bank loans (by members of the Fed-eral Reserve System) outstanding on November 20, 1946 from77 Business Week, Feb. 7, 1948, pp. 65-72.78 More than a third of the total number of machine toots in place in 1945 wereowned by the federal government.79 American Machinist, July 5, 1945, pp. 97-112; Dec. 6, 1945, PP. 105-20. 01course, the decade figure is not a perfect measure of obsolescence.80 Wilson, p. 19.

304 PART II
Table 8
Current Assets and Liabilities of 812 Registrants with the SECClassified as 'Manufacturing', 1943, 1944, 1946
(millions of current dollars)1943 1944 1946
Cash on hand & in banks 5,940 5,832 5,264U.S. tax & savings notes 2,731 2,751 1,096Other U.S. govt. 'securities 2,680 3,734 3,007Other marketable securities 173 175 136Receivables from U.S. govt. 3,761 3,536 328Other notes & accounts receivable 3,160 3,201 4,399Inventories 9,685 9,551 11,596Other current assets 100 102 413Total current assets 28,230 28,882 26,212
Notes payable to banks 1,000 1,219 875Advances & prepayments, U.S. govt. 1,715 1,455 73Other trade notes & accounts payable 3,049 3,133 3,035Federal income taxes accrued 5,694 5,328 2,389Other taxes accrued 757 764 509Renegotiation provisions 956 561 61Other current liabilities 1,323 1,377 1,427Total current liabilities 14,494 13,837 8,369
SEC, Statistical Series, Supplement to Release 775, June 26, 1947, Table 2.
manufacturing enterprises amounted to approximately $5 bil-lion; loans with an initial maturity of more than one year toabout $2 billion. To this must be added nearly half a billionfor loans by nonmember banks.81
'Other liabilities' rose from $2.2 billion in 1939 to almost$15 billion (current) in 1944, and presumably amounted toabout $8 billion (current) in 1946. These sharp fluctuationsare due to three factors:1) The largest item embraced in 'Other liabilities' during thewar was accrued income tax liabilities, estimated to be morethan $10 billion at the end of fiscal 1944.82 Federal incometaxes, accrued, of 812 manufacturing corporations registeredwith the Securities and Exchange Commission amounted to$5.3 billion at the end of 1944, declining to $2.4 billion by theend of 1946 (Table 8).81 For details, see Duncan Hoithausen, 'Term Lending to Business by Commer-cial Banks in 1946', Federal Reserve Bulletin, 1947, pp. 498-517, at 504; CharlesSchmidt, 'Member Bank Loans to Small Business', ibid., pp. 963-78, at 965.82 Wilson, p. 18.
BALANCE SHEET OF MANUFACTURING ENTERPRISES 3052) 'Provisions for war and postwar adjustments' also helpedto swell 'Other liabilities' in 1944 as well asin the other waryears. Some companies, e.g., E. I. du Pont de Nemours, dou-bled their reserves for contingencies between 1939 and 1944,and kept them at a high level through 1946. Other companies,e.g., Douglas Aircraft, restored substantial amounts that hadbeen booked under 'contingencies' during the war to surplusin 1946.
Reserves for contingencies during the war were increasedpartly because of the general uncertainty regarding the postwarsituation, partly for special reasons. For example, EastmanKodak and many other companies charged investments in sub-sidiaries and branches in war areas to reserve for contingencies.These amounts were at least partly recovered by the end of1946.
Higher replacement costs of capital assets were another rea-son for increasing reserves. According to a survey of businesspractices by the National Industrial Conference Board, "oneout of seven companies has established special reserves out ofearnings after taxes to provide at least in part for the highercost of replacement".83 Replacement reserves, however, havenot been recognized as deductible by the Bureau of InternalRevenue.843) Government contract advances and liabilities under re-negotiation agreements were substantial in 1944, but had beennearly eliminated by 1946 (Table 8).
Net worth increased from $46 billion in 1939 to $67 billionin 1944 and to nearly $73 billion in 1946 ($60 and $61 billionafter deflation of the balance sheet items). The increase since1944 is due partly to the methods of accounting, according towhich exceptionally large amounts were booked under 'con-83 Conference Board Business Record, Aug. 1947, p. 231. See also W. A. Cooper,'An Integrated Plan for Postwar Reserve Allowances', Journal of Accountancy,Vol. 76 (1943), p. 192.84 Note the distinction between valuation reserves and surplus reserves made in'Postwar Expenses Related to Wartime Income', Revenue Revision of 1943,Hearings before the Committee on Ways-and Means, 78th Cong., 1st Sess., p. 135.

306 PART II
tingencies' during the war and restored to surplus in 1946.85To this extent, net worth is understated for 1944.86
85 lii view of 102 of the Internal Revenuc Code, some C011ce19S havereErained from building up surplus rapidly.86 For data by asset size groups, and durable and nondurable goods industries,see Dirks, Federal Reserve Bulletin, 1945, pp. 313-30; A. R. Koch and E. J. Stock-well, 'The Postwar Financial Position of Business', ibid., 1946, pp. 1335-44;Warner and Koch, 'Financial Developments among Large Manufacturing Cor-porations, 1945', ibid., pp. 1106-14. See also A. R. Koch and C. H. Schmidt,'Financial Position of Manufacturing and Trade in Relation to Size and ProfIta-bility, 1946', ibid., 1947, pp. 1091-102.
APPENDIX
A Affiliations with Subsidiaries
Corporations owning nearly two-thirds of total assets of allmanufacturing corporations had affiliations with subsidiariesin 1929 that made it advisable to file a consolidated return forthe affiliated group. In 1939 the privilege of filing a consoli-dated return was not open to not fully consolidated groups ofmanufacturing corporations.
The degree and character of the consolidation of registeredmanufacturing corporations at the end of the 1930's can begathered to some extent from balance sheet data based largelyon consolidated statements and published by the Securitiesand Exchange Commission. In 1937 only 293 of 1,021 regis-trants in the 'manufacturing' group had no subsidiaries(Table 9). It has been the practice of the SEC to accept con-solidated statements whenever submitted by registrants.'
For 1937 alone is information available on the number,character—domestic or foreign, active or inactive, consolidatedor not—and distribution of subsidiaries of registrants with theSEC in 'manufacturing' and all its subgroups. For other yearssimilar information is available only for individual registrants.1 Statistics of American Listed Corporations, Part 2. pp. 21-2.

BALANCE SHEET OF MANUFACTURING ENTERPRISES 307Table 9
N timber and Types of Subsidiaries, 1937(Based upon statements of 1,961 registrants with the SEC classified
as 'manufacturing')Number of Registrants
Total 1,021
Without subsidiaries 293With subsidiaries
No active subsidiaries 671-10 active subsidiaries 54211-20 active subsidiaries 5221 or more active subsidiaries 67 b
Number of Subsidiaries CTotal 7,804
Domestic and foreign consolidated 5,335Domestic and foreign active 6,103
0 Domestic, total 5,763Of which 95% & over are controlled 4,395
Foreign, total 2,041Of which 95% & over are controlled d 1,534
Domestic inactive, total 1,425Of which 95% & over are controlled d 1,241
SEC, Statistics of American Listed Corporations, Part 1, pp. 160-1, 163-4.Excluding registrants that are consolidated or unconsolidated subsidiaries of
other registrants. Consolidated subsidiaries are those in which the registrantowns directly or indirectly more than 50 percent of the voting stock and thatwere included in the registrant's consolidated statements. Subsidiary refers to anaffiliate controlled by the registrant directly, or indirectly through one or moreintermediaries.
Steadily declining numbers in the brackets 21-30, 31-50, 51-100, 101 and more.Including registrants that are consolidated or unconsolidated subsidiaries of
other registrants.95 percent and over are controlled by intermediate parent. The remainder is
less than 95 percent controlled or the percentage of control was not indicated inthe report. The degree of control by the immediate parent is measured by thepercentage of voting power represented by securities of the subsidiary ownedby the immediate controlling parent.
The figures for 1937 may give an approximate picture of thesituation in 1939. The increase of investments in affiliatesfrom 3.2 percent of net worth in 1937 to 4 percent in 1939 mayindicate a trend toward expansion and stronger consolidation.However, it may be due partly to a change in accounting prac-tice as a result of war conditions: some companies did not con-solidate various foreign subsidiaries that had been consolidatedin prior years.22 Ibid., p.7, n. 1.

308 PART II
More than a fourth of all subsidiaries were incorporatedabroad. Most inactive subsidiaries were domestic. The averagenumber per registrant in the manufacturing group reportingactive subsidiaries was 9.2. The smallest registrants, i.e., withassets of less than $1 million, averaged only 2.4 active sub-sidiaries per registrant for all industries; the correspondingfigure for registrants with assets of $500 million and over was
Direct subsidiaries—active and inactive, domestic and for-eign—represented 74 percent of the total in 'manufacturing',the remainder being two or more steps removed; the corre-sponding percentage for domestic active subsidiaries was 78.5.For all industries, registrants with assets of less than $1 mil-lion directly controlled 93 percent of the total number oftheir subsidiaries, while the corresponding percentage forregistrants with assets of $500 million and over was
The total assets of the 1,030 registered companies (includ-ing their consolidated subsidiaries) that were classified by theSEC statistics as manufacturing, amounted to 58 percent ofthe assets of all corporations classified as manufacturing inStatistics of Income for 1939. If the SEC data are adjusted toallow for the overstatement due to the different industrialclassification and for the consolidated character of the state-ments, this percentage is reduced to about 51. The adjust-ment is based on the assumption that total assets are decreased12 percent after deconsolidation and reclassification, a per-centage computed for the corporations that submitted con-solidated returns for 1933 (Table 10).
At the end of 1943 the total assets of 1,087 corporationsregistered with the SEC amounted to 52.6 percent of the totalassets of all corporations classified as manufacturing in Statis-tics of Income for After deconsolidation and reclassifica-3 Statistics of American Listed Corporations, Part 1, presents data also on sub-sidiaries by asset size groups of registrants, but not classified by industry groups.4 Ibid., pp. 29-30, 160-1, 163, 164.5 Comparable data for 1944 have not been published by the SEC.

Tabl
e 10
: Eff
ect o
f Dec
onso
lidat
ion
in 1
934
on M
anuf
actu
ring
Cor
pora
tions
(mill
ions
of d
olla
rs)
Cha
nge
1933
—34
(5)
(6)
—as
%of
(1)
(1)
(5)
(6)
(7)
1,51
83,
510
3,79
271
06,
681
14,4
031,
712
32,3
26
1,61
36,
969
4,06
269
612
,601
13,1
362,
334
41,4
11
953,
459
270
—14
5,92
0—
1,26
762
19,
084
6.25
98.5
57J
2—
1.97
88.6
2—
8.79
36.2
728
.11
RET
UR
NS
CO
NSO
LID
ATE
D IN
193
3
Cha
nge
1933
—34
(2)
(3)
—as
%of
1933
a19
34b
(1)
(1)
(1)
(2)
(3)
(4)
Cas
h1,
248
Not
es &
acc
t. re
c.4,
274
Inve
ntor
ies
3,77
0In
vest
men
ts, t
ax-e
xem
pt51
7In
vest
men
ts, o
ther
5,30
7C
apita
l ass
ets
10,6
98O
ther
ass
ets
1,49
4To
tal a
sset
s27
,308
Not
es &
acc
t. pa
y.3,
912
Bon
ds, m
ortg
ages
2,57
7O
ther
liab
ilitie
s1,
858
Cap
ital s
tock
13,3
82Su
rplu
s les
s def
icit
5,57
9To
tal l
iabi
litie
s27
,308
Con
solid
ated
retu
rns f
or c
orpo
ratio
ns su
bmitt
ing
bala
nce
shee
tsan
d re
porti
ng o
n a
cons
olid
ated
bas
is in
193
3, b
y th
eir 1
933
indu
s-tri
al c
lass
ifica
tion;
Sta
tistic
sof
Inco
me
for
1934
. Par
t2,
Tab
le 1
1,p.
146
.b
Unc
onso
lidat
edre
turn
s for
cor
pora
tions
repo
rting
on
a co
nsol
i-da
ted
basi
s in
1933
, by
thei
r 193
3 in
dust
rial c
lass
ifica
tion;
ibid
.,Ta
ble
14, p
. 186
.U
ncon
solid
ated
retu
rns f
or c
orpo
ratio
ns re
porti
ng o
n a
cons
oli-
date
d ba
sis i
n 19
33, b
y th
eir 1
934
indu
stria
l cla
ssifi
catio
n, ib
id.,
RET
UR
NS
NO
T C
ON
SOLI
DA
TED
IN 1
933
Effe
ctC
hang
eof
Dc-
1933
—34
cons
oli-
(9)
(10)
datio
n—
as%
ofas
%of
J933
dl9
34e
(8)
1933
(1)
(8)
(9)
(10)
(11)
(12)
1,56
71,
758
191
1239
—24
.13,
255
3,20
9—
46—
1.41
23.2
4,29
24,
549
257
5.99
—7.
61,
273
1,08
6—
187
—14
.69
—25
.22,
817
2,74
7—
70—
2.48
—18
.19,
982
9,75
3—
229
—2.
29—
16.9
2,24
12,
112
—12
9—
5.76
—7.
025
,427
25,2
15—
212
—0.
83—
11.6
2,87
03,
496
2,10
316
,545
7,31
132
,326
—27
076
4—
22—
193
—1,
374
—3,
705
—21
8—
5,01
9
1,04
2—
919
—24
5—
3,16
3—
1,73
2—
5,01
9
6,79
73,
674
2,80
219
,798
8,34
041
,411
—17
.79
21.7
7—
0.58
—27
.18
—20
.57
—25
.72
—12
73—
15.5
3
36.3
1—
26.2
9—
11.6
5—
19.1
2—
23.6
9—
15.5
3
3,92
717
869
93,
253
1,02
99,
084
f S S S S
28.1
1
2,85
22,
855
30.
105
36.2
1,52
51,
448
—77
—5.
05—
21.2
1,56
41,
721
157
10.0
4—
21.7
13,8
5313
,549
—30
4—
2.19
5,63
25,
642
100.
18—
25,4
2725
,215
—21
2—
0.83
—11
.6
Tabl
e 12
, pp.
162
-3. '
Unc
onso
lidat
ed' i
n no
tes b
-e, e
xcep
t for
fisc
alye
ar c
ompa
nies
.U
ncon
solid
ated
retu
rns f
or c
orpo
ratio
ns n
ot re
porti
ng o
n a
con-
solid
ated
bas
is in
193
3, b
y th
eir 1
933
clas
sific
atio
n, ib
id.,
Tabl
e 11
, p. 1
54.
0U
ncon
solid
ated
retu
rns f
or c
orpo
ratio
ns n
ot re
porti
ng o
n a
con-
solid
ated
bas
is in
193
3, b
y th
eir 1
934
indu
stria
l cla
ssifi
catio
n, ib
id.,
Tabl
e 12
, p. 1
70.
'Not
nee
ded
for c
ompu
ting
col.
12.

310 PART H
tion of the SEC data and the consolidated data in Statistics ofIncome, the percentage is reduced to about 47•6
B Relative Importance of Corporate and NoncorporateEnterprises
Noncorporate enterprises decreased in relative importancebetween 1929 and 1939. In 1929 noncorporate enterprisesaccounted for 8.1 percent of the total value of product ofmanufacturing enterprises; in 1939 for only 7.4 percent. In-ventories held by noncorporate enterprises similarly declinedabout 1 percent, from nearly 7 percent at the end of 1929 tonearly 6 percent of total inventories at the end of
Data on the value of product of noncorporate enterprisesare not available for years since 1939. Operating manufactur-ing firms increased from more than 214,000 at the end of 1939(236,000 at the end of 1944) to more than 305,000 at the end of1946 (Table 11) apparently because of the growth of the non-corporate sector.86 Comparisons of SEC and Statistics of Income balance sheet data for the manu-
facturing group are rather hazardous, mainly because of differences in classifica-tion arising from the use of consolidated statements in the SEC statistics, on theone hand, and the use of unconsolidated statements in Statistics of Income for1939 and the small importance of consolidated statements submitted to theBureau of Internal Revenue for 1944, on the other. In general, the end productor operation (determined in most cases by the principal source of gross revenue)was the basis of industrial classification for the SEC data. This resulted in anunderstatement of the number of companies engaged in certain primary activi-ties. For example, many of the leading metal mining companies appear amongmanufacturing industries. Furthermore, since the unit of classification was thecompany and its consolidated subsidiaries, several companies generally reportedas holding companies whose assets consisted mainly of securities of operatingsubsidiaries were classified as operating companies (Statistics of American ListedCorporations, Part 1, pp. 6-7; Part 2, pp. 7-8). These methods of industrial classi-fication and the consolidated character of the statements submitted to the SEClead to an overstatement of net assets, total assets, and all other balance sheetitems except receivables and payables.7 The percentage for 1929 in Table 11 was derived from consolidated data. Thepercentage given here was computed after deconsolidation.8 The number of manufacturing corporations filing income tax returns declinedfrom 86,183 in 1939 to 76,619 in 1944.

BALANCE SHEET OF MANUFACTURING ENTERPRISES 311Table 11
Corporate and Noncorporate Manufacturing Enterprises,1929, 1939, 1944, 1946
(millions of current dollars)1929 1939 1944 1946
1 Corporate profits before taxes 5,038 3,712 13,741 10,8582 Income of unincorporated enterprises 512 378 1,536 1,9063 Line 2 as % of line I plus 2 9.2 9.2 10.1 14.94 Inventories, noncorporate as % of total 6.4 5.8 n.a. n.a.5 Value of product, noncorporate as % of total 8.1 7.4 n.a. n.a.6 No. of operating business firms (000) 211.Oa 236.2b 305.1c7 No. of active proprietors of unincorporated
enterprises (000) 133 124 133 164
n.a.: not available.Number of establishments or groups of establishments under the same manage.
ment and in the same city, classified as manufacturing by the Census of 1929.September 30.December 31.
LINE1-2 Survey of Current Business, July 1947, Supplement, Tables 16-17.4 Computed from Table 14 (1929 and 1939).5 Census of Manufactures, 1939, I, 228-30.6 Col. I: ibid., 1929, I, 95, Table 2; col. 2 and 3: Survey of Current Business,
Jan. 1947, p. 18, Table 6; col. 4: ibid., Sept. 1947, p. S-S.7 Economic Almanac for 1948, p. 77.
Demand deposits owned by noncorporate manufacturingand mining enterprises increased from about 9 percent of de-mand deposits owned by both corporate and noncorporateenterprises at the end of January 1945 to 10.5 percent onFebruary 26,
1
of forbalance sheet data
all active corporations on the basis of theratio of "taxes paid other than income tax" by all corporationsdivided by "taxes paid other than income tax" by balance sheetcorporations.0 Federal Reserve Bulletin, 1945, p. 332; ibid., 1947, p. 690.

312 PART II
For 1929 data on "taxes paid . ." by balance sheet corpora-tions are not given in Statistics of Income. Hence the ratio pre-vailing in 1931, the first year for which such information isavailable, was projected back to 1929.
The ratio was.1.0083 in 1931, 1.0088 in 1939, and 1.008 in1944. In other words, the compiled balance sheet data in Sta-tistics of Income did not have to be raised by more than about1 percent, so that apy deficiencies in the method are pre-sumably irrelevant.'0
In any event, this method seems preferable—for the pur-poses of this study—to raising balance sheet data to cover allcorporations on the basis of data on gross sales; for the ratio ofgross sales to total assets is larger for small corporations, whichdo not submit balance sheets, than for others. Even on thebasis of gross sales, the compiled balance sheet data in Statisticsof Income would have to be raised only slightly more than 1percent.11
In computing net changes in inventories, Kuznets raised thefigures for inventories held by corporations submitting bal-ance sheets to comprise all corporations on the basis of datafor costs of goods sold.'2 For computing inventories this methodmay be preferable to the one applied uniformly to all balancesheet items in this study. Kuznets' estimate of inventories heldby all manufacturing corporations at the end of 1929 differsfrom ours because (a) a different ratio was used and (b) Kuz-nets' estimate is the sum of the estimates for each minor indus-trial group.1310 The same ratio was applied to all balance sheet items although the distribu-tion of assets and liabilities of small corporations not submitting completebalance sheet data may not be the same as that of the others, on the average.Also, figures on "taxes paid other than income tax" in Statistics of Income areslightly incomplete; see C. J. Hynning, Taxation of Corporate Enterprise (TNECMonograph 9, 1941), p. 135.11 Compare C. A. Bliss, The Structure of Manufacturing Production (NBER,1939), App. VI, pp. 204-6.12 Commodity Flow and Capital Formation (NBER, 1938), 1, Table VII-2,Note A.13 Kuznets' 1929 figure (in current prices) for inventories held by manufactur.ing corporations is about 0.5 percent larger than our estimate.

BALANCE SHEET OF MANUFACTURING ENTERPRISES 3132 Changes in Industrial ClassificationThe industrial classification in Statistics of Income was notchanged between 1939 and 1944 in any way that would haveaffected the entire 'manufacturing' group, but several indus-trial activities were shifted from 'manufacturing' to othergroups, and vice versa, between 1937 and 1938.14 The solemajor change was the transfer of 'ship and boat building' from'construction' to 'manufacturing.' The gross income of cor-porations classified under 'ship and boat building' in 1929 wascomputed as a percentage of the gross income of all manufac-turing corporations and this percentage (0.15 percent) addedto the balance sheet data for all corporations classified as'manufacturing' in
3 Deconsolidation and Reclassification of the Data for 1929and 1944
In the middle of the decade 1929-39 the nature of the statisticaldata available changed fundamentally because of the with-drawal, in 1934, of the privilege enjoyed by corporations undercertain conditions to file consolidated income tax returns.14 Industrial activities not included in 'manufacturing' in 1929, but in 1938and the following years: salt (except mining of rock salt), logging, publishingdirectories and time tables, natural ice, retreading tires, ship and boat build.ing.
Industrial activities included in 1929, but not in 1938 and the followingyears: roasting and shelling nuts, repairing of machinery, mineral and springwater bottling, armature rewinding, welding, blocking and renovating hats,publishers' representatives (Statistics of Income for .1938, Part 2, pp. 243 if.).
No data are presented on these activities in Statistics of Income or theCensus of Manufactures. According to the Census of Manufactures, 1929, thevalue of product of corporate enterprises classified under 'Salt, obtained bymining or evaporation' was only about 0.05 percent of the total corporateproduct.15 Instead of computing the gross income of corporations dassified under 'shipand boat building' as a percentage of the gross income of all manufacturingcorporations, it could be computed as a percentage of the gross income of the'construction' group; then the balance sheet data of corporations engaged inship and boat building could be estimated on the basis of the balance sheetdata for 'construction'. The difference in the amounts for total assets of'manufacturing' as defined in 1939 is negligible. For other balance sheet itemsthe differences are somewhat larger.
314 PART II
Subsidiaries that had until then been unavoidably classifiedwith the parent corporation, although actually engaged in dif-ferently classified lines of business, were now classified sepa-rately. The problem was to find the percentages that had to bededucted from or added to the otherwise adjusted balancesheet data of manufacturing corporations in 1929 to make the1929 figures comparable with the 1939 figures. This entailed,among other things, use of figures for 1929 adjusted to repre-sent a situation as if the privilege of filing consolidated returnshad not existed in 1929.
For 1933 and 1934 separate data are available for corpora-tions that did and did not file consolidated returns in 1933(Table 10). The percentage changes in the balance sheet datafor 1933 due to the deconsolidation and the ensuing industrialreclassification of subsidiaries were estimated after deductingchanges caused by economic factors (temporal changes) be-tween December 31, 1933 and December 31, 1934. It was as-sumed here, in the absence of data to the contrary, that purelytemporal changes affected corporations filing and not filingconsolidated returns in the same way. For example, it wasassumed that 'investments, other' of both corporations filingand not filing consolidated returns would have decreased 2.48percent (Table 10, col. 11), the amount of the temporal changebetween 1933 and 1934. 'Investments, other' of corporationsfiling consolidated returns in 1933 decreased 20.57 percent(col. 7), because of temporal changes, deconsolidation, and re-classification. The difference between 20.57 and 2.48 percent,or 18.1 percent (col. 12) is consequently the decrease that can beattributed to deconsolidation and reclassification.
For 'cash', 'inventories', 'investments, tax exempt', and 'capi-tal assets', it was not considered necessary to resort to theassumption explained in the preceding paragraph. It is be-lieved that deconsolidation as such (without industrial reclassi-fication) did not affect these items, and that the temporalchanges are therefore directly expressed by columns 3 and16 Total assets were computed as the sum of all assets, and net worth as aresidual.

BALANCE SHEET OF MANUFACTURING ENTERPRISES 315Table 10, column 12, presents the approximate percentage
changes due to deconsolidation and reclassification in 1933,after temporal changes were taken into account.'7 In applyingthese percentage changes to 1929 data, the following facts mustbe kept in mind:
a) Fewer consolidated returns were filed beginning in 1932when higher income tax rates were applicable to consolidatedreturns (Table 12).18
b) Mergers and acquisitions occurred in manufacturing forvarious reasons between 1929 and 1933 (Table 3). Some werepresumably prompted by the discontinuation of the privilegeof filing consolidated returns. For these reasons the relativesize of the segment of manufacturing corporations that filedconsolidated returns declined from 63.3 percent in 1929 to54.2 percent in 1933, in terms of "taxes paid except incometax". Consequently, the percentage changes due to deconsoli-dation and reclassification found for the corporations that17 Because of the nature of the data, these percentages are somewhat smallerthan they would be if deconsolidation in 1934 had been complete. Fiscal-yearcompanies were permitted to file consolidated returns in computing their 1934income tax, and the new rule applied to them only from 1935 on. Conse-quently, the data for 1934 in Table 10 for corporations that had filed con-solidated returns for 1933 include consolidated returns for 1934 by corporationswith fiscal years ended before December 31, 1934. The gross income of manu-facturing corporations that filed consolidated returns for 1934 was 5.9 percentof the gross income of all manufacturing corporations. From these data wecannot estimate precisely the effect deconsolidation would have on balancesheet data. If data for 1935 were available comparable to those in Table 10 for1934, the percentage changes due to deconsolidation and reclassification wouldbe slightly larger than those in Table 10, col. 12 (for total assets presumably—13 instead of —11.6 percent). For the entire 'manufacturing' group the differ-ence is negligible.
To the extent that mergers occurred in 1933-34 between corporations thattook advantage of the privilege of filing a consolidated return for 1933, thecomparison of 1933 and 1934 data in Statistics of Income for 1934 (Table 10)does not show as big a change as it would if all corporations had switched tofiling deconsolidated returns. However, no suitable data on mergers for manu-facturing corporations between 1933 and 1934 seem to be available. Mergersand acquisitions in manufacturing and mining were fewer in 1934 than in anyyear ].929-33 (See Table 3).18 Additional tax of .75 percelfl for 1932 and 1933, Revenue Act of 1932, Sec.141 (c); 1 percent, National Industrial Recovery Act 1933, Sec. 217 (e).

316 PART II
Table 12
Consolidated Returns, Manufacturing Corporations,1929-34, 1942, 19441929 1930 1931 1932 1933 1934 1942 1944
Gross income reported onconsolidated returns as% of total gross incomereported on all returns 57.2 60.0 56.7 49.2 46.3 5.9
Assets of corporations fil-ing consolidated returnsas % of assets of all cor-porations b n.a. n.a. n.a. n.a. 56.0 n.a. n.a. n.a.
Taxes paid . . .' reportedon consolidated returnsas % of 'Taxes paid . . .'reported on all returns 63.3 n.a. n.a. n,a. 54.2 n.a. n.a. n.a.
Statistics of Income.n.a.: not available.
Total compiled receipts reported on consolidated returns as percentage of totalcompiled receipts reported on all returns. Gross income is smaller by the amountof wholly tax-exempt interest.
Submitting complete balance sheet data.
filed consolidated returns for 1933 were applied to 63.3 per-cent of the total balance sheet data for 1929.10
The following assumption, which apparently cannot beverified, must be made when applying the changes caused bydeconsolidation in 1934 to the percentage of consolidated re-turns in 1929: as a whole, the corporations that filed consoli-dated returns in 1929 and that merged between 1929 and 1933had a distribution of assets, affiliations with trade and miningsubsidiaries, and financial intercorporate ties that paralleledthe pattern of the entire group of corporations filing con-solidated returns. If, for example, the corporations that filedconsolidated returns for 1929 and that subsequently mergedhad larger subsidiaries engaged in mining than corporationsthat subsequently did not merge, the decrease in assets due tothe fictitious deconsolidation and reclassification would belarger than appears from our computations.19 No balance sheet data, but only income data of corporations submitting con-solidated returns, are presented in Statistics of Income for 1929. A comparison ofthe percentage of "taxes paid . . ." by corporations filing consolidated returns(54.2) with the percentage of total assets owned by such corporations in 1933(56.0), the only year when such a comparison is possible, shows that "taxespaid . . ." is a fairly adequate measure (see Table 12).
BALANCE SHEET OF MANUFACTURING ENTERPRISES 317
Mergers in 1934-39 also would have to be taken into accountto make the comparison between 1929 and 1939 exact. Thebalance sheet data for 1939 would have to be deconsolidated tothe extent of such mergers. While the data are insufficient formaking such an adjustment, we may conclude that mergers in1934-39 were not of such a magnitude as to affect appreciablythe validity of our estimates.2° The omission of the adjustmentof 1939 data tends to be balanced, with respect to the final com-parison of 1929 and 1939 data, by two errors in the other direc-tion: (a) A slight underestimate of the effects of the fictitiousdeconsolidation in 1929. We assumed that the ratio of assetsowned by corporations filing consolidated returns in 1929 to allcorporations equals the ratio of "taxes paid . . ." by them to"taxes paid . . ." by all corporations. (b) An underestimate ofthe effects of deconsolidation in 1934 on two counts: fiscalyear companies still took advantage of the privilege of filingconsolidated returns in 1934, and any mergers that may haveoccurred between 1933 and 1934 had to be neglected.
Summarizing the effects of this fictitious deconsolidation andreclassification of the 1929 data it can be said that net worth,total assets, and all other balance sheet items except receivablesand payables became smaller in the process. The two excep-tions became substantially larger (14.7 and 22.8 percent). Thedecreases were especially marked for cash, tax exempt invest-ments, bonds and mortgages, and 'other liabilities'.2'20 Mergers and acquisitions in manufacturing and mining (excluding mergerswith subsidiaries) during 1934-39 were fewer than half those during 1930-33.Similarly, the increases in investments (without mergers) in subsidiaries andaffiliates of a sample of manufacturing corporations in 1934-39 were about halfof the corresponding figure for 1930-33, as shown in Table 3. Little change inthe relations between manufacturing corporations and their subsidiaries alsoseems to follow from the compiled balance sheet data of 892 registrants withthe SEC 1935-39. The percentage of the net worth of the registrants that wasinvested in nonconsolidatcd affiliates was almost the same in 1935 and 1939(4.2 and 4 percent respectively). See Statistics of American Listed Corporations,Part 2, Tables 5 and 6.21 Compare W. L. Crum, Corporate Size and Earning Power (Harvard UniversityPress, 1939), pp. 359 if. The decrease in inventories is slightly larger, of course,when 1929 data are deconsolidated than the discrepancy between the twoamounts for inventories in 1934, presented by W. D. Hance, Survey of Current
318 PART II
From 1935 to 1941 manufacturing corporations and the cor-porations closely affiliated with them were not permitted to filea single consolidated return (unless they were fully consoli-dated), while certain types of corporation did enjoy this priv-ilege.22 The privilege was extended to all affiliated corpora-tions for taxable years beginning after December 31, 1941,under certain conditions regarding their connection throughstock ownership with a common parent corporation.
Thus the balance sheet data in Statistics of income for 1944are in part based on consolidated balance sheets. Consolidatedreturns played a smaller role in 1944 than in 1929, chiefly be-cause of the higher tax rate.23 Total compiled receipts reportedon consolidated returns amounted to only 15 percent of totalcompiled receipts reported on all returns of manufacturingcorporations (Table 12).
Apparently no data are available that would permit anaccurate estimate of the nonconsolidated balance sheet dataof the manufacturing corporations that submitted consoli-dated returns for 1944. On the assumption that the effects ofconsolidation, as far as trends go, were similar to those in 1933,the estimates for 1933 were applied to 15 percent of the datafor 1944.24 They probably should have been applied to a some-what larger percentage, for the importance of consolidatedreturns is presumably somewhat underestimated by takingBusiness, Sept. 1942, p. 18. Similarly, the decrease in capital assets is largerwhen 1929 data are deconsolidated than when 1934 figures are adjusted (Fabri-cant, Capital Consumption and Adjustment, Table 54, p. 247).22 Railroads, including electric railways after 1935, trackless trolley and bussystems after 1937, and—beginning with 1940—Pan-American trade corporations(Statistics of Income for 1940, Part 2, pp. 13, 37).23 For 1932-33 the income tax to be paid by corporations submitting consolidatedreturns was 0.75 percent higher than otherwise. For 1944 the surtax for con-solidated returns was 2 percent higher than for nonconsolidated returns.24 The compiled balance sheet data for 1943 of 1,087 registrants with the SECclassified as represent percentages of the thus adjusted com-piled balance sheet of all corporations which are similar to the correspondingpercentages for 1939. Receivables, for example, of the SEC corporationsamounted to 41 percent of the receivables of all corporations at the end of 1943,before deconsolidation. After deconsolidation, the percentage is 39, as comparedwith 36 for 1939 (see Tables 1 and 13).

BALANCE SHEET OF MANUFACTURING ENTERPRISES 319total compiled receipts as a measure (see Table 12). Thechanges due to fictitious deconsolidation and reclassificationwere less than a billion, except for net assets and total assets.
Table 13Compiled Balance Sheet of Registrants with the SEC Classified
as 1939 and 1943(millions of current dollars)
1939 1913
Number of registrants 1,030 1,087
Cash & cash items 3,520 6,538Marketable securities 955 4,167aTrade receivables, net b 2,704 6,248Inventories, net b 6,409 10,648Investments in affiliates, net b 1,045 1,098Other investments, net b 1,338 1,276Land, buildings, & equipment, net b 15,672 16,526°Treasury stock 65 8Intangibles, net b 692 627Deferred charges 359 437Other assets, net" 592 2,976Total assets 33,352 50,548
Notes payable 346 1,123Accounts payable 1,120 8,341Accrued items 1,190 7,498dLong term debt, instalments due in 1 year 43Total long term debt less instalments due in 1 year 3,410 3,612Other liabilities 578 2,345Other reserves 1,026 2,620Minority interest 362 329Total liabilities 8,070 20,898Total stock 15,838 16,057Total surplus 9,444 13,594Total liabilities & net worth 83,352 50,548
SEC. Survey of American Listed Corporations, Balance Sheet Data, 1939-1943,Part II, pp. 2-3.a Including nearly one billion for United States tax notes.
After reserves, unless registrant carried valuation reserves as liabilities.o 1ncluding Emergency Plant Facilities, at least half a billion dollars (fullamount not stated).dAfter deduction of United States tax notes for tax provisions ($1.8 billion).o Refers to the amount of capital stock and surplus applicable to interests otherthan the corporate entity.Including surplus reserves.
4 Noncorporate EnterprisesAssets owned by manufacturing corporations were raised toinclude those of other manufacturing enterprises. The value ofproduct of all enterprises divided by the value of product of

320 S PART II
enterprises owned by corporations gives the ratio used as ap-parently the best for this purpose.25
Another ratio that could have been used, viz., that yieldedby dividing the value added by all enterprises by the valueadded by enterprises owned by corporations, would give aslightly higher result. However, even the former possibly over-estimates somewhat the role of noncorporate enterprises.26 Theoverestimate, if any, can be assumed to be about the same in1929 and 1939, so that a comparison of 1929 data with 1939data would not be affected by it.
As no Census data are available for 1944, the 1939 ratio wasused to raise corporate balance sheet data for 1944 to includenoncorporate enterprises.
Differences in the scope of the Census of Manufactures for1929 and 1939 need not be considered here, since the 1929ratio we used was from the Census of Manufactures, 1939,where the changes between 1929 and 1939 had already beentaken into account. The coverage of the Census of Manufac-tures, 1939, is practically identical with the 'manufacturing'group in Statistics of Income for 1939.
5 Deduction of Data for Alaska and HawaiiTo get data for the continental United States alone, the per-centage produced by establishments in Alaska and Hawaii in1939, 0.3, was deducted from the total value of product ofmanufacturing enterprises in the continental United Statesplus Alaska and Hawaii.27 The Census of Manufactures, 192925 The same method was used by E. A. Keller, A Study of the Physical Assets,Sometimes Called Wealth, of the United States, 1922-1933 (Notre Dame Univer-sity, 1999), p. 91.26 The ratio of gross annual sales, in for example, of manufacturing cor-porations to capital assets increases inversely to the size of corporation. Non.corporate enterprises are usually smaller than corporate. Value of product fig.ures differ from gross sales figures, however, mainly in that they includecommodities transferred to other plants of the same enterprise. As interplanttransfers are probably a larger item for corporations than for other enterprises,the overestimate that would arise from a gross sales ratio tends to be offset.27 Census of Manufactures, 1939, I, 19, Table 1. Data on inventories at the endof 1939 are available for Hawaii (ibid., III, 1137) but not for Alaska.
BALANCE SHEET OF MANUFACTURING ENTERPRISES 321
does not give data for the territories, and no data for 1944 areavailable. Consequently, the same percentage was deductedfrom the amounts for 1929 and 1944.
Of the 1,059 registrants classified by the SEC as manufactur-ing and on which 1937 data are presented in Statistics of A men-can Listed Corporations, Part 1, four were incorporated inCanada, one in Hawaii.
6 Computation of the Estimates for 1946Estimates of assets and liabilities of all manufacturing enter-prises at the end of 1946 are usually based on data for the endof 1944 after adjustment for changes during 1945 and 1946.These estimates were compared with the estimates for corpora-tions alone, by the Federal Trade Commission and the Securi-ties and Exchange Commission for the end of the first quarterof 1947.28 The FTC estimates are not strictly comparable withour series. First, they are based on highly consolidated reports,as can be seen from the following figures. Marketable securi-ties, other than United States government securities, wereestimated to be $679 million; miscellaneous assets (includinginvestments in nonconsolidated subsidiaries and affiliates) $7billion. On the basis of Statistics of Income, however, miscel-laneous assets of manufacturing corporations (not includinginvestments in subsidiaries) may be estimated to have beenabout $3.6 billion, and investments other than in governmentsecurities about $11 billion at the end of 1946. Secondly, theFTC estimates understate slightly the true aggregates, becauseneither corporations that had changed from nonmanufactur-ing to manufacturing activities nor all corporations organizedsince the end of 1943 were included.29 This understatementgenerally tends to be balanced by the presumable overstate-ment due to the consolidated character of most reports.
Cash and deposits in banks of all manufacturing entcrpriseswere estimated in the following manner. According to the28 Quarterly Industrial Financial Report Series for All United States Manufac-turing Corporations, First Quarter—1947, p. 4, Table 2.20 Ibid., p. 13.
322 PART H
Federal Reserve Bulletin (Oct. 1947, p. 1310) demand depositsheld by manufacturing and mining corporations and partner-ships amounted to $16.4 billion at the end of July 1946 and$16.0 billion on February 26, 1947. Cash and bank depositsheld by manufacturing enterprises alone were estimated byconsidering the following facts. According to tabulations pre-pared by the Commissioner of Internal Revenue, cash andbank deposits held by mining corporations accounted for 4.2percent of the total amount held by manufacturing and miningcorporations at the end of Currency and time depositswere 8.1 percent of demand deposits owned by nonfinancialcorporations at the end of 1946.31 Reducing this figure by thepercentage by which the comparable estimate for the end of1944 is larger than the figure computed from Statistics ofIncome brings the amount for cash and bank deposits esti-mated to be held by all manufacturing enterprises at the endof 1946 ($11.7 billion) somewhat closer to the FTC estimatefor corporations billion at the end of first quarter of1947). The discrepancy between the two estimates is due tothe large amounts of cash and bank deposits owned by unin-corporated enterprises (see App. B); the decrease in cash andbank deposits owned by corporations in the first quarter of1947; 32 the relatively large holdings of cash and bank depositsby small enterprises, combined with the reliance of the FTCestimates on data for large corporations chiefly.83
Notes and accounts receivable were computed as an averageof two estimates. In the first estimate, this item was assumed tohave decreased 15 percent since 1944, on the basis of the de-crease in corporate sales30 Treasury Department, Press Service 8-484, Oct. 8, 1947, Table 3.31 Federal Reserve Bulletin, Sept. 1947, p. 1104.32 Nearly one billion for all corporations excluding banks and insurance com-panies; SEC. Statistical Series Release 779 (July 25, 1947) and 784 (Nov. 20, 1947).33 The sample for small corporations was rather small (one out of 72 for cor-porations with total assets of less than $50,000); Quarterly Industrial FinancialReport Series For All United States Manufacturing Corporations, First Quarter—1947, p. 10.34 Survey of Current Business, July 1947, Supplement, p. 41, Table 29.

BALANCE SHEET OF MANUFACTURING ENTERPRISES 323In the second estimate, 30 percent was deducted from the
amount for 1944, in accordance with the large decrease in re-ceivables of 812 manufacturing corporations registered withthe SEC (Table 8), caused by payments due from the federalgovernment. 'Receivables from U.S. Government' was a lessimportant item for smaller corporations.
The FTC estimates of receivables are considerably smaller($1 1.6 billion). The difference is not quite as large as it wouldbe had receivables not increased during the first quarter of
Inventories were computed, as shown in Table 14, by addingto Hance's estimates for 1941 the annual increments in 1942-46.36
Table 14Manufacturers' Inventories, End of Year, 1929 and 1939-46
(millions of current dollars)1929 1939 1940 1941 1942 1943 1944 1945 1946
Corporate 12720 11.129 12,427 16,421 n.a. n.a. na. n.a. n.a.Noncorporate 875 685 734 961 n.a. ma. n.a. n.a. n.a.Total 13,595 11,814 12,861 17,382 19,681 20,356 19,323 18,555 22,850W. D. Hance. 'Estimates of Annual Business Inventories. 1928-1941', Survey of CurrentBusiness, Sept. 1942, p. 18, Table 1 (1929-41); 1942-46 computed from Survey of CurrentBusiness, July 1947. Supplement. p. 45. Table 33. Hance's figures are before adjustmentfor changes in industrial classification and for changes due to the discontinuation of theprivilege of filing consolidated returns in 1934.n.a.: not available.
Investments, government obligations., were first based onthe 28 percent decrease in holdings by nonfinancial corpora-tions.37 In the second estimate, 37 percent was deducted fromthe amount for 1944, in line with the decrease for manufactur-ing corporations registered with the SEC (Table 8). The de-crease, however, occurred chiefly in holdings of United Statestax and savings notes, a trend presumably not fully shared bysmaller enterprises. The average of the two estimates approxi-mately squares with the FTC estimate ($6.6 billion) in view35 For all corporations excluding banks and insurance companies, $1.6 billion;SEC, Statistical Series Release 784 (Nov. 20, 1947).36 Our estimate is $0.6 billion smaller than the estimate published by the Bureauof Foreign and Domestic Commerce after this paper had been completed: In-dustry Survey, Manufacturers' Sales and Inventories—Revised Series (Feb.-March1948).
S7Fecleral Reserve Bulletin, Sept., 1947, p. 1104.

324 PART II
of the decrease in holdings of United States government securi-ties in the first quarter of 1947.
Other investments, which cannot be checked with the FTCestimates, were assumed to have remained unchanged since1944.38
Capital assets, net, were estimated on the basis of expendi-tures for new manufacturing plant and equipment amountingto $9 billion (current) in 1945-46, as shown in Table 4, andexpenditures of $1 billion for used plant and equipment,39minus depreciation of approximately $7.5 billion.40
Other assets were assumed unchanged since 1944.Accounts payable were estimated—similarly to receivables
(first estimate)—on the basis of the decrease in corporate sales,1944-46. The FTC estimates are appreciably lower ($6.8 bil-lion) because most of the underlying data are based on con-solidated reports.
Bonds) notes) mortgages payable were estimated by addingto the FTC estimate 7.9 percent for noncorporate enterprises.
Other liabilities were computed as a residual. The decreasesince the end of 1944 in accrued taxes and renegotiation pro-visions of 812 registered corporations was $3.7 billion (Table8). The decrease in other miscellaneous liabilities, plus thedrop in other liabilities of other enterprises, may have amount-ed to about $3 billion. An estimated total decrease of $6.7 bil-lion for this item squares with its computation as a residual.
Net worth was estimated by adding to the amount at theend of 1944 the undistributed income of manufacturing enter-prises in 1945 and 1946, estimated to be about $6.1 billion.4'38 'Other marketable securities' held by 812 corporations registered with the SECfell about 22 percent39 Survey of Current Business, Jan. 1946, p. 18; ibid. July 1947, p. 12, Table 5.40 Depreciation, depletion, and amortization (amortization according to Section124 of the Internal Revenue Code) by all corporations in 1944 amounted to $3billion (Treasury Department, Press Service S-484, Table 3). Depreciation, de-pletion, and amortization by more than 1,100 corporations registered with theSEC amounted to $2.1 billion in 1944 and $2.7 billion in 1945 (SEC, Survey ofAmerican Listed Corporations, Data on Profits and Operations, Part V).41 Undistributed corporate manufacturing incoqle was $1,981 million in 1945and $3,718 million in 1946 (Survey of Current Business, July 1948, p. 21).


![A.I. Enterprises Ltd. and A.I. Enterprises Ltd. et …...[2014] 1 R.C.S. A.I. ENTERPRISES c. BRAM ENTERPRISES 177 A.I. Enterprises Ltd. et Alan Schelew Appelants c. Bram Enterprises](https://static.fdocuments.in/doc/165x107/5e918dac94e60f42b949e30a/ai-enterprises-ltd-and-ai-enterprises-ltd-et-2014-1-rcs-ai-enterprises.jpg)