Compile Once Debug Twice - Schedschd.ws/hosted_files/cppcon2017/4f/cppcon2017-sbahra.pdf · Compile...
60
Compile Once Debug Twice Samy Al Bahra / @0xF390
Transcript of Compile Once Debug Twice - Schedschd.ws/hosted_files/cppcon2017/4f/cppcon2017-sbahra.pdf · Compile...
Compile Once Debug Twice
Samy Al Bahra / @0xF390
Samy Al Bahra@0xF390 or [email protected]
Co-founder of Backtrace. Building a modern debugging platform for natively compiled software.
AppNexus, Message Systems, GWU HPCL. Scalability, reliability, productivity, multicore, heterogeneous architectures and PGAS.
Concurrency Kit. Advanced synchronization primitives for the research, design and implementation of high-performance concurrent systems.
Introduction
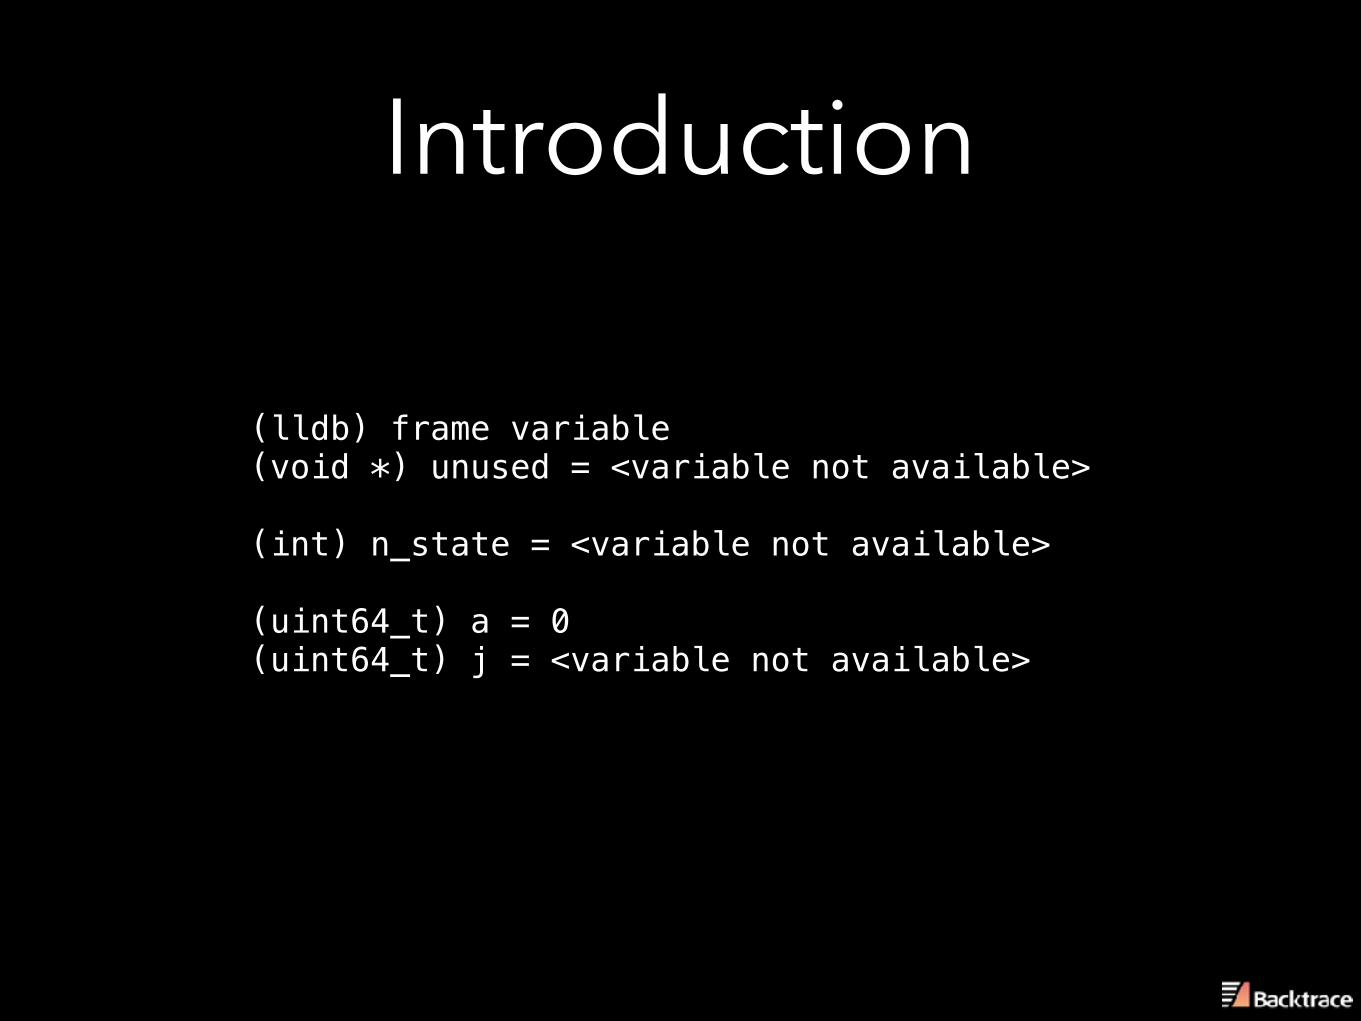
(lldb) frame variable (void *) unused = <variable not available>
(int) n_state = <variable not available>
(uint64_t) a = 0 (uint64_t) j = <variable not available>
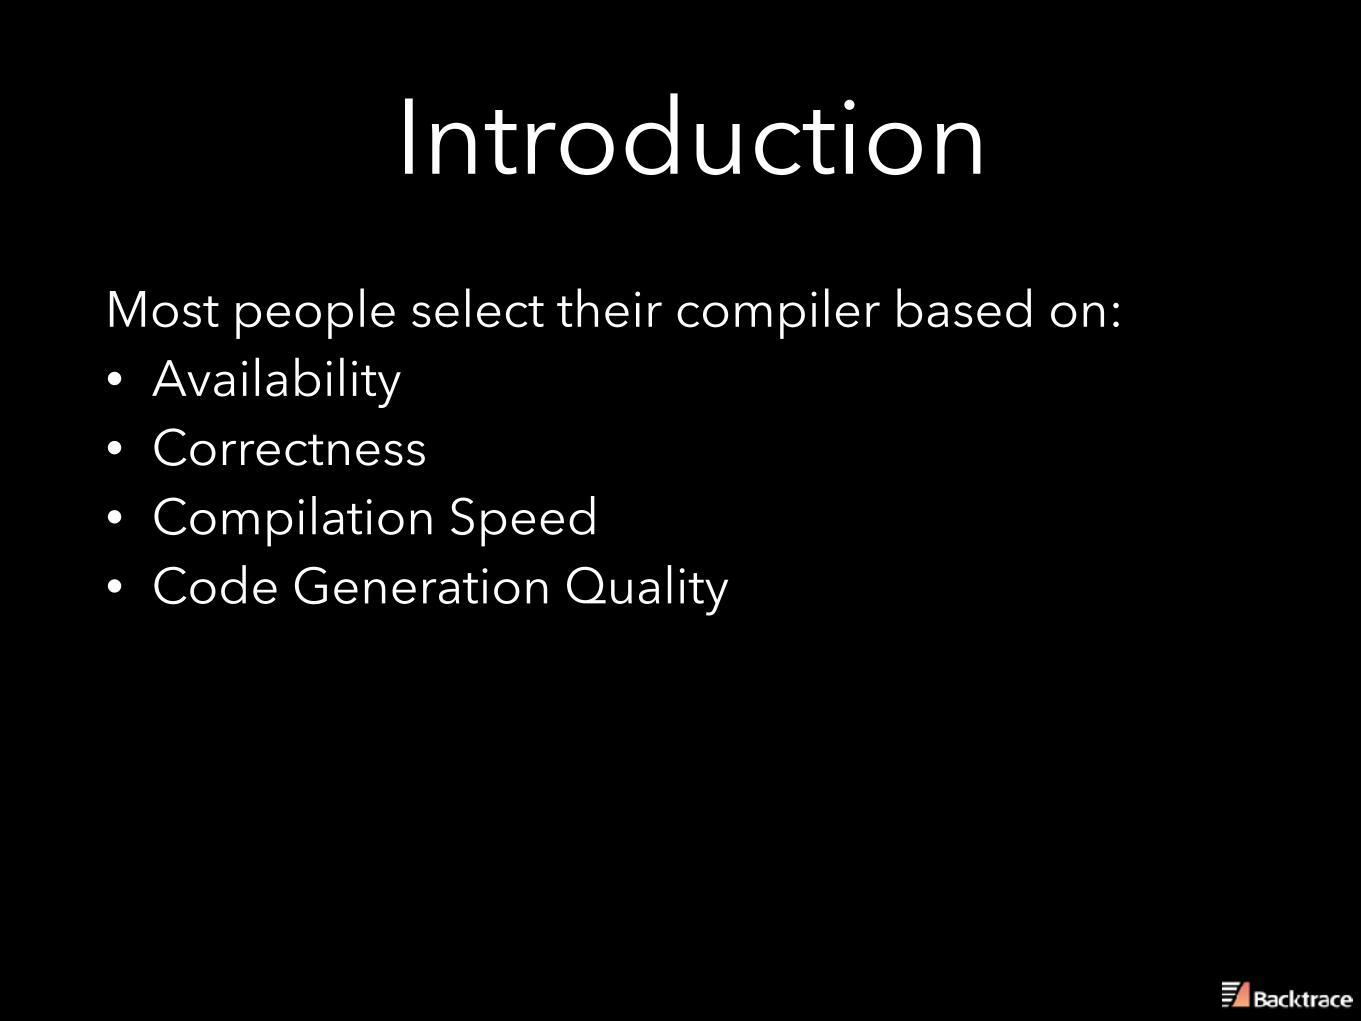
IntroductionMost people select their compiler based on: • Availability • Correctness • Compilation Speed • Code Generation Quality
IntroductionMost people select their compiler based on: • Availability • Correctness • Compilation Speed • Code Generation Quality
A facet that is commonly ignored is: Debug Information Quality.
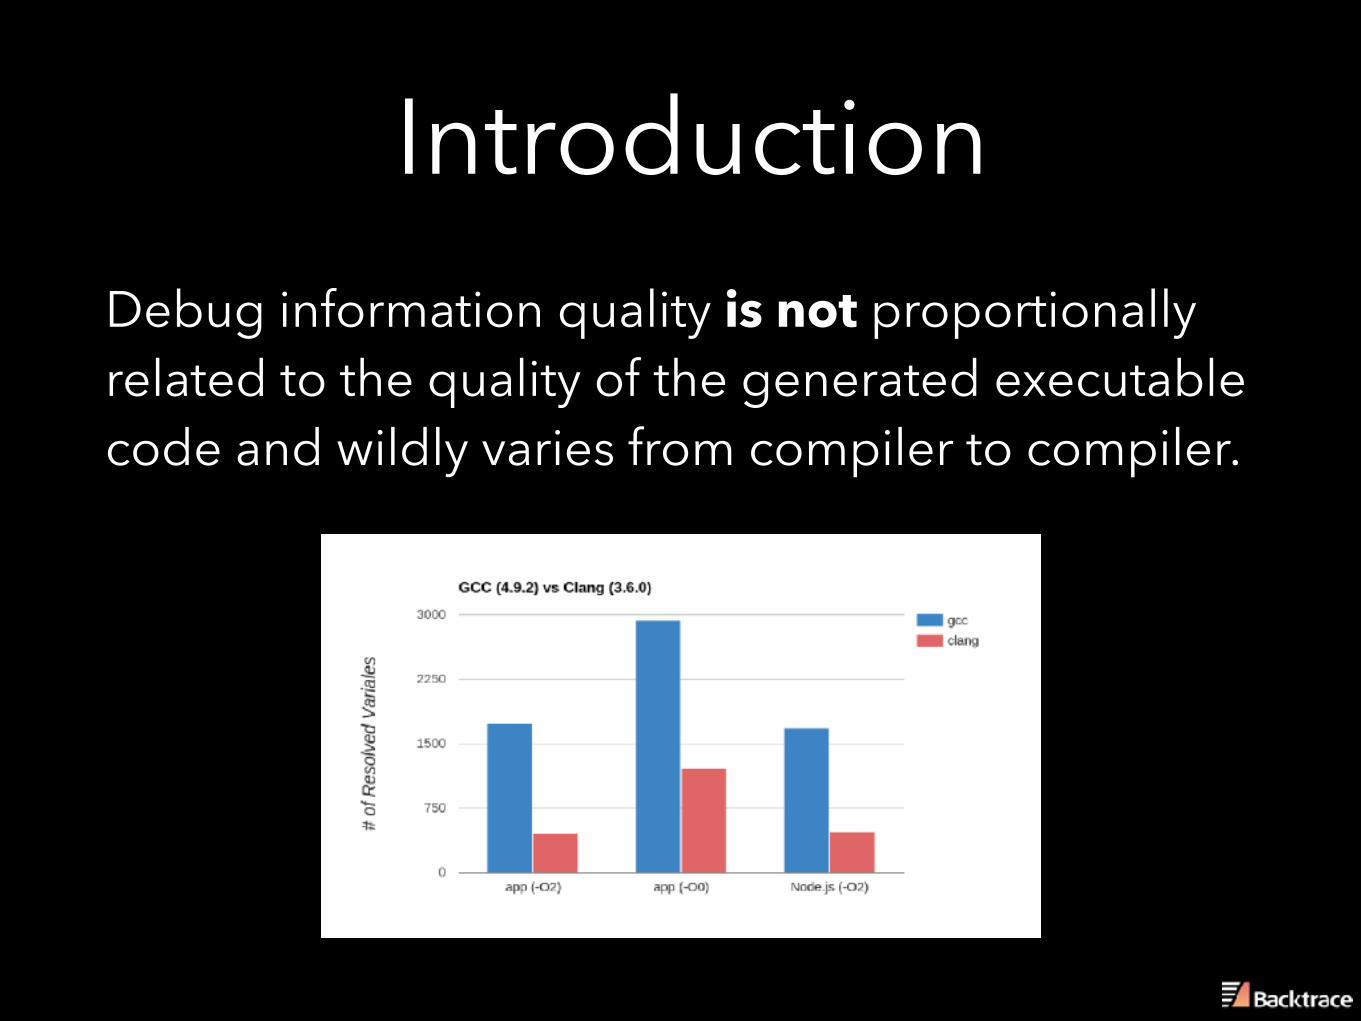
IntroductionDebug information quality is not proportionally related to the quality of the generated executable code and wildly varies from compiler to compiler.
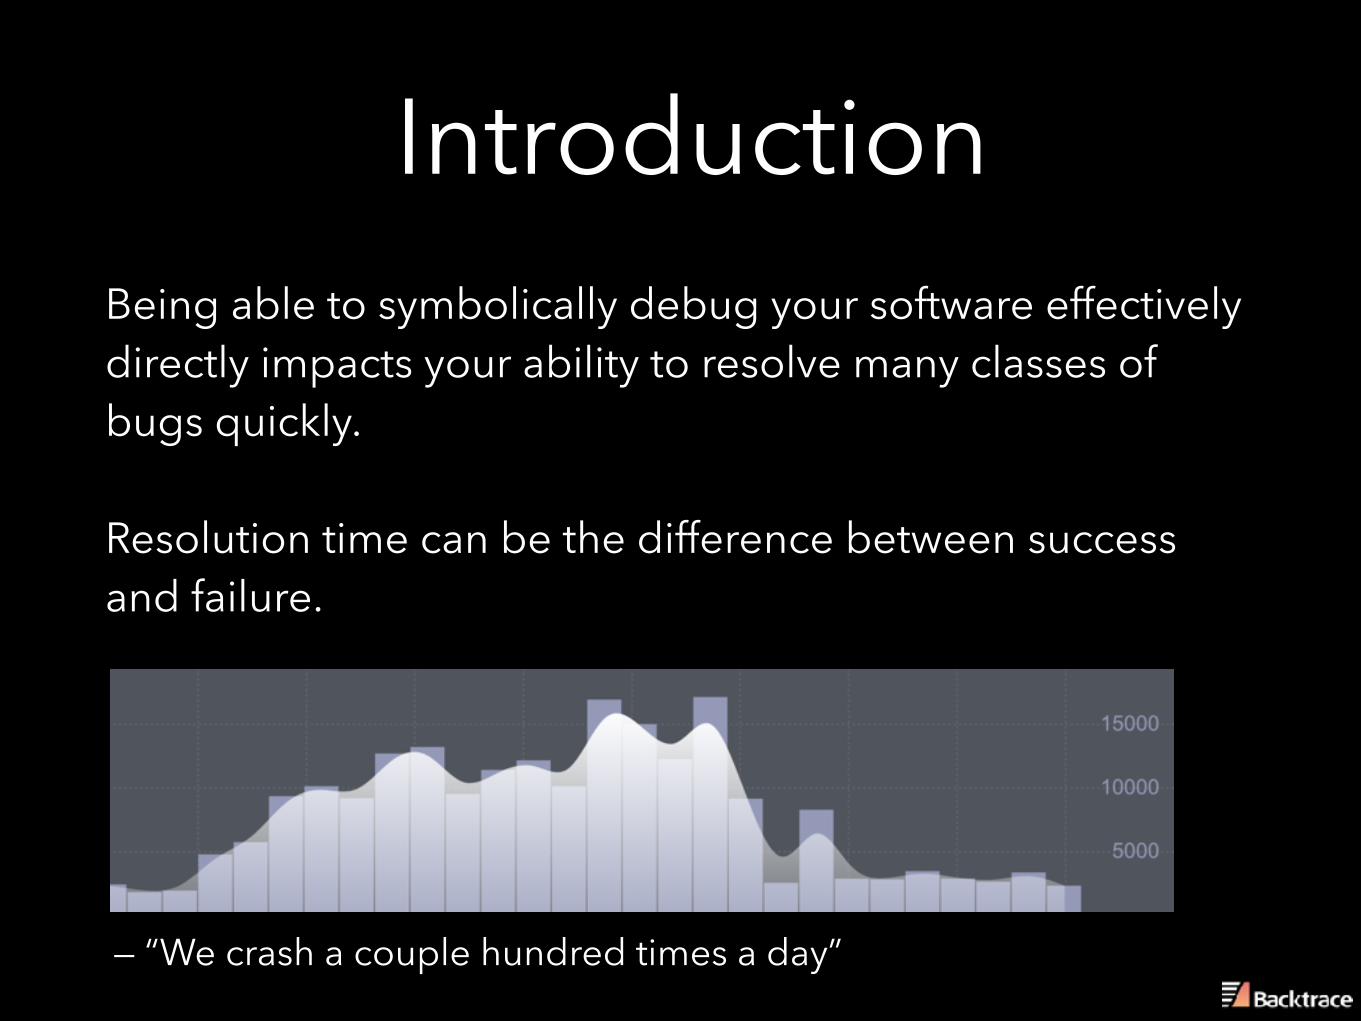
IntroductionBeing able to symbolically debug your software effectively directly impacts your ability to resolve many classes of bugs quickly.
Resolution time can be the difference between success and failure.
— “We crash a couple hundred times a day”
Agenda• An Introduction to Symbolic Debugging
• Optimizations and Debug Information
• A Comparison
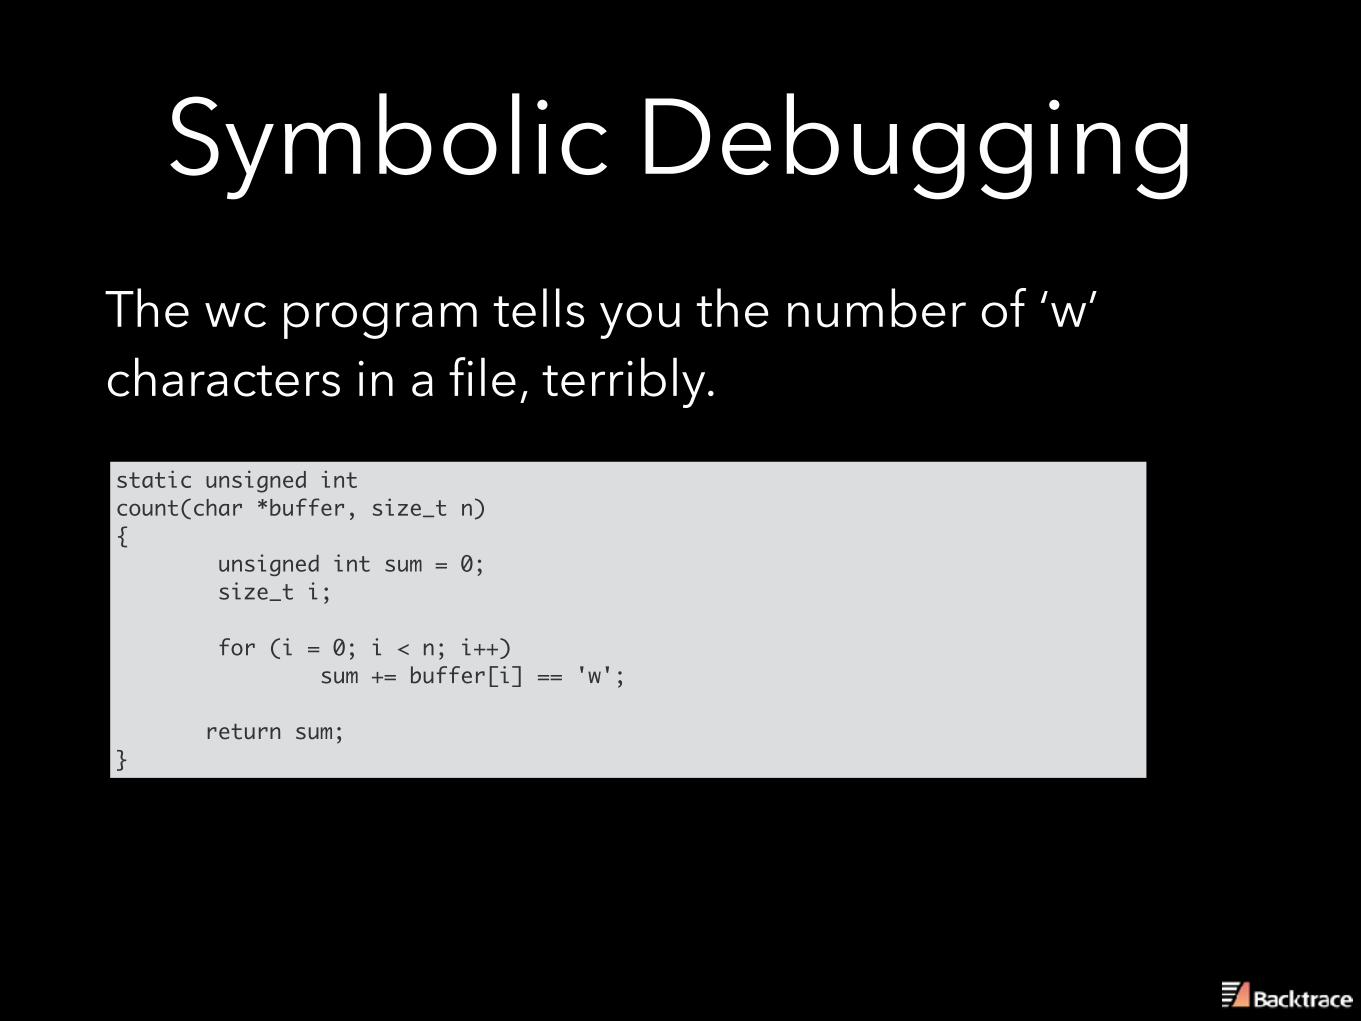
Symbolic DebuggingThe wc program tells you the number of ‘w’ characters in a file, terribly.
static unsigned int count(char *buffer, size_t n) { unsigned int sum = 0; size_t i; for (i = 0; i < n; i++) sum += buffer[i] == 'w'; return sum; }
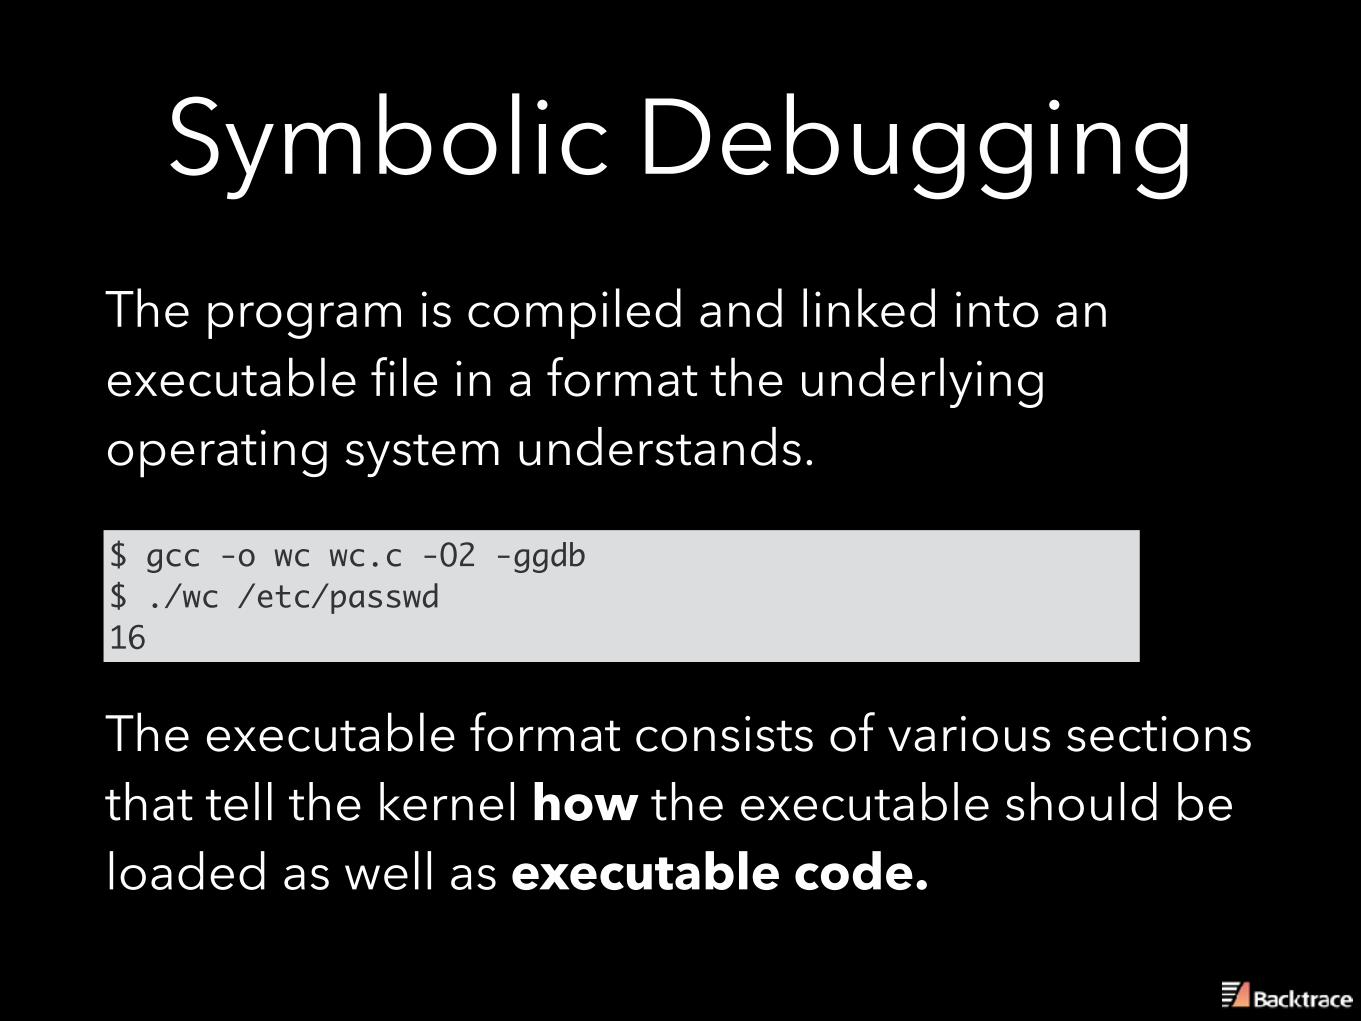
Symbolic DebuggingThe program is compiled and linked into an executable file in a format the underlying operating system understands.
$ gcc -o wc wc.c -O2 -ggdb$ ./wc /etc/passwd16
The executable format consists of various sections that tell the kernel how the executable should be loaded as well as executable code.
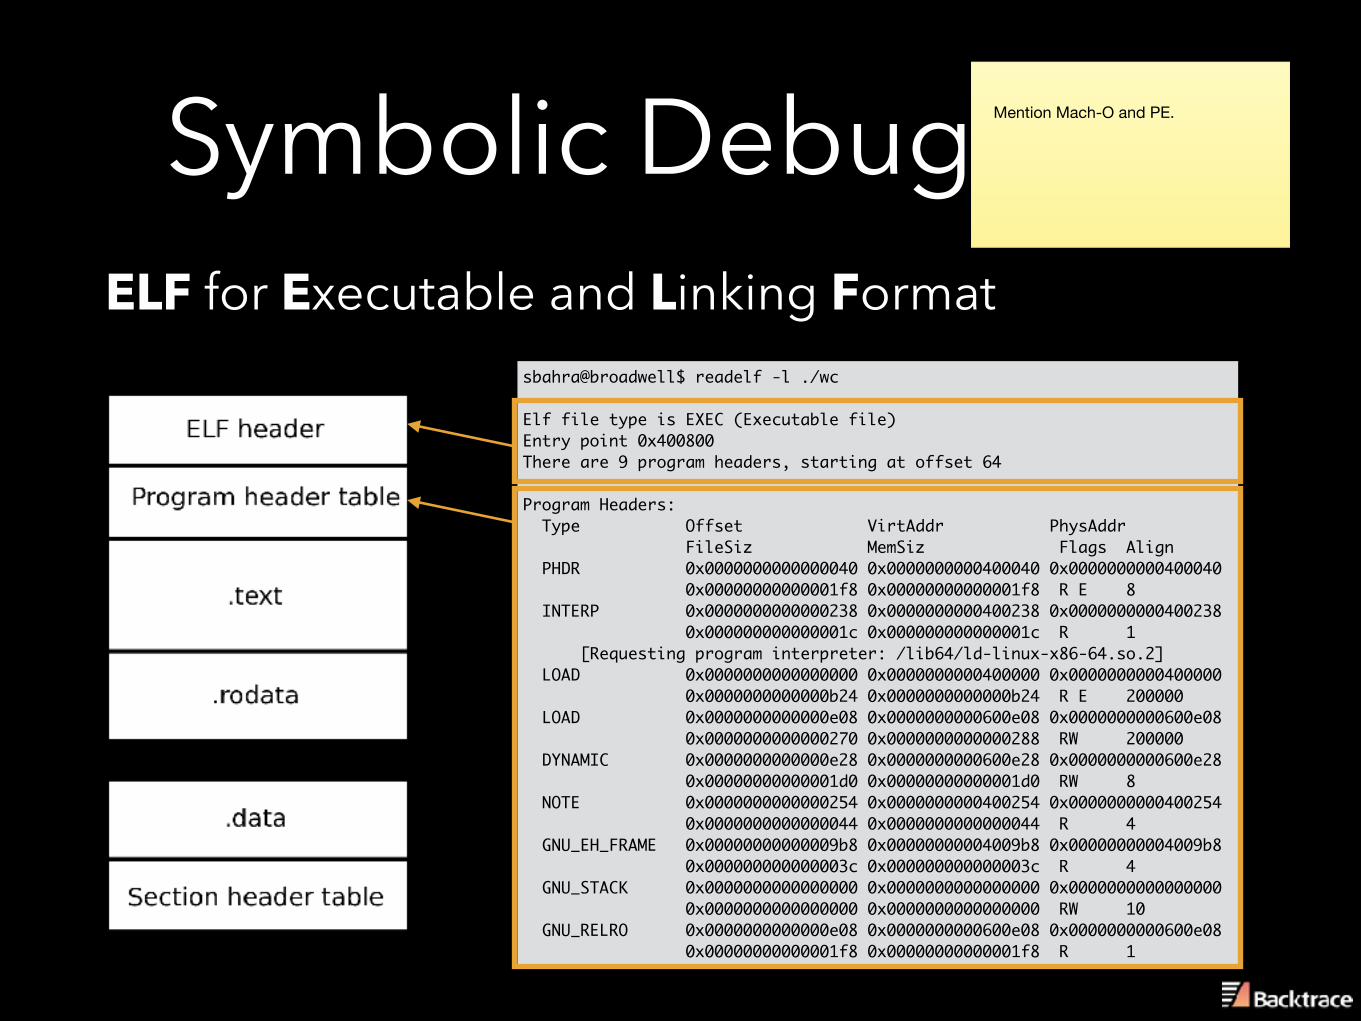
Symbolic DebuggingELF for Executable and Linking Format
sbahra@broadwell$ readelf -l ./wc
Elf file type is EXEC (Executable file)Entry point 0x400800There are 9 program headers, starting at offset 64
Program Headers: Type Offset VirtAddr PhysAddr FileSiz MemSiz Flags Align PHDR 0x0000000000000040 0x0000000000400040 0x0000000000400040 0x00000000000001f8 0x00000000000001f8 R E 8 INTERP 0x0000000000000238 0x0000000000400238 0x0000000000400238 0x000000000000001c 0x000000000000001c R 1 [Requesting program interpreter: /lib64/ld-linux-x86-64.so.2] LOAD 0x0000000000000000 0x0000000000400000 0x0000000000400000 0x0000000000000b24 0x0000000000000b24 R E 200000 LOAD 0x0000000000000e08 0x0000000000600e08 0x0000000000600e08 0x0000000000000270 0x0000000000000288 RW 200000 DYNAMIC 0x0000000000000e28 0x0000000000600e28 0x0000000000600e28 0x00000000000001d0 0x00000000000001d0 RW 8 NOTE 0x0000000000000254 0x0000000000400254 0x0000000000400254 0x0000000000000044 0x0000000000000044 R 4 GNU_EH_FRAME 0x00000000000009b8 0x00000000004009b8 0x00000000004009b8 0x000000000000003c 0x000000000000003c R 4 GNU_STACK 0x0000000000000000 0x0000000000000000 0x0000000000000000 0x0000000000000000 0x0000000000000000 RW 10 GNU_RELRO 0x0000000000000e08 0x0000000000600e08 0x0000000000600e08 0x00000000000001f8 0x00000000000001f8 R 1
Mention Mach-O and PE.
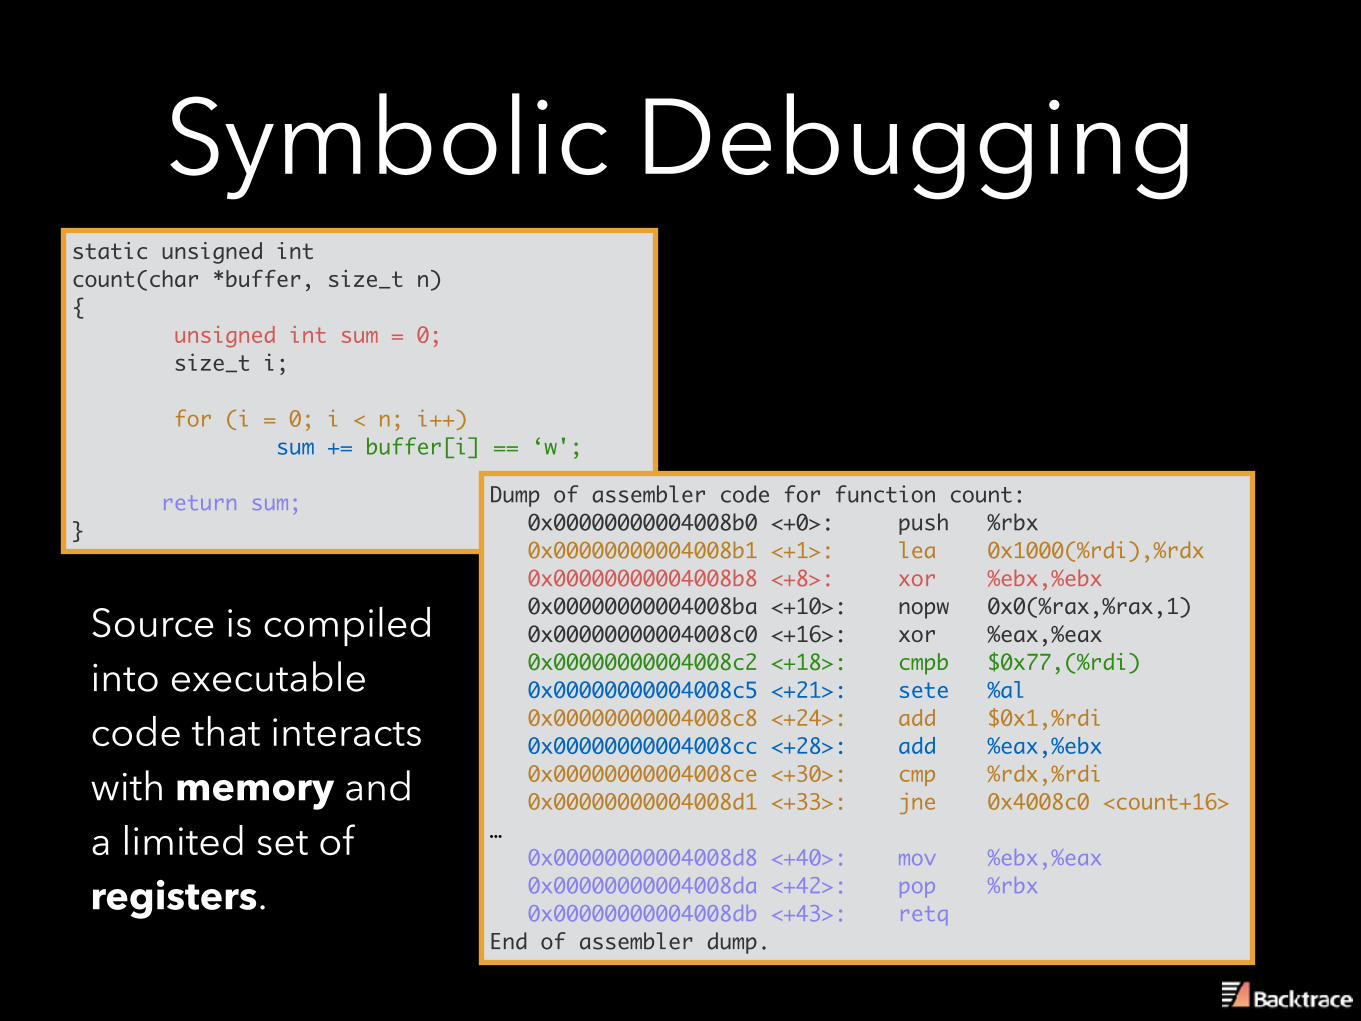
Symbolic Debuggingstatic unsigned intcount(char *buffer, size_t n){ unsigned int sum = 0; size_t i; for (i = 0; i < n; i++) sum += buffer[i] == ‘w';
return sum;}
Dump of assembler code for function count: 0x00000000004008b0 <+0>: push %rbx 0x00000000004008b1 <+1>: lea 0x1000(%rdi),%rdx 0x00000000004008b8 <+8>: xor %ebx,%ebx 0x00000000004008ba <+10>: nopw 0x0(%rax,%rax,1) 0x00000000004008c0 <+16>: xor %eax,%eax 0x00000000004008c2 <+18>: cmpb $0x77,(%rdi) 0x00000000004008c5 <+21>: sete %al 0x00000000004008c8 <+24>: add $0x1,%rdi 0x00000000004008cc <+28>: add %eax,%ebx 0x00000000004008ce <+30>: cmp %rdx,%rdi 0x00000000004008d1 <+33>: jne 0x4008c0 <count+16>… 0x00000000004008d8 <+40>: mov %ebx,%eax 0x00000000004008da <+42>: pop %rbx 0x00000000004008db <+43>: retq End of assembler dump.
Source is compiled into executable code that interacts with memory and a limited set of registers.
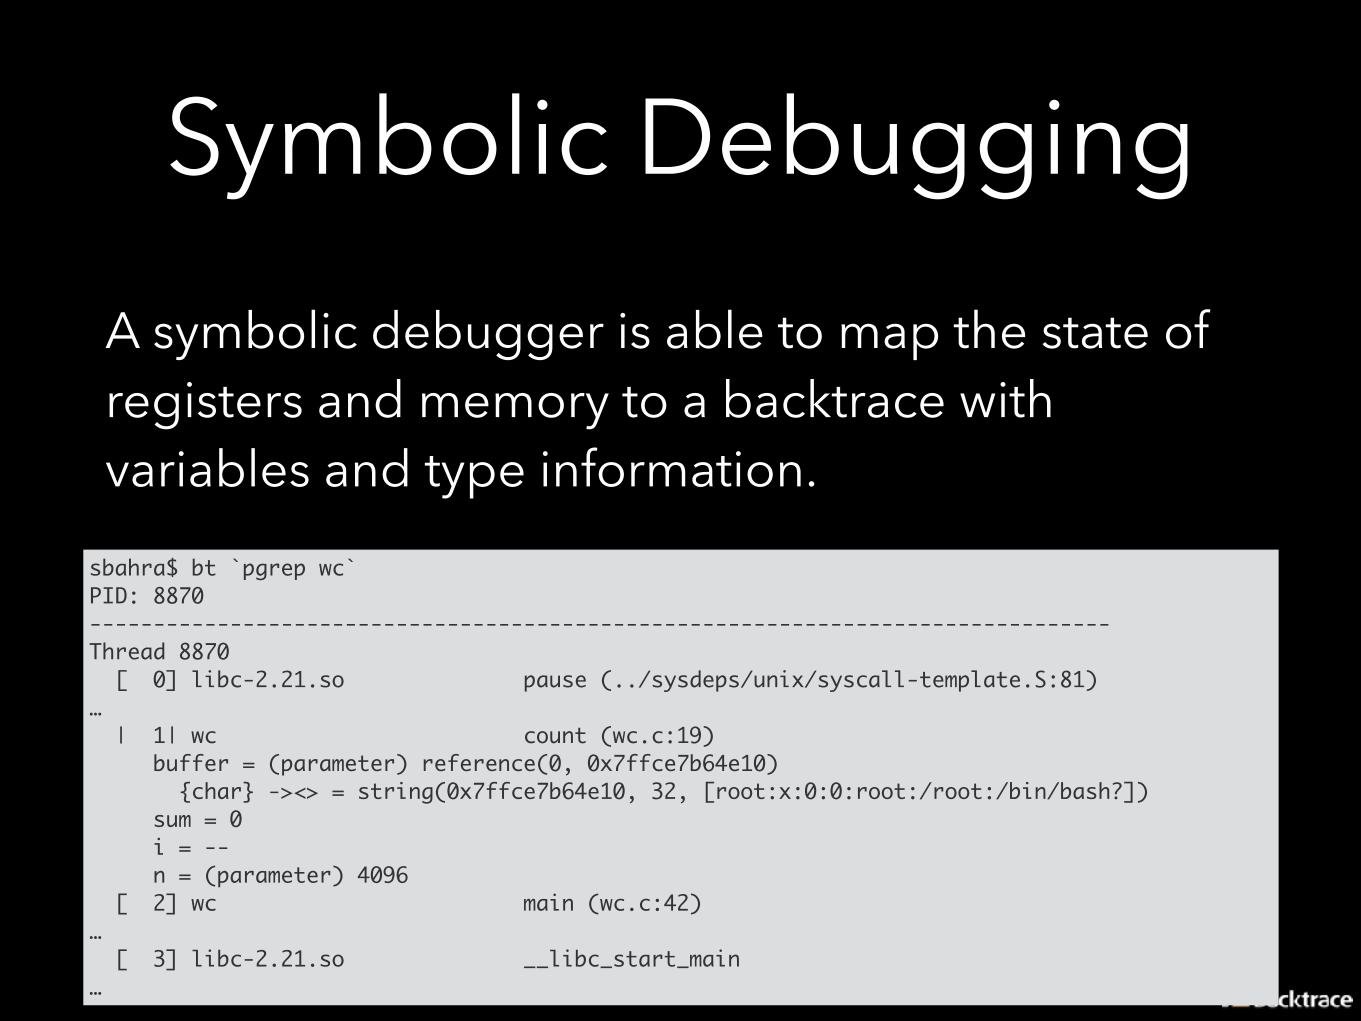
Symbolic DebuggingA symbolic debugger is able to map the state of registers and memory to a backtrace with variables and type information.
sbahra$ bt `pgrep wc`PID: 8870--------------------------------------------------------------------------------Thread 8870 [ 0] libc-2.21.so pause (../sysdeps/unix/syscall-template.S:81) … | 1| wc count (wc.c:19) buffer = (parameter) reference(0, 0x7ffce7b64e10) {char} -><> = string(0x7ffce7b64e10, 32, [root:x:0:0:root:/root:/bin/bash?]) sum = 0 i = -- n = (parameter) 4096 [ 2] wc main (wc.c:42) … [ 3] libc-2.21.so __libc_start_main…
Symbolic Debugging
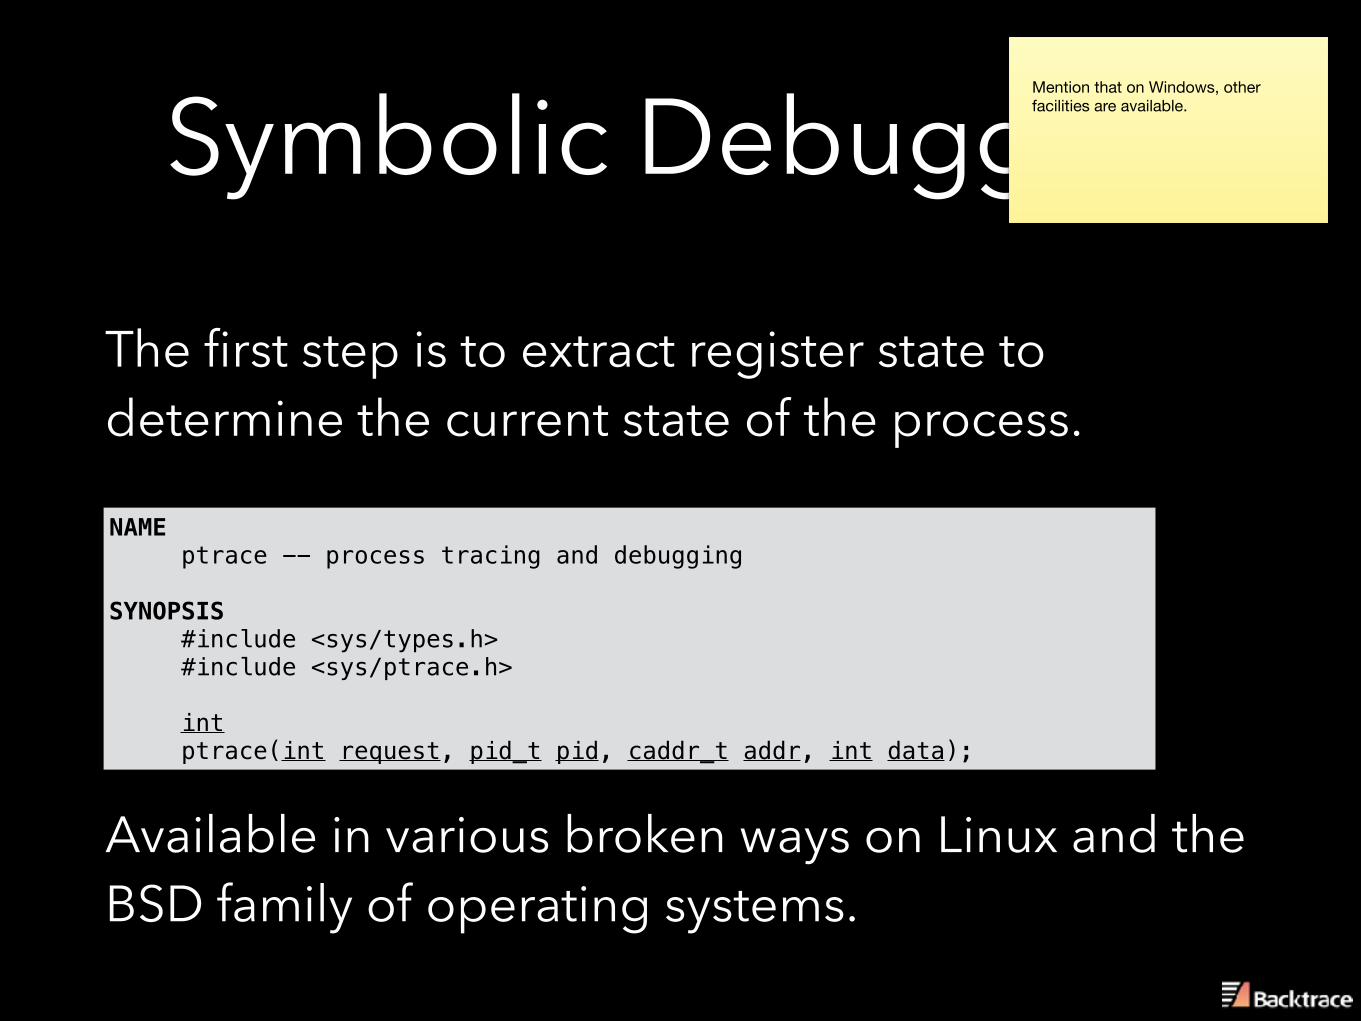
The first step is to extract register state to determine the current state of the process.
NAME ptrace -- process tracing and debugging
SYNOPSIS #include <sys/types.h> #include <sys/ptrace.h>
int ptrace(int request, pid_t pid, caddr_t addr, int data);
Available in various broken ways on Linux and the BSD family of operating systems.
Mention that on Windows, other facilities are available.
Symbolic Debugging
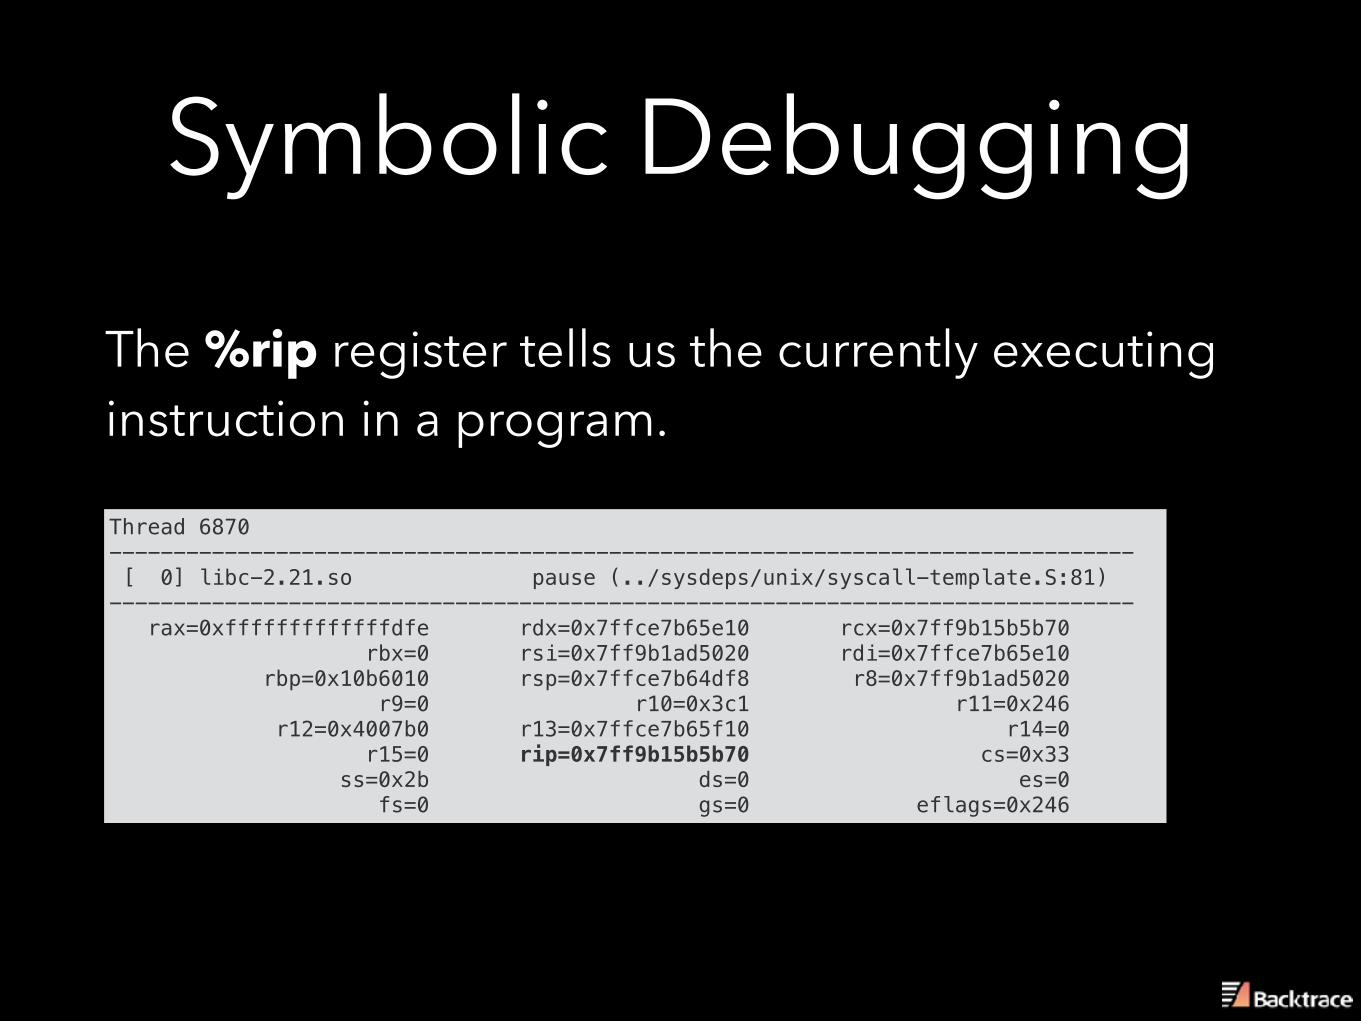
The %rip register tells us the currently executing instruction in a program.
Thread 6870 -------------------------------------------------------------------------------- [ 0] libc-2.21.so pause (../sysdeps/unix/syscall-template.S:81) -------------------------------------------------------------------------------- rax=0xfffffffffffffdfe rdx=0x7ffce7b65e10 rcx=0x7ff9b15b5b70 rbx=0 rsi=0x7ff9b1ad5020 rdi=0x7ffce7b65e10 rbp=0x10b6010 rsp=0x7ffce7b64df8 r8=0x7ff9b1ad5020 r9=0 r10=0x3c1 r11=0x246 r12=0x4007b0 r13=0x7ffce7b65f10 r14=0 r15=0 rip=0x7ff9b15b5b70 cs=0x33 ss=0x2b ds=0 es=0 fs=0 gs=0 eflags=0x246
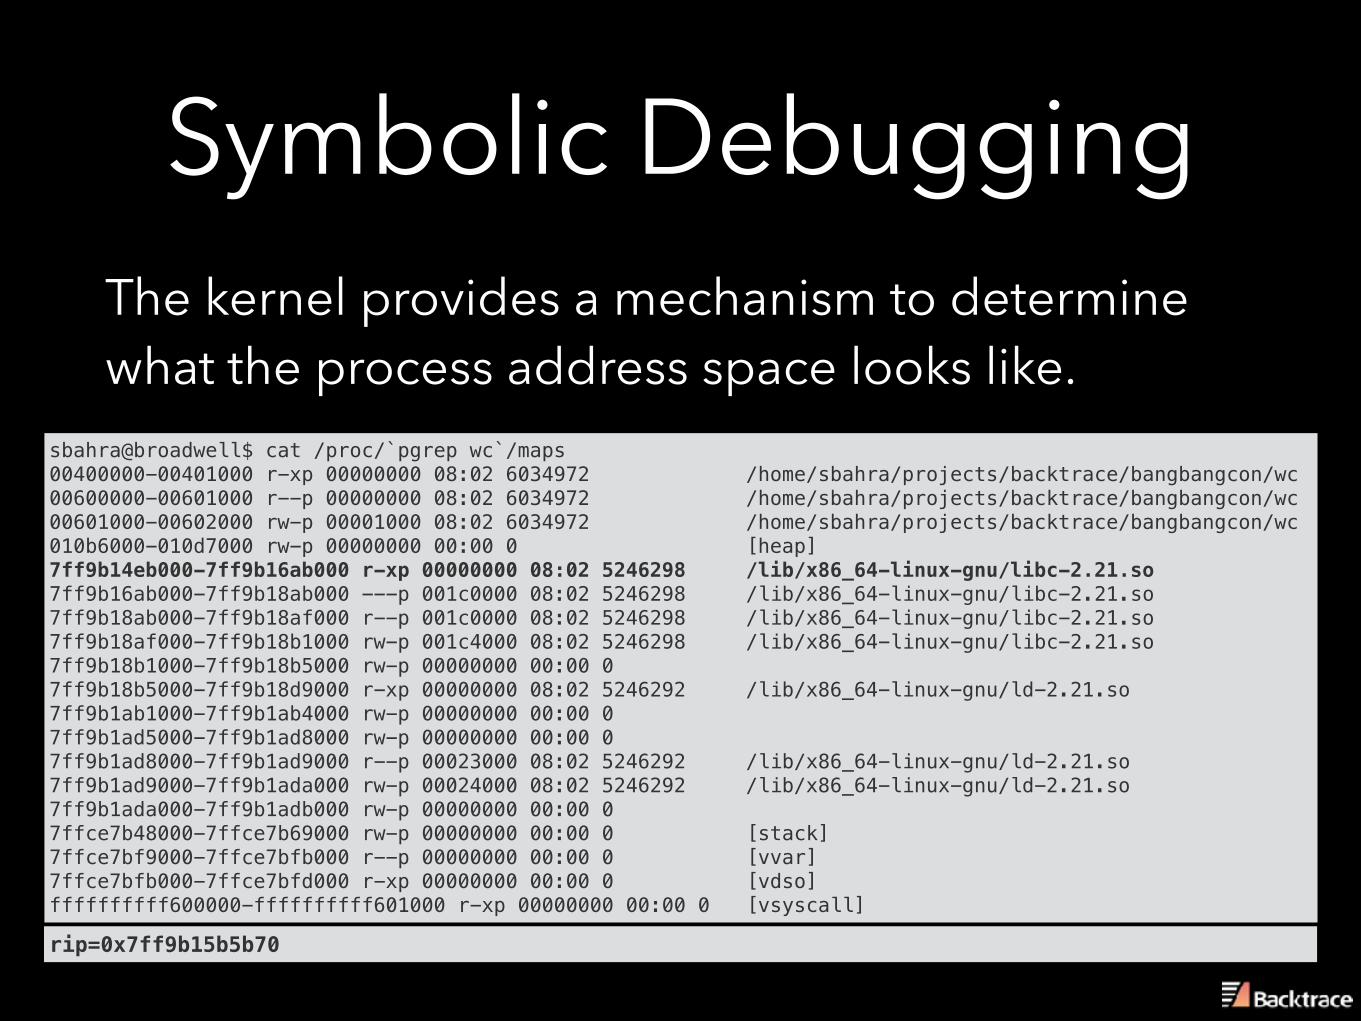
Symbolic DebuggingThe kernel provides a mechanism to determine what the process address space looks like.
sbahra@broadwell$ cat /proc/`pgrep wc`/maps 00400000-00401000 r-xp 00000000 08:02 6034972 /home/sbahra/projects/backtrace/bangbangcon/wc 00600000-00601000 r--p 00000000 08:02 6034972 /home/sbahra/projects/backtrace/bangbangcon/wc 00601000-00602000 rw-p 00001000 08:02 6034972 /home/sbahra/projects/backtrace/bangbangcon/wc 010b6000-010d7000 rw-p 00000000 00:00 0 [heap] 7ff9b14eb000-7ff9b16ab000 r-xp 00000000 08:02 5246298 /lib/x86_64-linux-gnu/libc-2.21.so 7ff9b16ab000-7ff9b18ab000 ---p 001c0000 08:02 5246298 /lib/x86_64-linux-gnu/libc-2.21.so 7ff9b18ab000-7ff9b18af000 r--p 001c0000 08:02 5246298 /lib/x86_64-linux-gnu/libc-2.21.so 7ff9b18af000-7ff9b18b1000 rw-p 001c4000 08:02 5246298 /lib/x86_64-linux-gnu/libc-2.21.so 7ff9b18b1000-7ff9b18b5000 rw-p 00000000 00:00 0 7ff9b18b5000-7ff9b18d9000 r-xp 00000000 08:02 5246292 /lib/x86_64-linux-gnu/ld-2.21.so 7ff9b1ab1000-7ff9b1ab4000 rw-p 00000000 00:00 0 7ff9b1ad5000-7ff9b1ad8000 rw-p 00000000 00:00 0 7ff9b1ad8000-7ff9b1ad9000 r--p 00023000 08:02 5246292 /lib/x86_64-linux-gnu/ld-2.21.so 7ff9b1ad9000-7ff9b1ada000 rw-p 00024000 08:02 5246292 /lib/x86_64-linux-gnu/ld-2.21.so 7ff9b1ada000-7ff9b1adb000 rw-p 00000000 00:00 0 7ffce7b48000-7ffce7b69000 rw-p 00000000 00:00 0 [stack] 7ffce7bf9000-7ffce7bfb000 r--p 00000000 00:00 0 [vvar] 7ffce7bfb000-7ffce7bfd000 r-xp 00000000 00:00 0 [vdso] ffffffffff600000-ffffffffff601000 r-xp 00000000 00:00 0 [vsyscall]
rip=0x7ff9b15b5b70
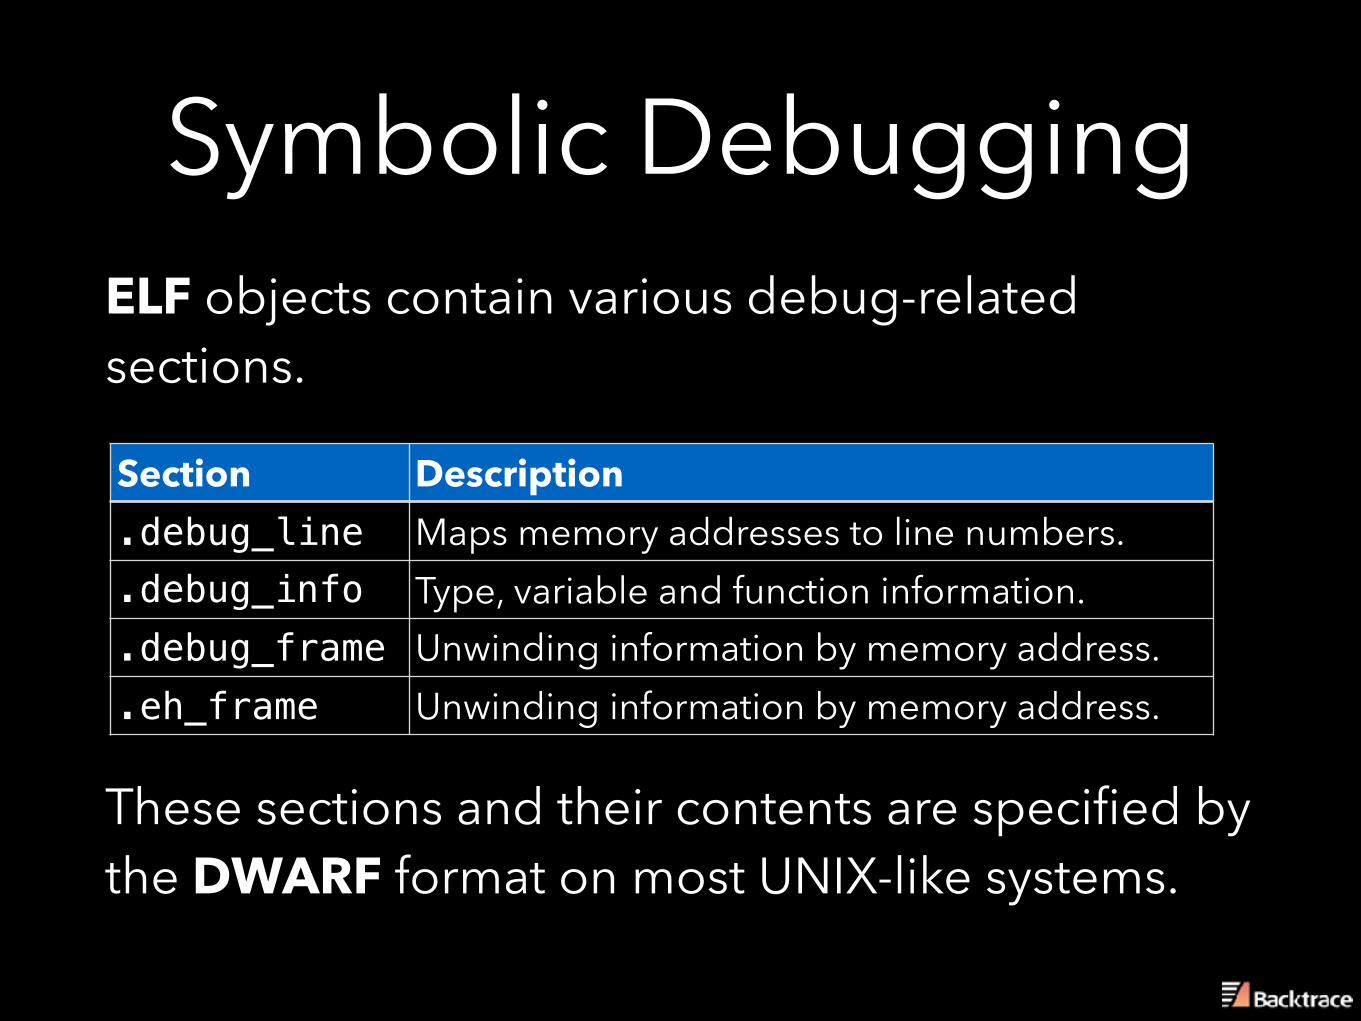
Symbolic DebuggingELF objects contain various debug-related sections.
Section Description.debug_line Maps memory addresses to line numbers..debug_info Type, variable and function information..debug_frame Unwinding information by memory address..eh_frame Unwinding information by memory address.
These sections and their contents are specified by the DWARF format on most UNIX-like systems.
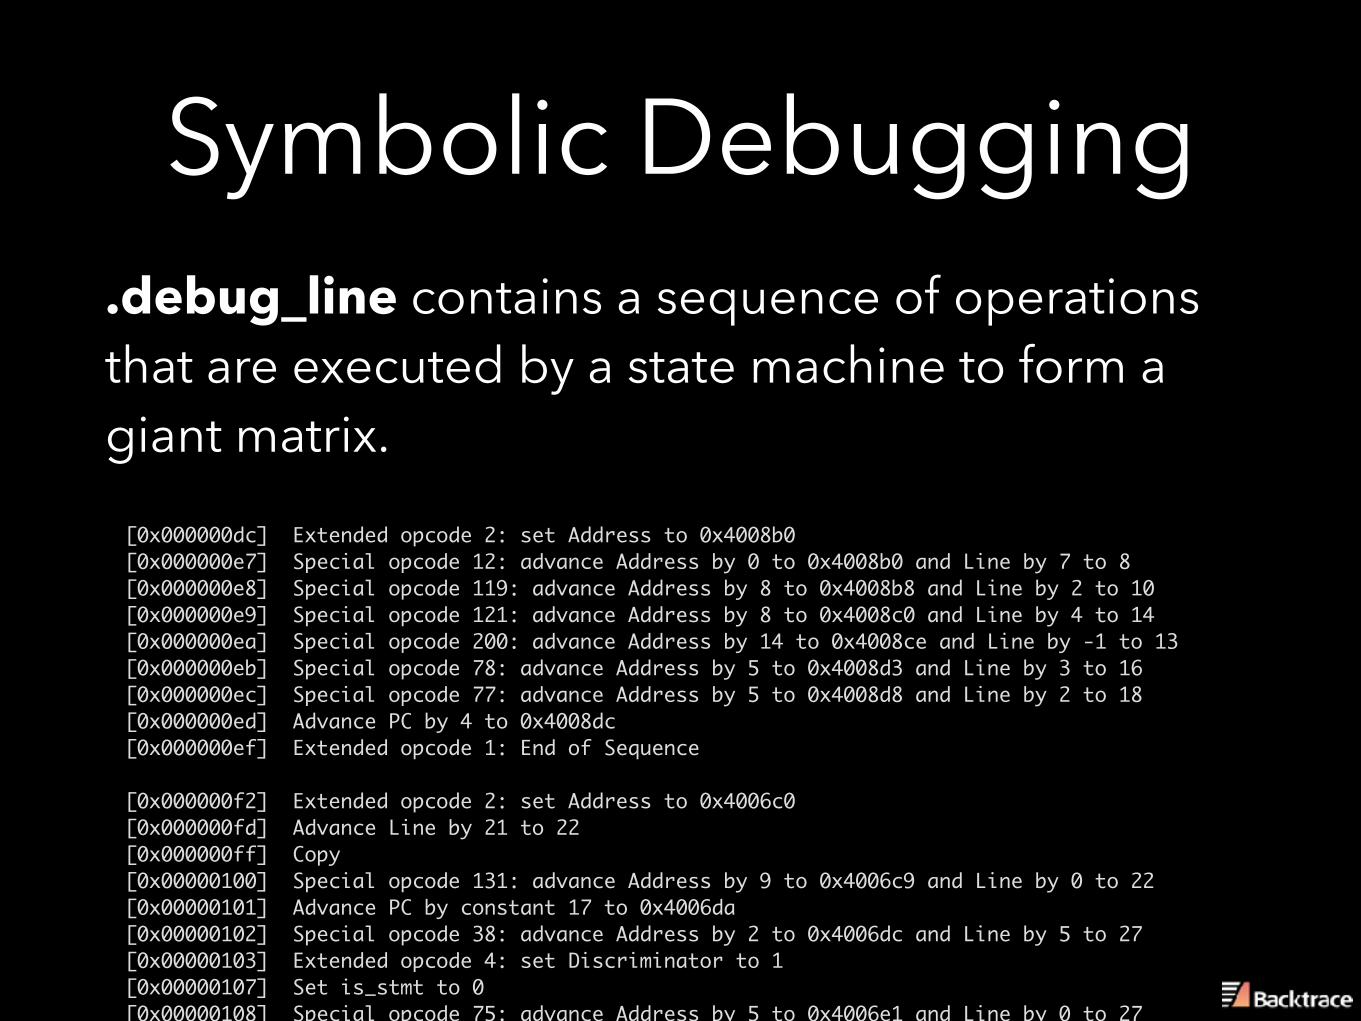
[0x000000dc] Extended opcode 2: set Address to 0x4008b0 [0x000000e7] Special opcode 12: advance Address by 0 to 0x4008b0 and Line by 7 to 8 [0x000000e8] Special opcode 119: advance Address by 8 to 0x4008b8 and Line by 2 to 10 [0x000000e9] Special opcode 121: advance Address by 8 to 0x4008c0 and Line by 4 to 14 [0x000000ea] Special opcode 200: advance Address by 14 to 0x4008ce and Line by -1 to 13 [0x000000eb] Special opcode 78: advance Address by 5 to 0x4008d3 and Line by 3 to 16 [0x000000ec] Special opcode 77: advance Address by 5 to 0x4008d8 and Line by 2 to 18 [0x000000ed] Advance PC by 4 to 0x4008dc [0x000000ef] Extended opcode 1: End of Sequence
[0x000000f2] Extended opcode 2: set Address to 0x4006c0 [0x000000fd] Advance Line by 21 to 22 [0x000000ff] Copy [0x00000100] Special opcode 131: advance Address by 9 to 0x4006c9 and Line by 0 to 22 [0x00000101] Advance PC by constant 17 to 0x4006da [0x00000102] Special opcode 38: advance Address by 2 to 0x4006dc and Line by 5 to 27 [0x00000103] Extended opcode 4: set Discriminator to 1 [0x00000107] Set is_stmt to 0 [0x00000108] Special opcode 75: advance Address by 5 to 0x4006e1 and Line by 0 to 27
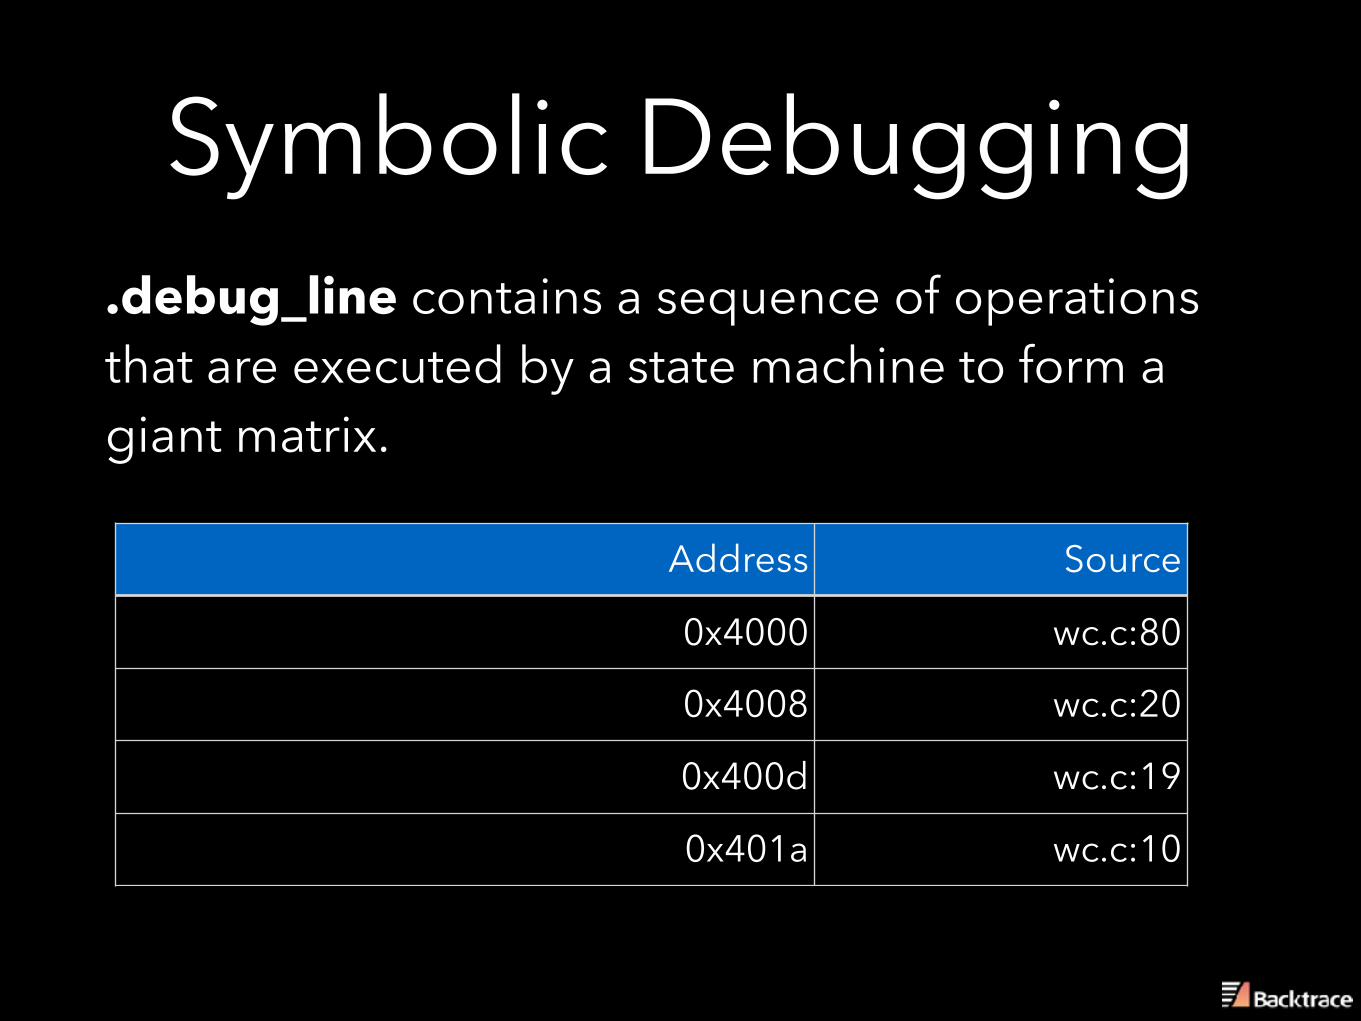
Symbolic Debugging.debug_line contains a sequence of operations that are executed by a state machine to form a giant matrix.
Symbolic Debugging.debug_line contains a sequence of operations that are executed by a state machine to form a giant matrix.
Address Source
0x4000 wc.c:80
0x4008 wc.c:20
0x400d wc.c:19
0x401a wc.c:10
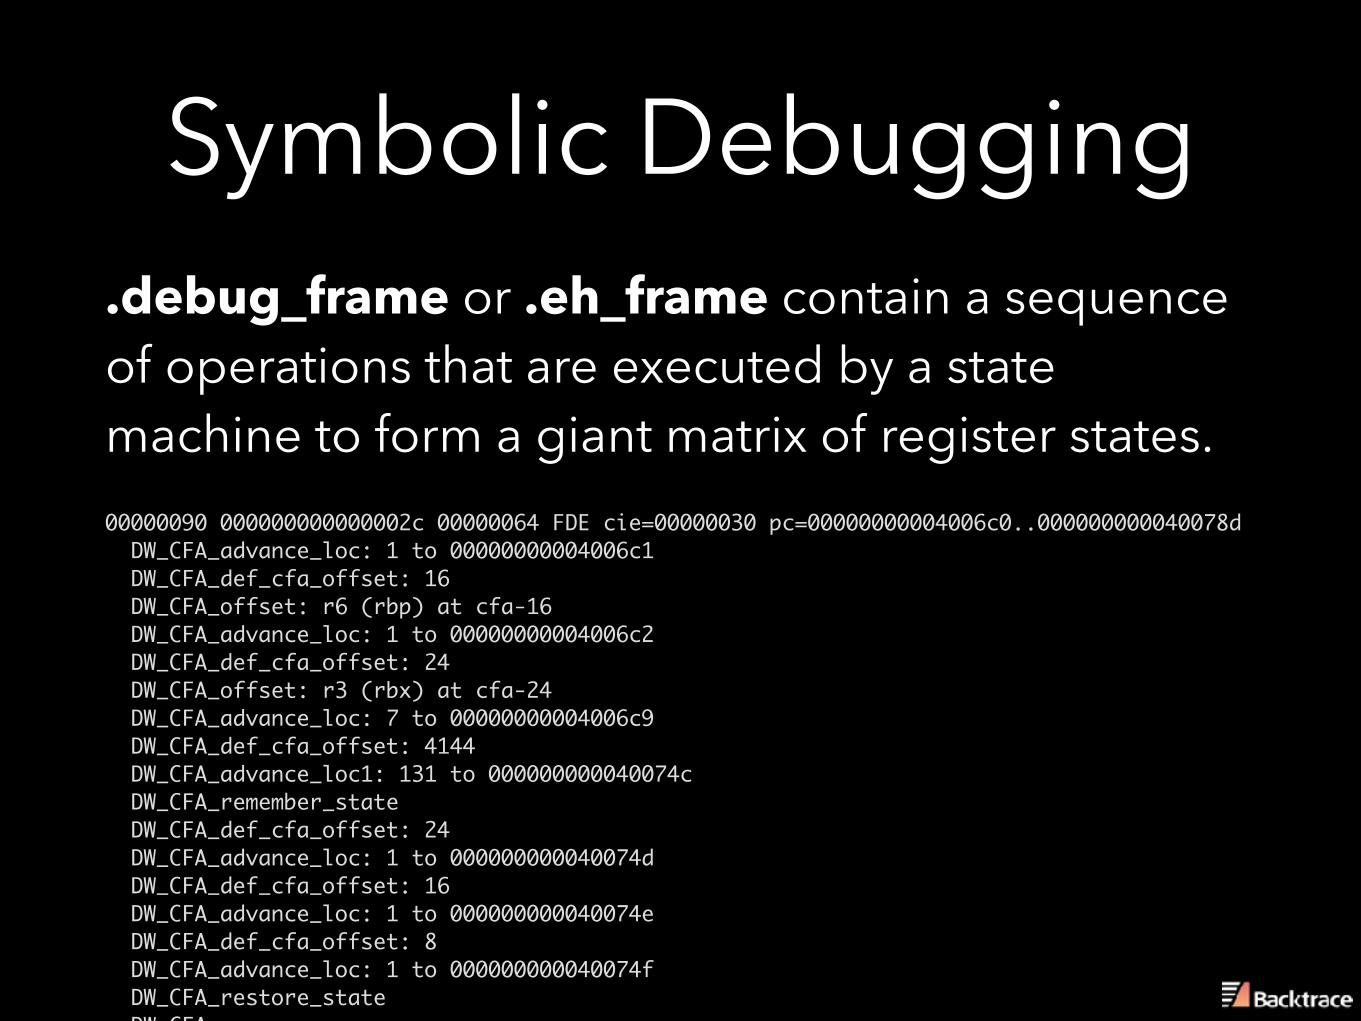
00000090 000000000000002c 00000064 FDE cie=00000030 pc=00000000004006c0..000000000040078d DW_CFA_advance_loc: 1 to 00000000004006c1 DW_CFA_def_cfa_offset: 16 DW_CFA_offset: r6 (rbp) at cfa-16 DW_CFA_advance_loc: 1 to 00000000004006c2 DW_CFA_def_cfa_offset: 24 DW_CFA_offset: r3 (rbx) at cfa-24 DW_CFA_advance_loc: 7 to 00000000004006c9 DW_CFA_def_cfa_offset: 4144 DW_CFA_advance_loc1: 131 to 000000000040074c DW_CFA_remember_state DW_CFA_def_cfa_offset: 24 DW_CFA_advance_loc: 1 to 000000000040074d DW_CFA_def_cfa_offset: 16 DW_CFA_advance_loc: 1 to 000000000040074e DW_CFA_def_cfa_offset: 8 DW_CFA_advance_loc: 1 to 000000000040074f DW_CFA_restore_state DW_CFA_nop
Symbolic Debugging.debug_frame or .eh_frame contain a sequence of operations that are executed by a state machine to form a giant matrix of register states.
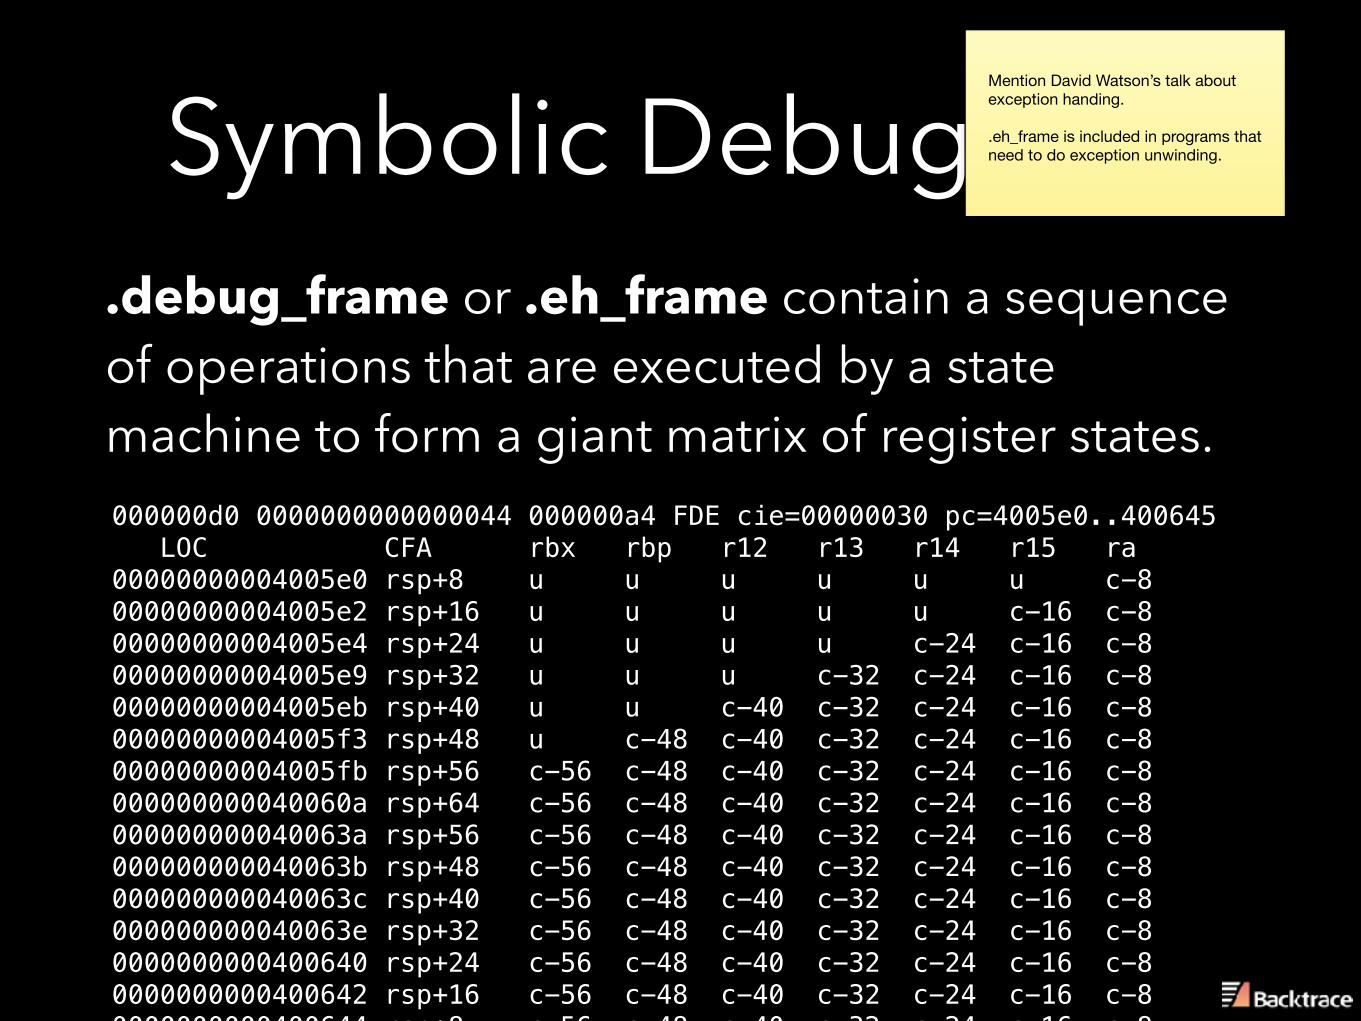
Symbolic Debugging.debug_frame or .eh_frame contain a sequence of operations that are executed by a state machine to form a giant matrix of register states.000000d0 0000000000000044 000000a4 FDE cie=00000030 pc=4005e0..400645 LOC CFA rbx rbp r12 r13 r14 r15 ra 00000000004005e0 rsp+8 u u u u u u c-8 00000000004005e2 rsp+16 u u u u u c-16 c-8 00000000004005e4 rsp+24 u u u u c-24 c-16 c-8 00000000004005e9 rsp+32 u u u c-32 c-24 c-16 c-8 00000000004005eb rsp+40 u u c-40 c-32 c-24 c-16 c-8 00000000004005f3 rsp+48 u c-48 c-40 c-32 c-24 c-16 c-8 00000000004005fb rsp+56 c-56 c-48 c-40 c-32 c-24 c-16 c-8 000000000040060a rsp+64 c-56 c-48 c-40 c-32 c-24 c-16 c-8 000000000040063a rsp+56 c-56 c-48 c-40 c-32 c-24 c-16 c-8 000000000040063b rsp+48 c-56 c-48 c-40 c-32 c-24 c-16 c-8 000000000040063c rsp+40 c-56 c-48 c-40 c-32 c-24 c-16 c-8 000000000040063e rsp+32 c-56 c-48 c-40 c-32 c-24 c-16 c-8 0000000000400640 rsp+24 c-56 c-48 c-40 c-32 c-24 c-16 c-8 0000000000400642 rsp+16 c-56 c-48 c-40 c-32 c-24 c-16 c-8 0000000000400644 rsp+8 c-56 c-48 c-40 c-32 c-24 c-16 c-8
Mention David Watson’s talk about exception handing.
.eh_frame is included in programs that need to do exception unwinding.
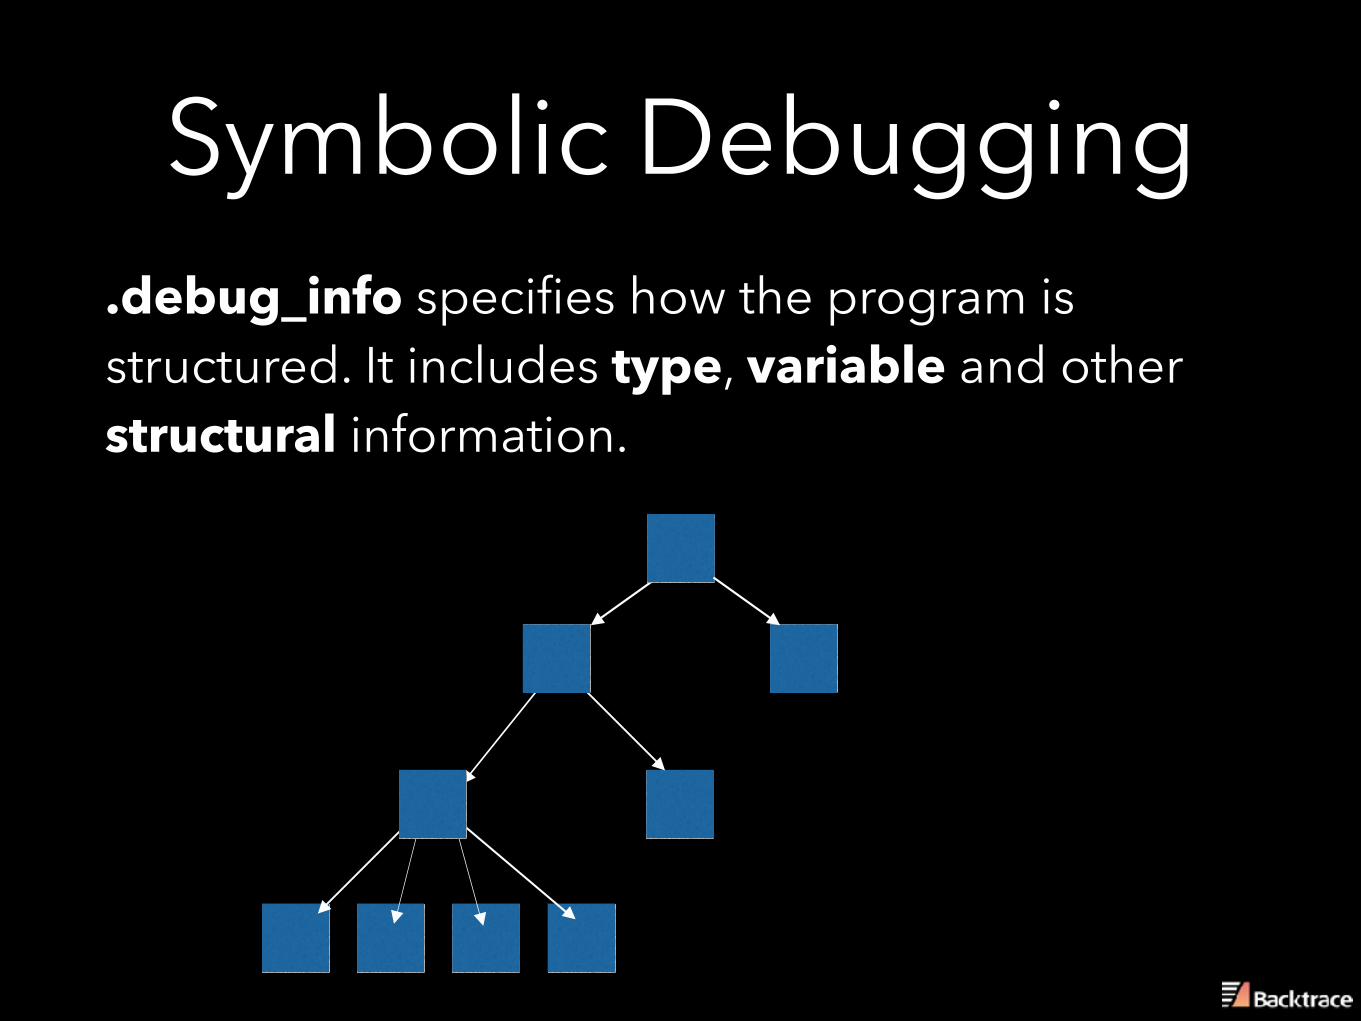
Symbolic Debugging.debug_info specifies how the program is structured. It includes type, variable and other structural information.
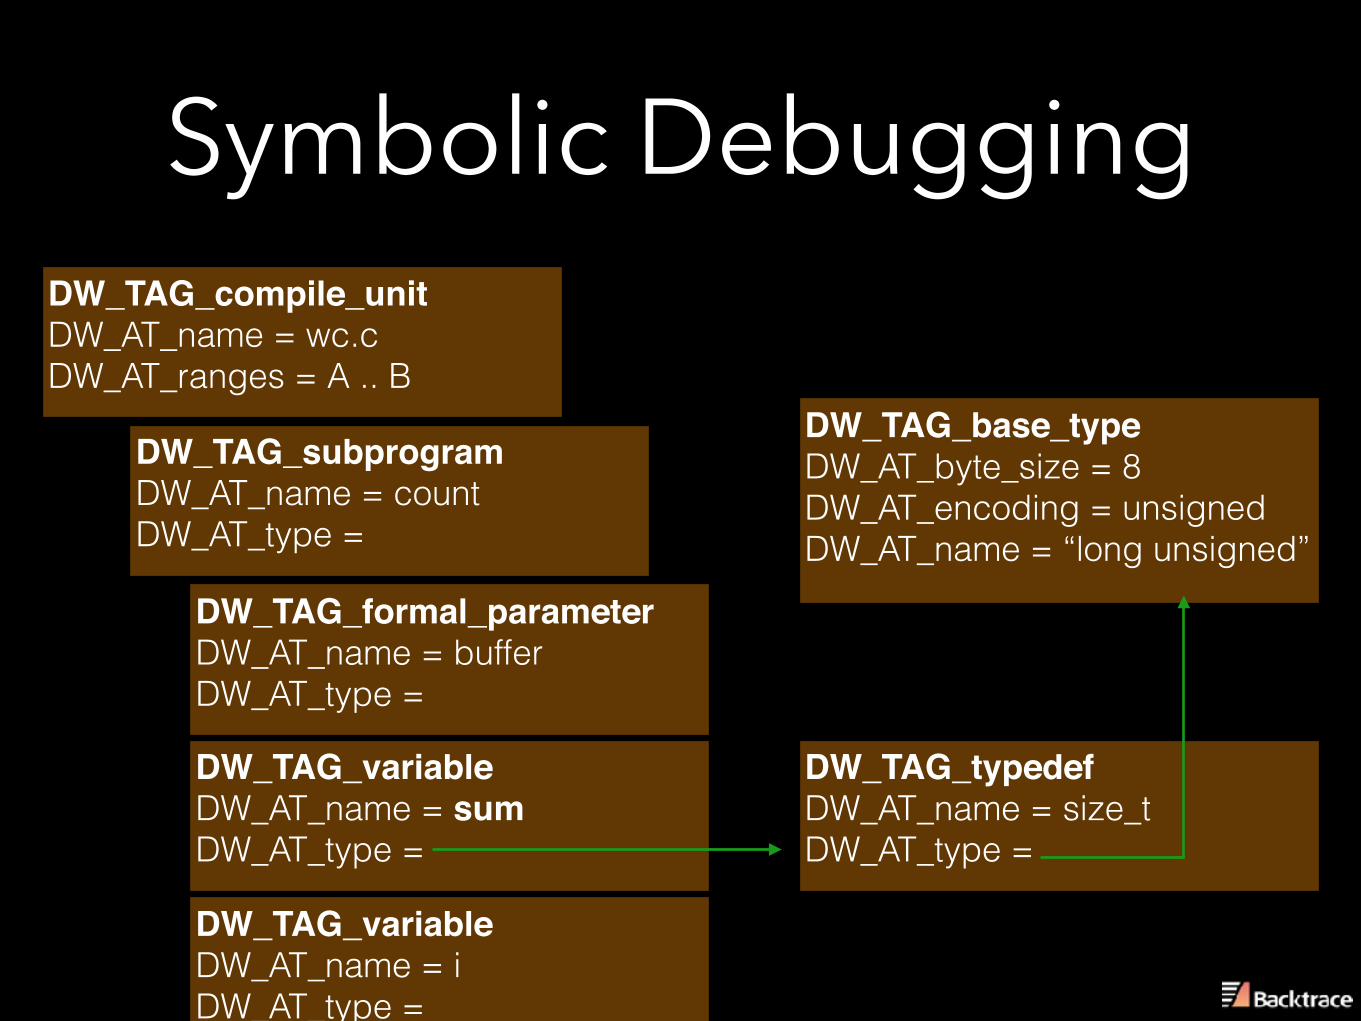
Symbolic DebuggingDW_TAG_compile_unitDW_AT_name = wc.c DW_AT_ranges = A .. B
DW_TAG_subprogramDW_AT_name = count DW_AT_type =
DW_TAG_formal_parameterDW_AT_name = buffer DW_AT_type =
DW_TAG_variableDW_AT_name = sumDW_AT_type =
DW_TAG_variableDW_AT_name = i DW_AT_type =
DW_TAG_typedefDW_AT_name = size_t DW_AT_type =
DW_TAG_base_typeDW_AT_byte_size = 8 DW_AT_encoding = unsigned DW_AT_name = “long unsigned”
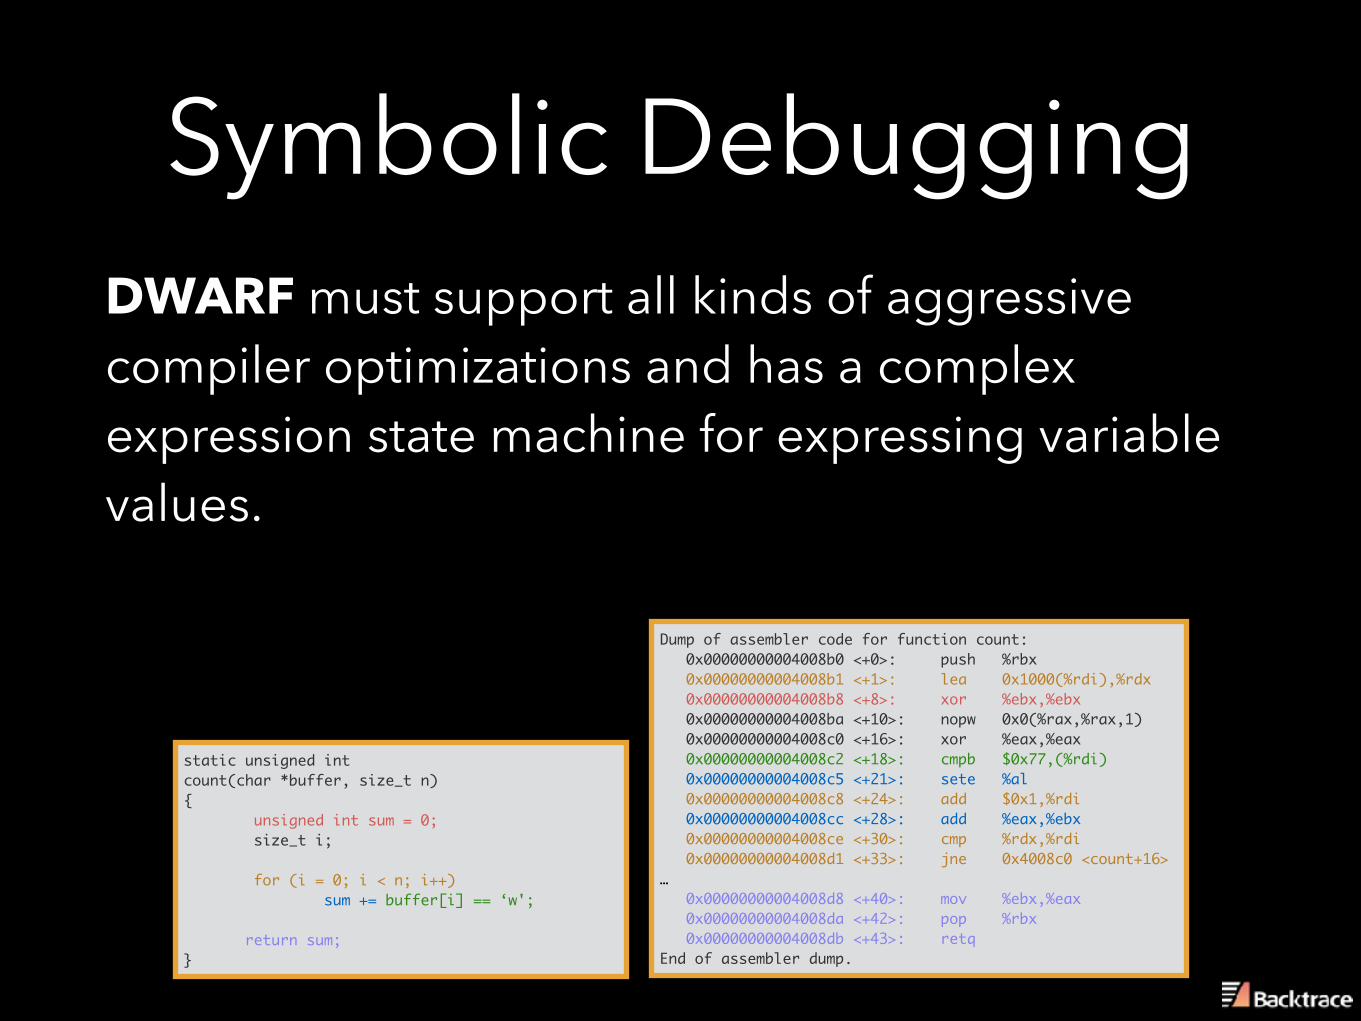
Symbolic DebuggingDWARF must support all kinds of aggressive compiler optimizations and has a complex expression state machine for expressing variable values.
static unsigned intcount(char *buffer, size_t n){ unsigned int sum = 0; size_t i; for (i = 0; i < n; i++) sum += buffer[i] == ‘w';
return sum;}
Dump of assembler code for function count: 0x00000000004008b0 <+0>: push %rbx 0x00000000004008b1 <+1>: lea 0x1000(%rdi),%rdx 0x00000000004008b8 <+8>: xor %ebx,%ebx 0x00000000004008ba <+10>: nopw 0x0(%rax,%rax,1) 0x00000000004008c0 <+16>: xor %eax,%eax 0x00000000004008c2 <+18>: cmpb $0x77,(%rdi) 0x00000000004008c5 <+21>: sete %al 0x00000000004008c8 <+24>: add $0x1,%rdi 0x00000000004008cc <+28>: add %eax,%ebx 0x00000000004008ce <+30>: cmp %rdx,%rdi 0x00000000004008d1 <+33>: jne 0x4008c0 <count+16>… 0x00000000004008d8 <+40>: mov %ebx,%eax 0x00000000004008da <+42>: pop %rbx 0x00000000004008db <+43>: retq End of assembler dump.
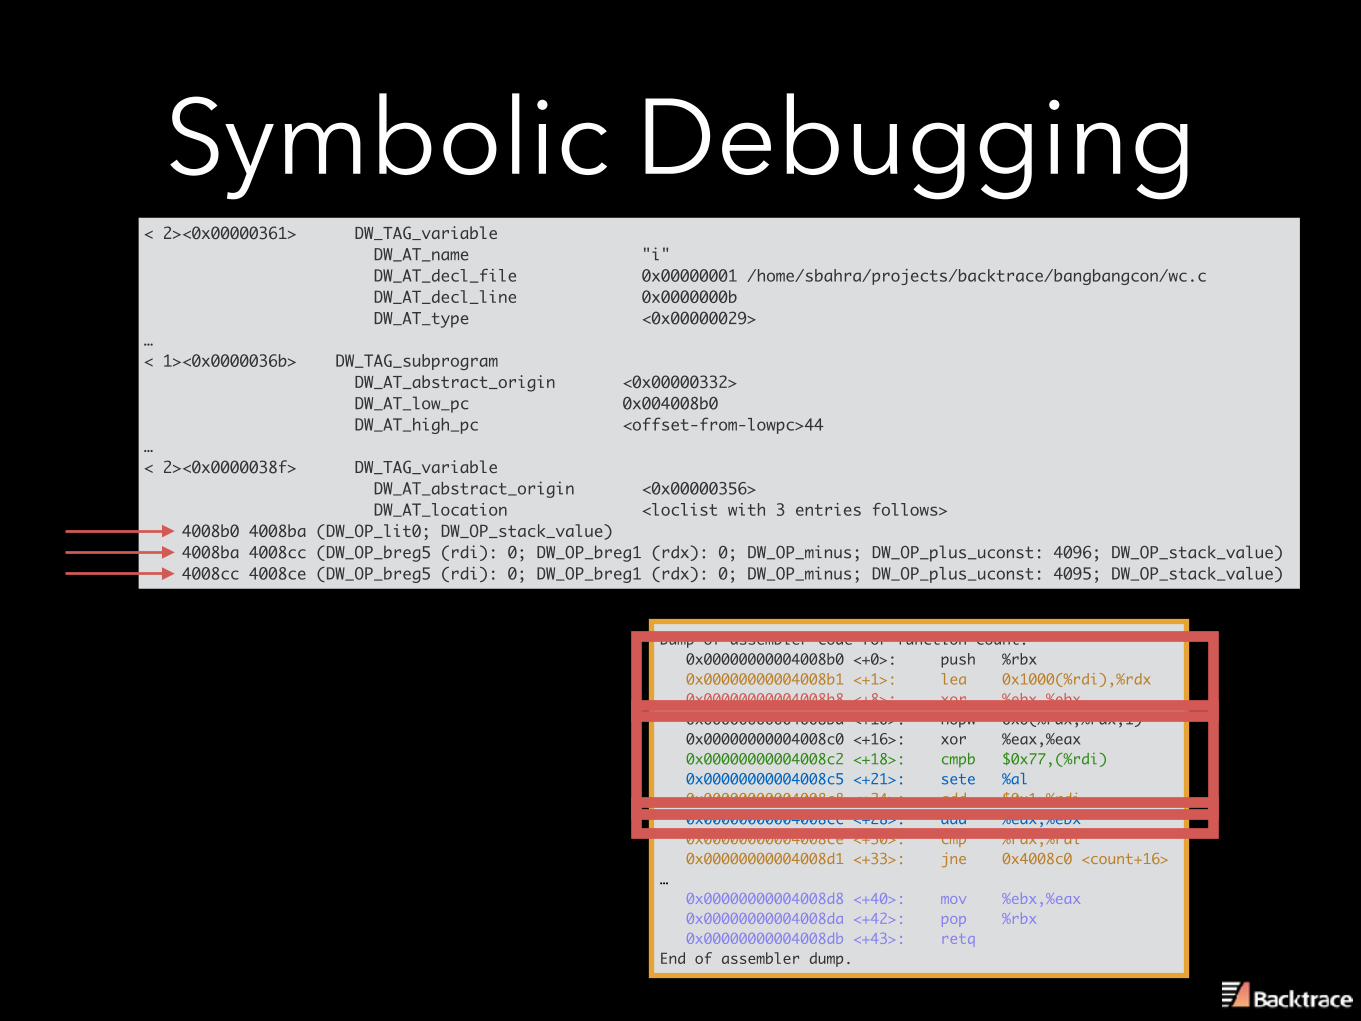
Symbolic Debugging< 2><0x00000361> DW_TAG_variable DW_AT_name "i" DW_AT_decl_file 0x00000001 /home/sbahra/projects/backtrace/bangbangcon/wc.c DW_AT_decl_line 0x0000000b DW_AT_type <0x00000029>…< 1><0x0000036b> DW_TAG_subprogram DW_AT_abstract_origin <0x00000332> DW_AT_low_pc 0x004008b0 DW_AT_high_pc <offset-from-lowpc>44…< 2><0x0000038f> DW_TAG_variable DW_AT_abstract_origin <0x00000356> DW_AT_location <loclist with 3 entries follows> 4008b0 4008ba (DW_OP_lit0; DW_OP_stack_value) 4008ba 4008cc (DW_OP_breg5 (rdi): 0; DW_OP_breg1 (rdx): 0; DW_OP_minus; DW_OP_plus_uconst: 4096; DW_OP_stack_value) 4008cc 4008ce (DW_OP_breg5 (rdi): 0; DW_OP_breg1 (rdx): 0; DW_OP_minus; DW_OP_plus_uconst: 4095; DW_OP_stack_value)
Dump of assembler code for function count: 0x00000000004008b0 <+0>: push %rbx 0x00000000004008b1 <+1>: lea 0x1000(%rdi),%rdx 0x00000000004008b8 <+8>: xor %ebx,%ebx 0x00000000004008ba <+10>: nopw 0x0(%rax,%rax,1) 0x00000000004008c0 <+16>: xor %eax,%eax 0x00000000004008c2 <+18>: cmpb $0x77,(%rdi) 0x00000000004008c5 <+21>: sete %al 0x00000000004008c8 <+24>: add $0x1,%rdi 0x00000000004008cc <+28>: add %eax,%ebx 0x00000000004008ce <+30>: cmp %rdx,%rdi 0x00000000004008d1 <+33>: jne 0x4008c0 <count+16>… 0x00000000004008d8 <+40>: mov %ebx,%eax 0x00000000004008da <+42>: pop %rbx 0x00000000004008db <+43>: retq End of assembler dump.
buffer + 1
buffer + 4096-
-4095
+4096
1
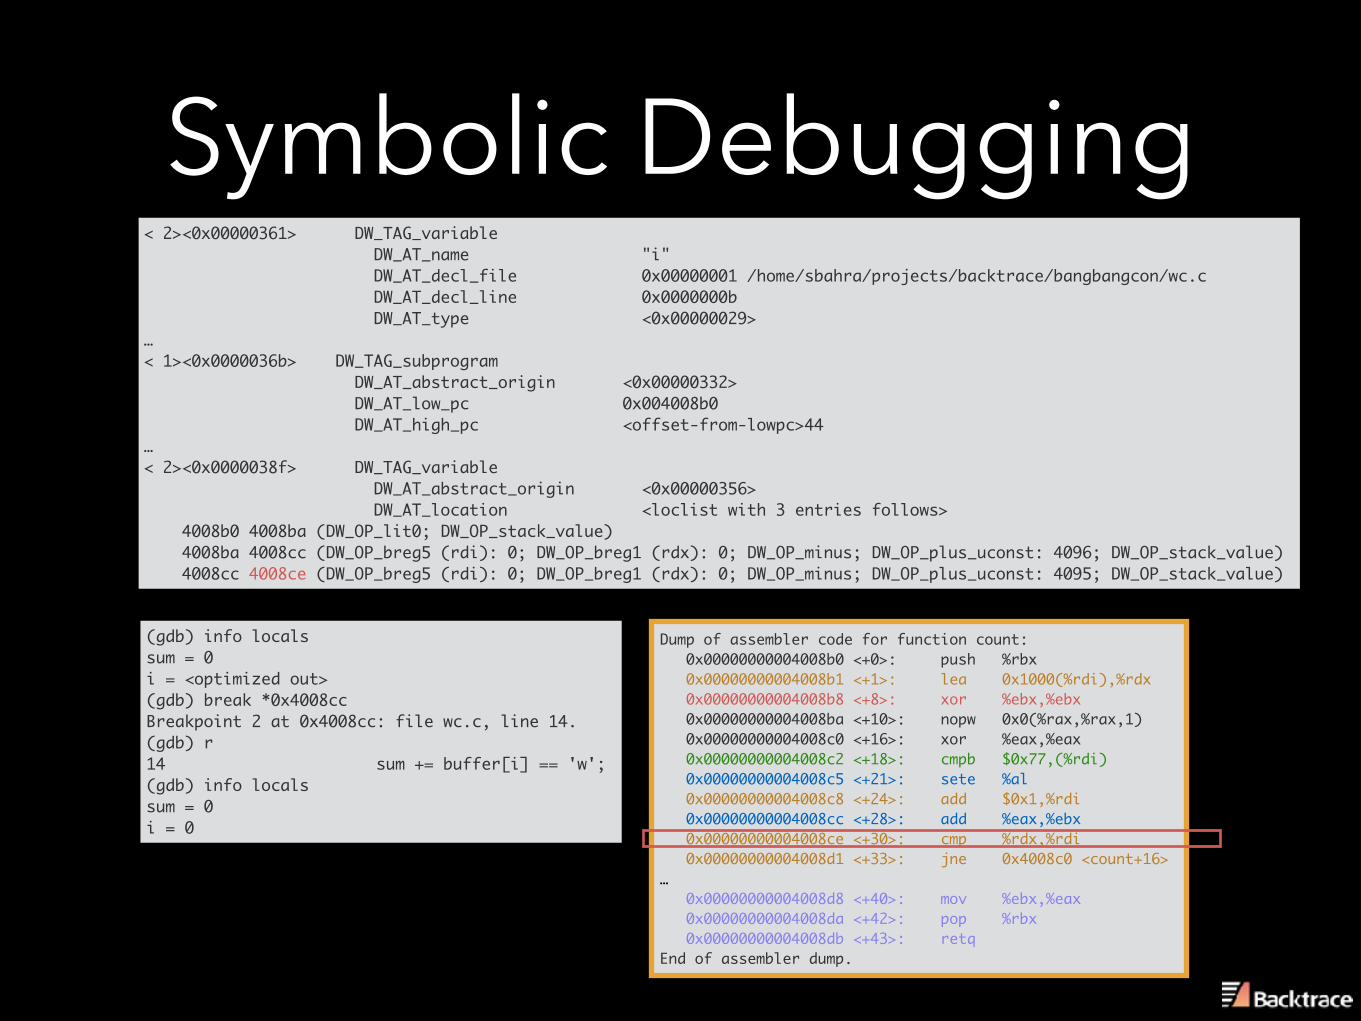
Symbolic Debugging< 2><0x00000361> DW_TAG_variable DW_AT_name "i" DW_AT_decl_file 0x00000001 /home/sbahra/projects/backtrace/bangbangcon/wc.c DW_AT_decl_line 0x0000000b DW_AT_type <0x00000029>…< 1><0x0000036b> DW_TAG_subprogram DW_AT_abstract_origin <0x00000332> DW_AT_low_pc 0x004008b0 DW_AT_high_pc <offset-from-lowpc>44…< 2><0x0000038f> DW_TAG_variable DW_AT_abstract_origin <0x00000356> DW_AT_location <loclist with 3 entries follows> 4008b0 4008ba (DW_OP_lit0; DW_OP_stack_value) 4008ba 4008cc (DW_OP_breg5 (rdi): 0; DW_OP_breg1 (rdx): 0; DW_OP_minus; DW_OP_plus_uconst: 4096; DW_OP_stack_value) 4008cc 4008ce (DW_OP_breg5 (rdi): 0; DW_OP_breg1 (rdx): 0; DW_OP_minus; DW_OP_plus_uconst: 4095; DW_OP_stack_value)
Dump of assembler code for function count: 0x00000000004008b0 <+0>: push %rbx 0x00000000004008b1 <+1>: lea 0x1000(%rdi),%rdx 0x00000000004008b8 <+8>: xor %ebx,%ebx 0x00000000004008ba <+10>: nopw 0x0(%rax,%rax,1) 0x00000000004008c0 <+16>: xor %eax,%eax 0x00000000004008c2 <+18>: cmpb $0x77,(%rdi) 0x00000000004008c5 <+21>: sete %al 0x00000000004008c8 <+24>: add $0x1,%rdi 0x00000000004008cc <+28>: add %eax,%ebx 0x00000000004008ce <+30>: cmp %rdx,%rdi 0x00000000004008d1 <+33>: jne 0x4008c0 <count+16>… 0x00000000004008d8 <+40>: mov %ebx,%eax 0x00000000004008da <+42>: pop %rbx 0x00000000004008db <+43>: retq End of assembler dump.
(gdb) info localssum = 0i = <optimized out>(gdb) break *0x4008ccBreakpoint 2 at 0x4008cc: file wc.c, line 14.(gdb) r14 sum += buffer[i] == 'w';(gdb) info localssum = 0i = 0
Symbolic DebuggingDWARF is designed to support aggressive compiler optimizations.
So why is my debugger not unwinding correctly or missing crucial information such as variable values?
Symbolic Debugging
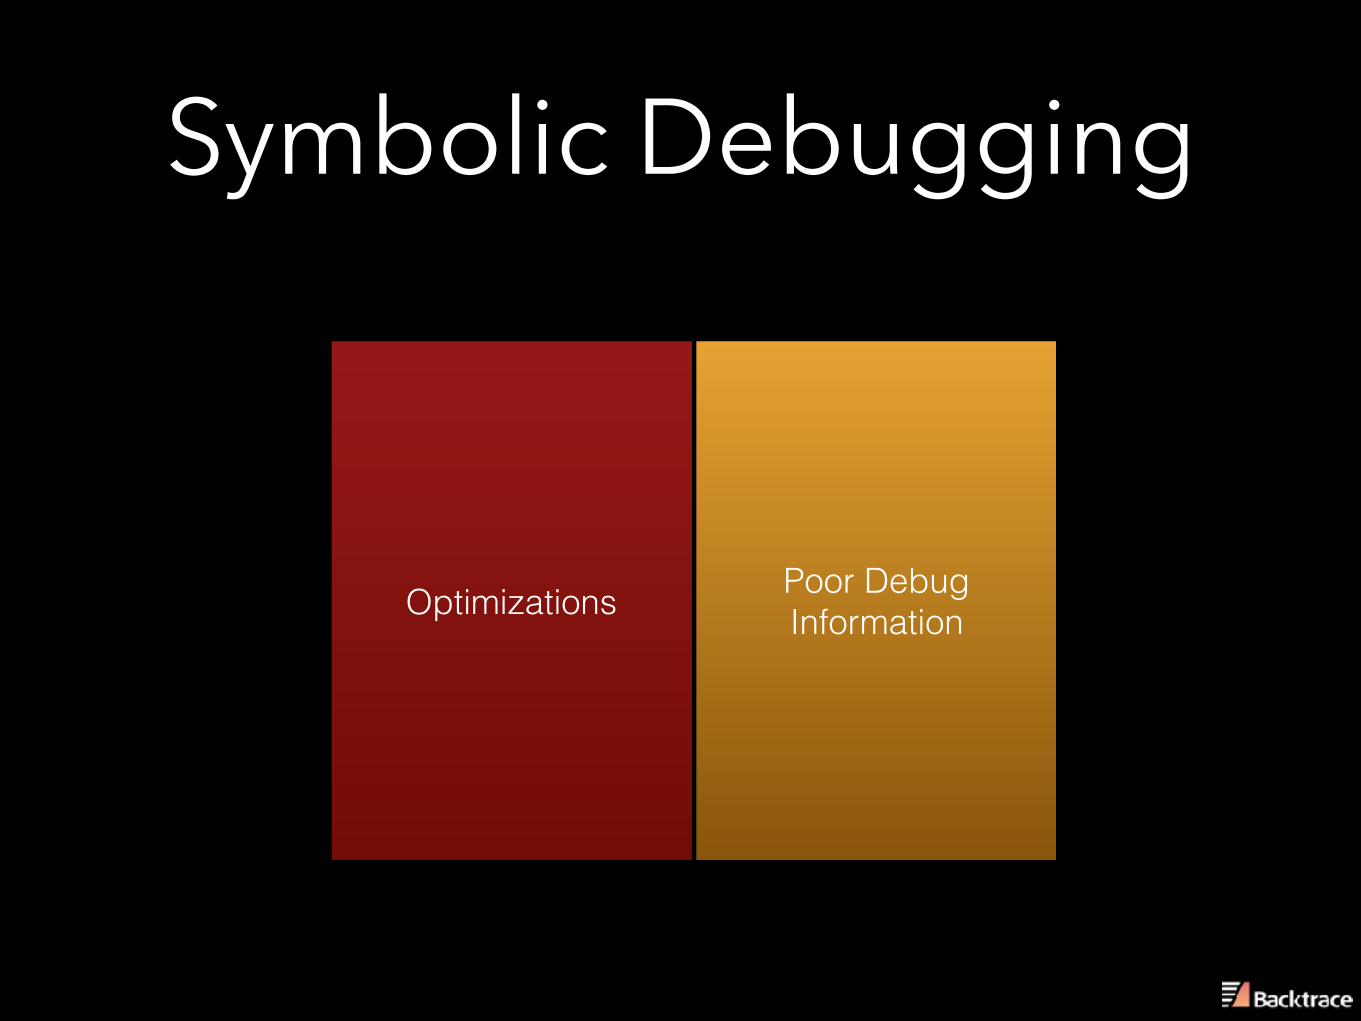
Optimizations Poor Debug Information
Debug Information Quality
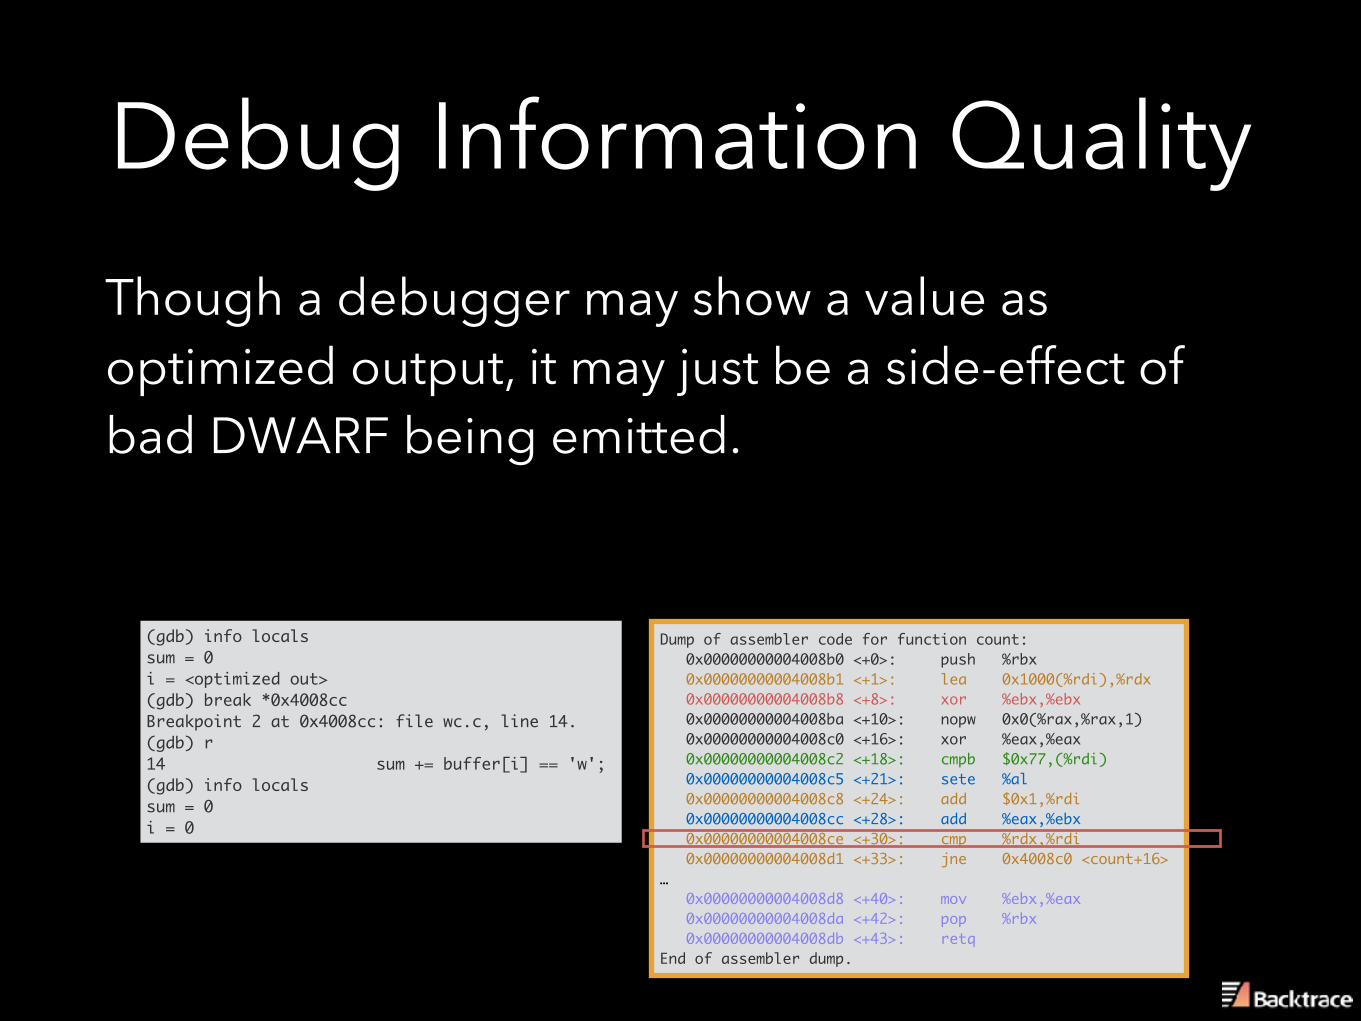
Dump of assembler code for function count: 0x00000000004008b0 <+0>: push %rbx 0x00000000004008b1 <+1>: lea 0x1000(%rdi),%rdx 0x00000000004008b8 <+8>: xor %ebx,%ebx 0x00000000004008ba <+10>: nopw 0x0(%rax,%rax,1) 0x00000000004008c0 <+16>: xor %eax,%eax 0x00000000004008c2 <+18>: cmpb $0x77,(%rdi) 0x00000000004008c5 <+21>: sete %al 0x00000000004008c8 <+24>: add $0x1,%rdi 0x00000000004008cc <+28>: add %eax,%ebx 0x00000000004008ce <+30>: cmp %rdx,%rdi 0x00000000004008d1 <+33>: jne 0x4008c0 <count+16>… 0x00000000004008d8 <+40>: mov %ebx,%eax 0x00000000004008da <+42>: pop %rbx 0x00000000004008db <+43>: retq End of assembler dump.
(gdb) info localssum = 0i = <optimized out>(gdb) break *0x4008ccBreakpoint 2 at 0x4008cc: file wc.c, line 14.(gdb) r14 sum += buffer[i] == 'w';(gdb) info localssum = 0i = 0
Though a debugger may show a value as optimized output, it may just be a side-effect of bad DWARF being emitted.
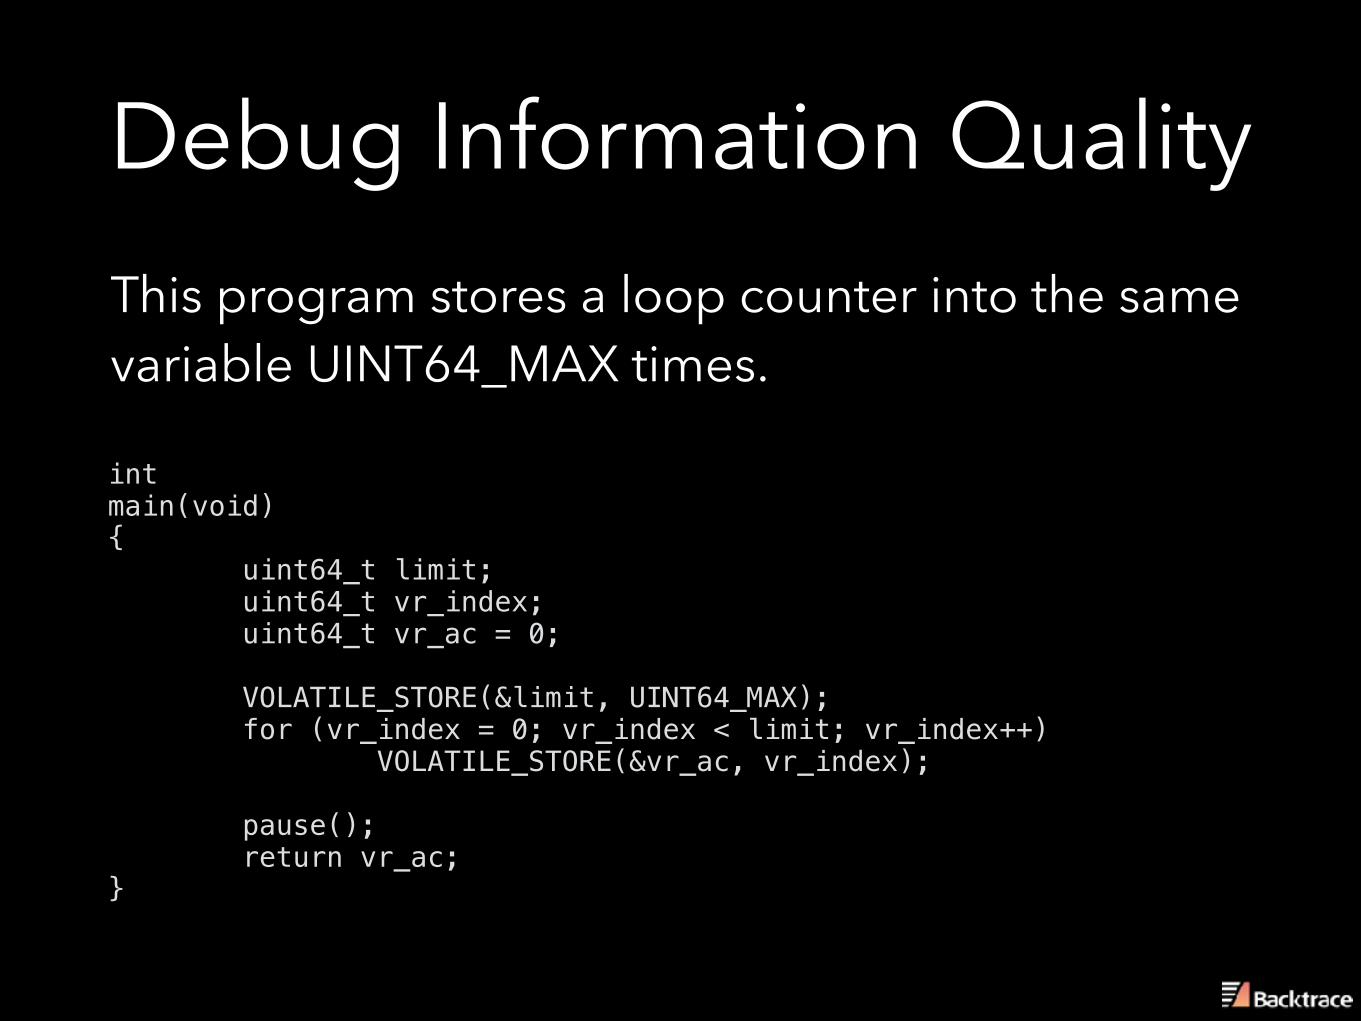
Debug Information QualityThis program stores a loop counter into the same variable UINT64_MAX times.
int main(void) { uint64_t limit; uint64_t vr_index; uint64_t vr_ac = 0; VOLATILE_STORE(&limit, UINT64_MAX); for (vr_index = 0; vr_index < limit; vr_index++) VOLATILE_STORE(&vr_ac, vr_index); pause(); return vr_ac; }
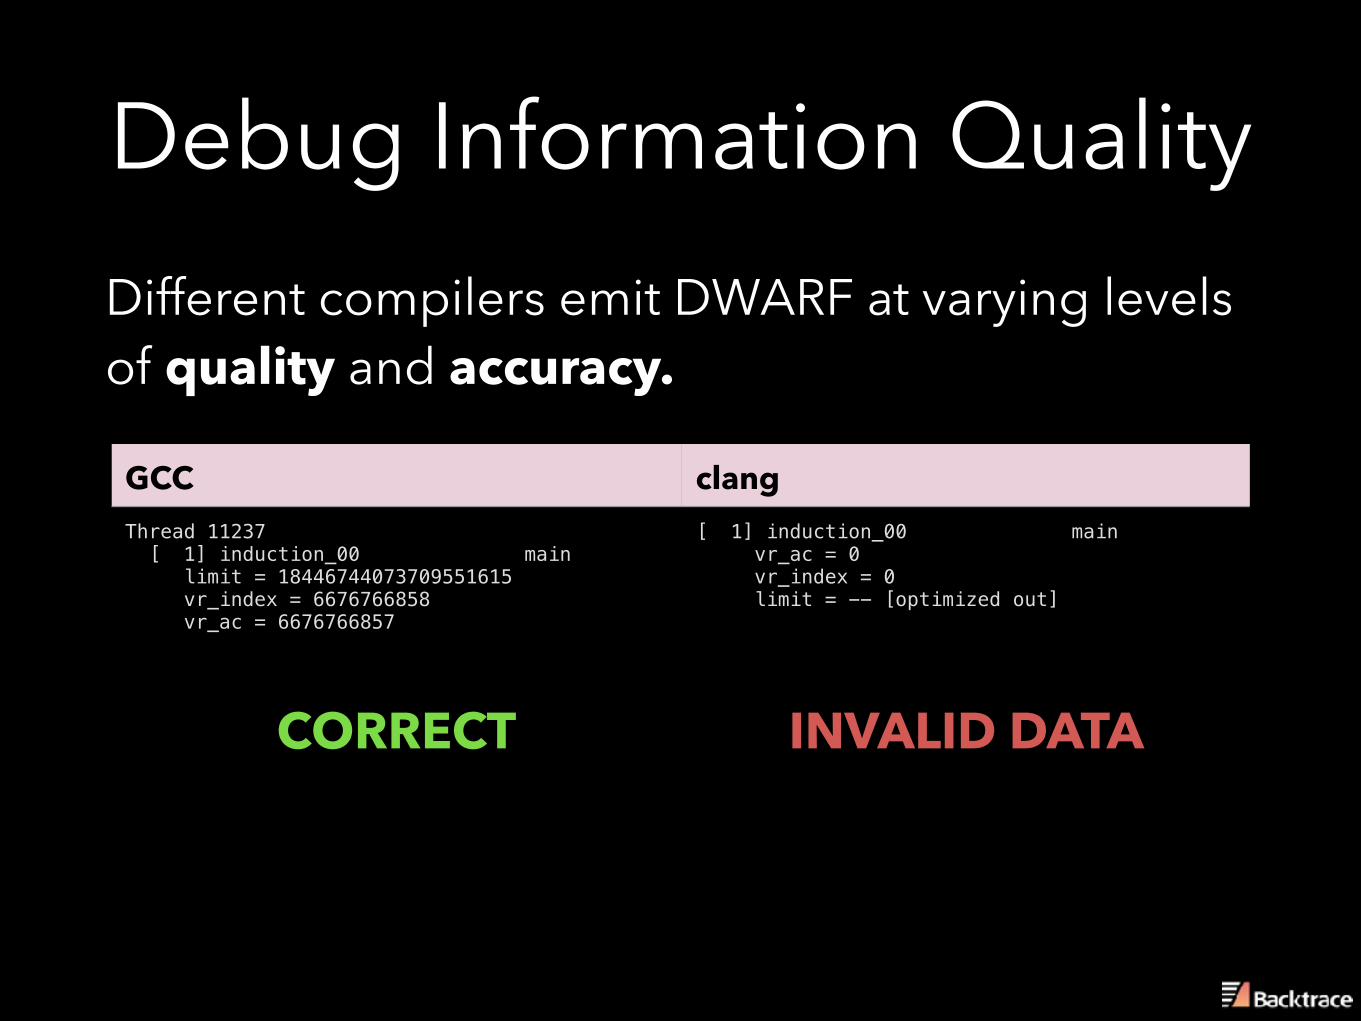
Debug Information QualityDifferent compilers emit DWARF at varying levels of quality and accuracy.
GCC clangThread 11237 [ 1] induction_00 main limit = 18446744073709551615 vr_index = 6676766858 vr_ac = 6676766857
[ 1] induction_00 main vr_ac = 0 vr_index = 0 limit = -- [optimized out]
CORRECT INVALID DATA
OptimizationsLet’s review optimizations that will impact availability of debug information.
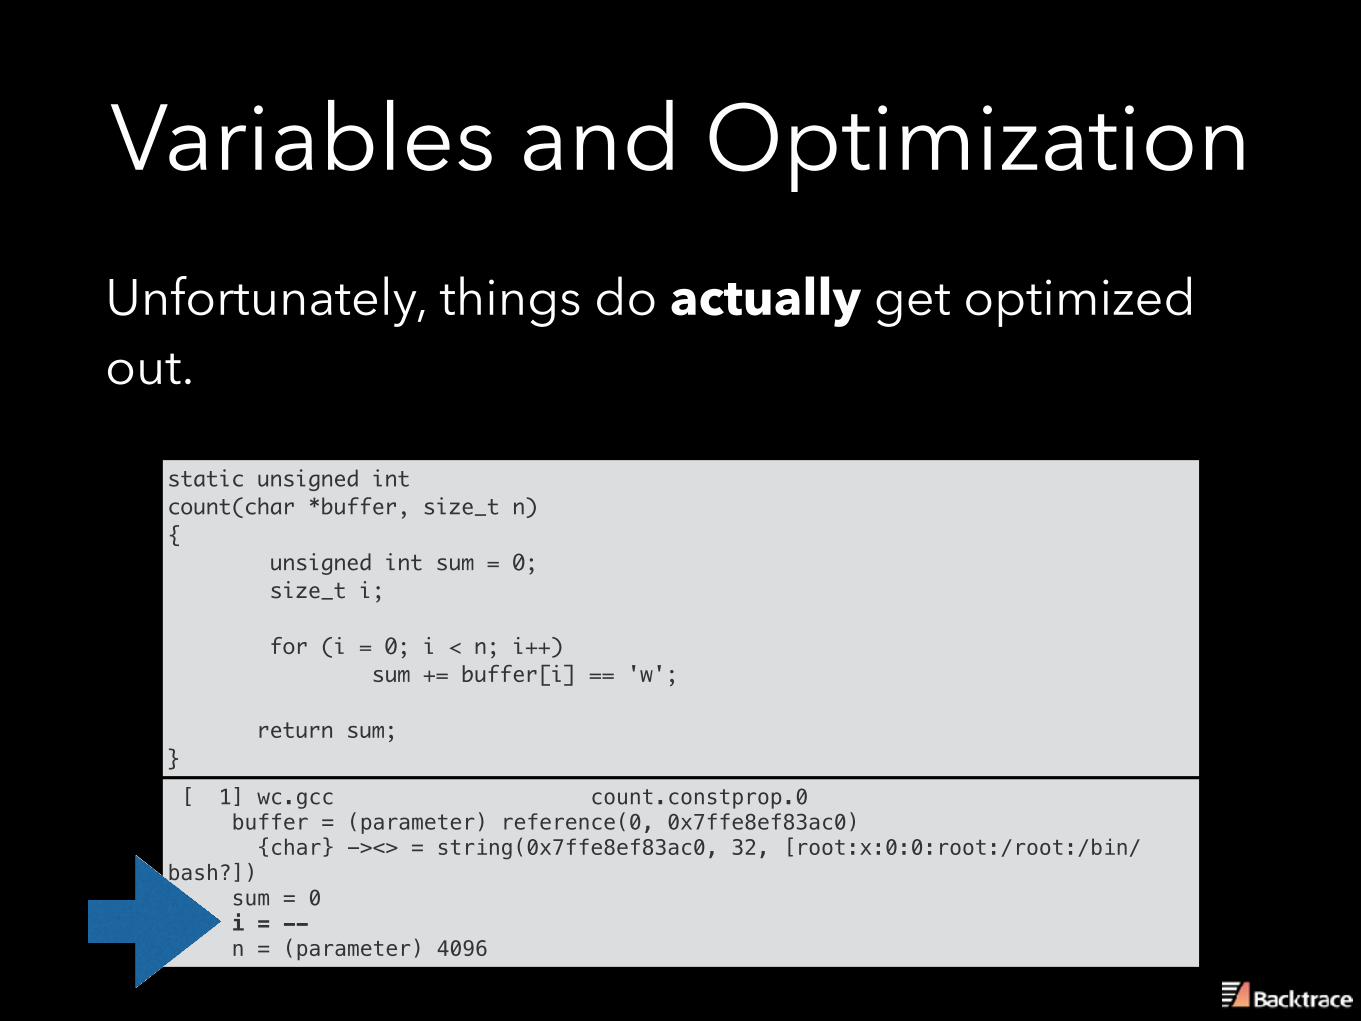
Variables and OptimizationUnfortunately, things do actually get optimized out.
static unsigned int count(char *buffer, size_t n) { unsigned int sum = 0; size_t i; for (i = 0; i < n; i++) sum += buffer[i] == 'w'; return sum; } [ 1] wc.gcc count.constprop.0 buffer = (parameter) reference(0, 0x7ffe8ef83ac0) {char} -><> = string(0x7ffe8ef83ac0, 32, [root:x:0:0:root:/root:/bin/bash?]) sum = 0 i = -- n = (parameter) 4096
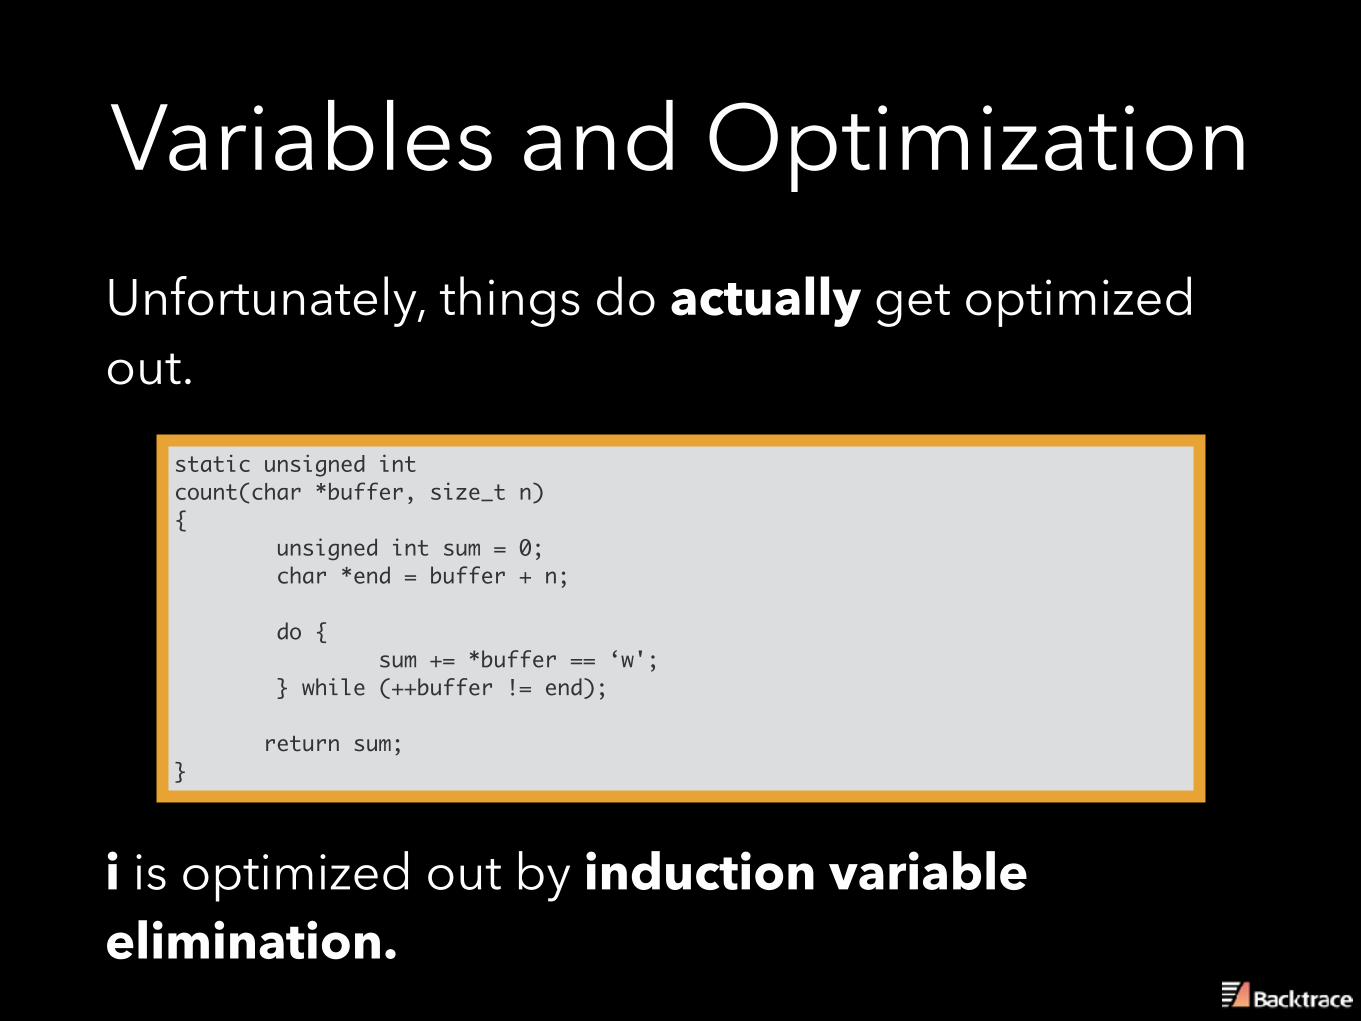
Variables and OptimizationUnfortunately, things do actually get optimized out.
static unsigned int count(char *buffer, size_t n) { unsigned int sum = 0; size_t i; for (i = 0; i < n; i++) sum += buffer[i] == 'w'; return sum; }
static unsigned int count(char *buffer, size_t n) { unsigned int sum = 0; char *end = buffer + n; do { sum += *buffer == ‘w'; } while (++buffer != end); return sum; }
i is optimized out by induction variable elimination.
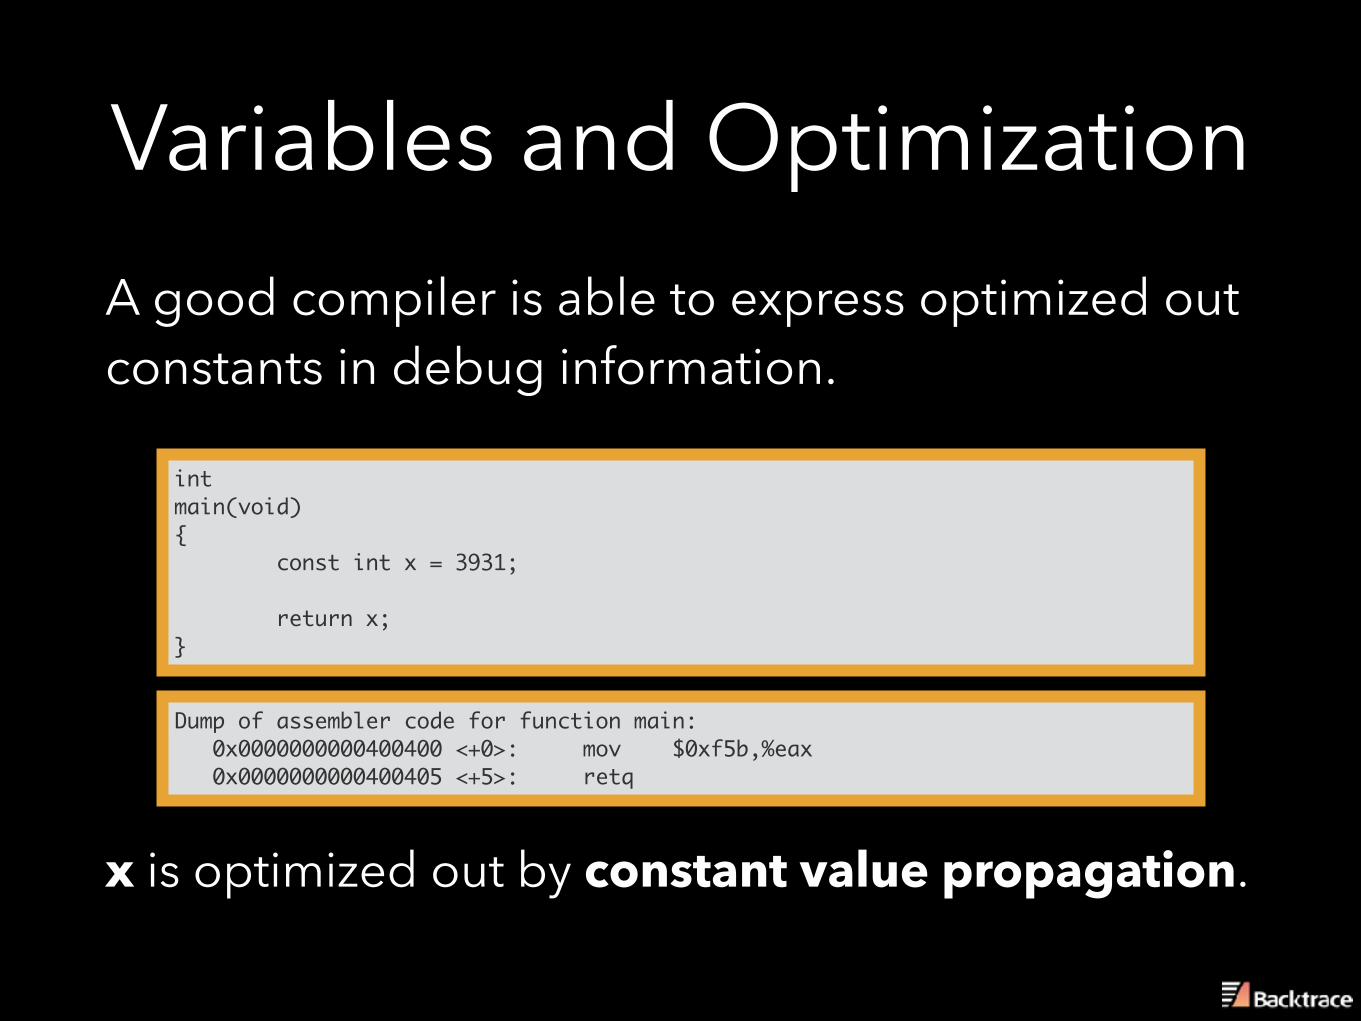
Variables and OptimizationA good compiler is able to express optimized out constants in debug information.
static unsigned int count(char *buffer, size_t n) { unsigned int sum = 0; size_t i; for (i = 0; i < n; i++)
intmain(void){ const int x = 3931;
return x;}
x is optimized out by constant value propagation.
Dump of assembler code for function main: 0x0000000000400400 <+0>: mov $0xf5b,%eax 0x0000000000400405 <+5>: retq
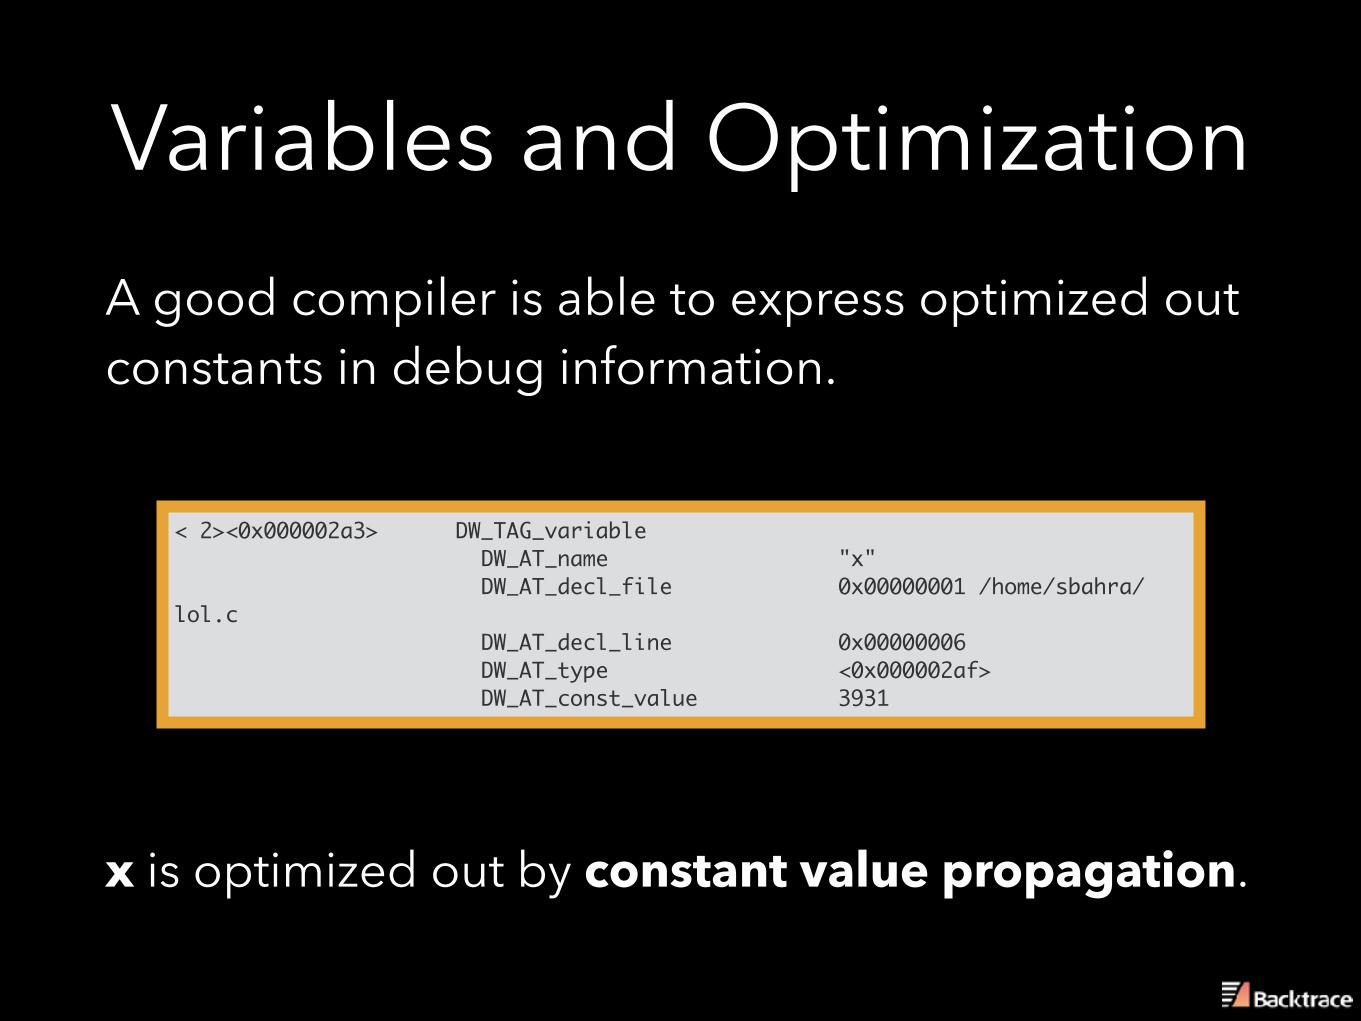
Variables and OptimizationA good compiler is able to express optimized out constants in debug information.
< 2><0x000002a3> DW_TAG_variable DW_AT_name "x" DW_AT_decl_file 0x00000001 /home/sbahra/lol.c DW_AT_decl_line 0x00000006 DW_AT_type <0x000002af> DW_AT_const_value 3931
x is optimized out by constant value propagation.
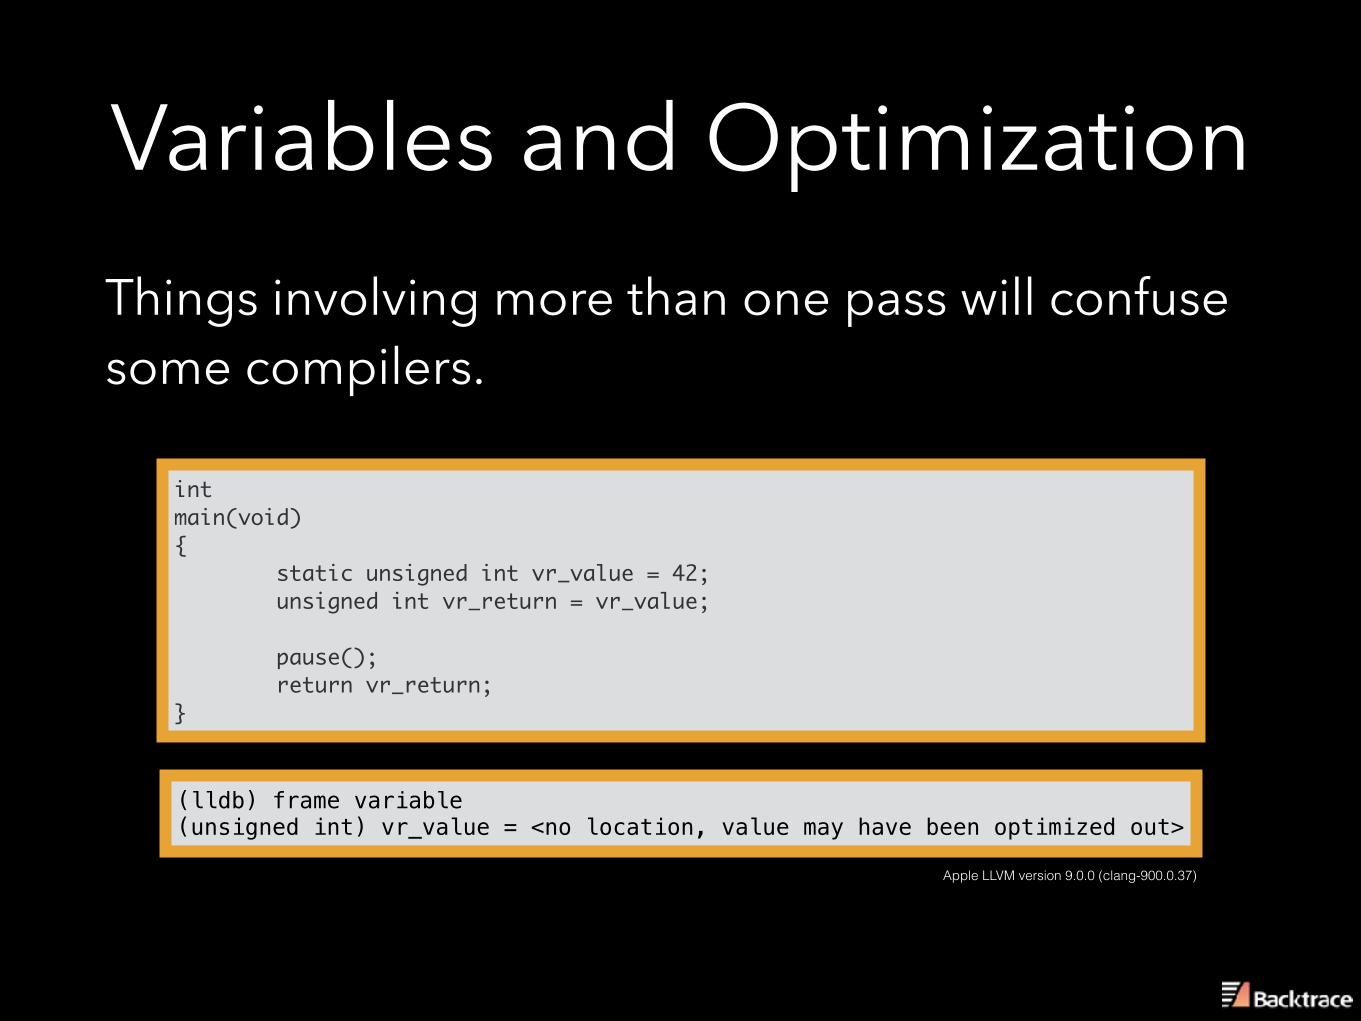
Variables and OptimizationThings involving more than one pass will confuse some compilers.
intmain(void){ static unsigned int vr_value = 42; unsigned int vr_return = vr_value;
pause(); return vr_return;}
(lldb) frame variable (unsigned int) vr_value = <no location, value may have been optimized out>
Apple LLVM version 9.0.0 (clang-900.0.37)
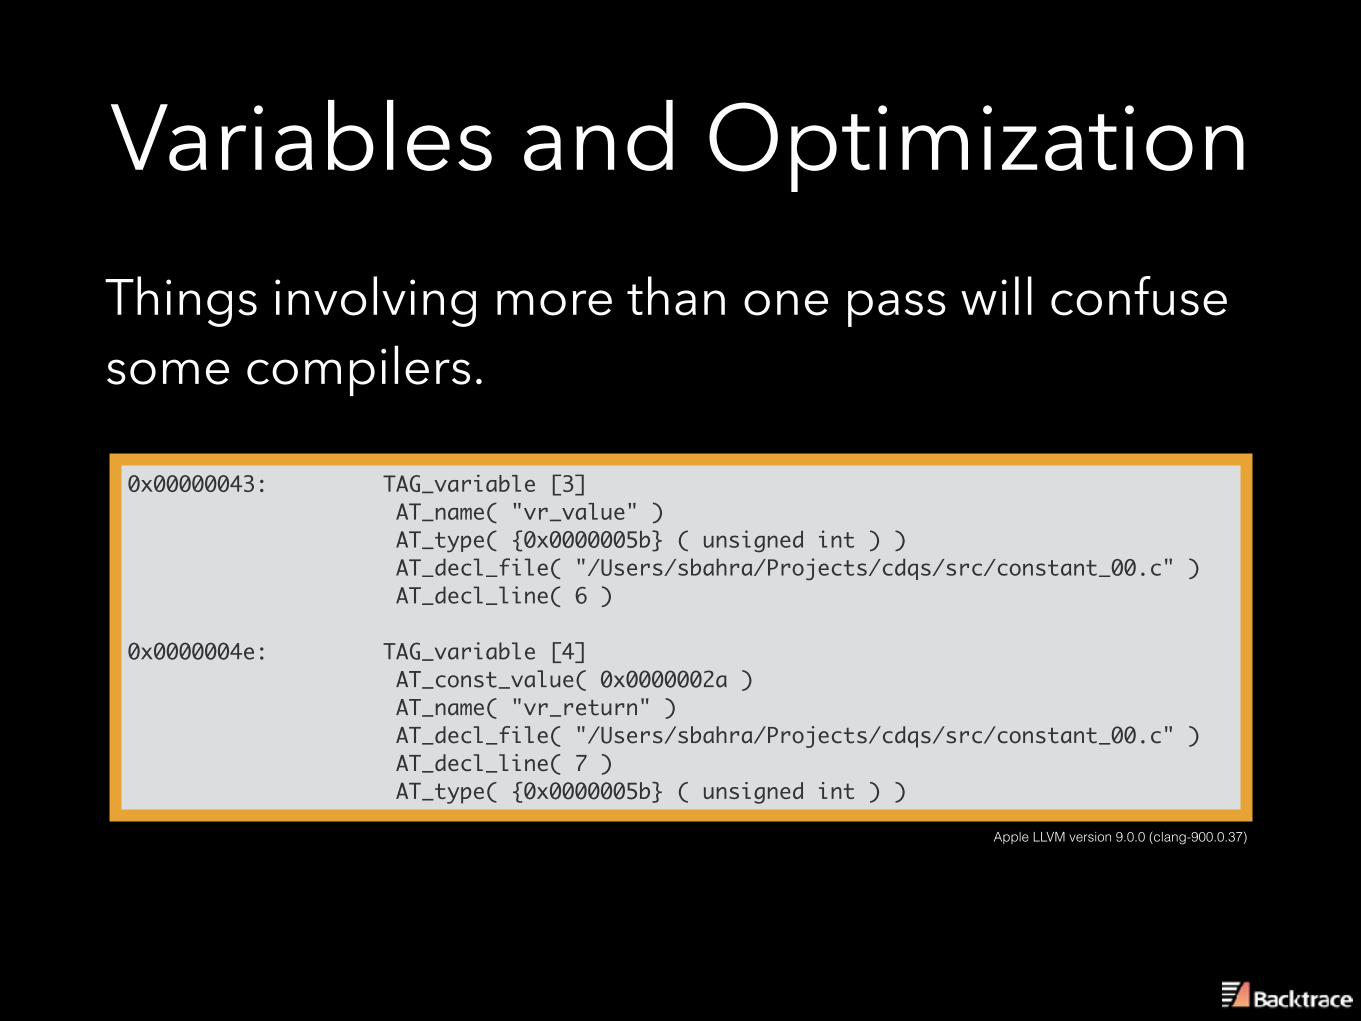
Variables and OptimizationThings involving more than one pass will confuse some compilers.
0x00000043: TAG_variable [3] AT_name( "vr_value" ) AT_type( {0x0000005b} ( unsigned int ) ) AT_decl_file( "/Users/sbahra/Projects/cdqs/src/constant_00.c" ) AT_decl_line( 6 )
0x0000004e: TAG_variable [4] AT_const_value( 0x0000002a ) AT_name( "vr_return" ) AT_decl_file( "/Users/sbahra/Projects/cdqs/src/constant_00.c" ) AT_decl_line( 7 ) AT_type( {0x0000005b} ( unsigned int ) )
Apple LLVM version 9.0.0 (clang-900.0.37)
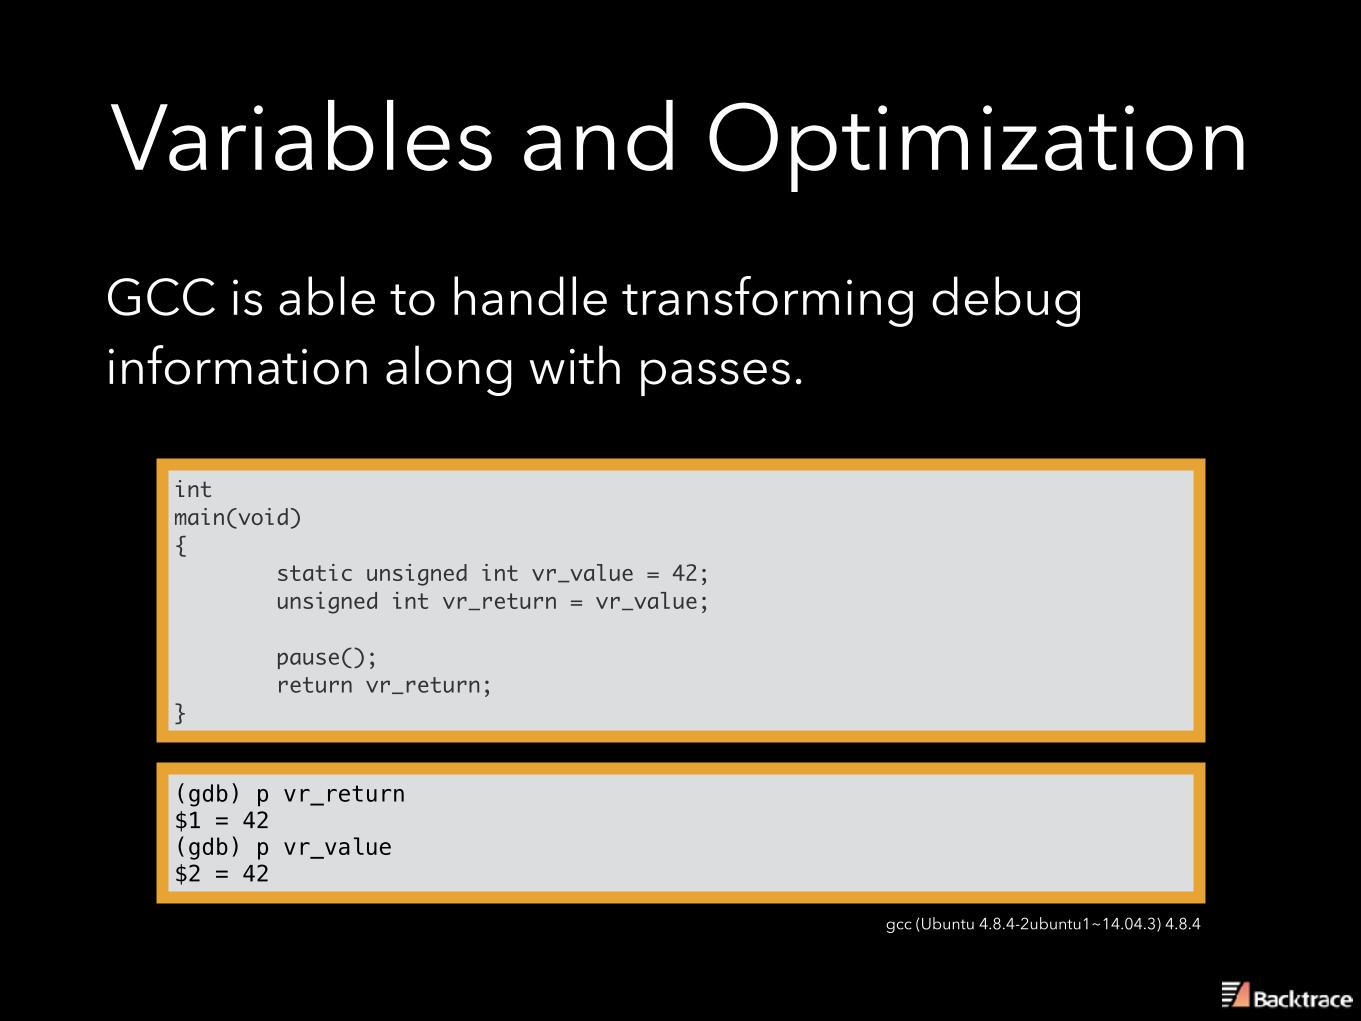
Variables and OptimizationGCC is able to handle transforming debug information along with passes.
intmain(void){ static unsigned int vr_value = 42; unsigned int vr_return = vr_value;
pause(); return vr_return;}
(gdb) p vr_return $1 = 42 (gdb) p vr_value $2 = 42
gcc (Ubuntu 4.8.4-2ubuntu1~14.04.3) 4.8.4
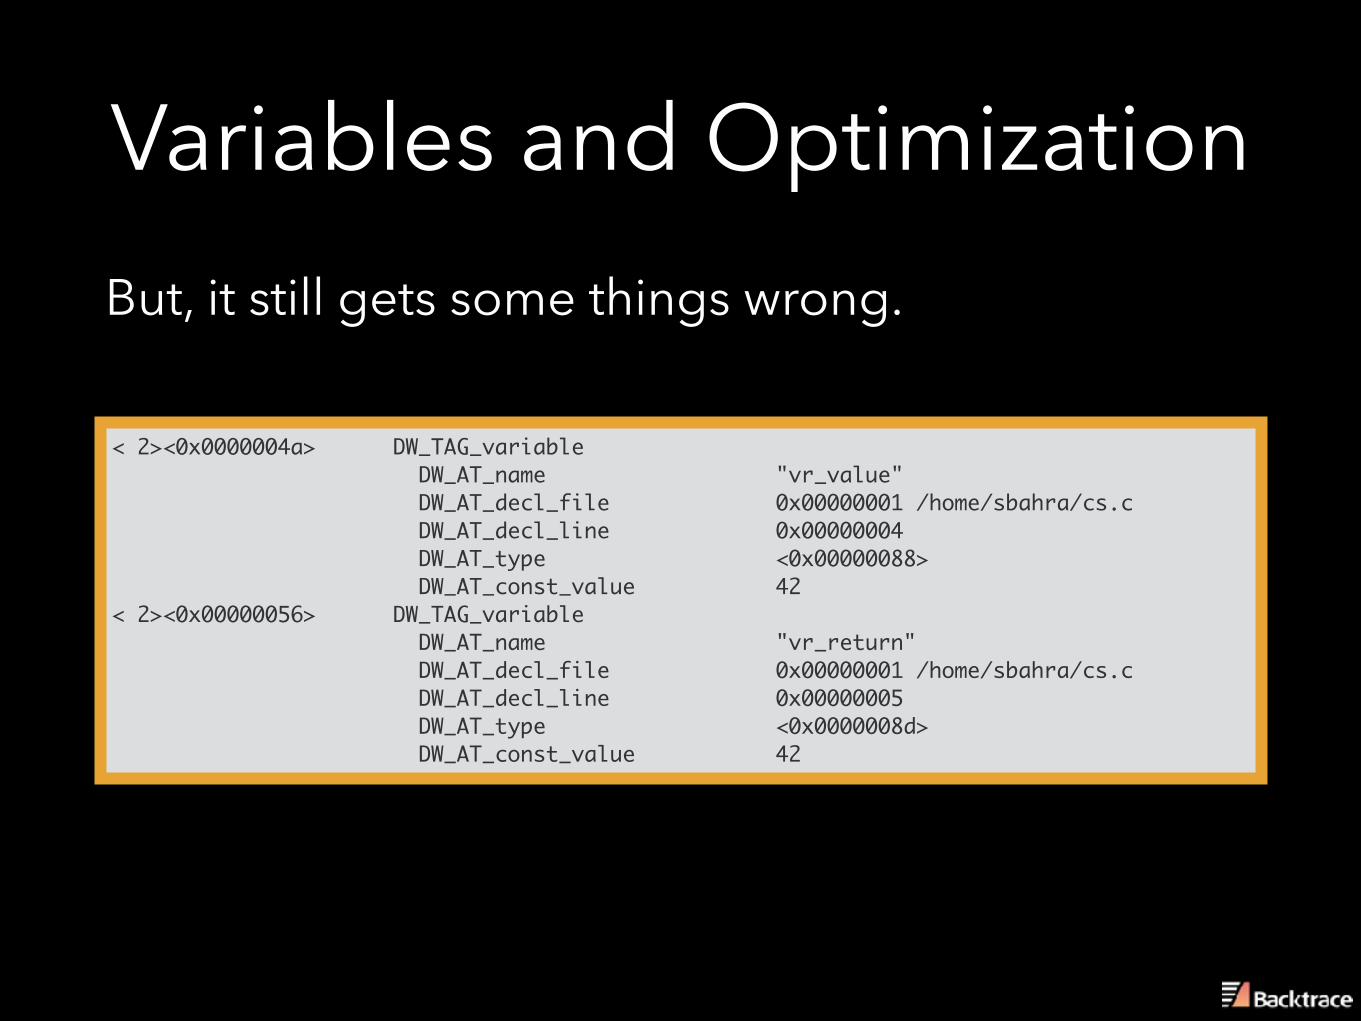
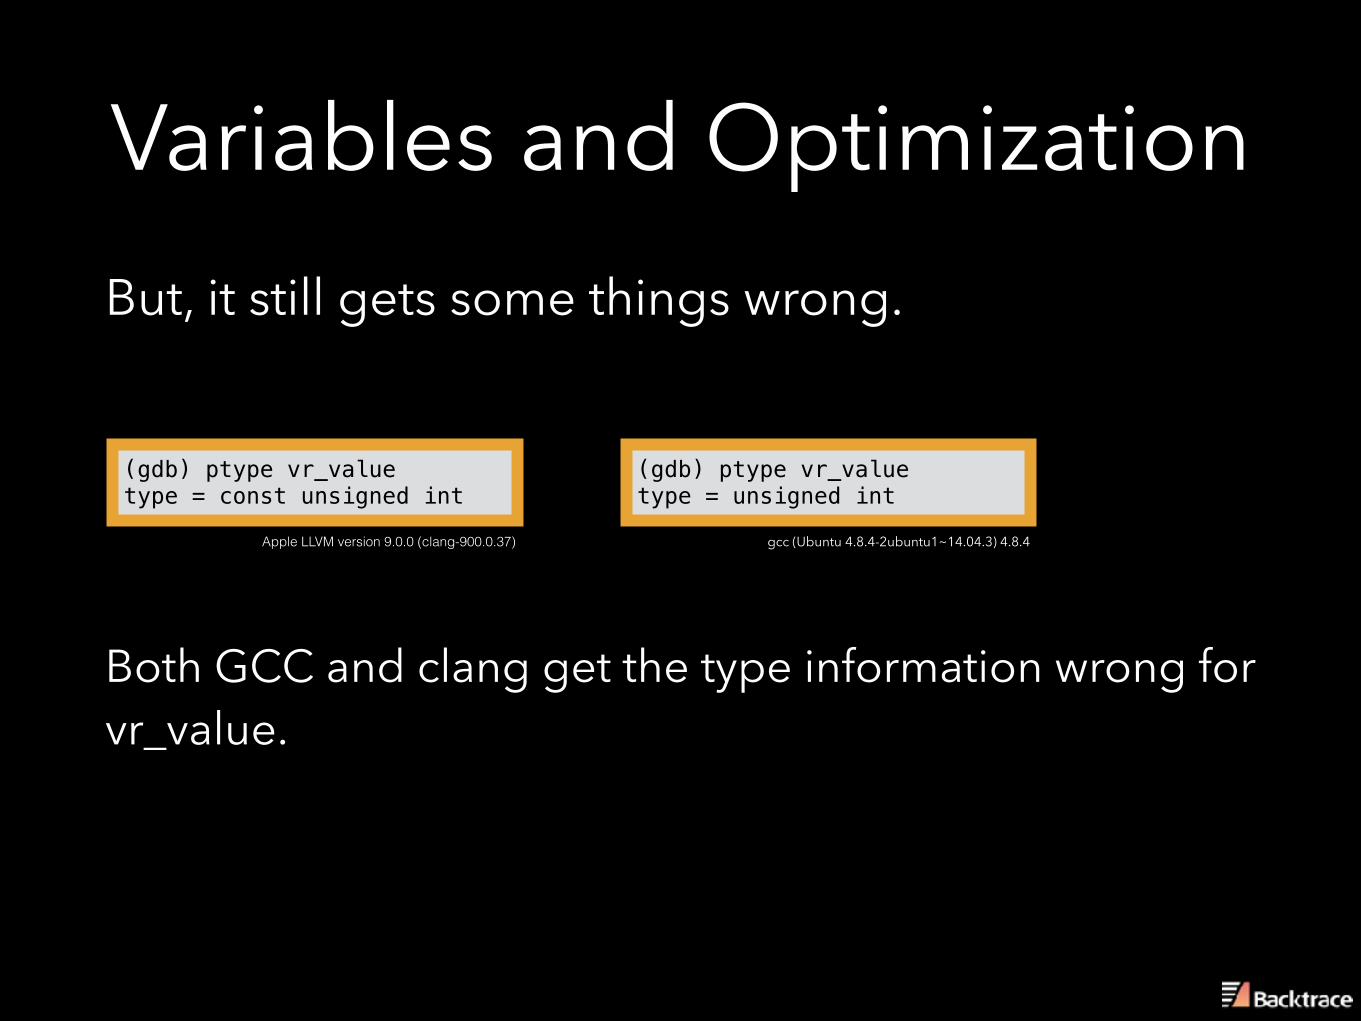
Variables and OptimizationBut, it still gets some things wrong.
< 2><0x0000004a> DW_TAG_variable DW_AT_name "vr_value" DW_AT_decl_file 0x00000001 /home/sbahra/cs.c DW_AT_decl_line 0x00000004 DW_AT_type <0x00000088> DW_AT_const_value 42< 2><0x00000056> DW_TAG_variable DW_AT_name "vr_return" DW_AT_decl_file 0x00000001 /home/sbahra/cs.c DW_AT_decl_line 0x00000005 DW_AT_type <0x0000008d> DW_AT_const_value 42
Variables and OptimizationBut, it still gets some things wrong.
(gdb) ptype vr_valuetype = const unsigned int
Both GCC and clang get the type information wrong for vr_value.
(gdb) ptype vr_valuetype = unsigned int
Apple LLVM version 9.0.0 (clang-900.0.37) gcc (Ubuntu 4.8.4-2ubuntu1~14.04.3) 4.8.4
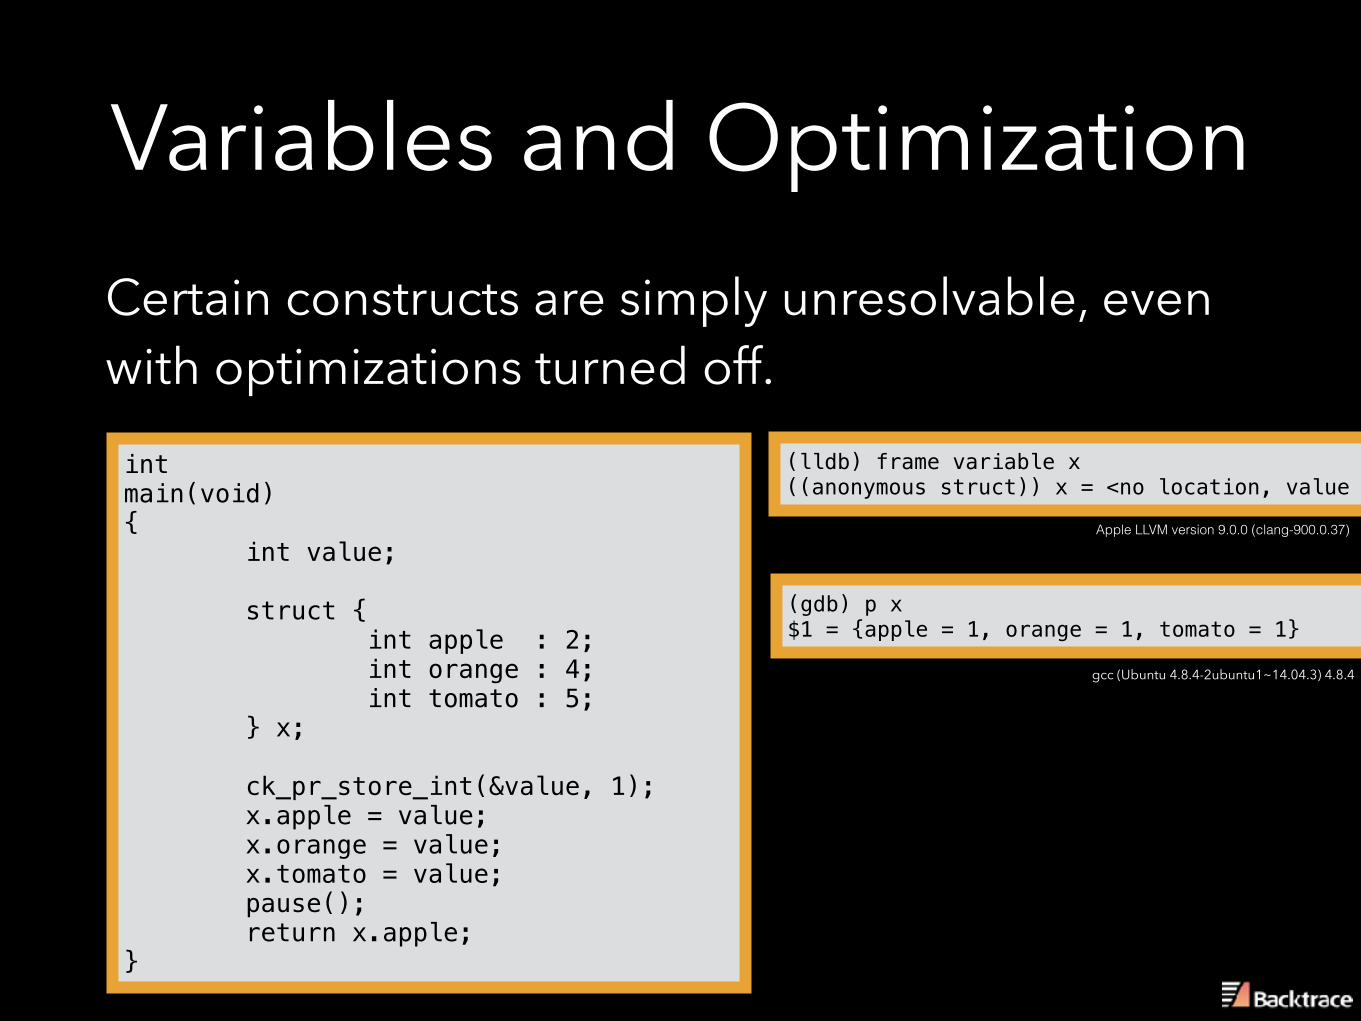
Variables and OptimizationCertain constructs are simply unresolvable, even with optimizations turned off.int main(void) { int value;
struct { int apple : 2; int orange : 4; int tomato : 5; } x;
ck_pr_store_int(&value, 1); x.apple = value; x.orange = value; x.tomato = value; pause(); return x.apple; }
(lldb) frame variable x ((anonymous struct)) x = <no location, value may have been optimized out>
Apple LLVM version 9.0.0 (clang-900.0.37)
(gdb) p x $1 = {apple = 1, orange = 1, tomato = 1}
gcc (Ubuntu 4.8.4-2ubuntu1~14.04.3) 4.8.4
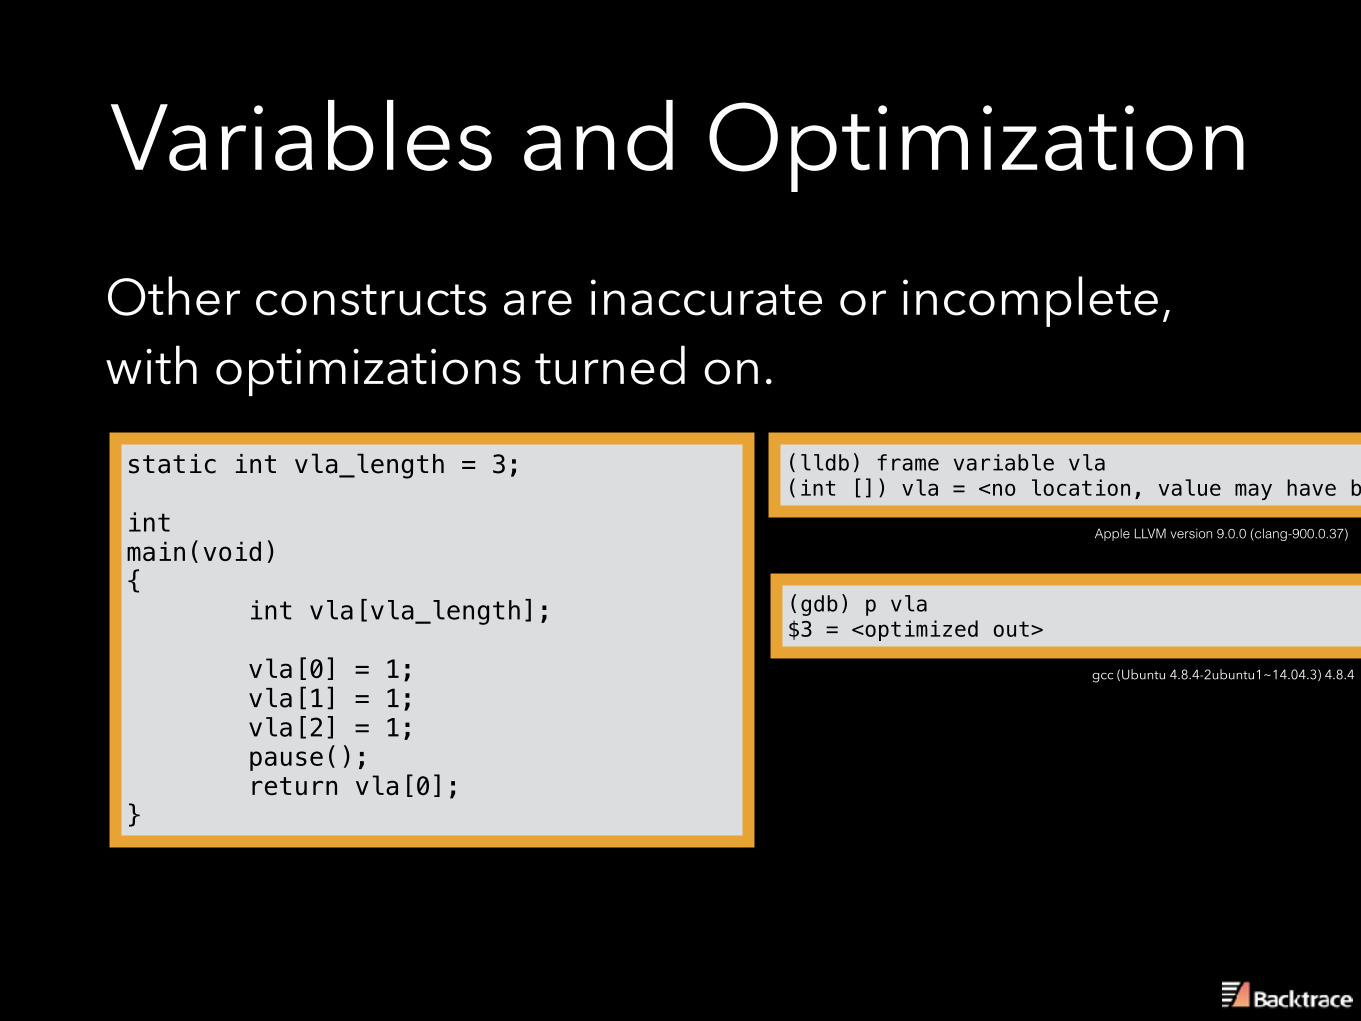
Variables and OptimizationOther constructs are inaccurate or incomplete, with optimizations turned on.static int vla_length = 3;
int main(void) { int vla[vla_length];
vla[0] = 1; vla[1] = 1; vla[2] = 1; pause(); return vla[0]; }
(lldb) frame variable vla (int []) vla = <no location, value may have been optimized out>
Apple LLVM version 9.0.0 (clang-900.0.37)
(gdb) p vla $3 = <optimized out>
gcc (Ubuntu 4.8.4-2ubuntu1~14.04.3) 4.8.4
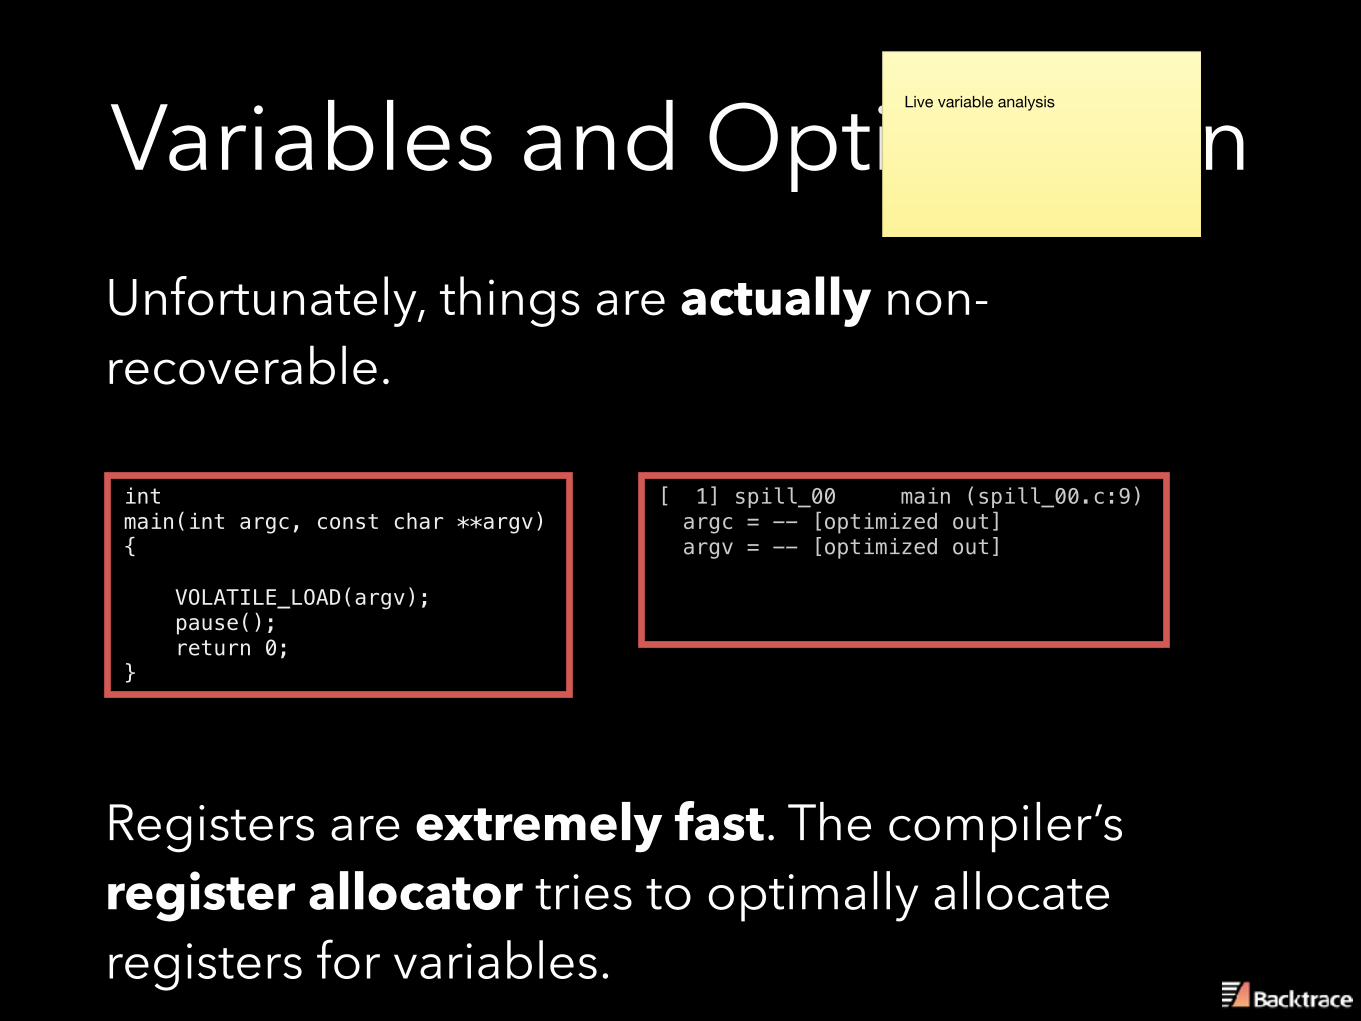
Variables and OptimizationUnfortunately, things are actually non-recoverable.
Registers are extremely fast. The compiler’s register allocator tries to optimally allocate registers for variables.
int main(int argc, const char **argv) { VOLATILE_LOAD(argv); pause(); return 0; }
[ 1] spill_00 main (spill_00.c:9) argc = -- [optimized out] argv = -- [optimized out]
Live variable analysis
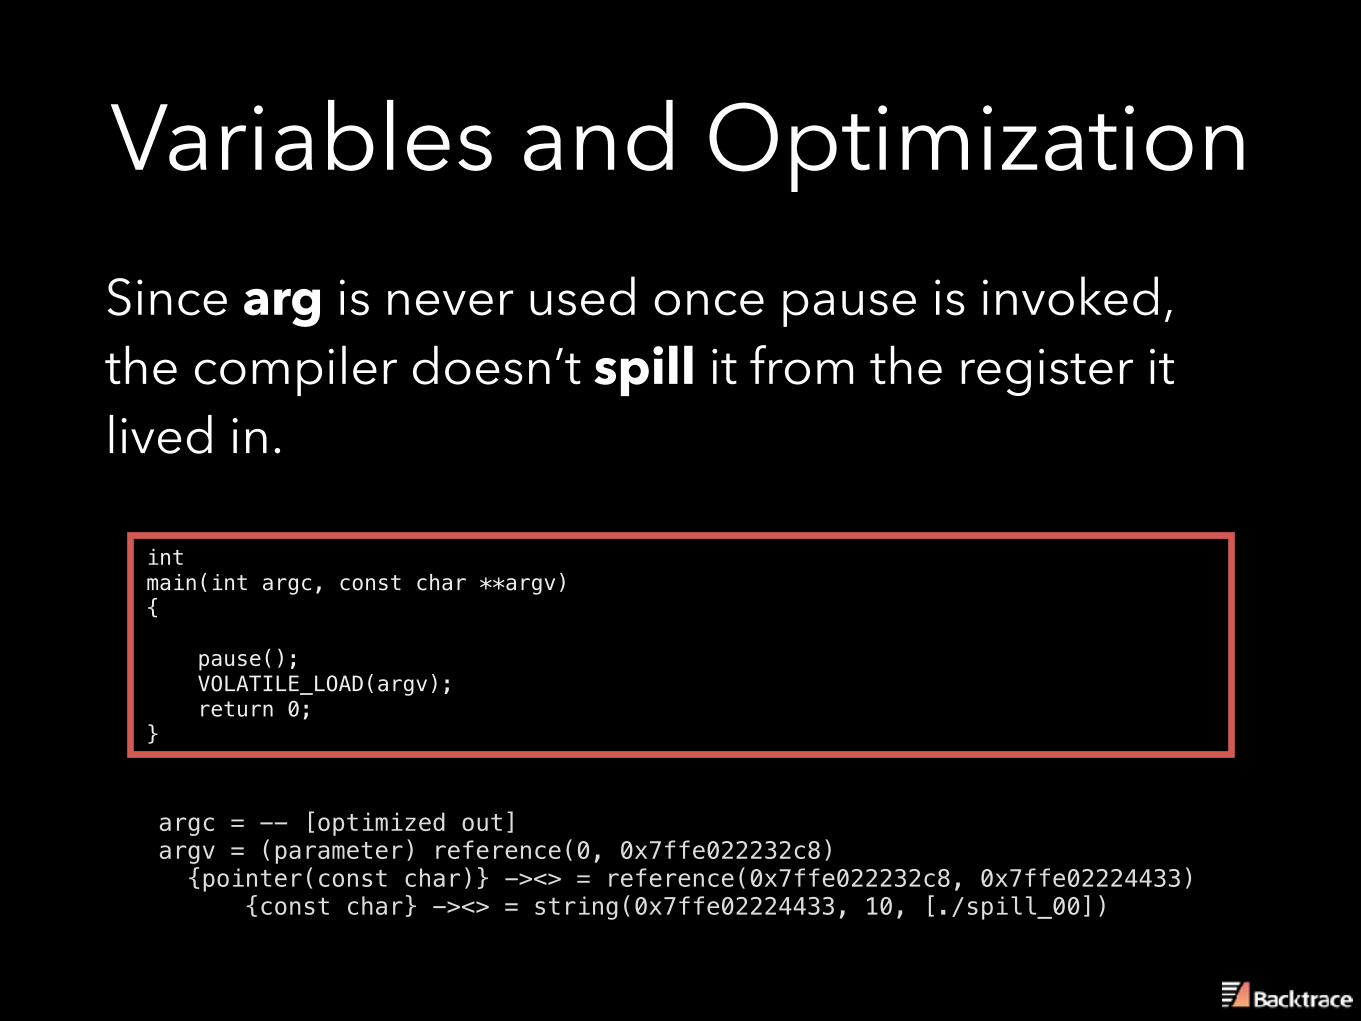
Variables and OptimizationSince arg is never used once pause is invoked, the compiler doesn’t spill it from the register it lived in.
argc = -- [optimized out] argv = (parameter) reference(0, 0x7ffe022232c8) {pointer(const char)} -><> = reference(0x7ffe022232c8, 0x7ffe02224433) {const char} -><> = string(0x7ffe02224433, 10, [./spill_00])
int main(int argc, const char **argv) { pause(); VOLATILE_LOAD(argv); return 0; }
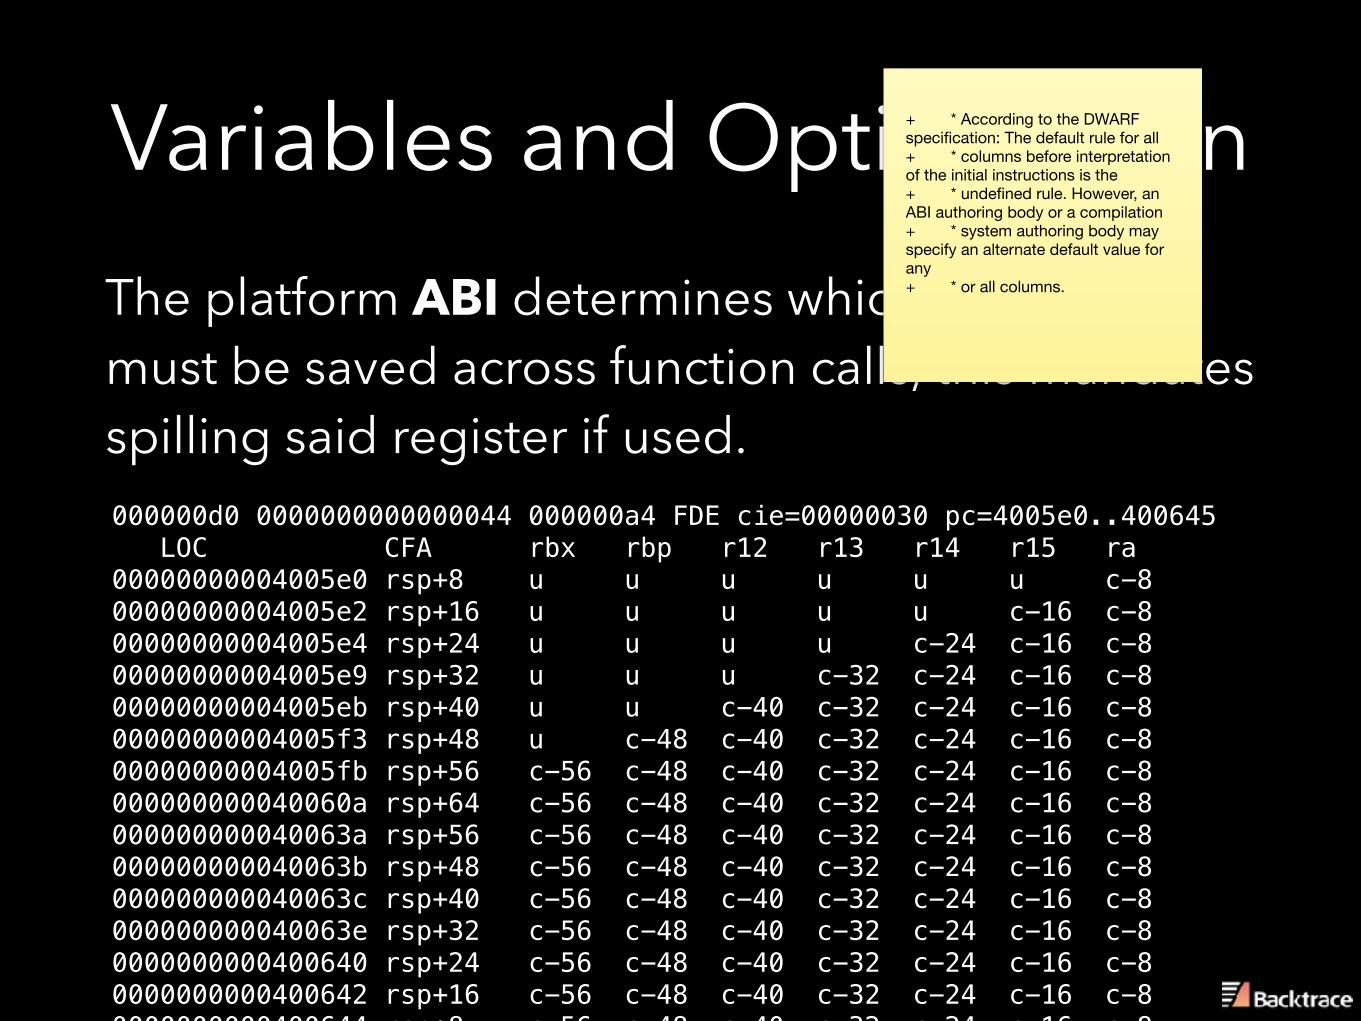
Variables and OptimizationThe platform ABI determines which registers must be saved across function calls, this mandates spilling said register if used.000000d0 0000000000000044 000000a4 FDE cie=00000030 pc=4005e0..400645 LOC CFA rbx rbp r12 r13 r14 r15 ra 00000000004005e0 rsp+8 u u u u u u c-8 00000000004005e2 rsp+16 u u u u u c-16 c-8 00000000004005e4 rsp+24 u u u u c-24 c-16 c-8 00000000004005e9 rsp+32 u u u c-32 c-24 c-16 c-8 00000000004005eb rsp+40 u u c-40 c-32 c-24 c-16 c-8 00000000004005f3 rsp+48 u c-48 c-40 c-32 c-24 c-16 c-8 00000000004005fb rsp+56 c-56 c-48 c-40 c-32 c-24 c-16 c-8 000000000040060a rsp+64 c-56 c-48 c-40 c-32 c-24 c-16 c-8 000000000040063a rsp+56 c-56 c-48 c-40 c-32 c-24 c-16 c-8 000000000040063b rsp+48 c-56 c-48 c-40 c-32 c-24 c-16 c-8 000000000040063c rsp+40 c-56 c-48 c-40 c-32 c-24 c-16 c-8 000000000040063e rsp+32 c-56 c-48 c-40 c-32 c-24 c-16 c-8 0000000000400640 rsp+24 c-56 c-48 c-40 c-32 c-24 c-16 c-8 0000000000400642 rsp+16 c-56 c-48 c-40 c-32 c-24 c-16 c-8 0000000000400644 rsp+8 c-56 c-48 c-40 c-32 c-24 c-16 c-8
+ * According to the DWARF specification: The default rule for all+ * columns before interpretation of the initial instructions is the+ * undefined rule. However, an ABI authoring body or a compilation+ * system authoring body may specify an alternate default value for any+ * or all columns.

Variables and OptimizationDifferent compilers and debuggers have different semantics for register value propagation in unwinding state machine.
(lldb) frame select 1 frame #1: 0x00007fffc5f5eb72 libsystem_c.dylib`nanosleep + 199 libsystem_c.dylib`nanosleep: 0x7fffc5f5eb72 <+199>: testl %eax, %eax 0x7fffc5f5eb74 <+201>: jns 0x7fffc5f5eb3d ; <+146> 0x7fffc5f5eb76 <+203>: callq 0x7fffc5f644e4 ; symbol stub for: __error 0x7fffc5f5eb7b <+208>: cmpl $0x3c, (%rax) (lldb) register read General Purpose Registers: rbx = 0x0000000000000000 rbp = 0x00007fff5fbff690 rsp = 0x00007fff5fbff660 r12 = 0x0000000000000000 r13 = 0x00007fffceda1a20 __stderrp r14 = 0x00007fff5fbff6a8 r15 = 0x00007fff5fbff6b8 rip = 0x00007fffc5f5eb72 libsystem_c.dylib`nanosleep + 199 13 registers were unavailable.
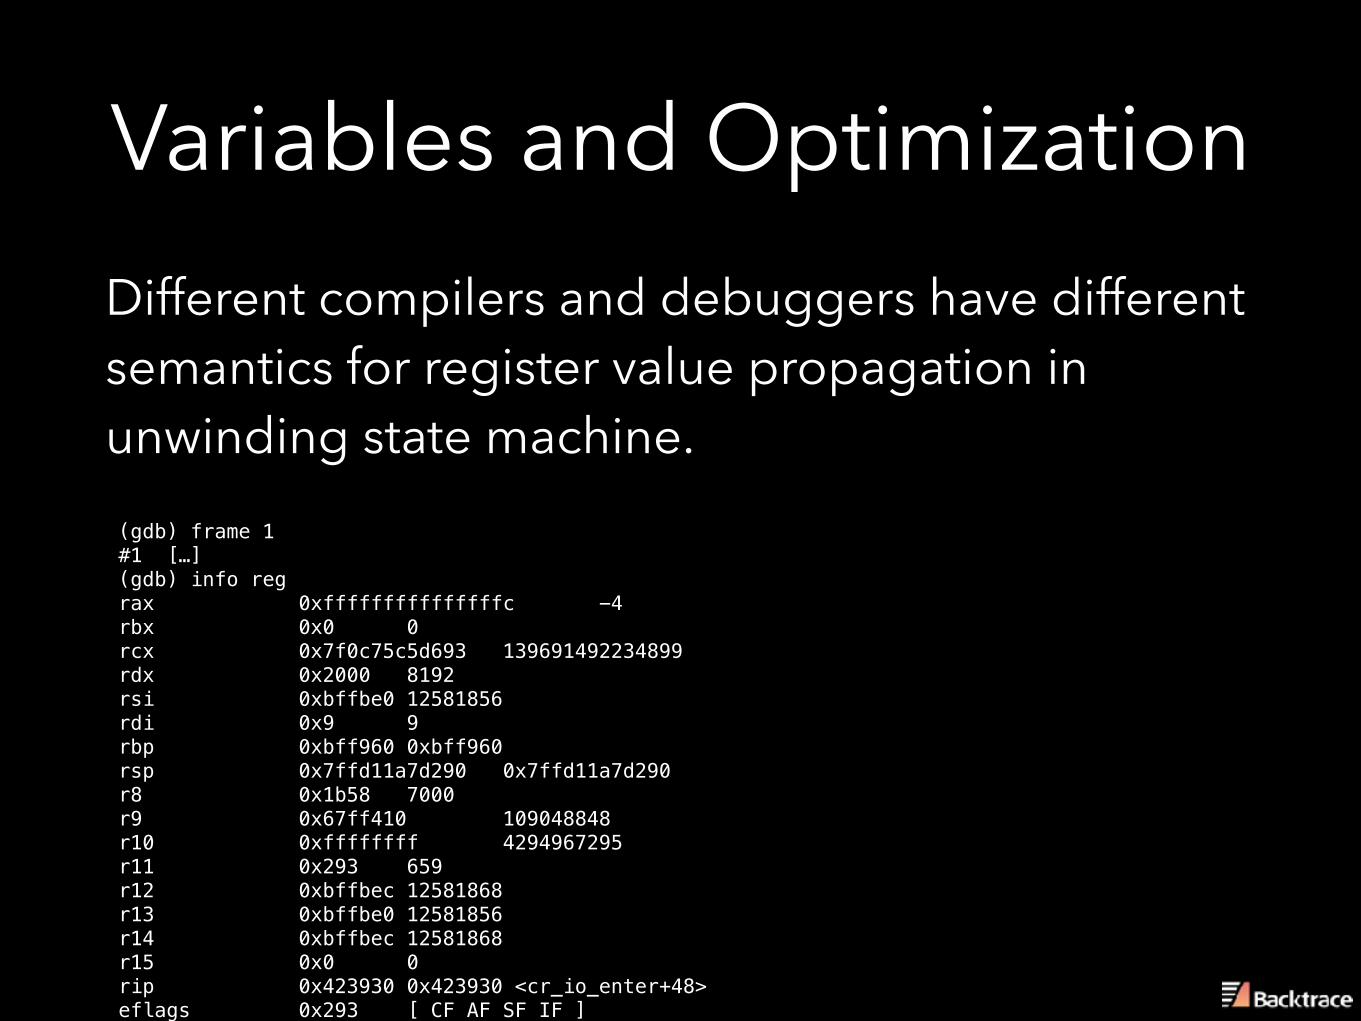
Variables and OptimizationDifferent compilers and debuggers have different semantics for register value propagation in unwinding state machine.(gdb) frame 1 #1 […] (gdb) info reg rax 0xfffffffffffffffc -4 rbx 0x0 0 rcx 0x7f0c75c5d693 139691492234899 rdx 0x2000 8192 rsi 0xbffbe0 12581856 rdi 0x9 9 rbp 0xbff960 0xbff960 rsp 0x7ffd11a7d290 0x7ffd11a7d290 r8 0x1b58 7000 r9 0x67ff410 109048848 r10 0xffffffff 4294967295 r11 0x293 659 r12 0xbffbec 12581868 r13 0xbffbe0 12581856 r14 0xbffbec 12581868 r15 0x0 0 rip 0x423930 0x423930 <cr_io_enter+48> eflags 0x293 [ CF AF SF IF ] cs 0x33 51
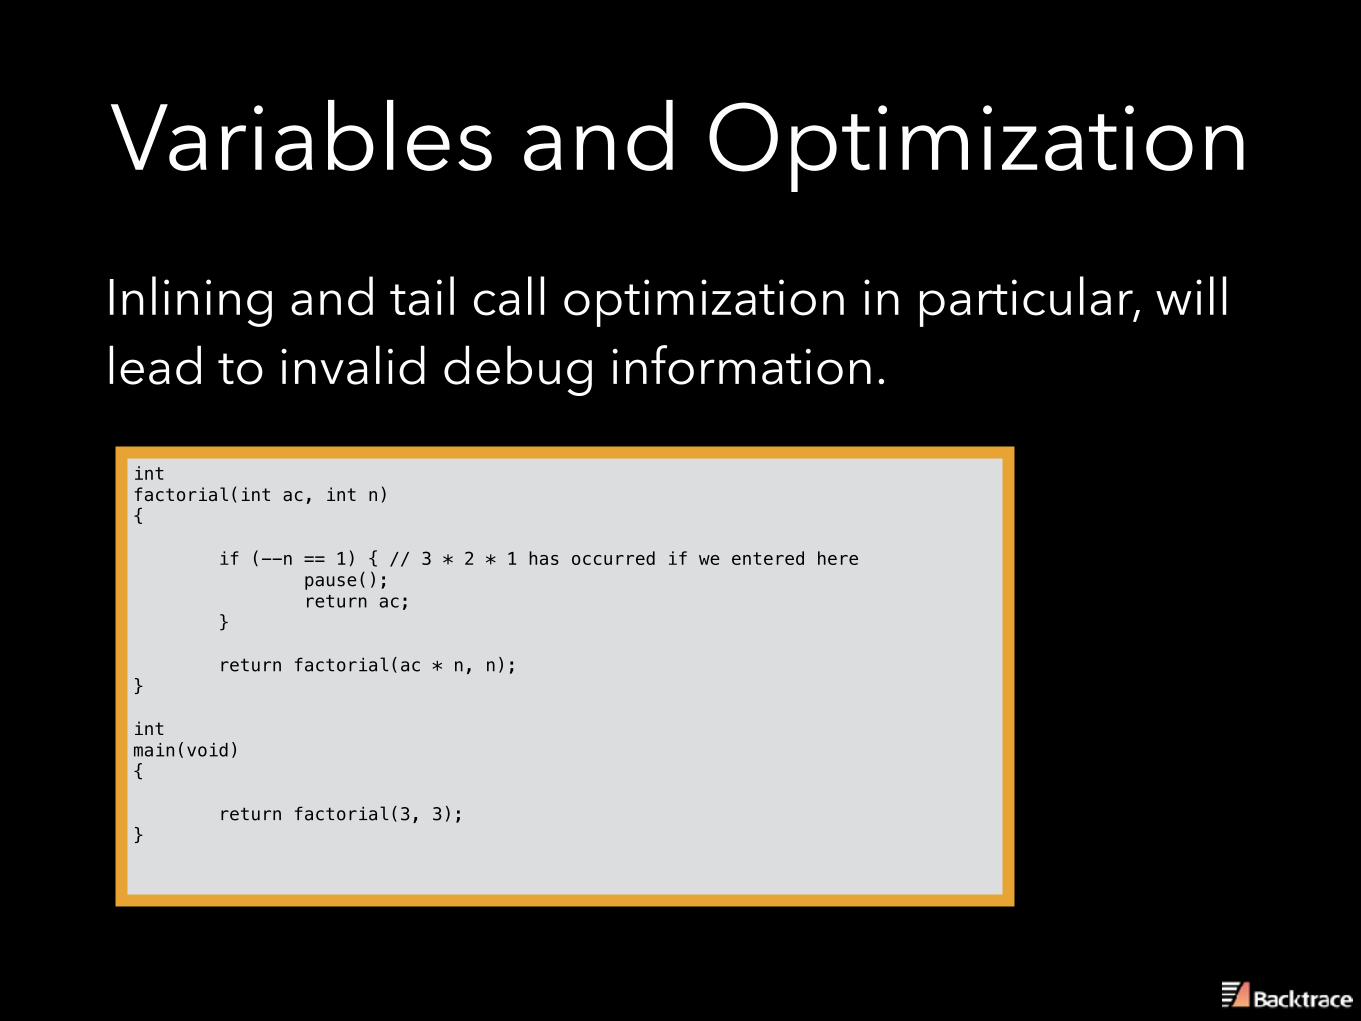
Variables and OptimizationInlining and tail call optimization in particular, will lead to invalid debug information.
int factorial(int ac, int n) { if (--n == 1) { // 3 * 2 * 1 has occurred if we entered here pause(); return ac; } return factorial(ac * n, n); } int main(void) { return factorial(3, 3); }
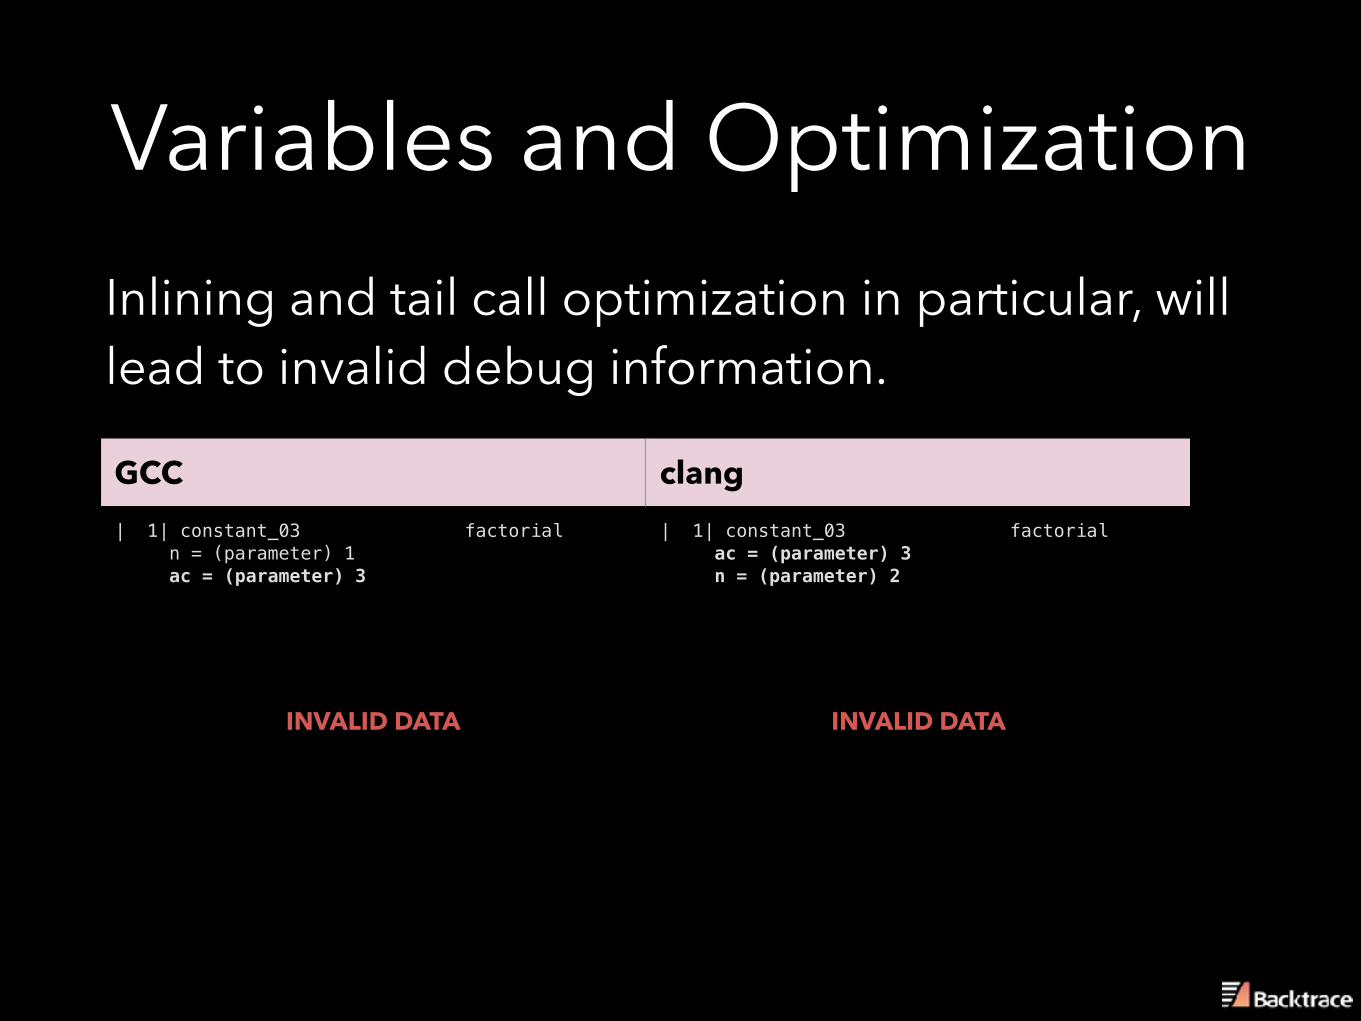
Variables and OptimizationInlining and tail call optimization in particular, will lead to invalid debug information.
GCC clang| 1| constant_03 factorial n = (parameter) 1 ac = (parameter) 3
| 1| constant_03 factorial ac = (parameter) 3 n = (parameter) 2
INVALID DATA INVALID DATA
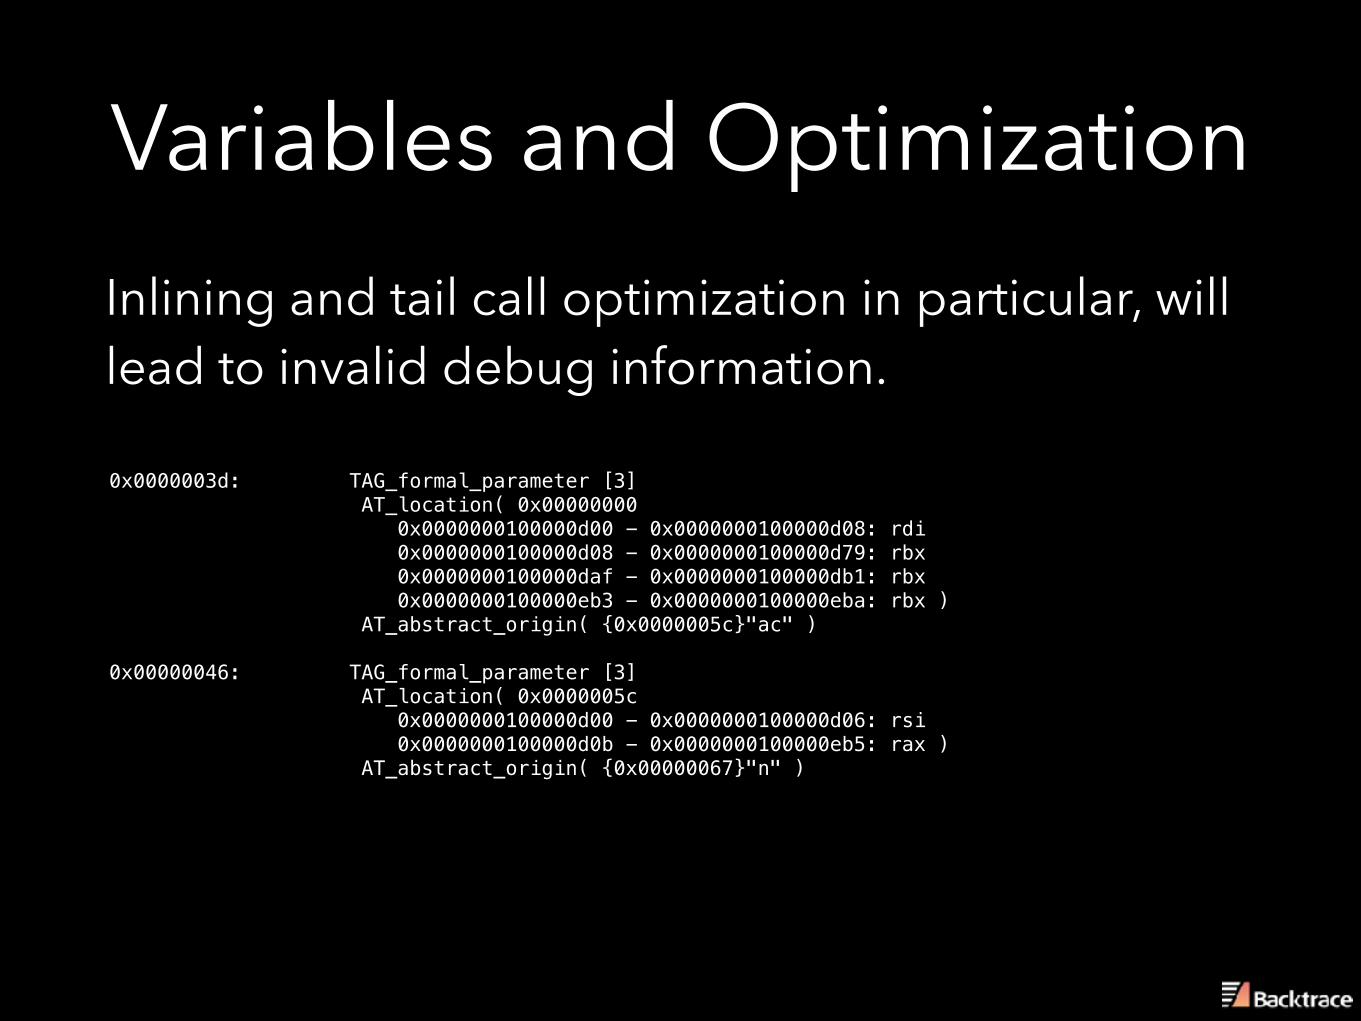
Variables and OptimizationInlining and tail call optimization in particular, will lead to invalid debug information.
0x0000003d: TAG_formal_parameter [3] AT_location( 0x00000000 0x0000000100000d00 - 0x0000000100000d08: rdi 0x0000000100000d08 - 0x0000000100000d79: rbx 0x0000000100000daf - 0x0000000100000db1: rbx 0x0000000100000eb3 - 0x0000000100000eba: rbx ) AT_abstract_origin( {0x0000005c}"ac" )
0x00000046: TAG_formal_parameter [3] AT_location( 0x0000005c 0x0000000100000d00 - 0x0000000100000d06: rsi 0x0000000100000d0b - 0x0000000100000eb5: rax ) AT_abstract_origin( {0x00000067}"n" )

Call stack and OptimizationsFrames might disappear in the presence of tail call optimization.
Thread 8163 [ 0] libc-2.21.so pause [ 1] chain three [ 2] chain two [ 3] chain one [ 4] chain main
Thread 8224 [ 0] libc-2.21.so pause [ 1] chain three [ 2] chain main
Tail calls are disambiguated by call sites and some times a debugger will only be able to extract the inner-most tail call in a chain.
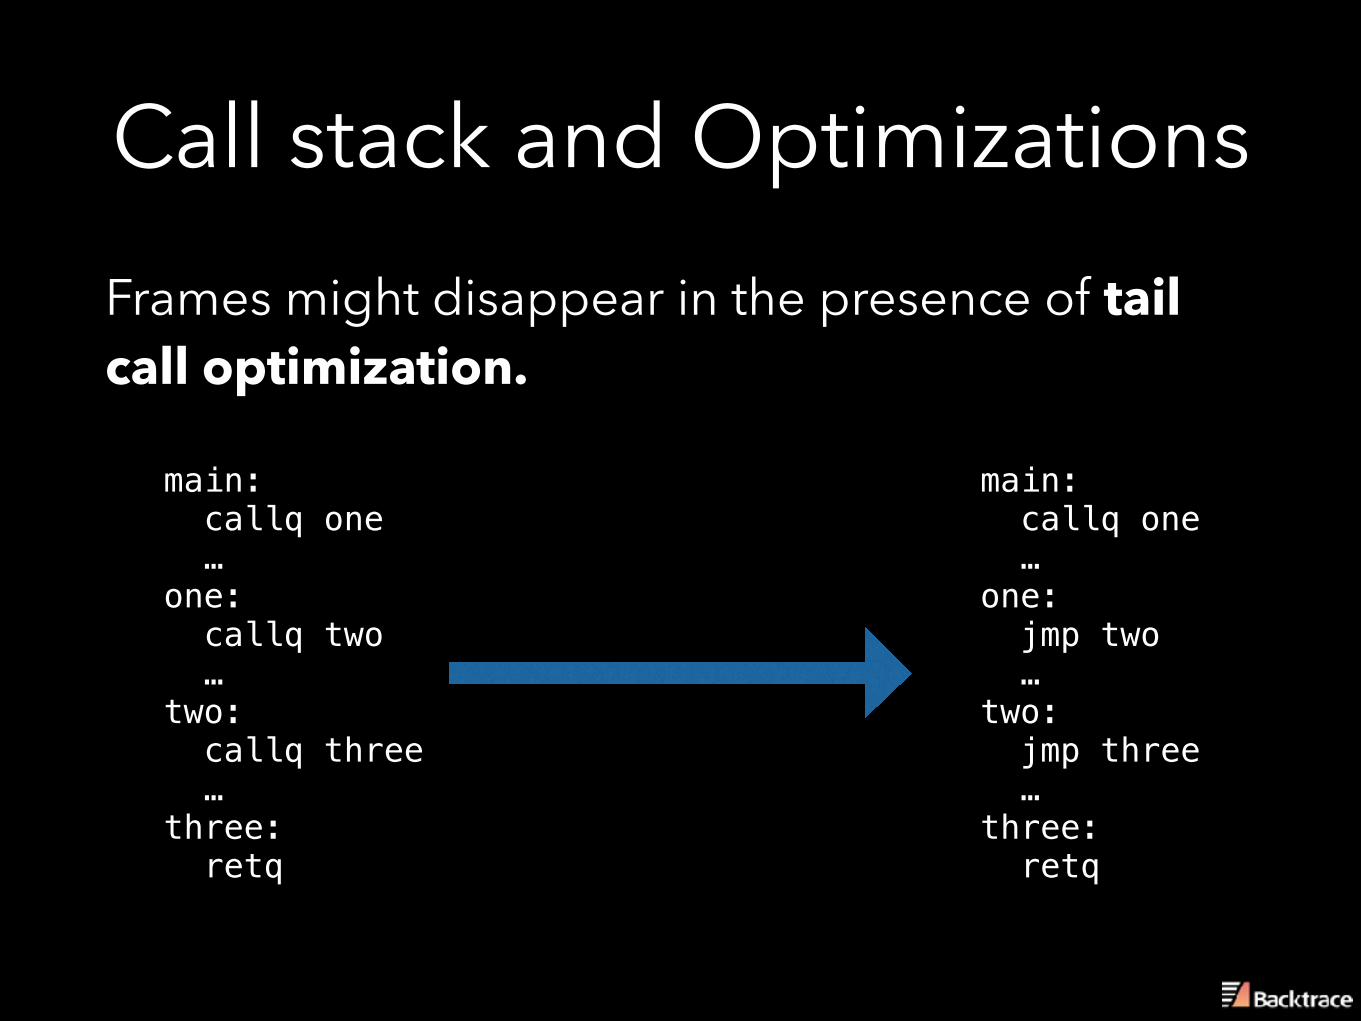
Call stack and OptimizationsFrames might disappear in the presence of tail call optimization.
main: callq one … one: callq two … two: callq three … three: retq
main: callq one … one: jmp two … two: jmp three … three: retq
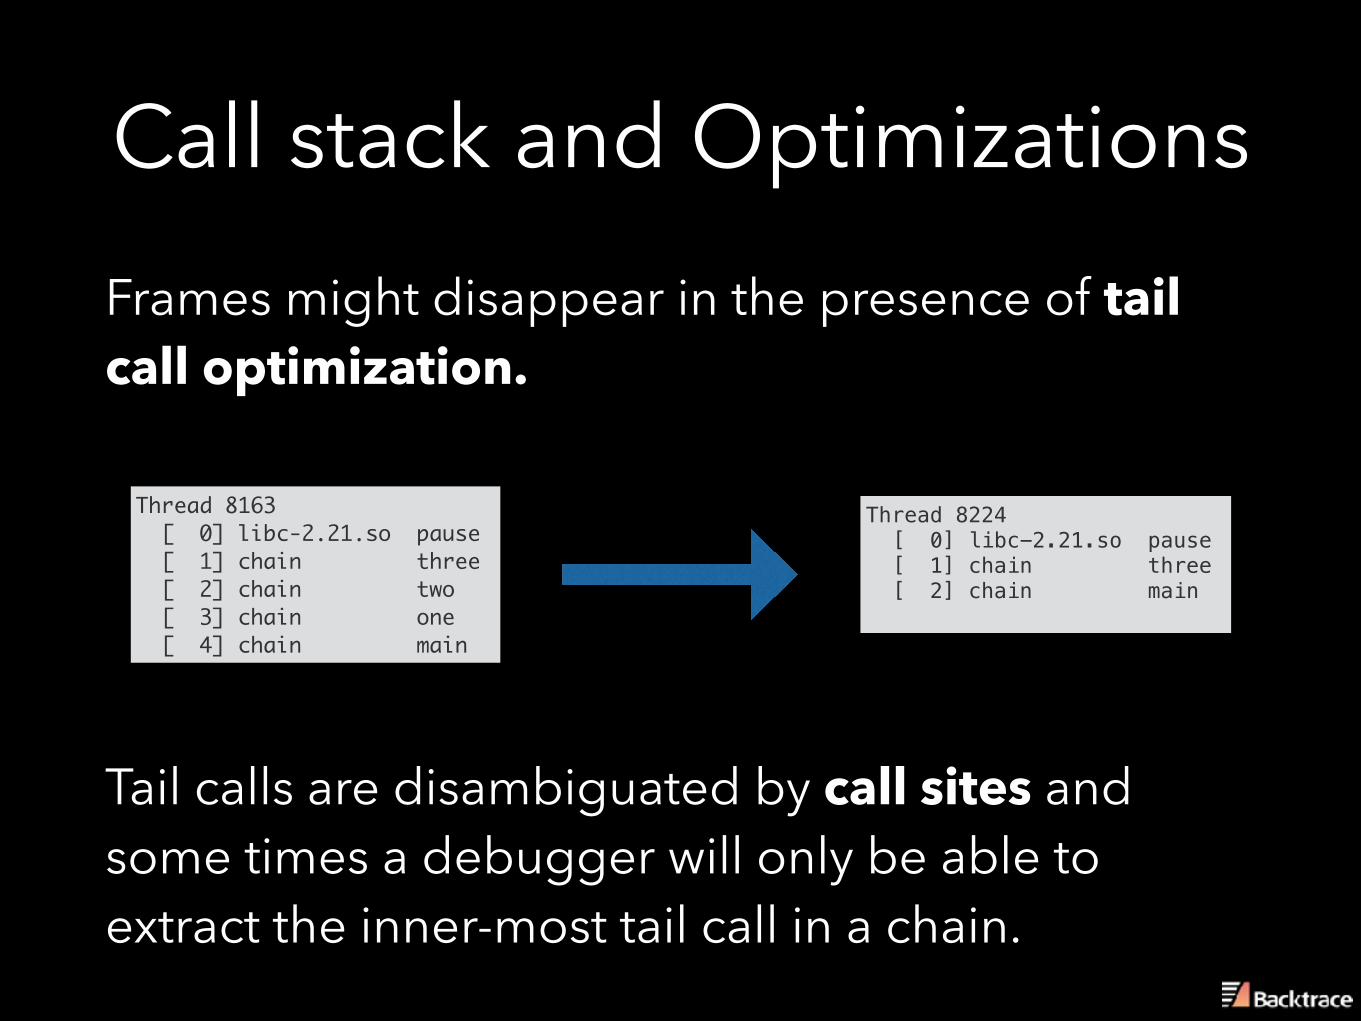
Call stack and OptimizationsFrames might disappear in the presence of tail call optimization.
Thread 8163 [ 0] libc-2.21.so pause [ 1] chain three [ 2] chain two [ 3] chain one [ 4] chain main
Thread 8224 [ 0] libc-2.21.so pause [ 1] chain three [ 2] chain main
Tail calls are disambiguated by call sites and some times a debugger will only be able to extract the inner-most tail call in a chain.
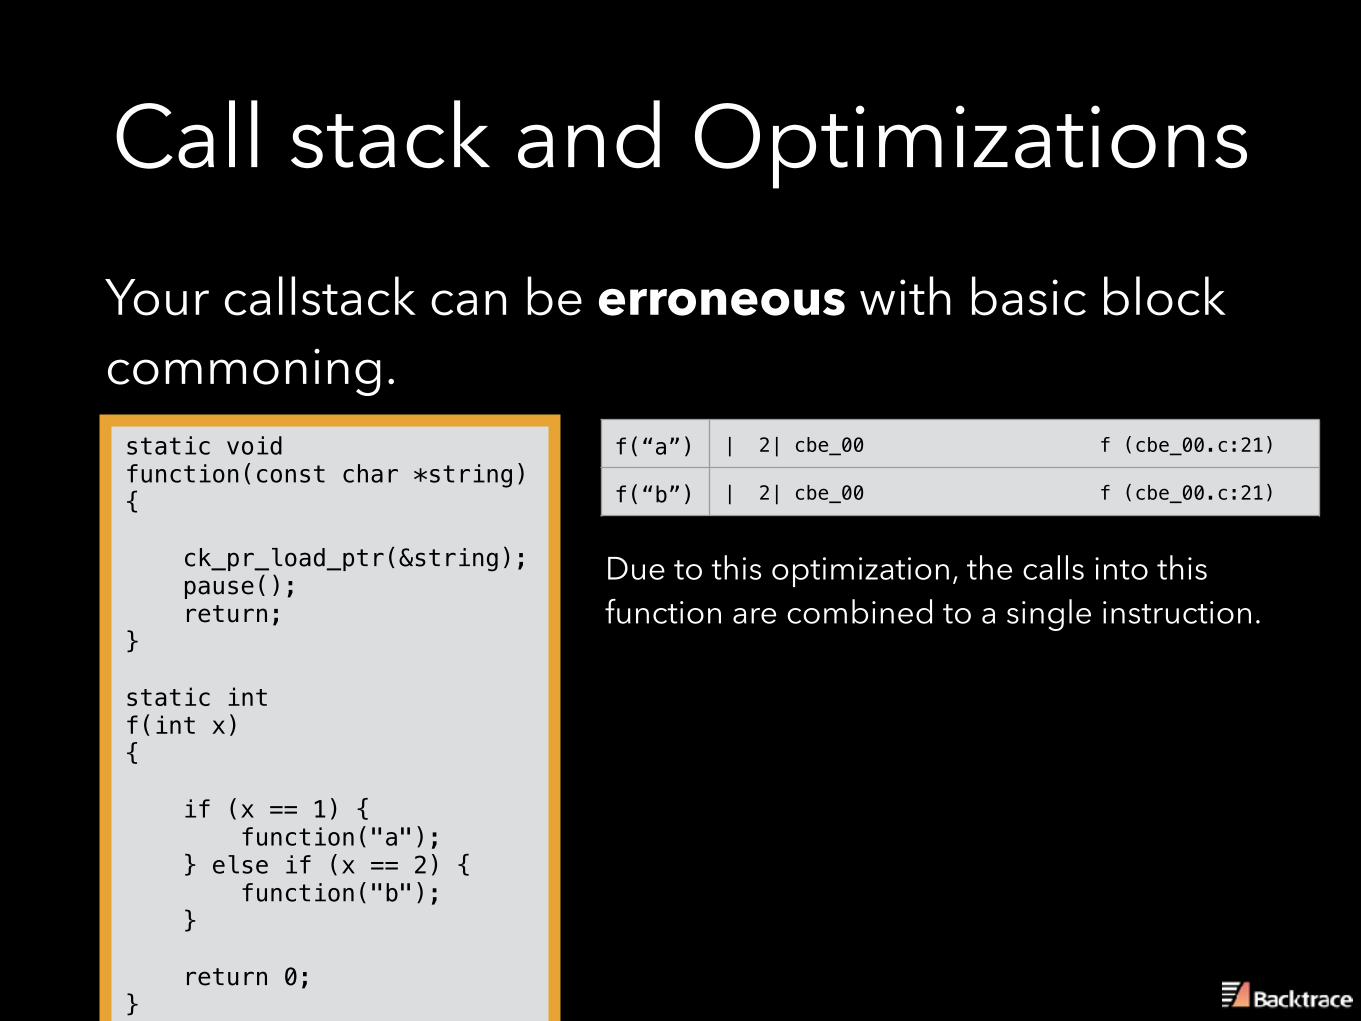
Call stack and OptimizationsYour callstack can be erroneous with basic block commoning.static void function(const char *string) { ck_pr_load_ptr(&string); pause(); return; } static int f(int x) { if (x == 1) { function("a"); } else if (x == 2) { function("b"); } return 0; }
f(“a”) | 2| cbe_00 f (cbe_00.c:21)
f(“b”) | 2| cbe_00 f (cbe_00.c:21)
Due to this optimization, the calls into this function are combined to a single instruction.
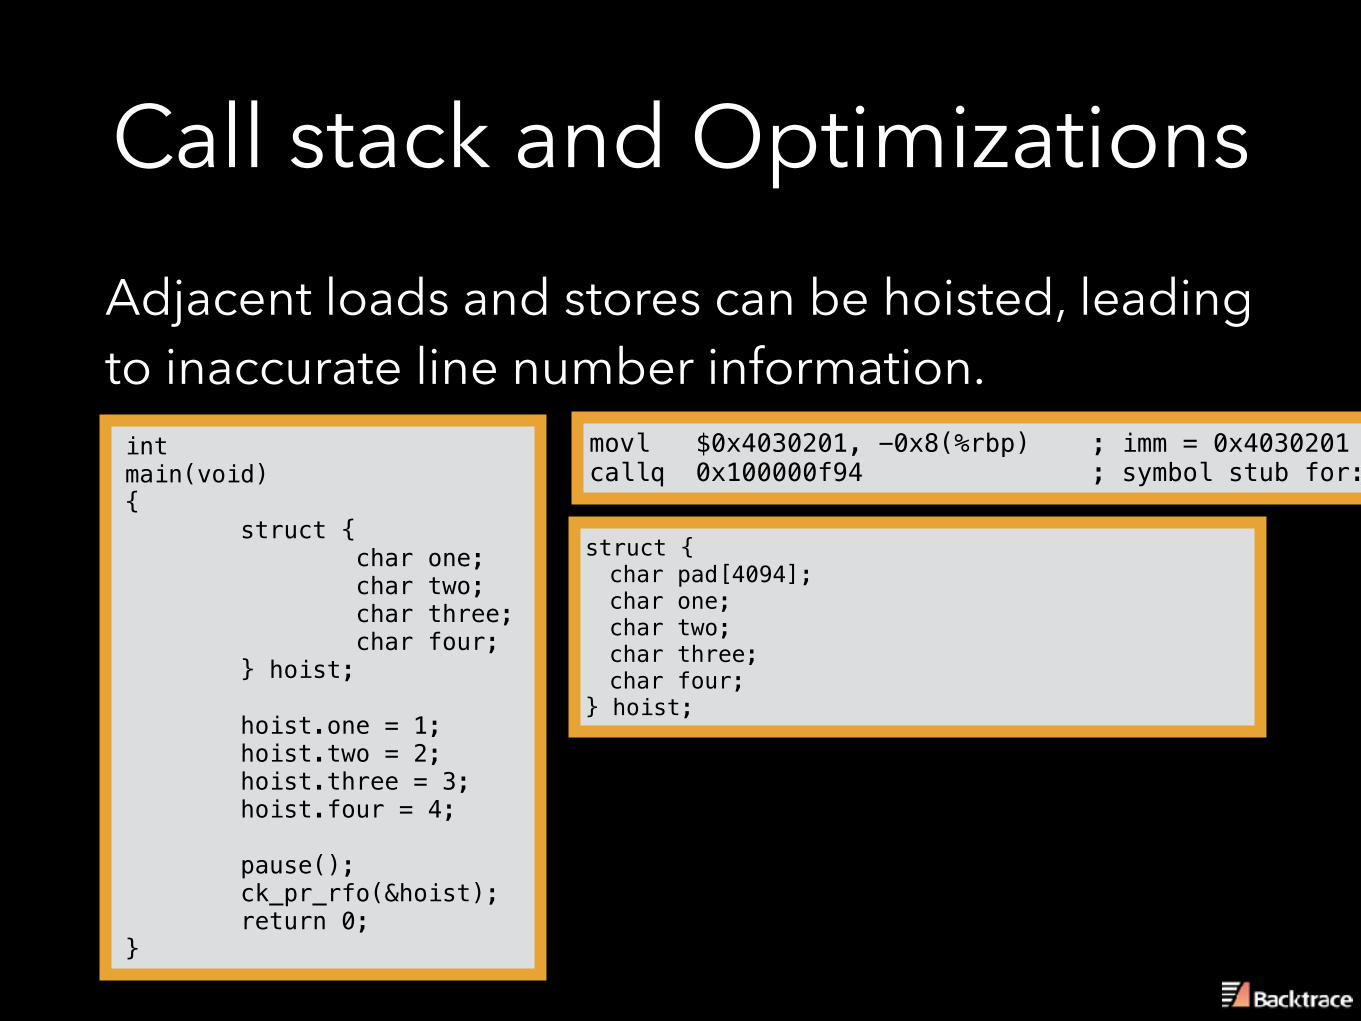
Call stack and OptimizationsAdjacent loads and stores can be hoisted, leading to inaccurate line number information.int main(void) { struct { char one; char two; char three; char four; } hoist;
hoist.one = 1; hoist.two = 2; hoist.three = 3; hoist.four = 4;
pause(); ck_pr_rfo(&hoist); return 0; }
movl $0x4030201, -0x8(%rbp) ; imm = 0x4030201 callq 0x100000f94 ; symbol stub for: pause
struct { char pad[4094]; char one; char two; char three; char four;
} hoist;
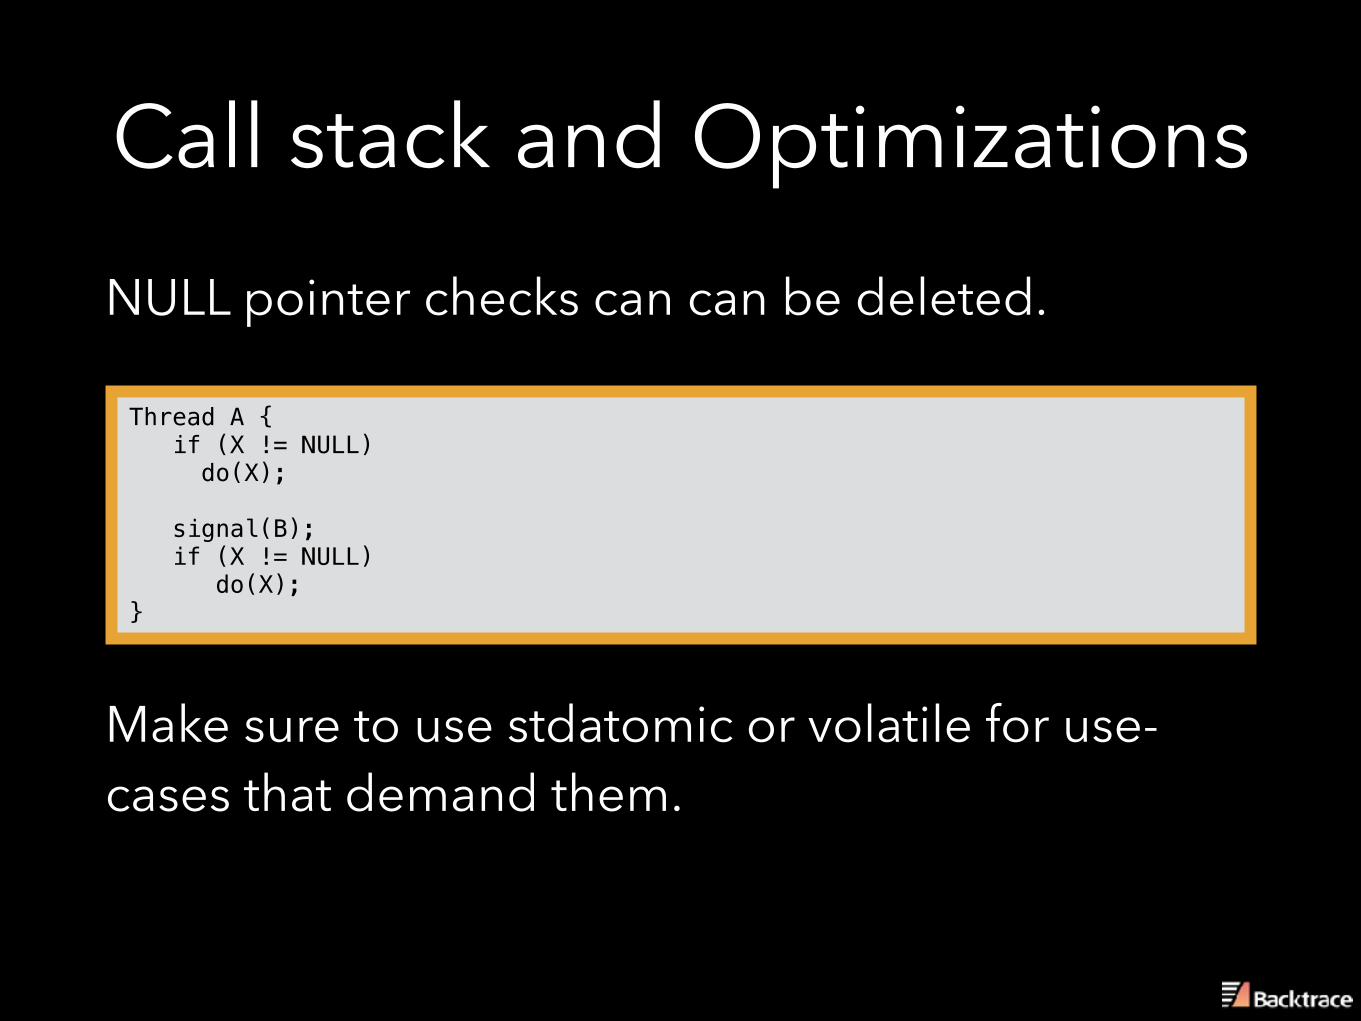
Call stack and OptimizationsNULL pointer checks can can be deleted.
Thread A { if (X != NULL) do(X);
signal(B); if (X != NULL) do(X); }
Make sure to use stdatomic or volatile for use-cases that demand them.
Next Time…
How do we measure debuggability?How do we defeat the optimizer?How do we marry DWARF with tracing?…or horror stories so you can avoid creating your own.
@0xF390http://backtrace.io/blog
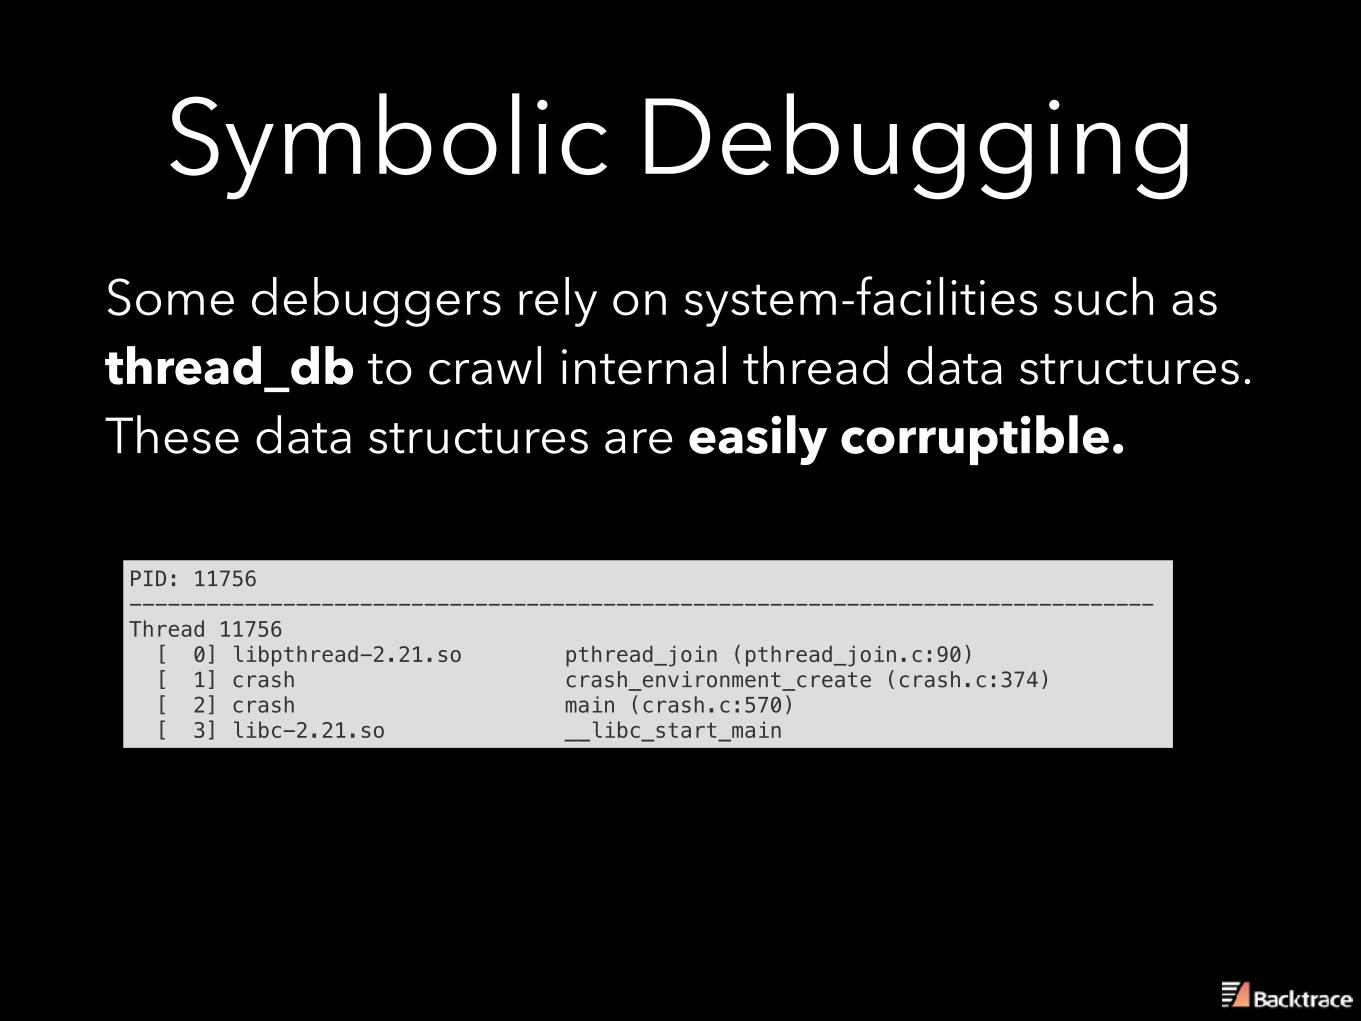
Symbolic DebuggingSome debuggers rely on system-facilities such as thread_db to crawl internal thread data structures. These data structures are easily corruptible.
PID: 11756 -------------------------------------------------------------------------------- Thread 11756 [ 0] libpthread-2.21.so pthread_join (pthread_join.c:90) [ 1] crash crash_environment_create (crash.c:374) [ 2] crash main (crash.c:570) [ 3] libc-2.21.so __libc_start_main
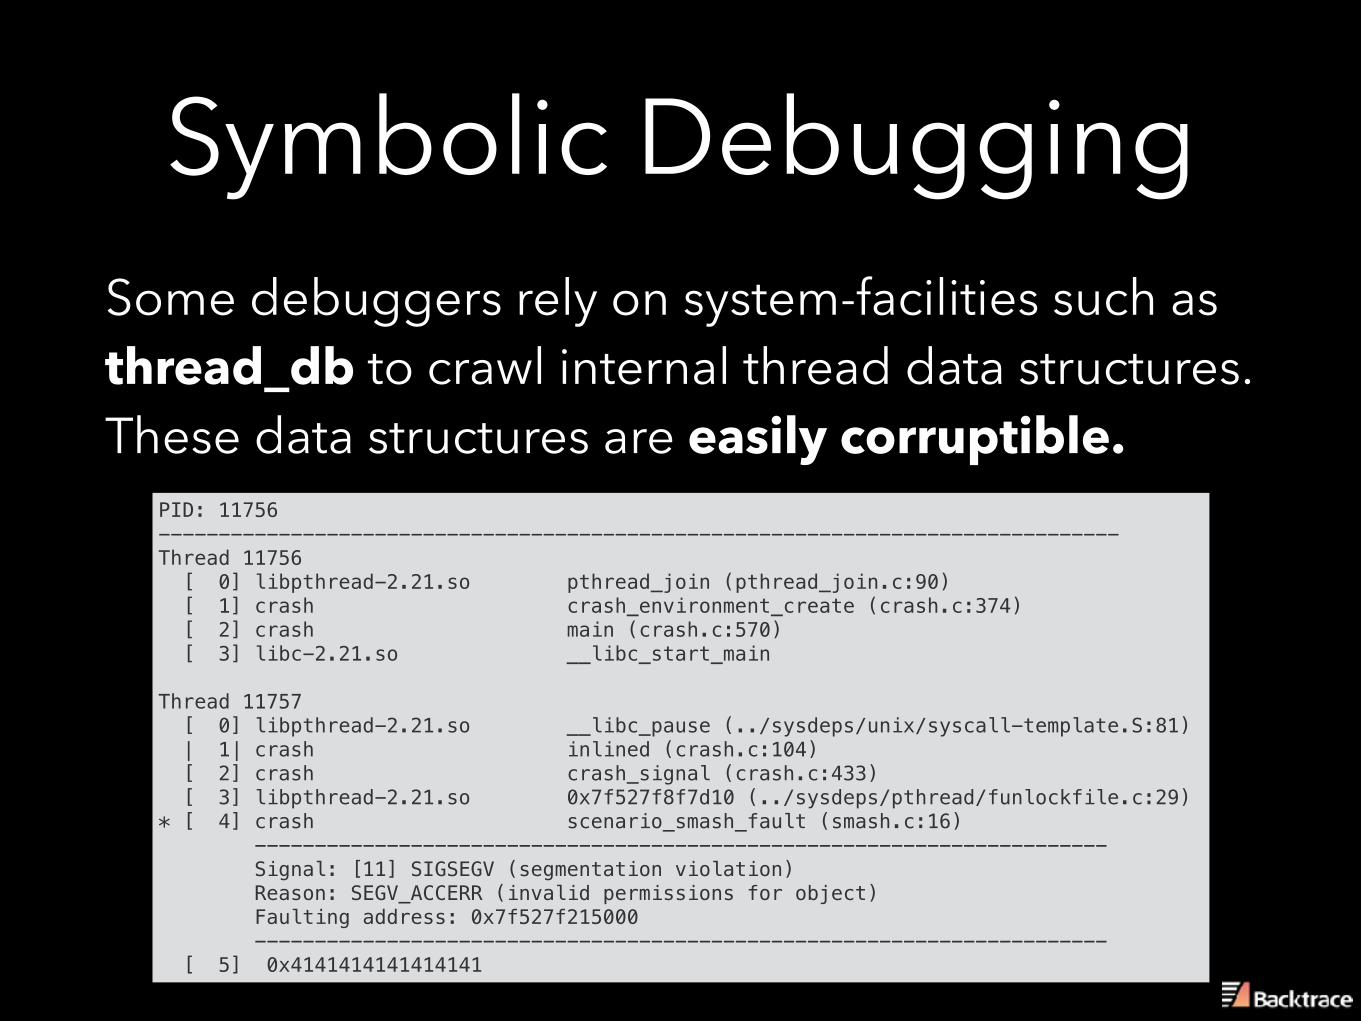
Thread 11757 [ 0] libpthread-2.21.so __libc_pause (../sysdeps/unix/syscall-template.S:81) | 1| crash inlined (crash.c:104) [ 2] crash crash_signal (crash.c:433) [ 3] libpthread-2.21.so 0x7f527f8f7d10 (../sysdeps/pthread/funlockfile.c:29) * [ 4] crash scenario_smash_fault (smash.c:16) ----------------------------------------------------------------------- Signal: [11] SIGSEGV (segmentation violation) Reason: SEGV_ACCERR (invalid permissions for object) Faulting address: 0x7f527f215000 ----------------------------------------------------------------------- [ 5] 0x4141414141414141