
Compilation of mRNA Polyadenylation Signals in Arabidopsis Revealed a New Signal Element
12
Compilation of mRNA Polyadenylation Signals in Arabidopsis Revealed a New Signal Element and Potential Secondary Structures 1[w] Johnny C. Loke 2 , Eric A. Stahlberg, David G. Strenski, Brian J. Haas, Paul Chris Wood, and Qingshun Quinn Li* Department of Botany, Miami University, Oxford, Ohio 45056 (J.C.L., P.C.W., Q.Q.L.); Ohio Supercomputer Center, Columbus, Ohio 43212 (E.A.S.); Cray, Inc., Brighton, Michigan 48116 (D.G.S.); and The Institute of Genomic Research, Rockville, Maryland 20850 (B.J.H.) Using a novel program, SignalSleuth, and a database containing authenticated polyadenylation [poly(A)] sites, we analyzed the composition of mRNA poly(A) signals in Arabidopsis (Arabidopsis thaliana), and reevaluated previously described cis-elements within the 3#-untranslated (UTR) regions, including near upstream elements and far upstream elements. As predicted, there are absences of high-consensus signal patterns. The AAUAAA signal topped the near upstream elements patterns and was found within the predicted location to only approximately 10% of 3#-UTRs. More importantly, we identified a new set, named cleavage elements, of poly(A) signals flanking both sides of the cleavage site. These cis-elements were not previously revealed by conventional mutagenesis and are contemplated as a cluster of signals for cleavage site recognition. Moreover, a single- nucleotide profile scan on the 3#-UTR regions unveiled a distinct arrangement of alternate stretches of U and A nucleotides, which led to a prediction of the formation of secondary structures. Using an RNA secondary structure prediction program, mFold, we identified three main types of secondary structures on the sequences analyzed. Surprisingly, these observed secondary structures were all interrupted in previously constructed mutations in these regions. These results will enable us to revise the current model of plant poly(A) signals and to develop tools to predict 3#-ends for gene annotation. Messenger RNA polyadenylation is a crucial step during the maturation of most eukaryotic mRNA, in which a polyadenine [poly(A)] tract is added to the cleaved 3#-end of a precursor mRNA (pre-mRNA) posttranscriptionally. Such a modification of mRNA has been shown to affect its stability, translatability, and nuclear-to-cytoplasmic export (Zhao et al., 1999). The posttranscriptional processing of mRNA is an event that has also been found tightly coupled with splicing and transcription termination (Proudfoot et al., 2002; Proudfoot, 2004). Thus, it is an essential processing event and the integral part of gene expres- sion. The polyadenylation process requires two major components: the cis-elements or poly(A) signals of the pre-mRNA, and the trans-acting factors that carry out the cleavage and addition of the poly(A) tail at the 3#-end. These trans-acting factors are a complex of about 25 to 30 proteins involved in signal recognition, cleavage, and polyadenylation (Proudfoot, 2004). These proteins seem to be conserved among eukary- otic organisms. However, the poly(A) signals have been found to differ widely among yeast (Saccharomy- ces cerevisiae), animals, and plants in terms of signal locations and sequence content. The highly conserved AAUAAA element in mammals becomes a minor signal in plant and yeast genes, and the ubiquitous downstream elements of mammalian pre-mRNAs are nowhere to be found in yeast and plants. The latter two possess an enhancing element located far up- stream of the cleavage site (Zhao et al., 1999). Previous understanding of these signal elements was derived mostly through conventional genetic and some biochemical analyses, which are both tedious and time consuming to perform. The availability of genomic, full-length cDNA and expressed sequence tag (EST) sequences through large-scale genome- sequencing projects makes it possible to search for poly(A) signals using bioinformatics tools (Graber et al., 1999b; Beaudoing et al., 2000; Hajarnavis et al., 2004). The efficacy of this approach has been demon- strated in the recent stream of publications revisiting the poly(A) cis-elements in different organisms in which such signal models were established based on conventional genetic analysis. Although still promi- nent, the status of the canonical AAUAAA pattern in mammals has been challenged (MacDonald and Redondo, 2002). The most detailed information comes 1 This work was supported in part by Miami University (Shoupp Award and Botany Department Academic Challenge Grant), the Ohio Plant Biotechnology Consortium, and the National Science Foundation (grant no. MCB–0313472 to Q.Q.L.). 2 Present address: Department of Medicine, Mount Sinai School of Medicine, 1425 Madison Ave., New York, NY 10029–6574. * Corresponding author; e-mail [email protected]; fax 513–529– 4243. [w] The online version of this article contains Web-only data. Article, publication date, and citation information can be found at www.plantphysiol.org/cgi/doi/10.1104/pp.105.060541. Plant Physiology, July 2005, Vol. 138, pp. 1457–1468, www.plantphysiol.org Ó 2005 American Society of Plant Biologists 1457 Downloaded from https://academic.oup.com/plphys/article/138/3/1457/6103111 by guest on 28 September 2021
Transcript of Compilation of mRNA Polyadenylation Signals in Arabidopsis Revealed a New Signal Element

Compilation of mRNA Polyadenylation Signals inArabidopsis Revealed a New Signal Elementand Potential Secondary Structures1[w]
Johnny C. Loke2, Eric A. Stahlberg, David G. Strenski, Brian J. Haas, Paul Chris Wood,and Qingshun Quinn Li*
Department of Botany, Miami University, Oxford, Ohio 45056 (J.C.L., P.C.W., Q.Q.L.); Ohio SupercomputerCenter, Columbus, Ohio 43212 (E.A.S.); Cray, Inc., Brighton, Michigan 48116 (D.G.S.); and The Instituteof Genomic Research, Rockville, Maryland 20850 (B.J.H.)
Using a novel program, SignalSleuth, and a database containing authenticated polyadenylation [poly(A)] sites, we analyzed thecomposition of mRNA poly(A) signals in Arabidopsis (Arabidopsis thaliana), and reevaluated previously described cis-elementswithin the 3#-untranslated (UTR) regions, including near upstream elements and far upstream elements. As predicted, there areabsences of high-consensus signal patterns. The AAUAAA signal topped the near upstream elements patterns and was foundwithin the predicted location to only approximately 10% of 3#-UTRs. More importantly, we identified a new set, named cleavageelements, of poly(A) signals flanking both sides of the cleavage site. These cis-elements were not previously revealed byconventional mutagenesis and are contemplated as a cluster of signals for cleavage site recognition. Moreover, a single-nucleotide profile scan on the 3#-UTR regions unveiled a distinct arrangement of alternate stretches of U and A nucleotides,which led to a prediction of the formation of secondary structures. Using an RNA secondary structure prediction program,mFold, we identified three main types of secondary structures on the sequences analyzed. Surprisingly, these observedsecondary structures were all interrupted in previously constructed mutations in these regions. These results will enable us torevise the current model of plant poly(A) signals and to develop tools to predict 3#-ends for gene annotation.
Messenger RNA polyadenylation is a crucial stepduring the maturation of most eukaryotic mRNA, inwhich a polyadenine [poly(A)] tract is added to thecleaved 3#-end of a precursor mRNA (pre-mRNA)posttranscriptionally. Such a modification of mRNAhas been shown to affect its stability, translatability,and nuclear-to-cytoplasmic export (Zhao et al., 1999).The posttranscriptional processing of mRNA is anevent that has also been found tightly coupled withsplicing and transcription termination (Proudfootet al., 2002; Proudfoot, 2004). Thus, it is an essentialprocessing event and the integral part of gene expres-sion.The polyadenylation process requires two major
components: the cis-elements or poly(A) signals ofthe pre-mRNA, and the trans-acting factors that carryout the cleavage and addition of the poly(A) tail at the3#-end. These trans-acting factors are a complex of
about 25 to 30 proteins involved in signal recognition,cleavage, and polyadenylation (Proudfoot, 2004).These proteins seem to be conserved among eukary-otic organisms. However, the poly(A) signals havebeen found to differ widely among yeast (Saccharomy-ces cerevisiae), animals, and plants in terms of signallocations and sequence content. The highly conservedAAUAAA element in mammals becomes a minorsignal in plant and yeast genes, and the ubiquitousdownstream elements of mammalian pre-mRNAs arenowhere to be found in yeast and plants. The lattertwo possess an enhancing element located far up-stream of the cleavage site (Zhao et al., 1999).
Previous understanding of these signal elementswas derived mostly through conventional genetic andsome biochemical analyses, which are both tediousand time consuming to perform. The availability ofgenomic, full-length cDNA and expressed sequencetag (EST) sequences through large-scale genome-sequencing projects makes it possible to search forpoly(A) signals using bioinformatics tools (Graberet al., 1999b; Beaudoing et al., 2000; Hajarnavis et al.,2004). The efficacy of this approach has been demon-strated in the recent stream of publications revisitingthe poly(A) cis-elements in different organisms inwhich such signal models were established based onconventional genetic analysis. Although still promi-nent, the status of the canonical AAUAAA patternin mammals has been challenged (MacDonald andRedondo, 2002). The most detailed information comes
1 This work was supported in part by Miami University (ShouppAward and Botany Department Academic Challenge Grant), theOhio Plant Biotechnology Consortium, and the National ScienceFoundation (grant no. MCB–0313472 to Q.Q.L.).
2 Present address: Department of Medicine, Mount Sinai School ofMedicine, 1425 Madison Ave., New York, NY 10029–6574.
* Corresponding author; e-mail [email protected]; fax 513–529–4243.
[w] The online version of this article contains Web-only data.Article, publication date, and citation information can be found at
www.plantphysiol.org/cgi/doi/10.1104/pp.105.060541.
Plant Physiology, July 2005, Vol. 138, pp. 1457–1468, www.plantphysiol.org � 2005 American Society of Plant Biologists 1457
Dow
nloaded from https://academ
ic.oup.com/plphys/article/138/3/1457/6103111 by guest on 28 Septem
ber 2021
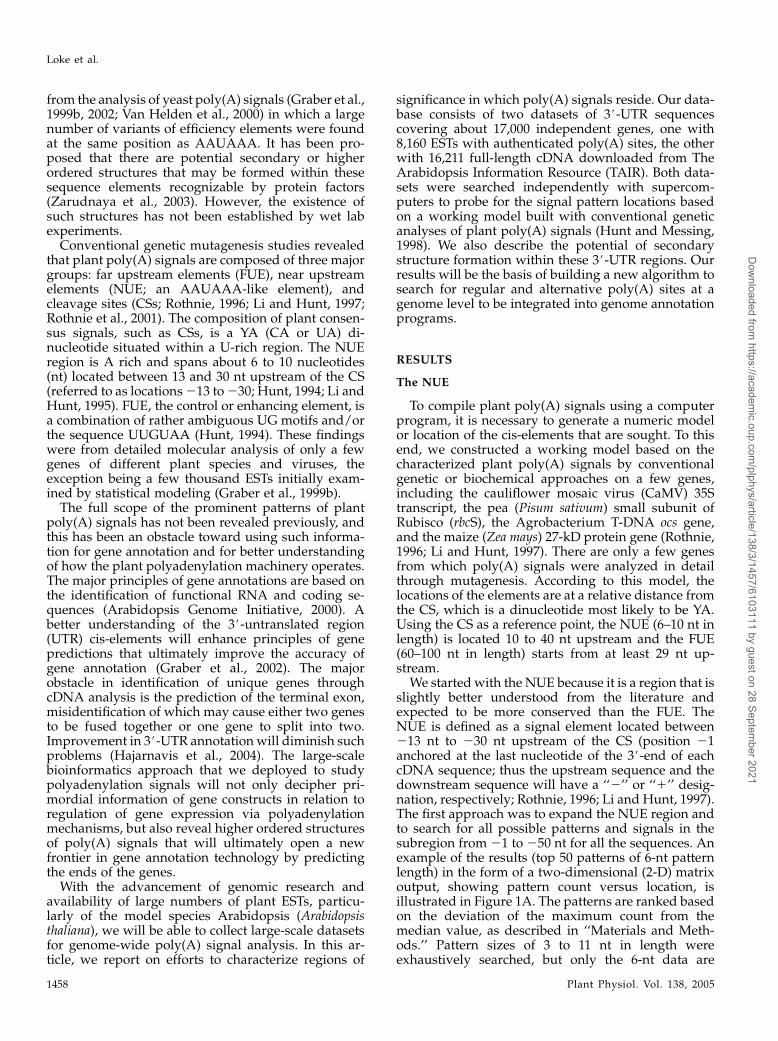
from the analysis of yeast poly(A) signals (Graber et al.,1999b, 2002; Van Helden et al., 2000) in which a largenumber of variants of efficiency elements were foundat the same position as AAUAAA. It has been pro-posed that there are potential secondary or higherordered structures that may be formed within thesesequence elements recognizable by protein factors(Zarudnaya et al., 2003). However, the existence ofsuch structures has not been established by wet labexperiments.
Conventional genetic mutagenesis studies revealedthat plant poly(A) signals are composed of three majorgroups: far upstream elements (FUE), near upstreamelements (NUE; an AAUAAA-like element), andcleavage sites (CSs; Rothnie, 1996; Li and Hunt, 1997;Rothnie et al., 2001). The composition of plant consen-sus signals, such as CSs, is a YA (CA or UA) di-nucleotide situated within a U-rich region. The NUEregion is A rich and spans about 6 to 10 nucleotides(nt) located between 13 and 30 nt upstream of the CS(referred to as locations213 to230; Hunt, 1994; Li andHunt, 1995). FUE, the control or enhancing element, isa combination of rather ambiguous UG motifs and/orthe sequence UUGUAA (Hunt, 1994). These findingswere from detailed molecular analysis of only a fewgenes of different plant species and viruses, theexception being a few thousand ESTs initially exam-ined by statistical modeling (Graber et al., 1999b).
The full scope of the prominent patterns of plantpoly(A) signals has not been revealed previously, andthis has been an obstacle toward using such informa-tion for gene annotation and for better understandingof how the plant polyadenylation machinery operates.The major principles of gene annotations are based onthe identification of functional RNA and coding se-quences (Arabidopsis Genome Initiative, 2000). Abetter understanding of the 3#-untranslated region(UTR) cis-elements will enhance principles of genepredictions that ultimately improve the accuracy ofgene annotation (Graber et al., 2002). The majorobstacle in identification of unique genes throughcDNA analysis is the prediction of the terminal exon,misidentification of which may cause either two genesto be fused together or one gene to split into two.Improvement in 3#-UTR annotation will diminish suchproblems (Hajarnavis et al., 2004). The large-scalebioinformatics approach that we deployed to studypolyadenylation signals will not only decipher pri-mordial information of gene constructs in relation toregulation of gene expression via polyadenylationmechanisms, but also reveal higher ordered structuresof poly(A) signals that will ultimately open a newfrontier in gene annotation technology by predictingthe ends of the genes.
With the advancement of genomic research andavailability of large numbers of plant ESTs, particu-larly of the model species Arabidopsis (Arabidopsisthaliana), we will be able to collect large-scale datasetsfor genome-wide poly(A) signal analysis. In this ar-ticle, we report on efforts to characterize regions of
significance in which poly(A) signals reside. Our data-base consists of two datasets of 3#-UTR sequencescovering about 17,000 independent genes, one with8,160 ESTs with authenticated poly(A) sites, the otherwith 16,211 full-length cDNA downloaded from TheArabidopsis Information Resource (TAIR). Both data-sets were searched independently with supercom-puters to probe for the signal pattern locations basedon a working model built with conventional geneticanalyses of plant poly(A) signals (Hunt and Messing,1998). We also describe the potential of secondarystructure formation within these 3#-UTR regions. Ourresults will be the basis of building a new algorithm tosearch for regular and alternative poly(A) sites at agenome level to be integrated into genome annotationprograms.
RESULTS
The NUE
To compile plant poly(A) signals using a computerprogram, it is necessary to generate a numeric modelor location of the cis-elements that are sought. To thisend, we constructed a working model based on thecharacterized plant poly(A) signals by conventionalgenetic or biochemical approaches on a few genes,including the cauliflower mosaic virus (CaMV) 35Stranscript, the pea (Pisum sativum) small subunit ofRubisco (rbcS), the Agrobacterium T-DNA ocs gene,and the maize (Zea mays) 27-kD protein gene (Rothnie,1996; Li and Hunt, 1997). There are only a few genesfrom which poly(A) signals were analyzed in detailthrough mutagenesis. According to this model, thelocations of the elements are at a relative distance fromthe CS, which is a dinucleotide most likely to be YA.Using the CS as a reference point, the NUE (6–10 nt inlength) is located 10 to 40 nt upstream and the FUE(60–100 nt in length) starts from at least 29 nt up-stream.
We started with the NUE because it is a region that isslightly better understood from the literature andexpected to be more conserved than the FUE. TheNUE is defined as a signal element located between213 nt to 230 nt upstream of the CS (position 21anchored at the last nucleotide of the 3#-end of eachcDNA sequence; thus the upstream sequence and thedownstream sequence will have a ‘‘2’’ or ‘‘1’’ desig-nation, respectively; Rothnie, 1996; Li and Hunt, 1997).The first approach was to expand the NUE region andto search for all possible patterns and signals in thesubregion from 21 to 250 nt for all the sequences. Anexample of the results (top 50 patterns of 6-nt patternlength) in the form of a two-dimensional (2-D) matrixoutput, showing pattern count versus location, isillustrated in Figure 1A. The patterns are ranked basedon the deviation of the maximum count from themedian value, as described in ‘‘Materials and Meth-ods.’’ Pattern sizes of 3 to 11 nt in length wereexhaustively searched, but only the 6-nt data are
Loke et al.
1458 Plant Physiol. Vol. 138, 2005
Dow
nloaded from https://academ
ic.oup.com/plphys/article/138/3/1457/6103111 by guest on 28 Septem
ber 2021
presented here. A full list of results for the top 1,000most common patterns for sizes from 3 to 11 nt arelisted in Supplemental Table I.A few striking features were found when searching
the NUE region of the sequences, namely, that a few
patterns had a much larger deviation than the rest ofthe top 50 patterns. The pattern AAUAAA came out atthe top of the list in this region, followed by other lessdominant ones. However, in this region, AAUAAAcan only account for about 10% of the signals. Second,
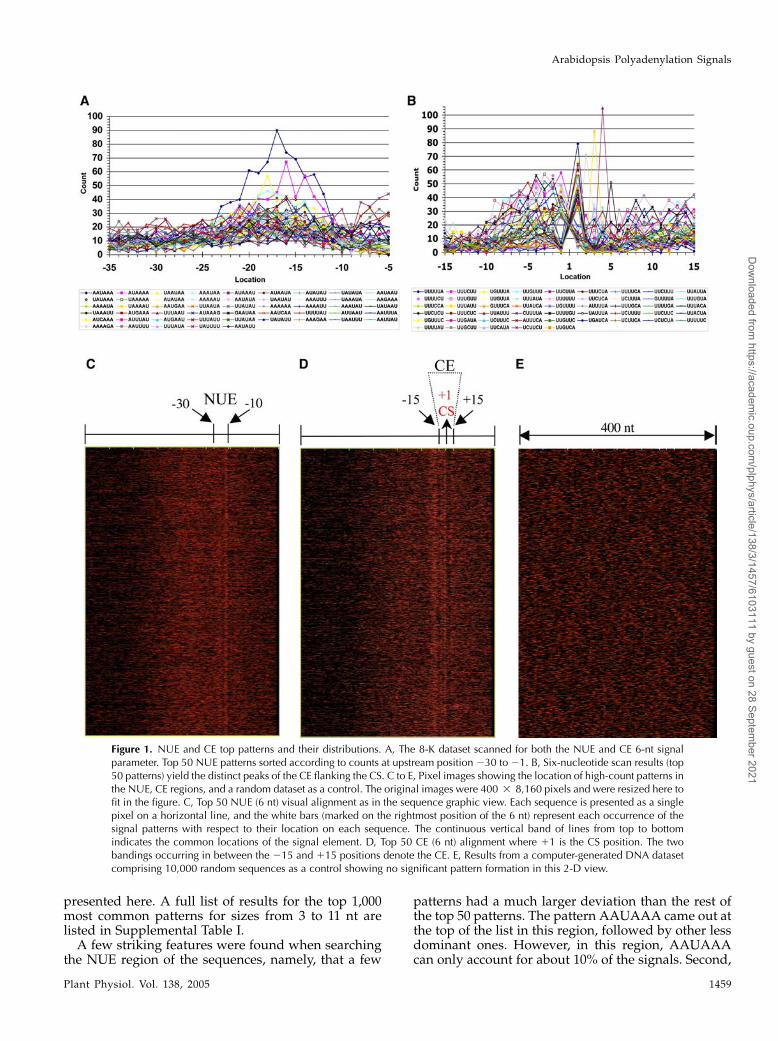
Figure 1. NUE and CE top patterns and their distributions. A, The 8-K dataset scanned for both the NUE and CE 6-nt signalparameter. Top 50 NUE patterns sorted according to counts at upstream position 230 to 21. B, Six-nucleotide scan results (top50 patterns) yield the distinct peaks of the CE flanking the CS. C to E, Pixel images showing the location of high-count patterns inthe NUE, CE regions, and a random dataset as a control. The original images were 400 3 8,160 pixels and were resized here tofit in the figure. C, Top 50 NUE (6 nt) visual alignment as in the sequence graphic view. Each sequence is presented as a singlepixel on a horizontal line, and the white bars (marked on the rightmost position of the 6 nt) represent each occurrence of thesignal patterns with respect to their location on each sequence. The continuous vertical band of lines from top to bottomindicates the common locations of the signal element. D, Top 50 CE (6 nt) alignment where 11 is the CS position. The twobandings occurring in between the 215 and 115 positions denote the CE. E, Results from a computer-generated DNA datasetcomprising 10,000 random sequences as a control showing no significant pattern formation in this 2-D view.
Arabidopsis Polyadenylation Signals
Plant Physiol. Vol. 138, 2005 1459
Dow
nloaded from https://academ
ic.oup.com/plphys/article/138/3/1457/6103111 by guest on 28 Septem
ber 2021
AAUAAA and related patterns are located at theexpected position of the working model at about 213to 230 nt upstream from the CS (Rothnie, 1996; Li andHunt, 1997). Surprisingly, there is a second unexpectedpeak immediately before the CS (Fig. 1A), which waspreviously unaccounted for in the working model.Moreover, the patterns in this region (21 to 210) arevery different from those of the NUEs, and the peakseemed to distribute across the CS, leaving somepatterns after the CS, indicative of possible indepen-dent signal elements.
A New Poly(A) Signal: Cleavage Element
To determine whether there is a new signal elementaround the CS, another dataset (UTR 1 downstream)was created to include 100 nt of genomic sequencedownstream of the CS for each of the sequences in the3#-UTR 8-K dataset. When the region of the sequences(215 to 120) was scanned for predominant patterns,the full peaks were seen collectively, with the CS in thecenter (Fig. 1B). Due to the nature of the SignalSleuthprogram, the patterns are counted from the position ofthe rightmost nucleotide (from 3# to 5#). Thus, consid-ering the 6-nt size patterns, most of the patterns withthe highest counts are across the CS. Moreover, theregion 210 to 115 is highly saturated with suchpatterns (the top 1,000 lists for 3- to 11-nt scan resultsare available in Supplemental Table I). It is clear thatthis region of the RNA consists of a signal element thatwas not previously documented in plants. The newsignal element is termed cleavage element (CE).
The SignalSleuth program also has the capability togenerate an output in the form of a 2-D image, asexplained in ‘‘Materials and Methods,’’ where thewidth represents the full length of the 400-nt sequence,and each red pixel represents one of the top 50patterns. Thus, the locations of the top 50 patterns onthe sequences can be marked on the image. As shownin Figure 1, C and D, these 2-D images clearly dem-onstrate the existence of the top signal patterns locatedwithin the NUE or CE regions (vertical bands) in the3#-UTR dataset, while no significant signals can beseen in the random DNA sequence dataset (Fig. 1E).Note that these top 50 patterns were reranked innarrower regions manually corresponding only tothe NUE (210 to 230) or the CE (210 to 110),respectively. This stipulation ensures visual evidencethat the top patterns on the NUE or CE lists arerepresentative of each element rather than a sum of thetwo elements. It seems that the CE patterns are locatedmainly in two regions, one at the CS, the other a fewnucleotides apart at the right of the CS.
The FUE
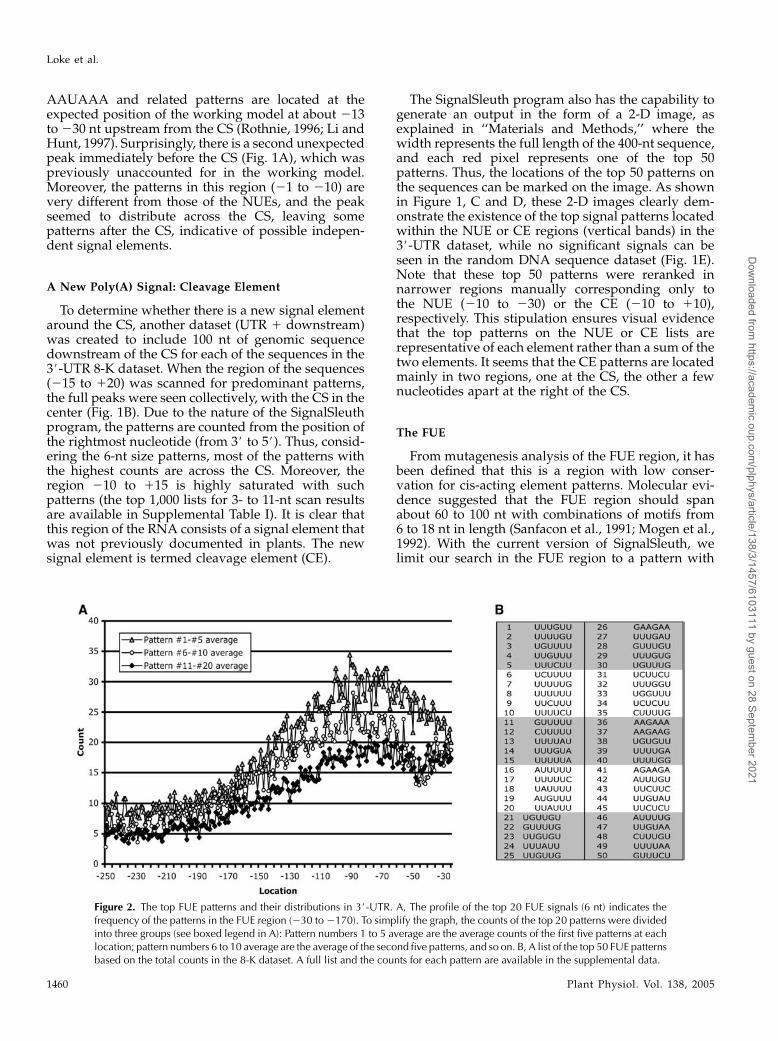
From mutagenesis analysis of the FUE region, it hasbeen defined that this is a region with low conser-vation for cis-acting element patterns. Molecular evi-dence suggested that the FUE region should spanabout 60 to 100 nt with combinations of motifs from6 to 18 nt in length (Sanfacon et al., 1991; Mogen et al.,1992). With the current version of SignalSleuth, welimit our search in the FUE region to a pattern with
Figure 2. The top FUE patterns and their distributions in 3#-UTR. A, The profile of the top 20 FUE signals (6 nt) indicates thefrequency of the patterns in the FUE region (230 to2170). To simplify the graph, the counts of the top 20 patterns were dividedinto three groups (see boxed legend in A): Pattern numbers 1 to 5 average are the average counts of the first five patterns at eachlocation; pattern numbers 6 to 10 average are the average of the second five patterns, and so on. B, A list of the top 50 FUE patternsbased on the total counts in the 8-K dataset. A full list and the counts for each pattern are available in the supplemental data.
Loke et al.
1460 Plant Physiol. Vol. 138, 2005
Dow
nloaded from https://academ
ic.oup.com/plphys/article/138/3/1457/6103111 by guest on 28 Septem
ber 2021

word length of 11 nt. Figure 2A represents the outputfrom the FUE search of the top 20 patterns of 6 nt inlength, presenting a cluster of pattern spikes with nodefined individual signal peaks, as seen in the NUE.However, as the search approaches the coding regions,there is a sudden shift in the combinations of nucleo-tides. The FUE patterns do not occupy one small do-main, but rather span across an approximately 125-ntregion, as indicated by the drops of peak densityflanking this FUE region (Fig. 2A). The top 50 patternsare listed in Figure 2B, while a full list of the top 1,000patterns of size 3 to 11 nt is available in SupplementalTable I.The NUE, CE, and FUE compilations were also done
with the 16-K dataset. Similar results, including rank-ings of the signals, were found (see SupplementalTable II).
Nucleotide Composition of 3#-UTRs
The NUE and CE patterns seemed to be notably richin A and U nucleotides. This prompted the need toanalyze the nucleotide composition profile of the3#-UTR sequences in the databases. A full-scan sweepof the 8-K dataset from 2250- to 1100-nt positionsrevealed intriguing findings (Fig. 3A). First, the dis-tributions of A and U are clearly distinct, where theups and downs of the curves complement each other.This is true between2200 to160 nt, covering a span ofa 260-nt region. The only exception is at the CS, whereC seemed to have a spike (for the previously knownYA dinucleotide). Second, distinct A and U profiles arealso seen in different signal elements. The FUE regionhas a high U content, while the NUE region has a highA content, with a clear transition between each. We
Figure 3. Single-nucleotide profile of 3#-UTR and a current model of plant poly(A) signals. A, Single-nucleotide scan frompositions 2250 to 1100 in the whole UTR 1 downstream region. Distinct profiles flanking the CS are now named CEs. B,Sequence logo generated from the actual percentage of each of the four nucleotide’s occurrence in the 8-K dataset, indicatingpreferred nucleotides flanking the CS (25 to 13 nt). C, A current model for Arabidopsis mRNA poly(A) signals. URE, U-richregions, which are found flanking both up- and downstream of the CS.
Arabidopsis Polyadenylation Signals
Plant Physiol. Vol. 138, 2005 1461
Dow
nloaded from https://academ
ic.oup.com/plphys/article/138/3/1457/6103111 by guest on 28 Septem
ber 2021

noticed that the CE region is composed of a complex,but clear, nucleotide composition with alternatingA- and U-rich submotifs. Third, the location of the ele-ments can be clearly identified as previously proposed,e.g. the NUE is located at about 20 nt upstream of theCS and the FUE at about 225 to 2160, coveringa region of over 100 nt. The occurrence of the NUEand the CE are consistent with the alignment shown inthe images in Figure 1, C and D. Finally, the CS 21position can be recognized by an A in about 73% of thesequences, followed by distinct U or C at the 22position in a total of 80% of the sequences (see Fig. 3B).The 22 position C was found to be 5.64-fold (from 453to 2,553 counts) at that location compared with theadjacent 21 position.
To verify whether such a nucleotide distributionprofile holds in the broader range of sequences, wealso scanned the 16-K dataset. The results showedsimilar patterns of nucleotide distribution at this re-gion (see Supplemental Fig. 1). This result indicatesthat both datasets, which cover about 17,000 uniquegenes of the Arabidopsis genome, possess similarprofiles of poly(A) signals.
Based on the information presented here, we pro-pose a new model for Arabidopsis mRNA poly(A)signals (Fig. 3C). From the single-nucleotide scananalysis, there is no obvious spatial separation amongthe three types of signals, FUE, NUE, and CE. How-ever, the locations of the signals seem to be wellpositioned, where the transition from one to the other
is complete. The proposed CE contains a subset ofsmall cis-elements: two U-rich sequences flankingboth sides of the CS.
Potential Secondary Structure Formation
of 3#-End Regions
The occurrence of patterns flanking CSs and theorder of an alternate arrangement of residues of com-plementarity for the poly(A) signals (Fig. 3A) indicatethe possibility of the formation of higher order struc-tures. To explore this, we used the mFold 2.3 modelanalysis as described by Zuker (2003). The foldingresults from the manual analysis of a subset of ran-domly selected 3#-UTR sequences (n 5 128) from the8-K dataset indicating categorical secondary structures(Fig. 4). Regions where the predicted poly(A) signalsmay reside were revealed from trends of secondarystructures related to their locations, especially flankingthe CS. These secondary structures can be categorizedinto three main groups based on the location of the CS:group I, CS clustered; group II, CS stem loop; andgroup III, CS flat. Using such classification, a total of128 3#-UTR foldingswere completed, with 57.0% of thefoldings falling into group I, 28.1% in group II, and14.8% in group III. The stem loop structures foundaround the CS were all from the base pairing ofadjacent sequences. For analysis purposes, the inputof each sequence was 400 nt for maximal coverage ofpossible pre-mRNA 3#-UTR sequence length. Similar
Figure 4. Representative secondary structure models of 3#-UTR predicted by mFold. A, Group I, the CS (all at position 300, total400 nt used) is situated on a cluster of stem loop structures. B, Group II, the CS is situated on or around the stem loop, but is notflanked with a cluster of secondary structures. C, Group III, the CS is situated in the middle of a long structure. The free energyindicated is for individual structures. Percentages of structures in each group are given, and the ends of the RNA are as marked.The mFold program tends to match both ends of the RNA. This does not interfere with the structure prediction here because thestructures around the CSs are formed by the adjacent sequences, not by the end sequences.
Loke et al.
1462 Plant Physiol. Vol. 138, 2005
Dow
nloaded from https://academ
ic.oup.com/plphys/article/138/3/1457/6103111 by guest on 28 Septem
ber 2021

results (structures around the CS) have been obtainedfrom folding of shorter sequences of approximately220 nt, or longer sequences to include some codingsequences (approximately 800 nt).
Mutagenesis Data Support the Existence of
the Predicted Secondary Structures
The secondary structure described above was basedon in silico prediction. Support of such structureswould be strongest from experimental evidence if thealteration of these structures could interrupt the func-tion of the poly(A) signals. Here we analyzed pub-lished data based on conventionalmutagenesis on a setof genes. It was this kind of classical analysis thatcontributed to the understanding of the poly(A) sig-nals in plants.
From the predicted secondary structure of pea rbcSE-9 3#-UTR (Fig. 5A), it is clear that the primary andcryptic CS (based on Hunt and MacDonald, 1989) areall situated on three stem loop areas. Mutation of thesignals for one areawould lead to the uses of the CSs inthe next area. Thus, deletion of the NUE and FUEresponsible for CSs 1, 2, and 3 (on the left) led to theusage of the major cryptic sites (Fig. 5A, middle andright boxed areas; based on C6 mutants in figure 1 ofHunt andMacDonald, 1989), and so on (other mutantsin the mentioned figure).
The finer correlation of the secondary structure andCS efficiency can be better illustrated by the linker-scanning (LS) analysis on the same rbcS 3#-UTR asdescribed (Mogen et al., 1992). The authors noted that20-nt LS of the area 2220 to 261 did not yield theresults of the deletion of the whole region by Hunt andMacDonald (1989). This can be explained at thesecondary structure level: The deletion abolished thefar left area structure (Fig. 5A), but the LS did not sig-nificantly alter the structure (data not shown). How-ever, with LS 260/241, 240/221, and 220/21, thestem loop arrangements around the CSs were drasti-cally altered, respectively (e.g. Fig. 5B). As a result,the efficiency of the normal CS altered accordingly(Mogen et al., 1992).
The mutagenesis analysis of CaMV poly(A) signalsalso offers a clue pertaining to the importance of thesecondary structures. Deletion of the CaMV NUEpattern AAUAAA almost abolished the use of a corre-sponding poly(A) site (only 15% that of the wild type;see figure 9 of Rothnie, 1996). However, in the same setof experiments, a single-nucleotide change of most ofthe nucleotides in AAUAAA had only a subtle impacton the poly(A) selection (80%–100% activity re-mained). This can be elaborated using the secondarystructure model of the CaMV 3#-UTR, which falls intogroup III in our structure models (Fig. 4), as depictedin Figure 6A. There is no visible secondary structuralchange in the single-nucleotide mutations of theCaMV NUE, except that the structure wobbles slightlynear the NUE region (Fig. 6D). However, whenAAUAAA is deleted, there is no observed secondarystructure at the NUE region; hence the dramatic re-duction in the use of the CS (Fig. 6B). Moreover, when3 of the 6 nt were changed (from AAUAAA toUAGAAU), the efficiency of the signal was reducedto 51% calculated from the band intensity of the S1nuclease protection assay (figure 3 in Mogen et al.,1990), and the structural change is visible (Fig. 6C).
DISCUSSION
Using in silico analysis tools, we compiled Arabi-dopsis nuclear mRNA poly(A) signals from two in-dependently produced 3#-UTR datasets coveringabout 17,000 independent genes. Beyond confirmingthe previous working model on the NUE and FUE, werevealed complex nucleotide distribution patterns
Figure 5. The secondary structure of pea rbcS E-9 3#-UTR anda mutation. The structures were derived using the lowest free-energylevels (2190.8 and 2194.0, respectively). A, Wild type. The boxesindicate three cleavage regions. The arrows indicate the normal CSsand a main cryptic site (site 4 in the original paper; Mogen et al., 1992).The exact locations of other cryptic sites in the far-right boxed areawerenot given in the paper. The ends of the sequence are as marked. B, Anexample of LS mutations that altered the secondary structures, as wellas the efficiencies of the CSs (Mogen et al., 1992). Normal sites 1 and 2were eliminated, and site 3 and the major cryptic site becamedominant.
Arabidopsis Polyadenylation Signals
Plant Physiol. Vol. 138, 2005 1463
Dow
nloaded from https://academ
ic.oup.com/plphys/article/138/3/1457/6103111 by guest on 28 Septem
ber 2021

around the CS and poly(A) site. The signal surround-ing the CS is named CE here. A set of prevailing,although not highly conserved, patterns that arepotentially poly(A) signals for each of the three ele-ments are presented. Conserved secondary structuressurrounding the CSs were also predicted using theRNA secondary structure prediction program, mFold.Using data from the literature, it is confirmed thatthese structures are important for the functionality ofthe signals because only those mutations that alteredsecondary structures had impact on the efficiencyof the signals. These findings should serve as a newstarting point for plant poly(A) signal study, e.g. thebasis for mutagenesis tests of CE, the design of a pro-gram to predict poly(A) sites for genome annotationpurposes, and for finding alternative poly(A) sites.
A new working model for Arabidopsis mRNApoly(A) signals has emerged. As shown in Figure 3,the location of the FUE and the NUE has been updatedbased on this large-scale analysis, where the FUEregion spans 60 to 125 nt, the NUE region 6 to 10 nt,but the CE is clearly expanded from the original CS(only 2 nt) to include two U-rich regions before andafter the CS, both spanning about 5 to 10 nt. A closerview of the CS indicates a sharp nucleotide composi-tion change where the U before the CS is highly
desirable and a few Us also follow (Fig. 3B). Sucha model could serve well in designing a computeralgorithm to scan genomic sequences for possiblepoly(A) sites.
Conventional genetic analysis of plant poly(A)signals was not able to reveal the significance of thesequence elements surrounding the CS. This may bedue partially to the signal element not being strongenough to be readily detected. The CE contains a longstretch of sequence to confirm its existence (althoughsuch a hypothesis is subject to further testing). It waspostulated that there may be a U-rich region sur-rounding the YA dinucleotide (Hunt, 1994), but itwas neither tested nor confirmed. A part of the CE,the sequence after the CS, was sometimes called thedownstream element in the early literature. Forexample, a downstream element was found to affectthe precision of cleavage, but did not influence theprocessing efficiency (Sanfacon et al., 1991). Moredramatic effect was noted in the analysis of ocs andrbcS 3#-UTR, in which the deletion of the downstreamelement alters or eliminates the use of the poly(A)site (Hunt and MacDonald, 1989; MacDonald et al.,1991). These notions were not pursued further, andhence remained unresolved, but are revisited in thisarticle.
Figure 6. The relationship of CaMV 3#-UTR structure, mutation, and poly(A) signal efficiency. A, Wild type; its efficiency isdefined as 100%. The arrows mark the CSs (Rothnie et al., 1994). The orientation of the sequence is as marked. B, Deletion of theNUE AAUAAA completely disrupts the secondary structure, which is also consistent with the reduction of efficiency of the signal.C, If 3 of the 6 nt altered, the structure changed from a small loop to a big one, and the signal efficiency was somewhat reduced.D, Some single-nucleotide mutations resulted in little structural changes, as well as signal efficiencies. *, The mutations andsignal usage efficiencies were measured from the data presented by Rothnie et al. (1994) for A, B, and D and Mogen et al. (1990)for A and C, respectively. Free energy is 2187 for all structures.
Loke et al.
1464 Plant Physiol. Vol. 138, 2005
Dow
nloaded from https://academ
ic.oup.com/plphys/article/138/3/1457/6103111 by guest on 28 Septem
ber 2021
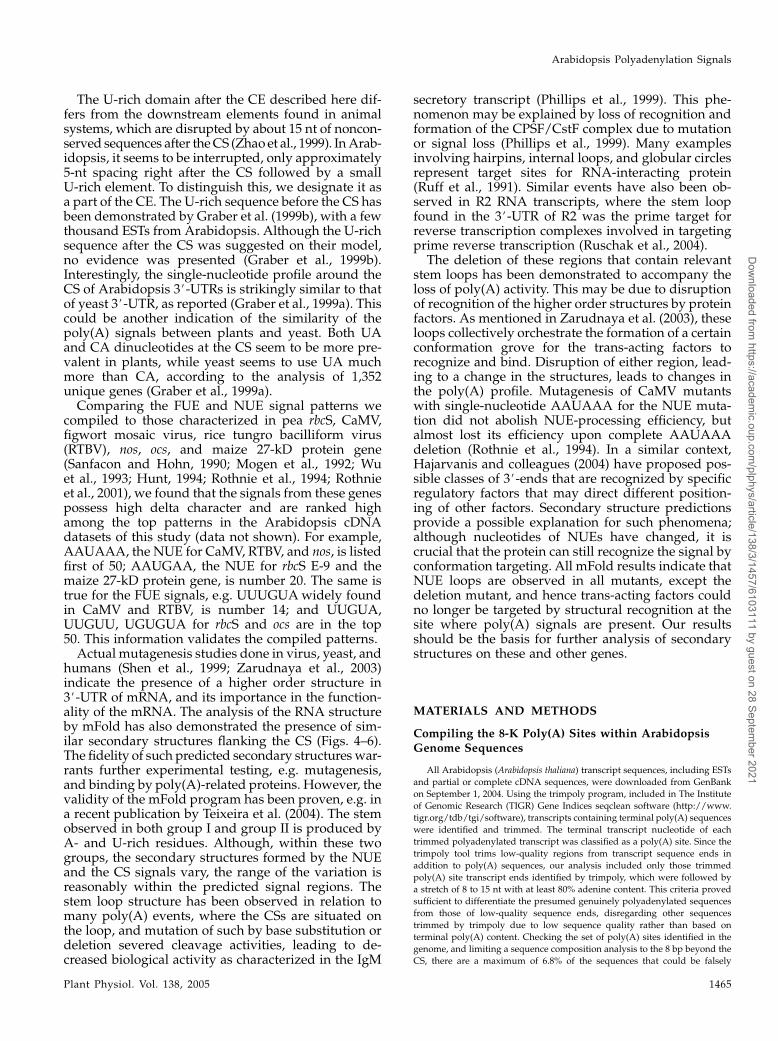
The U-rich domain after the CE described here dif-fers from the downstream elements found in animalsystems, which are disrupted by about 15 nt of noncon-served sequences after theCS (Zhao et al., 1999). InArab-idopsis, it seems to be interrupted, only approximately5-nt spacing right after the CS followed by a smallU-rich element. To distinguish this, we designate it asa part of the CE. The U-rich sequence before the CS hasbeen demonstrated by Graber et al. (1999b), with a fewthousand ESTs from Arabidopsis. Although the U-richsequence after the CS was suggested on their model,no evidence was presented (Graber et al., 1999b).Interestingly, the single-nucleotide profile around theCS of Arabidopsis 3#-UTRs is strikingly similar to thatof yeast 3#-UTR, as reported (Graber et al., 1999a). Thiscould be another indication of the similarity of thepoly(A) signals between plants and yeast. Both UAand CA dinucleotides at the CS seem to be more pre-valent in plants, while yeast seems to use UA muchmore than CA, according to the analysis of 1,352unique genes (Graber et al., 1999a).Comparing the FUE and NUE signal patterns we
compiled to those characterized in pea rbcS, CaMV,figwort mosaic virus, rice tungro bacilliform virus(RTBV), nos, ocs, and maize 27-kD protein gene(Sanfacon and Hohn, 1990; Mogen et al., 1992; Wuet al., 1993; Hunt, 1994; Rothnie et al., 1994; Rothnieet al., 2001), we found that the signals from these genespossess high delta character and are ranked highamong the top patterns in the Arabidopsis cDNAdatasets of this study (data not shown). For example,AAUAAA, the NUE for CaMV, RTBV, and nos, is listedfirst of 50; AAUGAA, the NUE for rbcS E-9 and themaize 27-kD protein gene, is number 20. The same istrue for the FUE signals, e.g. UUUGUAwidely foundin CaMV and RTBV, is number 14; and UUGUA,UUGUU, UGUGUA for rbcS and ocs are in the top50. This information validates the compiled patterns.Actual mutagenesis studies done in virus, yeast, and
humans (Shen et al., 1999; Zarudnaya et al., 2003)indicate the presence of a higher order structure in3#-UTR of mRNA, and its importance in the function-ality of the mRNA. The analysis of the RNA structureby mFold has also demonstrated the presence of sim-ilar secondary structures flanking the CS (Figs. 4–6).The fidelity of such predicted secondary structures war-rants further experimental testing, e.g. mutagenesis,and binding by poly(A)-related proteins. However, thevalidity of the mFold program has been proven, e.g. ina recent publication by Teixeira et al. (2004). The stemobserved in both group I and group II is produced byA- and U-rich residues. Although, within these twogroups, the secondary structures formed by the NUEand the CS signals vary, the range of the variation isreasonably within the predicted signal regions. Thestem loop structure has been observed in relation tomany poly(A) events, where the CSs are situated onthe loop, and mutation of such by base substitution ordeletion severed cleavage activities, leading to de-creased biological activity as characterized in the IgM
secretory transcript (Phillips et al., 1999). This phe-nomenon may be explained by loss of recognition andformation of the CPSF/CstF complex due to mutationor signal loss (Phillips et al., 1999). Many examplesinvolving hairpins, internal loops, and globular circlesrepresent target sites for RNA-interacting protein(Ruff et al., 1991). Similar events have also been ob-served in R2 RNA transcripts, where the stem loopfound in the 3#-UTR of R2 was the prime target forreverse transcription complexes involved in targetingprime reverse transcription (Ruschak et al., 2004).
The deletion of these regions that contain relevantstem loops has been demonstrated to accompany theloss of poly(A) activity. This may be due to disruptionof recognition of the higher order structures by proteinfactors. As mentioned in Zarudnaya et al. (2003), theseloops collectively orchestrate the formation of a certainconformation grove for the trans-acting factors torecognize and bind. Disruption of either region, lead-ing to a change in the structures, leads to changes inthe poly(A) profile. Mutagenesis of CaMV mutantswith single-nucleotide AAUAAA for the NUE muta-tion did not abolish NUE-processing efficiency, butalmost lost its efficiency upon complete AAUAAAdeletion (Rothnie et al., 1994). In a similar context,Hajarvanis and colleagues (2004) have proposed pos-sible classes of 3#-ends that are recognized by specificregulatory factors that may direct different position-ing of other factors. Secondary structure predictionsprovide a possible explanation for such phenomena;although nucleotides of NUEs have changed, it iscrucial that the protein can still recognize the signal byconformation targeting. All mFold results indicate thatNUE loops are observed in all mutants, except thedeletion mutant, and hence trans-acting factors couldno longer be targeted by structural recognition at thesite where poly(A) signals are present. Our resultsshould be the basis for further analysis of secondarystructures on these and other genes.
MATERIALS AND METHODS
Compiling the 8-K Poly(A) Sites within ArabidopsisGenome Sequences
All Arabidopsis (Arabidopsis thaliana) transcript sequences, including ESTs
and partial or complete cDNA sequences, were downloaded from GenBank
on September 1, 2004. Using the trimpoly program, included in The Institute
of Genomic Research (TIGR) Gene Indices seqclean software (http://www.
tigr.org/tdb/tgi/software), transcripts containing terminal poly(A) sequences
were identified and trimmed. The terminal transcript nucleotide of each
trimmed polyadenylated transcript was classified as a poly(A) site. Since the
trimpoly tool trims low-quality regions from transcript sequence ends in
addition to poly(A) sequences, our analysis included only those trimmed
poly(A) site transcript ends identified by trimpoly, which were followed by
a stretch of 8 to 15 nt with at least 80% adenine content. This criteria proved
sufficient to differentiate the presumed genuinely polyadenylated sequences
from those of low-quality sequence ends, disregarding other sequences
trimmed by trimpoly due to low sequence quality rather than based on
terminal poly(A) content. Checking the set of poly(A) sites identified in the
genome, and limiting a sequence composition analysis to the 8 bp beyond the
CS, there are a maximum of 6.8% of the sequences that could be falsely
Arabidopsis Polyadenylation Signals
Plant Physiol. Vol. 138, 2005 1465
Dow
nloaded from https://academ
ic.oup.com/plphys/article/138/3/1457/6103111 by guest on 28 Septem
ber 2021
classified by using these criteria alone. Using the 15-bp maximal window size,
we found the maximal false-positive rate drops to 5.6%.
From the sequences of 191,301 Arabidopsis ESTs and 35,557 mRNA
sequences obtained from GenBank, we found 10,735 sequences containing
poly(A) sequences, which align almost perfectly to the Arabidopsis genome.
Approximately one-half of the polyadenylated sequences were derived from
full-length cDNAs. The final assembly of 9,298 ESTs was further filtered
through methods described by Beaudoing and colleagues (2000) in which
sequences containing stretches of As within 10 bp after the CS may denote
internal priming contamination. The genome alignments of the trimmed
poly(A)-containing sequences provide the identity of 8,160 poly(A) sites
within all five chromosomes. The genomic sequence position corresponding
to the poly(A) site of each relevant transcript sequence was identified via
sequence alignment. The Program to Assemble Spliced Alignments (PASA)
pipeline (Haas et al., 2003) was used to align the trimmed transcript sequences
to the Arabidopsis Release 5.0 chromosome pseudomolecule sequences
(available at ftp://ftp.tigr.org/pub/data/a_thaliana). A total of 8,160 se-
quences 300 nt upstream of the poly(A) sites (including assumed 3#-UTRs)
were collected as this 8-K dataset. The coordinates of each poly(A) site based
on the genome coordinate reference were calculated based on the correspond-
ing transcript alignment coordinates. To include the study of downstream
sequences, a program was developed to extract sequence regions (100 nt
downstream from the CSs) from the chromosome sequences based on the
poly(A) site and annotated gene coordinates. FASTA formatted sequence files
(as cDNA) were created to serve as input for the remaining sequence analysis.
Compiling the 16-K Arabidopsis 3#-UTR Sequences
The 16-K dataset consists of the 3#-UTR terminal 300 nt, from the
assembled 16,211 Arabidopsis full-length cDNAs as described (Haas et al.,
2003). A total of 177,973 Arabidopsis ESTs, 27,414 cDNAs, and 3,217 partial
cDNAs, were examined in building this cDNA database, using PASA, which
integrates any unaligned sequences into at least one of the maximal assembly.
All sequences were selected for quality regions and poly(A) tail by using
a SeqClean tool, and realigned defined sequence regions, using the BLAST-
like Alignment Tool (BLAT) against the complete genomic sequences.
Comparing the two datasets used here, one containing 8,160 ESTs (8 K)
with authenticated poly(A) sites and the other with 16,211 full-length cDNAs
(16 K), the 8-K dataset contains 584 EST sequences that are not found in the
16-K dataset totaling 442 unique genes in the 8-K dataset. There are also 10,474
genes that are unique to the 16-K data set and 5,737 genes are common in both
datasets. Thus, the combined total number of genes being analyzed is about
17,000. Both the 8-K and 16-K datasets are available at http://www.users.
muohio.edu/liq.
The Pattern Compilation Program
A program, SignalSleuth, was created to perform an exhaustive search of
varying size patterns within a subregion of a large set of sequences. (The code
can be downloaded at http://www.users.muohio.edu/liq.) The program was
developed, installed, and run on Cray computers located at both Cray
facilities in Wisconsin and the Ohio Supercomputer Center (OSC). With the
use of the Cray Bioinformatics Library (CBL; Cray, Inc., 2004), the program
was quickly implemented and achieved unprecedented performance by
accessing special bit manipulation hardware instructions on the machine.
The algorithm used in the program starts out by reading the sequence data
from a FASTA file using the CBL routine cb_read_fasta. The program then
enters a triply nested loop, looping over pattern size, the number of sequences,
and the location within a given sequence. After entering the outermost loop,
pattern size, the program allocates enough memory to hold all possible
combinations of the four unique characters {A, C, G, T} in n locations, where n
is the size of the pattern for this trip through the loop. The program then
begins at the starting location for the first nucleotide, in the subregion of
interest, within the first sequence. The program copies the first pattern length
worth of characters from the sequence into a temporary variable and
compresses it, using the CBL routine cb_compress, into a 2-bit compress
form by picking out the second and third bits from each character in the
variable. Since there are only four possible characters, only 2 bits of in-
formation are needed {00, 01, 10, and 11} to store this information. Shifting the
bits in this 2-bit compress variable to the rightmost bits of the pattern, the
variable can then be used as an integer to index into the all-possible
combination array and increment that location. With this location now tallied,
the code shifts to the right one character in the input sequence and repeats the
process. When all the characters within the subregion for this sequence are
processed, the code advances to the next sequence and repeats the process for
the subregion in the next sequence. The program continues in this fashion
until all sequences have been processed.
At the end of this search process, the all-possible combination arrays now
contain a histogram of how frequently each combination was foundwithin the
target regions of all the sequences. The next step is to search this array to find
the largest number, or set of largest numbers, such as the top 50 most common
patterns in the target regions of the sequences. The program then converts the
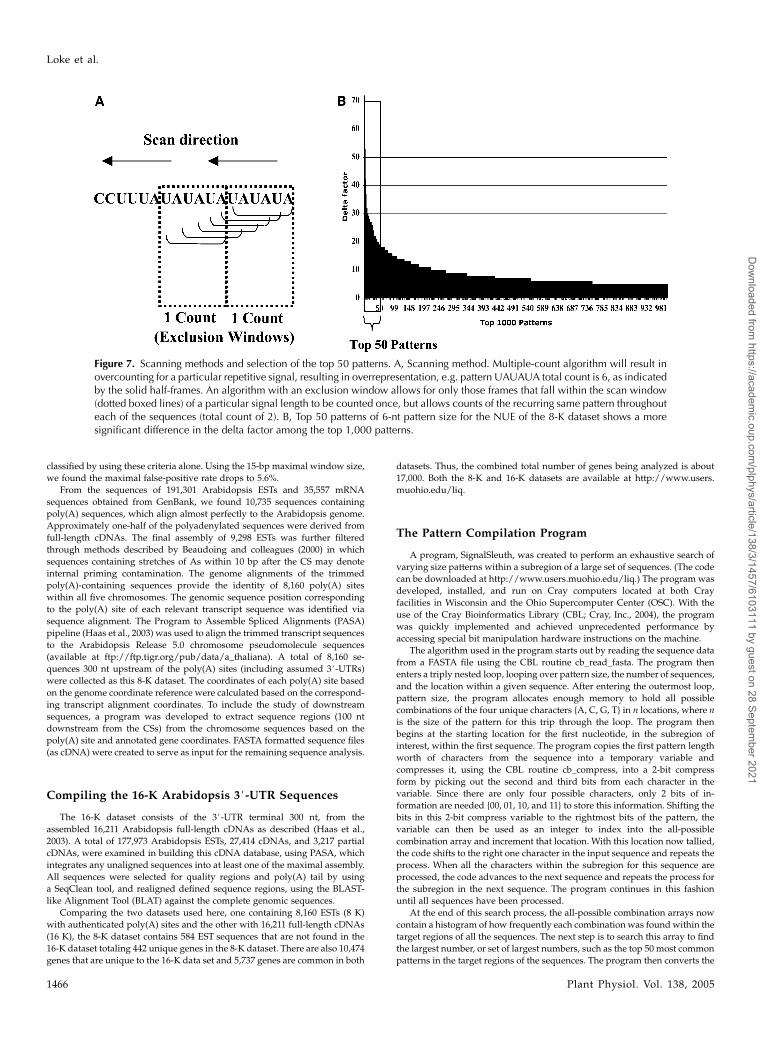
Figure 7. Scanning methods and selection of the top 50 patterns. A, Scanning method. Multiple-count algorithm will result inovercounting for a particular repetitive signal, resulting in overrepresentation, e.g. pattern UAUAUA total count is 6, as indicatedby the solid half-frames. An algorithm with an exclusion window allows for only those frames that fall within the scan window(dotted boxed lines) of a particular signal length to be counted once, but allows counts of the recurring same pattern throughouteach of the sequences (total count of 2). B, Top 50 patterns of 6-nt pattern size for the NUE of the 8-K dataset shows a moresignificant difference in the delta factor among the top 1,000 patterns.
Loke et al.
1466 Plant Physiol. Vol. 138, 2005
Dow
nloaded from https://academ
ic.oup.com/plphys/article/138/3/1457/6103111 by guest on 28 Septem
ber 2021
indices into this array from its 2-bit compressed form back into its full 8-bit
ASCII characters, and the characters associated with the index are printed out.
This scanning algorithm took on several different variations, based on user-
defined parameters. With these parameters, the count of a particular pattern
can be counted once or multiple times per sequence, and if multiple counts are
allowed, a gap can be defined regarding when to start counting the particular
pattern again. This helps to prevent short repeated patterns from being overly
represented. If the single count option is used, the count of a particular pattern
is only counted once per sequence and may result in an underrepresented
count of a given pattern. For example, if a tract of UAUAUAUAUAUAwere
encountered for a 6-nt window size pattern, each frame of the UAUAUAwill
be counted as the same pattern, resulting in an overrepresented count for this
particular pattern. This algorithm will allow the signal for a particular re-
peated pattern to be counted again on the same sequence only if it falls
outside a particular exclusion window size on the sequence (Fig. 7A). These
repetitive patterns can be observed in Figure 1, described in the following
section.
The ranking of the counts in the array of patterns of all-possible combi-
nations is based on a deviation factor from the median value, which is termed
delta, and is defined as the difference between the maximal count and the
median count of a respective pattern. Pattern counts deviating the farthest
from the median are ranked the highest. The selection of the top 50 is justified
by the reduction of this deviation among the top 1,000 signals because this
deviation drops sharply after the first 50 patterns, as seen in Figure 7B.
Pattern Location Images
After the most common patterns were found, the next task was to illustrate
where these common patterns fall within the sequences, and to see if they
were more common, for example, in the NUE region as opposed to the rest of
the sequence. To accomplish this, additional code was added to the program
to form a graphic picture of the locations of the patterns within each sequence.
Imagine a picture that is 8,160 pixels tall and 400 pixels wide, where a pixel is
a dot on the screen or printed on a page. In this picture each pixel represents
the starting location of one of the top 50 patterns within the sequence.
Referring to Figure 1C, the program was run to search the NUE region for the
top 50 most common patterns. With this list, the program then turned on the
pixel that corresponds to those patterns as they are located in each sequence.
Notice that, even though these patterns can be found throughout all the
sequences, they are clearly more common in the NUE region, as marked at
the top of the image. Similarly, the program was run to search the region near
the CS, and its top 50 most common patterns plotted in Figure 1D. Again,
distinct vertical bands can be seen on either side of the CS. Figure 1E is used as
a control to showwhat an image would look like using random data. For these
images, no exclusion window was used, so long repeats of short patterns can
be seen as small horizontal bars in the images.
Secondary Structure of RNA
The predictions of secondary structure of the RNA region surrounding
poly(A) sites were carried out by an RNA secondary structure prediction
program, mFold (Zuker, 2003; http://www.bioinfo.rpi.edu/applications/
mfold). All analyses were deployed at 25�C, 0.1 M Na1, 0.002 M Mg21, and
5% suboptimality number with a maximum of 50 upper bounds on the
number of computed folding. Only the top five of all given outputs were
selected as justified by the most favorable free-energy conditions.
ACKNOWLEDGMENTS
We thank Mouin Hourani, Mingjun Tang, and Minghui Ding for technical
assistance, and Michael Hughes for helping with statistical analysis. We also
thank Kim Davis for helping with mFold analysis, and Paula Strenski for her
invaluable assistance in editing and reviewing this manuscript. We are
grateful for the use of Cray’s SV1ex supercomputer, located in Chippewa
Falls, Wisconsin, and the Ohio Supercomputer Center’s SV1 located in
Columbus, Ohio.
Received January 31, 2005; revised April 29, 2005; accepted May 3, 2005;
published June 17, 2005.
LITERATURE CITED
Arabidopsis Genome Initiative (2000) Analysis of the genome sequence of
the flowering plant Arabidopsis thaliana. Nature 408: 796–815
Beaudoing E, Freier S, Wyatt JR, Claverie JM, Gautheret D (2000) Patterns
of variant polyadenylation signal usage in human genes. Genome Res
10: 1001–1010
Cray, Inc. (2004) Man Page Collection: Bioinformatics Library Procedures.
http://www.cray.com/craydoc/manuals/S-2397-21/S-2397-21.pdf
Graber JH, Cantor CR, Mohr SC, Smith TF (1999a) Genomic detection of
new yeast pre-mRNA 3#-end-processing signals. Nucleic Acids Res 27:
888–894
Graber JH, Cantor CR, Mohr SC, Smith TF (1999b) In silico detection of
control signals: mRNA 3#-end-processing sequences in diverse species.
Proc Natl Acad Sci USA 96: 14055–14060
Graber JH, McAllister GD, Smith TF (2002) Probabilistic prediction of
Saccharomyces cerevisiae mRNA 3#-processing sites. Nucleic Acids Res
30: 1851–1858
Haas BJ, Delcher AL, Mount SM, Wortman JR, Smith RK Jr, Hannick LI,
Maiti R, Ronning CM, Rusch DB, Town CD, et al (2003) Improving the
Arabidopsis genome annotation using maximal transcript alignment
assemblies. Nucleic Acids Res 31: 5654–5666
Hajarnavis A, Korf I, Durbin R (2004) A probabilistic model of 3# end
formation in Caenorhabditis elegans. Nucleic Acids Res 32: 3392–3399
Hunt AG (1994) Messenger RNA 3# end formation in plants. Annu Rev
Plant Physiol Plant Mol Biol 45: 47–60
Hunt AG, MacDonald MH (1989) Deletion analysis of the polyadenylation
signal of a pea ribulose-1,5-bisphosphate carboxylase small-subunit
gene. Plant Mol Biol 13: 125–138
Hunt AG, Messing J (1998) mRNA Polyadenylation in Plants. In J Bailey-
Serres, DR Gallie, eds, A Look beyond Transcription Mechanisms
Determining mRNA Stability and Translation in Plants. American
Society of Plant Physiologists, Rockville, MD, pp 29–39
Li QQ, Hunt AG (1995) A near upstream element in a plant polyadeny-
lation signal consists of more than six bases. Plant Mol Biol 28: 927–934
Li QQ, Hunt AG (1997) The polyadenylation of RNA in plants. Plant
Physiol 115: 321–325
MacDonald CC, Redondo JL (2002) Reexamining the polyadenyla-
tion signal: Were we wrong about AAUAAA? Mol Cell Endocrinol
190: 1–8
MacDonald MH, Mogen BD, Hunt AG (1991) Characterization of the
polyadenylation signal from the T-DNA-encoded octopine synthase
gene. Nucleic Acids Res 19: 5575–5581
Mogen BD, MacDonald MH, Graybosch R, Hunt AG (1990) Upstream
sequences other than AAUAAA are required for efficient messenger
RNA 3#-end formation in plants. Plant Cell 2: 1261–1272
Mogen BD, MacDonald MH, Leggewie G, Hunt AG (1992) Several
distinct types of sequence elements are required for efficient mRNA
3# end formation in a pea rbcS gene. Mol Cell Biol 12: 5406–5414
Phillips C, Kyriakopoulou CB, Virtanen A (1999) Identification of a stem-
loop structure important for polyadenylation at the murine IgM secre-
tory poly(A) site. Nucleic Acids Res 27: 429–438
Proudfoot N (2004) New perspectives on connecting messenger RNA 3#end formation to transcription. Curr Opin Cell Biol 16: 272–278
Proudfoot NJ, Furger A, Dye MJ (2002) Integrating mRNA processing with
transcription. Cell 108: 501–512
Rothnie HM (1996) Plant mRNA 3#-end formation. Plant Mol Biol 32: 43–61
Rothnie HM, Chen G, Futterer J, Hohn T (2001) Polyadenylation in rice
tungro bacilliform virus: cis-acting signals and regulation. J Virol 75:
4184–4194
Rothnie HM, Reid J, Hohn T (1994) The contribution of AAUAAA and the
upstream element UUUGUA to the efficiency of mRNA 3#-end forma-
tion in plants. EMBO J 13: 2200–2210
Ruff M, Krishnaswamy S, Boeglin M, Poterszman A, Mitschler A,
Podjarny A, Rees B, Thierry JC, Moras D (1991) Class II aminoacyl
transfer RNA synthetases: crystal structure of yeast aspartyl-tRNA
synthetase complexed with tRNA(Asp). Science 252: 1682–1689
Ruschak AM, Mathews DH, Bibillo A, Spinelli SL, Childs JL, Eickbush
TH, Turner DH (2004) Secondary structure models of the 3# untrans-
lated regions of diverse R2 RNAs. RNA 10: 978–987
Sanfacon H, Brodmann P, Hohn T (1991) A dissection of the cauliflower
mosaic virus polyadenylation signal. Genes Dev 5: 141–149
Sanfacon H, Hohn T (1990) Proximity to the promoter inhibits recognition
Arabidopsis Polyadenylation Signals
Plant Physiol. Vol. 138, 2005 1467
Dow
nloaded from https://academ
ic.oup.com/plphys/article/138/3/1457/6103111 by guest on 28 Septem
ber 2021
of cauliflower mosaic virus polyadenylation signal. Nature 346:
81–84
Shen LX, Basilion JP, Stanton VP Jr (1999) Single-nucleotide polymor-
phisms can cause different structural folds of mRNA. Proc Natl Acad Sci
USA 96: 7871–7876
Teixeira A, Tahiri-Alaoui A, West S, Thomas B, Ramadass A, Martianov I,
Dye M, James W, Proudfoot NJ, Akoulitchev A (2004) Autocatalytic
RNA cleavage in the human beta-globin pre-mRNA promotes tran-
scription termination. Nature 432: 526–530
Van Helden J, Olmo M, Perez-Ortin JE (2000) Statistical analysis of yeast
genomic downstream sequences reveals putative polyadenylation sig-
nals. Nucleic Acids Res 28: 1000–1010
Wu L, Ueda T, Messing J (1993) 3#-end processing of the maize 27 kDa zein
mRNA. Plant J 4: 535–544
Zarudnaya MI, Kolomiets IM, Potyahaylo AL, Hovorun DM (2003)
Downstream elements of mammalian pre-mRNA polyadenylation sig-
nals: primary, secondary and higher-order structures. Nucleic Acids Res
31: 1375–1386
Zhao J, Hyman L, Moore C (1999) Formation of mRNA 3# ends in
eukaryotes: mechanism, regulation, and interrelationships with other
steps in mRNA synthesis. Microbiol Mol Biol Rev 63: 405–445
Zuker M (2003) Mfold web server for nucleic acid folding and hybridiza-
tion prediction. Nucleic Acids Res 31: 3406–3415
Loke et al.
1468 Plant Physiol. Vol. 138, 2005
Dow
nloaded from https://academ
ic.oup.com/plphys/article/138/3/1457/6103111 by guest on 28 Septem
ber 2021