Competitiveness of Battery Energy Storage in the Future ...
140
1 Competitiveness of Battery Energy Storage in the Future Belgian Capacity Market Master thesis submitted to Delft University of Technology in partial fulfilment of the requirements for the degree of MASTER OF SCIENCE in Engineering and Policy Analysis Faculty of Technology, Policy and Management by Theodorus Johannes Albertus (Duco) Slooff Student number: 4295749 To be defended in public on November 26, 2019 Graduation committee Chair and first supervisor: Dr.ir. L.J. de Vries, Energy and Industry Second supervisor: Dr. M.E. Warnier, Systems Engineering External Supervisor: Ir. J.J. Hettema, Eneco
Transcript of Competitiveness of Battery Energy Storage in the Future ...

1
Competitiveness of Battery Energy
Storage in the Future Belgian Capacity
Market
Master thesis submitted to Delft University of Technology
in partial fulfilment of the requirements for the degree of
MASTER OF SCIENCE
in
Engineering and Policy Analysis
Faculty of Technology, Policy and Management
by
Theodorus Johannes Albertus (Duco) Slooff
Student number: 4295749
To be defended in public on November 26, 2019
Graduation committee
Chair and first supervisor: Dr.ir. L.J. de Vries, Energy and Industry
Second supervisor: Dr. M.E. Warnier, Systems Engineering
External Supervisor: Ir. J.J. Hettema, Eneco

2

3
Acknowledgements Throughout the writing of this master thesis, I have received support during various stages. I
express my sincere thanks to my academic supervisors Laurens de Vries and Martijn Warnier, for
their constructive feedback. I would also like to thank my external supervisor Jesse Hettema for
his guidance during my internship at Eneco. Furthermore, Jeroen and Paul from Eneco for the
discussions that have led to interesting insights.
Duco Slooff
Delft, 2019
4
Executive Summary
As the world is transitioning from conventional to renewable energy sources,
governments and energy utilities face the challenge to match the supply profile of these
intermittent sources to the energy demand. Energy storage is being considered as one of
the potential solutions to cope with the variability of renewables.
Belgium is not only challenged by the transition to renewable energy but must also deal
with the total nuclear power phase-out by 2025. The country significantly depends on the
seven nuclear power plants since they account for more than half of the national
electricity production (depending on the availability of the reactors). The Belgian TSO
Elia has investigated the urgency of adequacy and flexible electricity sources and
proposed a Capacity Remuneration Mechanism (CRM), which should encourage
investments in generation capacity to maintain the security of supply in Belgium. All
awarded capacity providers of the competitive auction receive financial compensation
for the availability of their generation capacity in the Belgian energy market.
Eneco is one of the largest utility companies in the Belgian electricity market for
consumers and provides clean energy through their wind and solar farms. However,
Eneco has no flexible generation capacity in Belgium, which makes the company more
sensitive to high electricity prices because of the abundant supply of solar and wind
energy. Electrical Energy Storage (EES) can reduce the risk of financial losses during high
electricity prices and can be seen as an additional income-generating asset next to
Eneco’s existing wind and solar assets in Belgium. Therefore, Eneco considers
participating in the Belgian capacity auction with EES capacity. As a result, this leads to
the following main research question:
What is the competitiveness of electrical energy storage in the future Belgian capacity
market?

5
The competitiveness of EES is assessed based on the constructed competitiveness
evaluation model. The model considers the long-term capacity remuneration, possible
costs related to the capacity market, storage costs, and revenue derived in the electricity
market. A capacity provider is considered as competitive if the expected costs are smaller
than the expected revenue from being in the capacity market. The net present value
(NPV) approach is chosen to investigate the economic competitiveness of EES. The
storage costs, intraday market income, payback obligation, and FCR income are modelled
for the photo years 2020, 2025 and 2030.
The most suitable storage technology for participating in the Belgian CRM auction, and
considered in this research, is Li-ion Battery Energy Storage (BES). This technology has
favourable characteristics such as short response time, high power and energy density,
high round-trip efficiency and low costs. Competing storage technologies are Large-scale
Pumped Hydroelectric Energy Storage (PHES) and Compressed Air Energy Storage
(CAES), however, both are not suitable in Belgium due to geographical restrictions.
The Battery Energy Storage System (BESS) will be deployed in the Frequency
Containment Reserve (FCR) market and intraday market because of the largest revenue
potential. FCR price is not expected to rise in the future and more likely to fall because of
the increase of flexible generation capacity and the further integration of European
ancillary service markets. Three FCR price scenarios are taken into consideration for
calculating the FCR income. The FCR price will be equal to today’s average FCR price
(€ 79.000/MW/year), the FCR price will be equal to the minimum FCR price scenario
observed since July 2019 (€ 51.000/MW/year) and the FCR price will be equal to the
halved today’s average FCR price (€ 39.000/MW/year). The expected intraday market
income is assessed by the software tool Linny-R which applies the optimization technique
linear programming based on the rolling horizon approach. The expected intraday
market income varies from € 16.000/MW/year in 2021 to € 19.000/MW/year from
2030.

6
BESS operating only in the intraday market is not expected to be competitive because of
the relatively high required capacity remuneration above € 100/kW/year. Auction
clearing prices in other European CRMs are below € 50/kW/year.
BES does not need capacity remuneration from 2025 onwards with today’s average FCR
price. However, it is not very likely that the FCR price stays the same in the future, as
described above. More realistic is 35% capacity price reduction from the average FCR
price scenario of € 79.000/MW/year to the minimum FCR price scenario of
€ 51.000 /MW/year. BES might be competitive in this scenario with a relatively high de-
rating factor and no payback obligation of the CRM. In the halved today’s average FCR
price scenario, BES will not be competitive in 2025 given the relatively high required
capacity remuneration of minimum capacity remuneration of at least € 69/kW/year. BES
might be competitive in 2030 with the halved today’s average FCR price since the
required capacity remuneration is at least € 21/kW/year. However, the capacity market
might be already saturated with capacity providers bidding near zero in the auctions.
Decisive parameters for competitiveness are the reference price, strike price and the de-
rating factor.
The results of this research are not convincing to regard BES as a competitive technology
in the upcoming Belgium capacity market. Revenue stacking by combining the FCR and
intraday market income would increase the competitiveness of BES and is necessary.
Further research should focus on deployment strategies of BESS in different markets and
FCR price developments.

7
Contents
Acknowledgements 3
Executive Summary 4
Contents 7
List of Figures 11
List of Tables 13
1. Introduction 15
1.1 Problem statement 15
1.2 Research objective 17
1.3 Outline 18
2. Literature review 19
2.1 Capacity Remuneration Mechanism 19
2.2 Central buyer mechanism based on reliability options 22
2.2.1 Reliability options mechanisms in Europe 22
2.3 Electrical Energy Storage (EES) 23
2.3.1 Presence of EES on European capacity markets 24
2.4 Competitiveness 26
2.5 Knowledge gap 27
3. Research questions and approach 30
3.1 Research questions 30
3.2 Research approach 31
3.3 Methods 33
3.3.1 Net Present Value 33
3.3.2 Linny-R 34
4. System description 36
4.1 Characteristics of the Belgian CRM 36
4.1.1 Description 37
4.1.1.1 Market reference price and strike price 38
4.1.1.2 Availability requirements and availability penalties 41
4.1.1.3 Clearing algorithm 42
4.1.1.4 Demand curve and price caps 43
4.1.1.5 T-1 reserved volume 43

8
4.1.1.6 Minimum participation threshold 43
4.1.1.7 De-rating factors 44
4.1.1.8 Investment levels 46
4.1.2 Conclusions 47
4.2 Appropriate EES technologies 48
4.2.1. Common BES projects 50
4.3 Opportunities in the electricity markets 51
4.3.1 Wholesale electricity market 51
4.3.1.1 Description 51
4.3.1.2 Analysis 53
4.3.2 Ancillary services 54
4.3.2.1 Description 54
4.3.2.1.1 Frequency Containment Reserve 56
4.3.2.1.2 Automatic Frequency Restoration Reserve 57
4.3.2.1.3 Manual Frequency Restoration Reserves 57
4.3.2.2 Analysis 58
4.4 Price developments 61
4.4.1 Intraday market 61
4.4.1.1 Relation between day-ahead and intraday market price 62
4.4.2 FCR 64
5. Model description 65
5.1 Conceptual model 65
5.2 BESS setup 66
5.2.1 Dimensioning 66
5.2.1.1 Intraday market 66
5.2.1.2 FCR market 67
5.2.1 Costs and technical parameters 68
5.3 Intraday market income modelling 69
5.3.1 Description 69
5.3.1.1 Roll and look-ahead period 70
5.4 FCR income modelling 71
5.4.1 Charging costs 73
5.5 CRM contract length 74
9
5.6 Scenarios 77
5.6.1 CRM design scenarios 77
5.6.2 Intraday market price scenarios 78
5.6.2.1 Payback obligation 79
5.6.3 FCR price scenarios 80
5.7 Experiment design 81
6 Verification and validation 83
6.1 Verification 83
6.2 Input validation 85
6.3 Model validation 86
7. Results 87
7.2 Competitiveness in the intraday market 88
7.2.1 Doubling the depth of storage 89
7.2.2 Conclusions 90
7.3 Competitiveness in the FCR market 91
7.3.1 Average FCR price scenario 91
7.3.2 Minimum FCR price scenario 92
7.3.3 50% Average FCR price scenario 93
7.3.4 Revenue stacking of FCR and intraday market income 94
7.4 Conclusions 95
8 Discussion 96
8.1 Results 96
8.1.1 Intraday market income 96
8.1.2 Payback obligation 97
8.1.3 FCR income 98
8.2 Limitations 99
8.2.1 Data 99
8.2.2 Method 99
8.2.2.1 Net Present Value 99
8.2.2.2 Linny-R 100
8.2.3 Model and analysis 100
8.3 De-rating factor methodology 101
8.3.1 Belgian methodology 101

10
8.3.2 BES operation strategies 103
8.3.3 UK methodology 105
8.3.4 Conclusions 106
9 Conclusions 107
9.1 Answers to the sub-questions 107
9.2 Answer to the main research question 110
9.3 Policy recommendations 111
9.4 Recommendations for further research 112
10 Reflection 113
10.1 Scientific relevance 113
10.2 Societal relevance 114
10.3 Link to the EPA programme 114
11 References 115
12. Appendices 133
12.1 Full cycle definition 133
12.2 Intraday market 134
12.2.1 Input prices 134
12.2.2 Income build year 2020 135
12.2.3 Income build year 2025 135
12.2.4 Income build year 2030 136
12.3 FCR market 137
12.3.1 Cycles and energy delivery on FCR market 137
12.3.2 Price scenarios 140

11
List of Figures
Figure 1. Price duration curve of the EPEX SPOT day-ahead market price 2013-2018
(Elyxis, 2019). ................................................................................................................................................ 19
Figure 2. Taxonomy of the capacity mechanism models (European Commission, 2015).
............................................................................................................................................................................. 21
Figure 3. Rolling horizon approach (Lu, Ying, & Chen, 2016). ................................................... 35
Figure 4. Belgian CRM timeline until the first capacity auction (Elia, 2019i)....................... 36
Figure 5. Application of reliability options (Vázquez, Rivier, & Pérez-Arriaga, 2002). .... 38
Figure 6. Price development of Li-ion battery pack price outlook till 2030
(BloombergNEF, 2019a). .......................................................................................................................... 49
Figure 7. Sorted (high-low) difference in Belgian intraday and day-ahead prices of
consecutive hours for a half year between December 4, 2018, and June 4, 2019. (Eneco,
personal information, June 26, 2019). ................................................................................................. 53
Figure 8. Sorted (high-low) difference in Belgian intraday and day-ahead prices of
consecutive hours for a half year between December 4, 2018, and June 4, 2019, < 100
hours. (Eneco, personal information, June 26, 2019). ................................................................... 53
Figure 9. Average day-ahead market price forecasts in Belgium 2020-2030 under
different CO2 and technologies. .............................................................................................................. 62
Figure 10. Hourly VWAP Belgium intraday and day-ahead market prices March 2019. . 62
Figure 11. Hourly VWAP Belgium intraday and day-ahead market prices (per month)
January 2014 - July 2019. .......................................................................................................................... 63
Figure 12. Competitiveness evaluation model. ................................................................................ 65
Figure 15. Linny-R model for calculating the intraday market income. ................................. 69
Figure 17. Marginal capacity price in Belgium on the regional platform between July 1,
2019 – September 29, 2019 (Regelleistung, n.d. -b). ..................................................................... 71
Figure 18. Continental Europe synchronous area frequency 3-3-2018 00:00 - 4-3-2018
0:00 (RTE, 2019). ......................................................................................................................................... 72
Figure 19. Intraday market income (2026) by operating different number of cycles. ..... 75
Figure 20. Aggregated intraday market income for different BES lifetime (years). .......... 76
Figure 16. Payback obligation in 2025 with strike price € 125/MWh. ................................... 79
Figure 21. Verification of Linny-R model of 2026. .......................................................................... 83
Figure 22. Required capacity remuneration, given the day-ahead market income in the
reference scenario and in the optimistic scenario (2020, 2025, 2030). ................................. 88
Figure 23. Breakdown of the EBIDTA for 2020, 2025 and 2030. .............................................. 90
Figure 24. Required capacity remuneration, given the average FCR price in the reference
and optimistic scenario (2020, 2025, 2030). .................................................................................... 91
Figure 25. Required capacity remuneration, given the minimum FCR price in the
reference and optimistic scenario (2020, 2025, 2030). ................................................................ 92
Figure 26. Required capacity remuneration given 50% of the average FCR price in the
reference and optimistic scenario (2020, 2025, 2030). ................................................................ 93
Figure 27. Combining intraday market and FCR incomes. .......................................................... 94

12
Figure 28. Process overview of the methodology for determining the de-rating factors of
the Belgian CRM (based on Elia, 2019e). ......................................................................................... 101
Figure 29. Alternative contributions of BES to shortage periods (Based on Dent, Wilson
Zachary, 2017). .......................................................................................................................................... 104
Figure 14. Cycling process (Thirugnanam, Saini., & Kumar, 2012). ..................................... 133

13
List of Tables
Table 1. Auction results of battery storage in Irish all-island and United Kingdom
(EirGrid., & SONI, 2018; EirGrid., & SONI, 2019a; EirGrid., & SONI, 2019b; National Grid,
2018a; National Grid, 2018b; National Grid, 2019)........................................................................ 24
Table 2. Current state of scientific knowledge on the relevant subjects for evaluating the
competitiveness of EES in the future Belgian capacity market. ................................................. 29
Table 3. Set of BESS constraints and description (Hu., Chen., & Bak-Jensen, 2010). ......... 34
Table 4. Elements determining the functioning of the CRM (Elia, 2019i). ............................ 37
Table 5. Possible outcomes reliability options (Vázquez, Rivier, & Pérez-Arriaga, 2002).
............................................................................................................................................................................. 39
Table 6: Mentioned strike prices in Italy and Irish all-island CRM (European
Commission, 2018; EirGrid, & SONI, 2019). ...................................................................................... 40
Table 7. SLA categories for energy-constrained capacity providers. Adapted from Elia
(2019k). ........................................................................................................................................................... 41
Table 8. United Kingdom and Irish all-island De-rating factors T-4 capacity auction
(deliver year 2022/23) and Poland de-rating factors capacity auction (delivery year
2021-2022, 2022-2023, 2023-2024) (Rozporządzenie Minstra Energii; 2018; EirGrid., &
SONI, 2019; National Grid, 2018c). ....................................................................................................... 45
Table 9. Investment levels of European CRMs (CREG, 2019). .................................................... 46
Table 10. Specification of the three EPEX SPOT Belgium market segments (EPEX SPOT,
n.d. -e). .............................................................................................................................................................. 52
Table 11. Overview of the (future) ancillary services (Elia, 2017a; Elia 2018d; Elia,
2019b). ............................................................................................................................................................. 55
Table 12. Technical characteristics ancillary services (Elia, 2017a; Elia, 2018a; Elia,
2019b; Elia, 2019c). .................................................................................................................................... 58
Table 13. Average price of selected bids for the ancillary services between January 2019
– week 31 August 2019 (Elia, n.d. –c). ................................................................................................. 60
Table 14. BESS setups taken initially into consideration. ............................................................ 67
Table 15. Li-ion BESS costs parameters and values (IRENA, 2017; Eneco, personal
information, May 21, 2019; Eneco, personal information, August 2, 2019; XE, 2019;
Statbel, 2019; KBC, 2018). ........................................................................................................................ 68
Table 16. Investment levels of European CRMs (CREG, 2019). ................................................. 74
Table 17. Reference scenario and experiments for calculating the required capacity
remuneration. ................................................................................................................................................ 77
Table 18. Average day-ahead market price 2018 predictions for 2020, 2023, 2025, 2028,
2030 including percentage change. ...................................................................................................... 78
Table 19. Payback obligation with strike price € 125/MWh (2021-2030). .......................... 79
Table 20. Year description of scenarios 2020, 2025 and 2030. ................................................. 81
Table 21. Experiments for BESS (10 MW/10 MWh) operating in the intraday market. .. 81
Table 22. Experiments for BESS (12,5 MW/10 MWh) operating in the FCR market. ....... 82

14
Table 23. Experiments for BESS (12,5 MW/10 MWh) operating in both the intraday and
FCR market. .................................................................................................................................................... 82
Table 24. Published (approximated) project costs by developers compared to IRENA’s
estimated storage costs (Infigen, 2018; Enel, 2019; Endesa, 2017; IRENA, 2017). ........... 85
Table 25. Income differences in the intraday market and the FCR market (2020, 2025,
2030). ................................................................................................................................................................ 95
Table 26. Deals on the EPEX intraday market 1-1-2018 02:00. ................................................ 96
Table 27. Influence of the payback obligation on the required capacity remuneration. . 97
15
1. Introduction
1.1 Problem statement
The worldwide energy consumption should drastically change the coming decennia to
avoid dangerous climate change. In 2015, 175 parties signed the Paris Agreement to keep
the global temperature rise this century below 2 degrees Celsius, aiming for 1,5 degrees
Celsius (UNFCCC, 2015). In the same year, all the United Nations Member States adopted
the Sustainable Development Goals to provide affordable and clean energy for everyone
by 2030 (United Nations, 2015). Every country in the world faces the major challenge of
reducing greenhouse gas emissions.
Renewable energy sources, such as wind and solar energy, offer great opportunities to
make the energy supply more sustainable. However, the energy production of these
sources strongly depends on weather conditions. Besides, the energy consumption varies
per part of the day but also per season. The difference between the supply profile and the
energy demand is considered as a major challenge for governments, utility companies,
and transmission system operators (TSOs). Energy storage is considered as one of the
major components of the solution to deal with the variable nature of wind and solar
energy. By way of illustration, the world demand for battery storage is estimated to reach
2800 gigawatt-hours (GWh) in 2040 – corresponding to storing around half of 2019’s
global renewable energy production in a day (World Bank, 2019).
The transition to a low-carbon society with higher penetration levels of variable
renewables is not the only challenge for Belgium. On January 31, 2003, the Belgian
parliament approved the bill for the nuclear power phase-out, implying shutting down all
seven nuclear power plants. No new nuclear power plants will be built for industrial
electricity production (Belgisch Staatsblad, 2003). In the end, no electricity is generated
from nuclear energy in 2025. Belgium significantly depends on nuclear energy, as nuclear
power plants produce more than half of Belgium’s total electricity production in 2017.
Nuclear represented 34% of Belgium’s electricity production in 2018 because of
unavailability of nuclear multiple power plants, which led to a greater import of
electricity from abroad (Elia, 2019a).
16
The Belgian minister of Energy has commissioned the Belgian TSO Elia to investigate the
urgency of adequacy and flexible electricity sources to ensure the security of supply in
the period 2017-2027. Elia cannot guarantee that the current energy-only market,
combined with a strategic reserve mechanism, can ensure sufficient investments in
generation capacity to maintain the security of supply in Belgium (Elia, 2016a). The
proposed measure is a Capacity Remuneration Mechanism (CRM) based on reliability
options and should succeed the strategic reserve mechanism (Belgische Kamer van
volksvertegenwoordigers, 2019a).
The objective of the prospective Belgian CRM is to ensure a certain level of security of
supply at the lowest possible cost. Capacity providers are remunerated in auctions for
the availability of their capacity per megawatt (MW) in the energy market (Belgische
Kamer van volksvertegenwoordigers, 2019a). On April 4, 2019, the Belgian federal
parliament approved the bill for the adaption of the Belgian electricity act that allows the
introduction of a CRM to encourage investments in capacity (Belgische Kamer van
volksvertegenwoordigers, 2019a). According to Elia’s recent adequacy and flexibility
study, the new capacity required is 3,9 GW from 2025 to guarantee the security of supply
after a full nuclear power phase-out. The assumption takes into account the limited
options during the winter months because of planned coal exits of neighbouring countries
and in particular Germany (Elia, 2019d). There will be one auction four years ahead of
each delivery year and one auction a year ahead of each delivery year securing the
capacity required (Belgische Kamer van volksvertegenwoordigers, 2019a). The first
auction should take place in October 2021 to ensure sufficient capacity from November
2025 (Elia, 2019d).
The capacity auctions do not exclude any form of capacity because of the technological
neutrality requirement imposed by the European Commission. Each capacity provider
who can contribute to the security of supply can participate in the auction. Possible
candidates are power plants, demand response, storage, and renewable sources
(Belgische Kamer van volksvertegenwoordigers, 2019b). In the light of the world’s
energy transition to a sustainable energy future is whether storage is competitive with
(existing) conventional plants in the Belgian capacity auction.

17
1.2 Research objective
Eneco is one of the largest utility companies in the Belgian electricity market for
consumers (VREG, 2019). In 2019, Eneco has a substantial generation capacity of on- and
offshore wind energy and solar energy (resp. 436 MW, 178 MW, 78 MW) in Belgium but
no flexible capacity (Eneco, n.d. –a, Eneco, n.d. –b, Eneco, n.d. –c). This implies Eneco is
more sensitive to high electricity prices when the sun does not shine, and the wind does
not blow (Eneco, personal communication, April 25, 2019). Electrical Energy Storage
(EES) can reduce the risk of financial losses during high electricity prices and aligns
Eneco’s mission (‘everyone’s sustainable energy’) better than conventional power plants
(Eneco, 2019). Also, EES can be seen as an additional income-generating asset next to
Eneco’s existing wind and solar assets in Belgium. Therefore, Eneco considers
participating in the Belgian capacity auction with EES capacity.
The research objective is to evaluate the competitiveness of EES installed by Eneco in the
future Belgian capacity market. The long-term capacity remuneration, possible costs
related to the capacity market, storage costs, and revenue derived in the electricity
market are integrated into one analysis.

18
1.3 Outline
This research is structured as follows:
● Chapter 2 includes the literature review. The literature review explains the
scientific problem regarding EES in the future Belgian capacity market. This
section discusses the core concepts and the formulation of the academic
knowledge gap;
● Chapter 3 involves the main research question, sub-questions and the research
approach including the methods used;
● Chapter 4 entails the system description, discusses the characteristics of the
Belgian CRM and explorers appropriate EES technologies. Subsequently, the
chapter discovers opportunities in the Belgian electricity market and discusses
price developments in the electricity market;
● Chapter 5 includes the model description including the conceptual model, BESS
dimensiong, intraday market and FCR income modelling and the scenarios;
● Chapter 6 discusses verification and validation;
● Chapter 7 presents the results including the required capacity remuneration;
● Chapter 8 discusses the results and the limitations of this research;
● Chapter 9 presents the conclusions, policy recommendations and
recommendations for further research;
● Chapter 10 entails the reflection on the scientific relevance, societal relevance and
the link to the EPA programme;
● Chapter 11 includes the references;
● Chapter 12 involves the appendices;

19
2. Literature review
The core concepts of the research will be discussed and defined in this chapter.
Eventually, the knowledge gap in existing research will be addressed.
2.1 Capacity Remuneration Mechanism
The ideal situation would be to have an electricity market which ensures the security of
supply for the lowest consumer prices. Generation capacity investments might lead to
more competitive market results and maintain the reliability of the electrical grid.
However, power generation companies have to deal with demand uncertainty and
competition. Besides, investments are to a large extent sunk costs, and generators have
to make the investment decision at the right time (Genc, 2012). The investment in
generation capacity is profitable if the expected revenue during production hours are at
least equal to the investment costs (Mulder, 2017). The revenue of peak generation assets
significantly depends on the frequency, height, and duration of price spikes (De Vries,
2007). Figure 1 shows the price duration curve of the hourly day-ahead market price on
the Belgian EPEX SPOT exchange between 2013-2018 (Elyxis, 2019).
Figure 1. Price duration curve of the EPEX SPOT day-ahead market price 2013-2018 (Elyxis, 2019).
0
100
200
300
400
500
600
700
Be
lgia
n d
ay
-ah
ae
d m
ark
et
pri
ce [
€/
MW
h]
Duration [% of the time]

20
According to the underlying day-ahead market prices of the price duration curve, the
price rises only about 3% of the time above 100 euros per megawatt-hour (MWh). Small
differences in the occurrence of price spikes greatly affect the steepness of the price
duration curve and thus the expected profitability of generation capacity investments (De
Vries, 2007). Peak plants should recover their investment costs from these price spikes
(Cepeda & Finon, 2011). However, peak prices are subject to the political debate because
the introduction of price caps should protect consumers from prices higher than their
value of lost load (de Vries, Correljé, & Knops, 2017). The situation where the revenue
from the energy markets is insufficient for a generation asset to cover its capital and
operating expenses is called the ‘missing money’ problem (Newbery, 2016).
If the market provides insufficient generation capacity to meet the demand without
government intervention, the solution involves the introduction of additional
mechanisms to ensure the security of supply (Batlle & Pérez-Arriaga, 2008). This
situation applies to Belgium, where the energy-only market cannot provide proper
investments incentives to ensure the security of supply after 2025 (Elia, 2019d). The
European Directive 2003/54/EC has been implemented which provide designations for
transmission and distribution system operators for direct interventions in the electricity
market (Finon & Pignon, 2008). This development brings the introduction of capacity
(remuneration) mechanisms (CRM) into the spotlight. The objective of all capacity
mechanisms is to introduce incentives for utility companies to provide sufficient
generation capacity, even in the situation of imperfect information or concerns regarding
risk. Besides, it should stimulate to maximise utility companies’ generation output during
shortages in the electricity market (de Vries, Correljé, & Knops, 2017). Capacity
mechanisms differ from one another in structure and implementation. All mechanisms
each have their effects in the electricity market, and each country’s implementation is
unique (Meulman & Méray, 2012).

21
The capacity mechanisms can be divided into five types according to the European
Commission (2015). The first classification is based on whether the mechanism is
volume-based or price-based. Price-based means the TSO sets the price, and the volume
depends on the willingness of investors. The opposite of price-based is volume-based
where the TSO sets the volume, and market forces determine the price. Market-wide
capacity mechanisms reward all forms of capacity, whereas targeted capacity
mechanisms only reward a subset (Hancher, de Hauteclocque, & Sadowska, 2015). The
volume-based capacity mechanisms can be divided into the following subgroups;
targeted and market-wide. All five types of capacity mechanisms are presented in Figure
2. The type of capacity remuneration mechanism in the Belgian bill, and therefore
relevant in this research, is the (market-wide) central buyer capacity mechanism based
on reliability options, which is the red block in the figure below. The mechanism will be
explained in 2.2.
Figure 2. Taxonomy of the capacity mechanism models (European Commission, 2015).
22
2.2 Central buyer mechanism based on reliability options
Reliability contracts should provide capacity providers with better incentives for being
active in the energy market during scarcity (De Vries, 2007). The central buyer
mechanism based on reliability options has been first introduced by Pérez-Arriaga
(1999) and further elaborated by Vázquez, Rivier, & Pérez-Arriaga (2002). It is often
called in literature reliability contracts, reliability options mechanism and energy call
options auction (Bidwell, 2005; Vázquez, Rivier, & Pérez-Arriaga, 2002; De Vries, 2007;
Vázquez, Batlle, Rivier, & Pérez-Arriaga, 2003; Bezerra et al., 2006; Bezerra, Barroso, &
Pereira, 2011).
The regulatory authority of the energy market, e.g., the TSO, prescribes the market to
purchase reliability contracts, which represents the desired volume of capacity. The
reliability contracts are procured in a competitive auction and are composed of a financial
call option and a penalty for non-delivery of the auction item. The capacity providers
receive a fixed remuneration for the awarded capacity in the auction. The call option of
reliability contract entails that the contracted capacity provider should pay the positive
difference between a reference price, e.g., electricity market price, and a predetermined
strike price during the contracted period in return (often called the ‘payback obligation’).
Capacity providers are penalized if they do not meet the delivery obligation. An elaborate
explanation of the Belgian reliability options mechanism will be discussed in 4.1.
2.2.1 Reliability options mechanisms in Europe
Reliability options schemes have been approved by the European Commission in the
United Kingdom (only Northern Ireland), Ireland and Italy in 2017 and 2018 (European
Commission, n.d.). The electricity market on the island of Ireland, which refers to the
Republic of Ireland and Northern Ireland, is managed and regulated collectively by the
TSOs of the Republic of Ireland (‘EirGrid’) and Northern Ireland (‘SONI’) (European
Commission, 2017a). The jointly CRM of Ireland and Northern Ireland1 is hereafter
referred to as Irish all-island CRM.
1The Irish all-island electricity market operates as a single market under the same market wholesale electricity market arrangement Integrated Single Electricity Market (I-SEM) and capacity is reimbursed through one CRM.

23
2.3 Electrical Energy Storage (EES)
Electrical Energy Storage (EES) refers to the process of transforming electrical energy
from the electricity distribution network into any form allowing temporary storage and
transforming back to electrical energy when needed. The process makes it possible to
store electricity during periods of low demand and supplying energy to the grid during
periods of high demand or shortages (Chen, Cong, Yang, Tan, & Ding, 2009).
The characteristics of EES differ from conventional and non-conventional power plants,
such as gas-fired generation assets and wind turbines. A major feature of EES is the short
response time compared to non-conventional and conventional power plants. As an
example, the response times of gas generation assets are between 4-45 minutes in hot
starts (4-250 minutes in cold starts) and the response times of coal generation assets are
between 100-300 minutes in hot starts (450-900 minutes in cold starts) (Gonzalez-
Salazar, Kirsten, & Prchlik, 2018). In contrast, the response time of chemical storage, such
as Li-ion batteries, is a few milliseconds (Evans, Strezov, & Evans, 2012). The short
response time makes EES suitable for applications which require this feature, such as
ancillary services.
EES technologies differ primarily in efficiency, response time, lifetime, energy and power
capacity, and discharge time (Poullikkas, 2013). The storage characteristics of new
installations improve over time as research on material science continues, and capital
costs are coming down (Dvorkin et al., 2017).
The most common EES application in the world is (electric) energy time-shifting and
accounts for 85% of the total EES applications (US DOE, 2017). Energy time-shifting
involves buying and storing of (electric) energy when demand and energy prices are low
and selling and releasing the energy when demand and energy prices are high (Energy
Storage Association, n.d.-a). The objective is to find the most economically favourable
buying and selling moments. Other applications are electric supply capacity (4%), black
start (4%) and renewables capacity firming (3%) (US DOE, 2017).

24
2.3.1 Presence of EES on European capacity markets
Reliability options schemes are approved by the European Commission for the Irish all-
island CRM and Italian CRM, as mentioned in 2.2.1. EES has not been successful in the
Irish-island T-1 auctions (auction one year ahead the deliver year) in December 2017 and
2018, but has been successful in the T-4 auction (auction four years ahead the delivery
year) in May 2019 (EirGrid., & SONI, 2018; EirGrid., & SONI, 2019a; EirGrid., & SONI,
2019b). The auction clearing price, the awarded de-rated battery capacity2 in the CRM
auction and the share of battery capacity of the total de-rated capacity for the Irish all-
island capacity auctions are presented in Table 1. According to the Italian authority, the
first capacity auction should take place before end of 2019, so there are no results yet
(Terna 2019; Askanews, 2019).
CRM Type Date Deliver year Auction
clearing price
[€/kW/year]
Awarded de-
rated battery
capacity [MW]
Share of total
de-rated
capacity [%] Irish all-
island T-4 May. 2019 2022/23 46,15 81 1,1 T-1 Dec. 2018 2019/20 40,65 0 0 T-1 Dec. 2018 2018/19 41,80 0 0
United
Kingdom T-1 Jun. 2019 2019/20 0,87 (£ 0,77) 23 0,6 T-4 Feb. 2018 2021/22 9,52 (£ 8,40) 158 0,3 T-1 Feb. 2018 2018/19 6,80 (£ 6,00) 113 1,9
Table 1. Auction results of battery storage in Irish all-island and United Kingdom (EirGrid., & SONI, 2018; EirGrid., & SONI, 2019a; EirGrid., & SONI, 2019b; National Grid, 2018a; National Grid, 2018b; National Grid, 2019).
2 The de-rated capacity awarded in the CRM auction, which is the contributing to generation adequacy, is equal to the awarded nominal capacity times the relevant de-rating factor for the capacity provider (see 4.1.1.7).

25
The CRM in the United Kingdom differs from the upcoming Belgian CRM and existing Irish
all-island and Italian CRM because it not based on reliability options, which implies
United Kingdom’s CRM does not include the payback obligation for capacity providers.
However, a lot of battery storage participate in United Kingdom’s capacity auctions and
therefore relevant to take into account. Battery storage projects have broken through in
the United Kingdom and awarded since the T-4 capacity auction for 2021-2022 in
December 2016 (National Grid, 2016). Full details of awarded battery capacity for
T-1 auction on June 2019, T-4 auction and T-1 auction in February 2018 are presented in
Table 1.
Remarkable is the significant difference in auction clearing price between the Irish all-
island and United Kingdom’s capacity auctions, and especially the latest T-1 auction in
the United Kingdom with a clearing price near zero. This can be explained by the fact that
T-1 auction is a ‘top-up’ auction of the main T-4 auction to meet the additional capacity
demand of that particular deliver year. Therefore, less capacity is procured in the T-1
auction compared to the T-4 auction of the delivery year 2019-2020, respectively 3,7 GW
versus 46 GW (National Grid, 2015; National Grid, 2019). The clearing price near zero can
be explained by the large supply of (cheap) capacity. 9,4 GW entered the latest T-1
capacity auction, including 198 MW of battery storage, and only 38% was awarded. One
new battery project and five existing battery projects are awarded, which in total
accounted for only 0,6% of the total capacity. The big winners in this specific auction are,
mostly existing, Combined Cycle Gas Turbine (CCGT), Open Cycle Gas Turbine (OCGT) and
Combined Heat and Power (CHP) which accounts in total over 40% of the awarded
capacity. The supply curve of the auction clearly shows a lot of capacity providers are
willing to bid close to zero (National Grid, 2019). The example of the United Kingdom
underlines the fierce competition in the capacity auction between technologies and new
and existing assets.
26
2.4 Competitiveness
The conceptual term competitiveness has multiple meanings and depends upon context.
Here, it is in the context of the economic feasibility of EES participating in the future
central buyer mechanism based on reliability options in Belgium.
In theory, any capacity provider can be successful by bidding € 0/kW/year in the capacity
auction, assuming that he meets all conditions of the CRM. However, an economically
rational capacity provider would participate in the CRM if his expected costs are smaller
than his expected revenue from being active in the capacity market. From the perspective
of this research, the costs consist of the storage costs and possible costs arising from
participating in the CRM, i.e., payback obligations and penalties. The expected revenue
consists of the revenue derived in the electricity market and the capacity remuneration.
Thus, the competitiveness of EES in the future Belgian capacity market can be expressed
by the following inequality:
𝐶𝑠𝑡𝑜𝑟𝑎𝑔𝑒 + 𝐶𝑐𝑟𝑚 < 𝑅𝑚𝑎𝑟𝑘𝑒𝑡 + 𝑅𝑐𝑟𝑚
As mentioned in 2.2, the missing money problem occurs if the revenue from the energy
markets is insufficient for a generation unit to cover its capital expenses and operating
expenses. Given the occurrence of the ‘missing money’ problem, the inequality above
implies the capacity remuneration 𝑅𝑐𝑟𝑚 a capacity provider requires should be greater
than the missing money (i.e., the revenue derived in the electricity market minus the
storage costs 𝐶𝑠𝑡𝑜𝑟𝑎𝑔𝑒 and the possible costs arising from participating in the mechanism
𝐶𝑐𝑟𝑚.) Otherwise, there’s no economic incentive to participate in the market. This
inequality is expressed by the equation below:
𝐶𝑠𝑡𝑜𝑟𝑎𝑔𝑒 + 𝐶𝑐𝑟𝑚 − 𝑅𝑚𝑎𝑟𝑘𝑒𝑡 < 𝑅𝑐𝑟𝑚
The four cost and revenue components will be defined in the system description.
27
2.5 Knowledge gap
As mentioned in 2.2, much is known about capacity remuneration mechanisms in general
and in particular the central buyer mechanism based on reliability options. However, no
scientific research has been conducted on the performance of EES on a capacity market.
Over the past several years, a lot of research has been done on the role of utility-scale EES
and identifying suitable technologies, given the increasing presence of Renewable Energy
Sources (RES) (Ferreira, Garde, Fulli, Kling, & Lopes, 2013; Soloveichik, 2011; Dunn,
Kamath & Tarascon, 2011; Ibrahim, Ilinca, & Perron, 2008; Divya, & Østergaard, 2009).
The literature review showed that the most appropriate choice for an EES technology
highly depends on the application. It is nearly impossible to give one simple,
straightforward answer. Research has demonstrated that EES could contribute to the
security of supply by, for example, lowering peak demand (Zhou, Mancarella, & Mutale,
2015). Methodologies have been introduced to quantify the contribution of an EES unit
to the security of supply and estimate its capacity value, i.e., the quantification of the EES
unit’s effect on the system reliability (Zhou, Mancarella, & Mutale, 2015; Sioshansi,
Madaeni, & Denholm, 2013; Konstantelos, & Strbac, 2018; Evans, Tindemans, & Angeli,
2019). However, scientific research lacks on the contribution of EES in capacity auctions
and related market-specific rules.
The Belgian Commission for Electricity and Gas Regulation (CREG) and the Belgian
federal government service FOD Economy carried out the most recent research of the
possibilities of EES on specifically the Belgian electricity market in 2015 (CREG, 2015;
FOD Economie, 2015). At that time, Pumped Hydroelectric Energy Storage (PHES) had
the highest maturity in the study by FOD economy because of its high efficiency and high
energy density, which makes it suitable for balancing energy supply and demand across
the electric grid. Both studies explicitly mentioned that technology costs of storage could
fall substantially in the coming years due to technological advances and economies of
scale. Therefore, the results should be interpreted with caution because the findings are
based on technology cost data from more than five years ago and are a poor indication of
the economic feasibility of EES.

28
Two papers by Bezerra et al. (2006) and Bezerra, Barroso, & Pereira (2011) describe
bidding strategies for capacity providers participating in Brazilian reliability options. The
research focusses on calculating the optimal strike price bid, and option premium bid to
maximise the capacity provider’s revenue, given a desired risk-adjusted rate of return.
However, the described stochastic optimisation in the papers is less accurate for the
European central buyer mechanism based on reliability options. First, the Brazilian
reliability options mechanism differs from the European reliability options mechanism
because both the premium fee and the strike price should be proposed by the capacity
providers in the Brazilian auction. Second, the expected market revenue is calculated
using Monte Carlo simulation for different hydrological scenarios (Bezerra, Barroso, &
Pereira, 2011). The Brazilian power system is hydro-based, so the hydrological
conditions influence the market reference price (Bezerra et al., 2006). However, they are
less relevant in Europe since the European power system is not hydro-based. Besides, the
calculation in the research for the expected premium fee per year assumes that a fraction
of the hours per year the market reference price exceeds the strike price (Bezerra et al.,
2006; Bezerra, Barroso, & Pereira, 2011). Estimates can be made more accurate by
calculating the payback obligation based on market reference price forecasts.
Last, the variable market revenue (or losses) are calculated by subtracting the
operational costs from the strike price (Bezerra et al., 2006; Bezerra, Barroso, & Pereira,
2011). This implies the strike price is the highest price the capacity provider can receive
in the market. This does not have to be true since it might be possible the market
reference price is not related to the market where the capacity provider is active. For
example, the market reference price could be the day-ahead market price, and the
capacity provider receives revenue from ancillary services. The ancillary service market
prices are relatively higher compared to day-ahead market prices (Regelleistung, n.d -a.;
EPEX SPOT, n.d. -a). This means the capacity provider can earn more than the strike price
imposed by the TSO if the reference price is based on the day-ahead market price.

29
Based on outdated costs of EES technologies, lack of specific focus on the European
reliability options mechanism and the role of storage, no conclusion can be drawn as to
whether EES is competitive in the future Belgian capacity market. The findings of this
study for Belgium could help capacity providers in different countries whether they
should participate in an auction of a central buyer mechanism based on reliability
options.
Table 2 presents the current state of scientific knowledge on the relevant subjects for
evaluating the competitiveness of EES in the future Belgian capacity market.
Subject Scientific knowledge
None - little – sufficient – much
References
Central buyer mechanism based
on reliability options
Sufficient Bidwell (2005), Vázquez, Rivier, &
Pérez-Arriaga (2002), De Vries (2007),
Vázquez, Batlle, Rivier, & Pérez-
Arriaga (2003), Bezerra et al. (2006),
Bezerra, Barroso, & Pereira (2011)
Role of EES and increasing
(intermittent) RES capacity
Much Ferreira, Garde, Full, Kling, & Lopes
(2013), Soloveichik, (2011), Dunn,
Kamath, & Tarascon, (2011), Ibrahim,
Ilinca, & Perron (2008), Divya, &
Østergaard (2009)
Contribution of EES to the
security of supply
Sufficient Zhou, Mancarella, & Mutale (2015), Konstantelos, & Strbac (2018), Evans,
Tindemans, & Angeli (2019),
Sioshansi, Madaeni, & Denholm,
(2013)
Competitiveness (in central
buyer mechanism based on
reliability options)
Little Vázquez, Rivier, & Pérez-Arriaga
(2002) Bezerra et al., (2006), Bezerra,
Barroso, & Pereira (2011)
Market rules for EES
participating in capacity
auctions
None
Table 2. Current state of scientific knowledge on the relevant subjects for evaluating the competitiveness of EES in the
future Belgian capacity market.

30
3. Research questions and approach
3.1 Research questions
Based on the identified knowledge gap and research objective, the main research
question of the research can be formulated as follows:
What is the competitiveness of electrical energy storage in the future Belgian
capacity market?
And the following sub-questions need to be answered to answer the main research
question:
1. What are the characteristics of the Belgian Capacity Remuneration Mechanism?
2. Which EES technologies fit the characteristics of the Belgian capacity market best?
3. What is the revenue derived from the wholesale electricity market and the
potential payback obligation of the capacity remuneration mechanism?
4. What is the revenue derived from ancillary services?
5. What is the remuneration required for EES in Belgian capacity remuneration
mechanism auction?

31
3.2 Research approach
The research objective is to evaluate the competitiveness of EES in the future Belgian
capacity market by providing a systemic view of the problem. The first two sub-questions
of this study are qualitative in nature, and the last three sub-questions are quantitative in
nature. The relevant methodology to fulfil the objective of this study and answer the
research questions is mixed methods research. Mixed methods refer to the integration, or
‘mixing’ of both qualitative and quantitative data in one study. The idea behind the
methodology is that the combination of qualitative and quantitative approach leads to a
better understanding of the research problem than only one of the two approaches is
applied (Creswell, 2014). The relevant research approaches and research methods used
in this study will be discussed per sub-question.
What are the characteristics of the Belgian Capacity Remuneration Mechanism?
The question results in an overview of the Belgian CRM characteristics. The
characteristics will be identified through literature review and desk research. Literature
can help to understand the general functioning of CRMs. Desk research includes research
reports, consultation documents, and Belgian and European laws and legislations from
actors such as the CREG, Elia, the Belgian government and the European Commission.
Which EES technologies fit the characteristics of the Belgian capacity market best?
The most suitable EES technology in the future Belgian capacity market, and taken into
consideration in this research will be treated with the above question. Literature review
and desk research are suitable methods for identifying appropriate EES technologies in
the Belgian capacity market. Literature is relevant for comparing the characteristics of
the different EES technologies. Desk research includes studies on storage costs of energy
research agencies and reports on the suitability of specific technologies in Belgium.

32
What is the revenue derived from the wholesale electricity market and the
potential payback obligation of the capacity remuneration mechanism?
First, the wholesale electricity market with the greatest economic potential for the
considered EES technology from the previous sub-question will be determined.
Subsequently, the potential revenue and payback obligation are calculated under
different CRM design and price scenarios. The relevant research methods are desk
research for creating electricity market and payback obligation scenarios. The expected
intraday market income is assessed by the software tool Linny-R which applies the
optimization technique linear programming. Historical wholesale electricity market
prices obtained via Eneco will be used as input of the optimization model. The scenarios
will be further discussed in the 5.6 and Linny-R in 3.3.2.
What is the revenue derived from ancillary services?
Similar to the previous sub-question, the ancillary service with the greatest economic
potential for the considered EES technology will be determined. The potential revenue
will be calculated again under different CRM design and price scenarios. The appropriate
research method is desk research for creating ancillary service price scenarios, and Excel
will be used for analysing historical FCR prices and making relevant calculations.
Historical FCR prices are obtained from the ancillary services auction platform
Regelleistung.
What is the remuneration required for EES in Belgian capacity remuneration
mechanism auction?
Eventually, the required capacity remuneration will be calculated and based on the
revenue from the wholesale market or ancillary services, storage costs and the payback
obligation. The required capacity remuneration will be determined by Excel-based
financial modelling, using the Net Present Value (NPV), which will be further explained
in 3.3.1.

33
3.3 Methods
3.3.1 Net Present Value
Financial modelling is a meaningful methodology for decision-makers to offer business
solutions (Ho, & Lee, 2004). The financial modelling method Net Present Value (NPV) is
chosen to investigate the economic competitiveness of BES. The method is the most
commonly used for evaluating investments. The NPV is the sum of the cash inflows and
outflows discounted to the present values (Arnaboldi, Azzone, & Giorgino, 2014).
The formula of the NPV in this research is presented below. The income and costs are
calculated at each point in time 𝑡 over timespan 𝑁 and discounted at the discount rate 𝑟𝑟
(Belderbos, Delarue, & D'haeseleer, 2016). The cash flows taken into consideration in this
research include the earnings before interest, taxes, depreciation, and amortisation
(EBITDA) and the corporate tax. Thus, income revenue derived in the electricity market
𝑅𝑚𝑎𝑟𝑘𝑒𝑡, the capacity remuneration 𝑅𝑐𝑟𝑚, operations and maintenance (O&M) costs for
BES 𝐶𝑜&𝑚 and possible costs arising from participating in the CRM 𝐶𝑐𝑟𝑚. The capital
expenses (CAPEX) 𝐼0 are not discounted to today’s values in this research. The size of the
storage project in this research can be realized within a year. The total capital expenses
(CAPEX) of the EES system will be made at the beginning of the project (𝑡 = 0) and there
is no debt financing required. Therefore, CAPEX are not discounted (Arnaboldi, Azzone,
& Giorgino, 2014). A positive NPV will result in a net profit which means the investment
is acceptable. On the other hand, a negative NPV will result in a net loss, and the
investment should be rejected (Arnaboldi, Azzone, & Giorgino, 2014).
𝑁𝑃𝑉 = − 𝐼0 + ∑𝑅𝑚𝑎𝑟𝑘𝑒𝑡 + 𝑅𝑐𝑟𝑚 − 𝐶𝑜&𝑚 − 𝐶𝑐𝑟𝑚 − 𝐶𝑡𝑎𝑥
(1 + 𝑟𝑟)𝑡
𝑁
𝑡=1
The required capacity remuneration can be derived by complying with the condition that
the NPV should be greater than 0.

34
3.3.2 Linny-R
The expected wholesale market income is assessed by the software tool Linny-R which
applies the optimization technique linear programming. Linear programming involves
the minimising or maximising a linear objective function given certain equality and
equality constraints (Karloff, 2008). The program, developed by Dr. P.W.G. Bots,
determine the most appropriate operation schedule of BES in order to maximize profit
(Henriques, & Stikkelman, 2017). Thus, it calculates the optimal moments of buying and
selling electricity in the wholesale market. The objective function is shown below and is
subject to a set of constraints shown in Table 3.
max ∑ 𝑃𝑡 ∗ 𝐼𝐷𝑡
𝑇
𝑡=1
Constraints Description
𝑇 Planning horizon
𝑃𝑡>0 Charging power 𝑃 at hour 𝑡
𝑃𝑡<0 Discharging power 𝑃 at hour 𝑡
𝐸𝑡+1 = 𝐸𝑡 + η ∗ 𝑃𝑡 ∗ ℎ Energy capacity stored expressed for charging (𝑃𝑡>0) at hour 𝑡 and roundtrip
efficiency η
𝐸𝑡+1 = 𝐸𝑡 + 𝑃𝑡 ∗ ℎ Energy capacity stored expressed for discharging (𝑃𝑡<0) at hour 𝑡
𝐼𝐷𝑡 Wholesale market price at hour 𝑡
−𝑃𝑚𝑎𝑥 ≤ 𝑃𝑡 ≤ 𝑃𝑚𝑎𝑥 Charge-discharge power capacity at hour 𝑡 should be less than the maximum
power capacity of the BESS
0 ≤ 𝐸𝑡 ≤ 𝐸𝑚𝑎𝑥 Charge-discharge energy capacity at hour 𝑡 should be less than the maximum
energy capacity of the BESS
Table 3. Set of BESS constraints and description (Hu, Chen., & Bak-Jensen, 2010).
The optimisation of the charge-discharge decisions, and so the prediction of the
wholesale market income, in Linny-R is based on the rolling horizon approach (Bots,
2017). The approach uses currently known information and short-term forecasts which
has a higher level of reliability to solve the optimisation problem while retaining the
effectiveness of the calculation (Lu, Ying, & Chen, 2016). The rolling horizon approach is
commonly used for scheduling problems dealing with uncertainty such as inventory
control and traffic forecasts (Silvente, Kopanos, Dua, & Papageorgiou, 2018; Lu, Ying, &
Chen, 2016).

35
The rolling horizon approach is shown in Figure 3. The total planning horizon 𝑇 is split
up into 𝑁 stages where each stage 𝑛 contains 𝑚 intervals (where 𝑚 ≥ 1). Each stage 𝑛
consists of a roll period 𝑙, which represents reliable (short-term) forecasts and a look-
ahead period 𝑚 − 𝑙 which represents less reliable (medium-term) forecasts. The model
computes successive stages the roll period 𝑙 while taken into account the entire stage 𝑛.
Thereafter, the stage 𝑛 moves forward by 𝑙 time steps until stage 𝑛 + 1, both forecasts
will be updated and the procedure is done for all 𝑁 stages. It should be taken into
consideration that longer optimisation periods, and in particular longer the look-ahead
periods, which consists of medium-forecasts, decrease the reliability of the overall
prediction (Lu, Ying, & Chen, 2016).
Figure 3. Rolling horizon approach (Lu, Ying, & Chen, 2016).

36
4. System description
This chapter will first describe the characteristics of the Belgian CRM based on what is
known is so far. Thereafter the appropriate EES technologies on the Belgian capacity
market will be discussed. Lastly, the chapter describes the Belgian wholesale electricity
market and ancillary services and focusses on relevant market developments.
4.1 Characteristics of the Belgian CRM
The Belgian bill regarding the CRM has been adopted on April 4, 2019 (Belgische Kamer
van volksvertegenwoordigers, 2019a). The Belgian CRM should comply with the
European Union state aid rules, and the European Commission is expected to approve the
mechanism in June 2020. The prequalification period starts June 2021, and the first
auction (T-4) is planned in October 2021 to ensure sufficient capacity from November
2025 (Elia, 2019i; Elia, 2019d). Figure 4 presents the timeline until the first capacity
auction of the Belgian CRM. It can be concluded from the timeline that the final CRM
market rules and auction parameters will be published after writing this research.
Therefore, this section describes first the characteristics of the Belgian CRM from what is
known from the bill and reports from Elia meetings. It focusses on the most important
parameters within the scope of this research for determining the competitiveness of EES.
Subsequently, assumptions will be made for these parameters based on proposals from
CRM Task Force (stakeholder) meetings organized by Elia, CRM design notes and
parameters from European Commission approved CRMs in the United Kingdom, Ireland,
Italy and Poland (Elia, 2019h; European Commission, n.d.).
Figure 4. Belgian CRM timeline until the first capacity auction (Elia, 2019i).

37
4.1.1 Description
The capacity auction of the CRM is a competitive process in which capacity providers offer
a price for the provision of capacity. Capable capacity providers are existing and future
electricity generators, storage facilities, demand-side response and foreign capacity
(Belgische Kamer van volksvertegenwoordigers, 2019a). Two auctions will be organized
by Elia for each capacity delivery period: one auction four years ahead of each delivery
year (T-4 auction) and one auction a year ahead of each delivery year (T-1 auction). Elia
is responsible for the annual determination of the capacity required and the auction
parameters for the T-4 and the T-1 auctions, whereas the CREG monitors the CRM. The
volume report consists of the calculations of the total capacity required and the number
of hours during which the capacity will be used for the sake of adequacy to ensure the
security of supply. The parameter report includes the demand curve, price limit(s),
market reference price, strike price, and de-rating factors.
Table 4 provides an overview of the most important elements of the CRM that determines
the functioning. All the features will be described shortly.
Product design Auction design Economic parameters
demand curve
Volume assessment
Market reference price Clearing algorithm Demand curve (y-axis) Demand curve (x-axis)
Strike price Price/bid caps T-1 reserved volume
Availability requirements De-rating factors
Availability penalties Investment levels
Minimum participation
threshold
Table 4. Elements determining the functioning of the CRM (Elia, 2019i).

38
4.1.1.1 Market reference price and strike price
The CRM proposed in Belgium is based on reliability options. A reliability option is a call
option and refers to the contract that includes the obligation of the capacity provider to
pay the option buyer the positive difference between of the market reference price 𝑝 and
the strike price 𝑠 for the capacity sold under the contract. In return, the capacity provider
receives a fixed premium fee. The conditions mentioned above apply during the contract
period of the call option and are independent whether the capacity provider is trading
electricity in the spot market. The purchaser of the reliability option, which is the TSO
Elia, pays the market reference price 𝑝 and receive the difference between 𝑝 − 𝑠 if 𝑝 >
𝑠. This means if 𝑝 > 𝑠, the net payment is 𝑠 and the maximum price for the purchaser is
capped at the strike price 𝑠. The reliability option allows buying at 𝑝, but when 𝑠 > 𝑝
the purchaser will buy rationally at the market reference price 𝑝. Capacity providers limit
the highest possible price from 𝑝 to 𝑠 by selling reliability options. In other words,
capacity providers change their fluctuating revenue to a fixed revenue, and therefore
reducing their income risk. Choosing for reliability options might be interesting for
capacity providers dealing with fluctuating revenue, e.g., peak plants. As mentioned
above, the payback obligation when 𝑝 > 𝑠 is independent whether the capacity provider
is trading electricity on the spot market. If the capacity provider cannot deliver the
demand required while not trading on the energy market, the payback obligation with
the reliability option is (𝑝 − 𝑠) (Vázquez, Rivier, & Pérez-Arriaga, 2002).
Figure 5 shows the development of the market reference price (here spot price) over time
and the imposed strike price. 𝑠 > 𝑝 is true in 𝑡1 and 𝑡5, whereas 𝑝 > 𝑠 is true in 𝑡2, 𝑡3
and 𝑡4. 𝑡3 Illustrates the period where the capacity provider fails to deliver the contracted
capacity (Vázquez, Rivier, & Pérez-Arriaga, 2002).
Figure 5. Application of reliability options (Vázquez, Rivier, & Pérez-Arriaga, 2002).

39
The different outcomes of the reliability mechanism for the buyer of capacity and the
capacity provider are indicated in Table 5.
Time T1 T2 T3 T4 T5
Demand pays (€/MWh) 𝑝 𝑝 − (𝑝 − 𝑠) = 𝑠 𝑠 𝑠 𝑝 Capacity provider receives (€/MWh)
Excluding reliability option 𝑝 𝑝 𝑝 𝑝
Capacity provider receives (€/MWh)
Including reliability option 𝑝 𝑝 − (𝑝 − 𝑠) = 𝑠 −(𝑝 − 𝑠) − 𝑝𝑒𝑛 𝑠 𝑝
Table 5. Possible outcomes reliability options (Vázquez, Rivier, & Pérez-Arriaga, 2002).
Reliability options should limit windfall profits and increase the availability incentive
during moments of (imminent) scarcity. Imminent scarcity moments and moments when
the market reference price 𝑝 exceeds the strike price 𝑠 are highly correlated. This
provides an incentive for capacity providers to be active in the energy market during
moments of (imminent) scarcity (Elia, 2019f).
The equation below describes the payback obligation to the TSO if the market reference
price exceeds the strike price. The payback obligation is equal to the market reference
price minus the strike price (𝑝 − 𝑠) times the number of hours 𝑡 to which 𝑝 > 𝑠 is true.
(Vázquez, Rivier, & Pérez-Arriaga, 2002).
𝐶𝑐𝑟𝑚 = ∫ (𝑝 − 𝑠) ∗ 𝐶 𝑑𝑡𝑝>𝑠
(8)
𝐶𝑐𝑟𝑚 Costs arising from participating in the CRM [€/𝑦𝑒𝑎𝑟];
𝑝 Market reference price [€/𝑀𝑊ℎ];
𝑠 Strike price [€/𝑀𝑊ℎ];
𝐶 Obligated capacity, i.e., installed capacity times the corresponding de-rating factor [𝑀𝑊].
40
According to Elia’s proposal for the Belgian CRM, the market reference price ‘represents
a continuous and relevant energy (spot) price signal (€/MWh) of the Belgian power
market revenue, and capturing moments relevant for the security of supply’ (Elia, 2019f,
p. 4). The Belgian day-ahead market price has been proposed as the market reference
price because of its liquidity. The price signal is closely related to the (near) scarcity
moments, and all technologies can react to the price. No alternatives have been proposed
during the CRM Task Force stakeholder meetings organised by Elia. Therefore, the
Belgian day-ahead market price will be considered as the market reference price in this
research (Elia, 2019g; Elia, 2019f).
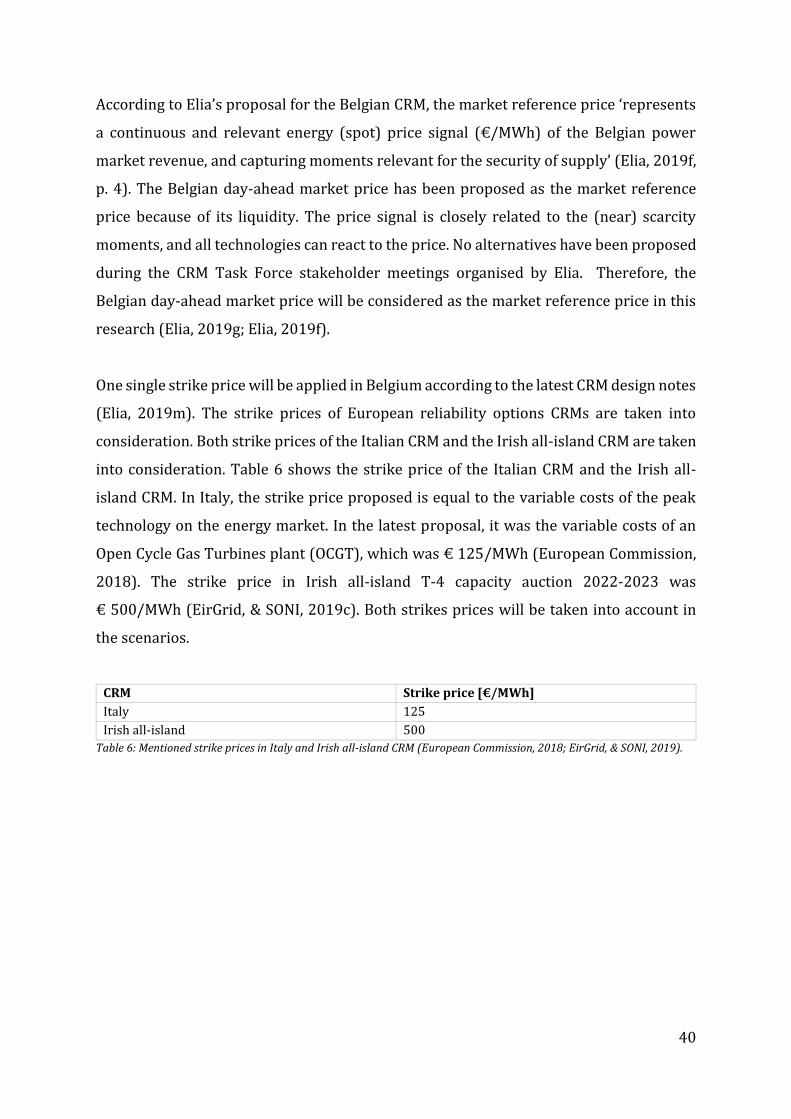
One single strike price will be applied in Belgium according to the latest CRM design notes
(Elia, 2019m). The strike prices of European reliability options CRMs are taken into
consideration. Both strike prices of the Italian CRM and the Irish all-island CRM are taken
into consideration. Table 6 shows the strike price of the Italian CRM and the Irish all-
island CRM. In Italy, the strike price proposed is equal to the variable costs of the peak
technology on the energy market. In the latest proposal, it was the variable costs of an
Open Cycle Gas Turbines plant (OCGT), which was € 125/MWh (European Commission,
2018). The strike price in Irish all-island T-4 capacity auction 2022-2023 was
€ 500/MWh (EirGrid, & SONI, 2019c). Both strikes prices will be taken into account in
the scenarios.
CRM Strike price [€/MWh]
Italy 125
Irish all-island 500
Table 6: Mentioned strike prices in Italy and Irish all-island CRM (European Commission, 2018; EirGrid, & SONI, 2019).

41
4.1.1.2 Availability requirements and availability penalties
All awarded capacity providers in the CRM auction contribute to the adequacy in Belgium.
Elia monitors the availability of each capacity provider during ‘adequacy relevant
moments’ in the contracted period. The Availability Monitoring Trigger (AMT) to identity
these adequacy relevant moments, i.e., AMT moments, is the Belgian day-ahead market
price. The availability monitoring of the contracted capacity providers is triggered if the
Belgian day-ahead market price exceeds a yearly defined AMT price. Every hour the
availability monitoring is triggered is called an AMT hour, and consecutive AMT hours is
called an AMT moment (Elia, 2019k).
Storage, aggregation of demand response and emergency assets capacity providers are
energy-constrained, so situations occur in which the AMT moment lasts longer than the
capacity provider’s (energy) reservoir constraint. Therefore, their contribution towards
adequacy is determined in a Service Level Agreement (SLA). The SLA is based on the
capacity’s energy constraint, i.e., maximum storage depth. The capacity provider should
provide according to the SLA their capacity until the energy reservoir of its asset is
exhausted. Hereafter, there is no delivery obligation for the capacity provider anymore
for that day since the limit is one activation per day. Table 7 shows the different SLA
categories for energy-energy constrained capacity providers and corresponding energy
delivery duration. As an example, if the storage depth of an asset is one hour, e.g., EES
power and energy capacity dimensioning is 10 MW/10 MWh, it should deliver only
during one AMT hour per day the (contracted) obligated capacity (Elia, 2019k).
Category Duration [hour] Limit [activation/day]
SLA #1 1
1
SLA #2 2
SLA #3 3
SLA #4 4
SLA #5 8
SLA #6 ∞
Table 7. SLA categories for energy-constrained capacity providers. Adapted from Elia (2019k).

42
Differences between the capacity provider’s available capacity and the obligated capacity,
i.e., missing capacity, could occur because of planned or forced outages (Elia, 2019k).
Capacity providers should cover the additional capacity required in a secondary market.
Elected bids from capacity providers could be (partly) transferred to other prequalified
capacity providers of the capacity auction with excess capacity of the capacity auctions
for a certain period and price. Capacity providers are penalized if they cannot cover the
missing capacity in the secondary market (Elia, 2019j).
The secondary market is considered as a liquid market. It is assumed in this research that
the capacity required to meet the contracted availability requirement is always met by
capacity from the secondary market. Besides, the Belgian CRM does not exclude any form
of capacity in the auctions because of the European Commission’s technological
neutrality requirement. EES is even mentioned as an example in Elia’s CRM presentation
(Elia, 2019i). Therefore, the availability requirement to participate in the capacity
auctions will be most likely no issue for EES. Last, the expected high penalties provide a
financial incentive to comply with the capacity delivery obligation. Therefore, payback
obligation in terms of penalties is not taken into consideration.
4.1.1.3 Clearing algorithm
The capacity remuneration is a yearly fixed premium in euro per MW. The pricing
depends on the type of CRM design. In the pay-as-bid design, the capacity provider
receives the accepted bid price in the auction whereas in the pay-as-clear design all
capacity providers receive the same market-clearing price (Harbordm & Pagnozzi, 2014).
The pay-as-bid design will be applied to the first two CRM auctions, i.e., the T-4 auction
in 2021 and 2022, and the pay-as-clear design will be applied in both T-1 and T-4
subsequent CRM auctions.

43
4.1.1.4 Demand curve and price caps
The demand curve describes the volume, i.e., capacity, to be contracted as a function of
the price per MW per year. The curve is often defined by three points, each representing
the willingness to pay for a certain level of security of supply. One point on the curve
corresponds to the minimum capacity which should be contracted at a certain price cap,
i.e., maximum price bid. The second point represents the price and capacity required to
ensure the desired security of supply level. The last point represents the maximum
capacity which could be contracted at zero euro per MW. Elia computes the capacity
required each year based on different scenarios and sensitives. No further details have
been published yet regarding the demand curve (Elia, 2019l).
4.1.1.5 T-1 reserved volume
The volume required for the T-4 auction is based on the desired security of supply level.
The T-1 auction is used for the refinement of capacity supply and demand. The minimum
reserved volume is at least equal to the capacity that has, on average less than 200
operating hours per year to cover the total peak capacity (Belgische Kamer van
volksvertegenwoordigers, 2019a).
4.1.1.6 Minimum participation threshold
The minimum capacity participation threshold, after applying de-rating factors, under
which capacity providers cannot participate in the prequalification process and
therefore, in the capacity auction (Belgische Kamer van volksvertegenwoordigers,
2019a).

44
4.1.1.7 De-rating factors
The CRM should contract the capacity to provide a secure energy supply. However,
generation units, demand response providers and storage facilities are assumed not
always to be able to continuously deliver 100% of their of generation capacity due to
malfunctions, lack of energy capacity, maintenance or weather conditions. In the Belgian
CRM, the contribution of a technology or a unit within ‘’near scarcity’’ hours is reflected
by de-rating factors. Near scarcity is the situation where the national resources and
import could just meet the country’s electricity demand. Market price thresholds
determine the near scarcity hours (Elia, 2019e). The system is considered adequate when
the capacity can meet the load demand anytime, given a certain reliability standard (Elia,
2019k). The de-rated capacity participating in the CRM auction, which is the contribution
to adequacy, is equal to the nominal capacity times the relevant de-rating factor for the
capacity provider.
Each SLA category as presented in Table 7 will correspond to a specific de-rating factor.
The de-rating factor represents the contribution of an asset in the SLA category to the
adequacy in Belgium. No concrete de-rating factors have been proposed in Elia’s CRM
meetings yet. However, the first SLA category is 1-hour duration (Elia, 2019e). Thus, the
minimum storage depth of the BESS should be at least 1 hour to be rewarded in the
Belgian CRM.

45
The de-rating factors of the upcoming Italian reliability options mechanism have not been
published yet. Table 8 shows the de-rating factors of storage (excluding hydro storage)
in the T-4 capacity auction delivery year 2022-2023 in the United Kingdom’s CRM and
the Irish all-island’s CRM. The de-rating factor is dependent on the maximum storage
duration of the asset, which is the ratio power capacity/energy capacity. The greater the
storage duration, i.e., the relatively larger the energy capacity compared the power
capacity, the more capacity is awarded in the capacity auction. Table 8 also includes the
de-rating factor of the Polish capacity auctions in 2018 for the delivery year 2021-2022,
2022-2023 and 2023-2024. Striking is the minimum duration of storage in Poland of 4
hours.
CRM De-rating factor 1h
storage depth [%]
De-rating factor 2h
storage depth [%]
De-rating factor 4h
storage depth [%]
United Kingdom 29,4% 56,68% 80%
Irish all-island 39,4% 59,9% 70,2%
Poland n/a n/a 96,11%
Table 8. United Kingdom and Irish all-island De-rating factors T-4 capacity auction (deliver year 2022/23) and Poland de-
rating factors capacity auction (delivery year 2021-2022, 2022-2023, 2023-2024) (Rozporządzenie Minstra Energii; 2018;
EirGrid., & SONI, 2019; National Grid, 2018c).

46
4.1.1.8 Investment levels
The standard CRM contract is for a delivery period of one year. Depending on the
investment costs, both Belgian and foreign capacity providers may be eligible to a
maximum of 3, 8 or 15-year CRM contracts. Investments thresholds distinguish the
different contract periods and thus the capacity remuneration. The objective of the
different investment levels is to create a level playing field among potential capacity
providers with different investment costs (CREG, 2019).
The CREG has mapped the investment thresholds of European CRMs and presented in
Table 9 It is striking that the investment threshold for a delivery period of 15 years differs
greatly per country (186.000 – 705.882 €/MW). The CRM contract duration relevant for
this research will be explained in 5.5
CRM Delivery period [years] Investment threshold [€/MW]
United Kingdom 1 n/a
3 (T-4 auction 2018) 152.550
15 (T-4 auction 2018) 305.100
Irish all-island 1 n/a
Max. 10 300.000
Poland 1 n/a
5 (7 If C02 < 450kg/MWh) 117.647
15 (17 If C02 < 450kg/MWh) 705.882
Italy 1 n/a
15 186.000
Table 9. Investment levels of European CRMs (CREG, 2019).

47
4.1.2 Conclusions
The availability requirements and the availability penalties are relevant parameters to
consider since strict requirements and penalties can be a barrier to entry to the capacity
auction. However, both do not seem to cause any problems regarding participation in the
CRM auctions. Given the research objective, the clearing algorithm, demand curve, price
caps, and the T-1 reserved volume are beyond the scope of this research and not taken
into consideration. The market reference price and strike price are the fundamentals of a
CRM based on reliability options. The potential costs arising from the payback obligation
might have a significant impact on the competitiveness of EES. Besides, the de-rating
factor directly influences the capacity remuneration of EES and therefore the competitive.
The investment levels are related to the number of capacity delivery periods and thus the
period for which the capacity provider receives remuneration.
To conclude, the most important CRM auction parameters in this research for evaluating
the competitiveness of BES are the reference price, strike price and the de-rating factors.
48
4.2 Appropriate EES technologies
Much research has been conducted into large-scale electrical storage. Studies from CREG
(2015) and FOD Economy (2015) and literature on EES discussed in 2.3 could provide
insights into the different EES technologies. The technologies taken into consideration
are Large-scale Pumped Hydroelectric Energy Storage (PHES), Compressed Air Energy
Storage (CAES), Flywheel Energy Storage (FES) and Battery Energy Storage (BES).
PHES and CAES are mainly used for energy time-shifting because of the low energy costs,
low self-discharge rates and the ability to charge and discharge economically optimally
over many hours (up to 40 hours is not exceptional) (IRENA, 2017). However, PHES and
CAES deal with geographic restrictions because PHES needs significant differences in
height between two reservoirs and CAES needs underground cavern reservoirs to store
compressed air. Both requirements cannot be met in Belgium due to lack of space for
PHES and no feasible geographical resources for CAES (Limpens, & Jeanmart, 2018).
FES has several benefits such as allowing a high number of charge-discharge cycles,
providing high power capacity and fast response time (Pena-Alzola, Sebastián, Quesada,
& Colmenar, 2011). However, the energy installation costs of FES is significantly higher
compared to PHSES, CAES and Li-ion batteries (respectively 140, 56 and 7 times higher
in 2016 and still is towards 2030). Also, the technology deals with self-discharge rates of
15% per hour and therefore less suitable for energy time-shifting (IRENA, 2017).

49
Lithium-ion (Li-ion) storage, which is a type of Battery Energy Storage (BES), is an
emerging technology in the utility-scale energy market and has several advantages over
other technologies. Major technical benefits of Li-ion batteries are the short response
time, high power and energy density, and high round-trip efficiency (Luo, Wang, Dooner,
& Clarke, 2015). From an economic perspective, the price of an average Li-ion battery
pack dropped 85% from 2010 to 2018. According to the historical battery pack prices
between 2010 and 2018, BloombergNEF (2019a) computed a learning curve of 18%. This
means every doubling of the cumulative volume of Lithium-ion battery packs decreases
the price by 18% and results in an average Li-ion battery pack price is $ 62/kWh in 2030
(BloombergNEF, 2019a). The Li-ion battery pack price outlook until 2030 is shown in
Figure 6.
Figure 6. Price development of Li-ion battery pack price outlook till 2030 (BloombergNEF, 2019a).
However, battery price forecasts should be interpreted with caution. BloombergNEF
(2019b) predicted four months after the price forecasts in Figure 6 an average price of
$ 88/kWh in 2030 (~ 40% difference in price prediction four months). In addition to the
strong price reduction, Li-ion storage is often preferred for fast frequency related
ancillary services because of its fast response time.

50
Eneco has also investigated the most suitable EES technologies for less than three hours
of storage duration applications in 2019. The research concludes that less than three
hours storage duration with Li-ion batteries, focussing on the FCR, imbalance, and
intraday market, might be the most economically feasible (Eneco, personal information,
May 2, 2019).
Based on research from IRENA (2017), BloombergNEF (2019a) and Eneco (personal
information, May 2, 2019), the focus of this research will be specifically on Battery Energy
Storage (BES), in particular, Li-ion storage. Li-ion storage will hereafter be referred to as
BES or Battery Energy Storage System (BESS) when the entire system is described. The
chemistry choice for the Li-on BES is nickel-manganese-cobalt (NMC) because of the
favourable combination of characteristics such as performance, safety, and costs (IRENA,
2017). NMC Li-ion cells are used as well in Eneco’s 48 MW BES system in Jardelund
Germany and provide frequency control reserve to maintain the network frequency
(Eneco, 2018; Eneco, personal information, August 2, 2019).
4.2.1. Common BES projects
There are several BESS active on energy markets, varying in power capacity and energy
capacity. In the United Kingdom, three kinds of BES projects trends, differing in power
capacity size and application, have been identified over the past years and is coming up
(Energy Storage News, 2019). The first category includes utility-scale stand-alone 50 MW
BES projects with long duration capacity contracts and income derived from energy
markets. Second, 10-20 MW BES projects in combination with (renewable) generation
assets such as wind and solar. Last, smaller-scale projects active in the Commercial &
Industrial (C&I) sector also in combination with generation assets.

51
4.3 Opportunities in the electricity markets
This section describes the opportunities for BES in the Belgian electricity market. First,
the Belgian wholesale electricity markets and the ancillary services offered by Elia will be
explained shortly in the description section. Subsequently, the technical feasibility and
the revenue potential of BES in the electricity market will be considered in the analysis
section.
4.3.1 Wholesale electricity market
4.3.1.1 Description
The EPEX SPOT (formerly Belpex Spot Market) is the short term Belgian power exchange
and operates in three market segments: the Day-Ahead Market (DAM), Continuous
Intraday Market (CIM) and the Strategic Reserve Market Segment (SRM).
The DAM is the auction for daily trading of electricity the following day. Buyers and sellers
submit their volume and price hour by hour, and afterwards, the supply and demand
determine the hourly day-ahead price (EPEX SPOT, n.d. –b).
The CIM is the auction for continuous daily trading of electricity the same day. Trading of
hourly products and several hours is possible from the day before delivery at 15:00 till
five minutes before delivery (EPEX SPOT, n.d. –c). This implies the possibility to trade at
15:00 for the next day 23:00-00:00, which is 33 hours in advance. Greater price volatility
is expected at the opening of the intraday trading slot because there is less certainty
regarding weather conditions, what other parties are trading and other market
circumstances. For example, due to fewer hours of sunshine or the wind blows less than
was expected. Traders have better information about their position and prices closer to
the delivery moment. Therefore, trades in the intraday market are done, on average, 5
minutes up to 8 hours ahead of the delivery moment (Eneco, personal information, July
4, 2019).

52
The SRM is introduced for guaranteeing the security of supply during the winter period.
Elia is responsible for the design, auction, and operation of the strategic reserve (EPEX
SPOT, n.d. –d). The TSO instructs contracted capacity providers during shortages to
increase their load or instructs consumers to reduce their load during an activation of the
strategic reserve (Elia, 2019n). Table 10 shows the main characteristics to distinguish
the three Belgian market segments of the EPEX SPOT Belgium.
DAM CIM SRM
Instrument
series
1-hour blocks 1-hour blocks3 1-hour blocks
Listed for Order
submission
14 trading days
before delivery
until noon
trading day
before delivery
From 15:00 trading day
before delivery until 5
minutes before delivery
The day before delivery for Strategic
Reserve Participant; Direct
Participants will have neither the
possibility to submit Orders on the
Belpex SRM via a different
mechanism nor the possibility to
cancel or modify such replicated
Orders
Trading days Every calendar
day
Every calendar day Every calendar day during the winter
period
Fixing Process Auction Continuous trading Strategic Reserve Allocation
Trading hours Order book
closing at 12:00
24/7 Order book closing at the publication
of DAM results
Table 10. Specification of the three EPEX SPOT Belgium market segments (EPEX SPOT, n.d. -e).
3 Standard is 1-hour blocks but the blocks are freely definable (EPEX SPOT, n.d. –c).

53
4.3.1.2 Analysis
Figure 7 shows the Belgian day-ahead and intraday (BELPEX) distribution of the market
price difference between consecutive hours for a half year between December 4, 2018,
and June 4, 2019 (Eneco, personal information, June 26, 2019).
Figure 7. Sorted (high-low) difference in Belgian intraday and day-ahead prices of consecutive hours for a half year
between December 4, 2018, and June 4, 2019. (Eneco, personal information, June 26, 2019).
Figure 8 focuses on the hours that occur less than 100 hours in that particular half-year.
For example, during less than 10 hours this specific half-year, the price difference
between consecutive hours is around € 25/MWh in the day-ahead market and almost
€ 40/MWh in the intraday market. The blue peak at the beginning of Figure 8 indicates
greater market price volatility in the intraday market compared to the day-ahead market.
EES generate income by capturing price spread in the electricity market and therefore
benefits from price volatility, i.e., relative differences in market prices. This means EES’
potential revenue in the Belgian intraday market is greater than the potential revenue on
the Belgian day-ahead market. Therefore, the Belgian intraday market is preferred from
an economic perspective and considered in this research.
Figure 8. Sorted (high-low) difference in Belgian intraday and day-ahead prices of consecutive hours for a half year
between December 4, 2018, and June 4, 2019, < 100 hours. (Eneco, personal information, June 26, 2019).
-100
-50
0
50
100
Mar
ket
pri
ce
dif
fere
nce
co
nst
ruct
ive
ho
urs
[€
/MW
h]
Duration [h]Intraday market Day-ahead market
0
20
40
60
80
100
120
1 10 19 28 37 46 55 64 73 82 91 100
Mar
ket
pri
ce d
iffe
ren
ce
con
stru
ctiv
e h
ou
rs [
€/M
Wh
]
Duration [h]Intraday market Day-ahead market

54
4.3.2 Ancillary services
4.3.2.1 Description
The electrical consumption must be continuously and instantaneously matched to the
electricity generation. Disruptions cause deviations in the system frequency and affect
the reliability of the electricity supply (Oudalov, Chartouni & Ohler, 2007). As a TSO, Elia
has the responsibility to evaluate and determine yearly the volume required to maintain
the reliability and of the Belgian grid (Elia, n.d. –c). Elia purchases flexible power capacity
and reserves from consumers and generators connected to the grid as it does not have
assets to maintain the frequency of the power grid. These services provided by
consumers and generators are called ancillary services (Elia, n.d. –b).
At the moment, the European electricity market is evolving towards an integrated market
consisting of various European TSOs (ENTSO-E, n.d. -a). The European guideline on
electricity balancing (EBGL) has been in force in the EU since November 2017 and should
increase competition, ensure the security of supply, transparency, and integration of
balancing markets (ENTSO-E, 2018). Two main elements of the guideline which influence
the design of the Belgian ancillary services are the notation of technological neutrality,
which must lead to more technologies being able to offer ancillary services, and the short-
term procurements (European Commission, 2017b). Moving from weekly towards daily
procurement should increase market liquidity and efficiency (Elia, 2018b). Elia’s long
term vision is to create harmonised, neutral rules for the ancillary services Frequency
Containment Reserve (FCR), automatic Frequency Restoration Reserves (aFRR) and
manual Frequency Restoration Reserves (mFRR) (Elia, 2019c). Deployment of multiple
ancillary services by one Balancing Service Provider (BSP) is possible under certain
conditions (Elia, 2018a; Elia, 2019b; Elia, 2019c).

55
The current ancillary services in 2019 no longer exist in the first delivery year of the first
CRM auction scheduled in 2025. Therefore, the upcoming ancillary products in 2025 will
be discussed, as far as known from publications from the European Network of
Transmission System Operators for Electricity (ENTSO-E) and Elia. Table 11 provides an
overview of the considered ancillary services, including the previous terminology, main
product characteristics, and the expected date of the first procurement of the final
products. Final products mean that there are currently temporary forms of the upcoming
balancing products.
New terminology Previous terminology Activation
frequency
Activation
energy
Procurement
Frequency Containment
Reserve (FCR) Primary reserve (R1) +++ + July 2020
Automatic Frequency
Restoration Reserves (aFRR) Secondary reserve (R2) +++ +++ July 2020
Manual Frequency Restoration
Reserves (mFRR) Tertiary reserve (R3) + +++ February 2020
Table 11. Overview of the (future) ancillary services (Elia, 2017a; Elia 2018d; Elia, 2019b).
One of the main implications of the European balancing guideline EBGL is moving to daily
procurements for all three ancillary services. There should be auctions for six
independent 4-hours blocks in a day for these three Belgian ancillary services. Elia will
allow 24-hours block for aFRR providers because it fits better the technical specifications
of the participating technologies. (Elia, 2018a; Elia, 2019b; Elia, 2019c). The sequence of
the daily procurement cycle will be FCR, mFRR and mFRR. The different ancillary services
will be discussed shortly in the following subchapters.

56
4.3.2.1.1 Frequency Containment Reserve
Frequency containment reserve (FCR, former ‘primary reserves’), focusses on balancing
the high-voltage European interconnected system. Any frequency deviations
automatically activate contracted primary reserves set by the European Network of
Transmission System Operators for Electricity (ENTSO-E) (Elia, n.d. –a). FCR should
“stabilize the system frequency at a stationary value after a disturbance or incident in the
time-frame of seconds, but without restoring the system frequency and the power
exchanges to their reference values” (ENTSO-E, 2009, p. 12). FCR product suppliers must
reserve a capacity band (upwards and downwards) equivalent to the contracted capacity
in the delivery period.
The total capacity required will be procured daily on a regional platform Regelleistung
with TSO’s from Germany, Austria, the Netherlands, France, and Denmark (Regelleistung,
n.d. -a). The product in the auction is the FCR symmetric 200 mHz service. The provider
should deliver maximum FCR power capacity between -200 mHz and +200 mHz
deviation from the nominal frequency of 50 Hz and the reaction should be proportionally
between -200 mHz till -10 mHz and +10 mHz till + 200 mHz (Elia, 2019b).

57
4.3.2.1.2 Automatic Frequency Restoration Reserve
The automatic Frequency Restoration Reserve (aFRR, former ‘secondary reserves’) takes
over the responsibilities of FCR. The generation assets are activated automatically in less
than 15 minutes after an imbalance incident occurs (ENTSO-E, 2009). The aFFR product
is characterised by the high frequency of activations and a large amount of activated
balancing capacity, as indicated in Table 11. It is considered as the most complex
balancing product offered (Elia, 2018a). The aFRR provider determines a baseline
(reference power), which is the power that the aFFR provider (or aggregation of
providers) would have consumed or added to the grid at a certain delivery point without
providing the aFRR service. The aFRR provider sends the value to Elia every four seconds.
The difference between the baseline and the measured power at the delivery point is the
delivered energy by aFRR provider (Elia, 2018a).
According to Elia’s aFRR design note, aFRR providers should place bids in both directions.
This means, aFRR providers are obligated to bid both symmetrical, i.e., volume upwards
and volume downwards, and asymmetrical, i.e., upwards or downwards (Elia, 2018a).
4.3.2.1.3 Manual Frequency Restoration Reserves
The manual Frequency Restoration Reserves (mFRR, former “tertiary reserves”) replaces
and can be activated as a supplement to aFRR. MFRR is manually controlled by Elia and
is normally activated for a longer period compared to FCR and aFRR (ENTSO-E, 2009).

58
4.3.2.2 Analysis
Table 12 summarises balancing processes availability requirements and the activation
characteristics from Table 11. As mentioned in chapter 5, Li-ion batteries are
characterized by their short response time, high energy density, and high round-trip
efficiency (Luo, Wang, Dooner, & Clarke, 2015). Therefore, it is technically possible to
develop a Li-ion BESS which meets all the balancing process requirements regarding
reaction time, activation time, and the minimum time sufficient energy for full activation.
Balancing process Maximum
full reaction
time
Maximum
time to full
activation
Minimum time
sufficient energy for
full activation
Activation
frequency
Activation
capacity
Frequency
Containment
Reserve (FCR)
Not
artificially
delayed and
– as soon as
possible
15 seconds
(50%), 30
seconds
(100%)
15 minutes (recovery
of energy capacity
within 2 hours after
the end of the alert
state)
+++ +
Automatic
Frequency
Restoration
Reserves (aFRR)
30 seconds 7,5 minutes 4 hours (i.e., one 4-
hours block)
+++ +++
Manual Frequency
Restoration
Reserves (mFRR)
15 minutes 4 hours (i.e., one 4-
hours block) + +++
Table 12. Technical characteristics ancillary services (Elia, 2017a; Elia, 2018a; Elia, 2019b; Elia, 2019c).
59
AFRR and mFRR require capacity which can deliver four hours of energy continuously.
This means a BESS should have a storage depth of at least four hours. The minimum
energy delivery period of the FCR 2020 procurement has not been determined by
European Network of Transmission System Operators for Electricity (ENTSO-E). The
minimum activation time will be at least 15 and not greater than 30 minutes during the
alert state (Elia, 2019b). The alert state is triggered by a continuous frequency deviation
is greater than 100 mHz during 5 minutes or 50 mHz during 15 minutes. (European
Commission, 2017c). Besides, an additional 10 minutes is required during normal state
for energy-constrained capacity providers, i.e., BES, in Belgium (Elia, 2019b). In the
normal state, the capacity provider is not violating the European frequency deviations
rules (European Commission, 2017c). All European TSOs should assess the required
minimum activation time during alert state and hand in their proposal in April 2020
(ENTSO-E, n.d. -b). At the moment, a minimum duration of 15 plus 10 minutes or 30 plus
10 minutes is equally assumable since no preference is given in Elia’s proposal. Therefore,
this research assumes the ‘worst-case scenario’ of a mandatory energy delivery
availability requirement of 40 minutes.
The average price of selected bids for the considered ancillary services between January
2019 and August 2019 is shown in Table 13 (Elia, n.d. –c). FCR symmetrical 200 mHz
(common auction) is the new FCR product and since July 2019 procured daily on the
regional platform ‘Regelleistrung’ (Regelleistung, n.d. -a). The weekly procurement of
FCR on Elia’s local (Belgium) platform will be fully procured daily on Regelleistung from
July 2020. (Elia, 2019b). The participating countries on the regional platform are Austria,
Belgium, France, Germany, Netherlands, and Switzerland (Regelleistung, n.d. -a; Elia,
2019b).
Table 13 shows that the average price for FCR symmetrical 200 mHz product in the
regional auction is 15% lower compared to the FCR symmetrical 200 mHz product in the
Belgian auction. The expectation is that the prices for R2 and R3 will also drop if R2 is
auctioned on the regional platform as aFRR and R3 is auctioned as mFRR. The prices will
be pressed because of the increasing volume of the joint tenders and the liquidity of the
balancing market increases. Second, because of the daily procurement in the sequence
FCR-aFRR-mFRR, providers try to participate in the different auctions.

60
This is especially true for the mFRR which the auction was first on a monthly basis. In the
future, ancillary service providers can make better forecasts in the day-ahead compared
to month-ahead regarding the (technical) availability, which translates into an increase
of competing volume. This leads to a lower price because the premium on risk is higher
in the monthly prices from uncertainty, not selling it (Elia, 2019b).
The average R3 prices (flex and standard) are already lower than the average FCR
common auction price, and the average R2 price (upward/downward) might decrease to
the same price as the average FCR common auction price.
Previous terminology New terminology Auction Average price
[€/MW/h]
R1 upward Frequency Containment Reserve (FCR) Belgium 2,04
R1 downward Frequency Containment Reserve (FCR) Belgium 1,72
R1 symmetrical 100 mHz Frequency Containment Reserve (FCR) Belgium 13,45
FCR symmetrical 200mHz n/a Common 8,84
FCR symmetrical 200mHz n/a Belgium 10,43
R2 upward/downward Secondary reserve (R2) Belgium 12,61
R3 Flex Tertiary reserve (R3) Belgium 4,16
R3 Standard Tertiary reserve (R3) Belgium 7,07
Table 13. Average price of selected bids for the ancillary services between January 2019 – week 31 August 2019 (Elia, n.d.
–c).
Comparing one hour of storage depth for FCR with R2/aFRR or R3/mFRR, which requires
a minimum of four hours of storage depth, the storage costs become three times as high,
given the storage costs calculations in the next paragraph. However, the aFRR or mFRR
revenues are not expected to be four times as high. Last, the activation frequency of
R2/aFRR is higher compared to FCR as mentioned in Table 13. Thus, the higher storage
costs do not outweigh any potential additional revenue. The economic concept is called
‘diminishing returns’.
Therefore, this research only evaluates the ancillary service FCR symmetrical 200 mHz
(common auction) and the Belgium intraday market as described in 4.3.1.
61
4.4 Price developments
The two sources of income of BES in this research are the intraday market and the
ancillary service FCR market, as discussed in the previous section. This section discusses
the future price developments of both markets.
4.4.1 Intraday market
No research has been found on the Belgian intraday market price developments.
However, Elia has published in their adequacy and flexibility study average day-ahead
market price forecasts in Belgium for 2020 till 2030. The price forecasts are shown in
Figure 9. The model used in this study assumes all the energy is sold in the day-ahead
market and the electricity price is equal to the hourly marginal price, which is based on
the variable costs of the energy production facilities (Elia, 2019d). Two CO2 price
scenarios of the International Energy Agency (IEA) World Energy Outlook 2018 are taken
into account (IEA, 2018). The New Policies Scenario (ref CO2 in Figure 9) is considered as
IEA’s baseline scenario and takes in short countries’ CO2 emissions reduction plans and
commitments into account. The scenario assumes the CO2 price is about € 30 per tonne
in 2030, which is similar to results from BNEF, HIS Markit and EU reference Scenario. The
Sustainable Development Scenario (high CO2 in Figure 9) represents, in short, the
pathway to meet the Paris Agreement climate goals and the scenarios assumes a higher
CO2 price compared to the New Policies Scenario of around € 80 per tonne in 2030 (Elia,
2019d; IEA, 2018). The ‘decentral’ scenario assumes a capacity mix consisting of low
CAPEX/high CAPEX technologies (e.g., emergency generators for load shedding, diesel
generators). The ‘efficient gas’ scenario assumes a capacity mix consisting of new built
Combined Cycle Gas Turbine (CCGT) plants and Combined Heat and Power (CHP) plants.
Elia predicts gas-fired power plants will set the day-ahead market price to meet the
energy demand in the future. The CO2 price and the gas price are the main drivers of the
marginal costs of gas-fired power plants, so therefore these prices have a major influence
on the day-ahead market price forecasts (Elia, 2019d).

62
Figure 9. Average day-ahead market price forecasts in Belgium 2020-2030 under different CO2 and technologies.
4.4.1.1 Relation between day-ahead and intraday market price
Based on multiple historical hourly intraday market prices, the Volume Weighted
Average Price (VWAP) is calculated per hour. The VWAP is the weighted average price
what has been paid for one MWh for a specific delivery hour. Thus, the VWAP intraday
market price is close to the imbalance price if mostly all intraday market trades are made
before the delivery hour. The VWAP intraday market price is determined for the random
month, e.g., March in 2019. The price development has been plotted together with the
Belgium day-ahead market price in figure 10. What emerges clearly from figure 10 is the
same movement of the intraday price level and the day-ahead price level in the
considered period. No clear trend in the intraday market price can be identified on a
monthly timescale.
Figure 10. Hourly VWAP Belgium intraday and day-ahead market prices March 2019.
-20
0
20
40
60
80
100
Ho
url
y m
ark
et p
rice
[€
/MW
h]
01-Mar-2019 00:00 - 31-Mar-2019 23:00 [hours]
Intraday market Day-ahead market

63
The VWAP intraday market price has also been determined on a monthly scale from
January 2014 – July 2019 in Figure 11. The same movement of the Belgian intraday
market and the day-ahead market is observable on a monthly level over a longer period,
Figure 11. Hourly VWAP Belgium intraday and day-ahead market prices (per month) January 2014 - July 2019.
Based on the same movement of day-ahead and intraday market prices, as shown in
figure 10 and Figure 11, Elia’s day-ahead market price forecasts for Belgium 2020-2030
will be used as a proxy for the future intraday market price developments.
The market prices corresponding with the New Policies Scenario (ref CO2) will be used
since this the most broadly accepted scenario by researchers and policy advisors. The
average price of the ‘decentral’ and ‘efficient gas’ scenario are close together, and the
average of both scenarios is taken into account.
0
10
20
30
40
50
60
70
80
90
Jan
-14
Ap
r-1
4
Jul-
14
Oct
-14
Jan
-15
Ap
r-1
5
Jul-
15
Oct
-15
Jan
-16
Ap
r-1
6
Jul-
16
Oct
-16
Jan
-17
Ap
r-1
7
Jul-
17
Oct
-17
Jan
-18
Ap
r-1
8
Jul-
18
Oct
-18
Jan
-19
Ap
r-1
9
Jul-
19
Mo
nth
ly m
ark
et p
rice
[€
/MW
h]
Date [months-year]
Intraday market Day-ahead market

64
4.4.2 FCR
There are no FCR price forecasts published by research agencies, the Belgian government
or Elia. In essence, the demand, and therefore the costs and the price, of ancillary services
increase by higher penetration of renewables because of its intermitted supply (Chuang,
& Schwaegerl, 2009). On the other hand, the procurement of FCR and aFRR will be
separated in July 2020. This means the interdependence of FCR and aFRR decrease and
Elia expects an increase of bids from new entrants in the FCR market (Elia, 2018c). Also,
because of the decrease in battery prices, as mentioned in 5.23, the number of new BESS
projects participating in ancillary services auction is likely to increase. Also, aggregators,
which aggregates small residential batteries to a large virtual battery, see ancillary
services as an interesting revenue stream. For example, 90.000 BESS representing 500
MWh, which is two-thirds of the total operational BESS energy capacity online in
Germany (Apricum, 2018). The rise of residential batteries may also spread to Belgium
and other neighbouring countries. Elia expects the volume of the ancillary services will
not significantly change in the future. Besides, more flexible generation capacity will be
sourced abroad because of the further integration of the European ancillary service
markets as explained in 4.3.2.1. Last, the nuclear power plants, which supplies a major
part of the current Belgian power baseload, will be replaced by (to some extent) flexible
generation capacity. This could lead to increased competitiveness in the FCR market and
lower prices (Elia, 2019d).

65
5. Model description
This chapter first introduces a conceptual model of the research, which outlines all
aspects that are important in determining the competitiveness of BES. Subsequently, the
power and energy capacity dimensioning of the BESS will be discussed. Thereafter, the
relevant approaches for modelling the FCR and the intraday market income will be taken
into account. At the end of this chapter the scenarios and eventually, the experiment
design will be presented.
5.1 Conceptual model
The competitiveness will be evaluated according to the constructed competitiveness
evaluation model which has been developed for this research and presented in Figure 12.
The conceptual model is based on the description of the central buyer mechanism
reliability options model from PwC (2018) and the definition of competitiveness from
chapter 2.4. The model aims to capture all the relevant elements that are important to
consider for the decision-making process regarding participating in the CRM capacity
auctions.
Figure 12. Competitiveness evaluation model.

66
5.2 BESS setup
5.2.1 Dimensioning
The initial situation in this research is a 10 MW BESS, which is a typical power capacity
dimension used in the past by Irish all-island and United Kingdom’s capacity auctions
(CEPA, 2019; National Grid, 2018c; National Grid, 2019).
The appropriate energy capacity (MWh) for a specific power capacity depends on the
application. However, according to the proposed SLA categories in 4.1.1.2, the minimium
storage duration to obtain a CRM contract is 1 hour. Therefore, the minimum storage
depth of the BESS would be 1 hour, so the BESS dimension would be atleast
10 MW/10MWh.
The specific power and energy capacity dimension taken into consideration in this
research will be discussed for a BESS operating each in the intraday and FCR market
5.2.1.1 Intraday market
Income in the intraday market is generated from energy time-shifting. For energy time-
shifting, as introduced in 2.3, a greater storage depth is preferred to make optimal use of
price spreads. The chosen storage depth for the intraday market are 1 hour and 2 hours.
1-hour BESS is initial setup for determining the competitiveness of BES. Although the 2-
hour BESS is expected to generate more income in the intraday market, the additional
income might not outweight the additional storage costs related to the doubling of the
storage depth, i.e., energy capacity. The forecasted CAPEX in 2025 would namely increase
by 75% if the storage depth is doubled and the income is not likely to increase with this
percentage (IRENA, 2017). More experiments will be made if a greater storage depth than
1 hour is economically profitable.

67
5.2.1.2 FCR market
The minimum BESS dimension is 10 MW/10 MWh. In this research the equivalent energy
constraint for energy-constrained capacity providers, e.g., BES, operating in the FCR
market should be at least 40 minutes as explained in 4.3.2. Given the 10 MW power
capacity and the minimum 40 minutes storage duration, the required energy capacity is
6,7 MWh. In addition, energy-constrained capacity providers should increase their power
capacity dimensioning by 25% to ensure continuous FCR activation (ENTSO-E, 2018a).
Thus, the dimensioning of BESS operating in the FCR market should be at least 12,5
MW/6,7 MWh in order to comply with the FCR requirements. This means, 3,3 MWh is
unused by the BESS. In the second BESS setup, the 3,3 MWh will be used for energy time-
shifting in the intraday market.
The four BESS setups taken into consideration in the research are shown in Table 14.
Power capacity
[𝑴𝑾]
Energy capacity
[𝑴𝑾𝒉]
Hours of storage depth
[𝒉]
Application
10 10 1 Intraday market 10 20 2 Intraday market 12,5 10 1 FCR
12,5 10 1 FCR + intraday market Table 14. BESS setups taken initially into consideration.

68
5.2.1 Costs and technical parameters
Table 15 shows the assumptions on the Li-ion storage costs parameters and technical
parameters for the years 2020, 2025 and 2030. The CAPEX, the maximum lifetime and
the maximum number of cycles are based on a public report from the International
Renewable Energy Agency (IRENA) (IRENA, 2017). The definition of a full cycle is further
explained in appendix 12.1. The CAPEX energy and power installation costs involve all
the costs of the BESS, e.g., battery pack, thermal management, controls, installation,
converter, etc. (IRENA, personal communication, October 9, 2019). The percentage O&M
costs, roundtrip efficiency, depth of discharge and the required rate of return are based
on assumptions of Eneco (Eneco, personal information, May 21, 2019; Eneco, personal
information, August 2, 2019). The Belgium inflation and euro/dollar exchange rate are
based on the current rate of August 2019. The corporate tax rate is the rate in Belgium
from 2020 (XE, 2019; Statbel 2019; KBC, 2018).
Parameter 2020 2025 2030
Effective CAPEX energy installation costs4 [€/kWh] 326 235 169
CAPEX power installation costs [€/kW] 108 77 55
Percentage O&M costs of total CAPEX [%] 3 3 3
Roundtrip efficiency [%] 93 93 93
Depth of discharge [%] 90 90 90
Maximum full cycles [#] 2406 3031 3819
Maximum cycle life [year] 14 16 18
EUR/USD exchange rate [€/$] 1,10 1,10 1,10
Required rate of return [%] 7,00 7,00 7,00
Inflation on O&M and commodity [%] 1,26 1,26 1,26
Belgium corporate tax [%] 25 25 25
Table 15. Li-ion BESS costs parameters and values (IRENA, 2017; Eneco, personal information, May 21, 2019; Eneco,
personal information, August 2, 2019; XE, 2019; Statbel, 2019; KBC, 2018).
4 (nominal) CAPEX divided by the maximum depth of discharge of 90%

69
5.3 Intraday market income modelling
5.3.1 Description
As mentioned in 4.3.1, EES generate income by capturing price spreads in the intraday
market. The operation is called ‘electric time-shifting’ and includes purchasing (charging)
of electric energy when demand and energy prices are low and selling (discharging) the
energy when demand and energy prices are high. (Energy Storage Association, n.d.-a). As
explained in 3.3.2, the expected wholesale market income, i.e., intraday market income,
is computed with the use of Linny-R. This software tool determines the most appropriate
operation schedule of BES in order to maximize profit.
Figure 13 presents the visualisation of the Linny-R model for calculating the intraday
market income. The different elements in the figure below can be categorized into
products processes and links. The products ‘Input BE ID price 2021’ and ‘Output BE ID
price 2021’ consists of the Belgium intraday market price forecasts of 2021 (8760 hours
thus 8760 prices). The processes ‘Loading battery process’ and ‘Discharging battery
process’ take care of the charging and discharging process whereby the battery can be
charged and discharged each hour. The arrow from ‘Input BE ID price 2021’ to ‘Loading
battery process’ with the value 1,08 represents the BESS roundtrip efficiency of 93%. This
implies the price spread must overcome the round trip efficiency related to the charging
and discharging process. The product ‘Li-ion storage’ represents the storage reservoir of
the battery with a maximum storage depth of 1 hour. The storage reservoir is either full
(1-hour storage) or empty (0-hour storage) in this example. Finally, the product ‘Cycle
cost’ represents the fictive costs associated with the charging and discharging process
and the value is equal to or smaller than zero. The product aims to reduce the number of
cycles, which will be further explained in the next subchapter.
Figure 13. Linny-R model for calculating the intraday market income.

70
5.3.1.1 Roll and look-ahead period
As mentioned in 4.3.1.1, trades in the intraday market are done, on average, 5 minutes up
to 8 hours ahead of the delivery moment. Even though you can look further ahead in
practice (up to 33 hours), there has been chosen for a more conservative forecast, which
the look-ahead period is constrained to 8 hours in this research and the roll period is 1
hour. Basing revenue forecasts on historical prices implies perfect foresight under the
assumption of knowledge on the realized prices and, which will further be discussed in
8.2.2.2.

71
5.4 FCR income modelling
The remuneration of electric time-shifting in the intraday market is per energy unit
(€/MWh). In contrast, FCR providers receive remuneration for the reservation of power
capacity (€/MW). The results of the current FCR symmetrical 200 mHz product in the
common auction on Regelleistung between 1 July 1, 2019, and September 29, 2019, are
shown in Figure 14. It shows the Belgium marginal capacity price, which represents the
price of the last bid to meet the capacity demand. Every awarded Belgium capacity
provider receives the same remuneration from Elia (ENTSO-E, 2018b).
Figure 14. Marginal capacity price in Belgium on the regional platform between July 1, 2019 – September 29, 2019
(Regelleistung, n.d. -b).
The results shown in Figure 14 has let to the conclusion that no clear trend upwards or
downwards can be identified. The average price during the period was €
213,55/MW/day, the minimum price € 140,33/MW/day, and the maximum price €
447,34/MW/day. Thus, if the BESS wanted to be awarded in all auctions between July 1,
2019, and September 29, 2019, it should have bid at least € 140,33/MW/day every
auction based on pay-as-clear design.
€ -
€ 50
€ 100
€ 150
€ 200
€ 250
€ 300
€ 350
€ 400
€ 450
€ 500
Bel
giu
m l
oca
l mar
gin
al c
apac
ity
pri
ce
[€/M
W/d
ay]
Date [dd-mm-yyyy]

72
Figure 15 shows the frequency of the continent Europe synchronous area on any day in
2018, the nominal 50 mHz frequency line, - 10 mHz line and the + 10 mHz line. The
surface between - 10 mHz and + 10 mHz indicates the dead band, which means no FCR
regulation is allowed if the frequency is in this area. Action by FCR suppliers is mandatory
if the frequency exceeds the - 10 mHz or + 10 mHz. (Elia, 2019b).
Figure 15. Continental Europe synchronous area frequency 3-3-2018 00:00 - 4-3-2018 0:00 (RTE, 2019).
The BESS discharges and charges by supplying and absorbing electricity from the grid.
The calculation of the number of cycles per year is based on the network frequency of
2018, FCR requirements and the BESS power capacity (RTE, 2019). As mentioned in
5.1.2.1.2, the minimum dimensioning of the BESS for the FCR is 10 MW/6,7 MWh
according to the FCR requirements. BES should always have sufficient energy capacity to
be fully activated for at least 15 minutes during a frequency alert state. Therefore, a
power and energy band, upwards and downwards, 2,5 MWh is reserved (Elia, 2019b).
Thus, the minimum state of charge of the battery is 2,5 MWh and the maximum state of
charge is 4,2 MWh. Given the constraints above, the BES would have made, rounded up,
362 cycles upwards and 362 cycles downwards, which is 362 full cycles per year in 2018.
362 cycles per year will be the initial situation in this research for FCR deployment with
10 MW/6,7 MWh. Details on the calculations can be found in appendix 12.3.1.
49,9
49,95
50
50,05
50,1
Fre
qu
ency
[H
z]
3-3-2018 00:00 - 4-3-2018 0:00 [min]
Frequency Minus 10 mHz Plus 10 mHz 50 mHz

73
5.4.1 Charging costs
Moments have been identified in which the BESS is exhausted but should have delivered
energy because of its obligation to the FCR. Based on the frequency data and the
constraints above, 34 MWh should have been bought in the electricity market for these
moments. The yearly charging costs from 2021-2030 are derived by multiplying the
particular forecasted day-ahead market price times the 34 MWh required per year. The
charging costs will be subtracted from the FCR income.

74
5.5 CRM contract length
In 4.1.1.8, the combinations of delivery periods and investment thresholds of different
European CRMs have been introduced and are shown again in Table 16Table 16. As
mentioned in 4.1.2.5, capacity suppliers might, depending on the investment threshold,
be eligible for CRM contracts with a maximum of 1, 3, 8 or 15 years. This study assumes
that the BESS lifetime is (at least) as long as the duration of the capacity contract. In the
end, the capacity provider is obligated to deliver the contracted capacity throughout the
entire contract period.
CRM Delivery periods [years] Investment threshold [€/MW]
United Kingdom 1 n/a
3 (T-4 auction 2021/22) 152.550
15 (T-4 auction 2021/22) 305.100
Irish all-island 1 n/a
Max. 10 300.000
Poland 1 n/a
5 (7 If C02 < 450kg/MWh) 117.647
15 (17 If C02 < 450kg/MWh) 705.882
Italy 1 n/a
15 186.000
Table 16. Investment levels of European CRMs (CREG, 2019).
The CAPEX of BES (1-hour storage depth) in this research in 2025 and 2030 are
respectively € 312/MW and € 224/MW (IRENA, 2017). Given the investment thresholds,
a BESS built-in 2025, i.e., the CAPEX of € 312/MW would obtain the longest contract in
the United Kingdom, Irish all-island and Italian CRM. Therefore, the expectation is that
BES is eligible for at least an 8-year CRM contract. This means that the BES capacity
provider could also choose for a CRM contract of less than 8 years.

75
As mentioned in 5.3.1, BES generate income by purchasing (charging) energy at low
prices and selling (discharging) at high prices. By way of illustration, Figure 16 shows
forecasted intraday market income in 2026 for a different number of cycles. In line with
expectation, the intraday market income decreases as the number of charge-discharge
cycles decreases. Therefore, it seems beneficial to make as many cycles per year as
possible.
Figure 16. Intraday market income (2026) by operating different number of cycles.
However, BES lifetime is affected by charge-discharge cycles and the lifetime is often
expressed in the (maximum) number of full equivalent cycles (Dufo-López, Lujano-Rojas,
& Bernal-Agustín, 2014). The BES lifetime (in years) may be longer by limiting the
number of cycles per year, compared to the situation where no restrictions are imposed
on the maximum number of cycles per year.
€ 22.507 € 22.032 € 21.207
€ 20.103 € 18.795
€ 17.860
€ -
€ 5.000
€ 10.000
€ 15.000
€ 20.000
€ 25.000
1039 758 606 505 433 379
Intr
aday
mar
ket
in
com
e in
20
26
[€
/MW
/yea
r]
Number of cycles [cycles/year]

76
Figure 17 shows the aggregated intraday market income over BES lifetime in years and
the corresponding maximum number of cycles per year. This research assumes 3031
equivalent cycles for Li-ion BESS in 2025 as mentioned in 5.2.1. As an example, the first
stacked bar chart of Figure 17 shows the intraday market income over three years (2026,
2027, and 2028) where the number of cycles per year is not limited by calculating the
income in Linny-R. Initially, Linny-R sets no restrictions to the number of charges and
discharges, i.e., the number of cycles, for solving the linear optimisation problem. The 3-
year lifetime follows from dividing the BES lifetime of 3031 cycles by the 1039 cycles.
Subsequently, the maximum cycles per year and the corresponding income has been
calculated for a lifetime of 4, 5, 6, 7 and 8 years.
Figure 17. Aggregated intraday market income for different BES lifetime (years).
Figure 17 shows that limiting the number of cycles per year ultimately leads to a higher
income over the entire BES lifetime. The additional income from performing more cycles
do not outweigh the income that you can earn in more years by limiting the number of
cycles per year. Therefore, it is desirable to opt for an 8-year CRM contract since this
results in a lower required capacity remuneration compared to a shorter contract.
€ -
€ 20.000
€ 40.000
€ 60.000
€ 80.000
€ 100.000
€ 120.000
€ 140.000
€ 160.000
3 years (1039) 4 years (758) 5 years (606) 6 years (505) 7 years (433) 8 years (379)
Intr
aday
mar
ket
in
com
e [€
/MW
/yea
r]
CRM contract length and number of cycles [cycles/year]
2026 2027 2028 2029 2030 2031 2032 2033

77
5.6 Scenarios
5.6.1 CRM design scenarios
Two scenarios have been drawn up due to the uncertainty regarding definitive market
CRM market design. The reference scenario can be described as a conservative scenario.
It assumes the relatively low strike proposed in Italy (€ 125/MWh), which is expected to
lead to a higher payback obligation compared to the situation with the Irish all-island
strike price. Furthermore, it is based on the last and also the smallest, least favourable,
de-rating factor of the considered European CRMs (29,4% for 1-hour storage depth). The
optimistic scenario assumes the most favourable strike price (€ 500/MWh) and de-rating
factor (39,4% for 1-hour depth of storage) that occurs in the considered European CRMs.
As mentioned in 7.3.2, the payback obligation is equal to zero with a strike price of
€ 500/MWh. This means, there is no payback obligation in the optimistic price scenario,
which leads to zero costs associated with participating in the CRM.
Parameter Reference scenario Optimistic scenario
Strike price € 125/MWh € 500/MWh
De-rating factor (1-hour storage depth) 29,4% 39,4%
Table 17. Reference scenario and experiments for calculating the required capacity remuneration.

78
5.6.2 Intraday market price scenarios
Table 18 shows the average day-ahead market price of 2018 and Elia’s predictions for
2020, 2023, 2025, 2028 and 2030 based on Figure 9 and the assumptions in 4.4.1 (Eneco,
personal information, June 26, 2019; Elia, 2019d). The last column shows the percentage
change of the day-ahead market price between the subsequent years. This percentage
change is also assumed for the intraday market price for forecasting the prices in 2020,
2023, 2025, 2028 and 2030. The hourly intraday market prices of the missing years
between 2020-2030, i.e., 2019, 2021, 2022, 2024, 2026, 2027, 2029, are approximated
through linear interpolation. For example, the price of 2019 is the average of the prices
of 2018 and 2020. In practice, this price trend could also be non-linear. However, this is
the best assumption available due to the limited data. Besides, the number of consecutive
missing years is limited and the price differences between the consecutive years is
relatively low, which is shown in appendix 12.2.1. Therefore, the impact of linear
interpolation is assumed to be limited.
Price year [year] Average day-ahead market Belgium
[€/MWh]
Percentage change regarding the
previous price [%]
2018 55,27
2020 44 -20,4%
2023 50 +13,6%
2025 49 -2%
2028 45 -8,2%
2030 51 +13,3%
Table 18. Average day-ahead market price 2018 predictions for 2020, 2023, 2025, 2028, 2030 including percentage
change.
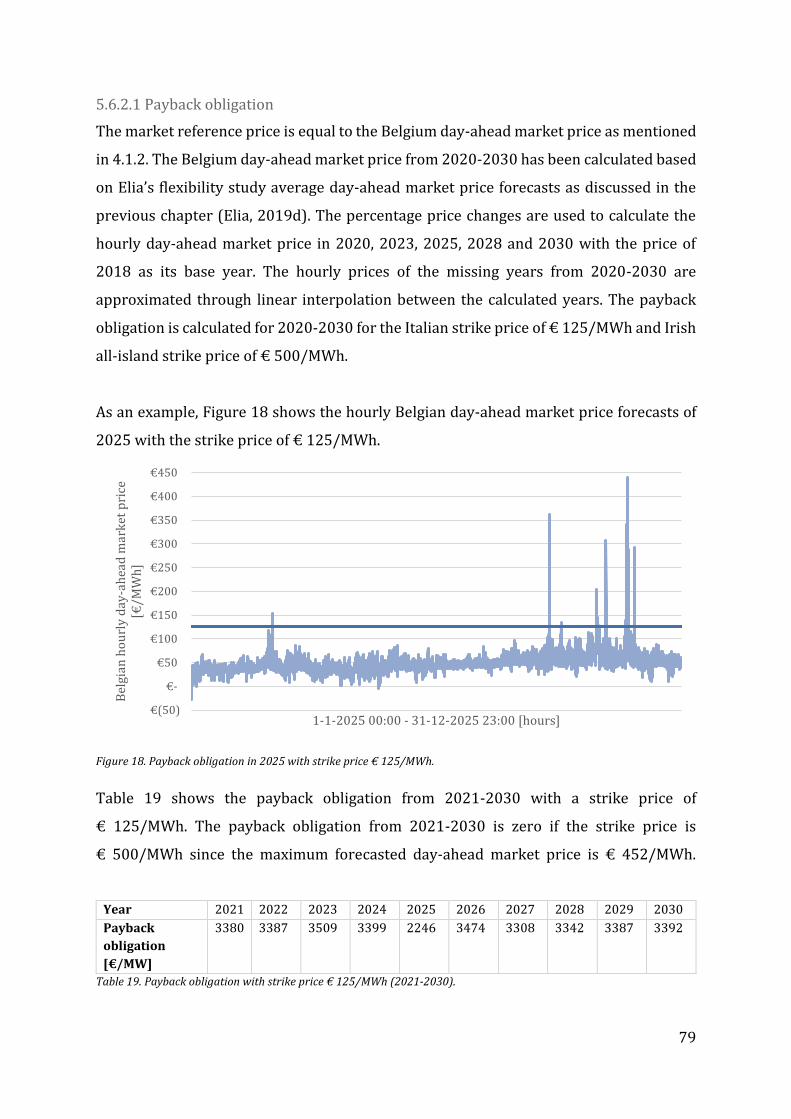
79
5.6.2.1 Payback obligation
The market reference price is equal to the Belgium day-ahead market price as mentioned
in 4.1.2. The Belgium day-ahead market price from 2020-2030 has been calculated based
on Elia’s flexibility study average day-ahead market price forecasts as discussed in the
previous chapter (Elia, 2019d). The percentage price changes are used to calculate the
hourly day-ahead market price in 2020, 2023, 2025, 2028 and 2030 with the price of
2018 as its base year. The hourly prices of the missing years from 2020-2030 are
approximated through linear interpolation between the calculated years. The payback
obligation is calculated for 2020-2030 for the Italian strike price of € 125/MWh and Irish
all-island strike price of € 500/MWh.
As an example, Figure 18 shows the hourly Belgian day-ahead market price forecasts of
2025 with the strike price of € 125/MWh.
Figure 18. Payback obligation in 2025 with strike price € 125/MWh.
Table 19 shows the payback obligation from 2021-2030 with a strike price of
€ 125/MWh. The payback obligation from 2021-2030 is zero if the strike price is
€ 500/MWh since the maximum forecasted day-ahead market price is € 452/MWh.
Year 2021 2022 2023 2024 2025 2026 2027 2028 2029 2030
Payback
obligation
[€/MW]
3380 3387 3509 3399 2246 3474 3308 3342 3387 3392
Table 19. Payback obligation with strike price € 125/MWh (2021-2030).
€(50)
€-
€50
€100
€150
€200
€250
€300
€350
€400
€450
Bel
gian
ho
url
y d
ay-a
hea
d m
ark
et p
rice
[€
/MW
h]
1-1-2025 00:00 - 31-12-2025 23:00 [hours]
80
5.6.3 FCR price scenarios
This research assumes that the FCR price is not expected to rise in the future and are
more likely to fall as discussed in 4.4.2. The following three price scenarios are taken into
consideration:
1. The FCR price is the average price since the introduction of the regional FCR
auction on July 1, 2019, till September 30, 2019: € 215,83/MW/day;
2. The FCR price is the lowest price since the introduction of the regional FCR auction
on July 1, 2019, till September 30, 2019: € 140,33/MW/day;
3. The FCR price is 50% of the (average) FCR price in the first price scenario:
€ 106,78/MW/day;
The first two price scenarios reflect the prices observed today and the third scenario
shows the price in an extreme case.

81
5.7 Experiment design
This section discusses the experiment design of modelling the required capacity
remuneration for BESS. BESS is assumed to operate in the intraday market, FCR market
or in both the intraday and FCR market. The experiments takes CRM design scenarios,
intraday market scenarios and FCR scenarios into consideration as discussed in 5.6 and
the corresponding expected storage costs from 5.4.1. The required capacity
remuneration will be modelled for the photo years 2020, 2025 and 2030. The years are
briefly described in the table below. The BESS will be built in 2020, 2025 and 2030 and
are in operation from respectively 2021, 2026 and 2030 till the end of the BESS its
lifetime. The BESSS lifetime is equal to the CRM contract of 8 years as mentioned in 5.5.
Year Description
2020 Competitiveness of BES in today’s energy market with (theoretically) a CRM
2025 Competitiveness of BES in the first CRM auction
2030 Competitiveness of BES in the 6th (T-4/T-1) CRM auction
Table 20. Year description of scenarios 2020, 2025 and 2030.
Table 21 shows the experiments for a BESS (10 MW/10 MWh) operating in the intraday
market. The price scenario Elia DA is the price scenario as discussed in 5.6.2 which is
based on Belgian wholesale market forecasts from Elia. Reference and optimistic refer to
the CRM design scenarios introduced in 5.6.1.
Year CRM design scenario Price scenario
2020 Reference Elia DA
Optimistic Elia DA
2025 Reference Elia DA
Optimistic Elia DA
2030 Reference Elia DA
Optimistic Elia DA
Table 21. Experiments for BESS (10 MW/10 MWh) operating in the intraday market.

82
Table 22 shows the experiments for a BESS (12,5 MW/10 MWh) operating in the FCR
market. Average, minimum and 50% refer to the FCR price scenarios as described in 5.6.3.
Year CRM design scenario Price scenario 2020 Reference Average
Optimistic Average Reference Minimum Optimistic Minimum Reference 50% Optimistic 50%
2025 Reference Average Optimistic Average
Reference Minimum
Optimistic Minimum
Reference 50%
Optimistic 50%
2030 Reference Average
Optimistic Average
Reference Minimum
Optimistic Minimum
Reference 50%
Optimistic 50%
Table 22. Experiments for BESS (12,5 MW/10 MWh) operating in the FCR market.
Table 23 shows the experiments for a BESS (12,5 MW/10 MWh) operating in both the
intraday and FCR market. As explained in 5.2.1.2, 6,7 MWh of the total 10 MWh BESS
energy capacity is reserved for the FCR operation and 3,3 MWh is used for energy time-
shifting in the intraday market.
Year CRM design scenario Price scenario
2025 Reference Minimum
Optimistic Minimum
Table 23. Experiments for BESS (12,5 MW/10 MWh) operating in both the intraday and FCR market.

83
6 Verification and validation
6.1 Verification
The Linny-R model for calculating the intraday market income will be verified to evaluate
if the model performs as it is intended to. Model verification concerns with building the
model right (Balci, 1994). The Linny-R model should find the optimal moments for buying
and selling electricity to maximise profit. Figure 19 shows the behaviour of the Linny-R
model for the year 2026 during the first 28 time steps, i.e., hours.
Figure 19. Verification of Linny-R model of 2026.
The number one indicates whether an operation is active in its specific hour. The second
column represents the activity of discharging and third column represents charging. The
fourth column shows the day-ahead market price during its corresponding hour. As
discussed in 5.3.1.1, the considered optimisation and look-ahead period in this research
of receptively 1 hour and 8 hours are taken into account. The green blocks represent the
optimisation period and the yellow blocks the look-ahead period. The numbers in the
green blocks indicate the number of optimisation stages. The first operation is done by
the BESS in hour 6.

84
The model then decides whether to charge and thus buy electricity for € -29,96/MWh,
i.e., receiving instead of paying money because of the negative electricity price and looks
ahead eight prices. € -29,96/MWh is the best price given the stage length.
Now that the BESS has been charged it seeks the best moment to sell the electricity while
considering the roundtrip efficiency losses, which is found at hour 20. The price at hour
20 is the highest of the prices from hour 20 – hour 28. Thus, the Linny-R model simulates
the behaviour that can be expected from energy time shifting. However, it should be kept
in mind that the BESS could earn more income by charging and discharging more
frequently. The BESS is constrained to 378 cycles per year due to the BESS cycle life and
the 8-year CRM contract as explained in 5.5, which means the battery charges and
recharges less often.

85
6.2 Input validation
The input validation considers whether storage costs estimated in this resarch
correspond somewhat to the actuals storage costs of realized projects. The CAPEX of the
BESS is based on IRENA’s electricity storage costs outlook from 2017 (IRENA, 2017).
According to Navigant Research, the price of 10/40MWh BESS is around $15,8 million in
2019 which almost corresponds to IRENA’s estimates (Eller, 2019). However, it is
difficult to find out what the actual costs are as developers in press releases often present
approximated project costs. The published (approximated) costs of projects in Lake
Bonney (Australia), Cremzow (Germany) and Carboneras (Spain) plus the estimated
storage costs in 2016 by IRENA (2017) are shown in Table 24
Location
(start
construction)
Power
capacity [MW]
Energy capacity
[MWh]
Total project
costs [M€]
IRENA’s estimated
storage costs in 2016
[M€]
Lake Bonney (2018) 25 52 23,4 25,6
Cremzow (2018) 22 34,8 17 17,9
Carboneras (2017) 20 11,7 11,5 7,8
Table 24. Published (approximated) project costs by developers compared to IRENA’s estimated storage costs (Infigen, 2018; Enel, 2019; Endesa, 2017; IRENA, 2017).
Assuming that the project quotations for projects starting construction in 2018 are made
in 2017, the prices published by developers and IRENA seem to be quite similar in the
first two examples. The prices of IRENA are somewhat higher since these were the prices
for 2016. There is a greater difference between the published project costs and IRENA in
the last example. This could be due to a too high estimate by the developer or a more
expensive supplier of the battery packs. On the other hand, it is most likely due to a
smaller power/energy capacity dimension of the BESS in the first two examples. The
calculation method of IRENA determines the CAPEX based on power and energy capacity.
However, the dimensioning of the power and energy capacity and the CAPEX is not an
exact linear relationship. Economies of scale effects occur since greater dimensioning of
the power and energy capacity leads to cost advantages. Therefore, the IRENA costs
outlook might more accurate for greater BES dimensions and the costs of the considered
10 MW BESS is probably higher. IRENA’s outlook is based on data of storage projects. If
these projects were mainly larger projects, this makes sense. An accurate estimate of the
storage costs can ultimately be obtained by requesting quotes from manufacturers

86
6.3 Model validation
Validation concerns with building the right model (Balci, 1994). Thus, whether the
assumptions that have been made represent the real-world system with sufficient. The
calculated intraday market income have been compared with realized results by Eneco’s
48 MW BES system in Germany. The results seem to be somewhat similar, taking into
account the power and energy capacity that has been deployed by Eneco in the intraday
market in the best possible way (Eneco, personal information, October 17, 2019).
However, the realized income is lower compared to the modelling results. The difference
can largely be explained by the fact that in the Linny-R model, the maximum amount of
energy that can be purchased or sold is equal to the BESS energy capacity, i.e., 10 MWh.
In reality, this does not happen. Smaller volumes are bought and sold, which is less
economically optimal compared to the optimization by Linny-R and leads to a lower
income.

87
7. Results
In this chapter, the competitiveness of BESS in the intraday market and in the FCR market
will be discussed according to the NPV and the required capacity remuneration for the
years 2020, 2025 and 2030. The calculation is based on a CRM contract 𝑁 of 8 years and
a real rate of return 𝑟𝑟 of 5,7% (based on the nominal rate return 𝑟𝑛 7% and inflation rate
𝑟𝑖 1,26%). The competitiveness has been assessed in the reference scenario and the
optimistic scenario as presented in the experiment design.

88
7.2 Competitiveness in the intraday market
The NPV for both the reference scenario and the optimistic scenario has been calculated
for the years 2020, 2025 and 2030 and are shown in Figure 20. The NPV is negative in all
the situations, which means the projects will result in a net loss and the investment
should be rejected. Thus, BES is not competitive in today’s market nor in the future
without any capacity remuneration. The decrease in NPV for the different years is mainly
because of the strong storage costs reduction and to a lesser extent to the income
increase. The CAPEX has been decreased by 48% between 2020-2030 while the intraday
market income has increased only by 17%.
Figure 20 shows the required capacity remuneration in the reference scenario and the
optimistic scenario for the years 2020, 2025 and 2030. The lower required capacity
remuneration in the optimistic scenario is mainly because of the higher de-rating factor
and because of the zero payback obligation. As mentioned in 2.3.1, the auction clearing
price in Irish all-island and United Kingdom’s capacity auctions with the presence of BES
varied from € 6,80 – 46,15/kW/year in 2018 and 2019. This implies the BESS are built
before the delivery years 2018 and 2019. Even with the significant storage costs
reductions expected in 2020, 2025 and 2030, BES is most likely not competitive in the
intraday market.
Figure 20. Required capacity remuneration, given the day-ahead market income in the reference scenario and in the optimistic scenario (2020, 2025, 2030).
€ 243
€ 179
€ 154
€ 112
€ 93
€ 66
€ -
€ 50
€ 100
€ 150
€ 200
€ 250
Reference scenario Optimistic scenario
Req
uir
ed c
apac
ity
rem
un
erat
ion
[€
/kW
/yea
r]
2020 2025 2030

89
7.2.1 Doubling the depth of storage
As mentioned in 4.1.2, energy-constrained capacity providers are awarded in the CRM
according to their corresponding de-rating factor, which depends on the depth of storage.
The greater the contribution towards adequacy, the greater the de-rating factor and thus
the greater the capacity remuneration. Furthermore, a greater depth of storage could
generate more income by capturing price spreads more effectively given the same
amount of (charging and discharging) cycles. However, greater depth of storage entails
additional CAPEX costs, more specifically energy capacity costs, and O&M costs. The
question is whether the additional intraday market income capacity outweighs the
additional storage costs.
The average intraday market income from 2026-2033 (2025 scenario) increases by 27%
if the storage depth doubles. In this research, the 10 MW/10 MWh BESS will become a 10
MW/20 MWh BESS, which means the CAPEX energy installation costs increase because
of the additional 10 MWh. The total CAPEX, consisting of the energy and power
installation costs increases 75% with the 10 MW/20 MWh BESS compared to the 10
MW/10 MWh. The additional intraday market income does not outweigh the extra
storage cost, thus doubling the storage depth leads to a larger negative NPV of the project.
The required capacity remuneration increases from € 154 to € 163/kW/year. Therefore,
more storage depth in 2025 will not increase the competitiveness of BES.

90
7.2.2 Conclusions
Figure 20 has shown the relatively high required capacity remuneration for the years
2020, 2025 and 2030 in the reference and the optimistic scenario. Given capacity
remunerations below € 50/kW/year in other European CRMs, which includes prices near
zero in the United Kingdom, it is unlikely that BESS is competitive if it operates in the
Belgian intraday market.
Figure 21 shows the breakdown of the EBIDTA for 2020, 2025 and 2030 in the reference
scenario. It includes the accumulated intraday market income and variable costs, i.e.,
O&M costs and the payback obligation during the 8-year CRM contract. The figure clearly
shows the relatively high variable costs compared to the income, which has a major
influence on the competitiveness of BESS.
Figure 21. Breakdown of the EBIDTA for 2020, 2025 and 2030.
-
200
400
600
800
1.000
1.200
1.400
1.600
2020 2025 2030
Acc
um
ula
ted
eu
ros
ov
er 8
yea
rs [
1*1
03
€]
Intraday market income O&M costs Payback obligation

91
7.3 Competitiveness in the FCR market
The NPV and the required capacity remuneration will be discussed in this chapter per
FCR price scenario. The price scenarios, as presented in 5.6.3, will again be briefly
explained.
7.3.1 Average FCR price scenario
The price in the average FCR price scenario is the average capacity price between the
introduction of the regional FCR auction on July 1, 2019 and September 30, 2019. The
yearly remuneration is equal to the average FCR price of € 215,83/MW/day multiplies
by 10 MW nominated power capacity in the FCR auctions, as assumed in the scenarios,
times 365 days per year. Thus, the capacity provider will receive € 787.792/year in the
average FCR price scenario during the 8-year CRM contract. The other two scenarios are
also calculated in the same way.
Given the average FCR price, the NPV is negative in 2020, which means the investment
result in a nett loss and should be rejected. The NPV in the optimistic scenario and both
2025 and 2030 scenarios are positive which implies no capacity remuneration is
necessary. It can be derived from Figure 22 that BESS seems to be competitive in the FCR
market in 2025 and 2030 given the average FCR price scenario. However, it is not very
likely that the current average FCR price is equal to the average FCR price in 2025 and
2030 given increasing competitiveness in the FCR market due to replacement of baseload
nuclear capacity by flexible generation capacity, as discussed in 5.4.3.
Figure 22. Required capacity remuneration, given the average FCR price in the reference and optimistic scenario (2020, 2025, 2030).
€ 50
€ 35
€ - € -€ - € -€ -
€ 10
€ 20
€ 30
€ 40
€ 50
€ 60
Reference scenario Optimistic scenario
Req
uir
ed c
apac
ity
rem
un
erat
ion
[€
/kW
/yea
r]
Average FCR price (2020) Average FCR price (2025) Average FCR price price (2030)

92
7.3.2 Minimum FCR price scenario
The price in the minimum FCR price scenario is the minimum capacity price between the
introduction of the regional FCR auction on July 1, 2019 and September 30, 2019, which
is € 140,33/MW/day. The FCR price, and thus the income, is 35% lower compared to the
previous average FCR price scenario. The NPV of the project is negative for both scenarios
in 2020, 2025 and 2030. However, the year 2025 is still more important than 2020 since
the remuneration starts from November 2025.
Figure 23 shows the required capacity remuneration is limited in 2025 to € 55/kW/year
in the reference scenario and € 39/kW/year in the optimistic scenario. In the previous
price scenarios, the de-rating factor and a high strike price did not seem to have a decisive
role. However, in this price scenario, the 11 euros that you need less in the 2025
optimistic scenario compared to the reference scenario may be decisive whether the
business case of BES is competitive, given the capacity remunerations in recent European
CRMs (€ 6,80 – 46,15/kW/year). BES might be competitive from 2025 if the FCR capacity
price is equal to the lowest price observed in today’s FCR market. However, the results
are not convincing and too dependent on favourable parameters and capacity prices.
Figure 23. Required capacity remuneration, given the minimum FCR price in the reference and optimistic scenario (2020, 2025, 2030).
€ 144
€ 105
€ 55
€ 39
€ - € -€ -
€ 20
€ 40
€ 60
€ 80
€ 100
€ 120
€ 140
€ 160
Reference scenario Optimistic scenario
Req
uir
ed c
apac
ity
rem
un
erat
ion
[€
/kW
/yea
r]
Minimum FCR price (2020) Minimum FCR price (2025) Minimum FCR price (2030)

93
7.3.3 50% Average FCR price scenario
The price in the 50% average FCR price scenario is 50% of the average capacity price
between the introduction of the regional FCR auction on July 1, 2019 and September 30,
2019, which is € 106,78/MW/day. This means the FCR income decreased again by 24%
compared to the previous scenario. Now the NPV of the project is negative in all situations
and dependent on capacity remuneration as in Figure 24. BES is most likely not be
competitive at all in 2025 because of the high required capacity remuneration. The
required capacity remuneration in 2030 looks favourable, but it is uncertain how the FCR
prices will develop over time. The FCR market may already be saturated by that time
and the capacity remuneration is already heading towards zero, as seen in the United
Kingdom CRM auction.
Figure 24. Required capacity remuneration given 50% of the average FCR price in the reference and optimistic scenario (2020, 2025, 2030).
€ 184
€ 135
€ 95
€ 69
€ 32 € 21
€ -
€ 20
€ 40
€ 60
€ 80
€ 100
€ 120
€ 140
€ 160
€ 180
€ 200
Reference scenario Optimistic scenario
Req
uir
ed c
apac
ity
rem
un
erat
ion
[€
/kW
/yea
r]
50% Average FCR price (2020) 50% Average FCR price (2025) 50% Average FCR price (2030)
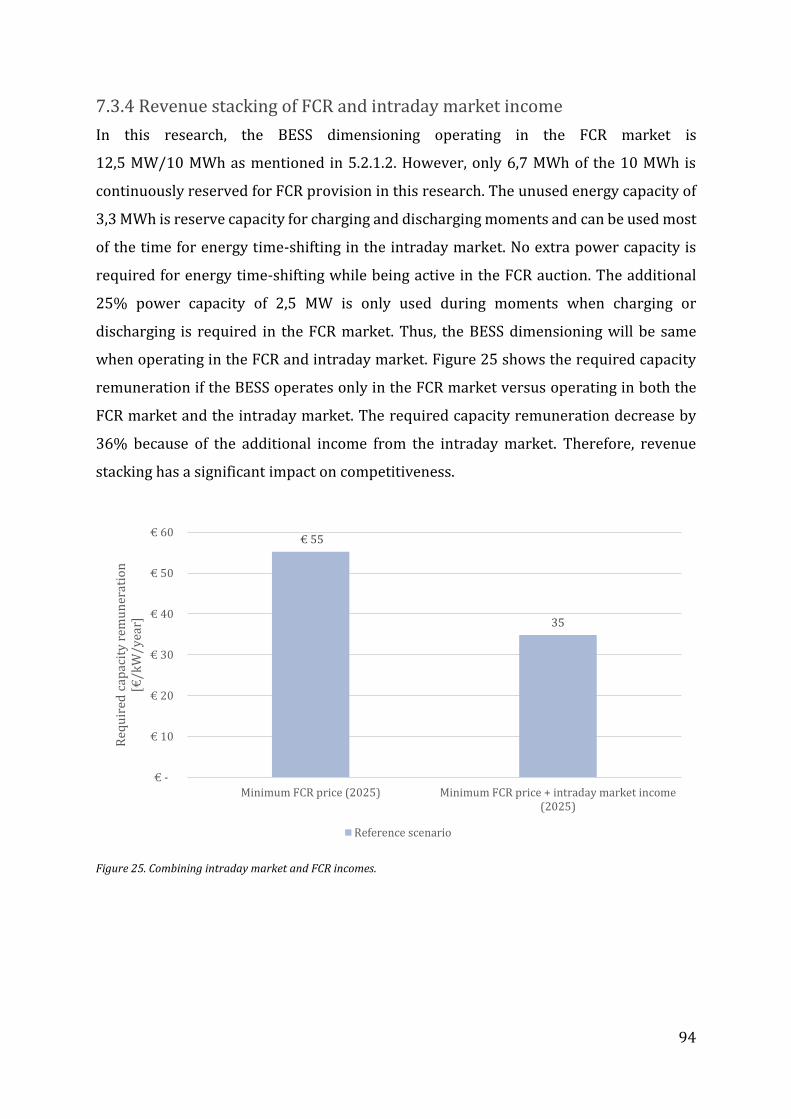
94
7.3.4 Revenue stacking of FCR and intraday market income
In this research, the BESS dimensioning operating in the FCR market is
12,5 MW/10 MWh as mentioned in 5.2.1.2. However, only 6,7 MWh of the 10 MWh is
continuously reserved for FCR provision in this research. The unused energy capacity of
3,3 MWh is reserve capacity for charging and discharging moments and can be used most
of the time for energy time-shifting in the intraday market. No extra power capacity is
required for energy time-shifting while being active in the FCR auction. The additional
25% power capacity of 2,5 MW is only used during moments when charging or
discharging is required in the FCR market. Thus, the BESS dimensioning will be same
when operating in the FCR and intraday market. Figure 25 shows the required capacity
remuneration if the BESS operates only in the FCR market versus operating in both the
FCR market and the intraday market. The required capacity remuneration decrease by
36% because of the additional income from the intraday market. Therefore, revenue
stacking has a significant impact on competitiveness.
Figure 25. Combining intraday market and FCR incomes.
€ 55
35
€ -
€ 10
€ 20
€ 30
€ 40
€ 50
€ 60
Minimum FCR price (2025) Minimum FCR price + intraday market income(2025)
Req
uir
ed c
apac
ity
rem
un
erat
ion
[€
/kW
/yea
r]
Reference scenario

95
7.4 Conclusions
The future looks bright for BESS from 2025 and onwards, given today’s average FCR
price. However, if the average FCR price decrease 35% to the minimum FCR price
measured today, BES is expected to be a lot less competitive. Halving the average price
today would be disastrous. The stronger competitive position in the FCR market comes
mainly from the higher FCR income compared to the intraday market income. The
maximum yearly intraday market income is compared in Table 25. The FCR income is
almost two times higher compared to the intraday income in every price scenario. This is
also the main reason for the difference in competitiveness between operating in the two
markets. Revenue stacking by combining the FCR and intraday market income would
increase the competitiveness of BES and can be concluded to be necessary.
Average intraday income
[€/MW/year]
Average / minimum / 50% average FCR scenario
[€/MW/year]
2020 16.123 78.779 / 51.221 / 39.390
2025 18.780 78.779 / 51.221 / 39.390
2030 20.376 78.779 / 51.221 / 39.390
Table 25. Income differences in the intraday market and the FCR market (2020, 2025, 2030).
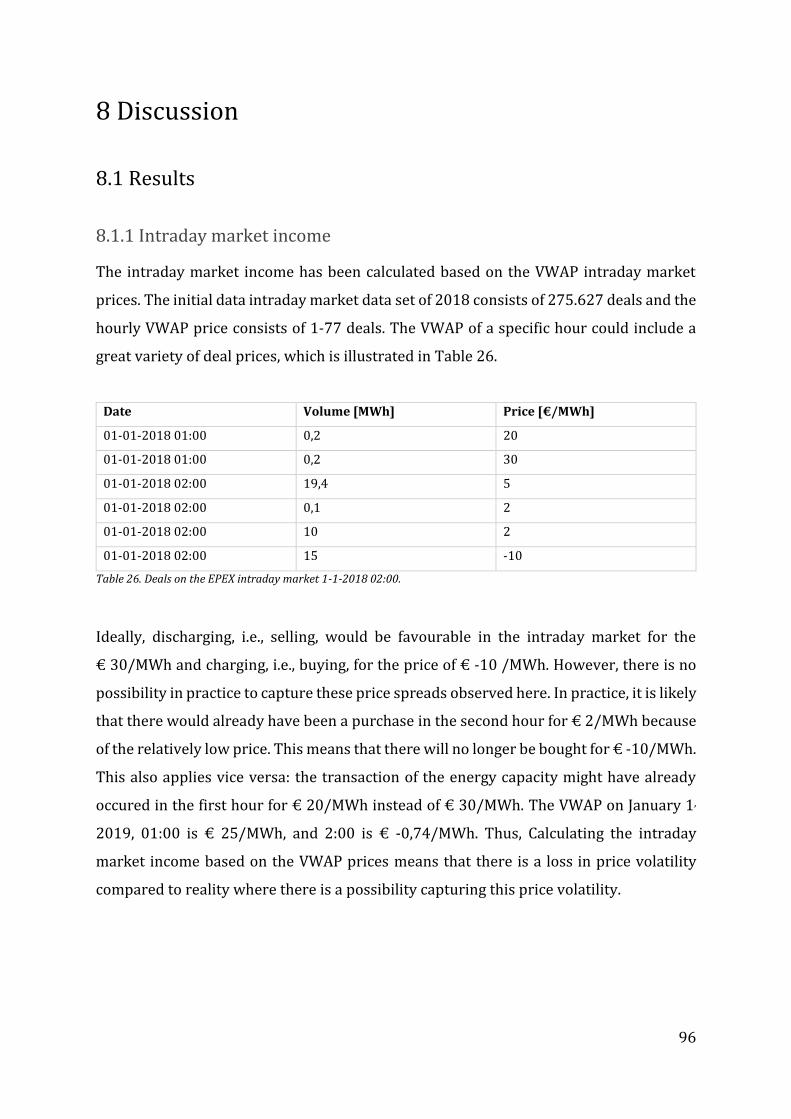
96
8 Discussion
8.1 Results
8.1.1 Intraday market income
The intraday market income has been calculated based on the VWAP intraday market
prices. The initial data intraday market data set of 2018 consists of 275.627 deals and the
hourly VWAP price consists of 1-77 deals. The VWAP of a specific hour could include a
great variety of deal prices, which is illustrated in Table 26.
Date Volume [MWh] Price [€/MWh]
01-01-2018 01:00 0,2 20
01-01-2018 01:00 0,2 30
01-01-2018 02:00 19,4 5
01-01-2018 02:00 0,1 2
01-01-2018 02:00 10 2
01-01-2018 02:00 15 -10
Table 26. Deals on the EPEX intraday market 1-1-2018 02:00.
Ideally, discharging, i.e., selling, would be favourable in the intraday market for the
€ 30/MWh and charging, i.e., buying, for the price of € -10 /MWh. However, there is no
possibility in practice to capture these price spreads observed here. In practice, it is likely
that there would already have been a purchase in the second hour for € 2/MWh because
of the relatively low price. This means that there will no longer be bought for € -10/MWh.
This also applies vice versa: the transaction of the energy capacity might have already
occured in the first hour for € 20/MWh instead of € 30/MWh. The VWAP on January 1,
2019, 01:00 is € 25/MWh, and 2:00 is € -0,74/MWh. Thus, Calculating the intraday
market income based on the VWAP prices means that there is a loss in price volatility
compared to reality where there is a possibility capturing this price volatility.

97
Besides, electricity market price volatility is expected to increase between 2030 – 2040
in Belgium because of the larger penetration of renewables, e.g., solar and wind energy,
and relying more on demand-side response (DSR) to maintain adequacy (Elia, 2017b).
However, the magnitude of the increase in price volatility is unclear. Therefore, the
expected price volatility after 2030 has not been taken into account. Both reasons could
underestimate the intraday market income. On the other hand, the optimization model in
Linny-R calculates the optimal buy and sell moments assuming you know all the VWAPs
which leads to perfect foresight, which will be further discussed in 8.2.2.2. To conclude,
the intraday market income may be underestimated when using VWAP. However,
considering the VWAPs compared to taken all the inviduals deals into account leads to a
more releastic approach.
8.1.2 Payback obligation
The payback obligation in this research depends strongly on the strike price of the
reliability option in the CRM. A strike of € 125/MWh results in payback obligation from
2021-2038 while if the strike price is € 500/MWh, there is no payback obligation at all.
This is due to the maximum forecasted day-ahead market price of € 452/MWh as
mentioned in 5.6.2.1. Table 27 shows the influence of the payback obligation on the
required capacity remuneration, given in the intraday market income and minimum FCR
income in 2025. Assuming that the strike price would not drop below the € 125/MWh,
the greatest influence of the payback obligation on the required capacity remuneration
would be € 3/kW/year. A difference of € 3/kW/year may not have a decisive role in the
investment decision in BES.
In the reference scenario Required capacity remuneration [€/kW/year]
With payback obligation Without payback obligation
Intraday market income (2025) 154 151
Minimum FCR income (2025) 55 52
Table 27. Influence of the payback obligation on the required capacity remuneration.

98
8.1.3 FCR income
As mentioned in 4.4.2, there are no clear forecasts on the FCR price development.
However, the price is not expected to rise and more likely to fall in the future. The FCR
prices are strongly demand-driven, and it is hard to model as stable income streams.
Furthermore, the FCR income rests on the assumption that the BESS is awarded in every
FCR auction. In practice, there might be moments that the FCR provider is not awarded
in the auction because of relatively low bids of other participants or unforeseen
circumstances.

99
8.2 Limitations
8.2.1 Data
All data used for the development of price scenarios in this study is publicly accessible
and thus auditable. However, there are also research organisations, such as Bloomberg
New Energy Finance (BNEF), which have also investigated electricity price developments
and storage costs. These paid reports may not be published in this master thesis, so
therefore there might be relevant data missing. Also, Eneco has electricity price forecasts
that have not been included in the report due to competition sensitivity. Therefore, in a
master thesis there is a limitation as to what is available to the public. By being allowed
to use data from, for example, BNEF and Eneco, the reliability of the research can be
increased. This could also be done by requesting quotes from storage costs. However, as
mentioned in the validation, the storage costs estimates do not differ very great from the
storage costs of realized projects.
8.2.2 Method
8.2.2.1 Net Present Value
The financial model for calculating the NPV of the project and after that, the required
capacity remuneration, are performed in Excel. NPV is the most common technique for
evaluating the profitability of a project. However, there are also drawbacks to this
method. The calculation of the NPV is based on the required rate of return, which is
chosen by the investors and often based on the risk of the investment, company’s
experience with similar projects, set by managers or a rule of thumb (Liljeblom, &
Vaihekoski, 2004). The NPV can be unreliable if it is incorrectly selected due to inaccurate
(risk) estimates. This research assumes a real rate of return 𝑟𝑟 of 5,7% based on the
nominal rate return 𝑟𝑛 7% and inflation rate 𝑟𝑖 1,26%. However, the nominal rate of
return is a rough estimate. A risk profile can be drawn up based on this specific
investment taking into account the likelihood of the related income and costs. This can
lead to a better estimate of the required rate of return. The uncertainty about the future
FCR and intraday market prices may lead to a higher nominal rate of return. A different
real rate of return influences the NPV, the required capacity remuneration and thus the
perception of the competitiveness of BES.

100
8.2.2.2 Linny-R
As mentioned in the model description, the intraday market income has been calculated
with the use of a Linny-R model, which determines the optimal buy and sell moments
over a certain period. The model assumes that there is knowledge into the intraday
market prices a few hours in advance. This look-ahead period, which is assumed 8 hours
in this research, reflects the time that, on average, traders look ahead when trading.
However, the model looks ahead for 8 hours of realized intraday market prices, which
causes perfect foresight.
The look-ahead period is halved to evaluate the influence of the look-ahead period on the
intraday market income. This leads to the fact that the Linny-R model looks ahead 4
intraday market prices instead of 8 intraday market prices. The average intraday income
decreases by 4% from 2026-2034 since the model buys and sells less optimally compared
to the previous situation. The average intraday income from 2026-2034 has decreased
by 4%. The required capacity remuneration in 2025 increases from € 154 to
156/kW/year with a look-ahead period of 4 hours instead of 8 hours. Therefore, the
difference in the look-ahead period does not have a major impact on the competitiveness
of BES.
8.2.3 Model and analysis
The NPV method can be seen as a common method for assessing the profitability of BES
in electricity markets based on the number of studies found in literature (Oudalov,
Chartouni, & Ohler, 2007; Cho, & Kleit, 2015; Mercier, Cherkaoui, & Oudalov, 2009).
Striking is that none of these studies takes corporate tax rate into consideration when
calculating the NPV. The Belgian corporate tax rate is 25% in 2020 as mentioned in 5.2.1
and has a significant impact on the NPV. By way of illustration, the required capacity
remuneration in 2025 (reference scenario) decrease by 8% for a BESS operating in the
intraday market if the corperate tax is not taken into consideration. Therefore, a
disadvantage of the NPV method is that only projects can be compared with each other
where the same assumptions have been made.
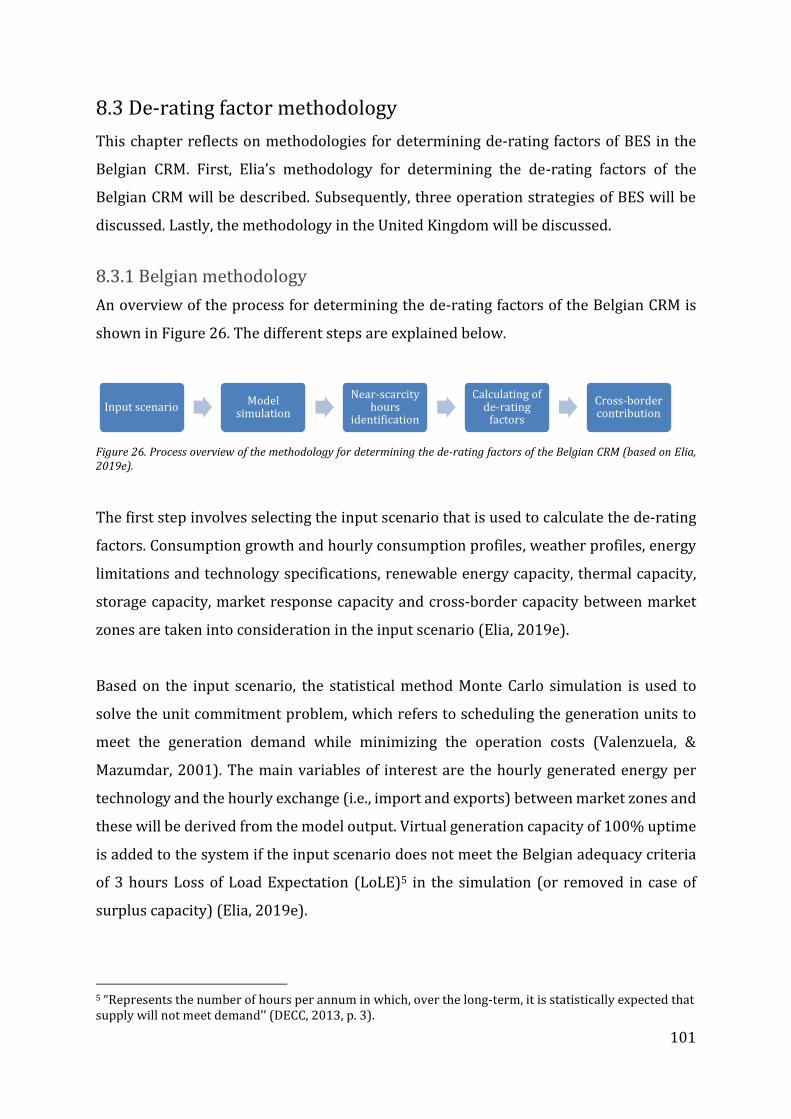
101
8.3 De-rating factor methodology
This chapter reflects on methodologies for determining de-rating factors of BES in the
Belgian CRM. First, Elia’s methodology for determining the de-rating factors of the
Belgian CRM will be described. Subsequently, three operation strategies of BES will be
discussed. Lastly, the methodology in the United Kingdom will be discussed.
8.3.1 Belgian methodology
An overview of the process for determining the de-rating factors of the Belgian CRM is
shown in Figure 26. The different steps are explained below.
Figure 26. Process overview of the methodology for determining the de-rating factors of the Belgian CRM (based on Elia, 2019e).
The first step involves selecting the input scenario that is used to calculate the de-rating
factors. Consumption growth and hourly consumption profiles, weather profiles, energy
limitations and technology specifications, renewable energy capacity, thermal capacity,
storage capacity, market response capacity and cross-border capacity between market
zones are taken into consideration in the input scenario (Elia, 2019e).
Based on the input scenario, the statistical method Monte Carlo simulation is used to
solve the unit commitment problem, which refers to scheduling the generation units to
meet the generation demand while minimizing the operation costs (Valenzuela, &
Mazumdar, 2001). The main variables of interest are the hourly generated energy per
technology and the hourly exchange (i.e., import and exports) between market zones and
these will be derived from the model output. Virtual generation capacity of 100% uptime
is added to the system if the input scenario does not meet the Belgian adequacy criteria
of 3 hours Loss of Load Expectation (LoLE)5 in the simulation (or removed in case of
surplus capacity) (Elia, 2019e).
5 “Represents the number of hours per annum in which, over the long-term, it is statistically expected that supply will not meet demand’’ (DECC, 2013, p. 3).
Input scenarioModel
simulation
Near-scarcity hours
identification
Calculating of de-rating
factors
Cross-border contribution

102
Subsequently, the relevant hours for the adequacy in Belgium, i.e., near-scarcity hours,
are determined based on the model output. Near-scarcity hours refers to both hours with
energy not served (i.e., scarcity hours) and hours in which any additional domestic load
will lead to Expected Energy Not Served (EENS). Domestic capacity and import capacity
from Belgian’s directly connected market zones, i.e., the Netherlands, United Kingdom,
Germany, and France, are taken into account (Elia, 2019e).
The contribution of thermal generation units, e.g., CHP, OCGT and CCGT plants, to the
Belgian adequacy is independent of weather conditions, activation limits and energy
limitations. Only annual forced outage rates and the corresponding duration derived
from historical input (scenario) data are taken into account for calculating the de-rating
factors of these technologies. The de-rating factor of thermal technologies (%) is equal to
100% minus the specific assumed forced-outrage rate (%) of the thermal technology
(Elia, 2019e).
In comparison with the thermal technologies, the de-rating factors of energy-constrained
technologies cannot be derived from historical data. The energy-constrained de-rating
factors are calculated based on their contribution during near-scarcity hours, where the
contribution is derived from the model output of a Monte Carlo simulation including all
technologies. The model optimizes the costs of energy-constrained technologies so that
the income from discharge is higher than the costs of discharge, which leads to a
maximum contribution during near-scarcity hours. The de-rating factor of energy-
constrained technologies (%) is its average contribution during near-scarcity hours
(MW) divided by its reference power (MW) (Elia, 2019e).
As mentioned earlier in 4.1.1.2, SLA categories are defined, which consists of energy-
constrained technologies with the same hourly activation constraints and assumed to be
activated once a day. Each SLA category is associated with a specific de-rating factor and
represents the contribution of the category to the adequacy. Elia will publish the de-
rating factors in their yearly auction report (Elia, 2019e).

103
In the last step, the cross-border contribution has been calculated based on the model
output. The average contribution of the directly connected market zones to adequacy is
determined by maximum capacity contribution, i.e., capability, of the directly connected
market zones to export during near-scarcity hours (Elia, 2019e). Belgium relies strongly
on cross-border capacity to ensure its necessary level of adequacy. Furthermore, scarcity
moments in Belgium are strongly correlated to scarcity moments in one of the directly
connected market zones and is likely to increase in the future (Elia, 2019d).
8.3.2 BES operation strategies
European countries with a capacity mechanism are obligated to have reliability standards
which indicate their security of supply requirement. The country’s adequacy indicators
include at least the LoLE and the EENS (European Parliament and of the Council, 2019).
Both indicators are also taken into consideration in the Belgian CRM law and Elia’s latest
adequacy study (Belgische Kamer van volksvertegenwoordigers, 2019a; Elia, 2019d).
EENS provides a better indication of the fiscal damage of shortage periods, while the LoLE
does not reflect on the severity of the shortage period. LoLE indicates only the period, i.e.,
hours, with the presence of EENS. One is indifferent which adequacy parameter is used if
the electricity in the market is only supplied by solely dispatchable generators. This is
because there is a direct relationship between the EENS and LoLE values since the
varying level of capacity in the electricity market. However, there is no direct relationship
anymore between EENS and LoLE for energy-constrained technologies, e.g., BES. BES has
a (maximum) energy stored, so the reduction in EENS is more or less the same. BES can
respond in different ways to EENS periods where each difference can lead to a different
impact on the reduction in LoLE (Dent, Wilson, & Zachary, 2017).
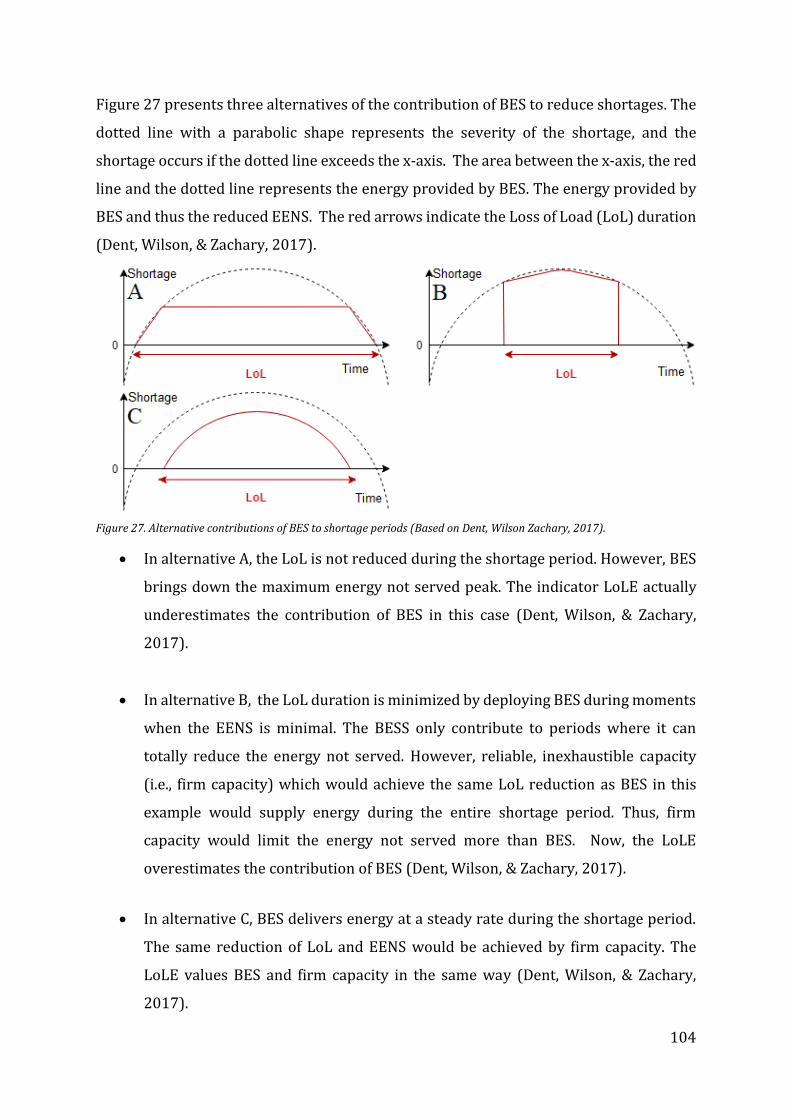
104
Figure 27 presents three alternatives of the contribution of BES to reduce shortages. The
dotted line with a parabolic shape represents the severity of the shortage, and the
shortage occurs if the dotted line exceeds the x-axis. The area between the x-axis, the red
line and the dotted line represents the energy provided by BES. The energy provided by
BES and thus the reduced EENS. The red arrows indicate the Loss of Load (LoL) duration
(Dent, Wilson, & Zachary, 2017).
Figure 27. Alternative contributions of BES to shortage periods (Based on Dent, Wilson Zachary, 2017).
In alternative A, the LoL is not reduced during the shortage period. However, BES
brings down the maximum energy not served peak. The indicator LoLE actually
underestimates the contribution of BES in this case (Dent, Wilson, & Zachary,
2017).
In alternative B, the LoL duration is minimized by deploying BES during moments
when the EENS is minimal. The BESS only contribute to periods where it can
totally reduce the energy not served. However, reliable, inexhaustible capacity
(i.e., firm capacity) which would achieve the same LoL reduction as BES in this
example would supply energy during the entire shortage period. Thus, firm
capacity would limit the energy not served more than BES. Now, the LoLE
overestimates the contribution of BES (Dent, Wilson, & Zachary, 2017).
In alternative C, BES delivers energy at a steady rate during the shortage period.
The same reduction of LoL and EENS would be achieved by firm capacity. The
LoLE values BES and firm capacity in the same way (Dent, Wilson, & Zachary,
2017).

105
As shown in Figure 27, the three alternatives for the deployment of BES lead to different
reduction of the LoL duration given an equal availability of storage. Therefore, the most
appropriate adequacy indicator for the contribution of BES is EENS because it is not
sensitive to the strategy of BES deployment during shortage periods and represents the
economic damages directly (Dent, Wilson, & Zachary, 2017; National Grid, 2017). The
deployment of BES on the electricity market, e.g., timing and energy delivery profile, is a
commercial decision. Therefore it is difficult to determine which strategy the storage
operator will choose during shortage periods (National Grid, 2017).
Note that the presence of storage is still limited in the Belgian electricity market.
Therefore, the available EES does not significantly affect the direct relationship between
LoLE and EENS, as discussed earlier. Thus, the LoLE is still appropriate for determining
the required capacity, i.e., level of security to be achieved by the Belgian CRM (Dent,
Wilson, & Zachary, 2017; Elia, 2019e).
8.3.3 UK methodology
The required capacity, i.e., level of security to be achieved by the Belgian CRM, is
calculated according to the LoLE adequacy criteria (Belgische Kamer van
volksvertegenwoordigers, 2019a). Besides, the input scenarios in the Belgian de-rating
methodology also relies on the same LoLE as mentioned in 8.3.2.1.
However, it is more appropriate to calculate the contribution of BES according to the
EENS adequacy criteria, as explained in the previous subsection. The de-rating
methodology for energy-constrained capacity providers used in the United Kingdom is
actually based on the EENS metric (National Grid, 2017). Research by National Grid
(2017) has shown that using the LoLE or EENS metric for calculating the contribution of
storage is significantly different. Given BES is deployed as described in alternative C and
taken into account that the input scenario is the same, the de-rating factor would be
29,9% (1-hour storage depth) if the methodology is based on the EEU, while the de-rating
factor is 47,0% if the methodology is based on the LoLE (National Grid, 2017).

106
Besides, National Grid (2017) showed that the de-rating factor for a certain storage depth
will decrease as the corresponding penetration of energy-constrained storage increases
since the contribution to the security of supply decreases. Energy-constrained storage
will cause an increase in the LoL duration, which means the contribution of that specific
energy-constrained storage will saturate, and thus the de-rating factor will decrease
(National Grid, 2017).
8.3.4 Conclusions
It can be concluded from previous subsections that calculating the contribution of BES
based on the adequacy indicator EENS is most appropriate. In the Belgian methodology,
the contribution is of storage is based on the LoLE, which is beneficial for storage
operators in terms of the de-rating factor as illustrated in the results above. The
methodology may be adjusted as storage will play a dominant role in the Belgian energy
supply. After all, this has also happened in the UK. Second, the de-rating factors are
expected to decrease as the penetration of storage increases. In the light of both findings,
it is therefore favourable for BES to participate in (one of the) first capacity auctions
where the de-rating value may still be favourable for energy-constrained technologies.

107
9 Conclusions
This section includes the conclusion of the research on the competitiveness of BES in the
future Belgian market. First, the sub-questions of this research, as introduced in 3.1, will
be answered. Finally, the main research question will be answered. Hereafter,
recommendations for further research will be presented.
9.1 Answers to the sub-questions
What are the characteristics of the Belgian Capacity Remuneration Mechanism?
The capacity remuneration mechanism proposed in Belgium is the (market-wide) central
buyer capacity mechanism based on reliability options. The Belgian CRM market rules
and auction rules are not known yet, and thus a selection has been made of the most likely
characteristics, based on interim publications by parties involved and other CRMs in
European countries. The market reference price, strike price and de-rating factors have
been identified as the most important parameters for required capacity remuneration.
The further elaboration of the mechanism on these parameters is therefore important for
the competitiveness of BES.
Which EES technologies fit the characteristics of the Belgian capacity market best?
Various studies support that Li-ion battery storage is the best alternative for operating in
the Belgian CRM. The technology is characterized by relatively low CAPEX, it still
undergoes a major cost reduction, has a fast response time and meets the ancillary
services requirements, and projects are relatively easy to realise. Therefore, Li-ion
storage is abundant on ancillary services markets and common in other European CRMs.

108
What is the revenue derived from the wholesale electricity market and the
potential payback obligation of the capacity remuneration mechanism?
The intraday market is preferred over the day-ahead market for BES due to the greater
price volatility. The price volatility is likely to increase in the future due to the large share
of renewables and relying more on DSR to maintain the adequacy in Belgium. This
development offers opportunities for BES in the future since it may lead to potentially
higher income. However, no studies have been found on the price development of the
Belgian intraday market.
Capacity providers in the Belgian CRM auction are obligated to pay the difference
between the market reference price, i.e., Belgian day-ahead market price, and a certain
strike price whenever the day-head market price exceeds the strike price. No Belgian
strike price has been mentioned during CRM meetings. The lowest strike price proposed
in Europe is € 125/MWh. This strike price would only leads to € 3/kW/year difference
in required capacity remuneration compared to a CRM without strike price. Therefore,
the payback obligation is not expected to have a significant impact on the investment
decision in BES.
What is the revenue derived from ancillary services?
BES would not require any capacity remuneration from the first capacity delivery year if
the FCR price is equal to today’s average FCR price. However, the research assumes that
the FCR price is not expected to rise in the future and more likely to fall because of the
increase of flexible generation capacity and the further integration of European ancillary
service markets. The FCR price is likely to decline when the new ancillary service
products will be implemented in July 2020. It is advisable to follow the FCR price
development after this introduction. There is a lot of uncertainty about the future FCR
prices and therefore the prices of the FCR scenarios vary widely (215,83 – 140,33 –
106,78 €/MW/day). Still, the FCR price will have to fall significantly to reach a
comparable level of the intraday market price. Even if 3,3 MWh of the BESS energy
capacity is actually unused, as explained in 5.2.1, the FCR market is still preferred over
the intraday market.

109
What is the remuneration required for EES in Belgian capacity remuneration
mechanism auction?
It is likely that the Belgian auction clearing price could drop to near-zero based on the
auction results of other European CRMs. In this case, BES must be able to compete with
probably (existing) gas plants. BES solely operating in the intraday market would not be
competitive in the Belgian CRM auctions given the required capacity remuneration of at
least € 66/kW/year in 2030. BES does not need capacity remuneration from 2025
onwards with today’s average FCR price. This is due to the expected fall in battery prices
up to 2025. However, it is not very likely that the capacity prices stays the same. The
competitiveness of BES can, however, be improved by trading in the intraday market
alongside FCR. Because of the minimum one-hour storage depth requirement in the
Belgian CRM, part of the energy capacity is not used in the FCR and can be used for
intraday market trading. The required capacity remuneration decreases significantly
from 55 to 35 €/kW/year.
This research has shown that both uncertainties about price developments and auction
design have a major impact on the required capacity remuneration. On the other hand,
the uncertainties surrounding the auction design can soon be mitigated if the design is
established by law.
110
9.2 Answer to the main research question
What is the competitiveness of electrical energy storage in the future Belgian
capacity market?
The research has been able to determine which factors are related to the competitiveness
of BES, such as the battery’s cycling life, storage costs, reference price, strike price and
the de-rating factors. However, uncertainties have been discovered regarding legislation,
rules and prices. Part of this uncertainty will be eliminated when the CRM rules and
auction parameters will be published. Deploying BES on electricity markets is expected
to become more popular due to the falling CAPEX of BESS. Creative solutions are required
to create stable revenue streams. Investing in BES for operating only in the FCR market
might not be a sustainable business case anymore in the future. Blindly relying on
maintaining current FCR prices is unwise. However, today’s average FCR price must
decrease by more than 75% to reach the expected average intraday market price in 2025.
By combining FCR and intraday market income streams, revenues can be improved as it
leads to a 35% lower capacity remuneration compared to the situation in which BES is
only delopyed in the FCR market. Instead of locking down to one revenue stream, BES
capacity providers should steer between the two revenue streams based on price
developments in these markets.
There are two major developments in the electricity market, which might increase the
average capacity remuneration outside capacity provider’s direct sphere of influence.
First, the planned decommissioning of nuclear plants in Belgium and coal-fired power
plants in Germany requires more new-build generation capacity in Europe. BES and gas-
fired peaking power plants might address the shortcomings in the future, which means
the average capacity remuneration rises. Second, the declining FCR price leads to lower
expected incomes of BES capacity providers. This means BES capacity providers require
a relatively higher capacity remuneration to cover its costs. Both factors could increase
the participation of BES in the capacity market if the capacity is required to achieve the
desired adequacy level.

111
There might be a significant gap between the low required capacity remuneration of
near-zero for conventional plants as shown in other European CRMs compared to the
relatively high required capacity remuneration of BES as shown in this research. To
conclude, the results are not convincing regarding BES as a competitive technology in the
upcoming Belgium capacity market.
9.3 Policy recommendations
The insights gained from answering the sub-questions and the main research question
are translated in this section into recommendations for the Belgium CRM. The first
recommendations relate to the CRM auction parameters, more specifically the strike
price and the de-rating factors. Both parameters could have a significant influence on the
competitiveness of BES as discussed earlier. In the minimum FCR price scenario, the
difference in required capacity remuneration in the reference and optimistic scenario
might be a decisive factor for competitive bidding in the CRM auction. As the CRM auction
parameters are still under public consultation, Eneco should discuss the research insights
on the competitiveness of BES with Elia.
The second recommendation concerns the development of the FCR price. Elia’s last
adequacy and flexibility study includes day-ahead market forecasts in Belgium for
different CO2 and technology scenarios. The forecasts include concrete (average) prices
from 2020-2030. However, the ancillary services chapter in the study describes only
price scenarios and does not provide specific prices or percentage changes. Although it
might be difficult to estimate the value of ancillary services in the future, Elia has the most
insight into this market through its knowledge and experience. Public price forecasts by
Elia would give potential capacity suppliers a better picture of their potential income,
which might increase the efficiency of the auctions. Capacity providers will be able to
make a better estimate of what they need in the FCR auction and ultimately also in the
CRM auction. Efficient market outcomes need relevant information for the participants.

112
9.4 Recommendations for further research
Several areas for further study have been discovered during the different stages of this
research. The first area is related to the development of the FCR market. As mentioned
in 5.4.3 there is no clear picture of how the FCR prices will develop in the future. The FCR
price has a significant impact on the competitiveness of BES and therefore is a relevant
area of study. However, it should be kept in mind that the FCR price is subject to many
uncertain factors such as the development of renewable energy generation, residential
batteries and further integration of European ancillary markets which is strongly
government policy-driven. Modelling future FCR price scenarios is a very complex subject
and probably interesting enough for a new master thesis. The second area is related to
the feasibility of switching between the intraday market and the FCR market. Deployment
strategies of the BESS could lead to optimal revenue stacking and might increase the
competitiveness of BES. It is interesting to investigate whether a quantitative model can
help to determine the optimal battery deployment in the intraday and FCR market, given
the price developments on both markets.
This research deals with uncertainty regarding BESS CAPEX, CRM auction parameters
and the FCR prices used for the scenarios. This uncertainty can be removed by adjusting
the input data of the research and may require less research compared to the other two
recommendations mentioned above. The accuracy of the results can be improved by
using real price quotes from BESS suppliers since this research assumes estimates at the
moment. The CRM rules and auction parameters will be published after this research so
assumptions have been made based on other European CRMs. Using the final de-rating
factor and strike price might influence the results. Furthermore, the FCR scenarios are
based on the prices from on July 1, 2019, untill September 30, 2019. Further integration
of the European ancillary services market starts from July 2020. Therefore, the price
might drop after July 2020 as discussed earlier and taking the prices over longer horizons
could affect the competitiveness of BES.

113
10 Reflection
10.1 Scientific relevance
Scientific research has been conducted on many aspects of this study, such as the
suitability of EES technologies per application, the central buyer mechanism based on
reliability options and the competitiveness of EES in this capacity mechanism. Besides,
the contribution of EES to the security of supply and specific market rules related to its
contribution has been studied.
During the literature review, it became clear that much was already known about EES
technologies and suitable applications in the electricity market. Besides, studies have
already been conducted on the central buyer mechanism based on reliability options in
general and the contribution of EES to the security of supply. The reflection on the Belgian
de-rating factor methodology has shown that the United Kingdom has a more appropriate
methodology for determining the contribution of BES based on EENS instead of LoLE. In
practice, the methodology of the United Kingdom is (financially) less favorable for BES
because it results in a lower capacity remuneration.
The reference price, strike price and the de-rating factor have emerged as important
factors for determining the competitiveness of BES during the investigation into the
Belgian CRM. The results have shown that the de-rating factor has a major impact on the
minimum remuneration that BES capacity providers require. The impact of the strike
price seems to be limited in this research. However, the determination of these
parameters and their impact on the competitiveness are underexposed in the existing
literature. This study constitutes a valuable contribution in the field of the impact of CRM
auction parameters on the competitiveness of BES.
This study has shown that Linny-R is a useful, easy-to-use software tool for determing the
expected income of BES. Linny-R has not been used in the past for this purpose in
scientific research. The added value lies mainly in running easily and fast multiple
experiments. For example, the effect of higher electricity prices, greater storage depth
and an increase number of cycles on the income could easily be calculated in Linny-R.

114
Many elements of this study have already been discussed in literature. The scientific
contribution of this research lies in the combination of from what is known from the
literature, new insights into the impact of auction parameters on the competitiveness and
a specific approach for assessing the competitiveness of BES in capacity markets based
on reliability options.
10.2 Societal relevance
This research has been conducted in response to an actual question from Eneco whether
it should participate with BES in the Belgian CRM. The constructed evaluation
competitiveness model can also be used by other capacity providers to assess their
competitiveness. The CRM was introduced to encourage investments in generation
capacity and offers an opportunity for the storage of (sustainable) energy through BES.
The social relevance lies in contributing to the formation of appropriate regulations for
the Belgian CRM to create a level playing field for all capacity providers in the auction.
This research shows that the strike price, de-rating factor and investment thresholds are
important factors that determine the competitiveness of BES. Incorrectly estimated CRM
auction parameters can reduce the participation of BES in capacity auctions, possibly in
favour of existing, polluting gas-fired power plants. Even though the contribution to
adequacy is a lot smaller for storage compared to conventional plants, it does contribute
to making the energy sector more sustainable.
10.3 Link to the EPA programme
The EPA Master’s programme focusses on the grand challenges of the 21st century. Policy,
politics, modelling and simulation are the core themes to approach challenges such as
flood risk, food security, clean energy and cybersecurity (TU Delft, n.d.). Battery storage
is strongly related to the grand challenge and seventh United Nations sustainable
development goal: affordable and clean energy for everyone (United Nations, 2015).
Several EPA methods, such as problem analysis, conceptual and quantitative modelling
have been conducted in this research. Subsequently, policy advice is given to Eneco based
on the model outcomes, which is in line with the qualifications of an EPA thesis.

115
11 References
Apricum. (2018). Dentists, clouds and virtual batteries – how residential energy storage
providers can drive market uptake in Germany. Retrieved from
https://www.apricum-group.com/residential-energy-storage-business-models-growth-
germany/
Arnaboldi, M., Azzone, G., & Giorgino, M. (2014). Performance measurement and
management for engineers. Academic Press.
Askanews. (2019). Arera: tutto pronto per l’avvio del mercato della capacità. Retrieved
from
https://www.askanews.it/economia/2019/09/04/arera-tutto-pronto-per-lavvio-del-
mercato-della-capacità-pn_20190904_00277/
Balci, O. (1994). Validation, verification, and testing techniques throughout the life cycle
of a simulation study. Annals of operations research, 53(1), 121-173.
Batlle, C., & Pérez-Arriaga, I. J. (2008). Design criteria for implementing a capacity
mechanism in deregulated electricity markets. Utilities Policy, 16(3), 184-193.
Belderbos, A., Delarue, E., & D'haeseleer, W. (2016). Calculating the levelized cost of
electricity storage. In Energy: Expectations and Uncertainty, 39th IAEE International
Conference, Jun 19-22, 2016. International Association for Energy Economics.
Belgisch Staatsblad. (2003). Wet houdende de geleidelijke uitstap uit kernenergie voor
industriële elektriciteitsproductie. Retrieved from
http://www.ejustice.just.fgov.be/eli/wet/2003/01/31/2003011096/justel
Belgische Kamer van volksvertegenwoordigers. (2019a). Wetontwerp tot wijziging van
de wet van 29 april 1999 betreffende de organisatie van de elektriciteitsmarkt, teneinde
een capaciteitsvergoedingsmechanisme in te stellen. Retrieved from
https://www.dekamer.be/FLWB/PDF/54/3584/54K3584007.pdf

116
Belgische Kamer van volksvertegenwoordigers. (2019b). Wetsvoorstel tot wijziging van
de wet van 29 april 1999 betreffende de organisatie van de elektriciteitsmarkt, teneinde
een capaciteitsvergoedingsmechanisme in te stellen (verslag). Retrieved from
http://www.dekamer.be/FLWB/PDF/54/3584/54K3584004.pdf
Bezerra, B., Barroso, L. A., Granville, S., Guimarães, A., Street, A., & Pereira, M. V. (2006).
Energy call options auctions for generation adequacy in Brazil. 2006 IEEE Power
Engineering Society General Meeting, Montreal, Que.
Bezerra, B., Barroso, L. A., & Pereira, M. V. (2011). Bidding strategies with fuel supply
uncertainty in auctions of long-term energy call options. IEEE Transactions on Power
Systems, 26(2), 653-660.
Bidwell, M. (2005). Reliability options: a market-oriented approach to long-term
adequacy. The Electricity Journal, 18(5), 11-25.
BloombergNEF. (2019a). A Behind the Scenes Take on Lithium-ion Battery Prices.
Retrieved from
https://about.bnef.com/blog/behind-scenes-take-lithium-ion-battery-prices/
BloombergNEF. (2019b). Energy Storage Investments Boom As Battery Costs Halve in the
Next Decade. Retrieved from
https://about.bnef.com/blog/energy-storage-investments-boom-battery-costs-halve-
next-decade/
Bots, P.W.G. (2017). Using offsets in Linny-R expressions. Unpublished document.
CEPA. (2019). I-SEM 2022/23 T-4 Capacity Auction Independent Auction Monitor Report.
Retrieved from
https://www.sem-o.com/documents/general-publications/2022-2023-T-4-Capacity-
Auction_Capacity-Auction-Monitor-Report_REDACTED.pdf

117
Cepeda, M., & Finon, D. (2011). Generation capacity adequacy in interdependent
electricity markets. Energy Policy, 39(6), 3128-3143.
Chen, H., Cong, T. N., Yang, W., Tan, C., Li, Y., & Ding, Y. (2009). Progress in electrical energy
storage system: A critical review. Progress in natural science, 19(3), 291-312.
Chuang, A. S., & Schwaegerl, C. (2009). Ancillary services for renewable integration.
In 2009 CIGRE/IEEE PES Joint Symposium Integration of Wide-Scale Renewable Resources
Into the Power Delivery System (pp. 1-1). IEEE.
Cho, J., & Kleit, A. N. (2015). Energy storage systems in energy and ancillary markets: A
backwards induction approach. Applied Energy, 147, 176-183.
Creswell, J. W. (2014). Research Design: Qualitative, Quantitative and Mixed Methods
Approaches (4th ed.). Thousand Oaks, CA: Sage.
CREG. (2015). Studie over ‘’de rentabiliteit van de elektriciteitsopslag in België’’.
Retrieved from
https://www.creg.be/sites/default/files/assets/Publications/Studies/F1412NL.pdf
CREG. (2019). Publiek raadplegingsdocument Ontwerpvoorstel (C)1907. Retrieved
https://www.creg.be/sites/default/files/assets/Consult/2019/CRM/PRD1907NL.pdf
DECC. (2013). Annex C: Reliability Standard Methodology. Retrieved
https://assets.publishing.service.gov.uk/government/uploads/system/uploads/attach
ment_data/file/223653/emr_consultation_annex_c.pdf
Dent, C., Wilson, A., & Zachary, S. (2017). Valuation of storage for capacity markets.
University of Edinburgh. Retrieved from:
https://www.emrdeliverybody.com/Lists/Latest%20News/Attachments/150/Duratio
n%20Limited%20Storage%20De-Rating%20Factor%20Assessment%20-%20Final.pdf
De Vries, L. J. (2007). Generation adequacy: Helping the market do its job. Utilities
Policy, 15(1), 20-35.

118
de Vries, L., Correljé, A., & Knops, H. (2017). Electricity: Market design and policy choice.
Divya, K. C., & Østergaard, J. (2009). Battery energy storage technology for power
systems—An overview. Electric power systems research, 79(4), 511-520.
Dufo-López, R., Lujano-Rojas, J. M., & Bernal-Agustín, J. L. (2014). Comparison of different
lead–acid battery lifetime prediction models for use in simulation of stand-alone
photovoltaic systems. Applied Energy, 115, 242-253.
Dvorkin, Y., Fernandez-Blanco, R., Kirschen, D. S., Pandžić, H., Watson, J. P., & Silva-
Monroy, C. A. (2017). Ensuring profitability of energy storage. IEEE Transactions on Power
Systems, 32(1), 611-623.
EirGrid., & SONI. (2018). Final Capacity Auction Results 2018/2019 T-1 Capacity Auction.
Retrieved from
https://www.sem-o.com/documents/general-publications/Capacity-Market-Final-
Capacity-Auction-Results-Report_FCAR1819T-1.pdf
EirGrid., & SONI. (2019a). Capacity Market Overview & Final 2022/2023 T-4 Auction
Results Summary. Retrieved from
https://www.sem-o.com/documents/general-publications/T-4-2022-2023-Final-
Capacity-Market-Auction-Overview.pdf
EirGrid., & SONI. (2019b). Final Capacity Auction Results 2019/2020 T-1 Capacity
Auction. Retrieved from
https://www.sem-o.com/documents/general-publications/T-1-2019-2020-Final-
Capacity-Auction-Results-Report.pdf
EirGrid., & SONI. (2019c). Capacity Remuneration Mechanism 2023/24 T-4 Capacity
Auction Parameters. Retrieved from
https://www.sem-o.com/documents/general-publications/Initial-Auction-Information-
Pack_IAIP2223T-4.pdf

119
Elia. (n.d. –a). Primary frequency control (0-30 sec) – Frequency Containment Reserve
(FCR, ex-R1). Retrieved from
http://www.elia.be/en/suppliers/purchasing-categories/energy-purchases/Ancillary-
services/Product-Description
Elia. (n.d. –b). Ancillary services. Retrieved from
https://www.elia.be/en/suppliers/purchasing-categories/energy-purchases/Ancillary-
services
Elia. (n.d. –c). Ancillary services. Retrieved from
https://www.elia.be/en/suppliers/purchasing-categories/energy-purchases/Ancillary-
services/Ancillary-Services-Volumes-Prices
Elia. (2016a). Studie over de nood aan ‘adequacy’ en flexibiliteit in het Belgische
elektriciteitssysteem. Retrieved from
http://www.elia.be/~/media/files/Elia/publications-
2/studies/160422_ELIA_AdequacyReport_2017-2027_NL.pdf
Elia. (2017a). R2 non-CIPU. Description and conclusions of the pilot project assessment
of implications of transfer of energy. Retrieved from
https://www.elia.be/~/media/files/Elia/users-group/Working-Group-
Balancing/20171221_R2-non-CIPU-Report.pdf
Elia. (2017b). Electricity Scenarios for Belgium Towards 2050. Retrieved from
https://www.elia.be/-/media/project/elia/elia-site/public-consultations/annual-
report/en/20171114_elia_4584_adequacyscenario.pdf
Elia. (2018a). aFRR product design note Market Development. Retrieved from
https://www.elia.be/-/media/project/elia/elia-site/public-
consultations/20180903_consultation_document_1_proposal_for_afrr_product_design_n
ote_en.pdf

120
Elia. (2018b). Study on the evolution towards a daily procurement of mFRR Market
Development. Retrieved from
https://www.elia.be/~/media/files/Elia/publications-2/Public-
Consultation/2018/22052018_Study-on-the-evolution-towards-a-daily-procurement-
of-mFRR.pdf
Elia. (2018c). Proposal for an implementation plan for new aFRR design and separated
procurement of FCR and aFRR. Retrieved from
https://www.elia.be/~/media/files/Elia/users-group/Working-Group-
Balancing/Projects%20and%20publications/R2-aFRR/20190114_Implementation-
study-aFRR-final-update-feedback-stakeholders-final-without-TC.pdf
Elia. (2019a). Elia releases its figures on Belgium's 2018 energy mix. Retrieved from
http://www.elia.be/~/media/files/Elia/PressReleases/2019/20190118_Press-
Release-Chiffres-2018_EN.pdf
Elia. (2019b). FCR service design note Market Development. Retrieved from
https://www.elia.be/-/media/project/elia/elia-site/electricity-market/system-
services/system-services-pdf-document-library/03-balancing-services-bsp/03-fcr/02-
design/2019-design-note-fcr-for-2020.pdf
Elia. (2019c). R3 down design note. Retrieved from
https://www.elia.be/~/media/files/Elia/users-group/Working-Group-
Balancing/Projects%20and%20publications/20180905_Design-note-R3-down.pdf
Elia. (2019d). Electricity scenarios for Belgium towards 2050. Retrieved from
http://www.elia.be/~/media/files/Elia/publications-
2/studies/20190628_ELIA_Adequacy_and_flexibility_study_NL.pdf
Elia. (2019e). CRM Design Note: Derating factors. Retrieved from
https://www.elia.be/-/media/project/elia/elia-site/public-
consultations/20191002/crm-design-note---derating-factors.pdf
http://www.elia.be/~/media/files/Elia/PressReleases/2019/20190118_Press-Release-Chiffres-2018_EN.pdf

121
Elia. (2019f). Product Design principles - Strike & reference price. Retrieved from
https://www.elia.be/~/media/files/Elia/users-group/TF_CRM/08_Reference-and-
Strike-price_20190426_TFCRM1.pdf
Elia. (2019g). Reference & Strike price: Overview of current proposals. Retrieved from
https://www.elia.be/~/media/files/Elia/users-
group/TF_CRM/08_20190613_TFCRM3_Strike-Reference-price.pdf
Elia. (2019h). TF CRM. Retrieved from
https://www.elia.be/nl/users-group/Implementation%20CRM/TF%20CRM
Elia. (2019i). Kick-off TF CRM. Retrieved from
http://www.elia.be/~/media/files/Elia/users-group/20190327_Kick-off-TF-CRM.pdf
Elia. (2019j). CRM Design Note: Secondary Market. Retrieved from
https://www.elia.be/-/media/project/elia/elia-site/public-
consultations/20191002/crm-design-note---secondary-market.pdf
Elia. (2019k). CRM Design Note: Availability Obligations and Penalties. Retrieved from
https://www.elia.be/-/media/project/elia/elia-site/public-
consultations/20190913/20190913_design_note_availability_obligations_and_penalties
Elia. (2019l). Overview of Belgian CRM Design: introduction note. Retrieved from
https://www.elia.be/-/media/project/elia/elia-site/public-
consultations/20190913/20190913_overview_crm_design.pdf
Elia. (2019m). CRM Design Note: Payback Obligation. Retrieved from
https://www.elia.be/-/media/project/elia/elia-site/public-
consultations/20191002/crm-design-note-payback-obligation.pdf

122
Elia. (2019n). Werkingregels voor strategische reserve Retrieved from
https://www.elia.be/-/media/project/elia/elia-site/strategic-reserve/722-
adequacy_strategic-reserve/03_functioning-rules/sr_fr-2019-20_nl.pdf
Elexys. (2019). Spot Belpex. Retrieved from
https://my.elexys.be/MarketInformation/SpotBelpex.aspx
Eller, A. (2019). Navigant: ‘Risk of slower than expected price declines’ for lithium
batteries but prices will fall. Retrieved from
https://www.energy-storage.news/news/navigant-risk-of-slower-than-expected-price-
declines-for-lithium-batteries
Eneco. (n.d. -a). Wind op land: productiecapaciteit (MW). Retrieved from
https://www.eneco.nl/over-ons/nieuws-en-
cijfers/energiecijfers/energiebronnen/wind-op-land/
Eneco. (n.d. -b). Wind op zee: productiecapaciteit (MW). Retrieved from
https://www.eneco.nl/over-ons/nieuws-en-
cijfers/energiecijfers/energiebronnen/wind-op-zee/
Eneco. (n.d. -c). Zon: productiecapaciteit (MW). Retrieved from
https://www.eneco.nl/over-ons/nieuws-en-
cijfers/energiecijfers/energiebronnen/zon/
Eneco. (2018). Europe's largest battery ready for its role in the energy market. Retrieved
from
https://news.enecogroup.com/europes-largest-battery-ready-for-its-role-in-the-
energy-market/
Eneco. (2019). Energy Transition | Mission: sustainable energy for everyone. Retrieved
from
https://www.eneco.com/who-we-are/energy-transition/

123
Endesa. (2017). Endesa signs agreement with EPS to build largest electric battery system
in Spain. Retrieved from
https://www.endesa.com/en/press/news/d201709-endesa-signs-agreement-eps.html
Enel. (2018). Enel Green Power, Enertrag, Leclanché inaugurate 22 MW Cremzow battery
energy storage system in Germany. Retrieved from
https://www.enel.com/media/press/d/2019/05/enel-green-power-enertrag-leclanch-
inaugurate-22-mw-cremzow-battery-energy-storage-system-in-germany-
ENTSO-E. (n.d. -a). Electricity Balancing. Retrieved from
https://www.entsoe.eu/network_codes/eb/
ENTSO-E. (n.d. -b). Operations. Retrieved from
https://www.entsoe.eu/network_codes/sys-ops/
ENTSO-E. (2009) P1 – Policy 1: Load-Frequency Control and Performance [C]. Retrieved
from
https://www.entsoe.eu/fileadmin/user_upload/_library/publications/entsoe/Operatio
n_Handbook/Policy_1_final.pdf
ENTSO-E. (2018a). Explanatory note for Additional Properties of
Frequency Containment Reserves. Retrieved from
https://consultations.entsoe.eu/system-operations/synchronous-area-operational-
agreement-policy-1-
lo/supporting_documents/Article_A2_Explanatory_Note_for_Additional%20properties
%20of%20FCR.pdf
ENTSO-E. (2018b). Electricity balancing in Europe. An overview of the European
balancing market and electricity balancing guideline. Retrieved from
https://docstore.entsoe.eu/Documents/Network%20codes%20documents/NC%20EB/
entso-e_balancing_in%20_europe_report_Nov2018_web.pdf

124
Energy Storage Association. (n.d. -a). Grid Operations Benefits. Retrieved from
http://energystorage.org/energy-storage/energy-storage-benefits/benefit-
categories/grid-operations-benefits
Energy Storage News. (2019). UK’s evolving ESS market likely to take installed base
above 1.2GW this year. Retrieved from
https://www.energy-storage.news/blogs/uks-evolving-business-models-likely-to-take-
installed-base-above-1.2gw-this
EPEX SPOT. (n.d. -a). Latest Market Results. Retrieved from
https://www.belpex.be/
EPEX SPOT. (n.d. -b). EPEX SPOT DAM. Retrieved from
https://www.belpex.be/trading-clearing/dam/
EPEX SPOT. (n.d. -c). EPEX SPOT CIM. Retrieved from
https://www.belpex.be/trading-clearing/belpex-cim/
EPEX SPOT. (n.d. -d). Belgian SRM. Retrieved from
https://www.belpex.be/trading-clearing/belpex-srm/
EPEX SPOT. (n.d. -e). Product specifications. Retrieved from
https://www.belpex.be/trading/product-specification/
European Commission. (n.d.). State aid to secure electricity supplies. Retrieved from
http://ec.europa.eu/competition/sectors/energy/state_aid_to_secure_electricity_suppl
y_en.html
European Commission. (2015). Capacity Mechanisms Working Group: High level
comparison of capacity mechanism models and compatibility with state aid guidelines.
Retrieved from
http://ec.europa.eu/competition/sectors/energy/capacity_mechanisms_working_grou
p_10_en.pdf

125
European Commission. (2017a). State aid No. SA.44464 (2017/N) – Ireland
Irish Capacity Mechanism. Retrieved from
http://ec.europa.eu/competition/state_aid/cases/267880/267880_1948214_166_2.pdf
European Commission. (2017b). Commission regulation (EU) 2017/2195
of 23 November 2017 establishing a guideline on electricity balancing. Retrieved from
https://eur-lex.europa.eu/legal-
content/EN/TXT/PDF/?uri=CELEX:32017R2195&from=EN
European Commission. (2017c). COMMISSION REGULATION (EU) 2017/1485. Retrieved
from
https://eur-lex.europa.eu/legal-
content/EN/TXT/PDF/?uri=CELEX:32017R1485&from=EN
European Commission. (2018). State Aid SA.42011 (2017/N) – Italy – Italian Capacity
Mechanism. Retrieved from
http://ec.europa.eu/competition/state_aid/cases/270875/270875_1979508_218_2.pdf
European Parliament and of the Council (2019). On the internal market for electricity.
(Regulation 2019/943). Retrieved from
https://eur-lex.europa.eu/legal-
content/EN/TXT/HTML/?uri=CELEX:32019R0943&from=FR
Evans, A., Strezov, V., & Evans, T. J. (2012). Assessment of utility energy storage options
for increased renewable energy penetration. Renewable and Sustainable Energy
Reviews, 16(6), 4141-4147.
Evans, M. P., Tindemans, S. H., & Angeli, D. (2019). Minimising Unserved Energy Using
Heterogeneous Storage Units. IEEE Transactions on Power Systems, 34(5), 3647–3656.
Ferreira, H. L., Garde, R., Fulli, G., Kling, W., & Lopes, J. P. (2013). Characterisation of
electrical energy storage technologies. Energy, 53, 288-298.

126
Finon, D., & Pignon, V. (2008). Electricity and long-term capacity adequacy: The quest for
regulatory mechanism compatible with electricity market. Utilities Policy, 16(3), 143-158.
FOD Economie (2015). Studie inzake de mogelijkheden tot opslag van elektriciteit die in
België kunnen worden aangewend op de korte, middellange en lange termijn teneinde bij
te dragen tot de bevoorradingszekerheid van elektriciteit. Retrieved from
https://anzdoc.com/studie-inzake-de-mogelijkheden-tot-opslag-van-elektriciteit.html
Genc, T. S. (2012). Equilibrium predictions in wholesale electricity markets. Handbook of
Networks in Power Systems I, 263-279.
Gonzalez-Salazar, M. A., Kirsten, T., & Prchlik, L. (2018). Review of the operational
flexibility and emissions of gas-and coal-fired power plants in a future with growing
renewables. Renewable and Sustainable Energy Reviews, 82, 1497-1513.
Hancher, L., de Hauteclocque, A., & Sadowska, M. (2015). Capacity mechanisms in the EU
energy market: law, policy, and economics. Oxford: Oxford University Press.
Harbord, D., & Pagnozzi, M. (2014). Britain's electricity capacity auctions: lessons from
Colombia and New England. The Electricity Journal, 27(5), 54-62.
Henriques, M. V., & Stikkelman, R. M. (2017). Assessing storage and substitution as power
flexibility enablers in industrial processes. In 2017 14th International Conference on the
European Energy Market (EEM) (pp. 1-6). IEEE.
Hu, W., Chen, Z., & Bak-Jensen, B. (2010). Optimal operation strategy of battery energy
storage system to real-time electricity price in Denmark. In IEEE PES general meeting (pp.
1-7). IEEE.
Ho, T. S., & Lee, S. B. (2004). The Oxford Guide to Financial Modeling: Applications for
Capital Markets, Corporate Finance, Risk Management and Financial Institutions. Oxford
University Press.

127
IEA (2018). World Energy Outlook 2018. Retrieved from
https://www.iea.org/weo2018/
Ibrahim, H., Ilinca, A., & Perron, J. (2008). Energy storage systems—Characteristics and
comparisons. Renewable and sustainable energy reviews, 12(5), 1221-1250.
Infigen (2018). Lake Bonney Battery Energy Storage System. Retrieved from
https://www.infigenenergy.com/lake-bonney-battery-energy-storage-system-0/
IRENA (2017). Electricity Storage and Renewables: Costs and Markets to 2030,
International Renewable Energy Agency, Abu Dhabi. Retrieved from
https://www.irena.org/publications/2017/Oct/Electricity-storage-and-renewables-
costs-and-markets
Karloff, H. (2008). Linear programming. Springer Science & Business Media.
KBC. (2018). Dit moet u weten over de nieuwe vennootschapsbelasting. Retrieved from
https://www.kbc.be/ondernemen/nl/nieuws/zaak-praktijk-en-u/nieuwe-
vennootschapsbelasting.html
Konstantelos, I., & Strbac, G. (2018). Capacity value of energy storage in distribution
networks. Journal of Energy Storage, 18, 389-401.
Liljeblom, E., & Vaihekoski, M. (2004). Investment evaluation methods and required rate
of return in Finnish publicly listed companies. Finnish Journal of Business
Economics, 53(1).
Limpens, G., & Jeanmart, H. (2018). Electricity storage needs for the energy transition: An
EROI based analysis illustrated by the case of Belgium. Energy, 152, 960-973.
Lu, C. C., Ying, K. C., & Chen, H. J. (2016). Real-time relief distribution in the aftermath of
disasters–A rolling horizon approach. Transportation research part E: logistics and
transportation review, 93, 1-20.

128
Luo, X., Wang, J., Dooner, M., & Clarke, J. (2015). Overview of current development in
electrical energy storage technologies and the application potential in power system
operation. Applied energy, 137, 511-536.
Mercier, P., Cherkaoui, R., & Oudalov, A. (2009). Optimizing a battery energy storage
system for frequency control application in an isolated power system. IEEE Transactions
on Power Systems, 24(3), 1469-1477.
Meulman, L., & Méray, N. (2012). Capacity Mechanisms in Northwest Europe. Between a
Rock and a Hard Place. Retrieved from
http://www.clingendaelenergy.com/inc/upload/files/Capacity_mechanisms.pdf
Mulder, M. (2017). Energietransitie en elektriciteitsmarkt: verkenning van een
gespannen relatie. Policy Papers, 1, 3-68.
National Grid. (2015). Final Auction Results. T-4 Capacity Market Auction for 2019/20.
Retrieved from
https://www.emrdeliverybody.com/Capacity%20Markets%20Document%20Library/
T-4%202015%20Final%20Results%20Report.pdf
National Grid. (2016). Final Auction Results. T-4 Capacity Market Auction for 2020/21.
Retrieved from
https://www.emrdeliverybody.com/Capacity%20Markets%20Document%20Library/
T-4%202016%20Final%20Results%20Report.pdf
National Grid. (2017). Duration-Limited Storage De-Rating Factor Assessment – Final
Report. Retrieved from
https://www.emrdeliverybody.com/Lists/Latest%20News/Attachments/150/Duratio
n%20Limited%20Storage%20De-Rating%20Factor%20Assessment%20-%20Final.pdf

129
National Grid. (2018a). Final Auction Results. T-1 Capacity Market Auction for 2018/19.
Retrieved from
https://www.emrdeliverybody.com/Capacity%20Markets%20Document%20Library/
T-1%202017%20Final%20Results%20Report.pdf
National Grid. (2018b). Final Auction Results. T-4 Capacity Market Auction for 2021/22.
Retrieved from
https://www.emrdeliverybody.com/Capacity%20Markets%20Document%20Library/
T-4%202017%20Final%20Results%20Report.pdf
National Grid. (2018c). Capacity Market Auction Guidelines. 2018 year ahead Capacity
Auction (T-1) and 2018 four year ahead Capacity Auction (T-4). Retrieved from
https://www.emrdeliverybody.com/Lists/Latest%20News/Attachments/197/Auction
%20Guidelines%202018%20v2.0.pdf
National Grid. (2019). Final Auction Report 2018 year ahead Capacity Auction (T-1)
Delivery year 2019/20. Between a Rock and a Hard Place. Retrieved from
https://www.emrdeliverybody.com/Capacity%20Markets%20Document%20Library/
T-1%202018%20Final%20Results%20Report%20(DY%2019-20).pdf
Newbery, D. (2016). Missing money and missing markets: Reliability, capacity auctions
and interconnectors. Energy Policy, 94, 401-410.
Oudalov, A., Chartouni, D., & Ohler, C. (2007). Optimizing a battery energy storage system
for primary frequency control. IEEE Transactions on Power Systems, 22(3), 1259-1266.
Pena-Alzola, R., Sebastián, R., Quesada, J., & Colmenar, A. (2011). Review of flywheel based
energy storage systems. In 2011 International Conference on Power Engineering, Energy
and Electrical Drives (pp. 1-6). IEEE.
Pérez-Arriaga, I. J. (1999). Reliability and generation adequacy. IEEE Power Engineering
Review, 19(12), 6-9.
130
Poullikkas, A. (2013). A comparative overview of large-scale battery systems for
electricity storage. Renewable and Sustainable energy reviews, 27, 778-788.
PwC. (2018). Bepaling van het mechanisme voor de vergoeding van capaciteit voor België
en de voorbereiding van het wettelijk kader. Retrieved from
https://economie.fgov.be/sites/default/files/Files/Energy/Rapport-Bepaling-van-het-
mechanisme-voor-de-vergoeding-van-capaciteit-voor-Belgie-en-de-voorbereiding-van-
het-wettelijk-kader.pdf
Regelleistung. (n.d. -a). Tender overview. Retrieved from
https://www.regelleistung.net/ext/static/prl?lang=en
Regelleistung. (n.d. -b). Datacenter FCR/aFRR/mFRR. Retrieved from
https://www.regelleistung.net/apps/datacenter/tenders/
Rozporządzenie Minstra Energii. (2018). w sprawie parametrów aukcji głównych dla
okresów dostaw przypadających na lata 2021–2023. Retrieved from
http://prawo.sejm.gov.pl/isap.nsf/download.xsp/WDU20180001632/O/D20181632.p
df
RTE. (2019). Continental Europe synchronous area frequency data metered by RTE 2019.
Retrieved from
https://clients.rte-france.com/servlets/FrequencesServlet?annee=2019
Sioshansi, R., Madaeni, S. H., & Denholm, P. (2013). A dynamic programming approach to
estimate the capacity value of energy storage. IEEE Transactions on Power Systems, 29(1),
395-403.
Soloveichik, G. L. (2011). Battery technologies for large-scale stationary energy storage.
Annual review of chemical and biomolecular engineering, 2, 503-527.
Statbel. (2019). Consumptieprijsindex. Retrieved from
https://statbel.fgov.be/nl/themas/consumptieprijsindex/consumptieprijsindex

131
Terna. (2019). July 2019 Monthly Report on the Electricity System. Retrieved from
https://download.terna.it/terna/Monthly%20Report%20on%20the%20Electricity%2
0System_July%202019_8d732d20b82a06f.pdf
Thirugnanam, K., Saini, H., & Kumar, P. (2012). Mathematical modeling of Li-ion battery
for charge/discharge rate and capacity fading characteristics using genetic algorithm
approach. 2012 IEEE Transportation Electrification Conference and Expo (ITEC), 1-6.
TU Delft. (n.d.). MSc Engineering and Policy Analysis. Retrieved from
https://www.tudelft.nl/onderwijs/opleidingen/masters/epa/msc-engineering-and-
policy-analysis/
United Nations. (2015). Sustainable Development Goals: Ensure access to affordable,
reliable, sustainable and modern energy. Retrieved from
https://www.un.org/sustainabledevelopment/energy/
UNFCCC. (2015). Paris Agreement. Retrieved from
https://unfccc.int/process-and-meetings/the-paris-agreement/the-paris-agreement
US DOE. (2017). DOE Global Energy Storage Database. United States Department of
Energy. Office of Electricity & Energy Reliability. Retrieved from
https://www.irena.org/media/Files/IRENA/Agency/Publication/2017/Oct/IRENA_Ele
ctricity_Storage_Costs_2017.pdf
Valenzuela, J., & Mazumdar, M. (2001). Monte Carlo computation of power generation
production costs under operating constraints. IEEE Transactions on Power
Systems, 16(4), 671-677.
Van den Bergh, K., Bruninx, K., Delarue, E., & D’haeseleer, W. (2014). A mixed-integer
linear formulation of the unit commitment problem. WP EN2014-07.
132
Vázquez, C., Rivier, M., & Pérez-Arriaga, I. J. (2002). A market approach to long-term
security of supply. IEEE Transactions on power systems, 17(2), 349-357.
Vázquez, C., Batlle, C., Rivier, M., & Pérez-Arriaga, I. J. (2003). Security of supply in the
Dutch electricity market: the role of reliability options. Retrived from
https://www.iit.comillas.edu/batlle/Docs/2003%20Security%20of%20supply%20in%
20the%20Dutch%20electricity%20market%20The%20role%20of%20reliability%20o
ptions.pdf
VREG. (2019). Marktgegevens elektriciteit 2019: Marktaandelen actieve leveranciers.
Retrieved from
https://www.vreg.be/sites/default/files/statistieken/marktaandelen/20190312-e-nl-
martkaandeel_maandelijks_netbeheerderds_h_plus_nh.pdf
Wang, W., Li, C., Liao, X., & Qin, H. (2017). Study on unit commitment problem considering
pumped storage and renewable energy via a novel binary artificial sheep
algorithm. Applied energy, 187, 612-626.
World Bank. (2019). Four Things You Should Know About Battery Storage. Retrieved
from
https://www.worldbank.org/en/news/feature/2019/05/16/four-things-you-should-
know-about-battery-storage
XE. (2019). XE Currency Converter. Retrieved from
https://www.xe.com/currencyconverter/convert/?Amount=1&From=EUR&To=USD
Zhou, Y., Mancarella, P., & Mutale, J. (2015). Modelling and assessment of the contribution
of demand response and electrical energy storage to adequacy of supply. Sustainable
Energy, Grids and Networks, 3, 12-23.

133
12. Appendices
12.1 Full cycle definition
An important performance characteristic for the lifetime of batteries is the cycle life. The
cycle life is defined as the number of (full round) charge and after that discharge cycles
before it no longer meets performance standards (Thirugnanam, Saini, & Kumar, 2012).
It is also closely related to the storage costs because of the more cycles a battery performs,
the shorter the battery’s lifetime, which increases the storage costs. The cycling process
of charging and discharging is shown in figure 14.
Figure 28. Cycling process (Thirugnanam, Saini., & Kumar, 2012).
In this research, the definition of an equivalent full-cycle refers to the full charge, and after
that, the full discharge of a BESS with one hour of storage depth. Batteries with a greater
storage depth require fewer (full) cycles for the same operation in the energy market. For
BESS with greater storage depth, the number of performance cycles should be divided by
the hours of storage depth.
Suppose, a BESS is deployed in the FCR market and is obligated to make 160 cycles per
year. According to the definition in this research, a BESS with 1 hour of storage depth
requires 160 cycles but a BESS with 2 hours of storage depth requires 80 cycles and a
BESS with 4 hours requires 40 cycles etc.

134
12.2 Intraday market
12.2.1 Input prices
The table below shows, as an example, first the 24 hours intraday market prices of the
years 2020-2030. 2018 is the initial year. The prices for 2020, 2023, 2025, 2028 and 2030
has been calculated based on the price scenarios mentioned in 5.2.1.
2018-2020: -20,4%
2020-2023: +13,6%
2023-2025: -2%
2025-2028: -8,2%
2028-2030: +13,3%
The prices of 2021, 2022, 2025, 2026, 2027 and 2029 are approximated through linear
interpolation between the calculated years.
Date 2018 2020 2021 2022 2023 2024 2025 2026 2027 2028 2029 2030
1-01-18 0:00 25,00 19,90 20,80 21,70 22,61 22,38 22,15 21,55 20,94 20,34 21,69 23,04
1-01-18 1:00 25,00 19,90 21,25 22,16 22,61 22,38 22,15 21,55 20,94 20,34 21,69 23,04
1-01-18 2:00 -0,74 -0,59 -0,63 -0,65 -0,67 -0,66 -0,65 -0,64 -0,62 -0,59 -0,64 -0,68
1-01-18 3:00 11,81 9,40 10,04 10,47 10,68 10,58 10,47 10,18 9,90 9,61 10,25 10,89
1-01-18 4:00 -5,52 -4,39 -4,69 -4,89 -4,99 -4,94 -4,89 -4,76 -4,62 -4,49 -4,79 -5,09
1-01-18 5:00 -34,76 -27,67 -29,55 -30,81 -31,44 -31,12 -30,81 -29,96 -29,12 -28,28 -30,16 -32,04
1-01-18 6:00 -20,36 -16,20 -17,30 -18,04 -18,41 -18,22 -18,04 -17,55 -17,05 -16,56 -17,66 -18,76
1-01-18 7:00 -22,99 -18,30 -19,55 -20,38 -20,79 -20,58 -20,37 -19,82 -19,26 -18,70 -19,95 -21,19
1-01-18 8:00 -16,14 -12,84 -13,72 -14,30 -14,59 -14,45 -14,30 -13,91 -13,52 -13,13 -14,00 -14,87
1-01-18 9:00 -12,29 -9,78 -10,45 -10,89 -11,11 -11,00 -10,89 -10,59 -10,30 -9,99 -10,66 -11,33
1-01-18 10:00 -8,45 -6,72 -7,18 -7,48 -7,64 -7,56 -7,48 -7,28 -7,08 -6,87 -7,33 -7,78
1-01-18 11:00 -4,60 -3,66 -3,91 -4,08 -4,16 -4,12 -4,08 -3,96 -3,85 -3,74 -3,99 -4,24
1-01-18 12:00 16,45 13,09 13,98 14,57 14,87 14,72 14,57 14,17 13,78 13,38 14,27 15,16
1-01-18 13:00 12,52 9,97 10,64 11,10 11,32 11,21 11,09 10,79 10,49 10,19 10,86 11,54
1-01-18 14:00 15,11 12,03 12,85 13,39 13,67 13,53 13,39 13,03 12,66 12,30 13,11 13,93
1-01-18 15:00 20,68 16,46 17,58 18,33 18,70 18,51 18,33 17,83 17,33 16,82 17,94 19,06
1-01-18 16:00 31,86 25,36 27,08 28,23 28,81 28,52 28,23 27,46 26,69 25,91 27,64 29,36
1-01-18 17:00 51,80 41,24 44,04 45,91 46,84 46,37 45,91 44,65 43,40 42,14 44,94 47,75
1-01-18 18:00 63,08 50,21 53,63 55,91 57,04 56,47 55,90 54,37 52,85 51,32 54,73 58,14
1-01-18 19:00 76,87 61,19 65,35 68,12 69,51 68,81 68,12 66,26 64,39 62,53 66,69 70,85
1-01-18 20:00 71,53 56,94 60,81 63,39 64,68 64,04 63,39 61,66 59,93 58,19 62,06 65,93
1-01-18 21:00 56,91 45,30 48,38 50,44 51,46 50,95 50,43 49,05 47,68 46,30 49,38 52,45
1-01-18 22:00 24,99 19,90 21,25 22,15 22,60 22,37 22,15 21,54 20,94 20,33 21,68 23,04
1-01-18 23:00 25,94 20,65 22,06 22,99 23,46 23,23 22,99 22,36 21,73 21,11 22,51 23,91

135
12.2.2 Income build year 2020
Assuming (maximum) 301 full equivalent cycles per year and 1-hour storage depth.
Year Intraday market income[€/MW/year]
2021 15.957
2022 16.750
2023 16.934
2024 16.685
2025 16.749
2026 16.119
2027 15.768
2028 15.269
12.2.3 Income build year 2025
Assuming (maximum) 379 full equivalent cycles per year and 1-hour storage depth.
Year Intraday market income[€/MW/year]
2026 17.860
2027 17.358
2028 16.856
2029 18.633
2030 18.780
2031 18.780
2032 18.780
2033 18.780
Assuming (maximum) 379 full equivalent cycles per year and 2-hour storage depth.
Year Intraday market income[€/MW/year]
2026 22.434
2027 21.920
2028 21.376
2029 23.509
2030 23.817
2031 23.817
2032 23.817
2033 23.817

136
12.2.4 Income build year 2030
Assuming (maximum) 479 full equivalent cycles per year and 1 hour storage depth
Year Intraday market income[€/MW/year]
2031 17.860
2032 17.860
2033 17.860
2034 17.860
2035 17.860
2036 17.860
2037 17.860
2038 17.860

137
12.3 FCR market
12.3.1 Cycles and energy delivery on FCR market
The table below shows the parameters and values assumed for calculating the minimum
(full equivalent) cycles to meet the FCR requirements.
parameters Value Unit
Nominal frequency 50 [Hz]
Minimum frequency deviation 0,01 [Hz]
Maximum frequency deviation 0,2 [Hz]
time unit 360 [s]
correction factor (1/ time unit) 0,002778 [1/s]
Initial state of charge 3,35 [MWh]
Energy capacity 6,7 [MWh]
Minimum State of Charge 2,5 [MWh]
Maximum State of Charge 4,2 [MWh]
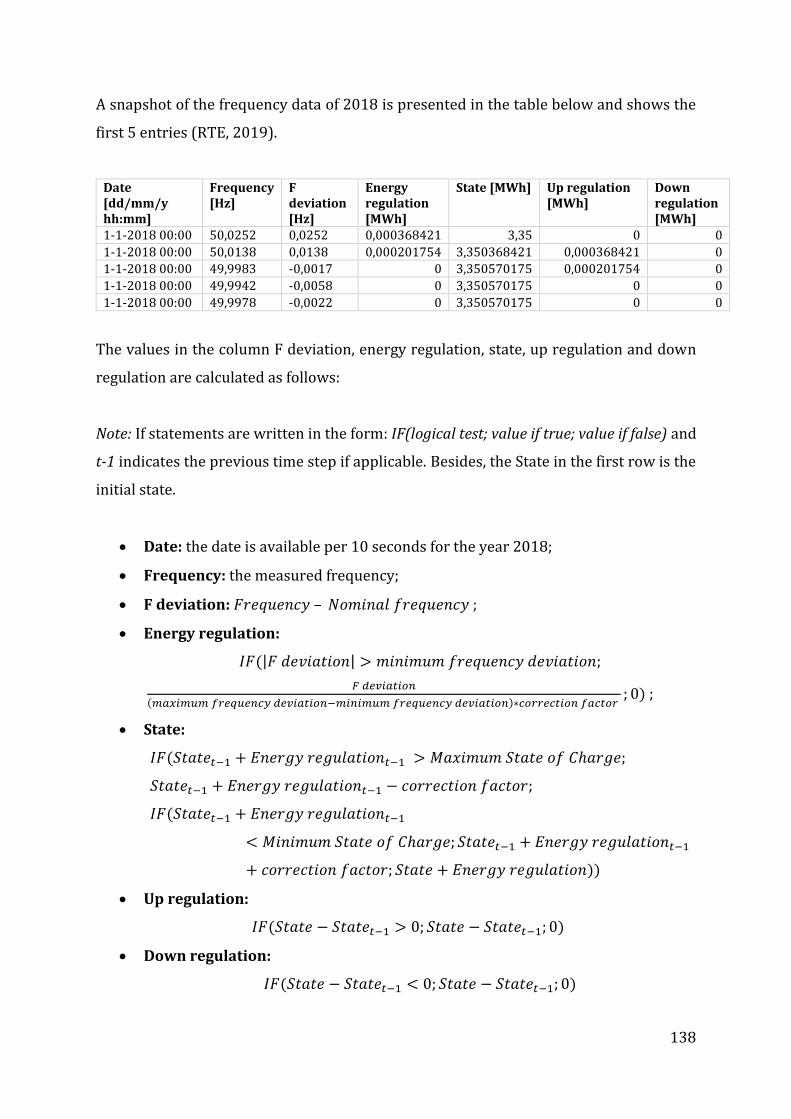
138
A snapshot of the frequency data of 2018 is presented in the table below and shows the
first 5 entries (RTE, 2019).
Date [dd/mm/y hh:mm]
Frequency [Hz]
F deviation [Hz]
Energy regulation [MWh]
State [MWh] Up regulation [MWh]
Down regulation [MWh]
1-1-2018 00:00 50,0252 0,0252 0,000368421 3,35 0 0
1-1-2018 00:00 50,0138 0,0138 0,000201754 3,350368421 0,000368421 0
1-1-2018 00:00 49,9983 -0,0017 0 3,350570175 0,000201754 0
1-1-2018 00:00 49,9942 -0,0058 0 3,350570175 0 0
1-1-2018 00:00 49,9978 -0,0022 0 3,350570175 0 0
The values in the column F deviation, energy regulation, state, up regulation and down
regulation are calculated as follows:
Note: If statements are written in the form: IF(logical test; value if true; value if false) and
t-1 indicates the previous time step if applicable. Besides, the State in the first row is the
initial state.
Date: the date is available per 10 seconds for the year 2018;
Frequency: the measured frequency;
F deviation: 𝐹𝑟𝑒𝑞𝑢𝑒𝑛𝑐𝑦 – 𝑁𝑜𝑚𝑖𝑛𝑎𝑙 𝑓𝑟𝑒𝑞𝑢𝑒𝑛𝑐𝑦 ;
Energy regulation:
𝐼𝐹(|𝐹 𝑑𝑒𝑣𝑖𝑎𝑡𝑖𝑜𝑛| > 𝑚𝑖𝑛𝑖𝑚𝑢𝑚 𝑓𝑟𝑒𝑞𝑢𝑒𝑛𝑐𝑦 𝑑𝑒𝑣𝑖𝑎𝑡𝑖𝑜𝑛;
𝐹 𝑑𝑒𝑣𝑖𝑎𝑡𝑖𝑜𝑛
(𝑚𝑎𝑥𝑖𝑚𝑢𝑚 𝑓𝑟𝑒𝑞𝑢𝑒𝑛𝑐𝑦 𝑑𝑒𝑣𝑖𝑎𝑡𝑖𝑜𝑛−𝑚𝑖𝑛𝑖𝑚𝑢𝑚 𝑓𝑟𝑒𝑞𝑢𝑒𝑛𝑐𝑦 𝑑𝑒𝑣𝑖𝑎𝑡𝑖𝑜𝑛)∗𝑐𝑜𝑟𝑟𝑒𝑐𝑡𝑖𝑜𝑛 𝑓𝑎𝑐𝑡𝑜𝑟 ; 0) ;
State:
𝐼𝐹(𝑆𝑡𝑎𝑡𝑒𝑡−1 + 𝐸𝑛𝑒𝑟𝑔𝑦 𝑟𝑒𝑔𝑢𝑙𝑎𝑡𝑖𝑜𝑛𝑡−1 > 𝑀𝑎𝑥𝑖𝑚𝑢𝑚 𝑆𝑡𝑎𝑡𝑒 𝑜𝑓 𝐶ℎ𝑎𝑟𝑔𝑒;
𝑆𝑡𝑎𝑡𝑒𝑡−1 + 𝐸𝑛𝑒𝑟𝑔𝑦 𝑟𝑒𝑔𝑢𝑙𝑎𝑡𝑖𝑜𝑛𝑡−1 − 𝑐𝑜𝑟𝑟𝑒𝑐𝑡𝑖𝑜𝑛 𝑓𝑎𝑐𝑡𝑜𝑟;
𝐼𝐹(𝑆𝑡𝑎𝑡𝑒𝑡−1 + 𝐸𝑛𝑒𝑟𝑔𝑦 𝑟𝑒𝑔𝑢𝑙𝑎𝑡𝑖𝑜𝑛𝑡−1
< 𝑀𝑖𝑛𝑖𝑚𝑢𝑚 𝑆𝑡𝑎𝑡𝑒 𝑜𝑓 𝐶ℎ𝑎𝑟𝑔𝑒; 𝑆𝑡𝑎𝑡𝑒𝑡−1 + 𝐸𝑛𝑒𝑟𝑔𝑦 𝑟𝑒𝑔𝑢𝑙𝑎𝑡𝑖𝑜𝑛𝑡−1
+ 𝑐𝑜𝑟𝑟𝑒𝑐𝑡𝑖𝑜𝑛 𝑓𝑎𝑐𝑡𝑜𝑟; 𝑆𝑡𝑎𝑡𝑒 + 𝐸𝑛𝑒𝑟𝑔𝑦 𝑟𝑒𝑔𝑢𝑙𝑎𝑡𝑖𝑜𝑛))
Up regulation:
𝐼𝐹(𝑆𝑡𝑎𝑡𝑒 − 𝑆𝑡𝑎𝑡𝑒𝑡−1 > 0; 𝑆𝑡𝑎𝑡𝑒 − 𝑆𝑡𝑎𝑡𝑒𝑡−1; 0)
Down regulation:
𝐼𝐹(𝑆𝑡𝑎𝑡𝑒 − 𝑆𝑡𝑎𝑡𝑒𝑡−1 < 0; 𝑆𝑡𝑎𝑡𝑒 − 𝑆𝑡𝑎𝑡𝑒𝑡−1; 0)
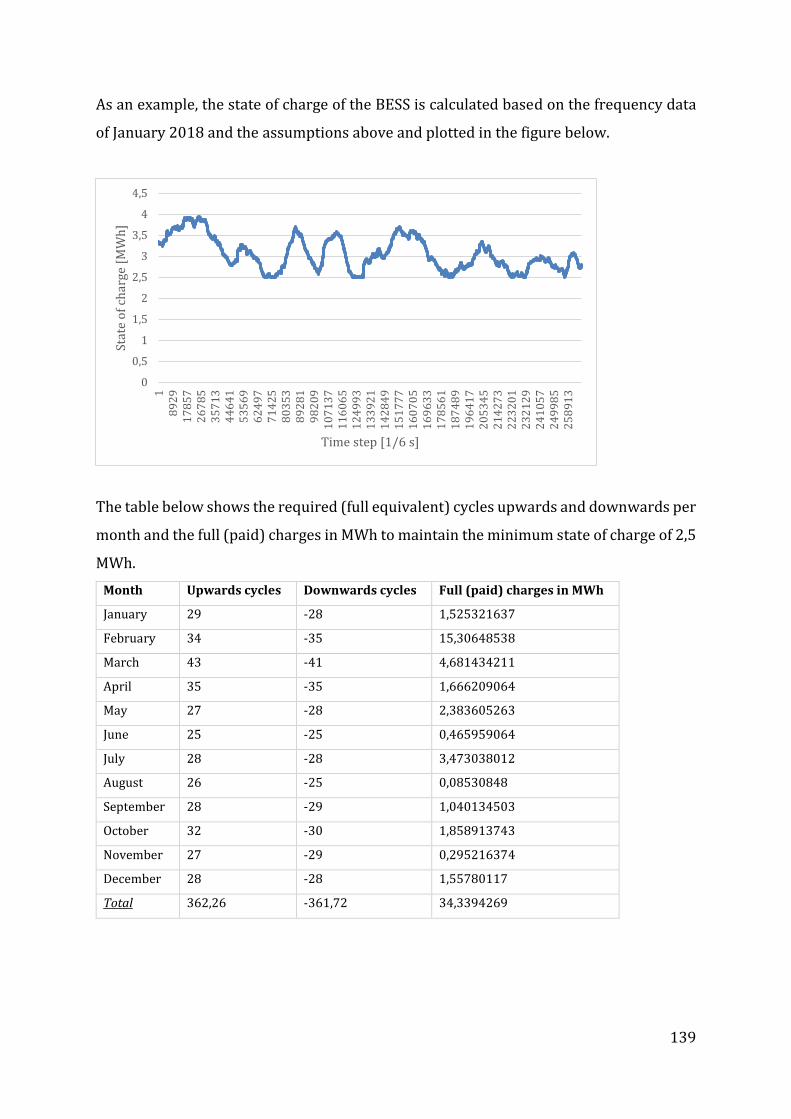
139
As an example, the state of charge of the BESS is calculated based on the frequency data
of January 2018 and the assumptions above and plotted in the figure below.
The table below shows the required (full equivalent) cycles upwards and downwards per
month and the full (paid) charges in MWh to maintain the minimum state of charge of 2,5
MWh.
Month Upwards cycles Downwards cycles Full (paid) charges in MWh
January 29 -28 1,525321637
February 34 -35 15,30648538
March 43 -41 4,681434211
April 35 -35 1,666209064
May 27 -28 2,383605263
June 25 -25 0,465959064
July 28 -28 3,473038012
August 26 -25 0,08530848
September 28 -29 1,040134503
October 32 -30 1,858913743
November 27 -29 0,295216374
December 28 -28 1,55780117
Total 362,26 -361,72 34,3394269
0
0,5
1
1,5
2
2,5
3
3,5
4
4,5
18
92
91
78
57
26
78
53
57
13
44
64
15
35
69
62
49
77
14
25
80
35
38
92
81
98
20
91
07
13
71
16
06
51
24
99
31
33
92
11
42
84
91
51
77
71
60
70
51
69
63
31
78
56
11
87
48
91
96
41
72
05
34
52
14
27
32
23
20
12
32
12
92
41
05
72
49
98
52
58
91
3
Stat
e o
f ch
arge
[M
Wh
]
Time step [1/6 s]

140
12.3.2 Price scenarios
Assuming (maximum) 362 full equivalent cycles per year and 1-hour storage depth.
Prices are based on capacity prices since the introduction of the regional FCR auction on
July 1, 2019 till September 30, 2019.
Price scenario FCR income [€/MW/year]
Average FCR price (€ 215,83/MW/day) 78.779
Min. FCR price (€ 140,33/MW/day) 51.220
50% of the average FCR price (€ 106,78/MW/day) 39.390