Competitiveness in the Agribusiness Environment‘rticles... · - ID production factors...
49
Competitiveness in the Agribusiness Environment (from analysis to cooperative strategy development - a South Africa case study) 1 st Annual Lecture of the Cooperative Central Bank University of Cyprus 22 Nov. 2016 Johan van Rooyen, Director & Johann Boonzaaier, PhD student Centre for Agribusiness Stellenbosch University
Transcript of Competitiveness in the Agribusiness Environment‘rticles... · - ID production factors...

Competitiveness in the Agribusiness Environment
(from analysis to cooperative strategy development - a South Africa case study)
1st Annual Lecture of the Cooperative Central Bank
University of Cyprus
22 Nov. 2016
Johan van Rooyen, Director &
Johann Boonzaaier, PhD student
Centre for Agribusiness
Stellenbosch University

GREETINGS FROM STELLENBOSH
UNIVERSITY, SOUTH AFRICA

My talk in a nut shell: - Competitiveness is a necessary
ingredient for agricultural existence
in todays world……. If you want to
manage it, you must measure &
analyse it; otherwise it just remains
a “good idea or theory”
The challenge:
- Designing a theoretically sound and
systematic approach to measure and
analyse competitive performance

Global Competitiveness
measured and analysed


Cyprus Competitive Performance

Cyprus Competitiveness Index

Content & Scope
Theme: To translate COMPETITIVENESS THEORY in to a
useful tool for STRATEGIC AGRIBUSINESS ANALYSIS and
PLANNING:
Establish a theoretical framework of analyses
Consider and define the business context of an
industry and measure competitive performance
Application to the SA Agricultural sector – 1961, 2005,
2008, 2016; ….some analysis on Cyprus too
Reference a number of Fruit Industry case studies; and
Propose future research and enquiry

Enquiry in to sector/industry/firm level
competitiveness?
Comprehensive economy wide views available
but not much industry level enquiry:
• IMD – WORLD COMPETITIVENESS YEARBOOK
• WEF - GLOBAL COMPETITIVENESS REPORT
Agri-focussed analysis? rather constrained views
• Agri-benchmarking in fruit industry –
O’Rourke, production cost based.
• Marketing Decision Support Models (DSM) &
Market Attractiveness Index (MAI)?
• Profits; productivity; ROI; ROR, etc. ?

THE AGRI-COMPETITIVENESS ANALYSIS
PROGRAMME (ACAP)
Stellenbosch University
1. Approach and process:
• New competitiveness theory framework
• Participative analysis & planning - stakeholders/client inputs
2. Funding (in whose interest?):
Project based: Industry, banking sector (Standard Bank
AgriBusiness), government (Western Cape Dept of Agriculture),
agribusiness/commodity groupings
3. Dissemination:
Annual Agri-Competitiveness Seminar, publications, papers
4. Selected commodities:
30 value chain groupings; 1600 observations: Deciduous- citrus- stone fruit, wine, dates, grains, dairy, sugar, forestry, meat and game…
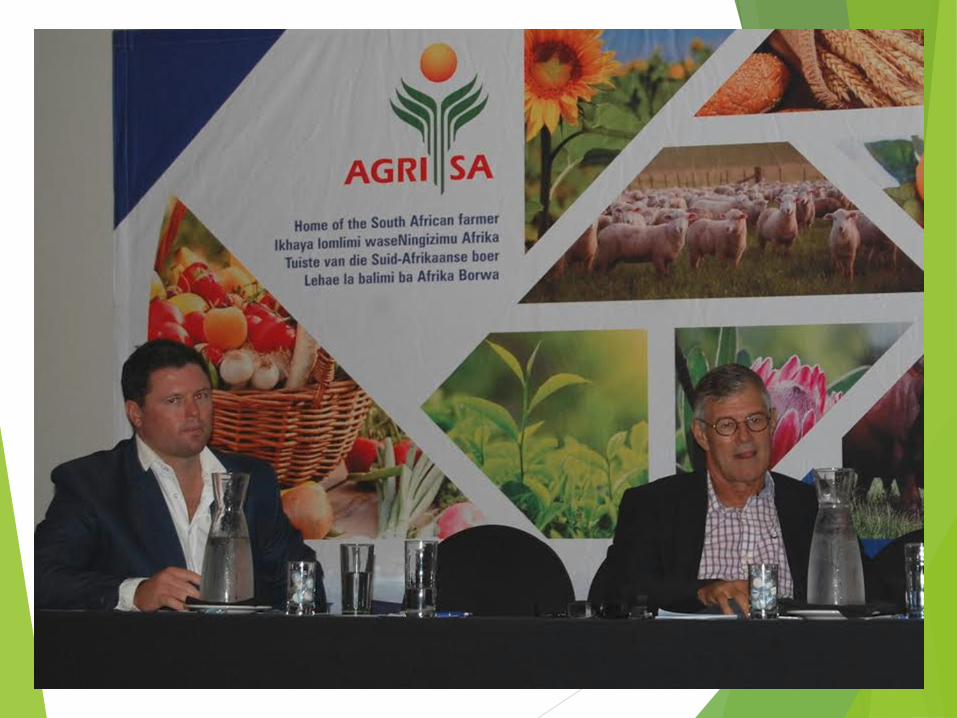
The theory of competitiveness: From
Absolute Advantage (Adam Smith, 1776)
to Competitive Advantage ( Porter, 1998)
Mercantilism; “strengthening the country” (1500-1800)
Classical Trade Theory:
- Absolute Advantage – wealth is created by natural endowments
(Adam Smith, 1776)
- Comparative Advantage - specialisation theory (David Riccardo,
1817)
- Politics of Protection (J.S. Mill, 1873)
Neoclassical models:
- Factor Proportions Theory – TFP (Heckscher-Ohlin, 1919,1933)
- Factor Price Equalisation Theorem – (Samuelson, 1948)

Theoretical framework:
Challenges to Comparative Advantage:
- Leontief Paradox – opposing the H-O Theory ( V. Leontief, 1953)
- Wealth through Economies of Scale ( Krugman, 1979; Lancaster, 1979)
New Competitiveness Theory:
- Competitive Advantages – wealth through strategic
choices (Michael Porter, 1990;1998); and
applications:
- Nine Factor Model (Cho, 1994)
- Double Diamond Models ( Rugman & Cruz,1993;
Moon, Rugman &Verbeke,1995)
- WEF (Global Competitiveness Report); IMD (WCR)

National industry or sector
researched Authors or researchers
Proxies for
measurements and/or
models/frameworks applied
Verdicts or conclusions
The European agro-food
system ISMEA (1999) RTA & Porter diamond model Scope for European Commission/Union integration
Hungarian agricultural-
food sectors Fertő and Hubbard (2002)
RCA and RTA
Hungary has a comparative advantage for 11 of the
22 aggregated product groups.
Namibian table grape
production Thomas (2007) Porter diamond model
The Namibian table grape chain is relatively
competitive in the international arena. Primary
production in becoming more competitive.
Livestock product exports
from India Kumar (2010)
Export and import analysis –
nominal protection coefficient
(NPC)
India is competitive in the export of meat products,
except poultry.
China’s agricultural
products
Qiang, Yong-Sheng and
Xiao-Yuan (2011)
RCA and
trade coefficient specialisation
(TCS)
Ability of direct factors is strong in terms of
transformation from cost advantage and price
advantage into competition advantage.
Poultry production in the
Czech Republic Belová et al. (2012)
Trade-related comparisons –
Lafay Index (LFI)
The comparative disadvantage deepens in relation to
European Union countries.
Global Pear Market Valenciano, Giancinti and
Uribe (2012) RCA
Geography plays a main role in competitiveness with
nearby markets, as happens in markets with free
trade.
Tobacco sub-sector in the
Republic of Macedonia
Tuna, Georgiev and Nacka
(2013)
RCA and
Porter diamond model
The republic of Macedonia has favourable conditions
and a competitive advantage for producing tobacco.
Canadian wheat, beef and
pork sectors
Sarker and Ratnasena
(2014)
RCA and normalised revealed
comparative advantage (NRCA)
Canada has enjoyed international competitiveness in
the wheat sector, but not in the pork sector, whilst
the beef sector has grown rapidly since 1992.

ACAP approach to COMPETITIVE PERFORMANCE
ANALYSIS: A Five Step analytical framework
1. DEFINITION Contextualise and define agri-competitiveness
2. MEASUREMENT
3. IDENTIFY FACTORS
AND CLUSTER INTO
DETERMINANTS
4. ANALYSE
5. STRATEGY
PLANNING
Empirically measure competitive performance -
IF YOU MEASURE YOU CAN MANAGE
Identify, through interviews with industry experts and
knowledgeable stakeholders (Executive Survey), trends and
major factors impacting on competitive performance
Establish the major Determinants of Competitiveness through the
application of the “new” competitiveness theory (Porter, 1990)
Develop strategies to enhance the competitiveness of Agricultural
Industries in SA –Participative planning (Log Frames…)

Step 1:DEFINING COMPETITIVE PERFORMANCE
“The ability of an industry/firm/sector to attract
investment and other scares resources by trading products in the global market, whilst striving to earn at
least the opportunity cost of resources engaged”
(Freebairn, 1987)
Notions of:
- Sustained international trade
- Scarcity; opportunity cost;
- Trends – “understand the trends and you know
what is happening”

TRADE BASED
MEASURES
• RCA and RTA • Other Indices; EMS, NEI,
STRATEGIC ANALYSIS
& PLANNING • Cost Measures
• Profitability
• Productivity and
Efficiency measures
• PORTER DIAMOND;EXEC
SURVEYS; FOCUS
GROUPS
𝑹𝑪𝑨𝒊𝒋 = 𝑹𝑿𝑨𝒊𝒋 =𝑿𝒊𝒋
𝑿𝒊𝒌 /
𝑿𝒏𝒋
𝑿𝒏𝒌
𝑹𝑴𝑨𝒊𝒋 =𝑴𝒊𝒋
𝑴𝒊𝒌 /
𝑴𝒏𝒋
𝑴𝒏𝒌
𝑹𝑻𝑨𝒊𝒋 = 𝑹𝑿𝑨𝒊𝒋 - 𝑹𝑴𝑨𝒊𝒋 (Balassa 1966, Vollrath 1991)
Data: FAO STATS -1961;
TRADEMAP -2001
COMPREHENSIVE ASSEMENTS
Data & Info
Porter
(1998)
Vollrath
(1991)
STEP 2: MEASUREMENT AND ANALYSES:

SA Agricultural competitiveness:
long term trends (FAO Data)
Protectionism;
Subsidisation
of farming
War – economy;
Urbanisation
1st economic
deregulation
Reduction in
direct farm subs
Droughts?
Sanctions
economy
Low agric
subsidies
Madiba Magic
+
Learning by doing
“no” agric subs
Droughts?
Sustaining
Global
Comp.
“low
agric”
subs

Industry RTA’s 2001 -2015 : Agriculture,
Forestry and Fisheries (ITC Data)

Industry RTA’s : Primary Agriculture
vs Agro-Processing (ITC Data)
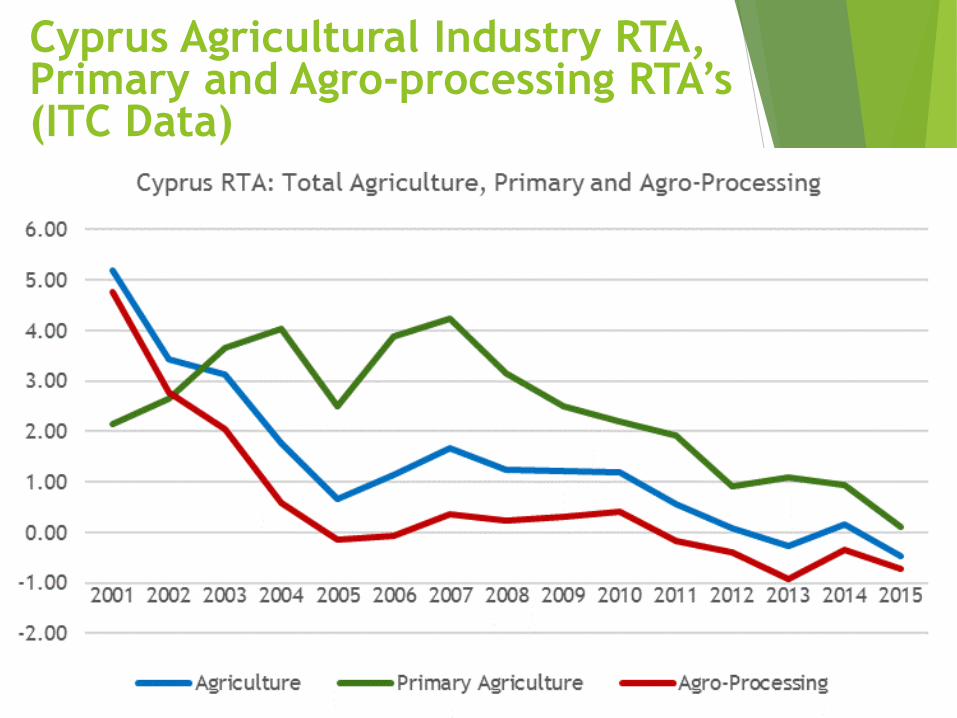
Cyprus Agricultural Industry RTA, Primary and Agro-processing RTA’s (ITC Data)

110313 Maize (corn) groats and meal 5.19 23.95 13.00 4.09 121.22 6.79 1.44 23.66 34.19 30.17 24.54 36.94 47.89 48.78 62.91
110220 Maize (corn) flour 6.56 24.36 6.01 2.82 15.86 2.59 4.31 11.83 10.18 13.69 11.20 8.61 11.48 14.20 10.81
110419 Cereals, rolled or flaked grains nes 0.56 0.29 0.23 -0.57 -0.02 0.40 0.88 0.86 0.07 0.57 1.15 2.89 1.92 1.55 4.13
110812 Maize (corn) starch 10.83 13.66 10.85 7.28 6.46 2.27 1.96 3.26 4.00 3.83 3.55 2.40 3.49 3.48 2.79
110320 Pellets 0.00 0.45 5.24 0.06 4.69 6.72 4.66 5.14 9.46 8.56 4.17 6.00 2.50 1.59 2.64
110319 Cereal groats and meal nes 36.39 1.83 -2.97 -4.47 -9.50 0.10 0.17 0.27 0.53 6.12 4.55 5.69 5.00 1.18 2.29
110100 Wheat or meslin flour 2.39 3.32 1.57 0.96 0.47 0.43 0.12 0.36 1.28 2.11 1.62 2.22 2.35 1.62 2.11
110610 Flour and meal of the dried leguminous vegetables of heading 0.22 -1.02 -0.21 -0.10 0.19 1.50 -0.27 -0.48 -0.55 4.98 2.36 6.77 0.08 1.08 0.97
110819 Starches nes -0.15 0.13 0.37 0.16 -0.04 -0.05 -0.06 -0.60 -0.11 1.76 0.80 1.16 0.94 0.60 0.54
110290 Cereal flour nes 6.13 1.34 0.40 0.53 0.99 0.64 0.18 0.46 0.77 1.87 3.03 2.66 0.85 0.94 0.46
110422 Oats, hulled,pearled,sliced or kibbled 0.04 0.11 0.10 -0.21 -2.07 -1.60 -0.08 1.73 -3.40 0.05 -0.06 -0.26 1.16 0.17 0.43
110510 Potato flour and meal 2.02 1.27 0.57 0.42 0.80 0.32 1.72 0.23 2.09 0.47 -12.45 -16.70 -17.23 0.32 0.30
110811 Wheat, starch -0.45 -0.61 -0.23 -0.38 -0.23 4.76 0.04 -0.17 -0.14 2.91 0.62 0.29 0.27 0.50 0.23
110429 Cereals, hulled, pearled, sliced or kibbled nes 0.02 0.19 0.09 0.05 0.03 -0.89 -2.30 0.14 0.40 1.92 0.51 0.27 0.39 0.11 0.14
110520 Potato flakes -0.85 -0.82 -0.64 -0.85 -0.79 -0.68 -1.10 -0.52 0.13 -0.06 -0.05 -0.46 0.29 -0.17 0.02
110430 Germ of cereals, whole, rolled, flaked or ground 0.03 0.03 0.01 0.01 0.07 0.07 0.02 -0.06 -0.01 -0.12 0.46 0.14 0.42 0.27 0.02
110210 Rye flour -0.61 2.60 -2.07 -4.18 -4.74 -4.28 -1.71 -1.76 -2.72 -1.12 -1.03 0.00 0.00 0.00 0.00
110230 Rice flour -0.02 0.02 -0.01 -0.01 0.01 -0.01 0.00 0.00 0.00 0.00 0.00 0.00 0.00 0.00 0.00
RSA industry RTA’s : SA Grain value chains
Codes: Blue + yellow- marginal; red - negative HS Code Product Description 2001 2002 2003 2004 2005 2006 2007 2008 2009 2010 2011 2012 2013 2014 2015


Phase 1 Phase 2 Phase 3 Phase 4
Phase 2: The Madiba Magic Period – learning the trade (1990-2001)
Phase 4: Operating in a constrained competitive environment ( 2010 -)
Phase 3: Towards becoming a global player (2001 -2010)
Phase 1: Regulated, constrained
Competitiveness; economic sanctions

Cyprus Agricultural Industry
RTA’s: Wine and Whiskey (ITC Data)

Cyprus Agricultural Industry
RTA’s: Cheese and Fish (ITC Data)

Cyprus Agricultural Industry
RTA’s: Potatoes and Citrus (ITC Data)

Step 3: Which factors determine industry
level competitive performance?
Executive Survey (views industry leaders, investors, producers, ceo’s):
- Identify the major operational factors affecting
competitive performance (2015 Deciduous Fruit
Industry Exec Survey; Wine Exec Survey, etc)
Determine views in value chain clusters:
- “Trade” respondents in export, trade and marketing
- ”Agribusiness” respondents in primary production,
input supply, storage, winemaking,

10
%

Step 4:Determinants of Competitive Industry
Performance(The Porter Diamond)
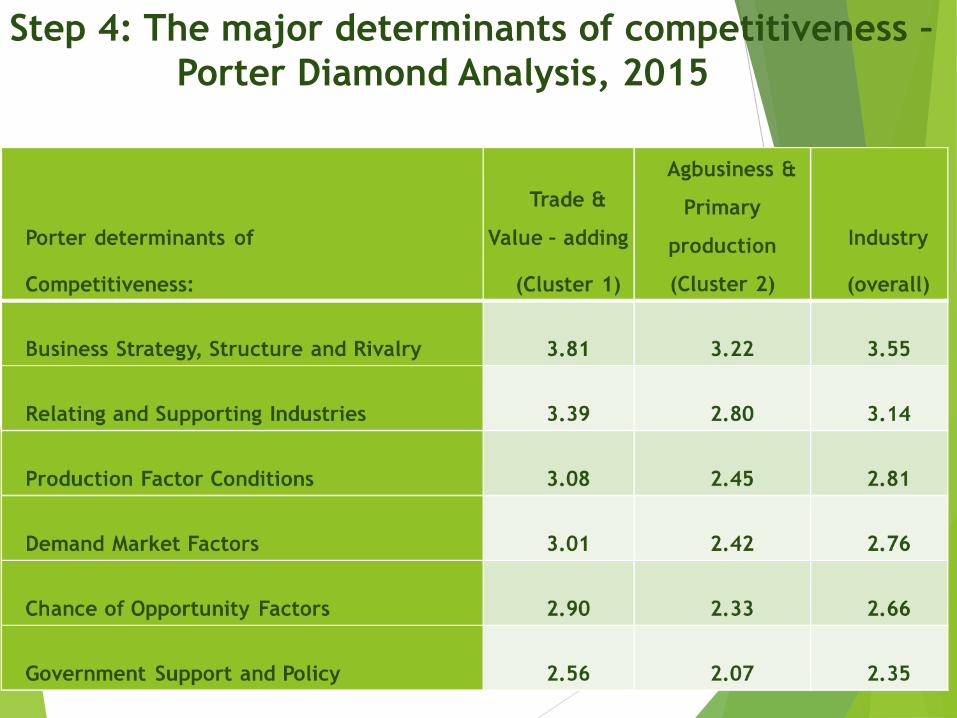
Step 4: The major determinants of competitiveness –
Porter Diamond Analysis, 2015

STEP 5 - COOPERATIVE AGENDA SETTING:
SA DECIDIOUS FRUIT INDUSTRY

New research directions
Move from general to specifics: Focus on form, place and time
utilities in different markets. Market analysis - “Decision Support
Models” “Market Attractiveness Index” - to identify and analyse new,
lucrative markets for competitive products
Expand into value chain benchmarking:
- ID production factors constraining competitiveness at particular
levels/functions in the value chain - on-farm level, processing, retail -
local level comparisons and global through “benchmarking” & “double
and triple” Porter diamonds.
- and conduct intra-value chain competitiveness: Give effect to
differing views of different functional groups in the chain – intra-value
chain investigation; weighting of Porter factors (Kothandaraman &
Wilson, 2001; Lia, & Whalleby, 2002, Angala 2015 and Boonzaaier 2015)

New research directions
“Future-based Enquiry”:
- “In the business world the rear-view mirror is always clearer than the
windshield” (Warren Buffet). Only historical trends analysed by RTA;
Porter models.
- Move towards prognostic analysis; not only diagnostic evaluation.
Scenario development and “Agri- industry Business Confidence
Indexes” (Esterhuizen, 2006) to predict expected variations be explored
Agri-sector analysis:
- Focus on “winning and losing” industries to direct policy support systems
- and investment decision-making

CONCLUDING REMARKS:
1. THE AGRICULTURE SECTOR IS NOT A UNITARY SYSTEM; RATHER A
SECTOR WITH COMPLEXITY & DIVERSITY WITH MANY COMPLEMENTARY,
COMPETITIVE AND SUPPLEMENTARY RELATIONSHIPS; A BIT “NON SENSICAL
TO TALK ABOUT AGRI-COMPETITIVENESS per se
2. CONTEXUALISE COMPETITIVENESS PERFORMANCE IN TERMS OF THE
PREDOMINANT FOCUS OF A PARTICULAR INDUSTRY AND ITS RELATIONSHIPS
– COMMODITY GROUPS, TRADE ORIENTATION, MARKETS, RIVALRY,
STRUCTURE, ETC – NO ONE MODEL FITS ALL
3. ENGAGE INDUSTRY VALUE CHAIN PLAYERS (GLOBAL WHERE REQUIRED)–
INPUT, PRODUCER, MANUFACTURER, RETAIL – IN COMPETITIVENESS
ANALYSIS AND STRATEGY DEV – SOLVE THE WEAKEST LINKS; BUILD ON
STRONG POINTS.

4. USE TREND ANALYSIS TO DESIGN CONSISTENCY AND RELIABILITY IN
STRATEGY/ LOBBY EFFORTS
REFRAIN FROM OPPORTUNISTIC BEHAVIOUR FOCUSING ON “QUICK
FIXES”.
TRENDS REFLECT “SPILL-INN” DYNAMICS. i.e. Chance factors such
as Westerns Europe low wine crop + SA bumper crop in 2008 =
positive impact over next few years for SA wines.
6. BUILT TRUSTFUL AND TRANSPARENT INDUSTRY STRUCTURES AND
RELATIONSHIPS – AVOID OPPORTUNISTIC BEHAVIOUR; SHARE
INTELLEGENCE AND DATA SETS; MONITOR, MEASURE , ANALYSE.
CONCLUDING REMARKS:

7. FARM LEVEL STRATEGIES:
- Be careful for long term investments in marginally competitive industries
- Consider size and scale:
# Large scale mega farmers - similar to industry type of considerations
# Medium scale farmers –take a “small business” focus re cash flows and
risks; link into competitive value chains; serve niche markets – GI’s; S & C
# Smallholders – remember “efficient but poor ” hypothesis: seek niche
markets; link into competitive value chains- out grower schemes; onsider
part-time farming (divert time to activities that secure income such as off
farm employment, rural tourism); rent land to larger farming firms, etc.
CONCLUDING REMARKS:

“In today’s (agri) business, the competition will bite you if
you keep running; if you stand still they will swallow you!” (William Knutsen, Jr. Chairman, Ford Motor Company)
RITY FOCUS
SOME WORDS OF WISDOM

THANK YOU – COOPERATIVE CENTRAL
BANK & UNIVERSITY OF CYPRU
BE COMPETITIVE!