Competitiveness impacts of post-2020 LDV CO 2 Regulation
321
Assessment of competitiveness impacts of post-2020 LDV CO 2 regulation Multiple framework contract for the procurement of studies and other supporting services on impact assessments and evaluations (ENTR/172/PP/2012/FC) Final Report April 10, 2015 Authors: Valdani Vicari & Associati (VVA): Marco Bolchi Leonardo Corbo Pierre Hausemer Technopolis Group (TG): Michal Miedzinski Asel Doranova Paresa Markianidou TNO, as part of Joint Institute for Innovation Policy (JIIP): Richard Smokers Evgueni Poliakov Maarten Verbeek Karin van Kranenburg Hugo Gelevert
Transcript of Competitiveness impacts of post-2020 LDV CO 2 Regulation

Assessment of competitiveness impacts of post-2020 LDV CO2
regulation
Multiple framework contract for the procurement of studies and other supporting services on impact
assessments and evaluations (ENTR/172/PP/2012/FC)
Final Report
April 10, 2015
Authors:
Valdani Vicari & Associati (VVA):
Marco Bolchi
Leonardo Corbo
Pierre Hausemer
Technopolis Group (TG):
Michal Miedzinski
Asel Doranova
Paresa Markianidou
TNO, as part of Joint Institute for Innovation Policy (JIIP):
Richard Smokers
Evgueni Poliakov
Maarten Verbeek
Karin van Kranenburg
Hugo Gelevert

Assessment of competitiveness impacts of post-2020 LDV CO2 regulation
Final Report Valdani Vicari & Associati (VVA), Technopolis Group (TG), Joint Institute for Innovation Policy (JIIP), TNO for DG CLIMA 2

Assessment of competitiveness impacts of post-2020 LDV CO2 regulation
Final Report Valdani Vicari & Associati (VVA), Technopolis Group (TG), Joint Institute for Innovation Policy (JIIP), TNO for DG CLIMA 3
EXECUTIVE SUMMARY
This report presents the results of the project “Assessment of competitiveness impacts of post-2020 LDV
CO2 regulation”. A consortium consisting of Valdani Vicari & Associati (VVA), Technopolis Group (TG), Joint
Institute for Innovation Policy (JIIP) / TNO has carried out this project for the Directorate-General Climate
Action of the European Commission.
Objective and scope
The objective of this study is to assess possible impacts of post-2020 EU CO2 legislation for light-duty
vehicles (LDVs = passenger cars and light-commercial vehicles (LCVs or vans)) on the competitiveness of
affected sectors in Europe. In line with the guidelines laid out in the Commission’s "Competitiveness
Proofing" Toolkit (SEC(2012) 91) the study assesses three elements of competitiveness:
Cost competitiveness: impacts from a micro-economic perspective based on costs of compliance;
Innovation competitiveness, impacts from the perspective of a company’s or sector’s capacity to
innovate resulting from the need to introduce innovations to comply with regulatory requirements;
International competitiveness: impacts from a macro-economic perspective, looking e.g. at resulting
impacts on trade flows and cross-border investments.
In 2014 the European Commission has started the process of preparing a proposal for the post-2020 EU
CO2 legislation for LDVs by initiating a series of supporting studies. In the absence of a concrete proposal
the focus of this study is on identifying possible competitiveness impact pathways and analysing their
dependence on choices with respect to target and modalities. Elements of the legislation that are relevant for
assessing competitiveness impacts include:
Metric: The current legislation is based on tailpipe, or tank-to-wheel (TTW), CO2 emissions as measured
on the type approval test. For post-2020 legislation also other options are considered including well-to-
wheel (WTW) CO2 emissions or a move towards energy consumption from a tank-to-wheel or well-to-
wheel perspective.
Target level: This determines the relative stringency of the EU legislation compared to legislation in
other regions.
Target function: The target function determines how the required reduction efforts are distributed over
the different regulated entities. For the post-2020 legislation both mass and footprint are considered as
possible utility parameters for differentiating the target. Also the shape and slope of the target function
are to be defined.
Modalities: A number of other design options, which are still to be defined, may affect impacts of the
legislation on competitiveness. These include e.g. a phase-in, pooling of targets, super-credits for
vehicles meeting specific criteria, eco-innovations or other ways of rewarding off-cycle emission
reductions, trading of emission credits, banking and borrowing, combining passenger cars and (part of
the) LCVs under a single target, including mileage weighting and/or embedded emissions (vehicle life
cycle), and excess emission premiums.

Assessment of competitiveness impacts of post-2020 LDV CO2 regulation
Final Report Valdani Vicari & Associati (VVA), Technopolis Group (TG), Joint Institute for Innovation Policy (JIIP), TNO for DG CLIMA 4
Focus
The assessment covers four selected main affected sectors:
automotive manufacturers
automotive suppliers
energy industry
(professional) end users
In assessing competitiveness impacts the focus has been on comparing impacts on affected sectors in the
EU vs. those in other regions. This means that possible impacts on competition between manufacturers from
different EU member states have not been assessed. Furthermore the analysis has focussed on the Δ, i.e.
possible changes in competitiveness resulting from the legislation. Current market shares are results of the
existing competitiveness situation, based on costs and attractiveness of existing products and services. The
analysis has focussed on the question of how these market shares could be affected as a result of post-2020
EU LDV CO2 legislation, defined by changes in the relative costs and attractiveness of the products of
different companies (e.g. manufacturers / manufacturer groups) that could be induced by the legislation.
Approach
Possible impacts on cost competitiveness, innovation competitiveness and international competitiveness
have been assessed in separate work packages. These assessments have been supported by the collection
of sectorial information from literature and relevant databases as well as by interaction with various
stakeholders. The latter has been organised by sending detailed questionnaires to a wide range of
stakeholders from different affected sectors as well as a stakeholder consultation workshop with selected
representatives from the automotive manufacturing and components supply industry.
Conceptual model
Figure 1 illustrates the main conceptual model that has been used to identify possible competitiveness
impact pathways of post-2020 EU LDV CO2 legislation. In general the competitiveness of companies is
determined by the price and value of their products or services relative to the price and value of products or
services of competing companies (selling similar products or services or alternatives that can serve as a
substitute). Changes in the price and value of a company’s product or service will change the relative
attractiveness of the product or service which will lead to changes in market shares. The price and value of a
company’s products or services are determined by the company’s capabilities to produce and sell attractive
products or services, which in turn are determined by a range of resources. Changes in market shares and
profits resulting from changes in the competitiveness of a company’s products are likely to affect the
company’s financial and other resources, causing a feedback loop. This model has been used to analyse on
the one hand how the legislation might affect the resources and capabilities of (companies in) affected
sectors in different regions and on the other hand how regional differences in the resources and capabilities
of (companies in) affected sectors might affect their ability to deal with the consequences of the legislation.

Assessment of competitiveness impacts of post-2020 LDV CO2 regulation
Final Report Valdani Vicari & Associati (VVA), Technopolis Group (TG), Joint Institute for Innovation Policy (JIIP), TNO for DG CLIMA 5
Figure 1 – General model of competitiveness
Perspective
As mentioned above the focus of the analysis is on impacts of EU CO2 legislation on the competitiveness of
European sectors versus those in other regions. Specifically for automotive manufacturers and suppliers this
assessment has been approached from a company perspective as well as a more overall sectorial
perspective, leading to two different cases:
EU manufacturers vs. competing manufacturers from other regions;
EU manufacturing vs. manufacturing in other regions.
In “EU manufacturing” it is clear that EU means production locations for vehicles, components and materials
in the EU. How to define what are EU manufacturers is a more difficult question. This study has identified
four options:
Current main association membership for the EU market;
Original association membership;
Location of headquarters / owner;
Share of the vehicles sold in the EU that are manufactured in the EU.
In the end no single definition was used. Instead an attempt has been made to draw conclusions that are
robust under different definitions.
The connection between the two perspectives for analysing competitiveness impacts resulting from CO2
legislation is illustrated in the Figure 2 for the case of car and component manufacturers. Competitiveness
impacts from a manufacturer perspective are first of all determined by the compliance mechanisms chosen

Assessment of competitiveness impacts of post-2020 LDV CO2 regulation
Final Report Valdani Vicari & Associati (VVA), Technopolis Group (TG), Joint Institute for Innovation Policy (JIIP), TNO for DG CLIMA 6
by EU and non-EU car manufacturing companies. These include changes to the overall vehicle design
(including e.g. improved aerodynamics or the use of light-weight materials), improving the efficiency of
conventional engines and powertrains or applying alternative powertrains. The average impacts of those
choices on the price and value / quality of the vehicles from manufacturers from different regions determine
possible changes in competitiveness between EU and non-EU companies. The impact of compliance
strategies on the price of vehicles from manufacturers from different regions is strongly affected by the
regions in which these manufacturers produce their vehicles and the regions from which they source their
components and materials. The average costs of manufacturing vehicles and components in the EU and
other regions are what makes up the competitiveness of these regions from a manufacturing perspective. In
this way the competitiveness of EU and non-EU manufacturing affects the competitiveness of EU and non-
EU manufacturers. The other way around, choices of car manufacturers (also called original equipment
manufacturers or OEMs) to manufacture cars in a certain region or source components from a certain region
determine production volumes and thus economies-of-scale in that region, which affect the competitiveness
of that region relative to other regions from a manufacturing perspective.
Figure 2 – Relation between assessing cost competitiveness impacts from the perspective of car manufacturers or car manufacturing
Cost competitiveness
Compliance mechanisms
The cost impacts of post-2020 EU CO2 legislation on individual manufacturers are determined on the one
hand by the stringency of the target (determined by the overall target level and the distribution of required
reduction efforts over different manufacturers) and by the costs of various measures that need to be applied
to meet the target.
share of cars for EU
market manufactured
in EU
share of cars for EU
market manufactured
outside EU
share of components
from EU
share of components
from outside EU
advanced
components
alternative
powertrains
vehicle design
specific target for
EU manufacturer
LDV CO2 legislation
in EU
cost & value of cars
by EU
manufacturer
compliance strategy
of EU manufacturer
cost of manufacturing cars
and components in EU
share of cars for EU
market manufactured
in EU
share of cars for EU
market manufactured
outside EU
share of components
from EU
share of components
from outside EU
advanced
components
alternative
powertrains
vehicle design
specific target for
non-EU
manufacturer
cost & value of cars
by non-EU
manufacturercompliance strategy
of non-EU
manufacturer
cost of manufacturing cars
and components outside EU
LDV CO2 legislation
in other regions
direct impact
direct impact
cost competitiveness of
EU manufacturers vs.
non EU manufacturers
cost competitiveness of
EU manufacturing vs.
non-EU manufacturing
indirect impact
incl. economies of scale
indirect impact
incl. economies of scale
indirect impacts from effects
of CO2 legislation on markets
in other regions

Assessment of competitiveness impacts of post-2020 LDV CO2 regulation
Final Report Valdani Vicari & Associati (VVA), Technopolis Group (TG), Joint Institute for Innovation Policy (JIIP), TNO for DG CLIMA 7
Manufacturer specific targets and the resulting required reduction efforts are effectively defined by:
the target function;
the sales portfolio / average utility value of the OEM;
additional modalities, such as pooling, banking & borrowing, eco-innovations, and super-credits.
The main compliance mechanisms available to OEMs for meeting their specific targets are:
technical options:
o improving efficiency of internal combustion engine vehicles (ICEVs);
o increase share of alternatively fuelled vehicles (AFVs)
including e.g. natural gas vehicles (NGVs), battery-electric vehicles (BEVs), plug-in hybrids
(PHEVs) and fuel cell vehicles (FCEVs)
o apply eco-innovations
non-technical options, e.g.:
o changing vehicle design (affecting utility) or portfolio (affecting average utility);
o utilisation of test flexibilities or paying excess premiums
The net costs of meeting the target are determined by the way in which manufacturers apply and combine
the various technical and non-technical options and the way these are distributed over the (various segments
in the) product portfolio.
Figure 3 – Overview of main possible pathways for competitiveness impacts of the LDV CO2 legislation on EU vs. non-EU manufacturers
An overview of the main direct pathways for competitiveness impacts on EU vs. non-EU manufacturers is
presented in Figure 3. No competitiveness impacts are to be expected if the following two conditions are
simultaneously met:
the regulation results in targets of similar stringency for EU and non-EU OEMs, and
the costs of similar compliance mechanisms are the same for EU and non-EU OEMs.
Competitiveness impacts are definitely expected if the legislation on average results in the same level of
stringency of targets for EU and non-EU OEMs, but the costs of compliance for the same product (portfolio)
are different for manufacturers from different regions. The same holds if costs of the same compliance
mechanisms are similar for manufacturers from different regions but targets are different on average. When

Assessment of competitiveness impacts of post-2020 LDV CO2 regulation
Final Report Valdani Vicari & Associati (VVA), Technopolis Group (TG), Joint Institute for Innovation Policy (JIIP), TNO for DG CLIMA 8
both targets and costs are different, it depends on the way in which these are different, whether the
regulation may be expected to lead to net impacts on the competitiveness of EU and non-EU OEMs.
Competitiveness impacts may also occur if manufacturers from different regions choose different compliance
mechanisms with different costs to meet targets of similar stringency. However, if such choices are not
forced by the legislation, the resulting competitiveness impacts are not to be attributed to the legislation.
Important factors affecting cost competitiveness
In the assessment of possible pathways, through which the competitiveness of automotive manufacturers
and suppliers can be affected, a number of important factors have been identified.
Target level / CO2 legislation in other regions
Economies of scale are likely to play a significant role in the cost of compliance. These are affected by the
size of the sales of different OEMs in the EU market and in other markets with similar or different CO2
legislation. An advantage may be expected for OEMs with higher sales on the EU market, if EU legislation is
more stringent than in other regions. The impact on competition in other markets depends on extent to which
OEMs differentiate their products for different markets.
An important question is how to determine the relative stringency of CO2 legislation in different countries or
regions. Such a comparison depends not only on the target level as such but also on definitions of the
targets in different regions (including the test procedure on which it is based) and possible differences in
regional fleet composition (where the stringency of a higher target for a fleet of on average larger cars may
be equivalent to that of a lower target for a fleet of on average smaller cars). For the period beyond 2020
such a comparison is furthermore difficult to make as the targets in the EU and several other regions are not
yet known for 2025 and 2030. Based on existing targets for 2020, however, regional differences in the
stringency of targets for passenger cars appear less prominent that what is suggested by the target level
alone. For LCVs fleet averages required in the EU are quite similar to those in Japan, but lower than those
required in the US and China. Especially for the US, however, it should be taken into account that the
vehicles sold there are generally different from those sold in the EU.
Slope of target function in relation to average utility value
The shape and slope of the target function for post-2020 legislation affect the competition between individual
OEMs depending on their sales distributions. A net effect on competition between EU and non-EU OEMs is
only expected if average sales distributions are markedly different. Ways in which the slope of the limit
function may affect competitiveness between OEMs are indicated in Figure 4.
Due to the dominance of EU manufacturers on the EU market, the average utility (mass or footprint) of cars
sold by EU manufacturers on the EU market is insensitive to the definition of what is an EU manufacturer.
The average utility of OEMs from other regions, however, is not only different from the average for EU
OEMs, but also strongly dependent of whether the definition e.g. labels Toyota and Hyundai as European
OEMs (based on their membership of ACEA or large production facilities in the EU) or as Japanese and
Korean OEMs, based on original association membership or location of headquarters. The choice of target
function is therefore expected to have an impact on the average relative stringency of the regulation for EU
vs. non-EU OEMs. In this respect it should, however, be noted that the slope of the 2020 target function for

Assessment of competitiveness impacts of post-2020 LDV CO2 regulation
Final Report Valdani Vicari & Associati (VVA), Technopolis Group (TG), Joint Institute for Innovation Policy (JIIP), TNO for DG CLIMA 9
cars is already quite flat. For post-2020 legislation the slope is likely to become flatter so that variations in
average targets for manufacturer from different regions as function of their average utility are likely to be
quite small.
Figure 4 – Ways in which the slope of the target function may affect competitiveness between OEMs
Slope of linear
utility-based
target line
Steep slope
Flat slope
Sales distribution
OEM A
Sales distribution
OEM B
Mainly large
vehicles
Broad spectrum
Mainly small
vehicles
Mainly large
vehicles
Broad spectrum
Mainly small
vehicles
YES, likely impact on
competitiveness of OEM A
relative to OEM B
OEM A
OEM B
has a tight target for smaller vehicles and may
therefore need to reduce more in large cars or
cross subsidize costs
has no room for internal optimisation, but due to
lenient target also does not need that
NO, no impact on
competitiveness of OEM A
relative to OEM B
OEM A
OEM B
has a lenient target for smaller vehicles and can
therefore reduce less in large cars or
cross subsidize costs
has a tight target for its large vehicles but no room
to reduce more in small cars or
cross subsidize costs
OEM A
OEM B
has a lenient target for larger vehicles and can
therefore reduce less in small cars or
cross subsidize costs
has a tight target for its small vehicles but no room
to reduce more in large cars or
cross subsidize costs
OEM A
OEM B
has a tight target for larger vehicles and may
therefore need to reduce more in small cars or
cross subsidize costs
has no room for internal optimisation, but due to
lenient target also does not need that
targets for OEM A and B are similar and
insensitive to slope of target function
favourable
for
OEM A
favourable
for
OEM B
favourable
for
OEM A
favourable
for
OEM B
targets for OEM A and B are similar
targets for OEM A and B are similar
Technology costs
Competitiveness impacts are likely to occur if the costs of efficiency improvement in ICEVs and the costs of
manufacturing AFVs are different for EU and non-EU manufacturers. Such differences may result from:
Differences in labour costs and productivity in different regions;
Differences in capital costs and cost of capital in different regions;
Economies of scale, determined by existing production volumes and by the effects of EU CO2 legislation
on these volumes determined by choices made by OEMs in response to the legislation regarding the
regions where they manufacture their vehicles or source components from.
The cost of components from regional suppliers will be different for the same reasons as the cost of
manufacturing vehicles in different regions may be different (e.g. wages, taxes, etc.).
A significant net impact of regional differences in costs factors for production (labour, capital, etc.) on the
relative price of products is only to be expected if the ratio of these cost factors for additional or new
technologies applied to the vehicles are different than for the baseline vehicles.
Influence of market presence and the economic crisis
Differences in the presence of different OEMs in different markets are mentioned as a driver for
competitiveness impacts in combination with effects of the economic crisis. EU OEMs have a stronger focus
on the EU market, and over the past 6 years have made losses there which some could not recover by
profits in in other markets, unlike their non-EU competitors. This influences their (financial) capability to

Assessment of competitiveness impacts of post-2020 LDV CO2 regulation
Final Report Valdani Vicari & Associati (VVA), Technopolis Group (TG), Joint Institute for Innovation Policy (JIIP), TNO for DG CLIMA 10
comply with post-2020 targets. The question, of course, is whether that is a structural issue or specifically
related to the current situation and the strong and lasting response of EU market to the crisis.
Premium vs. volume manufacturers
Whether an OEM is a premium or volume manufacturer may be a stronger determinant for its ability to deal
with impacts of CO2 legislation than whether it is European or not. EU premium OEMs are said to be in a
better position than EU volume OEMs to deal with post-2020 legislation, as EU premium manufacturers:
are less affected by the economic crisis;
can recover losses in the EU market through profits in other markets;
face limited competition on the EU market from non-EU OEMs;
have a client-base with high willingness to pay for innovative technologies.
Overall possible competitive advantages are identified for premium OEMs despite the fact that they are
faced with higher costs due to more stringent targets (resulting from the choice of a relatively flat slope of the
target function for 2015) and other factors leading to higher additional costs per vehicle. EU volume OEMs
may be more likely to lose market share to non-EU volume OEMs and EU premium OEMs. The high share of
EU companies in premium markets would mean that on average EU OEMs could have a competitive
advantage over non-EU OEMs.
Cost competitiveness: conclusions from a car manufacturer perspective
Many possible impact pathways have been identified that might have negative as well as positive impacts on
the competitiveness of EU OEMs. This is due to the large number of compliance mechanisms and the large
number of resources and capabilities that may be different for different OEMs. Overall this makes it appear
less likely that the regulation as a whole would lead to large net impacts on competitiveness of EU OEMs.
Nevertheless choices with respect to specific elements of the legislation could enhance the possibility of
specific competitiveness impacts to occur.
There are strong indications that the capability of EU OEMs to develop advanced ICEVs and AFVs may be
less than that of non-EU OEMs, especially if for meeting post-2020 targets powertrain electrification
becomes an important compliance mechanism. This lower capability is caused by different factors including
the worse financial position of EU OEMs, the technological focus of EU OEMs (and their suppliers) on diesel
technology rather than hybrid/electric propulsion, and a possible future shortage of skilled R&D personnel in
the EU.
There are various impact pathways related to the ability to manufacture vehicles with CO2-reducing
technologies at competitive cost, but for most of these pathways the likeliness, sign and size of impacts are
difficult to judge. Japanese OEMs appear to be in a better position to scale up production of electric and
hybrid vehicles, while EU OEMs may have a possible advantage to achieve cost reductions for integration of
different powertrains due their advanced platform approach.
The ability to sell at competitive prices is not only determined by additional costs of manufacturing vehicles
with CO2-reducing technologies, but also by e.g. the amount of R&D costs to be earned back per vehicle, the
ability to cross-subsidize within the product portfolio, and the ability to absorb losses. On all of these aspects
there are differences between EU and non-EU OEMs.

Assessment of competitiveness impacts of post-2020 LDV CO2 regulation
Final Report Valdani Vicari & Associati (VVA), Technopolis Group (TG), Joint Institute for Innovation Policy (JIIP), TNO for DG CLIMA 11
Timing of the legislation, specifically the lead time between announcement of the target and the actual target
year, is expected to affect the above impacts. A short lead time leads to higher costs for developing and
marketing new technologies, which are more difficult to bear for OEMs with a less strong financial position.
Cost competitiveness: conclusions from a car manufacturing perspective
It is concluded that post 2020 EU LDV CO2 legislation has no direct impacts on the cost competitiveness of
EU car manufacturing as the legislation is targeted at the CO2 performance of vehicles and not at factors that
determine the costs of producing cars or their components. A limited number of possible indirect impacts,
however, has been identified. Impact pathways seem to be quite generic and the same for the car and van
regulation. Actual impacts will depend on the specific design of both regulations beyond 2020.
Possible pathways for indirect impacts include:
Access to materials and costs of materials, which could be different for EU and non-EU OEMs. This is
especially likely for e.g. electric powertrains and vehicle light-weighting;
Possible positive or negative impacts in relation to regional differences in the cost of components for
advanced ICEVs and AFVs, depending e.g. on the relative stringency of EU legislation compared to that
in other regions (affecting economies of scale) or whether components are required for which suppliers
are mainly located outside Europe;
Regional differences in labour costs, which may have impacts of unknown sign depending on the design
of the legislation. This includes possible effects of a (temporary) shortage of qualified personnel for the
development as well as manufacturing of vehicles with advanced technologies.
Furthermore some potential pathways have been found relating to differences in costs of capital goods,
transport costs and tariffs, and sales volumes over which R&D costs can be divided. The size and sign of
these impacts depend mainly on the relative stringency of EU legislation.
Cost competitiveness: conclusions from a component manufacturer perspective
The ability of EU suppliers to develop and manufacture components for CO2 reduction in passenger cars and
vans appears likely to be less than that of non-EU competitors. This is specifically the case if regulation
increases the demand for vehicles with electric powertrains, due to the technology position and financial
position of EU suppliers and expected shortages in skilled R&D personnel. The ability of EU suppliers to sell
at competitive prices may be affected by their limited ability to absorb (temporary) losses.
Other possible pathways, that have been identified, relate to manufacturing costs depending on costs of
labour and equipment as well as economies of scale in the EU and other regions, to the costs of materials
and R&D costs per unit of product and to the the ability to cross-subsidize over the product portfolio. The
sign and size of these impacts is difficult to estimate. Overall, however, the likeliness of negative
competitiveness impacts to occur for EU suppliers seems somewhat higher than for EU vehicle
manufacturers

Assessment of competitiveness impacts of post-2020 LDV CO2 regulation
Final Report Valdani Vicari & Associati (VVA), Technopolis Group (TG), Joint Institute for Innovation Policy (JIIP), TNO for DG CLIMA 12
Cost competitiveness: conclusions from a component manufacturing perspective
Also here it is concluded that post 2020 EU LDV CO2 legislation has no direct impacts on the cost
competitiveness of EU component manufacturing as the legislation is targeted at the CO2 performance of
vehicles and not at factors that determine the costs of producing cars or their components.
A limited number of possible indirect impacts have been identified:
Impacts relating to the access to and costs of materials, which could be different for EU and non-EU
suppliers, e.g. regarding materials for electric powertrains and vehicle light-weighting. The sign and size
of effects cannot be determined at this stage, but effects likely to be more pronounced for component
manufacturing than for car manufacturing;
With respect to the costs of purchased components small positive impacts could occur as a result of
economies of scale if the EU has more stringent regulation than other regions or if a large share of new
(sub)components for advanced ICEVs and AFVs would be produced in the EU. Small negative impacts
may occur if (sub)components for advanced ICEVs and AFVs are mainly produced outside the EU.
Regional differences in labour costs may have an impact of unknown sign and size on the competiveness of
EU suppliers as new technologies may require more/less labour or have a higher/lower share of (manual)
labour in assembly/production. In addition some possible indirect impact pathways have been identified
which relate to differences in the costs of capital goods and the volume of sales over which R&D costs can
be divided. The size and sign of these impacts depend on the relative stringency of EU legislation.
Also from the supply industry perspective impact pathways seem to be quite generic and the same for the
car and van regulation. Actual impacts will depend on the specific design of both regulations beyond 2020.
Cost competitiveness: conclusions for the fuel supply sector
The energy supply sector can be divided into:
producers of fuels and other energy carriers, including the oil refining industry for petroleum based
fuels and companies involved in electricity generation or the production of other alternative (bio)fuels and
energy carriers (e.g. hydrogen);
distributors of fuels and other energy carriers, including fuel distributors and operators of filling
stations and operators of electricity distribution networks and operators of charging stations.
Both sub-sectors contain large, medium-size and small companies. The analysis of possible competitiveness
impacts has been done separately for the two sub-sectors.
Fuel producers
An effective CO2 regulation for cars and vans in the EU is likely to lead to reduced profitability of EU
refineries, if capacity is not adjusted. This is due to declining demand for petroleum fuels putting pressure on
the prices of fuels and to reduced refinery utilisation rates, leading to an increase in cost per unit production.
This will have a negative effect on the ability of EU refineries to compete on the EU market with imports from
Russia or new state-of-the art refineries being opened in India and the Middle-East.
The ability of EU companies in the fuel production sector to deal with changes in the EU market depends on
various factors such as:

Assessment of competitiveness impacts of post-2020 LDV CO2 regulation
Final Report Valdani Vicari & Associati (VVA), Technopolis Group (TG), Joint Institute for Innovation Policy (JIIP), TNO for DG CLIMA 13
the size of their European activities and the share of these in their global activities;
the extent to which they produce in the EU for the EU market or also import and export to and from the
EU.
The net effects are difficult to predict with available information.
In decisions of fuel producing companies on (dis)investments in refining capacity, also the status of facilities
may play a role. Decommissioning refinery capacity is more costly for newer than for older facilities. In this
respect there are likely differences between different refineries in Europe, but these have not been
assessed. The closing of refineries in the EU will lead to a loss of jobs and of value added within the EU.
This is not a competitiveness impact, but rather an economic impact that is likely to happen if EU LDV CO2
legislation is effective. The effect, however, could be amplified by fact that EU fuel producers are affected
more severely by CO2 legislation than competing producers outside the EU. The latter is due to the fact that
these non-EU fuel producers operate new facilities and have a large share of their sales in growing markets.
Fuel distribution
Fuel distribution companies, i.e. companies operating distribution infrastructure and filling stations, in the EU
operate locally or regionally. They are not directly competing with companies in other regions. From an EU
vs. non-EU perspective therefore no competitiveness impacts are to be expected. The reduced demand for
petroleum-based fuels could lead to negative economic impacts on this sub-sector of the fuel supply sector,
including a significant loss of jobs and value added, but also in this case these are not to be classified as
competitiveness impacts.
Cost competitiveness: conclusions for professional end users of LDVs
Post-2020 EU LDV CO2 legislation is likely to lead to higher purchase costs for vehicles and lower operating
costs due to lower energy costs. The net effect on total cost of ownership (TCO) depends on a range of
factors including the target levels, compliance strategies chosen by OEMs, procurement decisions by the
end-users and developments in the costs of technologies and various energy carriers.
For professional end users the TCO for using vehicles is an element in their cost of doing business. If post-
2020 EU LDV CO2 legislation affects the TCO of vehicles, it directly affects the costs of doing business for all
companies that use LDVs (professional end-users). Changes in the cost of doing business for a company
affect the price of products and/or services. This may affect competition in the market leading to a change in
market shares. Net competitiveness impacts, however, are only to be expected if the ΔTCO resulting from
the post-2020 legislation works out differently for different companies in same market.
Given that the focus is on EU vs. non-EU companies, competitiveness impacts are only expected for EU
companies that provide products / services that are competing on the EU market or other markets with
products / services from non-EU companies. This would appear to be the case only for a limited share of
professional end-users of LDVs. For manufacturers of goods that compete on international markets the
majority of transport costs will be related to transport over larger distances by truck, rail, ship or air. Positive
impacts are to be expected if the legislation leads to net a reduction of end-user costs for EU-based
companies, as is the case for the current legislation up to 2020. If different regions have LDV CO2
regulations with similar stringency, EU companies will benefit more as fuel prices are higher in Europe. The
Assessment of competitiveness impacts of post-2020 LDV CO2 regulation
Final Report Valdani Vicari & Associati (VVA), Technopolis Group (TG), Joint Institute for Innovation Policy (JIIP), TNO for DG CLIMA 14
size of the impact, however, is expected to be small as the costs of operating LDVs are generally only a
small fraction of the cost of doing business (in contrast to the costs of operating HDVs).
No competitiveness impacts are expected for EU-based SMEs, which in their operations make extensive use
of LDVs. EU SMEs are generally not competing with non-EU companies, regardless of whether or not these
LDVs are directly used for providing transport services. For those EU SMEs that are competing with non-EU
companies on the EU or foreign markets, the costs associated with the use of LDVs will generally be a small
share of the total transport costs. EU companies that are competing on the EU market will all be similarly
affected by cost impacts resulting from EU LDV CO2 legislation.
Innovation competitiveness
Car manufacturers and suppliers
The regulation is expected to have impacts on RDI investment choices regarding product innovation and the
prioritisation of R&D expenditures. Due to limited resources, innovation in CO2 reduction technologies will go
at the expense of other innovations.
The regulation is expected to enhance the trend of externalisation of OEM RDI activities to Tier 1 suppliers
as well as through joint R&D with other OEMs.
Post 2020 legislation is likely to increase the demand for AFVs, particularly for powertrain electrification, and
will consequently pose innovation requirements in this area. This creates demand for R&D personnel with
specific technological knowledge/skills. This personnel may have to be recruited internationally, given
expected shortages in the EU. In this respect, the legislation imposes less need for adjustment to ‘first
movers’, particularly non-EU OEMs and suppliers (Japan) with a stronger technology / patent position in
electric propulsion.
Energy suppliers
The regulation does not create innovation requirements for conventional fuel suppliers. Increasing shares of
AFVs may require innovation by suppliers of alternative fuels (e.g. electricity and hydrogen), but as most of
these companies are only competing on the EU market this is not expected to affect innovation
competitiveness of this sector.
Professional end users
The main impact of the legislation on professional end users is through the resulting change in total cost of
ownership (ΔTCO). This does not lead to innovation requirements for this sector. Moreover, given the small
share of LDV operating costs in the total costs of doing business, it is also not expected to affect the capacity
of these companies to innovate their products and services.
An increased share of AFVs, however, may require some innovation in fleet operation, but as most EU end-
users of LDVs are not in competition with companies from outside the EU this is not expected to affect
innovation competitiveness.

Assessment of competitiveness impacts of post-2020 LDV CO2 regulation
Final Report Valdani Vicari & Associati (VVA), Technopolis Group (TG), Joint Institute for Innovation Policy (JIIP), TNO for DG CLIMA 15
International competitiveness
Car manufacturers and suppliers
International competitiveness impacts depend partly on the net cost competitiveness impacts at the EU level.
However, as the size and sign of these impacts depend on details of legislation which are still to be defined,
international competitiveness impacts are difficult to assess at this stage. International competitiveness
impacts are furthermore dependent on the impacts on innovation competitiveness.
Overall it is concluded that EU-based manufactures hold strong international competitive positions in
passenger cars and components but not in LCVs. As a result of CO2 emission legislation, trade
competitiveness of the EU manufacturers of vehicles and automotive components is not expected to change
to a great extent. Overall the regulation is likely to be trade-neutral, with the view that the stringency of CO2
legislation will be broadly similar in the EU and in main competing regions.
Many second-order effects are possible, however, and these may have a positive or negative sign
depending on the relative stringency of EU targets post-2020 and details of the legislation. Competitiveness
impacts are possible in narrower defined markets. EU OEMs might to some extent lose in competitiveness in
gasoline vehicles while gain in competitiveness in diesel vehicles. Asian component manufacturers may
achieve competitive advantages in electric car components while EU manufacturers may win market shares
in diesel engine components. Some extra inward Foreign Direct Investment (FDI) flows may result, due to
required investments in EU production plants of non-EU OEMs, but their magnitude is unclear.
General conclusions
For many identified possible impact pathways no conclusions can be drawn on the sign and size of the net
impacts as these depend on the target level(s) and details of the post-2020 LDV CO2 legislation in the EU
and other regions, which at the moment are not known. Nevertheless the following high-level conclusions
can be drawn:
Post-2020 EU LDV CO2 legislation will not directly affect competiveness of EU car
manufacturing, component manufacturing and fuel or energy supply industry, with direct
meaning: through direct impact on the cost factors of production.
For professional end-users some direct competitiveness impacts possible. The legislation
affects the costs of operating passenger cars and vans, which are part of their cost of doing
business. However, for the type of EU companies that are in competition with companies
from other regions the share of costs related to using cars and vans in their total cost of
doing business will generally be small, so that this impact is probably not significant.
There are a large number of indirect pathways that could result in competitiveness impacts for OEMs and
component suppliers. The likelihood and size of these indirect impacts depend on:
the way in which the legislation is designed, especially the stringency of target and the shape and slope
of the target function;

Assessment of competitiveness impacts of post-2020 LDV CO2 regulation
Final Report Valdani Vicari & Associati (VVA), Technopolis Group (TG), Joint Institute for Innovation Policy (JIIP), TNO for DG CLIMA 16
ways in which resources and capabilities of EU companies and sectors may be different from those of
non-EU competitors, as these determine the ability of companies and sectors to deal with consequences
of the EU legislation.
The detailed decomposition of possible pathways in the report provides a consistent assessment framework
that will help to identify concrete impacts of specific proposals for post 2020 legislation to be developed in
the course of 2015.
Various possible cost competitiveness impacts on the EU automotive manufacturing and component supply
industry, both from a company (manufacturers) and a sectorial (manufacturing) perspective, were found to
relate to:
The economic / financial situation of European OEMs, with the EU automotive sector
appearing to be more strongly affected by the economic crisis than the industry in other
regions. It is a question, however, whether that remains the case up to 2030.
The market position of EU car manufacturers, with EU OEMs having a larger share in
premium markets.
Technology positions, with non-EU OEMs and suppliers having a stronger position in electric
powertrains. European targets that require, or provide a strong incentive for, implementing
AFVs could provide competitiveness benefits for non-EU manufacturers.
Economies of scale, with likely positive impacts for the EU automotive sectors if EU
legislation is more stringent than legislation in other regions.
Based on an overview of various impact pathways, the likeliness of negative competitiveness impacts for EU
suppliers seems somewhat higher than for LDV manufacturers.
Innovation competitiveness impacts on EU OEMs and component suppliers may relate to:
R&D on efficient ICEVs and AFVs going at the expense of other innovations.
Innovation readiness, with non-EU OEMs and suppliers benefiting from a “first mover”
advantage in electric powertrains.
Shortage of R&D personnel with skills for new technologies in the EU leading to global
recruitment
Competitiveness impacts on the EU fuel supply industry:
EU legislation may exacerbate already increasing competition between EU refineries and
new refineries in other regions;
No competitiveness impacts expected on the fuel / energy distribution sector.
Competitiveness impacts on professional end users:
No significant competitiveness impacts expected.

Assessment of competitiveness impacts of post-2020 LDV CO2 regulation
Final Report Valdani Vicari & Associati (VVA), Technopolis Group (TG), Joint Institute for Innovation Policy (JIIP), TNO for DG CLIMA 17
CONTENTS
EXECUTIVE SUMMARY ................................................................................................................................... 3
Objective and scope ...................................................................................................................................... 3
Approach ....................................................................................................................................................... 4
Cost competitiveness ..................................................................................................................................... 6
Innovation competitiveness ......................................................................................................................... 14
International competitiveness ...................................................................................................................... 15
General conclusions .................................................................................................................................... 15
1. Introduction .............................................................................................................................................. 21
1.1 Policy context of this study .............................................................................................................. 21
1.2 Project objectives and results .......................................................................................................... 23
1.3 Project scope ................................................................................................................................... 23
1.4 Reading guide .................................................................................................................................. 24
2. Methodological assessment framework .................................................................................................. 25
2.1 The structure of the project .............................................................................................................. 25
2.2 A general model of competitiveness ................................................................................................ 27
2.3 Identifying pathways for competitiveness impacts by means of mindmaps .................................... 29
2.4 Defining cases: focus on Europe versus the rest of the world ........................................................ 29
2.5 Definitions of EU vs. non-EU manufacturers ................................................................................... 30
3. Market and sectorial overview ................................................................................................................. 33
3.1 Automotive manufacturers ............................................................................................................... 33
3.2 Component suppliers ....................................................................................................................... 35
3.3 Employment and labour productivity in the automotive industry ..................................................... 35
3.4 Trade performance and comparative advantages ........................................................................... 36
3.5 Cost of capital and financial indicators ............................................................................................ 36
3.6 R&D and innovation ......................................................................................................................... 37
3.7 Fuel demand .................................................................................................................................... 38
3.8 Fuel prices ....................................................................................................................................... 38
3.9 Professional end users .................................................................................................................... 39
3.10 Automotive industry: market projections to 2020 and beyond ......................................................... 39
4. Policy options and compliance mechanisms ........................................................................................... 41
4.1 Introduction ...................................................................................................................................... 41
4.2 Policy options for post-2020 regulation ........................................................................................... 41
4.3 Possible compliance strategies of OEMs ........................................................................................ 50
4.4 Description and prioritisation of OEM compliance mechanisms ..................................................... 53
4.5 Key conclusions ............................................................................................................................... 58
5. Impacts on cost competitiveness: the automotive manufacturer perspective ......................................... 59
5.1 Introduction ...................................................................................................................................... 59
5.2 Overall methodology ........................................................................................................................ 60
5.3 Pathways for impacts on the cost competitiveness of automotive OEMs ....................................... 62
5.4 General consequences of different aspects of the legislation ......................................................... 66

Assessment of competitiveness impacts of post-2020 LDV CO2 regulation
Final Report Valdani Vicari & Associati (VVA), Technopolis Group (TG), Joint Institute for Innovation Policy (JIIP), TNO for DG CLIMA 18
5.5 Possible regional origins for differences in costs of compliance mechanism .................................. 81
5.6 Impacts on premium vs. volume manufacturers .............................................................................. 98
5.7 Impact of timing of the legislation on competiveness .................................................................... 102
5.8 Options available to OEMs to counteract cost competitiveness impacts of
EU LDV CO2 regulation ................................................................................................................. 103
5.9 Conclusions on cost competitiveness impacts from the automotive manufacturer perspective ... 103
6. Impacts on cost competitiveness: the automotive manufacturing perspective ..................................... 107
6.1 Introduction .................................................................................................................................... 107
6.2 Identification of possible pathways for cost competitiveness impacts on EU car manufacturing .. 108
6.3 Conclusions regarding cost competitiveness impacts on EU car manufacturing .......................... 117
7. Impacts on cost competitiveness: the component manufacturer perspective ....................................... 119
7.1 Introduction .................................................................................................................................... 119
7.2 Identification of impact pathways ................................................................................................... 119
7.3 Conclusions on cost competitiveness impacts from the perspective of component
manufacturers ................................................................................................................................ 133
8. Impacts on cost competitiveness: the component manufacturing perspective ..................................... 137
8.1 Possible cost competitiveness impact pathways for EU automotive component manufacturing .. 137
8.2 Conclusions regarding cost competitiveness impacts on EU automotive component
manufacturing ................................................................................................................................ 141
9. Effects of post 2020 regulation on cost competitiveness of the energy supply industry ....................... 143
9.1 Introduction .................................................................................................................................... 143
9.2 Cost competitiveness impacts on producers of fuels and other energy carriers ........................... 146
9.3 Cost competitiveness impacts on distributors of fuels and other energy carriers ......................... 150
9.4 Conclusions on cost competitiveness impacts on the fuel supply sector ...................................... 151
10. Effects of post 2020 regulation on cost competitiveness of (professional) end users....................... 153
10.1 Introduction .................................................................................................................................... 153
10.2 Identification of possible impact pathways .................................................................................... 153
10.3 SMEs ............................................................................................................................................. 157
10.4 Conclusions on cost competitiveness impacts on professional end-users ................................... 157
11. Impacts on innovation competitiveness ............................................................................................. 159
11.1 Introduction .................................................................................................................................... 159
11.2 Literature on innovation impacts of regulation ............................................................................... 161
11.3 Approach to assessing regulatory impacts on innovation competitiveness .................................. 163
11.4 Impacts on innovation competitiveness resulting from changes in regulatory framework
and compliance strategies ............................................................................................................. 170
11.5 Component manufacturers - Innovation capacity and innovation competitiveness impact ........... 180
11.6 Energy Providers - Innovation capacity and innovation competitiveness impact .......................... 181
11.7 Professional End users .................................................................................................................. 181
11.8 Key conclusions ............................................................................................................................. 182
12. Impacts on international competitiveness .......................................................................................... 185
12.1 Introduction .................................................................................................................................... 185
12.2 The analysis of current trade position of the EU............................................................................ 185

Assessment of competitiveness impacts of post-2020 LDV CO2 regulation
Final Report Valdani Vicari & Associati (VVA), Technopolis Group (TG), Joint Institute for Innovation Policy (JIIP), TNO for DG CLIMA 19
12.3 The impact of the prospective EU CO2 emission regulations on trade flows, trade
competiveness and cross-border investment flows in the automotive sector ............................... 187
12.4 Key conclusions ............................................................................................................................. 191
13. Conclusions and recommendations .................................................................................................. 193
13.1 Conclusions on possible cost competitiveness impacts ................................................................ 193
13.2 Conclusions on possible R&D competitiveness impacts ............................................................... 200
13.3 Conclusions on possible international competitiveness impacts ................................................... 202
13.4 Summary of conclusions on the basis of questions from the Competitiveness Proofing Toolkit .. 202
13.5 General conclusions ...................................................................................................................... 208
13.6 Recommendations ......................................................................................................................... 209
14. Literature ............................................................................................................................................ 211
Annex 1. Current CO2 legislation .............................................................................................................. 215
A1.1 CO2 regulation for passenger cars ................................................................................................ 215
A1.2 CO2 regulation for light commercial vehicles ................................................................................. 216
Annex 2. Detailed market and sectorial overview ..................................................................................... 219
A2.1 Overview of the automotive industry ............................................................................................. 219
A2.2 Employment and labour productivity in the automotive industry ................................................... 239
A2.3 Trade performance and comparative advantages ......................................................................... 244
A2.4 Cost of capital and financial indicators .......................................................................................... 251
A2.5 R&D and innovation ....................................................................................................................... 253
A2.6 Overview of the fuel supply sector ................................................................................................. 262
A2.7 Overview of professional end users .............................................................................................. 272
A2.8 Automotive industry: market projections to 2020 and beyond ....................................................... 274
Annex 3. Results from stakeholder consultation ....................................................................................... 283
A3.1 Answers by vehicle manufacturers ................................................................................................ 283
A3.2 Answers by component suppliers .................................................................................................. 288
A3.3 Answers by fuel suppliers .............................................................................................................. 289
Annex 4. Trade tariffs, barriers and Free Trade Agreements ................................................................... 291
Annex 5. Analysis of sales distributions .................................................................................................... 293
A5.1 Introduction .................................................................................................................................... 293
A5.2 Passenger cars .............................................................................................................................. 296
A5.3 Light commercial vehicles .............................................................................................................. 307
Annex 6. International competitiveness .................................................................................................... 319

Assessment of competitiveness impacts of post-2020 LDV CO2 regulation
Final Report Valdani Vicari & Associati (VVA), Technopolis Group (TG), Joint Institute for Innovation Policy (JIIP), TNO for DG CLIMA 20
GLOSSARY
ACEA European Automobile Manufacturers' Association
AFV Alternative Fuel Vehicle
BEV Battery Electric Vehicle
EU European Union
FCEV Fuel Cell Electric Vehicle
GHG Greenhouse Gas
ICEV Internal Combustion Engine Vehicle
JAMA Japan Automobile Manufacturers' Association
KAMA Korea Automobile Manufacturers' Association
LCV Light Commercial Vehicle
LDV Light Duty Vehicle
NEDC New European Driving Cycle
OEM Original Equipment Manufacturer
PHEV Plug-in Hybrid Electric Vehicle
RDI Research and Development and Innovation
TCO Total Cost of Ownership
TTW Tank-to-Wheels
WLTP Worldwide harmonized Light vehicles Test Procedures
WTW Well-to-Wheels

Assessment of competitiveness impacts of post-2020 LDV CO2 regulation
Final Report Valdani Vicari & Associati (VVA), Technopolis Group (TG), Joint Institute for Innovation Policy (JIIP), TNO for DG CLIMA 21
1. Introduction
This report presents the results of the project “Assessment of competitiveness impacts of post-2020 LDV
CO2 regulation”. A consortium consisting of Valdani Vicari & Associati (VVA), Technopolis Group (TG), Joint
Institute for Innovation Policy (JIIP) / TNO has carried out this project for the Directorate-General Climate
Action of the European Commission.
The objective of this study is to deliver an empirical evaluation of the possible competitiveness impacts of
future regulatory CO2 targets for cars and light commercial vehicles (LCVs). This will cover the main
elements included in the current Regulations or considered for beyond-2020 scenarios. The results of the
study are to provide a qualitative sectorial analysis and as well as a quantification of identified impacts when
feasible.
The main question to be answered is what effects the legislation could have on cost and innovation
competitiveness of individual companies and, in turn, on international competitiveness of the European
automotive industry and other affected sectors. The sectors considered in the study include automotive
manufacturers (OEMs), automotive component suppliers, energy supply companies and professional end
users.
1.1 Policy context of this study
The European Commission is currently starting up preparatory work for the development of proposals for
regulation of the CO2 emissions of light duty vehicles (LDV’s) beyond 2020. New legislative proposals are
expected to be made by the Commission in 2015. In the context of the decision process on the 2020
legislation in Council and Parliament, the co-legislators made a number of requests and in particular the
European Parliament proposed an indicative target range of 68-78 g/km for the passenger car legislation for
2025.1
During 2012 and 2013 two studies were carried out to increase the insight in various issues related to post-
2020 LDV CO2 regulation and to evaluate a number of possible modalities. Service requests #42 and #8
3,
under Framework Contract No ENV.C.3./FRA/2009/0043, paid specific attention to the choice of regulatory
metric, various pros and cons of the different options and their expected impact on manufacturer choices and
the cost-effectiveness of the regulation for reducing CO2 emissions.
In 2014 further analysis has started to provide inputs for the preparation of a proposal for post-2020
regulation. These include an ex-post evaluation of the current legislation, assessments of costs and
potentials of various technologies in the 2020-30 timeframe and a more comprehensive assessment of the
modalities for LDV CO2 regulations beyond 2020. The latter project will make use of the results of this project
with respect to competitiveness impacts.
1 Annex 1 contains a description of the current CO2 legislation.
2 Consideration of alternative approaches to regulating CO2 emissions from light duty road vehicles for the period after
2020, [TNO2013a]. 3 Analysis of the influence of metrics for future CO2 legislation for Light Duty Vehicles on deployment of technologies and
GHG abatement costs, [TNO2013b].

Assessment of competitiveness impacts of post-2020 LDV CO2 regulation
Final Report Valdani Vicari & Associati (VVA), Technopolis Group (TG), Joint Institute for Innovation Policy (JIIP), TNO for DG CLIMA 22
With respect to future CO2 legislation two notions are important. First, that there are an increasing number of
compliance mechanisms that manufacturers apply. Second, that attention to possible competitiveness
impacts is becoming more and more relevant.
An increasing number of compliance mechanisms
For the targets up to 2020 the most important compliance mechanism for manufacturers is to apply
efficiency-improving technologies to the conventional vehicles (ICEVs) that they produce. These include
among other things more efficient engines and transmissions, start-stop systems and various levels of
powertrain hybridisation, efficient auxiliaries, low rolling resistance tyres, improved aerodynamics, and weight
reduction measures. As a result of the additional technology light-duty ICEVs become more expensive to
buy, while at the same time cheaper to operate, due to the lower fuel consumption. The net economic effect
depends on a range of factors including the target set in the legislation, the direct cost of compliance, the
price of fuels and various indirect economic impacts.
In the future, replacing a share of the conventional vehicle sales by vehicles with alternative powertrains,
including e.g. plug-in hybrids (PHEVs), battery-electric vehicles (BEVs) and fuel cell vehicles (FCEVs) will
become an increasingly important compliance mechanism. For targets below around 70 g/km it will even be
necessary for meeting the target to sell a finite share of such alternatives as the CO2-emissions of ICEVs are
unlikely to be reduced beyond that point with the technologies currently in view. The cost structure of these
vehicles is different from that of ICEVs, and their introduction may affect the structure of the automotive
sector.
Increased attention for possible competitiveness impacts
The CO2 legislation affects the costs and cost structure of manufacturing, owning and operating light duty
vehicles. As a result the legislation has economic impacts, and may directly or indirectly affect the
competitiveness of companies in various economic sectors.
European Commission legislative proposals are accompanied by an Impact Assessment, an element of
which deals with the legislation’s impact on competitiveness of affected sectors. Recently the Commission
has been putting more emphasis on the analysis of the impacts of new policy proposals on enterprise
competitiveness within the Commission's integrated impact assessment approach. Specific operational
guidance for assessing impacts on sectorial competitiveness within the Commission Impact Assessment
System are laid down in SEC(2012) 914.The reason for this is that the Commission wishes to respond to the
need for better-targeted tools to boost productivity and growth in times of the economic slowdown. The
economic crisis has had, and is still having, strong impacts on the sales of new vehicles in Europe. Industrial
stakeholders and some Member States with large automotive industries are therefore stressing that
economic and competitiveness impacts are fully accounted for in the development of proposals for further
tightening of European CO2 regulation for LCVs. The topic of competitiveness in relation to the economic
crisis and EU policy was also addressed in the CARS21 initiative.
4 A "Competitiveness Proofing Toolkit” for use in Impact Assessments, Brussels, 27.1.2012 SEC(2012) 91 final.
See: http://ec.europa.eu/smart-regulation/impact/key_docs/docs/sec_2012_0091_en.pdf

Assessment of competitiveness impacts of post-2020 LDV CO2 regulation
Final Report Valdani Vicari & Associati (VVA), Technopolis Group (TG), Joint Institute for Innovation Policy (JIIP), TNO for DG CLIMA 23
1.2 Project objectives and results
The objective of this study is to deliver an empirical ex-ante evaluation of the impacts on competitiveness of
possible regulatory CO2 targets for cars and light commercial vehicles for the period beyond 2020. The study
is ex-ante because, at the moment, there is no proposal for this legislation.
This report contains the results of the study, consisting of a qualitative sectorial analysis as well as a
quantification of identified impacts when feasible. This result will enable the European Commission to include
insights on competitiveness impacts in the process of developing proposals for post-2020 regulation rather
than just performing a “check” on the impacts after finalising the proposal.
1.3 Project scope
The project team has developed and employed a methodological framework for the ex-ante assessment of
competitiveness impacts of post-2020 CO2 legislation for LDVs. The study has focussed on possible impacts
of this legislation on competitiveness of Europe compared to the rest of the world, and assessed impacts
with respect to:
cost competitiveness;
innovation competitiveness;
international competitiveness.
Legislation affects competition if it has different (economic) impacts for similar affected entities. For the
analysis the following sectors were considered:
automotive manufacturers;
automotive component suppliers;
energy supply industry;
professional end-users.
The main elements of the current legislation are considered in the analysis, complemented with additional
elements considered for post-2020 legislation. The main elements of the current legislation are:
target for average emissions;
mass as utility parameter;
a linear mass-based target line with defined slope;
derogations;
super-credits;
eco-innovations;
phase-in.
In addition, the following elements for post-2020 legislation have been considered:
alternative utility parameter, e.g. footprint;
alternative metric, e.g. Well-to-Wheels Greenhouse Gas (WTW GHG) emissions or WTW or TTW (Tank-
to-Wheels) energy consumption.

Assessment of competitiveness impacts of post-2020 LDV CO2 regulation
Final Report Valdani Vicari & Associati (VVA), Technopolis Group (TG), Joint Institute for Innovation Policy (JIIP), TNO for DG CLIMA 24
The project was explicitly about the possible effects on the competitiveness of Europe versus the rest of the
world, looking at the region as a whole, including companies operating in Europe in the affected sectors
compared to companies operating in other countries. The project therefore didn’t look at differential issues
between member states or between separate manufacturers. In the assessment no explicit subdivision was
made in different categories of OEMs or suppliers (for example based on the car segment they focus on or
the type of parts they are specialising in). Possible impacts of whether OEMs are volume or premium
manufacturers, however, are acknowledged and analysed in the report. With respect to affected sectors the
study did not consider impacts in vehicle retailing, insurance or repair. Companies in these sectors are
predominantly EU companies competing with other EU companies in the EU market. For that reason no
competitiveness impacts are to be expected from the perspective of EU vs. other regions.
1.4 Reading guide
The methodological approach used in the project is described in chapter 2. Chapter 3 presents a market and
sectorial overview (with additional information in Annex 2). Next, policy options and possible compliance
mechanisms are explored in chapter 4. The results of this exploration, together with the market and sectorial
overview, serve as a starting point for the analysis of possible impacts. The identified possible impacts on
cost competitiveness of different affected sectors are presented in chapters 5 to 10. After that, chapter 11
analyses innovation competitiveness impacts while chapter 12 deals with the impacts on international
competitiveness. A summary of the various impacts, conclusions and recommendations can be found in
chapter 13. More detailed results and background data are provided in the annexes.

Assessment of competitiveness impacts of post-2020 LDV CO2 regulation
Final Report Valdani Vicari & Associati (VVA), Technopolis Group (TG), Joint Institute for Innovation Policy (JIIP), TNO for DG CLIMA 25
2. Methodological assessment framework
2.1 The structure of the project
The way in which different activities in the project interacted to achieve the overall results is pictured in
Figure 5. The columns represent the various activities that were carried out, of which the collection of
sectorial information and the stakeholder interviews are general activities that support the three specific
assessments of different competitiveness impacts. Information was collected via desk research and by
means of a number of interviews with representatives of OEMs, component suppliers and fuel suppliers, and
the relevant associations for these sectors (a list of interviewees is contained in Annex 3). Also, an
intermediate stakeholder meeting involving these parties was organised in Brussels. At that meeting the
preliminary results of the study were discussed and elaborated.
The project has been split in two phases. In the first phase (upper half in Figure 5) the focus has been on a
general exploration of possible pathways through which the post-2020 CO2 legislation might impact
competitiveness of affected sectors. In the second phase (lower half in the figure), results from the collection
of sectorial information and stakeholder interviews are used to assess in a qualitative and as far as possible
quantitative manner to which extent identified pathways are likely to lead to significant impacts.
Figure 5 – Structure of the project
Following the approach outlined in the Commission's Competitiveness Proofing Toolkit the investigation of
competitiveness impacts has been structured along three key dimensions, namely:
Cost competitiveness, the cost of doing business, which includes cost of intermediate inputs (incl.
energy) and of factors of production (labour and capital);
Innovation competitiveness (defined as capacity to innovate), e.g. the capacity of the business to
produce more and/or higher quality products and services that meet better customers' preferences;

Assessment of competitiveness impacts of post-2020 LDV CO2 regulation
Final Report Valdani Vicari & Associati (VVA), Technopolis Group (TG), Joint Institute for Innovation Policy (JIIP), TNO for DG CLIMA 26
International competitiveness, e.g. the differential impact of the two dimensions above on the
European industries’ market shares and revealed comparative advantages vis-à-vis international
competitors.
These dimensions were investigated for each category of stakeholder considered. Below a short explanation
is provided of each of the criteria.
Cost competitiveness
Cost competitiveness relates to the (direct or indirect) impact of the legislation on the costs sustained by a
company in particular, or by the industry it belongs to in general, and to the impact of possible differences in
these cost impacts on the competition between companies or sectors. With respect to the role of CO2
legislation, the impacts relate to the compliance costs sustained by Original Equipment Manufacturers
(OEMs) in order to achieve the targets (or to manage the inability to meet these targets). The impact on
different OEMs and segments is explored in detail in the studies underlying the legislative proposals.
Based on the compliance actions put in place by OEMs, the investigation of cost competitiveness impacts is
also extended to other categories of stakeholders. Examples of topics being investigated under the cost
competitiveness criteria include:
OEMs: the costs to meet the target, as well as the difference in costs for different categories of OEMs,
the cost of required technical innovations and the increased cost of components purchased from
suppliers;
Component suppliers: the costs caused by satisfying new requirements from OEMs through the
development of innovative components and the effect on margins;
Fuel suppliers: the impact of the legislation on overall fuel demand, fuel prices and consequently
revenues and margins by industry players;
End users: possible changes both in terms of vehicles’ price and total cost of ownership (TCO).
Innovation competitiveness
The impacts on innovation competitiveness relate to the effects of the policy on a company’s innovation
capacity, which may then impact on its competitiveness (measured either by market shares, or leadership in
a specific market segment etc.).5 Impacts are generated if the legislation influences the capacity to innovate
of industry players, notably by altering their innovation choices. The need to innovate to comply with
regulatory requirements may change the relative positioning of industry players.
The assessment of relevant impacts in this study requires the consideration of the following three aspects:
1) The effect of the policy may have both a positive and a negative influence on innovation
competitiveness depending on the innovation capabilities of OEMs and first tier suppliers, in particular
EU vs. non-EU OEMs and first tier suppliers;
2) The nature of impacts may differ depending on the innovation capabilities and compliance strategies
chosen by the different OEMs and suppliers, and
5 See the Competitiveness Proofing Toolkit as issued by the European Commission in 2012, available at:
http://ec.europa.eu/smart-regulation/impact/key_docs/docs/sec_2012_0091_en.pdf

Assessment of competitiveness impacts of post-2020 LDV CO2 regulation
Final Report Valdani Vicari & Associati (VVA), Technopolis Group (TG), Joint Institute for Innovation Policy (JIIP), TNO for DG CLIMA 27
3) The nature and timing of impacts may differ depending on how advanced OEMs and suppliers are in the
innovation processes needed to comply with the regulation.
International competitiveness
International competitiveness impacts arise if EU firms and industries are impacted differently than non-EU
ones in any of the areas outlined above, leading to higher or lower competitiveness of the EU vis-à-vis
international competitors. A selection of the aspects investigated under the international competitiveness
dimension includes:
The “relative” levels of stringency of the targets imposed on EU and non-EU OEMs;
The international distribution of capabilities in the innovation areas relevant to CO2 legislation (e.g. diesel
engines, electrification, batteries);
The distribution of the required skills (e.g. electric and system engineering) globally, as well as
differences in cost of labour between different regions/nations;
Availability of investment capital in different countries.
To explore, investigate and assess the current status of international competitiveness, as well as the impacts
of post-2020 CO2 legislation, the following indicators suggested in Step 12 of the Competitiveness Proofing
Toolkit have been used:
Export market shares, showing how much of the total ‘world’ exports of cars, LCVs and components
are covered by the export of a particular country or region;
Revealed Comparative Advantage, comparing the share of automotive and component sector exports
in the EU’s total manufacturing exports with the share of exports of a group of reference countries for the
same sectors (i.e. calculation of the Balassa Index);
Trade Balances, comparing passenger car, LCV and component trade balances to a) the total volume
of trade, exports plus imports (relative trade balances) and to b) the figures of reference countries;
Unit Labour Costs, comparing the automotive industry cost of labour to the corresponding index in
reference countries.
These dimensions are investigated and assessed in Chapter 12 of the report.
2.2 A general model of competitiveness
In general the competitiveness of companies is determined by the price and value of their products or
services relative to the price and value of products or services of competing companies (selling similar
products or services or alternatives that can serve as a substitute). Changes in the price and value of a
company’s product or service will change the relative attractiveness of the product or service which will lead
to changes in market shares. The price and value of a company’s products or services are determined by the
company’s capabilities to produce and sell attractive products or services, which in turn are determined by a
range of resources, as illustrated in Figure 6. Changes in market shares and profits resulting from changes in
the competitiveness of a company’s products are likely to affect the company’s financial and other resources,
causing a feedback loop.

Assessment of competitiveness impacts of post-2020 LDV CO2 regulation
Final Report Valdani Vicari & Associati (VVA), Technopolis Group (TG), Joint Institute for Innovation Policy (JIIP), TNO for DG CLIMA 28
Figure 6 – General model of competitiveness
In assessing the competitiveness impacts of a piece of legislation the focus is on the change caused (delta
or Δ), both in terms of differences between similar affected entities and in terms of the changes in market
positions of these entities compared to the reference situation. A delta in the resources of a company relative
to those of its competitors leads to a delta in the capabilities of these companies to respond to the
(consequences of the) legislation, which in turn may translate into a delta in costs and price of the products
of the competing entities which influences the equilibrium in the market leading to changes in market shares.
From a cost competitiveness point of view legislation thus affects competition if it has different (economic)
impacts for similar affected entities. In the case of post-2020 CO2 legislation for cars and vans such entities
can e.g. be individual car manufacturers competing on the European market. For meeting the targets set in
the LDV CO2 legislation automotive manufacturers can choose from a range of compliance mechanisms.
The impact of these compliance mechanisms on the costs and value of their products may affect their
competitiveness if these impacts are significantly different from those incurred by their competitors. But also
the European automotive industry as a whole can be seen as an affected entity as it can be considered to
compete on a global market not only for customers but e.g. also for investors.
Impacts on innovation competitiveness can be assessed within the same framework related to resources
and capabilities, as it concerns the impact of available R&D resources on the ability to meet targets as well
as the impact of legislation on R&D resources.

Assessment of competitiveness impacts of post-2020 LDV CO2 regulation
Final Report Valdani Vicari & Associati (VVA), Technopolis Group (TG), Joint Institute for Innovation Policy (JIIP), TNO for DG CLIMA 29
International competitiveness, assessed from a macro-economic perspective, can be considered as the
overall resulting impacts of changes in cost competitiveness and innovation competitiveness on e.g. trade
flows and cross-border investments.
In other words, the model depicted in Figure 6 can be applied not only to competition between companies
but also – like in this study – to competition between industries or industry sectors from different regions (in
this case industry in the EU versus industry in other regions) operating on the same market.
2.3 Identifying pathways for competitiveness impacts by means of mindmaps
For the different affected sectors as considered in this study, mindmaps have been drawn up to assess the
pathways through which elements of the EU LDV CO2 legislation might lead to competitiveness impacts. For
cost competitiveness these mindmaps connect:
elements of the legislation to different compliance strategies;
(effects of) different compliance strategies to possible differences in resources and capabilities of
companies;
resulting differences in the cost and purchase price of vehicles as well as their operating costs
to impacts on competitiveness.
The mindmaps are mainly used in chapters 5 to 10, where they are employed to assess the effect and
significance of various possible pathways for cost competitiveness impacts6. Based on the insights from
these mindmaps, in chapter 11 and 12 innovation and international competitiveness are assessed.
To draw conclusions on the competitiveness impact of the EU LDV CO2 regulations the following two issues
need to be taken into consideration:
Counteracting competitiveness impacts: For a given company or region, different pathways may at
the same time lead to competitiveness impacts, which have different signs (positive or negative). The net
effect of these different pathways is not necessarily significant. The more pathways with differing signs
exist, the more likely it is that the net effect will be zero.
Options for mitigating competitiveness impacts: The analysis of pathways assumes that no
measures are taken by affected entities to mitigate impacts on competitiveness. However, in general
there will be a range of options available to automotive manufacturers and companies in other affected
sectors that may help to counteract any competitiveness impacts of the legislation. This reduces the
likelihood of the legislation causing significant net competitiveness impacts. In chapter 5, therefore,
possible mitigation measures are also discussed in the context of the assessment of different affected
sectors.
2.4 Defining cases: focus on Europe versus the rest of the world
As the focus of the analysis is on the competitiveness of EU sectors versus those in other regions, the
analysis aims at identifying whether and how the costs of complying with the EU LDV CO2 legislation could
6 NOTE: To facilitate printing on A3 paper, the larger mindmaps presented in this report are also provided in a
separate pdf-document.

Assessment of competitiveness impacts of post-2020 LDV CO2 regulation
Final Report Valdani Vicari & Associati (VVA), Technopolis Group (TG), Joint Institute for Innovation Policy (JIIP), TNO for DG CLIMA 30
be different for European companies versus companies from other regions and on how this effects
innovation and international competiveness. For the affected sectors the analysis is separated into two
cases:
European companies vs. competing companies from other regions;
European manufacturing or production vs. manufacturing or production in other regions.
The first approach starts from the impacts of the regulation on the price and value of products of competing
companies, while the second approach is based on identifying first and second order impacts on cost factors
of production in different regions. A more detailed explanation, including the relation between the two
approaches is provided in chapter 5.
Both analyses rely on identifying whether and how the EU legislation could lead to:
different levels of stringency of the targets imposed on EU and non-EU OEMs;
differences in the costs for EU and non-EU OEMs of complying with similar targets, which in turn may be
the result of:
o EU and non-EU OEMs choosing (or being forced to choose) different compliance mechanisms with
different cost implications to meet similar targets;
o costs of similar compliance mechanisms being different for EU vs. non-EU OEMs.
The latter two aspects strongly relate to the capabilities and resources of companies. One of the main goals
of the analysis, therefore, is to identify whether regional differences exist in the capabilities and resources of
companies and whether and how these could lead to different costs of compliance with the EU LDV CO2
legislation.
For the end user sector the analysis focusses on identifying whether and how the legislation could lead to
changes in the costs of operating LDVs and their share in the costs of doing business that are different for
EU companies than for competing non-EU companies.
2.5 Definitions of EU vs. non-EU manufacturers
The distinction between EU manufacturers and manufacturers from outside the EU may be intuitively clear,
but when a closer look is taken the distinction is less obvious. Many OEMs from Japan and Korea produce a
significant share of their EU sales in large manufacturing plants in the EU. Consistent with that large
European presence, Toyota and Hyundai have recently become members of ACEA. Ford was originally US-
based, but started establishing European branches in 1925 and has been developing vehicles for the
European market in Europe since the 1930’s. Opel is since 1929 part of US-based GM but started as a
German company. More recently some originally European manufacturers have been taken over by
companies from outside Europe, such as Jaguar-Landrover (owned by Tata, based in India) and Volvo
(owned by Geely, based in China). The ownership issue is more diffuse in the strategic partnership between
Renault and Nissan. This was not a merger or an acquisition, but instead the two companies are joined
together through a cross-shareholding agreement (and also to a lesser extent with Daimler). The structure of
buying each other’s shares was also used in a more recently announced cooperation between General
Motors and PSA Peugeot Citroën for the joint development of a new vehicle platform.

Assessment of competitiveness impacts of post-2020 LDV CO2 regulation
Final Report Valdani Vicari & Associati (VVA), Technopolis Group (TG), Joint Institute for Innovation Policy (JIIP), TNO for DG CLIMA 31
In the light commercial vehicle market the ownership situation appears less complex (although there appears
to be a larger proportion of brand engineering), but as many EU-based OEMs manufacture a large share of
their vehicles outside the EU in Turkey, the identification of companies as being EU or not still depends on
the definition that is used. In any case, from the perspective of the competitiveness of the EU automotive
manufacturing sector, where jobs and cross border investments are important indicators, vehicles
manufactured outside the EU should be considered to originate from non-EU automotive manufacturing
sectors.
To assess possible differences between EU and non-EU manufacturers the following (non-exhaustive list of)
different definitions could be used:
1. Current main association membership for the EU market:
o Classification as EU vs. Japanese, Korean and other according to membership of associations
ACEA, JAMA, KAMA, and other / unknown.
o Toyota (incl. Lexus) and Hyundai are included as members of ACEA.
o In this definition Ford and GM are EU manufacturers as they are member of ACEA.
o “Other / unknown” contains e.g. manufacturers from the US, China, India, and Malaysia.
2. Original association membership:
o Classification as EU, Japanese, Korean and other according to original membership of
associations ACEA, JAMA, KAMA, and other / unknown.
o Toyota (incl. Lexus) is included as a member of JAMA and Hyundai as a member of KAMA.
o In this definition Ford and GM are EU manufacturers as they are original members of ACEA.
o “Other / unknown” contains e.g. manufacturers from the US, China, India, and Malaysia.
3. Location of headquarters / owner
o Classification as EU, Japanese, Korean and other according to location of the owner or
headquarter by region: EU,. Japan, Korea and other (including US).
o Chrysler counts as EU as it is owned by Fiat.
o “Other” includes Ford and GM having US-based ownership and Volvo and Jaguar-Landrover
being owned respectively by companies from China and India.
4. Share of vehicles sold in the EU that are manufactured in the EU
o A possible definition could be to define an EU manufacturer as having a minimum of e.g. 50% of
its EU sales manufactured in the EU.
o For example, 67% of the cars sold by Toyota in the EU are produced in the EU. At a stakeholder
meeting Toyota indicated that it aims to increase this to 75% in the future.
If what is an EU manufacturer is defined on the basis of option 4, then the distinction between the
perspectives of EU vs. non-EU manufacturers and EU vs. non-EU manufacturing becomes less clear, as the
motivation for manufacturers to locate a large share of their production in the EU depends to a large extent
on the competitiveness of European manufacturing compared to manufacturing in other regions. Other
reasons for manufacturing in the EU include the possible benefits of having design and production located
closer to the customer in order to market cars that appeal to EU customers.

Assessment of competitiveness impacts of post-2020 LDV CO2 regulation
Final Report Valdani Vicari & Associati (VVA), Technopolis Group (TG), Joint Institute for Innovation Policy (JIIP), TNO for DG CLIMA 32
In Annex 5 an analysis is provided of sales distributions of EU vs. non EU manufacturers based on the first
three of the above definitions. Table 58 and Table 59 in that annex contain an overview of how brands /
manufacturers in the 2013 EEA monitoring database are divided over the different categories in the first
three definitions given above.
In the end no single definition was used in the assessment of potential competitiveness impact pathways.
Given that most conclusions needed to remain qualitative in view of their dependence on details of the
legislation that are still to be determined, an attempt has been made to draw conclusions that are robust
under different definitions.

Assessment of competitiveness impacts of post-2020 LDV CO2 regulation
Final Report Valdani Vicari & Associati (VVA), Technopolis Group (TG), Joint Institute for Innovation Policy (JIIP), TNO for DG CLIMA 33
3. Market and sectorial overview
3.1 Automotive manufacturers
In the automotive market, vehicle sales in the more mature markets have mostly plateaued, with sales in the
EU dropping significantly due to the crisis of the last years (-4.44% on an annual basis between 2007 and
2013 for passenger cars and -7.05% for LCVs). Vice versa, the emerging markets act as a catalyst for
growth especially due to their rapidly growing economies and large and young populations. Other than the
effect on distribution of sales worldwide, the economic context, combined with the legislative framework, is
having an impact on the profitability of the automotive business, with several groups (EU and non-EU
headquartered) recording losses in the EU markets and cross-subsidizing the EU business through the
profits in other regions.
In Europe, the issue of profitability has progressively led OEMs to react through mitigation strategies which
include:
Pursuit of the co-opetition model through alliances and partnerships with other OEMs to achieve cost
savings;
Increasing geographical presence on the most profitable markets worldwide;
Delocalisation of production facilities from Western to Eastern Europe and Turkey. Nonetheless, due to
the benefits of just-in-time production, proximity to customers, as well as the issues of trade tariffs and
logistics costs, production is likely to stay relatively close to sales;
Change in the make-vs-buy choice and increasing reliance on component suppliers.
Table 1 - Share of European sales of major automotive groups7
Manufacturer HQ
Country % of sales in Europe
Total sales 2013
worldwide (x1000)
Manufacturer HQ
Country % of sales in Europe
Total sales 2013
worldwide (x1000)
Renault France 59% 2,125 Nissan Japan 14% 4,825
PSA France 58% 2,189 Tata India 11% 1,192
BMW Germany 44% 1,964 Suzuki Japan 13% 2857
Volkswagen Germany 43% 9,729 Toyota Japan 9% 8,871
Daimler (Mercedes-Benz)
Germany 41% 1,565 Hyundai Korea 9% 4,622
Fiat Italy 23% 4,330 Fuji Japan 6% 724
Mitsubishi Japan 23% 1,257 Honda Japan 4% 4,323
Geely (incl. Volvo cars)
China 23% 977 Isuzu Japan 4% 639
Ford US 21% 6,330 Dongfeng China 0% 2,567
General motors US 16% 9,715 Changan China 0% 2,120
Mazda Japan 16% 1331 Brilliance China 0% 207
OEMs are global companies with distributed regional production facilities, sales and distribution channels
and local marketing strategies, therefore the economic downturn in Europe affects not only EU-
headquartered companies, but all companies active in the EU. The extent to which a specific OEM has been
7 Source: VVA analysis based on financial statements for the year 2013

Assessment of competitiveness impacts of post-2020 LDV CO2 regulation
Final Report Valdani Vicari & Associati (VVA), Technopolis Group (TG), Joint Institute for Innovation Policy (JIIP), TNO for DG CLIMA 34
impacted is influenced by the share of its sales in Europe. French companies are the most exposed with
60% of their sales being in the EU, German ones follow with sales between 40 and 45%, whereas Fiat and
US companies have sales ranging between 16 and 23% (Table 1).
OEMs consider CO2 legislation to hamper profitability by imposing compliance costs. This may be more
relevant for “volume” manufacturers, whose customers tend to have a low acceptance of environmental
technologies, resulting in a challenge for OEMs to transfer the cost of innovation to end users. In contrast,
“premium” manufacturers have significantly less difficulty in finding user acceptance (and thus adding a price
premium), as innovation is a key part of the selling proposition of their vehicles. A clustering based on the
average price and weight of the vehicles sold in the EU leads to a clear segmentation:
Fiat, Ford, General Motors, Hyundai, Nissan, PSA, Renault and Toyota can be considered as “volume”
manufacturers;
BMW, Daimler and Geely (Volvo) can be considered as “premium” manufacturers;
Volkswagen (group) is a specific case, as within the group Audi is a premium manufacturer, Skoda and
Seat are volume manufacturers and Volkswagen is on the highest end of the same cluster.
Figure 7 – Brands in the EU by average price and weight of passenger cars8
Vehicle manufacturers can also be categorised based on the type of engine of the vehicles sold in the EU.
Groups with a stronger European presence and a focus on premium vehicles exhibit a higher share of diesel
engine sales. Vice versa, brands of non-EU groups focusing on volumes tend to exhibit higher shares of
petrol engine sales.
According to some of the interviewed stakeholders, competences in diesel engines are currently a source of
competitive advantage in complying with the requirements of CO2 legislation. Stakeholders noted, in this
sense, that the Euro 6-2 legislation will reduce this advantage – the same effect is foreseen for ambitious
CO2 targets, as it is expected that they could not be fulfilled through diesel.
8 Source: VVA elaboration based on ICCT data, year 2012

Assessment of competitiveness impacts of post-2020 LDV CO2 regulation
Final Report Valdani Vicari & Associati (VVA), Technopolis Group (TG), Joint Institute for Innovation Policy (JIIP), TNO for DG CLIMA 35
3.2 Component suppliers
The vehicle components sector is highly fragmented. In recent years, however, consolidation has started to
take place also among suppliers which is leading to the creation of mega-suppliers leaving less space for
small and regional suppliers. Mega-suppliers are able to provide local support by building factories close to
OEMs but they also have an international presence, which gives them the possibility to better mitigate
regional recessions.
Automotive suppliers represent a significant source of innovation in the automotive industry. Tier-one
suppliers, in particular, are playing an increasingly prominent role in innovation and technological
development. Moreover, the ongoing suppliers consolidation will give rise to stronger OEM-supplier
relationships as the former are becoming more dependent on their suppliers.
In 2015, about 70% of R&D value creation will be generated by suppliers and engineering service providers.
The importance of tier-one suppliers in innovation and product development will escalate. Mega-suppliers
are already playing a bigger role in innovation in the areas of power train, interior design, and chassis
components - historically the R&D domains of carmakers.
3.3 Employment and labour productivity in the automotive industry
According to data from OICA, more than 8 million people worldwide were directly employed in 2005 in the
manufacturing of vehicles and their components, representing more than 5% of the world’s total
manufacturing employment. In the EU, according to Eurostat (data on NACE code 29) more than 2 million
people are directly employed in the automotive industry, almost half of them in the manufacture of parts and
accessories. Key categories of employees according to skill include mechanics, electricians, engineers, IT
expert, together with sales and marketing specialists and product managers, accountants, business and
financial specialists. In terms of geographical spread Germany alone accounts for 36% of the total direct
employment. Other large EU large Member States each account for 6% to 10%.
Before the crisis, there had been a trend of increasing employment especially in new Member States. The
decline in demand and production since mid-2008 and the resulting restructuring of the industry have
brought a significant number of job cuts, hitting, among others, the United Kingdom (-42% in 2011 compared
to 2007), France and Spain (-20% and -19%), Hungary (-13%) and Italy (-7%). In the same period, some
Central and Eastern European countries experienced steady growth, including Bulgaria (+54%), Slovakia
(+20%) and Romania (+18%). In 2012, figures improved slightly with Central and Eastern European
countries continuing their growth, Germany growing quite significantly (+4%) and Member States hit the most
by the crisis remaining at 2011 levels.
Labour costs and labour productivity represent an important aspect of an industry’s ability to remain
effective. Since competition is particularly intense for small-sized cars, producers of lower segment cars have
moved, or are moving, a great part of their production to countries with lower production costs. On the
contrary, premium segment cars are still largely assembled on traditional sites. The new facilities for volume
segment cars have been built with the latest technology, making these sites attractive for both lower labour
costs and productivity reasons.

Assessment of competitiveness impacts of post-2020 LDV CO2 regulation
Final Report Valdani Vicari & Associati (VVA), Technopolis Group (TG), Joint Institute for Innovation Policy (JIIP), TNO for DG CLIMA 36
The fact that costs are influenced by a series of specific factors (degree of automation of plants, efficiency
and production competences of the manufacturer, type of vehicle produced, labour productivity based on
skills, etc.) makes it extremely difficult to compare the different impacts of labour costs on vehicles. However,
important differences exist between countries within the same region for all the major markets. In the EU,
countries such as Poland, Slovakia and Hungary offer personnel costs a factor of 5 times lower than
European countries such as Germany, France and Italy. Moreover, Turkey is extremely competitive in terms
of labour costs – this is one of the reasons leading many OEMs (Ford, Toyota, Fiat, Hyundai among others)
to invest in production facilities in Turkey. Similar trends can be observed both in Central and North America
and Asia.
Labour costs are only a partial indicator of a country’s attractiveness. The most relevant indicator behind the
choice of an OEM on a manufacturing location is labour productivity. EU labour productivity figures suggest
that the distances between EU 15 and EU 13 are smaller than what emerges solely from a comparison of
personnel costs.
3.4 Trade performance and comparative advantages
The analysis shows that the automotive market is mainly a regional one, with vehicles typically produced in
the region where they are sold. Of all the cars sold in Europe, 86% are manufactured in Europe. The key
reasons for this include:
Trade barriers;
Benefits of geographical presence and just-in-time production;
Transportation and logistics costs.
Trade within the same region is a common practice, when enabled by favourable combinations of
geographical proximity, offset in labour costs and absence of trade barriers. This is the case for Turkey and
Mexico.
In spite of the barriers to trade caused by logistics costs and import tariffs, the EU automotive industry is a
global player delivering its products worldwide. The automotive sector contributes positively to the EU trade
balance with trade surplus around USD 100 billion when considering vehicle manufacturing (trade surplus in
2012 was USD 81 billion) and vehicle components (trade surplus summed up to USD 21 billion).
The EU has a revealed comparative advantage (RCA) in the car manufacturing market, a comparative
disadvantage in the LCV manufacturing market (due to the relevant trade flows from Turkey) and a
comparative advantage in CO2 related component manufacturing.
3.5 Cost of capital and financial indicators
The implementation of the legislation does not directly affect the financial sector, however indirect impacts
could take place if significant investments are needed by OEMs, their suppliers and other affected sectors. In
this framework, competitiveness impacts (related to the cost dimension) depend on different levels of the
cost of capital for companies.

Assessment of competitiveness impacts of post-2020 LDV CO2 regulation
Final Report Valdani Vicari & Associati (VVA), Technopolis Group (TG), Joint Institute for Innovation Policy (JIIP), TNO for DG CLIMA 37
At the beginning of 2014 the cost of capital for EU OEMs was reported to be on average slightly lower than
the one for non-European competitors. Regarding the automotive supplier sector, EU companies face higher
costs of capital than non-EU competitors.
Another relevant factor affecting the financial situation of companies is the availability of investment capital
for companies. Interviewees claim that OEMs facing major investments in the EU might have a disadvantage
in accessing capital compared to international competitors facing similar investments in countries such as the
United States.
3.6 R&D and innovation
Focusing on the R&D investment in new technologies, the automotive sector is the largest investor in R&D in
the EU with over 32 billion euros of expenditure and accounting for 25% of total R&D spending. In Germany
the sector accounts for more than 30% of all R&D spending. In the Czech Republic, Sweden, France and
Japan it exceeds 15%. The key areas for R&D investment by vehicle manufacturers are safety, connectivity
and fuel efficiency and eco innovation.
The ratio between R&D and total staff for different OEMs (and brands) ranges between 1:5 and 1:25, as
shown in the figure below.
Table 2 - R&D personnel, selected OEMs9
Automaker R&D staff R&D staff
Total staff ratio
BMW Group 11,359 1:10
Daimler 14,700 1:19
FIAT Group 18,700 1:12
General Motors10
17,000 1:10
Nissan 16,120 1:10
Opel 6,800 1:5
PSA 14,500 1:13
Renault 16,426 1:7
Toyota 14,000 1:24
Volkswagen 23,000 1:25
Focusing on patenting, from the early 2000s the “non-environmental” patenting rate dramatically declined
while the “environmental” patenting continued peaking. The leaders in alternative power patents during the
2006-2011 period included Toyota, Honda, Denso, General Motors and Panasonic. At country level, Japan
accounts for 35.2% of alternative power innovation, followed by China (28.4%), USA (10.3%) and South
Korea 9%. Germany ranks in the top five (being 5th with 7.8%) and is the first EU country, followed by France
(1.7%) and the UK (0.6%). The leading position of Japanese companies in alternative power patents may be
explained by their early and strong positioning in the electric vehicle global market.
The innovation process in the automotive sector has shifted towards more integrated partnerships with
systems and component suppliers. Around 24% of automotive firms cooperate with suppliers, 19% with
9 Source: own elaboration on OEMs annual reports and websites
10 Not including Opel/Vauxhall.

Assessment of competitiveness impacts of post-2020 LDV CO2 regulation
Final Report Valdani Vicari & Associati (VVA), Technopolis Group (TG), Joint Institute for Innovation Policy (JIIP), TNO for DG CLIMA 38
customers, 13% with universities and 8% with research institutions. First tier component suppliers and global
mega suppliers increasingly coordinate the supplier and innovation networks which entail the coordination of
a network of other first tier suppliers and tier ‘n’ suppliers. OEMs on their end select first tier suppliers and try
to retain influence in terms of project-organisation and development-expertise.
In Europe the most active country in Joint Ventures and Strategic Alliances (JVAs) is Germany. In the period
1994-2014, Germany launched more than 260 JVAs, almost twice the amount launched by the second
European country (France, followed by Italy and the United Kingdom). The most common countries with
which these JVAs took place include China, the US, Japan, India and Russia.
3.7 Fuel demand
In the past, final energy demand in the transport sector had grown in line with transport activity; however,
fuel efficiency improvements led by environmental legislation already in place are foreseen to stabilise
demand by 2050, despite the projected upward trends in freight and passenger transport activities.
As an effect of current measures, the structure of passenger cars fleet in terms of engine and the trends in
energy consumption are foreseen to experience:
In the short-medium term a progressive reduction of the share of gasoline, continuing the trend of recent
years;
In the longer term, the progressive erosion of the diesel engine share in favour of hybrid, plug-in electric
and BEVs.
Upcoming EU policy measures, which will represent the actions implementing the Roadmap for moving to a
competitive low carbon economy in 2050, will further impact fuel demand. By aiming to deliver greenhouse
gas reductions in line with the 80 to 95%, they could reduce total primary energy consumption by about 30%
compared with 2005 levels, implying a decline of imports of oil and gas by 50% by 2050 compared to 201111
.
Focusing on the transport sector, the Communication highlights that in 2005 greenhouse gas emissions
increased by 30% in 2005 vis-à-vis 1990 levels (with transport being the only sectors among those
considered showing an increase). Upcoming measures are foreseen to bring emissions back to 1990 levels
by 2030 (emissions change will range from +20% to -9% against 1990 levels) and to bring marked
reductions by 2050 (-54% to -67%).
3.8 Fuel prices
Comparing retail fuel prices for EU customers with those in other countries (assuming that existing
differences will remain similar over time) reveals that the price to end users is higher, so that improvements
in the fuel efficiency of vehicles will have a stronger impact on TCO for EU end-users than for users of similar
cars in other regions. Future savings are likely to be further amplified in case post-2020 CO2 targets for the
EU are more ambitious than those adopted in non-EU countries.
11
As an effect of the action suggested in the Communication “A Roadmap for moving to a competitive low carbon economy in 2050, Brussels, 25.5.2011 COM(2011) 112 final/2

Assessment of competitiveness impacts of post-2020 LDV CO2 regulation
Final Report Valdani Vicari & Associati (VVA), Technopolis Group (TG), Joint Institute for Innovation Policy (JIIP), TNO for DG CLIMA 39
3.9 Professional end users
There are many different categories of professional end users of vehicles, which could potentially be
indirectly impacted by CO2 legislation. They can be categorised in two groups: professional car end users
and professional users of LCVs. Most of the categories of end users compete locally using the same type of
vehicles, even if they are global companies. The latter regards postal and courier delivery services and
multinational companies using LCVs for goods distribution to retail stores.
3.10 Automotive industry: market projections to 2020 and beyond
In 2020 global light vehicle sales are foreseen to reach approximately 117 million units per year, against
sales of around 70 million today. Most of the growth will stem from emerging markets, above all from Asia-
Pacific followed by Eastern Europe and Latin America. At that moment, Asia-Pacific will likely account for
almost half of global light-vehicle sales. Considering emerging markets, Chinese and Indian OEMs are in a
favoured position compared to OEMs from other establishing countries.
Regional vehicle segments are also expected to change. China will benefit considerably from the premium
segment’s growth until 2025, while Europe will maintain its supremacy in the same segment. India will
significantly increase its share in the small vehicle segment, which will represent a major opportunity. It
already accounts for 30% of global sales and could reach 30 million units in 2020. More than 60% of this
market is located in emerging economies, where sales are expected to grow by an annual 5-6% rate until
2020. Success in this key segment requires a low-cost business model characterised by a limited number of
body types based on a single platform and a limited offer range. Modularity will thus become an even more
fundamental success driver.
In terms of production, although the triad (United States, Europe, and Japan) will no longer represent the
centre of growth, three out of four vehicles sold globally in 2020 will be still made by established OEMs from
those regions. As OEMs are switching progressively to a local-for-local production model, it is expected that
suppliers will also follow. In regions such as Asia, production volumes are expected to rise up to 70%, with
positive impacts on the growth of the local supplier base.
Focusing on the progress against CO2 emission targets, in Europe the 2020 target is expected to be largely
achieved through advancements of technologies to conventional (ICE) vehicles. For some OEMs it will be
necessary or beneficial to achieve part of the reduction through increased electrification.
Considering R&D, alternative power will see continuous innovation, even beyond 2020. This will influence
also the split of value creation among vehicle modules. Electric drives will be the strongest growth sector in
production increasing by 20% on an annual basis in terms of value creation.

Assessment of competitiveness impacts of post-2020 LDV CO2 regulation
Final Report Valdani Vicari & Associati (VVA), Technopolis Group (TG), Joint Institute for Innovation Policy (JIIP), TNO for DG CLIMA 40

Assessment of competitiveness impacts of post-2020 LDV CO2 regulation
Final Report Valdani Vicari & Associati (VVA), Technopolis Group (TG), Joint Institute for Innovation Policy (JIIP), TNO for DG CLIMA 41
4. Policy options and compliance mechanisms
4.1 Introduction
As the details of a proposal for post-2020 LDV CO2 legislation are still to be determined, it is not possible to
assess specific competitiveness impacts of a specific piece of legislation. In view of the large amount of
options available for different elements of the legislation and the even larger number of possible ways in
which these can be combined, it is considered premature at this stage to focus the assessment on a limited
number of scenarios that could be considered as likely.
Instead a more generic approach is used to assess possible competitiveness impacts of post-2020 LDV CO2
regulation, the results of which will also facilitate designing the legislation in such a way that these impacts
are minimised,. To that end the analysis focusses on creating an understanding of how choices made with
respect to individual elements of the regulations (target level and modalities) may affect competitiveness. In
doing so, it is necessary to understand the compliance mechanisms available to manufacturers. Choices
with respect to individual elements of the regulations will determine the need to implement less or more
advanced compliance strategies. The different modalities and options as well as the compliance
mechanisms foreseen for meeting post-2020 targets are described in this chapter.
4.2 Policy options for post-2020 regulation
The policy instrument for which competitiveness impacts are assessed in this report is the European LDV
CO2 legislation for the period beyond 2020. For this legislation the European Commission has not yet
defined a proposal. Compared to the existing pieces of legislation for 2015/17 and the agreed amendments
for the 2020 targets, many of the modalities are still open. This concerns:
the target year(s);
the target level(s);
the metric for which this target is to be defined, e.g. tank-to-wheel or well-to-wheel CO2 emission;
the utility parameter (e.g. mass or footprint) used to differentiate the overall target into manufacturer-
specific targets and the shape / slope of the target function;
possibilities for a joint legislative target for passenger cars and (one or more categories of) LCVs;
possibilities for including mileage weighting;
possibilities for including embedded emissions;
a set of more detailed modalities including e.g. a phase-in period, derogations, super credits, eco-
innovations, penalties and possibilities for pooling, banking and/or trading.
The target year(s)
Given that currently targets are set for 2015/17 and for 2020 a likely next target year would be 2025.
Currently the European Commission is starting up the process of preparing a proposal for post-2020 LDV
CO2 legislation.
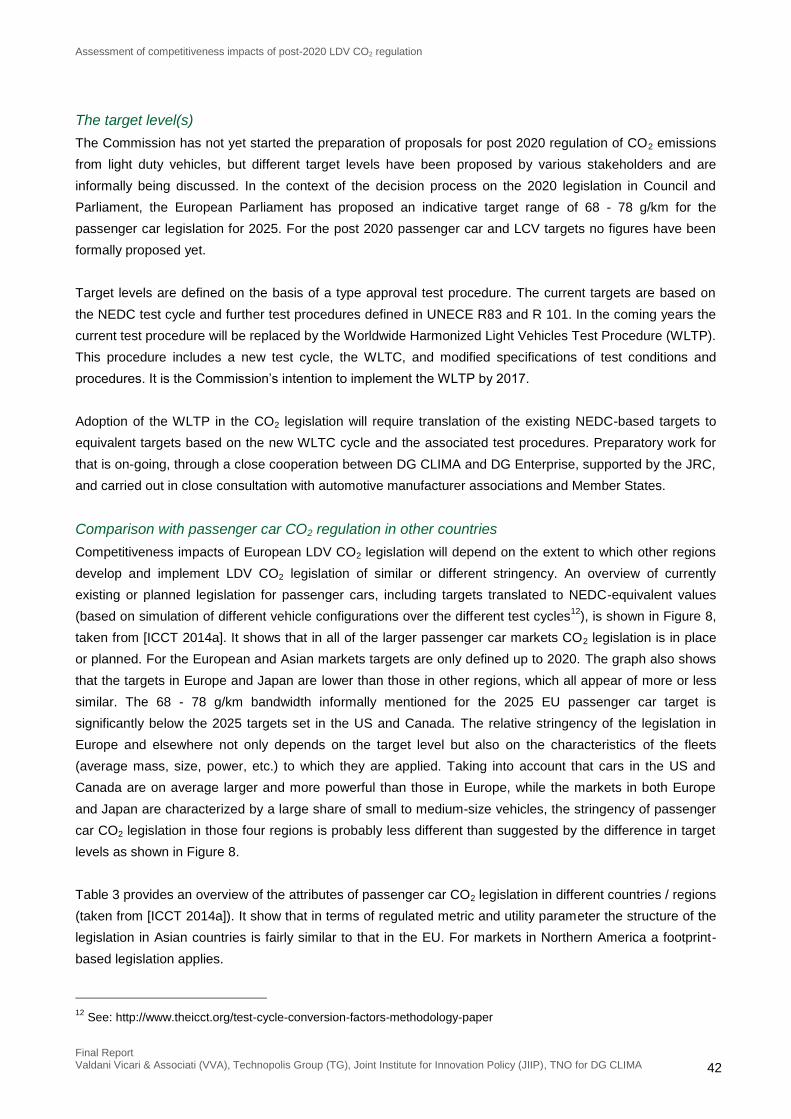
Assessment of competitiveness impacts of post-2020 LDV CO2 regulation
Final Report Valdani Vicari & Associati (VVA), Technopolis Group (TG), Joint Institute for Innovation Policy (JIIP), TNO for DG CLIMA 42
The target level(s)
The Commission has not yet started the preparation of proposals for post 2020 regulation of CO2 emissions
from light duty vehicles, but different target levels have been proposed by various stakeholders and are
informally being discussed. In the context of the decision process on the 2020 legislation in Council and
Parliament, the European Parliament has proposed an indicative target range of 68 - 78 g/km for the
passenger car legislation for 2025. For the post 2020 passenger car and LCV targets no figures have been
formally proposed yet.
Target levels are defined on the basis of a type approval test procedure. The current targets are based on
the NEDC test cycle and further test procedures defined in UNECE R83 and R 101. In the coming years the
current test procedure will be replaced by the Worldwide Harmonized Light Vehicles Test Procedure (WLTP).
This procedure includes a new test cycle, the WLTC, and modified specifications of test conditions and
procedures. It is the Commission’s intention to implement the WLTP by 2017.
Adoption of the WLTP in the CO2 legislation will require translation of the existing NEDC-based targets to
equivalent targets based on the new WLTC cycle and the associated test procedures. Preparatory work for
that is on-going, through a close cooperation between DG CLIMA and DG Enterprise, supported by the JRC,
and carried out in close consultation with automotive manufacturer associations and Member States.
Comparison with passenger car CO2 regulation in other countries
Competitiveness impacts of European LDV CO2 legislation will depend on the extent to which other regions
develop and implement LDV CO2 legislation of similar or different stringency. An overview of currently
existing or planned legislation for passenger cars, including targets translated to NEDC-equivalent values
(based on simulation of different vehicle configurations over the different test cycles12
), is shown in Figure 8,
taken from [ICCT 2014a]. It shows that in all of the larger passenger car markets CO2 legislation is in place
or planned. For the European and Asian markets targets are only defined up to 2020. The graph also shows
that the targets in Europe and Japan are lower than those in other regions, which all appear of more or less
similar. The 68 - 78 g/km bandwidth informally mentioned for the 2025 EU passenger car target is
significantly below the 2025 targets set in the US and Canada. The relative stringency of the legislation in
Europe and elsewhere not only depends on the target level but also on the characteristics of the fleets
(average mass, size, power, etc.) to which they are applied. Taking into account that cars in the US and
Canada are on average larger and more powerful than those in Europe, while the markets in both Europe
and Japan are characterized by a large share of small to medium-size vehicles, the stringency of passenger
car CO2 legislation in those four regions is probably less different than suggested by the difference in target
levels as shown in Figure 8.
Table 3 provides an overview of the attributes of passenger car CO2 legislation in different countries / regions
(taken from [ICCT 2014a]). It show that in terms of regulated metric and utility parameter the structure of the
legislation in Asian countries is fairly similar to that in the EU. For markets in Northern America a footprint-
based legislation applies.
12
See: http://www.theicct.org/test-cycle-conversion-factors-methodology-paper

Assessment of competitiveness impacts of post-2020 LDV CO2 regulation
Final Report Valdani Vicari & Associati (VVA), Technopolis Group (TG), Joint Institute for Innovation Policy (JIIP), TNO for DG CLIMA 43
Figure 8 - Comparison of CO2 regulations for passenger cars in different regions in gCO2/km, normalized to the NEDC
13
Table 3 – Overview of attributes of passenger car CO2 legislation in different countries / regions (taken from [ICCT 2013b])
13
See http://www.theicct.org/global-pv-standards-chart-library and [ICCT 2014a].

Assessment of competitiveness impacts of post-2020 LDV CO2 regulation
Final Report Valdani Vicari & Associati (VVA), Technopolis Group (TG), Joint Institute for Innovation Policy (JIIP), TNO for DG CLIMA 44
Comparison with CO2 regulation for LCVs in other countries
An overview of currently existing CO2 standards for light commercial vehicles is shown in Figure 9 (see also
[ICCT 2013a and 2014a]. It shows that the fleet averages required in the EU are quite similar to those in
Japan, albeit with different target years, but lower than those required in the US and China. Especially for the
US, however, it should be taken into account that the vehicles sold there as light trucks are generally
different from the LCVs sold in the EU.
Figure 9 - Comparison of CO2 regulations for Light Commercial Vehicles / Light Trucks in different regions in gCO2/km, normalized to the NEDC
14
The metric
Target levels depend on the parameter for which the regulation sets a target (metric). The existing legislation
applies to the so-called Tank-to-Wheel (TTW) CO2-emissions of vehicles as measured on the type approval
(TA) test.
The metric applied to the regulation for reducing CO2 emissions from light duty vehicles may promote certain
drivetrain technologies and discourage others. Besides improving the energy consumption of conventional
vehicles (ICEVs), alternative powertrains using alternative energy carriers will be needed to meet medium to
long term targets. These alternatives include battery-electric vehicles (BEVs or EVs), plug-in hybrid vehicles
(PHEVs) and fuel cell electric vehicles (FCEVs), which under a TTW CO2 based metric are considered low to
14
See http://www.theicct.org/global-pv-standards-chart-library.

Assessment of competitiveness impacts of post-2020 LDV CO2 regulation
Final Report Valdani Vicari & Associati (VVA), Technopolis Group (TG), Joint Institute for Innovation Policy (JIIP), TNO for DG CLIMA 45
zero emission vehicles (LEVs). However, depending on the WTT emissions associated with the production of
energy carriers for these LEVs, different technology mixes, chosen to meet the target, have different impacts
on the average WTW emissions of new vehicles as well as on the average costs for meeting the target.
As a result, the drivetrain technologies that are promoted by a given metric when viewed from a
manufacturer’s perspective may not be the most cost effective way to reduce transport WTW CO2 emissions
from a societal perspective. In order to ensure cost-effectiveness from a policy perspective, insights into the
relationship between possible regulatory metrics, manufacturer responses in terms of applying different
technologies, and the societal cost-effectiveness of WTW CO2 emission reduction are crucial. Manufacturers
will choose technologies for meeting a target on the basis of additional manufacturer costs on the one hand
(which affect the sales prices of vehicles or the profitability of the manufacturer) and impacts on total cost of
ownership for the end-user on the other hand (end-users may be willing to purchase a car that is more
expensive to buy but cheaper to drive due to lower energy costs).
Ideally the metric and target stimulate manufacturers to choose technologies that reduce CO2 emissions
most cost-effectively from a societal point of view. This is the case when the optimal share of LEVs from a
manufacturer’s point of view, based lowest additional manufacturer costs or the manufacturer’s weighing of
impacts on manufacturer costs and end-user costs, aligns with the share that leads to the lowest costs from
a societal point of view.
The main options for the metric for regulating CO2 emissions from light duty vehicles beyond 2020, as
identified by the Commission and analysed in [TNO 2013a and 2013b], are:
a. regulating vehicle CO2 emissions
tailpipe CO2 emissions as in existing Regulation (= TTW CO2 emissions)
tailpipe CO2 emissions for ICEs with exclusion of Zero Emission Vehicles
tailpipe CO2 emissions with notional GHG intensity for Zero Emission Vehicles
tailpipe CO2 emissions adjusted to take account of WTW emissions (= WTW GHG emissions)
b. regulating vehicle energy use
energy used in the vehicle per vehicle-km (= TTW energy consumption)
energy use per vehicle-km adjusted for WTW consumption (= WTW energy consumption)
c. The above approaches can be combined with size-dependent (lifetime) mileage weighting. Also
inclusion of embedded emissions in the WTW approaches listed above is considered.
In addition [TNO 2013a] has reviewed some regulatory options such as inclusion of road fuel use in the EU
ETS, a vehicle manufacturer based trading scheme based on lifetime vehicle GHG emissions, a cap and
trade system for vehicle manufacturers, of total CO2 emissions of vehicles sold (expressed in g/km). These
options, however, are not considered in the context of this study.
As several of these modalities significantly affect the competitiveness impacts, assumptions need to be
made on specific options for these modalities to allow a qualitative or quantitative assessment. The study will
try to draw conclusions with respect to possible competitiveness impacts which are independent of detailed

Assessment of competitiveness impacts of post-2020 LDV CO2 regulation
Final Report Valdani Vicari & Associati (VVA), Technopolis Group (TG), Joint Institute for Innovation Policy (JIIP), TNO for DG CLIMA 46
decisions on the modalities for future legislation, or will indicate how the choice of modalities could affect
impacts on competitiveness.
The utility parameter
The utility parameter is a vehicle characteristic that can be used to differentiate the overall target into
manufacturer-specific targets. This is done by defining a utility based target function, which for every vehicles
describes a target as function of the vehicle’s value for the utility parameter. Per vehicle these targets are
non-binding, but binding manufacturer targets are defined by sales-averaged weighting of the targets for all
vehicles sold by the manufacturer in the target year.
The current Regulations are based upon mass as the utility parameter. [TNO 2011] and [TNO 2012a] have
fairly conclusively shown that the only useful options for the utility parameter are mass or footprint for cars.
For LCVs, it is unclear whether footprint would be desirable. The poor correlation between CO2 and footprint
for this vehicle category, however, is an artefact of the NEDC's artificial cut-off in test mass. For vans,
therefore, the issue of the utility parameter would require further assessment also in view of the
consequences of moving from the NEDC to the WLTP.
The shape / slope of the target function
The current regulations for cars and vans define manufacturer-specific targets using a linear target function
expressed as 𝑇 = 𝑇𝑎𝑣𝑔 + 𝑎 ∙ (𝑚 − 𝑚0), with 𝑇 the specific target, 𝑇𝑎𝑣𝑔 the overall fleet average target (e.g.
130 g/km for passenger cars in 2015), and 𝑚0 the (assumed) average mass of vehicles sold in Europe in the
target year. The European Commission can adjust 𝑚0 to counteract e.g. impacts of so-called autonomous
mass increase (vehicle models getting heavier over time) on the overall achieved fleet average.
Figure 10 – Mass-based target functions in the current regulations for passenger cars and vans
Differentiation of the targets for different manufacturers using a utility-based target function means that the
impacts of the legislation on manufacturers of on average smaller / lighter or larger / heavier depend on the
shape and slope of this target function. The definition of the target function leads to differences in the
distances to target for different manufacturers and thus to differences in the costs of technologies that need
to be applied for reaching the target. This combined with the different fuel cost savings associated with the
Assessment of competitiveness impacts of post-2020 LDV CO2 regulation
Final Report Valdani Vicari & Associati (VVA), Technopolis Group (TG), Joint Institute for Innovation Policy (JIIP), TNO for DG CLIMA 47
required reductions determines the net impact on the end user costs (ΔTCO) of the vehicles produced by
each manufacturer. The change in purchase price and the ΔTCO affect the attractiveness of cars to end
users, so that differences in Δprice and ΔTCO between manufacturers, as a result of the modalities of the
legislation might affect their relative competitiveness. This is e.g. illustrated in Figure 12 to 15 of section 7.9
of the Commission’s Impact Assessment for the amendments to Regulation (EC) No 443/2009 and
Regulation (EU) No 510/2011 (see: SWD(2012) 213).
The target functions used in the current CO2 legislation for LDVs are presented in Figure 10. For the
passenger car regulation in 2020 it can be seen that the slope is already becoming very flat. The question
arises whether a differentiation of the target based on vehicle mass or size continues to be meaningful in the
long term. Figure 11 shows the footprint-based target functions as used in the 2017 and 2025 US Cars and
Light-Truck Standards. Using a floor (for small cars) and a ceiling (for large cars) in the limit function has also
been considered for the EU legislation (see [TNO 2011]. An assessment on the basis of the EU sales
database, however, indicated that in the European situation such a modality would offer negligible benefits in
terms of the costs for meeting the target or the avoidance of undesired distributional impacts among
manufacturers.
Figure 11 - Footprint-based target functions for the 2017 and 2025 US Cars and Light-Truck Standards (taken from [ICCT 2013a])
Possibilities for a joint legislative target for passenger cars and (one or more categories of) LCVs
One option that is seriously considered by the European Commission is to include the smallest LCVs, Class I
N1 vehicles, in the CO2 legislation for passenger cars. Other options for combining the passenger car and
LCV legislation include:
The targets and associated modalities for cars and vans could still be designed separately but
merged into one text (i.e. in the same Regulation). This is a formal way of bringing the two vehicle
categories under the same legislation;
Bringing part of the LCV market together with passenger cars under a single target. The categories
of LCVs to be joined with passenger cars may be based on the current class I, II and III definitions
for N1 vehicles, may include N2 vehicles or may be based on definitions still to be devised.

Assessment of competitiveness impacts of post-2020 LDV CO2 regulation
Final Report Valdani Vicari & Associati (VVA), Technopolis Group (TG), Joint Institute for Innovation Policy (JIIP), TNO for DG CLIMA 48
The two vehicle categories could be combined under a single target.
Some of these options have been assessed in previous studies (e.g. [TNO 2012]).
The question of merging the passenger cars and vans regulation or not is actually not really a modality, but
rather a matter of the scope of the legislation. But it does interact with other modalities, such as the utility
parameter for example. Also the test procedure for vans (esp. with respect to the WLTP) is an issue that can
have implications for merging the two regulations.
Possibilities for including mileage weighting
In general different vehicle segments (e.g. size classes) have different average annual mileages and
different average lifetimes. Including mileage weighting in the CO2 regulation has the potential to increase
the cost effectiveness and/or efficiency of the regulation as manufacturers would be stimulated to account of
lifetime mileage in the distribution of reduction efforts over different vehicle models / segments. However, this
measure requires reliable data on average life time mileage of different car segments, which are currently
not available on EU-scale.
Inclusion of embedded emissions
Embedded emissions are emissions occurring in the production and/or decommissioning phase of products.
So far CO2 regulation only targets emission in the use phase of vehicles. Indirect, so-called rebound effects
may occur if the legislation promotes vehicles with low or zero CO2 emission technologies for which the
embedded emissions are significantly larger than those of ICEVs. There is evidence for EVs and PHEVs that
this is the case.
This option would promote OEMs to take responsibility for environmental impacts occurring in the production
of materials, components and vehicles as well as in the decommissioning phase. Such chain management is
becoming more and more common as a way for companies to control their ecological footprint and other
direct and indirect societal impacts.
Eco-innovations and other ways of giving credit to technologies that reduce real-driving emissions
The European Commission is considering the option of expansion of the CO2 legislation to include CO2
reductions that can be achieved outside the standard test procedure. A substantial proportion of vehicle
energy use and CO2 emissions are accounted for by energy using devices that are not activated during the
normal test procedure. This is not expected to change substantially with the introduction of the WLTP. In
recognition of this the current regulations are complimented by specific measures addressing mobile air
conditioning systems and the eco-innovation scheme. In the US already a system of off-cycle credits has
been introduced. In considering options for continuing or expanding the eco-innovation scheme the
Commission is also paying attention to the likelihood that the scheme will lead to technologies that improve
the competitiveness of EU manufacturing. Giving credit to the CO2-reduction potential of new technologies
that specifically reduce emission in real-world driving further increases the number of compliance
mechanisms that manufacturers have available for meeting the target.

Assessment of competitiveness impacts of post-2020 LDV CO2 regulation
Final Report Valdani Vicari & Associati (VVA), Technopolis Group (TG), Joint Institute for Innovation Policy (JIIP), TNO for DG CLIMA 49
Super credits
The EU LDV CO2 regulation gives manufacturers additional incentives to produce vehicles with extremely
low emissions (below 50g/km). For the passenger car target in 2015 each low-emitting car will be counted as
3.5 vehicles in 2012 and 2013, 2.5 in 2014, 1.5 vehicles in 2015 and then 1 vehicle from 2016 to 2019.
Super-credits will also apply in the second stage of emission reductions, from 2020 to 2023. Each low-
emitting car will be counted as 2 vehicles in 2020, 1.67 in 2021, 1.33 in 2022 and 1 from 2023. For this
second step there will be a cap on the scheme’s contribution to the target of 7.5 g/km per manufacturer over
the three years. Under the LCV regulation each low-emitting van will be counted as 3.5 vehicles in 2014 and
2015, 2.5 in 2016, 1.5 vehicles in 2017 and then 1 vehicle from 2018 onwards. Manufacturers are able to
claim this 'super credit' for a maximum of 25,000 vans over the 2014-17 period. Similar provisions could be
part of the post-2020 legislation with possible modification of the emission threshold, the super credit factors
and the timing.
A phase-in period
A target for a given target year may be accompanied by a phase-in period in which a year-by-year increasing
share of each manufacturer’s sales is required to meet the specific target.
Derogations
The current legislation contains derogations for so-called small volume and niche manufacturers.
Independent manufacturers of passenger cars which sell between 1000 and 10,000 vehicles per year and
which cannot or do not wish to join a pool can propose their own emissions reduction target, which is subject
to approval by the Commission. The Commission decides on the acceptance of such a proposed specific
target on the basis of a set of agreed criteria which include the manufacturer's emissions reduction potential.
Manufacturers selling between 10,000 and 300,000 cars per year can apply for a fixed target of a 25%
reduction from their 2007 average emissions for the period 2012 to 2019, and a 45% reduction from the
2007 level as of 2020. The extent to which such a target is more lenient than the target set by the mass-
based target function depends on the average mass.
LCV manufacturers which are responsible for fewer than 1000 new van registrations per year in the EU are
exempted from having a specific emissions target. Independent manufacturers which are responsible for
fewer than 22,000 van registrations per year can propose their own emissions reduction target for approval
by the Commission.
Penalties
If the average CO2 emissions of a manufacturer's fleet exceed its limit value in any year from 2012 onwards,
the manufacturer has to pay an excess emissions premium for each car registered. This premium amounts
to €5 for the first g/km of exceedance, €15 for the second g/km, €25 for the third g/km, and €95 for each
subsequent g/km. From 2019, the cost will be €95 from the first gram of exceedance onwards.
The value of the penalty in € per g/km is tuned to the marginal costs for meeting the target. For post-2020
targets the penalty value may thus change depending on the target level chosen and cost curves estimated
for meeting the target.

Assessment of competitiveness impacts of post-2020 LDV CO2 regulation
Final Report Valdani Vicari & Associati (VVA), Technopolis Group (TG), Joint Institute for Innovation Policy (JIIP), TNO for DG CLIMA 50
Possibilities for pooling, banking and borrowing and/or trading
Manufacturers can group together to form a pool which can act jointly in meeting the emissions target. The
regulation states that in forming a pool, manufacturers must respect the rules of competition law and the
information that they exchange should be limited to average specific emissions of CO2, their specific
emissions targets, and their total number of vehicles registered. Obviously, for pooling to be beneficial for all
parties involved an OEM that has difficulty in meeting its own specific target will need to offer certain financial
or other advantages to the other OEMs in the pool.
The current regulation does not provide the possibility for banking and borrowing, but this option is part of a
long list of options being assessed in preparation of a proposal for the post-2020 legislation. Banking and/or
borrowing is a scheme that allows manufacturers to have more flexibility in the compliance with a specific
emission target for a specific year. When the average CO2 emission of the new vehicle sales is below the
specific emission target for that year, the manufacturer or group of manufacturers can bank the difference as
emission allowances. When the average CO2 emission value exceeds the specific emissions target in
another year, the manufacturer can offset these excess emissions with ‘banked’ emission allowances from
preceding year(s) or ‘borrow’ emission allowances, which have to be ‘paid back’ in subsequent years. This
mechanism allows manufacturers to flexibly deal with the introduction of new technologies, decreasing the
risk of paying excess emissions premiums, while maintaining the overall reduction trajectory. For banking
and borrowing to make sense it should be combined with a trajectory of declining annual target values.
4.3 Possible compliance strategies of OEMs
Possible competitiveness impacts of the LDV CO2 legislation on OEMs, as well as on the other affected
sectors studied in this report, depend on the compliance mechanisms chosen by manufacturers for meeting
the targets set by the legislation and the impact that these compliance mechanisms have on the costs of
manufacturing, buying and operating vehicles. A graphical overview of compliance mechanisms available to
vehicle manufacturers is presented in Figure 12. The main compliance mechanisms are:
Technical options
o applying additional CO2 reducing technologies to ICEVs
o applying eco-innovations or other technologies that deliver CO2 savings outside the normal test
procedure
o increasing shares of alternatively fuelled vehicles (AFVs)
Non-technical options
o utilising test flexibilities
o increase the average utility parameter value (without affecting CO2)
o selling smaller or less performant cars
o change sales (eligibility for derogation)
o pool with other OEM group
o pay excess premiums for non-compliance
For assessing the 2015-2020 legislation the main compliance mechanism considered was application of
efficiency improving technologies to ICEVs. The option of selling alternatively fuelled vehicles (such as

Assessment of competitiveness impacts of post-2020 LDV CO2 regulation
Final Report Valdani Vicari & Associati (VVA), Technopolis Group (TG), Joint Institute for Innovation Policy (JIIP), TNO for DG CLIMA 51
BEVs, PHEVs and FCEVs) could be ignored for assessing the targets (see [TNO 2011] and [TNO 2012]) as
these technologies were not needed and were still relatively expensive.
An overview of the most important technical options for meeting post-2020 targets is provided in Table 4.
The table includes a column with options that yield reductions outside the test cycle, which could become
relevant either through an eco-innovations scheme or by including other provisions that reward the
application of such technologies in the post-2020 legislation. Most of the options listed in the table are
already applied in vehicles on the market, but further innovation may be required to improve the performance
of these technologies or to reduce costs.
Depending on their level and definition, post-2020 targets may require alternative low-CO2 or zero-CO2
emission technologies to be marketed. Beyond 2020 the costs of these technologies are expected to
become more competitive. As the marginal costs for further improvement of the fuel efficiency of ICEVs
increase non-linearly, marketing AFVs will become an increasingly important compliance mechanism for
meeting post-2020 targets (see e.g. [TNO 2013b]). The costs for achieving CO2 reductions through efficiency
improvement in ICEVs and the marketing of AFVs not only depend on the costs of the individual
technologies, but also on the way in which their application is divided over vehicle models in different size
segments. In general it may be expected that OEMs will strive for a distribution of reduction efforts over
models and segments that leads to the lowest compliance costs.
Table 4 - Important technical compliance options for the 2020-2030 timeframe
Options for ICEVs and HEVs that yield reductions
on the test cycle
Options that yield
reductions outside the
test cycle
Alternative energy
carriers and propulsion
systems (AFVs*) Technologies improving
powertrain efficiency
Technologies reducing
vehicle resistance and
auxiliary energy
consumption
low friction design and
materials
direct injection petrol
engines
variable valve timing
and actuation
advanced combustion
concepts
various degrees of
engine downsizing
advanced transmissions
electrification:
start-stop system
mild / medium / full
hybridisation
body-in-white weight
reduction (advanced
steel, aluminium, fibre
reinforced plastics, etc.)
light-weight components
other than BIW
improved aerodynamics
low rolling resistance
tyres
electric auxiliaries, e.g.
electric power steering,
oil and water pumps.
etc.
efficient auxiliaries
efficient lighting
waste heat recovery
efficient air conditioning
/ vehicle thermal
management
solar roof
efficient auxiliaries
tyre pressure monitoring
natural gas vehicles
(NGVs)
(dedicated) biofuel
vehicles
battery-electric
propulsion (BEV)
plug-in hybrids (PHEVs)
and extended-range
electric vehicles
(EREVs)
fuel cell electric
propulsion on hydrogen
(FCEV)
*) Alternatively Fuelled Vehicles or AFVs

Assessment of competitiveness impacts of post-2020 LDV CO2 regulation
Final Report Valdani Vicari & Associati (VVA), Technopolis Group (TG), Joint Institute for Innovation Policy (JIIP), TNO for DG CLIMA 52
Figure 12 – Overview of compliance strategies available to OEMs for meeting targets defined by post-2020 LDV CO2 legislation
se
gm
en
t Z
se
gm
en
t Y
se
gm
en
t X
utility
pa
ram
ete
r
CO
2 le
gis
latio
n
utility
ba
se
d
targ
et fu
nctio
n
de
rog
atio
ns
su
pe
r-cre
dits
eco-in
no
va
tion
s
targ
et
targ
et
for O
EM
tech
nic
al o
ptio
ns
oth
er o
ptio
ns
co
mp
lian
ce
stra
teg
y
utilis
ing
test fle
xib
ilities
am
ou
nt o
f
ad
ditio
na
l CO
2
red
ucin
g
tech
no
log
ies
ap
plie
d to
ICE
Vs
incre
asin
g
sh
are
s o
f AF
Vs
ap
ply
ing
eco
-inn
ova
tion
s
po
ol w
ith o
the
r
OE
M g
rou
p
ch
an
ge
sa
les
(elig
ibility
for d
ero
ga
tion)
incre
ase
ave
rag
e u
tility
pa
ram
ete
r va
lue
(with
ou
t affe
ctin
g C
O2)
effe
ctiv
e ta
rge
t
for O
EM
ave
rag
e ty
pe-a
pp
rova
l
CO
2 e
mis
sio
ns to
be
ach
ieve
d fo
r ve
hic
le
sa
les in
EU
in ta
rge
t
ye
ar (a
fter c
orre
ctio
n
for s
up
er-c
red
its a
nd
eco
-inn
ova
tion
s a
nd
imp
act o
f no
n-
tech
nic
al o
ptio
ns)
effe
ctiv
e ta
rge
t
for T
A e
mis
sio
ns o
f
ICE
Vs o
f OE
M
CO
2 re
du
ctio
n
in IC
EV
s in
se
gm
en
t X
sh
are
s o
f AF
Vs
in s
eg
me
nt X
BE
Vs
PH
EV
s
FC
EV
s
CO
2-re
du
ctio
n
in IC
EV
s in
se
gm
en
t Y
sh
are
s o
f AF
Vs
in s
eg
me
nt Y
BE
Vs
PH
EV
s
FC
EV
s
CO
2-re
du
ctio
n
in IC
EV
s in
se
gm
en
t Z
sh
are
s o
f AF
Vs
in s
eg
me
nt Z
BE
Vs
PH
EV
s
FC
EV
s
co
mp
lian
ce
stra
teg
yco
mp
lian
ce
stra
teg
yco
mp
lian
ce
stra
teg
y
If ap
plie
d te
ch
no
log
ies
affe
ct (a
ve
rag
e) u
tility
va
lue
of v
eh
icle
s
In y
ea
rs w
he
n s
up
er-c
red
its a
re a
pp
lica
ble
.
---
Fo
r PH
EV
s n
et e
ffect o
f su
pe
r-cre
dits
is
als
o d
ep
en
de
nt o
n n
et T
A C
O2
em
issio
n
of P
HE
Vs.
exce
ss e
mis
sio
ns
pre
miu
ms
pa
y e
xce
ss p
rem
ium
s
for n
on
-co
mp
lian
ce
rem
ain
ing
sh
are
of IC
EV
s
co
ntrib
utio
n o
f
eco
-inn
ova
tion
s
tow
ard
s m
ee
ting
OE
M-s
pe
cific
targ
et
ne
t co
ntrib
utio
n
of A
FV
s to
wa
rds
me
etin
g O
EM
-
sp
ecific
targ
et
ap
ply
ing
ad
ditio
na
l CO
2
red
ucin
g
tech
no
log
ies to
ICE
Vs
If ap
plie
d te
ch
no
log
ies a
ffect
(ave
rag
e) u
tility v
alu
e o
f ve
hic
les

Assessment of competitiveness impacts of post-2020 LDV CO2 regulation
Final Report Valdani Vicari & Associati (VVA), Technopolis Group (TG), Joint Institute for Innovation Policy (JIIP), TNO for DG CLIMA 53
In relation to these technical compliance mechanisms it must be noted that the extent to which they
contribute to meeting the target also depends on the response of consumer and end-users to OEMs offering
new technologies. If the consumer acceptance of e.g. battery-electric vehicles is lower than an OEM
expects, higher reductions will have to be achieved by making ICEVs more efficient or by selling other types
of AFVs.
Besides technical options to reduce the CO2 emissions of new vehicles on the type approval test also a
number of other technical and non-technical compliance mechanisms may contribute to meeting the target.
In general an OEM will apply more than one option to meet the target.
4.4 Description and prioritisation of OEM compliance mechanisms
The compliance strategies to meet post 2020 CO2 target, as indicated in Figure 12, are described below. An
evaluation is made of their relevance for meeting future targets, resulting in a prioritisation of the
mechanisms to be assessed in detail.
Technical options
Applying additional CO2 reducing technologies to ICEVs
The main compliance mechanism for post 2020 legislation will be the application of technologies to ICEVs
that reduce the vehicles’ energy consumption and CO2 emissions. These measures include engine
improvements, various levels of engine down-sizing, exhaust heat recovery, advanced transmissions, start-
stop systems and various levels of powertrain hybridisation, lightweight construction and materials, improved
aerodynamics, low rolling resistance tyres, and efficient auxiliaries (e.g. pumps, power steering, air
conditioning). Increasing levels of CO2-emission reduction in ICEVs can be achieved by combining different
technologies. The most cost effective packages per level of reduction constitute a non-linear cost curve of
which examples from [TNO 2011], developed for the 2020 time horizon, are shown in Figure 13.
Figure 13 - Examples of cost curves for CO2 reduction in passenger cars: On the left specific cost curves for medium-sized passenger cars on petrol in 2020 as developed in [TNO 2011]. On the right average additional costs of new passenger cars as function of the achieved average CO2 emissions in the 2020-2030 timeframe,
developed for the modelling carried out in [TNO 2013b] on the basis of the scenario a) cost curves from [TNO 2011]
Assessment of competitiveness impacts of post-2020 LDV CO2 regulation
Final Report Valdani Vicari & Associati (VVA), Technopolis Group (TG), Joint Institute for Innovation Policy (JIIP), TNO for DG CLIMA 54
Cost curves for the 2025-30 period are being developed in an on-going project commissioned by DG CLIMA.
It is expected that these will show larger reduction potentials at lower additional manufacturer costs, due to
new technologies becoming available and improved performance and reduced costs of existing
technologies.
Relevance: Important
This compliance mechanism is considered very important as ICEVs will remain a large share in the post-
2020 new vehicle fleet and this mechanism offers a large and largely cost-effective reduction potential. This
strategy results in CO2 reduction both in the test procedure and in the ‘real world’, although the level of
reduction may be different on the test from the real-world due to the limited representativeness for real-world
driving of the test cycle and test condition.
Applying eco-innovations or other technologies that deliver CO2 savings outside the normal test
procedure
The current legislation states that manufacturers may receive emission credits contributing to the
achievement of their specific CO2 target for the application of so-called eco-innovations. These are
innovative technical measures applied to vehicles which reduce the energy consumption and CO2 emissions
under real-world driving conditions but that do not (or not significantly) affect the CO2 emissions as measured
on the type approval test. Examples are waste heat recovery, solar roofs and LED lighting. For cars and
LCVs the total contribution of those technologies to reducing the specific emissions target of a manufacturer
is limited to 7 gCO2/km under the current regulation.
A supplier or a manufacturer which applies for a measure to be approved under the current legislation as an
”eco-innovation” must submit a report, including a verification report undertaken by an independent and
certified body, to the Commission. An important issue with eco-innovations is the assessment of their impact
on real-world CO2 emissions. These depend on the characteristics of the technology, the level of uptake in
the market, the use of the technology by vehicle drivers and on regional conditions. The latter may be driving
patterns (e.g. relevant for the impact of waste-heat recovery), regional solar irradiation patterns (relevant for
solar roofs and efficient air conditioners) and day length and weather conditions (relevant for e.g. LED lights).
For other eco-innovations other conditions may have to be taken into account.
The take up of eco-innovations has demonstrated that there are substantial alternative cost effective routes
to reducing real-world LDV CO2 emissions. The Commission therefore considers it appropriate that such
options also be considered for inclusion as part of the post 2020 regime. The way in which incentives for
applying technologies that reduce “off-cycle” CO2 emissions rather than only type approval emission, are to
be included in post-2020 LDV CO2 legislation may differ from the current approach, which, as mentioned
above, gives credits to technologies that are approved by the European Commission as eco-innovations
under very specific conditions.

Assessment of competitiveness impacts of post-2020 LDV CO2 regulation
Final Report Valdani Vicari & Associati (VVA), Technopolis Group (TG), Joint Institute for Innovation Policy (JIIP), TNO for DG CLIMA 55
Relevance: Important
Given the increasing marginal costs of technologies for further reduction of CO2 emissions of ICEVs, it is to
be expected that in post-2020 legislation more attention will be paid to technologies that reduce real world
CO2 emissions even if these are not counted within the test procedure
The essence of this compliance strategy is to add new technologies or components to vehicles or to improve
the efficiency of existing technologies or components. For assessing competitiveness impacts this strategy
can thus be dealt with in the same way as the option of applying additional technologies to ICEVs that
reduce CO2 emissions on the type approval test, provided that the provisions that specify what is an eco-
innovation work out similarly for EU and non-EU manufacturers.
Increasing shares of AFVs
The extent to which AFVs contribute to meeting post-2020 targets depends on the metric chosen. Under a
TTW CO2-based metric BEVs and FCEVs count as zero-emission, while PHEVs have very low emissions,
often below 50 g/km. Under other metrics their “scores” are less different from those of ICEVs. Nevertheless,
in most cases marketing a finite share of AFVs will bring OEMs closer to their target.
Relevance: Important
Beyond 2020, and depending on the metric and target level, this is expected to become an increasingly
important compliance mechanism. Introducing AFVs may be cost effective from an OEM perspective as it
helps to avoid having to apply CO2 reduction measures to ICEVs with high marginal costs. In view of meeting
long term targets (60% reduction of transport GHG emissions by 2050 relative to 1990) introducing AFVs
can even be considered a necessary transition pathway.
Non-technical options
Utilising test flexibilities
Over the last decade OEMs have learned to exploit flexibilities in the test procedures to achieve lower type
approval test results that do not represent actual CO2 emission reductions while driving. These flexibilities
relate to unclear definitions or bandwidths in the specifications of test conditions for the coast-down test and
the chassis dynamometer test as well as for their execution and in the specifications for the condition of the
test vehicle. For cars [TNO 2012b] estimates that some 16 g/km of the reduction achieved between 2002
and 2012 may be attributable to this mechanism, while additional potential is still available. Replacing the
NEDC-based test procedure by the new WLTP will reduce the room for exploiting flexibilities, but is not
expected to solve this problem entirely.
Relevance: Less important
Optimising test conditions for vehicles has been going on for several years already. We assume that all
manufacturers will have the same knowledge and ability to apply flexibilities in the period post-2020. The
introduction of the new test procedure in 2017 will enhance this level playing field. Moreover, the utilization of
flexibilities can be ‘developed’ at relatively low cost and may be expected to be fully exploited by 2020.

Assessment of competitiveness impacts of post-2020 LDV CO2 regulation
Final Report Valdani Vicari & Associati (VVA), Technopolis Group (TG), Joint Institute for Innovation Policy (JIIP), TNO for DG CLIMA 56
Increase average utility parameter value (without affecting CO2)
Increasing the average utility parameter value increases an OEM’s specific target. The extent to which this
strategy effectively reduces the distance to target, however, depends on the slope of the utility-based target
function and the way in which increasing the utility parameter value affects CO2 emissions. Increasing mass
increases CO2 emissions, but the slope of the current mass-based target function is lower than the slope of
the relation between mass and CO2 making this unattractive. Increasing footprint is likely to have lower
impacts on CO2, but is more difficult to realise without changing the design of vehicles.
Relevance: Unimportant
The slope of the utility function, which determines the CO2 targets of manufacturer groups, is already rather
flat and could become even flatter in post-2020 legislation. Increasing the average utility value would then
result in a higher CO2 target. Since there is a trade-off between changing the utility parameter of a vehicle
and its CO2 emissions, this mechanism could increase the distance to target.
Selling smaller or less performant cars
Assessments of the costs for meeting targets for the 2015-2020 period (see [TNO 2006], [CE 2009], [TNO
2011] and [TNO 2012]) have always assumed that the characteristics of the new vehicle fleet in terms of
vehicle segment distributions and typical vehicle performance would not change between the reference year
and the target year. One reason for using this assumption has been that selling smaller cars as a compliance
mechanism involves negative direct costs (smaller cars are cheaper), but would also involve finite positive
welfare costs which are difficult to account for in the type of cost assessment made for the CO2 legislation.
Also, at least up to 2020, the technological changes needed to achieve the CO2 reduction without affecting
vehicle size or performance were found to be cost-effective from an end-user point of view, so that it was
considered unlikely that vehicle down-sizing or down-rating would be needed as a compliance mechanism.
Finally the effectiveness of selling smaller cars is limited under a target function with a finite slope. Together
with the fact that margins on small cars are generally very small, this makes it unlikely that OEMs would
purposely choose vehicle down-sizing as a compliance mechanism in the short to medium term.
However, selling smaller or less performant cars can in principle be a means to reduce the average CO2
emissions of the new vehicles sales. With more stringent longer term targets, and possibly an even flatter
slope of the target function, this option may become more relevant. The impact of vehicle down-sizing or
down-rating on the distance to target depends on the utility parameter and the slope of the target function, as
well as the adjustment of the target function to correct for the impact of the changing average utility value.
Selling on average smaller vehicles may not just be a matter of sales shifting to smaller segments. The VW
XL1 is an interesting example of an innovative vehicle model in which reduced size is combined with
advanced technology to achieve a vehicle with extremely low CO2 emissions15
.
A shift in sales towards smaller or less performant vehicles may not be a strategy for OEMs, but may also be
a knock-on consequence if there were an increase in the price of new cars as a result of technologies
applied to meet future CO2 standards.
15
See e.g. http://en.wikipedia.org/wiki/Volkswagen_1-litre_car

Assessment of competitiveness impacts of post-2020 LDV CO2 regulation
Final Report Valdani Vicari & Associati (VVA), Technopolis Group (TG), Joint Institute for Innovation Policy (JIIP), TNO for DG CLIMA 57
Relevance: Medium importance
Although it may be considered unlikely that EU CO2 standards for beyond 2020 will be set at levels that will
require OEMs to sell on average smaller or less performant cars, an assessment of competitiveness impacts
of the post-2020 legislation should at least pay attention to the possible consequences of a shift in sales
towards smaller or less performant vehicles occurring as a knock-on consequence of the vehicle price
increase that results from applying new CO2 reducing technologies. Different companies may be more or
less able to cater for such a shift in consumer preferences.
Change sales (eligibility for derogation)
Manufacturers whose sales are close to one of the thresholds between large volume manufacturers, niche
manufacturers and small volume manufacturers may choose to manage their sales in such a way that they
fall into or remain in a category with a less stringent target.
Relevance: Unimportant
Under the current regulation for some of the OEMs able to benefit from a niche derogation, there is actually
no benefit to receiving one. It is not likely that manufacturers will lower their sales under a derogation
threshold to ease their CO2 target. And if they are able to do this, they may generally not be considered
serious competitors for large volume manufacturers. The only exception to that could be in small
manufacturers of sports and other high-end vehicles that compete against such vehicles sold by OEMs with
a wider product portfolio. These, however, have more room for internal averaging of the costs of compliance
as well as for achieving economies of scale for applied technologies, so that the derogation provision can
actually be considered a means to avoid a competitiveness disadvantage for smaller volume manufacturers.
Pool with other OEM group
Pooling with a manufacturer with lower average CO2 emissions is a possible strategy to meet the target as a
manufacturer group. It is especially attractive for manufacturers with smaller sales volumes and high average
CO2 emissions as a result of selling vehicles with above-average performance or other characteristics.
Relevance: Less important
Under the current regulation a total of 12 pooling agreements have been established for passenger cars and
2 for vans16
. These, however, all only contain cooperation between companies that in the design of the
regulations were already considered to be part of the same manufacturer group. So, although it appears that
significant use of made of this provision, it does not lead to impacts that deviate from those assessed in the
design of the legislation.
Pay excess premiums for non-compliance
If a manufacturer is not able to meet its specific target, or only at marginal costs that exceed the penalty, it
can choose to pay excess emissions premiums for non-compliance. The fact that excess emissions
premiums are the same for all manufacturers caps the marginal cost for meeting the target for all
16
See: https://circabc.europa.eu/w/browse/3c090b5c-c2c5-4a7f-a04f-16e665532ecd, and https://circabc.europa.eu/w/browse/afed517d-5f6b-4fdc-ad44-7c5e4947b9a4

Assessment of competitiveness impacts of post-2020 LDV CO2 regulation
Final Report Valdani Vicari & Associati (VVA), Technopolis Group (TG), Joint Institute for Innovation Policy (JIIP), TNO for DG CLIMA 58
manufacturers, thus effectively reducing possible competitiveness impacts that may arise from the fact that
cost curves (and other factors) may not be the same for all manufacturers from all regions.
Relevance: Less important
For this study we assume that manufacturers will meet their targets. It is in the end the level of excess
premium that to a large extent influences manufacturers’ choices to meet the target or pay the fine for not
meeting it. It is assumed that the level of excess premiums for the post-2020 legislation will be tuned to the
estimated marginal costs for meeting the target(s) set by this legislation.
4.5 Key conclusions
Targets for LDV CO2 legislation beyond 2020 and the modalities of achieving them have not yet been
determined. The European Commission is considering a wide range of options, including the modalities
already used in the existing legislation as well as a range of new modalities. Important issues will be the
choice of metric (e.g. TTW or WTW CO2 emissions or energy consumption), the possible inclusion of
embedded emissions and the utility parameter.
In all of the larger passenger car markets CO2 legislation is in place or planned, at least up to 2020. The
targets in Europe and Japan are lower (in gCO2/km) than those in other regions, which all appear of
more or less similar stringency. The 68 - 78 g/km bandwidth proposed by the European Parliament for
the 2025 EU passenger car target is significantly below the 2025 targets set in the US and Canada. The
relative stringency of the legislation in Europe and elsewhere not only depends on the target level but
also on the characteristics of the fleets (average mass, size, power, etc.) to which they are applied.
Taking into account that cars in the US and Canada are on average larger and more powerful than those
in Europe, while the markets in both Europe and Japan are characterized by a large share of small to
medium-size vehicles, the stringency of passenger car CO2 legislation in those four regions is probably
less different than suggested by the difference in target levels.
In terms of regulated metric and utility parameter the structure of the passenger car CO2 legislation in
Asian countries is fairly similar to that in the EU. For markets in Northern America a footprint-based
legislation applies.
For vans the fleet averages required in the European CO2 regulation are quite similar to those in Japan,
but lower than those required in the US and China. Especially for the US, however, it should be taken
into account that the vehicles sold there as light commercial vehicles are generally different from those
sold in the EU.
OEMs have a wide range of technical and non-technical options at their disposal for complying with post-
2020 LDV CO2 legislation. Technical options are considered the most important compliance mechanism,
and will thus receive priority in the assessment of possible competitiveness impacts.
Compared to the 2015-2020 period the number of technical options that will be applied by OEMs to
comply with the post-2020 legislation is expected to increase significantly. Besides improved or new
technologies for efficiency improvement in ICEVs it is expected that OEMs will market a range of
alternatively fuelled vehicles. Depending on how they are rewarded in the legislation, the application of
technologies that reduce off-cycle CO2 emissions may also increase.

Assessment of competitiveness impacts of post-2020 LDV CO2 regulation
Final Report Valdani Vicari & Associati (VVA), Technopolis Group (TG), Joint Institute for Innovation Policy (JIIP), TNO for DG CLIMA 59
5. Impacts on cost competitiveness: the automotive manufacturer
perspective
5.1 Introduction
As mentioned in section 2.4, to assess cost competitiveness impacts on the affected sectors (automotive
manufacturing industry, automotive supply industry, energy supply industry and end-users) it is useful to
separate the analysis into two cases:
EU companies vs. competing companies from other regions;
EU manufacturing / production vs. manufacturing / production in other regions.
In this chapter separate assessments are presented for the cases of automotive manufacturers and
automotive manufacturing. In chapter 7 similar analyses are undertaken for the cost competitiveness impacts
on automotive suppliers and on the automotive components manufacturing industry.
The two perspectives are complementary, as illustrated in Figure 14. Cost competitiveness impacts from a
manufacturer perspective are first of all determined by the compliance mechanisms chosen by EU and non-
EU car manufacturing companies. These include changes to the overall vehicle design (including e.g.
improved aerodynamic of the use of light-weight materials), improving the efficiency of conventional engines
and powertrains or applying alternative powertrains. The average impacts of those choices on the price and
value / quality of the vehicles from manufacturers from different regions determine possible changes in cost
competitiveness between EU and non-EU companies. The impact of compliance strategies on the price of
vehicles from manufacturers from different regions is strongly affected by the regions in which these
manufacturers produce their vehicles and the regions from which they source their components and
materials. The average costs of manufacturing vehicles and components in the EU and other regions are
what makes up the cost competitiveness of these regions from a manufacturing perspective. In this way the
cost competitiveness of EU and non-EU manufacturing (of cars as well as of components and materials)
affects the cost competitiveness of EU and non-EU manufacturers. The other way around, choices of OEMs
to manufacture cars in a certain region or source components from a certain region determine production
volumes and thus economies-of-scale in that region, which affect the cost competitiveness of that region
relative to other regions from a car and component manufacturing perspective.
For the other two affected sectors (i.e. the fuel supply sector and professional end users) the two
perspectives are less distinct. Within the energy sector (chapter 9) oil companies are in global competition,
but fuel supplied to the EU market is largely produced in the EU, and other affected energy suppliers are
largely not competing with companies from other regions. Especially for end-users (chapter 10) many of the
possibly affected EU companies are not competing with non-EU companies, and if they are the impact of a
change in costs of operating passenger cars and vans is likely to be a very small part of their cost of
operations.
For the first case (EU vs. non-EU companies) the focus is on identifying possible reasons for the impacts of
the LDV CO2 legislation on the cost and value of products being different for EU companies than for

Assessment of competitiveness impacts of post-2020 LDV CO2 regulation
Final Report Valdani Vicari & Associati (VVA), Technopolis Group (TG), Joint Institute for Innovation Policy (JIIP), TNO for DG CLIMA 60
competing companies from other regions. This starts with identifying how the products / services change as
a result of the compliance mechanisms chosen by OEMs to meet their specific targets under the legislation.
For the second case (EU vs. non-EU manufacturing) the focus is on identifying possible impacts of the LDV
CO2 legislation on the cost of manufacturing or production or the cost of doing business. This analysis should
start with an assessment of possible impacts of the legislation on the various cost components that
determine the cost of doing business, such as the cost of labour, labour skills and labour productivity, and
the cost of capital. Identified possible impacts on cost competitiveness of EU manufacturing are relevant
because as a second order effect such impacts may encourage or discourage both EU and non-EU
manufacturers to move production facilities from other regions to the EU or from the EU to other regions, with
a positive or negative impact on employment in the EU.
If European manufacturers are defined as having a minimum of xx% of their EU sales manufactured in the
EU (definition 4 in section 2.5), then the distinction between the two perspectives becomes less clear, as the
motivation for manufacturers to locate a large share of their production in the EU depends on the cost
competitiveness of European manufacturing compared to manufacturing in other regions.
5.2 Overall methodology
In this chapter “mindmaps” are used in two different ways for analysing the extent to which post-2020 LDV
CO2 legislation in Europe might lead to impacts on cost competitiveness:
Overall mapping of impact pathways: Mindmaps have been developed that illustrate how different
aspects of the legislation may lead to different compliance strategies of OEMs (or response strategies of
companies in other affected sectors), and how these in turn affect cost competitiveness as a result of
differences in impacts on the cost and value of products or services which depend on the differences in
resources and capabilities of different companies;
Detailed analysis of determinants of possible cost competitiveness impacts: Mindmaps have also been
used to decompose complex if-then-else reasonings that determine under which conditions (ways in
which certain determinants may have different values for different competing companies or regions)
various aspects of the legislation may or may not lead to positive or negative impacts on cost
competitiveness.
These mindmaps17
should be read from left to right. Links between elements indicate that an element affects
other elements. Feedback loops, where outcomes of a reasoning affect (on the right hand side) affect
starting points (on the left hand side) are indicated by arrow-shaped connectors.
The largely qualitative reasoning in the second type of mindmaps often lead to identification of questions for
further quantitative data analysis which may be used to determine whether or not certain identified conditions
for cost competitiveness impacts are met. Data questions generally relate to identifying possible differences
in the characteristics of EU and non-EU companies or sectors. Whenever such data were or could be made
17
NOTE: To facilitate printing on A3 paper, the mindmaps presented in this report are also provided in a separate pdf-document.

Assessment of competitiveness impacts of post-2020 LDV CO2 regulation
Final Report Valdani Vicari & Associati (VVA), Technopolis Group (TG), Joint Institute for Innovation Policy (JIIP), TNO for DG CLIMA 61
available to the consortium, such questions are answered in this chapter. When that is not the case the
questions are listed as recommendations for further work.
Figure 14 – Relation between assessing cost competitiveness impacts from the perspective of car manufacturers or car manufacturing
sh
are
of ca
rs fo
r E
U
ma
rke
t m
an
ufa
ctu
red
in E
U
sh
are
of ca
rs fo
r E
U
ma
rke
t m
an
ufa
ctu
red
ou
tsid
e E
U
sh
are
of co
mp
on
en
ts
fro
m E
U
sh
are
of co
mp
on
en
ts
fro
m o
uts
ide
EU
ad
va
nce
d
co
mp
on
en
ts
alte
rna
tive
po
we
rtra
ins
ve
hic
le d
esig
n
sp
ecific
ta
rge
t fo
r
EU
ma
nu
factu
rer
LD
V C
O2
le
gis
lati
on
in E
U
co
st &
va
lue
of ca
rs
by E
U
ma
nu
factu
rer
co
mp
lian
ce
str
ate
gy
of E
U m
an
ufa
ctu
rer
co
st o
f m
an
ufa
ctu
rin
g c
ars
an
d c
om
po
ne
nts
in
EU
sh
are
of ca
rs fo
r E
U
ma
rke
t m
an
ufa
ctu
red
in E
U
sh
are
of ca
rs fo
r E
U
ma
rke
t m
an
ufa
ctu
red
ou
tsid
e E
U
sh
are
of co
mp
on
en
ts
fro
m E
U
sh
are
of co
mp
on
en
ts
fro
m o
uts
ide
EU
ad
va
nce
d
co
mp
on
en
ts
alte
rna
tive
po
we
rtra
ins
ve
hic
le d
esig
n
sp
ecific
ta
rge
t fo
r
no
n-E
U
ma
nu
factu
rer
co
st &
va
lue
of ca
rs
by n
on
-EU
ma
nu
factu
rer
co
mp
lian
ce
str
ate
gy
of n
on-E
U
ma
nu
factu
rer
co
st o
f m
an
ufa
ctu
rin
g c
ars
an
d c
om
po
ne
nts
ou
tsid
e E
U
LD
V C
O2
le
gis
lati
on
in o
the
r re
gio
ns
dire
ct im
pa
ct
dire
ct im
pa
ct
co
st co
mp
etitive
ne
ss o
f
EU
ma
nu
factu
rers
vs.
no
n E
U m
an
ufa
ctu
rers
co
st co
mp
etitive
ne
ss o
f
EU
ma
nu
factu
rin
g v
s.
no
n-E
U m
an
ufa
ctu
rin
g
ind
ire
ct im
pa
ct
incl. e
co
no
mie
s o
f sca
le
ind
ire
ct im
pa
ct
incl. e
co
no
mie
s o
f sca
le
ind
ire
ct im
pa
cts
fro
m e
ffe
cts
of C
O2
le
gis
latio
n o
n m
ark
ets
in o
the
r re
gio
ns

Assessment of competitiveness impacts of post-2020 LDV CO2 regulation
Final Report Valdani Vicari & Associati (VVA), Technopolis Group (TG), Joint Institute for Innovation Policy (JIIP), TNO for DG CLIMA 62
5.3 Pathways for impacts on the cost competitiveness of automotive OEMs
An overview of the main direct pathways for cost competitiveness impacts on EU vs. non-EU manufacturers
is presented in Figure 15. No cost competitiveness impacts are to be expected if the following two conditions
are simultaneously met:
the regulation results in targets of similar stringency for EU and non-EU OEMs, and
the costs of similar compliance mechanisms are the same for EU and non-EU OEMs.
Cost competitiveness impacts are definitely expected if the legislation on average results in the same level of
stringency of targets for EU and non-EU OEMs, but the costs of compliance for the same product (portfolio)
are different for manufacturers from different regions. The same holds if costs of the same compliance
mechanisms are similar for manufacturers from different regions but targets are different on average. When
both targets and costs are different, it depends on the way in which these are different, whether the
regulation may be expected to lead to net impacts on the cost competitiveness of EU and non-EU OEMs.
Cost competitiveness impacts may also occur if manufacturers from different regions choose different
compliance mechanisms with different costs to meet targets of similar stringency. However, if such choices
are not forced by the legislation, the resulting cost competitiveness impacts are not to be attributed to the
legislation.
As can be concluded from Figure 15, assessing cost competitiveness impacts on OEMs requires identifying
whether and how EU legislation could lead to:
different levels of stringency of the targets imposed on EU and non-EU OEMs;
differences in the costs for EU and non-EU OEMs of complying with similar targets, which in turn may be
the result of:
o EU and non-EU OEMs choosing different compliance mechanisms with different cost implications
to meet similar targets;
o costs of similar compliance mechanisms being different for EU vs. non-EU OEMs.
The latter two are strongly related to the capabilities and resources of different companies. Analysing
whether and how differences in capabilities and resources can be attributed to companies or manufacturing
activities being European or non-European, and determining whether such differences lead to differences in
the cost of compliance is the main challenge of this chapter.
But even if targets and compliance costs are on average similar for affected OEMs from different regions,
and direct cost competitiveness impacts are therefore unlikely, there may still be non-negligible second order
impacts. If the increased costs of manufacturing vehicles for the EU market would lead to lower margins and
thus reduced profits for sales on the EU market, EU manufacturers may still have different abilities than non-
EU manufacturers to deal with such impacts, e.g. as they may be less well placed to recover reduced profits
on the EU market by profits in other markets in the same way as non-EU manufacturers can.

Assessment of competitiveness impacts of post-2020 LDV CO2 regulation
Final Report Valdani Vicari & Associati (VVA), Technopolis Group (TG), Joint Institute for Innovation Policy (JIIP), TNO for DG CLIMA 63
Figure 15 – Overview of main possible pathways for cost competitiveness impacts of the LDV CO2 legislation on EU vs. non-EU manufacturers
Besides differences in resources and capabilities to manufacture and market vehicles with CO2-reducing
technologies, a possible determinant for cost competitiveness impacts could be the ability of OEMs to
recover reduced profits on the EU market through profits in other markets. This may not so much relate to
OEMs being European or not but maybe more to OEMs being premium manufacturers or not. OEMs selling
premium models in the EU market first of all have higher profit margins in that market and customers with a
higher willingness-to-pay (lower price-elasticity). But it is also the EU manufacturers of premium brands that
are selling a lot of cars in foreign markets.
A general analysis and detailed break-down of pathways along which the LDV CO2 legislation and the
capabilities and resources of OEMs can lead to cost competitiveness impacts of the legislation is graphically
presented in the mindmap of Figure 16.
The following things are clear from Figure 16:
Specific targets for manufacturers are affected by various aspects of the regulation;
For meeting a given target a large number of compliance mechanisms are available;
The costs for implementing these compliance mechanisms are determined by a large number of factors.
As a result of this there are a myriad of possible impact pathways that might have negative as well as
positive impacts on the cost competitiveness of EU manufacturers. Although this might make it appear less
likely that the post 2020 EU LDV CO2 regulation as a whole would lead to net impacts on cost
competitiveness of EU manufacturers, this cannot be concluded at this stage. Choices with respect to
specific elements of the legislation could enhance the possibility of specific cost competitiveness impacts to
occur. For that reason, before going into an analysis along the lines sketched above, first some
considerations are worked out regarding the general consequences of different aspects of the legislation for
OEMs.
Main possible
pathways for
competitiveness
impacts on car
manufacturers
If regulation results in different
levels of stringency of the
targets imposed on European
and non-European OEMs
If costs of similar compliance
mechanisms are different for
European vs. non-European
OEMs or manufacturing
If costs of similar compliance
mechanisms are the same for
European vs. non-European
OEMs or manufacturing
If regulation results in same
levels of stringency of the
targets imposed on European
and non-European OEMs
NO, no competitiveness
impact
MAYBE, possible impact on
competitiveness
YES, likely impact on
competitiveness
If European and non-European
OEMs choose different compliance
mechanisms with different cost
implications to meet similar targetsDepending on differences in
stringency of target and
costs of compliance options
MAYBE, possible impact on
competitiveness
Depending on whether
technology choices can be
attributed to elements of the
legislation

Assessment of competitiveness impacts of post-2020 LDV CO2 regulation
Final Report Valdani Vicari & Associati (VVA), Technopolis Group (TG), Joint Institute for Innovation Policy (JIIP), TNO for DG CLIMA 64
Figure 16 – Overview of pathways along which the LDV CO2 legislation and the capabilities and resources of companies can lead to cost competitiveness impacts on automotive manufacturers
Δ overall sales
volume
Δ price competitiveness within segment Z for
OEM compared to other OEMs
Δ price competitiveness within segment Y for
OEM compared to other OEMs
segment Z
segment Y
segment X
capabilitiesresources
additional CO2-
reducing
technology in
ICEVs in
segment X
cost of CO2-
reducing
technology in
ICEVs in
segment X
share of AFVs in
segment X
(Δ) costs of
AFVs in
segment X
cross
subsidizing
between
ICEVs and
AFVs in
segment X
(Δ) price of
AFVs in
segment X
Δ price of ICEVs
in segment X
cost pass-
through factor
for ICEVs in
segment X
cost pass-
through factor
for AFVs in
segment X
overall level of
cost pass
through
technology for
AFVs in
segment X
Δ quality / value
of ICEVs in
segment X
Δ competitiveness
of ICEVs in
segment X
(Δ)
competitiveness of
AFVs in
segment X
(Δ) quality /
value of AFVs in
segment X
Δ RW fuel
consumption of
ICEVs in
segment XΔ TCO of ICEVs
in segment X
(Δ) RW energy
consumption of
AFVs in
segment X
(Δ) TCO of
AFVs in
segment X
utility parameter
CO2 legislation
utility based
target function
derogations
super-credits
eco-innovations
target
target
for OEM
technical options
other options
compliance
strategy
utilising test flexibilities
amount of
additional CO2
reducing
technologies
applied to ICEVs
increasing
shares of AFVs
applying eco-
innovations
pool with other OEM
group
change sales (eligibility
for derogation)
increase average utility
parameter value
(without affecting CO2)
effective target
for OEM
average type-
approval CO2
emissions to be
achieved for
vehicle sales in
EU in target year
(after correction
for super-credits
and eco-
innovations and
impact of non-
technical options)
effective target
for TA emissions of
ICEVs of OEM
CO2 reductionin
segment X
shares of AFVs
in segment X
BEVs
PHEVs
FCEVs
CO2-reduction
in segment Y
shares of AFVs
in segment YBEVs
PHEVs
FCEVs
CO2-reduction
in segment Z
shares of AFVs
in segment Z
BEVs
PHEVs
FCEVs
Δ competitiveness
in segment X
If applied
technologies affect
(average) utility value
of vehicles
In years when super-credits
are applicable.
---
For PHEVs net effect of
super-credits is also
dependent on net TA CO2
emission of PHEVs.
Supplier
network
Facilities
Patents
Knowledge
Finance
Product
portfolio
Customer base
already applied
CO2-reducing
technologies in
ICEVs in
segment X
Δ long term cost
competitiveness of
company
distribution of utility
values of product
portfolio in target
year
Average utility value in case of
linear target function.
---
In case of non-linear target function
average target is determined by
sales weighted averaging of targets
per vehicle.
excess
emissions
premiums
pay excess premiums
for non-compliance
remaining share
of ICEVs
contribution of
eco-innovations
towards meeting
OEM-specific
target
net contribution
of AFVs towards
meeting OEM-
specific target
applying
additional CO2
reducing
technologies to
ICEVs
If applied technologies
affect (average) utility value
of vehicles
Δ price of ICEVs in
segment X
factors affecting Δ price and Δ value/quality within
segment X for other OEM
Δ price competitiveness within segment X for
OEM compared to other OEMs
Δ short term cost
competitiveness of
company
Impact of changes in short
term competitiveness on
long term competitiveness
are determined through
impacts on various
resources and capabilities
May be affected by
applied technologies
Ability to manufacture
at lower marginal costs
within segment than
competitor
Ability to manufacture
at lower average
marginal costs
compared to competitor
Room for internal
averaging / optimisation of
reduction efforts over
segments + room for cross-
subsidizing
Ability to maintain
current customers even
when sales price
is higher
Legislation & compliance strategies
Resources & capabilities
Effects of resources/capabilities & legislation/compliance strategies on competitiveness
In case better
competitive
position results in
higher profits
Ability to (temporarily)
absorb losses
Ability to sell licenses
Δ competitiveness of
ICEVs in segment Y
(Δ) competitiveness
of AFVs in
segment Y
Δ competitiveness
in segment Y
Δ competitiveness of
ICEVs in segment Z
(Δ) competitiveness
of AFVs in
segment Z
Δ competitiveness
in segment Z
Δ TCO of ICEVs in
segment X
Δ quality / value of
ICEVs in segment X
factors affecting Δ price and Δ value/quality within segment X for OEM
(Δ) price of AFVs in
segment X
(Δ) TCO of AFVs in
segment X
(Δ) quality / value of
AFVs in segment X
Ability to develop
improved ICEVs and
AFVs
Δ sales volume in
segment X
Δ sales volume
in segment Y
Δ sales volume
in segment Z
Generate revenue
from selling licenses
Different cost curves
than competitor for
similar vehicles
Δ profitability
Sales volumes affect
cost of production and
profitability of
production facilities
Sales volumes affect
profitability of
production and of
sales operations
Financial position can
affect other resources
“instantly”OEM specific lower
cross-price elasticity
because of loyal
customer base
Automotive manufacturers (OEMs) Automotive manufacturers (OEMs)
factors affecting Δ price and Δ value/quality within segment Y for OEM
factors affecting Δ price and Δ value/quality within segment Z for OEM
factors affecting Δ price and Δ value/quality within
segment Y for other OEM
factors affecting Δ price and Δ value/quality within
segment Z for other OEM
Δ price and value of
ICEVs in segment Y
Δ price and value of
AFVs in segment Y
Δ price and value of
ICEVs in segment Z
Δ price and value of
AFVs in segment Z
Sales volumes are affected
by changes in market share
and in total market volume.
Total EU sales may change
as a result of a change in
the average costs of buying
or owning a vehicle.
Technologies already applied on vehicles
cannot be added anymore. Marginal
costs for additional technologies higher.

Assessment of competitiveness impacts of post-2020 LDV CO2 regulation
Final Report Valdani Vicari & Associati (VVA), Technopolis Group (TG), Joint Institute for Innovation Policy (JIIP), TNO for DG CLIMA 65
Δ overall sales
volume
Δ price competitiveness within segment Z for
OEM compared to other OEMs
Δ price competitiveness within segment Y for
OEM compared to other OEMs
segment Z
segment Y
segment X
capabilitiesresources
additional CO2-
reducing
technology in
ICEVs in
segment X
cost of CO2-
reducing
technology in
ICEVs in
segment X
share of AFVs in
segment X
(Δ) costs of
AFVs in
segment X
cross
subsidizing
between
ICEVs and
AFVs in
segment X
(Δ) price of
AFVs in
segment X
Δ price of ICEVs
in segment X
cost pass-
through factor
for ICEVs in
segment X
cost pass-
through factor
for AFVs in
segment X
overall level of
cost pass
through
technology for
AFVs in
segment X
Δ quality / value
of ICEVs in
segment X
Δ competitiveness
of ICEVs in
segment X
(Δ)
competitiveness of
AFVs in
segment X
(Δ) quality /
value of AFVs in
segment X
Δ RW fuel
consumption of
ICEVs in
segment XΔ TCO of ICEVs
in segment X
(Δ) RW energy
consumption of
AFVs in
segment X
(Δ) TCO of
AFVs in
segment X
utility parameter
CO2 legislation
utility based
target function
derogations
super-credits
eco-innovations
target
target
for OEM
technical options
other options
compliance
strategy
utilising test flexibilities
amount of
additional CO2
reducing
technologies
applied to ICEVs
increasing
shares of AFVs
applying eco-
innovations
pool with other OEM
group
change sales (eligibility
for derogation)
increase average utility
parameter value
(without affecting CO2)
effective target
for OEM
average type-
approval CO2
emissions to be
achieved for
vehicle sales in
EU in target year
(after correction
for super-credits
and eco-
innovations and
impact of non-
technical options)
effective target
for TA emissions of
ICEVs of OEM
CO2 reductionin
segment X
shares of AFVs
in segment X
BEVs
PHEVs
FCEVs
CO2-reduction
in segment Y
shares of AFVs
in segment YBEVs
PHEVs
FCEVs
CO2-reduction
in segment Z
shares of AFVs
in segment Z
BEVs
PHEVs
FCEVs
Δ competitiveness
in segment X
If applied
technologies affect
(average) utility value
of vehicles
In years when super-credits
are applicable.
---
For PHEVs net effect of
super-credits is also
dependent on net TA CO2
emission of PHEVs.
Supplier
network
Facilities
Patents
Knowledge
Finance
Product
portfolio
Customer base
already applied
CO2-reducing
technologies in
ICEVs in
segment X
Δ long term cost
competitiveness of
company
distribution of utility
values of product
portfolio in target
year
Average utility value in case of
linear target function.
---
In case of non-linear target function
average target is determined by
sales weighted averaging of targets
per vehicle.
excess
emissions
premiums
pay excess premiums
for non-compliance
remaining share
of ICEVs
contribution of
eco-innovations
towards meeting
OEM-specific
target
net contribution
of AFVs towards
meeting OEM-
specific target
applying
additional CO2
reducing
technologies to
ICEVs
If applied technologies
affect (average) utility value
of vehicles
Δ price of ICEVs in
segment X
factors affecting Δ price and Δ value/quality within
segment X for other OEM
Δ price competitiveness within segment X for
OEM compared to other OEMs
Δ short term cost
competitiveness of
company
Impact of changes in short
term competitiveness on
long term competitiveness
are determined through
impacts on various
resources and capabilities
May be affected by
applied technologies
Ability to manufacture
at lower marginal costs
within segment than
competitor
Ability to manufacture
at lower average
marginal costs
compared to competitor
Room for internal
averaging / optimisation of
reduction efforts over
segments + room for cross-
subsidizing
Ability to maintain
current customers even
when sales price
is higher
Legislation & compliance strategies
Resources & capabilities
Effects of resources/capabilities & legislation/compliance strategies on competitiveness
In case better
competitive
position results in
higher profits
Ability to (temporarily)
absorb losses
Ability to sell licenses
Δ competitiveness of
ICEVs in segment Y
(Δ) competitiveness
of AFVs in
segment Y
Δ competitiveness
in segment Y
Δ competitiveness of
ICEVs in segment Z
(Δ) competitiveness
of AFVs in
segment Z
Δ competitiveness
in segment Z
Δ TCO of ICEVs in
segment X
Δ quality / value of
ICEVs in segment X
factors affecting Δ price and Δ value/quality within segment X for OEM
(Δ) price of AFVs in
segment X
(Δ) TCO of AFVs in
segment X
(Δ) quality / value of
AFVs in segment X
Ability to develop
improved ICEVs and
AFVs
Δ sales volume in
segment X
Δ sales volume
in segment Y
Δ sales volume
in segment Z
Generate revenue
from selling licenses
Different cost curves
than competitor for
similar vehicles
Δ profitability
Sales volumes affect
cost of production and
profitability of
production facilities
Sales volumes affect
profitability of
production and of
sales operations
Financial position can
affect other resources
“instantly”OEM specific lower
cross-price elasticity
because of loyal
customer base
Automotive manufacturers (OEMs) Automotive manufacturers (OEMs)
factors affecting Δ price and Δ value/quality within segment Y for OEM
factors affecting Δ price and Δ value/quality within segment Z for OEM
factors affecting Δ price and Δ value/quality within
segment Y for other OEM
factors affecting Δ price and Δ value/quality within
segment Z for other OEM
Δ price and value of
ICEVs in segment Y
Δ price and value of
AFVs in segment Y
Δ price and value of
ICEVs in segment Z
Δ price and value of
AFVs in segment Z
Sales volumes are affected
by changes in market share
and in total market volume.
Total EU sales may change
as a result of a change in
the average costs of buying
or owning a vehicle.
Technologies already applied on vehicles
cannot be added anymore. Marginal
costs for additional technologies higher.

Assessment of competitiveness impacts of post-2020 LDV CO2 regulation
Final Report Valdani Vicari & Associati (VVA), Technopolis Group (TG), Joint Institute for Innovation Policy (JIIP), TNO for DG CLIMA 66
5.4 General consequences of different aspects of the legislation
Target level and metric
Target levels for 2025 and 2030 have not yet been proposed by the European Commission. The European
Parliament has proposed a bandwidth of 68-78 g/km for the 2025 target for passenger cars. Based on the
cost curves for 2020, developed in [TNO 2011], the lowest average that can be achieved with applying CO2-
reducing technologies to ICEVs is around 70 g/km. From analyses in [TNO 2013b], however, it has become
clear that already for targets above 75 g/km it becomes beneficial, both from a manufacturer perspective
(striving for lowest average additional vehicle manufacturing costs) and from a user perspective (striving for
lowest total cost of ownership), to meet the target with a mix of efficient ICEVs and alternatively fuelled
vehicles (AFVs) such as BEVs, PHEVs and FCEVs. In the study, for a TTW CO2 target of 75 g/km the
optimal shares of AFVs are found to be around 20-30% (see Figure 17), increasing to around 40% for a
target of 65 g/km18
. The reason for that is that the cost curves for efficiency improvement in ICEVs are
strongly non-linear. Provided that the costs of AFVs go down as expected, at some point the marginal costs
of further CO2 reduction in ICEVs become higher than the marginal costs of replacing ICEVs by AFVs.
The leverage between CO2-reduction in ICEVs and introducing AFVs on the costs for meeting the target
depend on the metric that is chosen for the legislation. Under a TTW CO2-based target AFVs driving on
electricity or hydrogen count as zero-emission, creating a strong leverage. Under WTW CO2-based targets
or TTW or WTW energy based targets the leverage is less pronounced, as AFVs do not count as zero under
those metrics.
Figure 17 – Impact on costs from a manufacturer, end-user and societal perspective of introducing increasing shares of AFVs to meet a TTW CO2 target of 75 g/km in 2030 [TNO 2013b]. Additional costs are relative to
reaching 130 g/km in 2015.
18
This result obviously depends on the cost curves for CO2 reduction in ICEVs and the costs for AFVs in 2025-2030 as assumed in the study. However, these are being updated in a new study for the European Commission.

Assessment of competitiveness impacts of post-2020 LDV CO2 regulation
Final Report Valdani Vicari & Associati (VVA), Technopolis Group (TG), Joint Institute for Innovation Policy (JIIP), TNO for DG CLIMA 67
Cost competitiveness impacts could result from differences in the abilities of different OEMs to market AFVs
at competitive costs. In view of the focus on EU vs. rest of the world, this is a question of whether EU OEMs
would by 2025-2030 be in a better or worse position to manufacture and sell AFVs that are affordable and
attractive to their customers.
Overall an essential question is whether cost curves for efficiency improvement in ICEVs and costs of
manufacturing AFVs are different for EU and non-EU manufacturers. This question is difficult to answer
quantitatively, but in chapters 5 and 6 possible origins for cost differences will be explored with the help of
qualitative and quantitative sectorial information (as summarized in chapter 3 and Annex 2).
The way in which the target level affects individual OEMs not only depends on the level and the metric but
also on the shape and slope of the target function. Therefore no general conclusions can be drawn on this.
The target level as such could influence competiveness of EU manufacturers vs. non-EU OEMs if:
the average costs for further CO2 reduction in ICEVs are different from those of their competitors, or
the average costs for manufacturing AFVs are different from those of their competitors.
Possible origins for regional differences in the costs of compliance mechanisms are explored in section 5.5.
The target level could also affect cost competitiveness between EU and non-EU manufacturers if OEMs are
obliged to sell types of powertrains or other CO2 reducing technologies in the EU which they cannot or need
not sell in other regions. The latter case depends on the level of the CO2 target or other obligations in the EU
compared to targets in other regions. With respect to the overall target level the following reasoning applies:
If the target in the EU is significantly more stringent than in other regions, EU manufacturers could
benefit from that. The share of EU sales in their total sales is higher than for non-European OEMs as is
their absolute sales in the EU. This means that EU manufacturers would have to apply certain CO2
reducing measures to a larger volume of cars than non-EU manufacturers leading to economies of scale
that their non-EU competitors cannot achieve. This would improve the cost competitiveness of EU
manufacturers on the European market. Whether the cost competitiveness of European manufacturers
on foreign markets is negatively affected in this case, depends on the extent to which they can
differentiate their products for the EU and non-EU markets.
If the EU target is significantly less stringent than in other large markets, the cost competitiveness of EU
manufacturers on those markets would be negatively affected as they have a relatively low market share
on foreign markets and would not be able to achieve the same economies of scale as the dominant non-
EU OEMs that are active on those markets.
Figure 8 indicates that there are differences between the passenger car targets in different regions. Roughly
speaking one could conclude that up to 2020 targets in the EU and Japan appear to be quite similar while
targets in e.g. the US, Canada, Korea, China, India and Latin-American countries appear to be in the same
bandwidth at a level some 20 g/km above the targets in the EU and Japan. In comparing targets, however,
differences in fleets should be taken into account as already indicated in section 4.2.
Although it is not possible to predict how targets develop beyond 2020 in all these regions, it appears that
cost competitiveness of EU versus Japanese manufacturers on the EU and Japanese market would be less

Assessment of competitiveness impacts of post-2020 LDV CO2 regulation
Final Report Valdani Vicari & Associati (VVA), Technopolis Group (TG), Joint Institute for Innovation Policy (JIIP), TNO for DG CLIMA 68
affected by post 2020 target setting than cost competitiveness of EU OEMs versus those in the other
aforementioned regions. If targets in those regions remain higher than in the EU one may expect EU
manufacturers to benefit from that on the EU market in terms of lower compliance costs per vehicle sold.
Whether their cost competitiveness on those other markets would be negatively affected probably also
depends on whether EU OEMs sell “average” vehicles (“volume” models) on those markets or rather “high
end” vehicles (“premium” models) (see also section 5.6).
The above reasoning can be considered to apply if OEMs from different regions are faced with on average
similar targets on the same market. Whether that is the case, depends on how these targets are defined. If in
a region the target is somehow differentiated as a function of a utility parameter, the effective stringency of
the legislation in that region for different OEMs is determined by their sales distribution. If groups of OEMs
from different regions have different sales distributions, their average targets will be different and cost
competitiveness impacts could occur even if the targets in the home markets of the different regional OEM
groups are similar. If the target is not differentiated or if groups of OEMs from different regions have similar
sales distributions, the targets for those groups would be similar. In that case the cost competitiveness
impact of different regulations in different regions is mainly determined by the differences in target levels.
Utility parameter and shape / slope of the target function
Possible cost competitiveness impacts resulting from different levels of stringency of the targets imposed on
EU and non-EU OEMs or EU vs. non-EU manufacturing are determined by the shape and slope of the utility-
based target function which is used to establish specific targets for individual OEMs and by the utility
parameter used as a basis for differentiating the targets.
As competition takes place in the market, OEMs can be considered to compete within specific market
segments, with the products offered in those segments, rather than at company level with their complete
sales. This means that target functions that do not set targets of similar stringency for smaller and larger cars
can affect competition in specific segments in the ways as indicated in Figure 18. The graph leads to the
following general conclusions:
If two OEMs are competing in the same market segment, but one has a narrower model portfolio than
the other, then both a “flat” and a “steep” slope (compared to a neutral slope e.g. requiring similar
reductions across the whole spectrum of utility values) is likely to affect the mutual cost competitiveness
of both companies;
Which of the OEM benefits in that case from the choice of the slope of the utility based limit function
depends on whether the slope is “steep” or “flat” (with a “neutral” slope requiring similar relative
reductions for smaller and larger cars);
If two manufacturers are competing in the same market segment, and have similar model portfolios,
then no impacts on cost competitiveness are to be expected from the slope of the target function.
There is no exact way to determine whether the stringency of the legislation is similar or different for two
OEMs (or groups of related undertakings). In previous assessments two approaches have been used. In one
approach targets are considered of similar stringency if they require the same relative reduction for both
groups compared to the reference situation. If mass remains the utility parameter, this could be considered

Assessment of competitiveness impacts of post-2020 LDV CO2 regulation
Final Report Valdani Vicari & Associati (VVA), Technopolis Group (TG), Joint Institute for Innovation Policy (JIIP), TNO for DG CLIMA 69
generally the case if the post 2020 target line is such that the required relative reduction compared to the
2020 target is the same for all mass values (100% slope in the terminology of [TNO 2011]). In a second
approach, which was an important tool in determining the burden sharing for the 2020 target, targets are
considered of similar stringency if they lead to the same relative price increase (assuming the same costs
curves for all OEMs). Given the non-linear nature of the cost curves that does not give the same result as an
approach based on percentage level of reduction. Targets are fundamentally of the same stringency if the
sales of two OEM groups are more or less equally distributed over the range of CO2 values. Post 2020 LDV
CO2 legislation may thus lead to different effective targets, and thus to cost competitiveness impacts, if the
sales of EU OEMs and those of non-EU OEMs are not equally distributed over the range of CO2 values.
The above reasoning, however, may be too simplistic. In the initial passenger car legislation for 2015 the
slope was chosen flatter than the one based on same relative reduction over the entire CO2 range relative to
the sales-weighted fit to the CO2 vs. mass data for the reference year19
. As a consequence OEMs selling
vehicles with an average mass above the overall EU sales average will have had to apply higher relative
reductions to meet the 2015 and 2020 targets (have “climbed higher on the cost curve”) leading to higher
marginal costs for further emission reductions. Alternatively equivalence of targets could thus be related to
the effort to be made for meeting the target (e.g. expressed as relative price increase based on additional
manufacturer costs times a mark-up factor divided by the average sales price, as was used for assessing
distributional impacts in several previous studies). For vans the issue described here is not relevant as the
target lines for the 2017 and 2020 targets were defined in such a way that compared to the reference
situation similar reduction percentages are required for all mass values.
The impact of the shape and slope of the target function may be affected by the change in test procedure
from NEDC to WLTP. Various technologies have different CO2-reduction potentials on the two test
procedures, partly depending on the vehicle configuration, leading to cost curves being different for
reductions on the two test procedures. The slope of a target function leading to equal relative price increases
for different OEMs for a target based on the NEDC may thus be different from that for a target based on the
WLTP. How this will work out, cannot be determined at this stage, as the process of developing a correlation
function for CO2 emissions on the two tests and translation of targets is still on-going.
19
This was done for two reasons: A flatter slope than the so-called 100% slope was needed to avoid opportunities for gaming with mass (bringing a vehicle closer to the target line by making it heavier) (see [IEEP 2007] and [AEA 2008]). Also it was considered that smaller vehicles already contribute towards the overall EU objective to reduce CO2 emissions of the European vehicle fleet, and that there might be some additional reduction potential in larger vehicles as these on average tend to have a higher power-to-mass ratio than smaller vehicles.

Assessment of competitiveness impacts of post-2020 LDV CO2 regulation
Final Report Valdani Vicari & Associati (VVA), Technopolis Group (TG), Joint Institute for Innovation Policy (JIIP), TNO for DG CLIMA 70
Figure 18 – Ways in which the slope of the target function may affect cost competitiveness between OEMs
Slo
pe
of lin
ea
r
utility
-ba
se
d
targ
et lin
e
Ste
ep
slo
pe
Fla
t slo
pe
Sa
les
dis
tribu
tion
OE
M A
Sa
les
dis
tribu
tion
OE
M B
Ma
inly
larg
e
ve
hic
les
Bro
ad
sp
ectru
m
Ma
inly
sm
all
ve
hic
les
Ma
inly
larg
e
ve
hic
les
Bro
ad
sp
ectru
m
Ma
inly
sm
all
ve
hic
les
YE
S, lik
ely
imp
act o
n
co
mp
etitiv
en
ess o
f OE
M A
rela
tive
to O
EM
B
OE
M A
OE
M B
ha
s a
tigh
t targ
et fo
r sm
alle
r ve
hic
les a
nd
ma
y
the
refo
re n
ee
d to
red
uce
mo
re in
larg
e c
ars
or
cro
ss s
ub
sid
ize
co
sts
ha
s n
o ro
om
for in
tern
al o
ptim
isa
tion
, bu
t du
e to
len
ien
t targ
et a
lso
do
es n
ot n
ee
d th
at
NO
, no
imp
act o
n
co
mp
etitiv
en
ess o
f OE
M A
rela
tive
to O
EM
B
OE
M A
OE
M B
ha
s a
len
ien
t targ
et fo
r sm
alle
r ve
hic
les a
nd
ca
n
the
refo
re re
du
ce
less in
larg
e c
ars
or
cro
ss s
ub
sid
ize
co
sts
ha
s a
tigh
t targ
et fo
r its la
rge
ve
hic
les b
ut n
o ro
om
to re
du
ce
mo
re in
sm
all c
ars
or
cro
ss s
ub
sid
ize
co
sts
OE
M A
OE
M B
ha
s a
len
ien
t targ
et fo
r larg
er v
eh
icle
s a
nd
ca
n
the
refo
re re
du
ce
less in
sm
all c
ars
or
cro
ss s
ub
sid
ize
co
sts
ha
s a
tigh
t targ
et fo
r its s
ma
ll ve
hic
les b
ut n
o ro
om
to re
du
ce
mo
re in
larg
e c
ars
or
cro
ss s
ub
sid
ize
co
sts
OE
M A
OE
M B
ha
s a
tigh
t targ
et fo
r larg
er v
eh
icle
s a
nd
ma
y
the
refo
re n
ee
d to
red
uce
mo
re in
sm
all c
ars
or
cro
ss s
ub
sid
ize
co
sts
ha
s n
o ro
om
for in
tern
al o
ptim
isa
tion
, bu
t du
e to
len
ien
t targ
et a
lso
do
es n
ot n
ee
d th
at
targ
ets
for O
EM
A a
nd
B a
re s
imila
r an
d
inse
nsitiv
e to
slo
pe
of ta
rge
t fun
ctio
n
favo
ura
ble
for
OE
M A
favo
ura
ble
for
OE
M B
favo
ura
ble
for
OE
M A
favo
ura
ble
for
OE
M B
targ
ets
for O
EM
A a
nd
B a
re s
imila
r
targ
ets
for O
EM
A a
nd
B a
re s
imila
r

Assessment of competitiveness impacts of post-2020 LDV CO2 regulation
Final Report Valdani Vicari & Associati (VVA), Technopolis Group (TG), Joint Institute for Innovation Policy (JIIP), TNO for DG CLIMA 71
Choice of utility parameter
If the utility parameter is changed to footprint the situation is more complicated. Average mass and footprint
values of OEMs are not totally correlated, so that the required reduction per OEM not only depends on its
average footprint and the slope of the footprint based utility function but also on how his position relative to
the average is different for footprint compared to mass.
Annex 5 contains graphs with sales distributions in which sales in the EU are grouped for manufacturers
from Europe, Japan, Korea and other regions (using different definitions of what are European and non-
European manufacturers). One can see that sales distributions based on mass and footprint are different.
For mass the differences in average utility between EU and non-EU OEMs are larger than for footprint.
Furthermore for footprint sales distributions of EU and non-EU OEMs are more symmetric. From this it can
be concluded that for footprint as utility parameter the choices with respect to the shape and slope of the
target function are less likely to lead to impacts on cost competitiveness of EU vs. non-EU manufacturers
than for mass.
Other modalities
Possibilities for a joint legislative target for passenger cars and (one or more categories of) LCVs
Overall the stringency of the current LCV legislation is significantly less than for cars. This means that
especially in the category of smaller vans, which are either car-derived or share a large number of their
components with car models, the potential for CO2-reduction is larger than what is used to meet the LCV
target. A joint regulation for cars and small vans is likely to effectively lower the target for small vans, while it
allows the target function for larger vans to be defined in a way that is more suitable for that category of
vehicles (see example in Figure 19).
Possible ways in which this may lead to cost competitiveness impacts:
If sales shares N1/M1 are different for EU OEMs and non-EU OEMs, overall or in the LCV categories
that are joint with the passenger car legislation, the targets for EU and non-EU OEMs may be affected
differently.
Increasing the scope of the passenger car legislation to also include small vans increases the room for
internal averaging and optimisation of reduction potentials and costs for OEMs selling both passenger
cars and vans. OEMs that do not sell (significant quantities of) vans on the EU market would not benefit
from this. Given that van sales are typically 10% of passenger car sales the size of this effect is expected
to be small.
Possible impacts will depend on details of how the targets are joined. Different options lead to different
changes in the stringency of the legislation for small / car derived vans and larger vans. OEMs are affected
differently depending on their sales in different categories. Other options for joining the passenger cars and
vans legislation, as already discussed in section 4.2, include:
The targets and associated modalities for cars and vans could still be designed separately but merged
into one text (i.e. in the same Regulation);

Assessment of competitiveness impacts of post-2020 LDV CO2 regulation
Final Report Valdani Vicari & Associati (VVA), Technopolis Group (TG), Joint Institute for Innovation Policy (JIIP), TNO for DG CLIMA 72
Bringing part of the LCV market together with passenger cars under a single target. The categories of
LCVs to be joined with passenger cars may be based on the current class I, II and III definitions for N1
vehicles, may include N2 vehicles and may be based on definitions still to be devised.
The two vehicle categories could be combined under a single target.
The first option has no cost competitiveness impacts as it is only a formal way of joining two pieces of
legislation into a single regulation. The other two options could have impacts on cost competitiveness
depending on the exact definition of the combined legislation as well as on the different positioning of EU
and non-EU manufacturers in the cars and vans markets.
Figure 19 - Sales weighted fits through CO2 and mass for the passenger car sales in 2009 and the Class I & II light commercial vehicle sales in 2010 separately and combined, and the mass-based limit functions with 100%
slope based on these fits (taken from [TNO 2013a]
Possibilities for including mileage weighting
Including lifetime mileage weighting in the target setting is first of all a means to increase the cost
effectiveness of the regulation as it promotes OEMs to apply more CO2-reduction technologies in vehicles
with higher absolute lifetime savings as a consequence of their larger lifetime mileage. [Ricardo-AEA 2014]
estimates that mileage weighting reduces the costs for compliance by around 1.5% for vehicle
manufacturers (analysed using both mass and footprint as utility parameter)).
In comparing a sales weighted target (as used in the current legislation) with a sales and lifetime mileage
weighted target requires definition of equivalent targets. The approach used in [Ricardo-AEA 2014] is the
following:
Given a target function 𝑇(𝑈), with 𝑈 the utility parameter, for the sales weighted target and an assumed
division of the market into 𝑚 segments (for simplicity sake), a sales-weighted manufacturer specific target
𝑇𝑂𝐸𝑀 is defined as:

Assessment of competitiveness impacts of post-2020 LDV CO2 regulation
Final Report Valdani Vicari & Associati (VVA), Technopolis Group (TG), Joint Institute for Innovation Policy (JIIP), TNO for DG CLIMA 73
𝑇𝑂𝐸𝑀 = ∑ 𝑛𝑖
𝑚𝑖=1 ∙ 𝑇(𝑈𝑖)
∑ 𝑛𝑖𝑚𝑖=1
In this equation 𝑛𝑖 is the sales of the OEM in segment 𝑖, 𝑈𝑖 the average utility of vehicles in segment 𝑖. The
manufacturer has the freedom to optimise the applied levels of CO2 reduction over the various segments
leading to realised CO2 emissions 𝑒𝑖 per segment for which the sales average meets the target:
𝑇𝑂𝐸𝑀 =∑ 𝑛𝑖
𝑚𝑖=1 ∙ 𝑒𝑖
∑ 𝑛𝑖𝑚𝑖=1
For translating this to an equivalent mileage-weighted target the overall lifetime emissions 𝐸𝑂𝐸𝑀 are
calculated which are realised with the sales that are optimised under the sales-weighted target. It is then
demanded that the OEM realises the same absolute emission level but with the freedom to divide the
reduction efforts over the different segment in a way that is optimised with respect to the lifetime mileage of
the vehicles. This leads to alternative CO2 emission levels 𝑒′𝑖 per segment.
𝐸𝑂𝐸𝑀 = ∑ 𝑛𝑖
𝑚
𝑖=1
∙ 𝑒𝑖 ∙ 𝑑𝑖(𝑈𝑖) = ∑ 𝑛𝑖
𝑚
𝑖=1
∙ 𝑒′𝑖 ∙ 𝑑𝑖(𝑈𝑖)
In the above equation 𝑑𝑖(𝑈𝑖) is the average lifetime mileage of vehicles in segment 𝑖 (which will in any case
be a function of 𝑈𝑖, but may also depend on the type of fuel (e.g. petrol vs. diesel) or powertrain used (e.g.
ICEV vs BEV)). If mileage weighting is to be introduced it will most likely be based on uniform default
mileage values (as function of the value of the utility parameter and possible other vehicle attributes) which
are by definition the same for all manufacturers.
It is clear from the above that in the extreme case of an OEM that only sells vehicles in a single segment, this
OEM would not have room to optimise under a mileage-weighted target and would apply the same
reductions in both cases. OEMs with a wide product portfolio would thus benefit the most from the cost
reductions associated with mileage weighting. This could affect competition between OEMs with different
sales portfolios. Whether it affects cost-competitiveness from an EU vs. non-EU perspective depends on the
extent to which EU and non-EU manufacturers have markedly different sales portfolios in the EU market:
Based on analyses in sections 3.1 and 5.6 and the information in Annex 5 it appears that sales
distributions of EU and non-EU volume manufacturers as function of mass or footprint are quite similar.
EU OEMs, however, tend to have a higher share of diesels in their portfolio which, according to [Ricardo-
AEA 2014] on average have a higher lifetime mileage. This would mean that EU OEMs would benefit
more from a mileage-weighted target than non-EU OEMs.
A further distinction between EU and non-EU OEMs is the stronger presence of EU-OEMs in the
premium market, with some OEMs strongly focussing on that market. For premium OEMs with a
relatively narrow sales portfolio, mileage weighting could lead to moderate negative impacts on cost
competitiveness relative to EU and non-EU OEMs with a wider portfolio. This could reduce the possible
positive cost competitiveness impacts identified for premium manufacturers in section 5.6.
Assessment of competitiveness impacts of post-2020 LDV CO2 regulation
Final Report Valdani Vicari & Associati (VVA), Technopolis Group (TG), Joint Institute for Innovation Policy (JIIP), TNO for DG CLIMA 74
A detailed assessment of possible impacts of a sales- and mileage-weighted target would depend on the
details of its implementation. Also in a mileage-weighted target a target function would need to be defined.
Its slope would be different from that of a sales-weighted target if in defining the slope account is taken of the
differences in lifetime mileage between vehicles with different utility. As larger vehicles tend to have higher
lifetime mileages, this could lead to a flatter slope which would affect competition between OEMs with
different average utilities.
Possibilities for including embedded emissions
If embedded emissions are to be introduced it will in first instance most likely be based on uniform default
embedded emission values for different technologies, possibly as function of the value of the utility
parameter [TNO2013a]. This will affect the extent to which different technologies contribute to meeting a
manufacturer-specific target and thus their cost-effectiveness from a manufacturer point of view. In fact, as
the embedded emissions of AFVs are generally higher than of ICEVs, this modality tends to level the
effectiveness of different technologies, similar to the effect of changing the metric from TTW CO2 to WTW
CO2. In the terminology of [TNO 2013a] it reduces the leverage between introducing a finite share of AFVs
and the remaining reductions required in ICEVs for meeting the target. Compared to the current TTW CO2
metric, therefore, including embedded emissions will reduce the strong incentive that low targets provide for
marketing AFVs with zero or very-low TTW CO2 emissions. This means that potential cost competitiveness
related to possibly different capabilities of EU and non-EU manufacturers for manufacturing and marketing
AFVs will be greatly reduced. Given that non-EU OEMs have a stronger position in vehicles with electric
powertrains, it can be concluded that including embedded emissions is likely to reduce possible negative
cost competitiveness impacts compared to a TTW CO2-based legislation that does not include embedded
emissions. Overall, however, this modality is not expected to lead to significant direct impacts on cost
competitiveness.
Phase-in period
In a phase-in period manufacturers are required to meet the target with a share of their sales that increases
over time as the target year approaches. This to some extent reduces the flexibility that manufacturers have
with respect to timing of the introduction of new technologies. As introducing advanced technologies is often
aligned with model updates or new model introductions, a phase-in may increase the pressure for OEMs of
which the timing of model cycles is less compatible with the timing of the legislation. However, there are no
reasons to assume a difference in this compatibility for EU and non-EU OEMs. Furthermore a phase-in
period works out the same for all OEMs as it does not affect manufacturer specific reduction efforts. Overall it
is therefore concluded that this modality does not cause cost competitiveness impacts.
Derogations for small volume and niche manufacturers
OEMs selling small numbers of vehicles in the EU are not necessarily small volume manufacturers
worldwide. This case is more likely to apply to non-EU manufacturers, and as a result these on average
could be likely to benefit more from this modality than EU manufacturers. The extent to which this is the case
obviously also depends on the way in which the targets for small volume and niche manufacturers are
defined. Regulation (EC) No 443/2009 contains a derogation for manufacturers which sell between 10,000
and 300,000 new passenger cars per year in the EU, allowing them to use a target which is a 25 % reduction

Assessment of competitiveness impacts of post-2020 LDV CO2 regulation
Final Report Valdani Vicari & Associati (VVA), Technopolis Group (TG), Joint Institute for Innovation Policy (JIIP), TNO for DG CLIMA 75
on their average specific emissions of CO2 in 2007. Depending on the 2007 average, however, this target is
not necessarily higher than the one set by the target function that applies to large volume manufacturers.
Furthermore the following two considerations lead to concluding that possible cost competitiveness impacts
from derogations will not be significant:
The volumes sold by manufacturers that would be eligible for derogation are too small to have a
significant effect on the cost competitiveness of the EU car industry as a whole;
Secondly, it is clear that as soon as competitive advantages for manufacturers that are eligible for
derogation would translate into significantly increased market shares, these manufacturers would no
longer be eligible for derogation.
Super credits
Companies with a stronger than average technology and market position in AFVs are more likely to benefit
from super credits. If the technology and market position in AFVs of EU manufacturers is on average
different from that of non-EU manufacturers, this modality could affect cost competitiveness.
Eco-innovations
Eco-innovations reward the application of technologies that reduce CO2 emissions on the road but not
(significantly) on the type approval test. The rewards depend on the benefits of these technologies under
European driving conditions and are thus the same for all OEMs regardless of their region of origin of
location of manufacturing. Cost competitiveness impacts could only arise from differences in costs for
applying technologies that qualify as eco-innovations. Reasons for why these costs could be different for EU
and non-EU manufacturers are the same as for technologies that can be implemented to reduce CO2
emissions on the type approval test. From that perspective the mechanisms through which including eco-
innovations (or similar provisions for promoting the application of technologies that reduce off-cycle CO2
emissions) could lead to cost competitiveness impacts are expected to be the same as for a legislation which
only targets CO2 emission reductions on the type approval test. In practice specific cost competitiveness
impacts may arise if the relative capabilities for marketing off-cycle CO2-reducing technologies of EU OEMs
compared to non-EU OEMs would be different from the relative capabilities for marketing on-cycle CO2-
reducing technologies.
On the other hand, however, including eco-innovation increases the amount of compliance mechanisms
available to OEMs. This could provide an opportunity for some OEMs to reduce possible negative cost
competitiveness impacts resulting from having weaker capabilities than their competitors in manufacturing
CO2-reducing technologies that are rewarded by the type-approval test procedure.
For eco-innovations that are developed by component suppliers it can be stated that they are in principle
available to all OEMs. As a result the likelihood of differences in OEMs’ abilities to manufacture and sell
vehicles with such eco-innovations is small.

Assessment of competitiveness impacts of post-2020 LDV CO2 regulation
Final Report Valdani Vicari & Associati (VVA), Technopolis Group (TG), Joint Institute for Innovation Policy (JIIP), TNO for DG CLIMA 76
Penalties (excess emissions premiums)
Penalties are the same for all manufacturers. But the attractiveness of using penalties as a “safety valve” for
avoiding high compliance costs, or likelihood that penalties will be used in this way, depends on the marginal
costs for meeting the target. These marginal costs are different for different manufacturers. In that sense
penalties can be considered to reduce cost competitiveness impacts of the legislation as they set an upper
limit to the marginal costs of compliance that is equal for all manufacturers. It is acknowledged, however, that
there may be image-costs associated with following a strategy aimed at paying the penalty rather than
meeting the target. These may be different for different OEMs, depending of their target customers.
Possibilities for pooling, banking and/or trading
Pooling
Allowing manufacturers to pool their targets provides an opportunity for OEMs that have difficulties in
meeting their specific target at acceptable marginal costs to use part of the “emission allowance” of another
OEM that is able to achieve larger reductions than required by its specific target at lower marginal costs. A
pooling provision does not specify how the OEM that directly benefits from pooling should compensate the
costs involved for the other OEM which has to apply additional reduction efforts.
It is reasonable to assume that an OEM that is able to achieve larger reductions than required by its specific
target will only be willing to pool targets with another OEM if that leads to net benefits for the profitability of
the company in the short or long term. While pooling thus reduces negative cost competitiveness impacts for
OEMs that have difficulties in complying with CO2 legislation, it may be expected to generate positive cost
competitiveness impacts for OEMs that are able to comply more easily than their competitors. For both
partners in a pool the pooling thus has positive impacts, so their relative cost competitiveness can be
considered largely unaffected. Their joint cost competitiveness, however, may improve relative to OEMs that
do not engage in pooling. The extent to which this leads to net positive or negative cost competitiveness
impacts for EU OEMs vs. non-EU OEMs depends on the distribution per region of OEMs for which the target
is less or more challenging, on the extent to which these OEMs choose to make use of the possibility of
pooling, as well as the extent to which pools are formed between OEMs from the same region. If OEMs from
one region pool while OEMs from another do not the relative cost competitiveness of the industry in the two
regions is affected.
Manufacturers can pool their target with other manufacturers from the same region or from a different region.
Existing close collaborations between OEMs from the different regions (e.g. Renault and Nissan on
conventional and electric vehicles and collaboration between BMW and Toyota on diesel engines, the joint
development of a fuel cell system, joint development of architecture and components for a sports vehicle,
and joint research and development of lightweight technologies) show that there are no barriers that would
inhibit OEMs from different regions to work together. This is expected to apply also to pooling of targets, so
that manufacturers from different regions can be considered to benefit equally from this modality.

Assessment of competitiveness impacts of post-2020 LDV CO2 regulation
Final Report Valdani Vicari & Associati (VVA), Technopolis Group (TG), Joint Institute for Innovation Policy (JIIP), TNO for DG CLIMA 77
Trading
Allowing manufacturers to trade emission credits serves a similar purpose as pooling, with the main
differences being that the compensation for using another OEM’s “emission allowance” has to be financial
and is organised in a dedicated “market-place”. Also credits can be bought from / sold to more than one
OEM, and the system could be anonymous. The effects are expected to be largely similar.
A difference with pooling, depending on how the trading scheme is operated, is that an OEM that sells credit
may have no control over who buys the credits. OEMs may thus unwantedly “help” their competitors. A
phenomenon that is more likely to occur under a trading scheme than under pooling is that new entrants that
specialize in AFVs, and which thus have average CO2 emissions well below their targets, can obtain
additional revenue from selling credits. The current situation in Europe is that such new entrants are more
likely to come from outside the EU than from inside (e.g. electric vehicle manufacturer Tesla and BYD, which
in China also sells ICEVs but currently only sells battery-electric vehicles in the EU). As a consequence the
modality of trading may positively affect the cost competitiveness of new market entrants from outside the
EU.
Based on the above, it is concluded that trading schemes may have similar cost competitiveness impacts as
pooling, in the sense that they may alleviate some competiveness impacts and increase other compared to
regulatory schemes without trading. Especially in the competition between vested OEMs on the EU market
and specialised new entrants trading may have negative cost competitiveness impacts for EU
manufacturers.
Banking & borrowing
Banking and borrowing is a modality that can be used to improve flexibility of a CO2 legislation based on a
fixed target year, without sacrificing the overall reductions that are to be achieved. OEMs are allowed to
compensate possible overshoots in some years (average above target) by undershoots in CO2 emissions in
other years. This may help to reduce the costs for meeting the target for OEMs that have model cycles that
are incompatible with the target year or strongly varying sales volumes. It does not have consequences for
OEMs for which the target is less challenging. As such it is concluded that banking and borrowing is not
expected to have negative cost competitiveness impacts as such, but that it may alleviate possible cost
competitiveness impacts compared to legislative schemes without this provision.
Summary of possible impacts associated with different modalities
Overall conclusions with respect to possible cost competitiveness impacts associated with different
modalities discussed above based on the mindmap are summarized in Table 5. From the overview it is clear
that the modalities themselves do not directly lead to cost competitiveness impacts. However, for various
modalities it is possible that they may lead to, or at least contribute to cost competitiveness impacts
depending how they are implemented in combination with specifics of the market (e.g. positions of EU and
non-EU OEMs in terms of sales distribution). Note that "Maybe" could result in either positive or negative
cost competitiveness changes.

Assessment of competitiveness impacts of post-2020 LDV CO2 regulation
Final Report Valdani Vicari & Associati (VVA), Technopolis Group (TG), Joint Institute for Innovation Policy (JIIP), TNO for DG CLIMA 78
Table 5 - Summary of possible OEM cost competitiveness impacts associated with different modalities
Modality Impact Comments / questions
Target level Maybe ? Cost competitiveness impacts may occur if cost curves for efficiency
improvement in ICEVs and costs of manufacturing AFVs are different for EU
and non-EU manufacturers.
o The size of these impacts would then be affected by the target
level.
o Differences between EU and non-EU OEMs in costs of
technologies are likely as EU OEMs have a focus on efficient
diesel technology while non-EU OEMs (currently) have more
experience in electric propulsion technologies.
Differences in cost curves may result from:
o regional differences in resources and capabilities of OEMs;
Possible origins for regional differences in the costs of
compliance mechanisms are explored in section 5.5.
o differences in economies of scale.
Differences in economies of scale for EU and non-EU OEMs may result
from:
o differences in sales volumes of advanced technologies in the EU
and in other regions.
o differences in the stringency of CO2 legislation in the EU and in
other regions.
If EU legislation is more stringent than in other regions this would improve
the cost competitiveness of EU manufacturers on the European market.
o Whether the cost competitiveness of European manufacturers on
foreign markets is negatively affected in this case, depends on the
extent to which they can differentiate their products for the EU and
non-EU markets.
If the EU target is significantly less stringent than in other large markets, the
cost competitiveness of EU manufacturers on those markets would be
negatively affected as they have a relatively low market share on foreign
markets and would not be able to achieve the same economies of scale for
advanced ICEVs and AFVs as the dominant non-EU OEMs that are active
on those markets.
Change of metric
from TTW CO2
No Other metrics than TTW CO2 have a lower leverage between CO2-reduction
in ICEVs and the share of AFVs. This would reduce possible cost
competitiveness impacts associated with regional differences in the abilities
of OEMs to market AFVs at competitive prices.

Assessment of competitiveness impacts of post-2020 LDV CO2 regulation
Final Report Valdani Vicari & Associati (VVA), Technopolis Group (TG), Joint Institute for Innovation Policy (JIIP), TNO for DG CLIMA 79
Modality Impact Comments / questions
Utility parameter
and shape /
slope of the
target function
Maybe ? Target function defines effective stringency of target per manufacturer.
Possible cost competitiveness impacts depend on the:
o shape and slope of the target function
o sales distributions of EU vs. non-EU manufacturers, specifically
their average utility compared to the overall EU average
A “neutral” slope (requiring e.g. similar % retail price increase for all values
of the utility parameter) will not lead to cost competitiveness impacts.
A “steep” or “flat” slope may lead to cost competitiveness impacts.
o As EU OEMs have a larger share in premium segments (larger and
heavier cars), a flat slope is likely to cause negative cost
competitiveness impacts for the EU car industry.
o However, as buyers of premium cars have a higher willingness-to-
pay for new technologies a steep slope may be more harmful for
volume OEMs than a flat slope is for premium OEMs.
Sales distributions based on mass and footprint are different:
o For mass the differences in average utility between EU and non-
EU OEMs are larger than for footprint.
o For footprint sales distributions of EU and non-EU OEMs are more
symmetric.
So for footprint as utility parameter choices with respect to the shape and
slope of the target function are less likely to lead to impacts on cost
competitiveness of EU vs. non-EU manufacturers.
The change from NEDC to WLTP is likely to affect the stringency of targets
for different OEMs, but impacts can at this stage not be assessed.
Joint legislative
target for
passenger cars
and (one or more
categories of)
LCVs
Maybe ? Cost competitiveness impacts depends on the exact definition of the
combined legislation as well as on the different positioning of EU and non-
EU manufacturers in the cars and vans markets.
o The share of EU OEMs of the EU LCV market is on average higher
than for non-EU OEMs, so EU OEMs would be more affected by
this modality.
Including mileage
weighting
Maybe ? Mileage weighting improves cost effectiveness of the regulation. The extent
to which EU and non-EU OEMs benefit differently from that depends on
differences in their sales portfolios:
o Based on sales divisions over mass or footprint no significant cost
competitiveness impacts are expected for volume manufacturers;
o EU OEMs could benefit more due to their higher diesel share.
Diesels tend to have higher lifetime mileages;
o EU premium manufacturers could be negatively affected if their
sales portfolio is narrower than that of their non-EU competitors.
This would counteract possible positive cost-competitiveness
impacts identified for EU premium manufacturers related to other
impact pathways.

Assessment of competitiveness impacts of post-2020 LDV CO2 regulation
Final Report Valdani Vicari & Associati (VVA), Technopolis Group (TG), Joint Institute for Innovation Policy (JIIP), TNO for DG CLIMA 80
Modality Impact Comments / questions
Including
embedded
emissions
Unlikely May reduce possible negative cost competitiveness impacts compared to
legislation that does not include embedded emissions
Phase-in period No
Derogations for
small volume and
niche
manufacturers
No OEMs that sell small numbers of vehicles in the EU but are large volume
manufacturers worldwide could in principle benefit.
But volumes sold by manufacturers that would be eligible for derogation are
too small to have a significant effect on the cost competitiveness of the EU
car industry as a whole.
And as soon as competitive advantages for specific manufacturers would
translate into significantly increased market shares, these manufacturers
would no longer be eligible for derogation.
Super-credits Maybe ? If the technology and market position in AFVs of EU manufacturers is on
average different from that of non-EU manufacturers, this modality could
affect cost competitiveness.
Eco-innovations Unlikely Cost competitiveness impacts may arise if the relative capabilities for
marketing off-cycle CO2-reducing technologies of EU OEMs compared to
non-EU OEMs would be different from the relative capabilities for marketing
on-cycle CO2-reducing technologies.
o But eco-innovations developed by suppliers are available to all
OEMs.
Including eco-innovation increases the amount of compliance mechanisms
available to OEMs. This could provide an opportunity for some OEMs to
reduce possible negative cost competitiveness impacts.
Penalties
(excess
emissions
premiums)
No Penalties can be considered to limit any cost competitiveness impacts of the
legislation as they set an upper limit to the marginal costs of compliance that
is equal for all manufacturers.
Pooling Maybe ? Reduces cost so lowers any cost competitiveness impacts.
Could only lead to a net impact if OEMs from one region form pools while
OEMs from another don't.
Trading Maybe ? Likeliness of cost competitiveness impacts higher than for pooling.
OEMs buying credits may “help” their competitors. However, they will only
buy if it also "helps" them.
New entrants specializing in low emission vehicles may benefit.
Banking &
borrowing
No Reduces cost so only outcome is to reduce any possible competiveness
impacts.

Assessment of competitiveness impacts of post-2020 LDV CO2 regulation
Final Report Valdani Vicari & Associati (VVA), Technopolis Group (TG), Joint Institute for Innovation Policy (JIIP), TNO for DG CLIMA 81
5.5 Possible regional origins for differences in costs of compliance mechanism
If manufacturers from the EU and other regions have to meet targets of similar stringency (or achieve
similarly challenging CO2 emission reductions), their ability to comply with the post-2020 LDV CO2 regulation,
and the resulting costs of compliance, might be different due to reasons that have to do with them being
European or non-European. Concerning the latter, differences may result from two different perspectives:
regional differences in the conditions for doing business, e.g. different costs, regulations or availability of
suppliers for various technologies, under the assumption that the cost of doing business for EU
manufacturers are more strongly determined by the situation in the EU than that of non-EU
manufacturers (e.g. because a larger share of their manufacturing is located outside the EU);
differences in the characteristics of EU and non-EU manufacturers that simply “happen to be the case”
for other reasons than regional differences in the conditions for doing business. E.g. the financial
position, patent and knowledge position or customer loyalty may on average be different for EU and non
EU manufacturers.
Such elements may lead to differences in the abilities of OEMs to develop the improved ICEVs and AFVs
needed to meet their specific targets, to manufacture them at a competitive cost level and to sell them to
customers in Europe.
Using the model explained in Figure 6 in section 2.2, identifying possible regional origins for differences in
costs of compliance mechanism for EU and non-EU manufacturers, can be done by analysing resources and
capabilities that play a role in a manufacturer’s ability to comply with targets set by the CO2 regulations and
to see whether there are regional differences in these resources and capabilities. An attempt to identify such
relevant resources and capabilities is made in Figure 20.
In the main capabilities, which are influenced by a range of underlying capabilities and resources, a
distinction is made in:
the ability to manufacture at lower marginal costs within a segment compared to other competitor(s),
and
the ability to manufacture at lower average marginal costs compared to competitor(s).
This distinction is relevant as competition in the marketplace is firstly within segments. Overall market shares
and profits, reflecting cost competitiveness at company level, are the summed result of competition in various
segments. As indicated in Figure 16, the impact of CO2 legislation on a company’s cost competitiveness in a
segment may be affected by the extent to which a company is able to strategically divide CO2 reduction
efforts over different segments or to cross-subsidize between segments.
Resources for which regional differences may influence capabilities of EU and non-EU manufacturers to
comply with post-2020 CO2 regulation in a cost-competitive manner include:
the financial position of companies, which influences their ability to develop more efficient ICEVs and
AFVs as well as their ability to temporarily absorb losses if competition does not allow full pass-through of
the costs of compliance;

Assessment of competitiveness impacts of post-2020 LDV CO2 regulation
Final Report Valdani Vicari & Associati (VVA), Technopolis Group (TG), Joint Institute for Innovation Policy (JIIP), TNO for DG CLIMA 82
o In return the financial position is affected by the profitability of a company’s operations, which may be
affected by the CO2 legislation
the knowledge position of companies, which influences their ability to develop more efficient ICEVs
and AFVs vehicles;
o The patent position is part of the knowledge position and not only influences the ability to develop
advanced ICEVs and AFVs but also to generate revenues by selling patents or licenses;
the facilities of companies, more specifically;
o their efficiency of production;
o their geographical location, which influences cost of labour and possible other cost factors of
production, and also determines transport costs;
access to suppliers able to deliver components for the technologies more efficient ICEVs and AFVs, and
the cost at which these suppliers are able to sell the required components;
the portfolio of companies, which may determine:
o why the same CO2 reduction in vehicles with similar utility value may be more expensive for one or the
other OEM;
o the extent to which OEMs can optimize the application of CO2 reducing technologies over the entire
sales portfolio and as well as to differentiate cost pass-through factors per segments (effectively
allowing cross-subsidizing between segments).
the customer base, which is characterised by aspects such as;
o the brand loyalty of customers, also associated with the brand image;
o willingness to pay, or price elasticity;
o the division of sales over Europe and markets outside the EU.
Below the influence of these resources, and of possible regional differences therein, on relevant capabilities
of companies are discussed in more detail.
Ability to develop improved ICEVs and AFVs
An OEMs ability to develop more efficient ICEVs and AFVs is influenced by a range of factors:
knowledge and technology position of the OEM and its suppliers and the resulting efforts required to
improve the knowledge and technology position:
o technologies already developed or even marketed;
o available patents
R&D capacity
o capability for and costs of carrying out the required R&D
o capability for and costs of acquiring licences
financial position, which determines the ability to invest in the required R&D and product development.
supplier base, which determines an OEM’s access to advanced components
Below for each of these factors an assessment is made of the extent to which regional differences can give
rise to differences in the compliance costs for EU and non-EU manufacturers to an extent that the relative
price ratio of their products is affected. For all aspects it should be noted that any conclusions based on the

Assessment of competitiveness impacts of post-2020 LDV CO2 regulation
Final Report Valdani Vicari & Associati (VVA), Technopolis Group (TG), Joint Institute for Innovation Policy (JIIP), TNO for DG CLIMA 83
current situation of the sector may not necessarily remain valid in the 2020-2030 timeframe as a result of
unpredictable changes in e.g. the economy or manufacturer strategies.
Knowledge / technology position of the OEM and its suppliers and the resulting efforts required to
improve knowledge / technology position
An OEM’s R&D and other efforts for meeting LDV CO2 targets can be divided in general R&D to develop the
technologies required for meeting the targets as well as the general skills for manufacturing and or applying
these technologies to the OEM’s products and specific R&D efforts for applying technologies to specific car
models.
If the required reductions for meeting LDV CO2 targets are more or less the same for competing OEMs,
differences in required R&D efforts between EU and non-EU manufacturers could in principle result from:
differences in the technologies required to meet the target resulting from differences in technologies
already used to meet earlier legislative targets;
differences in the current technology position of OEMs (technologies already developed, patents);
differences in the access to suppliers that can deliver the required technologies;
o see under “supplier base”
In Annex 2 (section A2.5) evidence is provided that Japanese OEMs and suppliers have a stronger patent
position and specialization than European OEMs in the field of technologies related to alternative propulsion
such as electric and hybrid vehicles. From a technology position perspective therefore European targets that
require or provide a strong incentive for implementing AFVs could provide cost competitiveness benefits for
non-EU manufacturers.
R&D capacity
An OEM’s capacity to carry out R&D and to innovate is e.g. influenced by regional factors such as:
the ability to invest in R&D (see next subsection)
available R&D facilities
availability, focus and quality of the regional knowledge infrastructure (universities, R&D companies);
availability of trained personnel with the required knowledge and skills.
In all major automotive manufacturing countries in the EU there appears to be a strong knowledge
infrastructure. As indicated in Annex 2 European OEMs on average have a higher R&D intensity than OEMs
from other regions. It is difficult to say whether that means that they have a good starting point for doing
additional R&D to meet LDV CO2 targets or that R&D budgets are already stretched. In any case it means
that they can more easily shift R&D efforts without affecting the overall cost structure of the company.
Stakeholders have indicated, however, that the availability of trained R&D staff with the required knowledge
and skills may become a limiting factor, as certain trends initiated or amplified by the CO2 legislation lead to
a shift in the required types of personnel, specifically a shift from mechanical engineers to electrical
engineers and IT specialists.
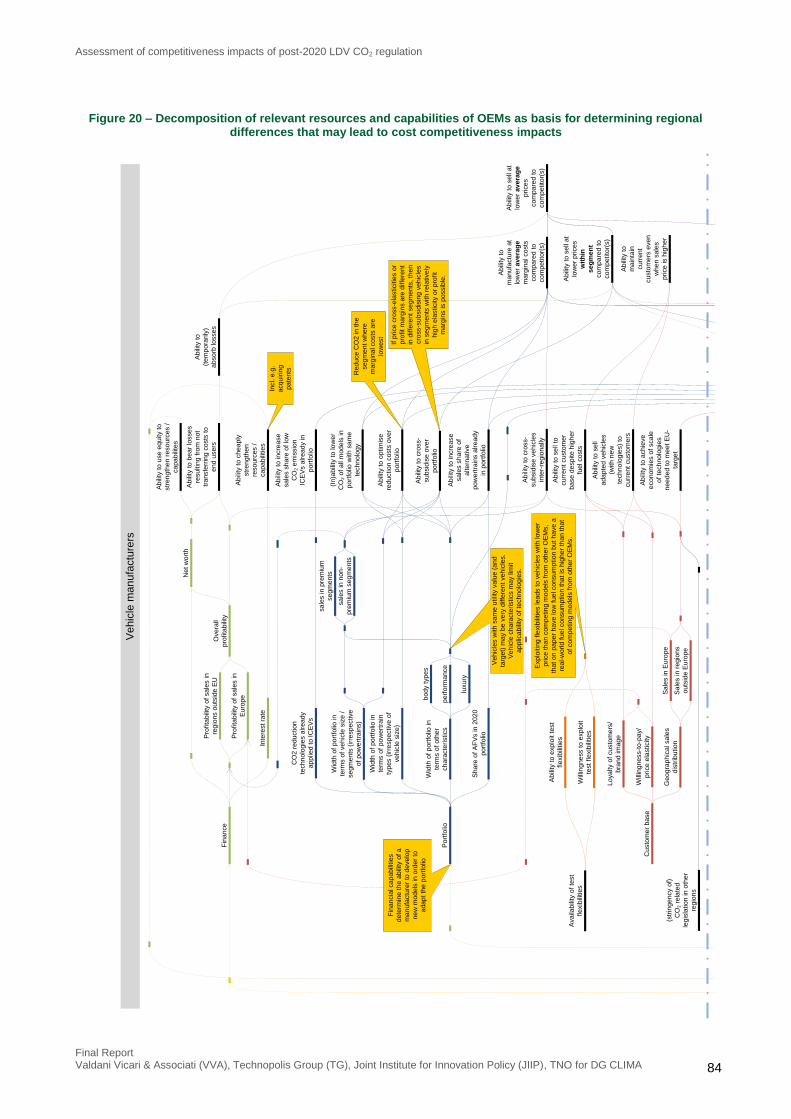
Assessment of competitiveness impacts of post-2020 LDV CO2 regulation
Final Report Valdani Vicari & Associati (VVA), Technopolis Group (TG), Joint Institute for Innovation Policy (JIIP), TNO for DG CLIMA 84
Figure 20 – Decomposition of relevant resources and capabilities of OEMs as basis for determining regional differences that may lead to cost competitiveness impacts
Wid
th o
f p
ort
folio
in
term
s o
f ve
hic
le s
ize
/
se
gm
en
ts (
irre
sp
ective
of p
ow
ert
rain
s)
Wid
th o
f p
ort
folio
in
term
s o
f o
the
r
ch
ara
cte
ristics
Sh
are
of A
FV
s in
20
20
po
rtfo
lio
Ge
og
rap
hic
al sa
les
dis
trib
utio
n
Lo
ya
lty o
f cu
sto
me
rs/
bra
nd
im
ag
e
Effic
ien
cy o
f
pro
du
ctio
n
facili
tie
s
Sh
are
of o
wn
co
mp
on
en
t p
rod
uctio
n
Ge
og
rap
hic
al d
istr
ibu
tio
n
of p
rod
uctio
n fa
cili
tie
s
Kn
ow
led
ge
of A
FV
po
we
rtra
in r
ela
ted
co
mp
on
en
ts
Kn
ow
led
ge
of C
O2
red
uctio
n
tech
no
log
ies fo
r
ICE
Vs
Pa
ten
ts in
lo
w
CO
2 e
mis
sio
n
tech
no
log
y (
ICE
V
or
alte
rna
tive
s)
Ne
t w
ort
h
Fle
xib
ility
to
ch
oo
se
diffe
ren
t su
pp
liers
Effic
ien
cy o
f p
rod
uctio
n
of su
pp
liers
Inte
rest ra
te
Re
so
urc
es
Ab
ility
to
op
tim
ise
red
uctio
n c
osts
ove
r
po
rtfo
lio
Ca
pa
bili
tie
s
Ab
ility
to
cro
ss-
su
bsid
ise
ove
r
po
rtfo
lio
Ab
ility
to
in
cre
ase
sa
les s
ha
re o
f
alte
rna
tive
po
we
rtra
ins a
lre
ad
y
in p
ort
folio
Wid
th o
f p
ort
folio
in
term
s o
f p
ow
ert
rain
typ
es (
irre
sp
ective
of
ve
hic
le s
ize
)
(In
)ab
ility
to
lo
we
r
CO
2 o
f a
ll m
od
els
in
po
rtfo
lio w
ith
sa
me
tech
no
log
y
Ab
ility
to
se
ll
ad
ap
ted
ve
hic
les
(with
ne
w
tech
no
log
ies)
to
cu
rre
nt cu
sto
me
rs
Ab
ility
to
ch
ea
ply
str
en
gth
en
reso
urc
es /
ca
pa
bili
tie
s
Ab
ility
to
use
eq
uity to
str
en
gth
en
re
so
urc
es /
ca
pa
bili
tes
Ab
ility
to
ge
ne
rate
ca
pita
l fr
om
lic
en
sin
g
Ab
ility
to
se
ll to
cu
rre
nt cu
sto
me
r
ba
se
de
sp
ite
hig
he
r
fue
l co
sts
Po
rtfo
lio
Cu
sto
me
r b
ase
Fin
an
ce
Kn
ow
led
ge
Pa
ten
ts
Fa
cili
tie
s
(R&
D/m
anu
fact
uri
ng/
asse
mb
ly)
Su
pp
liers
pe
rfo
rma
nce
luxu
ry
bo
dy typ
es
Sa
les in
Eu
rop
e
Sa
les in
re
gio
ns
ou
tsid
e E
uro
pe
(str
ing
en
cy o
f)
CO
2 r
ela
ted
leg
isla
tio
n in
oth
er
reg
ion
s
Ab
ility
to
ach
ieve
eco
no
mie
s o
f sca
le
of te
ch
no
log
ies
ne
ed
ed
to
me
et E
U-
targ
et
Ava
ilab
ility
of te
st
fle
xib
ilitie
s
Ab
ility
to
be
ar
losse
s
resu
ltin
g fro
m n
ot
tra
nsfe
rrin
g c
osts
to
en
d u
se
rs
Co
mp
an
y ta
xe
s
Ab
ility
to
co
ntr
ol
co
sts
of C
O2
red
uctio
n
tech
no
log
ies
Inte
r-re
gio
na
l
tra
nsp
ort
co
sts
fo
r
ca
rs
Ab
ility
to
pu
rch
ase
CO
2 r
ed
uctio
n
co
mp
on
en
ts a
t
low
er
price
Exte
rna
litie
s
Oth
er
kn
ow
led
ge
Ab
ility
to
in
cre
ase
sa
les s
ha
re o
f lo
w
CO
2 e
mis
sio
n
ICE
Vs a
lre
ad
y in
po
rtfo
lio
Ab
ility
to
ma
nu
factu
re a
t
low
er
ma
rgin
al
co
sts
wit
hin
se
gm
en
t
co
mp
are
d to
oth
er
co
mp
etito
r(s)
Ab
ility
to
ma
nu
factu
re a
t
low
er
av
era
ge
ma
rgin
al co
sts
co
mp
are
d to
co
mp
etito
r(s)
Ab
ility
to
ma
inta
in
cu
rre
nt
cu
sto
me
rs e
ve
n
wh
en
sa
les
price
is h
igh
er
Ab
ility
to
(te
mp
ora
rily
)
ab
so
rb lo
sse
s
Ab
ility
to
se
ll p
ate
nts
Ab
ility
to
cro
ss-
su
bsid
ise
ve
hic
les
inte
r-re
gio
na
lly
Mo
no
po
ly o
f
su
pp
liers
Co
ntr
acts
with
sp
ecific
su
pp
lier(
s)
Ab
ility
to
ad
d c
ert
ain
tech
no
log
ies a
t
low
er
co
sts
Kn
ow
led
ge
of A
FV
s
Ab
ility
to
de
ve
lop
imp
rove
d IC
EV
s
an
d A
FV
s
R&
D c
ap
acity
Co
sts
of tr
an
sp
ort
+
imp
ort
ing
ca
rs to
EU
Pro
du
ct p
ort
folio
of
exis
tin
g s
up
plie
rsA
cce
ss to
re
qu
ire
d
co
mp
on
en
ts
Pro
du
ct p
ort
folio
of
alte
rna
tive
su
pp
liers
CO
2 r
ed
uctio
n
tech
no
log
ies a
lre
ad
y
ap
plie
d to
IC
EV
s
Ve
hic
les w
ith
sa
me
utilit
y v
alu
e (
an
d
targ
et)
ma
y b
e v
ery
diffe
ren
t ve
hic
les.
Ve
hic
le c
ha
racte
ristics m
ay lim
it
ap
plic
ab
ility
of te
ch
no
log
ies.
Me
an
ing
th
at co
st
cu
rve
s a
re d
iffe
ren
t
fro
m th
ose
of
co
mp
etito
rs
Co
sts
of m
ate
ria
ls
Price
of re
qu
ire
d
co
mp
on
en
ts /
ma
teria
ls
Ve
hic
le m
an
ufa
ctu
rers
sa
les in
pre
miu
m
se
gm
en
ts
sa
les in
no
n-
pre
miu
m s
eg
me
nts
Pro
fita
bili
ty o
f sa
les in
reg
ion
s o
uts
ide
EU
Pro
fita
bili
ty o
f sa
les in
Eu
rop
e
Ove
rall
pro
fita
bili
ty
Ab
ility
to
exp
loit te
st
fle
xib
ilitie
s
Will
ing
ne
ss to
exp
loit
test fle
xib
ilitie
s
Will
ing
ne
ss-t
o-p
ay/
price
ela
sticity
Fin
an
cia
l ca
pa
bili
tie
s
de
term
ine
th
e a
bili
ty o
f a
ma
nu
factu
rer
to d
eve
lop
ne
w m
od
els
in
ord
er
to
ad
ap
t th
e p
ort
folio
Exp
loitin
g fle
xib
ilitie
s le
ad
s to
ve
hic
les w
ith
lo
we
r
price
th
an
co
mp
etin
g m
od
els
fro
m o
the
r O
EM
s,
tha
t o
n p
ap
er
ha
ve
lo
w fu
el co
nsu
mp
tio
n b
ut h
ave
a
rea
l-w
orld
fu
el co
nsu
mp
tio
n th
at is
hig
he
r th
an
th
at
of co
mp
etin
g m
od
els
fro
m o
the
r O
EM
s.
Re
gio
na
l
kn
ow
led
ge
infr
astr
uctu
re(s
)
Re
gio
na
l a
va
ilab
ility
of q
ua
lifie
d s
taff
Ab
ility
to
se
ll a
t
low
er
price
s
wit
hin
se
gm
en
t
co
mp
are
d to
co
mp
etito
r(s)
Ab
ility
to
se
ll a
t
low
er
av
era
ge
price
s
co
mp
are
d to
co
mp
etito
r(s)
Re
du
ce
CO
2 in
th
e
se
gm
en
t w
he
re
ma
rgin
al co
sts
are
low
est
If p
rice
cro
ss-e
lasticitie
s o
r
pro
fit m
arg
ins a
re d
iffe
ren
t
in d
iffe
ren
t se
gm
en
ts,
the
n
cro
ss-s
ub
sid
isin
g v
eh
icle
s
in s
eg
me
nts
with
re
lative
ly
hig
h e
lasticity o
r p
rofit
ma
rgin
s is p
ossib
le.
Inte
r-re
gio
na
l
tra
nsp
ort
co
sts
fo
r
ma
teria
ls /
co
mp
on
en
ts
Imp
ort
ta
riffs
R&
D c
osts
fo
r
de
ve
lop
ing
im
pro
ve
d
ICE
Vs a
nd
AF
Vs
Incl. e
.g.
acq
uirin
g
pa
ten
ts
Sim
ilar
to c
ost o
f m
an
ufa
ctu
rin
g
this
is in
flu
en
ce
d b
y g
eo
gra
ph
ica
l
loca
tio
n o
f R
&D
fa
cili
tie
s
Am
ou
nt o
f la
bo
ur
pe
r u
nit p
rod
uct
Eq
uip
me
nt, to
ols
an
d b
uild
ing
s
Ove
rhe
ad
activitie
s
La
bo
ur
co
sts
pe
r
un
it p
rod
uct
Ca
pita
l co
sts
pe
r
un
it p
rod
uct
Ove
rhe
ad
co
sts
pe
r u
nit p
rod
uct
Re
gio
na
l w
ag
e
leve
ls
Re
gio
na
l co
st o
f
ca
pita
l
Re
gio
na
l
reg
ula
tio
ns
Re
gio
na
l co
mp
an
y
tax le
ve
ls
Ma
nu
factu
rin
g
co
sts
pe
r u
nit
pro
du
ct
Ne
ed
to
acq
uire
lice
nse
sC
ost o
f lic
en
se
s

Assessment of competitiveness impacts of post-2020 LDV CO2 regulation
Final Report Valdani Vicari & Associati (VVA), Technopolis Group (TG), Joint Institute for Innovation Policy (JIIP), TNO for DG CLIMA 85
Wid
th o
f p
ort
folio
in
term
s o
f ve
hic
le s
ize
/
se
gm
en
ts (
irre
sp
ective
of p
ow
ert
rain
s)
Wid
th o
f p
ort
folio
in
term
s o
f o
the
r
ch
ara
cte
ristics
Sh
are
of A
FV
s in
20
20
po
rtfo
lio
Ge
og
rap
hic
al sa
les
dis
trib
utio
n
Lo
ya
lty o
f cu
sto
me
rs/
bra
nd
im
ag
e
Effic
ien
cy o
f
pro
du
ctio
n
facili
tie
s
Sh
are
of o
wn
co
mp
on
en
t p
rod
uctio
n
Ge
og
rap
hic
al d
istr
ibu
tio
n
of p
rod
uctio
n fa
cili
tie
s
Kn
ow
led
ge
of A
FV
po
we
rtra
in r
ela
ted
co
mp
on
en
ts
Kn
ow
led
ge
of C
O2
red
uctio
n
tech
no
log
ies fo
r
ICE
Vs
Pa
ten
ts in
lo
w
CO
2 e
mis
sio
n
tech
no
log
y (
ICE
V
or
alte
rna
tive
s)
Ne
t w
ort
h
Fle
xib
ility
to
ch
oo
se
diffe
ren
t su
pp
liers
Effic
ien
cy o
f p
rod
uctio
n
of su
pp
liers
Inte
rest ra
te
Re
so
urc
es
Ab
ility
to
op
tim
ise
red
uctio
n c
osts
ove
r
po
rtfo
lio
Ca
pa
bili
tie
s
Ab
ility
to
cro
ss-
su
bsid
ise
ove
r
po
rtfo
lio
Ab
ility
to
in
cre
ase
sa
les s
ha
re o
f
alte
rna
tive
po
we
rtra
ins a
lre
ad
y
in p
ort
folio
Wid
th o
f p
ort
folio
in
term
s o
f p
ow
ert
rain
typ
es (
irre
sp
ective
of
ve
hic
le s
ize
)
(In
)ab
ility
to
lo
we
r
CO
2 o
f a
ll m
od
els
in
po
rtfo
lio w
ith
sa
me
tech
no
log
y
Ab
ility
to
se
ll
ad
ap
ted
ve
hic
les
(with
ne
w
tech
no
log
ies)
to
cu
rre
nt cu
sto
me
rs
Ab
ility
to
ch
ea
ply
str
en
gth
en
reso
urc
es /
ca
pa
bili
tie
s
Ab
ility
to
use
eq
uity to
str
en
gth
en
re
so
urc
es /
ca
pa
bili
tes
Ab
ility
to
ge
ne
rate
ca
pita
l fr
om
lic
en
sin
g
Ab
ility
to
se
ll to
cu
rre
nt cu
sto
me
r
ba
se
de
sp
ite
hig
he
r
fue
l co
sts
Po
rtfo
lio
Cu
sto
me
r b
ase
Fin
an
ce
Kn
ow
led
ge
Pa
ten
ts
Fa
cili
tie
s
(R&
D/m
anu
fact
uri
ng/
asse
mb
ly)
Su
pp
liers
pe
rfo
rma
nce
luxu
ry
bo
dy typ
es
Sa
les in
Eu
rop
e
Sa
les in
re
gio
ns
ou
tsid
e E
uro
pe
(str
ing
en
cy o
f)
CO
2 r
ela
ted
leg
isla
tio
n in
oth
er
reg
ion
s
Ab
ility
to
ach
ieve
eco
no
mie
s o
f sca
le
of te
ch
no
log
ies
ne
ed
ed
to
me
et E
U-
targ
et
Ava
ilab
ility
of te
st
fle
xib
ilitie
s
Ab
ility
to
be
ar
losse
s
resu
ltin
g fro
m n
ot
tra
nsfe
rrin
g c
osts
to
en
d u
se
rs
Co
mp
an
y ta
xe
s
Ab
ility
to
co
ntr
ol
co
sts
of C
O2
red
uctio
n
tech
no
log
ies
Inte
r-re
gio
na
l
tra
nsp
ort
co
sts
fo
r
ca
rs
Ab
ility
to
pu
rch
ase
CO
2 r
ed
uctio
n
co
mp
on
en
ts a
t
low
er
price
Exte
rna
litie
s
Oth
er
kn
ow
led
ge
Ab
ility
to
in
cre
ase
sa
les s
ha
re o
f lo
w
CO
2 e
mis
sio
n
ICE
Vs a
lre
ad
y in
po
rtfo
lio
Ab
ility
to
ma
nu
factu
re a
t
low
er
ma
rgin
al
co
sts
wit
hin
se
gm
en
t
co
mp
are
d to
oth
er
co
mp
etito
r(s)
Ab
ility
to
ma
nu
factu
re a
t
low
er
av
era
ge
ma
rgin
al co
sts
co
mp
are
d to
co
mp
etito
r(s)
Ab
ility
to
ma
inta
in
cu
rre
nt
cu
sto
me
rs e
ve
n
wh
en
sa
les
price
is h
igh
er
Ab
ility
to
(te
mp
ora
rily
)
ab
so
rb lo
sse
s
Ab
ility
to
se
ll p
ate
nts
Ab
ility
to
cro
ss-
su
bsid
ise
ve
hic
les
inte
r-re
gio
na
lly
Mo
no
po
ly o
f
su
pp
liers
Co
ntr
acts
with
sp
ecific
su
pp
lier(
s)
Ab
ility
to
ad
d c
ert
ain
tech
no
log
ies a
t
low
er
co
sts
Kn
ow
led
ge
of A
FV
s
Ab
ility
to
de
ve
lop
imp
rove
d IC
EV
s
an
d A
FV
s
R&
D c
ap
acity
Co
sts
of tr
an
sp
ort
+
imp
ort
ing
ca
rs to
EU
Pro
du
ct p
ort
folio
of
exis
tin
g s
up
plie
rsA
cce
ss to
re
qu
ire
d
co
mp
on
en
ts
Pro
du
ct p
ort
folio
of
alte
rna
tive
su
pp
liers
CO
2 r
ed
uctio
n
tech
no
log
ies a
lre
ad
y
ap
plie
d to
IC
EV
s
Ve
hic
les w
ith
sa
me
utilit
y v
alu
e (
an
d
targ
et)
ma
y b
e v
ery
diffe
ren
t ve
hic
les.
Ve
hic
le c
ha
racte
ristics m
ay lim
it
ap
plic
ab
ility
of te
ch
no
log
ies.
Me
an
ing
th
at co
st
cu
rve
s a
re d
iffe
ren
t
fro
m th
ose
of
co
mp
etito
rs
Co
sts
of m
ate
ria
ls
Price
of re
qu
ire
d
co
mp
on
en
ts /
ma
teria
ls
Ve
hic
le m
an
ufa
ctu
rers
sa
les in
pre
miu
m
se
gm
en
ts
sa
les in
no
n-
pre
miu
m s
eg
me
nts
Pro
fita
bili
ty o
f sa
les in
reg
ion
s o
uts
ide
EU
Pro
fita
bili
ty o
f sa
les in
Eu
rop
e
Ove
rall
pro
fita
bili
ty
Ab
ility
to
exp
loit te
st
fle
xib
ilitie
s
Will
ing
ne
ss to
exp
loit
test fle
xib
ilitie
s
Will
ing
ne
ss-t
o-p
ay/
price
ela
sticity
Fin
an
cia
l ca
pa
bili
tie
s
de
term
ine
th
e a
bili
ty o
f a
ma
nu
factu
rer
to d
eve
lop
ne
w m
od
els
in
ord
er
to
ad
ap
t th
e p
ort
folio
Exp
loitin
g fle
xib
ilitie
s le
ad
s to
ve
hic
les w
ith
lo
we
r
price
th
an
co
mp
etin
g m
od
els
fro
m o
the
r O
EM
s,
tha
t o
n p
ap
er
ha
ve
lo
w fu
el co
nsu
mp
tio
n b
ut h
ave
a
rea
l-w
orld
fu
el co
nsu
mp
tio
n th
at is
hig
he
r th
an
th
at
of co
mp
etin
g m
od
els
fro
m o
the
r O
EM
s.
Re
gio
na
l
kn
ow
led
ge
infr
astr
uctu
re(s
)
Re
gio
na
l a
va
ilab
ility
of q
ua
lifie
d s
taff
Ab
ility
to
se
ll a
t
low
er
price
s
wit
hin
se
gm
en
t
co
mp
are
d to
co
mp
etito
r(s)
Ab
ility
to
se
ll a
t
low
er
av
era
ge
price
s
co
mp
are
d to
co
mp
etito
r(s)
Re
du
ce
CO
2 in
th
e
se
gm
en
t w
he
re
ma
rgin
al co
sts
are
low
est
If p
rice
cro
ss-e
lasticitie
s o
r
pro
fit m
arg
ins a
re d
iffe
ren
t
in d
iffe
ren
t se
gm
en
ts,
the
n
cro
ss-s
ub
sid
isin
g v
eh
icle
s
in s
eg
me
nts
with
re
lative
ly
hig
h e
lasticity o
r p
rofit
ma
rgin
s is p
ossib
le.
Inte
r-re
gio
na
l
tra
nsp
ort
co
sts
fo
r
ma
teria
ls /
co
mp
on
en
ts
Imp
ort
ta
riffs
R&
D c
osts
fo
r
de
ve
lop
ing
im
pro
ve
d
ICE
Vs a
nd
AF
Vs
Incl. e
.g.
acq
uirin
g
pa
ten
ts
Sim
ilar
to c
ost o
f m
an
ufa
ctu
rin
g
this
is in
flu
en
ce
d b
y g
eo
gra
ph
ica
l
loca
tio
n o
f R
&D
fa
cili
tie
s
Am
ou
nt o
f la
bo
ur
pe
r u
nit p
rod
uct
Eq
uip
me
nt, to
ols
an
d b
uild
ing
s
Ove
rhe
ad
activitie
s
La
bo
ur
co
sts
pe
r
un
it p
rod
uct
Ca
pita
l co
sts
pe
r
un
it p
rod
uct
Ove
rhe
ad
co
sts
pe
r u
nit p
rod
uct
Re
gio
na
l w
ag
e
leve
ls
Re
gio
na
l co
st o
f
ca
pita
l
Re
gio
na
l
reg
ula
tio
ns
Re
gio
na
l co
mp
an
y
tax le
ve
ls
Ma
nu
factu
rin
g
co
sts
pe
r u
nit
pro
du
ct
Ne
ed
to
acq
uire
lice
nse
sC
ost o
f lic
en
se
s

Assessment of competitiveness impacts of post-2020 LDV CO2 regulation
Final Report Valdani Vicari & Associati (VVA), Technopolis Group (TG), Joint Institute for Innovation Policy (JIIP), TNO for DG CLIMA 86
Financial position, determining the ability to invest in the required R&D and product development
A company’s financial position influences its ability to invest in R&D and product development. From this
perspective the EU LDV CO2 legislation could be considered to have an impact on the cost competitiveness
of European OEMs if:
1. the legislation would affect the profitability of EU OEMs more than non-EU OEMs, or
2. the financial position of EU OEMs is different from that of non-EU OEMs to begin with.
1) This could occur if the legislation leads to a significant change in the costs of buying or owning a vehicle,
which would influence overall sales in the EU. For EU manufacturers, sales on the EU market generally are a
higher share of their global sales, so that changes in the volume of the EU market will more strongly affect
their profitability than that of non-EU manufacturers. This is illustrated in the right-hand side of the mindmap
displayed in Figure 16. Whether the post-2020 LDV CO2 legislation will have a negative or positive effect on
EU car sales depends on the target level and on the marginal costs for achieving that target. The
development of fuel prices also plays a role. As a target has not been proposed yet and the costs of
technologies post-2020 is still being assessed, at this point in time no conclusions can be drawn on the
likeliness or magnitude of the impact on sales volumes.
2) This could be the case if EU manufacturers have been more severely affected by the economic crisis than
their non-EU competitors. Interviewed stakeholders claim that this is the case, due to the fact that the EU
economy, and as a consequence the car market in the EU, have stagnated more strongly than in other
regions. This is confirmed by the sectorial information presented in section A2.1.3. Where other regions have
seen growing sales again since mid-2009, this is not the case for Europe. LDV sales in EU have decreased
by around 25% between 2007 and 2013. Production capacity has not been adjusted by the same amount
leading to overcapacity and reduced profitability. This has affected EU OEMs more than non-EU OEMs as
EU OEMs sell a larger share of their production in EU (see Table 28 in section A2.1.4 of Annex 2).
For the financial capabilities of companies to invest in R&D also the cost of acquiring capital are relevant. In
section A2.4 of Annex 2 it is stated that in the beginning of 2014 the cost of capital for European car
manufacturing companies was reported to be on average slightly lower than for non-European competitors.
The question is whether such a difference would still exist in the 2020-2025 timeframe.
Supplier base
If the required reductions for meeting LDV CO2 targets would be more or less the same for competing OEMs,
differences in required RD&D efforts between EU and non-EU manufacturers could in principle result from
differences in the access to suppliers that can deliver the required technologies.
Although there are strong regional relationships between OEMs and suppliers, industry stakeholders have
indicated that the automotive supply market is a global market, so that in principle all OEMs have equal
access to components that are developed and manufactured by automotive suppliers in different regions.

Assessment of competitiveness impacts of post-2020 LDV CO2 regulation
Final Report Valdani Vicari & Associati (VVA), Technopolis Group (TG), Joint Institute for Innovation Policy (JIIP), TNO for DG CLIMA 87
Ability to manufacture at competitive costs within a given segment
An OEM’s ability to manufacture more efficient ICEVs and AFVs in a cost-competitive manner is influenced
by a range of factors:
aspects of the knowledge / technology position of the OEM and its suppliers
technologies already developed or even marketed (providing experience and economies of
scale)
costs of (acquiring) licences
manufacturing costs for CO2 reducing technologies for ICEVs and AFVs
costs of materials
costs for purchasing (sub)components
cost efficiency of production facilities determined by e.g.:
o direct overhead and labour costs
o equipment and tooling costs
o other costs such as operation and maintenance of buildings
impact of economies of scale
Below for each of these factors an assessment is made of the extent to which regional differences can give
rise to differences in the compliance costs for EU and non-EU manufacturers to an extent that the relative
price ratio of their products is affected.
Technologies already developed or even marketed
In this context the question is whether EU and non-EU manufacturers have a different position in the
marketing of technologies that are relevant for meeting longer term legislative targets. Overall EU
manufacturers have a stronger position in diesel technology. On technologies such as engine down-sizing,
direct injection petrol engines, aerodynamics or lightweight materials differences are less apparent or EU
manufacturers may even be in a stronger position. For a long time Japanese manufacturers were dominant
in the supply of hybrid-electric vehicles, but more recently that appears to be changing with more and more
European manufacturers marketing (plug-in) hybrid variants of their models. Regarding full electric vehicles
non-European manufacturers currently have larger production volumes, but also here several EU OEMs
appear to be catching up quickly, so that in the context of post-2020 targets differences may be expected to
be smaller than today.
Costs of (acquiring) licences
If OEMs wish to apply technologies for CO2 reduction which are patented by other companies, there may be
costs involved for acquiring the licence to produce these technologies or for buying the patents. The other
way around, OEMs that own patents for technologies that other companies wish to apply may generate
revenue from licencing or from selling these patents. Therefore, if future CO2 legislation would require the
widespread application of technologies for which OEMs from Europe have more / less patents than non-EU
OEMs, this would have positive / negative impacts on the cost competitiveness of EU manufacturers. This
pathway strengthens the impacts of differences in technology positions.

Assessment of competitiveness impacts of post-2020 LDV CO2 regulation
Final Report Valdani Vicari & Associati (VVA), Technopolis Group (TG), Joint Institute for Innovation Policy (JIIP), TNO for DG CLIMA 88
There is evidence that the cost of patenting is significantly higher in Europe than in other regions20
, due to
the need to have patents translated and validated by a large number of national patent offices. This could
hamper EU companies in generating revenues from licensing.
Manufacturing costs for CO2 reducing technologies for ICEVs and AFVs
For components for CO2 reduction in ICEVs and for AFVs that are manufactured by OEMs themselves,
differences in the manufacturing costs for EU and non-EU OEMs depend on the efficiency of their production
facilities and on a range of factors that relate to the geographic location of their facilities. The latter include
regional differences in e.g. production labour costs and taxes as well as transport costs for bringing vehicles
produced outside the EU to European countries. Labour productivity (linked to the level of automation) and
economies of scale also come into play, as these influence the cost efficiency of production facilities. All
these factors are further explored in the paragraphs below.
The extent to which regional differences in cost factors for production can affect the overall costs of
manufacturing vehicles depends on the share of own (component) manufacturing (as opposed to assembling
purchased components), the share of vehicles manufactured outside the EU in the EU sales, and the share
of regionally different costs in the total costs of manufacturing. Concerning the make-or-buy issue with
respect to components it should be noted that currently many suppliers have production facilities close to the
car manufacturing plants to which they supply the components. For a large share of purchased components
labour cost levels will thus be similar to those in the manufacturing of the cars in which they are applied.
Geographical distribution of facilities: Impact of regional differences in cost of labour and other cost
factors
Differences between OEMs or regions with respect to labour costs or to other cost components of car
manufacturing may lead to a difference in the absolute cost of compliance for competing companies.
However, if the price increase for one manufacturer is higher than that of his competitor by the same factor
as the ratio of the prices of the two companies’ baseline products, the ratio of the prices of the two products
stays the same and cost competitiveness may be considered not significantly affected. The fact that labour
costs and other costs factors differ between regions therefore does not automatically lead to significant cost
competitiveness impacts of the EU CO2 legislation. The price ratio of competing products, however, can be
significantly affected if the ratio of the different cost components for the additional technology, added to meet
the CO2 targets, differs from that in the base product.
So if manufacturing of the technologies, required to meet EU targets, would require a higher share of labour
costs or of any other cost component than the manufacturing of the baseline vehicle, regional differences in
labour and other manufacturing cost factors could lead to cost competitiveness impacts. For many of the
technologies needed to make ICEVs more efficient this is not expected as they concern improvements of
existing components / technologies. More advanced technologies, such as electric, hybrid or fuel cell
propulsion systems or application of advanced lightweight materials, however, may require relatively more
20
See e.g. Van Pottelsberghe De La Potterie,B. & François, D. 2009, "The cost factor in patent systems", Journal of Industry, Competition and Trade, vol. 9, no. 4, pp. 329-355, and Van Pottelsberghe de la Potterie,B. & Mejer, M. 2010, "The London Agreement and the cost of patenting in Europe", European Journal of Law and Economics, vol. 29, no. 2, pp. 211-237.

Assessment of competitiveness impacts of post-2020 LDV CO2 regulation
Final Report Valdani Vicari & Associati (VVA), Technopolis Group (TG), Joint Institute for Innovation Policy (JIIP), TNO for DG CLIMA 89
labour in the manufacturing or disproportionately higher or lower tooling costs, and may thus alter the ratio of
various cost components of manufacturing.
In addition to the above regional differences in labour costs could be caused by regional differences in the
availability of labourers with specific skills required for developing and manufacturing advanced ICEVs and
AFVs or their components. This is specifically the case if there is scarcity of such skilled labourers. In general
this can be considered a temporary effect, but it could affect costs over timescales that are relevant to the
CO2 regulation.
Equipment and tooling costs and other costs such as operation and maintenance of buildings
Geographical differences in labour costs indirectly also work out on the equipment and tooling costs and
other costs such as operation and maintenance of buildings. Furthermore equipment and tooling costs are
affected by the cost of capital.
Economies of scale
The impact of economies of scale on the costs of manufacturing vehicles with CO2 reducing technologies or
AFVs depends on the total number of vehicles to which these technologies are applied. These in turn
depend on:
sales volumes in the EU market;
sales volumes of vehicles with the same technologies in markets in other regions.
For different OEMs sales volumes of specific CO2-reducing technologies on the EU market depend on:
the manufacturer specific target, which determines the need to apply various advanced technologies;
the compliance strategies of the OEMS, i.e. the choice of applied technologies and other compliance
mechanisms chosen by OEMs to meet their specific targets.
This latter aspect is a matter of choice for OEMs and can thus be considered not to lead to cost
competitiveness impacts. The first aspect relates to possible cost competitiveness aspects associated with
the shape and slope of the target function, and has been explored in detail in section 5.4.
Sales volumes of advanced technologies in other regions depend on:
sales volumes of OEMs in other regions;
whether markets in these regions are subject to CO2 regulations of similar or different stringency as the
EU LDV CO2 legislation. An overview of passenger car regulations in different regions is provided in
Figure 8 in section 4.2.
In relation to the issue of the EU having similar or different CO2 legislation compared to other regions,
attention should be paid to the question of whether and to what extent EU manufacturers will differentiate
their products for the EU market and other markets. If they do, vehicles for other markets do not require
additional technology and therefore will not be directly affected in their costs. Reduced economies of scale
due to this product differentiation, however, might have a second order impact on costs of these vehicles.
Specifically CO2 reduction measures related to weight and aerodynamics require redesign of vehicles and
production processes. This issue has not been further analysed, but monitoring the amount of product

Assessment of competitiveness impacts of post-2020 LDV CO2 regulation
Final Report Valdani Vicari & Associati (VVA), Technopolis Group (TG), Joint Institute for Innovation Policy (JIIP), TNO for DG CLIMA 90
differentiation in different markets in the coming years could be an effective instrument to assess the relative
stringency of regulatory and other demands on fuel consumption in different markets.
In as far as costs of CO2 reducing technologies and AFVs depend on the costs of components purchased
from suppliers (see paragraph below), these costs depend on economies of scales applying to these
suppliers. These not only depend on sales volumes of the OEM under consideration but also of sales
volumes of other OEMs to which the supplier supplies the components for fuel efficient ICEVs and AFVs.
Costs of materials / costs for purchasing (sub)components
Post-2020 CO2 legislation is likely to affect the demand by OEMs and suppliers for certain materials and
(sub)components. Differences in compliance costs for EU and non-EU OEMs could result from regional
differences in the costs of materials and (sub)components. Such regional differences do exist as the cost
factors affecting the costs of (producing) materials or (sub)components (e.g. the cost of energy and the cost
of labour) are different in different regions.
The market for materials and components, however, can be considered a global market, meaning that all
OEMs in principle have access to products of most or all suppliers worldwide. If that is the case only different
costs associated with transporting materials or components from the supplier to manufacturers in different
regions would effectively lead to regionally different costs for materials or components.
If CO2 legislation leads to a change in the demand for materials and (sub)components, OEMs may be
expected to adapt their supplier base in order to be able to purchase these materials and (sub)components
at competitive costs.
Width of product portfolio in the EU market – possibilities for internal averaging
As the targets set by the EU LDV CO2 legislation do not apply to individual vehicle models, but to the sales-
weighted average at the level of a manufacturer group, OEMs have a certain degree of freedom to divide
reduction efforts (i.e. the amount of CO2-reducing technologies applied to vehicles) over their models or
segments. As a result they can e.g. choose to apply less CO2 reducing technologies in market segments with
stronger price competition and more in segments where the costs of these technologies can more easily be
absorbed. OEMs with a wider product portfolio in the EU market (i.e. wider distribution of sales over different
size or market segments) have more room for that than OEMs that only sell a limited number of models in
one or a few segments of the EU market.
The comparison of sales distributions based on different definitions of what are European and non-European
manufacturers, as presented in Annex 5, suggests that overall manufacturers from different region have
similarly wide portfolios, but that EU manufacturers have a higher share of their sales in the segments of
larger (and most likely premium) car models. Combined with the fact that advanced technologies may be
easier to sell in those segments, the larger portfolio width of EU manufacturers may be considered to lead to
a positive cost competitiveness impact as it allows EU manufacturers to limit the cost increase of vehicles in
the small and medium size segments. It should be acknowledged, however, that in these segments OEMs
are competing to some degree on g/km (e.g. through CO2-differentiated taxes) and fuel economy, so that

Assessment of competitiveness impacts of post-2020 LDV CO2 regulation
Final Report Valdani Vicari & Associati (VVA), Technopolis Group (TG), Joint Institute for Innovation Policy (JIIP), TNO for DG CLIMA 91
there is limit to the extent to which they can avoid application of CO2-reducing measures in small and
medium size segments.
Ability to manufacture at competitive average costs
The overall ability of a manufacturer to manufacture vehicles meeting the CO2 target set by the European
legislation is determined by factors such as:
the ability to apply the same technologies in a large number of models in the product portfolio;
the ability to scale up production of low CO2 ICEVs and AFVs already in the product portfolio;
the width of the product portfolio in the EU market offering possibilities for cost optimisation through
division of reduction efforts over different segments;
the ability to manufacture at competitive costs in the different segments included in the product
portfolio.
Ability to apply the same technologies in a large number of models in the product portfolio
OEMs that have small sales volumes in a large number of segments may be expected to have higher
average compliance costs (and higher average production costs to begin with) than OEMs that have high
sales in a small number of segments, due to the fact that the latter achieve economies of scale by the fact
that the same technologies can be applied in a large number of models in the product portfolio.
In this respect the increasing “platform” approach can be seen as a trend that enhances the ability to apply
similar technologies in a large number of models. EU OEMs appear to be somewhat more advanced in this.
Another strategy, specifically applied in LCVs but also to some degree in cars, is “brand engineering”, where
different OEMs cooperate in developing a vehicle model. Such a model is then sold under different brand
names with sometimes minor differences in technology and small cosmetic differences to make them fit the
design language of the different brands.
Ability to scale up production of low CO2 ICEVs and AFVs already in the product portfolio
This ability relates to differences in compliance strategies between OEMs in view of the existing as well as
future legislation. Some OEMs focus on applying modest CO2 reductions to a large number of their sales
(e.g. engine down-sizing), while other OEMs market a limited amount of very low CO2-emitting vehicles (e.g.
the hybrids that have been in the portfolio of Toyota for more than 15 years now). While the latter strategy
may in the short term be expected to lead to higher average additional costs per vehicle, it does allow OEMs
to gradually achieve economies of scale and increase their production capability. This not only leads to lower
costs for technologies needed to meet longer term targets, but may also allow them to increase volumes of
these technologies more rapidly than their competitors.
It is expected that powertrain electrification, more specifically increasing levels of hybridisation, will become
more important for meeting post-2020 CO2 targets. As such Japanese OEMs may be considered to have a
competitive advantage, although, as said before, EU OEMs appear to be catching up lately specifically with
plug-in hybrid variants of their models.

Assessment of competitiveness impacts of post-2020 LDV CO2 regulation
Final Report Valdani Vicari & Associati (VVA), Technopolis Group (TG), Joint Institute for Innovation Policy (JIIP), TNO for DG CLIMA 92
Width of product portfolio in the EU market – possibilities for cost optimisation
The width of the product portfolio not only allows OEMs to adjust the amount of CO2 reducing technologies in
the various models in different segments to the ability of these segment to absorb the associated additional
manufacturing costs. As the cost curves for CO2 reduction in different segments are different, a wide product
portfolio also allows OEMs to divide CO2 reduction efforts over models / segments in such a way that
average additional manufacturer costs over the whole portfolio are minimized (see e.g. [IEEP 2007]).
Differences in the width of the product portfolio of EU and non-EU OEMs could therefore affect average
compliance costs and thus lead to cost competitiveness impacts. The comparison of sales distributions
based on different definitions of what are EU and non-EU manufacturers, as presented in Annex 5, suggests
that overall the sales distributions of manufacturers from different regions have similar width. Nevertheless
there may be subgroups of manufacturers with narrower product portfolios. From that perspective, in Europe
there appears to be a stronger division between manufacturers of mainstream, small and medium size
vehicles (e.g. Fiat, PSA, Renault and to a lesser extent GM and Ford) and manufacturers with a higher share
of larger and premium models (e.g. BMW and Mercedes), while large Asian manufacturers (Toyota,
Hyundai) appear to have more overlapping portfolios. In that sense it could be the case that many EU OEMs
have less room for cost optimal distribution of reduction efforts than the major non-EU OEMs. But this is only
likely to be a significant problem for them if they are selling at the smaller end of the market. For those OEMs
selling only at the upper end there is less of a problem to pass on costs.
EU manufacturers have a higher share of their sales in the segments of larger (and most likely premium) car
models. This should be considered as allowing them to distribute reduction efforts in a way that may not be
optimal from an average additional manufacturing cost perspective but that is optimal from a sales and
profitability perspective.
Ability to manufacture at competitive costs in the different segments included in the product
portfolio
Besides the overall mechanisms described above, the average compliance cost over the whole product
portfolio is affected by compliance costs in the different market segments.
Ability to sell at competitive prices
The ability to sell efficient ICEVs or AFVs at a competitive price in the EU market depends on a range of
factors that may differentially impact on EU and non-EU OEMs including:
the additional manufacturing costs in different segments or models;
the impact of R&D costs on vehicle costs or price;
the costs of bringing products to the market including transport costs, tariffs, distribution costs and dealer
margins;
the ability to cross-subsidize within the product portfolio;
the ability to absorb losses.

Assessment of competitiveness impacts of post-2020 LDV CO2 regulation
Final Report Valdani Vicari & Associati (VVA), Technopolis Group (TG), Joint Institute for Innovation Policy (JIIP), TNO for DG CLIMA 93
The additional manufacturing costs in different segments or models
Possible causes of regional differences in the costs of manufacturing low-CO2 ICEVs and AFVs have been
discussed above.
Impact of R&D costs on vehicle costs or price
The magnitude of the required R&D costs associated with developing products that meet the requirements of
post-2020 EU LDV CO2 legislation may be different for different OEMs. The regional aspects that may lead
to regional differences in R&D costs are the same as those discussed in relation to the impact of R&D
capacity on the ability to develop improved ICEVs and AFVs (see previous subsection).
The ways in which R&D costs can be passed through and their impact on vehicle prices may depend on (the
stringency of) CO2 legislation in other regions and the size of the sales of competing companies worldwide
and in different regions.
If European legislation is much tighter than that in other regions, OEMs need to make specific R&D
efforts for the cars they sell in Europe. The R&D costs for meeting EU LDV CO2 standards can be
considered relatively independent of the amount of cars sold in Europe. OEMs can choose to pass on
those costs to cars sold in Europe only or distribute them over their worldwide sales. In both cases
differences in sales volumes in Europe or in other regions affect the way in which additional R&D costs
may affect the prices of products of competing companies on the EU market.
If other regions have legislation of similar stringency as the EU, and if OEMs decide to pass through
R&D costs for meeting those standards only to the vehicles sold in markets where the standards apply,
the R&D costs can be divided over a larger amount of vehicles. OEMs selling cars mainly in Europe may
have a disadvantage over OEMs that also sell cars in other regions with similar legislation.
The costs of bringing products to the market including international transport costs, tariffs, local
distribution costs and dealer margins
Transport costs and tariffs depend on the location of production. For vehicles manufactured within the EU
transport costs for bringing them to the EU market are relatively low and tariffs do not apply. For non-EU
manufacturers transport costs and costs associated with tariffs will generally be higher. Information on import
tariffs for cars, vans and components in the EU and other regions are presented in Table 57 in Annex 4.
Tariffs on car and van imports to the EU are 9.7% resp. 12.3%. With 3.8% the tariff on components is much
lower, allowing EU OEMs to import components and providing an incentive for non-EU OEMs to locate
manufacturing plants in the EU. The commercial cost to transport a car from Asia to Europe is highly
dependent on many factors (such as volume, number of ports, size of cars, etc.) but a ball park figure for
larger shipments21
on existing routes would be around US$ 900. Transport costs from Europe to Asia are
about US$ 100 lower, i.e. around US$ 800. Overall the costs of bringing a car manufactured in Asia to the
EU market is 1500 Euro or higher for small to medium size cars and significantly higher for premium models.
However, transport costs are not expected to be significantly influenced by the type of technologies applied
to vehicles. Insurance costs may be somewhat higher if vehicles become more expensive due to the
21
Information obtained from industry contacts.

Assessment of competitiveness impacts of post-2020 LDV CO2 regulation
Final Report Valdani Vicari & Associati (VVA), Technopolis Group (TG), Joint Institute for Innovation Policy (JIIP), TNO for DG CLIMA 94
application of CO2 reducing measures. In terms of the effect on the price ratio of cars manufactured inside
and outside of the EU transport costs could be considered to have a small benefit in favour of cars
manufactured outside the EU, as higher fixed cost mark-ups on top of the manufacturing costs dampen the
relative impact of an absolute increase in manufacturing costs on the vehicle price. But given that transport
costs are expected to increase somewhat with the value of the car, this effect is expected to be small.
Tariffs scale with the value of the imported products, so if cars become more expensive as a result of the EU
LDV CO2 legislation, the absolute amount of tariffs paid on imported cars will increase. Overall the effect of
transport costs and tariffs is at most directly proportional to the increase in price, and therefore does not
affect the price ratio of cars manufactured inside and outside of the EU if the technology costs are the same
in both regions.
It can thus be concluded that international transport costs and tariffs do not constitute a pathway through
which European CO2 legislation can be expected to have a significant impact on cost competitiveness.
Distribution costs within EU countries and dealer margins for cars sold in Europe are determined by
conditions of the EU car market and the EU economy in general. These can therefore be considered the
same for EU and non-EU manufacturers and thus do not constitute a pathway through which European CO2
legislation can be expected to have a significant impact on cost competitiveness.
The ability to cross-subsidize within the product portfolio
The additional costs of CO2-reducing measures applied to ICEVs or of alternative propulsion technologies do
not necessarily need to be passed on one-on-one to the price of vehicles on which these technologies are
applied. OEMs can choose to divide compliance costs over their product portfolio in a way that suits the
ability of different market segments to absorb these costs. The width of an OEM’s product portfolio
determines the ability of an OEM to apply cross-subsidisation.
The ability to absorb losses
Finally OEMs can decide not to pass through all compliance costs to their customers. In that case these
costs reduce the profitability of the company. The ability of companies to (temporarily) absorb losses
depends on their financial position. This aspect is further discussed below.
Ability to sell new products to customers / maintain customer base and to pass through costs of
compliance
Differences in the consumer base of companies may mean that some OEMs can more easily sell fuel
efficient ICEVs or AFVs with alternative powertrains to their customers. Customer loyalty, perceived value of
new technologies, cost awareness and spending power of the customer base are factors that affect the
extent to which compliance costs can be passed on to consumers through increasing vehicle prices.
Theoretically, therefore, differences in customer base between EU and non-EU manufacturers might lead to
differences in their ability to pass on compliance costs to their customers. Inability to pass through costs has
a negative impact on the profitability of a company and direct and indirect impacts on its cost
competitiveness.

Assessment of competitiveness impacts of post-2020 LDV CO2 regulation
Final Report Valdani Vicari & Associati (VVA), Technopolis Group (TG), Joint Institute for Innovation Policy (JIIP), TNO for DG CLIMA 95
In as far as regional differences in the ability of OEMs to sell new products and pass through costs are
associated with them being premium or mainstream manufacturers, such differences are analysed in section
5.6. The conclusion is that premium OEMs can more easily sell new technologies to their customers. As EU
manufacturers are more strongly represented in the premium segment this would constitute a competitive
advantage for the EU industry as a whole.
Ability to invest or to absorb (temporary) losses
If an OEM complying with EU CO2 regulations requires significant investments in R&D, product development
and production facilities, these upfront costs need to be absorbed by that OEM or the technology needs to
be purchased from a supplier. The company’s financial reserves and borrowing capacity determine its ability
to make the necessary investments.
If an OEM chooses to not pass on compliance costs to customers through price increases, these costs have
to be absorbed by the OEM at the expense of profit. Absorbing losses may be necessary for a short period
of time (e.g. until sufficient cost reductions have been achieved to make the compliance costs competitive) or
during a longer period of time or because these factors contribute to brand value. Reduced profits affect a
company’s financial health and therefore have a long term effect on cost competitiveness, e.g. through a
reduced ability to invest in R&D and product development.
In stakeholder consultations it was indicated by various OEMs that the financial position of some EU OEMs
may be temporarily worse than that of non-EU OEMs for a number of reasons. The European car market
was more heavily affected by the economic crisis. EU OEMs sell a larger share of their vehicles on the EU
market and are therefore less able to compensate losses on the EU market by profits in other markets.
Ability to exploit test flexibilities
In Figure 20 the ability to exploit flexibilities in test procedures is indicated as a possible origin of cost
competitiveness impacts. Exploiting flexibilities allows OEMs to sell vehicles with lower price than competing
models from other OEMs. On paper these vehicles have low fuel consumption but their real-world fuel
consumption is higher than that of competing models from other OEMs.
The availability of test flexibilities is obviously the same for EU and non-EU OEMs as both certify their
vehicles for the EU market against the same test procedure. It is also unlikely that their abilities to exploit test
flexibilities, which would e.g. relate to knowledge of these flexibilities and the capabilities of test facilities,
would be markedly different. The willingness to exploit flexibilities, however, could be different. From
stakeholder information it is understood that some Asian manufacturers initially had reservations about
exploiting test flexibilities as the culture of their region requires them to act according to the “spirit of the law”
rather than only according to the “letter of the law”. In the context of the existing CO2 legislation and national
fiscal promotion schemes for low-CO2 vehicles this was said to create unfair competition between Asian and
European manufacturers. However, in the context of post-2020 CO2 legislation such cultural differences are
not expected to play a significant role anymore for various reasons:
First of all the WLTP will eliminate some and reduce other flexibilities that exist in the NEDC;

Assessment of competitiveness impacts of post-2020 LDV CO2 regulation
Final Report Valdani Vicari & Associati (VVA), Technopolis Group (TG), Joint Institute for Innovation Policy (JIIP), TNO for DG CLIMA 96
Secondly, more recently various investigations into the increasing difference between real-world and
type approval CO2 emissions (as e.g. summarized in [ICCT 2014]) indicate that utilisation of test
flexibilities is no longer mainly seen in the eco-models of companies but across the complete model
portfolio of manufacturers and that it is also applied by OEMs from different regions.
Overall therefore test flexibilities are not considered to create a pathway for cost competitiveness impacts.
Summary of possible cost competitiveness impacts associated with regional differences in
resources and resulting capabilities
Table 6 provides a summary of possible cost competitiveness impacts on automotive manufacturers
associated with regional differences in resources and resulting capabilities as analysed above. From the
overview it is clear that for many capabilities and resources regional differences are expected to lead to likely
or possible impacts on the cost competitiveness of EU vs. non-EU car manufacturers. The size and sign of
the expected effects are different for different capabilities and resources, meaning that is not possible to
draw a conclusion on the overall net effect.
Table 6 - Summary of possible cost competitiveness impacts on EU automotive manufacturers associated with regional differences in resources and resulting capabilities
Capability Resource Impact Comments / questions
Ability to
develop
improved
ICEVs and
AFVs
R&D capacity Yes - Stakeholders foresee a shortage in the EU of R&D
personnel with the skills needed for technologies that are
necessary to meet post-2020 CO2 targets, specifically those
related to electric powertrains.
Patent position Yes - Non-EU OEMs have a stronger patent position in
technologies for electric and hybrid vehicles.
Financial position Yes - Profitability and financial position of some EU OEMs was
more strongly affected by economic crisis than of non-EU
OEMs
Supplier base Maybe ? EU suppliers have stronger focus on diesel technology.
But OEMs can source components globally.
Ability to
manufacture
at competitive
costs within
segment
Technologies
already developed
Yes - Japanese OEMs already have a higher share of AFV
technologies. But EU OEMs are catching up.
Cost of licences Yes +/- If future CO2 legislation would require the widespread
application of technologies for which OEMs from Europe
have more / less patents than non-EU OEMs, this would
have positive / negative impacts on the cost
competitiveness of EU manufacturers.
This pathway strengthens the impacts of differences in
technology positions.
Labour costs Maybe ? There are large regional differences in labour costs. But
these only impact cost competitiveness if the share of
labour costs in car manufacturing changes as a result of
compliance strategies for meeting CO2 targets.

Assessment of competitiveness impacts of post-2020 LDV CO2 regulation
Final Report Valdani Vicari & Associati (VVA), Technopolis Group (TG), Joint Institute for Innovation Policy (JIIP), TNO for DG CLIMA 97
Capability Resource Impact Comments / questions
o This may be the case if the targets require
significant shares of AFVs or e.g. application of
light-weight composites.
Equipment and
tooling costs
Maybe ? Possible impacts partly related to economies of scale (see
below)
Economies of
scale
Maybe ? Depending on sales volumes on EU and non-EU markets,
slope of the target function in EU legislation, and on
stringency of CO2 legislation in EU and other regions.
Cost of materials
and
(sub)components
Maybe
(small)
? Regional differences in costs of materials that need to be
sourced regionally.
Different transport costs for materials that can be sourced
globally.
Ability to optimize
division of
reduction efforts
over product
portfolio
Yes
(small)
+ Some EU manufacturers may be able to keep additional
costs for small vehicles lower through lower CO2 reductions
as these can be compensated in larger and premium
models.
Ability to
manufacture
at competitive
average costs
Ability to supply
same technology
in large number of
models
Yes + Possible advantage for EU OEMs due to advanced platform
approach
Ability to scale up
production of
existing advanced
ICEVs and AFVs
Yes - Japanese OEMs already have a higher share of hybrid
technologies. But EU OEMs are catching up.
Ability to optimize
division of
reduction efforts
over product
portfolio
Maybe ? Overall portfolio width is similar for OEMs for different
regions.
But some EU OEMs have focus on either cheap volume
models or premium models, with the latter posing less of
problem than the first.
Ability to sell
at competitive
prices
Additional
manufacturing
costs
Maybe ? see above
Impact of R&D
costs on price
Maybe ? Depending on whether EU target is more stringent or not
the impact on the cost competitiveness of EU OEMs may
be positive or negative.
o Relates to the amount of vehicles over which R&D
costs associated with CO2 legislation can be
divided.
o Positive impact expected if EU legislation is more
stringent.
Costs of bringing
products to the
market
No Small effects possible, but net effect considered not
significant.

Assessment of competitiveness impacts of post-2020 LDV CO2 regulation
Final Report Valdani Vicari & Associati (VVA), Technopolis Group (TG), Joint Institute for Innovation Policy (JIIP), TNO for DG CLIMA 98
Capability Resource Impact Comments / questions
Ability to cross-
subsidize within
portfolio
Maybe ? Overall portfolio width is similar for OEMs for different
regions.
But some EU OEMs have focus on either cheap volume
models or premium models, with the latter posing less of
problem than the first..
Ability to absorb
losses
Yes - Related to financial position of European OEMs; see below
Ability to sell
new products /
maintain
customer base
Product portfolio Yes + Possible positive impact for EU car industry:
o New technologies can more easily be marketed in
premium segments.
o Some EU OEMs have stronger position in
premium segments.
Ability to
absorb losses
Financial position Yes - Profitability and financial position of EU OEMs was more
strongly affected by economic crisis than of non-EU OEMs
Ability to
exploit test
flexibilities
No Options available to and exploited by all OEMs.
5.6 Impacts on premium vs. volume manufacturers
As indicated in the previous section certain abilities of a manufacturer, e.g. the ability to market CO2-reducing
technologies or the ability to absorb (temporary) losses could be correlated to whether or not a significant
share of the manufacturer group’s or OEM’s sales consists of premium brands or premium models. This
aspect was also an important input from interactions with stakeholders.
Competiveness impacts on the EU car industry associated with the issue of premium vs. volume
manufacturers may occur if EU and non-EU manufacturers have significantly different market shares in
volume and premium segments. Data on this are provided in section 3.1 Conclusions that can be drawn from
that information are that:
all premium OEMs on the EU market are EU manufacturers (BMW + Daimler + Volvo +Jaguar Land
Rover), based on their ACEA membership and location of production in the EU (Jaguar Land Rover and
Volvo are owned by non-EU companies but vehicles are mainly manufactured in EU);
7 manufacturer groups (Ford, General Motors, Hyundai, Nissan, PSA, Renault and Toyota) out of the 12
considered have a very similar positioning with respect to price and weight and can be considered
volume manufacturers;
Volkswagen combines premium and volume brands.
From the above it is clear that European car manufacturers have a higher share in the sales of vehicles in
premium segments on the EU market.
Figure 21 and Figure 22 explore possible mechanisms through which the post-2020 EU LDV CO2 regulation
may have different impacts on premium manufacturers and volume / mainstream manufacturers (i.e. OEMs
without (a significant share of) premium models in their sales portfolio and focussing on affordable vehicles

Assessment of competitiveness impacts of post-2020 LDV CO2 regulation
Final Report Valdani Vicari & Associati (VVA), Technopolis Group (TG), Joint Institute for Innovation Policy (JIIP), TNO for DG CLIMA 99
produced in large volumes). It is clear from these graphs that besides characteristics of the different types of
OEMs with respect to portfolio, customer base and financial capabilities also the target setting, both target
level (relative to that in other regions) and the slope of a utility-based target function, plays a role in the way
in which the legislation might lead to different cost competitiveness impacts for premium and volume
manufacturers:
A relatively stringent EU target, compared to other regions, is likely to create some competitive
advantage for EU OEMs due to their higher market share in the EU and the resulting stronger
economies of scale for the applied CO2-reducing technologies. Premium brands may be better placed to
deal with a stringent target. Premium brands tend to be more profitable and have a more loyal customer
base with a high willingness to pay for advanced technologies. European premium brands are also quite
successful and thus profitable in foreign markets.
A flatter slope requires a relatively larger reduction effort for premium manufacturers as premium cars
are on generally larger, more performant and more luxuriously equipped than volume and mainstream
models. This larger reduction effort, and the resulting higher compliance costs may to some extent
counteract the advantages that premium brands may have with respect to their ability to sell vehicles
with advanced and more costly CO2-reducing technologies.
Figure 21 shows that the cost competitiveness of EU premium brands relative to non-EU premium brands,
EU volume brands as well as non-EU volume brands is determined by the net impact of several factors with
opposite signs:
In the case of competition with non-EU premium brands the EU premium brands have the advantage of
stronger economies of scale for CO2-reducing technologies due to their higher sales volumes on the EU
market. This would be further amplified if the EU target is more stringent than targets in other regions.
This effect, however, is counteracted by e.g. the generally higher labour costs in the EU compared to
other regions. Overall the net effect may be positive, based on the observation that the higher labour
costs are not hindering EU premium brands to be successful in the US and Asian markets;
In the case of competition with EU volume manufacturers EU premium brands may be negatively
affected by higher costs for CO2 reducing technologies due to lower overall sales volumes. This,
however, is counteracted by their stronger financial position and the ability to cross-subsidize the costs
of CO2 reduction in volume modules from the higher margins on premium models. Overall their appears
to be a real possibility that EU premium manufacturers win market share from EU volume brands as a
result of EU CO2 legislation. This effect would be smaller if the slope of the target function is flat;
A similar situation of counteracting effects applies to the competition between EU premium brands and
non-EU volume brands. In that case, however, the higher labour costs for EU OEMs mean that if the net
effect is positive or negative, it is correspondingly smaller or larger than for competition with EU volume
manufacturers.

Assessment of competitiveness impacts of post-2020 LDV CO2 regulation
Final Report Valdani Vicari & Associati (VVA), Technopolis Group (TG), Joint Institute for Innovation Policy (JIIP), TNO for DG CLIMA 100
Figure 21 – Possible cost competitiveness impacts on premium manufacturers
EU
pre
miu
m
ma
nu
fac
ture
rs
hig
he
r ave
rag
e
ma
rgin
al c
osts
tha
n v
olu
me
ma
nu
factu
rers
Cu
sto
me
rs
Po
rtfolio
rela
tive
ly s
tring
en
t
targ
et c
om
pa
red
to
vo
lum
e
ma
nu
factu
rers
ave
rag
e m
ass
ab
ove
EU
ave
rag
e
willin
gn
ess to
pa
y:
hig
h
acce
pta
nce
of n
ew
tech
no
log
y: h
igh
bra
nd
loya
lty: h
igh
hig
h a
bility
to p
ass
thro
ug
h c
osts
to
cu
sto
me
rsa
bility
to c
ross
su
bsid
ize
be
twe
en
pre
miu
m a
nd
ma
instre
am
mo
de
ls
hig
h v
olu
me
of
pre
miu
m m
od
els
low
vo
lum
e o
f
ma
instre
am
mo
de
ls
hig
he
r po
we
r-to-
we
igh
t ratio
with
no
n-E
U
pre
miu
m
ma
nu
fac
ture
rs
with
EU
vo
lum
e
ma
nu
factu
rers
with
no
n-E
U
vo
lum
e
ma
nu
factu
rers
EU
ma
nu
factu
rers
ha
ve
hig
he
r
vo
lum
es o
n E
U
ma
rke
t
EU
ma
nu
factu
rers
ha
ve
mo
re
eco
no
my o
f sca
le
for C
O2 -re
du
cin
g
me
asu
res
EU
ma
nu
factu
rers
ha
ve
hig
he
r lab
ou
r
co
sts
pre
miu
m
ma
nu
factu
rers
ha
ve
low
er
vo
lum
es
pre
miu
m
ma
nu
factu
rers
ha
ve
less
eco
no
my o
f sca
le
for C
O2 -re
du
cin
g
me
asu
res
hig
he
r tech
no
log
y c
osts
for C
O2 -re
du
cin
g
me
asu
res to
ma
instre
am
ve
hic
les c
om
pa
red
to
EU
vo
lum
e
ma
nu
factu
rers
wh
at is
ne
t effe
ct o
n
co
mp
etitio
n w
ith
EU
vo
lum
e
ma
nu
fac
ture
rs?
pre
miu
m
ma
nu
factu
rers
ha
ve
low
er
vo
lum
es
EU
ma
nu
factu
rers
ha
ve
hig
he
r lab
ou
r
co
sts
pre
miu
m
ma
nu
factu
rers
ha
ve
less
eco
no
my o
f sca
le
for C
O2 -re
du
cin
g
me
asu
res
hig
he
r tech
no
log
y c
osts
for C
O2 -re
du
cin
g
me
asu
res to
ma
instre
am
ve
hic
les c
om
pa
red
to
no
n-E
U v
olu
me
ma
nu
factu
rers
wh
at is
ne
t effe
ct
on
co
mp
etitio
n
with
no
n-E
U v
olu
me
ma
nu
fac
ture
rs?
Po
ssib
le p
os
itive
effe
ct
on
co
st c
om
pe
titive
ne
ss o
f
EU
pre
miu
m m
an
ufa
ctu
rers
co
mp
are
d
to n
on-E
U p
rem
ium
ma
nu
factu
rers
Po
ssib
le p
os
itive
effe
ct:
Pre
miu
m m
an
ufa
ctu
rers
co
uld
win
ma
rke
t sh
are
from
vo
lum
e
ma
nu
factu
rers
limite
d im
pa
ct o
n
pro
fitab
ility
sig
nific
an
t sa
les in
oth
er re
gio
ns
hig
h p
rofits
in
oth
er re
gio
ns
Fin
an
cia
l
ca
pa
bilitie
sp
rofita
ble
on
EU
ma
rke
t de
sp
ite
eco
no
mic
cris
is
stro
ng
ab
ility to
ab
so
rb c
osts
/
losse
s
Ju
dg
em
en
t ba
se
d o
n
ap
pa
ren
t su
cce
ss o
f EU
pre
miu
m m
an
ufa
ctu
rers
on
fore
ign
ma
rke
ts w
ith
low
er la
bo
ur c
osts
wh
at is
ne
t effe
ct o
n
co
mp
etitio
n w
ith
no
n-E
U p
rem
ium
ma
nu
fac
ture
rs?
If ne
t effe
ct is
po
sitiv
e / n
eg
ativ
e it is
sm
alle
r / larg
er th
an
for c
om
pe
tition
with
EU
vo
lum
e m
an
ufa
ctu
rers
Co
mp
etitio
n
Ju
dg
em
en
t ba
se
d
on
sta
ke
ho
lde
r
inp
uts
If cu
rren
t
situ
atio
n w
ith
rela
tive
ly fla
t
slo
p is
co
ntin
ue
d
Siz
e o
f effe
ct
sm
alle
r/larg
er if
slo
pe
of ta
rge
t
fun
ctio
n is
flat/
ste
ep
.

Assessment of competitiveness impacts of post-2020 LDV CO2 regulation
Final Report Valdani Vicari & Associati (VVA), Technopolis Group (TG), Joint Institute for Innovation Policy (JIIP), TNO for DG CLIMA 101
Figure 22 – Possible cost competitiveness impacts on European mainstream manufacturers
If c
urr
en
t
situ
atio
n w
ith
rela
tive
ly fla
t
slo
p is c
on
tin
ue
d
EU
vo
lum
e
ma
nu
fac
ture
rs
low
er
ave
rag
e
ma
rgin
al co
sts
tha
n p
rem
ium
ma
nu
factu
rers
Cu
sto
me
rs
Po
rtfo
lio
rela
tive
ly le
nie
nt
targ
et co
mp
are
d to
pre
miu
m
ma
nu
factu
rers
ave
rag
e m
ass
be
low
EU
ave
rag
e
will
ing
ne
ss to
pa
y:
low
acce
pta
nce
of n
ew
tech
no
log
y: lo
w
bra
nd
lo
ya
lty: lo
w
low
ab
ility
to
pa
ss
thro
ug
h c
osts
to
cu
sto
me
rs
vo
lum
e m
an
ufa
ctu
rers
ha
ve
lim
ite
d
ab
ility
to
cro
ss s
ub
sid
ize
be
twe
en
pre
miu
m a
nd
vo
lum
e m
od
els
low
vo
lum
e o
f
pre
miu
m m
od
els
hig
h v
olu
me
of
ma
instr
ea
m
mo
de
ls
low
er
po
we
r-to
-
we
igh
t ra
tio
wit
h n
on
-EU
vo
lum
e
ma
nu
fac
ture
rs
with
EU
an
d n
on
-
EU
pre
miu
m
ma
nu
factu
rers
EU
ma
nu
factu
rers
ha
ve
hig
he
r
vo
lum
es o
n E
U
ma
rke
t
EU
ma
nu
factu
rers
ha
ve
mo
re
eco
no
my o
f sca
le
EU
ma
nu
factu
rers
ha
ve
hig
he
r la
bo
ur
co
sts
pre
miu
m
ma
nu
factu
rers
ha
ve
low
er
vo
lum
es in
ma
instr
ea
m m
ark
et
pre
miu
m m
an
ufa
ctu
rers
ca
n c
ross
su
bsid
ize
vo
lum
e m
od
els
fro
m
pro
fits
in
pre
miu
m m
ark
et
pre
miu
m
ma
nu
factu
rers
ha
ve
le
ss
eco
no
my o
f sca
lew
ha
t is
ne
t e
ffe
ct o
n
co
mp
etitio
n w
ith
pre
miu
m
ma
nu
fac
ture
rs?
wh
at is
ne
t e
ffe
ct o
n
co
mp
etitio
n w
ith
no
n-E
U v
olu
me
ma
nu
fac
ture
rs?
Effe
ct m
ay b
e
po
sit
ive
/ne
ga
tiv
e if E
U
targ
et is
mo
re/le
ss
str
ing
en
t th
an
ta
rge
ts in
oth
er
reg
ion
s
Po
ssib
le n
eg
ati
ve e
ffe
ct:
EU
ma
instr
ea
m
ma
nu
factu
rers
co
uld
lo
se
ma
rke
t sh
are
to
pre
miu
m
ma
nu
factu
rers
low
sa
les in
oth
er
reg
ion
s
low
pro
fits
in
oth
er
reg
ion
s
Fin
an
cia
l
ca
pa
bilit
ies
losse
s o
n E
U
ma
rke
t d
ue
to
eco
no
mic
crisis
limite
d a
bili
ty to
ab
so
rb c
osts
/
losse
s
str
on
g im
pa
ct o
n
pro
fita
bili
ty
no
n-E
U m
an
ufa
ctu
rers
ma
y b
e in
be
tte
r p
ositio
n to
ab
orb
co
sts
/ lo
sse
s
Co
mp
eti
tio
n
Sig
n a
nd
siz
e o
f n
et
effe
ct d
ep
en
d o
n
rela
tive
str
ing
en
cy o
f
EU
ta
rge
t
pre
miu
m
ma
nu
factu
rers
ha
ve
mo
re s
trin
ge
nt ta
rge
t
pre
miu
m
ma
nu
factu
rers
ha
ve
hig
he
r
ma
rgin
al co
sts
Siz
e o
f e
ffe
ct
sm
alle
r/la
rge
r
if s
lop
e o
f
targ
et fu
nctio
n
is fla
t/ste
ep
.

Assessment of competitiveness impacts of post-2020 LDV CO2 regulation
Final Report Valdani Vicari & Associati (VVA), Technopolis Group (TG), Joint Institute for Innovation Policy (JIIP), TNO for DG CLIMA 102
As indicated in Figure 22 such counteracting pathways also play a role in the competition between EU
volume manufacturers and non-EU volume manufacturers and between EU and non-EU premium
manufacturers:
In the competition between EU and non-EU volume manufacturers the positive pathway related to
stronger economies of scale for EU manufacturers in applying technologies to meet the EU target is
counteracted by negative pathways associated with higher labour costs in the EU, the (current) worse
financial state of various EU OEMs, and their limited ability to compensate losses on the EU market by
profits in other markets. The size and sign of the net effect is probably strongly dependent on the relative
stringency of the EU target compared to other regions.
For the same reasons as explained above EU volume manufacturers could possibly lose market share to
EU (and non-EU) premium brands as a result of EU CO2 legislation, with the sign of the effect depending
on the slope of the target function.
Overall the analysis in Figure 21 indicates that EU premium manufacturers might benefit from post-2020 EU
legislation, and could win market shares not only from competing non-EU premium manufacturers but also
from competing premium models of mainstream manufacturers. The latter results from the fact that volume
and mainstream manufacturers may not be able to reduce CO2 emissions in their premium models as easily
as premium manufacturers may be able to.
What is also clear from this analysis is that the financial health of EU manufacturers plays a strong role in
estimating the net cost competitiveness impact. From stakeholder inputs it appears that the financial position
of some EU manufacturers, specifically those with volume brands, is currently more heavily affected than
that of non-EU OEMs, due to the strong impacts of the economic crisis on the European car markets. The
extent that this remains valid in the coming years is uncertain.
5.7 Impact of timing of the legislation on competiveness
For an individual OEM the cost of compliance with future CO2 targets not only depends on average costs of
technologies, but also on the speed with which the OEMs needs to develop and implement these new
technologies. A short lead time between announcement of the legislation and the target year or
incompatibility of the timing of the legislation (target year) with the model cycles of an OEM will lead to higher
costs of compliance. The first aspect, however, is expected to work out the same for all OEMs and is not
depending on whether they are EU or non-EU OEMs. The second aspect will be different for different OEMs,
but as the timing of model cycles is different for different models and generally not aligned between
manufacturers from the same region there is no reason to assume that there will be regional differences in
the extent to which the timing of the legislation is compatible with model cycles.
Timing of the legislation may lead to cost competitiveness impacts in an indirect way. If a short lead time
between announcement of the legislation and the target year leads to higher costs of compliance some
OEMs may be better able to deal with these higher costs than others, depending on their financial position.

Assessment of competitiveness impacts of post-2020 LDV CO2 regulation
Final Report Valdani Vicari & Associati (VVA), Technopolis Group (TG), Joint Institute for Innovation Policy (JIIP), TNO for DG CLIMA 103
5.8 Options available to OEMs to counteract cost competitiveness impacts of EU
LDV CO2 regulation
It should be noted that identified possible pathways for cost competitiveness impacts do not necessarily
need to lead to actual impacts as OEMs may have means to counteract these impacts.
If an OEM would be faced with disproportionately higher costs (compared to its competitors) for
manufacturing vehicles that meet EU targets, the following options are available for reducing these costs:
Improve the technology position by investing in specific R&D or acquiring patents;
Engage in strategic alliances with other OEMs to cooperate on technical developments or on the
development and manufacturing of new vehicle models;
Reduce manufacturing costs by increasing efficiency of existing plants or by relocating manufacturing
e.g. to regions with lower labour costs or from outside EU to inside EU to avoid transport costs and
tariffs;
Seek price reductions from suppliers or purchase components from suppliers with lower prices, e.g. as a
result of manufacturing in lower wage countries inside or outside the EU;
Make use of modalities that increase the flexibility of the legislation (e.g. pooling targets) to (temporarily)
reduce the costs of compliance.
5.9 Conclusions on cost competitiveness impacts from the automotive
manufacturer perspective
Assessing cost competitiveness impacts on OEMs requires identifying whether and how the European post-
2020 LDV CO2 legislation could lead to:
different levels of stringency of the targets imposed on European and non-European OEMs;
differences in the costs for European and non-European OEMs of complying with similar targets, which
in turn may be the result of:
o European and non-European OEMs choosing different compliance mechanisms with different cost
implications to meet similar targets;
o costs of similar compliance mechanisms being different for European vs. non-European OEMs.
In view of the second aspect the essential question is whether cost curves for efficiency improvement in
ICEVs and costs of manufacturing AFVs are different for EU and non-EU manufacturers. This question is
difficult to answer quantitatively, but in this chapter possible origins for cost differences have been explored
with the help of qualitative and quantitative sectorial information.
From an analysis of ways in which the regulation may affect the price and quality of products the following
things can be concluded:
Specific targets for manufacturers are affected by various aspects of the regulation;
For meeting a given target a large number of compliance mechanisms is available;
The costs for implementing these compliance mechanisms are determined by a large number of factors.
As a result of this there are a myriad of possible impact pathways that might have negative as well as
positive impacts on the cost competitiveness of EU manufacturers. This makes it appear less likely that the
post 2020 EU LDV CO2 regulation as a whole would lead to net impacts on cost competitiveness of EU

Assessment of competitiveness impacts of post-2020 LDV CO2 regulation
Final Report Valdani Vicari & Associati (VVA), Technopolis Group (TG), Joint Institute for Innovation Policy (JIIP), TNO for DG CLIMA 104
manufacturers. Nevertheless choices with respect to specific elements of the legislation could enhance the
possibility of specific cost competitiveness impacts occurring. For that reason first an assessment was made
of the general consequences of different aspects (modalities) of the legislation on the cost competitiveness
of EU vs. non-EU OEMs.
The modalities as such do not directly lead to pronounced cost competitiveness impacts. However, for
various modalities it is possible that they lead to, or at least contribute to small indirect cost competitiveness
impacts depending how they are implemented in combination with specifics of the market (e.g. positions of
EU and non-EU manufacturers in terms of sales distribution):
The target level strongly determines the extent to which costs differences for similar technologies
between EU and non-EU OEMs affect their cost competitiveness. Whether the EU target is more or less
strict than that in other regions, together with the market shares of EU and non-EU OEMs on the EU and
other markets, determines economies of scale for CO2 reducing technologies (a more stringent target
leads to a cost competitiveness improvement for EU OEMs);
If sales distributions over different vehicle segments are different for EU and non-EU OEMs, the utility
parameter and the shape and slope of the target function determine the relative (average) stringency of
targets for these groups of OEMs. For footprint as utility parameter choices with respect to the shape
and slope of the target function are less likely to lead to impacts on cost competitiveness. Overall, from
an EU vs. non-EU perspective sales distributions and average utility values are not very different, so that
impacts associated with a future sloped target function are expected to be relatively small;
Other modalities, such as a joint legislative target for cars and vans, mileage weighting, super–credits,
eco-innovations, pooling and trading may lead to different abilities for EU and non-EU OEMs to meet
their targets and might thus affect cost competitiveness.
Resources of OEMs, defined by their financial position, knowledge position, facilities for R&D and
manufacturing, supplier base and their product portfolio and customer base determine their capability to
implement compliance mechanisms for meeting future CO2 targets. An analysis of possible regional
differences in these resources and capabilities, based on a qualitative analysis augmented with data
collected in chapter 3, Annex 2 and input from stakeholder consultation, revealed the following possible
impacts:
The capability of European OEMs to develop advanced ICEVs and AFVs may at present be less than
that of non-EU OEMs, especially if powertrain electrification becomes an important compliance
mechanism. Origins for this are the fact that the financial position of EU OEMs has been more heavily
affected by the economic crisis than that of non-EU OEMs, EU OEMs have focussed on diesel
technology rather than hybrid or electric propulsion and a possible shortage of skilled R&D personnel;
With respect to the ability to manufacture vehicles with CO2-reducing technologies at competitive costs,
various cost factors might lead to cost competitiveness impacts but for most of them the likelihood, sign
and size of these impacts are difficult to judge. Japanese OEMs appear in a better position to scale up
production of electric and hybrid vehicles and to benefit from their lead in this technology, but EU OEMs
are catching up fast. EU OEMs may have a possible advantage to achieve cost reductions for integration
of different powertrains due their advanced platform approach;

Assessment of competitiveness impacts of post-2020 LDV CO2 regulation
Final Report Valdani Vicari & Associati (VVA), Technopolis Group (TG), Joint Institute for Innovation Policy (JIIP), TNO for DG CLIMA 105
The ability to sell at competitive prices is not only determined by the additional costs of manufacturing
vehicles with CO2-reducing technologies, but also by e.g. the amount of R&D costs to be earned back
per vehicle, the ability to cross-subsidize within the product portfolio, and the ability to absorb losses.
Concerning the latter the current financial position of EU OEMs, if continued over the next years, could
cause negative cost competitiveness impacts;
The ability to sell vehicles with new technologies on the EU market seems better for (some) EU OEMs
due to their stronger position in premium segments of the market. Concerning the latter, stakeholder
inputs as well as a decomposition of pathways seems to suggest that whether an OEM is a premium or
volume manufacturer may be a stronger determinant for its ability to deal with the impacts of CO2
legislation than whether it is European or not.
Timing of the legislation, specifically the lead time between announcement of the target and the target
year is expected to affect these impacts. A shorter lead time leads to higher costs for developing and
marketing new technologies, which are more difficult to bear for OEMs with a less strong financial
position.

Assessment of competitiveness impacts of post-2020 LDV CO2 regulation
Final Report Valdani Vicari & Associati (VVA), Technopolis Group (TG), Joint Institute for Innovation Policy (JIIP), TNO for DG CLIMA 106
Assessment of competitiveness impacts of post-2020 LDV CO2 regulation
Final Report Valdani Vicari & Associati (VVA), Technopolis Group (TG), Joint Institute for Innovation Policy (JIIP), TNO for DG CLIMA 107
6. Impacts on cost competitiveness: the automotive manufacturing
perspective
6.1 Introduction
For the case of cost competitiveness impacts on EU car manufacturing the focus is on identifying possible
impacts of the LDV CO2 legislation on the cost of manufacturing or the cost of doing business. This analysis
starts with an assessment of possible impacts of the legislation on the various cost components that
determine the cost of doing business, such as the cost of labour and the cost of capital.
The main cost components that determine the costs of manufacturing cars are:
material costs
costs of purchased components
labour costs
capital costs (machines, tooling, etc.)
costs of overheads:
o management
o marketing
o logistics
o R&D
The cost competitiveness of EU car manufacturing is determined by the total average costs of manufacturing
per unit of production in the EU compared to those in other regions.
The total cost ratio between manufacturing in the EU and other regions may change as a result of the EU
LDV CO2 legislation:
if one or more cost factors change as a result of the LDV CO2 legislation and this change is different in
the EU than in other regions;
if application of new technologies or other activities needed to comply with LDV CO2 legislation affect the
shares of different cost factors in the total production costs, and if the ratio of these cost factors for EU
vs. other regions are significantly different. This could e.g. be the case if new components require more
labour and less mechanized production and labour costs in the EU differ strongly from those in other
regions.
In determining impacts of the EU LDV CO2 legislation on the various costs factors and subsequent cost
competitiveness impact pathways a distinction can be made in different types of impacts on cost factors:
Direct impacts:
o Does the regulation directly affect a cost factor per unit used?
Examples of such direct impacts from other types of policy instruments are a change in
cost of labour due to stricter labour conditions or higher taxes, or a change in price of
steel due to higher production costs as a result of environmental regulation for industry
or higher energy prices.

Assessment of competitiveness impacts of post-2020 LDV CO2 regulation
Final Report Valdani Vicari & Associati (VVA), Technopolis Group (TG), Joint Institute for Innovation Policy (JIIP), TNO for DG CLIMA 108
In general LDV CO2 legislation is not expected to have such direct impacts as the
legislation is targeted at the CO2 performance of cars and not at factors that determine
the costs of producing cars or their components.
Indirect impacts:
o 1st order:
Does the regulation affect the amount of units used? E.g. does it require more/less
labour or steel to be used per car?
Does it require other types of a certain unit to be used leading to other costs? E.g. does
it require electrical engineers instead of mechanical engineers or lightweight materials
instead of steel? And are costs of these other types of units higher/lower?
In both of these cases the cost competitiveness of the EU automotive manufacturing
industry may be affected if there is a strong difference between costs per unit for these
production factors in Europe and in other regions.
o 2nd
order:
Does the regulation indirectly affect a cost factor per unit used? E.g. an increase in the
price of certain types of labour, materials or components due to (temporary) scarcity as
a result of supply not being able to meet the growing demand caused by new regulation.
In this case the cost competitiveness of the EU automotive manufacturing industry may
be affected if such 2nd
order effects occur to different extents in different regions.
6.2 Identification of possible pathways for cost competitiveness impacts on EU
car manufacturing
A mindmap of impact pathways of post-2020 LDV CO2 legislation on the cost competitiveness of EU car
manufacturing is presented in Figure 23.
As can be seen from Figure 23 only a limited number of pathways seem to result in likely impacts on cost
competitiveness of EU car manufacturing, and in those cases impacts generally seem positive, i.e. that the
cost competitiveness of EU manufacturing might improve. Conclusions seem to be quite generic and the
same for the car and van regulation. Also they do not seem to depend very much on the target level or the
choice of modalities.
Below the different cost factors and associated possible pathways for cost competitiveness impacts are
discussed using a list of questions. These refer to the pathways shown across the mind map from left to right
and in order from top to bottom.
Does post-2020 EU LDV CO2 regulation lead to regionally different impacts related to the cost of
materials?
Not directly. The regulation does not directly affect the cost of materials per unit of material as it applies
to vehicles and not to factors that determine the costs of material production.
Indirectly the costs of materials as a share in the total costs of manufacturing can be affected along two
pathways:

Assessment of competitiveness impacts of post-2020 LDV CO2 regulation
Final Report Valdani Vicari & Associati (VVA), Technopolis Group (TG), Joint Institute for Innovation Policy (JIIP), TNO for DG CLIMA 109
The legislation will change demand for existing materials. Also it may lead to demand for new
materials (e.g. for electric propulsion components or light-weight bodies) which may be more
expensive per vehicle than steel and other currently used materials.
The impact depends on whether EU OEMs (need to) source these materials from within the EU
or from a global market:
o For materials that are sourced regionally there may be different costs in different regions
due to differences in e.g. labour and energy costs for producing these materials or
transport costs for raw materials. This may lead to a cost competitiveness impact for EU
manufacturing but the sign and size of the effect cannot be determined at this stage as it
requires detailed information on the exact materials that are affected, the costs of
producing these materials in different regions and on whether or not EU manufacturers
have the opportunity to select suppliers from outside the EU if production of these
materials would be more expensive in the EU. Overall, however, the effect is expected
to be small as for many materials there is a global market with a global price.
o For materials that are sourced globally (i.e. for which there is a global market), OEMs
have the freedom to purchase these materials from regions where costs are lowest. Also
all OEMs in principle have equal access to the suppliers of these materials. As a result
no cost difference is expected for car manufacturing in different regions except for
possible differences in transport costs. This, however, is expected to be a small factor.
Indirect effects may also come from price increases due to (temporary) scarcity of materials
resulting from production capacity not being able to match the increased demand.
o This impact pathway is considered to be unlikely as:
for many materials that are relevant to advanced ICEVs and AFVs the
production is already being scaled up in the EU and other regions;
due to large number of compliance strategies dependence on limited number of
materials is unlikely;
for now it foreseen that the date of announcement of the post-2020 legislation
gives enough lead time to the target year.

Assessment of competitiveness impacts of post-2020 LDV CO2 regulation
Final Report Valdani Vicari & Associati (VVA), Technopolis Group (TG), Joint Institute for Innovation Policy (JIIP), TNO for DG CLIMA 110
Figure 23 – Overview impact pathways on cost competitiveness of EU car manufacturing
Do different cost elements per unit production increase or decrease more in EU
than in other regions to the extent that they affect the cost ratio of cars
manufactured in the EU and in other regions?
material
costs
costs of
purchased
components
labour costs
costs of
capital
goods
overheads
management
marketing
logistics
R&D
Does post-2020 LDV CO2
legislation affect ...
directly?
indirectly?
Legislation sets requirements for
cars. It does not directly affect costs
of labour.
2nd
order
assembly /
production
RD&E
management &
overheads
Same skill required for alternative mechanical
technologies. In assembly new electrical
components do not require specialized skills
New specialists required with knowledge of
e.g. electrical engineering and new materials
No new skills needed for employees with jobs in management and
overhead and limited additional personnel required. Administrative
requirements of post-2020 legislation similar to current legislation.Developments in these fields are already on-
going in all regions with automotive
development and manufacturing. Unlikely that
these competences would be more/less
available in EU than in other regions
UNLIKELY
NO
NO
NO
directly?
indirectly?
Cost ratio for components will be similar as
cost ratio of baseline productCompliance requires
improved or new components
to be used
NOIf share of cost factors in new components
is similar to that of baseline car, e.g. for
mechanical components
If share of cost factors in new components
is different to that of baseline car, e.g. for
electrical components
Differences in labour costs and other cost
factors between EU and other regions
may lead to different cost ratio for these
components
If new components for
cars manufactured in EU
for EU market are
produced in EU
If new components for
cars manufactured in other
region for EU market are
produced in that region
If new components for
cars manufactured in EU
are produced in competing
region outside EU
If new components for
cars manufactured outside
EU are produced in EU
MAYBE
Are EU/non-EU ratios for various cost
factors in production of components
markedly different?
Absolute manufacturing costs of new
components are the same. But transport
costs are higher for EU car manufacturing.
YES / - What’s the size of transport costs from
other regions to EU and how does that
compare to differences in manufacturing
costs in EU and outside EU?
unlikely case
Absolute manufacturing costs of new
components are the same. But transport
costs are lower for EU car manufacturing.
YES / +
Indirect effects may come from price
increases due to (temporary)
scarcity of components resulting
from insufficient production capacity
Δcosts through dependence on
location of production
Δcosts through difference in
economies of scale and learning
effects in EU and other regions
If EU has more / less stringent
LDV CO2 regulation than
other regions
If other regions have LDV
CO2 regulation of similar
stringency
Economies of scale for EU production of
new components likely to be larger /
smaller than for non-EU production
Economies of scale for EU and non-EU
production of new components likely to be
similar
Assumption that majority of
components for vehicles manufactured
in EU are also manufactured in EU
Check if that
assumption is correct
NO
YES / + or -
Makes it likely that also components for
non-EU manufacturing (for EU market or
other) are purchased in EU
Improves
competitiveness of
EU supply industry
indirectly?
directly?
Indirect effects may come from price increases
due to (temporary) scarcity of materials
resulting from insufficient production capacity
Legislation will lead to
demand for new
materials
1st order
2nd
order
Legislation sets requirements for cars.
It does not directly affect costs of
(producing) materials.
NO
1st order
2nd
order
Legislation sets requirements for cars.
It does not directly affect costs of
(producing) components.
NO
1st order
New technologies &
administrative
requirements for
complying with LDV
CO2 legislation may
require new skills
Training costs are a relatively small
fraction of total labour costs
UNLIKELYExisting employees
need training
Scarcity of employees with new
skills may (temporarily) lead to
higher wages
New employees
must be hired
Total cost ratios between
manufacturing in EU and
other regions may be affected
if one or more cost factors
change as a result of the LDV
CO2 legislation and this
change is different in the EU
than in other regions.
Total cost ratios between
manufacturing in EU and
other regions may be affected
if application of new
technologies or other
activities needed to comply
with LDV CO2 legislation
affect the shares of different
cost factors, and if ratios of
these cost factors for EU vs
other regions are significantly
different. E.g. if new
components require more
labour and less mechanized
production.
directly? Legislation sets requirements for
cars. It does not directly affect costs
of capital goods.
indirectly?
2nd
order
1st order
Scarcity of capital goods not likely as new
technologies do not require extremely
specialized production tools.
NO
NO
New technologies may require new
tooling (e.g. autoclave for carbon
fiber bodies)
These production tools may be more / less
expensive in EU than in other regions.
E.g. as a result of general differences
in wages at suppliers, or interest rate
for borrowing investment capital MAYBE
Limited additional personnel required.
Administrative requirements of post-2020
legislation similar to current legislation.
NO
Additional marketing may be necessary to
make clients accept new technology
These costs need to be passed on to cars sold in EU, but not to cars
manufactured in EU for markets outside EU if these markets do not have
similar legislation. Foreign OEMs have to make similar efforts for imports to
EU. Cost per car may depend on sales volumes in EU. This aspect does not
generically affect competitiveness of production in EU.
NO
Shipping costs not directly
affected
directly?
indirectly? If cars become more expensive,
insurance + other costs for
transport may increase.
NO
If EU has more stringent
legislation than other regions
If EU regulation is of similar
stringency as in other regions
Imports to EU and exports from EU are similarly
affected.
NO
Due to longer transport distances imports to EU are
more severely affected than distribution of cars
manufactured in EU for EU market.
YES / +
R&D will be necessary to develop
(cars with) new technology.
These costs need to be passed on to cars sold in EU, but not to cars
manufactured in EU for markets outside EU if these markets do not
have similar legislation. Foreign OEMs have to make similar efforts for
imports to EU. Cost per car may depend on sales volumes in EU.
Competitiveness of performing R&D in EU (company R&D or
by R&D organisations) may be affected, e.g. if EU legislation
promotes innovation more than legislation in other regions.
Which specific machines are necessary
for producing cars that achieve post-2020
LDV CO2 targets? And how could costs
for these be different from costs for use
in manufacturing in other regions?
Indirect impacts:
1st order
Does the regulation affect the
amount of units used? E.g.
does it require more/less
labour or steel to be used per
car?
Does it require other types of
a certain unit to be used
leading to other costs? E.g.
does it require electrical
engineers instead of
mechanical engineers or
lightweight materials instead
of steel? And are costs of
these other types of units
higher/lower?
2nd
order
Does the regulation indirectly
affect a cost factor per unit
used? E.g. an increase in the
price of certain types of
labour, materials or
components due to
(temporary) scarcity.
Direct impacts:
Does the regulation directly
affect a cost factor per unit
used? E.g.: change in cost of
labour due to stricter labour
conditions or higher taxes, or
change in price of steel due to
higher production costs.
Pathway (element) will very likely
not lead to competitiveness impact
for EU industry
Pathway (element) will very likely
lead to competitiveness impact for
EU industry
Pathway (element) may lead to
competitiveness impact for EU
industry
Legend: traffic light colours
Shape and slope of target
function may lead to different
reduction efforts for cars
manufactured in EU vs. other
regions if average utility value is
different.
The use of new technologies may
lead to more or less labour required
for manufacturing cars
Effects expected to
be small
assembly /
production
RD&E
management &
overheads Limited additional personnel required.
Administrative requirements of post-2020 legislation
similar to current legislation.
Increased R&D activities may be needed for new
technologies
Additional components to be added
New technologies may require more/less labour or
have higher/lower share of (manual) labour in
assembly / production
NO
See under: Overhead
If labour costs are different in
different regions
Δcost as result of EU CO2 legislation may be
different for EU and non-EU manufacturing.
Sign and size of effect depend on impact of
technologies on share of labour costs in
production costs and on differences in labour
costs between regions.
YES / + or -
Regional differences in various cost factors
(e.g. labour and energy) may lead to regional
differences in the production costs of materials
For materials (that need to be)
sourced regionally
For materials (that can be) sourced
globally
Similar material purchasing costs for
EU and non-EU production
Possibility of different material costs for
EU and non-EU production
Possibility of different transport costs
for EU and non-EU production
MAYBE
Would apply mainly to materials for
electric propulsion components and for
lightweight construction
Depends on type material, regional
availability of material, ratio of
material costs and transport costs,
strategic alliances, etc.
Limited effect assuming that transport
costs for materials are a small part of
total manufacturing costsFor all relevant materials production
capacity is already being increased.
Assumption that legislation gives
enough lead time
Most likely this works out similarly for
manufacturing in different regions
NO
Due to large number of compliance
strategies dependence on limited
number of materials is unlikely
For all relevant components
production capacity is already being
increased.
Assumption that legislation gives
enough lead time
Most likely this works out similarly for
manufacturing in different regions
NO
Due to large number of compliance
strategies dependence on limited
number of components is unlikely
NO
If EU has more / less stringent
legislation than other regions
If EU regulation is of similar
stringency as in other regions
Larger / smaller production of advanced ICEVs and AFVs in EU
leads to more / less learning effects, lower / higher costs of
production equipment and more / less efficient use of equipment
Production in EU and outside EU is
similarly affected
NO
YES / + or - Could provide incentive for non-EU
OEMs to purchase components from
EU supliers
Majority of vehicles for EU market
are manufactured in EU
Do new technologies affect the share of
labour costs in production costs? And
how large are the differences in labour
costs between regions?
Expected net impact
depends on which case is
valid. This depends on
answers to questions in
grey boxes.
Please note that situation is
not static. EU OEMs that
now source components
regionally may choose to
source components from
suppliers in other regions if
these have significantly
lower costs. Suppliers may
also choose to locate
production facilities in EU.
If effective stringency of target
is different for EU and non-EU
OEMs
Economies of scale for EU production of
new components likely to be different than
for non-EU production
YES / + or -Size and sign depend on utility function
that is still to be determined
If EU has less stringent
legislation than other
regions
Due to longer transport distances exports from EU to other
markets are more severely affected than distribution of
cars manufactured outside EU for local markets.
YES / -
If EU has more stringent LDV
CO2 regulation than other
regions
If other regions have more
stringent LDV CO2 regulation
Competitive advantage for EU
component manufacturing industry due
to lower R&D costs per unit
Competitive advantage for non-EU car
manufacturing industry due to lower
R&D costs per unit
Assumption that majority of
components for vehicles manufactured
in EU are also manufactured in EU
YES / +
YES / - On EU market as well as for
exports to non-EU markets
Δcosts through difference in
economies of scale and learning
effects in EU and other regions

Assessment of competitiveness impacts of post-2020 LDV CO2 regulation
Final Report Valdani Vicari & Associati (VVA), Technopolis Group (TG), Joint Institute for Innovation Policy (JIIP), TNO for DG CLIMA 111
Do different cost elements per unit production increase or decrease more in EU
than in other regions to the extent that they affect the cost ratio of cars
manufactured in the EU and in other regions?
material
costs
costs of
purchased
components
labour costs
costs of
capital
goods
overheads
management
marketing
logistics
R&D
Does post-2020 LDV CO2
legislation affect ...
directly?
indirectly?
Legislation sets requirements for
cars. It does not directly affect costs
of labour.
2nd
order
assembly /
production
RD&E
management &
overheads
Same skill required for alternative mechanical
technologies. In assembly new electrical
components do not require specialized skills
New specialists required with knowledge of
e.g. electrical engineering and new materials
No new skills needed for employees with jobs in management and
overhead and limited additional personnel required. Administrative
requirements of post-2020 legislation similar to current legislation.Developments in these fields are already on-
going in all regions with automotive
development and manufacturing. Unlikely that
these competences would be more/less
available in EU than in other regions
UNLIKELY
NO
NO
NO
directly?
indirectly?
Cost ratio for components will be similar as
cost ratio of baseline productCompliance requires
improved or new components
to be used
NOIf share of cost factors in new components
is similar to that of baseline car, e.g. for
mechanical components
If share of cost factors in new components
is different to that of baseline car, e.g. for
electrical components
Differences in labour costs and other cost
factors between EU and other regions
may lead to different cost ratio for these
components
If new components for
cars manufactured in EU
for EU market are
produced in EU
If new components for
cars manufactured in other
region for EU market are
produced in that region
If new components for
cars manufactured in EU
are produced in competing
region outside EU
If new components for
cars manufactured outside
EU are produced in EU
MAYBE
Are EU/non-EU ratios for various cost
factors in production of components
markedly different?
Absolute manufacturing costs of new
components are the same. But transport
costs are higher for EU car manufacturing.
YES / - What’s the size of transport costs from
other regions to EU and how does that
compare to differences in manufacturing
costs in EU and outside EU?
unlikely case
Absolute manufacturing costs of new
components are the same. But transport
costs are lower for EU car manufacturing.
YES / +
Indirect effects may come from price
increases due to (temporary)
scarcity of components resulting
from insufficient production capacity
Δcosts through dependence on
location of production
Δcosts through difference in
economies of scale and learning
effects in EU and other regions
If EU has more / less stringent
LDV CO2 regulation than
other regions
If other regions have LDV
CO2 regulation of similar
stringency
Economies of scale for EU production of
new components likely to be larger /
smaller than for non-EU production
Economies of scale for EU and non-EU
production of new components likely to be
similar
Assumption that majority of
components for vehicles manufactured
in EU are also manufactured in EU
Check if that
assumption is correct
NO
YES / + or -
Makes it likely that also components for
non-EU manufacturing (for EU market or
other) are purchased in EU
Improves
competitiveness of
EU supply industry
indirectly?
directly?
Indirect effects may come from price increases
due to (temporary) scarcity of materials
resulting from insufficient production capacity
Legislation will lead to
demand for new
materials
1st order
2nd
order
Legislation sets requirements for cars.
It does not directly affect costs of
(producing) materials.
NO
1st order
2nd
order
Legislation sets requirements for cars.
It does not directly affect costs of
(producing) components.
NO
1st order
New technologies &
administrative
requirements for
complying with LDV
CO2 legislation may
require new skills
Training costs are a relatively small
fraction of total labour costs
UNLIKELYExisting employees
need training
Scarcity of employees with new
skills may (temporarily) lead to
higher wages
New employees
must be hired
Total cost ratios between
manufacturing in EU and
other regions may be affected
if one or more cost factors
change as a result of the LDV
CO2 legislation and this
change is different in the EU
than in other regions.
Total cost ratios between
manufacturing in EU and
other regions may be affected
if application of new
technologies or other
activities needed to comply
with LDV CO2 legislation
affect the shares of different
cost factors, and if ratios of
these cost factors for EU vs
other regions are significantly
different. E.g. if new
components require more
labour and less mechanized
production.
directly? Legislation sets requirements for
cars. It does not directly affect costs
of capital goods.
indirectly?
2nd
order
1st order
Scarcity of capital goods not likely as new
technologies do not require extremely
specialized production tools.
NO
NO
New technologies may require new
tooling (e.g. autoclave for carbon
fiber bodies)
These production tools may be more / less
expensive in EU than in other regions.
E.g. as a result of general differences
in wages at suppliers, or interest rate
for borrowing investment capital MAYBE
Limited additional personnel required.
Administrative requirements of post-2020
legislation similar to current legislation.
NO
Additional marketing may be necessary to
make clients accept new technology
These costs need to be passed on to cars sold in EU, but not to cars
manufactured in EU for markets outside EU if these markets do not have
similar legislation. Foreign OEMs have to make similar efforts for imports to
EU. Cost per car may depend on sales volumes in EU. This aspect does not
generically affect competitiveness of production in EU.
NO
Shipping costs not directly
affected
directly?
indirectly? If cars become more expensive,
insurance + other costs for
transport may increase.
NO
If EU has more stringent
legislation than other regions
If EU regulation is of similar
stringency as in other regions
Imports to EU and exports from EU are similarly
affected.
NO
Due to longer transport distances imports to EU are
more severely affected than distribution of cars
manufactured in EU for EU market.
YES / +
R&D will be necessary to develop
(cars with) new technology.
These costs need to be passed on to cars sold in EU, but not to cars
manufactured in EU for markets outside EU if these markets do not
have similar legislation. Foreign OEMs have to make similar efforts for
imports to EU. Cost per car may depend on sales volumes in EU.
Competitiveness of performing R&D in EU (company R&D or
by R&D organisations) may be affected, e.g. if EU legislation
promotes innovation more than legislation in other regions.
Which specific machines are necessary
for producing cars that achieve post-2020
LDV CO2 targets? And how could costs
for these be different from costs for use
in manufacturing in other regions?
Indirect impacts:
1st order
Does the regulation affect the
amount of units used? E.g.
does it require more/less
labour or steel to be used per
car?
Does it require other types of
a certain unit to be used
leading to other costs? E.g.
does it require electrical
engineers instead of
mechanical engineers or
lightweight materials instead
of steel? And are costs of
these other types of units
higher/lower?
2nd
order
Does the regulation indirectly
affect a cost factor per unit
used? E.g. an increase in the
price of certain types of
labour, materials or
components due to
(temporary) scarcity.
Direct impacts:
Does the regulation directly
affect a cost factor per unit
used? E.g.: change in cost of
labour due to stricter labour
conditions or higher taxes, or
change in price of steel due to
higher production costs.
Pathway (element) will very likely
not lead to competitiveness impact
for EU industry
Pathway (element) will very likely
lead to competitiveness impact for
EU industry
Pathway (element) may lead to
competitiveness impact for EU
industry
Legend: traffic light colours
Shape and slope of target
function may lead to different
reduction efforts for cars
manufactured in EU vs. other
regions if average utility value is
different.
The use of new technologies may
lead to more or less labour required
for manufacturing cars
Effects expected to
be small
assembly /
production
RD&E
management &
overheads Limited additional personnel required.
Administrative requirements of post-2020 legislation
similar to current legislation.
Increased R&D activities may be needed for new
technologies
Additional components to be added
New technologies may require more/less labour or
have higher/lower share of (manual) labour in
assembly / production
NO
See under: Overhead
If labour costs are different in
different regions
Δcost as result of EU CO2 legislation may be
different for EU and non-EU manufacturing.
Sign and size of effect depend on impact of
technologies on share of labour costs in
production costs and on differences in labour
costs between regions.
YES / + or -
Regional differences in various cost factors
(e.g. labour and energy) may lead to regional
differences in the production costs of materials
For materials (that need to be)
sourced regionally
For materials (that can be) sourced
globally
Similar material purchasing costs for
EU and non-EU production
Possibility of different material costs for
EU and non-EU production
Possibility of different transport costs
for EU and non-EU production
MAYBE
Would apply mainly to materials for
electric propulsion components and for
lightweight construction
Depends on type material, regional
availability of material, ratio of
material costs and transport costs,
strategic alliances, etc.
Limited effect assuming that transport
costs for materials are a small part of
total manufacturing costsFor all relevant materials production
capacity is already being increased.
Assumption that legislation gives
enough lead time
Most likely this works out similarly for
manufacturing in different regions
NO
Due to large number of compliance
strategies dependence on limited
number of materials is unlikely
For all relevant components
production capacity is already being
increased.
Assumption that legislation gives
enough lead time
Most likely this works out similarly for
manufacturing in different regions
NO
Due to large number of compliance
strategies dependence on limited
number of components is unlikely
NO
If EU has more / less stringent
legislation than other regions
If EU regulation is of similar
stringency as in other regions
Larger / smaller production of advanced ICEVs and AFVs in EU
leads to more / less learning effects, lower / higher costs of
production equipment and more / less efficient use of equipment
Production in EU and outside EU is
similarly affected
NO
YES / + or - Could provide incentive for non-EU
OEMs to purchase components from
EU supliers
Majority of vehicles for EU market
are manufactured in EU
Do new technologies affect the share of
labour costs in production costs? And
how large are the differences in labour
costs between regions?
Expected net impact
depends on which case is
valid. This depends on
answers to questions in
grey boxes.
Please note that situation is
not static. EU OEMs that
now source components
regionally may choose to
source components from
suppliers in other regions if
these have significantly
lower costs. Suppliers may
also choose to locate
production facilities in EU.
If effective stringency of target
is different for EU and non-EU
OEMs
Economies of scale for EU production of
new components likely to be different than
for non-EU production
YES / + or -Size and sign depend on utility function
that is still to be determined
If EU has less stringent
legislation than other
regions
Due to longer transport distances exports from EU to other
markets are more severely affected than distribution of
cars manufactured outside EU for local markets.
YES / -
If EU has more stringent LDV
CO2 regulation than other
regions
If other regions have more
stringent LDV CO2 regulation
Competitive advantage for EU
component manufacturing industry due
to lower R&D costs per unit
Competitive advantage for non-EU car
manufacturing industry due to lower
R&D costs per unit
Assumption that majority of
components for vehicles manufactured
in EU are also manufactured in EU
YES / +
YES / - On EU market as well as for
exports to non-EU markets
Δcosts through difference in
economies of scale and learning
effects in EU and other regions
Assessment of competitiveness impacts of post-2020 LDV CO2 regulation
Final Report Valdani Vicari & Associati (VVA), Technopolis Group (TG), Joint Institute for Innovation Policy (JIIP), TNO for DG CLIMA 112
Does post-2020 EU LDV CO2 regulation lead to regionally different impacts related to the cost of
purchased components?
Not directly. The regulation does not directly affect the cost of components as it applies to cars and not
to factors that determine the costs of component manufacturing.
Indirectly the costs of purchased components as a share in the total costs of manufacturing can be
affected along two pathways:
The legislation will change demand for components as improved or new components will have to
be applied to reduce vehicle CO2 emissions. Differences in this change in costs for EU
manufacturing compared to non-EU manufacturing may come from differences in economies of
scale or dependence of components costs on location of production:
o Differences in economies of scale
If the majority of components for vehicles manufactured in a region are also
manufactured in that region, as is the case for a large share of automotive
components, and if the EU has more stringent LDV CO2 regulation than other
regions, production volumes of improved / new components will be higher in the
EU leading to lower costs as a result of economies of scale. This results in a
possible (positive) impact.
o If new components are less expensive in the EU than in other regions,
this would also make it more likely that non-EU manufacturers would
purchase components manufactured in the EU (for use in cars for the
EU and other markets). This would improve the cost competitiveness of
the EU supply industry.
If other regions have LDV CO2 regulation of similar stringency, economies of
scale for required components will be similar in different regions. In that case
this pathway will not result in cost competitiveness impacts.
If the average utility value for the sales of European manufacturers on the EU
market is different from that of non-EU manufacturers, the shape and slope of
the utility-based target function (and possibly also other modalities) may lead to
targets for EU manufacturers that on average are of different stringency than for
non-EU manufacturers. If a larger share of cars sold by EU manufacturers in the
EU are manufactured in the EU than is the case for cars sold in the EU by non-
EU manufacturers, and if components for cars are mainly manufactured in the
same region where the cars are manufactured, then the different required
reduction efforts for EU and non-EU manufacturers may lead to differences in
the demand for improved or new components that may lead to differences in
economies of scale of similar components manufactured in EU and other
regions. This may affect the cost competitiveness of EU car manufacturing,
but sign and size of the impact cannot be determined in the absence of a
proposed target function. The likeliness of this impact pathway is further
determined by the stringency of LDV CO2 regulation in different regions.
o In Annex 5 it is shown that overall the sales distributions for cars
manufactured by European, Japanese, Korean and other OEMs are

Assessment of competitiveness impacts of post-2020 LDV CO2 regulation
Final Report Valdani Vicari & Associati (VVA), Technopolis Group (TG), Joint Institute for Innovation Policy (JIIP), TNO for DG CLIMA 113
different in detail but do not show very large difference in the average
mass and footprint. The impact of the above-described pathway is
therefore expected to be limited. For passenger cars this is further
influenced by the observed trend that the absolute slope of the target
function decreases with a decreasing target level.
o Dependence of component costs on location of production
The location of production affects component costs e.g. through differences in
the cost of labour in different regions. If the share of labour costs in the total cost
of new components is different from the share of labour costs in the reference
vehicle, differences in labour costs for manufacturing components may affect
the cost ratio of vehicles manufactured in the EU and in other regions. Different
combinations of conditions lead to different conclusions on the resulting cost
competitiveness impacts as shown in the graph below.
Figure 24 – Impact of the location of production on compliance costs
If new components for cars sold in the EU are manufactured in the EU both for EU
and non-EU car manufacturing, the component costs will be the same but due to
higher transport costs for use of these components in non-EU car manufacturing
there could be a positive impact on the cost competitiveness of EU
manufacturing.
Possible negative cost competitiveness impacts may arise if new components
for cars sold in the EU are manufactured outside the EU both for EU and non-EU
car manufacturing (but are more expensive for EU manufacturing due to higher
transport costs), or if components are manufactured in the same region as the
vehicles (and are cheaper in other regions due to lower labour costs or other cost
factors).
o Although a majority of automotive parts tend to be produced close to the
production locations of OEMs, these OEMs would source them elsewhere
if overall they were cheaper, if it concerns specialised components (e.g. for
electric powertrains) produced by a limited number of suppliers, or e.g. if
Cost ratio for components will
be similar as cost ratio of
baseline product
NOIf share of cost factors in new
components is similar to that of
baseline car, e.g. for mechanical
components
If share of cost factors in new
components is different to that of
baseline car, e.g. for electrical
components
Differences in labour costs and
other cost factors between EU and
other regions may lead to different
cost ratio for these components
If new components for
cars manufactured in EU
for EU market are
produced in EU
If new components for
cars manufactured in other
region for EU market are
produced in that region
If new components for
cars manufactured in EU
are produced in competing
region outside EU
If new components for
cars manufactured outside
EU are produced in EU
MAYBE
Absolute manufacturing costs of new
components are the same. But
transport costs are higher for EU car
manufacturing.
YES / -
unlikely case
Absolute manufacturing costs of new
components are the same. But
transport costs are lower for EU car
manufacturing.
YES / +
Δcosts through
dependence on
location of production
NO
Assessment of competitiveness impacts of post-2020 LDV CO2 regulation
Final Report Valdani Vicari & Associati (VVA), Technopolis Group (TG), Joint Institute for Innovation Policy (JIIP), TNO for DG CLIMA 114
production of these components is energy or labour intensive and
therefore located in counties with cheap energy or labour.
In order to be able to judge whether identified possible cost competitiveness
impacts are likely or likely to be significant the following questions would need to
be answered:
o Are EU/non-EU ratios for various cost factors markedly different?
o What is the size of transport costs from other regions to the EU and how
does that compare to differences between manufacturing costs of
components in the EU and outside the EU?
Overall the expected net impact depends on which case is valid. In addition it
should be noted that the situation is not static. EU OEMs that now source
components regionally may choose to source components from suppliers in other
regions if these have significantly lower costs. Suppliers from outside the EU may
also choose to locate production facilities in EU.
Indirect effects may also come from price increases due to (temporary) scarcity of components
resulting from production capacity not being able to match the increased demand.
o This impact pathway is considered to be unlikely as:
for many components that are relevant to advanced ICEVs and AFVs the
production is already being scaled up in the EU and other regions;
due to the large number of compliance strategies dependence on a limited
number of components is unlikely;
for now it is foreseen that the date of announcement of the post-2020 legislation
gives enough lead time to the target year.
Does post-2020 EU LDV CO2 regulation lead to regionally different impacts related to the cost of
labour?
Not directly. The legislation does not have a direct effect on labour conditions, wages, taxes or other
factors that determine the costs per unit of labour.
An indirect impact pathway could occur if the amount of labour needed to manufacture a car would
change as a result of the legislation and if the costs of labour are different for different regions. In that
case the share of labour costs as part of the total costs of car manufacturing would be affected differently
in the EU than in other regions as would the ratio of total costs between EU and other regions.
The question is whether it is likely that the amount of labour required for manufacturing cars
could change as a result of the legislation. Examples of possible origins for this are:
o Assembly of electric powertrains is less labour intensive than of mechanical power trains
(less components).
o Construction of vehicle bodies from composites and other alternative materials may be
more labour-intensive than construction of steel bodies.
Important questions for determining the size of possible cost competitiveness impacts are:
o What are the differences in wages between regions?
o What degree of automation and hours per vehicle produced?

Assessment of competitiveness impacts of post-2020 LDV CO2 regulation
Final Report Valdani Vicari & Associati (VVA), Technopolis Group (TG), Joint Institute for Innovation Policy (JIIP), TNO for DG CLIMA 115
o What’s the share of labour costs in car manufacturing and is that different in different
regions?
Indirectly there could be an effect on labour costs per vehicle and as a share of the total costs of
manufacturing vehicles if labourers with new skills are required and if these would not be sufficiently
available. This is not considered to apply to the compliance route of making ICEVs more efficient, as that
very much relies on incremental improvements of existing technologies. But it could result from the need
to sell or increase the share of AFVs. These contain novel technologies with more emphasis on electrical
and chemical engineering than on mechanical engineering.
If this applies to EU and non-EU manufacturing equally it does not affect cost competitiveness
as the relative cost ratio between regions will remain the same.
This could happen if the availability of skilled labour for the new technologies is lower or higher
in the EU than in other regions of the world and if recruiting from other regions is restricted.
It is likely to apply more to R&D and product development than to manufacturing, as
manufacturing requires limited amounts of specialised labourers and production labourers can
be trained to acquire new skills.
This is only a temporary effect, as it may be expected that skills of available labourers will be
changed to meet the changing demands through training.
No new skills are needed for employees with jobs in management and overhead and limited
additional personnel is required in those areas. The administrative requirements of post-2020
legislation are expected to be similar to those of the current legislation.
Does post-2020 EU LDV CO2 regulation lead to regionally different impacts related to the cost of
capital goods?
There is no direct impact expected as the regulation does not affect the factors that determine the cost of
capital goods per unit of production.
Indirect effects on total costs of capital goods as part of the costs of manufacturing vehicles are expected
as new technologies are likely to require new manufacturing equipment (e.g. autoclave for carbon fibre
bodies).
o Cost competitiveness impacts are expected only if the cost difference between new and
existing capital goods is different from the overall average difference in costs of
equipment in different regions. This seems fairly unlikely.
In addition indirect effects are possible in relation to the efficiency of production for advanced ICEVs and
AFVs.
o If the EU has more stringent legislation than other regions the production volumes of
advanced ICEVs and AFVs will be higher in the EU than in other regions, given that the
majority of vehicles sold in the EU is manufactured in the EU. This leads to learning
effects and more efficient use of capital goods, which may have a small positive
impacts on the cost competitiveness of the EU car manufacturing industry.
Scarcity of capital goods could occur if the demand for new equipment increases fast. This is not
expected as most technologies for compliance with post-2020 LDV CO2 legislation do not seem to
require extremely specialised or complex production tools for car manufacturing (for component
manufacturing this may be different) and OEMs have significant time to plan ahead.

Assessment of competitiveness impacts of post-2020 LDV CO2 regulation
Final Report Valdani Vicari & Associati (VVA), Technopolis Group (TG), Joint Institute for Innovation Policy (JIIP), TNO for DG CLIMA 116
If large investments would be needed to adapt production processes in a short period of time, and
especially if these investments are associated with high risks, this could affect the cost of capital. This
would only be the case with very rapid reduction trajectories. This would only seem to lead to cost
competitiveness impacts if targets for EU OEMs are on average more stringent than for non-EU OEMs.
Does post-2020 EU LDV CO2 regulation lead to regionally different impacts related to the overhead
costs?
No direct impacts on the costs per unit of overhead activity are expected, but the amount of overhead
per unit product might change.
Possible impacts can be assessed per type of overhead costs:
o Management: Limited additional personnel are expected to be required. Administrative
requirements of post-2020 legislation would be similar to those of current legislation,
which are minimal. In a transition phase additional management efforts could be
required to acquire new components or implement new production methods. This
aspect does not generically affect cost competitiveness of production in EU.
o Marketing: Additional marketing efforts may be necessary to inform clients about new
technologies and to use these to enhance brand value. These costs need to be passed
on to cars sold in the EU, but not to cars manufactured in the EU for markets outside the
EU if these markets do not have similar legislation. Foreign OEMs have to make similar
efforts for imports to the EU. The cost per car will depend on sales volumes in the EU.
This aspect does not generically affect cost competitiveness of production in the
EU.
o Logistics: Shipping costs per unit of transport activity are not directly affected. Indirect
impacts may result e.g. from increasing insurance costs for transport as a result of cars
becoming more expensive. If the EU has more stringent legislation than other regions,
imports to EU may be more severely affected than distribution of cars manufactured in
EU for EU market due to the longer transport distances. This would be a small positive
cost competitiveness impact for EU car manufacturing. If EU regulation is of similar
stringency as in other regions, imports to EU and exports from EU are similarly affected
and no cost competitiveness impact would be expected for this pathway.
o R&D costs: Additional R&D will be necessary to develop (LDVs with) new technologies.
These costs need to be passed on to LDVs sold in EU, but not to LDVs manufactured in
the EU for markets outside the EU if these markets do not have similar legislation.
Foreign OEMs have to make similar efforts for imports to the EU. Cost per LDV may
depend on sales volumes in the EU. This aspect does not generically affect cost
competitiveness of production in the EU. Also the relation between R&D costs and the
overall costs of manufacturing LDVs in the EU or in other regions is weak. R&D is
carried out at company level, and how R&D costs are passed through in the price of
products is a strategic decision of companies. Nevertheless this aspect may be
considered to cause impacts on overall cost competitiveness, which would appear to be
positive if the EU has more stringent regulation than other regions and negative if the
reverse is the case.

Assessment of competitiveness impacts of post-2020 LDV CO2 regulation
Final Report Valdani Vicari & Associati (VVA), Technopolis Group (TG), Joint Institute for Innovation Policy (JIIP), TNO for DG CLIMA 117
Cost competitiveness of performing R&D in the EU (company R&D or by R&D
organisations) may be affected, e.g. if EU legislation promotes innovation more
than legislation in other regions.
6.3 Conclusions regarding cost competitiveness impacts on EU vehicle
manufacturing
Table 7 - Summary of possible cost competitiveness impacts on EU automotive manufacturing
Cost factor Impact Comment
Material costs Maybe ? Relates to possible regional difference in materials needed for advanced
ICEVs and AFVs.
Sign and size of the effect cannot be determined at this stage, but
significant impacts appear unlikely.
Costs of purchased
components
Maybe + Small positive impacts could occur if the EU has more stringent regulation
than other regions or if large share of new components for advanced
ICEVs and AFVs are produced in the EU.
- Small negative impacts may occur if component for advanced ICEVs and
AFVs are mainly produced outside the EU.
+/- Finite impacts may occur if the effective stringency of the target is
different for EU and non-EU OEMs:
o Sign and size depend on target function which is not yet known.
Labour costs Yes +/- An impact of unknown sign and size is possible as new technologies may
require more/less labour or have a higher/lower share of (manual) labour
in assembly / production. This will only lead to a finite effect if labour costs
are different in different regions.
Costs of capital
goods
Maybe ? Depending on possible regional differences in the costs of production
tools for advanced ICEVs and AFVs
+/- Positive / negative impacts associated with economies of scale and
learning effects due to higher / lower volumes if EU has more / less
stringent legislation than other regions
Overheads Yes +/- Vehicles get more expensive. For transport costs that increase with the
value of the vehicle, the impact on vehicles imported from distant regions
is relatively larger than for cars manufactured in the EU.
+/- The number of vehicle sales over which R&D costs can be divided
depends on the relative stringency of CO2 regulation in the EU and other
regions (positive impacts if EU regulation is more stringent).
The total cost ratio between EU manufacturing and other regions may change as a result of the EU LDV CO2
legislation:
if one or more cost factors change as a result of the LDV CO2 legislation and this change is different in
the EU than in other regions;
if application of new technologies or other activities needed to comply with LDV CO2 legislation affects
the shares of different cost factors in the total production costs, and if ratios of these cost factors for EU
vs. other regions are significantly different.

Assessment of competitiveness impacts of post-2020 LDV CO2 regulation
Final Report Valdani Vicari & Associati (VVA), Technopolis Group (TG), Joint Institute for Innovation Policy (JIIP), TNO for DG CLIMA 118
It is concluded that post 2020 EU LDV CO2 legislation has no direct impacts on the cost competitiveness of
EU car manufacturing as the legislation is targeted at the CO2 performance of cars and not at factors that
determine the costs of producing cars or their components. A limited number of possible indirect impacts,
however, have been identified, of which the combined net impact may still be significant:
The access to materials as well as the costs of these materials could be different for EU and non-EU
OEMs. This especially relates to materials for electric powertrains and vehicle light-weighting;
Possible positive or negative cost competitiveness impacts are identified in relation to regional
differences in the cost of components for advanced ICEVs and AFVs, depending e.g. on the relative
stringency of EU legislation compared to that in other regions or whether components are required for
which suppliers are mainly located outside Europe;
Regional differences in labour costs may have an impact of unknown sign and size as new technologies
may require more/less labour or have a higher/lower share of (manual) labour in assembly / production.
Given the wage levels in different EU Members States this may also exacerbate the current shift of
production facilities within the EU to Central and Eastern Europe;
Some impact pathways have been identified that relate to differences in the costs of capital goods,
transport costs and tariffs, and the volume of sales over which R&D costs can be divided. The size and
sign of these impacts depend on the relative stringency of EU legislation, with a positive impacts likely of
the EU legislation is more stringent than that in other regions;
Conclusions seem to be quite generic and the same for the car and van regulation.
Assessment of competitiveness impacts of post-2020 LDV CO2 regulation
Final Report Valdani Vicari & Associati (VVA), Technopolis Group (TG), Joint Institute for Innovation Policy (JIIP), TNO for DG CLIMA 119
7. Impacts on cost competitiveness: the component manufacturer
perspective
7.1 Introduction
Companies supplying components (including materials such as steel) to automotive manufacturers operate
in a business-to-business market. Price and quality determine the attractiveness of their products, together
with a range of other factors such as the ability to meet the OEMs supply chain requirements (e.g. just-in-
time delivery). Assuming that the latter aspects are not affected by LDV CO2 regulation, the focus for
assessing cost competitiveness impacts on suppliers will be on analysing whether European suppliers would
be in a better, equal or worse position than suppliers from other regions to meet the additional demand by
OEMs for components for efficient ICEVs and AFVs in a cost-competitive way. This chapter focusses on
assessing cost competitiveness impacts from the manufacturer (i.e. company) perspective. An analysis of
cost competitiveness impacts on EU automotive component manufacturing (i.e. a sectorial perspective) is
provided in chapter 8.
7.2 Identification of impact pathways
Pathways along which the LDV CO2 legislation and the capabilities and resources of companies can lead to
cost competitiveness impacts on automotive supplier companies are presented in Figure 25. A
decomposition of relevant resources and capabilities of suppliers as a basis for determining regional
differences that may lead to cost competitiveness impacts on suppliers is presented in Figure 26.
Figure 25 shows that the demand for new components and materials for advanced ICEVs and AFVs,
resulting from the CO2 legislation, is primarily determined by the compliance strategies chosen by OEMs.
Over the last decades OEMs have come to rely more and more on R&D and new product development
carried out by their Tier 1 suppliers, so that the ability of these suppliers to develop and manufacture
advanced components is also a strong influencing factor in an OEM’s choices regarding the strategy for
complying with the post-2020 LDV CO2 regulation.
Differences in the abilities of suppliers to offer new components and materials for advanced ICEVs and AFVs
to their clients at competitive prices determine the impacts of post-2020 LDV CO2 regulation on the mutual
cost competitiveness of suppliers. Possible regional differences in these abilities may lead to cost
competitiveness impacts on European automotive suppliers or the EU automotive supply industry. What
makes an automotive supplier European can again be defined in different ways, such as:
membership of CLEPA, the European association of automotive suppliers;
location of headquarters and/or major R&D centres in the EU;
having production facilities in the EU.
For the analysis from a manufacturing perspective (see chapter 8) the latter definition is relevant. For the
distinction between EU and non-EU in the analysis of regional differences between automotive component
manufacturers the first two definitions are most relevant, but it is assumed that for suppliers with
headquarters in the EU also the majority of their production is located in the EU. Given that suppliers often
have factories close to those of their clients, and given that the majority of vehicles sold in the EU are

Assessment of competitiveness impacts of post-2020 LDV CO2 regulation
Final Report Valdani Vicari & Associati (VVA), Technopolis Group (TG), Joint Institute for Innovation Policy (JIIP), TNO for DG CLIMA 120
manufactured in the EU, it may be assumed that a large part of the components for vehicles affected by EU
CO2 legislation are manufactured in the EU. Reasons for why components are manufactured around
assembly plants relate not only to costs but also to supply chain reliability, just-in-time delivery, reduction of
inventories at the OEMs’ production plants, flexibility and responsiveness of supply, etc.. However, for more
specialised components it is less likely that the suppliers’ production plants are located in the vicinity of the
OEMs’ manufacturing locations.
An analysis of possible regional differences in the resources and capabilities of automotive suppliers can be
based on the mindmap depicted in Figure 26. The structure of Figure 26 is very similar to that for the
decomposition of relevant resources and capabilities of OEMs (Figure 20). Some noticeable differences are:
the dependence of economies of scale on the share of EU and non-EU OEMs among the clients of a
supplier and the sales of these clients in the EU and in other regions;
a more limited impact of the existing product portfolio on capabilities, with focus on:
o already having components for advanced ICEVs and AFVs in the portfolio may enable faster
increase in the supply and sales share of such components;
o that a wide power range of available ICEV and AFV powertrain components is necessary to
grasp a significant proportion of the market;
o that a wide product portfolio may enable some level of cross-subsidizing with other products to
allow competitive pricing of the ICEV and AFV components supplied to OEMs for meeting
targets of the LDV CO2 legislation.
Possible regional differences are expected to affect cost competitiveness in similar ways as analysed for
OEMs. These include regional differences in:
knowledge positions and existing product portfolios for specific technologies;
wages and other factors determining the cost of operations;
access to materials and (sub)components.
An assessment of whether such differences exist and to what extent they influence cost competitiveness will
have to answer similar questions for suppliers as have been listed in section 6 for automotive manufacturers.
Resources for which regional differences may influence capabilities of EU and non-EU automotive
component and material suppliers to respond to changing needs of their customers resulting from the need
to comply with post-2020 CO2 regulation in a cost-competitive manner include:
the financial position of companies, which influences their ability to develop materials and components
for efficient ICEVs and AFVs as well as their ability to temporarily absorb losses if competition does not
allow full pass-through of the costs;
o In return the financial position is affected by the profitability of a company’s operations, which may be
affected by the CO2 legislation;
the knowledge position of companies, which influences their ability to develop materials and
components for more efficient ICEVs and AFVs vehicles;
o The patent position is part of the knowledge position and not only influences the ability to develop
advanced materials and components for ICEVs and AFVs but also to generate revenues by selling
patents or licenses;

Assessment of competitiveness impacts of post-2020 LDV CO2 regulation
Final Report Valdani Vicari & Associati (VVA), Technopolis Group (TG), Joint Institute for Innovation Policy (JIIP), TNO for DG CLIMA 121
the facilities of companies, more specifically;
o their efficiency of production;
o their geographical location, which influences cost of labour and other cost factors of production, and
also determines transport costs;
access to suppliers able to deliver (sub-)components and materials for the manufacturing of components
for more efficient ICEVs and AFVs, and the cost at which these suppliers are able to sell the required
components and materials;
the portfolio of companies, which may determine:
o the speed with which suppliers can ramp up production of existing components and materials for
efficient ICEVs and AFVs;
o the extent to which suppliers can sell packages of components (systems);
o the extent to which suppliers can cross-subsidise costs over different products in the portfolio;
the customer base, which is characterised by aspects such as;
o the loyalty of customers;
o the share of EU and non-EU OEMs among the clients of a supplier and the sales of these clients in
the EU and in other regions.
Below the influence of these resources, and of possible regional differences therein, on relevant capabilities
of companies are discussed in more detail.
Ability to develop components for improved ICEVs and AFVs
A supplier’s ability to develop components and materials for more efficient ICEVs and AFVs is influenced by
a range of factors:
knowledge / technology position of the supplier and the resulting efforts required to improve the
knowledge / technology position:
o technologies already developed or even marketed;
o available patents;
R&D capacity:
o capability for and costs of carrying out the required R&D;
o capability for and costs of acquiring licences;
financial position, which determines the ability to invest in the required R&D and product development;
supplier base, which determines a supplier’s access to advanced (sub-)components and materials.
Below for each of these factors an assessment is made of the extent to which regional differences can give
rise to differences in the compliance costs for EU and non-EU suppliers to an extent that the relative price
ratio of their products is affected.
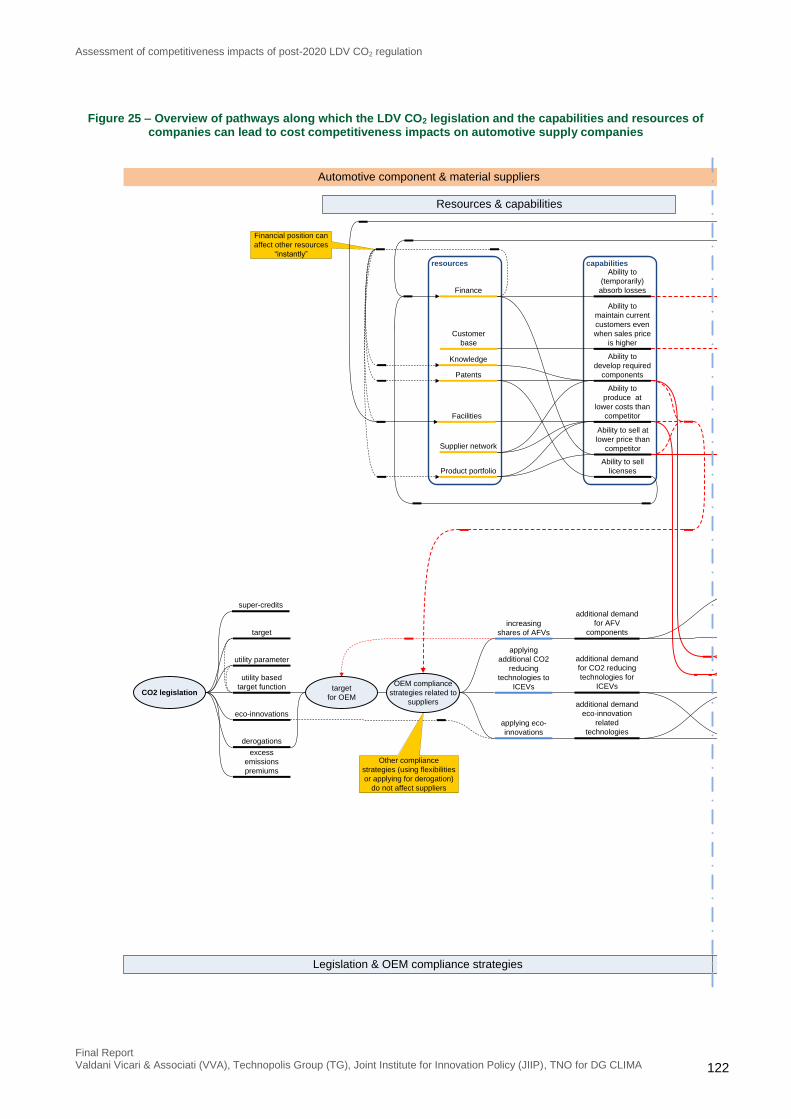
Assessment of competitiveness impacts of post-2020 LDV CO2 regulation
Final Report Valdani Vicari & Associati (VVA), Technopolis Group (TG), Joint Institute for Innovation Policy (JIIP), TNO for DG CLIMA 122
Figure 25 – Overview of pathways along which the LDV CO2 legislation and the capabilities and resources of companies can lead to cost competitiveness impacts on automotive supply companies
Financial position can
affect other resources
“instantly”
factors affecting (Δ) price competitiveness for other supplier(s)
factors affecting (Δ) price competitiveness of supplier of CO2
reducing technologies or AFV powertrain related components
(Δ) price competitiveness of supplier compared
to other suppliers
capabilitiesresources
cost of CO2
reducing
components for
ICEVs
costs of AFV
powertrain related
components
price of AFV
powertrain
related
components
price of CO2
reducing
components for
ICEVs
cost pass-through
factor for CO2
reducing
components for
ICEVs
cost pass-through
factor of AFV
powertrain related
components
overall level of
cost pass
through
quality / value of
CO2 reducing
components for
ICEVs
(Δ) competitiveness
of CO2 reducing
technologies for
ICEVs
(Δ) competitiveness
of AFV powertrain
related components
quality / value of
AFV powertrain
related components
utility parameter
CO2 legislation
utility based
target function
derogations
super-credits
eco-innovations
target
target
for OEM
OEM compliance
strategies related to
suppliers
increasing
shares of AFVs
applying eco-
innovations
(Δ) competitiveness
Supplier network
Facilities
Patents
Knowledge
Finance
Product portfolio
Customer
base
Δ long term cost
competitiveness of
company
excess
emissions
premiums
applying
additional CO2
reducing
technologies to
ICEVs
price of CO2 reducing
components for ICEVs
Δ price of AFVs
powertrain related
components
Δ quality / value of
AFVs powertrain
related components
quality / value of CO2
reducing components
for ICEVs
Δ short term cost
competitiveness of
company
Impact of changes in short
term competitiveness on long
term competitiveness are
determined through impacts
on various resources and
capabilities
Ability to
produce at
lower costs than
competitor
Ability to sell at
lower price than
competitor
Ability to
maintain current
customers even
when sales price
is higher
In case better
competitive
position results in
higher profits
Ability to
(temporarily)
absorb losses
Ability to sell
licenses
additional demand
for CO2 reducing
technologies for
ICEVs
additional demand
for AFV
components
Other compliance
strategies (using flexibilities
or applying for derogation)
do not affect suppliers
additional demand
eco-innovation
related
technologies
Ability to
develop required
components
Legislation & OEM compliance strategies Effects of resources/capabilities & legislation/OEM compliance strategies on competitiveness
Resources & capabilities
Automotive component & material suppliers Automotive component & material suppliers
Δ sales volumes
Δ profitability
Sales volumes
affect profitability of
production and of
sales operations
Sales volumes affect
cost of production and
profitability of
production facilities

Assessment of competitiveness impacts of post-2020 LDV CO2 regulation
Final Report Valdani Vicari & Associati (VVA), Technopolis Group (TG), Joint Institute for Innovation Policy (JIIP), TNO for DG CLIMA 123
Financial position can
affect other resources
“instantly”
factors affecting (Δ) price competitiveness for other supplier(s)
factors affecting (Δ) price competitiveness of supplier of CO2
reducing technologies or AFV powertrain related components
(Δ) price competitiveness of supplier compared
to other suppliers
capabilitiesresources
cost of CO2
reducing
components for
ICEVs
costs of AFV
powertrain related
components
price of AFV
powertrain
related
components
price of CO2
reducing
components for
ICEVs
cost pass-through
factor for CO2
reducing
components for
ICEVs
cost pass-through
factor of AFV
powertrain related
components
overall level of
cost pass
through
quality / value of
CO2 reducing
components for
ICEVs
(Δ) competitiveness
of CO2 reducing
technologies for
ICEVs
(Δ) competitiveness
of AFV powertrain
related components
quality / value of
AFV powertrain
related components
utility parameter
CO2 legislation
utility based
target function
derogations
super-credits
eco-innovations
target
target
for OEM
OEM compliance
strategies related to
suppliers
increasing
shares of AFVs
applying eco-
innovations
(Δ) competitiveness
Supplier network
Facilities
Patents
Knowledge
Finance
Product portfolio
Customer
base
Δ long term cost
competitiveness of
company
excess
emissions
premiums
applying
additional CO2
reducing
technologies to
ICEVs
price of CO2 reducing
components for ICEVs
Δ price of AFVs
powertrain related
components
Δ quality / value of
AFVs powertrain
related components
quality / value of CO2
reducing components
for ICEVs
Δ short term cost
competitiveness of
company
Impact of changes in short
term competitiveness on long
term competitiveness are
determined through impacts
on various resources and
capabilities
Ability to
produce at
lower costs than
competitor
Ability to sell at
lower price than
competitor
Ability to
maintain current
customers even
when sales price
is higher
In case better
competitive
position results in
higher profits
Ability to
(temporarily)
absorb losses
Ability to sell
licenses
additional demand
for CO2 reducing
technologies for
ICEVs
additional demand
for AFV
components
Other compliance
strategies (using flexibilities
or applying for derogation)
do not affect suppliers
additional demand
eco-innovation
related
technologies
Ability to
develop required
components
Legislation & OEM compliance strategies Effects of resources/capabilities & legislation/OEM compliance strategies on competitiveness
Resources & capabilities
Automotive component & material suppliers Automotive component & material suppliers
Δ sales volumes
Δ profitability
Sales volumes
affect profitability of
production and of
sales operations
Sales volumes affect
cost of production and
profitability of
production facilities

Assessment of competitiveness impacts of post-2020 LDV CO2 regulation
Final Report Valdani Vicari & Associati (VVA), Technopolis Group (TG), Joint Institute for Innovation Policy (JIIP), TNO for DG CLIMA 124
Figure 26 – Decomposition of relevant resources and capabilities of automotive supply companies as basis for determining regional differences that may lead to cost competitiveness impacts
If p
rice
cro
ss-e
lasticitie
s o
r p
rofit m
arg
ins a
re
diffe
ren
t in
diffe
ren
t m
ark
et se
gm
en
ts, th
en
cro
ss-s
ub
sid
isin
g w
ith
co
mp
on
en
ts in
se
gm
en
ts w
ith
re
lative
ly h
igh
ela
sticity o
r p
rofit
ma
rgin
s is p
ossib
le.
Co
mp
on
en
ts fo
r A
FV
po
we
rtra
ins a
lre
ad
y in
po
rtfo
lio
Ge
og
rap
hic
al sa
les
dis
trib
utio
n
Lo
ya
lty o
f
cu
sto
me
rs
Kn
ow
led
ge
of A
FV
po
we
rtra
in r
ela
ted
co
mp
on
en
ts
Kn
ow
led
ge
of C
O2
red
uctio
n te
ch
no
log
ies
for
ICE
Vs
Pa
ten
ts in
lo
w C
O2
em
issio
n te
ch
no
log
y
(IC
EV
or
alte
rna
tive
s)
Ne
t w
ort
h
Fle
xib
ility
to
ch
oo
se
diffe
ren
t
su
pp
liers
Effic
ien
cy o
f p
rod
uctio
n
of su
pp
liers
Inte
rest ra
te
Re
so
urc
es
Ca
pa
bili
tie
s
Ab
ility
to
cro
ss-
su
bsid
ise
ove
r p
ort
folio
Ab
ility
to
in
cre
ase
sa
les
sh
are
of A
FV
po
we
rtra
in c
om
po
ne
nts
Wid
th o
f p
rod
uct
po
rtfo
lio
Ab
ility
to
ch
ea
ply
to
str
en
gth
en
re
so
urc
es /
ca
pa
bili
tie
s
Ab
ility
to
use
eq
uity t
o
str
en
gth
en
reso
urc
es /
ca
pa
bili
tes
Ab
ility
to
ge
ne
rate
ca
pita
l fr
om
lic
en
sin
g
Ab
ility
to
se
ll im
po
ve
d /
ne
w c
om
po
ne
nts
to
cu
rre
nt cu
sto
me
rs
Po
rtfo
lio
Cu
sto
me
r b
ase
(ca
r m
an
ufa
ctu
rers
)
Fin
an
ce
Kn
ow
led
ge
Pa
ten
ts
Su
pp
liers
(su
b-c
om
po
ne
nts
/
ma
teria
ls)
Sa
les to
EU
OE
Ms
Sa
les to
no
n-E
U
OE
Ms
(str
ing
en
cy o
f)
CO
2 r
ela
ted
leg
isla
tio
n in
oth
er
reg
ion
s
Ab
ility
to
ach
ieve
eco
no
mie
s o
f sca
le o
f
tech
no
log
ies n
ee
de
d to
me
et E
U-t
arg
et
Ab
ility
to
be
ar
losse
s
resu
ltin
g fro
m n
ot
tra
nsfe
rrin
g c
osts
to
en
d u
se
rs
Ab
ility
to
co
ntr
ol co
sts
of C
O2 r
ed
uctio
n
tech
no
log
ies
Ab
ility
to
pu
rch
ase
ma
teria
ls a
nd
su
bco
mp
on
en
ts a
t
low
er
price
Exte
rna
litie
s
Oth
er
kn
ow
led
ge
Ab
ility
to
in
cre
ase
sa
les
sh
are
of C
O2 r
ed
uctio
n
tech
no
log
ies fo
r IC
EV
s
Ab
ility
to
ma
nu
factu
re
co
mp
on
en
ts a
t lo
we
r
co
sts
co
mp
are
d to
co
mp
etito
r(s)
Ab
ility
to
se
ll
co
mp
on
en
ts a
t lo
we
r
co
sts
co
mp
are
d to
co
mp
etito
r(s)
Ab
ility
to
ma
inta
in
cu
rre
nt cu
sto
me
rs
eve
n w
he
n s
ale
s
price
is h
igh
er
Ab
ility
to
(te
mp
ora
rily
)
ab
so
rb lo
sse
s
Ab
ility
to
cro
ss-
su
bsid
ise
pro
du
cts
inte
r-re
gio
na
lly
Mo
no
po
ly o
f
su
pp
liers
Co
ntr
acts
with
sp
ecific
su
pp
lier(
s)
Ab
ility
to
de
ve
lop
co
mp
on
en
ts fo
r
imp
rove
d IC
EV
s a
nd
AF
Vs
R&
D c
ap
acity
Pro
du
ct p
ort
folio
of
exis
tin
g s
up
plie
rsA
cce
ss to
re
qu
ire
d
co
mp
on
en
ts
Pro
du
ct p
ort
folio
of a
lte
rna
tive
su
pp
liers
CO
2 r
ed
uctio
n
tech
no
log
ies fo
r IC
EV
s
alre
ad
y in
po
rtfo
lio
Sh
are
of E
U m
ark
et
in s
ale
s o
f
cu
sto
me
rs
Sh
are
of n
on-E
U
ma
rke
ts in
sa
les o
f
cu
sto
me
rs
Ab
ility
to
se
ll syste
ms
rath
er
tha
n
co
mp
on
en
ts
Co
st o
f m
ate
ria
ls
Price
of re
qu
ire
d
co
mp
on
en
ts /
ma
teria
ls
Au
tom
otive
ma
teria
l a
nd
co
mp
on
en
t su
pp
liers
Ab
ility
to
se
ll p
ate
nts
Re
gio
na
l a
va
ilab
ility
of q
ua
lifie
d s
taff
Re
gio
na
l
kn
ow
led
ge
infr
astr
uctu
re(s
)
Effic
ien
cy o
f
pro
du
ctio
n
facili
tie
s
Sh
are
of o
wn
co
mp
on
en
t p
rod
uctio
n
Ge
og
rap
hic
al d
istr
ibu
tio
n
of p
rod
uctio
n fa
cili
tie
s
Fa
cili
tie
s
(R&
D/m
anu
fact
uri
ng/
asse
mb
ly)
Co
mp
an
y ta
xe
s
Am
ou
nt o
f la
bo
ur
pe
r u
nit p
rod
uct
Eq
uip
me
nt, t
oo
ls
an
d b
uild
ing
s
Ove
rhe
ad
activitie
s
La
bo
ur
co
sts
pe
r
un
it p
rod
uct
Ca
pita
l co
sts
pe
r
un
it p
rod
uct
Ove
rhe
ad
co
sts
pe
r u
nit p
rod
uct
Re
gio
na
l w
ag
e
leve
ls
Re
gio
na
l co
st o
f
ca
pita
l
Re
gio
na
l
reg
ula
tio
ns
Re
gio
na
l co
mp
an
y
tax le
ve
ls
Ma
nu
factu
rin
g
co
sts
pe
r u
nit
pro
du
ct
R&
D c
osts
fo
r
de
ve
lop
ing
im
pro
ve
d
ICE
Vs a
nd
AF
Vs
Am
ou
nt o
f te
ch
no
log
ies /
of p
rod
uct fo
r w
hic
h R
&D
is n
ece
ssa
ry
Ne
ed
to
acq
uire
lice
nse
sC
osts
of lic
en
se
s

Assessment of competitiveness impacts of post-2020 LDV CO2 regulation
Final Report Valdani Vicari & Associati (VVA), Technopolis Group (TG), Joint Institute for Innovation Policy (JIIP), TNO for DG CLIMA 125
If p
rice
cro
ss-e
lasticitie
s o
r p
rofit m
arg
ins a
re
diffe
ren
t in
diffe
ren
t m
ark
et se
gm
en
ts, th
en
cro
ss-s
ub
sid
isin
g w
ith
co
mp
on
en
ts in
se
gm
en
ts w
ith
re
lative
ly h
igh
ela
sticity o
r p
rofit
ma
rgin
s is p
ossib
le.
Co
mp
on
en
ts fo
r A
FV
po
we
rtra
ins a
lre
ad
y in
po
rtfo
lio
Ge
og
rap
hic
al sa
les
dis
trib
utio
n
Lo
ya
lty o
f
cu
sto
me
rs
Kn
ow
led
ge
of A
FV
po
we
rtra
in r
ela
ted
co
mp
on
en
ts
Kn
ow
led
ge
of C
O2
red
uctio
n te
ch
no
log
ies
for
ICE
Vs
Pa
ten
ts in
lo
w C
O2
em
issio
n te
ch
no
log
y
(IC
EV
or
alte
rna
tive
s)
Ne
t w
ort
h
Fle
xib
ility
to
ch
oo
se
diffe
ren
t
su
pp
liers
Effic
ien
cy o
f p
rod
uctio
n
of su
pp
liers
Inte
rest ra
te
Re
so
urc
es
Ca
pa
bili
tie
s
Ab
ility
to
cro
ss-
su
bsid
ise
ove
r p
ort
folio
Ab
ility
to
in
cre
ase
sa
les
sh
are
of A
FV
po
we
rtra
in c
om
po
ne
nts
Wid
th o
f p
rod
uct
po
rtfo
lio
Ab
ility
to
ch
ea
ply
to
str
en
gth
en
re
so
urc
es /
ca
pa
bili
tie
s
Ab
ility
to
use
eq
uity t
o
str
en
gth
en
reso
urc
es /
ca
pa
bili
tes
Ab
ility
to
ge
ne
rate
ca
pita
l fr
om
lic
en
sin
g
Ab
ility
to
se
ll im
po
ve
d /
ne
w c
om
po
ne
nts
to
cu
rre
nt cu
sto
me
rs
Po
rtfo
lio
Cu
sto
me
r b
ase
(ca
r m
an
ufa
ctu
rers
)
Fin
an
ce
Kn
ow
led
ge
Pa
ten
ts
Su
pp
liers
(su
b-c
om
po
ne
nts
/
ma
teria
ls)
Sa
les to
EU
OE
Ms
Sa
les to
no
n-E
U
OE
Ms
(str
ing
en
cy o
f)
CO
2 r
ela
ted
leg
isla
tio
n in
oth
er
reg
ion
s
Ab
ility
to
ach
ieve
eco
no
mie
s o
f sca
le o
f
tech
no
log
ies n
ee
de
d to
me
et E
U-t
arg
et
Ab
ility
to
be
ar
losse
s
resu
ltin
g fro
m n
ot
tra
nsfe
rrin
g c
osts
to
en
d u
se
rs
Ab
ility
to
co
ntr
ol co
sts
of C
O2 r
ed
uctio
n
tech
no
log
ies
Ab
ility
to
pu
rch
ase
ma
teria
ls a
nd
su
bco
mp
on
en
ts a
t
low
er
price
Exte
rna
litie
s
Oth
er
kn
ow
led
ge
Ab
ility
to
in
cre
ase
sa
les
sh
are
of C
O2 r
ed
uctio
n
tech
no
log
ies fo
r IC
EV
s
Ab
ility
to
ma
nu
factu
re
co
mp
on
en
ts a
t lo
we
r
co
sts
co
mp
are
d to
co
mp
etito
r(s)
Ab
ility
to
se
ll
co
mp
on
en
ts a
t lo
we
r
co
sts
co
mp
are
d to
co
mp
etito
r(s)
Ab
ility
to
ma
inta
in
cu
rre
nt cu
sto
me
rs
eve
n w
he
n s
ale
s
price
is h
igh
er
Ab
ility
to
(te
mp
ora
rily
)
ab
so
rb lo
sse
s
Ab
ility
to
cro
ss-
su
bsid
ise
pro
du
cts
inte
r-re
gio
na
lly
Mo
no
po
ly o
f
su
pp
liers
Co
ntr
acts
with
sp
ecific
su
pp
lier(
s)
Ab
ility
to
de
ve
lop
co
mp
on
en
ts fo
r
imp
rove
d IC
EV
s a
nd
AF
Vs
R&
D c
ap
acity
Pro
du
ct p
ort
folio
of
exis
tin
g s
up
plie
rsA
cce
ss to
re
qu
ire
d
co
mp
on
en
ts
Pro
du
ct p
ort
folio
of a
lte
rna
tive
su
pp
liers
CO
2 r
ed
uctio
n
tech
no
log
ies fo
r IC
EV
s
alre
ad
y in
po
rtfo
lio
Sh
are
of E
U m
ark
et
in s
ale
s o
f
cu
sto
me
rs
Sh
are
of n
on-E
U
ma
rke
ts in
sa
les o
f
cu
sto
me
rs
Ab
ility
to
se
ll syste
ms
rath
er
tha
n
co
mp
on
en
ts
Co
st o
f m
ate
ria
ls
Price
of re
qu
ire
d
co
mp
on
en
ts /
ma
teria
ls
Au
tom
otive
ma
teria
l a
nd
co
mp
on
en
t su
pp
liers
Ab
ility
to
se
ll p
ate
nts
Re
gio
na
l a
va
ilab
ility
of q
ua
lifie
d s
taff
Re
gio
na
l
kn
ow
led
ge
infr
astr
uctu
re(s
)
Effic
ien
cy o
f
pro
du
ctio
n
facili
tie
s
Sh
are
of o
wn
co
mp
on
en
t p
rod
uctio
n
Ge
og
rap
hic
al d
istr
ibu
tio
n
of p
rod
uctio
n fa
cili
tie
s
Fa
cili
tie
s
(R&
D/m
anu
fact
uri
ng/
asse
mb
ly)
Co
mp
an
y ta
xe
s
Am
ou
nt o
f la
bo
ur
pe
r u
nit p
rod
uct
Eq
uip
me
nt, t
oo
ls
an
d b
uild
ing
s
Ove
rhe
ad
activitie
s
La
bo
ur
co
sts
pe
r
un
it p
rod
uct
Ca
pita
l co
sts
pe
r
un
it p
rod
uct
Ove
rhe
ad
co
sts
pe
r u
nit p
rod
uct
Re
gio
na
l w
ag
e
leve
ls
Re
gio
na
l co
st o
f
ca
pita
l
Re
gio
na
l
reg
ula
tio
ns
Re
gio
na
l co
mp
an
y
tax le
ve
ls
Ma
nu
factu
rin
g
co
sts
pe
r u
nit
pro
du
ct
R&
D c
osts
fo
r
de
ve
lop
ing
im
pro
ve
d
ICE
Vs a
nd
AF
Vs
Am
ou
nt o
f te
ch
no
log
ies /
of p
rod
uct fo
r w
hic
h R
&D
is n
ece
ssa
ry
Ne
ed
to
acq
uire
lice
nse
sC
osts
of lic
en
se
s

Assessment of competitiveness impacts of post-2020 LDV CO2 regulation
Final Report Valdani Vicari & Associati (VVA), Technopolis Group (TG), Joint Institute for Innovation Policy (JIIP), TNO for DG CLIMA 126
Knowledge / technology position of the supplier and the resulting efforts required to improve
knowledge / technology position
The R&D and other efforts, carried out by suppliers to develop products for vehicles meeting LDV CO2
targets, can be divided in general R&D to develop the required technologies required as well as the general
skills for manufacturing these technologies.
If OEMs require similar products from different suppliers, then differences in required R&D efforts between
EU and non-EU suppliers could in principle result from:
differences in the current technology position of OEMs (technologies already developed, patents);
differences in the access to suppliers that can deliver the required sub-technologies;
o see under “supplier base”
In the stakeholder consultation European suppliers have indicated that Asian suppliers have better
knowledge and skills in electrification and in particular batteries. As a result they may have a competitive
advantage over European suppliers if EU LDV CO2 regulation would lead to an increased electrification of
powertrains.
R&D capacity
A supplier’s capacity to carry out R&D and to innovate is e.g. influenced by regional factors such as:
the ability to invest in R&D (see next subsection)
available R&D facilities
availability, focus and quality of the regional knowledge infrastructure (universities, R&D companies);
availability of trained personnel with the required knowledge and skills.
As was also concluded with respect to the R&D capacity of OEMs, the conditions for carrying out R&D are
good in Europe and do not give rise to concerns over cost competitiveness impacts.
In the stakeholder consultation automotive suppliers have indicated that in the EU the availability of trained
R&D staff with the required knowledge and skills may become a limiting factor.
Financial position, determining the ability to invest in the required R&D and product development
With respect to the “finance” resource the EU LDV CO2 legislation could be considered to have an impact on
the cost competitiveness of European suppliers if:
the legislation would affect the profitability of EU suppliers more than of non-EU OEMs, or
the financial position of EU suppliers is different from that of non-EU suppliers to begin with.
The first case could occur if post-2020 EU LDV CO2 legislation would lead to a significant change in the
overall sales in the EU. Reduced sales of cars lead to lower sales of components. As EU suppliers have a
high share of EU OEMs as clients, which turn have a higher share of their sales in the EU than non-EU
OEMs, EU suppliers would be more strongly impacted by a change in EU car sales. The extent to which this
is likely to occur depends on the target level, the additional costs of technologies for advanced ICEVs and
AFVs that are needed to meet the target, and the impact of those additional costs on car sales.

Assessment of competitiveness impacts of post-2020 LDV CO2 regulation
Final Report Valdani Vicari & Associati (VVA), Technopolis Group (TG), Joint Institute for Innovation Policy (JIIP), TNO for DG CLIMA 127
Counteracting this would be a greater dependence on suppliers for higher technology components and
systems.
The second situation could be the case if EU suppliers are, similarly to EU manufacturers, more severely
affected by the economic crisis than their non-EU competitors. Given that most of the main suppliers are
global players, however, this situation is less likely than in the case of automotive manufacturers.
For the financial capabilities of companies to invest in R&D also the cost of acquiring capital are relevant. In
section A2.4 it is stated that in the beginning of 2014 the cost of capital for European suppliers companies
was reported to be on average slightly higher than for non-European competitors. The question is whether
such differences are still likely to exist in the 2020-2025 timeframe.
Supplier base
Differences in the R&D effort required between EU and non-EU suppliers could in principle result from
differences in the access to suppliers of sub-technologies that are needed for the development of
components and materials for advanced ICEVs and AFVs. It appears that Tier 1 non-EU suppliers have a
stronger position in technologies for electric powertrains while EU suppliers have a stronger position in diesel
engine technology, it is likely that such differences also exist for their Tier 2 suppliers.
Width of product portfolio
A wide product portfolio, in terms of supplying components for a wide range of powertrain technologies,
could require suppliers to innovate a large share of their components. This could hinder their ability to
develop the required new components or increase the costs for development per unit manufactured. In
relation to this suppliers have indicated in the stakeholder consultation that post-2020 EU LDV CO2
legislation will lead to a strong diversification in powertrain technologies and configurations, which in turn
demands increased diversification of components. The ability of the automotive supply industry to develop
an increasing number of new products will be strongly determined by the rate of innovation that is required,
which in turn is determined by the target levels of post-2020 CO2 regulation. To what extent the ability to
diversify is different for EU and non-EU suppliers is unclear. In second order this may relate to their financial
positions, which may be different as EU OEMs and their suppliers have been more severely affected by the
economic crisis than their non-EU competitors. To what extent this remains the case in the period up to the
new post-2020 target years is a question.
Ability to manufacture at competitive costs
A supplier’s ability to manufacture more components and materials for efficient ICEVs and AFVs in a cost-
competitive manner is influenced by a range of factors:
aspects of the knowledge / technology position of the supplier
technologies already developed or even marketed (providing experience and economies of
scale)
costs of (acquiring) licences
manufacturing costs for CO2 reducing technologies for ICEVs and AFVs
costs of materials

Assessment of competitiveness impacts of post-2020 LDV CO2 regulation
Final Report Valdani Vicari & Associati (VVA), Technopolis Group (TG), Joint Institute for Innovation Policy (JIIP), TNO for DG CLIMA 128
costs for purchasing (sub)components
cost efficiency of production facilities determined by e.g.:
o direct overhead and labour costs
o equipment and tooling costs
o other costs such as operation and maintenance of buildings
impact of economies of scale
Below for each of these factors an assessment is made of the extent to which regional differences can give
rise to differences in the compliance costs for EU and non-EU suppliers to an extent that the relative price
ratio of their products is affected.
Portfolio - Technologies already developed or even marketed
The question is whether EU and non-EU suppliers have a different position in the marketing of technologies
that are relevant for meeting longer term legislative targets. Similar to EU OEMs, EU suppliers have a
stronger position in diesel technology. On technologies such as engine down-sizing, direct injection petrol
engines, aerodynamics or lightweight materials differences are less apparent or EU manufacturers may even
be in a stronger position. It is claimed that Asian suppliers have a stronger position in components for electric
powertrains.
Costs of (acquiring) licences
If component manufacturers wish to apply technologies for CO2 reduction which are patented by other
companies, there may be costs involved for acquiring the licence to produce these technologies or for buying
the patents. The other way around, component manufacturers that own patents for technologies that other
companies wish to apply may generate revenue from licencing or from selling these patents. Therefore, if
future CO2 legislation would require the widespread application of technologies for which suppliers from
Europe have more / less patents than non-EU suppliers, this would have positive / negative impacts on the
cost competitiveness of EU suppliers. This pathway strengthens the impacts of differences in technology
positions.
There is evidence that the costs of patenting is significantly higher in Europe than in other regions20
, due to
the need to have patents translated and validated by a large number of national patent offices. This could
hamper EU companies in generating revenues from licensing.
Manufacturing costs for CO2 reducing technologies for ICEVs and AFVs
Overall the possible factors that determine (regional differences in) component manufacturing costs are the
same as for the manufacturing of vehicles by OEMs. For components for CO2 reduction in ICEVs and for
AFVs differences in the manufacturing costs for EU and non-EU suppliers depend on the efficiency of their
production facilities and on a range of factors that relate to the geographic location of their facilities. The
latter include regional differences in e.g. labour costs and taxes as well as transport costs for bringing
components produced outside the EU to European countries. Economies of scale also come into play, as
these influence the cost efficiency of production facilities. All these factors are further explored in the
paragraphs below.

Assessment of competitiveness impacts of post-2020 LDV CO2 regulation
Final Report Valdani Vicari & Associati (VVA), Technopolis Group (TG), Joint Institute for Innovation Policy (JIIP), TNO for DG CLIMA 129
The extent to which regional differences in cost factors for production can affect cost competiveness of
suppliers depends on the share of regionally different costs in the total costs of manufacturing materials and
components, and on whether these shares change as a result of the CO2 legislation.
Geographical distribution of facilities: Impact of regional differences in cost of labour and other cost
factors
As for OEMs, the fact that labour and other cost factors differ between regions does not automatically lead to
cost competitiveness impacts of the EU CO2 legislation on automotive suppliers. The price ratio of competing
products, however, can be affected if the ratio of the different cost components for manufacturing the new
technologies, demanded by OEMs for meeting post-2020 CO2 targets, differs from that in the existing
products. For many technologies needed to make ICEVs more efficient this is not expected as they concern
improvements of existing components or technologies. More advanced technologies, such as components
for electric, hybrid or fuel cell propulsion systems or application of advanced lightweight materials may
require more or less labour in the manufacturing or disproportionately higher or lower tooling costs, and may
thus alter the ratio of various cost components of manufacturing.
Regional differences in labour costs could be caused by regional differences in the availability of labour with
specific skills required for developing and manufacturing components and materials for advanced ICEVs and
AFVs or their components. This is specifically the case if there is scarcity of such skilled labourers and
depends on the ability to recruit from elsewhere. In general this can be considered a temporary effect, but it
could affect costs over timescales that are relevant to the CO2 regulation.
Equipment and tooling costs and other costs such as operation and maintenance of buildings
Geographical differences in labour costs indirectly also affect equipment and tooling costs and other costs
such as operation and maintenance of buildings. Equipment and tooling costs are also affected by the cost
of capital.
Economies of scale
The impact of economies of scale on the costs of manufacturing components for advanced ICEVs or AFVs
depends on the total number of vehicles to which these components are applied. That in turn depends on a
supplier's sales to EU and non-EU OEMs and their sales volumes of vehicles with these advanced
technologies in the EU and other regions markets.
Sales volumes of vehicles with advanced CO2-reducing technologies in the EU market depend on the target
set for the post-2020 legislation and the way in which various modalities (e.g. the metric) affect the
compliance strategies chosen by OEMs.
Sales volumes of advanced technologies in other regions depend on:
sales volumes of OEMs in other regions;
whether markets in these regions are subject to CO2 regulations of similar or different stringency to the
EU LDV CO2 legislation. An overview of passenger car regulations in different regions is provided in
Figure 8 in section 4.2.

Assessment of competitiveness impacts of post-2020 LDV CO2 regulation
Final Report Valdani Vicari & Associati (VVA), Technopolis Group (TG), Joint Institute for Innovation Policy (JIIP), TNO for DG CLIMA 130
If the client base of European suppliers is dominated by European OEMs, then more stringent regulation in
the EU compared to other regions may be expected to lead to higher economies of scale for EU suppliers
than for non-EU suppliers manufacturing components for vehicles for the EU market from non-EU OEMs.
This would thus constitute a positive cost competitiveness impact.
Costs of materials / costs for purchasing (sub)components
Post-2020 CO2 legislation is likely to affect the demand by suppliers for certain materials and
(sub)components. Differences in component costs for EU and non-EU suppliers could result from regional
differences in the costs of materials and (sub)components. Such regional differences do exist as the cost
factors affecting the costs of (producing) materials or (sub)components (e.g. the cost of energy and the cost
of labour) are different in different regions.
The market for materials and components, however, can be considered a global market, meaning that all
suppliers in principle have access to products of most or all material and sub-component (Tier 2) suppliers
worldwide. If that is the case only different costs associated with transporting materials or components from
the supplier to manufacturers in different regions would effectively lead to regionally different costs for
materials or components.
If CO2 legislation leads to a change in the demand for materials and (sub)components, Tier 1 suppliers may
be expected to adapt their supplier base in order to be able to purchase these materials and
(sub)components at competitive costs.
Ability to sell at competitive prices
The ability to sell components and materials for efficient ICEVs or AFVs at a competitive price depends on a
range of factors including:
the manufacturing costs of the components and materials;
the impact of R&D costs on price of the components and materials;
the ability to cross-subsidize within the product portfolio;
the ability to absorb losses.
The additional manufacturing costs in different segments or models
Possible causes of regional differences in the costs of manufacturing components and materials for low-CO2
ICEVs and AFVs have been discussed above.
Impact of R&D costs on the price of components and materials
The magnitude of the required R&D costs associated with developing products that meet the requirements of
OEMs, associated with their need to meet post-2020 EU LDV CO2 targets, may be different for different
suppliers. The regional aspects that may lead to regional differences in R&D costs are the same as those
discussed in relation to the impact of R&D capacity on the ability to develop components and materials for
improved ICEVs and AFVs (see above).

Assessment of competitiveness impacts of post-2020 LDV CO2 regulation
Final Report Valdani Vicari & Associati (VVA), Technopolis Group (TG), Joint Institute for Innovation Policy (JIIP), TNO for DG CLIMA 131
The ways in which R&D costs can be passed through and their impact on component prices may depend on
(the stringency of) CO2 legislation in other regions, the resulting size of the sales of components for
advanced ICEVs and AFVs worldwide, and on the sales of other components by suppliers for the EU market
and markets in other regions.
If European legislation is much tighter than that in other regions, suppliers need to make specific R&D
efforts for components to be applied to cars sold in Europe. The R&D costs resulting from EU LDV CO2
standards can be considered relatively independent of the amount of cars sold in Europe. Suppliers can
choose to pass on those costs to the CO2-reducing technologies for vehicles sold in Europe only or
distribute them over their worldwide sales. In both cases differences in sales volumes for European
vehicles or vehicles sold in other regions affect the way in which additional R&D costs may affect the
prices of products of competing companies.
If other regions have legislation of similar stringency to the EU, and if suppliers decide to pass through
R&D costs for meeting those standards only to components for vehicles sold in markets where the
standards apply, the R&D costs can be divided over a larger amount of components. Suppliers delivering
components to OEMs that mainly sell cars in the EU may have a disadvantage over suppliers that also
sell components for cars sold in other regions with similar legislation.
The costs of bringing products to the market including international transport costs and tariffs
Transport costs and tariffs depend on the location of production of the components and the locations of
vehicle manufacturing plants of the OEMs to which these components are supplied. No impact on cost
competitiveness is expected from this cost factor, as for components for advanced ICEVs and AFVs the ratio
of transport costs for EU and non-EU suppliers is expected to be roughly the same as for components
supplied for use in vehicles with today’s technology.
Width of product portfolio
A wide portfolio of components, in terms of supplying many different components for the same powertrain
technologies, may enable suppliers to sell systems (packages of components) rather than single
components. This not only means that benefits of system integration can achieved, but it also allows the
supplier to grasp a larger share of the automotive value chain. There is no information available on which to
judge whether the abilities of EU suppliers in this respect differ from those of non-EU suppliers. One could
imagine, however, that close proximity of component or system manufacturing plants to vehicle
manufacturing plants could be a benefit as it enables larger sub-systems to be supplied and improves
reliability, responsiveness and reduces inventory. This could provide a competitive advantage for EU
suppliers.
The additional costs of new components for advanced ICEVs and AFVs do not necessarily need to be
passed on one-on-one to the prices of these components. Suppliers can choose to divide costs over their
product portfolio in a way that suits the ability of different market segments to absorb these costs or over
time. The width of a supplier’s product portfolio determines the ability of a supplier to apply cross-
subsidisation. Costs can also be distributed over a longer time when EU stringency is in advance of non-EU
legislation. Technology can be licenced to or produced in other regions later.

Assessment of competitiveness impacts of post-2020 LDV CO2 regulation
Final Report Valdani Vicari & Associati (VVA), Technopolis Group (TG), Joint Institute for Innovation Policy (JIIP), TNO for DG CLIMA 132
The ability to absorb losses
Finally suppliers can decide not to pass through all costs to their customers in which case this reduces the
profitability of the company. The ability of companies to (temporarily) absorb losses depends on their
financial position. This aspect is further discussed below.
Ability to sell new products to customers / maintain customer base
Customer loyalty in a business-to-business market is obviously a different issue than in the consumer
market. The extent to which OEMs are willing to buy components for advanced ICEVs and AFVs from their
existing suppliers, even if these might be more expensive than those offered by competing suppliers,
depends on other factors than costs that determine the relationship between supplier and OEM. These
factors may include quality of the products, supplier proximity to OEM production plants (especially for larger
systems with higher transport costs), the flexibility of the supplier to respond to changing OEM needs, joint
R&D programmes, ownership / shareholder relations, etc.. Cost competitiveness impacts could occur if EU
OEMs would e.g. be more inclined than non-EU OEMs to switch to alternative suppliers if these can deliver
components at lower costs. No information is available upon which one can judge whether there are regional
differences in these relationships.
In this context it is also interesting to look at the extent that EU manufacturers will be able to market vehicles
that are developed for meeting EU CO2 standards in other regions. This not only depends on the CO2
regulation in those countries, but also on fuel prices. As fuel prices are generally higher in the EU than in
other regions levels (due to higher tax levels), improvements in the fuel efficiency of vehicles resulting from
compliance to increasingly stringent targets will generate higher fuel cost savings for EU end-users than for
users of similar LDVs in other regions (and thus shorter payback times). This means that LDVs developed to
meet EU CO2 standards are less attractive in other regions, especially if CO2 legislation there is more lenient.
Consequently EU manufacturers may need to differentiate their production in LDVs for the EU market (with
CO2 reducing technologies) and LDVs for other markets (with less added CO2 reducing technologies). This,
however, reduces economies of scale compared to a situation in which vehicles for both markets are the
same. The net effect on costs of LDVs manufactured for other markets depends on a balance between lower
costs for additional technologies and higher production costs due to lower economies of scale.
Ability to invest or to absorb (temporary) losses
If a given supplier meeting the changing demands of OEMs for complying with EU CO2 regulations requires
significant investments in R&D, product development and production facilities, these upfront costs need to be
financed by the supplier. The company’s financial reserves and borrowing capacity determine its ability to
make the necessary investments.
If these costs cannot subsequently be fully passed on to customers through the price of the products, these
costs would have to be absorbed by the supplier reducing their profit. Absorbing losses may be necessary
for a short period of time (e.g. until sufficient costs reductions have been achieved to make the component
costs competitive) or during a longer period of time. Reduced profits affect a company’s financial health and
therefore have a long term effect on cost competitiveness, e.g. through a reduced ability to invest in R&D
and product development.

Assessment of competitiveness impacts of post-2020 LDV CO2 regulation
Final Report Valdani Vicari & Associati (VVA), Technopolis Group (TG), Joint Institute for Innovation Policy (JIIP), TNO for DG CLIMA 133
The financial position of EU suppliers may be worse than that of non-EU suppliers for a number of reasons.
This is a potential pathway for cost competitiveness impacts provided that this situation remains valid in the
coming decade up to the target year for the post-2020 legislation.
7.3 Conclusions on cost competitiveness impacts from the perspective of
component manufacturers
Conclusions on cost competitiveness impacts from the perspective of component manufacturers are
summarized in Table 8.
Table 8 - Summary of possible cost competitiveness impacts for automotive suppliers associated with regional differences in resources and resulting capabilities
Capability Resource Impact Comments / questions
Ability to
develop
components
for improved
ICEVs and
AFVs
R&D capacity Yes - Stakeholders foresee a shortage in the EU of R&D
personnel with the skills needed for technologies that are
necessary to meet post-2020 CO2 targets.
Patent position Maybe ? Non-EU suppliers have a stronger patent position in
technologies for electric and hybrid vehicles.
Financial position Yes - Profitability and financial position of EU suppliers is
currently more strongly affected by economic crisis than
of non-EU competitors
Portfolio width Maybe ? Amount of required R&D determined by amount of CO2-
related products in portfolio.
CO2 legislation likely to lead to powertrain diversification
requiring product diversification from suppliers.
o To what extent that affects the ability to develop
products and leads to cost competitiveness
impacts depends on possible differences in the
financial situation of EU and non-EU suppliers.
Supplier base Maybe ? EU Tier 1 suppliers have stronger focus on diesel
technology, while non-EU suppliers have a stronger
position in electric powertrain components.
This difference may apply also to their Tier 2 suppliers.
Ability to
manufacture
at competitive
costs
Ability to scale up
production of
technologies
already developed
Yes - EU Tier 1 suppliers have stronger focus on diesel
technology, while non-EU suppliers have a stronger
position in electric powertrain components.
Cost of licences Yes +/- If future CO2 legislation would require the widespread
application of technologies for which OEMs from Europe
have more / less patents than non-EU OEMs, this would
have positive / negative impacts on the cost
competitiveness of EU manufacturers.
This pathway strengthens the impacts of differences in
technology positions.
Labour costs Maybe ? There are large regional differences in labour costs. But

Assessment of competitiveness impacts of post-2020 LDV CO2 regulation
Final Report Valdani Vicari & Associati (VVA), Technopolis Group (TG), Joint Institute for Innovation Policy (JIIP), TNO for DG CLIMA 134
Capability Resource Impact Comments / questions
these only impact cost competitiveness if the share of
labour costs in component manufacturing changes as a
result of compliance strategies for meeting CO2 targets.
o This may be the case if the targets require
significant shares of AFVs or e.g. application of
light-weight composites.
Equipment and
tooling costs
Maybe ? Possible impacts partly related to economies of scale (see
below)
Economies of
scale
Maybe ? Depending on sales volumes of components to EU and
non-EU OEMs, which are determined by the customer
base of EU and non-EU suppliers and by the stringency of
CO2 legislation in EU and other regions.
Cost of materials
and
(sub)components
Maybe
(small)
? Regional differences in costs of materials that need to be
sourced regionally.
Different transport costs for materials that can be sourced
globally.
Ability to sell
at competitive
prices
Manufacturing
costs
Maybe ? see above
Impact of R&D
costs on price
Maybe ? Depending on whether EU target is more stringent or not
the impact on the cost competitiveness of EU suppliers
may be positive or negative.
o Relates to the amount of components over which
R&D costs associated with CO2 legislation can
be divided.
Costs of bringing
products to the
market
No .
Ability to cross-
subsidize within
portfolio
Maybe ? Overall portfolio width may be different for suppliers from
different regions.
Ability to absorb
losses
Yes - Related to financial position of European suppliers; see
below
Ability to sell
new products /
maintain
customer
base
Customer loyalty Unknown No information is available upon which one can judge
whether there are regional differences in OEM-supplier
relationships.
Ability to
absorb losses
Financial position Yes - Profitability and financial position of EU suppliers is
currently more strongly affected by economic crisis than
of non-EU suppliers

Assessment of competitiveness impacts of post-2020 LDV CO2 regulation
Final Report Valdani Vicari & Associati (VVA), Technopolis Group (TG), Joint Institute for Innovation Policy (JIIP), TNO for DG CLIMA 135
Concerning possible cost competitiveness impacts associated with regional differences in resources and
resulting capabilities of component suppliers the following conclusions have been drawn:
The ability of EU suppliers to develop components for CO2 reduction in passenger cars and vans
appears likely to be less than that of non-EU competitors, specifically if the post-2020 regulation would
increase demand for vehicles with electric powertrains. This is related to their technology position, their
financial position as well as to foreseen shortages in skilled R&D personnel;
The EU suppliers’ weak position in electric powertrain technologies could hamper them in manufacturing
at competitive cost. Factors such as the cost of labour, cost of equipment, economies of scale
associated with the customer base and the stringency of the legislation and the cost of materials could
lead to impacts on cost competitiveness, but the sign and size of these impacts is difficult to estimate;
The ability of EU suppliers to sell at competitive prices may be affected by their limited ability to absorb
(temporary) losses. Other factors such as manufacturing cost, R&D cost per unit of product and the
ability to cross-subsidize over the product portfolio could lead to impacts on cost competitiveness, but
the sign and size of these impacts is difficult to estimate;
The limited ability to absorb losses appears to negatively affect EU supplier cost competitiveness.
Compared to LDV manufacturers the likeliness of negative cost competitiveness impacts for EU suppliers
seems somewhat higher.

Assessment of competitiveness impacts of post-2020 LDV CO2 regulation
Final Report Valdani Vicari & Associati (VVA), Technopolis Group (TG), Joint Institute for Innovation Policy (JIIP), TNO for DG CLIMA 136

Assessment of competitiveness impacts of post-2020 LDV CO2 regulation
Final Report Valdani Vicari & Associati (VVA), Technopolis Group (TG), Joint Institute for Innovation Policy (JIIP), TNO for DG CLIMA 137
8. Impacts on cost competitiveness: the component manufacturing
perspective
8.1 Possible cost competitiveness impact pathways for EU automotive
component manufacturing
A mindmap of impact pathways of post-2020 LDV CO2 legislation on the cost competitiveness of EU
component manufacturing is presented in Figure 27. This mindmap follows the same structure as that
explained in section 6 for assessing cost competitiveness impacts on EU vehicle manufacturing (Figure 23).
As can be seen from Figure 27 also for component manufacturing only a limited number of pathways seem
likely to result in impacts on cost competitiveness of EU manufacturing. Where impacts are possible they
may be positive or negative. Conclusions seem to be quite generic and the same for the car and van
regulation.
Does post-2020 EU LDV CO2 regulation lead to regionally different impacts related to the cost of
materials?
Not directly. The regulation does not directly affect material costs per unit of material as it applies to
LDVs and not to factors that determine the costs of material production.
Indirect pathways are very similar to those identified for LDV manufacturing (see section 6). The size and
sign of possible impacts may, however, be different for component manufacturing as this requires
different materials than LDV manufacturing. An example are materials used for electric powertrain
components, such as lithium for batteries, copper for wiring and rare earth metals for magnets in electric
motors. The access of EU suppliers to such materials may be different than suppliers in e.g. China. This
also means that It may be more likely for component manufacturing than for LDV manufacturing that
indirect effects result from price increases due to (temporary) scarcity of materials resulting from
production capacity not being able to match the increased demand.

Assessment of competitiveness impacts of post-2020 LDV CO2 regulation
Final Report Valdani Vicari & Associati (VVA), Technopolis Group (TG), Joint Institute for Innovation Policy (JIIP), TNO for DG CLIMA 138
Figure 27 – Overview impact pathways on cost competitiveness of EU component manufacturing
Do different cost elements per unit production increase or decrease more in EU
than in other regions to the extent that they affect the cost ratio of components
manufactured in the EU and in other regions?
material
costs
costs of
purchased
(sub)components
labour costs
costs of capital
goods
overheads
management
marketing
logistics
R&D
Does post-2020 LDV CO2
legislation affect ...
directly?
indirectly?
Legislation sets requirements for
cars. It does not directly affect costs
of labour.
2nd
order
assembly / production
RD&E
management &
overheads
Same skill required for alternative mechanical
technologies. In assembly new electrical
components do not require specialized skills
New specialists required with knowledge of
electrical engineering and new materials
No new skills needed for employees with jobs in management and
overhead and no additional personnel required. No administrative
requirements of post-2020 legislation on suppliers.
Developments in these fields are already on-
going in all regions with automotive
development and manufacturing. Unlikely that
these competences would be more/less
available in EU than in other regions
UNLIKELY
NO
NO
NO
directly?
indirectly?
Cost ratio for new (sub)components will be
similar as cost ratio of baseline product
Changing demands from OEMs
require improved or new
(sub)components to be used
NOIf share of cost factors in new (sub)
components is similar to that of baseline
components, e.g. for mechanical components
If share of cost factors in new (sub)
components is different to that of baseline
components, e.g. for electrical components
Differences in labour costs and other cost
factors between EU and other regions may
lead to different cost ratio for these
components
If new (sub)components
for components
manufactured in EU are
produced in EU
If new (sub)components
for components
manufactured outside EU
are produced outside EU
If new (sub)components
for components
manufactured in EU are
produced outside EU
If new (sub)components
for components
manufactured outside EU
are produced in EU
MAYBEAre EU/non-EU ratios for various cost
factors markedly different?
Absolute manufacturing costs of new (sub)
components are the same. But transport costs
are higher for EU supply industry.
YES / -
What’s the size of transport costs from
other regions to EU and how does that
compare to differences in manufacturing
costs in EU and outside EU?
unlikely case
Absolute manufacturing costs of new (sub)
components are the same. But transport costs
are lower for EU supply industry.
YES / +
Indirect effects may come from price
increases due to (temporary) scarcity
of (sub)components resulting from
insufficient production capacity
Δcosts through dependence on
location of production
Δcosts through difference in
economies of scale and learning
effects in EU and other regions
If EU has more / less
stringent LDV CO2 regulation
than other regions
If other regions have LDV
CO2 regulation of similar
stringency
Economies of scale for EU production of
new (sub)components likely to be larger /
smaller than for non-EU production
Economies of scale for EU and non-EU
production of new (sub)components likely
to be similar
Assumption that majority of
(sub)components for EU Tier 1 supply
industry are also manufactured in EU
check if that
assumption is
correct
NO
YES / + or -
indirectly?
directly?
Legislation will lead to
demand for new
materials
1st order
2nd
order
Legislation sets requirements for cars.
It does not directly affect costs of
(producing) materials.
NO
1st order
2nd
order
Legislation sets requirements for cars.
It does not directly affect costs of
producing (sub)components.
NO
1st order
New technologies
may require new
skills
Training costs are a relatively small
fraction of total labour costs
UNLIKELYExisting
employees need
training
Scarcity of employees with new
skills may (temporarily) lead to
higher wages
New employees
must be hired
Total cost ratios between
manufacturing in EU and
other regions may be affected
if one or more cost factors
change as a result of the LDV
CO2 legislation and this
change is different in the EU
than in other regions.
Total cost ratios between
manufacturing in EU and
other regions may be affected
if application of new
technologies or other
activities needed to comply
with LDV CO2 legislation
affect the shares of different
cost factors, and if ratios of
these cost factors for EU vs
other regions are significantly
different. E.g. if new
components require more
labour and less mechanized
production.
directly? Legislation sets requirements for
cars. It does not directly affect costs
of capital goods.
indirectly?
2nd
order
1st order
Scarcity of capital goods possible if
new technologies require extremely
specialized production tools
MAYBE
NO
New technologies may require new
tooling (e.g. autoclave for carbon
fiber bodies)
These production tools may be more
expensive in EU than in other regions
E.g. as a result of general differences in wages at
suppliers, or interest rate for borrowing investment capital MAYBE
Limited additional personnel required.
Administrative requirements of post-2020
legislation similar to current legislation.
NO
Component suppliers operate BtoB, so limited marketing needed anyway. Demand for new / improved components will come
from OEMs. Some marketing may be necessary if component supplier offers technology that is not yet on roadmap of OEMs.
NO
Shipping costs not directly affected directly?
indirectly? Shipping costs may change due to
changes in value (insurance costs),
size or weight of new components
NO
Changes differ per type of component to no net effect expected.
R&D will be necessary to develop
new technology for improved / new
components
These costs need to be passed on to components sold to OEMs in the EU and
other regions for cars manufactured for the EU. Non-EU suppliers need to make
similar efforts as EU-based suppliers. Cost per component depend on sales
volumes, which depend on client OEM’s sales in the EU (and outside EU if
legislation in other regions requires application of similar components). This
aspect does not generically affect competitiveness of production in EU.
Competitiveness of performing R&D in EU (company R&D or
by R&D organisations) may be affected, e.g. if EU legislation
promotes innovation more than legislation in other regions.
Which specific machines are necessary for
producing components for vehicles that
meet post-2020 LDV CO2 targets? And how
could costs for these be different from costs
for use in manufacturing in other regions?
Indirect impacts:
1st order
Does the regulation affect the
amount of units used? E.g.
does it require more/less
labour or steel to be used per
car?
Does it require other types of
a certain unit to be used
leading to other costs? E.g.
does it require electrical
engineers instead of
mechanical engineers or
lightweight materials instead
of steel? And are costs of
these other types of units
higher/lower?
2nd
order
Does the regulation indirectly
affect a cost factor per unit
used? E.g. an increase in the
price of certain types of
labour, materials or
components due to
(temporary) scarcity.
Direct impacts:
Does the regulation directly
affect a cost factor per unit
used? E.g.: change in cost of
labour due to stricter labour
conditions or higher taxes, or
change in price of steel due to
higher production costs.
Pathway (element) will very likely
not lead to competitiveness impact
for EU industry
Pathway (element) will very likely
lead to competitiveness impact for
EU industry
Pathway (element) may lead to
competitiveness impact for EU
industry
Legend: traffic light colours
The use of new technologies may
lead to more or less labour required
for manufacturing components
Exception: Some administrative requirements
if components supplier applies for eco-innovation credits. But limited impact
on total costs and in 1st order the same for EU and non-EU suppliers.
assembly /
production
RD&E
management &
overheads No additional personnel required. No
administrative requirements for suppliers as
result of post-2020 legislation.
Increased R&D activities may be needed for
new technologies
Additional subcomponents to be added
New technologies may require more/less labour
or have higher/lower share of (manual) labour in
production / assembly
NO
See under: Overhead
If labour costs are different in
different regions
Δ cost for improved / new components may
be different for EU and non-EU based
suppliers. Sign and size of effect depend on
impact of technologies on labour and
differences in labour costs between regions.
YES / + or -
Indirect effects may come from price increases
due to (temporary) scarcity of materials
resulting from insufficient production capacity
Regional differences in various cost factors
(e.g. labour and energy) may lead to regional
differences in the production costs of materials
For materials (that need to be)
sourced regionally
For materials (that can be) sourced
globally
Similar material purchasing costs for
EU and non-EU production
Possibility of different material costs
for EU and non-EU production
Possibility of different transport costs
for EU and non-EU production
MAYBE
Would apply mainly to materials for
electric propulsion components and for
lightweight construction
Depends on type material, regional
availability of material, ratio of
material costs and transport costs,
strategic alliances, etc.
Limited effect assuming that transport
costs for materials are a small part of
total manufacturing costsFor all relevant materials production
capacity is already being increased.
Assumption that legislation gives
enough lead time
Most likely this works out similarly for
manufacturing in different regions
NO
Due to large number of compliance
strategies dependence on limited
number of materials is unlikely
If effective stringency of
target is different for EU and
non-EU OEMs
Economies of scale for EU production of
new components likely to be different than
for non-EU production
YES / + or -Size and sign depend on utility function
that is still to be determined
For all relevant (sub)components
production capacity is already being
increased.
Assumption that legislation gives
enough lead time
Most likely this works out similarly for
manufacturing in different regions
NO
Due to large number of compliance
strategies dependence on limited
number of components is unlikely
Shape and slope of target
function may lead to different
reduction efforts for cars
manufactured in EU vs. other
regions if average utility value is
different.
NO
If EU has more stringent LDV
CO2 regulation than other
regions
If other regions have more
stringent LDV CO2 regulation
Competitive advantage for EU
component manufacturing industry due
to lower R&D costs per unit
Competitive advantage for non-EU
component manufacturing industry due
to lower R&D costs per unit
Assumption that majority of components
for vehicles manufactured in EU are also
manufactured in EU
YES / +
YES / -
If EU has more stringent legislation
than other regions
If EU regulation is of similar
stringency as in other regions
Higher economies of scale and
learning effects for EU component
manufacturing
Similar economies of scale and
learning effects for EU and non-
EU component manufacturing
NO
YES / +
In this case competitive advantage
is probably bigger for EU Tier 2
than for Tier 1 suppliers
Size and sign depend on target level that
is still to be determined
Δcosts through difference in
economies of scale and learning
effects in EU and other regions
If new components or EU cars are
mainly produced in EU
If new components or EU cars are
mainly produced outside EU
If effective stringency of target is
different for EU and non-EU OEMs
If EU has less stringent legislation
than other regions
Higher economies of scale and
learning effects for non-EU
component manufacturing
E.g. if legislation promotes
electrification and non-EU
suppliers have a better
technology position for that
Economies of scale for EU production of new components
likely to be different than for non-EU production
YES / -
YES / + or -
Size and sign depend on utility function
that is still to be determined and on
whether new components for EU vehicles
are manufactured in EU or outside EU
Expected net impact depends on which
case is valid. This depends on answers to
questions in grey boxes.
Please note that situation is not static. EU
OEMs that now source components
regionally may choose to source
components from suppliers in other
regions if these have significantly lower
costs. Suppliers may also choose to locate
production facilities in EU.
NO

Assessment of competitiveness impacts of post-2020 LDV CO2 regulation
Final Report Valdani Vicari & Associati (VVA), Technopolis Group (TG), Joint Institute for Innovation Policy (JIIP), TNO for DG CLIMA 139
Do different cost elements per unit production increase or decrease more in EU
than in other regions to the extent that they affect the cost ratio of components
manufactured in the EU and in other regions?
material
costs
costs of
purchased
(sub)components
labour costs
costs of capital
goods
overheads
management
marketing
logistics
R&D
Does post-2020 LDV CO2
legislation affect ...
directly?
indirectly?
Legislation sets requirements for
cars. It does not directly affect costs
of labour.
2nd
order
assembly / production
RD&E
management &
overheads
Same skill required for alternative mechanical
technologies. In assembly new electrical
components do not require specialized skills
New specialists required with knowledge of
electrical engineering and new materials
No new skills needed for employees with jobs in management and
overhead and no additional personnel required. No administrative
requirements of post-2020 legislation on suppliers.
Developments in these fields are already on-
going in all regions with automotive
development and manufacturing. Unlikely that
these competences would be more/less
available in EU than in other regions
UNLIKELY
NO
NO
NO
directly?
indirectly?
Cost ratio for new (sub)components will be
similar as cost ratio of baseline product
Changing demands from OEMs
require improved or new
(sub)components to be used
NOIf share of cost factors in new (sub)
components is similar to that of baseline
components, e.g. for mechanical components
If share of cost factors in new (sub)
components is different to that of baseline
components, e.g. for electrical components
Differences in labour costs and other cost
factors between EU and other regions may
lead to different cost ratio for these
components
If new (sub)components
for components
manufactured in EU are
produced in EU
If new (sub)components
for components
manufactured outside EU
are produced outside EU
If new (sub)components
for components
manufactured in EU are
produced outside EU
If new (sub)components
for components
manufactured outside EU
are produced in EU
MAYBEAre EU/non-EU ratios for various cost
factors markedly different?
Absolute manufacturing costs of new (sub)
components are the same. But transport costs
are higher for EU supply industry.
YES / -
What’s the size of transport costs from
other regions to EU and how does that
compare to differences in manufacturing
costs in EU and outside EU?
unlikely case
Absolute manufacturing costs of new (sub)
components are the same. But transport costs
are lower for EU supply industry.
YES / +
Indirect effects may come from price
increases due to (temporary) scarcity
of (sub)components resulting from
insufficient production capacity
Δcosts through dependence on
location of production
Δcosts through difference in
economies of scale and learning
effects in EU and other regions
If EU has more / less
stringent LDV CO2 regulation
than other regions
If other regions have LDV
CO2 regulation of similar
stringency
Economies of scale for EU production of
new (sub)components likely to be larger /
smaller than for non-EU production
Economies of scale for EU and non-EU
production of new (sub)components likely
to be similar
Assumption that majority of
(sub)components for EU Tier 1 supply
industry are also manufactured in EU
check if that
assumption is
correct
NO
YES / + or -
indirectly?
directly?
Legislation will lead to
demand for new
materials
1st order
2nd
order
Legislation sets requirements for cars.
It does not directly affect costs of
(producing) materials.
NO
1st order
2nd
order
Legislation sets requirements for cars.
It does not directly affect costs of
producing (sub)components.
NO
1st order
New technologies
may require new
skills
Training costs are a relatively small
fraction of total labour costs
UNLIKELYExisting
employees need
training
Scarcity of employees with new
skills may (temporarily) lead to
higher wages
New employees
must be hired
Total cost ratios between
manufacturing in EU and
other regions may be affected
if one or more cost factors
change as a result of the LDV
CO2 legislation and this
change is different in the EU
than in other regions.
Total cost ratios between
manufacturing in EU and
other regions may be affected
if application of new
technologies or other
activities needed to comply
with LDV CO2 legislation
affect the shares of different
cost factors, and if ratios of
these cost factors for EU vs
other regions are significantly
different. E.g. if new
components require more
labour and less mechanized
production.
directly? Legislation sets requirements for
cars. It does not directly affect costs
of capital goods.
indirectly?
2nd
order
1st order
Scarcity of capital goods possible if
new technologies require extremely
specialized production tools
MAYBE
NO
New technologies may require new
tooling (e.g. autoclave for carbon
fiber bodies)
These production tools may be more
expensive in EU than in other regions
E.g. as a result of general differences in wages at
suppliers, or interest rate for borrowing investment capital MAYBE
Limited additional personnel required.
Administrative requirements of post-2020
legislation similar to current legislation.
NO
Component suppliers operate BtoB, so limited marketing needed anyway. Demand for new / improved components will come
from OEMs. Some marketing may be necessary if component supplier offers technology that is not yet on roadmap of OEMs.
NO
Shipping costs not directly affected directly?
indirectly? Shipping costs may change due to
changes in value (insurance costs),
size or weight of new components
NO
Changes differ per type of component to no net effect expected.
R&D will be necessary to develop
new technology for improved / new
components
These costs need to be passed on to components sold to OEMs in the EU and
other regions for cars manufactured for the EU. Non-EU suppliers need to make
similar efforts as EU-based suppliers. Cost per component depend on sales
volumes, which depend on client OEM’s sales in the EU (and outside EU if
legislation in other regions requires application of similar components). This
aspect does not generically affect competitiveness of production in EU.
Competitiveness of performing R&D in EU (company R&D or
by R&D organisations) may be affected, e.g. if EU legislation
promotes innovation more than legislation in other regions.
Which specific machines are necessary for
producing components for vehicles that
meet post-2020 LDV CO2 targets? And how
could costs for these be different from costs
for use in manufacturing in other regions?
Indirect impacts:
1st order
Does the regulation affect the
amount of units used? E.g.
does it require more/less
labour or steel to be used per
car?
Does it require other types of
a certain unit to be used
leading to other costs? E.g.
does it require electrical
engineers instead of
mechanical engineers or
lightweight materials instead
of steel? And are costs of
these other types of units
higher/lower?
2nd
order
Does the regulation indirectly
affect a cost factor per unit
used? E.g. an increase in the
price of certain types of
labour, materials or
components due to
(temporary) scarcity.
Direct impacts:
Does the regulation directly
affect a cost factor per unit
used? E.g.: change in cost of
labour due to stricter labour
conditions or higher taxes, or
change in price of steel due to
higher production costs.
Pathway (element) will very likely
not lead to competitiveness impact
for EU industry
Pathway (element) will very likely
lead to competitiveness impact for
EU industry
Pathway (element) may lead to
competitiveness impact for EU
industry
Legend: traffic light colours
The use of new technologies may
lead to more or less labour required
for manufacturing components
Exception: Some administrative requirements
if components supplier applies for eco-innovation credits. But limited impact
on total costs and in 1st order the same for EU and non-EU suppliers.
assembly /
production
RD&E
management &
overheads No additional personnel required. No
administrative requirements for suppliers as
result of post-2020 legislation.
Increased R&D activities may be needed for
new technologies
Additional subcomponents to be added
New technologies may require more/less labour
or have higher/lower share of (manual) labour in
production / assembly
NO
See under: Overhead
If labour costs are different in
different regions
Δ cost for improved / new components may
be different for EU and non-EU based
suppliers. Sign and size of effect depend on
impact of technologies on labour and
differences in labour costs between regions.
YES / + or -
Indirect effects may come from price increases
due to (temporary) scarcity of materials
resulting from insufficient production capacity
Regional differences in various cost factors
(e.g. labour and energy) may lead to regional
differences in the production costs of materials
For materials (that need to be)
sourced regionally
For materials (that can be) sourced
globally
Similar material purchasing costs for
EU and non-EU production
Possibility of different material costs
for EU and non-EU production
Possibility of different transport costs
for EU and non-EU production
MAYBE
Would apply mainly to materials for
electric propulsion components and for
lightweight construction
Depends on type material, regional
availability of material, ratio of
material costs and transport costs,
strategic alliances, etc.
Limited effect assuming that transport
costs for materials are a small part of
total manufacturing costsFor all relevant materials production
capacity is already being increased.
Assumption that legislation gives
enough lead time
Most likely this works out similarly for
manufacturing in different regions
NO
Due to large number of compliance
strategies dependence on limited
number of materials is unlikely
If effective stringency of
target is different for EU and
non-EU OEMs
Economies of scale for EU production of
new components likely to be different than
for non-EU production
YES / + or -Size and sign depend on utility function
that is still to be determined
For all relevant (sub)components
production capacity is already being
increased.
Assumption that legislation gives
enough lead time
Most likely this works out similarly for
manufacturing in different regions
NO
Due to large number of compliance
strategies dependence on limited
number of components is unlikely
Shape and slope of target
function may lead to different
reduction efforts for cars
manufactured in EU vs. other
regions if average utility value is
different.
NO
If EU has more stringent LDV
CO2 regulation than other
regions
If other regions have more
stringent LDV CO2 regulation
Competitive advantage for EU
component manufacturing industry due
to lower R&D costs per unit
Competitive advantage for non-EU
component manufacturing industry due
to lower R&D costs per unit
Assumption that majority of components
for vehicles manufactured in EU are also
manufactured in EU
YES / +
YES / -
If EU has more stringent legislation
than other regions
If EU regulation is of similar
stringency as in other regions
Higher economies of scale and
learning effects for EU component
manufacturing
Similar economies of scale and
learning effects for EU and non-
EU component manufacturing
NO
YES / +
In this case competitive advantage
is probably bigger for EU Tier 2
than for Tier 1 suppliers
Size and sign depend on target level that
is still to be determined
Δcosts through difference in
economies of scale and learning
effects in EU and other regions
If new components or EU cars are
mainly produced in EU
If new components or EU cars are
mainly produced outside EU
If effective stringency of target is
different for EU and non-EU OEMs
If EU has less stringent legislation
than other regions
Higher economies of scale and
learning effects for non-EU
component manufacturing
E.g. if legislation promotes
electrification and non-EU
suppliers have a better
technology position for that
Economies of scale for EU production of new components
likely to be different than for non-EU production
YES / -
YES / + or -
Size and sign depend on utility function
that is still to be determined and on
whether new components for EU vehicles
are manufactured in EU or outside EU
Expected net impact depends on which
case is valid. This depends on answers to
questions in grey boxes.
Please note that situation is not static. EU
OEMs that now source components
regionally may choose to source
components from suppliers in other
regions if these have significantly lower
costs. Suppliers may also choose to locate
production facilities in EU.
Expected net impact depends on which
case is valid. This depends on answers to
questions in grey boxes.
Please note that situation is not static. EU
OEMs that now source components
regionally may choose to source
components from suppliers in other
regions if these have significantly lower
costs. Suppliers may also choose to locate
production facilities in EU.
NO

Assessment of competitiveness impacts of post-2020 LDV CO2 regulation
Final Report Valdani Vicari & Associati (VVA), Technopolis Group (TG), Joint Institute for Innovation Policy (JIIP), TNO for DG CLIMA 140
Does post-2020 EU LDV CO2 regulation lead to regionally different impacts related to the cost of
purchased (sub)components?
Not directly. The regulation does not directly affect the cost of components as it applies to LDVs and not
to factors that determine the cost of component manufacturing.
Indirectly the costs of purchased (sub)components as a share in the total costs of manufacturing
components can be affected in the same way as was identified for the costs of purchased components
for LDV manufacturing. This leads to similar cost-competitiveness impact pathways as identified for the
case of LDV manufacturing (see section 6.2).
Positive cost competitiveness impacts for EU component manufacturing may arise due to
economies of scale if the EU has more stringent LCV CO2 regulation than other regions and if
(sub)components for EU component manufacturing are also manufactured in Europe. Negative
impacts may arise if the EU has less stringent legislation than other regions.
Positive cost competitiveness impacts for EU component manufacturing are to be expected as a
result of differences in transport costs and tariffs if the EU (sub)component industry is able to
deliver products to the EU as well as non-EU supply industry, and negative impacts if new
(sub)component technologies are mainly manufactured in non-EU countries.
Overall the expected net impact depends on which cases are valid. In addition it should be noted
that the situation is not static. EU suppliers that now source (sub)components regionally may
choose to source (sub)components from Tier 2 suppliers in other regions if these have
significantly lower costs. Tier 2 suppliers from outside the EU may also choose to locate
production facilities in EU.
Indirect effects resulting from price increases due to (temporary) scarcity of production capacity
for (sub)components is also here considered unlikely.
Does post-2020 EU LDV CO2 regulation lead to regionally different impacts related to the cost of
labour?
Not directly. The legislation does not have a direct effect on labour conditions, wages, taxes or other
factors that determine the costs per unit of labour.
For the case of component manufacturing indirect pathways for cost competitiveness impacts related to
labour costs are identical to those described for vehicle manufacturing.
Does post-2020 EU LDV CO2 regulation lead to regionally different impacts related to the cost of
capital goods?
No direct impact is expected as the regulation does not affect the factors that determine the cost of
capital goods per unit of production.
Indirect effects on the costs of capital goods as part of the costs of manufacturing components mainly
relate to possible differences in economies of scale and learning effects caused by differences in
production volumes that relate to the level of stringency of legislation in the EU and other regions and the
main production location for new components for advanced ICEVs and AFVs.
Positive cost competitiveness impacts may be expected if the EU has more stringent CO2
legislation than other regions and if components for LDVs, sold in the EU, are mainly

Assessment of competitiveness impacts of post-2020 LDV CO2 regulation
Final Report Valdani Vicari & Associati (VVA), Technopolis Group (TG), Joint Institute for Innovation Policy (JIIP), TNO for DG CLIMA 141
manufactured in the EU. Other combinations of relative levels of stringency and production
location could lead to negative or no cost competitiveness impacts.
Cost competitiveness impacts are expected only if the cost difference between new and existing
capital goods is different from the overall average difference in costs of equipment in different
regions.
Cost competitiveness impacts are in principle conceivable if there would be regional differences
in the costs of tools and equipment for manufacturing new components to be applied in
advanced ICEVs and AFVs. It is unclear whether this is to be expected but overall it appears
quite unlikely.
If large investments would be needed to adapt production processes in a short period of time, and
especially if these investments are associated with high risks, this could affect the cost of capital.
Differences in the profitability and financial position of EU and non-EU suppliers could then affect cost
competitiveness.
Does post-2020 EU LDV CO2 regulation lead to regionally different impacts related to the overhead
costs?
No direct impacts on the costs per unit of overhead activity are expected, but the amount of overhead
per unit product might change.
Possible cost competitiveness impact pathways are only identified in relation to the volume of products
over which R&D costs can be divided. These depend on sales volumes which are determined by the
stringency of CO2 regulations in the EU and other regions and by the location of component
manufacturing. There would be a positive impact if technologies developed and used in the EU market
could subsequently be sold or licensed for use in non-EU markets.
8.2 Conclusions regarding cost competitiveness impacts on EU automotive
component manufacturing
Table 9 summarizes the identified possible cost competitiveness impacts on automotive component
manufacturing. Likely pathways for impacts are identified, but in the absence of a concrete proposal for the
post-2020 targets and the modalities with which these are implemented it is at this stage not possible to
predict the net sign and size of these impacts.
For component manufacturing only a limited number of pathways seem to result in likely impacts on EU
manufacturing cost competitiveness. Where impacts are possible, they may be positive or negative.
Conclusions seem to be quite generic and the same for the car and van regulation.
It is concluded that post 2020 EU LDV CO2 legislation has no direct impact on the cost competitiveness of
EU component manufacturing as the legislation is targeted at the CO2 performance of LDVs and not at
factors that determine the costs of producing them or their components.
A limited number of possible indirect impacts has been identified:
The access to materials as well as the costs of these materials could be different for EU and non-EU
suppliers. This especially relates to materials for electric powertrains and vehicle light-weighting. Sign

Assessment of competitiveness impacts of post-2020 LDV CO2 regulation
Final Report Valdani Vicari & Associati (VVA), Technopolis Group (TG), Joint Institute for Innovation Policy (JIIP), TNO for DG CLIMA 142
and size of the effect cannot be determined at this stage, but effects are likely to be more pronounced for
component manufacturing than for car manufacturing;
With respect to the costs of purchased components small positive impacts could occur if the EU has
more stringent regulation than other regions or if a large share of new (sub)components for advanced
ICEVs and AFVs are produced in the EU. Small negative impacts may occur if (sub)components for
advanced ICEVs and AFVs are mainly produced outside the EU;
Regional differences in labour costs may have an impact of unknown sign and size as new technologies
may require more or less labour or have a higher or lower share of (manual) labour in assembly or
production;
Some indirect impact pathways have been identified that relate to differences in the costs of capital
goods and the volume of sales over which R&D costs can be divided. The size and sign of these impacts
depend on the relative stringency of EU legislation.
Conclusions seem to be quite generic and the same for the car and van regulation.
Table 9 - Summary of possible cost competitiveness impacts on automotive component manufacturing
Cost factor Impact Comment
Material costs Maybe ? Relates to possible regional difference in materials needed for
manufacturing components for advanced ICEVs and AFVs.
Sign and size of the effect cannot be determined at this stage, but effects
are likely to be more pronounced for component manufacturing than for
car manufacturing.
Costs of purchased
(sub)components
Maybe + Small positive impacts could occur if the EU has more stringent regulation
than other regions or if large share of new (sub)components for advanced
ICEVs and AFVs are produced in the EU.
- Small negative impacts may occur if (sub)component for advanced ICEVs
and AFVs are mainly produced outside the EU.
+/- Finite impacts may occur if the effective stringency of the target is
different for EU and non-EU OEMs:
o Sign and size depend on target function which is not yet known.
Labour costs Yes +/- An impact of unknown sign and size is possible as new technologies may
require more or less labour or have a higher or lower share of (manual)
labour in assembly or production. This will only lead to a finite effect if
labour costs are different in different regions.
Costs of capital
goods
Maybe ? Depending on possible regional differences in the costs of production
tools for advanced ICEVs and AFVs
o Significant impacts not considered likely.
+/- Positive / negative impacts on cost competitiveness associated with
economies of scale and learning effects due to higher / lower volumes if
EU has more / less stringent legislation than other regions
Overheads Yes +/- The number of car sales over which R&D costs can be divided depends
on the relative stringency of CO2 regulation in the EU and other regions.
Positive impacts expected if EU regulation is more stringent.
Assessment of competitiveness impacts of post-2020 LDV CO2 regulation
Final Report Valdani Vicari & Associati (VVA), Technopolis Group (TG), Joint Institute for Innovation Policy (JIIP), TNO for DG CLIMA 143
9. Effects of post 2020 regulation on cost competitiveness of the
energy supply industry
9.1 Introduction
The post-2020 LDV CO2 regulation does not directly affect the costs of producing petroleum-based transport
fuels or alternative fuels or energy carriers for transport, as it does not target any of the factors that
determine the costs of producing these energy carriers. Indirect impacts are very likely, though, as the
legislation will affect the demand for different energy carriers and different companies may have different
abilities to cope with this changing demand.
The energy supply sector can be divided into:
producers of fuels and other energy carriers
o the oil refining industry for petroleum based fuels
o electricity generation
o production of alternative (bio)fuels and energy carriers (e.g. hydrogen)
distributors of fuels and other energy carriers
o fuel distributors and operators of filling stations
o operators of electricity distribution networks and operators of charging stations
Both sub-sectors contain large, medium-size and small companies. The analysis of possible cost
competitiveness impacts will be done separately for the two sub-sectors.
The post-2020 EU LDV CO2 legislation will lead to reduced demand for petrol and diesel. The extent to
which it leads to increased use of alternative energy carriers, such as LPG, CNG / LNG, liquid biofuels,
biogas, electricity or hydrogen, will depend on details of the regulation and how OEMs respond. Important
modalities are the target level, the metric and specific provisions for alternative technologies such as super-
credits. If the metric remains to be based on TTW CO2 emissions as measured on the type approval test, low
post-2020 targets are likely to promote the uptake of zero TTW emission energy carriers such as electricity
and hydrogen, but also the demand for methane fuels may increase as this has lower CO2 emissions per unit
of energy. The demand for biofuels is not affected by a regulation based on TTW CO2 emissions as
measured on the type approval test, as the use of biofuels does not affect direct exhaust CO2 emissions.
This would be different if the regulation would give credits to vehicles running on biofuels22
. If WTW CO2
emissions, or TTW or WTW energy consumption, is chosen as the metric, the leverage between
conventional and alternative fuels would be greatly reduced (see [TNO 2013a]), and the increased demand
for alternative energy carriers as a result of the legislation would be less pronounced.
22
As is currently the case in article 6 of Article 6 (Specific emissions target for alternative-fuel vehicles) of Regulation (EC) 443/2009, which specifies that credits are given to vehicles capable of running on E85 sold in countries where at least 30% of the filling stations provide this type of alternative fuel complying with the sustainability criteria for biofuels set out in relevant Community legislation.

Assessment of competitiveness impacts of post-2020 LDV CO2 regulation
Final Report Valdani Vicari & Associati (VVA), Technopolis Group (TG), Joint Institute for Innovation Policy (JIIP), TNO for DG CLIMA 144
Figure 28 – Overview of pathways along which the LDV CO2 legislation and the capabilities and resources of companies can lead to cost competitiveness impacts on companies in the energy supply sector
(focus on energy production sector)
factors affecting Δ price competitiveness for competitor(s) in the energy sector
factors affecting Δ price competitiveness within the energy sector (alternative energy carriers)
capabilitiesresources
Δ cost of
providing
petroleum fuels /
products
Δ cost of providing
alternative energy
carriers
(production and
distribution)
Δ price of
alternative
energy carriers
Δ price of
petroleum fuels /
products
cost pass-
through factor
for petroleum
products
cost pass-
through factor
for alternative
energy carriers
absorb part of
Δ cost
Δ competitiveness
of petroleum
products
Δ competitiveness
of alternative
energy carriers
utility parameter
CO2 legislation
utility based
target function
derogations
super-credits
eco-innovations
target
average target
for OEMs
OEM compliance
strategies
increasing
shares of AFVs
applying eco-
innovations
Δ competitiveness of
AFVs vs ICEVs
Supplier network
Facilities
Patents
Knowledge
Finance
Customer base
Δ long term cost
competitiveness of
company
excess
emissions
premiums
applying
additional CO2
reducing
technologies to
ICEVs
Δ price of
petroleum
products
Δ price of
alternative
energy carriers
Δ short term cost
competitiveness of
company
Impact of changes in short
term competitiveness on long
term competitiveness are
determined through impacts
on various resources and
capabilities
Ability to provide
energy/fuel at lower
costs compared to
other supplier
Ability to maintain
current customers
even though sales
price is higher
In case better
competitive
position results
in higher profits
Ability to
(temporarily) absorb
losses
Ability to sell licenses
reduced demand for
petroleum products
in EU
increased demand
for alternative energy
carriers in EU
Demand will be reduced
relative to BAU scenario. Net
Δ demand also depends on
development of mobility
volumes in Europe.
Includes e.g. improvements to
electricity grid (“more copper”
or “smart grid”) for dealing with
increased peak demand
additional production
form existing system
investments in
additional production
capacity
investments in
additional distribution
infrastructure
reducing capacity of
production system
reduced production
from existing system
reducing capacity of
distribution system
increased utilisation of
existing distribution
infrastructure
decreased utilisation
of existing distribution
infrastructure
factors affecting Δ price competitiveness within the energy sector (petroleum fuels)
Δ competitiveness
Δ competitiveness
Δ price competitiveness within the energy sector
(alternative energy carriers)
Δ price competitiveness within the energy sector
(petroleum fuels)
Δ TCO of AFVs
Δ TCO of ICEVs
natural gas
electricity
hydrogen
biofuels
possible synergies
between production
of petroleum fuels
and alternative
energy carriers
Ability to invest in
new production and
distribution capacity
Resources & capabilities
Energy suppliers Energy suppliers
Legislation & OEM compliance strategies Effects of resources/capabilities & legislation/OEM compliance strategies on competitiveness
impacts of the regulation
on car ownership
and car use
E.g. for existing
hydrogen production
at refineries or bio-
refining
Volume effects as a
result of the net impact
on the costs of buying
and owning cars
Δ sales volume in
alternative energy
carriers
Δ sales volume in
alternative energy
carriers
Δ profitability
Sales volumes affect
cost of production and
profitability of
production facilities
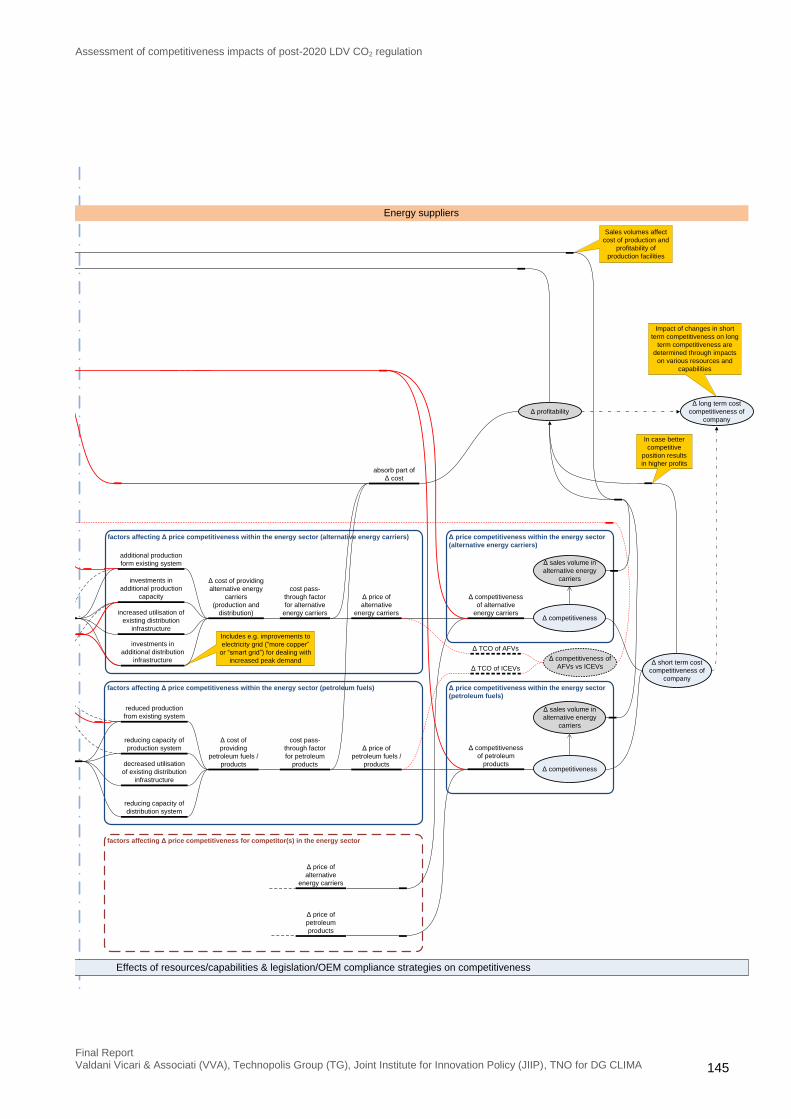
Assessment of competitiveness impacts of post-2020 LDV CO2 regulation
Final Report Valdani Vicari & Associati (VVA), Technopolis Group (TG), Joint Institute for Innovation Policy (JIIP), TNO for DG CLIMA 145
factors affecting Δ price competitiveness for competitor(s) in the energy sector
factors affecting Δ price competitiveness within the energy sector (alternative energy carriers)
capabilitiesresources
Δ cost of
providing
petroleum fuels /
products
Δ cost of providing
alternative energy
carriers
(production and
distribution)
Δ price of
alternative
energy carriers
Δ price of
petroleum fuels /
products
cost pass-
through factor
for petroleum
products
cost pass-
through factor
for alternative
energy carriers
absorb part of
Δ cost
Δ competitiveness
of petroleum
products
Δ competitiveness
of alternative
energy carriers
utility parameter
CO2 legislation
utility based
target function
derogations
super-credits
eco-innovations
target
average target
for OEMs
OEM compliance
strategies
increasing
shares of AFVs
applying eco-
innovations
Δ competitiveness of
AFVs vs ICEVs
Supplier network
Facilities
Patents
Knowledge
Finance
Customer base
Δ long term cost
competitiveness of
company
excess
emissions
premiums
applying
additional CO2
reducing
technologies to
ICEVs
Δ price of
petroleum
products
Δ price of
alternative
energy carriers
Δ short term cost
competitiveness of
company
Impact of changes in short
term competitiveness on long
term competitiveness are
determined through impacts
on various resources and
capabilities
Ability to provide
energy/fuel at lower
costs compared to
other supplier
Ability to maintain
current customers
even though sales
price is higher
In case better
competitive
position results
in higher profits
Ability to
(temporarily) absorb
losses
Ability to sell licenses
reduced demand for
petroleum products
in EU
increased demand
for alternative energy
carriers in EU
Demand will be reduced
relative to BAU scenario. Net
Δ demand also depends on
development of mobility
volumes in Europe.
Includes e.g. improvements to
electricity grid (“more copper”
or “smart grid”) for dealing with
increased peak demand
additional production
form existing system
investments in
additional production
capacity
investments in
additional distribution
infrastructure
reducing capacity of
production system
reduced production
from existing system
reducing capacity of
distribution system
increased utilisation of
existing distribution
infrastructure
decreased utilisation
of existing distribution
infrastructure
factors affecting Δ price competitiveness within the energy sector (petroleum fuels)
Δ competitiveness
Δ competitiveness
Δ price competitiveness within the energy sector
(alternative energy carriers)
Δ price competitiveness within the energy sector
(petroleum fuels)
Δ TCO of AFVs
Δ TCO of ICEVs
natural gas
electricity
hydrogen
biofuels
possible synergies
between production
of petroleum fuels
and alternative
energy carriers
Ability to invest in
new production and
distribution capacity
Resources & capabilities
Energy suppliers Energy suppliers
Legislation & OEM compliance strategies Effects of resources/capabilities & legislation/OEM compliance strategies on competitiveness
impacts of the regulation
on car ownership
and car use
E.g. for existing
hydrogen production
at refineries or bio-
refining
Volume effects as a
result of the net impact
on the costs of buying
and owning cars
Δ sales volume in
alternative energy
carriers
Δ sales volume in
alternative energy
carriers
Δ profitability
Sales volumes affect
cost of production and
profitability of
production facilities

Assessment of competitiveness impacts of post-2020 LDV CO2 regulation
Final Report Valdani Vicari & Associati (VVA), Technopolis Group (TG), Joint Institute for Innovation Policy (JIIP), TNO for DG CLIMA 146
9.2 Cost competitiveness impacts on producers of fuels and other energy
carriers
Possible impact pathways of the legislation on producers of energy carriers for transport are sketched in
Figure 28. Main impact pathways relate to the impact of changes in production volumes of different energy
carriers on the production costs for these energy carriers, as well as on the extent to which additional costs
can be passed on to the consumer.
Whether the identified impacts of the regulation on energy producers affect cost competitiveness, in the
definition used in this report, depends on whether companies are effectively competing (in the EU or on other
markets), on how the impacts affect costs for different competing companies or industries and if such
differences are region-dependent. Changes in the cost of producing energy carriers only lead to cost
competitiveness impacts if costs are different for different companies. Even if the impacts of the legislation, in
terms of changes in demand and requirements to (dis)invest in production and distribution infrastructure and
the resulting impact on costs, would be similar for different energy supply companies, their abilities to deal
with these impacts may be different. This would also lead to possible impacts on cost competitiveness. A
question therefore is whether there are regional differences in these abilities for the EU and non-EU fuel
producing industry and whether this affects their competition on the EU market or globally.
Producers of petroleum-based fuels
For the EU petroleum industry a reduction in the use of petrol and diesel by LDVs in the EU, as a result of
LDVs becoming more fuel efficient, could lead to a reduced utilisation of existing production facilities
(refineries) and distribution infrastructure (pipelines, filling stations), leading to higher production costs per
unit of product. This could exacerbate a currently on-going trend of increased under-utilisation of refining
capacity in the EU that is illustrated in Figure 29. Very likely refineries and distribution facilities will need to be
closed, which may represent destruction of capital if this is done before the end of their economic lifetime.
The latter, however, is less likely as many of Europe’s refineries are already in use for several decades. If, on
the other hand, the older and less efficient refineries are closed, this could actually lead to a reduction in
average production costs.
While costs per unit output could increase, the declining market is likely to increase competition which puts
pressure on prices. As indicated in section A2.6.2 such competition does not only exist between European
refineries / fuel suppliers. Diesel from EU refineries is already supplemented with diesel imported from the
US and FSU, the latter often still needing processing in the EU, while according to FuelsEurope23
in the
coming years EU refineries are expected to encounter competitive pressure from newly opened refineries in
India and the Middle-East, which have production capacities that for some amount of time will exceed local
demand.
23
https://www.fuelseurope.eu/dataroom

Assessment of competitiveness impacts of post-2020 LDV CO2 regulation
Final Report Valdani Vicari & Associati (VVA), Technopolis Group (TG), Joint Institute for Innovation Policy (JIIP), TNO for DG CLIMA 147
Figure 29 – Capacity and utilisation of European refineries (source: https://www.fuelseurope.eu/dataroom based on BP Statistical Review of World Energy 2013)
Reduced LDV diesel consumption in the EU, resulting from post-2020 LDV CO2 legislation, will decrease the
need for diesel imports. But as LDV petrol demand will also decrease, and HDV diesel demand does not (or
at least not at the same rate), the diesel to petrol ratio in the demand from the transport sector further
increases. This will worsen the mismatch with the optimal refinery output mix and may therefore put more
pressure on the profitability of EU refineries.
The EU is a net exporter of gasoline and EU refinery products compete on markets outside the EU. The US
is an important market for EU petrol exports, but due to CO2 regulations in place in the US and the
mandating of ethanol blending, demand for gasoline from the US will decline. This will reduce opportunities
for EU refineries to export surplus gasoline further reducing this option for EU refineries. However demand is
growing elsewhere. The size of this effect will depend on the stringency of future legislation in the US and
the rate at which demand grows in other markets.
The extent to which companies can absorb lower margins or even losses, depends on their financial
position, the share of their EU sales in their sales world-wide, and developments in markets in other regions.
The extent to which EU refineries are owned by global companies, and the extent to which these are able
and willing to sustain low profits or losses on these refineries, are thus important factors. Information on
these aspects, however, has not been collected so that no conclusions can be drawn on this. However, there
is evidence major oil companies are seeking to divest from EU refining.
If the focus is on EU versus non-EU companies, the following conclusions can be drawn with respect to cost
competitiveness impacts for producers of petroleum based fuels:
A declining demand for petroleum fuels, resulting from post-2020 EU LDV CO2 legislation, will put
pressure on the price of fuels. At the same time refinery utilisation rates are expected to go down unless
there are sufficient refinery closures, leading to an increase in costs per unit production. The combination

Assessment of competitiveness impacts of post-2020 LDV CO2 regulation
Final Report Valdani Vicari & Associati (VVA), Technopolis Group (TG), Joint Institute for Innovation Policy (JIIP), TNO for DG CLIMA 148
of the two will strongly reduce profitability of EU refineries. This means that it will become more difficult
for the products of these refineries to compete on the EU markets with imports from Russia or new state-
of-the art refineries being opened in India and the Middle-East.
Refineries are mostly owned by large, often global companies competing on various regional markets.
The ability of companies to deal with changes in the EU market may depend on the size of their
European activities and the share of these in their global activities. Impacts may also depend on the
extent to which they produce in the EU for the EU market or also import and export to and from the EU.
With the information available it is not possible to “predict” what the strategic decisions of such global
companies will be in response to the effects of post-2020 EU LDV CO2 legislation on the demand for
fuels in Europe.
In decisions on (dis)investments in refining capacity, also the status of facilities may play a role as
decommissioning refinery capacity is more costly for newer than for older facilities. It is likely that there
are differences in this respect between different refineries in Europe, but this has not been assessed.
The need to close refineries in Europe may thus affect competition within the EU refining sector, but this
is not to be considered a cost competitiveness impact for the EU refining sector as a whole.
Closing of refineries in the EU will lead to a loss of jobs and of value added within the EU. This is an
economic impact that is likely to happen if EU LDV CO2 legislation is effective, but that could be
amplified by the fact that European fuel producers are affected more severely by the legislation than
producers outside the EU which operate new facilities and have a large share of their sales in markets
that are still growing.
Producers of alternative energy carriers
If car manufacturers choose to meet the target with an increasing share of alternatively fuelled vehicles, this
will lead to increased demand for e.g. natural gas, electricity, hydrogen and/or biofuels. Whether this may
lead to cost competitiveness impacts for EU companies producing these energy carriers depends on the
type of energy carrier:
Natural gas: Production infrastructure for natural gas exists and will be able to provide the additional
supply needed. Improved utilisation of existing infrastructure may offer potential cost reductions, but the
net impact on costs depends strongly on the purchasing price of the additional natural gas. Additional
demand for natural gas in Europe will be largely met by imports from Russia or other regions (by pipeline
or in the form of LNG transported by ship), but within the EU will be mostly traded and transported by
European (and often still national) companies. Also these can thus be considered not to compete with
non-EU companies, so that no cost competitiveness impacts are to be expected for EU natural gas
supply companies or the EU natural gas supply industry as a whole.
Electricity: The existing production infrastructure for electricity will be able to provide the additional
supply needed in the 2020-2030 timeframe. Also here improved utilisation of existing infrastructure may
offer potential cost reductions, but the net impact on costs depends strongly on the price of the additional
primary energy used for electricity production. Electricity is not traded between the EU and other regions
at any significant scale. Electricity production and supply companies tend to have a regional focus, so
that European electricity production and supply companies can be considered not to compete with
companies in other regions. As a result LDV CO2 legislation will not have cost competitiveness impacts
Assessment of competitiveness impacts of post-2020 LDV CO2 regulation
Final Report Valdani Vicari & Associati (VVA), Technopolis Group (TG), Joint Institute for Innovation Policy (JIIP), TNO for DG CLIMA 149
on the EU electricity generation industry. Mutual cost competitiveness of EU companies, may be affected
though.
Hydrogen: Existing hydrogen production infrastructure (e.g. at refineries) may be able to generate
additional hydrogen to supply the first vehicles on the market. Already at fairly modest market
penetration levels investments in hydrogen production infrastructure is likely to be necessary. Hydrogen
can in theory be transported over longer distances allowing for trade between regions, but in the next
decades it is not expected that this will happen, among other things because long distance transport of
hydrogen is less practical due to its low density. Hydrogen production and distribution will be organised
within the EU, so that also here companies can be considered not to compete with companies outside
the EU. This means that also for the EU hydrogen production industry no cost competitiveness impacts
are to be expected from post-2020 LDV CO2 legislation.
Biofuels: As indicated above, post-2020 EU LDV CO2 legislation will only lead to increased demand for
biofuels if a different metric is chosen than the current one or if specific provisions would be included that
promote the marketing of vehicles running on biofuels. If demand for biofuels increases, this will improve
the utilisation of existing production capacity, and will require investments in additional production
infrastructure. Liquid biofuels can be easily transported over long distances, and their production occurs
largely in global competition (albeit in a market that is heavily distorted based on subsidies). If EU CO2
legislation for cars would lead to higher demand growth in Europe than in other markets, this could lead
to higher investments, accelerated economies of scale and innovation in products and production
systems in Europe. This may improve the cost competitiveness of European biofuels production, as it
provides European companies a possible cost advantage for competition on the EU market as well as
other markets. As biogas production, especially from waste streams, is more likely to happen within
Europe for the European market, such competitive advantages would not occur for the biogas industry.
Further considerations
In the above it is assumed that different energy carriers are not supplied by the same company. Also it is
assumed that companies producing one energy carrier are not in competition with companies that produce
other energy carriers. These assumptions, however, may not be true or may not remain true. If oil companies
decide to become energy suppliers to the transport sector rather than fuel suppliers, they could grasp part of
the market for new energy carriers. Depending on their resources and capabilities some may be in a better
position to pursue such a strategy than others. This would not only blur the distinction between the two
energy producing sub-sectors but could also be seen as a strategy to cope with a reducing demand for
petroleum fuels in Europe. Although such a transition is promoted by the Fuel Quality Directive, which
contains elements aiming at decarbonisation of energy carriers for transport at company level, it is at this
point unclear whether oil companies will adopt such a strategy.
A further interaction between the two subsectors is via the EU-ETS. All large energy producing plants are
subject to this cap & trade system for CO2. If alternative energy carriers produced in the EU are not fully
derived from renewable or other low-CO2 primary energy sources, emission rights need to be bought for the
additional production of alternative energy carriers. A shrinking petroleum industry could generate revenue
from selling credits. CO2 emissions per unit energy output are generally lower in the petroleum industry than
in (partly fossil based) production of electricity and hydrogen. On the other hand final energy demand

Assessment of competitiveness impacts of post-2020 LDV CO2 regulation
Final Report Valdani Vicari & Associati (VVA), Technopolis Group (TG), Joint Institute for Innovation Policy (JIIP), TNO for DG CLIMA 150
reduces when vehicle propulsion switches from petroleum fuels to electricity or hydrogen. It is therefore
unclear whether the possible supply of credits from the petroleum industry is likely to be smaller or larger
than the demand from a growing electricity and hydrogen generation industry.
Besides cost competitiveness impacts on companies of the changes in costs of energy production as a
consequence of the LDV CO2 regulation could also affect the mutual cost competitiveness of ICEVs and
AFVs. This may in turn affect the choice of compliance mechanisms by OEMs, leading to a possible
feedback loop to the consequences of the legislation that are the starting point for assessing cost
competitiveness impacts on the energy supply industry.
9.3 Cost competitiveness impacts on distributors of fuels and other energy
carriers
Distribution of conventional fuels
The structure of the European fuel distribution sector is very much different from that of the fuel production
sector. As indicated in section A2.6.1, major oil companies (ExxonMobil, Shell, BP, Total and Chevron) now
own just a third of Europe’s petrol filling stations and this share may even decline as the largest oil
companies are now seen to place greater emphasis on upstream activities, namely exploration and
production. Independent petrol retailers, most of which are SMEs, own 20% of all petrol filling stations across
Europe. The rest of the market is served by larger, independent fuel distribution and retail companies.
Margins on the sales of fuel are generally low in Europe, so that filling stations have to earn an increasing
share of their income through the shop-sales of other products. A decline in EU petrol and diesel sales as a
result of the CO2 legislation will lead to decreasing turnover for existing filling stations. With costs remaining
the same, this will lead to even lower profit on the fuel sales. Very likely the number of filling stations will
continue to reduce in the coming 10-15 years, or become more automated, leading to a loss of jobs in the
sector. Stakeholders believe that SMEs are more likely to suffer from this than larger companies active in the
sector.
If LDV manufacturers choose to meet the target with an increasing share of alternatively fuelled vehicles, this
will lead to increased demand for e.g. natural gas, electricity, hydrogen and/or biofuels. The impact of a
decreasing petrol and diesel sales on the EU fuel distribution sector can be reduced if these companies
capture a significant part of the market for these new energy carriers. For biofuels this is likely to happen, but
natural gas and hydrogen can in principle be integrated in existing filling stations. Even fast charging stations
for electric vehicles could become part of “energy stations” serving a range of conventional and alternative
energy carriers.
The above impacts, however, should be qualified as economic rather than cost competitiveness impacts
from an EU versus non-EU point of view. Fuel supply companies operate locally or regionally, but do not
directly compete with companies in other regions (apart from some cross-border competition between
adjacent EU and non-EU countries). Even if companies from outside the EU take an increasing share in the
EU fuel distribution and supply infrastructure (for example Lukoil and Q8), they would operate those facilities

Assessment of competitiveness impacts of post-2020 LDV CO2 regulation
Final Report Valdani Vicari & Associati (VVA), Technopolis Group (TG), Joint Institute for Innovation Policy (JIIP), TNO for DG CLIMA 151
in the EU. This would therefore not affect jobs, value added or investments in the EU in a significant way,
compared to these facilities being owned by EU companies.
Distribution of alternative fuels
Increasing the supply of alternative energy carriers requires investments in the distribution and supply
infrastructure for these energy carriers. This is especially the case for natural gas, electricity and hydrogen,
less so for liquid biofuels. For biofuels blended in conventional petrol and diesel no additional distribution
infrastructure is needed. Selling dedicated biofuel vehicles (e.g. E85 or B100) would require investment in
distribution of these dedicated fuels, but costs would be more limited than for electricity and hydrogen as this
infrastructure is incremental to the existing transport fuel distribution system.
In the period in which this infrastructure is expanded the market for companies that build such infrastructure
or supply components for it will increase. This could lead to economies of scale and innovations in products
and production processes, which will improve the cost competitiveness of such companies also on markets
outside the EU.
9.4 Conclusions on cost competitiveness impacts on the fuel supply sector
A declining demand for petroleum fuels, resulting from post-2020 EU LDV CO2 legislation, will increase
competition in fuel supply. For fuel producing companies lower volumes mean that refinery utilisation
rates are expected to go down, leading to an increase in costs per unit production, unless sufficient
refinery closures occur. The combination of the two will strongly reduce profitability of EU refineries. This
means that it will become more difficult for the products of these refineries to compete on the EU market
with imports from Russia or new state-of-the art refineries being opened in India and the Middle-East.
Refineries are mostly owned by large, often global companies competing on various regional markets.
The ability of companies to deal with changes in the EU market may depend on the size of their
European activities and the share of these in their global activities. Impacts may also depend on the
extent to which they produce in the EU for the EU market or also import and export to and from the EU.
With the information available it is not possible to “predict” what the strategic decisions of such global
companies will be in response to the effects of post-2020 EU LDV CO2 legislation on the demand for
fuels in Europe.
Closing of refineries in the EU will lead to a loss of jobs and of value added within the EU. This is an
economic impact that is likely to happen if EU LDV CO2 legislation is effective, but that could be
amplified by the fact that European fuel producers are affected more severely by the legislation than
producers outside the EU which operate new facilities and have a large share of their sales in markets
that are still growing.
Companies that operate fuel distribution infrastructure and filling stations in the EU operate locally or
regionally, and are not directly competing with companies in other regions (apart from some cross-border
competition between adjacent EU and non-EU countries). Reduced demand for petroleum-based fuels
could lead to negative economic impacts on this sub-sector of the fuel supply sector, including a
significant loss of jobs and value added, but these are not to be classified as cost competitiveness
impacts.

Assessment of competitiveness impacts of post-2020 LDV CO2 regulation
Final Report Valdani Vicari & Associati (VVA), Technopolis Group (TG), Joint Institute for Innovation Policy (JIIP), TNO for DG CLIMA 152

Assessment of competitiveness impacts of post-2020 LDV CO2 regulation
Final Report Valdani Vicari & Associati (VVA), Technopolis Group (TG), Joint Institute for Innovation Policy (JIIP), TNO for DG CLIMA 153
10. Effects of post 2020 regulation on cost competitiveness of
(professional) end users
10.1 Introduction
For companies that use cars and vans, either to provide transport services to clients or as part of their own
operations, the total cost of ownership (TCO) for using these vehicles is an element in their cost of doing
business. If the post-2020 EU LDV CO2 legislation affects the TCO of vehicles, it directly affects the costs of
doing business for all companies that use LDVs (professional end-users).
10.2 Identification of possible impact pathways
Pathways along which post-2020 EU LDV CO2 legislation may lead to cost competitiveness impacts on
professional end-users are indicated in Figure 30. Changes in the cost of doing business for a company
affect the price of its products and/or services, which may affect competition in the market and lead to a
change in market shares. If prices change similarly for all competitors, an overall change in the volume of the
market is likely to occur. This may lead to a change in the utilization of facilities of these companies and thus
to a further change in the costs per unit product or service. If these effects work out differently for competing
companies, e.g. as a consequences of differences in their resources and capabilities that are associated with
the region in which they are based or operate, cost competitiveness may be affected.
Making ICEVs more energy-efficient generally leads to a higher vehicle price but lower fuel costs. The net
effect on TCO depends on the amount of efficiency improvement, the related additional vehicle costs and the
costs per unit of fuel. Figure 31 indicates that levels that may come into view for the 2020-2030 period can
be achieved with net negative costs to the end user based on cost curves for 2020 emission reductions. It is
expected that new cost curves for the 2020-30 period will suggest higher reductions to be possible at lower
costs, further increasing the cost effective reduction potential for the-end user.
Alternative fuelled vehicles (AFVs) tend to be more expensive than ICEVs. The fuel costs per kilometre differ
strongly for different energy carriers, partly because no or less tax is levied on them. Currently most AFVs
(without tax incentives) have a TCO that is higher than that of ICEVs. In the 2020-30 timeframe the TCO of
most AFVs is expected to approach that of ICEVs.
In addition to a change in TCO the technologies applied to ICEVs as well as AFVs may have an impact on
the reliability and operability of vehicles, which may affect the value of the product or services supplied.
Implementing BEVs with limited range may affect the way in which end-users use their vehicles and may
even require changes in their operations or way of providing services. This may be seen as a reduction in
the value added by operating such vehicles. On the other hand, the use of electric powertrains is expected to
lead to lower maintenance costs, which may improve the TCO of BEVs.

Assessment of competitiveness impacts of post-2020 LDV CO2 regulation
Final Report Valdani Vicari & Associati (VVA), Technopolis Group (TG), Joint Institute for Innovation Policy (JIIP), TNO for DG CLIMA 154
Figure 30 – Overview of pathways along which the LDV CO2 legislation and the capabilities and resources of companies can lead to cost competitiveness impacts on (professional) end-users

Assessment of competitiveness impacts of post-2020 LDV CO2 regulation
Final Report Valdani Vicari & Associati (VVA), Technopolis Group (TG), Joint Institute for Innovation Policy (JIIP), TNO for DG CLIMA 155
Other compliance strategies
(using flexibilities or applying
for derogation) do not affect
(professional) end users
Location of vehicle
registration (inside or
outside EU) determines
whether company’s fleet is
affected by EU CO2
legislation.
factors affecting Δ price competitiveness for other end user(s)
factors affecting Δ price competitiveness of end user Δ price competitiveness for end user
capabilitiesresources
Δ costs of
provided service
Δ price of
provided
services
cost pass-
through factor
absorb part of
Δ cost
Δ competitiveness
of provided
services
utility parameter
CO2 legislation
utility based
target function
derogations
super-credits
eco-innovations
target
average target
for OEMs
OEM compliance
strategies
increasing
shares of AFVs
applying eco-
innovations
Δ competitiveness
Supplier network
Facilities
Knowledge
Finance
Customer base
Δ long term cost
competitiveness of
company
excess
emissions
premiums
applying
additional CO2
reducing
technologies to
ICEVs
Δ price of of
provided service
Δ quality of
provided service
Δ short term cost
competitiveness of
company
Impact of changes in short term
competitiveness on long term
competitiveness are determined
through impacts on various
resources and capabilities
Ability to provide service
at lower costs
compared to other
(professional) end user
Ability to maintain
current customers even
though price of services
is higher
In case better
competitive
position results
in higher profits
Ability to (temporarily)
absorb losses
Δ CAPEX
ΔTCO
Δ quality of
provided service
Manufacturers need end
users to buy AFVs to meet
target, if these are too
expensive, manufacturers
will cross-subsidise AFVs
higher interest
cost as result of
higher CAPEX
Ability to cheaply
generate capital to
strengthen resources /
capabilities
Δ OPEX
Δ energy costs
Δ maintenance
costs
Δ reliability
Δ applicability /
operabilityΔ fleet
composition /
characteristics
Resources & capabilities
Professional end users Professional end users
Δ profitability
Legislation & OEM compliance strategies Effects of ... Effects of resources/capabilities & legislation/OEM compliance strategies on competitiveness
Δ volume of
products
or services
Sales volumes affect
cost of production
and profitability of
production facilities

Assessment of competitiveness impacts of post-2020 LDV CO2 regulation
Final Report Valdani Vicari & Associati (VVA), Technopolis Group (TG), Joint Institute for Innovation Policy (JIIP), TNO for DG CLIMA 156
Calculations as presented in Figure 17 (see section 5.4) indicate that at least for BEVs and PHEVs
compliance strategies consisting of a combination of improving ICEV efficiency and introducing a finite share
of AFVs leads to a net reduction of cost from an end-user perspective. Provided that the target is not set
extremely low, post-2020 CO2 legislation may thus be expected to lead to an on average net reduction in the
TCO of LDVs for end-users. This, however, remains to be confirmed by currently on-going studies with
respect to costs and modalities of post 2020 LDV CO2 regulations.
Figure 31 – Indicative assessment of impacts on costs to end-users of CO2 emission reduction in passenger cars and vans, based on 2020 cost curves derived in [TNO 2011] and [TNO 2012]
Changes in the TCO of vehicles only lead to cost competitiveness impacts if the changes in costs are
different for different, competing companies. In this respect it seems reasonable to assume that companies
that compete on the same market in the EU with similar products or services will have similar LDV fleets. If
these fleets are registered in the EU, also for non-EU companies, the TCO of these vehicles, and the cost of
doing business for companies using them, will be affected similarly as a result of the LDV CO2 legislation.
From this perspective the legislation does not affect the competition between companies on the EU market.
The condition that LDV fleets are registered in the EU seems applicable to companies that use LDVs for
transport services to clients, as LDVs are not used for long-distance interregional transportation of persons
or goods. As a consequence companies that use LDVs for transport services to clients are most likely EU-
based companies, which are not in competition with companies from other regions.
For EU companies that use LDVs as part of their operations for providing other products or services, which
may be competing with products and services from non-EU companies on the EU market as well as on
markets in other regions, the change in TCO of LDVs affects their cost of doing business and thus the cost of
their products and services. Whether this affects their cost competitiveness relative to companies from other
regions depends on whether other regions have LDV CO2 legislation of similarly stringency as well as on the
fuel prices in the EU and other regions. The fact that post-2020 EU CO2 legislation is in principle expected to
lead to net reduction of end-user costs, can be considered a positive cost competitiveness impact of the

Assessment of competitiveness impacts of post-2020 LDV CO2 regulation
Final Report Valdani Vicari & Associati (VVA), Technopolis Group (TG), Joint Institute for Innovation Policy (JIIP), TNO for DG CLIMA 157
legislation. If different regions have LDV CO2 regulations with similar levels of stringency, EU companies are
expected to benefit more as fuel prices are generally higher in Europe than in other regions. This means that
the fuel cost savings per unit of CO2 reduction are higher in Europe. However, the size of this impact is
expected to be small. For companies that are not directly involved in the transport of people and goods,
transport costs are usually only a small part of the total cost of operation, and the majority of transport costs
will be related to goods transportation using HGVs (trucks) or other modes of transport. The costs of these
are not affected by the LDV CO2 legislation. This means that even if CO2 legislation in other regions would
lead to higher cost reductions for companies from those regions, the negative cost competitiveness impacts
would be limited.
10.3 SMEs
The wide variety of end-users contains a large number of SMEs. EU-based SMEs making extensive use of
LDVs in their operations will in general not be competing with non-EU companies, even if the LDVs are not
directly used for providing transport services. Companies competing on the EU market will be similarly
affected by post-2020 LDV CO2 regulations. For end-user SMEs, therefore no impact on their cost
competitiveness is expected.
10.4 Conclusions on cost competitiveness impacts on professional end-users
Cost competitiveness impacts for professional end-users of LDVs are only to be expected for EU companies
that provide products or services that compete on the EU market or other markets against products and
services from non-EU companies. Positive impacts are expected as the post-2020 EU CO2 legislation is in
principle expected to lead to net reduction of end-user costs. If different regions have LDV CO2 regulations
with similar levels of stringency, EU companies are expected to benefit more as fuel prices are generally
higher in the EU. However, the size of this impact is expected to be small, as the costs of operating LDVs is
generally only a small fraction of the cost of doing business. These slightly lower costs for companies
operating in the EU will result in a net positive (albeit small) improvement in EU cost competitiveness overall.
EU-based SMEs, which in their operations make extensive use of LDVs, will in general not be competing
with non-EU companies, regardless of whether or not these LDVs are directly used for providing transport
services. Companies competing on the EU market will be similarly affected by post-2020 LDV CO2
regulations. For end-user SMEs, therefore no impact on their competiveness is expected.

Assessment of competitiveness impacts of post-2020 LDV CO2 regulation
Final Report Valdani Vicari & Associati (VVA), Technopolis Group (TG), Joint Institute for Innovation Policy (JIIP), TNO for DG CLIMA 158

Assessment of competitiveness impacts of post-2020 LDV CO2 regulation
Final Report Valdani Vicari & Associati (VVA), Technopolis Group (TG), Joint Institute for Innovation Policy (JIIP), TNO for DG CLIMA 159
11. Impacts on innovation competitiveness
11.1 Introduction
The key question regarding innovation impacts of the post-2020 LDV CO2 legislation is whether and how the
LDV CO2 regulation can impact on innovation activities and innovation capabilities of the affected sectors
(including OEMs, component manufacturers, energy supply companies and professional end users) and as a
consequence influence their innovation competitiveness.
Innovation Definitions
Key terms used throughout this section in the context of this study are understood as follows:
Innovation activities are any activities of a company or other organisation that aim at contributing to the implementation
of new or improved products and processes. Activities may be innovative as such but not necessarily as non-novel
activities are necessary for implementation.24
Innovation capability is a set of attributes of a company or other organisation that enable them to effectively engage in
innovation activities. These factors are grouped as follows in the context of this study: 1) Capacity for in-house R&D, 2)
Capacity for in-house product and process innovation, supply of skills etc., 3) Capacity for R&D externalisation, 4)
Capacity to produce and acquire industrial patents and 5) Access to finance.
Firm Competitiveness is the ability to compete in markets for goods or services.25
Competitive Advantage gives a firm
(an OEM or component manufacturer) an edge over its rivals.26
Impacts on innovation competitiveness relate to effects of a policy on a company’s innovation capability that impacts
on their competitiveness (measured either by market share or leadership in a specific market segment).27
The need to
introduce innovations to comply with regulatory requirements may change the relative positioning between industry
players. Note that: 1) the effect of the policy may in fact have both a positive and a negative influence on innovation
competitiveness depending on the innovation capabilities of OEMs and component manufacturers, in particular EU vs.
non-EU OEMs and component manufacturers, 2) the nature of impacts may differ depending on both innovation
capabilities and compliance strategies chosen by different OEMs and component manufacturers and 3) the nature and
timing of impacts may differ depending on how advanced OEMs and component manufacturers are in the innovation
process needed to comply with the regulation.
The LDV CO2 legislation has been found to generally promote innovation in terms of development and
deployment of advanced technologies for conventional and alternative vehicles according to the
Commission’s Impact Assessment study (2013) regarding 2020 targets. This can be seen in increases in the
rate of deployment of CO2 reducing technologies in new LDVs. According to the public consultation held in
2011, “72% of stakeholders and 83% of individuals agreed or partly agreed that EU regulation of road
vehicle emissions stimulates innovation in the automotive sector and helps keep Europe's automotive
24
See Oslo Manual, available at: http://www.oecd.org 25
See Oxford Economic Dictionary available at: http://www.oxfordreference.com 26
See the Economist’s Glossary available at: http://www.economist.com/economics-a-to-z/c#node-21529835 27
See Competitivenss Proofing Toolkit, available at: http://ec.europa.eu

Assessment of competitiveness impacts of post-2020 LDV CO2 regulation
Final Report Valdani Vicari & Associati (VVA), Technopolis Group (TG), Joint Institute for Innovation Policy (JIIP), TNO for DG CLIMA 160
industry competitive”.28
Depending on the rate at which OEMs need to apply new technologies or other
innovative solutions to comply with post-2020 LDV CO2 legislation and on the economic conditions and
financial capacity of the automotive industry, CO2 reduction targets may pose challenges for research,
development and innovation (RDI) both in terms of required knowledge, skills, budgets and timing of
investment.
In terms of Innovation Competitiveness the 2013 impact assessment also concluded that there is no
evidence suggesting that the implementation of 2020 targets would fundamentally alter the competitive
position of EU OEMs. The conclusion was drawn due to the expectation that innovation capacity would
increase as measured by data regarding R&D investments undertaken by OEM’s and component
manufacturers (in terms of both investment size and type of investment). These investments, the authors
observed, consolidated the leading position of EU OEMs in some of the transitional drive-train and fuel
technologies (EC,2013[a]). Similarly, no evidence on competitiveness impacts was found for skills i.e. R&D
employment or IPR protection.
Analysing Innovation Competitiveness impacts of EU post-2020 LDV CO2 legislation requires an
understanding of the relative positioning of EU companies versus companies from other regions and the
level and type of changes required to comply with the LDV CO2 legislation. The reflection needs to include
the following main elements:
Other region’s current and expected stringency of LDV CO2 legislation and current differences in the
capabilities of EU companies versus companies from other regions. The innovation competitiveness
landscape may change depending on the relative positioning of EU OEMs vs. OEMs from other regions
with respect to innovative technologies required to comply with the post-2020 LDV CO2 legislation.
Demand for innovations driven by the LDV CO2 regulation, in the EU and in other regions, which is
critical for the competitiveness of EU OEMs depending on their current presence or aspiration to
penetrate EU and foreign markets.
Costs of carrying out the required RDI and costs of patenting and acquiring licences. Together with the
general economic conditions, market trends and differences in labour and capital costs, decisions
regarding relocation of R&D centres and/or development centres or externalising RDI activities may take
place as a means to remain competitive in the market. While remaining competitive in a global market is
of the essence for EU OEMs a significant part of the value creation may be lost.
In terms of the temporal dimension of impacts, it is important to consider whether and how the introduction
of regulation influences time and timing of RDI activity needed to meet externally or internally imposed
targets. More specifically, this relates to different needs of the innovation process in terms of capital
investment, human resources and RDI infrastructures depending on the stage of the process. Different
compliance strategies may impact the innovation process and also ultimately innovation competitiveness of
an OEM or other related actors.
28
See: http://europa.eu/rapid/press-release_IP-12-771_en.htm; http://eur-lex.europa.eu/legal-content

Assessment of competitiveness impacts of post-2020 LDV CO2 regulation
Final Report Valdani Vicari & Associati (VVA), Technopolis Group (TG), Joint Institute for Innovation Policy (JIIP), TNO for DG CLIMA 161
In this context, innovation competitiveness impacts may be assessed not only in relation to the distance to
the target (i.e. innovation gap) but also considering the past RDI activity and investments and overall
innovation strategy of an actor in focus (e.g. have OEMs RDI strategies and investment been aligned with
the direction of change imposed by the new regulatory pressure?). The latter relates to the dynamics of RDI
developments, which may indicate whether new regulatory pressure requires short- or medium-term action.
This dimension is relevant for analysing the relative positioning of EU OEMs compared to OEMs from other
regions along the time pathway.
More specifically, by time-pathway dependent innovation competitiveness we refer to the differences in
terms of resources, capabilities or market positioning from idea generation, through product design, R&D
and testing to innovative ways to commercialise the product and/or service. Different compliance strategies
aiming to reduce both the cost and the time of the entire process may impact RDI activity and investments
and also ultimately innovation competitiveness of an OEM or other related actors.
11.2 Literature on innovation impacts of regulation
The literature dealing with the effect of regulation on innovative activities emphasises the need to take
account of the systemic nature of innovation activities and the difficulties in attributing innovation effects to
regulation. General findings from the literature review are presented below before looking at specific
evidence on the automotive sector.
Relation between regulation and innovation: The introduction of the Porter hypothesis suggested that strict
environmental regulations could induce efficiency and encourage innovations that help improve commercial
competitiveness (Porter 1995). Empirical evidence compiled by the Community Innovation Survey - 2008
survey, that contains the environmental innovation module, showed that the regulatory factor plays an
important role in introducing environmental innovations. The innovation literature nevertheless suggests that
regulation is but one of the factors influencing innovation. Based on the innovation system approach
innovation evolves within a system in which many interconnected factors play a role (e.g. framework
conditions, technological capabilities, culture).
Type of regulation: Innovation effects have been found to be stronger when due to national rather than supra
national regulation (i.e. involving more than one country) (Popp 2006). Also, the Community Innovation
Survey - 2008 survey, showed that the importance of expected regulations is significant.
Sectorial divergence: Empirical evidence suggests that innovation effects of regulation vary by area (Frondel
et al. 2007; Kammerer 2009). The Community Innovation Survey showed that transport was among the
sectors introducing environmental innovation in response to regulation. Transport (29% of companies) is the
fourth most highly influenced sector after water (47% of companies), energy generation (electricity, gas,
steam and air conditioning supply; 40% of companies), mining (35% of companies) and construction (31% of
companies). The influence from the prospect of future regulation was strikingly high for transportation (26%
of companies) following three other sectors, in particular water (38% of companies), energy sector (37% of
companies) and mining (27% of companies).

Assessment of competitiveness impacts of post-2020 LDV CO2 regulation
Final Report Valdani Vicari & Associati (VVA), Technopolis Group (TG), Joint Institute for Innovation Policy (JIIP), TNO for DG CLIMA 162
Type of Innovations induced by regulation: Evidence suggests that regulation plays an important role in
fostering end-of-the pipe technologies whereas other measures, such as environmental management
schemes and energy and material cost saving measures, seem to be more important when it comes to the
introduction of cleaner production technologies or resource efficiency measures (Frondel 2007, Fleiter 2013).
Attribution of impact to regulation: The attribution of innovation effects to a specific regulation is
methodologically challenging as well as strongly context dependent. The academic work focussing on the
interface of regulation and innovation is rather descriptive since the relation between regulation and
innovation is complex, most often indirect and often evolving over long time periods and thus bearing effects
with long time lags. A relevant distinction that is made is between intended and unintended and direct and
indirect effects. This occurs since between the implementation and occurrences of a regulation’s effect,
several other measures may be introduced which trigger changes and thus, other circumstances than the
regulation itself may influence innovation.
In the automotive sector (and subsectors), the positive role that regulation and policies play in increasing
environmental innovation is supported by the academic literature, notably with the use of patent data. De
Vries and Medhi (2008)29
studied the role of environmental regulation in innovative activities in automotive
emission control in the EU, the USA and Japan. The study was based on patenting data from 1975-2001. It
brought evidence that increasingly integrated abatement strategies are due to policy “shocks” (regulation
introduction). It also showed that a policy shock in other countries could spur innovation also in countries
where such a shock is not occurring. However, the study was inconclusive on the impact of the stringency of
regulation on innovation.
The study by Aghion et al. (2012) estimated the impact of a carbon tax proxied by data on tax-inclusive fuel
prices30
on patenting activities in “clean” (e.g. electric and hybrid) and “dirty” (internal combustion engine)
technologies in the automotive industry. The study used patenting data from 3,423 firms and individuals
between 1965 and 2005 across 80 patent offices. Consistent with what theory predicts the study found that
“clean” innovation is stimulated by increases in the tax-inclusive fuel prices (proxy for a carbon tax) whereas
dirty innovation is depressed.
Volleberg (2010) also focused on the impacts of motor vehicle fuel taxes and mandatory fuel efficiency
standards on relevant car-related innovation activity measured through patenting in selected car-producing
countries. The study showed that important regulatory interventions by governments in Germany, Japan and
the US have induced serious inventions in the car market. Regulatory pressure was considered much more
important than autonomous and contemporaneous effects from changing net of tax fuel prices. Standards, in
particular for CO2 and to a lesser extent NOx emissions, strongly correlated with inventions in emission
abatement (‘emission’), engine redesign (‘input’) and fuel efficiency (‘output’) technologies. Fuel taxes have
an impact, in particular on the technologies that increase fuel efficiency. A limited effect is observed for fuel
29
Published as OECD (2008),Environmental Policy, Technological Innovation and Patents, OECD Studies on Environmental Innovation, OECD Publishing. doi: 10.1787/9789264046825-en, available on http://www.oecd-ilibrary.org/environment/environmental-policy-technological-innovation-and-patents_9789264046825-en 30
Available from the International Energy Agency (IEA) for 25 major countries from 1978 onwards)
Assessment of competitiveness impacts of post-2020 LDV CO2 regulation
Final Report Valdani Vicari & Associati (VVA), Technopolis Group (TG), Joint Institute for Innovation Policy (JIIP), TNO for DG CLIMA 163
efficiency standards, an expected outcome given that CAFE standards were only tightened in 2012 while
Europe had no such standards prior to the current legislation which was agreed in 2009.
Patents are, however, but one output of innovation activity. An interesting complement to the latter findings is
provided by the study conducted by the Sectoral Innovation Watch (SIW) based on survey data. The survey
results indicated that the overall size and frequency of environmental regulations significantly associated with
automotive innovations is relatively low compared to other sectors monitored in the SIW (Montalvo and
Koop, 2011). The conclusion was based on the number of statistically significant correlations between
specific types of innovation and regulations. The authors note that most of the regulatory attention focused
on energy efficiency in final automotive goods while the rest of the provision system is not pressured directly
by regulation to innovate but by specifications provided by OEMs. In other words, the pressure might be
transmitted through the supply chain management dominated by main brand companies. Normally the
dominating company indicates desired changes in intermediate goods to suppliers through new standards
and design modifications.
11.3 Approach to assessing regulatory impacts on innovation competitiveness
The analysis considers whether regulatory impacts of different options and possible strategies may result in
innovation in products and processes. Competitiveness impacts are subsequently assessed on the basis of
the differences in RDI capacity and costs of RDI.
Innovation competitiveness focus
The focus is on manufacturers and in particular the R&D and Innovation capacity of European companies and
competing companies from other regions: To distinguish the European versus companies from other regions we
refer to the analysis made in sub-chapter 2.5. The principal definition chosen is the location of headquarters / owner.
The focus on European manufacturing versus manufacturing in other regions: the current concentrations of RDI
activity and whether changes in the location of RDI activity to comply with the LDV CO2 legislation would seem likely
is addressed within the most relevant pillar, “Capacity for in-house R&D” and in particular “R&D investment in
personnel (R&D centres)”.
To better understand the approach and structure of the chapter we summarise the steps undertaken in a
flowchart (see figure 6.1) showing the four steps (top row from left to right) and a short description of key
aspects (second row below each step).
In designing the approach considerations with respect to the timing of this assessment are made and in
particular the main limiting factor the lack of a defined post-2020 LDV CO2 legislation proposal. The way we
deal with this is by grouping the regulation modalities in terms of their RDI intensity and focusing on main
compliance strategies (step I). On the basis of the compliance strategies in the RDI context key questions
are identified (step II) that help structure the collection of baseline data and form the basis of the interview
questions to stakeholders (step III, see also Annex 3 on how the interviews were conducted). The
assessment of impacts (step IV) is made based on the collected evidence and complemented by the insights
provided in chapters five to ten.

Assessment of competitiveness impacts of post-2020 LDV CO2 regulation
Final Report Valdani Vicari & Associati (VVA), Technopolis Group (TG), Joint Institute for Innovation Policy (JIIP), TNO for DG CLIMA 164
Figure 32 - Innovation impact – Four step approach
Modalities of the Regulation
While the core focus is placed on compliance strategies as a result of a more stringent target, the impact of
other modalities of the regulation on OEMs capacity to innovate and innovation competitiveness must also
be assessed. Compliance strategies are expected to vary by legislative option. Given however the large
variation of possible modalities, we emphasize compliance strategies irrespective of their link to the
regulatory modality. The objective thus is to use our understanding of the modalities to identify the
compliance strategies subsequently scrutinised in terms of their impact on capacity to innovate and
competitiveness.
Compliance strategies and corresponding RDI intensity
Compliance strategies to the post-2020 LDV CO2 legislation may vary in their degree of RDI intensity. This is
showcased by reflecting on the identified options, distinguishing them in medium/high RDI intensive and low-
RDI intensive options of compliance strategies. The degree of RDI intensity relates to technological
innovation required by the legislation. Low RDI intensive compliance options may require more
organisational or marketing rather than technological innovation from OEMs and are hence classified as low.
The potential OEM’s compliance strategies corresponding to the Medium to High RDI intensity in Table 10
where innovation is central include:
Product and service innovation (in-house);
Technological process innovation (in-house);
Purchase of technology;
Strategic partnering for R&D;
Strategic partnering for product/service innovation;
Organisational change (including vertical re-organisation of supply chain and/or geographical relocation).
> In-house RDI
> Purchase of
technology
> Strategic
partnering for R&D;
> Strategic
partnering
> Organisational
change
…
Step I: translate regulation modalities &
compliance strategies in
the RDI context
Step II: Identify Key questions
Step III: Collect Data/ stakeholder views
Step IV: Assess Impacts
> For Innovation
process and
innovation capacity
Impact ...
> For Innovation
Competitiveness
…
> RDI indicators
describing the
baseline
> Information on
regulatory impact
through interviews
and desk research
> Manufacturers
capacity to innovate
…
> EU vs. Other
regions …
Synthesize
Positive Negative
& Grey zone
Impacts

Assessment of competitiveness impacts of post-2020 LDV CO2 regulation
Final Report Valdani Vicari & Associati (VVA), Technopolis Group (TG), Joint Institute for Innovation Policy (JIIP), TNO for DG CLIMA 165
Table 10 - RDI intensive compliance strategies options leading to a mix
RDI technological intensity Compliance Options
Medium to High RDI intensity: Applying additional CO2 reducing technologies to ICEVs
Applying eco-innovations
Increasing shares of AFVs
Low RDI intensity:
Utilising test flexibilities
Increase average utility parameter value (without affecting CO2)
Change sales (eligibility for derogation)
Pool with other OEM group
Pay excess premiums for non-compliance
Product and service innovation can result in new products and services introduced on the market by OEMs,
including engine improvements, introduction of new materials (e.g. light-weight materials), new design etc.
Low-carbon product or service innovation will also result in reduced CO2 emissions in the use phase.
Technological process innovation is innovation in production processes leading to labour and resource
efficiency gains. Strategic partnerships for R&D and product/service innovation may be formed when the
option of following the innovation cycle to develop the technologies in house is weighed against costs and
time path considerations. Organisational change in the RDI context may be pursued to set up an appropriate
organisational setting (e.g. sufficient supply of qualified labour, access to infrastructure) to develop the
technologies required to meet the targets and/or cost of labour.
The translation of the compliance options of medium to high RDI intensity into “innovation language”
represents the core of the subsequent analysis.
Key questions: Innovation Impact Matrix
To identify key questions (see Table 11) we start from the five dimensions as requested in the TOR (see
column capacity to innovate pillars) and combine it with the EC’s Impact Assessment Competitiveness
Proofing Toolkit. After having identified the questions we link each one of them to a set of indicators
necessary for the baseline analysis (see columns proxies and source).
What Table 11 shows is that the literature review and quantitative indicators are used for the description of
the baseline, while Stakeholders’ input primarily focuses on innovation impacts. The analysis is based on
both qualitative and quantitative data. The former are sourced from the literature review (including both
professional and academic literature) and interviews with selected stakeholders. The quantitative part
includes the key RDI capacity indicators covering key innovation aspects requested by this study. While the
analysis concentrates on EU vs. the rest of the world, we follow a bottom up approach and distinguish those
two groups on the level of OEM/Component manufacturer.

Assessment of competitiveness impacts of post-2020 LDV CO2 regulation
Final Report Valdani Vicari & Associati (VVA), Technopolis Group (TG), Joint Institute for Innovation Policy (JIIP), TNO for DG CLIMA 166
Table 11 - Innovation Impact Matrix
INNOVATION CAPACITY BASELINE Questions assessing Innovation Impact
Capacity to Innovate
pillars
Proxies Source
(I) EC term: The potential impact on enterprises' capacity to carry out R&D leading to innovation in its products, which can be further traced to the
impact of the proposal on: supply of skills needed by the sector (Point 6.1.1)
Our understanding: With respect to skills supply in the automotive sector we place ‘innovation impact’ within the context of capabilities of the
sector to perform in house R&D enabled by both RDI personnel and RDI investment. This dimension extends to innovation impacts in terms
Proposition 1: The regulation impacts innovation strategy and RDI investment choices by influencing OEMs business strategy, notably related to
product and service innovation.
Proposition 2: By creating the need for specific R&D skills, the regulation influences the needs of RDI personnel of OEMs.
Capacity for in-house
R&D
Total R&D personnel
and researchers, in
business enterprise
sector (HC)
Eurostat CLEPA
Labour Force Survey
data
Innovation Sectoral
watch31
1. Are the changes in OEMs’ strategy introduced as a direct
response to the regulation likely to influence their current and
future RDI strategy and investment?
2. Are the changes in OEMs’ strategy introduced as a direct
response to the regulation likely to influence the OEMs needs in
terms of RDI personnel? Total R&D Investment
R&D Intensity 2013 EU Industrial R&D
Scoreboard
(II) EC term: The capacity to innovate in processes and product related services, including distribution, marketing and after-sales services (process
innovation), which depends on the supply of management and organizational skills and talents (Point 6.3)
Our understanding: With respect to process and product innovation in the automotive sector we place ‘innovation impact’ within the context the
capacity to design and implement product and process innovation, including organisational and business model innovation.
Proposition 3: The regulation impacts the design and implementation of innovative products.
Proposition 4: The regulation impacts the design and implementation of innovative processes, including changes to business models of OEMs.
Capacity for in-house
product and process
innovation, supply of
skills etc.
Share of Innovative
enterprises
Community Innovation
Survey (CIS)
3. Does the regulation influence the process of design and
implementation of innovative products? (ranging from the design
of the entire car to changes in sub-components)
4. Does the regulation influence the process of design and
implementation of innovative services, including, including
consideration for new product-service systems e.g. based on
leasing and sharing)?
(III) EC definition: The sector’s capacity to bring to the market new products or improve the features of current ones (capacity for product
innovation), which depends crucially on technical skills and application of new technologies (Point 6.2)
Our understanding: With respect to innovation activities in the automotive sector we place ‘innovation impact’ within the context of RDI
externalisation capacity (closely related to point 6.1.1) and the collaboration patterns of OEMs in the supply and value chain.
Proposition 5: The regulation leads to externalisation of OEM’s RDI activities.
Proposition 6. The regulation impacts RDI processes by creating the need for alternative forms of co-operation with external partners
31
Available at: http://ec.europa.eu/enterprise/policies/innovation/files/proinno/sector-report-automotive_en.pdf; A number of relevant sources and data are included in this publication.

Assessment of competitiveness impacts of post-2020 LDV CO2 regulation
Final Report Valdani Vicari & Associati (VVA), Technopolis Group (TG), Joint Institute for Innovation Policy (JIIP), TNO for DG CLIMA 167
INNOVATION CAPACITY BASELINE Questions assessing Innovation Impact
Capacity to Innovate
pillars
Proxies Source
Capacity for R&D
externalisation
Number of R&D
centres inside and
outside Europe and
interactions with
production sites
Desk research 5. Does the regulation lead to externalising R&D or changing the
R&D partners of OEMs? (e.g. purchasing existing technology,
intensifying interactions with tier firms or production sites abroad
or relocation of R&D activity)
6. Are the changes in RDI activities introduced as a direct
response to the regulation likely to influence value chains the
OEMs are part of?
6.1. Are OEMs likely to search for new RDI partners and engage
in new strategic alliances?
6.2. Are OEMs likely to search for new RDI component
manufacturers?
6.3. Are OEMs likely to engage in new strategic alliances?
Cooperation CIS & desk research
Strategic alliances desk research & SDC
database on Joint
Ventures/ Alliances
database
Automotive Clusters Clusters observatory
(IV) EC definition: The potential impact on enterprises' capacity to carry out R&D leading to innovation in its products, which can be further traced
to the impact of the proposal on: the efficiency of protection of intellectual property rights (Point 6.1.2)
Our understanding: With respect to IPR in the automotive sector we place ‘innovation impact’ within the context of IPR strategies.
Proposition 7: The regulation impacts IPR strategies.
Capacity to produce
and acquire industrial
patents
Counts of Patents
registered
Innovation Sectoral
watch & other32
7. Are the RDI changes introduced as a direct response to the
regulation likely to influence OEMs IPR strategies?
7.1. Does the regulation lead to changes in the approaches to
protecting intellectual property (e.g. use of patents versus
industrial secrets)?
7.2. Does the regulation lead to changes in the approach to
patenting and acquiring patents?
Counts of CO2
reducing patents
(V) EC definition: Ability to access risk capital (Point 6.4)
Our understanding: With respect to access to risk capital in the automotive sector we place ‘innovation impact’ within the context of availability of
venture capital
Proposition 8: The regulation leads to a need to attract risk capital.
Access to finance Venture Capital ThomsonOne 8. Are the R&D investments implied by conforming to the
regulation likely to impact on OEM’s access to risk capital?
32
http://thomsonreuters.com/press-releases/012013/747445 ; http://articles.sae.org/11989/

Assessment of competitiveness impacts of post-2020 LDV CO2 regulation
Final Report Valdani Vicari & Associati (VVA), Technopolis Group (TG), Joint Institute for Innovation Policy (JIIP), TNO for DG CLIMA 168
Innovation Impacts
The assessment of innovation impacts of the LDV CO2 legislation on innovation capacities of OEMs is
followed by the assessment of the innovation competitiveness of EU manufacturers compared with
manufacturers from other regions in terms of their differences (Δs) in ‘activities’, ‘outputs and results’ and
‘innovation strategies and strategic partnerships’. To facilitate the analysis a mapping exercise of key
components is performed with the main purpose to: 1) identify the critical points to raise during interviews, 2)
decompose the elements feeding into the impact analysis after the interviews took place and 3) re-assess
the secondary data requirements to be collected before the interviews take place (see Figure 33).
The differences (Δs) are linked back to the innovation impact matrix and to their main components to be
further analysed as shown in Table 12. Possible regulatory impacts on innovation activity are assessed
based on a qualitative analysis backed when possible with quantitative data. Emphasis is placed on the
following attributes:
Directedness (direct and indirect effect);
Likelihood (risk and uncertainty);
Strength of impact (how strong is the probable direct impact on innovation activity);
Strength of attribution (how strong is the attribution of innovation effect to the regulation);
Cumulativeness (does the impact of regulation accumulate or run counter to other innovation drivers
e.g. other policy measures or external market conditions);
Timing of expected impacts (e.g. time lag between regulation and actual impact).
Table 12 - Link between Δs & innovation impact matrix
Differences (Δs) Pathway components to be analysed
Δ RDI activities Capacity for in-house R&D
Capacity for in-house product and process innovation
(In the context of: Availability of necessary skilled personnel and
strategies for attracting talented professionals; Ability to
constantly upgrade the R&D infrastructure etc.)
R&D investment in new technologies
R&D investment in personnel
Service Innovation
Δ RDI outputs and
results
Capacity to produce and acquire industrial patents
(In the context of: Application and capitalisation on patents;
Introduction of new products or improved products (models) in
the market; Development of new trademarks and design; Shifting
to new business models, (e.g. from product to product-service
systems), etc.)
Strategic patenting
Δ Innovation
strategies and
strategic
partnerships
Capacity for R&D externalisation
(In the context of: Capacity for building strategic alliances and
legal partnerships with companies with complementary
innovation capabilities for product development,
commercialisation, diffusion; Capability to do forecast analysis
and based on that develop long term innovation, R&D strategies;
Capability to analyse strength and weaknesses of the
competitors and monitor their innovation development; Capability
to find and enter new markets, adjust to needs of new markets
(develop adjusted models for those) etc.)
Strategic cooperation

Assessment of competitiveness impacts of post-2020 LDV CO2 regulation
Final Report Valdani Vicari & Associati (VVA), Technopolis Group (TG), Joint Institute for Innovation Policy (JIIP), TNO for DG CLIMA 169
Figure 33 - Innovation Pathway Components
Does LDV CO2 legislation impact RDI activities?
Manufacturers
Directly?
Indirectly?
Product Innovation
RDI changes required as a direct
response to the regulation lead to
externalising R&D or changing the
R&D partners of OEMs or influence
value chains the OEMs are part of
Regulation leads to new partners
Regulation leads to new strategic alliances
Regulation intensifies interactions with tier firm
Strategic cooperation
Regulation leads to changes in the approach to protecting intellectual property (e.g. use of patents versus industrial secrets)
Regulation leads to purchasing new technologies
RDI changes required as a direct response to the regulation likely influence OEMs IPR strategies
Strategic patenting
The question is whether and how the affected companies need to change their RDI products and process to meet the requirements of the new regulation.
Compliance influences the process of design and implementation of innovative services, including consideration for new product-service systems e.g. based on leasing and sharing
The question is whether and how the changes introduced as a direct response to the regulation indirectly influence the overall capacity to innovate
The regulation impacts the implementation of innovation services
The regulation impacts the design of the entire car (e.g. emission constraint in the design process)
Process Innovation
Regulation leads to more patenting
Compliance requires higher RD investments
RD prioritization takes place as a result of stringent regulation (toward more CO2 RDI)
RD investment in new technologies
Compliance requires the development of new technologies which may require specific RD skills
RD investment in personnel
(+)
(+)
RDI investment in other segments adjusts downwards
Necessary skills are readily available
(+)
(+)
(-)
(+)
(~)
(~)
(~)
(+)
Δ R&I inputs
Δ RDI outputs
and results
Δ Innovation
strategies &
strategic
partnerships
There is misalignment of CO2
regulation with other innovation aspects impacting the design of the car
(~)
EUROPEAN MANUFACTURERS
VS. MANUFACTURERS IN
OTHER REGIONSCAPACITY TO INNOVATE
Faster prototyping takes place
(+)
OEMs make use of sleeping patents
Legislation leads to relocation of R&D
more investments in R&D in Europe than elsewhere due to the availability of knowledge, skilled researchers and proximity to the market.
(~)Necessary skills need to be sourced internationally
relocation of R&D to countries with lower labour costs
(+)
(-)

Assessment of competitiveness impacts of post-2020 LDV CO2 regulation
Final Report Valdani Vicari & Associati (VVA), Technopolis Group (TG), Joint Institute for Innovation Policy (JIIP), TNO for DG CLIMA 170
11.4 Impacts on innovation competitiveness resulting from changes in regulatory
framework and compliance strategies
Based on the indicators and the interview input from both EU and non-EU manufacturers we compare the
baseline to the different compliance strategies thereby investigating the difference (Δ) in RDI activities, RDI
outputs and results and Innovation strategies and strategic partnerships.
Baseline & stated impacts of CO2 legislation
A summary of the Baseline’s key inputs coupled with the compliance impacts of the current legislation as
discussed by OEMs are described in Table 13. While a distinction is made between EU OEMs and OEMs
from other regions (distinguished according to the criterion of headquarters) similar points were raised by
both. The collected inputs inform the subsequent chapter on assessment of the impact.
Automotive Manufacturers - Innovation capacity and innovation competitiveness impact
The impact assessment analysis combines the baseline information, interviews and insights from chapter 5.
The objective is to describe pathways that lead to a positive, negative, neutral or inconclusive impact on the
innovation capacity of OEMs and on the competitiveness impacts of EU OEMs compared with OEMs from
other regions.
Table 13 - Baseline description & preliminary summary of OEM views
EU OEMs VS OEMs from other regions
Baseline Current Legislation Compliance Impacts on R&D
RDI activities
Cap
acity
for
in-h
ouse
R&
D
R&D expenditure in Europe is
1.6 times higher than Asia
(Japan and South Korea) and
slightly lower (0.9) than the US
(based on 2012 data). Trends
show that the gap between
Europe and Asia has been
increasing and the gap
between Europe and the US
has been decreasing.
R&D Intensity33 in Europe is
highest (ca. 4.6) compared to
Asia and the US (with ca. 4.1
and 4.5 respectively)
R&D personnel in Europe
indications on R&D
employment are limited.
Anecdotal evidence of
increasing R&D employment is
limited to premium OEMs.
Views of EU OEMs
Innovation strategies are only a part of all other strategies (product, service, marketing
etc.). Cost optimization considerations do impact R&D investments.
R&D activities are becoming more resource intensive because technology becomes
obsolete more quickly (the case of cars and not so much vans).
Innovation spending has increased and choices have to be made in terms of prioritising
innovation efforts in different segments, which may lead to a competitive disadvantage in
the longer term.
Mass market OEMs have not and will not most likely increase R&D even further as they
are already constrained and have had serious losses in last few years of economic crisis.
Finding people with the right set of skills in Europe is becoming increasingly difficult
particularly in relation to EVs.
OEMs that are global are more profitable – because the EU market is less profitable than
the foreign ones and can thus rely on external markets to finance innovation.
Views of OEMs from other regions (or of EU OEMS regarding non EU OEMs)
No notable differences in views were provided.
33
R&D Intensity is calculated as the ratio between R&D investment and net sales

Assessment of competitiveness impacts of post-2020 LDV CO2 regulation
Final Report Valdani Vicari & Associati (VVA), Technopolis Group (TG), Joint Institute for Innovation Policy (JIIP), TNO for DG CLIMA 171
EU OEMs VS OEMs from other regions
Baseline Current Legislation Compliance Impacts on R&D
Cap
acity
for
in-h
ouse
pro
duct
and
ser
vice
inno
vatio
n
Innovation activity of EU OEMs
is high though not extraordinary
considering that 6 EU OEMs
ranked among the 150 most
innovative companies in the
world (including the top
innovator ranking first),
compared to 7 from Japan (of
the 8 major OEMs) and 2 from
the US (of the 3 major OEMs)
Views of EU OEMs
Product Innovation
Regulation may impact the scope of innovation but not hugely the extent of the efforts;
Regulatory pressure has led to incremental innovation.
Market acceptance is the main driver particularly the case of mass production OEMs;
Profitability is a pre-condition for ambitious innovation strategies.
CO2 legislation was behind most of the efforts on ICEV.
The more the target and the slope make targets stringent the bigger will be the push to
AFVs and EVs.
A significant share of OEMs R&D expenses was already addressing CO2 reduction
technologies. This is the case for both mass production and premium OEMs.
Low hanging fruit related to ICEV innovation have been grabbed and the most resource
intensive innovations are currently under development.
Innovation is concentrated on powertrain-related innovation, engines, aerodynamics,
affordable light-weight materials, catalytic converters
Increasing efficiency of diesel engines is important for EU OEMs.
Strategies on alternative fuel vehicles seem to vary across companies. Innovation in EVs
and natural gas is in some cases no longer actively pursued nor is hybridisation.
Services Innovation:
A number of OEMs got involved in car sharing initiatives. However the emergence of these
business models/services was not driven by CO2 regulation, but rather it was a strategy to
enter a new market and/or being prepared to potentially changing customer behaviours.
Emerging trends like service innovation e.g. electricity contracts, applications locating
charging stations, parking etc. is backing product innovation are occurring. Currently they
are developed by premium OEMs and hence motivated by being on the cutting edge of
innovation.
Manufacturers that can differentiate their technology by product and market may have an
advantage over premium manufacturers that apply technological innovations on all
products.
Views of OEMs from other regions (or of EU OEMS regarding non EU OEMs)
Product Innovation:
Regulation drives R&D efforts.
The focus of some OEMs has been on affordable low CO2 options to make fuel efficient
vehicles available for everybody (better aerodynamics, light-weight materials that are still
affordable) and bring the fleet average down (not just have some extreme show cases).
No difference between EU and non-EU OEMs: Similar concerns regarding premium and
mass production cars; Similar concerns on the impact because of regulation preventing
focus in developing other technologies (e.g. autonomous driving) that can satisfy the
demands’ needs, solving current challenges (e.g. “gridlock”) and therefore possibly
generating revenues and margins.
Differences between EU and non-EU OEMs in terms of accessibility and affordability of
financial sources may exist if granted under more favourable conditions from third parties
or governments (e.g. Chinese or US governments have substantially more favourable
conditions for industry R&D investments and in higher amounts available in comparison to
the EU – for transport sector only around maximum 2bn will be granted from Horizon
2020).
Differences between EU and non-EU OEMs in terms of direct or indirect support from the
headquarters outside the EU that might give higher level of security and financial means
for certain type of costs (like research, innovation etc.). It was however stressed that this
works both ways as all ACEA members are global companies.

Assessment of competitiveness impacts of post-2020 LDV CO2 regulation
Final Report Valdani Vicari & Associati (VVA), Technopolis Group (TG), Joint Institute for Innovation Policy (JIIP), TNO for DG CLIMA 172
EU OEMs VS OEMs from other regions
Baseline Current Legislation Compliance Impacts on R&D
RDI outputs and results
Cap
acity
to p
rodu
ce
and
acqu
ire in
dust
rial
pate
nts
Patents on “alternative
powered vehicles”: EU OEMs
are significantly behind Asian
OEMs and comparable to US
OEMs
Views of EU OEMs
IPR strategies are more relevant outside of Europe in particular China.
No impact in the management of IPR and of patent portfolio strategies
No shifts towards other form of protection of IP (e.g. industrial secrets)
Innovation strategies and strategic partnerships
Ca
pa
city fo
r R
&D
exte
rna
lisa
tio
n
R&D fundamental research
centres of EU OEMs tend to
be located in Europe. Non-EU
OEMs have at least
development centres in
Europe.
Collaboration/ Partnerships/
Clusters: OEMs (including both
Motor vehicles and passenger
car bodies & Motor vehicle
parts and accessories) in the
EU participate less than non
EU OEMs in alliances (in ca.
40% of total Alliances between
2000-2014)
Views of EU OEMs
Partnerships
Due to fierce competition R&D activities done internally at the moment may be
reconsidered in the future.
Partnerships with OEMs that own patents that are considered necessary or critical are
considered.
Partnerships, with other OEMs are less prominent in the case of premium OEMs for whom
retaining a competitive advantage through technology leadership is critical.
Alliances on technical matters are already happening in particular for German and
Japanese OEMs (e.g. BMW and Mercedes announced very recently that they launch a
new programme on HEV and PHEV components)
Partnerships with other OEMs in non EU countries occur, because for example of
obligations to launch joint ventures to produce in some countries (e.g. China)
Relocation
Pressure on prices may lead to moving resource allocation for R&D to less expensive
locations than Europe.
Views of OEMs from other regions (or of EU OEMS regarding non EU OEMs)
Partnerships
OEMs form partnerships and joint ventures to pool resources for R&D
Relocation
Establishment of R&D centres active in CO2 emissions compliance in the EU of non EU
OEMs are motivated by the different pace of legislation in Europe
Other
Electrification will move a lot of value creation out of the industry and push towards players
specialized in the production of electric motors and batteries.
A big challenge are new players such as Tesla and possibly players that are currently in
other businesses such as Google. This is due to the fact that the more stringent the
legislation becomes, the more the sector needs restructuring and new competences. This
creates opportunities for new players to enter the market – especially the ones with large
resources – and this leads back to players such as Google.
In case of radical changes incumbents will suffer from “legacy effects” such as out-of-date
competences, employees’ skills, pension funds, etc.

Assessment of competitiveness impacts of post-2020 LDV CO2 regulation
Final Report Valdani Vicari & Associati (VVA), Technopolis Group (TG), Joint Institute for Innovation Policy (JIIP), TNO for DG CLIMA 173
R&D investment in new technologies
According to interviews with OEMs, R&D budgets are set by OEMs as a % of turnover hence total innovation
investment has not changed due to the existing regulations. As profitability has been decreasing R&D
budgets have been under pressure. CO2 related R&D has in fact consumed higher shares of RDI budgets as
a consequence of CO2 regulation but R&D investments in CO2 reducing technologies to make engines more
efficient, has occurred before the CO2 regulation. The legislation has led to larger scale applications and
possibly an acceleration of the innovation process particularly regarding innovations “in the pipeline”. That
said regional priorities and other legislation restricts future substantial increases in CO2 investments. On the
other hand the increasing pressures on R&D dedicated resources, poses risks to R&D investments in other
forward looking segments of the market like for example automated driving systems or infotainment.
From the baseline (see Annex 2) and interviews we infer that the regulation directly impacts R&D
investments of OEMs. The likelihood is high particularly under the assumption that stringent targets will
eventually push car manufacturers towards AFVs including those that have until now chosen a different
compliance strategy like e.g. diesel. R&D investments are however not expected to increase in absolute
value in the event of more stringent CO2 regulation assuming profit margins remain low and price pressures
continue. This appears to be the case irrespective of stringency or compliance strategy. The attribution of the
absolute levels of R&D investment to the regulation appears low.
However, bearing in mind that: 1) R&D is viewed as a key driver for competitiveness irrespective of
regulation, 2) CO2 reducing technologies have been part of the R&D portfolio of companies, and 3) that in
some cases CO2 reducing technologies have already absorbed substantially more OEM funding due to the
regulation, we can infer that R&D prioritisation may be further impacted depending on the stringency of the
target, compliance strategy and related R&D effort (e.g. in house R&D or externalisation of R&D).
That said, cumulative innovation impacts may occur since OEMs opting to build core competences in CO2
reducing technologies in house will need to use resources previously allocated to other R&D segments
should profit margins remain low. In the case of low margins persisting in the short to longer term the
availability of financing like through venture capital or the ability to cross subsidize losses in Europe by other
markets overseas are determining factors.
As such the effect on innovation competitiveness of EU OEMs compared with OEMs from other regions is
indirect since it is mainly driven by profitability and hence the positioning of OEMS in more or less profitable
market segments across the globe. For example OEMs largely present in the EU markets and able to cross
subsidize losses from markets outside of Europe could respond to stringent targets with increased R&D
investments given higher total turnover. This has been observed in the case of premium manufactures. Mass
producer manufacturers on the other hand are not in this position and are unlikely to increase R&D even
further as they are already constrained and have had serious losses in the last few years of economic crisis.
It hence appears difficult now and in coming years for these companies to increase R&D expenditure.
Differences in the access to finance, for example the availability of venture capital, which tends to be higher
in the US than Europe may also result in a competitive disadvantage to EU companies in the medium to
longer term. Moreover, disadvantages may occur considering emerging competition from new players like

Assessment of competitiveness impacts of post-2020 LDV CO2 regulation
Final Report Valdani Vicari & Associati (VVA), Technopolis Group (TG), Joint Institute for Innovation Policy (JIIP), TNO for DG CLIMA 174
Tesla or Google which possess the resources to finance technologies of the future and benefit from a ‘first
mover’ advantage.
Profit Margins
Scotiabank (2013) reports34
that profitability for the five largest car manufacturers remains healthy, with gross margins at
10-year highs and net income consistently exceeding USD 50 billion per year since 2011. Profitability is highest in North
America, but is improving in every region, including Western Europe, the only jurisdiction where the industry remains
unprofitable. While car manufacturers have started to close plants in Western Europe, they continue to ramp up their
capital expenditures in the rapidly-growing emerging markets of Asia and Latin America. Profit margins are higher on
premium models whereas city or mini cars margins are thin. Many of the mini cars sell for less than EUR 10 000 (USD
13 860), barely more than the cost of making them. Experts suggest that the margins on city cars can only be 3% at
best.35
The EU new-car market has shrunk every year since peaking at 16 million units in 2007. New-car sales dipped 8% to 12
million in Europe in 2013. This negative trend is mainly attributed to the 2007-08 financial crisis that has led to a dramatic
decline in consumption. On the other hand, the three premium German automakers have managed to avoid the EU sales
declines due to the strong demand for their models in countries such as China and the United States.
Although highly conditional on a number of factors a brief overview of inferred impacts of post-2020
regulations on R&D and innovation investments is provided in Table 14.
Table 14 – Summary: Post 2020 regulation impacts on R&D and innovation investments
Directedness
(direct and indirect effect)
Likelihood
(risk &
uncertainty)
Strength of impact
(how strong is the
probable direct
impact on
innovation
activity)
Strength of
attribution
(how strong is the
attribution of
innovation effect
to the regulation)
Cumulativeness (does the
impact of regulation
accumulate or run counter to
other innovation drivers e.g.
other policy measures or
external market conditions)
Timing of expected
impacts (e.g. time
lag between
regulation and
actual impact)
Direct impact on OEMs
R&D investments implied
by the regulation’s
modalities: Regulation
does not directly affect
total R&D spending but
may influence allocation
between different lines of
R&D expenditure
Low to Medium:
Low with respect
to absolute R&D
expenditures
Medium in the
case of R&D
prioritisation -
highly dependent
on target level
and R&D strategy
Low to Medium-
low: Low with
respect to
absolute R&D
expenditures
Medium Low to
R&D prioritisation
Low to Medium:
Low with respect
to absolute R&D
expenditures
Medium in the
case of R&D
prioritisation -
highly dependent
on target level
and R&D strategy
Yes: cumulative costs of
regulation are possible; the
regulation may run counter
other regulations e.g. safety,
infotainment or fully
automated vehicles that may
become less prioritary -
highly dependent on target
level and R&D strategy
No time lag: in
anticipation of a
stringent regulation
options are
investigated and
actions undertaken
R&D investment in personnel (R&D centres)
According to interviews, OEMs and component manufacturers unanimously stress the increasing difficulty in
finding people with the right set of skills in Europe. New skills both on new technologies and at system level -
more complex profiles with a mix of knowledge from different domains, are scarce and student scholarships
34
Available at: http://www.marketwired.com 35
Available at: http://online.wsj.com/news

Assessment of competitiveness impacts of post-2020 LDV CO2 regulation
Final Report Valdani Vicari & Associati (VVA), Technopolis Group (TG), Joint Institute for Innovation Policy (JIIP), TNO for DG CLIMA 175
no longer suffice. India, China, Pakistan are among the countries with highest engineering skills supplies and
hence provide a current and increasingly important pool from which OEMs may source the necessary skills.
Skills are therefore currently already sought outside Europe and made good use of in research centres
(namely development centres but maybe also fundamental research centres) in those countries where the
necessary skills are more easily available. Provided no constraints apply on global recruits the sector does
not face particular skills shortage. Strategic R&D is however typically performed at headquarters.
According to the baseline (see Annex 2) and interviews we infer that the regulation directly impacts OEMs
human capital requirements in R&D, should OEMs comply to stringent targets by in-house development
(either in collaboration or using exclusively own resources). This may not necessarily translate into a growth
of R&D personnel but a differentiation in the set of skills of people employed (considering that R&D budgets
are tied to profit margins and hence differentiated for premium and mass manufacturers or more generally
manufacturers compensating losses in Europe by sales overseas).
R&D skills may in fact be more actively sought outside Europe in the short term should OEMs respond to
more stringent targets with an intensification of AFV and EV technologies. Shortage of skills in Europe
altogether may however have the same effect irrespective of the stringency of the target. In fact R&D skills
are already sought globally and are not limited to electrical engineering skills. Depending on the local
conditions (namely the supply of the right set of skills) and R&D prioritisation, decisions to recruit globally at
headquarters, increase capacity in some R&D centres at the expense of other R&D centres, or relocate R&D
may be considered irrespective and in anticipation of the regulation with an eye to future global market
trends.
The impact of the regulation is cumulative considering the R&D requirements and consequently skills implied
by for example safety regulations and equally the requirements imposed by the market itself and the
emerging competition.
Competitiveness impacts between EU OEMs and OEMs from other regions are not expected due to the
nature of the industry, operating global production, supply and value chains and the relative ease of
attracting talent from countries with lower income per capita. However, the loss of expertise within Europe
further heightened in the sector by a possible increased tendency to relocate R&D centres and the impacts
beyond the automotive sector is a competitiveness implication for Europe altogether. This aspect however
falls beyond the scope of this study.
Although highly conditional on a number of factors a brief overview of possible impacts on R&D employment
is provided in Table 15.
Service innovation
According to the interviews with OEMs, service innovation with respect to the aforementioned examples like
car sharing and car leasing are motivated by the emerging new market opportunities that car manufacturers
anticipate, as well as by consumer behaviour and not the CO2 legislation.

Assessment of competitiveness impacts of post-2020 LDV CO2 regulation
Final Report Valdani Vicari & Associati (VVA), Technopolis Group (TG), Joint Institute for Innovation Policy (JIIP), TNO for DG CLIMA 176
Table 15 - Summary: Post 2020 regulation impact on R&D employment
Directedness
(direct and
indirect effect)
Likelihood
(risk & uncertainty)
Strength of impact
(how strong is the
probable direct
impact on
innovation activity)
Strength of
attribution
(how strong is the
attribution of
innovation effect
to the regulation)
Cumulativeness (does the
impact of regulation
accumulate or run counter
to other innovation drivers
e.g. other policy measures
or external market
conditions)
Timing of expected impacts
(e.g. time lag between
regulation and actual
impact)
Direct impact
on OEMs R&D
human capital
requirements
and R&D
recruitment.
Medium-High: due
to current shortages
of skills in Europe
and pressures from
regulation, market
demand,
competition.
Medium-High: due
to current shortages
of skills in Europe
and pressures from
regulation, market
demand,
competition.
Low-medium:
regulation affects
R&D recruitment
and decisions on
R&D relocation
among other
factors
Yes: the impact of
regulation is cumulative
given the increasing
overall R&D pressures for
technological advances
from other regulations,
market demand and
competition
No time lag: In anticipation
of more stringent regulations
R&D staff is already
employed from overseas
and relocations of R&D may
already be happening/
considered
According to the baseline (see Annex 2) and interviews we can infer that there is no direct impact of the
regulation on service innovation. The impact is rather induced in nature due to the fact that manufacturers
complying to the regulation with for instance increased investments in AFVs and EVs may also couple their
products with innovative services. Service innovation tends to be motivated by the intention of OEMs to
interact directly with the end user and not from regulatory requirements. Consumer behaviour is nevertheless
affected by regulation and hence does impact the type of service innovations which OEMs would seek to
develop and make available to the consumer. In terms of innovation competitiveness there is insufficient
information to assess the impacts in terms of EU OEMs vs. OEMs from other regions.
Although highly conditional on a number of factors a brief overview of possible impacts of post-2020
regulation on service innovation is provided in Table 16.
Table 16 - Summary: Post 2020 regulation impact on Service Innovation
Directedness
(direct and indirect
effect)
Likelihood
(risk & uncertainty)
Strength of
impact (how
strong is the
probable direct
impact on
innovation
activity)
Strength of attribution
(how strong is the attribution
of innovation effect to the
regulation)
Cumulativeness (does
the impact of
regulation accumulate
or run counter to other
innovation drivers e.g.
other policy measures
or external market
conditions)
Timing of
expected impacts
(e.g. time lag
between
regulation and
actual impact)
Induced: no modality
of the regulation is
directly or indirectly
linked to the provision
of services
Low-medium:
depending on the
compliance strategy
services may be more
directly linked to
specific products
Not applicable:
no direct
impact
Low due to the
predominance of other
demand related conditions
Not applicable Not applicable

Assessment of competitiveness impacts of post-2020 LDV CO2 regulation
Final Report Valdani Vicari & Associati (VVA), Technopolis Group (TG), Joint Institute for Innovation Policy (JIIP), TNO for DG CLIMA 177
Strategic patenting
Very limited information was provided during either the interviews or the workshop. Two main points were
made: 1) Individual IPRs are not always desired or possible and hence IPRs may be shared by 2-3 OEMs
and 2) IPR strategies are principally relevant outside of Europe and in particular China.
According to the baseline (see Annex 2) and interviews we can infer that the regulation may indirectly impact
patenting activities by inducing OEMs to reconsider their patenting strategies. OEMs may be pushed towards
more shared IPR should they decide to penetrate a market segment requiring technological capacities either
currently under development or fully developed or both developed and commercialised by competitors. The
availability of capital and ‘time to market’ are key considerations in such decision making process.
Shared IPR may hence take the form of collaboration - sharing development costs, or direct purchase of
patent(s). Collaboration may occur for a single technology or a set of technologies and be temporary or be
set up as a more long term collaboration like the case of Renault and Nissan that have announced their
intention to deepen their integration by strengthening cooperation in R&D. In the case of OEMs using
electrification as their compliance strategy, some form of shared IPR between EU and Japanese OEMs/
component manufacturers may become increasingly desirable should there be gains for all parties involved.
There is however no available information on the current shared IPR strategies of those EU OEMs with
formed relationships with Japanese OEMs.
Table 17 - Summary: Post 2020 regulation impact on IPR strategies
Directedness
(direct indirect
induced effect)
Likelihood
(risk & uncertainty)
Strength of impact
(how strong is the
probable direct
impact on innovation
activity)
Strength of attribution
(how strong is the
attribution of
innovation effect to
the regulation)
Cumulativeness
(does the impact of
regulation
accumulate or run
counter to other
innovation drivers
e.g. other policy
measures or external
market conditions)
Timing of expected
impacts (e.g. time lag
between regulation
and actual impact)
Indirect impact on
patenting strategies
Low-high: highly
dependent on the
current capabilities of
OEMs as reflected in
their patent portfolio
and the compliance
strategy
Low-high: highly
dependent on the
current capabilities of
OEMs as reflected in
their patent portfolio
and the compliance
strategy
Medium-high:
depending on the
compliance strategy
and the current
distance from the
new targets patenting
strategies will be
strongly impacted
Yes: R&D budgets
need to cover a wide
spectrum of
innovations as a
result of other
regulations and
market drivers and
patenting is a costly
endeavour
No time lag: Being a
‘first mover’, and
achieving ‘speed to
market’ impacts
competitiveness. In
anticipation of the
regulation IPR
strategies are re-
considered hence no
significant time lag is
expected.
As in the case of R&D expenditure and R&D skills, patenting requirements are cumulative in nature given the
requirements imposed by regulations, the market itself and the emerging competition. Patenting is resource
intensive and time consuming leading to strategic choices and prioritisation being made for the medium to

Assessment of competitiveness impacts of post-2020 LDV CO2 regulation
Final Report Valdani Vicari & Associati (VVA), Technopolis Group (TG), Joint Institute for Innovation Policy (JIIP), TNO for DG CLIMA 178
longer term. Unexpected and/or significant changes in any of the influencing factors linked to the developed
technologies can impact the return on investment with further consequences on market shares and survival.
That said a possible regulatory push towards electrification as the only means of compliance could lead to a
competitive advantage for Japanese, but possibly also Chinese and Korean manufacturers/component
manufacturers whose R&D and innovation investments are currently further ahead in the innovation cycle
and hence benefit from a ‘first mover’ advantage. On the other hand some EU Manufacturers are catching
up fast and given the breakthroughs accomplished already in the course of time, EU manufacturers may
benefit from a higher ‘speed to market’.
Although highly conditional on a number of factors a brief overview of possible impacts of post-2020
regulation on IPR strategies is provided in Table 17.
Strategic collaboration
According to the interviews with OEMs strategic cooperation through partnerships with first tier producers or
among OEMs have not been uncommon and are expected to become more relevant as stringent targets
require technologies that may either not be readily available in-house (skills shortage altogether or early
stage in the innovation cycle) or may not be cost-effective.
The market for electric and hybrid vehicles
Today there are around 500,000 electric vehicles in the world (which is a small proportion of the approximately 1 billion
road vehicle fleet). The amount has been growing, however earlier optimistic projections have been slightly tempered.
Core motivations behind the push for EVs include national and regional government regulations. Those reasons plus the
underlying environmental and energy concerns that gave rise to mandates – and generally shared sentiment held by
consumers – is continuing to spur demand.
Countries which showed the highest rate of growth from 2012 to 2013 were the Netherlands (338%), Norway (129%),
Germany (105%) and the U.S. (81%). Those countries with the highest market share in 2013 were Norway (5.6%), the
Netherlands (5.37%), France (0.65%), Sweden (0.57%) and the U.S. (0.62%).36
The hybrid car market is increasing rapidly as more manufacturers introduce new and wider range of models into the
market, giving consumers more options. The majority of the hybrid car market is American based and the second largest
is Japan.37
Hybrids account for just over 1 % of the global market, while Japan and the US together represent 84 % of
the global hybrid market.
Projections by Pike research show that the main increase in sales of hybrid-electric light-duty vehicle will take place in
the Asia-Pacific and North America. The growth in the EU is expected to be rather insignificant.
According to the baseline (see Annex 2) and interviews we can infer that the regulation may indirectly impact
collaboration strategies. Capabilities and risk sharing are among the reasons motivating such initiatives.
Strategic collaborations are expected to become an important part of OEMs compliance strategies
particularly in the event of a stringent target, a short time horizon for adjustment considering the length of the
36
http://www.hybridcars.com/top-6-plug-in-car-adopting-countries/ 37
http://mosaic.cnfolio.com/M528Coursework2007A204

Assessment of competitiveness impacts of post-2020 LDV CO2 regulation
Final Report Valdani Vicari & Associati (VVA), Technopolis Group (TG), Joint Institute for Innovation Policy (JIIP), TNO for DG CLIMA 179
innovation cycle and the different positioning of OEMs in technological capabilities. The regulation would
therefore possibly heighten the urgency while the speed at which the market demands new technologies is
expected to be slower particularly in the case of AFVs and EVs in Europe. In the case of other faster growing
markets like Asia-Pacific and North America OEMs already present in those markets would benefit the most
in the short term to medium term. As such among EU OEMs premium OEMs already present in those
markets will suffer the least.
Although highly conditional on a number of factors a brief overview of inferences drawn with respect to R&D
collaboration strategies is provided in Table 18.
Table 18 - Summary: Post 2020 regulation impact on R&D Collaboration Strategies
Directedness
(direct and indirect
effect)
Likelihood
(risk & uncertainty)
Strength of impact
(how strong is the
probable direct
impact on innovation
activity)
Strength of attribution
(how strong is the
attribution of
innovation effect to
the regulation)
Cumulativeness
(does the impact of
regulation
accumulate or run
counter to other
innovation drivers
e.g. other policy
measures or external
market conditions)
Timing of expected
impacts (e.g. time lag
between regulation
and actual impact)
Indirect impact: no
modality of the
regulation is directly
linked to R&D
collaboration
strategies
Low-high: highly
dependent on the
current capabilities of
OEMs as reflected in
their R&D & patent
portfolio and the
compliance strategy
Low-high: highly
dependent on the
current capabilities of
OEMs as reflected in
their R&D & patent
portfolio and the
compliance strategy
Low-high: depending
on the target level,
compliance strategy,
corresponding R&D
requirements and
existing
collaborations R&D
collaborations are
expected to vary in
urgency and form
Yes: R&D budgets
need to cover a wide
spectrum of
innovations as a
result of other
regulations and risks
are high
No time lag:
Collaborations are
being considered in
anticipation of the
regulation
LCVs - Innovation capacity and innovation competitiveness impact
From a customers’ perspective, LCVs are mainly intended for businesses, including a lot of SMEs. Among
key factors in the purchasing of an LCV has been fuel consumption and increasingly the rules on local
delivery typically defined by municipalities or cities. A common practice has been for new LCVs to be re-sold
after 2-3 years using the purchase price as a reference.
The market for LCVs is a factor of 10 smaller than the market for cars. Sales of LCVs are quite sensitive to
economic fluctuations and have been particularly hit by the recent economic crisis. LCV customers have a
low willingness to pay a premium for AFVs. In general, the market for premium LCVs is very small and hence
margins are small.
From an innovative power perspective strong limitations apply due to the commercial use of those vehicles,
namely the fact that the body of LCVs needs to carry the load and LCVs often have multiple uses. Making
specific powertrains makes little commercial sense. Since technologies are transferable between the two
types of vehicles, the innovation resources spent on LCVs are much smaller than for cars.

Assessment of competitiveness impacts of post-2020 LDV CO2 regulation
Final Report Valdani Vicari & Associati (VVA), Technopolis Group (TG), Joint Institute for Innovation Policy (JIIP), TNO for DG CLIMA 180
No evidence suggests that there would be any impact on innovation investment or the relocation of R&D
centres, as technologies used in LCVs are typically a result of knowledge transferred from the technologies
developed for cars. With respect to competitiveness between EU and non-EU OEMs should the regulation
be coupled by other actions to stimulate the use of AFVs a negative impact for EU OEMs may occur as a
result of the technological advantage of non-EU OEMs. This assumes non EU OEMs will more actively target
the EU LCV market whereas they currently represent a minor share.
LCV Sales
EU sales of LCVs have dropped significantly over the last 5 years. New LCV sales are correlated with business
investments and retail activities by companies which, in turn, have been affected by the economic downturn. As a result,
sales in Europe in the last 6 years have dropped dramatically, from more than 2.2 million units in 2007 to 1.43 million
units in 2013, with an annual decrease of more than 7%.
EU manufacturers, which retain more than 74% of EU LCV sales in terms of units, have been affected differently,
somehow in line with the trends of their national economies. Whereas German manufacturers have managed to contain
sales drops (e.g. Volkswagen -10% and Daimler -17% over the last 5 years), French ones have faced heavier
consequences (with Renault recording 22% and PSA 24.5% sales decreases from 2008 to 2013). Fiat has been the
most affected among large EU manufacturers with -52% over the last 5 years.
In summary in the case of LCVs the RDI exclusive expenditure is substantially lower since technologies are
highly transferable from cars to LCVs. The usage of LCVs also limits the applicability of technically possible
innovations. These limitations apply to all manufacturers, EU and from other regions hence should a
regulation impose stringent targets we expect sales will be impacted depending on the price elasticity of
professional end users. OEMs with competitive prices due to low development costs and economies of scale
may have an advantage. Collaborations may also arise as a result of market accessibility and technological
advantages lying distinct in the hands of respectively EU and non EU OEMs.
11.5 Component manufacturers - Innovation capacity and innovation
competitiveness impact
From a technological innovation view point OEMs are dependent on first tier component manufacturers.
These on their side strive for cutting edge technology advances in terms of commodities and system
integration to avoid commoditisation and sustain constant price pressures from the OEMs. Regulatory
pressure is considered the main driver of innovation. Component manufacturers have been increasingly
redirecting or boosting their R&D efforts on powertrain electrification and hybridization. There are component
manufacturers in Europe that have increased their R&D budgets in absolute terms. Nevertheless currently
Asian component manufacturers benefit from a ‘first mover’ advantage and are better placed in AFV and EV
technologies particularly considering that the highest share of the total value is in the battery (with the great
majority of manufacturers in Japan and some in Korea, the US, Canada).
Component manufacturers’ innovation capacity is directly positively impacted by the regulation. Innovation
activity of first tier component manufacturers and their suppliers is further stimulated in response to
legislation in their major markets also beyond Europe. Given that EU component manufacturers’ R&D

Assessment of competitiveness impacts of post-2020 LDV CO2 regulation
Final Report Valdani Vicari & Associati (VVA), Technopolis Group (TG), Joint Institute for Innovation Policy (JIIP), TNO for DG CLIMA 181
portfolio is wide-ranging a legislative push towards a more narrow range of technologies would give a
competitive advantage to component manufacturers with a competitive edge in those specific technologies at
least in the short term, the case of Japanese component manufacturers for electric components vs. the
diesel based innovations of EU component manufacturers. Moreover due to the value of the battery and the
dominance of Japanese component manufacturers a large share of the value would shift outside of Europe.
Therefore, such a technologically biased regulatory push may cause negative innovation competitiveness
impacts in the short term as a result of the different innovation capabilities of EU component manufacturers
compared to component manufacturers from other regions. In the medium to longer term and depending on
the strategies of EU component manufacturers in response to the technological mix implied by the post 2020
legislation increased innovation in EV technologies may occur with EU component manufacturers benefiting
from a higher ‘speed to market’.
In summary component manufacturers act in anticipation of regulations and are particularly responsive to
regulations particularly due to the important role they play in the realisation of technological innovations. First
tier component manufacturers provide beyond components, system integration which differentiates them
from other component manufacturers focused exclusively on commodities. The portfolio of component
manufacturers tends to be diverse with a leading position in fuel injection technologies and an increasing
emphasis on powertrain electrification and hybridization. Japanese component manufacturers are however
clearly leading in the field. A regulation with an emphasis on electrification will inevitably impact EU
component manufacturers should OEMs currently focused on diesel reconsider their product mix.
11.6 Energy Providers - Innovation capacity and innovation competitiveness
impact
By Energy providers we refer to fuel distributors and refineries. In the case of fuel distributors no emphasis is
placed on R&D and innovation activities. In the case of refineries a significant part of R&D and innovation
resources goes to improving environmental performance also as a consequence of tightening fuel product
norms and emissions standards included in the EU’s Fuel Quality Directive. The impact of CO2 legislation on
their capacity to innovate is considered negligible. However increasing shares of AFVs, may require
innovation by suppliers of alternative fuels (e.g. electricity and hydrogen). Nonetheless as most of these
companies are only competing on the EU market this is not expected to affect innovation competitiveness
with non EU fuel distributors.
11.7 Professional End users
By professional end users we refer to companies that use cars and vans, either to provide transport services
to clients or as part of their own operations. The impact of CO2 legislation on their capacity to innovate is
considered negligible. Increased share of AFVs may require some innovation in fleet operation but as most
EU end-users of LDVs are not in competition with companies from outside EU this is not expected to affect
innovation competitiveness.

Assessment of competitiveness impacts of post-2020 LDV CO2 regulation
Final Report Valdani Vicari & Associati (VVA), Technopolis Group (TG), Joint Institute for Innovation Policy (JIIP), TNO for DG CLIMA 182
11.8 Key conclusions
Key conclusions synthesize most relevant findings of the impact analysis of the LDV CO2 legislation on R&D
and Innovation. To do so we go back to our theoretical framework and in particular our propositions and the
innovation competitiveness impact matrix.
Table 19 - Innovation Capacity and Competitiveness key Conclusions
Propositions Differences
(Δs) Key conclusions
Proposition 1: The
regulation impacts
innovation strategy and
RDI investment choices
by influencing OEMs
business strategy, notably
related to product and
service innovation.
Proposition 2: By
creating the need for
specific R&D skills, the
regulation influences the
needs of RDI personnel of
OEMs.
Δ RDI
activities
RDI investment choices for automotive manufacturers are impacted particularly as regards
product innovation and the prioritisation of R&D expenditures. A regulatory push to
electrification poses less need for adjustment to those automotive manufacturers from other
Regions who are ‘first movers’ in this segment of the market and EU automotive
manufacturers cross-subsidizing losses through overseas markets. That said, given the
significantly below expectations market growth of EVs in Europe a push to electrification would
put significant stress on profit margins particularly of mass production automotive
manufacturers.
Component manufacturers act in terms of RDI investment in anticipation of regulations and
are particularly responsive to regulations due to the important role they play in the realisation
of technological innovations. First tier component manufacturers provide beyond components,
system integration which differentiates them from other component manufacturers focused
exclusively on commodities. The portfolio of component manufacturers tends to be diverse
with a leading position in fuel injection technologies and an increasing emphasis on powertrain
electrification and hybridization. Japanese component manufacturers are however clearly
leading in the field. A regulation with an emphasis on electrification will inevitably impact EU
component manufacturers should automotive manufacturers currently focused on diesel
reconsider their product mix.
In the case of LCVs the RDI investment is substantially lower since technologies are highly
transferable from cars to LCVs. The usage of LCVs also limits the applicability of technically
possible innovations.
Services are primarily driven by market conditions. Increasing potential appears to be linked
to the development of services linked to electrification. In Europe with EVs being a niche
market and given the lack of the necessary infrastructure competitiveness impacts related to
this segment are not yet prominent.
The increasing demand for people with either basic engineering skills or specific R&D skills is
being met through global recruitment due to a shortage of the desired skills in Europe. The
same applies for automotive and component manufacturers vs. Automotive and component
manufacturers from other regions. The declining expertise in Europe is posing a threat to
Europe’s competitiveness altogether and not strictly on global industries like the automotive
industry.
Depending on the local conditions in terms of supply of the right set of skills and R&D
prioritisation for both automotive and component manufacturers, increasing capacity in some
R&D centres at the expense of other R&D centres, or relocate R&D may be considered
irrespective and in anticipation of the regulation with an eye to future global market trends.
Proposition 3: The
regulation impacts the
design and
implementation of
innovative products.
Proposition 4: The
regulation impacts the
The design and implementation of innovative products is not directly influenced by the
regulation but is a consequence of the chosen compliance strategy (i.e. product mix). It is also
linked to the coherence between CO2 regulation and other regulations. Services are linked to
products and are thus indirectly influenced by the regulation.
Business models have been shaped by regulation over many years considering the
emphasis towards sustainable business models predominantly centred on product, ranging for

Assessment of competitiveness impacts of post-2020 LDV CO2 regulation
Final Report Valdani Vicari & Associati (VVA), Technopolis Group (TG), Joint Institute for Innovation Policy (JIIP), TNO for DG CLIMA 183
Propositions Differences
(Δs) Key conclusions
design and
implementation of
innovative processes,
including changes to
business models of
OEMs.
example from efficient ICEV to AFVs and EVs. Nevertheless designs of product-process-
structure-business models are shaped by market conditions and other regulations as well.38
The same applies for automotive manufacturers manufacturers vs. manufacturers from other
regions and no competitive advantage can be attributed given similar levels of regulatory
stringency across regions.
Proposition 5: The
regulation leads to
externalisation of OEM’s
RDI activities.
Proposition 6. The
regulation impacts RDI
processes by creating the
need for alternative forms
of co-operation with
external partners
Δ Innovation
strategies
and strategic
partnerships
Externalisation of some R&D activities by either shorter term or longer term collaborations to
bring down development costs have been occurring as a response to shrinking profit margins.
Regulations implying products already available in the market by some automotive
manufacturers or component manufacturers does imply collaborations as the fastest “catch
up” strategy and may hence result in a further intensification of this trend. Moreover in the
specific example of electrification the product can be characterised as a "high learning
product” with long introductory phases particularly in Europe. Given growth expectations in
other non-EU regions further consolidation in an already highly consolidated industry
(including thus R&D) may also be unavoidable. On the other hand automotive manufacturers
with either their local markets in regions where electrification has picked up faster or with
presence in those markets do have a competitive advantage and some may be less inclined to
form collaborations in the absence of a favourable outcome to them.
Proposition 7: The
regulation impacts IPR
strategies.
Δ RDI
outputs and
results
IPR strategies are linked to decisions on R&D externalisation and strategic co-operations.
Automotive manufacturers may thus develop technologies in house and hence patent or
decide to purchase patents or directly collaborate with automotive manufacturers in
possession of the patents linked to their strategy of compliance. Automotive manufacturers
and component manufacturers in possession of those patents deemed necessary have a
competitive advantage either financially due to the possibility to sell or license their patents or
in terms of negotiating power. Currently the great majority of automotive manufacturers and
component manufacturers in possession of patents related to electrification are from regions
outside of Europe.
Proposition 8: The
regulation leads to the
need for attracting risk
capital.
The low profit margins for particularly mass production automotive manufacturers heightens
the need for alternative forms of access to finance for either innovations linked to the
regulation or other innovations that may as a consequence of the regulation become less of a
priority but are considered either strategic for their future competitiveness or are required for
their compliance with other regulations.
Notes: For Energy providers and Professional end users no relevant conclusions are drawn for either their capacity to
innovate or competitiveness impacts (no references were made during the interviews).
38
For example the innovative process of making a car using carbon fibre as material makes a car lighter and hence more efficient in its fuel consumption (plus makes the option of 3D printing possible). Moreover it impacts compliance to safety requirements posing hence higher R&D costs. In terms of the CO2 regulation assuming weight is part of the utility function lighter cars decrease OEMs’ target, which is not desirable for a manufacturer. While hence in the specific case not desirable as a compliance strategy it is a forward looking approach with a shorter term effect on fuel efficiency, a critical factor for the consumer.

Assessment of competitiveness impacts of post-2020 LDV CO2 regulation
Final Report Valdani Vicari & Associati (VVA), Technopolis Group (TG), Joint Institute for Innovation Policy (JIIP), TNO for DG CLIMA 184

Assessment of competitiveness impacts of post-2020 LDV CO2 regulation
Final Report Valdani Vicari & Associati (VVA), Technopolis Group (TG), Joint Institute for Innovation Policy (JIIP), TNO for DG CLIMA 185
12. Impacts on international competitiveness
12.1 Introduction
The first important element in defining the impact of the CO2 regulation on the international competitiveness
position in the automotive and related sectors is to clarify the definition of international competitiveness. For
an individual firm, competitiveness means securing a higher market share than its competing firms while
maintaining positive profits margin or, vice versa, achieving a higher than competitors’ profit margin without a
loss of market share. National (or supranational, like the EU) competitiveness means higher productivity than
in competing countries or stronger international trade and investment position (net exports and the FDI
stock). This definition fits the suggested indicators of the international competitiveness in the EU
Competitiveness Toolkit, namely the export volumes, trade balance, revealed comparative advantage and
inward and outward FDI stock.
The definition of the international competitiveness of the automotive sector is inherently ambiguous due to
the global nature of the sector looked at either from a manufacturer (EU companies vs. competing
companies from other regions) or manufacturing (by the place of production – Europe vs. other regions)
perspective.
The international competitiveness indicators of the Competitiveness Toolkit are close to the manufacturing
definition characterized by the location of production facilities notwithstanding the ownership of these
facilities. For example, foreign-owned companies located in Europe employ mostly EU workers and produce
value added which is counted as the EU GDP consequently raising the overall productivity measure (GDP
per capita). In the same vein, the exports of the foreign-owned companies are counted as EU exports with a
positive effect on the trade balance. The FDI which the foreign-owned companies receive, for instance, from
their parent countries improve the EU investment position.
12.2 The analysis of current trade position of the EU
The ten main trade partners of the EU in passenger vehicles (classification code HS8703) are presented in
the Annex 4 tables.
The U.S., Canada and Korea appear on both the list of ten largest export destinations for the EU exports and
of ten largest origins of the EU imports. Developing countries, such as Mexico, India and China are among
the most active exporters to the EU. Mexico and India, contrary to China, export the makes produced by the
automotive majors.
The two important, and mutually related, trade competitiveness indicators are the trade balance (net exports)
and the revealed comparative advantage (RCA) index. The trade balances of the cars, light commercial
vehicles and auto components are presented in the Annex tables.
The EU has a strong positive trade balance in passenger vehicles, which increased by one-third from 2011
to 2012. However, the EU had a trade deficit with Korea, India and Japan.

Assessment of competitiveness impacts of post-2020 LDV CO2 regulation
Final Report Valdani Vicari & Associati (VVA), Technopolis Group (TG), Joint Institute for Innovation Policy (JIIP), TNO for DG CLIMA 186
Trade in light commercial vehicles and the related trade balance are just small fractions of the respective
figures for passenger vehicles. The EU does not have a stable positive trade balance in this product group.
The net exports were negative in 2011 but turned very slightly positive in 2012. For the trade of automotive
components, we observe a strong trade position of the EU reduced by a sharply negative trade balance with
Japan.
The revealed comparative advantage coefficient presented below is the simple Balassa index, which is the
ratio of the proportion of the exports of a certain good in the total EU exports to the proportion of the world
exports of the same good in total world exports. An index value above one designates a comparative
advantage (or export specialization) in the commodity in question. An index value close to zero means the
lack of comparative advantage in this commodity.
Table 20 - The revealed comparative advantage coefficient in passenger vehicles
2012 2011
EU-27 1.71 1.69
Japan 3.26 2.93
Rep. of Korea 2.07 2.04
Turkey 1.06 1.33
USA 0.94 0.90
India 0.39 0.33
Canada 2.77 2.44
China 0.06 0.05
Mexico 2.10 2.12
Russian Federation 0.05 0.03
Note: The Balassa RCA index.
Table 21 - The revealed comparative advantage coefficient in light commercial vehicles
2012 2011
EU-27 0.68 0.67
Canada 0.10 0.05
China 0.18 0.18
Japan 0.95 0.96
Mexico 7.51 7.19
Norway 0.01 0.01
Rep. of Korea 0.92 1.02
Russian Federation 0.07 0.04
Switzerland 0.03 0.03
Turkey 5.09 7.61
Note: The Balassa RCA index.
We, again, observe a strong export specialization of the EU in passenger vehicles. This table is comparable
with the table on net exports above. However, Japan, Korea, Canada and Mexico specialize even more
strongly in passenger vehicles. Mexico’s strong export specialization emerged from the maquiladora

Assessment of competitiveness impacts of post-2020 LDV CO2 regulation
Final Report Valdani Vicari & Associati (VVA), Technopolis Group (TG), Joint Institute for Innovation Policy (JIIP), TNO for DG CLIMA 187
industry, which fostered the relocation of the U.S. auto plants into Mexico, especially after the conclusion of
NAFTA in 1994.
In light commercial vehicles, the EU does not have a comparative advantage, which is consistent with the
unstable EU trade position in light commercial vehicles. Mexico (again) and Turkey appear strongly
specialized in this export.
The EU specializes in the exports of automotive components. Mexico and Japan possess an even higher
comparative advantage than the EU while Turkey and the U.S. exhibit a marked export specialization slightly
below the EU level:
Table 22 - The revealed comparative advantage coefficient in automotive components
2012 2011
EU-27 1.35 1.36
China 0.46 0.47
India 0.30 0.30
Japan 3.25 3.06
Mexico 2.55 2.52
Rep. of Korea 1.00 0.80
Russian Federation 0.09 0.03
Switzerland 0.26 0.26
Turkey 1.22 1.42
USA 1.15 1.12
Note: The Balassa RCA index.
12.3 The impact of the prospective EU CO2 emission regulations on trade flows,
trade competiveness and cross-border investment flows in the automotive
sector
The international trade indicators (net exports, trade balance, revealed comparative advantage) depend on
the change in export and import flows of cars and light commercial vehicles as a result of the new
regulations. The determining factor of the changes in the direction of trade flows is the changes in the
relative production costs of vehicles assembled, respectively, in Europe and overseas. Two types of costs
should be considered:
the costs of achieving the EU targets by, respectively EU and foreign producers, and
the costs of achieving the targets established in the overseas markets by, respectively EU and foreign
producers.
If the cost of achieving the targets are higher for the EU than for the foreign producers, then the EU trade
balance will have the tendency to degenerate and the RCA index to decline.
Chapter 4.2 of this report compares and contrasts the EU CO2 emission regulations with those in other
regions. The chapter shows that in absolute values the current targets in Europe and Japan are lower than in

Assessment of competitiveness impacts of post-2020 LDV CO2 regulation
Final Report Valdani Vicari & Associati (VVA), Technopolis Group (TG), Joint Institute for Innovation Policy (JIIP), TNO for DG CLIMA 188
America and the rest of Asia, which all appear more or less similar. However, the targets may gradually
equalize in the post-2020 perspective.
Effects of post 2020 regulation on international competitiveness of EU car manufacturing
Chapter 5 on cost competitiveness established that the change in costs results from a multitude of factors,
including various specific targets for manufacturers affected by aspects of the regulation; compliance
mechanisms used by the manufacturers; and the factors determining the costs of implementation of these
mechanisms. A large number of pathways were qualitatively described, each of which can have either
positive or negative sign of impact, which cannot be determined with any accuracy at this point. The overall
conclusion is that modalities of the regulation as such do not strongly suggest either a positive or negative
impact on relative costs for both cars and light commercial vehicles, hence we can posit that the regulation
will probably be neutral for the trade balance and RCA. This overall conclusion, however, can be adjusted
when more is known about the future target levels, utility parameter, the slope of the target function, the
relative stringencies of the EU and overseas regulations, production factors (components, labour costs,
labour requirement by labour type to meet the regulations, volumes of sales, capital goods requirements
etc.).
The relocation of production is also not expected. The main factor of such relocation would be an advantage
in labour costs resulting from the regulation. The impact of the regulation on labour cost competitiveness is
possible if new technologies require more/less labour or have a higher/lower share of (manual) labour in
assembly / production. This impact is of unknown sign and size but is expected to be rather small. Chapter
11 concludes that there might be an impact of the regulations on the location of R&D centres due to a
different pace of regulations in the EU and abroad. However, the differences in the pace of regulations are
uncertain and the impact is likely to be small.
Import tariffs if kept unchanged are unlikely to play a role in changing international competitiveness. The
tariffs are currently higher in the EU than in partner countries. The EU tariff for cars is 10 per cent while it is
2.5 per cent in the U.S. and 0 per cent in Japan. Unless all non EU manufactured vehicles are just at the
point where they would be imported (which is an unlikely situation) any change isn't going to make a big
difference.
This reasoning was generally supported by the interviews. Survey questions were as follows:
1. Does the EU CO2 legislation for light duty vehicles lead to different “relative” levels of stringency of the
targets imposed on EU and non-EU OEMs? If so, why? What elements of the legislation are causing this
difference?
2. Are there differences in the costs for EU and non-EU OEMs of complying with similar targets? Are these
the result of EU and non-EU OEMs choosing different compliance mechanisms with different cost
implications to meet similar targets? Or are they the result of costs for similar compliance mechanisms
being different for EU vs. non-EU OEMs? And if the latter is the case, what are the reasons for these
differences in costs.
3. Would EU OEMs and suppliers or their non-EU competitors benefit from EU LDV CO2 regulations being
more stringent than in other regions / markets? If there would be similar LDV CO2 regulations in different

Assessment of competitiveness impacts of post-2020 LDV CO2 regulation
Final Report Valdani Vicari & Associati (VVA), Technopolis Group (TG), Joint Institute for Innovation Policy (JIIP), TNO for DG CLIMA 189
markets / regions, would the economies of scale resulting from that benefit EU OEMs and suppliers or
their non-EU competitors?
4. If future targets would require OEMs to sell significant shares of very efficient vehicles (ICEVs, BEVs,
PHEVs and FCEVs), would you consider the EU automotive industry to be in a better / equal / worse
position compared to non-EU competitors to apply that compliance mechanism? Why?
The responses point to some second-order effects which could have an effect on cost competitiveness and
trade balances but whose magnitude is currently hard to assess. The responses to the first and second
questions indicated that there is some difference between the EU and non-EU manufacturers in relation to
stringency of the legislative targets due to the difference in vehicle portfolios. Namely, there appear to be
some disadvantage for non-EU manufacturers that are mainly focused on gasoline, unless they are strong
on hybrid, while the EU is primarily a “diesel market” and the targets can be achieved mainly through
increasing the efficiency of ICEs39
. In this case, we might expect (a slight) improvement in the
competitiveness of EU OEMs in the EU market. For the same reason, the cost of compliance of the non-EU
manufacturers would be higher than EU manufacturers, with a similar effect on competitiveness.
On the third question, respondents think that more stringent EU regulations would not benefit EU OEMs on
other markets. On the contrary, they think this would result in a decrease of the EU market share abroad,
with a negative effect on the revealed comparative advantage index. Respondents do not expect significant
variation of CO2 emission legislation across major markets. On the fourth question, respondents believe that
both EU and non-EU manufacturers would be affected similarly if future targets would require OEMs to sell
significant shares of very efficient vehicles (i.e. there will be no change in relative competitiveness).
However, they point to a possible negative consumer reaction whose acceptance of very fuel-efficient
vehicles remains low. This will lead to loss of profitability of all OEMs and a slower fleet renewal.
In 2011, the outwards stock of FDI (investment out of the EU-27) in the sector “Manufacture of motor
vehicles, trailers and semi-trailers” stood at 65,139 million euro with the inward FDI stock of the EU in the
same sector at 28,740 million euro. Thus the ratio of outward to inward FDI stock equalled 2.27, i.e. the EU
invested more abroad than it received investments from abroad.
The prospective regulations are likely to require additional investment of foreign-owned OEMs into their R&D
and production facilities. While the former are located in their host countries, the EU plants will probably
require updates in equipment and production processes. Some inwards FDI flows, which compensate the
financing gap when EU-generated revenues are not enough, might result but the magnitude of these flows
will be probably quite modest.
Effects of post 2020 regulation on international competitiveness of automotive (component)
suppliers
Overall, cost differences among regions are not expected to be affected by the legislation. No marked
changes in trade competitiveness or business relocation will likely result.
39
It should be mentioned however that the (unrelated to this study) Euro 6-2 regulation will somewhat reduce the advantage of the diesel engine by increasing development and production costs related to Euro 6-2.

Assessment of competitiveness impacts of post-2020 LDV CO2 regulation
Final Report Valdani Vicari & Associati (VVA), Technopolis Group (TG), Joint Institute for Innovation Policy (JIIP), TNO for DG CLIMA 190
Effects of post 2020 regulation on international competitiveness of EU component manufacturing
Chapter 7 concludes that the post 2020 EU LDV CO2 legislation is unlikely to have a direct impact on the
cost competitiveness of EU component manufacturing. A limited number of possible indirect impacts have
been identified, including access to materials; the relative stringency of the legislation; the share of new
(sub)components for advanced ICEVs and AFVs produced in the EU; regional differences in labour costs in
combination with a distinctly higher/lower share of labour and differences in the costs of capital goods. The
overall sign and size of these effects cannot be determined at this stage but we do not have solid reasons to
assert a systematic change in international competitiveness and the location of the production facilities. In
our survey, the respondents indicated somewhat lower prospective costs for Asian manufacturers in some
components (e.g. electric cars) and for EU manufacturers in other components (e.g. diesel).
Effects of post 2020 regulation on international competitiveness of the energy supply industry
EU refineries may face reduced profitability as a result of the legislation. This means that the international
competitiveness of EU refineries may be reduced and imports of petroleum products produced at low-cost or
new state-of-the-art refineries in Russia, India and the Middle East might increase. However, since refineries
are mostly owned by large global companies competing on various regional markets, the strategic decisions
of these companies with respect to production locations may have an effect on the international
competitiveness of EU refineries. However, these decisions are impossible to foresee at this time.
Regarding different product streams, the EU is currently a net importer of diesel and a net exporter of
petroleum. Assuming that:
the regulation does not alter the petrol-diesel share in the passenger car market;
the net demand for diesel by HGVs will not reduce in the coming decades as a result of freight transport
volume increases compensating efficiency improvements,
post-2020 LDV CO2 legislation will lead to an increase of the diesel-to-petrol ratio in the demand from the EU
transport sector. If the volume of fuel production in the EU is not adjusted to the overall lower demand, this
will lead to a decrease in diesel imports and an increase in petrol exports. Given that rising motorization of
the developing countries will create extra world market demand for petrol, this will lead to an improvement in
trade balance and revealed comparative advantage for both petrol and diesel. If the volume of fuel
production in the EU is reduced in accordance with the reduced demand from the EU transport sector, the
ratio of diesel imports and petrol exports would remain at the current level with small changes in overall
volumes.
Companies that operate fuel distribution infrastructure and filling stations in the EU do not and will not have a
significant exposure to international markets and their international competitiveness position is irrelevant.
Effects of post 2020 regulation on international competitiveness of (professional) end users
Competitiveness impacts for professional end-users of LDVs will be insignificant, since the delivery services
with LDVs are mostly provided locally, within the EU.

Assessment of competitiveness impacts of post-2020 LDV CO2 regulation
Final Report Valdani Vicari & Associati (VVA), Technopolis Group (TG), Joint Institute for Innovation Policy (JIIP), TNO for DG CLIMA 191
12.4 Key conclusions
EU-based manufacturers currently hold strong competitive positions in passenger vehicles and auto
components but not in light commercial vehicles.
As a result of CO2 emission legislation, the trade competitiveness of EU manufacturers of vehicles,
automotive components and end users is not expected to change to a great extent. The regulation is
likely to be trade-neutral. However, there are likely to arise some second-order effects, although quite
small. For instance, the international competitiveness of EU-based gasoline vehicles may increase.
Contrary to that, the competitiveness of EU-manufacturers may suffer if the EU targets are too stringent
exceeding those of the competitors by a large margin.
The competitiveness of the energy supply industry might be negatively affected by post-2020 CO2
legislation as reduced demand leads to reduced profitability of refineries, but future strategic decisions of
the global energy supply companies may alter this effect. In addition, however, the legislation may lead
to an improvement in trade balance and revealed comparative advantage for both petrol and diesel.
Some extra inward FDI flows may result but their magnitude is probably small.

Assessment of competitiveness impacts of post-2020 LDV CO2 regulation
Final Report Valdani Vicari & Associati (VVA), Technopolis Group (TG), Joint Institute for Innovation Policy (JIIP), TNO for DG CLIMA 192

Assessment of competitiveness impacts of post-2020 LDV CO2 regulation
Final Report Valdani Vicari & Associati (VVA), Technopolis Group (TG), Joint Institute for Innovation Policy (JIIP), TNO for DG CLIMA 193
13. Conclusions and recommendations
13.1 Conclusions on possible cost competitiveness impacts
For assessing cost competitiveness impacts on the affected sectors automotive manufacturing industry,
automotive supply industry and energy supply industry and end-users it is useful to separate the analysis
into two cases:
EU companies vs. competing companies from other regions;
EU manufacturing / production vs. manufacturing / production in other regions.
The two perspectives are complementary. OEMs for instance compete for market shares in the EU market
as well as on markets in other regions. This competition is strongly determined by the price and quality of
their products and how these are valued by customers in the different markets. Price and quality of vehicles
may be affected by legislative demands that are in place in different markets. This competition is affected by
manufacturing costs, which depend among other things on whether the vehicles are manufactured in the EU
or in other regions. Based on developments in this competition, combined with a range of other factors,
OEMs may decide to increase or decrease their production capacity in the EU or in other regions.
Competitiveness impacts have been assessed from these two perspectives for the car manufacturing sector
as well as the automotive supply sector. For the energy supply sector and professional end-users, the other
two affected sectors included in this study, the two perspectives are less distinct. Within the energy sector oil
companies are in global competition, but fuel supplied to the EU market is largely produced in the EU. Other
affected energy suppliers (e.g. for electricity) are largely not competing with companies from other regions.
Especially for end-users many of the possibly affected EU companies are not competing with non-EU
companies, and if they are the impact of a change in costs of operating passenger cars and vans is likely to
be a very small part of their cost of operations.
Effects of post-2020 regulation on cost competitiveness of EU automotive manufacturers and
manufacturing
Possible competitiveness impacts of the post-2020 EU LDV CO2 legislation have been assessed for EU
OEMs vs. non-EU OEMs as well as for the EU automotive manufacturing industry (which includes production
facilities of non-EU OEMs in the EU) vs. automotive manufacturing outside the EU.
Competitiveness impacts from the perspective of car manufacturers
Assessing cost competitiveness impacts on OEMs requires identifying whether and how the EU post-2020
LDV CO2 legislation could lead to:
different levels of stringency of the targets imposed on EU and non-EU OEMs;
differences in the costs for EU and non-EU OEMs of complying with similar targets, which in turn may be
the result of:
o EU and non-EU OEMs choosing different compliance mechanisms with different cost implications
to meet similar targets;
o costs of similar compliance mechanisms being different for EU vs. non-EU OEMs.

Assessment of competitiveness impacts of post-2020 LDV CO2 regulation
Final Report Valdani Vicari & Associati (VVA), Technopolis Group (TG), Joint Institute for Innovation Policy (JIIP), TNO for DG CLIMA 194
The latter two are strongly related to the capabilities and resources of different companies. Analysing
whether and how differences in capabilities and resources can be attributed to companies or manufacturing
activities being EU or non-EU, and determining whether such differences lead to differences in the cost of
compliance is the main challenge of the assessment of possible cost competitiveness impacts.
But even if targets and compliance costs are on average similar for affected OEMs from different regions,
and direct competitiveness impacts are therefore unlikely, there may still be non-negligible second order
impacts. If the increased costs of manufacturing vehicles for the EU market would lead to lower margins and
thus reduced profits for sales on the EU market, EU manufacturers may still have different abilities than non-
EU manufacturers to deal with such impacts, e.g. as they cannot recover losses on the EU market by profits
in other markets in the same way as non-EU manufacturers can. The ability to deal with competitiveness
impacts on the EU market may not so much relate to OEMs being EU or not, but maybe more to OEMs
being premium manufacturers or not. OEMs selling premium models in the EU market first of all have higher
profit margins in that market and customers with a higher willingness-to-pay (lower price-elasticity). But it is
also the EU manufacturers of premium brands that are selling a lot of cars in foreign markets.
In view of the second aspect, i.e. costs of similar compliance mechanisms being different for EU vs. non-EU
OEMs, the essential question is whether cost curves for efficiency improvement in ICEVs and costs of
manufacturing AFVs are different for EU and non-EU manufacturers. This question is difficult to answer
quantitatively, but possible origins for cost differences have been explored with the help of qualitative and
quantitative sectorial information.
From an analysis of ways in which the regulation may affect the price and quality of products the following
things can be concluded:
Specific targets for manufacturers are affected by various aspects of the regulation;
For meeting a given target a large number of compliance mechanisms are available;
The costs for implementing these compliance mechanisms are determined by a large number of factors.
As a result of this there are a myriad of possible impact pathways that might have negative as well as
positive impacts on the competitiveness of EU manufacturers. This makes it appear less likely that the post
2020 EU LDV CO2 regulation as a whole would lead to net impacts on competitiveness of EU manufacturers.
Nevertheless choices with respect to specific elements of the legislation could enhance the possibility of
specific competitiveness impacts to occur. For that reason first an assessment was made of the general
consequences of different aspects (modalities) of the legislation on the competitiveness of EU vs. non-EU
OEMs.
It is concluded that the modalities as such do not directly lead to pronounced competitiveness impacts.
However, for various modalities it is possible that they lead to, or at least contribute to competitiveness
impacts depending how they are implemented in combination with specifics of the market (e.g. positions of
EU and non-EU manufacturers in terms of sales distribution):
The target level strongly determines the extent to which differences in the costs for similar technologies
between EU and non-EU OEMs affect their competitiveness. Whether the EU target is more or less strict

Assessment of competitiveness impacts of post-2020 LDV CO2 regulation
Final Report Valdani Vicari & Associati (VVA), Technopolis Group (TG), Joint Institute for Innovation Policy (JIIP), TNO for DG CLIMA 195
than that in other regions, together with the market shares of EU and non-EU OEMs on the EU and other
markets, determines economies of scale for CO2 reducing technologies;
If sales distributions over different vehicle segments are different for EU and non-EU OEMs, the utility
parameter and the shape and slope of the target function determine the relative (average) stringency of
targets for these groups of OEMs. For footprint as utility parameter, choices with respect to the shape
and slope of the target function are less likely to lead to impacts on competitiveness;
Other modalities, such as a joint legislative target for cars and vans, including mileage weighting, super –
credits, eco-innovations, pooling and trading may lead to different abilities for EU and non-EU OEMs to
meet their targets and might thus affect competitiveness.
Resources of OEMs, defined by their financial position, knowledge position, facilities for R&D and
manufacturing, supplier base and their product portfolio and customer base determine their capability to
implement compliance mechanisms for meeting future CO2 targets. An analysis of possible regional
differences in these resources and capabilities, based on a qualitative analysis augmented with sectorial
data and input from stakeholder consultation, revealed the following possible impacts:
The capability of EU OEMs to develop advanced ICEVs and AFVs may be less than that of non-EU
OEMs, especially if powertrain electrification becomes an important compliance mechanism. Origins for
this are the fact that the financial position of EU OEMs is more heavily affected by the economic crisis
than that of non-EU OEMs, the technological focus of EU OEMs on diesel technology rather than
hybrid/electric propulsion and a possible shortage of skilled R&D personnel;
With respect to the ability to manufacture vehicles with CO2-reducing technologies at competitive costs,
various cost factors might lead to competitiveness impacts but for most of them the likeliness, sign and
size of these impacts are difficult to judge. Japanese OEMs appear in a better position to scale up
production of electric and hybrid vehicles and to benefit from their lead in this technology, but EU OEMs
are catching up fast. EU OEMs may have a possible advantage to achieve cost reductions for integration
of different powertrains due their advanced platform approach;
The ability to sell at competitive prices is not only determined by the additional costs of manufacturing
vehicles with CO2-reducing technologies, but also by e.g. the amount of R&D costs to be earned back
per vehicle, the ability to cross-subsidize within the product portfolio, and the ability to absorb losses.
Concerning the latter the current financial position of EU OEMs, if continued over the next years, could
cause negative competitiveness impacts;
The ability to sell vehicles with new technologies on the EU market seems better for (some) EU OEMs
due to their stronger position in premium segments of the market. Concerning the latter, stakeholder
inputs as well as a decomposition of pathways seems to suggest that whether an OEM is a premium or
volume manufacturer may be a stronger determinant for its ability to deal with the impacts of CO2
legislation than whether it is EU or not.
Timing of the legislation, specifically the lead time between announcement of the target and the target year is
expected to affect the above impacts. A short lead time leads to higher costs for developing and marketing
new technologies, which are more difficult to bear for OEMs with a less strong financial position.
Assessment of competitiveness impacts of post-2020 LDV CO2 regulation
Final Report Valdani Vicari & Associati (VVA), Technopolis Group (TG), Joint Institute for Innovation Policy (JIIP), TNO for DG CLIMA 196
Competitiveness impacts from the perspective of automotive manufacturing
For the case of competitiveness impacts on EU car manufacturing the focus is on identifying possible
impacts of the LDV CO2 legislation on the cost of manufacturing or the cost of doing business. The main cost
components that determine the costs of manufacturing cars are material costs, costs of purchased
components, labour costs, capital costs (machines, tooling, etc.), and costs of overheads (such as
management, marketing, logistics and R&D). The competitiveness of EU car manufacturing is determined by
the total average costs of manufacturing per unit of production in the EU compared to those in other regions.
The total cost ratio between manufacturing in EU and other regions may change as a result of the EU LDV
CO2 legislation:
if one or more cost factors change as a result of the LDV CO2 legislation and this change is different in
the EU than in other regions;
if application of new technologies or other activities needed to comply with LDV CO2 legislation affect the
shares of different cost factors in the total production costs, and if ratios of these cost factors for EU vs.
other regions are significantly different.
Post 2020 EU LDV CO2 legislation has no direct impact on the cost competitiveness of EU car
manufacturing. A limited number of possible indirect impacts, however, have been identified:
The access to materials as well as the costs of these materials could be different for EU and non-EU
OEMs. This especially relates to materials for electric powertrains and vehicle light-weighting;
Possible positive or negative competitiveness impacts are identified in relation to regional differences in
the cost of components for advanced ICEVs and AFVs, depending e.g. on the relative stringency of EU
legislation compared to that in other regions or whether components are required for which suppliers are
mainly located outside Europe;
Regional differences in labour costs may have an impact of unknown sign and size as new technologies
may require more/less labour or have a higher/lower share of (manual) labour in assembly / production.
Furthermore some impact pathways have been identified that relate to differences in the costs of capital
goods, transport costs and tariffs, and the volume of sales over which R&D costs can be divided. The
size and sign of these impacts depend on the relative stringency of EU legislation, with in general
positive impacts for the EU industry if the EU legislation is more stringent.
Conclusions seem to be quite generic and the same for the car and van regulation.
Possible cost competitiveness impacts on the automotive supply industry
Also for the automotive supply industry possible competitiveness impacts of the post-2020 EU LDV CO2
legislation have been assessed for EU suppliers vs. non-EU suppliers as well as for the EU automotive
component manufacturing vs. non-EU component manufacturers. Similar mechanisms are found as for
OEMs, but with different conclusions on the likeliness, sign and size of some of the possible impacts.

Assessment of competitiveness impacts of post-2020 LDV CO2 regulation
Final Report Valdani Vicari & Associati (VVA), Technopolis Group (TG), Joint Institute for Innovation Policy (JIIP), TNO for DG CLIMA 197
Competitiveness impacts from the perspective of component manufacturers
Concerning possible competitiveness impacts associated with regional differences in resources and resulting
capabilities of component suppliers the following conclusions have been drawn:
The ability of EU suppliers to develop components for CO2 reduction in passenger cars and vans
appears likely to be less than that of non-EU competitors, specifically if the post-2020 regulation would
increase demand for vehicles with electric powertrains. This is related to their technology position, their
financial position as well as to foreseen shortages in skilled R&D personnel;
With respect to the ability of EU suppliers to manufacture at competitive costs their weak position in
electric powertrain technologies could be a drawback. Other factors such as the costs of labour, the
costs of equipment, economies of scale associated with the customer base and the stringency of the
legislation and the costs of materials could lead to impacts on competitiveness, but the sign and size of
these impacts is difficult to estimate;
The ability of EU suppliers to sell at competitive prices may be affected by their limited ability to absorb
(temporary) losses. Other factors such as manufacturing costs, R&D costs per unit of product and the
ability to cross-subsidize over the product portfolio could lead to impacts on competitiveness, but the
sign and size of these impacts is difficult to estimate;
Overall the limited ability to absorb losses appears to negatively affect the competitiveness of EU
suppliers.
Compared to car manufacturers the likeliness of negative competitiveness impacts for EU suppliers seems
somewhat higher.
Competitiveness impacts from the perspective of component manufacturing
As for car manufacturing, also for component manufacturing only a limited number of pathways seem to
result in likely impacts on competitiveness of EU manufacturing. Where impacts are possible, they may be
positive or negative. Conclusions seem to be quite generic and the same for the car and van regulation.
Post 2020 EU LDV CO2 legislation has no direct impact on the cost competitiveness of EU component
manufacturing. A limited number of possible indirect impacts, however, have been identified:
The access to materials as well as the costs of these materials could be different for EU and non-EU
suppliers. This especially relates to materials for electric powertrains and vehicle light-weighting. Sign
and size of the effect cannot be determined at this stage, but effects are likely to be more pronounced for
component manufacturing than for vehicle manufacturing;
With respect to the costs of purchased components small positive impacts could occur if the EU has
more stringent regulation than other regions or if a large share of new (sub)components for advanced
ICEVs and AFVs are produced in the EU. Small negative impacts may occur if (sub)components for
advanced ICEVs and AFVs are mainly produced outside the EU;
Regional differences in labour costs may have an impact of unknown sign and size as new technologies
may require more/less labour or have a higher/lower share of (manual) labour in assembly / production;
Furthermore some indirect impact pathways have been identified that relate to differences in the costs of
capital goods and the volume of sales over which R&D costs can be divided. The size and sign of these
impacts depend on the relative stringency of EU legislation.
Conclusions seem to be quite generic and the same for the car and van regulation.

Assessment of competitiveness impacts of post-2020 LDV CO2 regulation
Final Report Valdani Vicari & Associati (VVA), Technopolis Group (TG), Joint Institute for Innovation Policy (JIIP), TNO for DG CLIMA 198
Possible cost competitiveness impacts on the fuel supply sector
The post-2020 LDV CO2 regulation does not directly affect the costs of producing petroleum-based transport
fuels or alternative fuels or energy carriers for transport. Indirect impacts are very likely, though, as the
legislation will affect the demand for different energy carriers and different companies may have different
abilities to cope with this changing demand.
The energy supply sector can be divided into:
producers of fuels and other energy carriers
o the oil refining industry for petroleum based fuels
o electricity generation
o production of alternative (bio)fuels and energy carriers (e.g. hydrogen)
distributors of fuels and other energy carriers
o fuel distributors and operators of filling stations
o operators of electricity distribution networks and operators of charging stations
Both sub-sectors contain large, medium-size and small companies. The analysis of possible competitiveness
impacts has been done separately for the two sub-sectors.
For producers of fuels and other energy carriers the following pathways for possible competitiveness impacts
have been identified:
A declining demand for petroleum fuels, resulting from post-2020 EU LDV CO2 legislation, will put
pressure on the prices of fuels. For fuel producing companies lower volumes mean that refinery
utilisation rates are expected to go down, leading to an increase in costs per unit production. The
combination of the two will strongly reduce profitability of EU refineries. This means that it will become
more difficult for the products of these refineries to compete on the EU market with imports from Russia
or new state-of-the art refineries being opened in India and the Middle-East.
Refineries are mostly owned by large, often global companies competing on various regional markets.
The ability of companies to deal with changes in the EU market may depend on the size of their EU
activities and the share of these in their global activities. Impacts may also depend on the extent to which
they produce in the EU for the EU market or also import and export to and from the EU. With the
information available it is not possible to “predict” what the strategic decisions of such global companies
will be in response to the effects of post-2020 EU LDV CO2 legislation on the demand for fuels in
Europe.
In decisions on (dis)investments in refining capacity, also the status of facilities may play a role as
decommissioning refinery capacity is more costly for newer than for older facilities. It is likely that there
are differences in this respect between different refineries in Europe, but this has not been assessed.
Closing of refineries in the EU will lead to a loss of jobs and of value added within the EU. This is an
economic impact that is likely to happen if EU LDV CO2 legislation is effective, but that could be
amplified by the fact that EU fuel producers are affected more severely by the legislation than producers
outside the EU which operate new facilities and have a large share of their sales in markets that are still
growing.

Assessment of competitiveness impacts of post-2020 LDV CO2 regulation
Final Report Valdani Vicari & Associati (VVA), Technopolis Group (TG), Joint Institute for Innovation Policy (JIIP), TNO for DG CLIMA 199
Companies that operate fuel distribution infrastructure and filling stations in the EU operate locally or
regionally, and are not directly competing with companies in other regions (apart from some cross-border
competition between adjacent EU and non-EU countries). Reduced demand for petroleum-based fuels could
lead to negative economic impacts on this sub-sector of the fuel supply sector, including a significant loss of
jobs and value added, but these are not to be classified as competitiveness impacts.
Possible cost competitiveness impacts on professional end-users
For those companies that use passenger cars and vans, either to provide transport services to clients or as
part of their own operations, the total cost of ownership (TCO) for using these vehicles is an element in their
cost of doing business. If the post-2020 EU LDV CO2 legislation affects the TCO of vehicles, it directly affects
the costs of doing business for all companies that use LCVs (professional end-users). Changes in the cost of
doing business for a company affect the price of its products and/or services, which may affect competition in
the market and lead to a change in market shares. If prices change similarly for all competitors, an overall
change in the volume of the market is likely to occur. This may lead to a change in the utilization of facilities
of these companies and thus to a further change in the costs per unit product or service. If these effects work
out differently for competing companies, e.g. as a consequences of differences in their resources and
capabilities that are associated with the region in which they are based / operate, competitiveness may be
affected.
Making ICEVs more energy-efficient generally leads to a higher vehicle price but lower fuel costs. The net
effect on TCO depends on the amount of efficiency improvement, the related additional vehicle costs and the
costs per unit of fuel. Already based on cost curves for 2020 emission reductions to levels that may come
into view for the 2020-2030 period can be achieved with net negative costs to the end user. It is expected
that new cost curves for the 2020-30 period will suggest higher reductions to be possible at lower costs,
further increasing the reduction potential that is cost effective to the-end user. Alternative fuelled vehicles
(AFVs) tend to be more expensive than ICEVs. The fuel costs per kilometre differ strongly for the different
energy carriers. Currently most AFVs (without tax incentives) have a TCO that is higher than that of ICEVs.
In the 2020-30 timeframe the TCO of most AFVs is expected to approach that of ICEVs.
In addition to a change in TCO the technologies applied to ICEVs as well as AFVs may have an impact on
the reliability and operability of vehicles, which may affect the value of the product or services supplied.
Implementing e.g. BEVs with limited range may affect the way in which end-users use their vehicles and may
even require changes in their operations or way of providing services. This may be seen as a reduction in
the value added by operating such cars. On the other hand, the use of electric powertrains is expected to
lead to lower maintenance costs, which may improve the TCO of BEVs.
In view of the above the following conclusions can be drawn with respect to possible competitiveness
impacts on professional end-users of LDVs:
Competitiveness impacts for professional end-users of LDVs are only to be expected for EU companies
that provide products or services that compete on the EU market or other markets against products and
services from non-EU companies. Positive impacts are expected as the post-2020 EU CO2 legislation is
in principle expected to lead to a net reduction of end-user costs. If different regions have LDV CO2

Assessment of competitiveness impacts of post-2020 LDV CO2 regulation
Final Report Valdani Vicari & Associati (VVA), Technopolis Group (TG), Joint Institute for Innovation Policy (JIIP), TNO for DG CLIMA 200
regulations with similar levels of stringency, EU companies are expected to benefit more as fuel prices
are generally higher in Europe. However, the size of this impact is expected to be small, as the costs of
operating LDVs is generally only a small fraction of the cost of doing business.
EU-based SMEs, which in their operations make extensive use of LDVs, will in general not be competing
with non-EU companies, regardless of whether or not these LDVs are directly used for providing
transport services. Companies competing on the EU market will be similarly affected by post-2020 LDV
CO2 regulations. For end-user SMEs, therefore no impact on their competiveness is expected.
13.2 Conclusions on possible R&D competitiveness impacts
In Table 19 key conclusions on possible competitiveness impacts of the LDV CO2 legislation on R&D and
Innovation are summarized using the innovation competitiveness impact matrix.
In the case of LCVs the RDI exclusive expenditure is substantially lower since technologies are highly
transferable from cars to LCVs. The usage of LCVs also limits the applicability of technically possible
innovations. These limitations apply to all manufacturers, both EU and from other regions, hence should a
regulation impose stringent targets we expect sales will be impacted depending on the price elasticity of
professional end users. OEMs with competitive prices due to low development costs and economies of scale
may have an advantage. Collaborations may also arise as a result of market accessibility and technological
advantages lying in the hands of respectively EU and non EU OEMs.
Suppliers act in anticipation of regulations and are particularly responsive to regulations particularly due to
the important role they play in the realisation of technological innovations. First tier suppliers provide beyond
components, system integration which differentiates them from other suppliers focused exclusively on
commodities. The portfolio of suppliers tends to be diverse with a leading position in fuel injection
technologies and an increasing emphasis on powertrain electrification and hybridization. Japanese suppliers
are however clearly leading in the field. A regulation with an emphasis on electrification will inevitably impact
EU suppliers should OEMs currently focused on diesel reconsider their product mix.
With respect to other stakeholders, Energy providers and Professional end users no relevant conclusions
are drawn for either their capacity to innovate or competitiveness impacts.

Assessment of competitiveness impacts of post-2020 LDV CO2 regulation
Final Report Valdani Vicari & Associati (VVA), Technopolis Group (TG), Joint Institute for Innovation Policy (JIIP), TNO for DG CLIMA 201
Table 23 – Key conclusions on competitiveness impacts related to innovation capacity
Propositions Differences
(Δs) Key conclusions
Proposition 1: The regulation impacts innovation strategy and RDI investment choices by influencing OEMs business strategy, notably related to product and service innovation. Proposition 2: By creating the need for specific R&D skills, the regulation influences the needs of RDI personnel of OEMs.
Δ RDI
activities RDI investment choices are impacted particularly as regards product innovation and the prioritisation of R&D expenditures. A regulatory push to electrification poses less need for adjustment to those OEMs/Suppliers from other Regions who are ‘first movers’ in this segment of the market and EU OEMs cross-subsidizing losses through overseas markets. That said, given the significantly below expectations market growth of EVs in Europe a push to electrification would put significant stress on profit margins particularly of mass production OEMs. Services are primarily driven by market conditions. Increasing potential appears to be linked to the development of services linked to electrification. In Europe with EVs being a niche market and given the lack of the necessary infrastructure competitiveness impacts related to this segment are not yet prominent. The increasing demand for people with either basic engineering skills or specific R&D skills is being met through global recruitment due to a shortage of the desired skills in Europe. The same applies for EU manufacturers vs. manufacturers from other regions. The declining expertise in Europe is posing a threat to Europe’s competitiveness altogether and not strictly on global industries like the automotive industry.
Proposition 3: The regulation impacts the design and implementation of innovative products. Proposition 4: The regulation impacts the design and implementation of innovative processes, including changes to business models of OEMs.
The design and implementation of innovative products is not directly influenced by the regulation but is a consequence of the chosen compliance strategy (i.e. product mix). It is also linked to the coherence between CO2 regulation and other regulations. Services are linked to products and are thus indirectly influenced by the regulation. Business models have been shaped by regulation over many years considering the emphasis towards sustainable business models predominantly centred on product, ranging for example from efficient ICEV to AFVs and EVs. Nevertheless designs of product-process-structure-business models are shaped by market conditions and other regulations as well.40 The same applies for EU manufacturers vs. manufacturers from other regions and no competitive advantage can be attributed given similar levels of regulatory stringency across regions.
Proposition 5: The regulation leads to externalisation of OEM’s RDI activities. Proposition 6. The regulation impacts RDI processes by creating the need for alternative forms of co-operation with external partners
Δ Innovation
strategies and strategic partnerships
Externalisation of some R&D activities by either shorter term or longer term collaborations to bring down development costs have been occurring as a response to shrinking profit margins. Regulations implying products already available in the market by some manufacturers does imply collaborations as the fastest “catch up” strategy and may hence result in a further intensification of this trend. Moreover in the specific example of electrification the product can be characterised as a "high learning product” with long introductory phases particularly in Europe. Given growth expectations in other non-EU regions further consolidation in an already highly consolidated industry (including thus R&D) may also be unavoidable. On the other hand OEMs with either their local markets in regions where electrification has picked up faster or with presence in those markets do have a competitive advantage and some may be less inclined to form collaborations in the absence of a favourable outcome to them.
Proposition 7: The regulation impacts IPR strategies.
Δ RDI
outputs and results
IPR strategies are linked to decisions on R&D externalisation and strategic co-operations. OEMs may thus develop technologies in house and hence patent or decide to purchase patents or directly collaborate with OEMs in possession of the patents linked to their strategy of compliance. OEMs/Suppliers in possession of those patents deemed necessary have a competitive advantage either financially due to the possibility to sell or license their patents or in terms of negotiating power. Currently the great majority of OEMs/Suppliers in possession of patents related to electrification are from regions outside of Europe.
Proposition 8: The regulation leads to the need for attracting risk capital.
The low profit margins for particularly mass production manufacturers heightens the need for alternative forms of access to finance for either innovations linked to the regulation or other innovations that may as a consequence of the regulation become less prioritary but are considered either strategic for their future competitiveness or are required for their compliance with other regulations.
40
For example the innovative process of making a car using carbon fibre as material makes a car lighter and hence more efficient in its fuel consumption (plus makes the option of 3D printing possible). Moreover it impacts compliance to safety requirements posing hence higher R&D costs. In terms of the CO2 regulation assuming weight is part of the utility function lighter cars decrease OEMs’ target, which is not desirable for a manufacturer. While hence in the specific case not desirable as a compliance strategy it is a forward looking approach with a shorter term effect on fuel efficiency, a critical factor for the consumer.

Assessment of competitiveness impacts of post-2020 LDV CO2 regulation
Final Report Valdani Vicari & Associati (VVA), Technopolis Group (TG), Joint Institute for Innovation Policy (JIIP), TNO for DG CLIMA 202
13.3 Conclusions on possible international competitiveness impacts
The EU-based manufacturers currently hold strong competitive positions in passenger vehicles and auto
components but not in light commercial vehicles.
As a result of CO2 emission legislation, the trade competitiveness of EU manufacturers of vehicles,
automotive components and end users is not expected to change to a great extent. The regulation is
likely to be trade-neutral. However, some second-order effects are possible and may be of either positive
and negative signs. The sign and the precise magnitude of these effects is not clear at this time but they
are likely to be small.
The competitiveness of the energy supply industry might be negatively affected by post-2020 CO2
legislation as reduced demand leads to reduced profitability of refineries, but future strategic decisions of
the global energy supply companies may alter this effect. In addition, however, the legislation may lead
to an improvement in trade balance and revealed comparative advantage for both petrol and diesel.
Some extra inward FDI flows may result but their magnitude is probably small.
13.4 Summary of conclusions on the basis of questions from the Competitiveness
Proofing Toolkit
In Table 24 the above conclusions for the different sectors are summarized in the form of answers to
questions on cost, R&D and international competitiveness impacts as stated in the Commission’s
Competitiveness Proofing Toolkit.
Table 24 - Summary of conclusions on the basis of questions from the Competitiveness Proofing Toolkit
Affected sectors
Question Car manufacturing Component
manufacturing Energy supply
Professional end-
users
What is the effect on cost and price competitiveness?
A. Does the assessed proposal cut or increase compliance costs of the affected sector(s)?
1. Does the policy option
affect the nature of
information obligations
placed on businesses,
such as the type of data
required, reporting
frequency, the complexity
of submission process,
etc.?
Maybe
A monitoring mechanism for
the CO2 legislation is
already in place. Details of
that, and resulting
requirements for OEMs,
may change.
No No No
2. Does it require the use
of new equipment (e.g. to
reduce pollution, or to
register sales, or to
measure the content of a
substance in the final
product, etc.)?
Yes
Applying CO2 reducing
technologies to ICEVs or
manufacturing AFVs is
likely to require new
equipment for
manufacturing or assembly.
Yes
Manufacturing advanced
components for ICEVs or
AFVs is likely to require
new equipment for
manufacturing or assembly.
No
Equipment for supplying
energy to AFVs is already
existing. Infrastructure
only needs to be
expanded.
No
3. Would it require
additional staff time or
business services
provided by the private or
public sector (such as
external accounting or
Maybe
A monitoring mechanism for
the CO2 legislation is
already in place. Details of
that, and resulting
requirements for OEMs,
No No No

Assessment of competitiveness impacts of post-2020 LDV CO2 regulation
Final Report Valdani Vicari & Associati (VVA), Technopolis Group (TG), Joint Institute for Innovation Policy (JIIP), TNO for DG CLIMA 203
Affected sectors
Question Car manufacturing Component
manufacturing Energy supply
Professional end-
users
audit services, or
conformity verification by
authorized public or
private sector entities,
etc.)?
may change.
4. Do compliance costs
place certain enterprises
or sectors at a
disadvantage relative to
their competitors
(including by creating an
uneven playfield)?
Yes
Size and sign of impact
unknown. Depends on a
range of factors such as
relative stringency of EU
legislation for EU and non-
EU OEMs, relative
stringency of the EU
legislation compared to
legislation in other regions,
the target level and
modalities and the extent to
which these promote the
implementation of AFVs as
compliance mechanism.
Yes
EU refineries may face
increased competition
from refineries in other
regions.
No
5. How are SMEs affected
in particular?
Maybe
Depends on derogations for
small volume and niche
manufacturers in post-2020
CO2 legislation.
No
Advanced components for
ICEVs or AFVs is likely to
be supplied by large
component manufacturing
companies.
No
In the fuel distribution sub-
sector (filling stations)
SMEs may be affected but
this is an economic impact
rather than a
competitiveness impact.
No
Costs of doing business
may be affected by
ΔTCO of cars and vans,
but SME end-users are
not in competition with
companies from outside
EU
B. Does the proposal affect the prices and cost of intermediate consumption?
1. by affecting the price or
availability of natural
resources including raw
materials and other inputs
(intermediate goods and
services) used in
production?
Maybe
Components for advanced
ICEVs and AFVs are likely
to require new materials.
The price of these materials
may be affected if demand
increases faster than
supply.
Maybe
Components for advanced
ICEVs and AFVs are likely
to require new materials.
The price of these materials
may be affected if demand
increases faster than
supply.
No No
2. by introducing
restrictions (or bans) on
the use of hazardous
materials?
No No No No
3. indirectly, when
changes in the cost of
output of directly affected
sector are passed on
downstream, or shift of
demand to substitutes
bids prices up, and those
substitutes are used in
intermediate
consumption?
Yes
A change in the costs of
cars and vans is expected
which will impact on
professional end users.
Yes
A change in the costs of
components is expected
which will impact on OEMs.
Yes
A change in the price of
fuels is expected which
will impact professional
end-users.
Maybe
Prices of products and
services may be
affected by the ΔTCO of
cars and vans, but
impact is expected to be
small.
C. Does the proposal affect the cost of capital?
1. by increasing the prices
of capital goods?
Maybe
Prices of alternative
equipment for
manufacturing advanced
Maybe
Prices of alternative
equipment for
manufacturing components
No Yes
The prices of cars and
vans is likely to
increase, but this is

Assessment of competitiveness impacts of post-2020 LDV CO2 regulation
Final Report Valdani Vicari & Associati (VVA), Technopolis Group (TG), Joint Institute for Innovation Policy (JIIP), TNO for DG CLIMA 204
Affected sectors
Question Car manufacturing Component
manufacturing Energy supply
Professional end-
users
ICEVs and AFVs may be
affected if demand
increases faster than
supply.
for advanced ICEVs and
AFVs may be affected if
demand increases faster
than supply..
(partly) counteracted by
lower energy costs.
2. by affecting availability
and cost of financing
(equity, bank loans and
bonds)?
No No No No
D. Does the proposal affect the cost of labour?
1. by changing e.g.
retirement age, minimum
wages, social insurance
contributions, or other
taxes on labour?
No No No No
2. by changing accounting
or reporting obligations?
No No No No
3. by affecting labour
mobility, employee
protection legislation, or
labour market rigidities
and flexibilities as a side
effect?
No No No No
4. by changes leading to
additional/new labour
demand?
Maybe
Developing and
manufacturing advanced
ICEVs and AFVs will
require specifically skilled
labour. Temporary shortage
of such skilled labour is
considered possible and will
affect costs.
Maybe
Developing and
manufacturing components
for advanced ICEVs and
AFVs will require
specifically skilled labour.
Temporary shortage of
such skilled labour is
considered possible and
will affect costs.
No No
5. by imposing additional
compliance costs related
to employment: e.g.
higher standards for
health and safety at work
or additional reporting
requirements about the
company’s workforce?
No No No No
E. Does the proposal
affect the cost of energy?
No No Maybe
Changes in demand for
petroleum fuel in EU may
affect the global oil price.
Yes
Reduced demand for
petroleum fuel in EU is
likely to increase costs
for production but also
put pressure on
margins. Net effect is
difficult to predict.
F. Does the policy proposal affect consumer’s choice and prices?
1. by affecting the
availability of certain
products on the market?
Yes
Purchase prices of cars and
vans are likely to go up.
The legislation does not
directly affect the portfolio
offered by manufacturers,
Not relevant Maybe
The number of brands for
fuels may reduce.
No
The CO2 legislation is
not expected to change
the products and
services offered by end-
users.

Assessment of competitiveness impacts of post-2020 LDV CO2 regulation
Final Report Valdani Vicari & Associati (VVA), Technopolis Group (TG), Joint Institute for Innovation Policy (JIIP), TNO for DG CLIMA 205
Affected sectors
Question Car manufacturing Component
manufacturing Energy supply
Professional end-
users
but indirect effects are likely
as changes in the product
portfolio (sizes,
performance, propulsion
technology, etc.) may help
OEMs to reduce cost of
compliance.
2. by banning or limiting
the marketing (or
advertising) of certain
products?
No Not relevant No No
3. by regulating or
otherwise affecting the
prices consumers pay for
the products of the
affected sector?
Yes
The legislation does not
directly affect prices, but as
a result of applying CO2
reducing technologies
purchase prices of cars and
vans are likely to go up.
Not relevant Yes
The legislation does not
directly affect prices of
fuels and other energy
carriers. Reduced demand
for petroleum fuel in EU is
likely to increase costs for
production but also put
pressure on margins. Net
effect is difficult to predict.
Maybe
For most end-users the
impact on the costs of
delivered products and
services will be
negligible. For Transport
companies a finite
impact may occur, but
the net effect depends
on stringency of the
regulation and
development of costs of
advanced technologies
for ICEVs and AFVs
beyond 2020.
4. by affecting the quality
of the goods and services
consumers buy?
No Not relevant No No
5. by affecting the
transparency and
comparability of
information about quality
and prices of products and
services?
No No No No
G. Would the impacts above require a major restructuring of affected enterprises’ operations?
1. Would there be
substantial adjustment
costs for enterprises (incl.
workforce)?
Yes Yes Yes No
2. Would the sector need
a major restructuring such
as closing of production
lines, substitution of
technologies, substitution
of skills, etc.?
Yes Yes Yes No
3. May it lead to closing
down of enterprises?
Maybe
No direct impacts expected,
but identified possible
impacts on competitiveness
may in principle lead to
closing down of enterprises.
Maybe
No direct impacts expected,
but identified possible
impacts on competitiveness
may in principle lead to
closing down of
enterprises.
Yes
Reduced demand for
petroleum fuels in EU is
likely to lead to closing of
refineries,
No
4. Would SMEs have
difficulty to meet the cost
Maybe
Depends on derogations for
No
Advanced components for
Yes
In the fuel distribution sub-
No
Costs of doing business
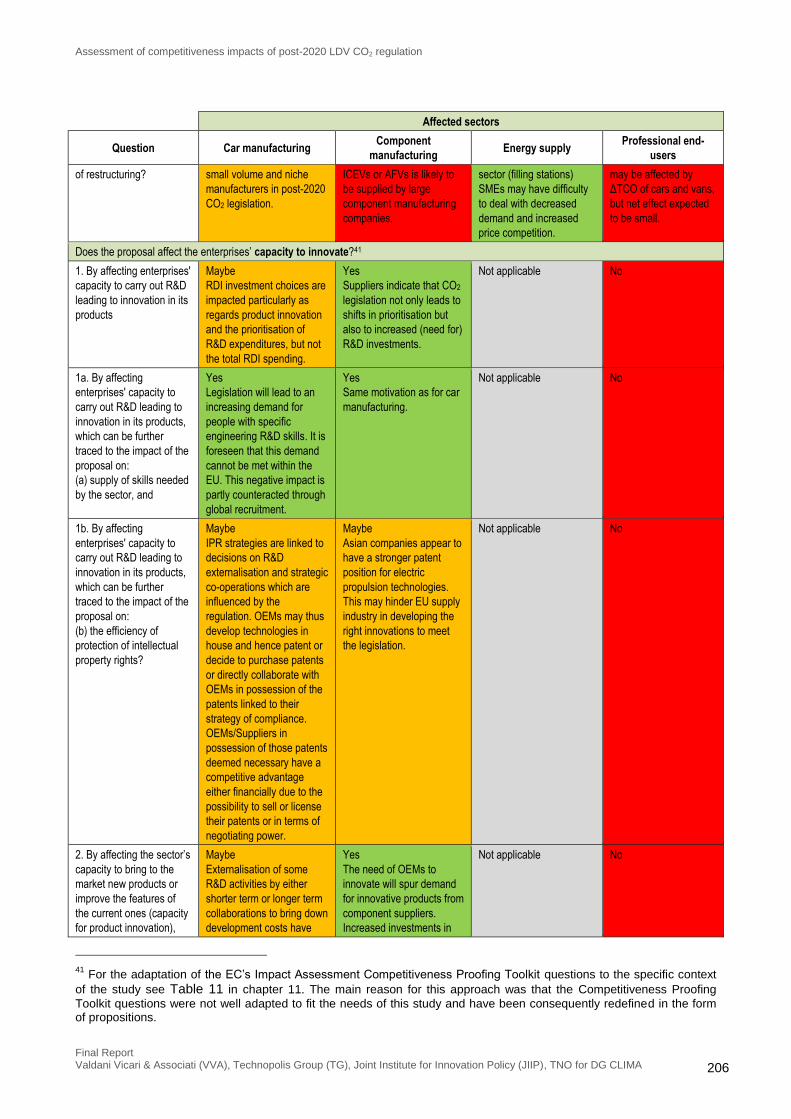
Assessment of competitiveness impacts of post-2020 LDV CO2 regulation
Final Report Valdani Vicari & Associati (VVA), Technopolis Group (TG), Joint Institute for Innovation Policy (JIIP), TNO for DG CLIMA 206
Affected sectors
Question Car manufacturing Component
manufacturing Energy supply
Professional end-
users
of restructuring? small volume and niche
manufacturers in post-2020
CO2 legislation.
ICEVs or AFVs is likely to
be supplied by large
component manufacturing
companies.
sector (filling stations)
SMEs may have difficulty
to deal with decreased
demand and increased
price competition.
may be affected by
ΔTCO of cars and vans,
but net effect expected
to be small.
Does the proposal affect the enterprises’ capacity to innovate?41
1. By affecting enterprises'
capacity to carry out R&D
leading to innovation in its
products
Maybe
RDI investment choices are
impacted particularly as
regards product innovation
and the prioritisation of
R&D expenditures, but not
the total RDI spending.
Yes
Suppliers indicate that CO2
legislation not only leads to
shifts in prioritisation but
also to increased (need for)
R&D investments.
Not applicable No
1a. By affecting
enterprises' capacity to
carry out R&D leading to
innovation in its products,
which can be further
traced to the impact of the
proposal on:
(a) supply of skills needed
by the sector, and
Yes
Legislation will lead to an
increasing demand for
people with specific
engineering R&D skills. It is
foreseen that this demand
cannot be met within the
EU. This negative impact is
partly counteracted through
global recruitment.
Yes
Same motivation as for car
manufacturing.
Not applicable No
1b. By affecting
enterprises' capacity to
carry out R&D leading to
innovation in its products,
which can be further
traced to the impact of the
proposal on:
(b) the efficiency of
protection of intellectual
property rights?
Maybe
IPR strategies are linked to
decisions on R&D
externalisation and strategic
co-operations which are
influenced by the
regulation. OEMs may thus
develop technologies in
house and hence patent or
decide to purchase patents
or directly collaborate with
OEMs in possession of the
patents linked to their
strategy of compliance.
OEMs/Suppliers in
possession of those patents
deemed necessary have a
competitive advantage
either financially due to the
possibility to sell or license
their patents or in terms of
negotiating power.
Maybe
Asian companies appear to
have a stronger patent
position for electric
propulsion technologies.
This may hinder EU supply
industry in developing the
right innovations to meet
the legislation.
Not applicable No
2. By affecting the sector’s
capacity to bring to the
market new products or
improve the features of
the current ones (capacity
for product innovation),
Maybe
Externalisation of some
R&D activities by either
shorter term or longer term
collaborations to bring down
development costs have
Yes
The need of OEMs to
innovate will spur demand
for innovative products from
component suppliers.
Increased investments in
Not applicable No
41
For the adaptation of the EC’s Impact Assessment Competitiveness Proofing Toolkit questions to the specific context
of the study see Table 11 in chapter 11. The main reason for this approach was that the Competitiveness Proofing
Toolkit questions were not well adapted to fit the needs of this study and have been consequently redefined in the form of propositions.

Assessment of competitiveness impacts of post-2020 LDV CO2 regulation
Final Report Valdani Vicari & Associati (VVA), Technopolis Group (TG), Joint Institute for Innovation Policy (JIIP), TNO for DG CLIMA 207
Affected sectors
Question Car manufacturing Component
manufacturing Energy supply
Professional end-
users
which depends crucially
on technical skills and
application of new
technologies?
been occurring as a
response to shrinking profit
margins. Regulations
implying products already
available in the market by
some manufacturers does
imply collaborations as the
fastest “catch up” strategy
and may hence result in a
further intensification of this
trend.
component innovation will
improve the supply sectors
capacity to innovate.
3. by affecting the
capacity to innovate in
processes and product
related services, including
distribution, marketing and
after-sales services
(process innovation),
which depends on the
supply of management
and organizational skills
and talents?
No
The design and
implementation of
innovative products is not
directly influenced by the
regulation but is a
consequence of the chosen
compliance strategy (i.e.
product mix). It is also
linked to the coherence
between CO2 regulation
and other regulations.
Services are linked to
products and are thus
indirectly influenced by the
regulation.
Business models have
been shaped by regulation
over many years
considering the emphasis
towards sustainable
business models
predominantly centred on
product, ranging for
example from efficient ICEV
to AFVs and EVs.
Nevertheless designs of
product-process-structure-
business models are
shaped by market
conditions and other
regulations as well.
Maybe
A change in the type of
components supplied to
OEMs may require
changes in services and
supply logistics.
Not applicable No
4. by affecting the ability
to access risk capital?
No
Regulation impacts the
need to access risk captial
not their ability to access
risk capital.
The low profit margins for
particularly mass production
manufacturers heightens
the need for alternative
forms of access to finance
for either innovations linked
to the regulation or other
innovations that may as a
consequence of the
No
Same motivation as for car
manufacturing.
Not applicable No
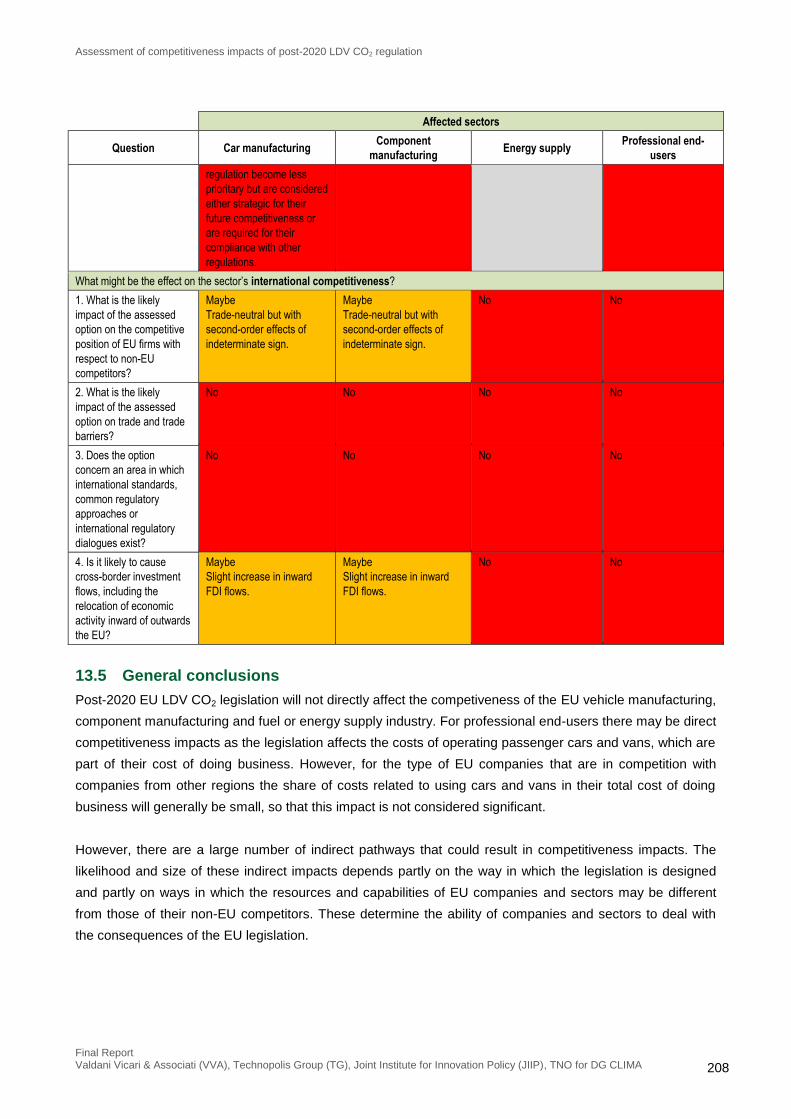
Assessment of competitiveness impacts of post-2020 LDV CO2 regulation
Final Report Valdani Vicari & Associati (VVA), Technopolis Group (TG), Joint Institute for Innovation Policy (JIIP), TNO for DG CLIMA 208
Affected sectors
Question Car manufacturing Component
manufacturing Energy supply
Professional end-
users
regulation become less
prioritary but are considered
either strategic for their
future competitiveness or
are required for their
compliance with other
regulations.
What might be the effect on the sector’s international competitiveness?
1. What is the likely
impact of the assessed
option on the competitive
position of EU firms with
respect to non-EU
competitors?
Maybe
Trade-neutral but with
second-order effects of
indeterminate sign.
Maybe
Trade-neutral but with
second-order effects of
indeterminate sign.
No No
2. What is the likely
impact of the assessed
option on trade and trade
barriers?
No No No No
3. Does the option
concern an area in which
international standards,
common regulatory
approaches or
international regulatory
dialogues exist?
No No No No
4. Is it likely to cause
cross-border investment
flows, including the
relocation of economic
activity inward of outwards
the EU?
Maybe
Slight increase in inward
FDI flows.
Maybe
Slight increase in inward
FDI flows.
No No
13.5 General conclusions
Post-2020 EU LDV CO2 legislation will not directly affect the competiveness of the EU vehicle manufacturing,
component manufacturing and fuel or energy supply industry. For professional end-users there may be direct
competitiveness impacts as the legislation affects the costs of operating passenger cars and vans, which are
part of their cost of doing business. However, for the type of EU companies that are in competition with
companies from other regions the share of costs related to using cars and vans in their total cost of doing
business will generally be small, so that this impact is not considered significant.
However, there are a large number of indirect pathways that could result in competitiveness impacts. The
likelihood and size of these indirect impacts depends partly on the way in which the legislation is designed
and partly on ways in which the resources and capabilities of EU companies and sectors may be different
from those of their non-EU competitors. These determine the ability of companies and sectors to deal with
the consequences of the EU legislation.

Assessment of competitiveness impacts of post-2020 LDV CO2 regulation
Final Report Valdani Vicari & Associati (VVA), Technopolis Group (TG), Joint Institute for Innovation Policy (JIIP), TNO for DG CLIMA 209
13.6 Recommendations
This report provides a structured approach to assessing possible competitiveness impacts of post-2020 EU
CO2 legislation for light-duty vehicles. This framework has been used to identify possible impact pathways
with respect to cost competitiveness, R&D competitiveness and international competitiveness. However, for
most of the identified pathways no conclusions could be drawn on the likelihood, sign and size of the impacts
as a result of the following factors:
Many impact pathways were found to depend on the relative stringency of LDV CO2 legislation in the EU
versus regulations in other regions or on the relative stringency of the EU legislation for EU and non-EU
OEMs active on the EU market. Generally it appears likely that a more stringent EU legislation has net
positive impacts on the cost competitiveness of EU OEMs.;
Various identified pathways might have been further explored using concrete sectorial information, e.g.
on sales distributions, shares of production inside and outside the EU, or trade flows. However, in many
cases such information was either not available to the consortium or could not be further collected or
analysed within the time and budget available for this study.
Furthermore various possible competitiveness impacts on EU OEMs and component suppliers were found to
relate to the economic / financial situation of the EU automotive industry, which appears to be more strongly
affected by the economic crisis than the industry in other regions, due to the fact that the EU economy, and
as a consequence the car market in the EU, has stagnated more strongly than in other regions. It is to be
expected that this will be an important issue in the discussion on post-2020 targets. At the same time,
however, this is in principle a temporary situation that may change in the coming decade. To enable a more
objective discussion on this issue, it is recommended that a more in-depth analysis is made of the current
economic situation of the EU automotive sector and its possible development in the coming years, and on
how this may affect their ability to deal with different levels of stringency for the post-2020 CO2 legislation in
the EU.

Assessment of competitiveness impacts of post-2020 LDV CO2 regulation
Final Report Valdani Vicari & Associati (VVA), Technopolis Group (TG), Joint Institute for Innovation Policy (JIIP), TNO for DG CLIMA 210

Assessment of competitiveness impacts of post-2020 LDV CO2 regulation
Final Report Valdani Vicari & Associati (VVA), Technopolis Group (TG), Joint Institute for Innovation Policy (JIIP), TNO for DG CLIMA 211
14. Literature
[AEA 2008] Impacts of regulatory options to reduce CO2 emissions from cars, in particular on car
manufacturers, study carried out by CE Delft, TNO, Öko-Institut and AEA under a
framework contract (nr. ENV/C.5/FRA/2006/0071) led by AEA, ED05315010 - Issue 1,
December 2008
http://ec.europa.eu/clima/policies/transport/vehicles/docs/2008_co2_car_en.pdf
[AEA 2009] Assessment of options for the legislation of CO2 emissions from light commercial
vehicles, Final Report – Update, study carried out by CE Delft and TNO under a
framework contract (nr. ENV/C.5/FRA/2006/0071) led by AEA,
AEA/ED05315010/Issue 2, November 2009
http://ec.europa.eu/clima/events/docs/0019/final_report_lcv_co2_250209_en.pdf
[ICCT 2014] From laboratory to road: A 2014 update, by Peter Mock, Uwe Tietge, Vicente Franco,
John German, Anup Bandivadekar (ICCT), Norbert Ligterink (TNO), Udo Lambrecht
(IFEU), Jörg Kühlwein (KISU), and Iddo Riemersma (Sidekick Project Support), ICCT,
2014
http://www.theicct.org/sites/default/files/publications/ICCT_LaboratoryToRoad_2014_
Report_English.pdf
[FEV 2013] Light-Duty Vehicle Technology Cost Analysis - EU Vehicle Market Result Summary
and Labor Rate Sensitivity Study, Revised Final Report, August 7, FEV, 2013
http://www.theicct.org/sites/default/files/Phase_1_2_Summary%20080713B_Trans.pdf
[ICCT 2013a] Design of Fuel Economy/Greenhouse Gas (GHG) Standards, Learning from
international experiences, presentation by ICCT, 2013
[ICCT 2013b] “Learning from each other” Global Best Practices in Fuel Economy Policies,
presentation by Peter Mock (ICCT Europe) at the GFEI Global Networking Event 20-
21st June 2013, UNEP, Paris
[ICCT 2014a] EU CO2 emission standards for passenger cars and light-commercial vehicles,
International Council On Clean Transportation, January 2014
[ICCT 2014b] Summary of Eastern EU labor rate impacts on EU cost curves, Working Paper 2014-3,
by Dan Meszler, John German, Peter Mock, Anup Bandivadekar, and Jun Tu, ICCT,
February 2014
[IEEP 2007] Possible regulatory approaches to reducing CO2 emissions from cars, Study on the
detailed design of the regulation to reduce CO2 emissions from new passenger cars to
130 g/km in 2012, carried out by IEEP, CE Delft and TNO on behalf of the EU
Commission (DG ENV, contract nr. 070402/2006/452236/MAR/C3) in 2007
http://ec.europa.eu/clima/policies/transport/vehicles/docs/report_ia_en.pdf
[Ricardo-AEA 2014] Understanding vehicle lifetime mileage and its impacts on the cost-effectiveness of
light-duty vehicle CO2 Regulations, presentation by Ricardo-AEA at the Stakeholder
meeting to present studies on CO2 emissions from light-duty vehicles, Brussels,
December 9, 2014
http://ec.europa.eu/clima/events/articles/0103_en.htm

Assessment of competitiveness impacts of post-2020 LDV CO2 regulation
Final Report Valdani Vicari & Associati (VVA), Technopolis Group (TG), Joint Institute for Innovation Policy (JIIP), TNO for DG CLIMA 212
[TNO 2006] Review and analysis of the reduction potential and costs of technological and other
measures to reduce CO2-emissions from passenger cars, Final Report (Contract nr.
SI2.408212), October 2006.
http://ec.europa.eu/clima/policies/transport/vehicles/docs/report_co2_reduction_en.pdf
[TNO 2011] Support for the revision of Regulation (EC) No 443/2009 on CO2 emissions from cars,
Service request #1 for Framework Contract on Vehicle Emissions (Framework
Contract No ENV.C.3./FRA/2009/0043), carried out by TNO, AEA, CE Delft, Ökopol,
Ricardo, TML and IHS Global Insight for the EU Commission’s DG CLIMA, November
2011
http://ec.europa.eu/clima/policies/transport/vehicles/cars/docs/study_car_2011_en.pdf
[TNO 2012a] Support for the revision of regulation on CO2 emissions from light commercial
vehicles, Service request #3 for Framework Contract on Vehicle Emissions, Final
Report, Framework Contract No ENV.C.3./FRA/2009/0043, Delft, November 25, 2011
http://ec.europa.eu/clima/policies/transport/vehicles/cars/docs/study_car_2011_en.pdf
[TNO 2012b] Supporting Analysis regarding Test Procedure Flexibilities and Technology
Deployment for Review of the Light Duty Vehicle CO2 Regulations, Service request #6
for Framework Contract on Vehicle Emissions (Framework Contract No
ENV.C.3./FRA/2009/0043) by TNO, AEA, IHS Global Insight, and Ricardo, on behalf
the EU Commission’s DG CLIMA, December 2012
http://ec.europa.eu/clima/policies/transport/vehicles/cars/docs/report_2012_en.pdf
[TNO 2013a] Consideration of alternative approaches to regulating CO2 emissions from light duty
road vehicles for the period after 2020, Service request #4 for Framework Contract on
Vehicle Emissions (Framework Contract No ENV.C.3./FRA/2009/0043) by TNO, AEA,
CE Delft, and Ricardo on behalf the EU Commission’s DG CLIMA, October 2013
http://ec.europa.eu/clima/policies/transport/vehicles/docs/alternatives_en.pdf
[TNO 2013b] Analysis of the influence of metrics for future CO2 legislation for Light Duty Vehicles on
deployment of technologies and GHG abatement costs, Service request #8 for
Framework Contract on Vehicle Emissions, Framework Contract No
ENV.C.3./FRA/2009/0043, carried out by TNO for the EU Commission’s DG CLIMA,
October 2013
http://ec.europa.eu/clima/policies/transport/vehicles/docs/influence_en.pdf

Assessment of competitiveness impacts of post-2020 LDV CO2 regulation
Final Report Valdani Vicari & Associati (VVA), Technopolis Group (TG), Joint Institute for Innovation Policy (JIIP), TNO for DG CLIMA 213
ANNEXES

Assessment of competitiveness impacts of post-2020 LDV CO2 regulation
Final Report Valdani Vicari & Associati (VVA), Technopolis Group (TG), Joint Institute for Innovation Policy (JIIP), TNO for DG CLIMA 214

Assessment of competitiveness impacts of post-2020 LDV CO2 regulation
Final Report Valdani Vicari & Associati (VVA), Technopolis Group (TG), Joint Institute for Innovation Policy (JIIP), TNO for DG CLIMA 215
Annex 1. Current CO2 legislation
Regulation (EC) 443/2009 establishes CO2 emissions performance requirements for newly registered
passenger cars for 2015 setting an overall target of 130 g/km. In March 2014 Regulation (EU) 333/2014 has
been approved which defines the modalities for further reducing CO2 emissions from new passenger cars to
95 g/km by 2021. Similar legislation for light commercial vehicles (also named LCVs or vans) is laid down in
Regulation (EU) 510/2011, setting a target of 175 g/km for 2017, and Regulation (EC) 253/2014, defining the
modalities for reaching a target of 147 g/km by 2020. The EU Commission is currently starting up
preparatory work for the development of proposals for regulation of the CO2 emissions of light duty vehicles
beyond 2020. New legislative proposals are expected to be made by the Commission in 2015.
A1.1 CO2 regulation for passenger cars Some important elements of Regulation (EC) No 443/2009 are:
Target and limit value curve: In 2015 the fleet average CO2 emission, as measured on the EU type
approval test using the New European Driving Cycle (NEDC), to be achieved by all cars registered in the
EU is 130 grams per kilometre (g/km). A so-called limit value curve implies that heavier cars are allowed
higher emissions than lighter cars while preserving the overall fleet average. Manufacturers will be given
a target based on the sales-weighted average mass of their vehicles.
Phasing-in of requirements: In 2012 65% of each manufacturer's newly registered cars had to comply
on average with the limit value curve set by the legislation. This rose to 75% in 2013, 80% in 2014, and
is 100% from 2015 onwards.
Super-credits: In calculating the average specific emissions of CO2, each new passenger car with
specific emissions of CO2 of less than 50 g/km are counted as 3.5 cars in 2012 and 2013, 2.5 cars in
2014, 1.5 cars in 2015, and 1 car from 2016.
Excess emission premiums: Manufacturers that fail to comply with their specific target must pay
excess emission premiums increasing from 5 €/vehicle for the first g/km above target, 15 €/vehicle for
the second and 25 €/vehicle for the third g/km above target, and 95 €/vehicle for every g/km that the
manufacturer’s average is more than 3 g/km above their specific target.
Pooling: The formation of manufacturers' pools is allowed as a way of meeting the emissions target.
A number of implementing measures, detailing various provisions and procedures of the CO2 legislation for
cars, have been adopted. These implementing measures cover issues relating to:
A procedure for the approval and certification of innovative technologies for reducing CO2 (so-called
"eco-innovations"), defined in Commission Implementing Regulation (EU) No 725/2011 of 25 July 2011;
o These are technical measures applied to vehicles which reduce the energy consumption and CO2
emissions under real-world driving conditions but that do not affect the CO2 emissions as
measured on the type approval test. Examples are waste heat recovery, solar roofs and LED
lighting;
o The total contribution of those technologies to reducing the specific emissions target of a
manufacturer may be up to 7 g/km.
Derogations for niche and small volume manufacturers and for market entrants, defined in Commission
Regulation (EU) No 63/2011 of 26 January 2011;

Assessment of competitiveness impacts of post-2020 LDV CO2 regulation
Final Report Valdani Vicari & Associati (VVA), Technopolis Group (TG), Joint Institute for Innovation Policy (JIIP), TNO for DG CLIMA 216
A method for the collection of premiums for excess CO2 emissions from new passenger cars defined in
Commission Decision 2012/100/EU of 17 February 2012;
Provisions for monitoring CO2 emissions and other features (e.g. mass and footprint) from newly
registered light duty vehicles, defined in Commission Regulation (EU) No 1014/2010 of 10 November
2010. The rules on how to calculate the phase-in, eco innovation super credits, pooling and specific
emission targets have been established in 2010 by Commission Communication COM(2010) 657 final.
Some important elements of Regulation (EC) No 333/2014 are:
A target value of 95 g/km is set for 2020. However, due to a one-year phase-in period, requiring 95
percent of new car sales to comply with the target in 2020 and 100 percent from the end of 2020
onwards, the 95 g/km target effectively applies from 2021 onwards.
De minimis clause excludes manufacturers registering less than 1000 vehicles from the effect of the
Regulation.
Vehicle weight is retained as the utility parameter for differentiating targets using a linear limit value
curve.
Super-credits for low-emission vehicles: In calculating the average specific emissions of CO2, each new
passenger car with specific emissions of CO2 below 50 g/km shall be counted as 2 passenger cars in
2020, 1.67 passenger cars in 2021, 1.33 passenger cars in 2022, and 1 passenger car from 2023
onwards. The use of super-credits is subject to a cap of 7.5 g/km over the 2020-2022 period for each
manufacturer.
Test procedure: In order to ensure that specific CO2 emissions quoted for new passenger cars are
brought more closely into line with the emissions actually generated during normal conditions of use, the
new WLTP test procedure should be applied at the earliest opportunity. When the test procedures are
amended, the limits should be adjusted to ensure comparable stringency for manufacturers and classes
of vehicles.
Eco-innovations: Arrangements in the 2015 regulation are continued.
A1.2 CO2 regulation for light commercial vehicles Some important elements of Regulation (EU) No 510/2011 are:
Target and limit value curve: The fleet average CO2 emissions to be achieved by all light commercial
vehicles registered in the EU in 2017 is 175 grams per kilometre (g/km). As with passenger cars a mass-
based limit value curve implies that heavier vans are allowed higher emissions than lighter vans while
preserving the overall fleet average. Manufacturers will be given a target based on the sales-weighted
average mass of their vehicles.
Phasing-in of requirements: The EU fleet average of 175 g/km will be phased in between 2014 and
2017. In 2014 an average of 70% of each manufacturer's newly registered vans must comply with the
limit value curve set by the legislation. This proportion will rise to 75% in 2015, 80% in 2016, and 100%
from 2017 onwards.
Eco-innovations, through a similar provision as in the regulation for cars.
Excess emissions premium, through a similar provision as in the regulation for cars.

Assessment of competitiveness impacts of post-2020 LDV CO2 regulation
Final Report Valdani Vicari & Associati (VVA), Technopolis Group (TG), Joint Institute for Innovation Policy (JIIP), TNO for DG CLIMA 217
Since then additional provisions have been implemented defining procedures for dealing with excess
premiums (Commission Implementing Decision 2012/99/EU of 17 February 2012) and monitoring
(Commission Implementing Regulation (EU) No 293/2012 of 3 April 2012 and Commission Delegated
Regulation (EU) No 205/2012 of 6 January 2012). Detailed provisions on derogations and eco-innovations
for light commercial vehicles have not yet been published.
Some important elements of Regulation (EC) No 253/2014 are:
A target value of 147 g/km is set for 2020.
De minimis clause excludes manufacturers registering less than 1000 vehicles from the effect of the
Regulation.
Vehicle weight is retained as the utility parameter for differentiating targets using a linear limit value
curve.
Eco-innovations: Arrangements in the 2017 regulation are continued.
Test procedure: In order to ensure that specific CO2 emissions quoted for new passenger cars are
brought more closely into line with the emissions actually generated during normal conditions of use, the
new WLTP test procedure should be applied at the earliest opportunity. When the test procedures are
amended, the limits should be adjusted to ensure comparable stringency for manufacturers and classes
of vehicles.
Excess emissions premium continued.

Assessment of competitiveness impacts of post-2020 LDV CO2 regulation
Final Report Valdani Vicari & Associati (VVA), Technopolis Group (TG), Joint Institute for Innovation Policy (JIIP), TNO for DG CLIMA 218

Assessment of competitiveness impacts of post-2020 LDV CO2 regulation
Final Report Valdani Vicari & Associati (VVA), Technopolis Group (TG), Joint Institute for Innovation Policy (JIIP), TNO for DG CLIMA 219
Annex 2. Detailed market and sectorial overview
The global automotive industry is undergoing profound change. Vehicle sales in the more mature markets
have mostly plateaued and the emerging markets are driving growth due to their rapidly growing economies
and their larger, younger and growing populations. This has led automakers to increasingly shift their
attention, and plant location towards these regions. The growth of the automotive industry is influenced by a
series of factors, principally: the need for significant capital investment, the impact of the legislation including
the environmental one, and strong competition for material, human, and natural resources. The next sections
are devoted to analysing the market structure of the global automotive industry and related sectors and
represent the baseline supporting the analysis of competitiveness impacts of post-2020 CO2 legislation. An
assessment of the EU's current position compared to other regions illustrates its relative strengths and
weaknesses. The examination of industry KPIs further enriches the market overview. Market projections
provide a deeper understanding of the industry’s future trends.
A2.1 Overview of the automotive industry
A2.1.1. Industry structure
The automotive industry is a capital intensive industry with a relatively high capital-to-labour ratio. In many
countries the majority of the vehicles produced are exported. More recently production has been increasingly
shifted towards lower wage costs, emerging economies moving from regions such as Western Europe (i.e.
EU 15) to Central and Eastern Europe (i.e. EU 13 plus Ukraine, Serbia and Belarus) and Turkey, from North
America to Mexico, and in Asia towards China and India. For instance, between 2000 and 2007, the share of
Japan and the United States in global production fell by 10% while the share of the non-OECD areas
increased from 10% to 20%42
(OECD, 2009). Market saturation in mature regions, tariffs and high shipping
costs and efforts by automakers to gain market share by placing production where sales are growing are
some of the reasons for this trend. Simultaneously, the minimum efficient scale of production has grown,
encouraging incumbents to pursue mergers and acquisitions in order to improve economies of scale.
Alliances and partnerships have also become fundamental at both horizontal and vertical levels. OEMs and
suppliers have formed buyer-supplier relationships on a global scale. Interregional trade of parts and
vehicles is substantial, but capped by operational and political considerations. Intraregional trade of finished
vehicles and parts has become a relevant operational pattern, whereas domestic production is still very
strong for the majority of markets. At local level, a phenomenon related to collaboration in the automotive
industry is the emergence of clusters where companies along the value chain dealing with different activities
(e.g. design, component manufacturing, and assembly) tend to be geographically close. The automotive
industry is one where competitors cooperate both vertically and horizontally for different purposes including
engine development, joint design or platform sharing. This phenomenon is known in management literature
as co-opetition. Even though the automotive industry is highly competitive, there are occasions where
combining both technical and financial resources can help the industry to move in new directions. The Ford-
Daimler-Nissan alliance is a great example of co-opetition, with the joint aim to bring a hydrogen vehicle to
42
OECD (2009). Responding to the economic crisis: Fostering industrial restructuring and renewal.

Assessment of competitiveness impacts of post-2020 LDV CO2 regulation
Final Report Valdani Vicari & Associati (VVA), Technopolis Group (TG), Joint Institute for Innovation Policy (JIIP), TNO for DG CLIMA 220
market within four years. In other cases, companies buy equity stakes in other companies (e.g. Renault,
Nissan and Daimler).
In the EU automotive market competition is intense. Many factors have affected the industry including
declining real prices for new cars, successful new entries, shortened life cycles, changes in market shares
and demand-side changes. Competition is expected to increase mainly due to the entry of companies from
emerging countries in the EU market. The EU industry has responded to these trends and to the recent crisis
through consolidation and cooperation. The situation is not that different in other mature markets such as the
United States. In the EU, Jaguar and Land Rover were bought by Tata Motors and Volvo by Geely, whereas
in the US the acquisition of Chrysler by FIAT gave the latter the possibility to establish a global presence.
The figure below provides an illustrative example of the automotive ties existing between European and
Japanese companies belonging to the automotive sector.
A driver for further consolidation and alliances will be overcapacity in a price competitive market, which is
likely to lead to as much cost optimisation as possible. Many manufacturers already co-operate in both
production and R&D (e.g. in form of automotive clusters), which could provide a platform for further
restructuring or consolidation in the industry. Restructuring also concerns automotive suppliers who are
currently in the process of consolidation accelerated by the recession.
A key feature of the automotive sector is its tiered structure encompassing a relatively small number of large,
multinational motor vehicle manufacturers that produce passenger cars, light and heavy commercial
vehicles, tier 1 suppliers of main systems, components and tyres, along with a larger number of smaller tier 2
and tier 3 suppliers of individual components. In the aftermarket segment there are two main distribution
channels: authorised ones linked to the OEM and independent manufacturers and traders of spare parts.
Finally there are the providers of maintenance and repair services.
In the past OEMs manufactured almost the entire vehicle on their production lines. Now large parts of value-
added are outsourced, assigning a much larger role to part suppliers than in the past. This was made
possible via modularisation and the design of common under-body platforms. In this way producers benefit
from economies of scale as they can build more car models using the same platform, a trend which has
been strengthened by the recent industry consolidation.
Regarding automotive components, the European Association of Automotive Suppliers (CLEPA) state that
around 75% of each vehicle is made by automotive suppliers, which supports the thesis that OEMs are
increasingly relying on outsourcing. Tier 1 suppliers deliver some of the largest components or sub-systems
for cars (e.g. powertrain systems, suspension assemblies, transmission and steering systems). These
suppliers are large firms with multiple production plants and usually pursue diversification into other sectors
such as electronics, plastics, metals or information technology among others. Tier 2 suppliers typically
provide components to tier 1 suppliers (e.g. electric motors, pump units) and are generally small and
medium-sized companies. Upstream from tier 1 suppliers are raw material suppliers which are also
considered as tier 3 suppliers, although in some cases they supply directly to OEMs. Geographical proximity
to OEMs has traditionally been key to tier 1 suppliers’ development and growth. This is important in terms of

Assessment of competitiveness impacts of post-2020 LDV CO2 regulation
Final Report Valdani Vicari & Associati (VVA), Technopolis Group (TG), Joint Institute for Innovation Policy (JIIP), TNO for DG CLIMA 221
operations management as it gives tier 1 suppliers the chance to pursue just-in-time production strategies.
Tyre manufacturers are considered tier 1 suppliers. The tyre industry is quite concentrated, with ten tyre
producers representing almost the 70% of the total tyre production. Three of these firms, representing 1/4 of
world tyre production, have their headquarters in the EU.
Figure 34 - Automotive ties between European and Japanese companies
Source: JAMA
OEMs are car, truck and bus original equipment manufacturers. In 2012, there were 16 major OEMs in
Europe and 177 vehicle assembly and engine production plants in 16 different Member States43
. The main
car producers in the European market are Volkswagen, Toyota, FIAT, PSA, Renault, Daimler, BMW, Ford,
GM, Nissan, Honda and Hyundai. The five main producers for the European light commercial vehicle market
are Volkswagen, Ford, PSA, Renault and FIAT. In addition to the large OEMs, there are a number of
43
ACEA (2013). Automobile assembly and engine production plants in Europe, see: http://www.acea.be/news/news_detail/automobile_assembly_engine_production_plants_in_europe

Assessment of competitiveness impacts of post-2020 LDV CO2 regulation
Final Report Valdani Vicari & Associati (VVA), Technopolis Group (TG), Joint Institute for Innovation Policy (JIIP), TNO for DG CLIMA 222
specialised niche manufacturers that produce sports cars or special purpose vehicles (e.g. ambulances and
taxis).
Figure 35 - Automotive industry value chain
Despite the negative trend of the past few years, the automotive industry is still a major EU manufacturing
and service industry, as highlighted by the European Commission in a recent study which states: “the
automotive industry is one of Europe’s key industrial sectors, and its importance is largely derived from its
linkages within the domestic and international economy and its complex value chain” (EC, 2009). The 839
billion euro turnover generated by the automotive sector represents 6.9% of EU GDP. The automotive
industry has ripple effects throughout the economy, with a supply chain involving industries such as metals,
plastics, chemicals, textiles and electronics. Cars and commercial vehicles generate a wide variety of
business services: sales and after-sales, insurance and finance, roadside assistance, leasing and rental,
distribution and logistics, infrastructure and maintenance to name a few. The table below provides a
synthesis of the major indicators that are used in the following sections to assess the current status and the
future prospects of the EU automotive industry vis-à-vis the major markets outside the EU.
The industry’s growth is related to the business and economic cycles, with overall economic growth
influencing the demand for new vehicles. This trend can be observed in the medium term for passenger cars
and is very evident for LCVs: the 4.5% decrease in EU (real) GDP in 2009 resulted in a dramatic drop
(-29.5%) in LCV registrations. The trends in recent years are shown in the chart below.

Assessment of competitiveness impacts of post-2020 LDV CO2 regulation
Final Report Valdani Vicari & Associati (VVA), Technopolis Group (TG), Joint Institute for Innovation Policy (JIIP), TNO for DG CLIMA 223
Table 25 - Key figures in the automotive industry: comparison between EU and RoW44
Figure 36 - Yearly growth of EU GDP and vehicle registrations45
A2.1.2. Vehicle manufacturing
In 2005 66.5 million passenger cars and commercial vehicles were produced globally, by 2013 production
reached 87.3 million vehicles. The table below shows worldwide vehicle production from 2000 to 2013.
44
Source: ACEA, VDA, AAA, IHS Global Insight, Eurostat 45
Source: Internal elaboration of ACEA and Eurostat data

Assessment of competitiveness impacts of post-2020 LDV CO2 regulation
Final Report Valdani Vicari & Associati (VVA), Technopolis Group (TG), Joint Institute for Innovation Policy (JIIP), TNO for DG CLIMA 224
Figure 37 - Worldwide vehicle production, 2000-2013 (in million vehicles)46
Over this time, Asia has maintained its leadership in car and LCV production, in front of Europe and the
Americas. China is now the largest producer of vehicles, followed by the EU (23% of cars and 8.5% of LCVs)
and Japan, as reported in the table below.
Table 26 - Car and LCV manufacturing by geographical area47
Production by area (2012) Cars, units
Cars, % of
global
production
LCVs, units
LCVs, % of
global
production
Cars and
LCV, units
Cars and
LCVs, % of
global
production
EU manufacturing 14,693,534 23.19% 1,435,990 8.48% 16,129,524 21.88%
Other European manufacturing
(incl. Turkey) 656,574 1.04% 503,078 2.97% 1,159,652 1.87%
Asian manufacturing 34,006,727 53.67% 5,291,266 31.23% 39,297,993 50.65%
NAFTA manufacturing 4,105,853 6.48% 5,955,087 35.15% 10,060,940 23.45%
Others 9,896,304 15.62% 3,757,750 22.18% 13,654,054 17.42%
Vehicle manufacturing in the EU
Vehicle manufacturing is a strategic industry in Europe, with vehicle production being around 16 million cars
and LCVs per annum. Consolidation has been pursued to improve industry profitability, as larger companies
are better able to cope with high model development and launch costs, as well as benefiting from keen
supplier prices. Partnership in production activity and shared use of plants is common in the industry, with
several plants producing vehicles for different manufacturers.
46
Source: Statista 47
Source: own elaboration of OICA data for the year 2012

Assessment of competitiveness impacts of post-2020 LDV CO2 regulation
Final Report Valdani Vicari & Associati (VVA), Technopolis Group (TG), Joint Institute for Innovation Policy (JIIP), TNO for DG CLIMA 225
Automobile manufacturers operate some 226 vehicle assembly and production plants in the EU and 27
additional plants in Turkey, Ukraine, Serbia and Belarus. However, the number of plants and total production
in Europe is concentrated in a few Member States, as shown below.
Figure 38 - Automotive assembly and production plants in Europe48
Around 40% of total turnover comes from Germany, and around 10% from France, while all other countries
each account for less than 10% (Eurostat, 2013). A large share of LCV manufacturing for the EU market is
located in Turkey, due to the positive combination of manufacturing and logistics costs, as well as free trade
agreements.
The figure below shows the volume of vehicle production and the number of production plants in each
Member State. Germany dominates (35% of total production in 2010), while other important producers
include Spain (14%), France (13%), and the UK (8%), as well as the Czech Republic, Poland and Italy. The
same countries are also the main producers of parts and components, despite Central and Eastern
European Member States such as Slovakia, Slovenia, Hungary and Romania gradually gaining a higher
share of total production, particularly regarding parts and components.
Figure 39 - Vehicle production and number of production plants per Member State, 201049
48
Source: own elaboration on ACEA data, May 2014. Non-EU Europe includes Turkey (15 plants), Ukraine (5), Serbia (2) and Belarus (1) 49
Source: ACEA

Assessment of competitiveness impacts of post-2020 LDV CO2 regulation
Final Report Valdani Vicari & Associati (VVA), Technopolis Group (TG), Joint Institute for Innovation Policy (JIIP), TNO for DG CLIMA 226
Despite some plant closures in recent years, the European automotive industry has been experiencing
significant overcapacity (AEA, 2012). However, certain manufacturers have opened new manufacturing sites
in Europe (mainly in Central and Eastern Europe) to take advantage of the lower production costs and the
proximity to the Western European markets. Currently, approximately one European vehicle out of five is
produced in Eastern Europe, reaching a total annual capacity of 3 million vehicles according to Roland
Berger. For instance, the number of vehicles produced in Romania increased by 21% compared to the
previous year, reaching 400 thousand units in 2013, the fastest increase of any country in the world. While
the majority of sites belong to European OEMs, overseas investors have also invested in new plants in the
Czech Republic (Hyundai), Hungary (Suzuki) and Poland (Toyota)50
.
In spite of these developments, the location of production currently remains primarily in Western Europe for
all major manufacturers selling vehicles in the EU. The table below shows the distribution of plants producing
vehicles of different OEM groups by area. Companies with EU headquarters manufacture mainly in the
country of their headquarters (plants in Germany for German manufacturers account between 40 and 52% of
the total, French plants for French manufacturers between 42% and 50%, Italian plants for Fiat (incl. Iveco)
53%, Geely (Volvo) has 50% of its plants in Sweden). Non-EU based companies that acquired EU brands in
Western Europe (General Motors) or have signed production partnerships (Nissan) exhibit similar figures for
the geographical split of production plants, whereas non-EU based players such as Hyundai and Toyota
exhibit a markedly higher share of plants outside Western Europe, suggesting that “legacy” factors have a
long-term influence on the distribution of plants.
Table 27 – Distribution of plants producing vehicles of main OEM groups in Europe51
Share of plants
Geely BMW Daimler Volkswagen
Fiat PSA Renault Ford GM Hyundai Nissan Toyota Others
(European)
Others (non-
European) Total
HQ
CN (SE Volvo car)
DE DE DE IT FR FR US US KR JP JP - - -
EU Western 100% 100% 88% 71% 83% 74% 79% 67% 53% 0% 100% 50% 61% 64% 70%
EU Central and Eastern
0% 0% 4% 21% 10% 11% 14% 17% 18% 40% 0% 30% 12% 14% 13%
Other Countries
0% 0% 8% 7% 7% 16% 7% 17% 29% 60% 0% 20% 28% 21% 16%
A2.1.3. Vehicle sales
The global automotive industry has been in a difficult situation for some years. The ‘big three’ in the US (GM,
Ford and Chrysler) were particularly hit by the recession because of their specialisation in larger vehicles.
The rise in oil prices up to mid-2008 drove material costs higher and shifted consumer preferences toward
smaller vehicles. High debt burdens, huge fixed capital and labour costs further exacerbated the negative
effects of the downturn. Other actors along the value chain have also been hit by the crisis. Suppliers have
been particularly exposed to the recent crisis due to their close links to vehicle manufacturers, smaller size,
lower diversification and their substantial role in vehicle production. Put differently, if a vehicle production site
cuts capacity, co-located suppliers with strong ties to the site itself often have little choice but to follow suit.
50
Kawecka-Wyrzykowska, E. (2009). New Member States of the euro zone. First experiences and lessons for Poland. Pacific Rim Conference, March 24-27, Kyoto, Japan 51
Source: own elaboration of ACEA data on production, 2014. Russia in not included among other countries

Assessment of competitiveness impacts of post-2020 LDV CO2 regulation
Final Report Valdani Vicari & Associati (VVA), Technopolis Group (TG), Joint Institute for Innovation Policy (JIIP), TNO for DG CLIMA 227
A recovery in global vehicle sales began in mid-2009. In 2012, sales increased in every region except
Europe. The EU has been losing competitiveness in recent years due to both industry-related factors (such
as overcapacity and production delocalisation) and external factors (such as recession and lower
consumption) which has favoured production in emerging regions. Interviews with OEM professionals
confirm this trend by indicating that for most OEMs competition is not confined to a single area and that the
natural consequence of losing competitiveness in one region (i.e. Europe) is for delocalisation to areas
(Eastern Europe and Asia in particular) with more suitable conditions (such as lower production costs and
better financing). Yet, the EU still has a major role in both production and sales accounting for 23% and 18%
of production and sales of passenger cars respectively.
The figure below represents the number of cars sold worldwide from 1990 through 2013 and presents a
forecast for 2014. Global passenger car sales increased from 57 million units in 2010 to 65 million in 2012
and are forecast to exceed 70 million in 2014. Increased demand for cars in Asia and North America is
forecast to offset declining sales volumes in Western Europe.
Figure 40 - Number of cars sold worldwide from 1990 to 2014 (in million units)52
The dynamics of world sales are particularly interesting. Car manufacturers are particularly keen to tap into
the growing Asian markets, where car sales have doubled over the past seven years. Car sales are rising in
Malaysia, Indonesia and India, while in China they quadrupled to 17.9 million vehicles in 2013. Leading
52
Source: Statista (**2014 forecast) and ACEA Pocket guide 2013; 1
America includes LCVs;

Assessment of competitiveness impacts of post-2020 LDV CO2 regulation
Final Report Valdani Vicari & Associati (VVA), Technopolis Group (TG), Joint Institute for Innovation Policy (JIIP), TNO for DG CLIMA 228
OEMs such as General Motors or Volkswagen are enjoying rising sales across all Asian markets, and Ford
expects Asia Pacific to contribute around 40% of its vehicle sales in four or five years’ time. It is expected
that OEMs will undertake investment programs to grow their businesses in China, India and other emerging
markets. For commercial vehicles, Asia is the largest market, with China alone accounting for 46% of the
global market. The EU share of global sales has decreased to around 13% following the economic downturn
of 2007/2008.
Vehicle sales in the EU
In the Western EU market, new car sales consist largely of replacement demand with a significant element of
discretion on the timing of vehicle replacement. New vehicle sales depend on a broad range of factors such
as consumer confidence, utility of change and the availability of finance. In New EU Member States, demand
has been driven more by new motorisation than by replacement. In total the EU new-car market has shrunk
every year since peaking at 16 million units in 2007, declining a further 8% to 12 million in 2013. This
negative trend is mainly attributed to the 2007-08 financial crisis that has led to a dramatic decline in
consumption. Industry analysts believe the industry will not see a return to pre-crisis sales before the end of
the decade. In view of this, some have advocated making capacity reductions. On the other hand, the three
premium German OEMs have managed throughout the crisis to avoid overall declines in their EU sales.
These OEMs have added shifts or shortened vacation periods at their European plants in recent years to
keep pace with strong demand for their models in countries such as China and the United States. While
global sales are projected to continue growing reaching almost 100 million in 2020, the EU share of global
car sales will decline because of the expanded share from developing countries such as China.
Figure 41 - Passenger car sales in EU27, 2009-201353
In the aftermath of the 2008 crisis, manufacturers proved unable to lower production as fast as sales
declined, leading to over-production. Moreover, the crisis increased the pressure on margins, also because
the strong competition in the EU market prevents manufacturers (in particular “volume” ones) from increasing
vehicle prices. To respond to the downturn generated by the crisis and to take advantage of existing
opportunities, EU manufacturers have:
further relocated part of their vehicle production for the EU in Central and Eastern Europe, as well as
outside the EU borders (e.g. Turkey);
53
Source: own elaboration on ACEA and National Associations data, EU27 + EFTA

Assessment of competitiveness impacts of post-2020 LDV CO2 regulation
Final Report Valdani Vicari & Associati (VVA), Technopolis Group (TG), Joint Institute for Innovation Policy (JIIP), TNO for DG CLIMA 229
increased their presence (in terms of sales and consequently production facilities) in emerging markets,
given that a substantial amount of future growth will come from extra-EU regions. Most European car
manufacturers have significantly invested in new capacity in emerging markets such as China, for
instance by opening car assembly plants.
Yet, Europe still holds a relevant role in the automotive industry as approximately one out of five cars are
produced and sold in Europe. At the same time, EU manufacturers face competition also within the EU as
Asian OEMs are expanding their market shares by introducing new products (e.g. Hyundai) or through
mergers and acquisitions (e.g. Tata).
In the light commercial vehicles segment, EU sales have dropped significantly over the last 6 years. New
LCV sales are correlated with business investments and retail activities by companies which, in turn, have
been affected by the economic downturn. As a result, sales in Europe have dropped from more than 2.2
million units in 2007 to 1.43 million units in 2013, an annual decrease of more than 7%.
Figure 42 - LCV sales in Europe, 2007-201354
EU manufacturers, which retain more than 74% of European LCV sales in terms of units, have been affected
differently, in line with the trends of their national economies. German manufacturers have suffered limited
sale decreases over the last 5 years (e.g. Volkswagen -10% and Daimler -17%), over the same time French
ones have faced larger drops (Renault -22% and PSA -24.5%), while Fiat has been affected the most of all
large EU manufacturers (-52%).
A2.1.4. Vehicles sales and production by groups of manufacturers
With more than 8 million passenger cars sold worldwide Toyota, including its premium brand Lexus and
Daihatsu, is the global market leader closely followed by General Motors and Volkswagen. The South
Korean OEM Hyundai has gained significant market shares in recent years (+7% in sales in 2012 compared
to 2011) mainly due to demand increases from Europe and North America. Worldwide, despite the fact that
EU and US players are still in leading positions, the centre of gravity is shifting towards the east with 12
54
Source: own elaboration on ACEA and National Associations data, EU27 + EFTA

Assessment of competitiveness impacts of post-2020 LDV CO2 regulation
Final Report Valdani Vicari & Associati (VVA), Technopolis Group (TG), Joint Institute for Innovation Policy (JIIP), TNO for DG CLIMA 230
Chinese, Indian and Russian groups in the top 30 manufacturers by units produced worldwide, along with 9
from Japan and Korea, against 6 from the EU and 3 from North America. An overview of the key EU and
worldwide figures for the Top 30 groups is provided below.
Table 28 - Top 30 groups: Europe sales and world production figures55
Group HQ
Country
Registra-tions of cars
Europe (units, 2013)
Registra-tions
Europe % change
last 5 years
Cars Europe
MKT SHARE (units, 2013)
Registrations of LCV Europe
(units, 2013)
Registra-tions
Europe LCV
% change last 5 years
LCV Europe MKT SHARE
(units, 2013)
World production
Cars (units, 2012)
Cars Produc-
tion Share
World production LCV (units,
2012)
LCV Produc-
tion Share
VOLKSWAGEN Germany 3,042,143 0.63% 24.7% 204,853 -9.89% 14.27% 8,576,964 13.00% 486,544 3.36%
TOYOTA Japan 543,115 -8.70% 4.4% 30,909 -50.62% 2.15% 8,381,968 12.71% 1,448,107 10.00%
HYUNDAI
(incl. KIA)
South
Korea 765,143 3.92% 6.2% 3,220 -73.62% 0.22% 6,761,074 10.25% 279,579 1.93%
GM US 964,865 -5.52% 7.8% 74,770 -46.26% 5.21% 6,608,567 10.02% 2,658,612 18.35%
HONDA Japan 138,703 -10.71% 1.1% 216 -76.85% 0.02% 4,078,376 6.18% 32,481 0.22%
NISSAN Japan 422,036 2.76% 3.4% 45,202 -32.39% 3.15% 3,830,954 5.81% 1,022,974 7.06%
FORD US 918,539 -6.67% 7.5% 166,683 -29.13% 11.61% 3,123,340 4.73% 2,394,221 16.53%
PSA France 1,342,410 -6.57% 10.9% 301,308 -24.49% 20.99% 2,554,059 3.87% 357,705 2.47%
SUZUKI Japan 152,099 -9.45% 1.2% 805 -58.59% 0.06% 2,483,721 3.77% 409,881 2.83%
RENAULT France 1,096,210 -4.06% 8.9% 230,066 -21.99% 16.03% 2,302,769 3.49% 373,457 2.58%
BMW Germany 794,693 2.33% 6.5% 1,734 -2.36% 0.12% 2,065,216 3.13% 261 0.00%
SAIC China n.a. n.a. n.a. n.a. n.a. n.a. 1,523,398 2.31% 190,848 1.32%
DAIMLER Germany 688,436 0.13% 5.6% 136,648 -16.81% 9.52% 1,455,650 2.21% 257,496 1.78%
FIAT Italy 740,565 -10.01% 6.0% 187,988 -51.82% 13.10% 1,501,979 2.28% 498,984 3.44%
MAZDA Japan 147,005 -6.95% 1.2% 260 0.02% 0.02% 1,097,661 1.66% 91,622 0.63%
MITSUBISHI Japan 81,267 -3.53% 0.7% 15,276 1.06% 1.06% 980,001 1.49% 127,435 0.88%
GEELY China n.a. n.a. n.a. n.a. n.a. n.a. 922,906 1.40% n.a. n.a.
CHANGAN China n.a. n.a. n.a. n.a. n.a. n.a. 835,334 1.27% 166,727 1.15%
TATA India n.a. n.a. n.a. n.a. n.a. n.a. 744,067 1.13% 314,399 2.17%
FUJI Japan 38,687 -2.23% 0.3% n.a. n.a. n.a. 734,959 1.11% 18,361 0.13%
CHRYSLER US 629 -58.42% 0.0% n.a. n.a. n.a. 656,892 1.00% 1,702,235 11.75%
AVTOVAZ Russia n.a. n.a. n.a. n.a. n.a. n.a. 553,232 0.84% n.a. n.a.
CHERY China n.a. n.a. n.a. n.a. n.a. n.a. 550,565 0.83% 13,386 0.09%
DONGFENG China n.a. n.a. n.a. n.a. n.a. n.a. 539,845 0.82% 245,641 1.70%
GREAT WALL China 464 n.a. 0.0% 1,038 0.07% 0.07% 487,704 0.74% 136,722 0.94%
FAW China n.a. n.a. n.a. n.a. n.a. n.a. 480,443 0.73% 52,983 0.37%
MAHINDRA India n.a. n.a. n.a. n.a. n.a. n.a. 429,101 0.65% 173,083 1.19%
BRILLIANCE China n.a. n.a. n.a. n.a. n.a. n.a. 231,527 0.35% 231,862 1.60%
BAIC China n.a. n.a. n.a. n.a. n.a. n.a. 83,033 0.13% 285,081 1.97%
ISUZU Japan n.a. n.a. n.a. n.a. n.a. n.a. n.a. n.a. 32,309 0.22%
EU OEMs in the top 30 7,704,457 -2.18% 62.58% 1,062,597 -24.95% 74.03% 18,456,637 28% 1,974,447 14%
Large EU OEMs (Volkswagen, PSA, Renault, Daimler, Fiat and BMW) retain significant shares of the EU
market, accounting for more than 62% of car sales and for 74% of the LCV market. The largest part of the
remaining market shares is held either by US based groups (with Ford and General Motors together
accounting for 15% of car sales and 17% of LCV sales) or by Japanese and Korean players. Toyota,
Hyundai, Nissan and other groups together hold 18.5% of EU cars and 6.5% of EU LCV sales. The rest of
the EU market is supplied mainly by smaller EU brands with players from other regions having substantially
55
Source: Own elaboration of ACEA and OICA data

Assessment of competitiveness impacts of post-2020 LDV CO2 regulation
Final Report Valdani Vicari & Associati (VVA), Technopolis Group (TG), Joint Institute for Innovation Policy (JIIP), TNO for DG CLIMA 231
failed to date to enter both the car and LCV markets without buying European Companies (e.g. Volvo being
now part of Geely and Jaguar Land-Rover now part of Tata).
The best-selling car models worldwide reflect to some degree the top OEMs. The table below shows the
situation in 2013. During that year, Ford's Focus sold approximately 1.1 million cars. One Chinese
manufacturer is included in this top 10, in line with the recent trend of emerging countries assuming an
increasingly central role in the automotive industry.
Figure 43 - Bestselling car models worldwide in 2012 (in 1,000s)56
A2.1.5. Differences among OEMs
Positioning
In the automotive industry, OEMs are usually segmented as “premium” or “volume” manufacturers. The
value proposition of “premium” brands relates to the provision of high performance technology, higher
quality equipment, improved comfort, stylish design, as well as other features that convey the idea of
prestige and high status. The value proposition of “volume” brands is based instead on value for money,
efficiency, “smartness” and reliability, often combined with a specific style which is meant to increase the
appeal of the vehicle to specific end user segments (e.g. young people, women).
For OEM groups, this distinction may become blurred as each manufacturer and brand competes on
different vehicle segments (e.g. mini, small, different “medium” rangers, luxury, sport, etc.) by offering
vehicles with very different positioning (as in the case of Fiat, offering both the Panda and the 500 in the mini
segment). Nonetheless, the average vehicle price by manufacturer and, to a lesser extent, their average
weight provide a clear indication of the differences between OEMs, as shown in the figure below.
56
Source: Statista

Assessment of competitiveness impacts of post-2020 LDV CO2 regulation
Final Report Valdani Vicari & Associati (VVA), Technopolis Group (TG), Joint Institute for Innovation Policy (JIIP), TNO for DG CLIMA 232
Figure 44 – Manufacturers active in the EU by average price and weight of passenger cars57
Seven groups (Ford, General Motors, Hyundai, Nissan, PSA, Renault and Toyota) out of the 12 considered
have a very similar positioning regarding price and weight, with average prices ranging from 19,200 to
22,500 Euro and average weight from 1680 to 1890 kg (the bubble size indicates the magnitude of yearly EU
sales). Thus, they are clustered in this study as “volume” manufacturers. In 2012 Fiat was an outlier in the
lower end of the market; however the positioning of the group has been changing thanks to the acquisition of
Chrysler and the change in brand strategy, which started focusing on models such as the 500 and the
Freemont.
The average pricing and weight of BMW, Daimler and Geely (Volvo) vehicles clearly show a different
positioning with respect to the majority of manufacturers – they are considered “premium” groups in the
study.
In the case of Volkswagen, the average pricing and weight can be better understood by analysing the
individual brands within the group. Figure 45 below shows that whereas the Volkswagen brand is positioned
on the (very) high end of the “volume” cluster, Skoda and Seat occupy lower-end positions within the same
cluster. In contrast Audi clearly shares a similar positioning with other premium groups (and brands).
The analysis at brand level shows that the Renault group can also be split into Renault (in the middle of the
“volume” cluster) and Dacia, which has an extremely aggressive positioning regarding price. In the figure
above, a further split is not provided for PSA (with brands Peugeot and Citroen) and General Motors (with
Opel and Vauxhall) due to the brands showing very similar characteristics.
57
Source: VVA elaboration based on ICCT data, year 2012

Assessment of competitiveness impacts of post-2020 LDV CO2 regulation
Final Report Valdani Vicari & Associati (VVA), Technopolis Group (TG), Joint Institute for Innovation Policy (JIIP), TNO for DG CLIMA 233
Figure 45 – Brands in the EU by average price and weight of passenger cars58
The distinction between premium and volume manufacturers is relevant to competitiveness impacts of CO2
legislation due to a characteristic of the automobile market described by interviewed OEMs: the product
innovation driven by CO2 legislation is more likely to meet user acceptance (and willingness to pay) by end
users of “premium” vehicles, as innovation is a key part of the selling proposition of vehicles. In contrast, end
users purchasing “volume” brand vehicles are less willing to pay a premium price for greener vehicles. This
issue has been reported by stakeholders to have a differential impact on the profitability of different OEMs
based on their positioning, also due to the fact that Europe is a very competitive market with low margins for
OEMs. While it is not possible in this study to compare directly the profitability in Europe of “premium” brands
or groups vis-à-vis “volume” ones59
, available data from a selection of OEMs confirms that the profitability of
the European market is currently the lowest among the regions covered, also an effect of the recession. In
2013, the EBIT of Fiat in EMEA was worth -520 EUR million, i.e. -3% of total revenues, vis-à-vis +5% in both
NAFTA and South America and +9% in the Asia-Pacific Region. General Motors showed somewhat similar
figures, with the EBIT being -4% of revenues in Europe, +8% in North America, +2% in South America and
+6% in Asia-Pacific60
.
Engine types in Europe
In the past decade, the EU has gradually become a “diesel market”, as opposed to other regional markets
where petrol is the main fuel for cars. The chart below depicts the share of cars sold by engine type in EU-
27, showing that the share of diesel car sales rose from 35% in 2001 to 55% in 2012. On the contrary, petrol
has progressively declined, whereas natural gas (in particular LPG) experienced a brief peak in 2009 and
2010, due to the combination of fiscal incentives by Member States such as Italy and strategic choices by
certain manufacturers (e.g. Fiat).
58
Source: VVA elaboration based on ICCT data, year 2012 59
Profitability is not detailed at regional level in the Yearly Financial Reports of premium groups 60
Source: Annual Reports of the Groups.

Assessment of competitiveness impacts of post-2020 LDV CO2 regulation
Final Report Valdani Vicari & Associati (VVA), Technopolis Group (TG), Joint Institute for Innovation Policy (JIIP), TNO for DG CLIMA 234
Figure 46 – Passenger cars sales in the EU by type of engine61
As confirmed by interviewed manufacturers, the choice of increasingly relying on diesel engines represents
one of the compliance mechanisms by OEMs in order to meet the targets of the current legislation. When
looking at the breakdown of sales by individual brands or groups, however, it is possible to observe
differences between OEMs, as shown in the figure below.
The figure below clearly shows that the brands of groups with EU headquarters (or sold recently to
international groups, such as Volvo) exhibit a higher share of diesel engine sales (Fiat is an exception due to
its choice to focus on natural gas for domestic reasons). Among them, the premium brands (e.g. Audi, BMW,
Mercedes-Benz and Volvo) are the ones focusing the most on diesel. In contrast, brands of non-EU groups
(Vauxhall, Opel, Hyundai, Kia, Toyota and to a lesser extent Nissan and Ford) tend to exhibit higher shares
of petrol engines. Within this group, Toyota and Ford both represent unique situations, due to their choices to
focus on hybrid propulsion and on the EcoBoost petrol engine respectively.
Figure 47 – Breakdown of EU 2012 Passenger cars sales by manufacturer and type of engine62
Such differences are mainly due to companies selling most of their vehicles in the EU having specific
competences in diesel engines, which, according to some of the interviewed stakeholders, currently
represents not only a key compliance mechanism with current CO2 legislation (in particular for premium and
heavier vehicles) but also a source of competitive advantage. Stakeholders remarked, in this sense, that the
61
Source: VVA elaboration based on ICCT data, year 2012 62
Source: VVA elaboration based on ICCT data, year 2012

Assessment of competitiveness impacts of post-2020 LDV CO2 regulation
Final Report Valdani Vicari & Associati (VVA), Technopolis Group (TG), Joint Institute for Innovation Policy (JIIP), TNO for DG CLIMA 235
Euro 6-2 legislation will reduce this advantage by raising the costs of diesel engines and thus contributing to
reducing their sales, in particular for the medium car segment and for the “non-premium” models.
Share of sales in the EU
All major OEMs can be considered as global companies, which serve several different regions in addition to
the one of their headquarters through local production facilities, sales and distribution channels.
Nevertheless, individual OEMs are influenced in their business by the distribution of their sales, with higher
shares in a given region/country increasing the possible impact of changes in its market, competitive,
economic and/or legislative scenario.
The table below presents the major groups in the world based on their share of sales in Europe. Companies
headquartered in France remain the most “European”, with almost 60% of their sales being in Europe in
2013. German-based groups all show a similar share of around 40% of European sales. Another
commonality among German groups is their progressive penetration of Asian markets, with 37% of
Volkswagen's sales being in Asia-Pacific, 29% of BMW’s and 25% of Daimler's (Mercedes-Benz only).
Table 29 – Share of European sales of major automotive groups63
Manufacturer HQ
Country % of sales in Europe
Total sales 2013
worldwide (x1000)
Manufacturer HQ
Country % of sales in Europe
Total sales 2013
worldwide (x1000)
Renault France 59% 2,125 Nissan Japan 14% 4,825
PSA France 58% 2,189 Tata India 11% 1,192
BMW Germany 44% 1,964 Suzuki Japan 13% 2857
Volkswagen Germany 43% 9,729 Toyota Japan 9% 8,871
Daimler (Mercedes-Benz)
Germany 41% 1,565 Hyundai Korea 9% 4,622
Fiat Italy 23% 4,330 Fuji Japan 6% 724
Mitsubishi Japan 23% 1,257 Honda Japan 4% 4,323
Geely (incl. Volvo cars)
China 23% 977 Isuzu Japan 4% 639
Ford US 21% 6,330 Dongfeng China 0% 2,567
General motors US 16% 9,715 Changan China 0% 2,120
Mazda Japan 16% 1331 Brilliance China 0% 207
63
Source: VVA analysis based on financial statements for the year 2013

Assessment of competitiveness impacts of post-2020 LDV CO2 regulation
Final Report Valdani Vicari & Associati (VVA), Technopolis Group (TG), Joint Institute for Innovation Policy (JIIP), TNO for DG CLIMA 236
Following the acquisition of Chrysler, the focus of Fiat's sales has shifted to the Americas and is similar to
Ford’s and General Motors’ (European sales between 16% and 23% and sales in the Americas between 50
and 70%). The remaining groups are Asian OEMs which are mainly active in Asia. Within this group,
Japanese OEMs exhibit on average higher EU shares of sales, whereas Chinese and Indian OEMs currently
only compete in Europe following the acquisition of European brands (as in the case of Tata with JLR and
Geely with Volvo). Nonetheless some Chinese groups record very large global sales (e.g. Dongfeng,
Changan) but do not currently sell their vehicles in Europe.
A2.1.6. The vehicle component sector
Automotive suppliers vary significantly in size and some of them are present in other businesses besides
automotive. These suppliers usually serve more than one OEM which makes them less dependent on the
performance of a single OEM. At the same time, OEMs do not depend on a single supplier and, in Europe
for example, around 50 component suppliers are typically involved in the manufacture of single model.
Table 30 - Main types of motor vehicle components
Component sub-division Components
Engine parts Pistons, piston rings, fuel delivery systems, engine valves, carburettors (largest components)
Electrical parts Starter motors, spark plugs, electric ignition systems (EIS), generators, distributors, voltage regulators, ignition coils, flywheel magnetos
Drive transmission and steering parts
Steering systems, gears, axles, wheels, clutches
Suspension and braking parts Leaf springs, shock absorbers, brakes, brake assemblies, brake lining
Equipment Switches, electric horns, headlights, halogen bulbs, wiper motors, dashboard instruments, other panel instruments
Others Sheet metal parts, pressure die castings, plastic moulded components, fan belts, hydraulic pneumatic equipment
The vehicle component sector is highly fragmented. Out of the ca. 20,000 companies belonging to NACE
code 29 in the EU-27 in 2011, almost nine out of ten were component and part manufacturers. However, in
recent years, consolidation has also started to take place among suppliers, which is leading to the creation of
mega-suppliers, leaving less space for small and regional suppliers. Mega-suppliers are able to provide local
support by building factories close to OEMs but they also have an international presence which gives them
the possibility to better mitigate regional recessions. These players are also better positioned to exploit the
automotive industry’s increasing use of global platforms64
. Among the automotive suppliers that can be
classified as mega-suppliers are companies such as Robert Bosch GmbH, the world’s biggest supplier with
USD 36.8 billion sales, Johnson Controls Inc. with USD 22.5 billion, and Yazaki Corp. with USD 15.8 billion
in 2012.
64
According to IHS Automotive, by 2019, global platforms will account for 74% of worldwide light vehicle production which may further push toward the creation of mega-suppliers.

Assessment of competitiveness impacts of post-2020 LDV CO2 regulation
Final Report Valdani Vicari & Associati (VVA), Technopolis Group (TG), Joint Institute for Innovation Policy (JIIP), TNO for DG CLIMA 237
Table 31 – TOP 10 global vehicle part and component suppliers65
Rank Company Nationality Sales (mln
USD)
North
America (%)
Europe
(%) Asia (%)
Rest of
world (%)
1 Robert Bosch GmbH Germany 36,787 17 52 27 4
2 Denso Corp. Japan 34,200 16 11 71 2
3 Continental AG Germany 32,800 21 50 25 4
4 Magna International Inc. Canada 30,428 53 40 - 7
5 Aisin Seiki Co. Japan 30,080 14 10 76 -
6 Johnson Controls Inc. USA 22,515 41 47 12 -
7 Faurecia France 22,500 27 56 10 7
8 Hyundai Mobis South Korea 21,351 22 11 67 -
9 ZF Friedrichshafen AG Germany 18,614 19 58 18 5
10 Yazaki Corp. Japan 15,801 22 - - -
Research and development is another key aspect for automotive suppliers as they represent a significant
source of innovation in the automotive industry. In particular, tier-one suppliers are playing an increasingly
prominent role in innovation and technological development. Moreover, the ongoing supplier consolidation
will give rise to stronger OEM-supplier relationships as the former are becoming more dependent on their
suppliers. This trend is not necessarily negative from the OEM standpoint as it means part of R&D expenses
is shifting from the OEMs to suppliers, allowing OEMs to learn from upstream partners and decrease costs
by leveraging on economies of scale for the component suppliers (in case their R&D are shared between
components supplied to different OEMs. There is ample literature showing that producers combining their
own critical expertise with that of their supply-chain partners may provide a competitive advantage66
. By
developing intense relationships based on mutual trust, both OEMs and suppliers can increase their
knowledge base and become more innovative. The figures below illustrate the described trends and
demonstrate that the development of vehicles and components is becoming an increasingly shared task
between OEMs and suppliers. In 2015, about 70% of R&D value creation will be generated by suppliers and
engineering service providers.
The importance of tier-one suppliers in innovation and product development will grow. For instance,
according to company sources, Bosch allocated 9% of its revenues in 2012 for all company-wide research.
These companies are already playing a larger role in innovation in the areas of power train, interior design,
and chassis components — historically the R&D domains of OEMs. In addition, the determinants for
differentiation are shifting toward connectivity and active-safety features, in which tier-one suppliers have
substantial expertise. The OEMs that construct the most effective collaboration models, encouraging and
rewarding supplier R&D investment, are likely to build a long-term advantage.
65
Source: own elaboration on Automotive News data 66
Flint, D. J., Larsson, E., & Gammelgaard, B. (2008). Exploring processes for customer value insights, supply chain learning and innovation: An international study. Journal of Business Logistics, 29 (1), 257–281. Paulraj, A., Lado, A. A., & Chen, I. J. (2008). Inter-organizational communication as a relational competency: Antecedents and performance outcomes in collaborative buyer-supplier relationships. Journal of Operations Management, 26, 45–64.

Assessment of competitiveness impacts of post-2020 LDV CO2 regulation
Final Report Valdani Vicari & Associati (VVA), Technopolis Group (TG), Joint Institute for Innovation Policy (JIIP), TNO for DG CLIMA 238
Figure 48 – Automotive R&D value creation in 2005 and 2015 (in billion euros)67
The EU-27 motor vehicle, trailer, and semi-trailer manufacturing sector generates EUR 141 billion of value
added almost 40% of which is by vehicle component manufacturers. The latest data available indicate that
the EU-27 motor vehicle, trailer, and semi-trailer manufacturing sector turnover was EUR 740.5 billion
around 30% of which was generated by vehicle component manufacturers. In terms of value added and
employment, the motor vehicle, trailer, and semi-trailer manufacturing sector was the fourth largest NACE
division in the EU 27 manufacturing sector (Section C), accounting for 7.2% of the manufacturing workforce
and 8.9% of manufacturing value added for the year 201068
.
Figure 49 – Value added and employment for different segments of the automotive manufacturing sector (% share)
69
67
Source: own elaboration on Oliver Wyman data 68
Eurostat 69
Source: own elaboration on Eurostat data

Assessment of competitiveness impacts of post-2020 LDV CO2 regulation
Final Report Valdani Vicari & Associati (VVA), Technopolis Group (TG), Joint Institute for Innovation Policy (JIIP), TNO for DG CLIMA 239
Table 32 – EU-27 market size indicators for different segments of the automotive manufacturing sector, 2008-2011
70
Faced with increasing pressure, component suppliers are implementing production outsourcing in the same
way as OEMs. A projection by PricewaterhouseCoopers suggests that in the future, only 20% of the demand
from German producers for components will come from Germany. This projection can be viewed as a
consequence of the increasing delocalisation of German suppliers. For instance, Bosch has built a new plant
in the western Chinese city of Chengdu, and plans to invest a further 100 million Euros there. By 2018, the
company intends to shift the production of starters and alternators from Hildesheim (Germany) to Miskolic
(Hungary). Headquartered in the United States, TRW Automotive Holdings Corp. has opened three new
plants in China (Shanghai, Qingdao, and Wuhan) reaching a total of twenty plants. These factories account
for 15% of TRW’s global sales which summed up to USD 14.1 billion in 2012. Another international supplier,
Johnson Controls, is also closing plants or reducing production in Germany while opening a new plant
located close to Daimler’s facility in Kecskemét (Hungary). The company will also open eleven new plants in
China, all close to international OEM plants. These developments are a sign of the changes underway in the
industry’s value chain that will be addressed in Section A2.8.
A2.2 Employment and labour productivity in the automotive industry
A2.2.1. Employment
The latest data available from OICA indicate that more than 8 million people worldwide were directly
employed in 2005 to make vehicles and their components, representing more than 5% of the world’s total
manufacturing employment. It is estimated that the total workforce related either directly or indirectly to the
automotive industry is more than 50 million.
In the EU, the data available on employees show a general equilibrium in the distribution of the workforce
among the three NACE 29 segments (Divisions 29.1, 29.2, and 29.3). There were more than 2 million people
70
Source: own elaboration on Eurostat data
Activity NACE code
2008 2009 2010 2011 2008 2009 2010 2011
Manufacture of motor
vehicles, trailers and semi-
trailers
29 800,000 625,003 740,587 n/a n/a 99,060 141,063 n/a
Manufacture of motor
vehicles29.1 569,798 n/a 526,000 n/a 79,893 60,000 90,000 n/a
Manufacture of bodies
(coachwork) for motor
vehicles; manufacture of
trailers and semi-trailers
29.2 38,944 25,000 25,300 n/a 9,111 6,000 6,600 n/a
Manufacture of parts and
accessories for motor
vehicles
29.3 200,000 152,258 188,803 215,346 50,000 35,525 45,965 50,884
Manufacture of electrical and
electronic equipment for motor
vehicles
29.31 23,335 19,907 23,707 25,652 4,833 5,545 5,839 5,839
Manufacture of other parts and
accessories for motor vehicles29.32 176,665 132,351 165,096 189,694 41,257 30,692 40,420 45,045
Manufacture of rubber tyres
and tubes; retreading and
rebuilding of rubber tyres
22.11 37,156 29,867 38,268 46,251 n/a n/a n/a n/a
Turnover (EUR million) Value added (EUR million)

Assessment of competitiveness impacts of post-2020 LDV CO2 regulation
Final Report Valdani Vicari & Associati (VVA), Technopolis Group (TG), Joint Institute for Innovation Policy (JIIP), TNO for DG CLIMA 240
employed in the EU-27’s motor vehicle, trailer, and semi-trailer manufacturing sector, almost half of which
were employed in the manufacture of parts and accessories for motor vehicles.
Table 33 – EU-27 indicators for different segments of automotive manufacturing71
Key categories of employees according to skill include mechanics, electricians, engineers, IT expert,
together with sales and marketing specialists and product managers, accountants, business and financial
specialists.
In terms of geographical spread Germany alone accounts for 36% of the total employment generated by the
manufacture of motor vehicles (including both vehicles and parts), with more than 800,000 people
employed. Other large EU Member States each account for 6 to 10%.
Figure 50 – EU employment in the manufacture of motor vehicles, 201272
71
Source: own elaboration on Eurostat data 72
Source: own elaboration of Eurostat data “Number of persons employed - Manufacture of motor vehicles, trailers and semi-trailers”. Data for France and Ireland refers to 2011
Activity NACE code
2008 2009 2010 2011 2008 2009 2010 2011
Manufacture of motor
vehicles, trailers and semi-
trailers
29 21,029 19,720 20,525 20,000 2,400 2,196 2,153 n/a
Manufacture of motor
vehicles29.1 2,070 2,260 2,300 5,200 1,070 1,029 1,000 n/a
Manufacture of bodies
(coachwork) for motor
vehicles; manufacture of
trailers and semi-trailers
29.2 7,559 7,100 7,670 7,400 200 169 154 n/a
Manufacture of parts and
accessories for motor
vehicles
29.3 11,400 10,500 10,595 10,400 1,137 999 1,001 1,051
Manufacture of electrical and
electronic equipment for motor
vehicles
29.31 1,857 1,714 1,694 1,687 234 197 193 200
Manufacture of other parts and
accessories for motor vehicles29.32 9,543 8,786 8,901 8,713 903 802 808 852
Manufacture of rubber tyres
and tubes; retreading and
rebuilding of rubber tyres
22.11 1,806 1,641 1,747 1,699 n/a n/a 125 n/a
Number of enterprises Employees (in thousands)

Assessment of competitiveness impacts of post-2020 LDV CO2 regulation
Final Report Valdani Vicari & Associati (VVA), Technopolis Group (TG), Joint Institute for Innovation Policy (JIIP), TNO for DG CLIMA 241
Before the crisis, there had been a trend of increasing employment, especially in new Member States. The
decline in demand and production since mid-2008 and the resulting restructuring of the industry have
brought a significant number of job cuts, hitting, among others, the United Kingdom (-42% in 2011), France
and Spain (-20% and -19%), Hungary (-13%) and Italy (-7%) all compared to 2007. In the same period,
some Central and Eastern European countries experienced a steady growth, including Bulgaria (+54%),
Slovakia (+20%) and Romania (+18%). In 2012, figures improved slightly with Central and Eastern European
countries continuing their growth, Germany growing quite significantly (+4%) and Member States hit the most
by the crisis remaining at 2011 levels.
Focusing only on the employment in the manufacture of parts and accessories for motor vehicles, the EU
workforce is more distributed across Member States than the direct one. Germany still accounts for the
majority of the total (25%, vis-à-vis 36% of direct employment), whereas Central European countries such as
Romania and Poland account for around 10% of indirect employment, whereas Italy, Spain, France and the
UK retain between 9% and 4%. Even though data is not available for all Member States, overall trends
suggest that, after strong decreases due to the economic downturn in 2007-2008, employment has slowly
recovered in the following years. As for direct employment, the decrease in employment in Western
European countries has been compensated by the growth in Central and Eastern European Member States.
Figure 51 - EU employment in the manufacture of parts and accessories for motor vehicles, 201273
Similarly to the situation in the EU, in other countries automotive employees also represent a significant
share of the total workforce. In Japan, according to the Japanese Automotive Manufacturers Association
(JAMA), auto-related employment amounts to 5.48 million people, equal to 8.8% of the country’s workforce.
After a period of downturn following the 2008 crisis, employment in the US automotive industry is growing
again. Data from the Bureau of Labour Statistics (BLS) show motor vehicle and part manufacturing
employment to be at its highest in over four years, reaching 789,800 in March 2013. Combining vehicle
production, sales, repair and vehicle maintenance, auto-related workforce reaches a total 4.7 million jobs.
73
Source: own elaboration of Eurostat data “Manufacture of parts and accessories for motor vehicles”. Data for France, United Kingdom and Ireland refers to 2011

Assessment of competitiveness impacts of post-2020 LDV CO2 regulation
Final Report Valdani Vicari & Associati (VVA), Technopolis Group (TG), Joint Institute for Innovation Policy (JIIP), TNO for DG CLIMA 242
A2.2.2. Labour productivity
Labour costs and labour productivity represent an important aspect of an industry’s ability to remain
effective. Increased competition is pushing car producers to aggressively pursue cost optimisation. Since
competition is particularly intense for small-sized cars, producers of lower segment cars have moved, or are
moving, a great part of their production to countries with lower production costs. On the contrary, premium
segment cars are still largely assembled on traditional sites. The new facilities for volume segment cars have
been built with the latest technology, making these sites attractive for both lower labour costs and
productivity reasons.
The fact that the cost of components are influenced by a series of specific factors (degree of automation of
plants, efficiency and production competences of the manufacturer, type of vehicle produced, labour
productivity based on skills, etc.) makes it extremely difficult to compare the different impacts of labour costs
on vehicles.
As a rough estimation based on existing literature, however, suggests that around 25 to 40 hours of work are
necessary per vehicle to produce a subcompact car, some hypotheses can be made, as reported in the table
below. Under the hypotheses formulated above, mid-range vehicles produced in Turkey have a labour cost
lower by 550 to 1,000 Euro than the average cost in western countries. Also Central and Eastern European
countries also show significantly lower figures.
Table 34 – Automotive manufacturing: labour productivity by country74
Estimated labour costs
Germany Belgium Austria Denmark France Italy United
Kingdom Spain Estonia Hungary Poland Turkey
Subcompact cars
€ 1,194 € 1,184 € 931 € 887 € 857 € 746 € 708 € 651 € 228 € 220 € 192 € 91
The hypotheses formulated above have been confirmed by stakeholders within the panel of OEMs that have
commented on labour cost figures. Focusing on the latter, important differences exist between countries
within the same region for all the major markets. In the EU, countries such as Poland, Slovakia and Hungary
offer personnel costs 5 times lower than West European countries such as Germany, France and Italy.
Hungary still offers relatively low wages on all hierarchy levels, particularly in the blue-collar sectors. In
addition to Central and Eastern European countries, Turkey is extremely competitive in terms of labour costs
– this is one of the reasons leading many OEMs (Ford, Toyota, Fiat, Hyundai among others) to invest in
production facilities in Turkey.
Similar trends can be observed both in North America and Asia. In Mexico, General Motors, Ford, Fiat,
Toyota and Volkswagen, to name a few, have established production facilities serving the internal market,
North America and increasingly South America, thanks to the favourable combination of skills, low labour
costs and growing economy. In Asia, at the start of the last decade China had an extremely competitive
market in terms of labour costs, which were ten times lower than Japanese and Korean ones. However,
since the mid-2000s’ the booming economy has led to wages increasing by 20% or more every year,
74
Source: own elaboration of VVA

Assessment of competitiveness impacts of post-2020 LDV CO2 regulation
Final Report Valdani Vicari & Associati (VVA), Technopolis Group (TG), Joint Institute for Innovation Policy (JIIP), TNO for DG CLIMA 243
resulting in a partial loss of competitiveness to countries such as Vietnam and India. The labour costs for a
selection of countries are provided below.
Table 35 – Automotive manufacturing labour costs75
Automotive manufacturing labour costs (US $ per hour)
2008 2009 2010 2011 2012
Austria 48.07 49.43 43.16 47.95 46.05
Belgium NA 59.44 57.42 61.72 58.52
Denmark 45.16 44.12 43.45 44.82 43.87
Estonia NA 12.00 10.25 11.44 11.29
France 44.97 43.16 41.70 44.86 42.36
Germany 59.46 57.30 54.35 60.42 59.04
Greece 28.44 NA NA NA NA
Hungary 11.51 10.26 9.73 10.88 10.87
Ireland 30.89 NA NA NA NA
Italy 37.93 37.03 36.26 39.00 36.88
Netherlands 42.33 NA NA NA NA
Poland 10.67 8.68 9.34 9.90 9.49
Slovakia 11.65 12.53 11.27 12.60 NA
Spain 34.42 34.33 32.90 34.51 32.19
United Kingdom 37.33 32.86 32.71 34.87 35.00
Turkey
2.98
4.50
United States 37.36 38.10 37.35 37.90 37.38
Mexico 8.70 8.01 7.96 8.16 7.79
Brazil 14.50 13.98 16.89 20.01 18.80
Japan 32.82 35.66 37.21 42.37 41.65
Korea, Republic of 20.83 18.79 23.67 23.26 25.87
Taiwan 9.54 8.60 8.78 9.89 10.20
China NA NA 4.02 NA 6.91
India NA NA NA NA 3.10
Australia 36.76 35.05 42.73 51.67 54.34
New Zealand 21.46 19.72 23.40 25.99 27.97
Labour costs are only a partial indicator of a country’s attractiveness, as the most relevant indicator behind
the choice of an OEM on a manufacturing location is labour productivity. In the EU, Germany’s automotive
workforce remains the largest by far due to its productivity and skills, despite its high hourly cost: nearly 80%
of the workforce has formal vocational training or an academic degree thanks to its unique dual education
system76
. Labour productivity is also high in countries such as Hungary, which has been praised for the
qualification level of its workforce. This has been one of the factors mentioned by Daimler behind the
decision to use Hungary as a production base. Looking at EU labour productivity figures (table below), it is
evident that the distances between West and East (and Central) European countries are smaller than what
emerges solely from a comparison of personnel costs.
75
Source: own elaboration of US Bureau of Labor Statistics, HRBS Manufacturing Labour Cost Survey 2012, EY’s surveys on country attractiveness (India and Turkey), IHS 76 Pricewaterhouse Coopers (2013). Automobiles: the economic system and employment situation.
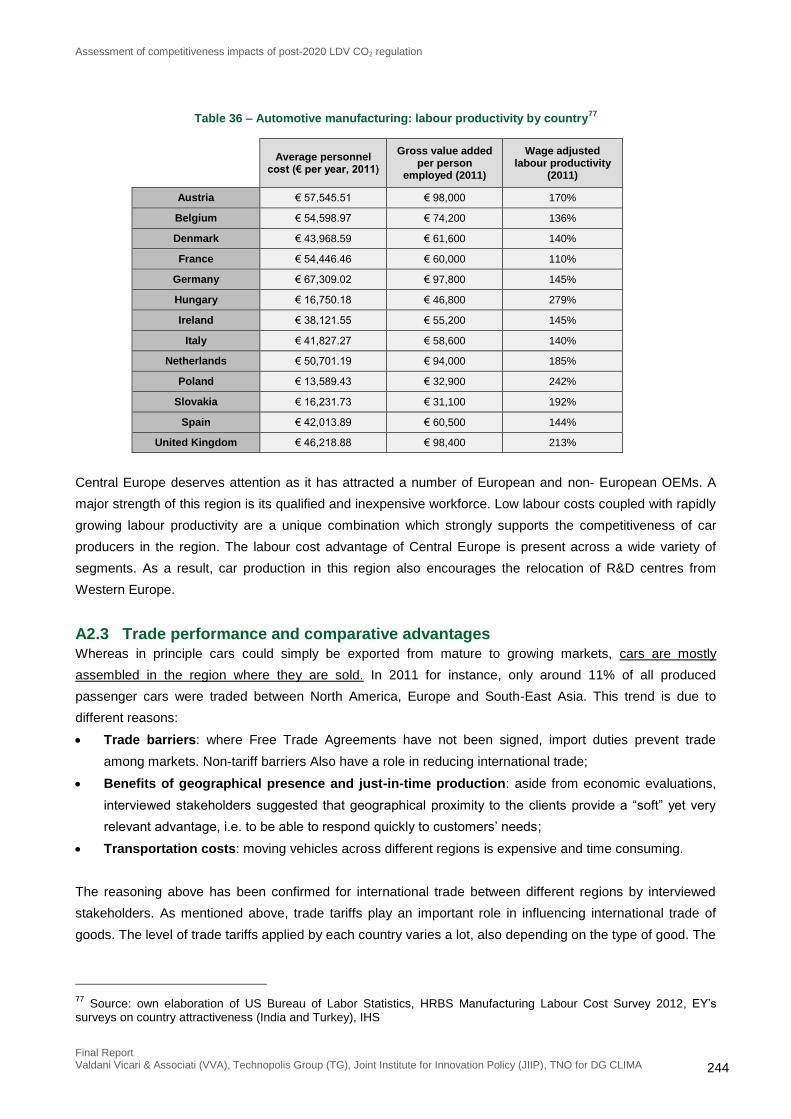
Assessment of competitiveness impacts of post-2020 LDV CO2 regulation
Final Report Valdani Vicari & Associati (VVA), Technopolis Group (TG), Joint Institute for Innovation Policy (JIIP), TNO for DG CLIMA 244
Table 36 – Automotive manufacturing: labour productivity by country77
Average personnel cost (€ per year, 2011)
Gross value added per person
employed (2011)
Wage adjusted labour productivity
(2011)
Austria € 57,545.51 € 98,000 170%
Belgium € 54,598.97 € 74,200 136%
Denmark € 43,968.59 € 61,600 140%
France € 54,446.46 € 60,000 110%
Germany € 67,309.02 € 97,800 145%
Hungary € 16,750.18 € 46,800 279%
Ireland € 38,121.55 € 55,200 145%
Italy € 41,827.27 € 58,600 140%
Netherlands € 50,701.19 € 94,000 185%
Poland € 13,589.43 € 32,900 242%
Slovakia € 16,231.73 € 31,100 192%
Spain € 42,013.89 € 60,500 144%
United Kingdom € 46,218.88 € 98,400 213%
Central Europe deserves attention as it has attracted a number of European and non- European OEMs. A
major strength of this region is its qualified and inexpensive workforce. Low labour costs coupled with rapidly
growing labour productivity are a unique combination which strongly supports the competitiveness of car
producers in the region. The labour cost advantage of Central Europe is present across a wide variety of
segments. As a result, car production in this region also encourages the relocation of R&D centres from
Western Europe.
A2.3 Trade performance and comparative advantages
Whereas in principle cars could simply be exported from mature to growing markets, cars are mostly
assembled in the region where they are sold. In 2011 for instance, only around 11% of all produced
passenger cars were traded between North America, Europe and South-East Asia. This trend is due to
different reasons:
Trade barriers: where Free Trade Agreements have not been signed, import duties prevent trade
among markets. Non-tariff barriers Also have a role in reducing international trade;
Benefits of geographical presence and just-in-time production: aside from economic evaluations,
interviewed stakeholders suggested that geographical proximity to the clients provide a “soft” yet very
relevant advantage, i.e. to be able to respond quickly to customers’ needs;
Transportation costs: moving vehicles across different regions is expensive and time consuming.
The reasoning above has been confirmed for international trade between different regions by interviewed
stakeholders. As mentioned above, trade tariffs play an important role in influencing international trade of
goods. The level of trade tariffs applied by each country varies a lot, also depending on the type of good. The
77
Source: own elaboration of US Bureau of Labor Statistics, HRBS Manufacturing Labour Cost Survey 2012, EY’s surveys on country attractiveness (India and Turkey), IHS

Assessment of competitiveness impacts of post-2020 LDV CO2 regulation
Final Report Valdani Vicari & Associati (VVA), Technopolis Group (TG), Joint Institute for Innovation Policy (JIIP), TNO for DG CLIMA 245
tariffs for the most recent available years for a selection of countries and goods (i.e. cars code HS8703, light
commercial vehicles 870421, 31 and 90 and components 8708) are provided in the table below.
It can be noted that also non-tariff barriers (NTBs) have a significant role in reducing or hampering
international trade. These include, for example, anti-dumping measures and countervailing duties. NTBs
have increasingly been applied following the reduction of trade tariff levels by WTO activities and rules.
Table 37 – Overview of trade tariffs78
Average of Ad Valorem Duties (%)
Reporter Year HS 8703 HS 870421, 870431 and
870490 HS8708
Brazil 2012 35 35 15.35
Canada 2013 5.8 5.1 3.4
China 2011 25 25 9.8
EU Union 2013 9.7 12.3 3.8
India 2013 100 7 10
Japan 2013 0 0 0
Korea, Republic of 2013 8 10 8
Mexico 2012 31.3 20 1
Russian Federation 2012 1.7 20 2
Turkey 2011 9.7 12.3 3.8
USA 2013 2.5 25 1.3
Figure 52 - Flows of passenger cars in % of world production, 201179
The result of these factors is that a large share of cars is typically produced in the region where they are
sold, as shown in the figure below. Roughly 82% of all cars manufactured in Europe are sold in Europe, with
9% exported to Asia and a similar share to Central and North America. Of all cars sold in Europe, 86% are
manufactured in Europe, 9.5% in Asia and the rest in Central and North America. Trade from and to Asia
exhibits similar figures to the European ones, whereas in Central and North America imports have a more
78
Source: WTO, Integrated Database (IDB) notifications. Most Favourable Nation applied tariffs 79
Source: OECD (2013)

Assessment of competitiveness impacts of post-2020 LDV CO2 regulation
Final Report Valdani Vicari & Associati (VVA), Technopolis Group (TG), Joint Institute for Innovation Policy (JIIP), TNO for DG CLIMA 246
prominent role. In 2011, 73.5% of cars sold in Central and North America were produced regionally, whereas
16% and 10.5% were imported respectively from Asia and Europe.
Trades within the same region are a common practice, when enabled by favourable combinations of
geographical proximity, offset in labour costs and absence of trade barriers (as in the case of EFTA,
Customs Union, NAFTA etc.). One interviewee reported shipping costs from Turkey to Germany to be
around 300 Euro per vehicle, vis-à-vis savings in production costs in the order of 1,000 euros. Shipping from
Asia to EU is reported to cost around 900 Euro per car.
A2.3.1. Free trade agreements
Where they are considered to be mutually beneficial, bilateral or regional Free Trade Agreements involving
or excluding specific groups of goods are signed. The FTAs can have a significant impact on increasing the
intensity of international trade, as exemplified by the recently signed FTA (Free Trade Agreement) with
South Korea. According to the Annual Report on the Implementation of the EU-Korea Free Trade Agreement
issued by the EU Commission in February 2014, EU exports of cars to Korea increased by 40 % in value
and 38 % in units, compared to the year before the FTA was provisionally applied (i.e. two years before), as
compared with an increase of 24% in value and 25% in units worldwide. Likewise, imports of cars from Korea
increased by 53 % in value and by 36 % in units80
. The data suggest that FTAs can provide significant
opportunities for EU exports, at the expense of increased internal competition, leading to the need of
carefully considering advantages and drawbacks of FTAs on a case-by-case basis.
At the present stage, the EU has the following FTAs in place81
:
Central America (Costa Rica, El Salvador, Guatemala, Honduras, Nicaragua and Panama);
Colombia and Peru;
South Korea;
Mexico (Comprehensive Free Trade Agreement);
Economic Partnership Agreements with the Caribbean (fifteen CARIFORUM states), the Pacific (Papua
New Guinea) and Eastern and Southern Africa (Zimbabwe, Mauritius, Madagascar, the Seychelles);
South Africa (Trade, Development and Co-operation Agreement);
Chile (Free Trade Agreement).
Moreover, FTAs are a core component of Association Agreements as well as Customs Unions (Andorra,
San Marino, and Turkey). Hence the EU also has free trade deals in force with a number of countries in
Europe (Faroe Islands, Norway, Iceland, Switzerland, the former Yugoslav Republic of Macedonia, Albania,
Montenegro, Bosnia and Herzegovina, Serbia) and the Southern Mediterranean (Algeria, Egypt, Israel,
Jordan, Lebanon, Morocco, Palestinian Authority, Syria, Tunisia) and three with African, Caribbean and
Pacific countries (Caribbean, Pacific and Eastern and Southern Africa).
80
Source: European Commission, Annual Report on the Implementation of the EU-Korea Free Trade Agreement, February 2014 81
Source: AALEP

Assessment of competitiveness impacts of post-2020 LDV CO2 regulation
Final Report Valdani Vicari & Associati (VVA), Technopolis Group (TG), Joint Institute for Innovation Policy (JIIP), TNO for DG CLIMA 247
A series of FTAs are finished but not yet being applied. These include:
Eastern Neighbourhood – Deep and Comprehensive Free Trade Area (DCFTA) with Moldova, and
Georgia. Ukraine
Singapore – Free Trade Agreement (FTA)
Five interim Economic Partnership Agreements with Cote d'Ivoire, Central Africa (Cameroon), the
Southern African Development Community, Ghana and the East African Community.
On-Going Negotiations include:
United States of America (The Transatlantic Trade and Investment Partnership (TTIP)
Agreement on investment with China
Canada (Comprehensive Economic and Trade Agreement (CETA)
Japan (Free Trade Agreement)
Association of Southeast Asian Nations (ASEAN): Malaysia, Vietnam and Thailand;
Southern Mediterranean: Deep and Comprehensive Free Trade Agreement (DCFTA) with Morocco.
The Commission has a mandate to start a similar process with Tunisia, Egypt and Jordan.
India (Free Trade Agreement)
Mercosur (EU-Mercosur Association Agreement)
African, Caribbean and Pacific countries (ACP) – Economic Partnership Agreements (EPAs)
Of particular interest is the situation with Japan. EU-Japan FTA negotiations are ongoing for both vehicles
and components – the EU does not envisage any exclusions. The negotiation involves both tariffs and NTBs:
Tariffs: Japan has 0% tariffs on cars and most of the components. The EU has 10% duty on cars and
Japan's objective is to eliminate this duty;
On NTBs the objective of the EU is to encourage Japan to adopt and comply with the international
(UNECE) standards. The EU has issued a list of NTBs some of which are related to cars. Several of the
NTBs were already resolved during the first year of negotiations. A second list of NTBs is expected to
be submitted in autumn 2014. Additionally, and in parallel with the discussions on specific NTBs, the EU
has submitted to Japan an automotive annex which focuses on the elimination of NTBs and introduces
mechanisms to prevent new NTBS from emerging.
A2.3.2. Trade performance of the European automotive industry
In spite of the barriers to trade caused by logistics costs and import tariffs, the European automotive industry
is a global player delivering quality ‘Made in Europe’ products worldwide. The automotive sector contributes
positively to the EU trade balance with trade surplus in the order of 100 billion euros when considering
vehicle manufacturing (passenger cars and LCVs) and vehicle components82
.
Cars account for the large majority of this surplus. The trade balance of cars with the main trade partners,
shown in table 13, (NAFTA countries, EFTA countries, Middle East countries including Turkey, Russia,
Korea, Japan, China and India) was positive and worth more than USD 81 million, a 34.5% growth compared
to 2011.
82
Data based on UN COM trade statistics, year 2012

Assessment of competitiveness impacts of post-2020 LDV CO2 regulation
Final Report Valdani Vicari & Associati (VVA), Technopolis Group (TG), Joint Institute for Innovation Policy (JIIP), TNO for DG CLIMA 248
Whereas the highest positive overall trade balances are with NAFTA, China, Russia and EFTA, high values
of exports were also recorded for Japan and Turkey (respectively USD 8 million and USD 6 million).
Table 38 - EU-27 Balance of cars trade flows by area (USD million)83
Partner 2012 2011
NAFTA $26,909 $18,916
EFTA $13,153 $12,381
Middle East $7,758 $5,859
Russian Federation $11,269 $8,868
Republic of Korea -$1,806 -$2,287
Japan $746 -$2,825
China $24,322 $21,322
India -$1,078 -$1,880
TOTAL Main Partners $81,272 $60,354
Trade flows are different for light commercial vehicles. The magnitude of LCV trade flows is much lower
than for passenger cars (both in absolute and relative terms). In 2012 car exports from the EU to key trade
partners accounted for USD 110 billion and imports for USD 29 billion while both exports and imports of
LCVs were worth around USD 3 billion.
The overall EU LCV trade balance was almost neutral (+USD 50 million) in 2012 and slightly negative in
2011 (-USD 1 billion). The main determinant of this are trade flows with Turkey, as imports from the country
to the EU accounted for USD 3.5 billion in 2012 and USD 2.9 billion in 2011, against exports worth around
USD 670 million in both these years.
Table 39 - EU-27 Balance of LCVs trade flows by area (USD million Dollars)84
Partner 2012 2011
NAFTA $355 $265
EFTA $1,033 $1,034
Middle East -$2,037 -$2,737
Russian Federation $751 $553
Republic of Korea -$23 -$27
Japan -$27 -$193
China $2 $35
India -$6 -$12
TOTAL Main Partners $50 -$1,082
For components that can be associated with CO2 reduction85
, the EU recorded a positive trade balance in
both 2012 and 2011 (respectively worth around USD 20 billion and USD 15 billion). EU Member States
83
Source: Internal elaboration based on UN COMtrade statistics. The total can differ from the sum of rows due to rounding 84
Source: Internal elaboration based on UN COMtrade statistics. Note: Harmonized System Codes 870421, 870431 and 870490 were considered. Calculation of trade flows is lightly overestimated, as Harmonized System Codes do not perfectly match vehicles in scope of EU CO2 legislation in terms of weight. The total can differ from the sum of rows due to rounding.

Assessment of competitiveness impacts of post-2020 LDV CO2 regulation
Final Report Valdani Vicari & Associati (VVA), Technopolis Group (TG), Joint Institute for Innovation Policy (JIIP), TNO for DG CLIMA 249
exhibit the most relevant positive trade balances with NAFTA countries and China. The only trade partner
with significant net imports for the EU is Japan (yearly exports to Japan account for around USD 1 billion,
whereas imports are worth USD 5 billion).
Table 40 - EU-27 Balance of CO2-related components trade flows by area (USD million)86
Partner 2012 2011
NAFTA $10,688 $8,080
EFTA -$10 -$125
Middle East $2,662 $2,942
Russian Federation $3,994 $3,333
Republic of Korea -$193 -$87
Japan -$3,893 -$4,058
China $6,007 $4,692
India $476 $403
TOTAL Main Partners $19,732 $15,180
Comparative advantages
An examination of the competitiveness of the EU automotive industry using the Revealed Comparative
Advantage is provided below. The revealed comparative advantage coefficient presented below is the simple
Balassa index, which is the ratio of the proportion of the exports of a certain good in the total EU exports to
the proportion of the world exports of the same good in the total world exports. An index value above one
designates a comparative advantage (or export specialisation) in the commodity in question. An index value
close to zero means a lack of comparative advantage in this commodity.
Table 41 - The revealed comparative advantage coefficient in passenger vehicles
2012 2011
EU-27 1.71 1.69
Japan 3.26 2.93
Rep. of Korea 2.07 2.04
Turkey 1.06 1.33
USA 0.94 0.90
India 0.39 0.33
Canada 2.77 2.44
China 0.06 0.05
Mexico 2.10 2.12
Russian Federation 0.05 0.03
Note: The Balassa RCA index.
85
Calculations consider both components that can be enhanced to reduce emissions and components whole sales might be influenced by CO2 legislation. These include the following Harmonised System codes: 840733, 840734, 840820, 840991, 840999, 870840, 870850, 870870, 870892, 870893 and 870894. The total can differ from the sum of rows due to rounding. 86
Source: Internal elaboration based on UN COM trade statistics. The total can differ from the sum of rows due to rounding.

Assessment of competitiveness impacts of post-2020 LDV CO2 regulation
Final Report Valdani Vicari & Associati (VVA), Technopolis Group (TG), Joint Institute for Innovation Policy (JIIP), TNO for DG CLIMA 250
Table 42 - The revealed comparative advantage coefficient in light commercial vehicles
2012 2011
EU-27 0.68 0.67
Canada 0.10 0.05
China 0.18 0.18
Japan 0.95 0.96
Mexico 7.51 7.19
Norway 0.01 0.01
Rep. of Korea 0.92 1.02
Russian Federation 0.07 0.04
Switzerland 0.03 0.03
Turkey 5.09 7.61
Note: The Balassa RCA index.
We, again, observe a strong export specialisation of the EU in passenger vehicles. This table is comparable
with the table on net exports above. However, Japan, Korea, Canada and Mexico are even more specialised
in light commercial vehicles. Mexico’s strong export specialization emerged from the maquiladora industry,
which fostered the relocation of the U.S. auto plants into Mexico, especially after the conclusion of NAFTA in
1994.
In light commercial vehicles, the EU does not have a comparative advantage, which is consistent with the
unstable EU trade position in light commercial vehicles. Mexico (again) and Turkey appear strongly
specialised in this export.
The EU specialises in the export of automotive components. Mexico and Japan possess an even higher
comparative advantage than the EU while Turkey and the U.S. exhibit an export specialisation slightly below
the level of the EU:
Table 43 - The revealed comparative advantage coefficient in automotive components
2012 2011
EU-27 1.35 1.36
China 0.46 0.47
India 0.30 0.30
Japan 3.25 3.06
Mexico 2.55 2.52
Rep. of Korea 1.00 0.80
Russian Federation 0.09 0.03
Switzerland 0.26 0.26
Turkey 1.22 1.42
USA 1.15 1.12
Note: The Balassa RCA index.

Assessment of competitiveness impacts of post-2020 LDV CO2 regulation
Final Report Valdani Vicari & Associati (VVA), Technopolis Group (TG), Joint Institute for Innovation Policy (JIIP), TNO for DG CLIMA 251
A2.4 Cost of capital and financial indicators As analysed in the Impact Assessment on the modalities to achieve the 2020 targets, the implementation of
the legislation does not directly affect the financial sector, however indirect impacts could take place in case
of significant increases in the need for investment capital by OEMs, their suppliers and other affected
sectors. For OEMs, these increases might be caused by the investments in developing and manufacturing
innovative technologies required in order to fill the gap between the current average CO2 emissions and the
target. Supplier investments would be a consequence of the demand for enhanced or alternative
components from OEMs.
The relevance of these impacts post-2020 depends on the level of ambition: if the target leads OEMs to
invest heavily in alternative technologies (e.g. electric, plug-in hybrid or fuel cell vehicles), this might lead to a
restructuring of the industry. The resulting uncertainty could increase the risk faced by financial institutions in
providing capital, and eventually the cost of capital for automotive manufacturers and other affected sectors.
In this framework, competitiveness impacts (related to the cost dimension) result from different levels of the
cost of capital for companies. At the beginning of 2014 the cost of capital for European OEMs was reported
to be on average slightly lower than that of non-European competitors. This is mainly due to the combined
effect of low after-tax costs of debt (3.24%) and high shares of debt over capital. The key figures of the car
and commercial vehicle sectors are provided in the table below.
Table 44 - Cost of capital of the automotive sector87
Area Cost of
Equity E/(D+E)
After-tax
Cost of Debt D/(D+E)
Cost of
Capital
Europe 12.97% 42.85% 3.24% 57.15% 7.41%
United States 9.42% 50.62% 6.71% 49.38% 8.08%
Japan 12.09% 57.11% 3.08% 42.89% 8.23%
China 10.63% 90.12% 3.38% 9.88% 9.92%
India 17.53% 78.62% 4.34% 21.38% 14.71%
Global 11.15% 55.59% 5.11% 44.41% 8.47%
As the sector is extremely concentrated, the average figures reported below depend on the cost of debts and
the cost of equity of a restricted number of players. The cost of debt depends largely on the financial stability
and the outlook of a company, which are summarised by their credit rating. The table below shows the (long-
term) Standard & Poor’s credit rating for of a selection of OEMs.
The cost of equity reflects the return an OEM pays equity investors, i.e. shareholders, to compensate for the
risk they undertake in investing their capital. It has more complex components than the cost of debt since, for
each company, it depends on the increase of the firm market value as well as on the dividend payments
made.
87
Source: Damodaran based on S&P Capital IQ data, January 2014

Assessment of competitiveness impacts of post-2020 LDV CO2 regulation
Final Report Valdani Vicari & Associati (VVA), Technopolis Group (TG), Joint Institute for Innovation Policy (JIIP), TNO for DG CLIMA 252
Table 45 – Long-term Credit rating of a selection of OEMs
Group or company Headquarters Long-term credit
rating88
Estimated spread
89
BMW Germany A+ 0.85%
DAIMLER Germany A- 1.30%
VOLKSWAGEN Germany A 1.00%
PEUGEOT France B+ 5.50%
RENAULT France BB+ 3.00%
FIAT (EXOR Spa) Italy BBB+ Slightly lower than 2%
TOYOTA Japan AA- 0.70%
GM United States BBB- Slightly higher than 2%
FORD United States BBB- Slightly higher than 2%
HYUNDAI (incl. KIA) South Korea BBB+ Slightly lower than 20%
NISSAN Japan A- 1.30%
HONDA Japan A+ 0.85%
TATA India BB 4.00%
GEELY China BB+ 3.00%
European automotive suppliers face higher costs of capital than non-EU competitors (11.77% against an
average of 9.49%). The reasons behind this are a) the higher cost of equity for European firms (14% returns
against around 10% both globally and in major trade partner markets), combined with the high weight of
equity on total capital (around 80%) of the sector in all regions. The key figures of the automotive suppliers
sector are displayed in the table below.
Table 46 - Cost of capital of the automotive suppliers sector90
Area Cost of
Equity E/(D+E)
After-tax
Cost of Debt D/(D+E)
Cost of
Capital
Europe 14.16% 77.49% 3.54% 22.51% 11.77%
United States 10.35% 75.76% 6.38% 24.24% 9.38%
Japan 10.84% 74.62% 3.38% 25.38% 8.95%
China 9.31% 84.47% 3.38% 15.53% 8.39%
India 12.57% 77.02% 4.34% 22.98% 10.68%
Global 10.85% 77.53% 4.81% 22.47% 9.49%
Aside from cost of capital, another factor affecting the financial situation of companies is the availability of
investment capital for companies. Despite the fact that all OEMs and some component suppliers are global
players, interviewed stakeholders remarked that:
Local investments (e.g.in Europe) tend to be financed through local sources (i.e. European) of
capital;
Due to business culture differences, EU investors (e.g. banks, equity funds, etc.) have a lower risk
acceptance than those in other regions, notably the United States;
88
Source: S&P, September 2014 89
Source: Damodaran, 2014 90
Source: Damodaran based on S&P Capital IQ data, January 2014

Assessment of competitiveness impacts of post-2020 LDV CO2 regulation
Final Report Valdani Vicari & Associati (VVA), Technopolis Group (TG), Joint Institute for Innovation Policy (JIIP), TNO for DG CLIMA 253
Consequently, interviewees claim that OEMs facing major investments in the EU might have a disadvantage
compared to international competitors making similar investments in their own country.
A2.5 R&D and innovation
A2.5.1. R&D investment in new technologies
Baseline: Almost half of the world’s top 20 most innovative companies are car manufacturers according to a
recent report by the Boston Consulting Group (BCG).91
More recently, according to the EU Commission’s
2013 EU Industrial R&D Investment Scoreboard, more than one out five companies ranked in the top 50 of
the Scoreboard are from Automobiles and parts. In fact, Volkswagen, ranked as the world’s largest private
sector R&D investor with 9.5 billion euros invested in R&D followed by Samsung Electronics (8.3 billion
euros). This is the first time since 2004 that a company based in the EU leads the world R&D ranking.
The automotive sector is the largest investor in R&D in the EU with over 32 billion euros of expenditure and
accounting for 25% of total R&D spending.92
In the Czech Republic, Sweden, France and Japan, the sector
accounts for more than 15% of all R&D spending; in Germany its share exceeds 30%. EU OEMs and
suppliers, led by German carmakers, show very high increases in R&D investment and sales (14.2% and
11.3% respectively). The R&D growth rates of Volkswagen (32.1%), BMW (17.2%) and Bosch (17%)
determine a large portion of German and EU overall positive numbers. The R&D growth of FIAT (+51.5%)
accounted for more than 36% of the R&D of the companies based in Italy. The opposite trend can be seen
with US-based competitors, such as General Motors and Chrysler, which are still recovering from the crisis
and the US government bail-outs. It is important hence to note that in many countries, the aggregate
indicators depend to a large extent on the figures of a few firms.
The automotive sector is considered a medium R&D intensity sector opposed to high R&D intensity sectors
such as software, pharmaceuticals, health, and technology hardware. The EU and Japan are stronger than
the US in medium R&D intensity sectors like the automotive one.
One of the areas in which car manufacturers have invested the most in terms of R&D is safety. Since more
than 90% of crashes involve some kind of driver error, a range of safety systems has been created to aid
drivers in avoiding accidents. Driver assist systems include lane departure and blind spot warnings, adaptive
cruise control and automatic braking. Another area of major development is represented by connectivity and
the internet. In fact, the percentage of new passenger cars globally shipping with factory-installed telematics
will increase from nearly 10% in 2010 to 62% in 2016 according to ABI Research. Moreover, companies
along the automotive value chain are working to increase conventional vehicles’ fuel efficiency, by
developing better hybrid and electric models, more efficient power trains and lighter car bodies.
91
The Boston Consulting Group (2013). The most innovative companies 2013, www.bcgperspectives.com 92
According to ACEA, the sector is the largest private investor in R&D in Europe representing about 4% of the industry’s turnover and 23% of EU industry’s total R&D expenditure.

Assessment of competitiveness impacts of post-2020 LDV CO2 regulation
Final Report Valdani Vicari & Associati (VVA), Technopolis Group (TG), Joint Institute for Innovation Policy (JIIP), TNO for DG CLIMA 254
Figure 53 - R&D intensity by region, 2013
Source: own elaboration on 2013 EU industrial R&D Scoreboard
Figure 54 - R&D intensity most innovative OEMs, 2012 (Top 150)
Source: own elaboration on 2013 EU industrial R&D Scoreboard
A2.5.2. R&D investment in personnel (R&D centres)
Baseline: All top OEMs have R&D centres, the majority of them being located in the OEM’s country of origin.
As products are becoming increasingly more complex from a technological standpoint, the automotive
industry seeks to employ a highly skilled workforce. In particular given that EU automakers are increasing
their investments in alternative technologies such as battery-powered hybrid vehicles, electric vehicles and
hydrogen, their R&D departments are consequently witnessing a shift in competences from mechanical to
electrical engineering. The workforce employed in R&D ranges in terms of an ‘R&D staff to Total staff ratio’
(see Table 47) of 1:5 concerning Opel to a 1:25 for Volkswagen. In terms of geographical location some
OEMs tend to concentrate R&D resources in their base country where headquarters are located (e.g. Toyota
and PSA), whereas others distribute R&D centres based on key markets (e.g. Volkswagen, Daimler and
Honda, see Figure 54). To better understand the differences between OEMs, the context behind those
figures is described below by OEM.
5,1
3,7
4,3
0
1
2
3
4
5
6
EU US Japan
R&
D i
nte
nsi
ty (
%)
0,0
1,0
2,0
3,0
4,0
5,0
6,0
R&
D in
ten
sity
(%
)

Assessment of competitiveness impacts of post-2020 LDV CO2 regulation
Final Report Valdani Vicari & Associati (VVA), Technopolis Group (TG), Joint Institute for Innovation Policy (JIIP), TNO for DG CLIMA 255
OEMs – EU headquarters
Within the premium brands, German OEMs, BMW and Daimler are among the most innovative brands in the
automotive industry. BMW’s research and development activities are located in three different continents,
namely Europe, America, and Asia. Of the 11,359 employees belonging to the BMW Group’s global research
and innovation network, the vast majority are employed at the BMW Group Research and Innovation Centre
(9,200 employees). As one of the most innovative EU OEMs, BMW has recruited skilled staff specifically for
the development and production of new technologies such as electromobility. As a result, the R&D staff
represents approximately 10% of BMW’s total workforce as of December 2013. Daimler’s R&D staff is made
of 14,700 employees over 16 locations in six different countries. The company’s major areas of research and
development are related to design, safety and vehicle testing, telematics, and electronic mobility among
others.
Other EU automakers that invest heavily in R&D activities, and thus need specialised staff, are FIAT, Opel,
PSA, Renault and Volkswagen. According to the latest data available, the FIAT Group has a workforce of
18,700 employees in R&D, spread over 78 research centres. These are significant numbers, as innovation
will be a major driver of growth not only for the premium brands but also for the more generalist automakers.
The relatively recent investment in Chrysler is paving the way for the creation of a shared research and
innovation plan. The main areas in which FIAT concentrates its R&D activities are the reduction of
environmental footprint, safety and connected vehicles along with increasing the competitiveness of its
products.
Another German company which is particularly investing in innovation is Opel, which is expected to introduce
twenty-three new models and sixteen engines by 2016. A recent example of Opel’s innovativeness is the
launch in 2012 of an Extended Range Electric Vehicle, the Opel Ampera. Sustainable mobility is one of the
areas where Opel focuses its R&D activities through more eco-friendly engines and alternative propulsion
systems. Opel’s workforce dedicated to engineering and development activities is made of approximately
6,800 employees. The most important centre is in Rüsselsheim where the company is also headquartered.
In an effort to achieve the aforementioned goals, Opel’s parent company General Motors will invest 230
million euros in new facilities at the Rüsselsheim R&D centre.
Innovation is one of the key factors of the French PSA Peugeot Citroën’s strategy. PSA’s R&D staff counts
14,500 employees worldwide in six dedicated centres, four in France (Vélizy, Sochaux-Belchamp, La
Garenne-Colombes and Carrières-sous-Poissy), one in Shanghai (China Tech Center) and one in Sao Paulo
in South America. PSA Peugeot Citroën’s innovation policy is based on three key concepts: performance
(cutting the time to market), openness (networking) and looking to the future (detecting any weak
technological signals). PSA’s efforts in R&D also aim at cutting CO2 emissions and improving connectivity
between the driver and the vehicle. The PSA Group has its own style centre, the ADN (Automotive Design
Network), which brings together the style studios of both brands and the innovation and vehicle architecture
teams, totalling almost 1,000 people. Moreover, the China Tech Center also has its own style teams in order
to better meet local needs. Finally, the Group operates vehicle test centres at Belchamp and La Ferté-
Vidame in France.

Assessment of competitiveness impacts of post-2020 LDV CO2 regulation
Final Report Valdani Vicari & Associati (VVA), Technopolis Group (TG), Joint Institute for Innovation Policy (JIIP), TNO for DG CLIMA 256
The latest data available on the Renault Group explain that its overall workforce employed in R&D equals
16,426 employees. These figures are related to all of Renault’s brands including Dacia and Renault
Samsung Motors. Besides having invested heavily in electromobility, other priority areas in Renault’s
innovation strategy include innovative design, low CO2 emissions, autonomous vehicles and on-board
multimedia services. R&D activities of the Renault Group are carried mainly in France. Renault Samsung
Motor’s plant in Busan, South Korea, carries also R&D activities with an R&D staff of one thousand.
OEMs – non EU headquarters
Among the non-EU automakers, Nissan has a variety of research centres located across four continents and
employing more than 16,000 people in R&D activities. The main areas in which Nissan is active are safety,
CO2 emission reduction, driving experience and vehicle performance. More recently, Renault and Nissan
have announced their intention to deepen their integration by strengthening cooperation in four areas, one of
which is research and development. The two automakers are studying how to allocate research on next-
generation technologies, accelerate the exploitation common platforms, define and deploy a common
powertrain strategy, and optimise test facilities globally.93
Toyota has a large number of centres dedicated to a variety of research and development activities such as
product planning, vehicle engineering and evaluation as well as design. The amount of staff working on R&D
activities is equal to 14,000, the majority of which is employed in Japan (approximately 12,000). In R&D,
Toyota focuses its efforts on three key areas: environment, safety and energy.
General Motors employs around 17,000 people in R&D activities in its eight R&D facilities. The main areas in
which the GM group focuses are design and technology, environment, quality and safety. The largest facility
is located in Detroit, Michigan (US), which accounts for more than 80% of the company’s R&D staff.
Table 47 - R&D personnel, selected OEMs94
Automaker R&D staff R&D staff
Total staff ratio
BMW Group 11,359 1:10
Daimler 14,700 1:19
FIAT Group 18,700 1:12
General Motors95
17,000 1:10
Nissan 16,120 1:10
Opel 6,800 1:5
PSA 14,500 1:13
Renault 16,426 1:7
Toyota 14,000 1:24
Volkswagen 23,000 1:25
93
Source: http://www.media.blog.alliance-renault-nissan.com/news/renault-and-nissan-launch-projects-to-accelerate-alliance-synergies/ 94
Source: own elaboration on OEMs annual reports and websites 95
Not including Opel/Vauxhall.

Assessment of competitiveness impacts of post-2020 LDV CO2 regulation
Final Report Valdani Vicari & Associati (VVA), Technopolis Group (TG), Joint Institute for Innovation Policy (JIIP), TNO for DG CLIMA 257
Figure 55 - R&D centres geographic locations, selected OEMs
Source: own elaboration on OEMs annual reports and websites
A2.5.3. Service innovation
Baseline: Service based business models where OEMs other than the product also offer services around
the product have emerged as a response to shrinking sales partly due to the financial and sovereign debt
crises, and partly due to declining trends in car ownership96
, or urbanisation trends97
, among other reasons.
The most notable trend in service innovation has been car sharing. Last year, about 2.3 million drivers
worldwide belonged to a car-sharing service, a number expected to increase to 26 million by 2020. The
OEMs have joined in, through their own new ventures with possibly as main objective to hold onto existing
customers and connectwith future ones. E.g. Daimler and the rental company Europcar have joined forces to
create Car2Go, while BMW has teamed up with the car-rental company Sixt to form DriveNow. Volkswagen,
Citroën and Ford are among the other big manufacturers venturing into car-sharing. OEMs also use car-
sharing vehicles to try out new technologies, like parking-space location, that will eventually be installed in
the cars they sell or rent conventionally.98
Another business model in place in the sector is BMW’s
comprehensive service package ‘360° ELECTRIC’ which is backing BMW’s product i8 with service
innovation e.g. electricity contracts, applications locating charging stations, parking etc.
96
A study of HIS showed that particularly young people are waiting longer to get their driving license in the US. A study of Michigan referenced in the report included figures of licensed drivers in the US recording a decrease of 10% between 1983 and 2008. This trend was also confirmed in other countries (in particular the UK, Sweden, Norway, Korea and Japan) (Available at: http://www.ihs.com/info/ecc/a/automotive-study.aspx) 97
Namely the expected growth of urban populations and the increasing positive attitude for public transport, cycling and walking in urban areas - as encouraged by policy makers and driven by a more environmentally conscious younger generation, or the increase in small and mini car use especially in urban areas. In fact. the European car use statistics shows that there was a steady growth of the market for ‘mini’ car models of 80% between 2003 and 2007 and a slight expansion for ‘small’ cars. Since the start of the financial crisis there has been a drop for both and a notable drop of 50% for mini cars (recorded in 2012). 98
http://www.nytimes.com/2013
0
1
2
3
4
5
6
7
8
9
10
N°
of
ce
ntr
es
NAFTA
LATAM
EU
ASIA-PACIFIC
ROW

Assessment of competitiveness impacts of post-2020 LDV CO2 regulation
Final Report Valdani Vicari & Associati (VVA), Technopolis Group (TG), Joint Institute for Innovation Policy (JIIP), TNO for DG CLIMA 258
A2.5.4. Strategic patenting
Baseline: The EU automotive industry is the origin of more than 53% of the patents submitted to the EU
Patent Office, compared to the 21%, 15% and 0.4% of Japanese, US and Chinese manufacturers
respectively (as measured in the year 2007) (Centre for Strategy and Evaluation Services, 2013). According
to ACEA 56% of the world’s total automotive patents are filed in the EU. Technologies ranging from
computerised driving aids and advanced transmission systems to lighter materials and improved engine
technologies have put Europe at the cutting edge of automotive innovation.
Over the years the growth trends of electric and hybrid engine technology patenting were either lower or the
same as the ones of traditional engine technologies. From the early 2000s however the “non-environmental”
patenting rate dramatically declined while the “environmental” patenting continued to peak. Using patents on
vehicle fuel efficiency and air pollution abatement, Volleberg (2010) showed empirically the increased
dominance of R&D in alternative fuel vehicles, biofuel-driven, hydrogen-based or electric cars over the
emission control, engine redesign, and other improvements (e.g. improvement of aerodynamics, tyre
resistance, substitution of materials to decrease weight).
More recently, the electric and hybrid engine technologies (or “alternative powered vehicles” in Table 48)
have been found to be the fastest growing segment of auto industry R&D with a 182% increase in patenting
activity between 2006 and 2011, and 31% between 2012-2103 (Thomson Reuters, 2012; Thomson Reuters,
2014). The study compared innovation segments in technologies in the auto industry as measured by patent
applications and granted patents (unique patents) in an attempt to identify those of growing attention by
automotive innovators.
Geographically within the top 10 car manufacturers doing the most alternative power innovation Germany,
France and the UK are the only EU countries on the list with a share of 7.8%, 1.7% and 0.6% respectively.
Of those, only Germany ranks in the top five (being 5th) below frontrunner Japan with 35.2%, China 28.4%,
USA 10.3% and S. Korea 9%.
Table 48 - Top automotive related technology areas & patent activity by regions/company
Technology areas Volume 2013 % change 2012-2013 % change 2006-2011
Alternative powered vehicles 29,694 31% 182%
Transmission 15,236 28% 48%
Navigation Systems 15,050 30% 43%
Safety 14,306 39% 26%
Seat, Seatbelts and airbags 12,070 40% 42%
Steering Systems 9,030 32% 29%
Suspension Systems 8,321 30% 35%
Pollution Control 8,180 13% n.a
Security Systems 7,096 25% 54%
Engine Design and Systems 5,898 13% 24%
Braking Systems 5,441 28% 38%
Entertainment systems 3,495 28% n.a
Source: Thomson Reuters

Assessment of competitiveness impacts of post-2020 LDV CO2 regulation
Final Report Valdani Vicari & Associati (VVA), Technopolis Group (TG), Joint Institute for Innovation Policy (JIIP), TNO for DG CLIMA 259
The leaders in alternative power patents during the 2006-2011 period identified in the study included Toyota,
Honda, Denso (Japanese auto components manufacturer), General Motors and Panasonic. The leading
position of Japanese companies in alternative power patents may be explained by their early and strong
positioning in the electric vehicles global market. This is further supported by a cross-country trend
comparison that showed that the non-EU companies have stronger relative specialisation on electric and
hybrid car technologies (Aghion et al., 2012). In 2013 Bosch significantly strengthened its presence, ranking
third after Toyota and Honda and far ahead any other EU OEM or supplier, but also markedly lower than
Toyota.
Cooperation trends in the period 2002-2005 expressed by co-patenting investigated in the Sectoral
Innovation Watch report on the automotive sector (2011), show that national cooperation is the most
dominant form of cooperation and that OEMs are the most central in their networks compared to first tier
suppliers. Nevertheless co-operations between OEMs, tier level suppliers and others have grown compared
to earlier periods 1988-1991 and 1995-1998 creating a denser network, and international co-patenting has
also increased primarily driven by Germany.
Figure 56 - Top 10 assignees in alternative powered vehicles 2013
Source: Thomson, 2014
29
30
31
33
36
39
44
71
96
106
106
111
115
131
151
173
284
307
322
356
386
418
444
505
523
535
535
566
635
2520
0 500 1000 1500 2000 2500 3000
LEAR
JOHNSON CONTROLS TECHNOLOGY
HALLA VISTEON CLIMATE CONTROL
DU PINT DE NEMOURS
CATERPILLAR
REMY TECHNOLOGIES
TESLA MOTORS
GENERAL ELECTRIC
CONTINENTAL AUTOMOTIVE
ZF FRIEDRICHSHAFEN
VOLKSWAGEN
AUDI
BMW
RENAULT
PEUGEOT CITROEN AUTOMOBILES
SIEMENS
FORD
DAIMLER
GM GLOBAL TECHNOLOGY OPERATIONS
LG
SUMITOMO ELECTRIC
TOYODA AUTOMATIC LOOK WORKS
SAMSUNG
MATSUSHITA
DENSO CORPORATION
HYUNDAI
NISSAN
ROBERT BOSCH
HONDA
TOYTA

Assessment of competitiveness impacts of post-2020 LDV CO2 regulation
Final Report Valdani Vicari & Associati (VVA), Technopolis Group (TG), Joint Institute for Innovation Policy (JIIP), TNO for DG CLIMA 260
A2.5.5. Strategic collaboration
Baseline: The innovation process in the automotive sector has shifted towards more integrated partnership
with systems and component suppliers. According to CIS 499
data, 24% of automotive firms cooperate with
suppliers, 19% with customers, 13% with universities and 8% with research institutions. Collaborations are
therefore not a recent trend. First tier component suppliers and global mega suppliers increasingly
coordinate the supplier and innovation networks, which entail the coordination of a network of other first tier
suppliers and tier ‘n’ suppliers. OEMs on their end select first tier suppliers and try to retain influence in terms
of project-organisation and development-expertise (Sectoral Innovation Watch – Automotive sector, 2011).
To put collaboration in the context of this study we look at EU vs. non-EU collaboration activities using Joint
Ventures and Strategic Alliances (JVAs)100
. Based on the available data on JVAs, during the period 1994-
2014 (most recent data available in 08/214) EU OEMs and suppliers have participated in ca. 39% of all total
(i.e. global) JVAs. In Europe the countries most active in JVAs are Germany with a significant distance from
all the rest of EU countries (122 JVAs), France, Italy and the United Kingdom (see Figure 57). The most
common countries with which these JVAs took place include China, the US, Japan, India and Russia (see
Figure 57).
Figure 57 - Top EU countries engaged in JVAs (left) and top EU collaborators through JVAs (right)
Source: own elaboration based on Thomson One JVA data
Notes: JVAs have been sourced using Thomson Reuters’ SDC platinum database by querying for the following two SIC codes: Motor
Vehicle Parts and Accessories & Motor Vehicles and Passenger Car Bodies. The data covers the period 1994-2014 (June).
99
The CIS 4 was implemented based on the reference year 2004. 100
Joint ventures and strategic alliances are agreements between businesses (or other organisations) to pursue a set of agreed upon objectives while remaining independent. Common objectives can be product developments, distribution channels, increasing manufacturing capability, project funding, capital equipment, knowledge, expertise, or intellectual property. Technology transfer constitutes often a part of joint ventures and strategic alliances.
5
5
7
8
11
11
12
13
16
17
18
23
54
112
117
143
265
0 50 100 150 200 250 300
Norway
Slovenia
Austria
Romania
Finland
Poland
Hungary
Belgium
Czech Republic
Netherlands
Spain
Switzerland
Sweden
United Kingdom
Italy
France
Germany
5
5
6
6
6
7
8
8
8
9
9
11
14
20
49
71
80
120
130
148
0 20 40 60 80 100 120 140 160
Singapore
Yugoslavia
Hong Kong
Indonesia
South Africa
Taiwan
Brazil
Thailand
Unknown
Turkey
Vietnam
Australia
Canada
Malaysia
South Korea
Russian Fed
India
Japan
United States
China

Assessment of competitiveness impacts of post-2020 LDV CO2 regulation
Final Report Valdani Vicari & Associati (VVA), Technopolis Group (TG), Joint Institute for Innovation Policy (JIIP), TNO for DG CLIMA 261
With respect to collaborations of German stakeholders with non-EU stakeholders, we observe a shift towards
more JVAs with Chinese stakeholders recording a growth of 25%between the periods 1994-2003 and 2004-
2014. French stakeholders on the other hand have shifted towards more JVAs with Indian stakeholders,
recording a growth of 83%. Italian stakeholders have substantially increased JVAs by ca. 600% with India
and by 78% with China. UK stakeholders increased JVAs with China by 11%.
A2.5.6. Auxiliary baseline tables
Table 49 - R&D investment in the motor vehicles sector
Source: Economisti Associati & CSES (2013)
Table 50 - Share of innovative firms in motor vehicles and components sector
Source: Eurostat, R&D and innovation statistics

Assessment of competitiveness impacts of post-2020 LDV CO2 regulation
Final Report Valdani Vicari & Associati (VVA), Technopolis Group (TG), Joint Institute for Innovation Policy (JIIP), TNO for DG CLIMA 262
Figure 58 - R&D investment of EU and US companies by sector group
Source: 2013 EU industrial R&D Scoreboard
Table 51 - Most innovative OEMs worldwide (Top 150), 2012
Source: own elaboration on 2013 EU industrial R&D Scoreboard
A2.6 Overview of the fuel supply sector
A2.6.1. Overview of the fuel supply industry
The two main types of enterprises which will be affected in the fuel supply sector are filling stations and fuel
refineries. In 2011 there were more than 70,000 enterprises classified as retail sale of automotive fuel in the
EU-27, which comprise less than 10% of all enterprises in the wholesale and retail trade and repair of motor
vehicles. These enterprises generated 203 billion euros in turnover, which resulted in 13.8 billion euros
added value, again less than 10% of that of all enterprises in the motor vehicle trade and repair sector
(Eurostat). The sector employed 400,000 people, 13 % of the motor trades’ workforce.
World
rankName Country R&D R&D intensity Sales Capex Capex int. Profits Profitability Employees
(€million) (%) (€million) (€million) (%) (€million) (%)
1 VOLKSWAGEN Germany 9515 4.9 193000 10493 5.4 8333 4.3 525245
5 TOYOTA MOTOR Japan 7071 3.7 193000 17288 8.9 11567 5.9 333498
11 DAIMLER Germany 5639 4.9 114000 4827 4.2 9103 7.9 275087
12 GENERAL MOTORS USA 5584 4.9 115000 6911 6 -23013 -20 213000
16 HONDA MOTOR Japan 4906 5.6 86501 5490 6.3 4771 5,5 190338
23 FORD MOTOR USA 4169 4 102000 4159 4.1 4768 4,7 171000
25 NISSAN MOTOR Japan 4115 4.9 84326 10831 12.8 4477 5.3 160530
27 BMW Germany 3952 5.1 76848 5236 6.8 8878 11.6 105876
34 FIAT Italy 3295 3.9 83957 7534 8.9 3921 4.7 214836
48 PEUGEOT (PSA) France 2481 4.5 55446 2279 4.1 -5087 -9.1 204287
58 RENAULT France 1889 4.6 41270 2847 6.8 1028 2.5 127086
73 TATA MOTORS India 1496 5.7 26149 1251 4.7 2391 9.1 62716
108 SUZUKI MOTOR Japan 1044 4.6 22578 1436 6.3 1262 5.6 55948
119 HYUNDAI MOTOR South Korea 934 1.6 59799 2689 4.5 5973 9.9 n.a.
143 MAZDA MOTOR Japan 788 4 19312 612 3.1 448 2.3 37745

Assessment of competitiveness impacts of post-2020 LDV CO2 regulation
Final Report Valdani Vicari & Associati (VVA), Technopolis Group (TG), Joint Institute for Innovation Policy (JIIP), TNO for DG CLIMA 263
The evolution of filling stations in Europe shows that the number of stations has slowly declined over time
(from 137,000 to 135,500), with each individual station dispensing on average more fuel in 2012 than in 2005
(3 million litres per site against 2.8 million litres in 2005)101
.
The petroleum refining sector is likely to undergo significant change in the future. According to consultancy
AT Kearney consultancy, over the next 10 years, operators at one in every three refineries in North America
and Western Europe will need to reconsider their operating models and how they are integrated across the
value chain.102
They project that the current trend of refinery closings will continue, with one in five refining
assets being squeezed out of the market over the next five years in North America and Europe.
Similarly, a Lukoil report suggests that after a golden age between 2004 and 2008, the global financial crisis
of 2008 left the European oil refining industry in a significantly changed environment. They point out that
overcoming the European oil refining crisis, will require shutting down an additional 1-1.5 mb/d of refining
capacities in the region.103
The distribution and density of filling stations across the EU varies from country to country. Italy has by far
the most filling stations (around 22,500) followed by Germany with less than 15,000. A major trend in Europe
has been the increasing importance of filling stations operated by supermarket chains, which has reduced
the attractiveness of independent and oil company sites within the geographical sphere of influence of a
supermarket forecourt. For stations operated by supermarket chains, “the performance of forecourt stores
and other profit streams are increasingly important in order to keep them operating viably”.101
CBRE researchers note that major oil companies (ExxonMobil, Shell, BP, Total and Chevron) now own just a
third of Europe’s filling stations and instead the largest oil companies now place greater emphasis on
upstream activities, namely exploration and production. For instance, Shell announced the potential
divestment of its Italian service station portfolio and Esso recently sold 45 sites in the UK to Euro Garages.
According to CBRE research, independent fuel retailers, most of whom are SMEs, now own 20%, of all filling
stations across Europe, compared to 16% in 2007. Across the same period major oil companies’ market
shares decreased from 43% in 2007 to 32% today. Independent fuel retailers have the strongest foothold in
Bulgaria, where they account for almost two thirds of filling stations at 64%. In Czech Republic the figure is
56%, and over a third of filling stations have been acquired by independents in Hungary, Belgium, Poland
and Romania. Major oil companies retain a stronger presence in Europe’s more mature fuel markets
including Denmark and France where just 6% and 13% of filling stations are owned by independents.
101
http://portal.cbre.eu/portal/page/portal/RRP/ResearchReportPublicFiles/PI_EMEA_MarketView_Sep%202012_ FINAL2.pdf
102 http://www.atkearney.co.uk/paper/-/asset_publisher/dVxv4Hz2h8bS/content/refining-2021-who-will-be-in-the- game-/10192
103 http://www.lukoil.com/materials/doc/documents/Global_trends_to_2025.pdf

Assessment of competitiveness impacts of post-2020 LDV CO2 regulation
Final Report Valdani Vicari & Associati (VVA), Technopolis Group (TG), Joint Institute for Innovation Policy (JIIP), TNO for DG CLIMA 264
Figure 59 - Number of filling stations in Europe, 2013104
One aspect that is not reflected in the above statistics is the increasing importance of unmanned service
stations in Europe, which has reached 7.7% of all service stations across the continent in 2011. Verdict
research forecasts that by 2013 there will be 10,616 unmanned sites in Europe; a further upsurge of 3.7%.
Countries with an increasing unmanned site count include Austria, Belgium, Denmark, France, Italy and
Switzerland101
. According to Eurostat, wage-adjusted labour productivity for the automotive fuel retail sector
was of 169% in 2011 compared to 133% in the overall motor vehicle sector. Oil price changes need to be
taken into account when looking at these figures, as they directly affect revenues and thus labour
productivity statistics.
Stripping out the impact of prices on the retail value of fuel, the figure below shows the evolution in EU
demand for road fuel (by volume) and the mix between petrol and diesel. While demand for diesel fuel has
increased steadily from 150 to 220 million tonnes per year between 2000 and 2013 (with a short plateau
during the height of the financial crisis), petrol demand has been dropping from about 130 to just below 90
million tonnes per year.
On a country by country basis, there are significant differences both in terms of the overall fuel demand as
well as the mix between different types of fuel (petrol / diesel). Despite diesel being the overwhelming source
of road fuel in France, the majority of road fuel sold in Greece is petrol. In every other EU country diesel
104
Source: National Oil Industry association and FuelsEurope

Assessment of competitiveness impacts of post-2020 LDV CO2 regulation
Final Report Valdani Vicari & Associati (VVA), Technopolis Group (TG), Joint Institute for Innovation Policy (JIIP), TNO for DG CLIMA 265
represents the largest share of fuel demand; however the ratio varies among Member States, confirming that
national markets for vehicles are dissimilar in terms of demand and preferences.
Figure 60 - Road Fuel Demand in the EU in 2013105
Apart from filling stations retailing fuel, the other large sector in the fuel supply chain consists of refineries
and fuel processing. According to Eurostat, in 2006 there were around 1,013 enterprises classified as
concerned with manufacture of refined petroleum products in the EU 27. According to FuelsEurope there
were 82 mainstream refineries in the EU in 2013 (plus 4 in Switzerland and Norway). Germany (11), Italy
(11), Spain (9), France (8) and the UK (7) together accounted for almost 60% of the total. The manufacture
of coke and refined petroleum products is one of the few manufacturing subsectors that are dominated by
large enterprises.
Turnover in 2010 (latest available) was estimated to be around 497 billion euros with around 23 billion euros
of value added. According to Eurostat, more than four fifths of EU-27 value added in the sector came from
enterprises with at least 250 persons employed. Average personnel costs within the EU-27’s coke and
refined petroleum product manufacturing sector are high, at 69.5 thousand euros per employee in 2010
compared to 35.8 thousand euros per employee for manufacturing as a whole. Over 121,000 people were
employed in the sector with a wage adjusted labour productivity of 261% in 2010 (latest figures) significantly
higher than in 2009 (170%) and 2008 (200%).
A2.6.2. Competition of fuel producers on the EU market
As can be seen from Figure 61 and Figure 62 the EU is a net importer of diesel and a net exporter of petrol.
Diesel is mainly imported from the US and Russia. This situation is not so much a result of (price)
competition between EU and non-EU fuel suppliers on the EU market, but is rather caused by the high share
of diesel vehicles in the European LDV fleet, leading to a mismatch between the demand for petrol and
diesel and the optimal production ratios of these fuels for European refineries. Oil companies need to strike a
105
Source: WoodMacKenzie and FuelEurope

Assessment of competitiveness impacts of post-2020 LDV CO2 regulation
Final Report Valdani Vicari & Associati (VVA), Technopolis Group (TG), Joint Institute for Innovation Policy (JIIP), TNO for DG CLIMA 266
balance between optimising the operation of EU refineries and meeting the demands of the market. As a
result of this there is competition between diesel from EU and non-EU refineries on the EU market.
Figure 61 – Major petrol and diesel trade flows to and from the EU in 2012 (source: https://www.fuelseurope.eu/dataroom based on Eurostat)
Figure 62 – EU trade balance for petrol and diesel (source: https://www.fuelseurope.eu/dataroom based on Eurostat)
According to FuelsEurope, in the near future EU refineries will see increasing competition from new, large
refineries coming online in China, India and the Middle East. With domestic demand for high-quality fuels in
these countries still low, these refiners are expected turn to the EU to export their products. FuelsEurope
states that upstream integration and cheap power supply, together with low labour costs, economies of scale

Assessment of competitiveness impacts of post-2020 LDV CO2 regulation
Final Report Valdani Vicari & Associati (VVA), Technopolis Group (TG), Joint Institute for Innovation Policy (JIIP), TNO for DG CLIMA 267
(due to the large size of many new facilities) and tax incentives will provide these refineries with a
competitive edge over their European counterparts. While the local markets for these non-EU refineries
continue to grow to a level where they can sufficiently absorb production, exports from Indian and Middle
Eastern refineries are thus expected to at least temporarily add competitive pressure to the EU refinery
system. A counteracting trend could be that fuel demand in China grows faster than its refining capacity,
which makes Chinese companies look overseas for new refining opportunities, mostly to import back into
China.
A2.6.3. R&D and innovation
Looking at innovation and R&D, the 2014 European competitiveness report points out that the coke and
refined petroleum product sector is characterised by a high proportion of tertiary-educated employees
(second highest manufacturing sector after pharmaceutical products and preparations). This also
corresponds to Eurostat’s aggregations of knowledge-intensive activities.106
In addition the report finds that
this sector (together with motor vehicles) features high investment ratios (37.8% in 2012 compared to a
cross-industry average of 21.0%) which reflect a high proportion of capital-intensive firms.107
While the R&D intensity of the coke and refined petroleum sector in Europe is low (2%) in comparison with
other sectors, including motor vehicles (18%), the EU’s performance in this regard is better than that of the
US in the same sector. At the same time, given the very low R&D intensity of this sector the 2014 European
competitiveness report notes that “any differences between the EU and the US in R&D spending in such
sectors are less important than other factors, such as differences in unit costs or productivity”108
A2.6.4. Trends in fuel demand
Trends based on adopted policies and measures
In the past, final EU energy demand in the transport sector has grown in line with the transport activity.
However, the EU Reference Scenario109
shows that in the future fuel efficiency improvements driven by
legislation adopted by the first half of 2012 are foreseen to stabilise energy demand by 2050, despite the
projected upward trends in freight and passenger transport activities.
The most relevant driver of the reduction of average energy demand is policy, in particular at present for cars
and LCVs. Regarding passenger road transport, the energy efficiency of vehicles is expected to improve by
21% by 2020 and 35% by 2030 with respect to 2005, leading to a decline in energy demand by 2030 and to
stabilisation in the following two decades. The structure of passenger cars fleet in terms of engine and the
trends in energy consumption are foreseen to experience:
In the short-medium term a progressive reduction of the share of petrol, prolonging the trend of the last
years;
106
http://ec.europa.eu/enterprise/policies/industrial-competitiveness/competitiveness-analysis/european-competitiveness-
report/index_en.htm 107
http://ec.europa.eu/enterprise/policies/industrial-competitiveness/competitiveness-analysis/european-competitiveness-
report/index_en.htm 108
European competitiveness report, 2014 109
http://ec.europa.eu/energy/observatory/trends_2030/doc/trends_to_2050_update_2013.pdf

Assessment of competitiveness impacts of post-2020 LDV CO2 regulation
Final Report Valdani Vicari & Associati (VVA), Technopolis Group (TG), Joint Institute for Innovation Policy (JIIP), TNO for DG CLIMA 268
In the long term, the progressive erosion of diesel engine shares in favour of hybrid, plug-in electric and
BEV
Figure 63 - Trends in transport activity and energy demand110
Figure 64 - Structure of all passenger cars fleet and fuel consumption111
Expected trends based on future policies
In order to keep climate change below 2ºC, in 2011 the European Council reconfirmed the EU objective of
reducing greenhouse gas emissions by 80-95% by 2050 vis-à-vis 1990 levels, in the context of necessary
actions according to the Intergovernmental Panel on Climate Change by developed countries.
110
ibid. 111
http://ec.europa.eu/energy/observatory/trends_2030/doc/trends_to_2050_update_2013.pdf

Assessment of competitiveness impacts of post-2020 LDV CO2 regulation
Final Report Valdani Vicari & Associati (VVA), Technopolis Group (TG), Joint Institute for Innovation Policy (JIIP), TNO for DG CLIMA 269
In particular, the Communication “A Roadmap for moving to a competitive low carbon economy in 2050”112
presents a Roadmap for possible action up to 2050 which could enable the EU to deliver greenhouse gas
reductions in line with the agreed 80 to 95% target.
As an effect of the actions considered in the Roadmap, by 2050 the EU's total primary energy consumption
could be about 30% below 2005 levels:
More domestic energy resources would be used, in particular renewables;
Imports of oil and gas would decline by 50% compared to 2011.
Focusing on the transport sector, the Communication highlights that in 2005 greenhouse gas emissions
increased by 30% in 2005 vis-à-vis 1990 levels (with transport being the only sector among those considered
showing an increase). Upcoming measures are foreseen to bring emissions back to 1990 levels by 2030
(emission change will range from +20% to -9% compared to 1990 levels) and to bring marked reductions by
2050 (-54% to -67%).
A2.6.5. Fuel prices
Road transport energy consumption represents about 89% of total transport energy consumption, relying
mostly on oil. In the past years, standards for fuel economy and vehicle CO2 emissions have led OEMs to
progressively reduce the amount of fuel required by vehicles per km driven. The extent to which these
improvements are achieved by individual OEMs has an impact on their competitiveness, since it increases
the value of their products for end users by reducing the Total Cost of Ownership (TCO) of the vehicle.
The significance of the impact on TCO depends on fuel price. In this regard the EU market offers very
relevant opportunities due to the high fuel prices. May 2014 data suggest that, on average, unleaded 95
retail prices are in the range of 1.5 €/litre, diesel prices around 1.4 €/litre and LPG 0.75 €/litre, as shown in
the table below.
These prices are significantly higher than those in most of the other major LDV markets, with EU retail prices
being twice the US prices and significantly higher than the Chinese and Japanese ones. The figure below
provides a visualisation of the price level difference among a subset of EU Member States and a selection of
major international markets and trade partners, measured in the last year.
Fuel prices have slightly increased in recent years and dropped significantly in the last quarter of 2014.
Figure 66 shows fuel price trends in Europe since 2005.
Notwithstanding the impact of price drops in the last quarter of 2014, since 2005 fuel costs have
progressively become more important over time. The purchase price of cars has steadily reduced compared
to average consumer prices. Over the same period the cost of fuel, which is covered under the operation of
personal transport equipment, has increased (see Figure 67).
112
Brussels, 25.5.2011 COM(2011) 112 final/2

Assessment of competitiveness impacts of post-2020 LDV CO2 regulation
Final Report Valdani Vicari & Associati (VVA), Technopolis Group (TG), Joint Institute for Innovation Policy (JIIP), TNO for DG CLIMA 270
As a conclusion, medium-term fuel prices levels (assuming that existing differences will remain similar over
time) suggest that improvements in the fuel efficiency of vehicles resulting from compliance with increasingly
stringent targets will have a stronger impact on TCO for EU end-users than for users of similar vehicles in
other regions. This effect will be further amplified in case post-2020 CO2 targets set for the EU will be more
ambitious than the ones that will be adopted in non-EU countries.
Table 52 - Fuel prices in the EU113
Member State Unleaded 95 Diesel LPG
Austria € 1.37 € 1.30 € 0.80
Belgium € 1.65 € 1.44 € 0.60
Bulgaria € 1.28 € 1.30 € 0.60
Croatia € 1.41 € 1.31 € 0.75
Cyprus € 1.44 € 1.43 -
Czech Republic € 1.31 € 1.32 € 0.64
Denmark € 1.74 € 1.53 € 1.20
Estonia € 1.30 € 1.28 € 0.63
Finland € 1.63 € 1.50 -
France € 1.52 € 1.30 € 0.86
Germany € 1.64 € 1.43 € 0.73
Greece € 1.61 € 1.29 € 0.88
Hungary € 1.37 € 1.39 € 0.81
Ireland € 1.55 € 1.47 € 0.78
Italy € 1.79 € 1.67 € 0.73
Latvia € 1.29 € 1.26 € 0.52
Lithuania € 1.31 € 1.27 € 0.64
Luxembourg € 1.33 € 1.19 € 0.55
Malta € 1.44 € 1.36 -
Netherlands € 1.82 € 1.50 € 0.87
Poland € 1.23 € 1.21 € 0.53
Portugal € 1.64 € 1.40 € 0.85
Romania € 1.41 € 1.42 € 0.70
Slovakia € 1.48 € 1.36 € 0.71
Slovenia € 1.48 € 1.38 € 0.75
Spain € 1.42 € 1.34 € 0.75
Sweden € 1.58 € 1.54 € 1.00
United Kingdom € 1.61 € 1.68 € 0.88
EU Average € 1.49 € 1.39 € 0.75
113
Source : http://www.fuel-prices-europe.info, May 2014

Assessment of competitiveness impacts of post-2020 LDV CO2 regulation
Final Report Valdani Vicari & Associati (VVA), Technopolis Group (TG), Joint Institute for Innovation Policy (JIIP), TNO for DG CLIMA 271
Figure 65 - Fuel prices in the world114
Figure 66 - Fuel price trends (EU average), 2000-2014115
114
Source: http://www.globalpetrolprices.com 115
Source: oil bulletin prices history provided by Directorate-General Energy (DG-ENER).

Assessment of competitiveness impacts of post-2020 LDV CO2 regulation
Final Report Valdani Vicari & Associati (VVA), Technopolis Group (TG), Joint Institute for Innovation Policy (JIIP), TNO for DG CLIMA 272
Figure 67 - Real changes in transport prices in the EU-27116
A2.7 Overview of professional end users It is possible to highlight many different categories of professional end users of vehicles, which could be
indirectly impacted by CO2 and more generally by environmental legislation. Focusing on professional end
users of cars, these include:
Rental companies and leasing companies, although the latter can be considered intermediates for
the real end-users;
Passenger transport services, among which taxis represent the most relevant category;
Other categories, such as companies operating large fleets of passenger cars for various
professional services.
Professional users of LCVs include the following categories:
Postal and courier delivery companies, using LCVs for picking orders and last mile deliveries;
A wide range of other companies, including large companies operating (large) fleets of LCVs for
retail distribution activities various professional services, SMEs using single LCVs or small fleets
as well as Goods transport services
Most of end users compete locally using the same type of vehicles, even if they are global players. The latter
is the case of postal and courier delivery services and multinational companies using LCVs for the
distribution of goods to retail stores. However, the net effect of their operating costs has an impact on the
cost of doing business in the economy and therefore on overall EU competitiveness.
A2.7.1. Professional end users of cars
Rental and leasing companies
Vehicle leasing is the provision of a motor vehicle for a client to use for a fixed period of time, at an agreed
amount of money for the lease. Dealers offer leasing solutions as an alternative to vehicle purchase. It is
also used by companies to acquire vehicles without causing “peaks” in cash flows. Vehicle rental companies
rent cars (or vans) for short periods of time (usually up to a maximum of few weeks). Major rental companies
116
Source: EEA TERM report (2013). Real change in passenger transport prices, relative to average consumer prices based on the United Nations (UN) Classification of individual consumption by purpose (COICOP). Passenger transport by road includes exclusively transport of individuals and groups of persons and luggage by bus, coach, taxi and hired car with driver.

Assessment of competitiveness impacts of post-2020 LDV CO2 regulation
Final Report Valdani Vicari & Associati (VVA), Technopolis Group (TG), Joint Institute for Innovation Policy (JIIP), TNO for DG CLIMA 273
such as Europcar, Avis and Hertz are organised in local branches located in transport nodes (e.g. airports,
stations but also busy city areas, which enable clients to pick vehicles easily and also to return them to
different locations. Local branches are complemented by online reservation systems.
According to Eurostat, there are around 35,000 companies active in the renting and leasing of motor
vehicles, generating a total turnover of more than 65 EUR billion. The United Kingdom is the largest market
(14 EUR billion), followed by France (11.5), Germany (8.5), the Netherlands (6.5) and Italy (5.5). The sector
employs some 160,000 people, with around 24% of them located in the United Kingdom, 16% in Germany
and 11% in France.
Despite the large number of companies, the European market is quite concentrated. Three large
multinational companies control around 61% of the overall market. With almost 30% of the companies
located in France, the country is the leader in terms of number of enterprises. Yet, it employs less people
than the United Kingdom and Germany, showing that the concentration of the market is different across
Member States. The main industry indicators are summarised in the tables below.
Figure 68 - Key industry indicators for selected countries, 2009-2011
Source: own elaboration on Eurostat data
Around 30% of new vehicle registrations in Europe are done by leasing companies. Data from Lease Europe
show that in 2009 approximately 5.5 million new vehicle registrations were for lease (4.79 million cars) and
short term car rentals (704 thousand cars). In 2012 the European leasing industry registered 5.8 million new
leases while the overall fleet consists of more than fifteen million vehicles. Due to the typical duration of
leasing contracts (around 4 years), leasing plays an important role in the renewal of the car fleet.
Passenger transport services (taxi)
Eurostat data indicates that more than 400,000 people are employed in taxi operation, whereas according to
IRU data, the European taxi industry employs more than one million people, representing 8% of employment
Countries
2009 2010 2011 2009 2010 2011
EU 27 31,855 33,691 34,621 n.a. 1,300 n.a.
Germany 4,136 4,055 3,504 18,369 18,706 21,177
Spain 2,986 2,555 2,963 14,712 13,921 13,600
France 6,910 8,128 9,235 19,708 18,792 17,524
Italy 2,250 2,394 2,441 7,600 7,985 7,835
United Kingdom 3,710 3,685 3,700 45,986 34,390 n.a.
Number of enterprises Number of employees
Countries
2009 2010 2011 2009 2010 2011 2009 2010 2011
EU 27 59,000 59,900 63,247 n.a. 390 419 4,300 4,400 4,488
Germany 8,487 7,525 7,684 370 323 310 574 522 574
Spain 4,489 4,649 4,444 266 290 290 447 410 424
France 10,546 11,132 10,454 n.a. 573 571 787 801 761
Italy 5,741 6,142 5,196 550 573 510 328 345 333
United Kingdom 10,682 10,857 14,242 215 289 n.a. 1,099 1,130 1,200
Turnover Turnover per person employed Personnel costs

Assessment of competitiveness impacts of post-2020 LDV CO2 regulation
Final Report Valdani Vicari & Associati (VVA), Technopolis Group (TG), Joint Institute for Innovation Policy (JIIP), TNO for DG CLIMA 274
in the European transport sector117
. Taxis complement other public transport modes, in particular in urban
areas but also in suburban and rural ones thanks to their flexibility and availability.
Thanks to the particular usage conditions (namely urban transport, in areas with high availability of different
types) fuel infrastructures, taxis are early adopters of green technologies, in particular when fiscal,
administrative and operational incentives are available for environmentally friendly innovations.
A2.7.2. Professional end users of light commercial vehicles
Postal and courier delivery companies
Postal services gather, manage and deliver correspondence in a given territory, usually national. Each
country has its own postal system, whereas national systems are coordinated with each other so as to
enable deliveries globally. Parcel delivery can be distinguished from ordinary mail services by a series of
added value features, including delivery speed, security, tracking, customisation, etc. Large couriers
operating in Europe include DHL, FedEx, TNT, UPS, etc., which offer services worldwide through hub and
spoke models with different levels of aggregation. According to Eurostat data, the postal and courier delivery
sector includes 52,000 companies in the EU. Total turnover in 2012 was 110 billion euros, employees
summed up to more than 1.8 million.
Postal and in particular express delivery companies use LCVs and other motor for ‘last mile’ deliveries in
local areas. Even though data is not available at EU level, the express delivery industry worldwide operates
and owns more than 200,000 trucks and delivery vehicles118
. Large individual companies publish statistics
online - UPS declares that its delivery fleet includes 8,800 vehicles, including package cars, vans, tractors
and motorcycles.
A2.8 Automotive industry: market projections to 2020 and beyond The changes that will interest the automotive industry are not confined to a single geographical area.
Distinctions between mature and emerging markets will remain but will become more subtle as the latter
establish themselves as the engines of growth. These trends will also push to rethink the label “emerging”
since the numbers reveal that it would be rather appropriate to define such markets as “establishing” (the
stage between emerging and established). The interaction of two key forces underlies the growth predicted
for the emerging markets (e.g. Brazil, China, India and Russia). These are the liberalisation of industrial and
market regulatory policies and the increasing ability of large and underserved populations to purchase
vehicles.
To serve these markets, characterised by younger populations, economic growth and low vehicle
penetration, OEMs are already setting up local production and tailoring vehicles to the needs of local
consumers. This opportunity could push aggregate sales to more than 1 billion light vehicles worldwide over
a ten year period (2010-2020).
117
Source: International Road Transport Union 118
Oxford Economics Report - The Economic Impact of Express Carriers in Europe

Assessment of competitiveness impacts of post-2020 LDV CO2 regulation
Final Report Valdani Vicari & Associati (VVA), Technopolis Group (TG), Joint Institute for Innovation Policy (JIIP), TNO for DG CLIMA 275
According to LMC Automotive, in 2020 global light vehicle sales will reach approximately 117 million units
annually, against the current level of around 70 million. Most of this growth will stem from emerging markets,
above all Asia-Pacific followed by Eastern Europe and Latin America. By 2020 Asia-Pacific could account for
almost half of global light-vehicle sales. McKinsey predicts the global share of sales of established markets
will decline from 50% in 2012 to 40% in 2020 and are predicted to account for only 25% of future volume
growth. Both KPMG and LMC predict that China will be the major automotive market, accounting for almost
one-third of annual new vehicle sales globally followed by North America and Western Europe. India will
enjoy an important sales growth (11% CAGR) while Iran will account for the largest portion of sales coming
from the rest of the world with 1.8 million vehicles sold in 2020.
Chinese and Indian OEMs are in a favoured position compared to OEMs from other emerging countries.
Despite the acquisitions of Jaguar Land Rover by India’s Tata Motors and Volvo by the Chinese Geely, the
demarcation between established and establishing OEMs will remain clear up to 2020. Establishing OEMs
will still play a minor role in established markets achieving less than a 2% market share by 2020119
.
The regulatory changes that have been implemented in Brazil, China, India and Russia will benefit the auto
markets of such countries. These changes have attracted significant foreign direct investments and helped
the development of export industries, which provide foreign currency reserves to help financial growth.
Table 53 - Largest light-vehicle markets in 2013 and 2020
Country Light-vehicle sales in 2013
(in millions)
Light-vehicle sales in 2020
(in millions)
China 21.5 34.6
United States 15.4 17.4
Japan 5.1 4.2
Brazil 3.7 5.4
India 3.4 9.5
Germany 3.1 3.3
Russia 2.8 3.9
United Kingdom 2.4 2.7
Source: own elaboration on LMC Automotive data
One major growth opportunity is in smaller vehicles which already account for 30% of global sales and could
reach 30 million units in 2020. More than 60% of this market is located in emerging economies, where sales
are expected to grow by an annual 5-6% rate until 2020. Success in this key segment requires a low-cost
business model characterised by a limited number of body types based on a single platform and a limited
offer range. Modularity will thus become a fundamental success driver as most automakers are stretching
their product lines, mainly through derivatives – products derived from standard models – to satisfy customer
needs with respect to e.g. performance, style and uniqueness. Running more derivatives per platform
creates complexity. To manage complexity while controlling costs and ensuring sufficient differentiation,
OEMs will increasingly develop new global platform strategies including modular concepts. It is not excluded
119
KPMG (2013). Global automotive retail market
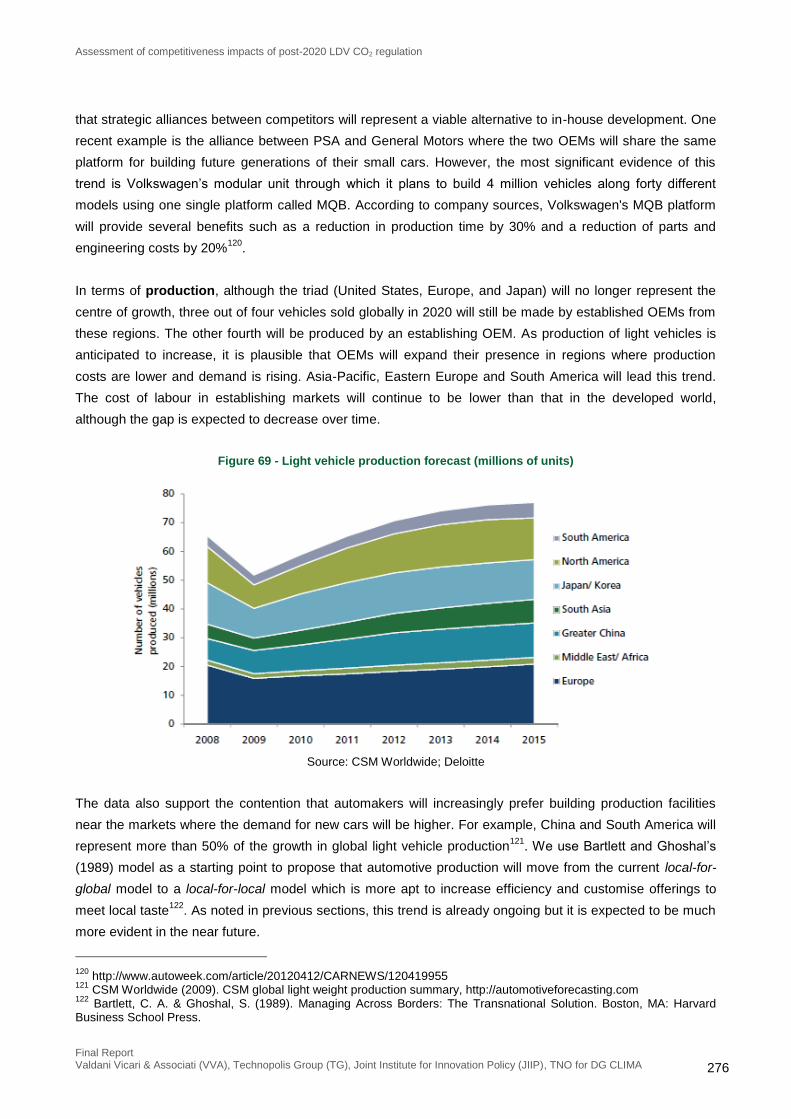
Assessment of competitiveness impacts of post-2020 LDV CO2 regulation
Final Report Valdani Vicari & Associati (VVA), Technopolis Group (TG), Joint Institute for Innovation Policy (JIIP), TNO for DG CLIMA 276
that strategic alliances between competitors will represent a viable alternative to in-house development. One
recent example is the alliance between PSA and General Motors where the two OEMs will share the same
platform for building future generations of their small cars. However, the most significant evidence of this
trend is Volkswagen’s modular unit through which it plans to build 4 million vehicles along forty different
models using one single platform called MQB. According to company sources, Volkswagen's MQB platform
will provide several benefits such as a reduction in production time by 30% and a reduction of parts and
engineering costs by 20%120
.
In terms of production, although the triad (United States, Europe, and Japan) will no longer represent the
centre of growth, three out of four vehicles sold globally in 2020 will still be made by established OEMs from
these regions. The other fourth will be produced by an establishing OEM. As production of light vehicles is
anticipated to increase, it is plausible that OEMs will expand their presence in regions where production
costs are lower and demand is rising. Asia-Pacific, Eastern Europe and South America will lead this trend.
The cost of labour in establishing markets will continue to be lower than that in the developed world,
although the gap is expected to decrease over time.
Figure 69 - Light vehicle production forecast (millions of units)
Source: CSM Worldwide; Deloitte
The data also support the contention that automakers will increasingly prefer building production facilities
near the markets where the demand for new cars will be higher. For example, China and South America will
represent more than 50% of the growth in global light vehicle production121
. We use Bartlett and Ghoshal’s
(1989) model as a starting point to propose that automotive production will move from the current local-for-
global model to a local-for-local model which is more apt to increase efficiency and customise offerings to
meet local taste122
. As noted in previous sections, this trend is already ongoing but it is expected to be much
more evident in the near future.
120
http://www.autoweek.com/article/20120412/CARNEWS/120419955 121
CSM Worldwide (2009). CSM global light weight production summary, http://automotiveforecasting.com 122
Bartlett, C. A. & Ghoshal, S. (1989). Managing Across Borders: The Transnational Solution. Boston, MA: Harvard Business School Press.

Assessment of competitiveness impacts of post-2020 LDV CO2 regulation
Final Report Valdani Vicari & Associati (VVA), Technopolis Group (TG), Joint Institute for Innovation Policy (JIIP), TNO for DG CLIMA 277
Table 54 - Global light vehicle production forecast123
Country 2013
(in millions) 2013
(share of total) 2020
(in millions) 2020
(share of total) Δ%
Asia-Pacific 21.5 36% 34.6 42% 48
North America 15.4 26% 17.4 21% 16
Western Europe 11.9 20% 14.1 17% 18
Eastern Europe 6.8 11% 10.1 12% 48
South America 4.5 7% 6.5 8% 44
The link between economic growth and attention to the environment will become stronger as efficient mass
production of modern vehicles might be among the most challenging manufacturing pursuits in the future.
CO2 regulation is likely to continue to tighten not solely in Europe as legal initiatives to reduce emissions
have already been put in place in countries such as the US, Japan and China. OEMs will face additional
manufacturing costs to comply with regulation, as described in detail in Chapter 4.
Figure 70 - Manufacturing costs associated with CO2 reduction124
Source: ICCT; McKinsey
In Europe, the 2020 target is expected to be largely achieved by applying advanced technologies to
conventional vehicles. Some OEMs argue it is necessary or beneficial to achieve part of the reduction
through increased electrification. This will act as an incentive for OEMs to invest more in e-mobility, meaning
electrical/hybrid powertrains, including batteries, as well as in lightweight and aerodynamic drag-reducing
technologies. Electric vehicles (EVs) may be promising in the long term but will not achieve a major market
penetration in the next six years. Internal combustion engines (ICEs) that burn petrol, diesel, or another
combustible fuel accounted for 97% of the passenger vehicles sold worldwide in 2013 while the remaining
3% had alternative configurations (hybrid powertrain or full battery electric motor). This ratio will not change
significantly in 2020 when LMC estimate that ICEs will account for about 95% of sales whereas McKinsey
estimate 90% for traditional ICEs. Deloitte is very optimistic, stating that by 2020 electric vehicles and other
123
Source: own elaboration on LMC Automotive data 124
A broad definition of electrification is considered in the chart, including also hybridization

Assessment of competitiveness impacts of post-2020 LDV CO2 regulation
Final Report Valdani Vicari & Associati (VVA), Technopolis Group (TG), Joint Institute for Innovation Policy (JIIP), TNO for DG CLIMA 278
“green” cars will represent up to a third of total global sales in developed markets and up to 20% in urban
areas of emerging markets125
.
Tackling environmental pollution is a theme that is strongly related to innovation and research and
development (R&D). Alternative power will see continuous innovation even beyond 2020. For instance,
lithium-ion technology will see considerable investment and growth. Micro, mild and full hybridisation is
already undergoing extensive development and will continue to do so. A majority of the new vehicles in 2020
are expected to have some level of hybridisation.
Figure 71 - Level of innovation in various aspects of the vehicle by 2020
Source: IBM Automotive 2020 global study
At the same time, the vehicle of 2020 will be characterised by several significant developments that will
make it remarkably different from today. Innovation will be mostly concentrated on software, electrical
systems, electronics, engine and auxiliary systems, and powertrain.
In 2012, the world’s top 17 OEMs spent more than 50 billion euros on R&D. It is likely that the automotive
industry exceeds 100 billion euros in this area. This spending trend will continue as OEMs need to develop
more efficient internal combustion engines in parallel with electromobility. On average, R&D accounts for 4-
5% of OEMs’ total costs. According to some industry experts, it is possible that it will increase in the next
years126
.
Another important aspect of car innovation is related to telematics and infotainment. Vehicles are being
equipped with danger-warning applications, traffic information services as well as infotainment features. The
number of networked cars will rise by 30% every year and by 2020 one out of five cars will be connected to
the internet. Approximately half of these cars will be in the premium segment.
125
Deloitte (2009). A new era. Accelating toward 2020 – an automotive industry transformed. 126
E.g. Oliver Wyman (2013). Automotive manager.

Assessment of competitiveness impacts of post-2020 LDV CO2 regulation
Final Report Valdani Vicari & Associati (VVA), Technopolis Group (TG), Joint Institute for Innovation Policy (JIIP), TNO for DG CLIMA 279
Figure 72 - R&D spent per unit for selected OEMs
Source: Oliver Wyman (2013)
As OEMs are switching progressively to a local-for-local production model, it is expected that suppliers will
also follow. In regions such as Asia, where production volumes are expected to rise to meet 70% of demand,
it will be crucial to build a local supplier base. This requires the design of an enhanced supply chain as well
as the full exploitation of supplier capacities. Another particular aspect in which the relationship between
suppliers and OEMs is expected to be essential is the challenge of low carbon mobility. OEMs will need and
depend on suppliers to manage the long-term transition from ICEs to EVs for both technology and logistics.
The maturity of the automotive retail market will be influenced by a variety of specific features and
macroeconomic conditions such as new car demand, first car versus replacement car demand, used car
demand, the used/new car sales ratio, car park density and income levels. By 2020, none of the establishing
markets such as China, Brazil, and India will have reached a state of maturity that is comparable to current
levels in North America, Western Europe and Japan. As auto mobility will undergo significant changes,
established markets where demand is more mature, are expected to be in a “hard selling” period. This will
lead to a consolidation and centralisation of the retail network. The centralisation process will not necessarily
lead to fewer point-of-sale locations but will probably lead to fewer retail network owners (i.e. grid managers)
managing the retail grid. In establishing markets, where vehicle penetration is still low, a rise in demand will
lead to an “easy selling” period characterised by strong new car demand, leading to the development of a
large and decentralised retail network structure.
Another major challenge dealers will need to face stems from the incredible amount of information on the
web available to car buyers. The volume and breath of the material available through the internet is going to
increase dramatically until 2020. In 2007, a potential car buyer would visit a dealer an average of five times
before purchasing a car, whereas nowadays she/he is already well-informed since the first time she/he visits
the point of sale, leaving the dealer fewer chances to turn the browser into a buyer. Embracing this challenge

Assessment of competitiveness impacts of post-2020 LDV CO2 regulation
Final Report Valdani Vicari & Associati (VVA), Technopolis Group (TG), Joint Institute for Innovation Policy (JIIP), TNO for DG CLIMA 280
will require innovative retail strategies that may feature brand experience centres with high-tech digital,
personalised visualisation tools or “pop-up” stores that advertise a specific product to create buzz127
.
A2.8.1. Business models in 2020
A recent study conducted by Arthur D. Little highlights the need for business model redesign in the
automotive industry128
. The study reveals how the current and established business models may not be
sustainable in light of the major trends shown previously. The models proposed are based on two variables.
The first is the range of services which describes the scope of services that are directly linked to mobility
(e.g. parking guidance systems) or otherwise overarching services which the customer can use during the
actual mobility time (e.g. online shopping). The second variable is the link between product and mobility
which ranges from physical ownership of a car to rejection of ownership in favour of alternative forms such
as car-sharing. The table below provides an overview and synthesis of the four business model archetypes.
Table 55 - Automotive business models in 2020
Product Focused Manufacturer (PFM)
This business model is the closest to today’s
traditional OEMs
Technological excellence, core competence in
product and manufacturing technology
Main income stream primarily derived from selling
physical products
Premium vendors (e.g. Porsche) or volume
manufacturers with leading market position, sufficient
margins and optimal cost position (e.g. Tata)
Service Focused Manufacturer (SFM)
This business model provides mobility in the same
way as the PFM through strong attachment to the
automobile
Moderate technology dominance, outsourcing of
areas beyond their strategic competence
Service portfolio with comprehensive offering around
the core product that allows generating revenue
opportunities across the product lifecycle
Unique selling proposition through design and
individuality
Basic Mobility Provider (BMP)
This business model uncouples mobility from can
ownership
The focus moves from the product (automobile) to the
need (transport). Practicability and cost efficiency are
of key relevance.
The auto mobility share is covered by a standard car
(no frills), while other mobility building blocks can be
handled using public and non-individual means of
transport
Pay-by-use approach (e.g. Car2go)
Mobility Service Provider (MSP)
This business model dissolves completely the link
between car and mobility
The core competence is the successful mastery and
operation of complex customer relationships by
integrating a cooperation network
Similar to the SFM, the MSP offers a range of
services that go beyond vehicle acquisition (e.g.
online commerce, parking services)
Comfort, luxury and status are substituted by
sustainable convenience
Source: adapted from Arthur D. Little (2009)
127
McKinsey (2012). The road to 2020 and beyond: what’s driving the global automotive industry? 128
Arthur D. Little (2009). Future of Mobility 2020. The automotive industry in upheaval?

Assessment of competitiveness impacts of post-2020 LDV CO2 regulation
Final Report Valdani Vicari & Associati (VVA), Technopolis Group (TG), Joint Institute for Innovation Policy (JIIP), TNO for DG CLIMA 281
A2.8.2. An overview of the industry post 2020
In the post 2020 era the automotive industry may look reasonably different from how it looks today. Here, we
briefly summarise some of the most significant trends that will characterise the automotive industry.
OEMs and suppliers will face significant challenges which may impact buyer-supplier relationships. Make or
buy evaluations may push some OEMs to backward integrate by acquiring some of their suppliers while
others may increase their outsourcing activities. A competence shift is also highly likely as OEMs will focus
on their core competences, leaving space for suppliers to capture additional value in production and R&D
activities. The overall OEM share of global R&D value creation will decline from 60% today to 47% in
2025129
. OEMs will place the major focus of their innovation activities on environmental friendliness and fuel
efficiency instead of comfort. Europe will retain its leadership as an R&D location. OEM R&D spending is
expected to rise as automakers will need to develop smarter and more innovative solutions to meet more
stringent environmental regulations. For example, according to industry experts, between 2010 and 2025 car
CO2 emissions will need to be reduced annually by 4.7% and in Europe by 3.9%130
. Engine downsizing as
well as hybrid engines and electric powertrain replacing conventional engines, and new materials (e.g.
composites) are all potential solutions requiring an effort in innovation. Accordingly, it is expected that R&D
spending will double, accounting for 10% of OEMs’ total costs by 2025 compared to the current 4-5%.
Another important aspect is related to the growth of emerging versus established markets. The global
automotive industry is expected to grow by about 3% per annum until 2025. By 2025, global automotive
value creation will grow to 1.25 trillion euros compared with 840 million euros in 2012. As emerging countries
will continue to experience higher and faster growth compared to the established markets, Asia will further
expand its position as the dominant automotive region. By 2025, China is expected to be the most important
vehicle producing country globally generating around 300 billion Euros in value.
Regional vehicle segments are also expected to change. China will benefit considerably from the premium
segment’s growth until 2025, while Europe will maintain its supremacy in that segment. India will significantly
increase its share in the small vehicle segment. At the same time, value creation by vehicle modules will be
also subject to change. Electric drives will be the strongest growth sector in production, increasing by 20%
per year in terms of value creation. If we consider the individual vehicle segments, the exterior and chassis
sectors will show the highest growth for the small car segment. For the premium vehicle segment, value
creation in the exterior sector will increase strongly by 2025 due to lightweight construction concepts, new
materials, cost reductions and a strong focus on design131
.
129
Oliver Wyman & VDA (2012). FAST 2025 – Future automotive industry structure 2025. 130
Oliver Wyman (2013). Automotive manager 131
Ibid.

Assessment of competitiveness impacts of post-2020 LDV CO2 regulation
Final Report Valdani Vicari & Associati (VVA), Technopolis Group (TG), Joint Institute for Innovation Policy (JIIP), TNO for DG CLIMA 282

Assessment of competitiveness impacts of post-2020 LDV CO2 regulation
Final Report Valdani Vicari & Associati (VVA), Technopolis Group (TG), Joint Institute for Innovation Policy (JIIP), TNO for DG CLIMA 283
Annex 3. Results from stakeholder consultation
This section provides a synthetic overview of the key outcomes of the interview to stakeholders along the
value chain, organized by type of player and by question. Overall, the interview campaign included 12
interviews with automotive manufacturers, component suppliers and fuel suppliers. End users
representatives were also contacted, but did not provide an answer.
Table 56 – List of interviewees
Category Type of entity Name
Vehicle Manufacturer Company Daimler
Vehicle Manufacturer Company Ford (Europe)
Vehicle Manufacturer Company Fiat
Vehicle Manufacturer Company Toyota
Vehicle Manufacturer Company BMW Group
Vehicle Manufacturer Company Volkswagen
Vehicle Manufacturer Association ACEA
Vehicle Manufacturer Independent expert Mr Luc Bastard
Component Supplier Company Robert Bosch
Component Supplier Association CLEPA
Fuel supplier Association Eurofuels
Fuel supplier Association Renault
The survey consisted of semi-structured in depth interviews. This choice was made due to the necessity to
obtain the maximum information from stakeholders even in the absence of information regarding the targets
and modalities of post 2020 CO2 legislation (which were not defined yet at the time the study was
performed).
The tables below include the questionnaires submitted to manufacturers (left column), as well as a summary
of the answers received (right column).
A3.1 Answers by vehicle manufacturers
Question Answer
1. In what way does current legislation affect competitiveness between competitors in the affected sector? By which part of current policy? Focusing on the target, how feasible and expensive will it be to comply with the 2020 one?
Most manufacturers remarked that competitiveness is a general task (i.e. not related to one specific piece of legislation), and is thus affected by the whole regulatory framework in the EU
Concerning CO2 regulation, it was suggested that the target is the most influencing factor in terms of profitability. According to interviewees, achieving the targets set definitely had an impact on costs of operations within the EU and resulted in a loss of competitiveness in manufacturing in the EU in favour of other production sites outside the EU
A few interviewees discussed in detail the role of the slope. The slope has been reported to have an influence on competitiveness based on the relative positioning of OEMs (big/”premium” vs. small/”volume” vehicles)

Assessment of competitiveness impacts of post-2020 LDV CO2 regulation
Final Report Valdani Vicari & Associati (VVA), Technopolis Group (TG), Joint Institute for Innovation Policy (JIIP), TNO for DG CLIMA 284
Question Answer
It has been argued that the innovation led by CO2 legislation is more likely to meet user acceptance (and availability to pay) by end users of “premium” vehicles, where innovation is part of the selling proposition. Vice versa, end users purchasing “volume” brand vehicles are not willing to pay a premium for greener vehicles. This dynamic has been reported to have a differential impact on the profitability of different OEMs based on their positioning
Eco-innovations, super credits and other “flexibilities” have been reported to have a mitigating effect on competitiveness impacts by helping to make the target feasible for “non-premium positioned” vehicles manufacturers
The 2020 target was judged to be extremely challenging by interviewees, although costs were not quantified
2. Does the EU CO2 legislation for light duty vehicles lead to different “relative” levels of stringency of the targets imposed on EU and non-EU OEMs? If so, why? What elements of the legislation are causing this difference?
It was reported that all manufacturers are global companies. From the perspective of manufacturers, competitiveness in the EU market must be always linked to global competitiveness. All OEMs operating in EU and producing here under similar costs structure across the EU and all have operations outside EU.
It was reported that it is not possible to split competitiveness to one local area, as losing competitiveness in one leads to delocalisation to another area with more suitable conditions
While the stringency is the same the impact on the feasibility of reaching the target [considering that it has been reported to be expensive and to lower profitability], the only possible differences between OEMs depend on:
the financial resources available
the “weight” of EU sales vis-à-vis non EU sales, as OEMs with higher dependency on EU market have to cope with higher costs associated with production in the EU not being offset by revenues from third market. It was agreed that the EU market is less profitable than the foreign ones. This means that OEMs have to find external markets to finance EU innovation
A stakeholder pointed out that some manufacturers are very distant from the target. This has been reported to be due to the fact that diesel engines are the main mechanism of compliance with current targets. Players with sales mainly in the EU have strong competences in diesel, whereas other players (not focusing on hybridization) are more focused on gasoline due to the characteristics of their internal market. It has been remarked that, in this sense, Euro 6-2 legislation is “doing a favour” to non-EU OEMs by raising costs of diesel engines and thus reducing their sales, in particular for the medium segment
3. Are there differences in the costs for EU and non-EU OEMs of complying with similar targets? Are these the result of EU and non-EU OEMs choosing different compliance mechanisms with different cost implications to meet similar targets? Or are they the result of costs for similar compliance mechanisms being different for EU vs. non-EU OEMs? And if the latter is the case, what are the reasons for these differences in costs?
It was remarked that costs are depending on the production localisation: In general, production in
Europe is more expensive to other possible production places due to high regulatory burden, but all OEMs have operations and production in the EU, there is no difference for EU and non-EU manufacturers

Assessment of competitiveness impacts of post-2020 LDV CO2 regulation
Final Report Valdani Vicari & Associati (VVA), Technopolis Group (TG), Joint Institute for Innovation Policy (JIIP), TNO for DG CLIMA 285
Question Answer
4. What strategies are being applied to comply with the legislation? Do you foresee that in the future (post-2020) the available strategies will remain the same? What are the policy elements with the largest effect? Why?
It was remarked that strategies are up to individual OEMs and all OEMs are trying to cope with similar conditions on the EU market. Some similarities were noted however:
In general, up to 2020 the strategy is to focus on diesel and to downsize gasoline.
For post 2020, it should be noticed that the pace of technical progress on reducing CO2 emissions will slow down. Diverse range of low carbon technologies that include biofuels, CNG, LPG, clean diesel, hybrids, electricity and hydrogen are available
Some of the manufacturers might resort to pooling as a “last resource” before paying fines
OEMs are focusing on cost reduction and global approach how to stay and be further competitive on the EU market. Especially for volume manufacturers, part of this strategy includes delocalization of production site to (EU or neighbouring) countries with lower costs than Western EU countries
5. Would EU OEMs and suppliers or their non-EU competitors benefit from EU LDV CO2 regulations being more stringent than in other regions / markets? If there would be similar LDV CO2 regulations in different markets / regions, would the economies of scale resulting from that benefit EU OEMs and suppliers or their non-EU competitors?
Focusing on cars, it was remarked that imposing overly-ambitious targets for Europe as compared to other world would lead to non-profitable investments for manufacturers, with a heavier weight on those selling the largest share of their vehicles in the EU
Focusing on LCVs, on the one hand it was answered that LCV legislation is expected to be similar across different regions, on the other hand it was remarked that very ambitious targets can damage profitability: stringent CO2 targets accelerate the obsolescence of the vehicle. This pushes manufacturers to maintain prices competitive and/or to accelerate innovation (i.e. product lifecycles). In both cases, profitability drops
6. If future targets would require OEMs to sell significant shares of very efficient vehicles (ICEVs, BEVs, PHEVs and FCEVs), would you consider the EU automotive industry to be in a better / equal / worse position compared to non-EU competitors to apply that compliance mechanism? Why?
Focusing on cars, it was answered that there is an issue of acceptance by the market: the current market uptake of alternative powertrains is low
Besides this issue, most manufacturers stated that there is no difference between EU and non-EU manufacturers, as they will all be faced with the same problems and need to finance non-profitable operations due to the regulatory burden not being “transferrable” to end users through higher prices
In this frame, “premium” manufacturers would be better positioned due to lower price sensitivity of their customers
Focusing on LCVs, it was remarked that usually LCV customers don’t want to pay for the premium associated to AFVs. It is not possible for manufacturers to have a downsizing strategy for the vehicle because of the loss of load capacity – which is a key driver for purchase for customers in addition to price
7. To what extent does the regulation influence the design and implementation of innovative products or services?
Product Innovation
Regulation may impact the scope of innovation but not hugely the extent of the efforts; Regulatory pressure has led to incremental innovation.
Market acceptance is the main driver particularly the case of mass production OEMs; Profitability is a pre-condition for ambitious innovation strategies.
CO2 legislation was behind most of the efforts on ICEV.

Assessment of competitiveness impacts of post-2020 LDV CO2 regulation
Final Report Valdani Vicari & Associati (VVA), Technopolis Group (TG), Joint Institute for Innovation Policy (JIIP), TNO for DG CLIMA 286
Question Answer
the bigger will be the push to AFVs and EVs.
A significant share of OEMs R&D expenses was already addressing CO2 reduction technologies. This is the case for both mass production and premium OEMs.
Low hanging fruit related to ICEV innovation have been grabbed and the most resource intensive innovations are currently under development.
Innovation is concentrated on powertrain-related innovation, engines, aerodynamics, affordable lightweight materials, catalytic converters
Increasing efficiency of diesel engines is important for EU OEMs.
Strategies on alternative fuel vehicles seem to vary across companies. Innovation in EVs and natural gas is in some cases no longer actively pursued nor is hybridisation.
Services Innovation
A number of OEMs got involved in car sharing initiatives. However the emergence of these business models/services was not driven by CO2 regulation, but rather it was a strategy to enter a new market and/or being prepared to potentially changing customer behaviours.
Emerging trends like service innovation e.g. electricity contracts, applications locating charging stations, parking etc. is backing product innovation are occurring. Currently they are developed by premium OEMs and hence motivated by being on the cutting edge of innovation.
Manufacturers that can differentiate their technology by product and market may have an advantage over premium manufacturers that apply technological innovations on all products.
8. Is the legislation likely to affect internal production process and/or organisational structure?
Different views were expressed:
The majority of manufacturers stated that these issues are affected by all various aspects of business life, not by a specific piece of legislation
One manufacturer answered that no change was expected
Two manufacturers stated that increasing price pressure will lead to further shift in the choice of production location, and that electrification will move a lot of value creation out of the industry and push towards players specialized in the production of electric motors and batteries. This trend towards decreasing role of production vis-à-vis assembly has been judged to be detrimental in the long term for the EU, as the creation and nurturing of competences would eventually damage exports
9. Is the legislation likely to affect value chains of product development and marketing? Does the regulation, for example, lead to externalizing R&D activities or changing the R&D partners? And would those changes affect the competitiveness of EU industry & business vs. industry & business in other parts of the world?
Innovation strategies are only a part of all other strategies (product, service, marketing etc.). Cost optimization considerations do impact R&D investments.
R&D activities are becoming more resource intensive because technology becomes obsolete more quickly (the case of cars and not so much vans).
Innovation spending has increased and choices have to be made in terms of prioritising innovation efforts in different segments, which may lead to a competitive disadvantage in the longer term.
Mass producing OEMs have not and will not most likely increase R&D even further as they are already constrained and have had serious losses in last few years of economic crisis.
10. What is the impact of changes in innovation strategies on your overall costs of doing business? Are the required R&D investments likely to require access to external equity, including risk capital? Do you foresee a positive impact on revenues counterbalancing compliance costs? What will be the effect in the long term? And would the impact on the cost of doing

Assessment of competitiveness impacts of post-2020 LDV CO2 regulation
Final Report Valdani Vicari & Associati (VVA), Technopolis Group (TG), Joint Institute for Innovation Policy (JIIP), TNO for DG CLIMA 287
Question Answer
business be different for you than for your (non-EU) competitors?
Finding people with the right set of skills in Europe is becoming increasingly difficult particularly in relation to EVs
OEMs that are global are more profitable – because the EU market is less profitable than the foreign ones and can thus rely on external markets to finance innovation
11. What are possible strategies and actions for limiting possible negative competitiveness effects?
It was answered that strategies depend on individual OEMs
Brand management is important because of what said above (i.e. to gain premium positioning), but this is a difficult and resource-consuming strategy to pursue. Moreover, there is not just “space” for everybody to “jump” in the premium segment
12. At the lights of the points above, can you conclude that EU companies will in general be affected differently than companies from other regions? Why? Will possible competitive advantages or disadvantages be maintained also in the long term?
It was answered that there is not a large difference as all OEMs are global companies. Possible differences could still exist along these lines:
Looking to the short term Diesel-specialised manufacturers have an advantage vs. gasoline-specialised OEMs, but Euro 6-2 will reduce it
Both in short and medium-long term, Premium-focused manufacturers have an advantage vs. non-premium-focused OEMs
In the long term, in case of stringent targets leading to radical changes, it will be more a matter of incumbents in the automotive industry vs. new players. with large amount of resources and familiarity with the new technologies
13. What is the overall impact of implementing compliance strategies on vehicles’ prices? Does this impact the demand for new vehicles?
In general, market prices have been relatively stable in recent years. Absorption of all costs is not converted into a price increase.
For premium vehicles it is possible to advertise and sell quite easily the new technologies and put a premium price
Some manufacturers underlined that in the future, more stringent targets might eventually oblige [in particular volume] manufacturers to increase prices, which would eventually reduce the demand. This could have a potential social equity impact, as well as slowing the achievement of CO2 emissions reduction due to slower fleet renewal
14. Focusing on components enabling to hit CO2 targets, it possible to estimate the share of CO2 related components purchased from EU manufacturers vis-à-vis international ones? What is the share of CO2 reducing components produced in-house per manufacturer?
Most manufacturers answered that all the vehicle is impacted. Focusing on components, low prices will be the priority. This is again due to profitability issues.
It was also suggested that components related to the diesel technology are purchased mainly by EU manufacturers, whereas electrification-related technologies are sourced mainly outside EU, from Japanese players Korean ones and in the future increasingly Chinese players
15. What impact do you think that compliance actions by OEMs will have on component manufacturers, e.g. in terms of sales? Do you think that EU component manufacturers are better positioned than non-EU ones for taking advantage of compliance actions? Why?
With the push towards electrification there will be a general tendency towards moving out of Europe (at least in terms of some of the required technologies), therefore EU component manufacturers will need to be even more competitive. To this do this they might be required replicate the strategies pursued recently by OEMs, e.g. to form partnerships and joint ventures to pool resources for R&D

Assessment of competitiveness impacts of post-2020 LDV CO2 regulation
Final Report Valdani Vicari & Associati (VVA), Technopolis Group (TG), Joint Institute for Innovation Policy (JIIP), TNO for DG CLIMA 288
A3.2 Answers by component suppliers
Question Answer
1. What impact is the current CO2 legislation having on the automotive supply industry? In what way does it eventually affect competitiveness between automotive suppliers? By which part of current policy? (probe for: Target; Utility parameter and utility function (slope); Eco-innovations; Legal entity; Derogation, …) Focusing on the post-2020 CO2 legislation, what impacts do you expect on the industry and on the competition between suppliers?
Legislation is a driver to spur innovations and new technologies; all regulations apply the same way to all the stakeholders; it thus spurs competitiveness.
Looking to the impact on of the target, it depends mainly on its stringency and the distribution of capabilities: at the moment the EU industry is in a good position with respect to the injection equipment of diesel and ECU (electronic control units), and also for partition components and gasoline equipment.
In the field of electrification EU is not this strong. Looking to the volume of sales in future on electrification. The highest share of value is on the battery as the rest is commoditized. Here Asian players are in a very good position.
2. Does the European CO2 legislation for light duty vehicles lead to different “relative” levels of pressure on costs for European and non-European suppliers, due to requirements from OEMs caused by the legislation? Can you map the causal reaction linking the legislation, the compliance actions by OEMs and eventually the impact on suppliers?
If regulation puts pressure on innovation it prevents commoditization with other suppliers. However, to take advantage of this the industry need to be in the right position and on the stringency of the target.
With no or lean legislation there will be lower prices and competition on commodities from Asian players
“Medium” stringency will cause stable situation on prices
High stringency will lead price to increase but will provide competitive advantage to Asian suppliers against EU ones
3. What strategies are being applied by suppliers to satisfy the demands from OEMs resulting from the EU LDV CO2 legislation? Do you foresee that in the future (post-2020) the available strategies will remain the same? Why?
Strategies include combination of lightweight, downsizing, down speeding. From a technical point of view, 2020 targets are expecting to be achieved with known technologies. However the continuation of the gradient of CO2 will progressively lead to electrification and increased demand for high-end powertrains.
4. Would European suppliers or, alternatively, their non-EU competitors benefit from EU LDV CO2 regulations being more stringent than in other regions / markets? If there would be similar LDV CO2 regulations in different markets / regions, would the economies of scale resulting from that benefit EU suppliers or rather their non-EU competitors?
In the last decade EU regulation is in the leading position but in future more or less more or less the same levels across different regions is expected. For EU component suppliers, it was not a disadvantage in the past to have EU legislation more stringent as it avoided commoditization.
5. Do you expect the CO2 legislation to lead to more or less turnover and more or less jobs in the European automotive supply industry? Is that the result of European automotive supply companies gaining / losing market share or of non-European suppliers relocating production facilities to or out of Europe? Or is the labour intensity of manufacturing CO2 reducing components different from the current average?
Very stringent legislation is expected to lead to a disadvantage for the EU industry, meaning less turnover and jobs. To ensure competitiveness of suppliers and OEMs a better compromise is judged to be needed.
6. To what extent does the regulation influence the design and implementation of innovative products or services?
Regulation is judged to be a main driver of change.
7. Is the legislation likely to affect internal production process AND/OR organisational structure?
To improve systems a change of the type of engineering, from component-based engineering to the systems engineering, Is required. On the production side suppliers remarked the need to be close to customer and react to their needs.

Assessment of competitiveness impacts of post-2020 LDV CO2 regulation
Final Report Valdani Vicari & Associati (VVA), Technopolis Group (TG), Joint Institute for Innovation Policy (JIIP), TNO for DG CLIMA 289
Question Answer
8. Is the legislation likely to affect value chains of product development and marketing? Does the regulation, for example, lead to searching for new RDI partners, partners in design, new materials, engagement in new strategic alliances? Do these changes lead to new ways of protecting IPRs? And would those changes affect the competitiveness of European industry & business vs. industry & business in other parts of the world?
In the future partnerships will be necessary, it will be also necessary to have different partnerships from the past, i.e. short-term partnerships.
There is no easy answer to IP protection.
9. What is the impact of changes in your innovation strategies on your overall costs of doing business? And would the impact on the cost of doing business be different for you than for your (non-EU) competitors?
R&D budget will be used with a focus on electrification. Different suppliers in Europe already changed (increased) the overall budget allocated to R&D.
A3.3 Answers by fuel suppliers In addition to the answers received to the specific questions, fuel suppliers emphasised that:
any policy, and in particular policy related to progressive reduction of CO2 emissions from transport,
should be technology neutral.
the more that alternatives to fossil fuels are being including in transport CO2 emissions related policy,
the more it is important to able to compare each fuel and/or technology on a comparable basis: this
should be based on the emissions over the life cycle of the considered fuel, (i.e. well-to-wheel.)
Question Answer
1. If post 2020 CO2 legislation for light duty vehicles (LDVs) leads to more efficient internal combustion engine vehicles (ICEVs), as well as to the introduction of alternatives such as battery electric vehicles (BEVs), plug-in hybrid electric vehicles (PHEVs) and fuel cell electric vehicles (FCEVs), what are the main impacts on your business? Why?
The impact can be seen in reduced volumes of motor fuels, while the overhead cost and the other operational costs will remain approximately the same. These costs have to be spread over a smaller volume and so this will increase the price per litre (assuming taxes etc. remain the same). When the costs are too high compared to the turnover, this will result in a growing number of petrol stations that will be forced to stop the activities and a growing number of smaller petrol distributors that will be going bankrupt, not being able to cope with market pressures. Of course, this scenario will depend very much on the success of deployment and market buy-in of alternative fuels
2. Can you estimate the long-term impact of CO2 legislation on fuel demand and fuel prices?
The long term impact will be that prices will go up, as margins will increase and there will be less demand for oil-based fuels. Of course, this scenario will depend very much on the success of deployment and market buy-in of alternative fuels
3. To what extent are these effects impacting the competition between energy supply companies active on the European market? How would a shrinking fuel market in Europe affect competition between companies on the EU market? Are all companies active in Europe equally able to deal with the impacts of the CO2 legislation? And if not, is that related to them being European or non-European companies?
The shrinking market will increase competition in principle, if one assumes that EU legislation is applied in the same way in all countries.
4. Currently fuel suppliers and electricity suppliers are not generally seen as direct competitors. Will that change when post-2020 CO2 legislation for LDVs leads to large scale introduction of alternatives such as BEVs, PHEVs and FCEVs?
No, it will favour alternative fuels and not so much electricity providers, so they will not be direct competitors. However, the legislation will create unfair competition between fuel suppliers and alternative fuels suppliers.

Assessment of competitiveness impacts of post-2020 LDV CO2 regulation
Final Report Valdani Vicari & Associati (VVA), Technopolis Group (TG), Joint Institute for Innovation Policy (JIIP), TNO for DG CLIMA 290
Question Answer
5. Will post-2020 CO2 legislation for LDVs lead to impacts on the number of jobs in your sector in Europe?
Yes, there will be a drastic impact on jobs in the fuel retail sector – drastic jobs reduction. Smaller firms will also be closed as they would not be able to cope with market pressures and larger firms in our sector will decrease in size too. Family enterprises will be closed, so there will be serious impact on SMEs.
6. Would the large scale introduction of alternatives such as BEVs, PHEVs and FCEVs foreseen to affect the business’ operations and structure? E.g. related to the installation, operation and maintenance of new energy supply infrastructures?
The key question is whether petrol stations will invest in alternative fuels infrastructure – some will do so and other will not, it will all depend on whether there is a business case for it or not. It will also depend on the kind of alternative fuel.

Assessment of competitiveness impacts of post-2020 LDV CO2 regulation
Final Report Valdani Vicari & Associati (VVA), Technopolis Group (TG), Joint Institute for Innovation Policy (JIIP), TNO for DG CLIMA 291
Annex 4. Trade tariffs, barriers and Free Trade Agreements
Trade tariffs play an important role in influencing international trade of goods. The level of trade tariffs
applied by each country varies a lot, also depending on the type of good. The tariffs for the most recent
available years for a selection of countries and goods (i.e. cars code HS8703, light commercial vehicles
870421, 31 and 90 and components 8708) is provided in the table below.
Table 57 – Overview of trade tariffs132
Average of Ad Valorem Duties (%)
Reporter Year HS 8703 HS 870421, 870431
and 870490 HS8708
Brazil 2012 35 35 15.35
Canada 2013 5.8 5.1 3.4
China 2011 25 25 9.8
EU Union 2013 9.7 12.3 3.8
India 2013 100 7 10
Japan 2013 0 0 0
Korea, Republic of 2013 8 10 8
Mexico 2012 31.3 20 1
Russian Federation 2012 1.7 20 2
Turkey 2011 9.7 12.3 3.8
USA 2013 2.5 25 1.3
It is also to be remarked that also non-tariff barriers (NTBs) have a significant role in reducing or hampering
international trade. These include, for example, anti-dumping measures and countervailing duties. NTBs
have increasingly been applied following the reduction of trade tariffs levels by WTO activities and rules.
Where considered to be mutually beneficial, bilateral or regional Free Trade Agreements involving or
excluding specific groups of goods are signed. The FTAs can have a significant impact on increasing the
intensity of international trade,, as exemplified by the recently signed FTA (Free Trade Agreement) with
South Korea. According to the Annual Report on the Implementation of the EU-Korea Free Trade Agreement
issued by the EU Commission in February 2014, EU exports of cars to Korea increased by 40 % in value
and 38 % in units, compared to the year before the FTA was provisionally applied (i.e. two years later), as
compared with an increase of 24% in value terms and 25% worldwide. Likewise, imports of cars from Korea
increased by 53 % in value terms and by 36 % in terms of units.
At the present stage, the EU has in place the following FTAs133
:
Central America (Costa Rica, El Salvador, Guatemala, Honduras, Nicaragua and Panama);
Colombia and Peru;
South Korea;
Mexico (Comprehensive Free Trade Agreement);
132
Source: WTO, Integrated Database (IDB) notifications. Most Favourable Nation applied tariffs 133
Source: AALEP

Assessment of competitiveness impacts of post-2020 LDV CO2 regulation
Final Report Valdani Vicari & Associati (VVA), Technopolis Group (TG), Joint Institute for Innovation Policy (JIIP), TNO for DG CLIMA 292
Economic Partnership Agreements with the Caribbean (fifteen CARIFORUM states), the Pacific (Papua
New Guinea) and Eastern and Southern Africa (Zimbabwe, Mauritius, Madagascar, the Seychelles);
South Africa (Trade, Development and Co-operation Agreement);
Chile (Free Trade Agreement).
Moreover, FTAs are a core component of Association Agreements as well as Customs Unions (Andorra,
San Marino, Turkey). Hence the EU also has free trade deals in force with a number of countries in Europe
(Faroe Islands, Norway, Iceland, Switzerland, the former Yugoslav Republic of Macedonia, Albania,
Montenegro, Bosnia and Herzegovina, Serbia) and the Southern Mediterranean (Algeria, Egypt, Israel,
Jordan, Lebanon, Morocco, Palestinian Authority, Syria, Tunisia) and three with African, Caribbean and
Pacific countries (Caribbean, Pacific and Eastern and Southern Africa).
A series of FTAs are finished but not yet being applied. These include:
Eastern Neighbourhood – Deep and Comprehensive Free Trade Area (DCFTA) with Moldova, and
Georgia. Ukraine
Singapore – Free Trade Agreement (FTA)
Five interim Economic Partnership Agreements with Cote d'Ivoire, Central Africa (Cameroon), the
Southern African Development Community, Ghana and the East African Community.
On-Going Negotiations include:
United States of America (The Transatlantic Trade and Investment Partnership (TTIP)
Agreement on investment with China
Canada (Comprehensive Economic and Trade Agreement (CETA)
Japan (Free Trade Agreement)
Association of Southeast Asian Nations (ASEAN): Malaysia, Vietnam and Thailand;
Southern Mediterranean: Deep and Comprehensive Free Trade Agreement (DCFTA) with Morocco.
The Commission has a mandate to start a similar process with Tunisia, Egypt and Jordan.
India (Free Trade Agreement)
Mercosur (EU-Mercosur Association Agreement)
African, Caribbean and Pacific countries (ACP) – Economic Partnership Agreements (EPAs. )
Of particular interest is the situation with Japan. EU-Japan FTA negotiations are ongoing for both vehicles
and components – the EU does not envisage any exclusions. The negotiation involves both tariffs and NTBs:
Tariffs: Japan has 0% tariffs on cars and most of the components. The EU has 10% duty on cars and
Japan's objective is to eliminate this duty;
On NTBs the objective of the EU is to encourage Japan to adopt and comply with the international
(UNECE) standards. The EU has issued a list of NTBs some of which related to cars. Several of the
NTBs were already resolved during the first year of negotiations. A second list of NTBs is expected to
be submitted in autumn 2014. Additionally, and in parallel with the discussions on specific NTBs, the EU
has submitted to Japan an automotive annex which focuses on elimination of NTBs and introduces
mechanisms to prevent new NTBS from emerging.

Assessment of competitiveness impacts of post-2020 LDV CO2 regulation
Final Report Valdani Vicari & Associati (VVA), Technopolis Group (TG), Joint Institute for Innovation Policy (JIIP), TNO for DG CLIMA 293
Annex 5. Analysis of sales distributions
A5.1 Introduction
An important question for assessing possible competitiveness impacts of post-2020 CO2 legislation is
whether the legislation is likely to lead to targets of different stringency for EU manufacturers and non-EU
manufacturers. In case the target is implemented on manufacturers using a utility-based target function,
differences in the effective stringency of targets posed on individual manufacturer are the result of
differences in the sales distributions of these manufacturers in relation to the utility parameter and the slope
of the utility-based target function. As indicated in chapter 4, differences in the sales-averaged value of the
utility parameter lead to significantly different targets if the target function has a finite slope. In this Annex
sales distributions and average values for the utility parameters mass and footprint are assessed for EU
manufacturers and non-EU manufacturers. The analysis is based on the 2013 monitoring database134
.
Different definitions of what are EU and non-EU manufacturers are discussed in section 2.5. Here analyses
are presented for the following cases:
1. Current main association membership for the EU market:
Associations: ACEA, JAMA, KAMA, and other / unknown;
With Toyota (incl. Lexus) and Hyundai as member of ACEA;
Chrysler counts as ACEA member as it is owned by Fiat (since 2014);
Various GM brands counting as ACEA member (since 2014) through the Opel Group;
For large manufacturers this represents as European manufacturers all OEMs that manufacture a
large share of their EU sales in the EU;
“Other / unknown” contains e.g. manufacturers from the US, China, India, and Malaysia;
Many small manufacturers are not member of ACEA, JAMA or KAMA and are also classified as
other / unknown, without distinction of whether they are EU or non-EU. Due to their low sales this
does not affect the overall picture.
2. Original association membership:
Associations: ACEA, JAMA, KAMA, and other / unknown;
With Toyota (incl. Lexus) as member of JAMA and Hyundai as member of KAMA;
“Other / unknown” contains e.g. manufacturers from the US, China, India, and Malaysia;
Many small manufacturers are not member of ACEA, JAMA or KAMA and are also classified as
other / unknown, without distinction of whether they are EU or non-EU. Due to their low sales this
does not affect the overall picture.
3. Location of headquarters / owner
Regions: Europe vs. Japan, Korea and other (including US);
Chrysler counts as European as it is owned by Fiat;
The region “other” then includes Ford and GM counted as having US-based ownership and Volvo
and Landrover/Jaguar as owned by companies from China resp. India.
The fourth definition, based on the share of vehicles manufactured in the EU, could not be used in this
analysis due to a lack of data.
134
See: http://www.eea.europa.eu/data-and-maps/data/co2-cars-emission-6

Assessment of competitiveness impacts of post-2020 LDV CO2 regulation
Final Report Valdani Vicari & Associati (VVA), Technopolis Group (TG), Joint Institute for Innovation Policy (JIIP), TNO for DG CLIMA 294
For passenger cars a detailed list of how different brands/manufacturers are attributed to different regions
according to the above definitions is given in Table 58. A similar list for LCVs is presented in Table 59.
Table 58 – Classification of different passenger car brands / manufacturers in the EEA 2013 monitoring database as European or non-European according to three different definitions (sales > 500)
Brand Sales Main association
for EU market Original
association Owner/HQ
VOLKSWAGEN 1486615 ACEA ACEA EU
FORD 891905 ACEA ACEA Other/ukn
RENAULT 793271 ACEA ACEA EU
PEUGEOT 723889 ACEA ACEA EU
AUDI 662318 ACEA ACEA EU
BMW 608594 ACEA ACEA EU
MERCEDES 594093 ACEA ACEA EU
CITROEN 587649 ACEA ACEA EU
OPEL 545451 ACEA ACEA Other/ukn
FIAT 535793 ACEA ACEA EU
TOYOTA 491902 ACEA JAMA Japan
SKODA 480740 ACEA ACEA EU
NISSAN 409673 JAMA JAMA Japan
HYUNDAI 406286 ACEA KAMA Korea
KIA 338679 KAMA KAMA Korea
DACIA 289162 ACEA ACEA EU
SEAT 280326 ACEA ACEA EU
VAUXHALL 258868 ACEA ACEA EU
VOLVO 203431 ACEA ACEA Other/ukn
MINI 147247 ACEA ACEA EU
SUZUKI 137188 JAMA JAMA Japan
CHEVROLET 136437 ACEA OTHER/ukn Other/ukn
MAZDA 133210 JAMA JAMA Japan
HONDA 130996 JAMA JAMA Japan
LAND ROVER 98711 ACEA ACEA Other/ukn
MITSUBISHI 70833 JAMA JAMA Japan
LANCIA 70791 ACEA ACEA EU
SMART 63384 ACEA ACEA EU
ALFA ROMEO 62237 ACEA ACEA EU
PORSCHE 40492 ACEA ACEA EU
SUBARU 27903 JAMA JAMA Japan
JAGUAR 26061 ACEA ACEA Other/ukn
Unknown 21667 OTHER/ukn OTHER/ukn Other/ukn
LEXUS 21293 ACEA JAMA Japan
JEEP 15788 ACEA OTHER/ukn Other/ukn
CHRYSLER 13513 ACEA OTHER/ukn Other/ukn
RANGE ROVER 6800 ACEA ACEA Other/ukn
SSANGYONG 5372 KAMA KAMA Other/ukn
MAGYAR SUZUKI 4068 JAMA JAMA Japan
FERRARI 2058 ACEA ACEA EU
INFINITI 1970 JAMA JAMA Japan
LADA 1689 OTHER/ukn OTHER/ukn Other/ukn
TESLA 1654 OTHER/ukn OTHER/ukn Other/ukn
BENTLEY 1518 ACEA ACEA EU

Assessment of competitiveness impacts of post-2020 LDV CO2 regulation
Final Report Valdani Vicari & Associati (VVA), Technopolis Group (TG), Joint Institute for Innovation Policy (JIIP), TNO for DG CLIMA 295
Brand Sales Main association
for EU market Original
association Owner/HQ
DAIMLER 1385 ACEA ACEA EU
MASERATI 1358 ACEA ACEA EU
ABARTH 1307 ACEA ACEA EU
ASTON MARTIN 1223 OTHER/ukn OTHER/ukn EU
BUICK 1206 ACEA OTHER/ukn Other/ukn
TATA 876 OTHER/ukn OTHER/ukn Other/ukn
GENERAL MOTORS COMPANY 609 ACEA ACEA Other/ukn
CECOMP 566 OTHER/ukn OTHER/ukn EU
DAIHATSU 544 JAMA JAMA Japan
Table 59 – Classification of different LCV brands / manufacturers in the EEA 2013 monitoring database as European or non-European according to three different definitions (sales > 500)
Brand Sales Main association
for EU market Original
association Owner/HQ
RENAULT 189862 ACEA ACEA EU
VOLKSWAGEN 166956 ACEA ACEA EU
FORD 151525 ACEA ACEA Other/ukn
CITROEN 131195 ACEA ACEA EU
PEUGEOT 130753 ACEA ACEA EU
FIAT 121723 ACEA ACEA EU
MERCEDES 115587 ACEA ACEA EU
Unknown 65599 OTHER/ukn OTHER/ukn Other/ukn
OPEL 39897 ACEA ACEA Other/ukn
NISSAN 37499 JAMA JAMA Japan
VAUXHALL 29515 ACEA ACEA Other/ukn
TOYOTA 24974 ACEA JAMA Japan
DACIA 17081 ACEA ACEA EU
IVECO 12554 ACEA ACEA EU
MITSUBISHI 12388 JAMA JAMA Japan
LAND ROVER 11947 ACEA ACEA Other/ukn
ISUZU 10015 JAMA JAMA Japan
SKODA 4729 ACEA ACEA EU
HYUNDAI 2476 ACEA KAMA Korea
PIAGGIO 2356 ACEA ACEA EU
SEAT 1133 ACEA ACEA EU
JEEP 1032 ACEA OTHER/ukn Other/ukn
MINI 1012 ACEA ACEA EU
AUDI 968 ACEA ACEA EU
GREAT WALL 947 OTHER/ukn OTHER/ukn Other/ukn
KIA 935 KAMA KAMA Korea
SCANIA 856 ACEA ACEA EU
SSANGYONG 722 KAMA KAMA Korean
BMW 651 ACEA ACEA EU
DANGEL 643 OTHER/ukn OTHER/ukn EU
GIOTTI VICTORIA 641 OTHER/ukn OTHER/ukn EU
GOUPIL 573 OTHER/ukn OTHER/ukn EU

Assessment of competitiveness impacts of post-2020 LDV CO2 regulation
Final Report Valdani Vicari & Associati (VVA), Technopolis Group (TG), Joint Institute for Innovation Policy (JIIP), TNO for DG CLIMA 296
A5.2 Passenger cars
A5.2.1. Mass
Figure 73 shows that in all three definitions the European, Japanese and Korean manufacturers have fairly
similar distributions of sales over the range of mass values, with Korean OEMs having a somewhat more
pronounced sales peak in the medium segment. In the definition based on association membership
manufacturers in the category “Other/unknown” have peaks in their sales for vehicles with smaller than
average and higher than average mass, as well as a wider spread towards higher masses. Based on the
location of headquarters / owner, in which case e.g. Ford, GM and Volvo are categorised as
“Other/unknown”, this category has a sales distribution that is more similar to that of OEMs from the EU,
Japan and Korea.
In Figure 74 it can be seen that the average mass for EU manufacturers is not sensitive to the definition,
which is to be expected given the high share of EU OEMs in the European vehicle sales. For OEMs from
other regions the average mass and CO2 value are somewhat sensitive to the definition used to categorise
the OEMs, but sign and to a lesser extent size of the deviation from the average for EU OEMs remain largely
the same for the three definitions. Sales volumes for the category “Other/unknown” are most sensitive to the
definition of the categories.

Assessment of competitiveness impacts of post-2020 LDV CO2 regulation
Final Report Valdani Vicari & Associati (VVA), Technopolis Group (TG), Joint Institute for Innovation Policy (JIIP), TNO for DG CLIMA 297
Based on current main association membership for the EU market
Based on original association membership / intuitive region of origin
Based on location of headquarters / owner
Figure 73 – EU passenger car sales distributions as function of utility: mass

Assessment of competitiveness impacts of post-2020 LDV CO2 regulation
Final Report Valdani Vicari & Associati (VVA), Technopolis Group (TG), Joint Institute for Innovation Policy (JIIP), TNO for DG CLIMA 298
Based on current main association membership for the EU market
Based on original association membership / intuitive region of origin
Based on location of headquarters / owner
Figure 74 – EU passenger car average CO2 vs. utility: mass (The sizes of the bubbles indicate the sales volumes in the EU)

Assessment of competitiveness impacts of post-2020 LDV CO2 regulation
Final Report Valdani Vicari & Associati (VVA), Technopolis Group (TG), Joint Institute for Innovation Policy (JIIP), TNO for DG CLIMA 299
A5.2.2. Footprint
Figure 75 shows that in all three definitions the European and Japanese manufacturers have fairly similar
distributions of sales over the range of footprint values, while both Korean OEMs and OEMs in the category
“Other/unknown” have a more peaked distributions with large shares in small vehicles as well as vehicles
with a footprint just above the average. These differences are less pronounced when OEMs are categorised
on the basis of the location of headquarters / owner.
Figure 76 shows that also the average footprint for EU manufacturers is not sensitive to the definition.
Contrary to the case of mass as utility parameter, however, for OEMs from other regions the average
footprint and CO2 value are quite sensitive to the definition used to categorise the OEMs. The average
footprint of OEMs in the category “Other/unknown” is below average for the definitions based on association
membership, but above average for the definition based on the location of headquarters / owner. The
average CO2 emissions of Japanese OEMs are above average if Toyota is categorised as European, but
slightly below average if Toyota is categorised as Japanese.

Assessment of competitiveness impacts of post-2020 LDV CO2 regulation
Final Report Valdani Vicari & Associati (VVA), Technopolis Group (TG), Joint Institute for Innovation Policy (JIIP), TNO for DG CLIMA 300
Based on current main association membership for the EU market
Based on original association membership / intuitive region of origin
Based on location of headquarters / owner
Figure 75 – EU passenger car sales distributions as function of utility: footprint

Assessment of competitiveness impacts of post-2020 LDV CO2 regulation
Final Report Valdani Vicari & Associati (VVA), Technopolis Group (TG), Joint Institute for Innovation Policy (JIIP), TNO for DG CLIMA 301
Based on current main association membership for the EU market
Based on original association membership / intuitive region of origin
Based on location of headquarters / owner
Figure 76 – EU passenger car average CO2 vs. utility: footprint (The sizes of the bubbles indicate the sales volumes in the EU)

Assessment of competitiveness impacts of post-2020 LDV CO2 regulation
Final Report Valdani Vicari & Associati (VVA), Technopolis Group (TG), Joint Institute for Innovation Policy (JIIP), TNO for DG CLIMA 302
A5.2.3. Footprint vs. mass
Figure 77 shows the average footprint vs. average mass for passenger car manufacturers from different
regions based on the three different definitions for categorising the OEMs. This graph confirms that average
footprint is more sensitive than average mass to how one defines the region to which an OEM belongs. On
the other hand the differences between OEMs from different regions appear more pronounced for mass than
for footprint, meaning that the relative stringency of the target for OEMs from different regions will be more
sensitive to the slope of the target function when this is based on mass rather than footprint.

Assessment of competitiveness impacts of post-2020 LDV CO2 regulation
Final Report Valdani Vicari & Associati (VVA), Technopolis Group (TG), Joint Institute for Innovation Policy (JIIP), TNO for DG CLIMA 303
Based on current main association membership for the EU market
Based on original association membership / intuitive region of origin
Based on location of headquarters / owner
Figure 77 – EU passenger car average footprint vs. mass (The sizes of the bubbles indicate the sales volumes in the EU)

Assessment of competitiveness impacts of post-2020 LDV CO2 regulation
Final Report Valdani Vicari & Associati (VVA), Technopolis Group (TG), Joint Institute for Innovation Policy (JIIP), TNO for DG CLIMA 304
A5.2.4. Power-to-weight
Power-to-weight is not a considered utility parameter for post-2020 LDV CO2 legislation, but an evaluation of
sales distributions over this parameter gives insight into one of the origins of why OEMs with different
average utility values may have different average CO2 emissions. Some manufacturers focus more on
sportive or premium models within the different size segments. For such vehicles CO2 emissions are not only
higher, but also applicable technologies for CO2 emission reduction and their costs may be different than for
(volume) manufacturers of more mainstream vehicles.
Different associations, however, are found to have quite comparable sales distributions over the power-to-
weight range, with distributions being most similar if the categorisation is based on location of headquarters /
owner. Korean manufacturers show a more pronounced peak at below-average power-to-weight, but also
have a shoulder in the distribution at above average power-to-weight values. If the categorisation is based
on current main association membership for the EU market, OEMs in the category “Other/unknown” have a
very wide distribution towards higher power-to-mass. In that case this category contains a large number of
small European companies producing sports cars, which are not a member of ACEA. Striking to see is that
European OEMs, although they dominate the premium segment of the market in the EU, show lower sales
shares at above-average power-to-weight values than OEMs from other regions. This must be because the
premium segment remains a relatively small share of the overall sales of EU OEMs.
Figure 79 shows that European, Japanese and Korean OEMs have quite comparable average power-to-
weight, fairly independent of the definition for categorisation. Based on current and original association
membership the OEMs in the category “Other / unknown” clearly have higher average power-to-weight as
well as CO2 emissions. When Ford and GM are added to this category, based on the location of their
headquarter / owner, the average power-to-weight drops to a value just below the average. Average CO2
also drops but to a lesser extent.

Assessment of competitiveness impacts of post-2020 LDV CO2 regulation
Final Report Valdani Vicari & Associati (VVA), Technopolis Group (TG), Joint Institute for Innovation Policy (JIIP), TNO for DG CLIMA 305
Based on current main association membership for the EU market
Based on original association membership / intuitive region of origin
Based on location of headquarters / owner
Figure 78 – EU passenger car sales distributions as function power-to-weight ratio

Assessment of competitiveness impacts of post-2020 LDV CO2 regulation
Final Report Valdani Vicari & Associati (VVA), Technopolis Group (TG), Joint Institute for Innovation Policy (JIIP), TNO for DG CLIMA 306
Based on current main association membership for the EU market
Based on original association membership / intuitive region of origin
Based on location of headquarters / owner
Figure 79 – EU passenger car average CO2 vs power-to-weight ratio (The sizes of the bubbles indicate the sales volumes in the EU)

Assessment of competitiveness impacts of post-2020 LDV CO2 regulation
Final Report Valdani Vicari & Associati (VVA), Technopolis Group (TG), Joint Institute for Innovation Policy (JIIP), TNO for DG CLIMA 307
A5.3 Light commercial vehicles The graphs in this section analyse sales distributions and averages for European, Japanese, Korean and
other manufacturers of light commercial vehicles. Some differences may be noted in the graphs for mass
and footprint which are related to the fact that in the EEA database for LCVs not for all vehicles mass,
footprint and CO2 data are available.
A5.3.1. Mass
Compared to cars the sales distributions for LCVs show a more scattered picture, with a much wider spread
of sales over mass and footprint as well as a less smooth distribution with several pronounced peaks. As far
as mass is concerned, all distributions show a dip in the sales around 1700 kg, indicating a clear
segmentation of the market into lighter and heavier vans. Due to this scattered distribution Figure 80 does
not directly lead to clear conclusions on differences between OEMs from different regions and how these
depend on the definition for categorisation.
Figure 81, however, which indicates total sales and the average mass and CO2 for the various groups,
provides a much clearer picture. First of all it is clear that the LCV market is much more dominated by EU
manufacturers than is the case for passenger cars. Only when Ford and GM are counted as non-European
does on see a significant share of sales from non-EU OEMs. This already indicates that the competition in
the EU market is more between EU OEMs than between EU and non-EU OEMs. For Japanese and Korean
OEMs the average mass and CO2 value are found to be very insensitive to the definition of the categories.
For the category “Other / unknown” average mass and CO2 do depend on the definition. Differences in
average mass between OEMs from different regions are quite significant so that the relative stringency of
average targets will be quite sensitive to the slope of a mass-based target function.

Assessment of competitiveness impacts of post-2020 LDV CO2 regulation
Final Report Valdani Vicari & Associati (VVA), Technopolis Group (TG), Joint Institute for Innovation Policy (JIIP), TNO for DG CLIMA 308
Based on current main association membership for the EU market
Based on original association membership / intuitive region of origin
Based on location of headquarters / owner
Figure 80 – EU LCV sales distributions as function of utility: mass
1000 1500 2000 2500 3000 35000
0.05
0.1
0.15
0.2
0.25
0.3
0.35
0.4
Mass [kg]
Sale
s s
hare
of
tota
l sale
s o
f associa
tion [
-]
ACEA
JAMA
KAMA
OTHER/ukn
1000 1500 2000 2500 3000 35000
0.05
0.1
0.15
0.2
0.25
0.3
0.35
0.4
Mass [kg]
Sale
s s
hare
of
tota
l sale
s o
f associa
tion [
-]
ACEA
JAMA
KAMA
OTHER/ukn
1000 1500 2000 2500 3000 35000
0.05
0.1
0.15
0.2
0.25
0.3
0.35
0.4
Mass [kg]
Sale
s s
hare
of
tota
l sale
s o
f associa
tion [
-]
EU
Japan
Korea
Other/ukn

Assessment of competitiveness impacts of post-2020 LDV CO2 regulation
Final Report Valdani Vicari & Associati (VVA), Technopolis Group (TG), Joint Institute for Innovation Policy (JIIP), TNO for DG CLIMA 309
Based on current main association membership for the EU market
Based on original association membership / intuitive region of origin
Based on location of headquarters / owner
Figure 81 – EU LCV average CO2 vs. utility: mass (The sizes of the bubbles indicate the sales volumes in the EU)
1000 1500 2000 2500 3000 35000
20
40
60
80
100
120
140
160
180
200
220
Mass [kg]
CO
2 e
mis
sio
ns [
g/k
m]
ACEA
JAMA
KAMA
OTHER/ukn
1000 1500 2000 2500 3000 35000
20
40
60
80
100
120
140
160
180
200
220
Mass [kg]
CO
2 e
mis
sio
ns [
g/k
m]
ACEA
JAMA
KAMA
OTHER/ukn
1000 1500 2000 2500 3000 35000
20
40
60
80
100
120
140
160
180
200
220
Mass [kg]
CO
2 e
mis
sio
ns [
g/k
m]
EU
Other/ukn
Japan
Korea

Assessment of competitiveness impacts of post-2020 LDV CO2 regulation
Final Report Valdani Vicari & Associati (VVA), Technopolis Group (TG), Joint Institute for Innovation Policy (JIIP), TNO for DG CLIMA 310
A5.3.2. Footprint
Also for footprint the sales distributions for LCVs are much more scattered than for passenger cars.
Compared to mass the distribution is somewhat more even. EU, Japanese and “other” OEMs still appear to
show a dip separating segments of smaller and larger vans, while this dip is located at a higher average
footprint for the Korean OEMs Also here the scattered distribution makes that Figure 82 does not directly
lead to clear conclusions on differences between OEMs from different regions and how these depend on the
definition for categorisation.
As for mass, however, Figure 83, which indicates total sales and the average footprint and CO2 for the
various groups, provides a much clearer picture. For Japanese and Korean OEMs the average footprint and
CO2 value are found to be very insensitive to the definition of the categories. For the category “Other /
unknown” average footprint and CO2 do depend strongly on the definition. Average footprint is below the
overall average for the definitions based on association membership and above the overall average for the
definition based on location of headquarters / owner. Differences in average footprint between OEMs from
different regions are quite significant so that the relative stringency of average targets will be quite sensitive
to the slope of a footprint-based target function.

Assessment of competitiveness impacts of post-2020 LDV CO2 regulation
Final Report Valdani Vicari & Associati (VVA), Technopolis Group (TG), Joint Institute for Innovation Policy (JIIP), TNO for DG CLIMA 311
Based on current main association membership for the EU market
Based on original association membership / intuitive region of origin
Based on location of headquarters / owner
Figure 82 – EU LCV sales distributions as function of utility: footprint
2 3 4 5 6 7 8 9 100
0.05
0.1
0.15
0.2
0.25
0.3
0.35
0.4
Footprint [m2]
Sale
s s
hare
of
tota
l sale
s o
f associa
tion [
-]
ACEA
JAMA
KAMA
OTHER/ukn
2 3 4 5 6 7 8 9 100
0.05
0.1
0.15
0.2
0.25
0.3
0.35
0.4
Footprint [m2]
Sale
s s
hare
of
tota
l sale
s o
f associa
tion [
-]
ACEA
JAMA
KAMA
OTHER/ukn
2 3 4 5 6 7 8 9 100
0.05
0.1
0.15
0.2
0.25
0.3
0.35
0.4
Footprint [m2]
Sale
s s
hare
of
tota
l sale
s o
f associa
tion [
-]
EU
Japan
Korea
Other/ukn
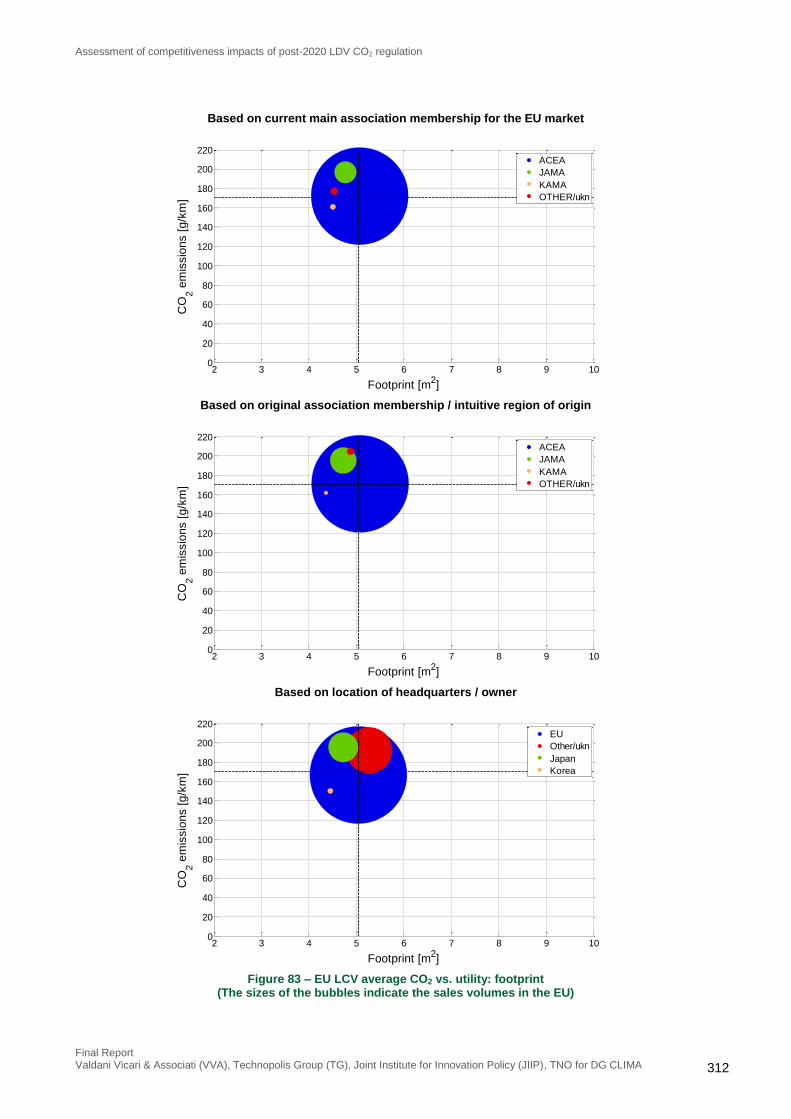
Assessment of competitiveness impacts of post-2020 LDV CO2 regulation
Final Report Valdani Vicari & Associati (VVA), Technopolis Group (TG), Joint Institute for Innovation Policy (JIIP), TNO for DG CLIMA 312
Based on current main association membership for the EU market
Based on original association membership / intuitive region of origin
Based on location of headquarters / owner
Figure 83 – EU LCV average CO2 vs. utility: footprint (The sizes of the bubbles indicate the sales volumes in the EU)
2 3 4 5 6 7 8 9 100
20
40
60
80
100
120
140
160
180
200
220
Footprint [m2]
CO
2 e
mis
sio
ns [
g/k
m]
ACEA
JAMA
KAMA
OTHER/ukn
2 3 4 5 6 7 8 9 100
20
40
60
80
100
120
140
160
180
200
220
Footprint [m2]
CO
2 e
mis
sio
ns [
g/k
m]
ACEA
JAMA
KAMA
OTHER/ukn
2 3 4 5 6 7 8 9 100
20
40
60
80
100
120
140
160
180
200
220
Footprint [m2]
CO
2 e
mis
sio
ns [
g/k
m]
EU
Other/ukn
Japan
Korea

Assessment of competitiveness impacts of post-2020 LDV CO2 regulation
Final Report Valdani Vicari & Associati (VVA), Technopolis Group (TG), Joint Institute for Innovation Policy (JIIP), TNO for DG CLIMA 313
A5.3.3. Footprint vs. mass
Figure 84 shows the average footprint vs. average mass for LCV manufacturers from different regions based
on the three different definitions for categorising the OEMs. Contrary to passenger cars this graph suggests
that average mass is more sensitive than average footprint to how one defines the region to which an OEM
belongs. Similar to passenger cars, the differences between LCV manufacturers from different regions
appear more pronounced for mass than for footprint, meaning that the relative stringency of the target for
OEMs from different regions will be more sensitive to the slope of the target function when this is based on
mass rather than footprint.

Assessment of competitiveness impacts of post-2020 LDV CO2 regulation
Final Report Valdani Vicari & Associati (VVA), Technopolis Group (TG), Joint Institute for Innovation Policy (JIIP), TNO for DG CLIMA 314
Based on current main association membership for the EU market
Based on original association membership / intuitive region of origin
Based on location of headquarters / owner
Figure 84 – EU LCV average footprint vs. mass (The sizes of the bubbles indicate the sales volumes in the EU)
1000 1500 2000 2500 3000 35002
3
4
5
6
7
8
9
10
Mass [kg]
Footp
rint
[m2]
ACEA
JAMA
KAMA
OTHER/ukn
1000 1500 2000 2500 3000 35002
3
4
5
6
7
8
9
10
Mass [kg]
Footp
rint
[m2]
ACEA
JAMA
KAMA
OTHER/ukn
1000 1500 2000 2500 3000 35002
3
4
5
6
7
8
9
10
Mass [kg]
Footp
rint
[m2]
EU
Other/ukn
Japan
Korea

Assessment of competitiveness impacts of post-2020 LDV CO2 regulation
Final Report Valdani Vicari & Associati (VVA), Technopolis Group (TG), Joint Institute for Innovation Policy (JIIP), TNO for DG CLIMA 315
A5.3.4. Power-to-weight
Power-to-weight is not a considered utility parameter for post-2020 LDV CO2 legislation, but - for passenger
cars at least - an evaluation of sales distributions over this parameter gives insight into one of the origins of
why OEMs with different average utility values may have different average CO2 emissions. For LCVs this is
expected to be less the case as there is no distinction between volume and premium models and overall a
more rational approach towards motorisation of the vehicles.
In the LCV market different associations are found to have quite different sales distributions over the power-
to-weight range, as can be seen in Figure 85. Strong similarities, however, are apparent if the categorisation
is based on location of headquarters / owner. This is especially the case for EU OEMs and the category
“Other / unknown” which have strikingly coinciding sales distributions under this definition. It is tempting to
seek the origin in the high level of platform sharing among various OEMs, e.g. Renault and Opel, but then
one would expect this also to show up in the sales distributions as function of mass and footprint.
Figure 86 shows that European, Japanese and Korean OEMs have different average power-to-weight
values, fairly independent of the definition for categorisation. The values for the category “Other / unknown”
depend strongly on the definition. When Ford and GM are added to this category, based on the location of
their headquarter / owner, the average power-to-weight becomes equal to the EU average, with average CO2
some 20 g/km above the EU average.

Assessment of competitiveness impacts of post-2020 LDV CO2 regulation
Final Report Valdani Vicari & Associati (VVA), Technopolis Group (TG), Joint Institute for Innovation Policy (JIIP), TNO for DG CLIMA 316
Based on current main association membership for the EU market
Based on original association membership / intuitive region of origin
Based on location of headquarters / owner
Figure 85 – EU LCV sales distributions as function power-to-weight ratio
0 20 40 60 80 100 120 140 160 1800
0.05
0.1
0.15
0.2
0.25
0.3
0.35
0.4
Power-to-weight [kW/tonne]
Sale
s s
hare
of
tota
l sale
s o
f associa
tion [
-]
ACEA
JAMA
KAMA
OTHER/ukn
0 20 40 60 80 100 120 140 160 1800
0.05
0.1
0.15
0.2
0.25
0.3
0.35
0.4
Power-to-weight [kW/tonne]
Sale
s s
hare
of
tota
l sale
s o
f associa
tion [
-]
ACEA
JAMA
KAMA
OTHER/ukn
0 20 40 60 80 100 120 140 160 1800
0.05
0.1
0.15
0.2
0.25
0.3
0.35
0.4
Power-to-weight [kW/tonne]
Sale
s s
hare
of
tota
l sale
s o
f associa
tion [
-]
EU
Japan
Korea
Other/ukn

Assessment of competitiveness impacts of post-2020 LDV CO2 regulation
Final Report Valdani Vicari & Associati (VVA), Technopolis Group (TG), Joint Institute for Innovation Policy (JIIP), TNO for DG CLIMA 317
Based on current main association membership for the EU market
Based on original association membership / intuitive region of origin
Based on location of headquarters / owner
Figure 86 – EU LCV average CO2 vs. power-to-weight ratio (The sizes of the bubbles indicate the sales volumes in the EU)
0 20 40 60 80 100 120 140 160 1800
20
40
60
80
100
120
140
160
180
200
220
Power-to-weight [kW/tonne]
CO
2 e
mis
sio
ns [
g/k
m]
ACEA
JAMA
KAMA
OTHER/ukn
0 20 40 60 80 100 120 140 160 1800
20
40
60
80
100
120
140
160
180
200
220
Power-to-weight [kW/tonne]
CO
2 e
mis
sio
ns [
g/k
m]
ACEA
JAMA
KAMA
OTHER/ukn
0 20 40 60 80 100 120 140 160 1800
20
40
60
80
100
120
140
160
180
200
220
Power-to-weight [kW/tonne]
CO
2 e
mis
sio
ns [
g/k
m]
EU
Other/ukn
Japan
Korea

Assessment of competitiveness impacts of post-2020 LDV CO2 regulation
Final Report Valdani Vicari & Associati (VVA), Technopolis Group (TG), Joint Institute for Innovation Policy (JIIP), TNO for DG CLIMA 318

Assessment of competitiveness impacts of post-2020 LDV CO2 regulation
Final Report Valdani Vicari & Associati (VVA), Technopolis Group (TG), Joint Institute for Innovation Policy (JIIP), TNO for DG CLIMA 319
Annex 6. International competitiveness
Table 60 - EU-27 net exports of passenger vehicles, by trade partner (mil. U.S.$)
2012 2011
NAFTA 26,910 18,916
EFTA 13,153 12,381
Middle East 7,758 5,859
Russian Federation 11,269 8,868
Republic of Korea -1,806 -2,287
Japan 746 -2,825
China 24,322 21,322
India -1,078 -1,880
TOTAL Main Partners 81,272 60,354
Note: HS 8703.
Table 61 - EU-27 net exports of passenger vehicles, by trade partner (mil. U.S.$)
2012 2011
NAFTA 26,910 18,916
EFTA 13,153 12,381
Middle East 7,758 5,859
Russian Federation 11,269 8,868
Republic of Korea -1,806 -2,287
Japan 746 -2,825
China 24,322 21,322
India -1,078 -1,880
TOTAL Main Partners 81,272 60,354
Note: HS 8703.
Table 62 - EU-27 net exports of light commercial vehicles, by trade partner (mil. U.S.$)
2012 2011
NAFTA 355 265
EFTA 1,033 1,034
Middle East -2,037 -2,737
Russian Federation 751 553
Republic of Korea -23 -27
Japan -27 -193
China 2 35
India -6 -12
TOTAL Main Partners 50 -1,082
Note: The light commercial vehicles are defined as trucks with gross weight under five tons. This definition differs from
the definition used by the EU commission (trucks and vans with the gross weight under 3.5 tons). However, this is the
closest definition that can be found in the Harmonized System coding system of international trade.

Assessment of competitiveness impacts of post-2020 LDV CO2 regulation
Final Report Valdani Vicari & Associati (VVA), Technopolis Group (TG), Joint Institute for Innovation Policy (JIIP), TNO for DG CLIMA 320
Table 63 - EU-27 net exports of components, by trade partner (mil. U.S.$)
2012 2011
NAFTA 10,688 8,080
EFTA -10 -125
Middle East 2,662 2,942
Russian Federation 3,994 3,333
Republic of Korea -193 -87
Japan -3,893 -4,058
China 6,007 4,692
India 476 403
TOTAL Main Partners 19,732 15,180
Table 64 - The revealed comparative advantage coefficient in passenger vehicles
2012 2011
EU-27 1.71 1.69
Japan 3.26 2.93
Rep. of Korea 2.07 2.04
Turkey 1.06 1.33
USA 0.94 0.90
India 0.39 0.33
Canada 2.77 2.44
China 0.06 0.05
Mexico 2.10 2.12
Russian Federation 0.05 0.03
Note: The Balassa RCA index.
Table 65 - The revealed comparative advantage coefficient in light commercial vehicles
2012 2011
EU-27 0.68 0.67
Canada 0.10 0.05
China 0.18 0.18
Japan 0.95 0.96
Mexico 7.51 7.19
Norway 0.01 0.01
Rep. of Korea 0.92 1.02
Russian Federation 0.07 0.04
Switzerland 0.03 0.03
Turkey 5.09 7.61
Note: The Balassa RCA index.

Assessment of competitiveness impacts of post-2020 LDV CO2 regulation
Final Report Valdani Vicari & Associati (VVA), Technopolis Group (TG), Joint Institute for Innovation Policy (JIIP), TNO for DG CLIMA 321
Table 66 - The revealed comparative advantage coefficient in automotive components
2012 2011
EU-27 1.35 1.36
China 0.46 0.47
India 0.30 0.30
Japan 3.25 3.06
Mexico 2.55 2.52
Rep. of Korea 1.00 0.80
Russian Federation 0.09 0.03
Switzerland 0.26 0.26
Turkey 1.22 1.42
USA 1.15 1.12
Note: The Balassa RCA index.