Competitiveness: Creating a Mongolian Economic Strategy Files/Mongolia - CAON 07-22-08... ·...
55
1 GCR South Africa 062007.ppt Copyright © 2007 Professor Michael E. Porter This presentation draws on ideas from Professor Porter’s articles and books, in particular, The Competitive Advantage of Nations (The Free Press, 1990), “Building the Microeconomic Foundations of Competitiveness,” in The Global Competitiveness Report 2006 (World Economic Forum, 2006), “Clusters and the New Competitive Agenda for Companies and Governments” in On Competition (Harvard Business School Press, 1998), and ongoing research on clusters and competitiveness. No part of this publication may be reproduced, stored in a retrieval system, or transmitted in any form or by any means - electronic, mechanical, photocopying, recording, or otherwise - without the permission of Michael E. Porter. Further information on Professor Porter’s work and the Institute for Strategy and Competitiveness is available at www.isc.hbs.edu Version: July 21, 2008, 4pm Competitiveness: Creating a Mongolian Economic Strategy Professor Michael E. Porter Institute for Strategy and Competitiveness Harvard Business School July, 2008
Transcript of Competitiveness: Creating a Mongolian Economic Strategy Files/Mongolia - CAON 07-22-08... ·...
1 GCR South Africa 062007.ppt
Copyright © 2007 Professor Michael E. Porter
This presentation draws on ideas from Professor Porter’s articles and books, in particular, The Competitive Advantage of Nations (The Free Press,
1990), “Building the Microeconomic Foundations of Competitiveness,” in The Global Competitiveness Report 2006 (World Economic Forum, 2006),
“Clusters and the New Competitive Agenda for Companies and Governments” in On Competition (Harvard Business School Press, 1998), and
ongoing research on clusters and competitiveness. No part of this publication may be reproduced, stored in a retrieval system, or transmitted in any
form or by any means - electronic, mechanical, photocopying, recording, or otherwise - without the permission of Michael E. Porter.
Further information on Professor Porter’s work and the Institute for Strategy and Competitiveness is available at www.isc.hbs.edu
Version: July 21, 2008, 4pm
Competitiveness: Creating a Mongolian
Economic Strategy
Professor Michael E. Porter
Institute for Strategy and Competitiveness
Harvard Business School
July, 2008
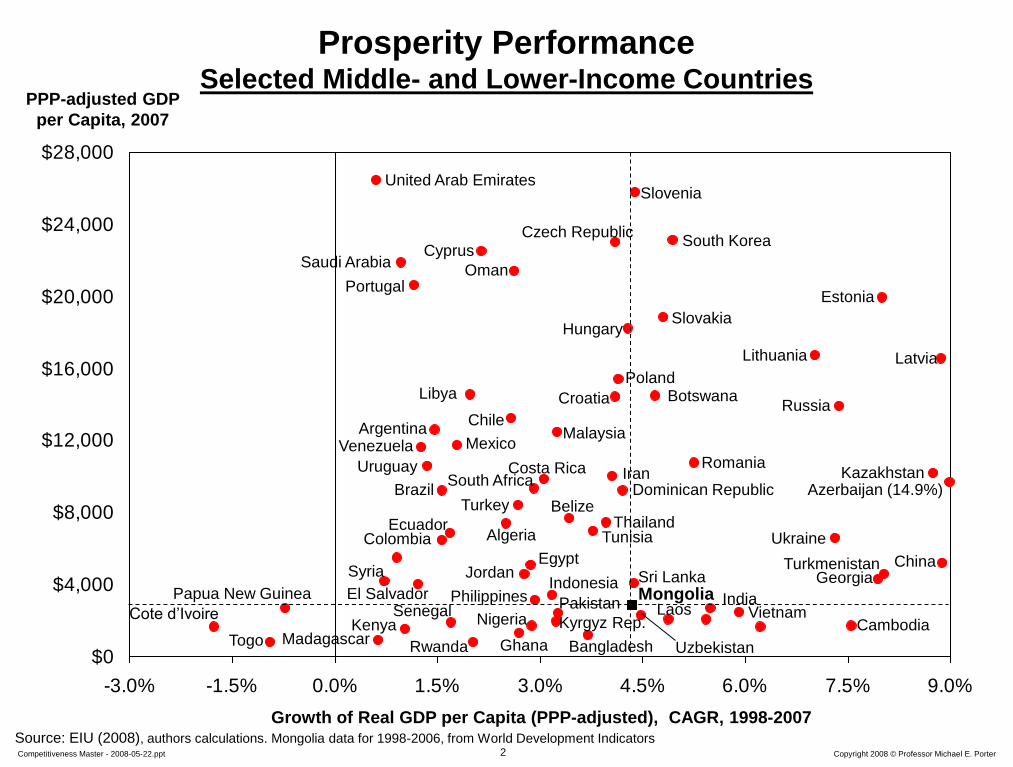
2 Copyright 2008 © Professor Michael E. Porter Competitiveness Master - 2008-05-22.ppt
$0
$4,000
$8,000
$12,000
$16,000
$20,000
$24,000
$28,000
-3.0% -1.5% 0.0% 1.5% 3.0% 4.5% 6.0% 7.5% 9.0%
Prosperity Performance Selected Middle- and Lower-Income Countries
PPP-adjusted GDP
per Capita, 2007
Growth of Real GDP per Capita (PPP-adjusted), CAGR, 1998-2007 Source: EIU (2008), authors calculations. Mongolia data for 1998-2006, from World Development Indicators
United Arab Emirates
China
Vietnam
Poland
Russia
Saudi Arabia
Turkey Thailand
Chile
Croatia
Philippines
Mexico
Brazil
India
Iran
Indonesia
Argentina Malaysia
South Africa Romania
Lithuania
Ukraine
Cambodia
Sri Lanka
Togo
Venezuela
Bangladesh
Egypt
Cote d’Ivoire
Dominican Republic
Tunisia
Libya
Costa Rica
Colombia
El Salvador
Portugal
Czech Republic Cyprus
Estonia
Latvia
Hungary Slovakia
Kenya
Slovenia
South Korea
Senegal
Botswana
Laos
Ghana
Jordan
Belize
Uruguay
Nigeria Pakistan
Syria
Papua New Guinea
Madagascar
Georgia
Oman
Rwanda
Ecuador Algeria
Mongolia
Azerbaijan (14.9%)
Turkmenistan
Uzbekistan
Kyrgyz Rep.
Kazakhstan
3 Copyright 2008 © Professor Michael E. Porter Competitiveness Master - 2008-05-22.ppt
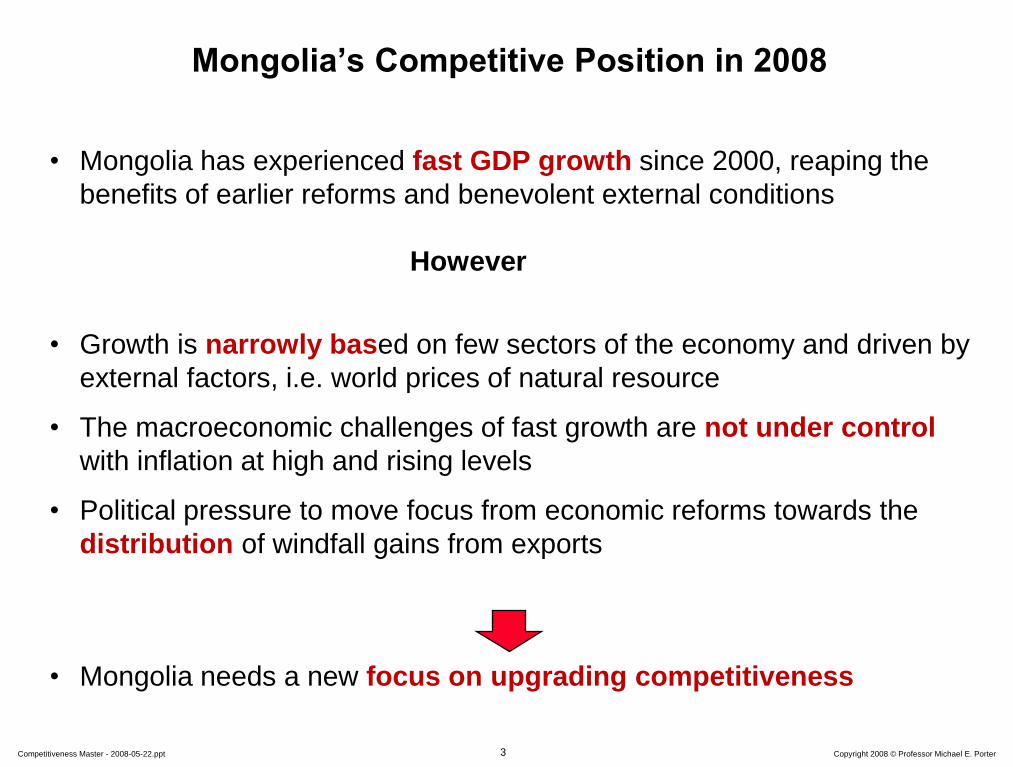
Mongolia’s Competitive Position in 2008
• Mongolia has experienced fast GDP growth since 2000, reaping the
benefits of earlier reforms and benevolent external conditions
However
• Growth is narrowly based on few sectors of the economy and driven by
external factors, i.e. world prices of natural resource
• The macroeconomic challenges of fast growth are not under control
with inflation at high and rising levels
• Political pressure to move focus from economic reforms towards the
distribution of windfall gains from exports
• Mongolia needs a new focus on upgrading competitiveness
4 Copyright 2008 © Professor Michael E. Porter Competitiveness Master - 2008-05-22.ppt
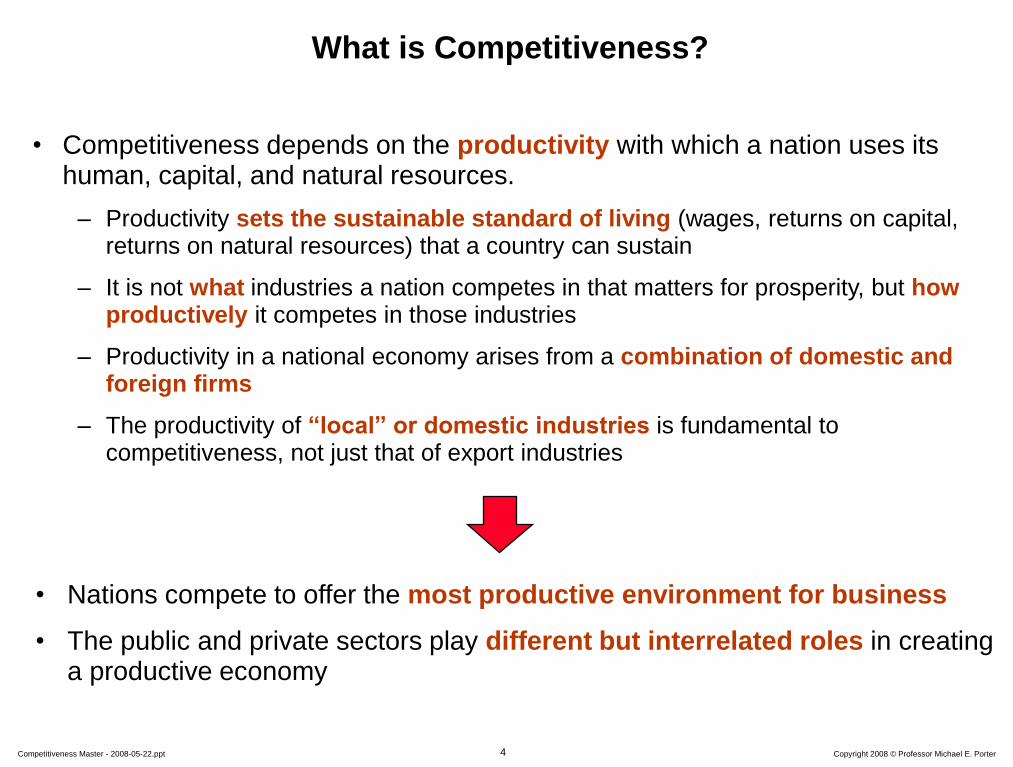
What is Competitiveness?
• Nations compete to offer the most productive environment for business
• The public and private sectors play different but interrelated roles in creating a productive economy
• Competitiveness depends on the productivity with which a nation uses its human, capital, and natural resources.
– Productivity sets the sustainable standard of living (wages, returns on capital, returns on natural resources) that a country can sustain
– It is not what industries a nation competes in that matters for prosperity, but how productively it competes in those industries
– Productivity in a national economy arises from a combination of domestic and foreign firms
– The productivity of “local” or domestic industries is fundamental to competitiveness, not just that of export industries
5 Copyright 2008 © Professor Michael E. Porter Competitiveness Master - 2008-05-22.ppt
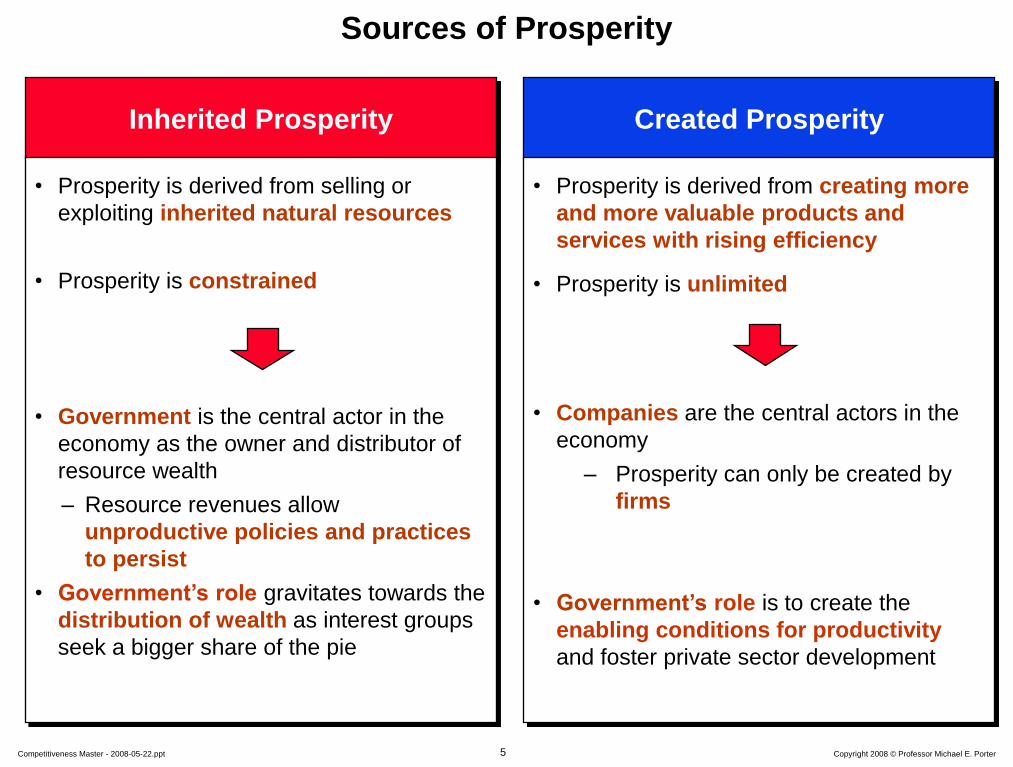
Sources of Prosperity
Inherited Prosperity
• Prosperity is derived from selling or
exploiting inherited natural resources
• Prosperity is constrained
• Government is the central actor in the
economy as the owner and distributor of
resource wealth
– Resource revenues allow
unproductive policies and practices
to persist
• Government’s role gravitates towards the
distribution of wealth as interest groups
seek a bigger share of the pie
Created Prosperity
• Prosperity is derived from creating more
and more valuable products and
services with rising efficiency
• Prosperity is unlimited
• Companies are the central actors in the
economy
– Prosperity can only be created by
firms
• Government’s role is to create the
enabling conditions for productivity
and foster private sector development
6 Copyright 2008 © Professor Michael E. Porter Competitiveness Master - 2008-05-22.ppt
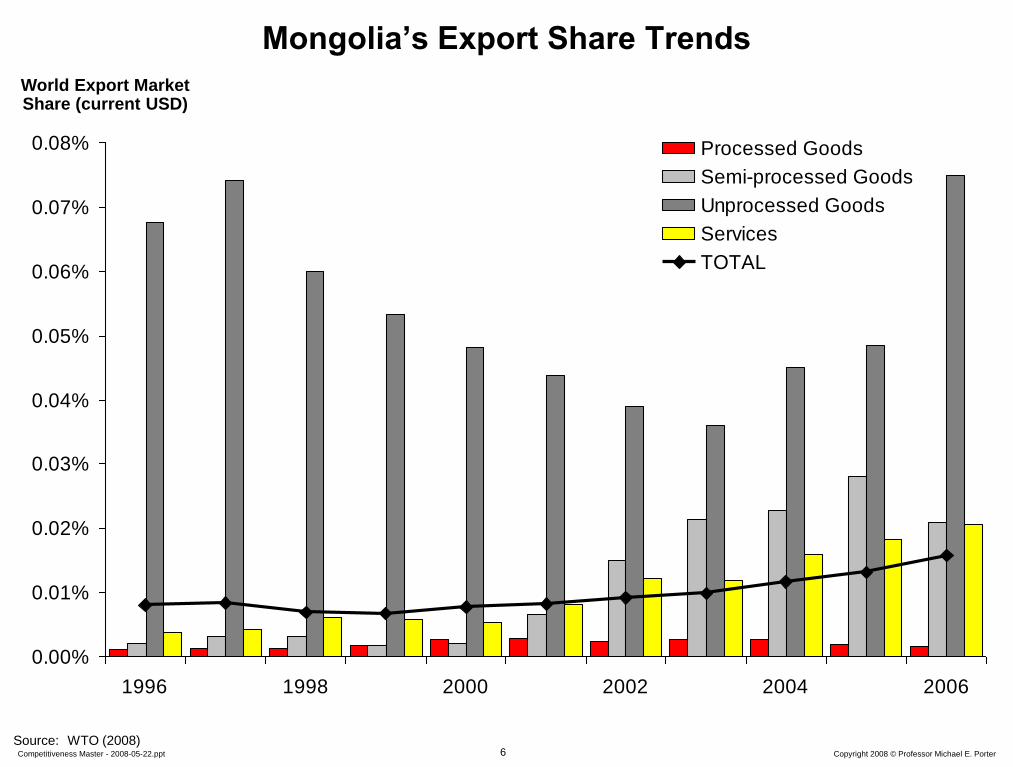
Mongolia’s Export Share Trends
0.00%
0.01%
0.02%
0.03%
0.04%
0.05%
0.06%
0.07%
0.08%
1996 1998 2000 2002 2004 2006
Processed Goods
Semi-processed Goods
Unprocessed Goods
Services
TOTAL
Source: WTO (2008)
World Export Market Share (current USD)
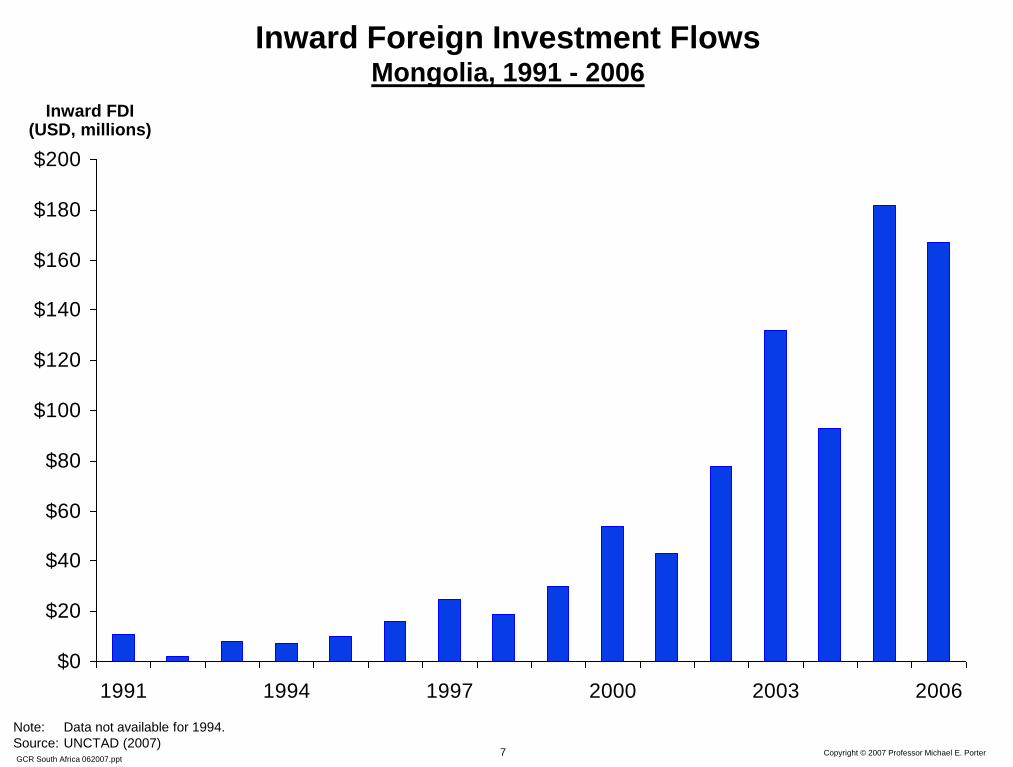
7 GCR South Africa 062007.ppt
Copyright © 2007 Professor Michael E. Porter
Inward Foreign Investment Flows Mongolia, 1991 - 2006
$0
$20
$40
$60
$80
$100
$120
$140
$160
$180
$200
1991 1994 1997 2000 2003 2006
Note: Data not available for 1994.
Source: UNCTAD (2007)
Inward FDI (USD, millions)
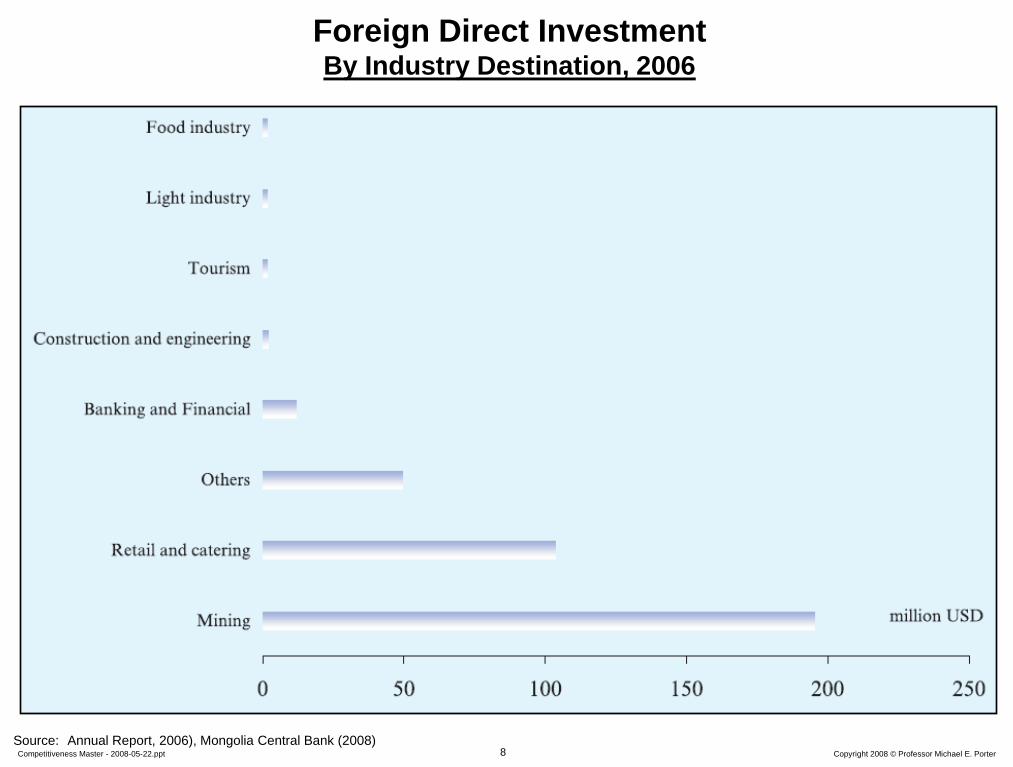
8 Copyright 2008 © Professor Michael E. Porter Competitiveness Master - 2008-05-22.ppt
Foreign Direct Investment By Industry Destination, 2006
Source: Annual Report, 2006), Mongolia Central Bank (2008)
9 Copyright 2008 © Professor Michael E. Porter Competitiveness Master - 2008-05-22.ppt
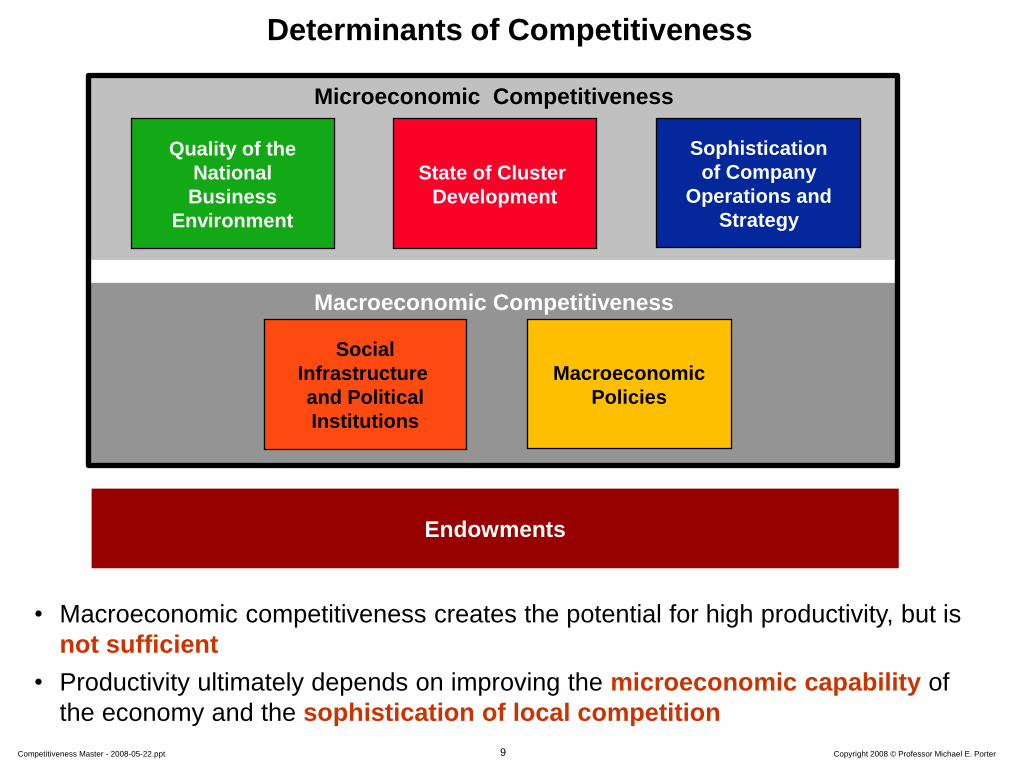
Macroeconomic Competitiveness
Microeconomic Competitiveness
Sophistication
of Company
Operations and
Strategy
Quality of the
National
Business
Environment
Macroeconomic
Policies
Social
Infrastructure
and Political
Institutions
State of Cluster
Development
• Macroeconomic competitiveness creates the potential for high productivity, but is
not sufficient
• Productivity ultimately depends on improving the microeconomic capability of
the economy and the sophistication of local competition
Determinants of Competitiveness
Endowments
10 Copyright 2008 © Professor Michael E. Porter Competitiveness Master - 2008-05-22.ppt
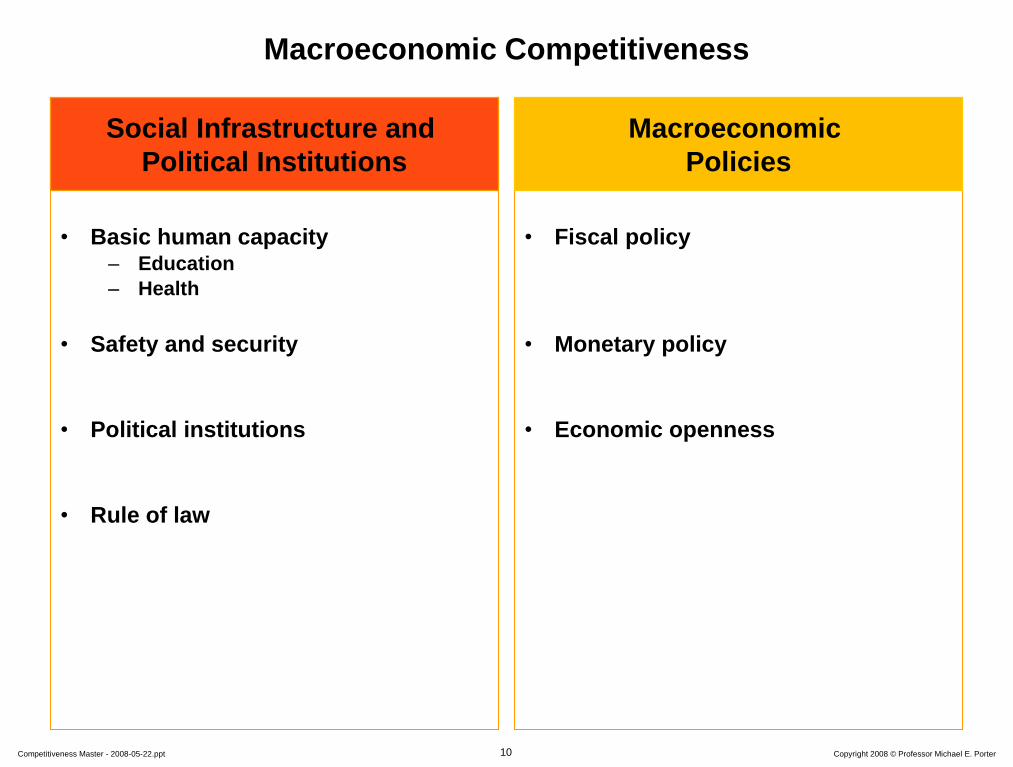
Macroeconomic Competitiveness
• Basic human capacity – Education
– Health
• Safety and security
• Political institutions
• Rule of law
• Fiscal policy
• Monetary policy
• Economic openness
Social Infrastructure and
Political Institutions
Macroeconomic
Policies
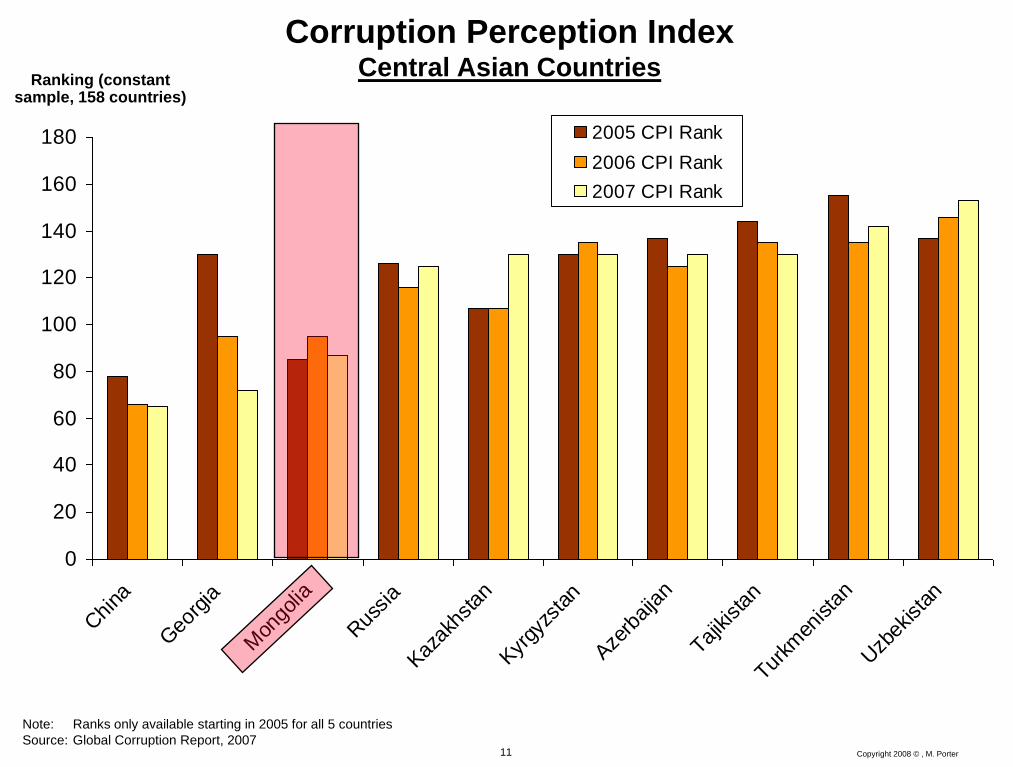
11 Copyright 2008 © , M. Porter
Corruption Perception Index Central Asian Countries
0
20
40
60
80
100
120
140
160
180
Chi
na
Geo
rgia
Mon
golia
Rus
sia
Kaz
akhs
tan
Kyr
gyzs
tan
Aze
rbaija
n
Tajikista
n
Turkm
enista
n
Uzb
ekista
n
2005 CPI Rank
2006 CPI Rank
2007 CPI Rank
Ranking (constant sample, 158 countries)
Note: Ranks only available starting in 2005 for all 5 countries
Source: Global Corruption Report, 2007
12 Copyright 2008 © , M. Porter
0
20
40
60
80
100
120
140
160
Kaz
akhst
an
Bulga
ria
Rom
ania
Arm
enia
Ukr
aine
Mon
golia
Kyr
gyz Rep
ublic
Turkm
enista
n
Aze
rbaijan
Tajikista
n
Thaila
nd
Indo
nesia
Bur
ma
Chin
a
Sri
Lank
a
Uzb
ekista
n
Kor
ea, S
outh
Pak
ista
n
Vietn
am Iran
Laos
Cam
bodia
India
Russ
ia
Ban
glade
sh
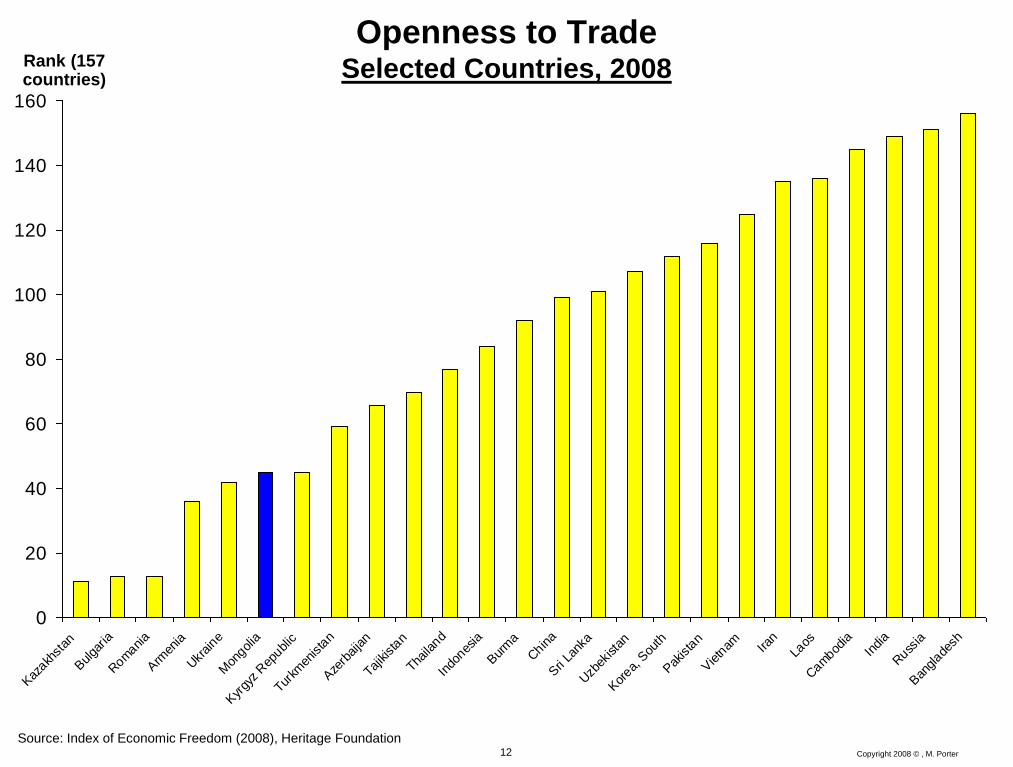
Openness to Trade Selected Countries, 2008 Rank (157
countries)
Source: Index of Economic Freedom (2008), Heritage Foundation
13 Copyright 2008 © Professor Michael E. Porter Competitiveness Master - 2008-05-22.ppt
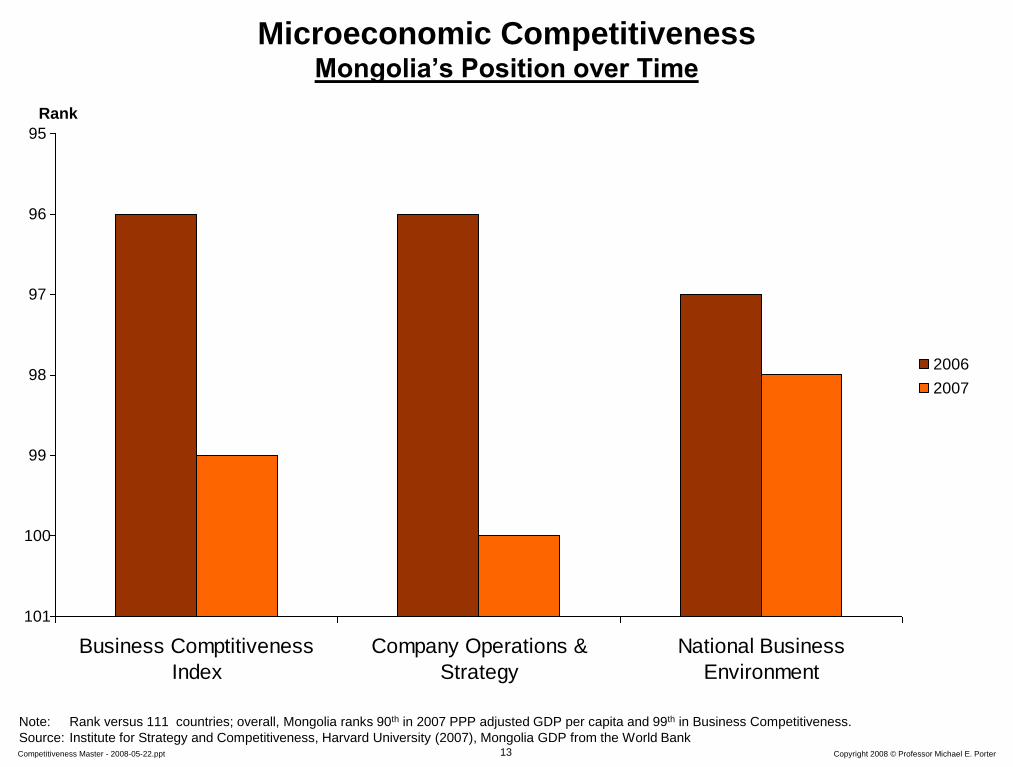
Business Comptitiveness
Index
Company Operations &
Strategy
National Business
Environment
2006
2007
Microeconomic Competitiveness Mongolia’s Position over Time
Rank
101
95
97
99
96
98
100
Note: Rank versus 111 countries; overall, Mongolia ranks 90th in 2007 PPP adjusted GDP per capita and 99th in Business Competitiveness.
Source: Institute for Strategy and Competitiveness, Harvard University (2007), Mongolia GDP from the World Bank
14 Copyright 2008 © Professor Michael E. Porter Competitiveness Master - 2008-05-22.ppt
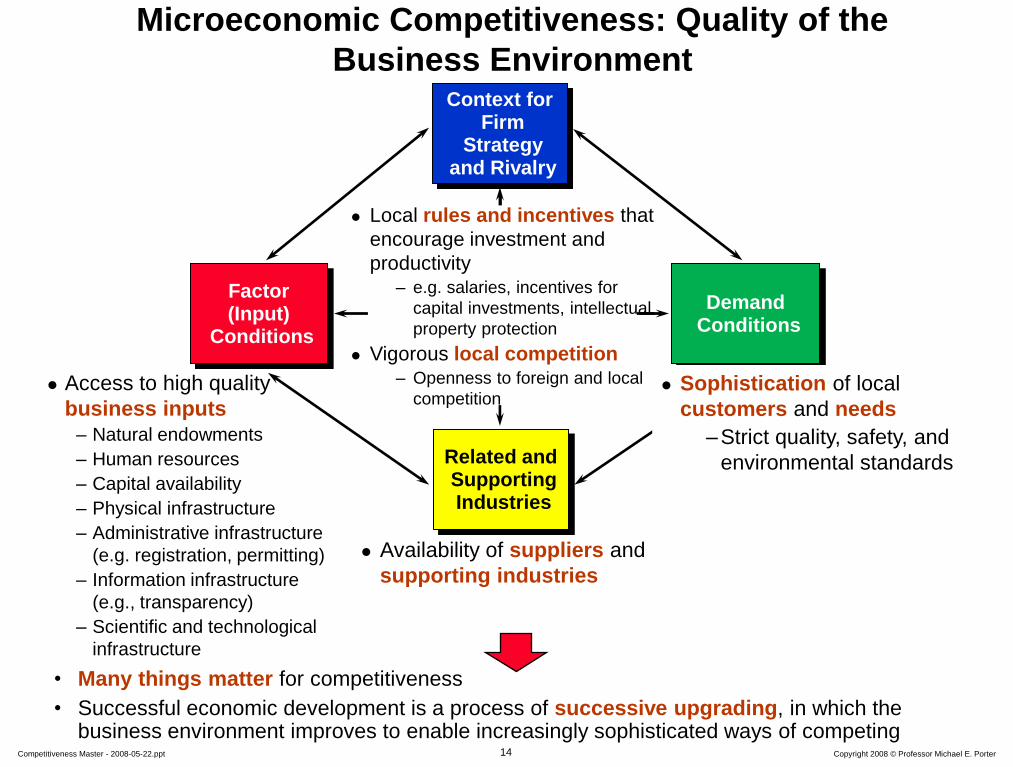
Access to high quality
business inputs
– Natural endowments
– Human resources
– Capital availability
– Physical infrastructure
– Administrative infrastructure
(e.g. registration, permitting)
– Information infrastructure
(e.g., transparency)
– Scientific and technological
infrastructure
Microeconomic Competitiveness: Quality of the
Business Environment Context for
Firm Strategy
and Rivalry
Related and Supporting Industries
Factor (Input)
Conditions
Demand Conditions
Availability of suppliers and
supporting industries
Sophistication of local
customers and needs
–Strict quality, safety, and
environmental standards
• Many things matter for competitiveness
• Successful economic development is a process of successive upgrading, in which the business environment improves to enable increasingly sophisticated ways of competing
Local rules and incentives that
encourage investment and
productivity – e.g. salaries, incentives for
capital investments, intellectual
property protection
Vigorous local competition – Openness to foreign and local
competition
15 Copyright 2008 © Professor Michael E. Porter Competitiveness Master - 2008-05-22.ppt
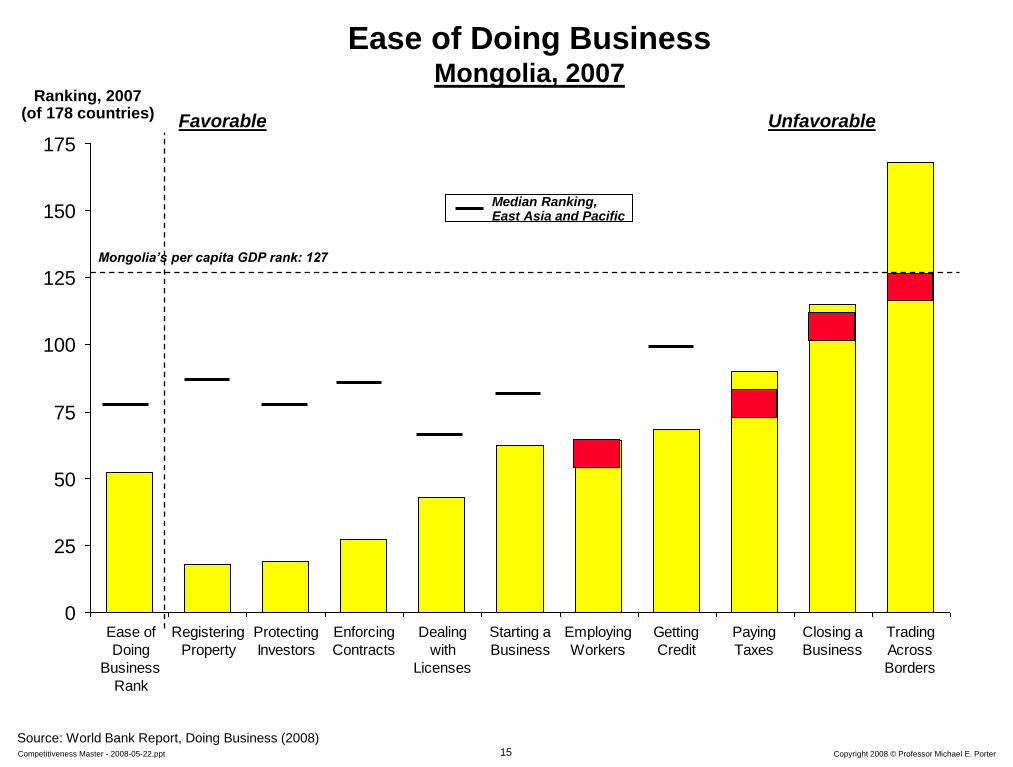
0
25
50
75
100
125
150
175
Ease of
Doing
Business
Rank
Registering
Property
Protecting
Investors
Enforcing
Contracts
Dealing
with
Licenses
Starting a
Business
Employing
Workers
Getting
Credit
Paying
Taxes
Closing a
Business
Trading
Across
Borders
Ease of Doing Business Mongolia, 2007
Ranking, 2007 (of 178 countries)
Source: World Bank Report, Doing Business (2008)
Favorable Unfavorable
Mongolia’s per capita GDP rank: 127
Median Ranking, East Asia and Pacific
16 Copyright 2008 © Professor Michael E. Porter Competitiveness Master - 2008-05-22.ppt
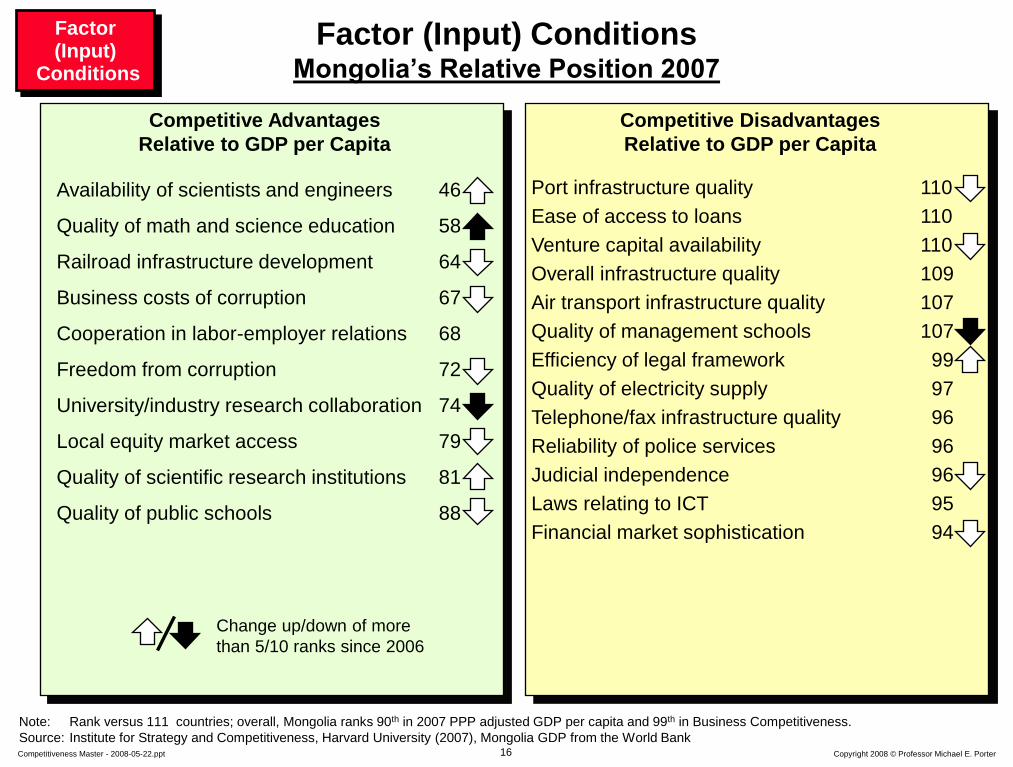
Availability of scientists and engineers 46
Quality of math and science education 58
Railroad infrastructure development 64
Business costs of corruption 67
Cooperation in labor-employer relations 68
Freedom from corruption 72
University/industry research collaboration 74
Local equity market access 79
Quality of scientific research institutions 81
Quality of public schools 88
Competitive Disadvantages
Relative to GDP per Capita
Competitive Advantages
Relative to GDP per Capita
Port infrastructure quality 110
Ease of access to loans 110
Venture capital availability 110
Overall infrastructure quality 109
Air transport infrastructure quality 107
Quality of management schools 107
Efficiency of legal framework 99
Quality of electricity supply 97
Telephone/fax infrastructure quality 96
Reliability of police services 96
Judicial independence 96
Laws relating to ICT 95
Financial market sophistication 94
Factor (Input) Conditions Mongolia’s Relative Position 2007
Factor (Input)
Conditions
Change up/down of more
than 5/10 ranks since 2006
Note: Rank versus 111 countries; overall, Mongolia ranks 90th in 2007 PPP adjusted GDP per capita and 99th in Business Competitiveness.
Source: Institute for Strategy and Competitiveness, Harvard University (2007), Mongolia GDP from the World Bank
17 Copyright 2008 © Professor Michael E. Porter Competitiveness Master - 2008-05-22.ppt
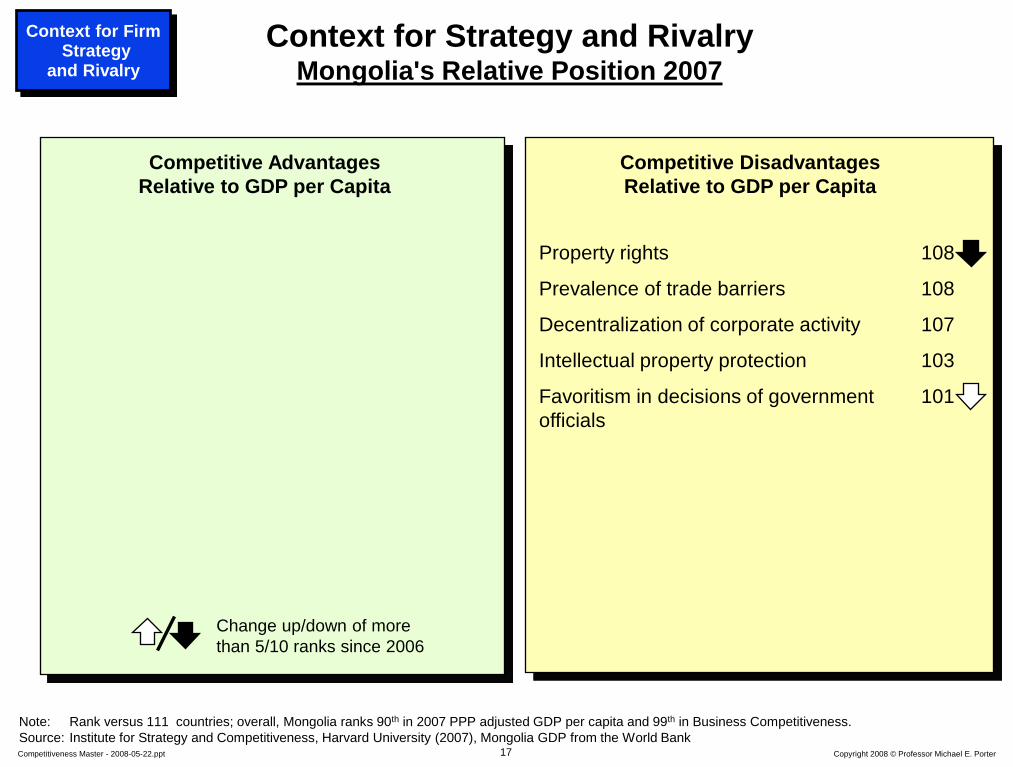
Context for Strategy and Rivalry Mongolia's Relative Position 2007
Competitive Disadvantages
Relative to GDP per Capita
Competitive Advantages
Relative to GDP per Capita
Property rights 108
Prevalence of trade barriers 108
Decentralization of corporate activity 107
Intellectual property protection 103
Favoritism in decisions of government 101
officials
Context for Firm Strategy
and Rivalry
Note: Rank versus 111 countries; overall, Mongolia ranks 90th in 2007 PPP adjusted GDP per capita and 99th in Business Competitiveness.
Source: Institute for Strategy and Competitiveness, Harvard University (2007), Mongolia GDP from the World Bank
Change up/down of more
than 5/10 ranks since 2006
18 Copyright 2008 © Professor Michael E. Porter Competitiveness Master - 2008-05-22.ppt
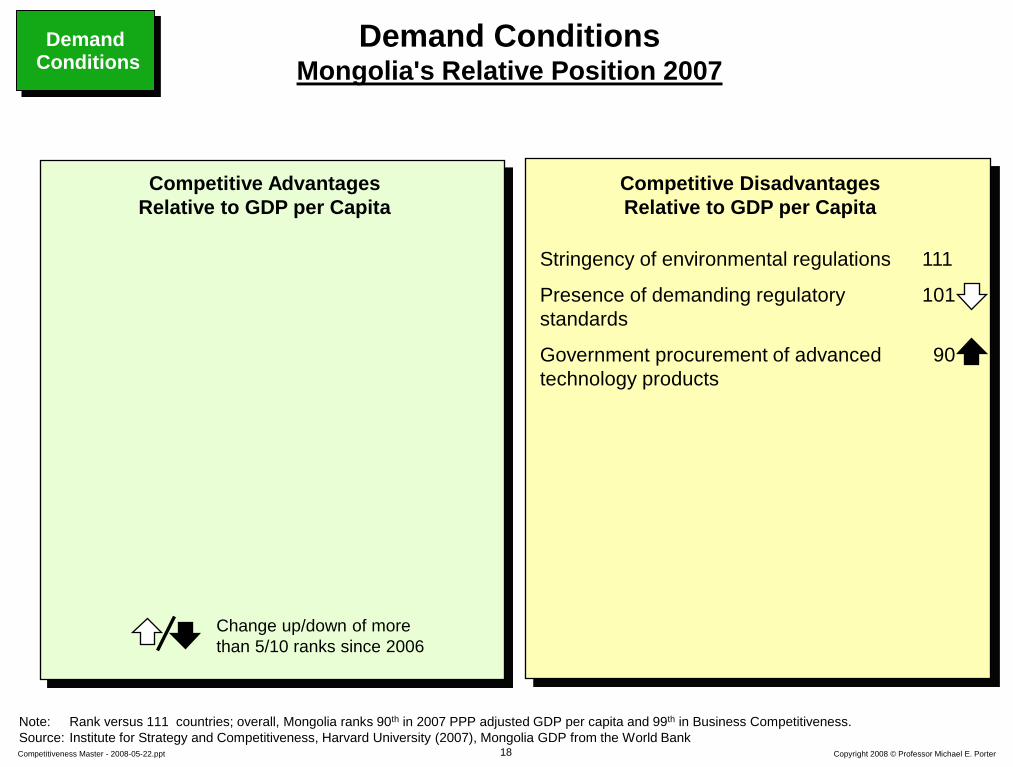
Demand Conditions Mongolia's Relative Position 2007
Competitive Disadvantages
Relative to GDP per Capita
Competitive Advantages
Relative to GDP per Capita
Demand Conditions
Stringency of environmental regulations 111
Presence of demanding regulatory 101
standards
Government procurement of advanced 90
technology products
Note: Rank versus 111 countries; overall, Mongolia ranks 90th in 2007 PPP adjusted GDP per capita and 99th in Business Competitiveness.
Source: Institute for Strategy and Competitiveness, Harvard University (2007), Mongolia GDP from the World Bank
Change up/down of more
than 5/10 ranks since 2006
19 Copyright 2008 © Professor Michael E. Porter Competitiveness Master - 2008-05-22.ppt
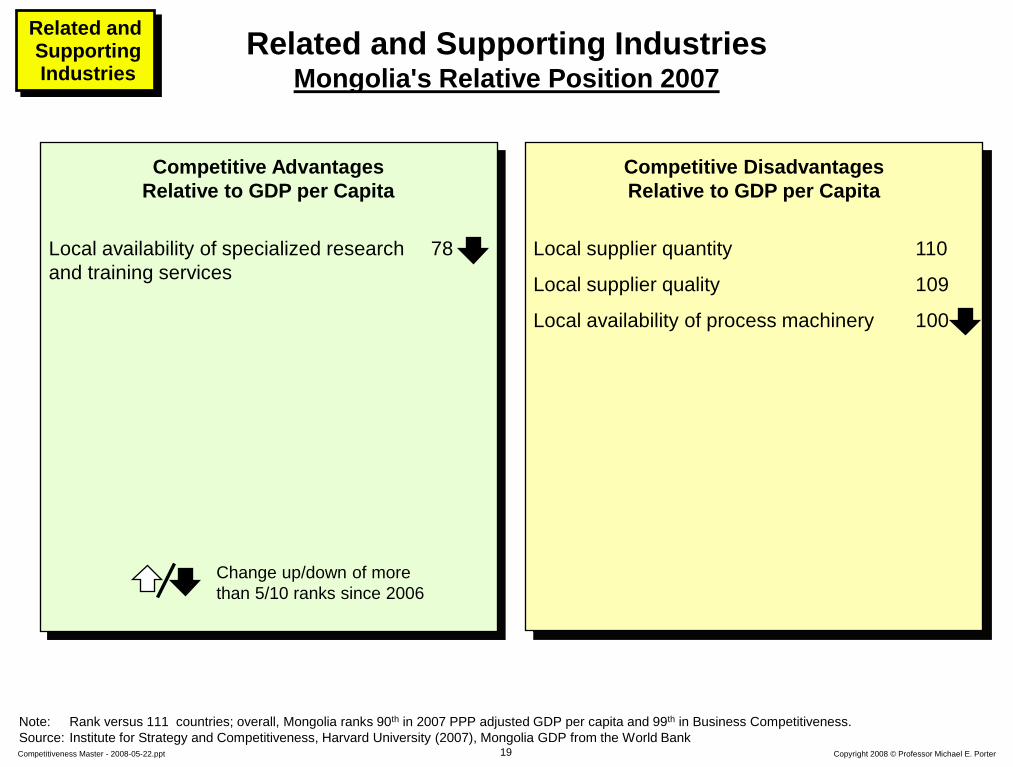
Related and Supporting Industries Mongolia's Relative Position 2007
Competitive Disadvantages
Relative to GDP per Capita
Competitive Advantages
Relative to GDP per Capita
Related and Supporting Industries
Local availability of specialized research 78
and training services
Local supplier quantity 110
Local supplier quality 109
Local availability of process machinery 100
Note: Rank versus 111 countries; overall, Mongolia ranks 90th in 2007 PPP adjusted GDP per capita and 99th in Business Competitiveness.
Source: Institute for Strategy and Competitiveness, Harvard University (2007), Mongolia GDP from the World Bank
Change up/down of more
than 5/10 ranks since 2006
20 Copyright 2008 © Professor Michael E. Porter Competitiveness Master - 2008-05-22.ppt
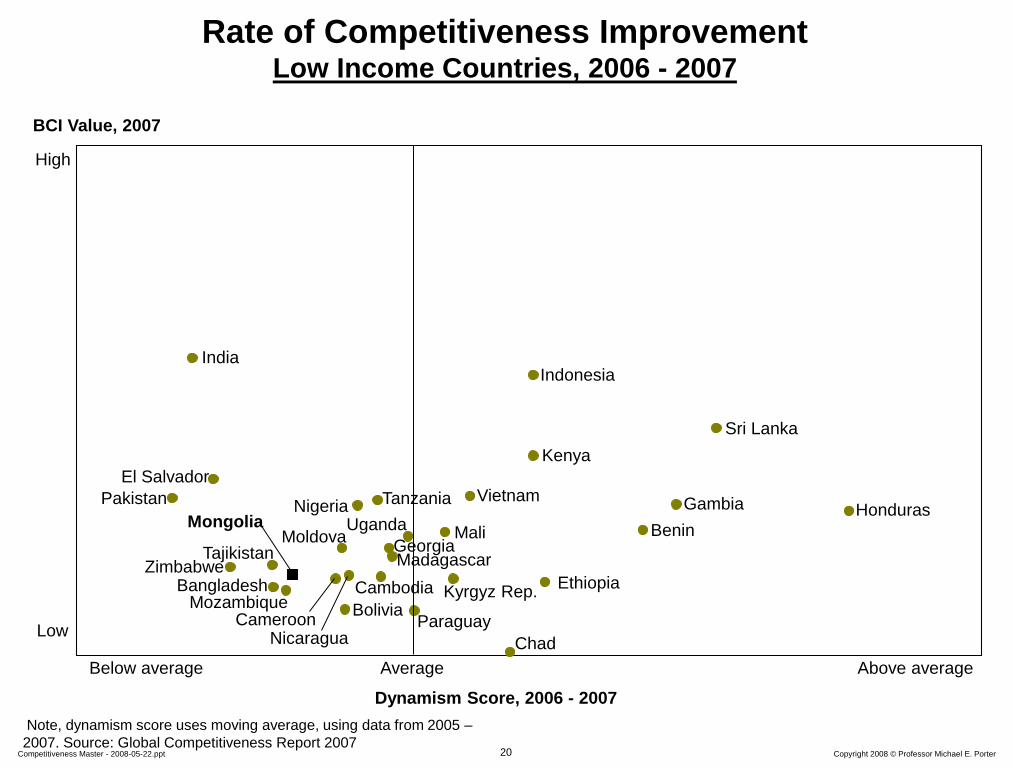
BCI Value, 2007
Dynamism Score, 2006 - 2007
High
Low
Below average Above average Average
Rate of Competitiveness Improvement Low Income Countries, 2006 - 2007
Note, dynamism score uses moving average, using data from 2005 –
2007. Source: Global Competitiveness Report 2007
Benin
Zimbabwe
Uganda
Tanzania Honduras
Indonesia
Sri Lanka
Bolivia
Mali
Kenya
Pakistan
Nicaragua
India
Bangladesh
Paraguay
El Salvador
Chad
Mozambique
Madagascar
Nigeria Vietnam
Gambia
Ethiopia
Cameroon
Moldova Mongolia
Tajikistan
Kyrgyz Rep.
Georgia
Cambodia
21 Copyright 2008 © Professor Michael E. Porter Competitiveness Master - 2008-05-22.ppt
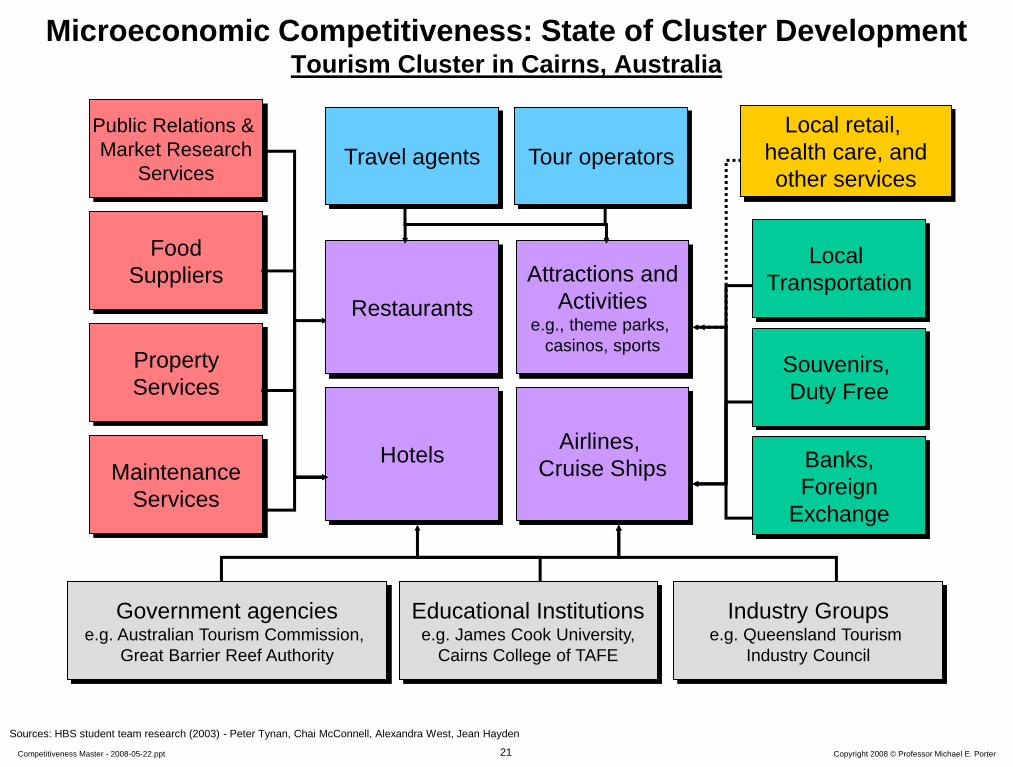
Sources: HBS student team research (2003) - Peter Tynan, Chai McConnell, Alexandra West, Jean Hayden
Hotels
Attractions and
Activities e.g., theme parks,
casinos, sports
Airlines,
Cruise Ships
Travel agents Tour operators
Restaurants
Property
Services
Maintenance
Services
Government agencies e.g. Australian Tourism Commission,
Great Barrier Reef Authority
Educational Institutions e.g. James Cook University,
Cairns College of TAFE
Industry Groups e.g. Queensland Tourism
Industry Council
Food
Suppliers
Public Relations &
Market Research
Services
Local retail,
health care, and
other services
Souvenirs,
Duty Free
Banks,
Foreign
Exchange
Local
Transportation
Microeconomic Competitiveness: State of Cluster Development Tourism Cluster in Cairns, Australia
22 Copyright 2008 © Professor Michael E. Porter Competitiveness Master - 2008-05-22.ppt
$0
$50,000
$100,000
$150,000
$200,000
$250,000
$300,000
$350,000
1990 1992 1994 1996 1998 2000 2002 2004 2006
0.0%
0.5%
1.0%
1.5%
2.0%
2.5%
3.0%
3.5%
4.0%
4.5%
5.0%
Value
Market Share
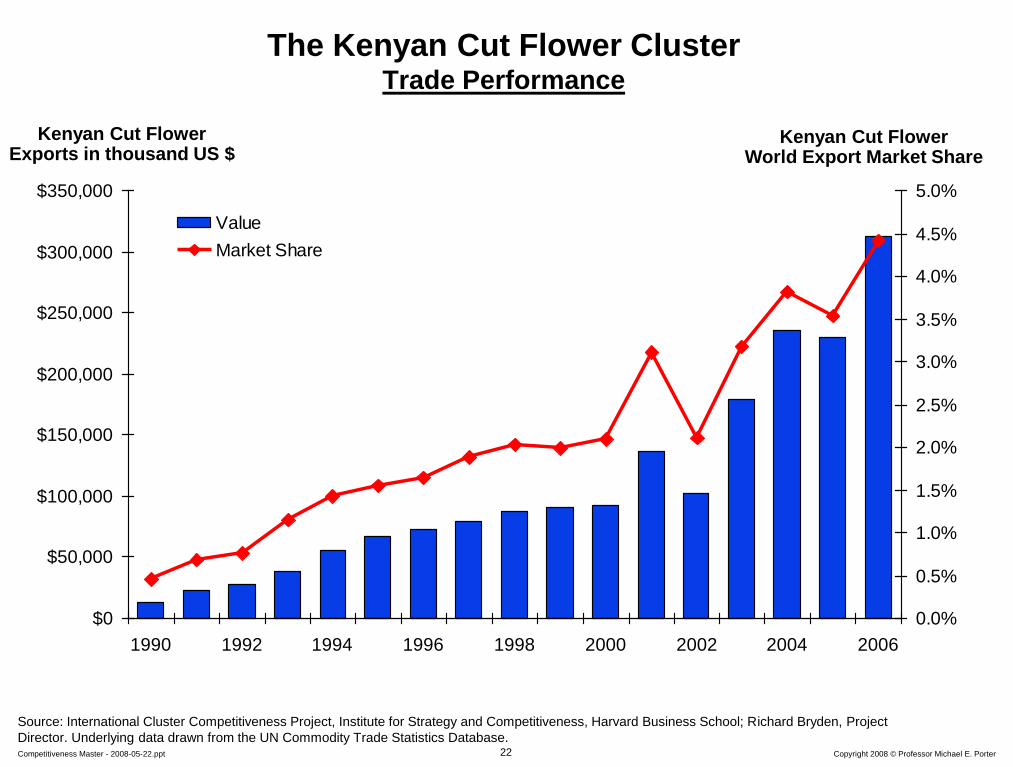
The Kenyan Cut Flower Cluster Trade Performance
Kenyan Cut Flower Exports in thousand US $
Kenyan Cut Flower World Export Market Share
Source: International Cluster Competitiveness Project, Institute for Strategy and Competitiveness, Harvard Business School; Richard Bryden, Project
Director. Underlying data drawn from the UN Commodity Trade Statistics Database.
23 Copyright 2008 © Professor Michael E. Porter Competitiveness Master - 2008-05-22.ppt
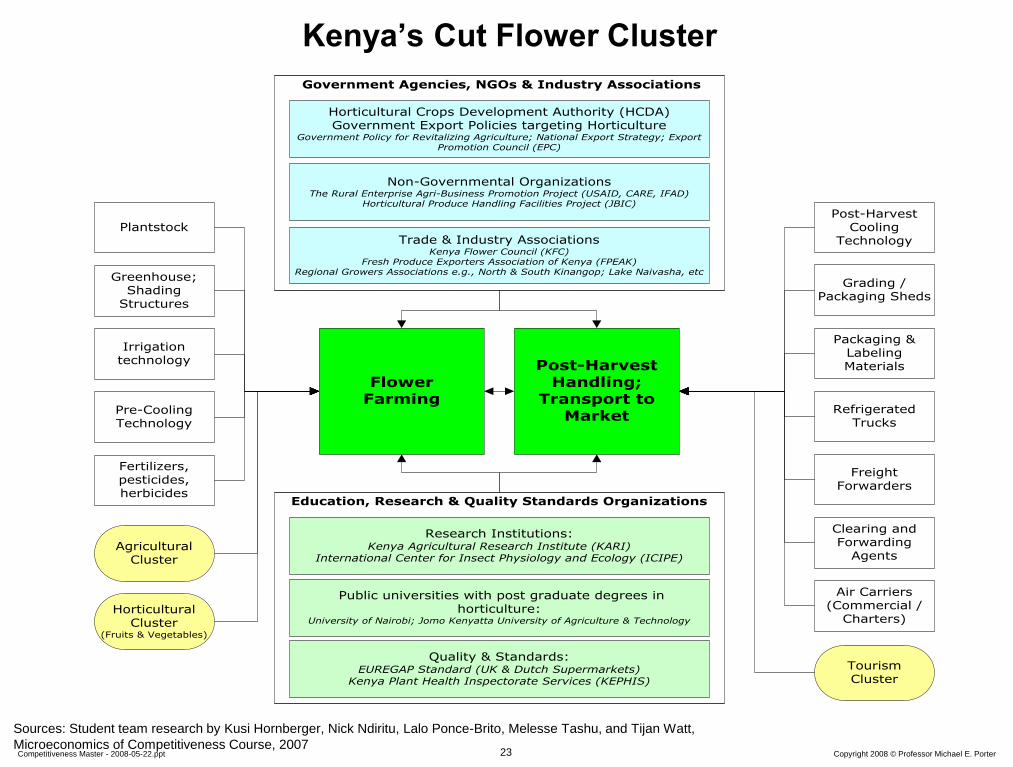
Government Agencies, NGOs & Industry Associations
Education, Research & Quality Standards Organizations
FlowerFarming
Post-HarvestHandling;
Transport toMarket
FreightForwarders
Clearing andForwarding
Agents
Air Carriers(Commercial /
Charters)
PlantstockTrade & Industry Associations
Kenya Flower Council (KFC)Fresh Produce Exporters Association of Kenya (FPEAK)
Regional Growers Associations e.g., North & South Kinangop; Lake Naivasha, etcGreenhouse;
ShadingStructures
Pre-CoolingTechnology
Irrigationtechnology
Grading /Packaging Sheds
Post-HarvestCooling
Technology
AgriculturalCluster
HorticulturalCluster
(Fruits & Vegetables)
Public universities with post graduate degrees inhorticulture:
University of Nairobi; Jomo Kenyatta University of Agriculture & Technology
Horticultural Crops Development Authority (HCDA)Government Export Policies targeting Horticulture
Government Policy for Revitalizing Agriculture; National Export Strategy; ExportPromotion Council (EPC)
Fertilizers,pesticides,herbicides
Research Institutions:Kenya Agricultural Research Institute (KARI)
International Center for Insect Physiology and Ecology (ICIPE)
RefrigeratedTrucks
Quality & Standards:EUREGAP Standard (UK & Dutch Supermarkets)
Kenya Plant Health Inspectorate Services (KEPHIS)
Non-Governmental OrganizationsThe Rural Enterprise Agri-Business Promotion Project (USAID, CARE, IFAD)
Horticultural Produce Handling Facilities Project (JBIC)
Packaging &LabelingMaterials
TourismCluster
Kenya’s Cut Flower Cluster
Sources: Student team research by Kusi Hornberger, Nick Ndiritu, Lalo Ponce-Brito, Melesse Tashu, and Tijan Watt,
Microeconomics of Competitiveness Course, 2007
24 Copyright 2008 © Professor Michael E. Porter Competitiveness Master - 2008-05-22.ppt
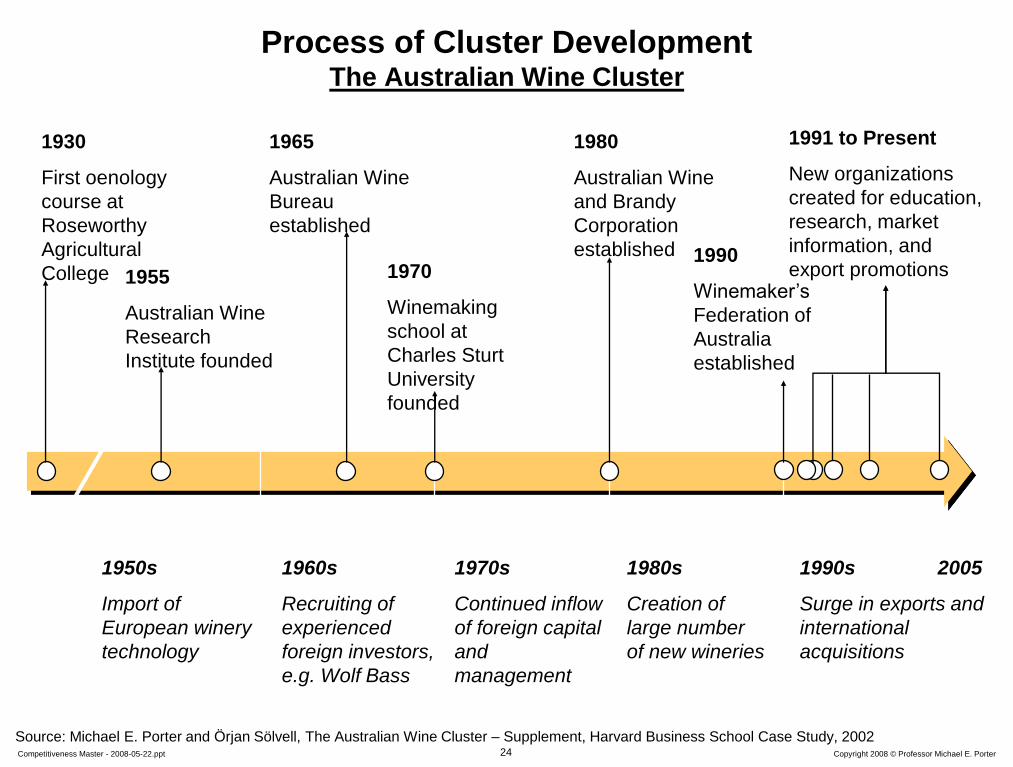
Process of Cluster Development The Australian Wine Cluster
1955
Australian Wine
Research
Institute founded
1970
Winemaking
school at
Charles Sturt
University
founded
1980
Australian Wine
and Brandy
Corporation
established
1965
Australian Wine
Bureau
established
1930
First oenology
course at
Roseworthy
Agricultural
College
1950s
Import of
European winery
technology
1960s
Recruiting of
experienced
foreign investors,
e.g. Wolf Bass
1990s 2005
Surge in exports and
international
acquisitions
1980s
Creation of
large number
of new wineries
1970s
Continued inflow
of foreign capital
and
management
1990
Winemaker’s
Federation of
Australia
established
1991 to Present
New organizations
created for education,
research, market
information, and
export promotions
Source: Michael E. Porter and Örjan Sölvell, The Australian Wine Cluster – Supplement, Harvard Business School Case Study, 2002
25 Copyright 2008 © Professor Michael E. Porter Competitiveness Master - 2008-05-22.ppt
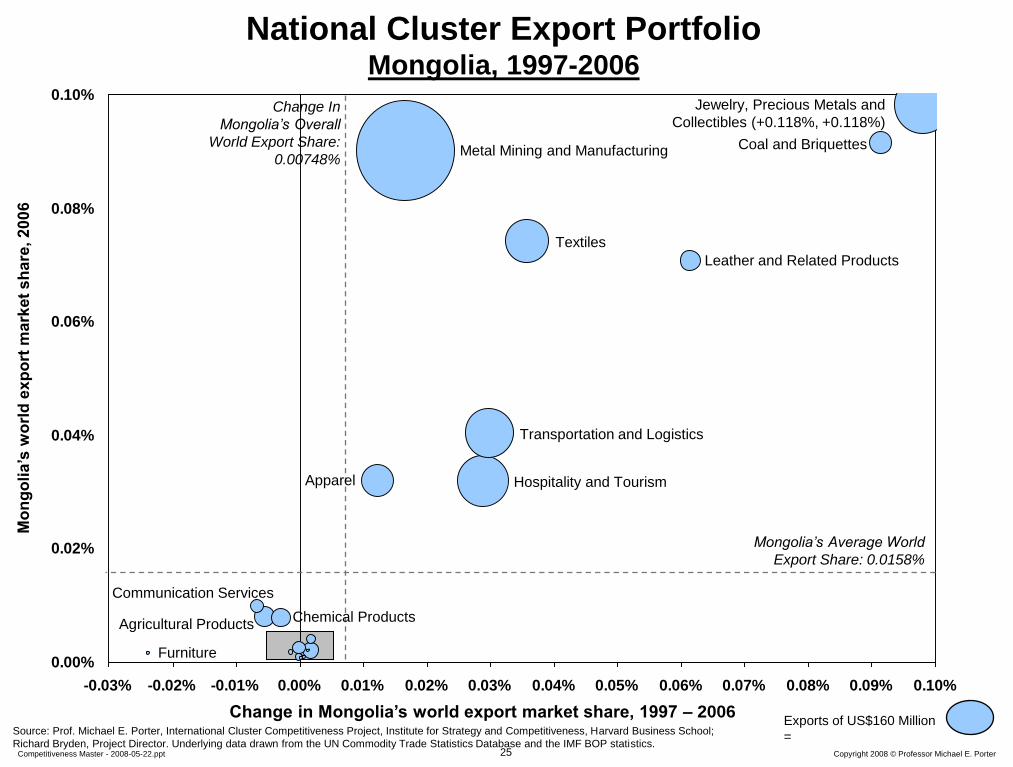
0.00%
0.02%
0.04%
0.06%
0.08%
0.10%
-0.03% -0.02% -0.01% 0.00% 0.01% 0.02% 0.03% 0.04% 0.05% 0.06% 0.07% 0.08% 0.09% 0.10%
National Cluster Export Portfolio Mongolia, 1997-2006
Change in Mongolia’s world export market share, 1997 – 2006 Source: Prof. Michael E. Porter, International Cluster Competitiveness Project, Institute for Strategy and Competitiveness, Harvard Business School;
Richard Bryden, Project Director. Underlying data drawn from the UN Commodity Trade Statistics Database and the IMF BOP statistics.
Mo
ng
oli
a’s
wo
rld
ex
po
rt m
ark
et
sh
are
, 2
00
6
Change In
Mongolia’s Overall
World Export Share:
0.00748%
Mongolia’s Average World
Export Share: 0.0158%
Exports of US$160 Million
=
Hospitality and Tourism
Agricultural Products
Transportation and Logistics
Chemical Products
Textiles
Leather and Related Products
Furniture
Metal Mining and Manufacturing
Apparel
Jewelry, Precious Metals and
Collectibles (+0.118%, +0.118%)
Communication Services
Coal and Briquettes
26 Copyright 2008 © Professor Michael E. Porter Competitiveness Master - 2008-05-22.ppt
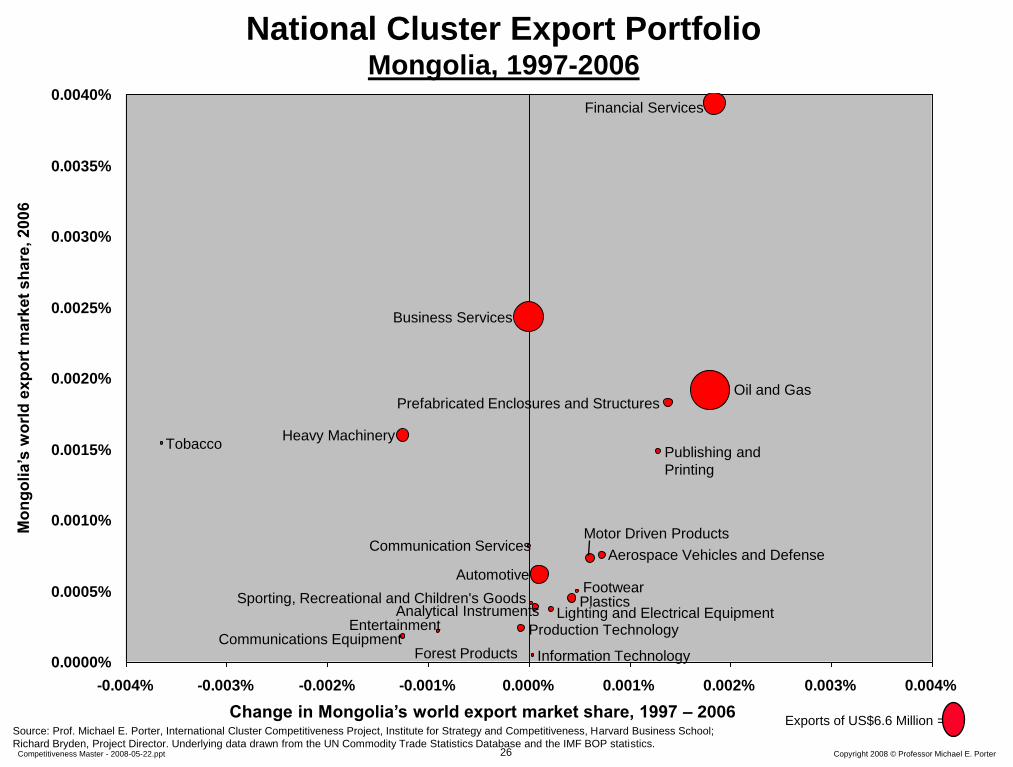
0.0000%
0.0005%
0.0010%
0.0015%
0.0020%
0.0025%
0.0030%
0.0035%
0.0040%
-0.004% -0.003% -0.002% -0.001% 0.000% 0.001% 0.002% 0.003% 0.004%
National Cluster Export Portfolio Mongolia, 1997-2006
Change in Mongolia’s world export market share, 1997 – 2006 Source: Prof. Michael E. Porter, International Cluster Competitiveness Project, Institute for Strategy and Competitiveness, Harvard Business School;
Richard Bryden, Project Director. Underlying data drawn from the UN Commodity Trade Statistics Database and the IMF BOP statistics.
Mo
ng
oli
a’s
wo
rld
ex
po
rt m
ark
et
sh
are
, 2
00
6
Exports of US$6.6 Million =
Automotive
Motor Driven Products
Oil and Gas
Plastics Analytical Instruments
Prefabricated Enclosures and Structures
Information Technology
Financial Services
Production Technology
Heavy Machinery
Footwear
Forest Products
Sporting, Recreational and Children's Goods
Communications Equipment
Aerospace Vehicles and Defense
Lighting and Electrical Equipment
Business Services
Tobacco Publishing and
Printing
Entertainment
Communication Services
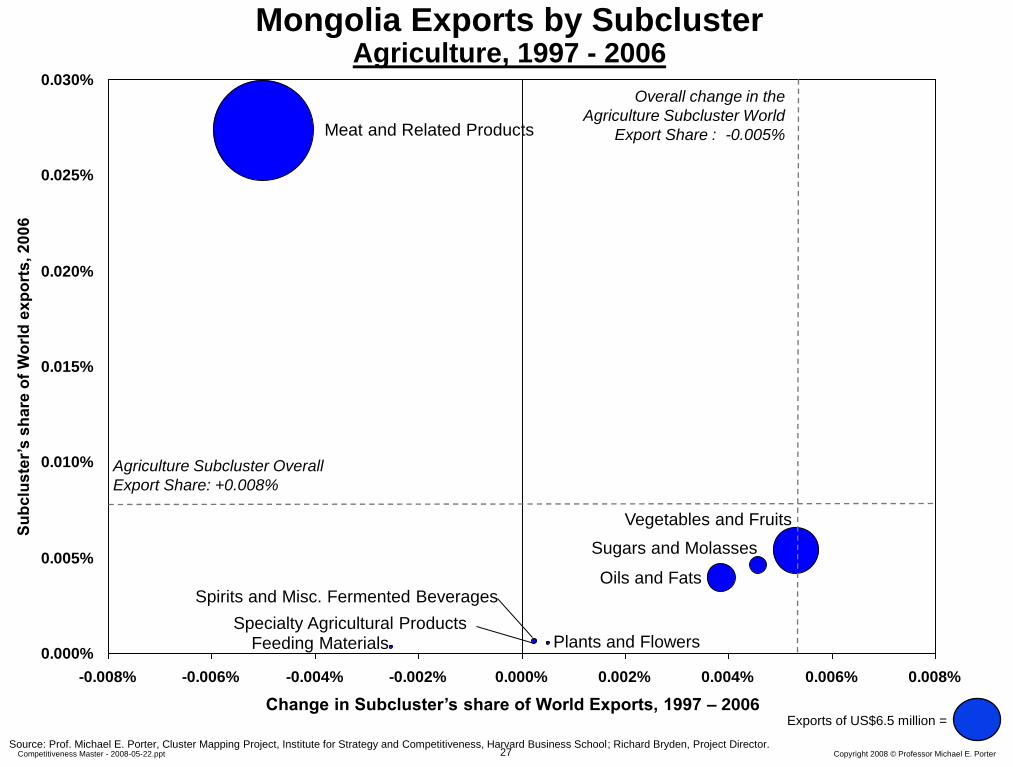
27 Copyright 2008 © Professor Michael E. Porter Competitiveness Master - 2008-05-22.ppt
0.000%
0.005%
0.010%
0.015%
0.020%
0.025%
0.030%
-0.008% -0.006% -0.004% -0.002% 0.000% 0.002% 0.004% 0.006% 0.008%
Change in Subcluster’s share of World Exports, 1997 – 2006
Su
bclu
ste
r’s
sh
are
of
Wo
rld
ex
po
rts
, 2
00
6
Mongolia Exports by Subcluster Agriculture, 1997 - 2006
Plants and Flowers
Vegetables and Fruits
Specialty Agricultural Products
Agriculture Subcluster Overall
Export Share: +0.008%
Overall change in the
Agriculture Subcluster World
Export Share : -0.005%
Source: Prof. Michael E. Porter, Cluster Mapping Project, Institute for Strategy and Competitiveness, Harvard Business School; Richard Bryden, Project Director.
Meat and Related Products
Oils and Fats
Exports of US$6.5 million =
Sugars and Molasses
Spirits and Misc. Fermented Beverages
Feeding Materials
28 Copyright 2008 © Professor Michael E. Porter Competitiveness Master - 2008-05-22.ppt
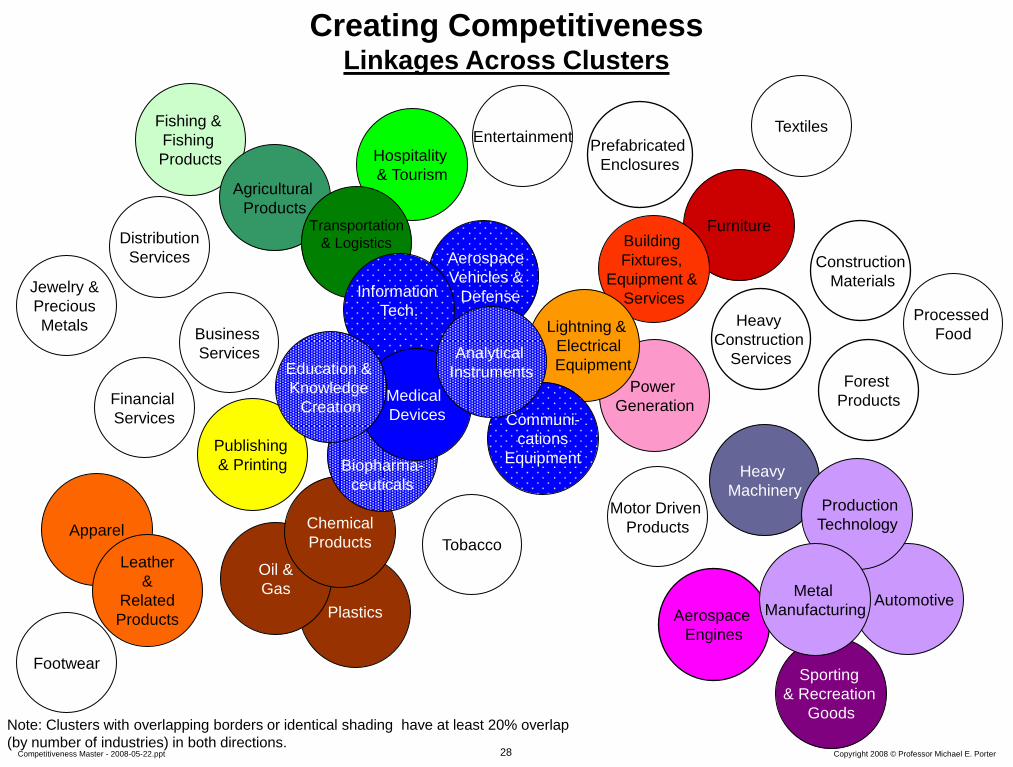
Furniture Building
Fixtures,
Equipment &
Services
Fishing &
Fishing
Products Hospitality
& Tourism Agricultural
Products Transportation
& Logistics
Creating Competitiveness Linkages Across Clusters
Plastics
Oil &
Gas
Chemical
Products
Biopharma-
ceuticals
Power
Generation
Aerospace
Vehicles &
Defense
Lightning &
Electrical
Equipment
Financial
Services
Publishing
& Printing
Entertainment
Information
Tech.
Communi-
cations
Equipment
Aerospace
Engines
Business
Services
Distribution
Services
Forest
Products
Heavy
Construction
Services
Construction
Materials
Prefabricated
Enclosures
Heavy
Machinery
Sporting
& Recreation
Goods
Automotive
Production
Technology Motor Driven
Products
Metal
Manufacturing
Apparel
Leather
&
Related
Products
Jewelry &
Precious
Metals
Textiles
Footwear
Processed
Food
Tobacco
Medical
Devices
Analytical
Instruments Education &
Knowledge
Creation
Note: Clusters with overlapping borders or identical shading have at least 20% overlap
(by number of industries) in both directions.
29 Copyright 2008 © Professor Michael E. Porter Competitiveness Master - 2008-05-22.ppt
The Evolution of Regional Economies San Diego
U.S.
Military
Communications
Equipment
Sporting and
Leather Goods
Analytical Instruments
Power Generation
Aerospace Vehicles
and Defense
Transportation
and Logistics
Information Technology
1910 1930 1950 1990 1970
Bioscience
Research
Centers
Climate
and
Geography
Hospitality and Tourism
Medical Devices
Biotech / Pharmaceuticals
Education and
Knowledge Creation
30 Copyright 2008 © Professor Michael E. Porter Competitiveness Master - 2008-05-22.ppt
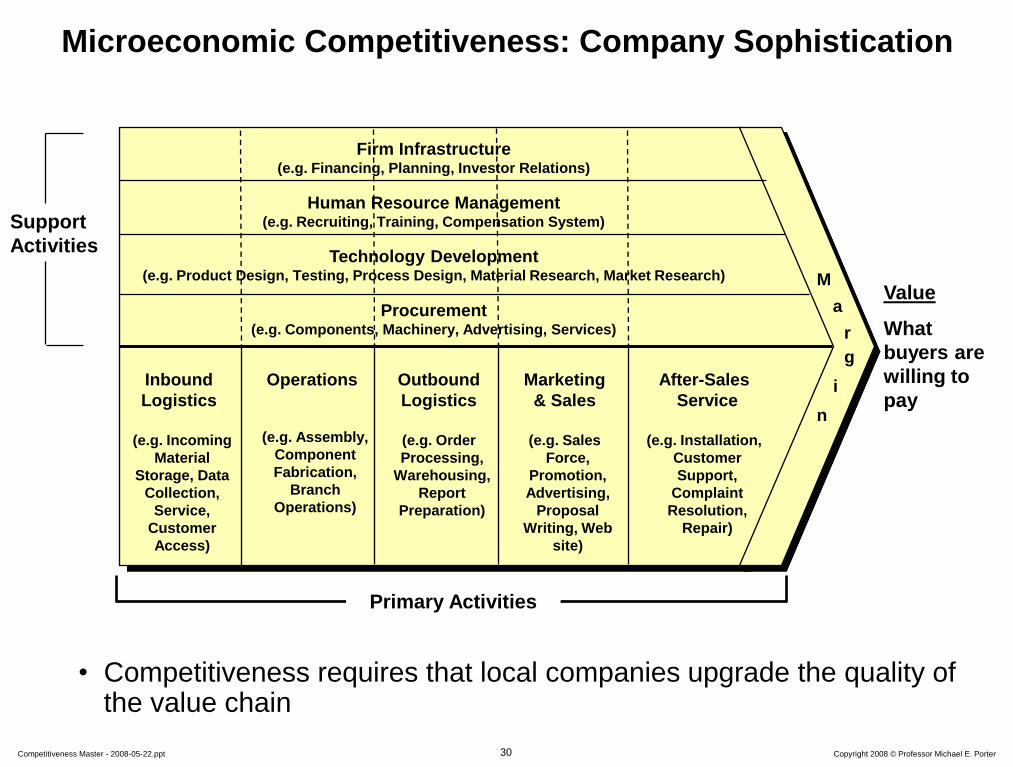
• Competitiveness requires that local companies upgrade the quality of the value chain
Microeconomic Competitiveness: Company Sophistication
Support
Activities
Marketing
& Sales
(e.g. Sales
Force,
Promotion,
Advertising,
Proposal
Writing, Web
site)
Inbound
Logistics
(e.g. Incoming
Material
Storage, Data
Collection,
Service,
Customer
Access)
Operations
(e.g. Assembly,
Component
Fabrication,
Branch
Operations)
Outbound
Logistics
(e.g. Order
Processing,
Warehousing,
Report
Preparation)
After-Sales
Service
(e.g. Installation,
Customer
Support,
Complaint
Resolution,
Repair)
M
a
r
g
i
n
Primary Activities
Firm Infrastructure (e.g. Financing, Planning, Investor Relations)
Procurement (e.g. Components, Machinery, Advertising, Services)
Technology Development (e.g. Product Design, Testing, Process Design, Material Research, Market Research)
Human Resource Management (e.g. Recruiting, Training, Compensation System)
Value
What
buyers are
willing to
pay
31 Copyright 2008 © Professor Michael E. Porter Competitiveness Master - 2008-05-22.ppt
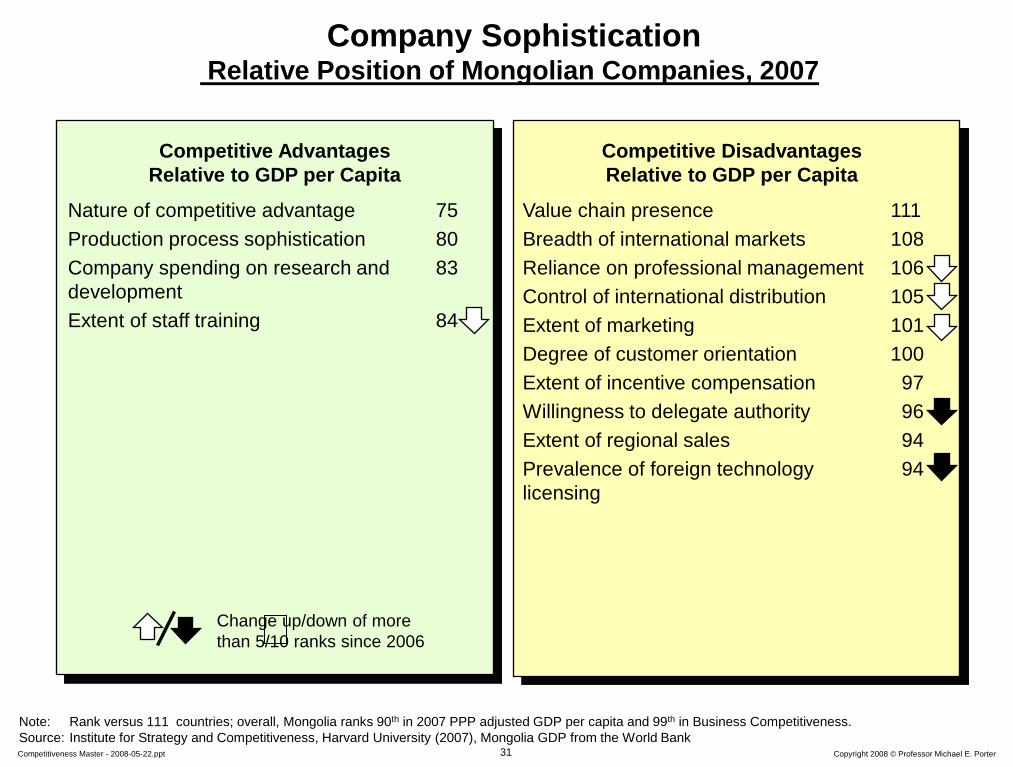
Company Sophistication Relative Position of Mongolian Companies, 2007
Value chain presence 111
Breadth of international markets 108
Reliance on professional management 106
Control of international distribution 105
Extent of marketing 101
Degree of customer orientation 100
Extent of incentive compensation 97
Willingness to delegate authority 96
Extent of regional sales 94
Prevalence of foreign technology 94
licensing
Competitive Disadvantages
Relative to GDP per Capita
Competitive Advantages
Relative to GDP per Capita
Change up/down of more
than 5/10 ranks since 2006
Note: Rank versus 111 countries; overall, Mongolia ranks 90th in 2007 PPP adjusted GDP per capita and 99th in Business Competitiveness.
Source: Institute for Strategy and Competitiveness, Harvard University (2007), Mongolia GDP from the World Bank
Nature of competitive advantage 75
Production process sophistication 80
Company spending on research and 83
development
Extent of staff training 84
32 Copyright 2008 © Professor Michael E. Porter Competitiveness Master - 2008-05-22.ppt
Geographic Influences on Competitiveness
Broad Economic Areas
Groups of Neighboring
Nations
States, Provinces
Metropolitan Areas
Nation
World Economy
Rural Areas
Sub-National Economies
33 Copyright 2008 © Professor Michael E. Porter Competitiveness Master - 2008-05-22.ppt
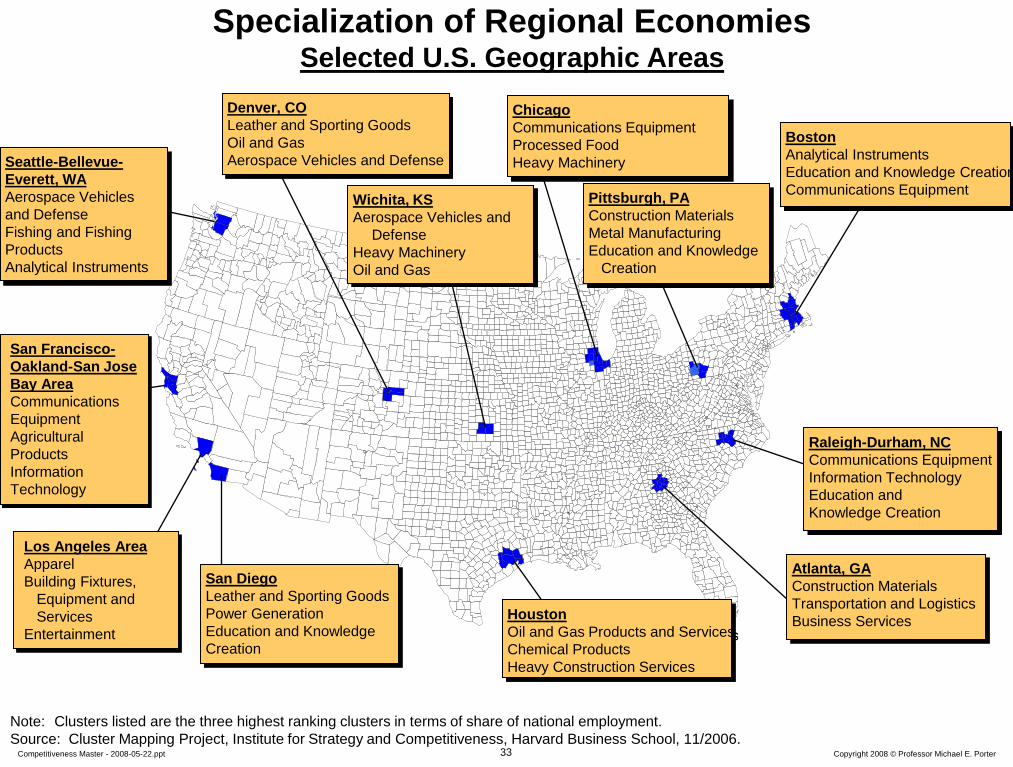
Specialization of Regional Economies Selected U.S. Geographic Areas
Boston
Analytical Instruments
Education and Knowledge Creation
Communications Equipment
Los Angeles Area
Apparel
Building Fixtures,
Equipment and
Services
Entertainment
Chicago
Communications Equipment
Processed Food
Heavy Machinery
Denver, CO
Leather and Sporting Goods
Oil and Gas
Aerospace Vehicles and Defense
San Diego
Leather and Sporting Goods
Power Generation
Education and Knowledge
Creation
San Francisco-
Oakland-San Jose
Bay Area
Communications
Equipment
Agricultural
Products
Information
Technology
Seattle-Bellevue-
Everett, WA
Aerospace Vehicles
and Defense
Fishing and Fishing
Products
Analytical Instruments
Houston
Oil and Gas Products and Services
Chemical Products
Heavy Construction Services
Pittsburgh, PA
Construction Materials
Metal Manufacturing
Education and Knowledge
Creation
Atlanta, GA
Construction Materials
Transportation and Logistics
Business Services
Raleigh-Durham, NC
Communications Equipment
Information Technology
Education and
Knowledge Creation
Wichita, KS
Aerospace Vehicles and
Defense
Heavy Machinery
Oil and Gas
Note: Clusters listed are the three highest ranking clusters in terms of share of national employment.
Source: Cluster Mapping Project, Institute for Strategy and Competitiveness, Harvard Business School, 11/2006.
34 Copyright 2008 © Professor Michael E. Porter Competitiveness Master - 2008-05-22.ppt
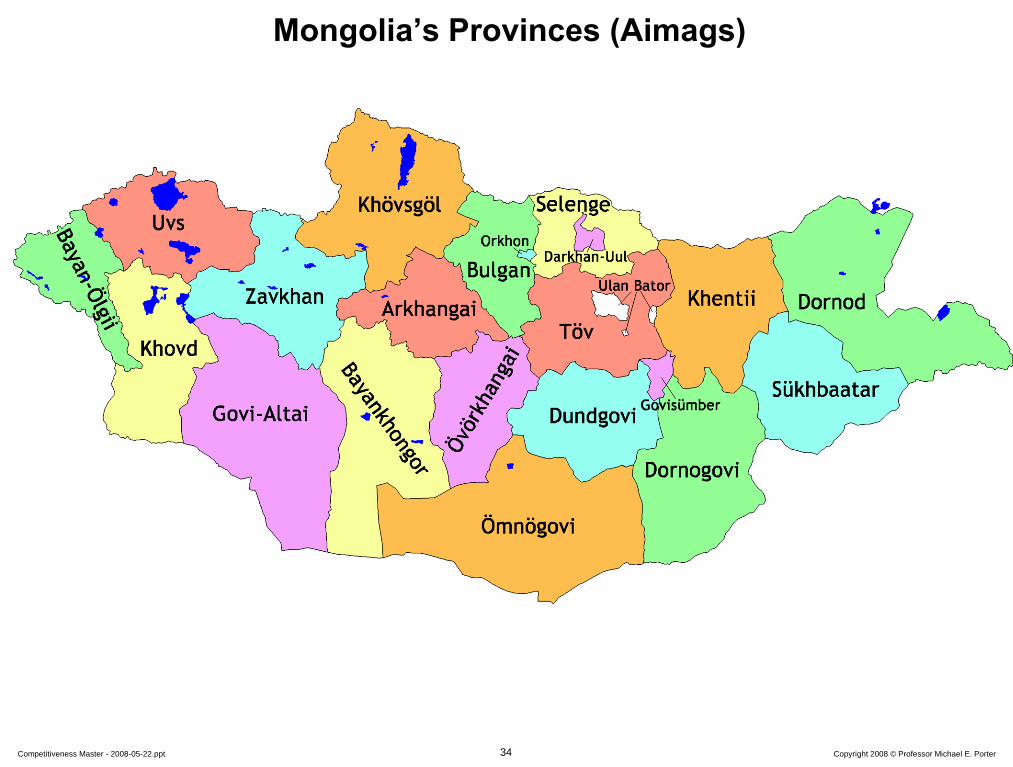
Mongolia’s Provinces (Aimags)
35 Copyright 2008 © Professor Michael E. Porter Competitiveness Master - 2008-05-22.ppt
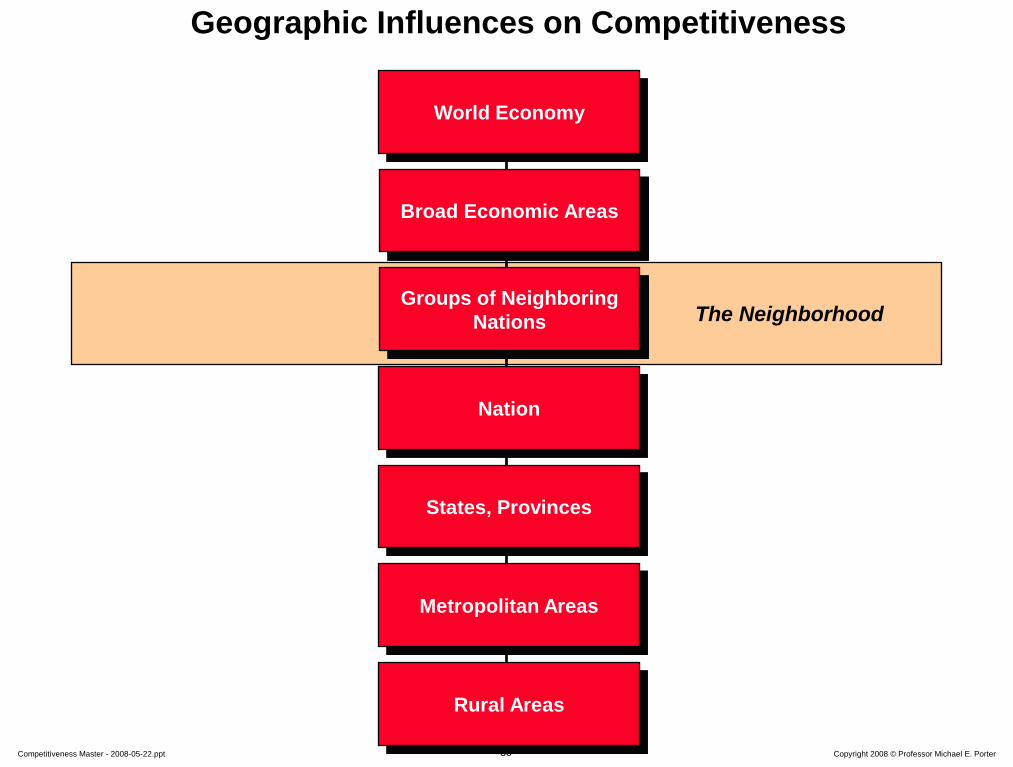
Geographic Influences on Competitiveness
Broad Economic Areas
Groups of Neighboring
Nations
States, Provinces
Metropolitan Areas
Nation
World Economy
Rural Areas
The Neighborhood
36 Copyright 2008 © Professor Michael E. Porter Competitiveness Master - 2008-05-22.ppt
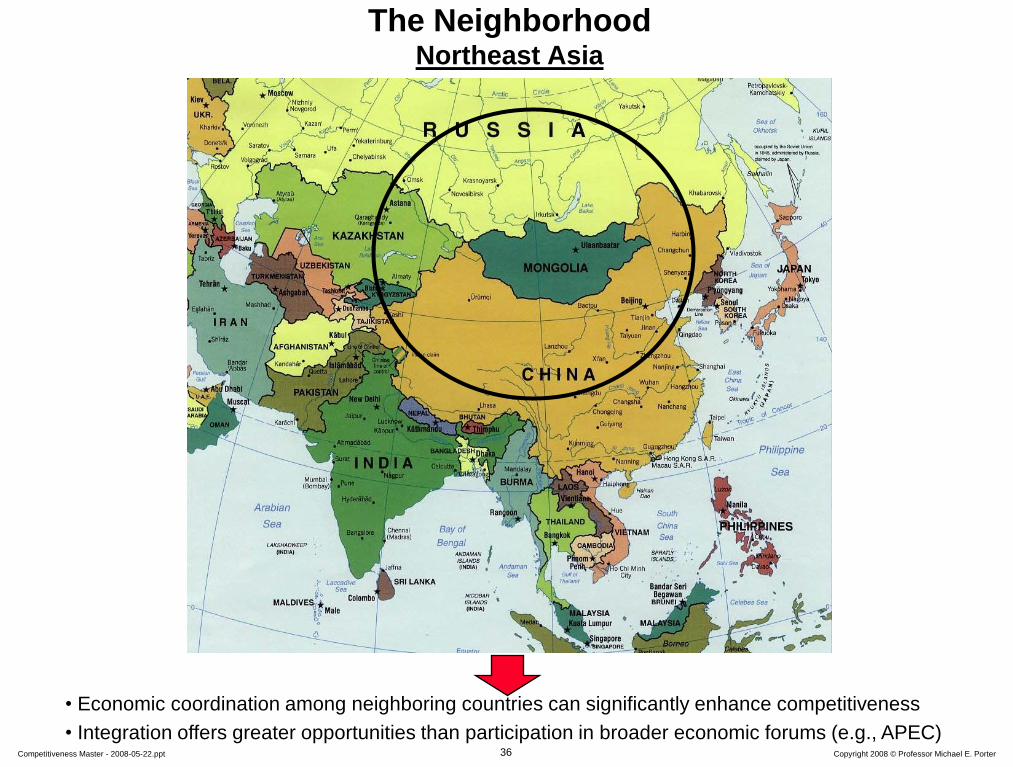
The Neighborhood Northeast Asia
• Economic coordination among neighboring countries can significantly enhance competitiveness
• Integration offers greater opportunities than participation in broader economic forums (e.g., APEC)
37 Copyright 2008 © , M. Porter East African Business Summit – final.ppt
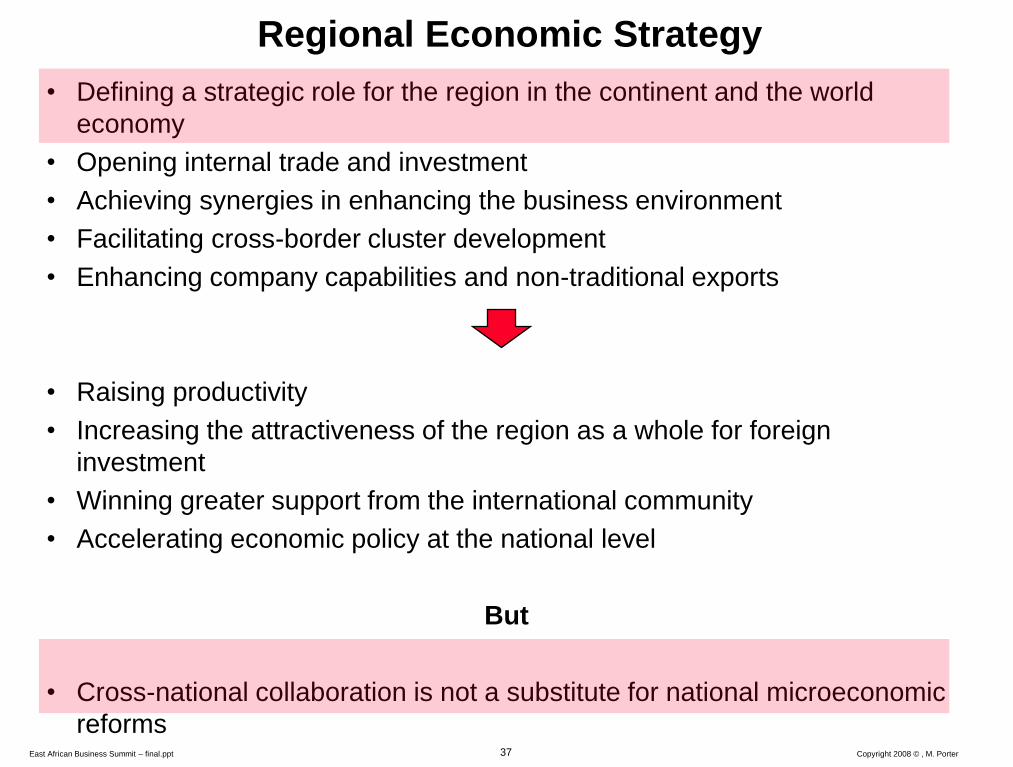
Regional Economic Strategy
• Defining a strategic role for the region in the continent and the world
economy
• Opening internal trade and investment
• Achieving synergies in enhancing the business environment
• Facilitating cross-border cluster development
• Enhancing company capabilities and non-traditional exports
• Raising productivity
• Increasing the attractiveness of the region as a whole for foreign
investment
• Winning greater support from the international community
• Accelerating economic policy at the national level
But
• Cross-national collaboration is not a substitute for national microeconomic
reforms
38 Copyright 2008 © , M. Porter East African Business Summit – final.ppt
• Eliminating
trade and
investment
barriers within
the region
• Simplifying
and
harmonizing
cross-border
regulations
and paperwork
• Coordinating
anti-monopoly
and fair
competition
policies
• Harmonizing
environmental
standards
• Harmonizing
product safety
standards
• Establishing
reciprocal
consumer
protection laws
• Opening
government
procurement
within the region
• Improving regional
transportation
infrastructure
• Creating an
efficient energy
network
• Enhancing regional
communications
and connectivity
• Linking financial
markets
• Opening the
movement of
students for higher
education
• Harmonizing
administrative
requirements for
businesses
• Facilitating
cross-border
cluster
upgrading, e.g.
– Tourism
– Agribusiness
– Transport &
Logistics
– Business
services
• Creating a
regional strategy
and marketing
program
• Sharing best
practices in
government
operations
• Creating regional
institutions – Dispute
resolution mechanisms
– Regional development bank
• Developing a
regional position
with
international
organizations
Factor
(Input)
Conditions
Regional
Strategy &
Governance
Context for
Strategy
and Rivalry
Related and
Supporting
Industries
Demand
Conditions
Economic Coordination Among Neighbors
Capturing Synergies
Macroeconomic
Competitiveness
• Coordinating
programs to
improve public
safety
• Coordinating
macro-economic
policies
39 Copyright 2008 © , M. Porter East African Business Summit – final.ppt
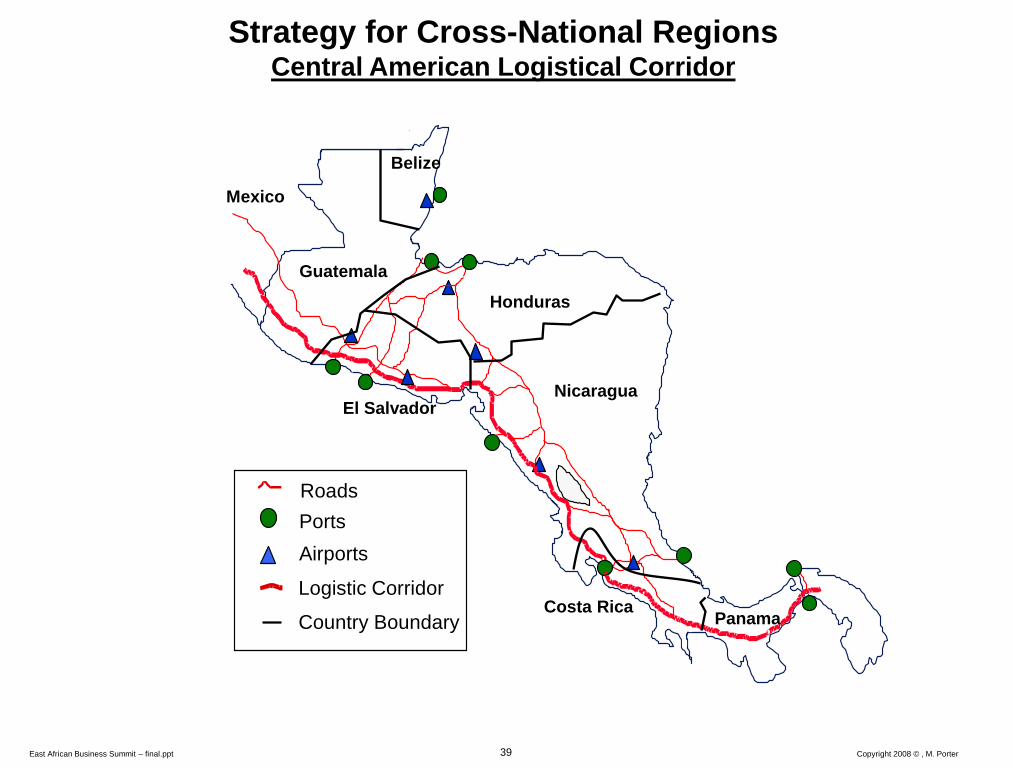
Roads
Airports
Ports
Logistic Corridor
Strategy for Cross-National Regions Central American Logistical Corridor
Mexico
Belize
Honduras
El Salvador Nicaragua
Costa Rica Panama
Guatemala
Country Boundary
40 Copyright 2008 © Professor Michael E. Porter Competitiveness Master - 2008-05-22.ppt
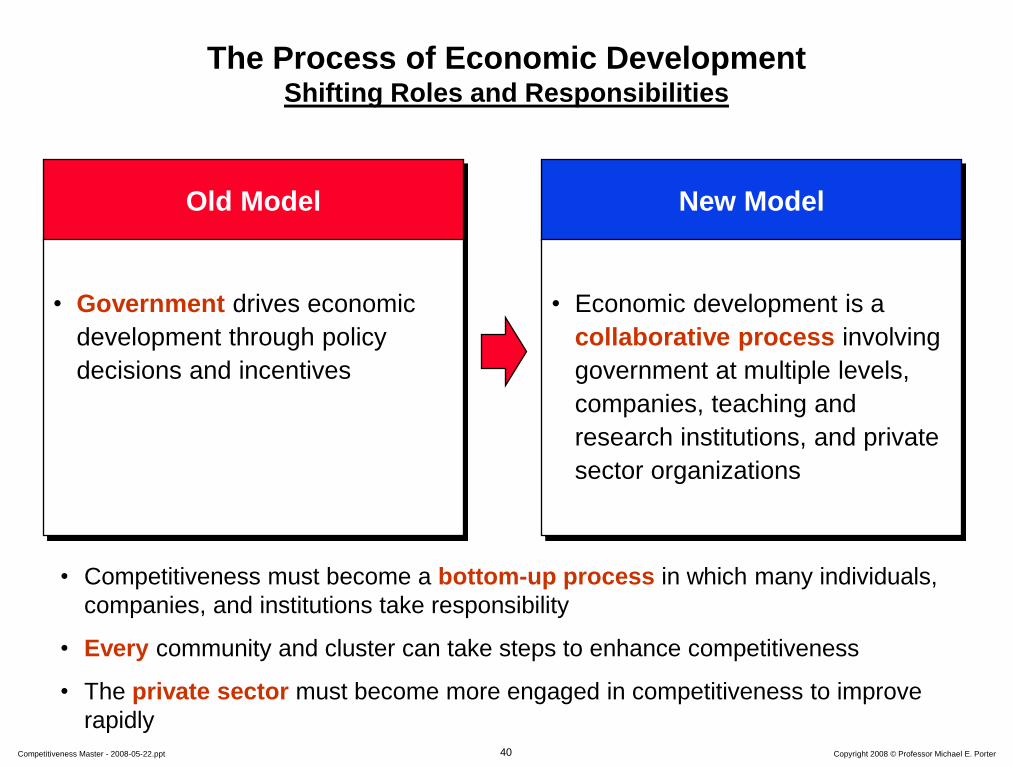
The Process of Economic Development Shifting Roles and Responsibilities
Old Model
• Government drives economic
development through policy
decisions and incentives
New Model
• Economic development is a
collaborative process involving
government at multiple levels,
companies, teaching and
research institutions, and private
sector organizations
• Competitiveness must become a bottom-up process in which many individuals,
companies, and institutions take responsibility
• Every community and cluster can take steps to enhance competitiveness
• The private sector must become more engaged in competitiveness to improve
rapidly
41 Copyright 2008 © Professor Michael E. Porter Competitiveness Master - 2008-05-22.ppt
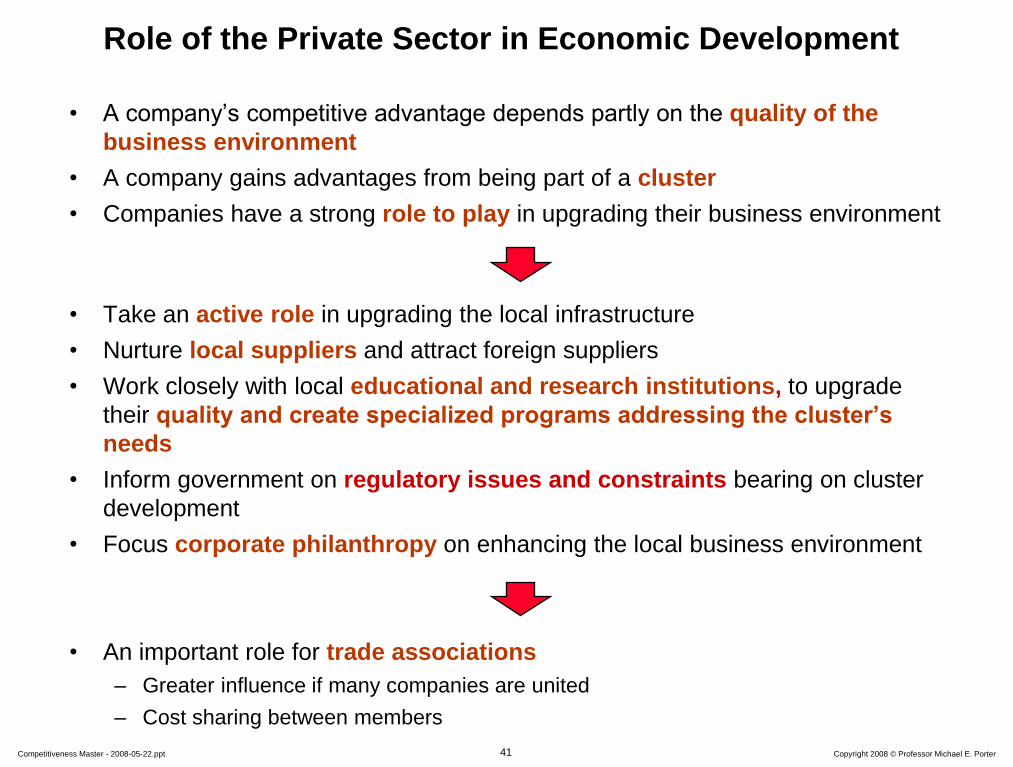
Role of the Private Sector in Economic Development
• A company’s competitive advantage depends partly on the quality of the
business environment
• A company gains advantages from being part of a cluster
• Companies have a strong role to play in upgrading their business environment
• Take an active role in upgrading the local infrastructure
• Nurture local suppliers and attract foreign suppliers
• Work closely with local educational and research institutions, to upgrade
their quality and create specialized programs addressing the cluster’s
needs
• Inform government on regulatory issues and constraints bearing on cluster
development
• Focus corporate philanthropy on enhancing the local business environment
• An important role for trade associations
– Greater influence if many companies are united
– Cost sharing between members
42 Copyright 2008 © Professor Michael E. Porter Competitiveness Master - 2008-05-22.ppt
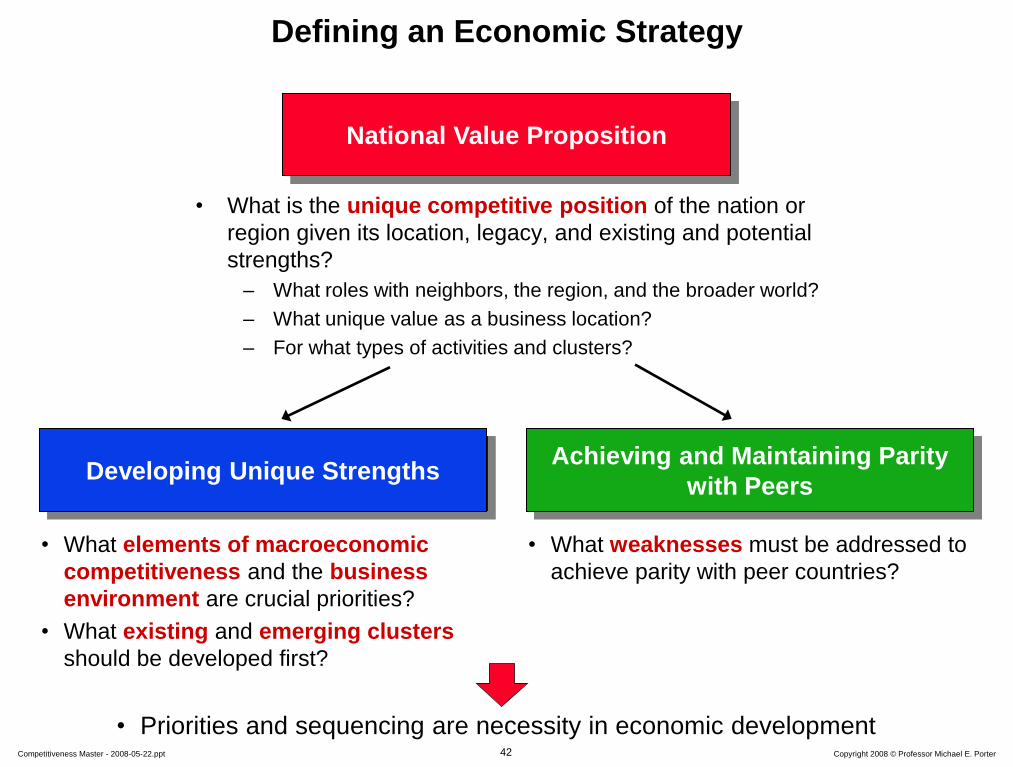
National Value Proposition
Defining an Economic Strategy
Developing Unique Strengths Achieving and Maintaining Parity
with Peers
• What elements of macroeconomic
competitiveness and the business
environment are crucial priorities?
• What existing and emerging clusters
should be developed first?
• What weaknesses must be addressed to
achieve parity with peer countries?
• What is the unique competitive position of the nation or
region given its location, legacy, and existing and potential
strengths?
– What roles with neighbors, the region, and the broader world?
– What unique value as a business location?
– For what types of activities and clusters?
• Priorities and sequencing are necessity in economic development
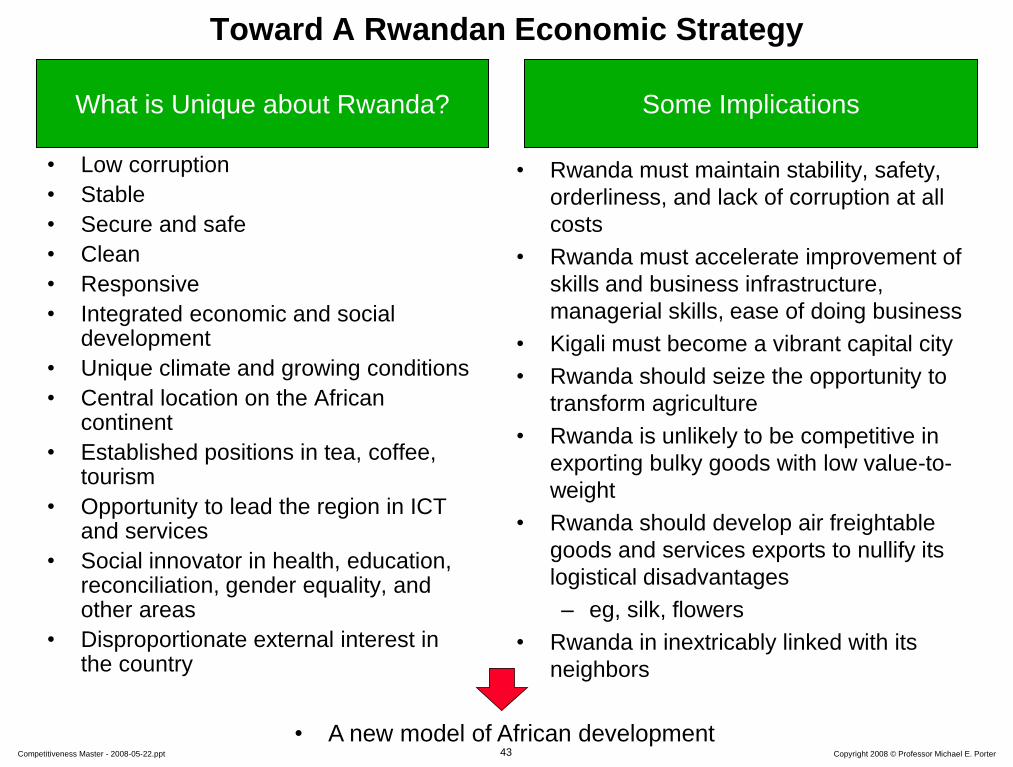
43 Copyright 2008 © Professor Michael E. Porter Competitiveness Master - 2008-05-22.ppt
Some Implications What is Unique about Rwanda?
Toward A Rwandan Economic Strategy
• Low corruption
• Stable
• Secure and safe
• Clean
• Responsive
• Integrated economic and social development
• Unique climate and growing conditions
• Central location on the African continent
• Established positions in tea, coffee, tourism
• Opportunity to lead the region in ICT and services
• Social innovator in health, education, reconciliation, gender equality, and other areas
• Disproportionate external interest in the country
• Rwanda must maintain stability, safety,
orderliness, and lack of corruption at all
costs
• Rwanda must accelerate improvement of
skills and business infrastructure,
managerial skills, ease of doing business
• Kigali must become a vibrant capital city
• Rwanda should seize the opportunity to
transform agriculture
• Rwanda is unlikely to be competitive in
exporting bulky goods with low value-to-
weight
• Rwanda should develop air freightable
goods and services exports to nullify its
logistical disadvantages
– eg, silk, flowers
• Rwanda in inextricably linked with its
neighbors
• A new model of African development
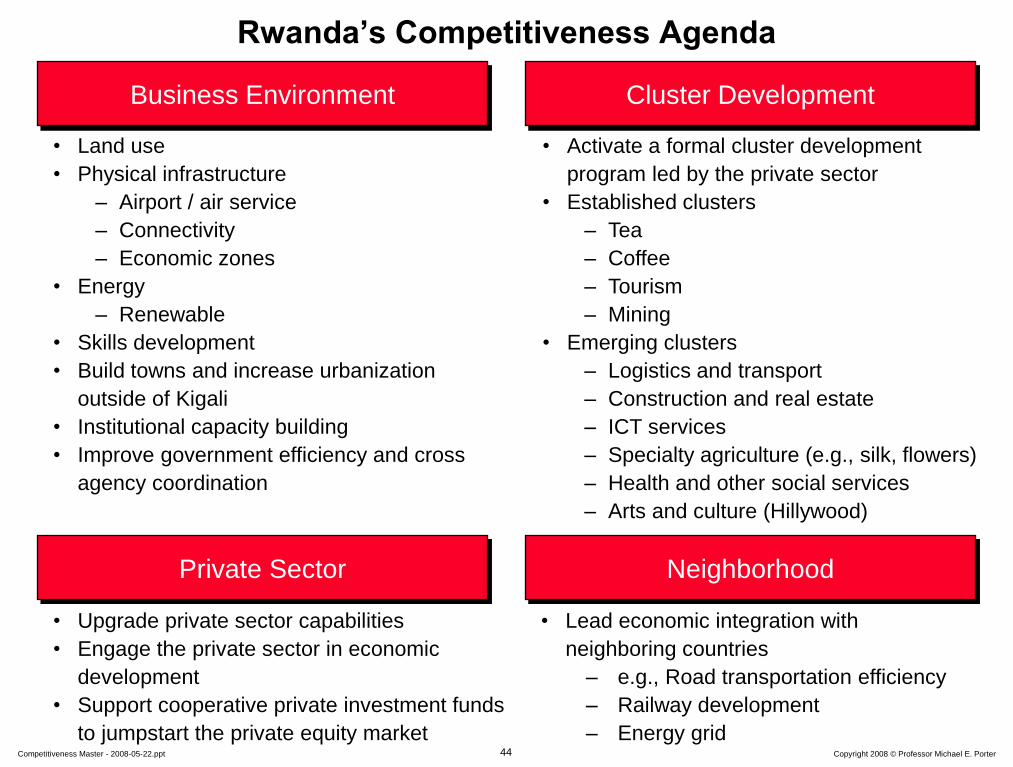
44 Copyright 2008 © Professor Michael E. Porter Competitiveness Master - 2008-05-22.ppt
Rwanda’s Competitiveness Agenda
Business Environment
• Land use
• Physical infrastructure
– Airport / air service
– Connectivity
– Economic zones
• Energy
– Renewable
• Skills development
• Build towns and increase urbanization
outside of Kigali
• Institutional capacity building
• Improve government efficiency and cross
agency coordination
Cluster Development
• Activate a formal cluster development
program led by the private sector
• Established clusters
– Tea
– Coffee
– Tourism
– Mining
• Emerging clusters
– Logistics and transport
– Construction and real estate
– ICT services
– Specialty agriculture (e.g., silk, flowers)
– Health and other social services
– Arts and culture (Hillywood)
Private Sector
• Upgrade private sector capabilities
• Engage the private sector in economic
development
• Support cooperative private investment funds
to jumpstart the private equity market
Neighborhood
• Lead economic integration with
neighboring countries
– e.g., Road transportation efficiency
– Railway development
– Energy grid
45 Copyright 2008 © Professor Michael E. Porter Competitiveness Master - 2008-05-22.ppt
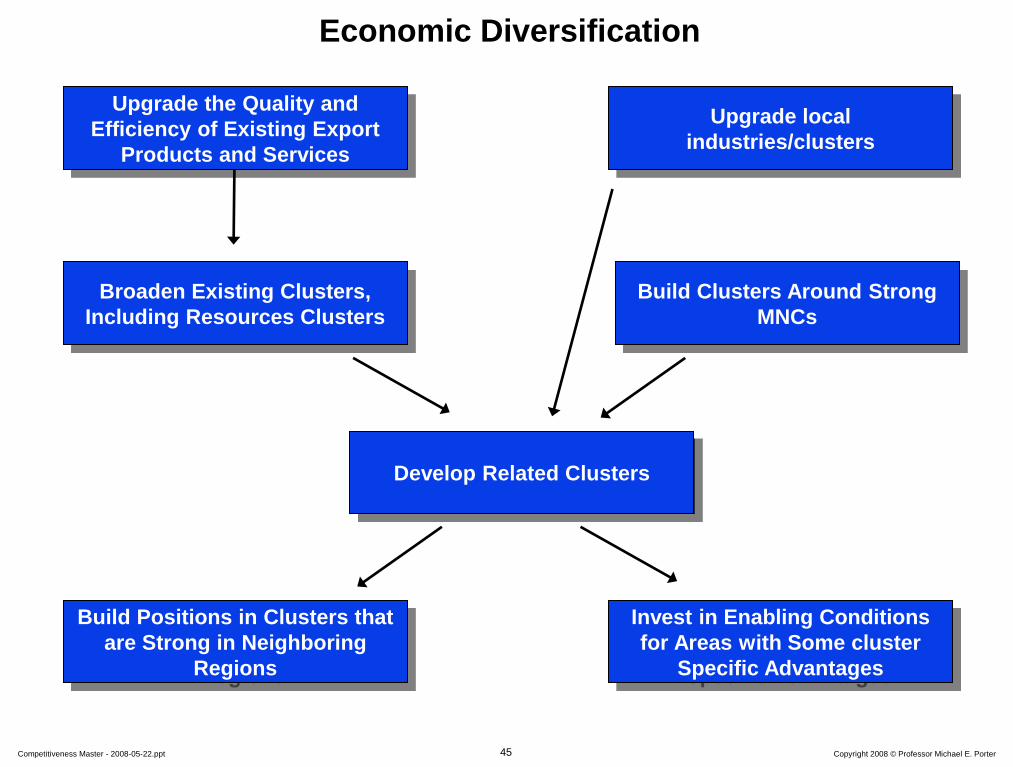
Economic Diversification
Upgrade the Quality and
Efficiency of Existing Export
Products and Services
Broaden Existing Clusters,
Including Resources Clusters
Build Clusters Around Strong
MNCs
Develop Related Clusters
Build Positions in Clusters that
are Strong in Neighboring
Regions
Invest in Enabling Conditions
for Areas with Some cluster
Specific Advantages
Upgrade local
industries/clusters
46 Copyright 2008 © Professor Michael E. Porter Competitiveness Master - 2008-05-22.ppt
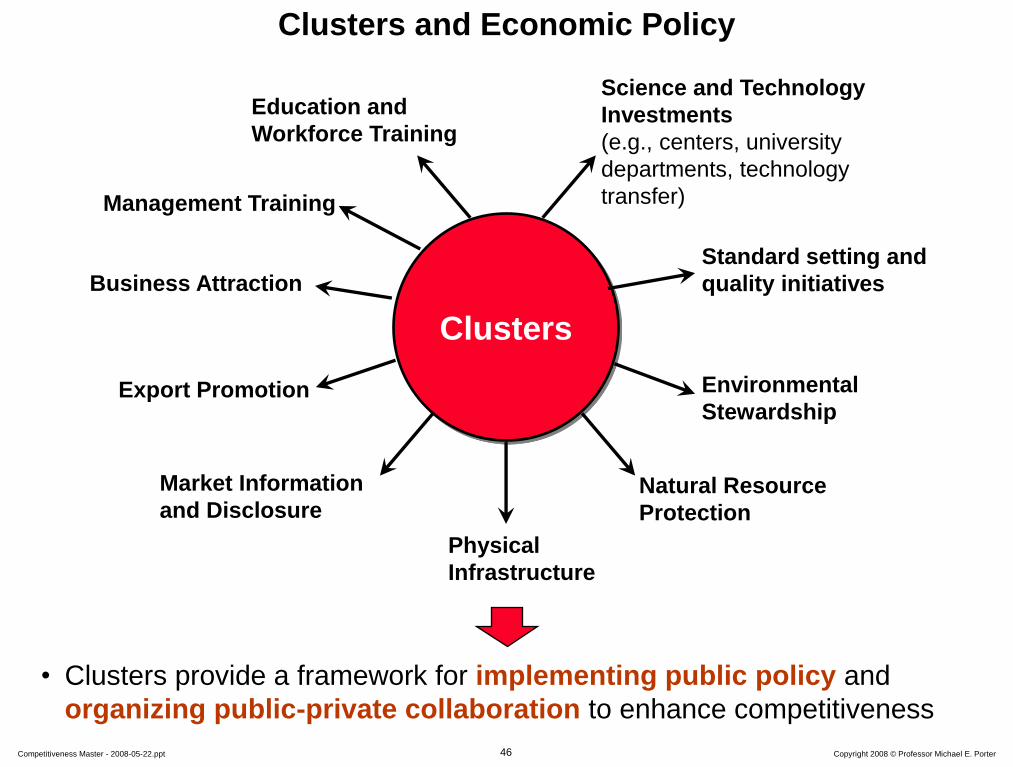
Clusters and Economic Policy
Clusters
Physical
Infrastructure
Natural Resource
Protection
Environmental
Stewardship
Science and Technology
Investments
(e.g., centers, university
departments, technology
transfer)
Education and
Workforce Training
Business Attraction
Export Promotion
• Clusters provide a framework for implementing public policy and
organizing public-private collaboration to enhance competitiveness
Standard setting and
quality initiatives
Market Information
and Disclosure
Management Training
47 Copyright 2008 © Professor Michael E. Porter Competitiveness Master - 2008-05-22.ppt
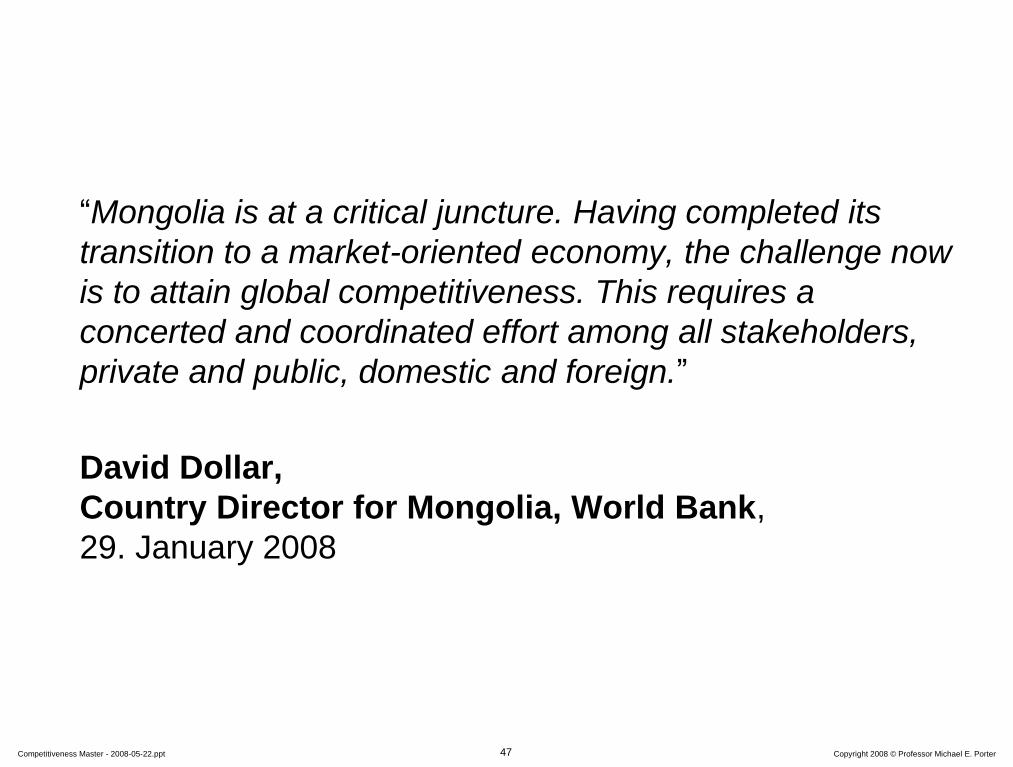
“Mongolia is at a critical juncture. Having completed its
transition to a market-oriented economy, the challenge now
is to attain global competitiveness. This requires a
concerted and coordinated effort among all stakeholders,
private and public, domestic and foreign.”
David Dollar,
Country Director for Mongolia, World Bank,
29. January 2008
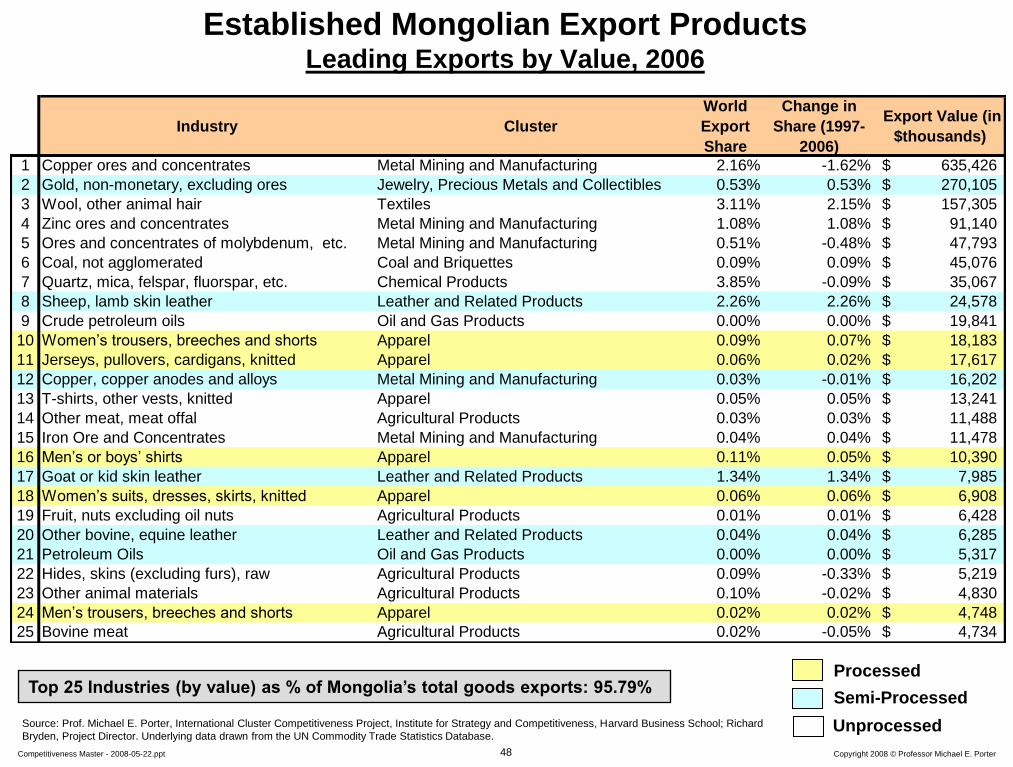
48 Copyright 2008 © Professor Michael E. Porter Competitiveness Master - 2008-05-22.ppt
Industry Cluster
World
Export
Share
Change in
Share (1997-
2006)
Export Value (in
$thousands)
1 Copper ores and concentrates Metal Mining and Manufacturing 2.16% -1.62% 635,426$
2 Gold, non-monetary, excluding ores Jewelry, Precious Metals and Collectibles 0.53% 0.53% 270,105$
3 Wool, other animal hair Textiles 3.11% 2.15% 157,305$
4 Zinc ores and concentrates Metal Mining and Manufacturing 1.08% 1.08% 91,140$
5 Ores and concentrates of molybdenum, etc. Metal Mining and Manufacturing 0.51% -0.48% 47,793$
6 Coal, not agglomerated Coal and Briquettes 0.09% 0.09% 45,076$
7 Quartz, mica, felspar, fluorspar, etc. Chemical Products 3.85% -0.09% 35,067$
8 Sheep, lamb skin leather Leather and Related Products 2.26% 2.26% 24,578$
9 Crude petroleum oils Oil and Gas Products 0.00% 0.00% 19,841$
10 Women’s trousers, breeches and shorts Apparel 0.09% 0.07% 18,183$
11 Jerseys, pullovers, cardigans, knitted Apparel 0.06% 0.02% 17,617$
12 Copper, copper anodes and alloys Metal Mining and Manufacturing 0.03% -0.01% 16,202$
13 T-shirts, other vests, knitted Apparel 0.05% 0.05% 13,241$
14 Other meat, meat offal Agricultural Products 0.03% 0.03% 11,488$
15 Iron Ore and Concentrates Metal Mining and Manufacturing 0.04% 0.04% 11,478$
16 Men’s or boys’ shirts Apparel 0.11% 0.05% 10,390$
17 Goat or kid skin leather Leather and Related Products 1.34% 1.34% 7,985$
18 Women’s suits, dresses, skirts, knitted Apparel 0.06% 0.06% 6,908$
19 Fruit, nuts excluding oil nuts Agricultural Products 0.01% 0.01% 6,428$
20 Other bovine, equine leather Leather and Related Products 0.04% 0.04% 6,285$
21 Petroleum Oils Oil and Gas Products 0.00% 0.00% 5,317$
22 Hides, skins (excluding furs), raw Agricultural Products 0.09% -0.33% 5,219$
23 Other animal materials Agricultural Products 0.10% -0.02% 4,830$
24 Men’s trousers, breeches and shorts Apparel 0.02% 0.02% 4,748$
25 Bovine meat Agricultural Products 0.02% -0.05% 4,734$
Established Mongolian Export Products Leading Exports by Value, 2006
Source: Prof. Michael E. Porter, International Cluster Competitiveness Project, Institute for Strategy and Competitiveness, Harvard Business School; Richard
Bryden, Project Director. Underlying data drawn from the UN Commodity Trade Statistics Database.
Top 25 Industries (by value) as % of Mongolia’s total goods exports: 95.79% Processed
Semi-Processed
Unprocessed
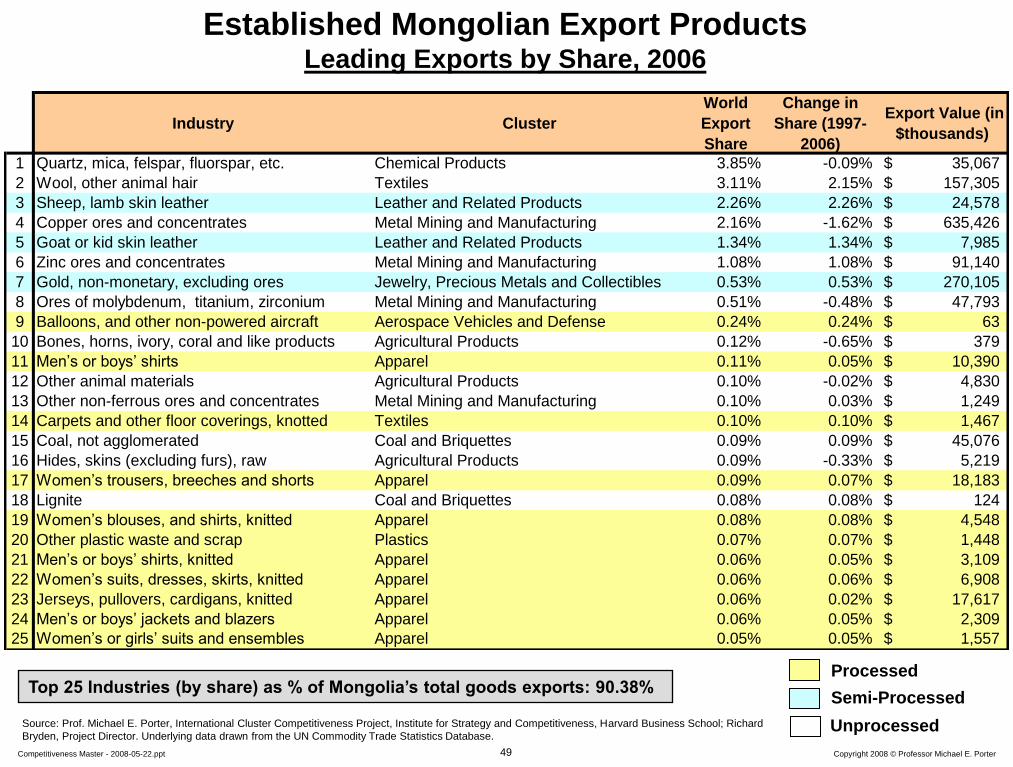
49 Copyright 2008 © Professor Michael E. Porter Competitiveness Master - 2008-05-22.ppt
Industry Cluster
World
Export
Share
Change in
Share (1997-
2006)
Export Value (in
$thousands)
1 Quartz, mica, felspar, fluorspar, etc. Chemical Products 3.85% -0.09% 35,067$
2 Wool, other animal hair Textiles 3.11% 2.15% 157,305$
3 Sheep, lamb skin leather Leather and Related Products 2.26% 2.26% 24,578$
4 Copper ores and concentrates Metal Mining and Manufacturing 2.16% -1.62% 635,426$
5 Goat or kid skin leather Leather and Related Products 1.34% 1.34% 7,985$
6 Zinc ores and concentrates Metal Mining and Manufacturing 1.08% 1.08% 91,140$
7 Gold, non-monetary, excluding ores Jewelry, Precious Metals and Collectibles 0.53% 0.53% 270,105$
8 Ores of molybdenum, titanium, zirconium Metal Mining and Manufacturing 0.51% -0.48% 47,793$
9 Balloons, and other non-powered aircraft Aerospace Vehicles and Defense 0.24% 0.24% 63$
10 Bones, horns, ivory, coral and like products Agricultural Products 0.12% -0.65% 379$
11 Men’s or boys’ shirts Apparel 0.11% 0.05% 10,390$
12 Other animal materials Agricultural Products 0.10% -0.02% 4,830$
13 Other non-ferrous ores and concentrates Metal Mining and Manufacturing 0.10% 0.03% 1,249$
14 Carpets and other floor coverings, knotted Textiles 0.10% 0.10% 1,467$
15 Coal, not agglomerated Coal and Briquettes 0.09% 0.09% 45,076$
16 Hides, skins (excluding furs), raw Agricultural Products 0.09% -0.33% 5,219$
17 Women’s trousers, breeches and shorts Apparel 0.09% 0.07% 18,183$
18 Lignite Coal and Briquettes 0.08% 0.08% 124$
19 Women’s blouses, and shirts, knitted Apparel 0.08% 0.08% 4,548$
20 Other plastic waste and scrap Plastics 0.07% 0.07% 1,448$
21 Men’s or boys’ shirts, knitted Apparel 0.06% 0.05% 3,109$
22 Women’s suits, dresses, skirts, knitted Apparel 0.06% 0.06% 6,908$
23 Jerseys, pullovers, cardigans, knitted Apparel 0.06% 0.02% 17,617$
24 Men’s or boys’ jackets and blazers Apparel 0.06% 0.05% 2,309$
25 Women’s or girls’ suits and ensembles Apparel 0.05% 0.05% 1,557$
Established Mongolian Export Products Leading Exports by Share, 2006
Source: Prof. Michael E. Porter, International Cluster Competitiveness Project, Institute for Strategy and Competitiveness, Harvard Business School; Richard
Bryden, Project Director. Underlying data drawn from the UN Commodity Trade Statistics Database.
Top 25 Industries (by share) as % of Mongolia’s total goods exports: 90.38% Processed
Semi-Processed
Unprocessed
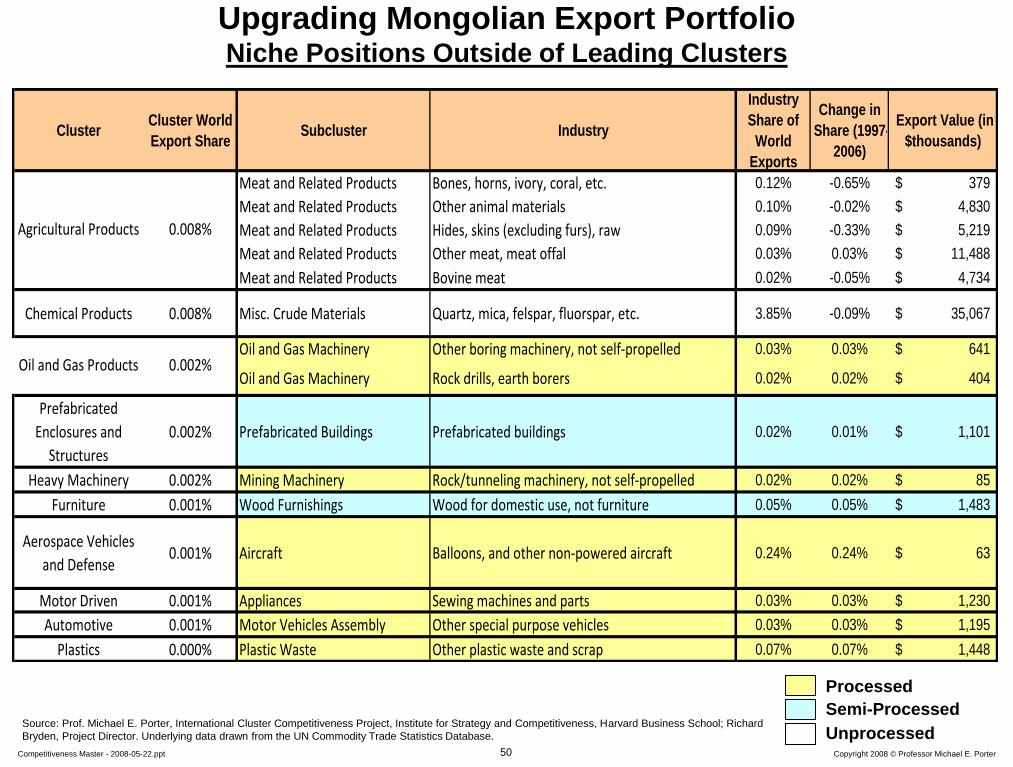
50 Copyright 2008 © Professor Michael E. Porter Competitiveness Master - 2008-05-22.ppt
ClusterCluster World
Export ShareSubcluster Industry
Industry
Share of
World
Exports
Change in
Share (1997-
2006)
Export Value (in
$thousands)
Meat and Related Products Bones, horns, ivory, coral, etc. 0.12% -0.65% 379$
Meat and Related Products Other animal materials 0.10% -0.02% 4,830$
Meat and Related Products Hides, skins (excluding furs), raw 0.09% -0.33% 5,219$
Meat and Related Products Other meat, meat offal 0.03% 0.03% 11,488$
Meat and Related Products Bovine meat 0.02% -0.05% 4,734$
Chemical Products 0.008% Misc. Crude Materials Quartz, mica, felspar, fluorspar, etc. 3.85% -0.09% 35,067$
Oil and Gas Machinery Other boring machinery, not self-propelled 0.03% 0.03% 641$
Oil and Gas Machinery Rock drills, earth borers 0.02% 0.02% 404$
Prefabricated
Enclosures and
Structures
0.002% Prefabricated Buildings Prefabricated buildings 0.02% 0.01% 1,101$
Heavy Machinery 0.002% Mining Machinery Rock/tunneling machinery, not self-propelled 0.02% 0.02% 85$
Furniture 0.001% Wood Furnishings Wood for domestic use, not furniture 0.05% 0.05% 1,483$
Aerospace Vehicles
and Defense0.001% Aircraft Balloons, and other non-powered aircraft 0.24% 0.24% 63$
Motor Driven 0.001% Appliances Sewing machines and parts 0.03% 0.03% 1,230$
Automotive 0.001% Motor Vehicles Assembly Other special purpose vehicles 0.03% 0.03% 1,195$
Plastics 0.000% Plastic Waste Other plastic waste and scrap 0.07% 0.07% 1,448$
0.008%
0.002%Oil and Gas Products
Agricultural Products
Upgrading Mongolian Export Portfolio Niche Positions Outside of Leading Clusters
Source: Prof. Michael E. Porter, International Cluster Competitiveness Project, Institute for Strategy and Competitiveness, Harvard Business School; Richard
Bryden, Project Director. Underlying data drawn from the UN Commodity Trade Statistics Database.
Processed
Semi-Processed
Unprocessed
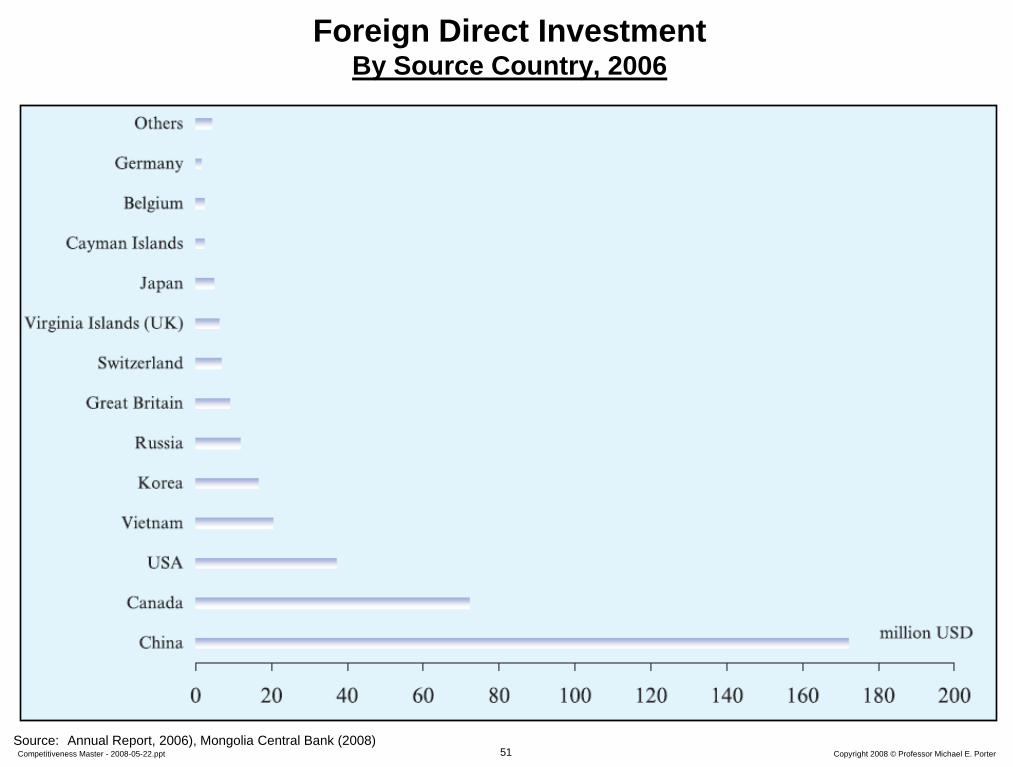
51 Copyright 2008 © Professor Michael E. Porter Competitiveness Master - 2008-05-22.ppt
Source: Annual Report, 2006), Mongolia Central Bank (2008)
Foreign Direct Investment By Source Country, 2006
52 Copyright 2008 © Professor Michael E. Porter Competitiveness Master - 2008-05-22.ppt
0
10
20
30
40
50
60
70
Geo
rgia
Aze
rbaija
n
Ukr
aine
Thaila
nd
Cam
bodia
Rus
sia
Sri
Lank
a
Philip
pine
s
Kaz
akhs
tan
Bra
zil
Kyr
gyzs
tan
Pak
ista
n
Ban
glad
esh
Uzb
ekista
n
Laos
Mal
aysia
Kor
ea
Taiwan
Indi
a
Indo
nesia
Mon
golia
Iran
Vietn
am
China
Singa
pore
Aus
tralia
New
Zea
land
Japa
n
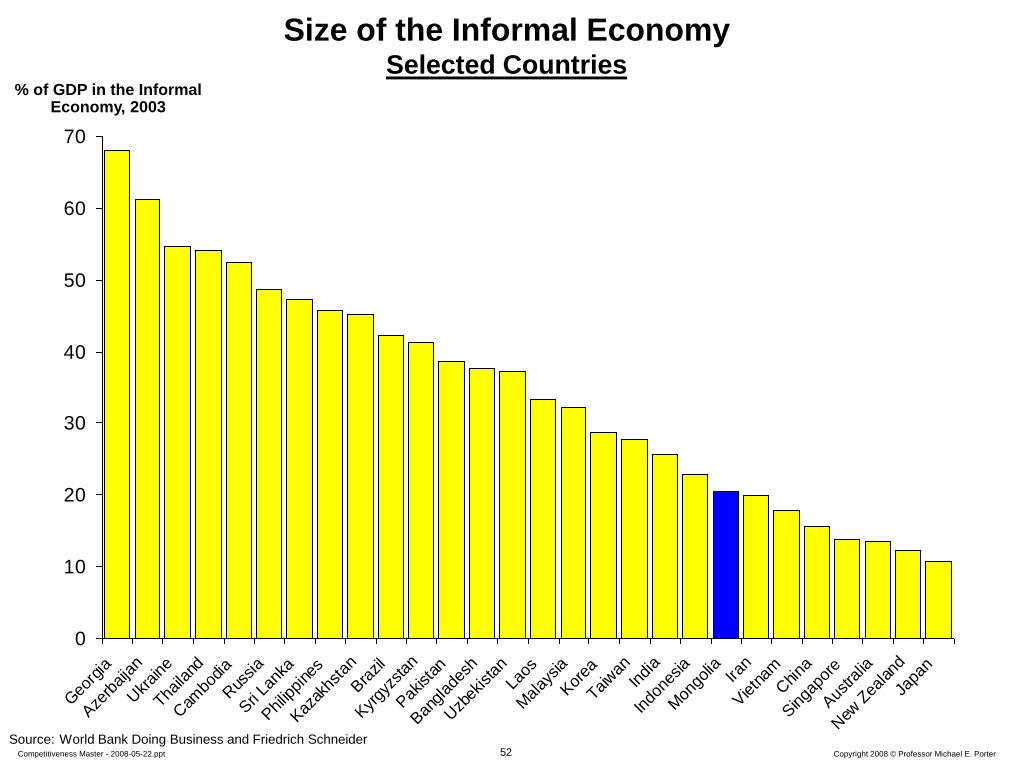
Size of the Informal Economy Selected Countries
Source: World Bank Doing Business and Friedrich Schneider
% of GDP in the Informal Economy, 2003
53 Copyright 2008 © Professor Michael E. Porter Competitiveness Master - 2008-05-22.ppt
0
10
20
30
40
50
60
Sou
th A
frica
Bra
zil
Pap
ua N
ew G
uine
a
Mal
aysia
China
Philip
pine
s
Hon
g Kon
g, C
hina
Singa
pore
Thaila
nd
Cam
bodia
Geo
rgia
Turkm
enista
n
Sri
Lank
a
Rus
sian
Fed
erat
ion
Indo
nesia
Iran,
Islam
ic R
ep.
Vietn
am Indi
a
Uzb
ekista
n
Aze
rbaija
n
Aus
tralia
Lao
PDR
Kaz
akhs
tan
Tajikista
n
Ban
glad
esh
Mon
golia
Kor
ea, R
ep.
Pak
ista
n
Kyr
gyz Rep
ublic
Japa
n
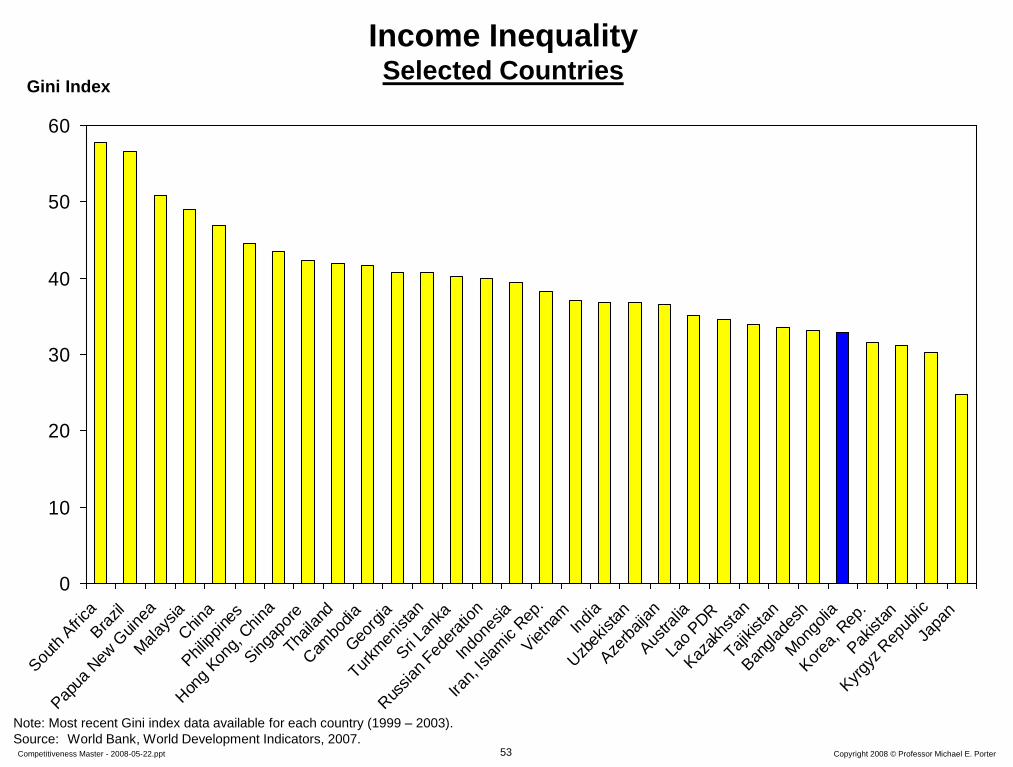
Income Inequality Selected Countries
Gini Index
Note: Most recent Gini index data available for each country (1999 – 2003).
Source: World Bank, World Development Indicators, 2007.
54 Copyright 2008 © Professor Michael E. Porter Competitiveness Master - 2008-05-22.ppt
Tests of a National Economic Strategy
• Has the country articulated a distinctive position?
– That will create a positive identity for the country?
– That will inspire citizens?
• Does the strategy build on strengths?
– Are the strengths realistic versus neighbors and other peer countries?
• Does the strategy fit with trends in the region and the world economy?
• Is the strategy realistic given the country’s weaknesses. Can those weaknesses inconsistent with the strategy be neutralized?
• Are social and political reforms integrated with economic reforms pursued simultaneously?
• Is there the political will and the political consensus to implement the strategy?
55 Copyright 2008 © Professor Michael E. Porter Competitiveness Master - 2008-05-22.ppt
Tests of a National Economic Strategy – cont’d
• Do the policy priorities fit the strategy?
– The choice of policies to address
– The sequence in which policies are implemented?
• Has the strategy been communicated clearly to the stakeholders?
• Is the private sector engaged?
• Is government organized around the strategy?
• Is there an overall coordinating structure for economic development?
• Is the quality of governmental agencies and other institutions sufficient for effective implementation?
• Are there mechanisms to measure progress and review / modify the strategy as prosperity improves or conditions change?