Competitiveness and Growth in Latin America Revisiting economic growth in Colombia - A microeconomic...
45
Competitiveness and Growth in Latin America Revisiting economic growth in Colombia - A microeconomic perspective Marcela Meléndez and Arturo Harker September 21, 2007
-
Upload
corey-roberts -
Category
Documents
-
view
214 -
download
0
Transcript of Competitiveness and Growth in Latin America Revisiting economic growth in Colombia - A microeconomic...
Competitiveness and Growth in Latin America
Revisiting economic growth in Colombia - A microeconomic
perspective
Marcela Meléndez and Arturo Harker
September 21, 2007
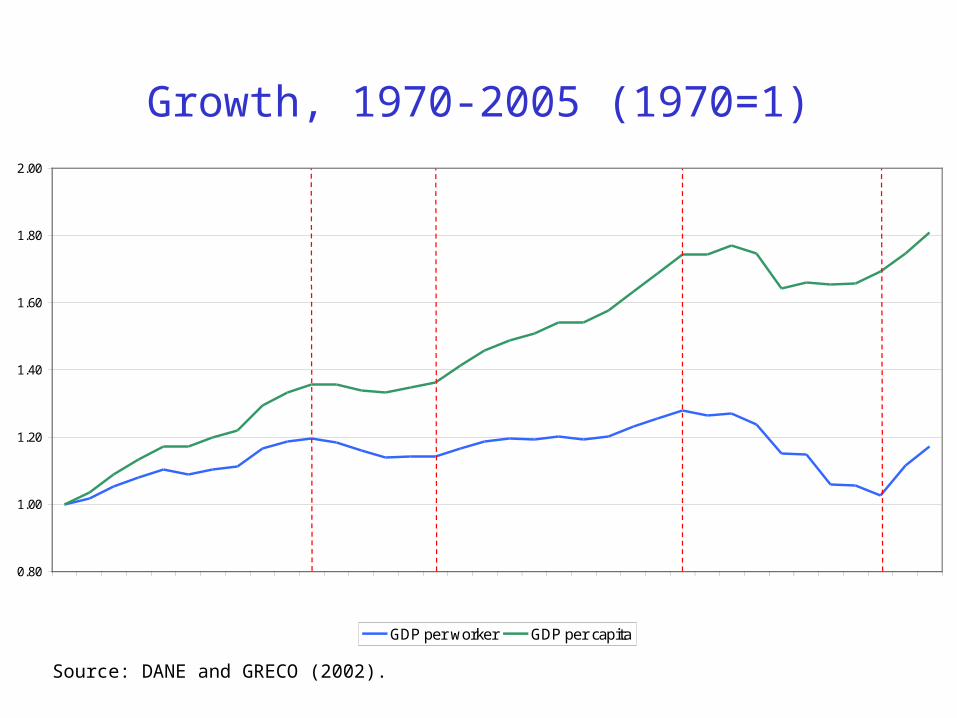
Growth, 1970-2005 (1970=1)
Source: DANE and GRECO (2002).
0.80
1.00
1.20
1.40
1.60
1.80
2.00
1970 1972 1974 1976 1978 1980 1982 1984 1986 1988 1990 1992 1994 1996 1998 2000 2002 2004
GDP per worker GDP per capita
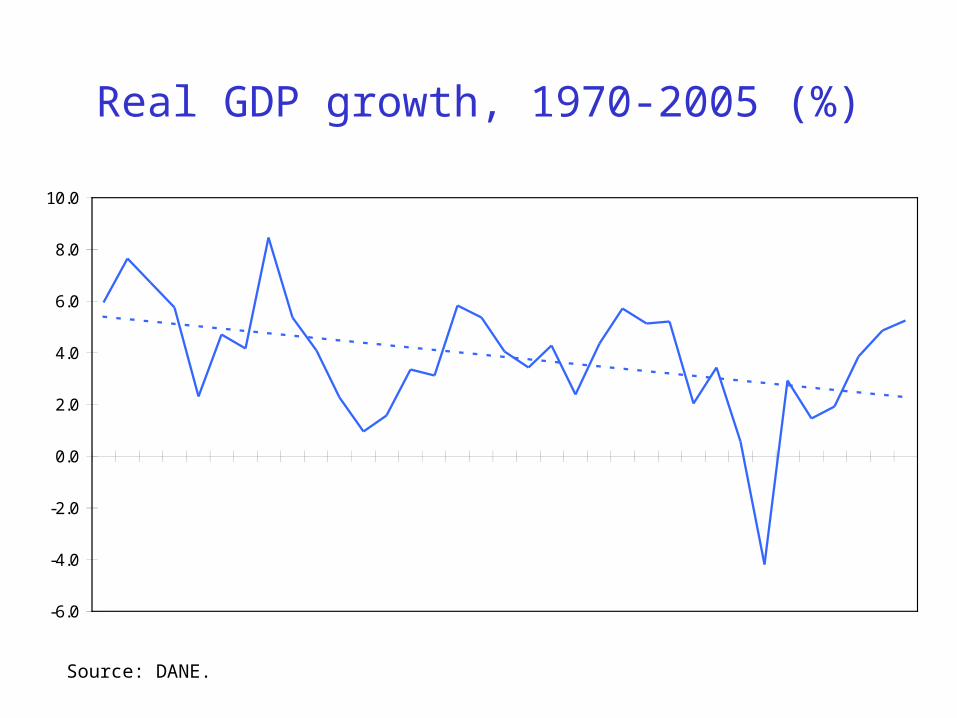
Real GDP growth, 1970-2005 (%)
Source: DANE.
-6.0
-4.0
-2.0
0.0
2.0
4.0
6.0
8.0
10.0
19711972197319741975197619771978197919801981198219831984198519861987198819891990199119921993199419951996199719981999200020012002200320042005
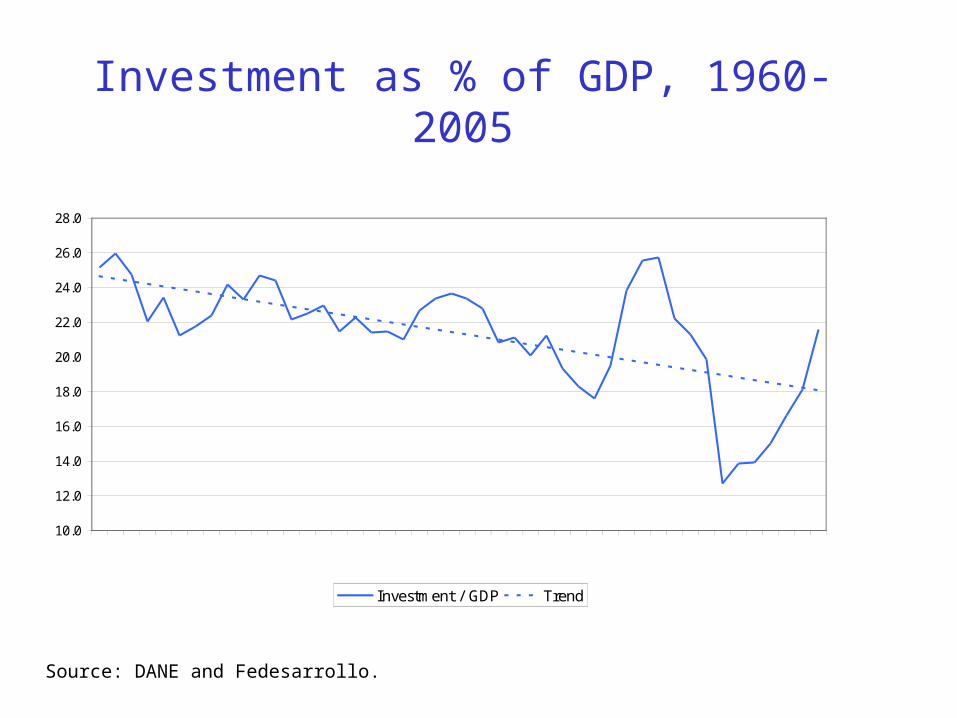
Investment as % of GDP, 1960-2005
Source: DANE and Fedesarrollo.
10.0
12.0
14.0
16.0
18.0
20.0
22.0
24.0
26.0
28.0
19601962196419661968197019721974197619781980198219841986198819901992199419961998200020022004
Investment / GDP Trend
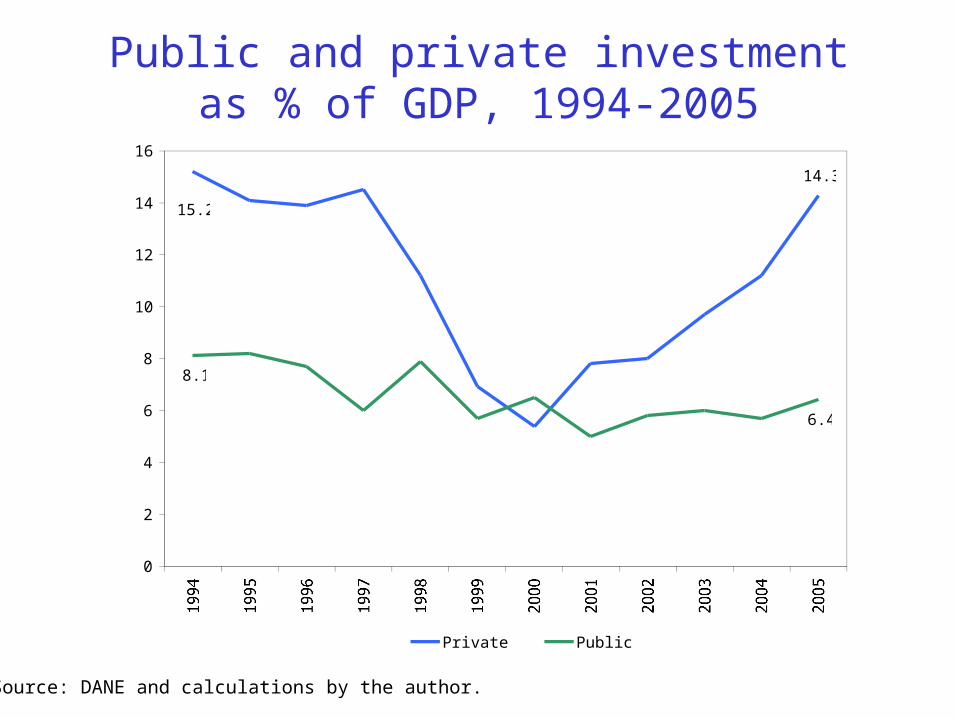
Public and private investment as % of GDP, 1994-2005
14.3
15.2
8.1
6.4
0
2
4
6
8
10
12
14
16
1994 1995 1996 1997 1998 1999 2000 2001 2002 2003 2004 2005
Private Public
Source: DANE and calculations by the author.

Investment by type of capital, as % of GDP
Source: DANE and calculations by the author.
0.0
5.0
10.0
15.0
20.0
25.0
1994 1995 1996 1997 1998 1999 2000 2001 2002 2003 2004 2005
Agriculture, hunting, forestry and fishing Furniture and equipmentMetal and metallic products Machinery (non-electrical)Machinery (electrical and other) Transportation equipmentConstruction - Housing and other buildings Construction - Transport infrastructure and otherServices

Regional differences - GDP per capita by department, 1990-2005
Source: DANE and calculations by the author.
1990-97 1997-02 2002-051990-05Amazonas -0.96 -1.21 1.15 -0.63Antioquia 1.07 -0.63 2.89 0.86Arauca -3.77 -12.01 0.69 -5.75Atlántico 2.28 -2.45 3.98 1.01Bogotá D.C. 1.27 -2.49 2.84 0.31Bolívar 0.30 1.59 2.79 1.22Boyacá 1.28 -1.02 3.10 0.86Caldas 1.94 0.64 3.33 1.78Caquetá 2.79 -5.44 2.17 -0.15Casanare 9.90 -0.98 -3.64 3.39Cauca 0.93 3.00 4.69 2.36Cesar 2.73 0.35 6.61 2.69Chocó 1.30 -1.25 4.63 1.09Córdoba 5.42 0.76 4.78 3.71Cundinamarca 1.36 -0.41 1.84 0.86Guainía 3.06 -4.06 -2.93 -0.57Guaviare 4.73 -14.53 -17.34 -6.65Huila 2.02 -0.91 2.91 1.21La Guajira 3.50 -4.26 8.62 1.82Magdalena 3.17 -2.33 2.25 1.12Meta 4.62 -2.63 1.29 1.49Nariño 2.20 1.53 1.61 1.86Norte Santander 0.27 0.21 -1.22 -0.05Putumayo 3.72 -0.76 -9.08 -0.45Quindío 3.18 -2.95 -1.20 0.22Risaralda 1.48 -2.67 4.57 0.68San Andrés y Providencia -0.52 -2.00 2.36 -0.45Santander 3.72 0.57 6.27 3.16Sucre 3.55 -2.71 4.29 1.57Tolima 4.81 -1.86 0.01 1.58Valle 2.09 -1.52 1.58 0.77Vaupés 9.24 -2.38 -4.89 2.34Vichada -8.06 7.57 4.64 -0.58
Real growth (annual averages)Departments
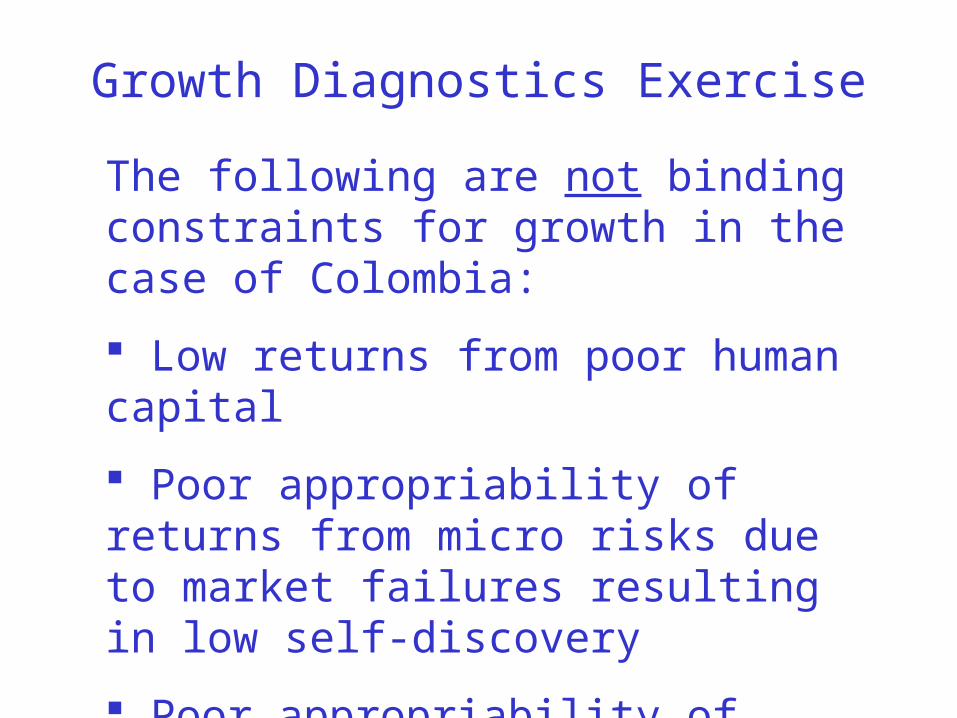
Growth Diagnostics Exercise
The following are not binding constraints for growth in the case of Colombia:
Low returns from poor human capital
Poor appropriability of returns from micro risks due to market failures resulting in low self-discovery
Poor appropriability of returns from government failures resulting in macroeconomic risks
Growth Diagnostics Exercise
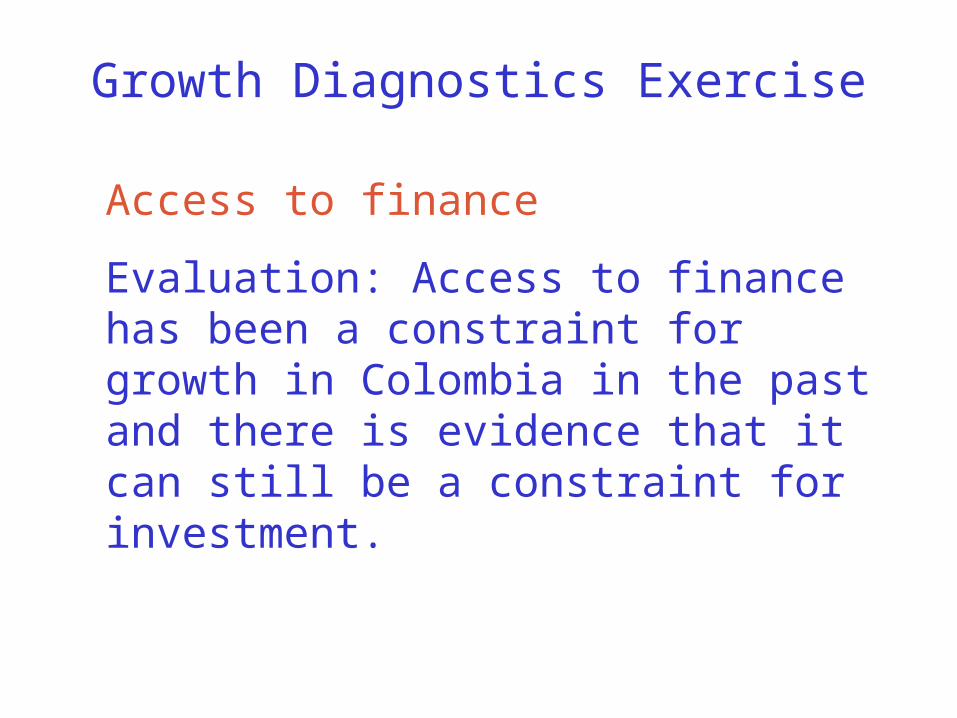
Access to finance
Evaluation: Access to finance has been a constraint for growth in Colombia in the past and there is evidence that it can still be a constraint for investment.

Interest rates, 1986-2004
Source: IFS.
Nominal Real Nominal Real1986 40.8 16.4 31.4 8.61987 41.1 13.8 30.8 5.51988 42.7 11.4 33.5 4.21989 43.0 13.4 33.7 6.01990 45.2 9.7 36.4 3.11991 47.1 16.0 37.2 8.21992 37.3 9.7 26.7 1.21993 35.8 10.8 25.8 2.61994 40.5 14.6 29.4 5.61995 42.7 19.5 32.3 10.81996 42.0 16.7 31.2 7.81997 34.2 14.1 24.1 5.51998 42.2 21.9 32.6 13.61999 25.8 15.1 21.3 11.12000 18.8 9.2 12.1 3.12001 20.7 12.1 12.4 4.52002 16.3 8.7 8.9 1.82003 15.2 8.2 7.8 1.22004 15.1 9.1 7.8 2.22005 14.6 9.3 7.0 2.12006 12.9 7.7 6.3 1.4
Lending rate Deposit rate
While recent growth in Colombia has been paired with falling interest rates, and this would signal that access to financing is not a constraint for growth…

The financial sector is still small and shallow..
Bank credit, stock market capitalization and domestic debt as % of GDP, 2004
Source: Source: IMF (2005). Data for Colombia: Banco de la República de Colombia, Superintendencia Financiera.
Government Financial Corporate
Mature MarketsJapan 94.4 78.5 141.0 25.6 16.3United States 45.8 129.0 47.1 22.0 22.0Euro Area 103.9 54.6 53.6 29.8 10.0
Emerging marketsAsia 103.6 74.1 22.3 13.4 6.9Europe 24.3 34.1 26.9 0.5 1.0Latin America 20.9 40.2 28.9 5.3 2.6 Argentina 10.4 30.7 5.8 3.4 6.4 Brazil 25.2 50.0 44.7 10.8 0.6 Chile 56.8 114.8 19.6 10.2 11.3 Peru 17.6 28.3 5.6 1.3 3.1 México 14.3 25.4 22.6 0.8 2.7 Colombia 18.0 24.3 22.8 4.3 3.9
Bank credit
Stock market capitalization
Domestic debt
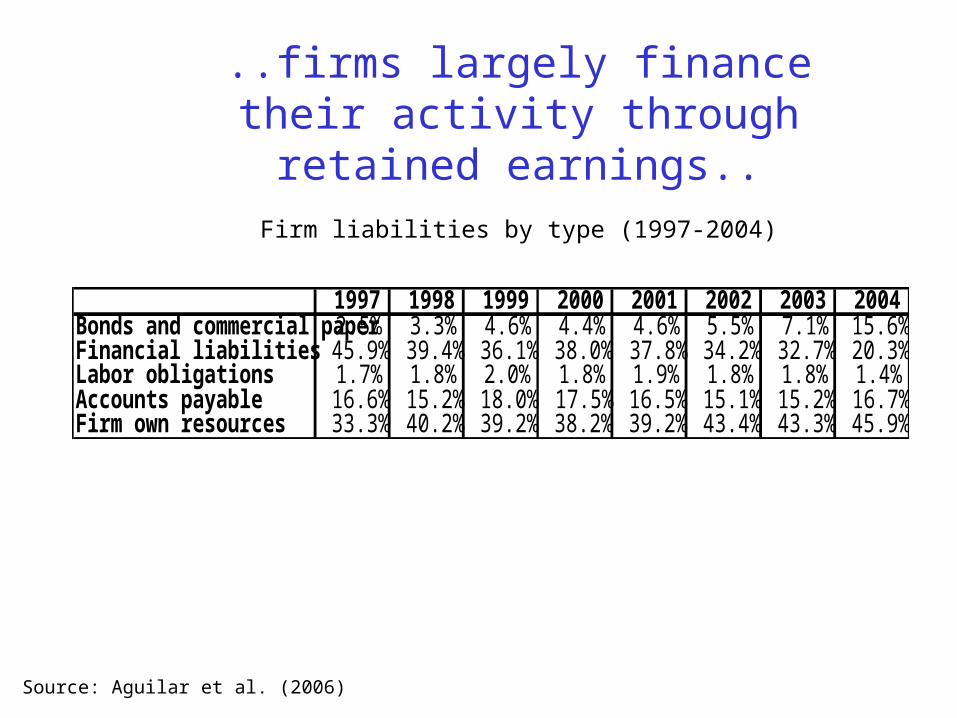
..firms largely finance their activity through retained
earnings..Firm liabilities by type (1997-2004)
Source: Aguilar et al. (2006)
1997 1998 1999 2000 2001 2002 2003 2004Bonds and commercial paper2.5% 3.3% 4.6% 4.4% 4.6% 5.5% 7.1% 15.6%Financial liabilities 45.9% 39.4% 36.1% 38.0% 37.8% 34.2% 32.7% 20.3%Labor obligations 1.7% 1.8% 2.0% 1.8% 1.9% 1.8% 1.8% 1.4%Accounts payable 16.6% 15.2% 18.0% 17.5% 16.5% 15.1% 15.2% 16.7%Firm own resources 33.3% 40.2% 39.2% 38.2% 39.2% 43.4% 43.3% 45.9%
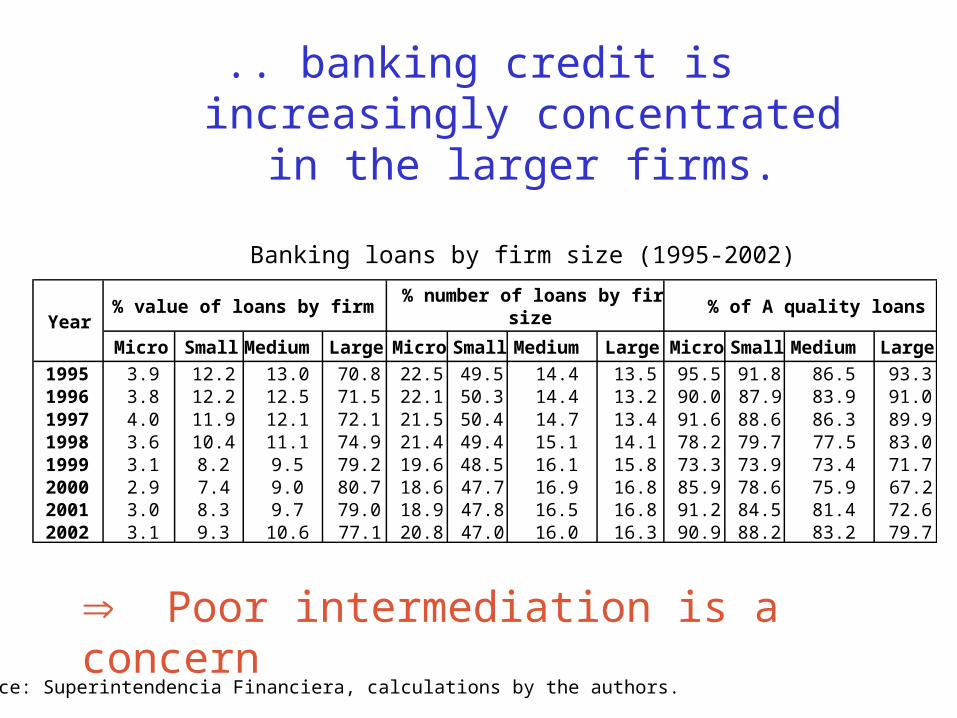
.. banking credit is increasingly concentrated in the larger firms.
Banking loans by firm size (1995-2002)
Source: Superintendencia Financiera, calculations by the authors.
Micro SmallMedium Large Micro Small Medium Large Micro Small Medium Large
1995 3.9 12.2 13.0 70.8 22.5 49.5 14.4 13.5 95.5 91.8 86.5 93.31996 3.8 12.2 12.5 71.5 22.1 50.3 14.4 13.2 90.0 87.9 83.9 91.01997 4.0 11.9 12.1 72.1 21.5 50.4 14.7 13.4 91.6 88.6 86.3 89.91998 3.6 10.4 11.1 74.9 21.4 49.4 15.1 14.1 78.2 79.7 77.5 83.01999 3.1 8.2 9.5 79.2 19.6 48.5 16.1 15.8 73.3 73.9 73.4 71.72000 2.9 7.4 9.0 80.7 18.6 47.7 16.9 16.8 85.9 78.6 75.9 67.22001 3.0 8.3 9.7 79.0 18.9 47.8 16.5 16.8 91.2 84.5 81.4 72.62002 3.1 9.3 10.6 77.1 20.8 47.0 16.0 16.3 90.9 88.2 83.2 79.7
Year% value of loans by firm size % of A quality loans
% number of loans by firm size
Poor intermediation is a concern
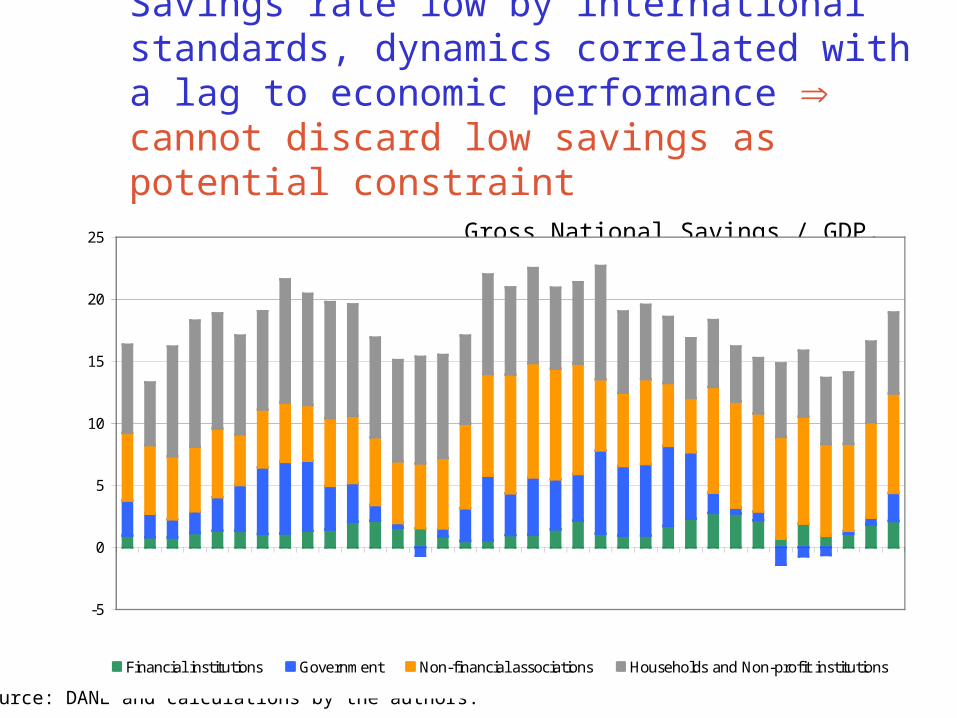
Savings rate low by international standards, dynamics correlated with a lag to economic performance cannot discard low savings as potential constraint Gross National Savings / GDP, 1970-2004
Source: DANE and calculations by the authors.
-5
0
5
10
15
20
25
1970 1972 1974 1976 1978 1980 1982 1984 1986 1988 1990 1992 1994 1996 1998 2000 2002 2004
Financial institutions Government Non-financial associations Households and Non-profit institutions
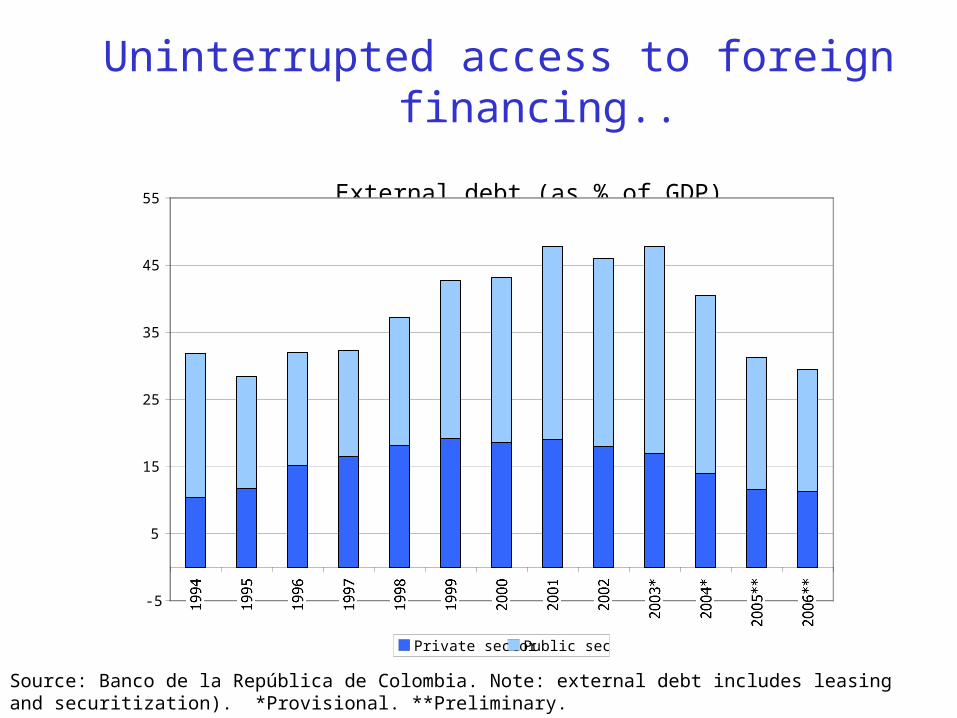
Uninterrupted access to foreign financing..
External debt (as % of GDP)
Source: Banco de la República de Colombia. Note: external debt includes leasing and securitization). *Provisional. **Preliminary.
-5
5
15
25
35
45
55
1994 1995 1996 1997 1998 1999 2000 2001 2002 2003* 2004* 2005**2006**
Private sector Public sector
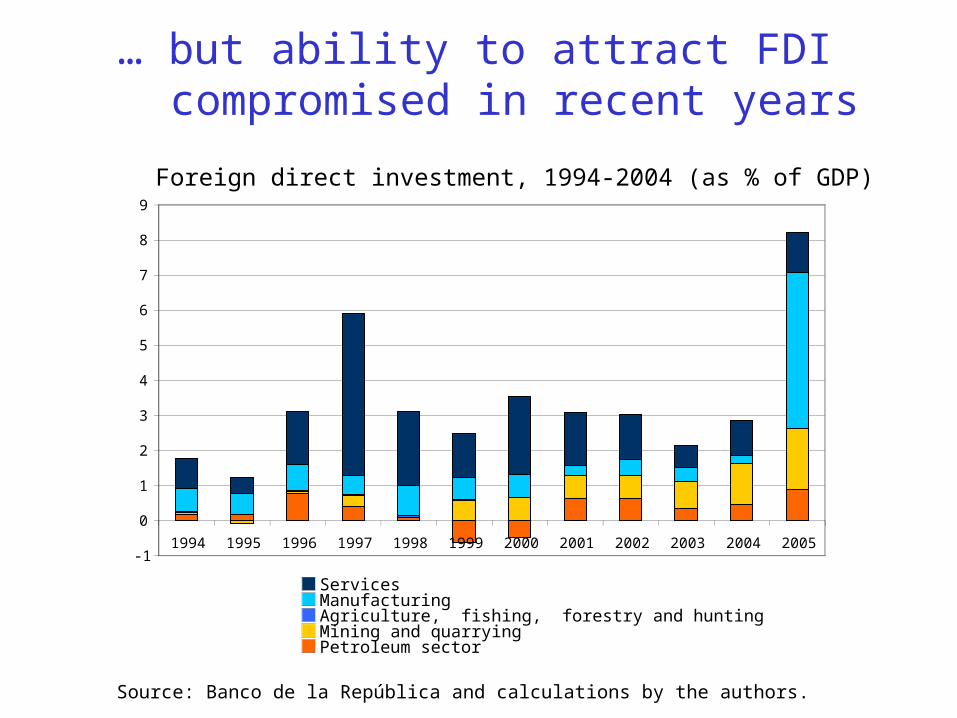
… but ability to attract FDI compromised in recent years
Foreign direct investment, 1994-2004 (as % of GDP)
Source: Banco de la República and calculations by the authors.
-1
0
1
2
3
4
5
6
7
8
9
1994 1995 1996 1997 1998 1999 2000 2001 2002 2003 2004 2005
ServicesManufacturingAgriculture, fishing, forestry and huntingMining and quarryingPetroleum sector

Growth Diagnostics Exercise
Low appropriability - government failures - micro risks
Evaluation: Uncertainty about private appropriability of investment returns due to poor protection of property rights, change of rules and weak competition policy is one of the most binding constraints for growth in Colombia.
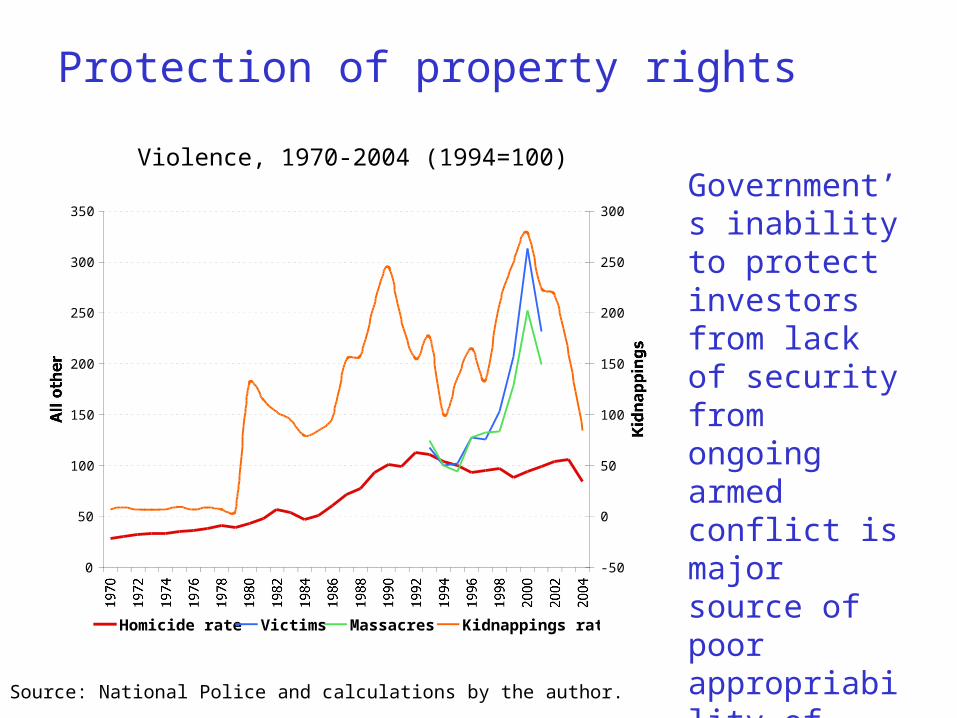
Protection of property rights
Violence, 1970-2004 (1994=100)
0
50
100
150
200
250
300
350
197019721974197619781980198219841986198819901992199419961998200020022004
All other
-50
0
50
100
150
200
250
300
Kidnappings
Homicide rate Victims Massacres Kidnappings rate
Source: National Police and calculations by the author.
Government’s inability to protect investors from lack of security from ongoing armed conflict is major source of poor appropriability of returns
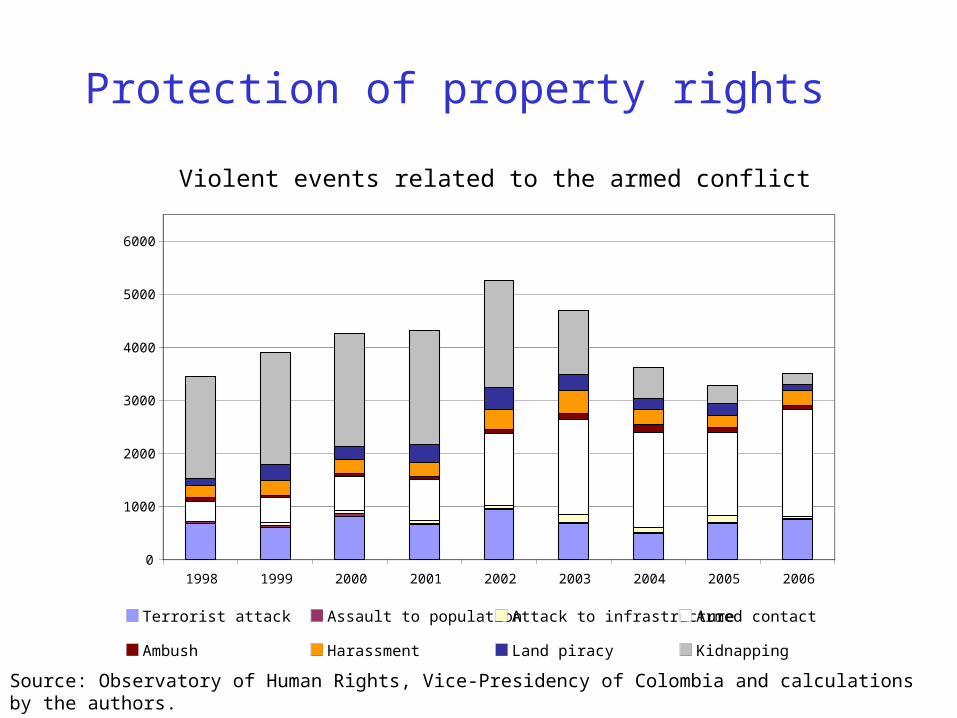
Protection of property rights
Violent events related to the armed conflict
Source: Observatory of Human Rights, Vice-Presidency of Colombia and calculations by the authors.
0
1000
2000
3000
4000
5000
6000
1998 1999 2000 2001 2002 2003 2004 2005 2006
Terrorist attack Assault to population Attack to infrastructure Armed contact
Ambush Harassment Land piracy Kidnapping
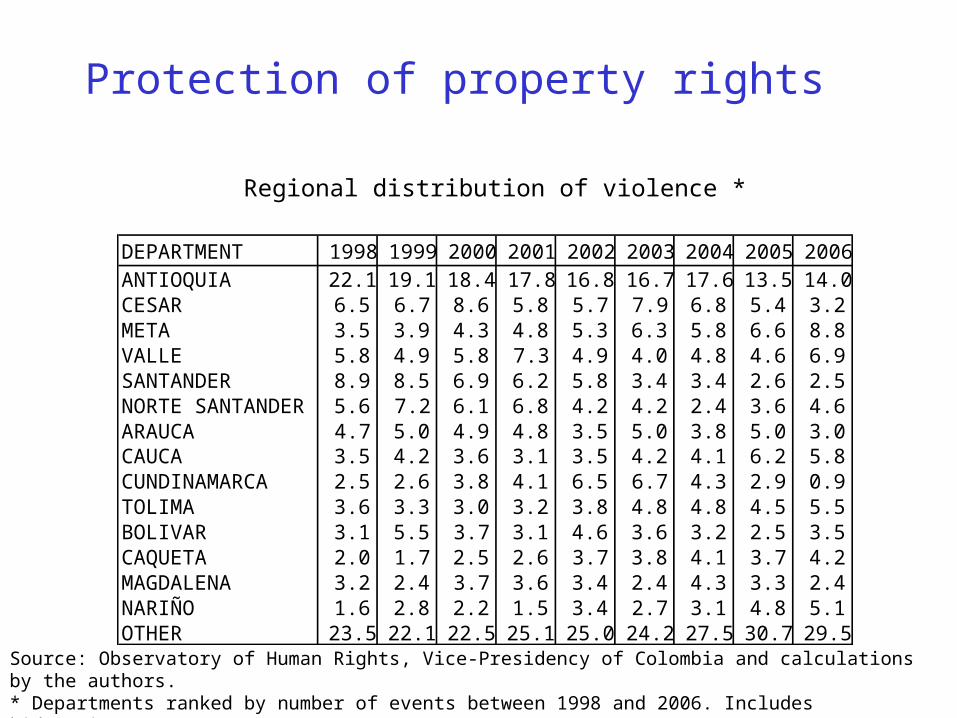
Protection of property rights
Regional distribution of violence *
Source: Observatory of Human Rights, Vice-Presidency of Colombia and calculations by the authors.* Departments ranked by number of events between 1998 and 2006. Includes kidnappings.
DEPARTMENT 1998 1999 2000 2001 2002 2003 2004 2005 2006ANTIOQUIA 22.1 19.1 18.4 17.8 16.8 16.7 17.6 13.5 14.0CESAR 6.5 6.7 8.6 5.8 5.7 7.9 6.8 5.4 3.2META 3.5 3.9 4.3 4.8 5.3 6.3 5.8 6.6 8.8VALLE 5.8 4.9 5.8 7.3 4.9 4.0 4.8 4.6 6.9SANTANDER 8.9 8.5 6.9 6.2 5.8 3.4 3.4 2.6 2.5NORTE SANTANDER 5.6 7.2 6.1 6.8 4.2 4.2 2.4 3.6 4.6ARAUCA 4.7 5.0 4.9 4.8 3.5 5.0 3.8 5.0 3.0CAUCA 3.5 4.2 3.6 3.1 3.5 4.2 4.1 6.2 5.8CUNDINAMARCA 2.5 2.6 3.8 4.1 6.5 6.7 4.3 2.9 0.9TOLIMA 3.6 3.3 3.0 3.2 3.8 4.8 4.8 4.5 5.5BOLIVAR 3.1 5.5 3.7 3.1 4.6 3.6 3.2 2.5 3.5CAQUETA 2.0 1.7 2.5 2.6 3.7 3.8 4.1 3.7 4.2MAGDALENA 3.2 2.4 3.7 3.6 3.4 2.4 4.3 3.3 2.4NARIÑO 1.6 2.8 2.2 1.5 3.4 2.7 3.1 4.8 5.1OTHER 23.5 22.1 22.5 25.1 25.0 24.2 27.5 30.7 29.5
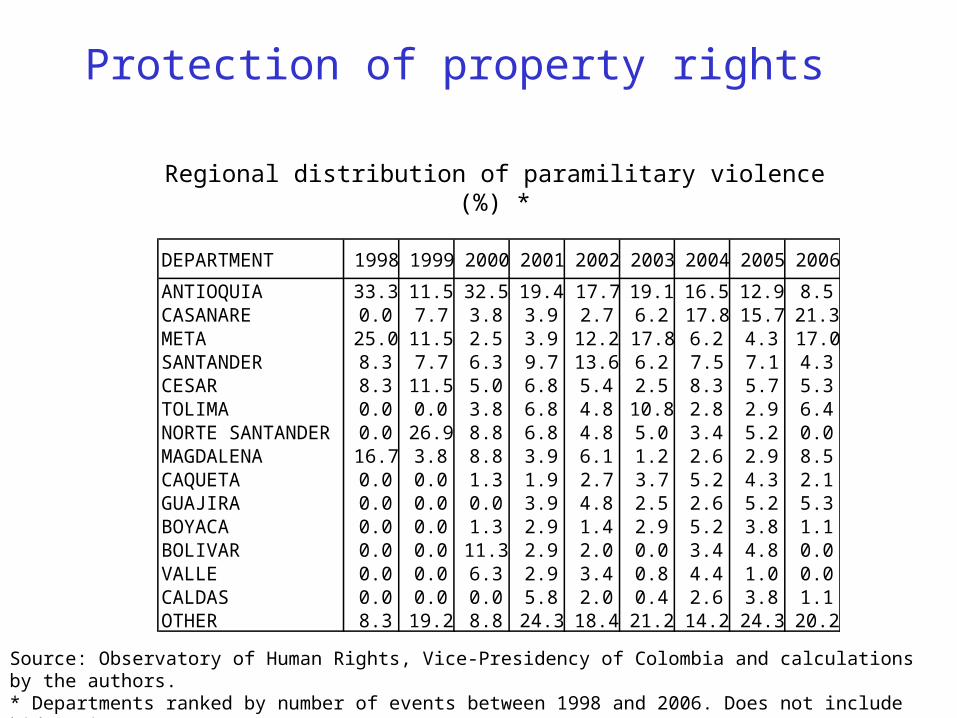
Protection of property rights
Regional distribution of paramilitary violence (%) *
Source: Observatory of Human Rights, Vice-Presidency of Colombia and calculations by the authors. * Departments ranked by number of events between 1998 and 2006. Does not include kidnappings.
DEPARTMENT 1998 1999 2000 2001 2002 2003 2004 2005 2006
ANTIOQUIA 33.3 11.5 32.5 19.4 17.7 19.1 16.5 12.9 8.5CASANARE 0.0 7.7 3.8 3.9 2.7 6.2 17.8 15.7 21.3META 25.0 11.5 2.5 3.9 12.2 17.8 6.2 4.3 17.0SANTANDER 8.3 7.7 6.3 9.7 13.6 6.2 7.5 7.1 4.3CESAR 8.3 11.5 5.0 6.8 5.4 2.5 8.3 5.7 5.3TOLIMA 0.0 0.0 3.8 6.8 4.8 10.8 2.8 2.9 6.4NORTE SANTANDER 0.0 26.9 8.8 6.8 4.8 5.0 3.4 5.2 0.0MAGDALENA 16.7 3.8 8.8 3.9 6.1 1.2 2.6 2.9 8.5CAQUETA 0.0 0.0 1.3 1.9 2.7 3.7 5.2 4.3 2.1GUAJIRA 0.0 0.0 0.0 3.9 4.8 2.5 2.6 5.2 5.3BOYACA 0.0 0.0 1.3 2.9 1.4 2.9 5.2 3.8 1.1BOLIVAR 0.0 0.0 11.3 2.9 2.0 0.0 3.4 4.8 0.0VALLE 0.0 0.0 6.3 2.9 3.4 0.8 4.4 1.0 0.0CALDAS 0.0 0.0 0.0 5.8 2.0 0.4 2.6 3.8 1.1OTHER 8.3 19.2 8.8 24.3 18.4 21.2 14.2 24.3 20.2
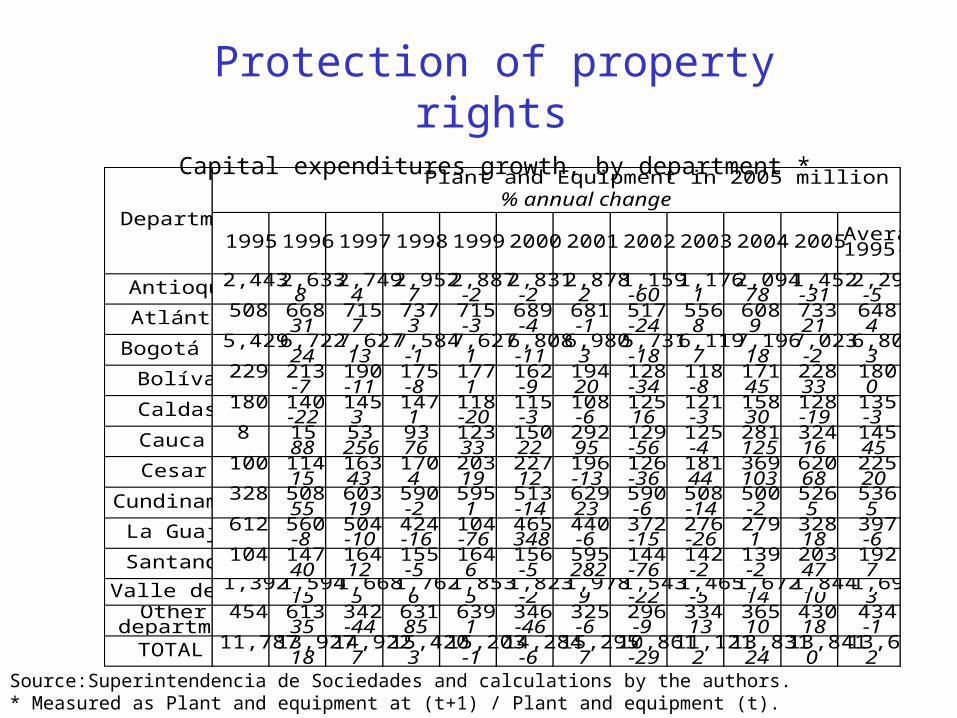
Protection of property rights
Capital expenditures growth, by department *
Source:Superintendencia de Sociedades and calculations by the authors. * Measured as Plant and equipment at (t+1) / Plant and equipment (t).
19951996199719981999200020012002200320042005Average 1995-05
2,4432,6332,7492,9522,8872,8312,8781,1591,1762,0941,4522,2968 4 7 -2 -2 2 -60 1 78 -31 -5
508 668 715 737 715 689 681 517 556 608 733 64831 7 3 -3 -4 -1 -24 8 9 21 4
5,4296,7227,6277,5847,6276,8086,9805,7316,1197,1967,0236,80424 13 -1 1 -11 3 -18 7 18 -2 3
229 213 190 175 177 162 194 128 118 171 228 180-7 -11 -8 1 -9 20 -34 -8 45 33 0
180 140 145 147 118 115 108 125 121 158 128 135-22 3 1 -20 -3 -6 16 -3 30 -19 -3
8 15 53 93 123 150 292 129 125 281 324 14588 256 76 33 22 95 -56 -4 125 16 45
100 114 163 170 203 227 196 126 181 369 620 22515 43 4 19 12 -13 -36 44 103 68 20
328 508 603 590 595 513 629 590 508 500 526 53655 19 -2 1 -14 23 -6 -14 -2 5 5
612 560 504 424 104 465 440 372 276 279 328 397-8 -10 -16 -76 348 -6 -15 -26 1 18 -6
104 147 164 155 164 156 595 144 142 139 203 19240 12 -5 6 -5 282 -76 -2 -2 47 7
1,3921,5941,6681,7621,8531,8231,9781,5431,4651,6721,8441,69015 5 6 5 -2 9 -22 -5 14 10 3
454 613 342 631 639 346 325 296 334 365 430 43435 -44 85 1 -46 -6 -9 13 10 18 -1
11,78713,92714,92215,42015,20314,28415,29510,86111,12113,83113,84113,68118 7 3 -1 -6 7 -29 2 24 0 2
Antioquia
Atlántico
Bogotá D.C.
Bolívar
Caldas
Cauca
Cesar
Cundinamarca
La Guajira
Santander
Valle del CaucaOther
departmentsTOTAL
Plant and Equipment in 2005 million USD% annual change
Department
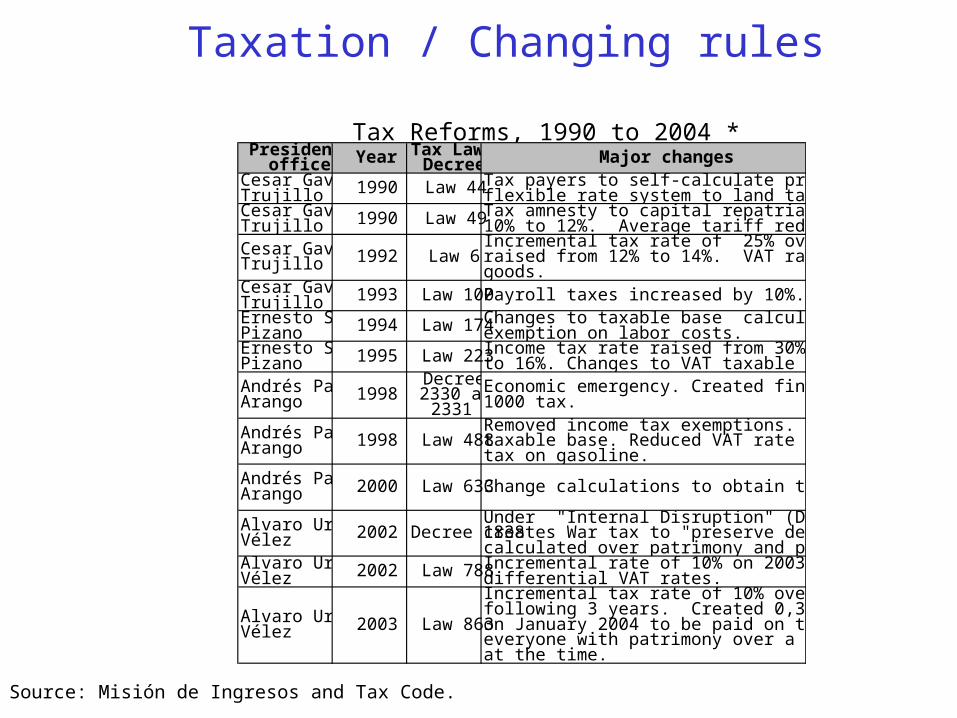
Taxation / Changing rules
Tax Reforms, 1990 to 2004 *
Source: Misión de Ingresos and Tax Code.
President in office Year Tax Law or
Decree Major changesCesar Gaviria Trujillo 1990 Law 44Tax payers to self-calculate property values. Introduction of
flexible rate system to land taxes.Cesar Gaviria Trujillo 1990 Law 49Tax amnesty to capital repatriation. VAT tax raised from
10% to 12%. Average tariff reduced from 16,5% to 7%.Cesar Gaviria Trujillo 1992 Law 6
Incremental tax rate of 25% over income tax. VAT tax raised from 12% to 14%. VAT rate of 35-45% for luxury goods.
Cesar Gaviria Trujillo 1993 Law 100Payroll taxes increased by 10%.Ernesto Samper Pizano 1994 Law 174Changes to taxable base calculations of. 30% tax
exemption on labor costs.Ernesto Samper Pizano 1995 Law 223Income tax rate raised from 30% to 35%. VAT tax raised
to 16%. Changes to VAT taxable set.Andrés Pastrana Arango 1998
Decrees 2330 and
2331Economic emergency. Created financial transactions 2 x 1000 tax.
Andrés Pastrana Arango 1998 Law 488
Removed income tax exemptions. Changed calculation of taxable base. Reduced VAT rate from 16% to 15%. New tax on gasoline.
Andrés Pastrana Arango 2000 Law 633Change calculations to obtain taxable base.
Alvaro Uribe Vélez 2002 Decree 1838
Under "Internal Disruption" (Decree 1837, August 2002) creates War tax to "preserve democratic security", to be calculated over patrimony and paid only once.
Alvaro Uribe Vélez 2002 Law 788Incremental rate of 10% on 2003 income tax. Introduced
differential VAT rates.
Alvaro Uribe Vélez 2003 Law 863
Incremental tax rate of 10% over income tax of the following 3 years. Created 0,3% tax on patrimony owned on January 2004 to be paid on the following 3 years by everyone with patrimony over a floor of 3,000 million pesos at the time.
Taxation / Changing rules
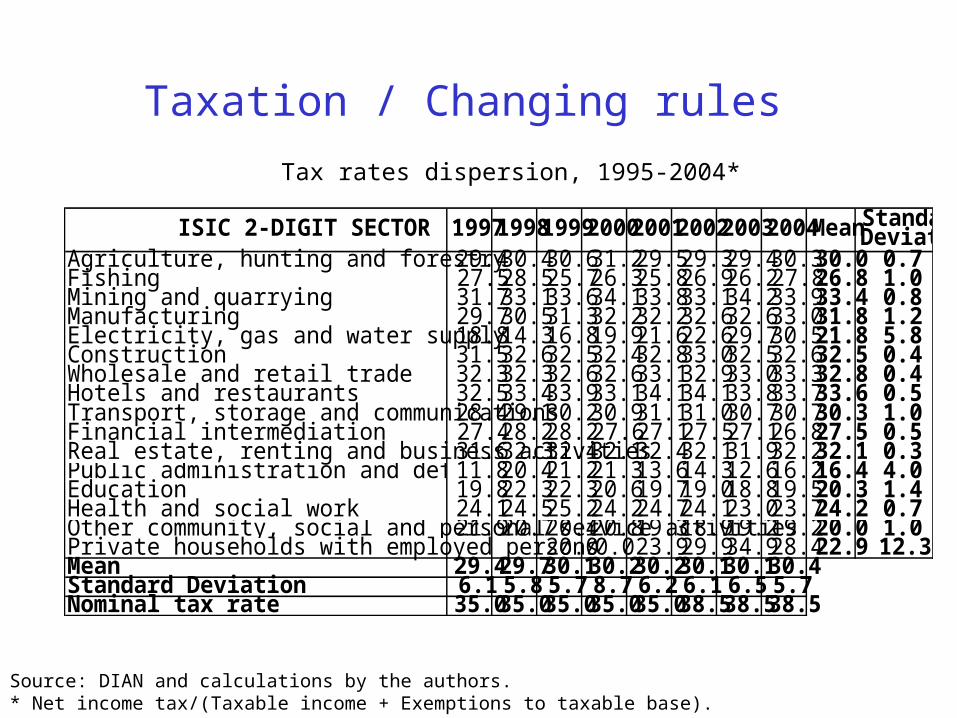
Tax rates dispersion, 1995-2004*
Source: DIAN and calculations by the authors. * Net income tax/(Taxable income + Exemptions to taxable base).
ISIC 2-DIGIT SECTOR 19971998199920002001200220032004MeanStandard Deviation
Agriculture, hunting and forestry 29.430.430.631.229.529.329.430.330.0 0.7Fishing 27.528.525.726.325.826.926.227.826.8 1.0Mining and quarrying 31.733.133.634.133.833.134.233.933.4 0.8Manufacturing 29.730.531.332.232.232.632.633.031.8 1.2Electricity, gas and water supply 18.814.316.819.921.622.629.730.521.8 5.8Construction 31.532.632.532.432.833.032.532.632.5 0.4Wholesale and retail trade 32.332.332.632.633.132.933.033.332.8 0.4Hotels and restaurants 32.533.433.933.134.134.133.833.733.6 0.5Transport, storage and communications28.429.130.230.931.131.030.730.730.3 1.0Financial intermediation 27.428.228.227.627.127.527.126.827.5 0.5Real estate, renting and business activities31.632.332.432.132.432.131.932.232.1 0.3Public administration and defence; compulsory social security11.820.421.221.313.614.312.616.216.4 4.0Education 19.822.322.320.619.719.018.819.520.3 1.4Health and social work 24.124.525.224.224.724.123.023.724.2 0.7Other community, social and personal service activities21.920.720.420.819.318.919.219.220.0 1.0Private households with employed persons20.00.0 23.929.934.928.422.9 12.3Mean 29.429.730.130.230.230.130.130.4Standard Deviation 6.1 5.8 5.7 8.7 6.2 6.1 6.5 5.7Nominal tax rate 35.035.035.035.035.038.538.538.5

Weak competition policy
Record of Antitrust cases, 2000 – March, 2007
Source: Superintendence of Industry and Commerce.
Guarantee (1) Sanction (2) File (3) Transfer (4) Other (5) Total
Agreements to restrict
competition25 10 21 0 2 58
Abuse of market power
6 4 4 0 0 14
Unauthorized merger
5 6 6 1 0 18
Other 3 3 8 0 0 14
Total 39 23 39 1 2 104
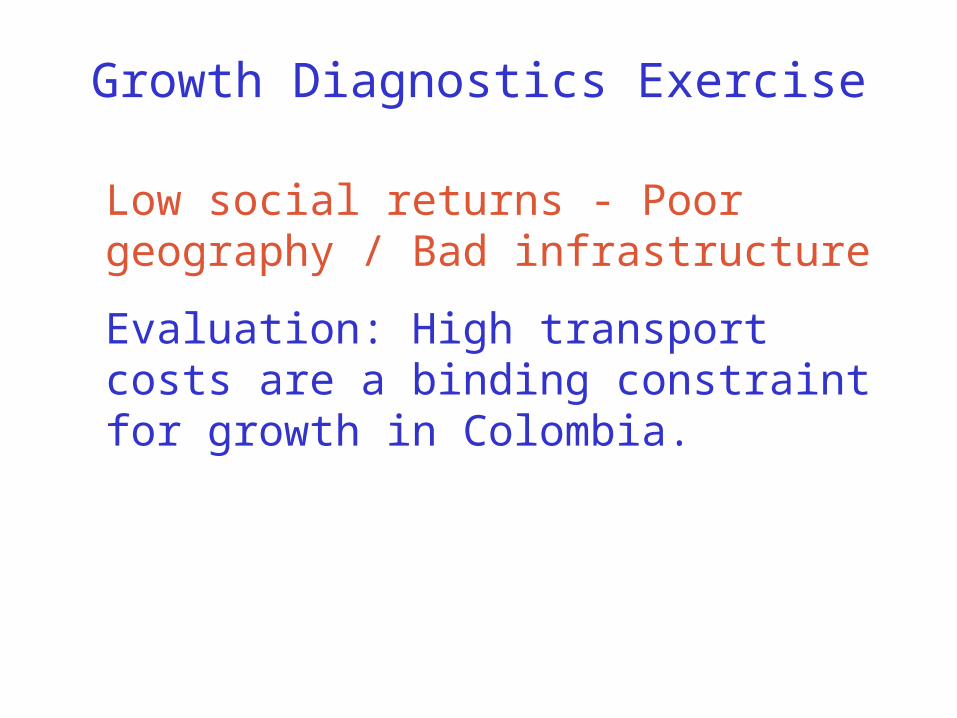
Growth Diagnostics Exercise
Low social returns - Poor geography / Bad infrastructure
Evaluation: High transport costs are a binding constraint for growth in Colombia.
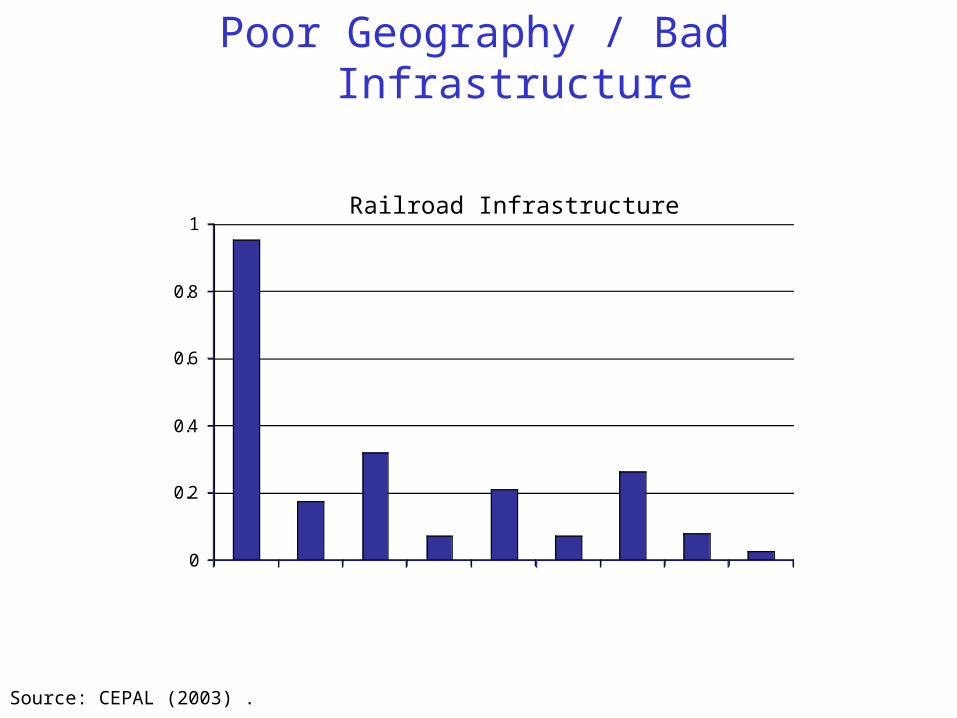
Poor Geography / Bad Infrastructure
Railroad Infrastructure
Source: CEPAL (2003) .
0
0.2
0.4
0.6
0.8
1
Argentina
Brasil Chile
ColombiaCosta RicaEcuadorMexico
Peru
Venezuela
Km / 1000 inhabitants (2001)
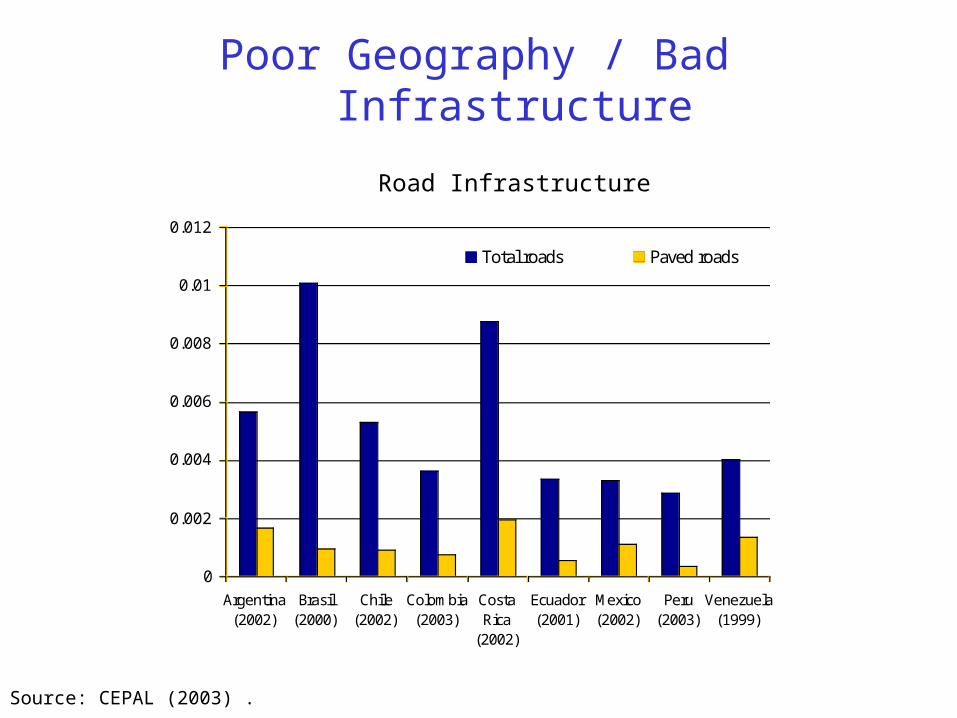
Poor Geography / Bad Infrastructure
Road Infrastructure
Source: CEPAL (2003) .
0
0.002
0.004
0.006
0.008
0.01
0.012
Argentina(2002)
Brasil(2000)
Chile(2002)
Colombia(2003)
CostaRica
(2002)
Ecuador(2001)
Mexico(2002)
Peru(2003)
Venezuela(1999)
Km per capita
Total roads Paved roads

Poor Geography / Bad Infrastructure
National road network
Source: INVIAS .
Km % Km % Km % Km % Km % Km %1998 10,388 2,931 13,319 8,103 78 1,766 17 519 5 1,348 46 938 32 645 221999 11,010 3,549 14,559 7,597 69 2,312 21 1,101 10 674 19 1,597 45 1,278 362000 11,732 4,790 16,522 7,978 68 2,816 24 939 8 2,156 45 1,868 39 766 162001 11,744 4,791 16,535 8,221 70 2,701 23 822 7 1,629 34 2,012 42 1,150 242002 11,921 4,607 16,528 8,225 69 2,623 22 1,073 9 1,889 41 1,520 33 1,198 262003 12,154 4,493 16,647 8,022 66 3,160 26 972 8 1,887 42 1,573 35 1,033 232004 12,170 4,471 16,641 8,276 68 3,043 25 852 7 1,967 44 1,654 37 849 19
Paved UnpavedGood Medium Bad Good Medium BadYear
Km Paved
Km Unpaved
Km Total
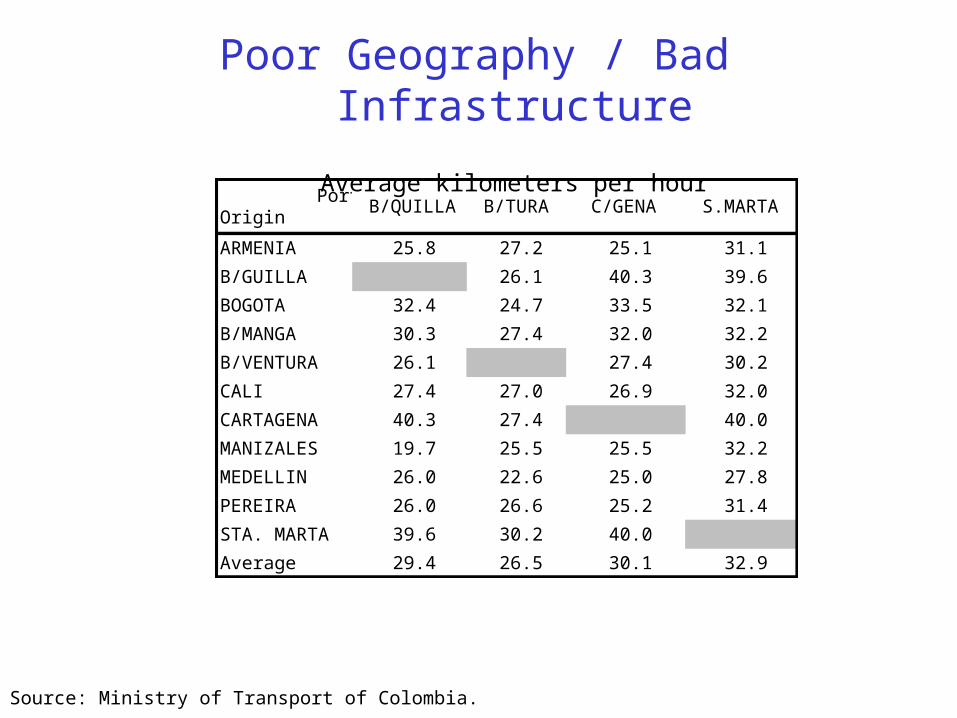
Poor Geography / Bad Infrastructure
Average kilometers per hour
Source: Ministry of Transport of Colombia.
PortOrigin
B/QUILLA B/TURA C/GENA S.MARTA
ARMENIA 25.8 27.2 25.1 31.1
B/GUILLA 26.1 40.3 39.6
BOGOTA 32.4 24.7 33.5 32.1
B/MANGA 30.3 27.4 32.0 32.2
B/VENTURA 26.1 27.4 30.2
CALI 27.4 27.0 26.9 32.0
CARTAGENA 40.3 27.4 40.0
MANIZALES 19.7 25.5 25.5 32.2
MEDELLIN 26.0 22.6 25.0 27.8
PEREIRA 26.0 26.6 25.2 31.4
STA. MARTA 39.6 30.2 40.0
Average 29.4 26.5 30.1 32.9
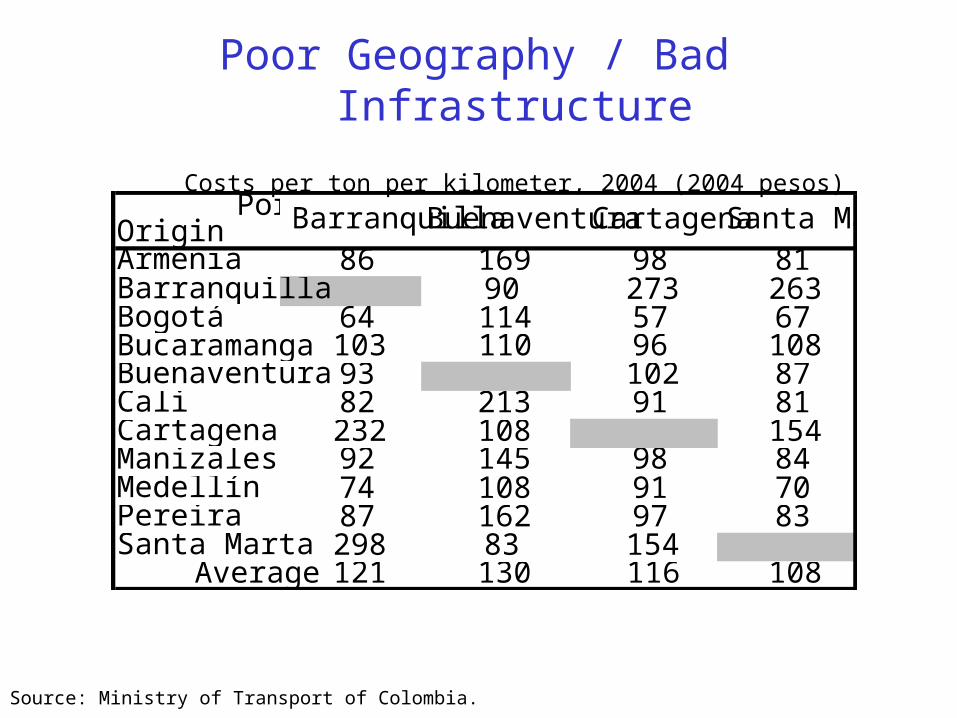
Poor Geography / Bad Infrastructure
Costs per ton per kilometer, 2004 (2004 pesos)
Source: Ministry of Transport of Colombia.
PortOrigin BarranquillaBuenaventuraCartagenaSanta MartaArmenia 86 169 98 81Barranquilla 90 273 263Bogotá 64 114 57 67Bucaramanga 103 110 96 108Buenaventura 93 102 87Cali 82 213 91 81Cartagena 232 108 154Manizales 92 145 98 84Medellín 74 108 91 70Pereira 87 162 97 83Santa Marta 298 83 154
Average 121 130 116 108
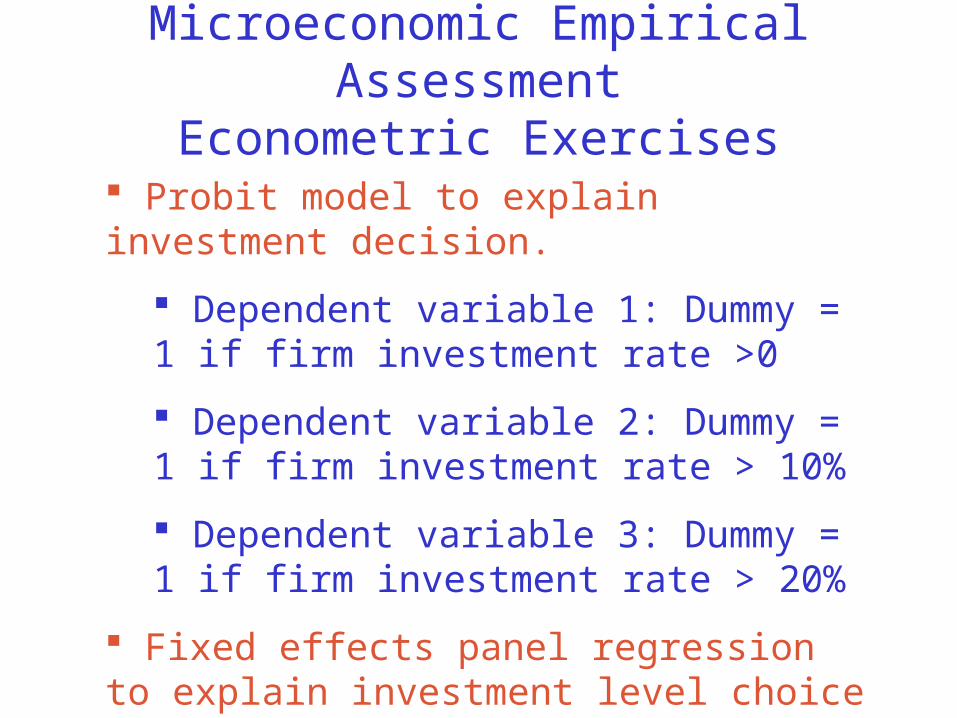
Microeconomic Empirical Assessment
Econometric Exercises Probit model to explain investment decision.
Dependent variable 1: Dummy = 1 if firm investment rate >0
Dependent variable 2: Dummy = 1 if firm investment rate > 10%
Dependent variable 3: Dummy = 1 if firm investment rate > 20%
Fixed effects panel regression to explain investment level choice of firms that choose to invest.
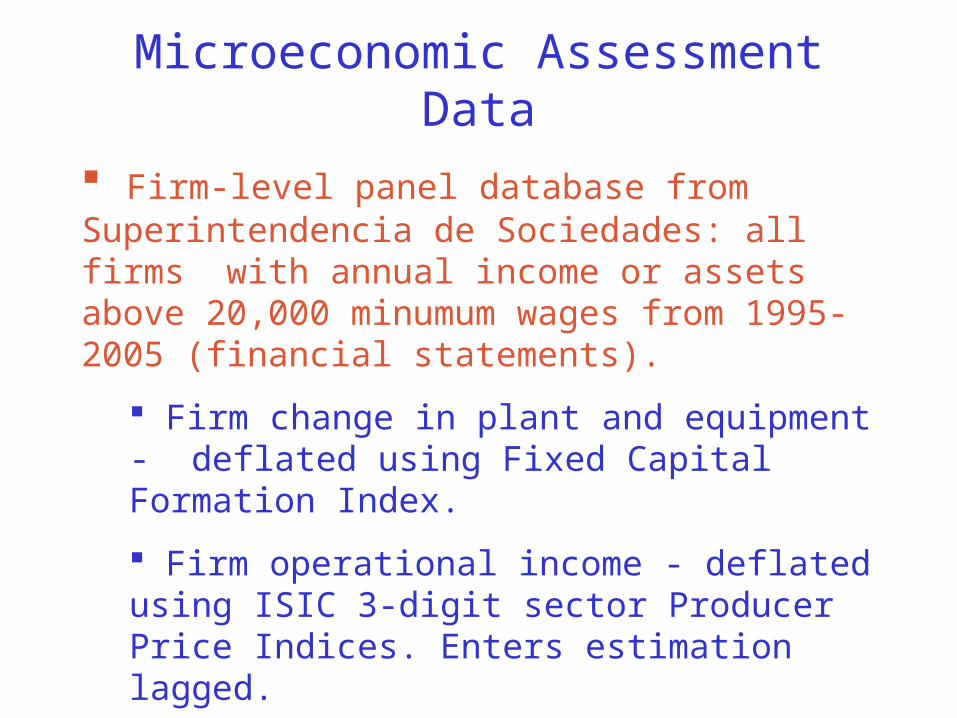
Microeconomic AssessmentData
Firm-level panel database from Superintendencia de Sociedades: all firms with annual income or assets above 20,000 minumum wages from 1995-2005 (financial statements).
Firm change in plant and equipment - deflated using Fixed Capital Formation Index.
Firm operational income - deflated using ISIC 3-digit sector Producer Price Indices. Enters estimation lagged.
Herfindahl Hirshman indices of market concentration at ISIC 4-digit sector level.
Microeconomic AssessmentData
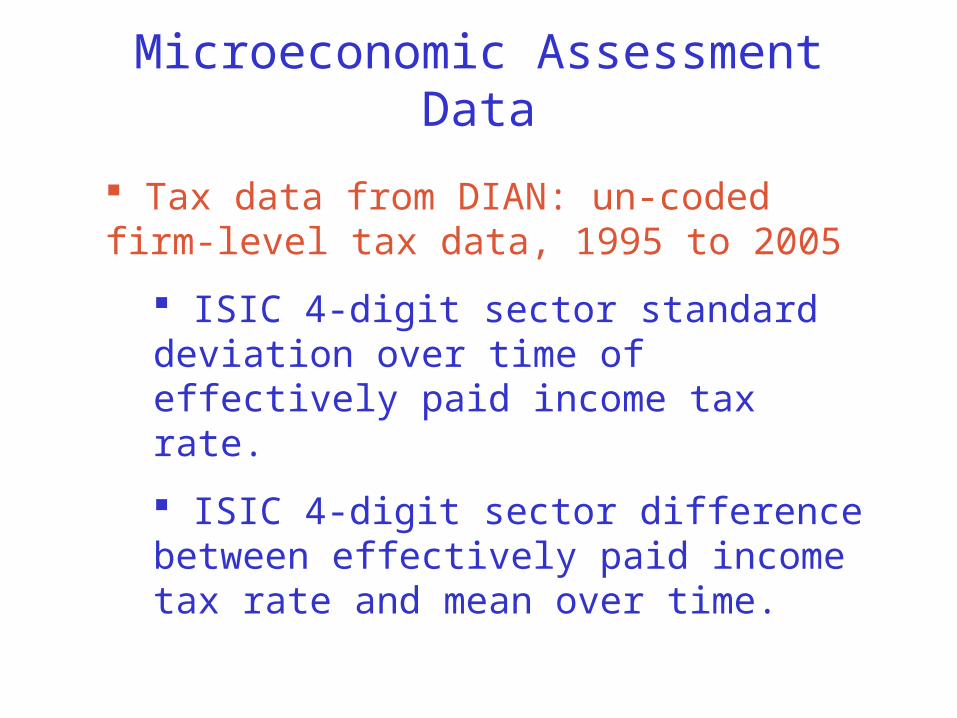
Tax data from DIAN: un-coded firm-level tax data, 1995 to 2005
ISIC 4-digit sector standard deviation over time of effectively paid income tax rate.
ISIC 4-digit sector difference between effectively paid income tax rate and mean over time.
Microeconomic AssessmentData
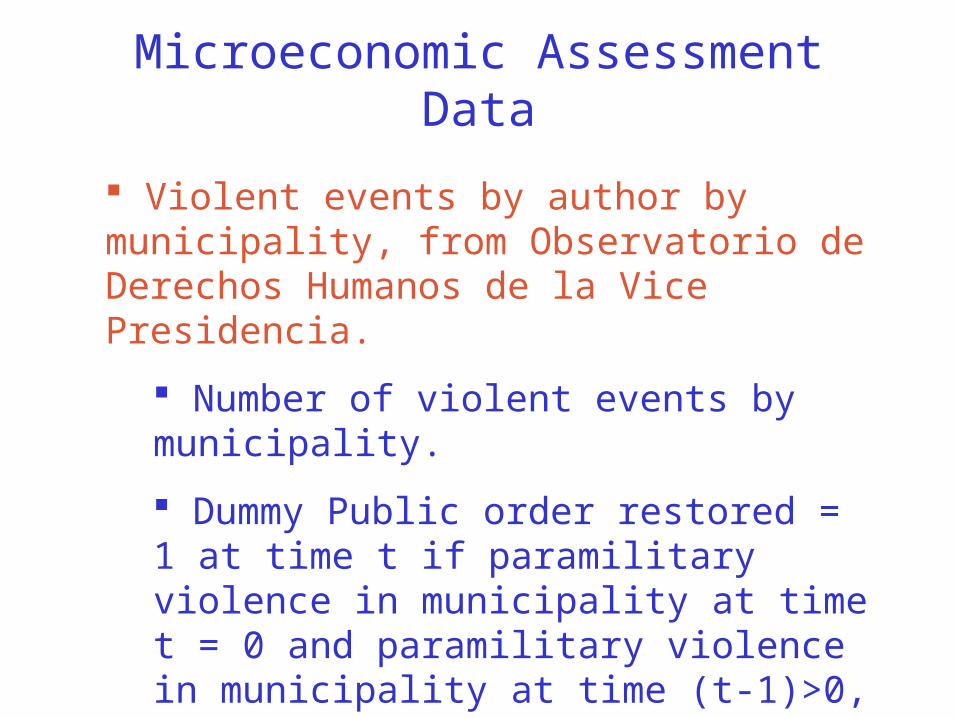
Violent events by author by municipality, from Observatorio de Derechos Humanos de la Vice Presidencia.
Number of violent events by municipality.
Dummy Public order restored = 1 at time t if paramilitary violence in municipality at time t = 0 and paramilitary violence in municipality at time (t-1)>0, 0 otherwise.
Microeconomic AssessmentData
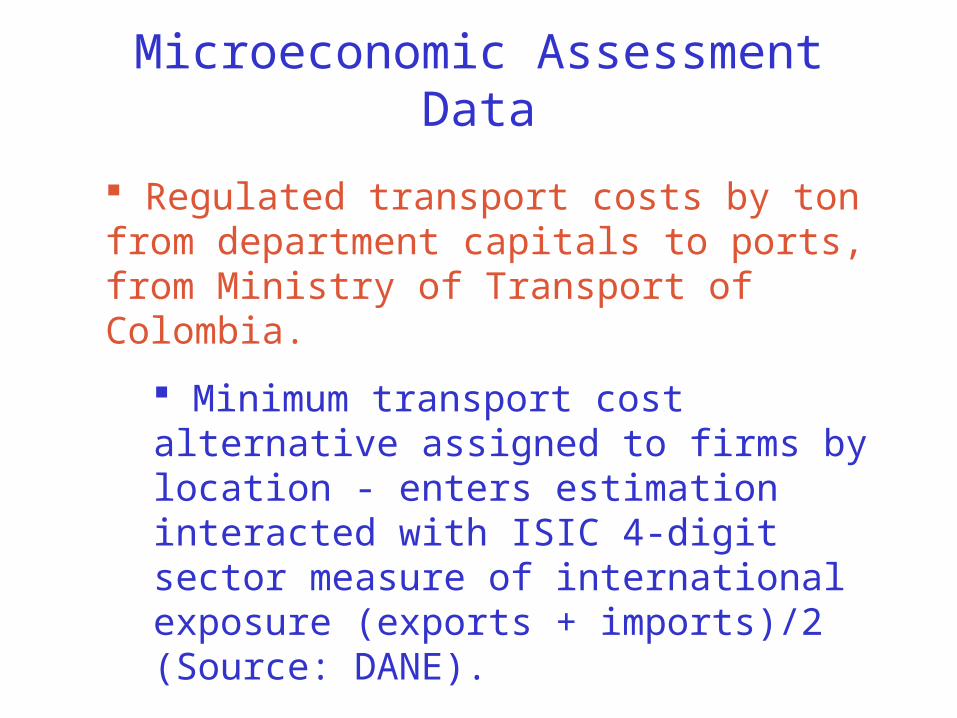
Regulated transport costs by ton from department capitals to ports, from Ministry of Transport of Colombia.
Minimum transport cost alternative assigned to firms by location - enters estimation interacted with ISIC 4-digit sector measure of international exposure (exports + imports)/2 (Source: DANE).
Enters estimation instrumented to avoid endogeneity bias.
Microeconomic AssessmentData
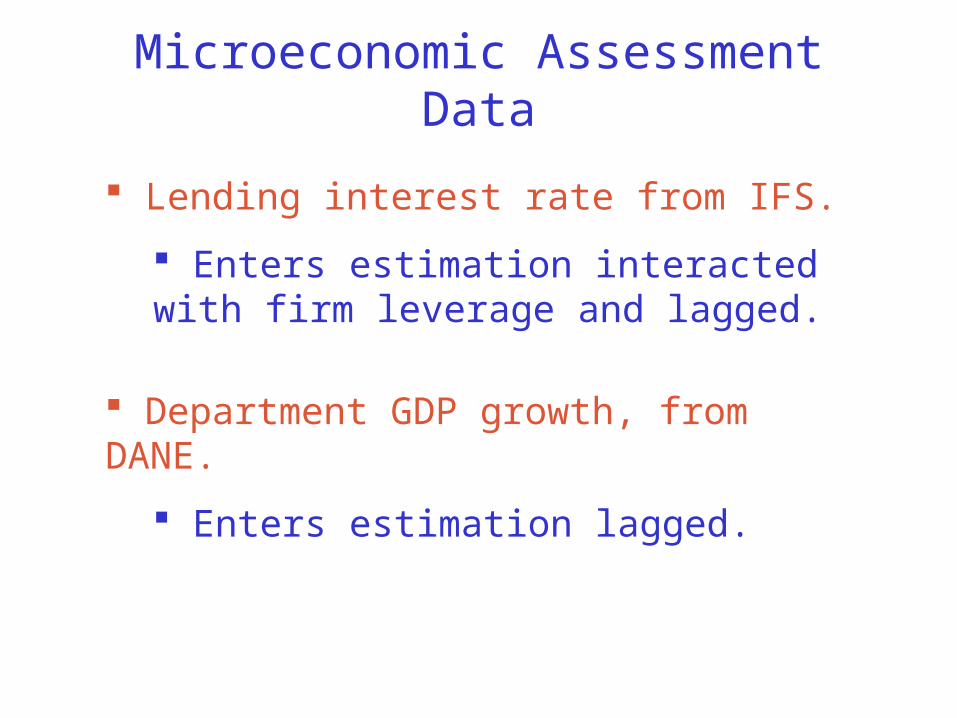
Lending interest rate from IFS.
Enters estimation interacted with firm leverage and lagged.
Department GDP growth, from DANE.
Enters estimation lagged.
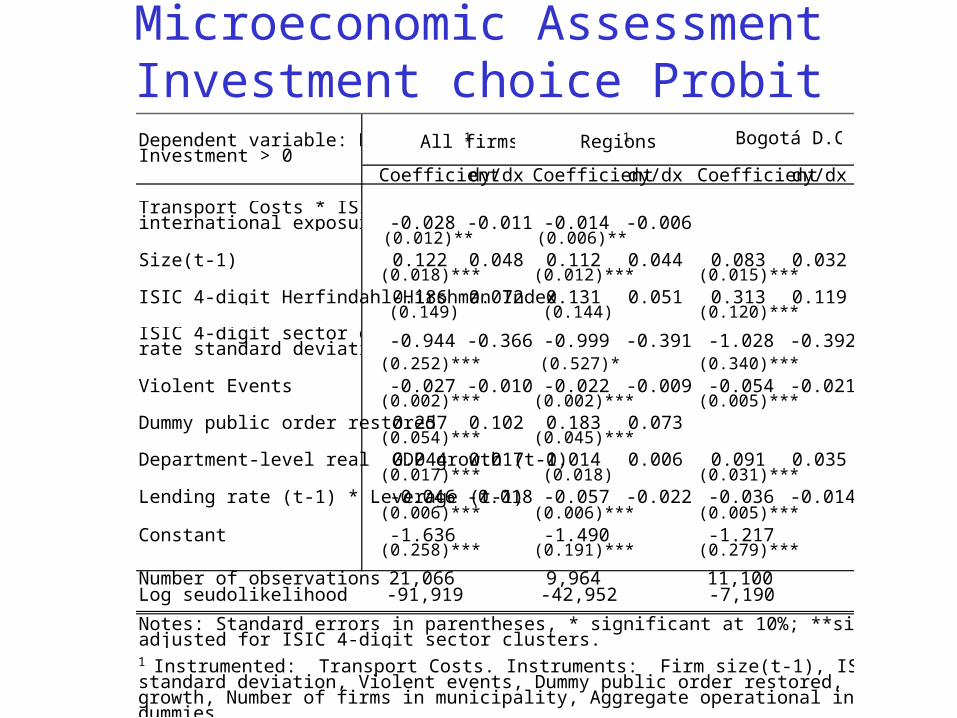
Microeconomic AssessmentInvestment choice Probit
Coefficientdy/dx Coefficientdy/dx Coefficientdy/dx
Transport Costs * ISIC 4-digit sector international exposure -0.028 -0.011 -0.014 -0.006
(0.012)** (0.006)**Size(t-1) 0.122 0.048 0.112 0.044 0.083 0.032
(0.018)*** (0.012)*** (0.015)***ISIC 4-digit Herfindahl-Hirshman Index0.186 0.072 0.131 0.051 0.313 0.119
(0.149) (0.144) (0.120)***ISIC 4-digit sector effective income tax rate standard deviation -0.944 -0.366 -0.999 -0.391 -1.028 -0.392
(0.252)*** (0.527)* (0.340)***Violent Events -0.027 -0.010 -0.022 -0.009 -0.054 -0.021
(0.002)*** (0.002)*** (0.005)***Dummy public order restored0.257 0.102 0.183 0.073
(0.054)*** (0.045)***Department-level real GDP growth (t-1)0.044 0.017 0.014 0.006 0.091 0.035
(0.017)*** (0.018) (0.031)***Lending rate (t-1) * Leverage (t-1)-0.046 -0.018 -0.057 -0.022 -0.036 -0.014
(0.006)*** (0.006)*** (0.005)***Constant -1.636 -1.490 -1.217
(0.258)*** (0.191)*** (0.279)***
Number of observations 21,066 9,964 11,100Log seudolikelihood -91,919 -42,952 -7,190
Bogotá D.C.Regions1All firms1
Notes: Standard errors in parentheses, * significant at 10%; **significant at 5%; ***significant at 1%. Robust standard errors adjusted for ISIC 4-digit sector clusters.
Dependent variable: Dummy =1 if Investment > 0
1 Instrumented: Transport Costs. Instruments: Firm size(t-1), ISIC 4-digit sector HHI, ISIC 4-digit sector effective tax rate standard deviation, Violent events, Dummy public order restored, Lending rate(t-1)*Leverage((t-1), Real Department GDP growth, Number of firms in municipality, Aggregate operational income of firms in municipality, Height of municipality, Department dummies.

Microeconomic AssessmentInvestment choice Probit
Coefficientdy/dx Coefficientdy/dx Coefficientdy/dx
Transport Costs * ISIC 4-digit sector international exposure -0.019 -0.006 -0.012 -0.004
(0.009)** (0.006)**Size(t-1) 0.117 0.037 0.117 0.037 0.085 0.026
(0.015)*** (0.014)*** (0.012)***ISIC 4-digit Herfindahl-Hirshman Index0.076 0.024 -0.015 -0.005 0.196 0.061
(0.108) (0.117) (0.107)**ISIC 4-digit sector effective income tax rate standard deviation -0.568 -0.179 -0.530 -0.168 -0.649 -0.200
(0.349)* (0.641) (0.479)Violent Events -0.017 -0.005 -0.013 -0.004 -0.035 -0.011
(0.002)*** (0.002)*** (0.005)***Dummy public order restored0.172 0.057 0.139 0.046
(0.048)*** (0.048)***Department-level real GDP growth (t-1)0.004 0.001 -0.028 -0.009 0.043 0.013
(0.019) (0.022) (0.033)Lending rate (t-1) * Leverage (t-1)-0.026 -0.008 -0.033 -0.010 -0.017 -0.005
(0.005)*** (0.006)*** (0.004)***Constant -2.217 -2.239 -1.858
(0.244)*** (0.234)*** (0.228)***
Number of observations 21,066 9,964 11,100Log seudolikelihood -89,716 -41,919 -6,031
Regions1
1 Instrumented: Transport Costs. Instruments: Firm size(t-1), ISIC 4-digit sector HHI, ISIC 4-digit sector effective tax rate standard deviation, Violent events, Dummy public order restored, Lending rate(t-1)*Leverage((t-1), Real Department GDP growth, Number of firms in municipality, Aggregate operational income of firms in municipality, Height of municipality, Department dummies.
Bogotá D.C.
Notes: Standard errors in parentheses, * significant at 10%; **significant at 5%; ***significant at 1%. Robust standard errors adjusted for ISIC 4-digit sector clusters.
Dependent variable: Dummy =1 if Investment Rate > 10%
All firms1
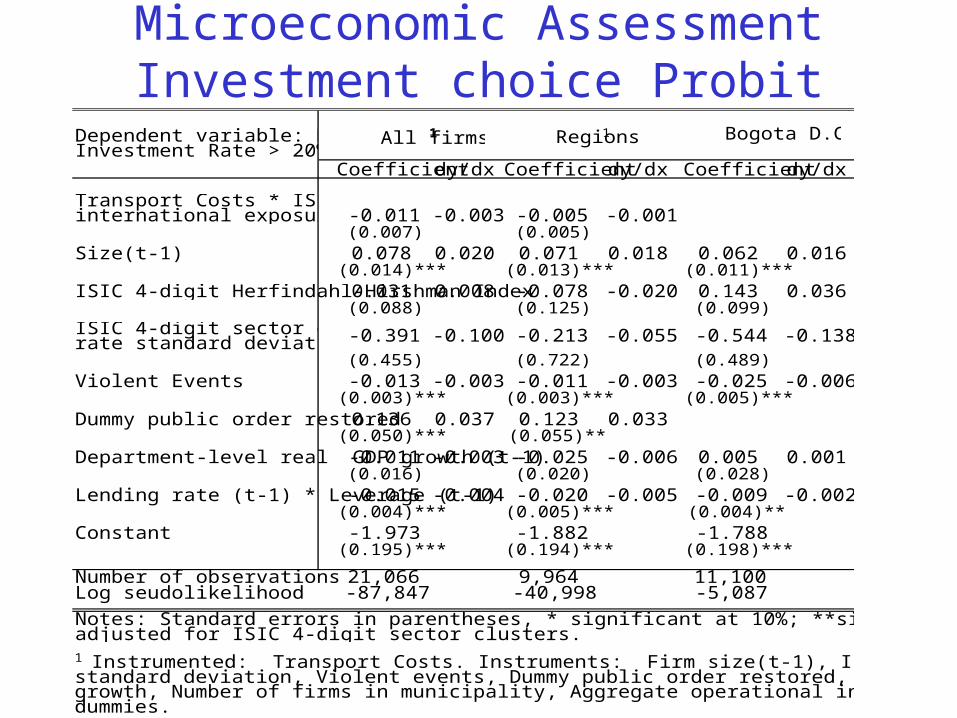
Microeconomic AssessmentInvestment choice Probit
Coefficientdy/dx Coefficientdy/dx Coefficientdy/dx
Transport Costs * ISIC 4-digit sector international exposure -0.011 -0.003 -0.005 -0.001
(0.007) (0.005)Size(t-1) 0.078 0.020 0.071 0.018 0.062 0.016
(0.014)*** (0.013)*** (0.011)***ISIC 4-digit Herfindahl-Hirshman Index0.031 0.008 -0.078 -0.020 0.143 0.036
(0.088) (0.125) (0.099)ISIC 4-digit sector effective income tax rate standard deviation -0.391 -0.100 -0.213 -0.055 -0.544 -0.138
(0.455) (0.722) (0.489)Violent Events -0.013 -0.003 -0.011 -0.003 -0.025 -0.006
(0.003)*** (0.003)*** (0.005)***Dummy public order restored0.136 0.037 0.123 0.033
(0.050)*** (0.055)**Department-level real GDP growth (t-1)-0.011 -0.003 -0.025 -0.006 0.005 0.001
(0.016) (0.020) (0.028)Lending rate (t-1) * Leverage (t-1)-0.015 -0.004 -0.020 -0.005 -0.009 -0.002
(0.004)*** (0.005)*** (0.004)**Constant -1.973 -1.882 -1.788
(0.195)*** (0.194)*** (0.198)***
Number of observations 21,066 9,964 11,100Log seudolikelihood -87,847 -40,998 -5,087
1 Instrumented: Transport Costs. Instruments: Firm size(t-1), ISIC 4-digit sector HHI, ISIC 4-digit sector effective tax rate standard deviation, Violent events, Dummy public order restored, Lending rate(t-1)*Leverage((t-1), Real Department GDP growth, Number of firms in municipality, Aggregate operational income of firms in municipality, Height of municipality, Department dummies.
Bogota D.C.Regions1Dependent variable: Dummy =1 if Investment Rate > 20%
All firms1
Notes: Standard errors in parentheses, * significant at 10%; **significant at 5%; ***significant at 1%. Robust standard errors adjusted for ISIC 4-digit sector clusters.
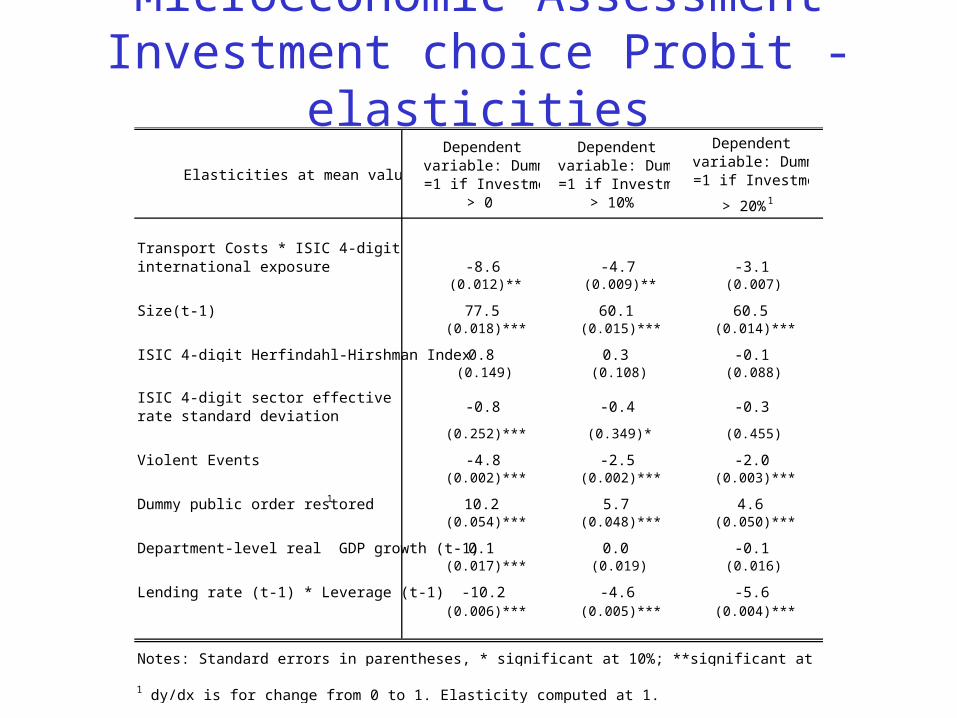
Microeconomic AssessmentInvestment choice Probit -
elasticities
Transport Costs * ISIC 4-digit sector international exposure -8.6 -4.7 -3.1
(0.012)** (0.009)** (0.007)
Size(t-1) 77.5 60.1 60.5(0.018)*** (0.015)*** (0.014)***
ISIC 4-digit Herfindahl-Hirshman Index 0.8 0.3 -0.1(0.149) (0.108) (0.088)
ISIC 4-digit sector effective income tax rate standard deviation
-0.8 -0.4 -0.3
(0.252)*** (0.349)* (0.455)
Violent Events -4.8 -2.5 -2.0(0.002)*** (0.002)*** (0.003)***
Dummy public order restored1 10.2 5.7 4.6(0.054)*** (0.048)*** (0.050)***
Department-level real GDP growth (t-1) 0.1 0.0 -0.1(0.017)*** (0.019) (0.016)
Lending rate (t-1) * Leverage (t-1) -10.2 -4.6 -5.6(0.006)*** (0.005)*** (0.004)***
Dependent variable: Dummy =1 if Investment
> 20%1
Notes: Standard errors in parentheses, * significant at 10%; **significant at 5%; ***significant at 1%.
1 dy/dx is for change from 0 to 1. Elasticity computed at 1.
Elasticities at mean values
Dependent variable: Dummy =1 if Investment
> 10%
Dependent variable: Dummy =1 if Investment
> 0
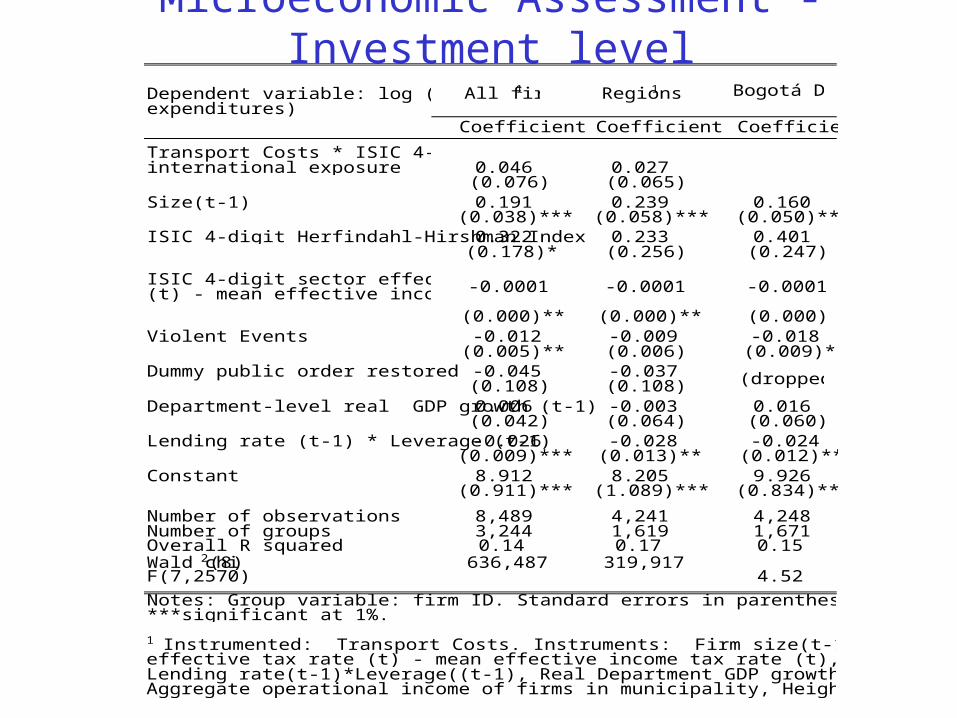
Microeconomic Assessment - Investment level
Coefficient Coefficient Coefficient
Transport Costs * ISIC 4-digit sector international exposure 0.046 0.027
(0.076) (0.065)Size(t-1) 0.191 0.239 0.160
(0.038)*** (0.058)*** (0.050)***ISIC 4-digit Herfindahl-Hirshman Index0.322 0.233 0.401
(0.178)* (0.256) (0.247)
ISIC 4-digit sector effective income tax rate (t) - mean effective income tax rate (t)-0.0001 -0.0001 -0.0001
(0.000)** (0.000)** (0.000)Violent Events -0.012 -0.009 -0.018
(0.005)** (0.006) (0.009)*Dummy public order restored -0.045 -0.037
(0.108) (0.108)Department-level real GDP growth (t-1)0.006 -0.003 0.016
(0.042) (0.064) (0.060)Lending rate (t-1) * Leverage (t-1)-0.026 -0.028 -0.024
(0.009)*** (0.013)** (0.012)**Constant 8.912 8.205 9.926
(0.911)*** (1.089)*** (0.834)***
Number of observations 8,489 4,241 4,248Number of groups 3,244 1,619 1,671Overall R squared 0.14 0.17 0.15Wald chi2 (8) 636,487 319,917F(7,2570) 4.52
Regions1All firms1Dependent variable: log (change in capital expenditures)
(dropped)
Bogotá D.C.
1 Instrumented: Transport Costs. Instruments: Firm size(t-1), ISIC 4-digit sector HHI, ISIC 4-digit sector effective tax rate (t) - mean effective income tax rate (t), Violent events, Dummy public order restored, Lending rate(t-1)*Leverage((t-1), Real Department GDP growth , Number of firms in municipality, Aggregate operational income of firms in municipality, Height of municipality, Department dummies.
Notes: Group variable: firm ID. Standard errors in parentheses, * significant at 10%; **significant at 5%; ***significant at 1%.
Concluding remarks
Among sources of poor appropriability, only variables associated to poor protection of property rights from government failure to control conflict survive across model specifications. This is one of the most binding constraints for investment and any effort directed towards reestablishing public order will see a reward in economic reactivation.
There is little new insight in recognizing critical role of conflict in connection to economic activity, but research advances in identifying channel through which effect materializes and order of magnitude of costs it represents through negative impact on private investment.
Concluding remarks Timing of investment decisions is explained more by restoration of some form of public order connected to the cessation of paramilitary violence than by reduction of violence per se.
From public policy perspective, most relevant result is confirmation that in Colombia investment decisions are negatively affected by costs of financing. Empirical results single out the provision of access to financing at fair prices as a policy priority for economic growth, relevant across country regions and independent of whether uncertainties about appropriability issues are resolved.

Thank you!