Competitive Impacts of IT Innovation: An Empirical … Competitive Impacts of IT Innovation: An...
31
1 Competitive Impacts of IT Innovation: An Empirical Analysis of Software Patents in the IT Industry Sunghun Chung Kunsoo Han Animesh Animesh Alain Pinsonneault Desautels Faculty of Management McGill University (sunghun.chung, kunsoo.han, animesh.animesh, alain.pinsonneault)@mcgill.ca ABSTRACT While prior research has examined the role of Information Technology (IT) investments in the process and performance of innovation, there is relatively little research on the business value of IT innovation itself. In particular, the impact of a firm’s IT innovation on the performance of the firm’s rivals remains unexplored. In order to advance our understanding of the competitive impact of IT innovation, we investigate the impact of a firm’s software patents on rivals’ market value using data from the US IT industries. Theoretically, there are two countervailing forces influencing the competitive impact of software patents: market-stealing and spillover. Therefore, the net impact of a firm’s software patents on rivals depends on the relative magnitude of these two forces, and is essentially an empirical question. We find that a focal firm’s software patent stock is negatively associated with its rivals’ market value. In addition, we find interesting moderating effects of two factors: hardware patent stock and competitive intensity. Our results indicate that the focal firm’s hardware patent stock amplifies the negative impact of its software patent stock on rivals’ market value. Furthermore, we find that the competitive intensity of the industry mitigates the competitive impact of software patent stock. We discuss the implications for research and practice. Keywords: IT innovation, software patent, rivals, market competition, firm value, market- stealing, spillover
Transcript of Competitive Impacts of IT Innovation: An Empirical … Competitive Impacts of IT Innovation: An...

1
Competitive Impacts of IT Innovation:
An Empirical Analysis of Software Patents in the IT Industry
Sunghun Chung Kunsoo Han Animesh Animesh Alain Pinsonneault
Desautels Faculty of Management McGill University
(sunghun.chung, kunsoo.han, animesh.animesh, alain.pinsonneault)@mcgill.ca
ABSTRACT While prior research has examined the role of Information Technology (IT) investments in the process and performance of innovation, there is relatively little research on the business value of IT innovation itself. In particular, the impact of a firm’s IT innovation on the performance of the firm’s rivals remains unexplored. In order to advance our understanding of the competitive impact of IT innovation, we investigate the impact of a firm’s software patents on rivals’ market value using data from the US IT industries. Theoretically, there are two countervailing forces influencing the competitive impact of software patents: market-stealing and spillover. Therefore, the net impact of a firm’s software patents on rivals depends on the relative magnitude of these two forces, and is essentially an empirical question. We find that a focal firm’s software patent stock is negatively associated with its rivals’ market value. In addition, we find interesting moderating effects of two factors: hardware patent stock and competitive intensity. Our results indicate that the focal firm’s hardware patent stock amplifies the negative impact of its software patent stock on rivals’ market value. Furthermore, we find that the competitive intensity of the industry mitigates the competitive impact of software patent stock. We discuss the implications for research and practice.
Keywords: IT innovation, software patent, rivals, market competition, firm value, market-stealing, spillover

2
1. INTRODUCTION
Innovation is an essential strategic endeavor that plays a critical role in both the survival and
prosperity of firms in every industry (Utterback 1994). A firm’s innovations are often manifested
in new ways of doing things or new products and processes that contribute to the
competitiveness and performance of the firm. In today’s digital age, firms rely heavily on
investments in information technology (IT) to innovate and manage the process of innovation
(Kleis et al. 2012). Consequently, researchers have examined the role of IT investments and
capabilities in generating patented innovation (Joshi et al. 2010; Kleis et al. 2012) as well as the
impact of complementarities between IT investment and innovation processes on firm’s financial
performance (Bardhan et al. 2013).
However, there has been relatively little research on the business value of IT innovation
itself (e.g., Brynjolfsson and Saunders 2009). Further, the limited extant research investigating
the impact of IT innovation has focused primarily on the value of IT innovations to the focal firm
that innovates, and found that IT innovations increase the financial market value of the
innovating firm (Chung et al. 2014; Hall and MacGarvie 2010). Although the results demonstrate
the value of IT innovations, it is not clear whether this value is created at the expense of the
competitors of the focal firm or such IT innovations are beneficial to the whole industry in which
the focal firm operates (i.e., the focal firm’s innovation benefit not only itself but also its
competitors in that industry). Therefore, in this study we examine the impact of IT innovations
by a focal firm on the firm’s competitors.
In order to protect their IT innovations and prevent other firms from using them, firms
frequently rely on patents, which are one of the strongest forms of firms’ intellectual property
(Teece 1998). Patents grant legal authority to the inventor to prohibit others from making or
selling the patented invention for a fixed period of time. Although IT innovations can result in
hardware as well as software patents, our study focuses on software patents. Unlike hardware
patent focusing on hardware technologies, software patents involve a logic or algorithm for
processing data and have been defined as patents on any performance of a computer realized by
means of a computer program (FFII 2007; Hall 2003). Software patents have highly abstract
property due to its complexity (Bessen and Hunt 2007).

3
In the past, only hardware innovations were patentable while software innovations were not,
because of their abstract nature and also because the lengthy process of patenting made the
software patents, which have a short commercial life, irrelevant (Bender and Barkume 1992).
However, since the landmark court decision in 1998 that made software patentable, the number
of software patents has been increasing. 1 At the same time, patent infringement lawsuits
involving software have increased considerably. According to a report by US Government
Accountability Office (GAO), from 2007 to 2011, the number of overall defendants in patent
infringement lawsuits increased by about 129 percent, and lawsuits involving software-related
patents accounted for about 89 percent of the increase in defendants (GAO 2013).
Further, although prior research has examined the value of patents mostly at the economy
level (i.e., across various heterogeneous industries), prior research suggests that industries differ
in terms of the average number of patents generated by each dollar of R&D investment (Scherer
1983), their ability to appropriate returns from their R&D investments, and the value of the
patents themselves (Hall et al. 2005; Levin et al. 1987). Therefore, there has been a call for
patent research within specific industries (Cockburn and MacGarvie 2011; Mykytyn et al. 2002).
Given that software innovation is the core product innovation in the IT industry - an industry that
is characterized by fierce competition and fast technological changes, we focus on examining the
value impacts of software patents in the IT industry. The aforementioned increase in software-
related lawsuits including the highly publicized lawsuits between Samsung and Apple attest to
the strategic importance of software patents in the IT industry.
Despite the growing importance of software patents and the call for research on their
impacts on firm value and competitive advantage (Kazuyuki 2009; Mykytyn et al. 2002), there
has been relatively little empirical research on the business value and competitive effect of
software patents. While a few studies have examined the impact of software patents on firm
performance (Hall et al. 2005; Hall and MacGarvie 2010), there is a paucity of research on the
competitive impact of software patents. As a result, our understanding of whether and how
software patents impact competition is still limited. In this study, we attempt to fill this research
1 The number of software-related patents grew steadily from the mid-1990s to 2005, at an average rate of 4.7 percent a year from 2000. In 2005, more than 50,500 international patent applications were filed under the PCT (Patent Co-operation Treaty) to protect inventions in IT. In fact, the number of software-related patents increased more rapidly than the total number of PCT applications. In 2005, more than 15,000 software patents were granted and its proportion exceeded 12%.

4
gap by empirically investigating the relationship between the software patents of a firm on its
competitors’ financial market value.
Empirically examining the relationship between a firm’s software patents and its
competitors’ market value is important especially because the impact of a focal firm’s patented
software innovations on its competitors is theoretically ambiguous (Fosfuri and Giarratana 2009;
McGahan and Silverman 2006; Teece 1986). On one hand, a focal firm’s software patents can
have market-stealing effects: software patenting by a firm may generate property rights that give
the firm a competitively advantageous position, thereby adversely affecting the competitor firms’
market value. On the other hand, a focal firm’s software patents can also have spillover effects
on the rival firm: a software innovation patented by a firm may trigger greater technological
opportunity for the rival firms, or the disclosure of software patents by a firm may provide
crucial information on which rival firms can build their own products/services, thereby
enhancing the rival firms’ market value. Therefore, the net impact of a focal firm’s software
patents on a rival firms’ market value depends on the relative magnitude of these two
countervailing forces, and hence is an empirical question.
To address this empirical question, we employ a large panel dataset covering 420 firms
(including their rivals) in US IT industries over the 1998-2006 period and investigate whether a
focal firm’s software patents have a positive or negative impact on rival firms’ market value. We
also examine whether the focal firm’s hardware patents moderate the impact of its software
patents on the rival firms’ market value. Furthermore, we examine the moderating role of
competitive intensity, one of the key environmental variables used by prior studies.
The paper makes several contributions to both theory and practice. First, we contribute to the
literature on the value of patents in general (e.g., Ernst 2001; Hall et al. 2005; Hall and
MacGarvie 2010), and the nascent literature on the value of IT patents in particular (e.g., Chung
et al. 2014) by separating the two types of IT patents—software and hardware patents—and
theorizing and empirically assessing the competitive impact of software patents. Our finding that
a firm’s software patents have a negative impact on its rivals’ market value, while the impact of
the firm’s hardware patents is insignificant, highlights that different types of patents have distinct
characteristics and need to be examined separately to gain a richer understanding of their impacts.
Second, more importantly, we contribute to the literature by examining the competitive
effects of software patents. Most prior patent studies have focused on examining the impact of

5
firms’ patents on their own performance, and the impacts on rivals’ performance remain
relatively unexplored. Although prior studies suggest that a firm’s innovation can benefit rival
firms through knowledge spillover (McGahan and Silverman 2006), our results suggest that
market-stealing effects dominate in the case of software patents in the IT industries. This is
consistent with our conceptualization of software patents as a key resource in the IT industry that
can offer competitive advantage, and extends the handful of studies that have examined the value
of software patents (Bessen 2011; Graham and Vishnubhakat 2013; Hall and MacGarvie 2010).
Third, our analysis of the moderating role of hardware patent stock and competitive intensity
provides new insights into the conditions under which the effects of software patents on rivals
(i.e., either market-stealing or spillover) can be magnified or mitigated. Prior patent studies have
mostly focused on the main effect of patents, and, for the most part, have not identified factors
that can influence the extent to which patents create value (Bessen 2011; Hall and MacGarvie
2010; Liu and Wong 2011). Our finding that a firm’s hardware patent stock strengthens the
negative impact of the firm’s software patent stock on rivals’ market value provides empirical
evidence on the importance of complementary assets (hardware patents in our case) in
developing competitive advantage from innovations (Teece 1986). This also underscores the
importance of having a systems approach to IT innovations—firms are more likely to gain
competitive advantage from IT-based innovations including both hardware and software
components, compared to those focusing solely on either software or hardware innovations.
Further, by examining the moderating effect of competitive intensity in the context of
software patents, we extend the strategy literature that has examined the impact of external
environments on the competitive dynamics (Keats and Hitt 1988; Megna and Klock 1993;
Sirmon et al. 2007; Zahra and Bogner 2000). Our finding that the negative impact of a firm’s
software patent stock on rivals’ market value is mitigated under a higher level of competitive
intensity has an important policy implication.
The next section reviews prior literature and derives our research questions. Section 3
describes our research data; Section 4 presents our empirical methods, results, and robustness
checks. Section 5 concludes the paper.
2. THORETICAL BACKGROUND AND RESEARCH QUESTIONS

6
Drawing on the resource-based view (RBV) (Barney 1991; Wernerfelt 1984), we conceptualize
software patents as a key resource in firms in IT industries. RBV stresses the role of
heterogeneous firm resources in gaining competitive advantage, and we argue that software
patents are such a resource because they are valuable, rare, imperfectly imitable, and difficult to
substitute for (Barney 1991).2 While IS scholars have applied RBV to identify key IT resources
that can lead to superior performance (see for a review Wade and Hulland 2004), they have
focused on IT human resources (especially managerial skills possessed by IT workers). In this
study, we conceptualize software patents as another key resource in the IT industry for gaining
competitive advantage, and examine their competitive effects.
Prior studies on innovation have discussed two distinct effects of a firm’s innovations on its
rivals: market-stealing and spillover (Levin et al. 1985; McGahan and Silverman 2006; Teece
1986). The market-stealing effect occurs when a firm’s innovations enable the firm to improve
its products and services, increase efficiency, or gain stronger competitive advantage against its
rivals. On the other hand, the spillover effect occurs when the knowledge generated by a firm’s
R&D becomes available to other firms, consequently benefiting its rivals as well as the focal
firm. These two effects may co-exist in the case of software patents. Specifically, software
patents help a firm legally protect its knowledge so that rivals cannot copy its improved products
and services, thus generating a competitive advantage beyond that from its initial R&D. At the
same time, however, the disclosure involved in the patenting process may diffuse knowledge
about the patented innovation that may spill over to other firms, its rivals in particular, thereby
benefitting the rivals. Table 1 summarizes the arguments for each of these two effects in the
context of software patents and related empirical work.
- Insert Tables 1about here –
These two effects have countervailing influences on a firm’s market value (McGahan and
Silverman 2006; Teece 1986) and which effect will dominate is an empirical question. If the
market-stealing effect is dominant, rivals’ software patents will have an adverse effect on the
focal firm’s market value; if the spillover effect dominates, however, rivals’ software patents will
2 In IT industry one finds companies providing three different types of products and services: hardware (e.g., computers, and telecommunications equipment), software and related services (e.g., systems integration, and tailored product development, etc.). Within the computer software segment, two major types of companies are to be found: computer hardware/software producers, such as IBM, Apple, Sun Microsystems and Compaq, and independent software producers such as Microsoft and Oracle.

7
have a net positive impact on the focal firm. Therefore, we examine the following research
question:
RQ1: Do a firm’s software patents influence its rivals’ market value positively or negatively?
More importantly, under what conditions a firm’s software patents influence rivals’
performance more (or less) has not been studied. To address this gap in the literature, we
examine the moderating role of two factors: a focal firm’s hardware patents and industry
competitive intensity. First, we examine the role of hardware patents developed by the focal firm
that may enhance the value of the firm’s software patents as complementary resources. To
understand the interaction between hardware and software patents, we need to understand the
concept of software stack. A software stack (Gao and Iyer 2006) divides the software activity
into layers that are complementary to each other. At a highest level one can define a two-layer
stack comprised of hardware and software. Integration between these layers has implications for
competition in the industry—a firm that can integrate various layers of the stack can increase
switching costs for users, which in turn enhances the market performance of the firm (Gao and
Iyer 2006). While a firm only having superior software resources in the form of patents would
have to rely on other firms in the industry that own hardware patents and coordinate with such
firms to succeed, a firm with strong software as well as hardware patent stock is able to create
complementarities between their superior hardware and software innovations. This, in turn, can
strengthen the firm’s competitive advantage (Gao and Iyer 2006; Teece 1986). Moreover, such a
firm can consolidate its position in the industry as a technological leader, thereby extracting
greater rents from its resources and outperforming its competitors (Gao and Iyer 2006; Piccoli
and Ives 2005). Thus, greater hardware patent stock possessed by a firm will strengthen the
market-stealing effect of its software patent portfolio.
On the other hand, greater hardware patent stock owned by a firm can weaken the spill-over
effects of the firm’s software patent portfolio. The spillover effect requires rival firms to be able
to learn and build upon the knowledge disclosed by the focal firm’s software patents. However,
the hardware and software patents in the focal firm’s portfolio may create complex knowledge
interdependencies which make it difficult for its rivals to leverage the knowledge embedded in
software patents (Jain and Jain 2011). Thus, the extent of knowledge spillover from a focal

8
firm’s software patents and its impact on rivals would be smaller in the presence of high stocks
of hardware patent owned by the focal firm.
To summarize, in the presence of greater hardware patent stock owned by a focal firm, the
market-stealing effect of its software patents will be stronger and the spillover effect of its
software patents will be weaker. Taken together, this implies that the focal firm’s hardware
patents will negatively moderate the relationship between the firm’s software patents and the
market value of its rivals. In other words, when the spillover (market-stealing) effect of the
firm’s software patents dominates, the firm’s hardware patent stock will weaken (strengthen) the
positive (negative) impact of its software patents on rivals’ market value. In order to empirically
verify this conjecture, we examine the following question:
RQ2: Do a firm’s hardware patents moderate the relationship between the firm’s software
patents and its rivals’ market value positively or negatively?
Next, building on prior research suggesting that the outcomes of market-stealing and
spillover may vary depending on industry characteristics (Austin 1993; Megna and Klock 1993),
we argue that competitive intensity can have a significant influence on the effects of rivals’
software patents. Competitive intensity refers to the extent to which a firm’s external
environment is characterized by intense competition (Matusik and Hill 1998). In a more
competitive environment, there are more competitors, and it is difficult for a firm to predict its
competitors’ actions. In such environment, firms need to be very agile in responding to
competitors’ moves to stay ahead of the competition.
A large body of research highlights that a firm’s own patents offer a more significant boost
to its market value in industries that are characterized by strong protection of intellectual
property rights (Cockburn and Griliches 1988; McGahan and Silverman 2006; Teece 1986).
However, in a highly competitive industry where many firms try to differentiate themselves from
and stay ahead of their competition, the market-stealing effect of rivals’ software patenting may
be severely dampened.
On the other hand, a high level of competitive intensity leads to the erosion of software
patent protection because it allows rival firms to exploit the knowledge embedded in the
innovations more easily. In other words, under highly competitive environments, outcomes of

9
patented innovations tend to become rapidly diffused over the population of competitors without
consent of the patent owner (Jansen et al. 2006; Levinthal and March 1993). Thus, in a more
competitive environment, we expect the spillover effect of a firm’s software patents on rivals’
performance to be stronger. Taken together, this implies that competitive intensity will positively
moderate the relationship between a firm’s software patents and the market value of its rivals. In
other words, when the spillover (market-stealing) effect of a focal firm’s software patents
dominates, competitive intensity will strengthen (weaken) the positive (negative) impact of the
firm’s software patents on rival firms’ market value. In order to empirically validate our
conjecture, we examine the following question:
RQ3: Does competitive intensity moderate the relationship between a firm’s software
patents and its rivals’ market value positively or negatively?
3. RESEARCH DATA
IT industries provide an ideal setting for our study because profitability in IT industries depends
critically on firms’ abilities to create and commercialize new technologies and defend rivals’
infringement of intellectual property (Hall and MacGarvie 2010). Our empirical analysis
employs data on software patents in the IT industries (twenty two four-digit industries3 within
SICs 357, 366, 367, 381, 382, 384, and 737) during the 1998-2006 period. We obtained the
patent data from the National Bureau of Economic Research (NBER) constructed by Hall et al.
(2001).4 This dataset covers detailed information on all patents granted by the US Patent and
Trademark Office (USPTO) between 1976 and 2006. It includes, among other items, annual
information on patent assignee names (mainly, the firm), the number of patents, the number of
citations received by each patent, the technological class of the patent, and the year that the
patent application was filed and granted. We recorded patents by their filing year, rather than
their granted year, as there may be arbitrarily long lags between application year and granted
year (see Benner and Tushman 2002).
Because the USPTO published new guidelines for software patentability on March 29, 1996
and our analysis requires patent citation information, we choose our sample period to be 1998-
3 We focus on the IT industry that consists of 22 sub-industries, based on SICs from the US Bureau of Economic Analysis’ (BEA) guidelines. 4 The NBER data have been updated through 2006 and are available online: https://sites.google.com/site/patentdataproject/Home.

10
2006. Furthermore, we obtained firm-level measures from the Compustat database, which
provides data of all public firms in the US. Following the method suggested in Hall et al. (2001),
we matched the NBER data with the financial data from Compustat (see also Hall et al. 2005;
Hall and MacGarvie 2010; Liu and Wong 2011).
We used patent technology classes to categorize software and hardware patents. Specifically,
we identified those technology classes related to software and/or hardware patents and
categorized all of the patents within these technology classes as either software or hardware
patents. First, regarding software patents, we identified all of the US patent classes in which top
20 software firms5 patented, and categorized patents falling within these classes as software
patents, following Hall and MacGarvie (2010). We ruled out those patent classes for which the
share of the top 20 software firms was under 20%. Further, we also included any additional
technology classes that had been classified as software patents in prior research (Bessen 2011;
Graham and Mowery 2003; Hall 2003). Next, we identified hardware patents by adopting the
classification method employed in prior studies (Choi et al. 2007; Schaaper 2003). Finally, we
re-examined patent classes for which the consistency among patent classes suggested from prior
studies, as well as our own classification, is low. Three coders, who are experts in information
technology, validated and re-classified these patent classes after independently reading the
definitions of these classes in detail. The inter-rater reliability for the coding of software and
hardware patent was 0.94, suggesting a high level of agreement. The resulting categorization of
software patents consists of 22 technology classes and that of hardware patents contains 25
technology classes (see Table 2).
- Insert Tables 2 about here –
In line with prior research (Hall et al. 2005; Hall and MacGarvie 2010; Liu and Wong 2011),
we computed the patent stock measure in year t for firm i using a single depreciation rate (ρ) for
the patent value, which is assumed to be 20%, consistent with prior research. We also calculated
the R&D stock in year t for firm i using the same depreciation rate.6 To control for the size of
5 The top 20 firms were selected by the sales of their calendar 2006 revenues from the NAICS 511210 group (i.e., software publishers). These firms are Microsoft, Oracle, SAP, SunGard Data Systems, Symantec, CA, Electronic Arts, Adobe, Amdocs, Intuit, Konami, Dassault Systems, Autodesk, BMC Software, Cadence Design Systems, Activision, Business Objects, Compuware, BEA Systems, and Comverse Tech. 6 Our empirical results are not sensitive to the chosen value of the depreciation rate (e.g., 0.2, 0.15, etc.).

11
R&D investments, we scaled the patent stock by the R&D stock following prior studies
(Griliches 1981; Hall et al. 2005; Hall and MacGarvie 2010; Liu and Wong 2011). Another
reason we use the ratio of patent stock to R&D stock is that once R&D is observed, the market
presumably knows how to price the expected value of the innovative stream that will result from
it, including the expected number of patents that will come further down the line (Griliches
1981). Thus, the additional informational value of patents once R&D has already been factored
in must be captured by the number of patents per dollar of R&D. In sum, the ratio of software
patent stock to R&D stock indicates the software patent yield of R&D. If the yield of R&D in
terms of software patents is higher than average, it may indicate that the R&D project succeeded
beyond expectations, conversely so if the patent yield is low.7
Prior studies on identification of rivals (e.g., Eckbo 1983; Oxley et al. 2009) suggested both
incumbent rivals that were recognized as leaders in the corresponding industry in year t and peer
rivals comprised firms whose total asset size was close to that of a focal firm. In this study, we
used peer rivals to capture direct, short-term competition in a certain year. We identified peer
rivals of an IT firm using procedures similar to those used by Han et al. (2012). To minimize
possible noise in the data for the identification of the peer rivals, the sample data was refined in
several ways. First, we identified a group of peer rival firms sharing the same primary four-digit
SIC with the focal firm, constrained within +/- 20 percent of total asset compared with that of
focal firm on the basis of the year of patent applications. Second, firms whose rivals could not be
identified accurately through the use of multiple sources such as Hoover’s company profiles
were removed from the sample. This resulted in 567 rivals during nine years.8
To capture market competition, we employ two measures of industry concentration: the
four-firm concentration ratio (CR4) which is measured as the ratio of the total sales of the top
four firms in an industry to the total industry sales, and the Herfindahl-Hirschman Index (HHI).
We calculated CR4 and HHI for each four-digit SIC industry and each year to measure the
market concentration. Higher values indicate lower market competition (Han and Mithas 2013;
Mithas et al. 2013). To avoid confusion in interpreting the coefficient, we use the log of the
7 Using raw software patent stock (without scaling by R&D stock) yielded similar results. 8 For a robustness check, we also applied 10% and 30% as the criteria for selecting peer rivals, and obtained similar results.

12
reciprocal of the HHI in the estimations so that the higher the value of this index, the higher the
degree of market competition.9
As our main dependent variable, we use rivals’ Tobin’s q that captures the financial market
performance of rivals. Given that it offers the advantage of capturing both short-term
performance and long-term prospects based on the market value, it has been widely used in prior
IS literature (Bardhan et al. 2013; Bharadwaj et al. 1999; Kohli et al. 2012; Xue et al. 2012) and
prior research examining the impact of rival’s activities on a focal firm’s market value (Fosfuri
and Giarratana 2009). Moreover, Tobin’s q covers the market-based measure of a firm’s tangible
and intangible value because it is forward-looking, risk-adjusted, and less volatile to changes in
accounting practices. In order to effectively capture the competitive impact of software patents,
which may have long-term consequences not recorded in rivals’ financial statements, we use
rivals’ Tobin’s q to measure the market performance.10
We included a number of control variables that can affect rivals’ Tobin’s q.11 To control for
the growth opportunities available to rivals, we included rivals’ R&D intensity, which was
computed as the total amount of R&D expenditures in a given year, divided by total sales for
each firm, and the industry Tobin’s q (Bardhan et al. 2013; Bharadwaj et al. 1999; Xue et al.
2012). We also included the total number of employees as a control for firm size, and included
advertising intensity and net income (Hitt and Brynjolfsson 1996; Xue et al. 2012). Finally, a set
of industry dummies at the four-digit SIC level were included to control for time-invariant
industry-specific effects. Year dummies for the sample years from 1998 to 2006 were included to
control for year-specific effects. Table 3 summarizes the definitions of variables, and Table 4
provides correlations among the variables.
- Insert Tables 3and 4 about here –
Our initial matched panel dataset contains 7,538 firm-year observations covering 1,133
unique IT firms from 1998 to 2006. We removed 1,528 observations for which we could not
identify rivals, and additional 2,542 observations with missing or zero values in software or
hardware patents stock. Next, we removed 2,162 observations with missing or zero values for
9 With CR4, we obtained similar results. 10 We use the average value of rivals’ Tobin’s q. Using an aggregated value yielded similar results. 11 We also use the average value for the control variables in the model.

13
advertising expenses or R&D spending, and 55 observations with missing market values used in
computing Tobin’s q. The final sample consists of 1,251 observations from 420 firms spanning
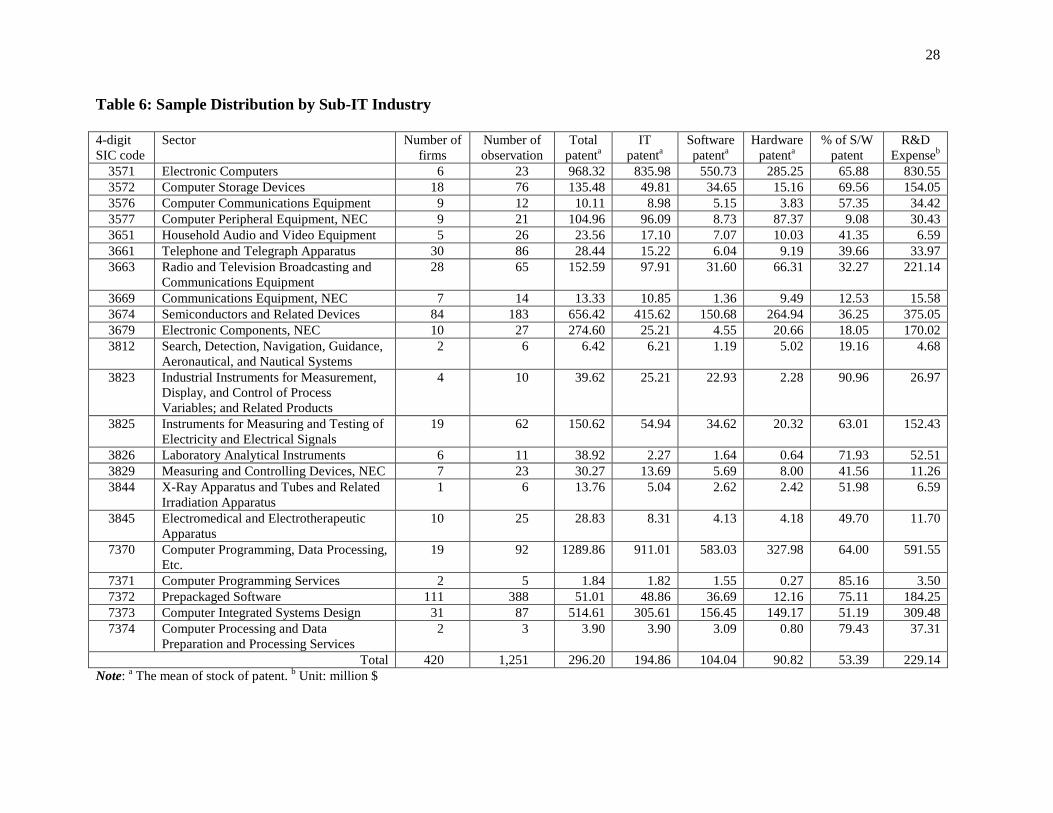
nine years as shown in Table 5. Table 6 provides our sample distribution by sub-IT industry at
the four-digit SIC level. Our sample consists of hardware manufacturing industries that
correspond to the SIC codes 35, 36, and 38, and software industries corresponding to the SIC
code 73. We compare the amount of software and hardware patent stock across industries. The
overall ratio of software patent stock to IT patent stock is 53.4% and it is not significantly
different across sub-IT industries.
- Insert Tables 5 and 6 about here -
4. MODELS AND RESULTS
4.1. Econometric Estimation
Our empirical specification is similar to what has been used in prior studies (Griliches 1981; Hall
et al. 2005; Liu and Wong 2011). In particular, as noted above, following prior studies, we use
software (and hardware) patent stock scaled by R&D stock in order to control for the size of
R&D investments and to capture the additional informational value of patents beyond what is
already captured by R&D investments.12, 13 To examine our three research questions, we use the
following empirical specification: 14
Rivals’ Tobin’s qj,t = β0 + β1 Firm’s SW Patenti,t + β2 Firm’s HW patenti,t
+ β3 (Firm’s SW Patenti,t × Firm’s HW patenti,t)
+ β4 (Firm’s SW Patenti,t × Market Competitionk,t)
+ β5 (Firm’s HW Patenti,t × Market Competitionk,t)
+ β6 Rivals’ SW Patentj,t + β7 Rivals’ HW Patentj,t
+ Ʃβm Rivals’ Controlsj,t + Ʃβs Year Dummiess + Ʃβk Industry Dummiesk + εi,t (1)
12 Prior studies have used R&D stock (input) as a determinant of patents (output). In order to account for the endogeneity of software (hardware) patents, we also estimated a system of equations using a 3SLS technique: in the first equation, software (hardware) were regressed on R&D stock and a set of control variables; and in the second equation, Tobin’s q was regressed on software (hardware) patent stock (not scaled by R&D stock) and R&D stock as well as other control variables. The 3SLS results were similar to our main results and are available upon request. 13 We also used software (hardware) patent divided by firm assets (Hall et al. 2005, Xue et al. 2012), and obtained similar results. 14 We take the natural logarithm of Rivals’ Tobin’s q, Rivals’ and firm’s Software (Hardware) Patent Stock, and Rivals Controls to control their skewedness and the different absolute magnitude.

14
Equation (1) assesses the relationship between a firm’s patents (software and hardware) and
rivals’ market value (RQ1). It also includes the interaction term between a firm’s software
patents and hardware patents to examine the possible complementarities between them (RQ2).
Further, the equation includes the interaction term between a firm’s software patents and market
competition to examine the moderating effect of competitive intensity (R3). We first estimate the
model without the interaction terms to examine the unconditional effects of a firm’s software
patent stock on rivals’ market value. Then, we re-estimate the model with the interaction terms to
examine the moderating effects of a firm’s hardware patents and market competition,
respectively. In addition to a firm’s own patents, we include rivals’ software and hardware
patents as they have been shown to impact its firm value (Chung et al. 2014). In addition, we
include a comprehensive set of rival-specific exogenous variables, as noted earlier.
We center the variables comprising the interaction terms by calculating the deviations from
their respective mean values to reduce the multicollinearity between the main and interaction
terms (Pinsonneault and Kraemer 1997; Smith and Sasaki 1979). We then perform several
diagnostic checks to ensure the stability of our estimation results and do not detect any
significant problems. The variance inflation factors (VIFs) of all independent variables did not
exceed 10, a commonly used cut-off value.
In order to account for unobserved heterogeneity across industries in our data, we first
considered fixed-effects and random-effects models. To choose between fixed- and random-
effects models, we conducted a Hausman test and could not reject the null hypothesis that the
errors are not correlated with the explanatory variables (Prob > chi2 = 0.142). Then, we ran the
Breusch-Pagan Lagrange multiplier (LM) test and could reject the null hypothesis that there is no
significant unobserved heterogeneity across firms (Prob > chi2 = 0.000). These test results
suggest that our use of a random-effects model is warranted. 15 Because the Wooldridge test for
autocorrelation indicates the presence of first-order autocorrelation (AR1) in our panel dataset (F
= 65.42, p < 0.01), we employ a random-effects model with a correction for AR(1) errors, using
the xtregar procedure in the STATA software.
- Insert Table 7 about here -
15 Random effects estimation models have also been used by Kleis et al. (2011) and Bardhan et al. (2013) to estimate the impact of R&D and IT on firm value (or firm productivity).

15
4.2. Results
Table 7 reports the results of estimating a random-effects model. We only include the control
variables in Model 1 and add our focal variables in a hierarchical manner. In all Models, rivals’
own software and hardware patents are positively associated with its firm value, confirming the
previous finding that a firm’s IT patent stock significantly contributes to firm value (Chung et al.
2014). We include a firm’s software and hardware patents in Models 2 through 4. In Model 5, we
include the interaction term between a firm’s software patents and hardware patents to examine
the complementarity between the two types of patents. In Model 6, we include the interaction
between a firm’s software patents and market competition. In Model 7, we include all the terms
specified in Equation (1).
We observe that rivals’ software patents are negatively associated with firm value (see
Models 2 – 7). Addressing RQ1, this result indicates that a firm’s software patent stock
significantly diminishes its rivals’ market value. Specifically, based on Model 1, a 1% increase
in a focal firm’s software patent stock is associated with approximately a 0.03% decrease in the
rivals’ market value. This suggests that the market-stealing effect is more dominant compared to
spillover effect in the case of software patents. Although not our focus, it is worth noting that the
impact of a firm’s hardware patents on rivals’ value is not significant. Regarding RQ2, we find
that the interaction between a focal firm’s software and hardware patents is negative (in Model 5,
β = -0.025, p < .05; in Model 7, β = -0.021, p < 0.05); this suggests that a firm’s hardware patents
play a role of a complementary asset to their software patents, thereby strengthening the market-
stealing effects of software patents while weakening the spillover effects, consistent with our
conjecture.
Next, we report the estimation results for Model 6 and 7 where we consider the interaction
between a focal firm’s software patents and market competition. We find that the interaction
between a firm’s software patents and market competition is positively significant (in Model 6, β
= 0.040, p < .05; in Model 7, β = 0.041, p < .05). With regard to RQ3, this finding suggests that
the impact of a firm’s software patents on rival’s value is stronger in a less competitive market
environment. In other words, an increase in the market competition mitigates the adverse impact
of a firm’s software patents on rivals’ market value. The coefficients in Model 6 indicate that
when market competition increases from 0 to 1, the impact of the focal firm’s software patents
on rivals’ market value changes from -0.038 to 0.002. This suggests that as competitive intensity

16
increases the spillover effect becomes stronger relative to the market-stealing effect, and under
an extremely high level of competitiveness, the spillover effect dominates.
4.3. Robustness Checks
We have conducted several robustness checks. First, in order to check whether the quality of
patents affect our results, we used an alternative measure of patent stock that can account for
patent quality. Because patent quality is commonly measured by the number of citations a patent
receives (Hall et al. 2005; Hall and MacGarvie 2010), we used citation-weighted software
(hardware) patent stock as an alternative measure for software (and hardware) patent stock. We
retrieved the number of subsequent citations (i.e., forward citations) a patent receives from the
NBER patent database. Then, we computed the citation-weighted software and hardware patent
stock, scaled by the R&D stock (Liu and Wong 2011). Using this alternative measure yielded
similar results.16
- Insert Table 8 about here -
Second, there is a potential concern for the endogeneity of our patent stock variables. For
example, a firm’s decision to patent its innovations may be influence by its rivals’ current and
future performance (expectations) that is reflected in the rivals’ market value. In this case, the
firm’s patent stock would be endogenous and our estimates would be biased. To address this
potential endogeneity, we employ the Arellano-Bover/Blundell-Bond system GMM estimator
(Arellano and Bover 1995; Blundell and Bond 1998). Our independent variables, except for the
industry Tobin’s q and year-sector dummies, are assumed to be endogenous and are instrumented
with lagged values of the variables, in both levels and in their first differences. We estimate the
two-step system GMM estimator, which is asymptotically efficient and robust to any panel-
specific autocorrelation and heteroskedasticity. Furthermore, we correct for the downward bias
in standard errors using the Windmeijer correlation (Windmeijer 2005).
- Insert Table 9 about here -
16 We also used citation-weighted software and hardware patent stock excluding self-citation and obtained similar results. Details are available upon request.

17
Table 9 presents the system GMM estimation results which are qualitatively similar to our
main results in Table 7. The results of the AR(2) test of the null hypothesis indicate that there is
no serial correlation in the second differences of the residuals (p = -0.97, -1.22, -1.34 and -1.54,
respectively). The Hansen test yields a J-statistic with a χ2 distribution under the null hypothesis,
indicating that the instruments are orthogonal to the error term. The results show that we cannot
reject the null hypothesis that the instruments are valid (p = 0.626, 0.798, 0.973 and 1.000,
respectively). Further, we report the results of a test of exgeneity of a subset of our instruments.
Using a difference-in-Hansen test of exogeneity under the null hypothesis, indicating that the
subset of instruments that we use in the levels equations are exogenous, we find that the p-value
associated with the Hansen test imply that additional instruments in the system GMM estimation
are exogenous as well. Overall, these results indicate that endogeneity is not a serious concern in
our estimations.
Further, we used an alternative measure of market competition (i.e., CR4 instead of HHI).
The overall estimation results based on CR4 are qualitatively similar to our main results. 17
Finally, to further address cross-industry heterogeneity, quantile regression (Koenker and
Hallock 2001) was employed with three quantiles (.25, .50, and .75). We found that the
coefficient estimates on rivals’ software patents are similar across quantiles (for the 25th
percentile, β = -0.021, p < .05; for 50th percentile, β = -0.023, p < .05; and for 75th percentile, β =
-0.024, p < .01). This suggests that there is no significant difference in the impact of a firm’s
software patents on rivals’ value across different sectors in the IT industry.
5. DISCUSSION AND CONCLUSIONS
While prior research on IT and innovation has primarily examined the impact of IT investments
on the innovation performance (Bardhan et al. 2013; Kleis et al. 2012; Xue et al. 2012), our
study focuses on investigating the value impacts of IT innovation itself. Specifically, we
examined the impact of a firm’s software patents on the financial market value of its competitors
in the IT industry and the moderating role of hardware patents and competitive intensity. Based
on a sample of 420 firms in the US IT industry, we find that a focal firm’s software patents are
significantly associated with a decrease in the competitors’ market value, captured by Tobin’s q.
17 Details are available upon request.
18
On average, we find that a 1% increase in a firm’s software patent stock is associated with a 0.03%
decrease in rivals’ financial market value.
More importantly, we have identified two factors that moderate the impact of a focal firm’s
software patents on its rivals’ market value. Although a firm’s hardware patents do not have a
direct impact on rivals’ market value, our results suggest that a firm’s hardware patents amplify
the competitive (negative) impact of its software patents. In addition, we find that market
competition significantly influences the extent to which the stock of a firm’s software patents
affects rivals’ market value. Specifically, an increase in the market competition mitigates the
negative impact of focal firm’s software patents on rival firms’ performance. These findings
provide unique and important implications for theory and practice, regarding the business value
and impacts of software patents.
Theoretically, our study offers evidence of the important role played by software patents in
the competitive dynamics in IT industry. Although considerable research has been conducted on
the market performance of software patents (Chung et al. 2014; Fosfuri et al. 2008; Hall and
MacGarvie 2010), prior studies have focused on the impact of software patents on the patent-
owners’ performance and there has been a paucity of research on the impact of software patents
on rival firms’ performance. By conceptualizing software patents as a key resource in the IT
industry and adopting the perspectives of market-stealing versus spillover, this study addresses
which effect (market-stealing or spillover) would dominate in software patents. By showing the
significant competitive effects of software patents, our study provides a rationale for firms to
invest heavily in software patents within the IT industry, thereby extending the prior studies that
question the value of software patents (Bessen and Hunt 2007; Hall and MacGarvie 2010).
In addition, our analysis of the moderating role of hardware patent stock provides a richer
understanding of the conditions under which the competitive effects of software patents can be
magnified or mitigated. Our finding that a firm’s hardware patent stock strengthens the
competitive impact of its software patent stock underscores the importance of complementary
assets (hardware patents in our case) in developing competitive advantage from innovations
(Teece 1986). Furthermore, our study provides new insights into the relationship between a
firm’s software patents and the market competition. Extending prior research suggesting that the
outcomes of market-stealing and spillover vary depending on industry characteristics (Austin
1993; McGahan and Silverman 2006; Megna and Klock 1993), our study finds that the adverse

19
impact of a firm’s software patents on rivals’ performance is more salient in a less competitive
environment. Our results suggest that when firms build capabilities through software patents, a
focal firm’s software patents may be more detrimental to rivals’ performance in the presence of
fewer rivals. In this respect, our study makes a meaningful contribution to the literature on the
consequences of rivals’ actions (Fosfuri and Giarratana 2009; McGahan and Silverman 2006;
Oxley et al. 2009).
For managers, one of the most interesting results is the negative market-stealing effect of a
firm’s software patents on rival firms’ financial market value in the IT industry. Our results
provide an explanation as to why many firms adopted a system for tracking its rivals’ patents
portfolio, filing lawsuits against patent infringers to protect their intangible assets and to
compensate for their loss (e.g., Nielsen 2013). Our results also imply that IT firms should
carefully adjust their patenting strategies depending on the level of market competition in order
to increase the financial returns to software patents. In particular, our findings underscore the
importance of having a systems approach to IT innovations—firms are more likely to gain
competitive advantage from IT-based innovations including both hardware and software
components, compared to those solely focusing on either software or hardware innovations.
Furthermore, our study can inform policymakers about the importance of competitive
intensity in IT industries in mitigating the adverse impact of software patents on rivals. Our
result suggests that in a more concentrated (less competitive) industry, software patents have a
greater competitive effect on rivals, which will further solidify the competitive position of the
“strong” firms owning important software patents. Given the potential negative social impact of
patents on innovation (Gans et al. 2008; Savich 2007), our result suggest that policy makers
should take measures that can increase the competitive intensity in IT industries, thereby
mitigating the competitive effects of software patents.
REFERENCES
Arellano, M., and Bover, O. 1995. "Another Look at the Instrumental Variable Estimation of
Error-Components Models," Journal of Econometrics (68:1), pp. 29-51. Austin, D.H. 1993. "An Event-Study Approach to Measuring Innovative Output: The Case of
Biotechnology," The American Economic Review (83:2), pp. 253-258.

20
Bardhan, I., Krishnan, V., and Lin, S. 2013. "Business Value of Information Technology: Testing the Interaction Effect of It and R&D on Tobin's Q," Information Systems Research (24:4), pp. 1147-1161.
Barney, J. 1991. "Firm Resources and Sustained Competitive Advantage," Journal of Management (17:1), pp. 99-120.
Bender, D., and Barkume, A.R. 1992. "Patents for Software-Related Inventions," Software Law Journal (5), pp. 279-298.
Benner, M.J., and Tushman, M. 2002. "Process Management and Technological Innovation: A Longitudinal Study of the Photography and Paint Industries," Administrative Science Quarterly (47:4), pp. 676-707.
Bessen, J., and Hunt, R.M. 2007. "An Empirical Look at Software Patents," Journal of Economics & Management Strategy (16:1), pp. 157-189.
Bessen, J.E. 2011. "A Generation of Software Patents." Boston University School of Law, Law and Economics Research Paper No. 11-31.
Bharadwaj, A.S., Bharadwaj, S.G., and Konsynski, B.R. 1999. "Information Technology Effects on Firm Performance as Measured by Tobin's Q," Management Science (45:6), pp. 1008-1024.
Blundell, R., and Bond, S. 1998. "Initial Conditions and Moment Restrictions in Dynamic Panel Data Models," Journal of Econometrics (87:1), pp. 115-143.
Brynjolfsson, E., and Saunders, A. 2009. Wired for Innovation: How Information Technology Is Reshaping the Economy. MIT Press Books, The MIT Press.
Choi, C., Kim, S., and Park, Y. 2007. "A Patent-Based Cross Impact Analysis for Quantitative Estimation of Technological Impact: The Case of Information and Communication Technology," Technological Forecasting and Social Change (74:8), pp. 1296-1314.
Chung, S., Animesh, A., Han, K., and Pinsonneault, A. 2014. "It Patent and Firm Value in It Industry: The Role of Innovation Orientation and Environmental Uncertainty." McGill University Working Paper. Available at SSRN: http://ssrn.com/abstract=2448518
Cockburn, I., and Griliches, Z. 1988. "Industry Effects and Appropriability Measures in the Stock Market's Valuation of R&D and Patents," American Economic Review (78:2), pp. 419-423.
Cockburn, I.M., and MacGarvie, M.J. 2011. "Entry and Patenting in the Software Industry," Management Science (57:5), pp. 915-933.
Eckbo, B.E. 1983. "Horizontal Mergers, Collusion, and Stockholder Wealth," Journal of Financial Economics (11:1), pp. 241-273.
Ernst, H. 2001. "Patent Applications and Subsequent Changes of Performance: Evidence from Time-Series Cross-Section Analyses on the Firm Level," Research Policy (30:1), pp. 143-157.
FFII. 2007. "The Gauss Project," Available at Online: http://www.ffii.se/erik/EPIP/img0.html. Fosfuri, A., and Giarratana, M.S. 2009. "Masters of War: Rivals' Product Innovation and New
Advertising in Mature Product Markets," Management Science (55:2), pp. 181-191.

21
Fosfuri, A., Giarratana, M.S., and Luzzi, A. 2008. "The Penguin Has Entered the Building: The Commercialization of Open Source Software Products," Organization Science (19:2), pp. 292-305.
Furman, J.L., Kyle, M.K., Cockburn, I.M., and Henderson, R. 2005. "Public and Private Spillovers, Location and the Productivity of Pharmaceutical Research," Annales d'Economie et de Statistique (79/80:167-190).
Gans, J.S., Hsu, D.H., and Stern, S. 2008. "The Impact of Uncertain Intellectual Property Rights on the Market for Ideas: Evidence from Patent Grant Delays," Management Science (54:5), pp. 982-997.
GAO. 2013. "Intellectual Property: Assessing Factors That Affect Patent Infringement Litigation Could Help Improve Patent Quality." Available at Online: http://www.gao.gov/assets/660/657103.pdf
Gao, L.S., and Iyer, B. 2006. "Analyzing Complementarities Using Software Stacks for Software Industry Acquisitions," Journal of Management Information Systems (23:2), pp. 119-147.
Graham, S., and Vishnubhakat, S. 2013. "Of Smart Phone Wars and Software Patents," Journal of Economic Perspectives (27:1), pp. 67-86.
Graham, S.J.H., and Mowery, D.C. 2003. "Intellectual Property Protection in the U.S. Software Industry," in Patents in the Knowledge-Based Economy, W.M. Cohen and S.A. Merrill (eds.). Washington: National Academies Press, pp. 1-41.
Griliches, Z. 1981. "Market Value, R&D, and Patents," Economics Letters (7:2), pp. 183-187. Hall, B.H. 2003. "Business Method Patents, Innovation, and Policy." Cambridge, MA: National
Bureau of Economic Research. Available at http://www.nber.org/papers/w9717 Hall, B.H., Jaffe, A., and Trajtenberg, M. 2005. "Market Value and Patent Citations," RAND
Journal of Economics (36:1), pp. 16-38. Hall, B.H., Jaffe, A.B., and Trajtenberg, M. 2001. "The Nber Patent Citation Data File: Lessons,
Insights and Methodological Tools." Cambridge, MA: National Bureau of Economic Research.
Hall, B.H., and MacGarvie, M. 2010. "The Private Value of Software Patents," Research Policy (39:7), pp. 994-1009.
Han, K., and Mithas, S. 2013. "Information Technology Outsourcing and Non-It Operating Costs: An Empirical Investigation," MIS Quarterly (37:1), pp. 315-331.
Han, K., Oh, W., Im, K.S., Chang, R.M., Oh, H., and Pinsonneault, A. 2012. "Value Cocreation and Wealth Spillover in Open Innovation Alliances," MIS Quarterly (36:1), pp. 291-315.
Hitt, L.M., and Brynjolfsson, E. 1996. "Productivity, Business Profitability, and Consumer Surplus: Three Different Measures of Information Technology Value," MIS Quarterly (20:2), pp. 121-142.
Jaffe, A.B., Trajtenberg, M., and Fogarty, M.S. 2000. "Knowledge Spillovers and Patent Citations: Evidence from a Survey of Inventors," The American Economic Review (90:2), pp. 215-218.

22
Jain, S., and Jain, R.K. 2011. "Software Patents Emerging Legal Issues," in Patent Procedure and Practices. New Delhi: Universal Law Publishing Co. Pvt. Ltd., pp. 146-148.
Jansen, J.J.P., Bosch, F.A.J.V.D., and Volberda, H.W. 2006. "Exploratory Innovation, Exploitative Innovation, and Performance: Effects of Organizational Antecedents and Environmental Moderators," Management Science (52:11), pp. 1661-1674.
Joshi, K.D., Chi, L., Datta, A., and Han, S. 2010. "Changing the Competitive Landscape: Continuous Innovation through It-Enabled Knowledge Capabilities," Information Systems Research (21:3), pp. 472-495.
Kazuyuki, M. 2009. "Software Patent and Its Impact on Software Innovation in Japan." RIETI. Keats, B.W., and Hitt, M.A. 1988. "A Causal Model of Linkages among Environmental
Dimensions, Macro Organizational Characteristics, and Performance," Academy of Management Journal (31:3), pp. 570-598.
Kleis, L., Chwelos, P., Ramirez, R.V., and Cockburn, I. 2012. "Information Technology and Intagible Output: The Impact of It Investment on Innovation Productivity," Information Systems Research (23:1), pp. 42-59.
Koenker, R., and Hallock, K.F. 2001. "Quantile Regression," Journal of Economic Perspectives (15:4), pp. 143-156.
Kohli, R., Devaraj, S., and Ow, T.T. 2012. "Does Information Technology Investment Influences Firm's Market Value? The Case of Non-Publicly Traded Healthcare Firms," MIS Quarterly (36:4), pp. 1145-1163.
Levin, R.C., Cohen, W.M., and Mowery, D.C. 1985. "R&D Appropriability, Opportunity, and Market Structure: New Evidence on Some Schumpeterian Hypotheses," American Economic Review (75:2), pp. 20-24.
Levin, R.C., Klevorick, A.K., Nelson, R.R., Winter, S.G., Gilbert, R., and Griliches, Z. 1987. "Appropriating the Returns from Industrial Research and Development," Brookings Papers on Economic Activity (18:3), pp. 783-831.
Levinthal, D.A., and March, J.G. 1993. "The Myopia of Learning," Strategic Management Journal (14:S2), pp. 95-112.
Liu, Q., and Wong, K.P. 2011. "Intellectual Capital and Financing Decisions: Evidence from the U.S. Patent Data," Management Science (57:10), pp. 1861-1878.
Matusik, S.F., and Hill, C.W.L. 1998. "The Utilization of Contingent Work, Knowledge Creation, and Competitive Advantage," Academy of Management Review (23:4), pp. 680-697.
McGahan, A.M., and Silverman, B.S. 2006. "Profiting from Technological Innovation by Others: The Effect of Competitor Patenting on Firm Value," Research Policy (35:8), pp. 1222-1242.
Megna, P., and Klock, M. 1993. "The Impact of Intangible Capital on Tobin's Q in the Semiconductor Industry," The American Economic Review (83:2), pp. 265-269.
Mithas, S., Tafti, A., and Mitchell, W. 2013. "How a Firm's Competitive Environment and Digital Strategic Posture Influence Digital Business Strategy," MIS Quarterly (37:2), pp. 511-536.

23
Mykytyn, K., Jr., P.P.M., Bordoloi, B., McKinney, V., and Bandyopadhyaye, K. 2002. "The Role of Software Patents in Sustaining It-Enabled Competitive Advantage: A Call for Research," Journal of Strategic Information Systems (11:1), pp. 59-82.
Nielsen, M. 2013. "Microsoft Coporation Wins Patent War Againt Google Inc," in: Market News Call. Available at http://www.marketnewscall.com/microsoft-corporation-nasdaqmsft-wins-patent-war-against-google-incnasdaqgoog/121602/
Oxley, J.E., Sampson, R.C., and Silverman, B.S. 2009. "Arms Race or Détente? How Interfirm Alliance Announcements Change the Stock Market Valuation of Rivals," Management Science (55:8), pp. 1321-1337.
Piccoli, G., and Ives, B. 2005. "Review: It-Dependent Strategic Initiatives and Sustained Competitive Advantage: A Review and Synthesis of the Literature," MIS Quarterly (29:4), pp. 747-776.
Pinsonneault, A., and Kraemer, K.L. 1997. "Middle Management Downsizing: An Empirical Investigation of the Impact of Information Technology," Management Science (43:5), pp. 659-679.
Savich, J. 2007. "Monsanto V. Scruggs: The Negative Impact of Patent Exhaustion on Self-Replicating Technology," Berkeley Tech. LJ (22), p. 115.
Schaaper, M. 2003. "A Proposal for a Core List of Indicators for Ict Measurement," in: The UNCTAD Expert Meeting on Measuring Electronic Commerce as an Instrument for the Development of the Digital Economy. Geneva.
Scherer, F.M. 1983. "The Propensity to Patent," International Journal of Industrial Organization (1:1), pp. 107-128.
Sirmon, D.G., Hitt, M.A., and Ireland, R.D. 2007. "Managing Firm Resources in Dynamic Environments to Create Value: Looking inside the Black Box," Academy of Management Review (32:1), pp. 273-292.
Smith, K.W., and Sasaki, M.S. 1979. "Decreasing Multicollinearity: A Method for Models with Multiplicative Functions," Sociological Methods & Research (8:1), pp. 35-56.
Teece, D.J. 1986. "Profiting from Technological Innovation: Implications for Integration, Collaboration, Licensing and Public Policy," Research Policy (15:6), pp. 285-305.
Teece, D.J. 1998. "Capturing Value from Knowledge Assets: The New Economy, Markets for Know-How, and Intagible Assets," California Management Review (40:3), pp. 55-79.
Utterback, J.M. 1994. Mastering the Dynamics of Innovation. Harvard Business Review Press. Wade, M., and Hulland, J. 2004. "Review: The Resource-Based View and Information Systems
Research: Review, Extension, and Suggestions for Future Research," MIS Quarterly (28:1), pp. 107-142.
Wernerfelt, B. 1984. "A Resource-Based View of the Firm," Strategic Management Journal (5:2), pp. 171-180.
Windmeijer, F. 2005. "A Finite Sample Correction for the Variance of Linear Efficient Two-Step Gmm Estimators," Journal of Econometrics (126:1), pp. 25-51.

24
Xue, L., Ray, G., and Sambamurthy, V. 2012. "Efficiency or Innovation: How Do Industry Environments Moderate the Effects of Firms' It Asset Portfolios?," MIS Quarterly (36:2), pp. 509-528.
Zahra, S.A., and Bogner, W.C. 2000. "Technology Strategy and Software New Ventures' Performance: Exploring the Moderating Effect of the Competitive Environment," Journal of Business Venturing (15:2), pp. 135-173.
Table1: Two Competing Perspectives on the Impact of Software Patents on Rivals’ Performance Market-Stealing Spillover
Anticipated Impacts on Rivals
Negative Positive
Underlying Arguments
A firm’s software patents can enable the firm to improve its products and services, and increase efficiency, thereby helping solidify the firm’s competitive position relative to its rivals (Teece 1986; Teece 1998).
A firm’s software patents can generate property rights that give the firm a competitively advantageous position and an ability to take legal actions against its rivals that attempt to copy its technologies without permission (Levin et al. 1985; McGahan and Silverman 2006).
A firm’s software patents can trigger greater technological opportunities for rival firms (Jaffe et al. 2000).
The disclosure of software patents by the firm provides crucial information about the innovation. Based on this information, the rivals can imitate a focal firm’s innovation and develop similar or better products/services (McGahan and Silverman 2006).
Related Empirical Works Patents have a market-stealing effect in the semiconductor industry (Megna and Klock 1993).
Rival product announcements have a market-stealing effect in mature product market (i.e., carbonated soft drink industry) (Fosfuri and Giarratana 2009).
Patents have a spillover effect in the biotechnology industry (Austin 1993) and the pharmaceutic industry (Furman et al. 2005).
Alliance announcements have a spillover effect on allying firms’ rivals in the telecommunications and electronics industry (Oxley et al. 2009) and open innovation alliances (Han et al. 2012).

25
Table 2: IT Patent Technology Classes with Software and Hardware Patent IT patent US Class Description Literature
Software
Patent
341 Coded data generation or conversion [a, d]*
345 Computer graphics processing and selective visual display systems [a, b, d, e, f] 370 Multiplex communications [a, d, e, f] * 380 Cryptography [a, c] * 382 Image analysis [a, b, c, d, e, f] 700 Data processing: generic control systems or specific applications [a, c, d, e, f] 701 Data processing: vehicles, navigation, and relative location [a, c, e, f] * 702 Data processing: measuring, calibrating, or testing [a, c, d] 703 Data processing: structural design, modeling, simulation, and emulation [a, c, d]
704 Data processing: speech signal processing, linguistics, language translation, and audio compression/decompression
[a, b, c, d]
705 Data processing: financial, business practice, management, or cost/price determination
[a, c, d, e, f]
706 Data processing: artificial intelligence [a, c, d, e, f] 707 Data processing: database and file management or data structures [a, b, c, d, e, f] 710 Electrical computers and digital data processing systems: input/output [b, c, d, e, f] 711 Electrical computers and digital processing systems: memory [b, c, d, e, f] 713 Electrical computers and digital processing systems: support [b, c, d, e, f] 714 Error detection/correction and fault detection/recovery [b, d, e, f] *
715 Data processing: presentation processing of document, operator interface processing, and screen saver display processing
[a, b, c, d, e, f]
717 Data processing: software development, installation, and management [a, b, c, d, e, f]
718 Electrical computers and digital processing systems: virtual machine task or process management or task management/control
[d] *
726 Information security [a, d] * 902 Electronic funds transfer [a, c] *
Hardware
Patent
235 Registers [d, e, f] * 318 Electricity: motive power systems [e, f] 340 Communications: electrical [d, e, f] * 342 Communications: directive radio wave systems and devices [e, f] 343 Communications: radio wave antennas [e, f] 348 Television [d, e, f] * 349 Liquid crystal cells, elements and systems [e, f] 353 Optics: image projectors [e, f] 358 Facsimile and static presentation processing [b, d] * 361 Electricity: electrical systems and devices [e, f] 365 Static information storage and retrieval [e, f] 367 Communications, electrical: acoustic wave systems and devices [e, f] 375 Pulse or digital communications [a, e, f] * 379 Telephonic communications [e, f] 381 Electrical audio signal processing systems and devices [a, e, f] * 386 Television signal processing for dynamic recording or reproducing [e, f] 395 Information Processing System Organization [c] * 438 Semiconductor device manufacturing: process [e, f] 455 Telecommunications [d, e, f] * 505 Superconductor technology: apparatus, material, process [e, f] 708 Electrical computers: arithmetic processing and calculating [e, f] 709 Electrical computers and digital processing systems: multicomputer data transferring [b, d] *
712 Electrical computers and digital processing systems: processing architectures and instruction processing (e.g., processors)
[c, d, e, f] *
716 Data processing: design and analysis of circuit or semiconductor mask [a, e, f] *
719 Electrical computers and digital processing systems: interprogram communication or interprocess communication (ipc)
[d, e, f] *
Note: (a) Bessen, 2011; (b) Graham & Mowery, 2003; (c) Hall, 2003; (d) New added way for classifying software patent in this research; (e) Choi et al., 2007; (f) Schaaper, 2003. * We qualitatively reclassified these US patent classes into either software patent or hardware patent by examining definition of these classes in detail with three experts.

26
Table 3: Definitions and Descriptive Statistics of Key Variables (N=1,251)
Variable Definition/Operationalization Mean Std. Q1 Median Q3 Source Literature
Rivals’ Tobin’s q Average of each rival’s Tobin’s q measure as in Bharadwaj et al. (1999) in year t
3.374 5.807 1.052 2.106 5.639 Compustat Bharadwaj et al. (1999)
Firm’s S/W patent stock
Firm’s cumulative software patent counts, scaled by R&D stock in year t
0.162 0.544 0.051 0.131 0.309 NBER Hall et al. (2005) Liu and Wong (2011) Firm’s H/W patent
stock Firm’s cumulative hardware patent counts, scaled by R&D stock in year t
0.191 0.712 0.039 0.136 0.358
Firm’s S/W patent citation stock
Firm’s cumulative citation-weighted software patent counts, scaled by R&D stock in year t
4.528 18.908 0.713 2.604 7.604
Firm’s H/W patent citation stock
Firm’s cumulative citation-weighted hardware patent counts, scaled by R&D stock in year t
5.249 26.631 0.141 2.274 8.310
Rivals’ S/W patent stock
Average of each rival’s cumulative software patent counts, scaled by R&D stock in year t
0.145 0.921 0.036 0.102 0.254
Rivals’ H/W patent stock
Average of each rival’s cumulative hardware patent counts, scaled by R&D stock in year t
0.151 0.478 0.028 0.112 0.305
Rivals’ firm size Average of each rival’s total employees 4.947 15.688 0.851 3.477 10.044 Compustat Hitt and Brynjolfsson (1996); Bharadwaj et al. (1999)
Rivals’ R&D intensity
Average of the ratio of each rival’s R&D expenses to its sales in year t
0.296 2.265 0.163 0.238 0.422
Rivals’ advertising intensity
Average of the ratio of each rival’s advertising expenses to its sales in year t
0.029 0.074 0.012 0.026 0.061
Rivals’ net income Average of each rival’s net income in year t 2.073 2.443 1.071 3.852 5.698
Industry Tobin’s q The median Tobin’s q for the firm’s industry measured at the fiscal year end of year t, based on the firm’s SIC4
2.255 1.113 1.269 2.015 3.244
Market competition
The log value of the reciprocal of the HHI 1.995 0.629 1.517 1.919 2.507 Kearts and Hitt (1988); Han and Mithas (2013)

27
Table 4: Correlation Coefficient among Key Variables 1 2 3 4 5 6 7 8 9 10
1. Rivals’ Tobin’s q
1.000***
2. Firm’s software patent
-0.053* 1.000***
3. Firm’s hardware patent
-0.041 0.195*** 1.000***
4. Rivals’ software patent
0.075** 0.027 0.013 1.000***
5. Rivals’ hardware patent
0.050* 0.037 0.129*** 0.363*** 1.000***
6. Rivals’ firm size
-0.035 -0.037 -0.007 -0.026 0.027 1.000***
7. Rivals’ R&D intensity
0.082*** 0.010 0.088*** -0.026 -0.176*** -0.288*** 1.000***
8. Rivals’ advertising intensity
0.116*** 0.042 0.042 -0.010 0.017 -0.012 0.134*** 1.000***
9. Rivals’ net income
0.136*** -0.059** -0.052* -0.031 -0.051* 0.636*** -0.243*** 0.027 1.000***
10. Industry Tobin’s q
0.015 -0.046 -0.046 -0.008 -0.131*** -0.028 0.032 0.128*** -0.001 1.000***
11. Market competition
0.034 -0.037 -0.037 0.048* -0.014 0.044 0.277*** -0.042 0.047* 0.169***
Note: The table presents pearson correlation coefficients among key variables used in our empirical analysis. *, **, *** Correlation coefficients that are significant at the 10%, 5%, and 1% levels, respectively. Table 5: Sample Selection Methodology Firm-year
obs. Firms
Firm-year observations obtained from the original sample covering years from 1998-2006, which those IT patent stock (S/W and H/W patent) is greater than zero
7,538 1,133
After removing those with missing the identification of rivals in year t 6,010 1,001 removing those with missing or zero either software or hardware patents stock in year t
3,468 568
removing those with missing or zero either advertising expense or R&D spending data in year t
1,306 425
removing those with insufficient data for computing Tobin’s q in year t 1,251 420
28
Table 6: Sample Distribution by Sub-IT Industry
4-digit SIC code
Sector Number of firms
Number of observation
Total patenta
IT patenta
Software patenta
Hardware patenta
% of S/W patent
R&D Expenseb
3571 Electronic Computers 6 23 968.32 835.98 550.73 285.25 65.88 830.55 3572 Computer Storage Devices 18 76 135.48 49.81 34.65 15.16 69.56 154.05 3576 Computer Communications Equipment 9 12 10.11 8.98 5.15 3.83 57.35 34.42 3577 Computer Peripheral Equipment, NEC 9 21 104.96 96.09 8.73 87.37 9.08 30.43 3651 Household Audio and Video Equipment 5 26 23.56 17.10 7.07 10.03 41.35 6.59 3661 Telephone and Telegraph Apparatus 30 86 28.44 15.22 6.04 9.19 39.66 33.97 3663 Radio and Television Broadcasting and
Communications Equipment 28 65 152.59 97.91 31.60 66.31 32.27 221.14
3669 Communications Equipment, NEC 7 14 13.33 10.85 1.36 9.49 12.53 15.58 3674 Semiconductors and Related Devices 84 183 656.42 415.62 150.68 264.94 36.25 375.05 3679 Electronic Components, NEC 10 27 274.60 25.21 4.55 20.66 18.05 170.02 3812 Search, Detection, Navigation, Guidance,
Aeronautical, and Nautical Systems 2 6 6.42 6.21 1.19 5.02 19.16 4.68
3823 Industrial Instruments for Measurement, Display, and Control of Process Variables; and Related Products
4 10 39.62 25.21 22.93 2.28 90.96 26.97
3825 Instruments for Measuring and Testing of Electricity and Electrical Signals
19 62 150.62 54.94 34.62 20.32 63.01 152.43
3826 Laboratory Analytical Instruments 6 11 38.92 2.27 1.64 0.64 71.93 52.51 3829 Measuring and Controlling Devices, NEC 7 23 30.27 13.69 5.69 8.00 41.56 11.26 3844 X-Ray Apparatus and Tubes and Related
Irradiation Apparatus 1 6 13.76 5.04 2.62 2.42 51.98 6.59
3845 Electromedical and Electrotherapeutic Apparatus
10 25 28.83 8.31 4.13 4.18 49.70 11.70
7370 Computer Programming, Data Processing, Etc.
19 92 1289.86 911.01 583.03 327.98 64.00 591.55
7371 Computer Programming Services 2 5 1.84 1.82 1.55 0.27 85.16 3.50 7372 Prepackaged Software 111 388 51.01 48.86 36.69 12.16 75.11 184.25 7373 Computer Integrated Systems Design 31 87 514.61 305.61 156.45 149.17 51.19 309.48 7374 Computer Processing and Data
Preparation and Processing Services 2 3 3.90 3.90 3.09 0.80 79.43 37.31
Total 420 1,251 296.20 194.86 104.04 90.82 53.39 229.14 Note: a The mean of stock of patent. b Unit: million $

29
Table 7: Estimation Results of Random-Effects Model with AR1 Adjustment Model 1
(z-stat.) Model 2 (z-stat.)
Model 3 (z-stat.)
Model 4 (z-stat.)
Model 5 (z-stat.)
Model 6 (z-stat.)
Model 7 (z-stat.)
DV: Rivals’ Tobin’s q ln(Y) ln(Y) ln(Y) ln(Y) ln(Y) ln(Y) ln(Y) Firm’s S/W patent -0.029**
(0.015) -0.032**
(0.015) -0.034**
(0.015) -0.038**
(0.018) -0.040**
(0.020) Firm’s H/W patent 0.011
(0.014) 0.017
(0.015) 0.013
(0.016) 0.019
(0.020) 0.017
(0.018) Firm’s S/W patent × H/W patent
-0.025**
(0.010) -0.021**
(0.011) Firm’s S/W patent × Market competition
0.040**
(0.024) 0.041**
(0.021) Firm’s H/W patent × Market competition
-0.011
(0.027) -0.013
(0.028) Rivals’ S/W patent 0.058**
(0.018) 0.058**
(0.018) 0.058**
(0.017) 0.055**
(0.017) 0.054**
(0.017) 0.059**
(0.018) 0.060**
(0.017) Rivals’ H/W patent 0.021*
(0.019) 0.023*
(0.019) 0.021*
(0.019) 0.022*
(0.018) 0.023*
(0.018) 0.022*
(0.019) 0.023*
(0.019) Rivals’ firm size -0.102***
(0.014) -0.102***
(0.014) -0.104***
(0.014) -0.104***
(0.014) -0.103***
(0.014) -0.103***
(0.014) -0.102***
(0.014) Rivals’ R&D intensity 0.079***
(0.020) 0.079***
(0.020) 0.079***
(0.020) 0.079***
(0.020) 0.080***
(0.019) 0.080***
(0.020) 0.080***
(0.019) Rivals’ advertising intensity
-0.008
(0.012) -0.007
(0.013) -0.008
(0.013) -0.007
(0.012) -0.007
(0.012) -0.008
(0.013) -0.008
(0.013) Rivals’ net income 0.135***
(0.009) 0.135***
(0.010) 0.134***
(0.009) 0.135***
(0.009) 0.136***
(0.009) 0.134***
(0.009) 0.135***
(0.009) Industry Tobin’s q -0.019
(0.022) -0.020
(0.023) -0.019
(0.023) -0.020
(0.023) -0.021
(0.023) -0.016
(0.022) -0.017
(0.023) Market competition 0.104
(0.095) 0.106
(0.095) 0.105
(0.095) 0.107
(0.095) 0.096
(0.095) 0.090
(0.095) 0.081
(0.096) Intercept 0.894***
(0.417) 0.835**
(0.418) 0.896**
(0.420) 0.871** (0.419)
0.915**
(0.419) 0.897***
(0.419) 0.936**
(0.419) Wald χ2 (df) 518.20***
(37) 520.49***
(38) 518.84***
(38) 529.34***
(39) 535.72***
(40) 533.33***
(41) 550.47***
(42) R2 (%) 27.86 30.07 28.05 32.33 34.64 34.61 39.86 N 1,251 1,251 1,251 1,251 1,251 1,251 1,251 Note: Log scale. Significance: ***p < 0.01; **p < 0.05; *p < 0.10. Huber-White robust standard errors are shown in parentheses. Models include year or sector (SIC 4-digit) dummies but the coefficients are not reported for the brevity. All of the variable in the interaction terms have been centered. We use the log value of the reciprocal of the HHI as the market competition (i.e., large value of this measure means more competitive industries).

30
Table 8: Estimation Results based on Citation-weighted Patent Stock Model 1
(z-stat.) Model 2 (z-stat.)
Model 3 (z-stat.)
Model 4 (z-stat.)
Model 5 (z-stat.)
Model 6 (z-stat.)
Model 7 (z-stat.)
DV: Rivals’ Tobin’s q ln(Y) ln(Y) ln(Y) ln(Y) ln(Y) ln(Y) ln(Y) Firm’s S/W citation-weighted patent
-0.053***
(0.011) -0.052***
(0.012) -0.054***
(0.012) -0.052***
(0.013) -0.057***
(0.013) Firm’s H/W citation-weighted patent
0.042
(0.012) 0.039
(0.013) 0.038
(0.013) 0.036
(0.012) 0.037
(0.012) Firm’s S/W × H/W (citation-weighted) patent
-0.046**
(0.009) -0.045**
(0.008)
Firm’s S/W citation-weighted patent × Market competition
0.042**
(0.018) 0.041**
(0.019)
Firm’s H/W citation-weighted × Market competition
-0.020
(0.013) -0.021
(0.012)
Rivals’ S/W citation-weighted patent
0.068***
(0.018) 0.068***
(0.018) 0.068***
(0.017) 0.064***
(0.017) 0.063***
(0.017) 0.070***
(0.018) 0.071***
(0.017) Rivals’ H/W citation-weighted patent
0.051**
(0.019) 0.053**
(0.019) 0.051**
(0.019) 0.052**
(0.018) 0.053**
(0.018) 0.052**
(0.019) 0.053**
(0.019) Rivals’ firm size -0.098**
(0.034) -0.099**
(0.035) -0.098**
(0.034) -0.099**
(0.034) -0.098**
(0.035) -0.098**
(0.034) -0.099**
(0.034) Rivals’ R&D intensity 0.071***
(0.020) 0.071***
(0.020) 0.071***
(0.020) 0.071***
(0.020) 0.079***
(0.019) 0.081***
(0.020) 0.079***
(0.019) Rivals’ advertising intensity
-0.008
(0.012) -0.007
(0.013) -0.008
(0.013) -0.007
(0.012) -0.007
(0.012) -0.008
(0.013) -0.008
(0.013) Rivals’ net income 0.112***
(0.009) 0.113***
(0.010) 0.113***
(0.009) 0.113***
(0.009) 0.112***
(0.009) 0.114***
(0.009) 0.115***
(0.009) Industry Tobin’s q -0.019
(0.022) -0.020
(0.023) -0.019
(0.023) -0.020
(0.023) -0.021
(0.023) -0.016
(0.022) -0.017
(0.023) Market competition 0.106
(0.095) 0.111
(0.095) 0.109
(0.095) 0.109
(0.095) 0.101
(0.095) 0.099
(0.095) 0.091
(0.096) Intercept 1.040***
(0.570) 1.032**
(0.514) 1.015**
(0.528) 1.011** (0.520)
1.015**
(0.512) 1.020***
(0.519) 1.011**
(0.521) Wald χ2 (df) 812.34***
(37) 816.22***
(38) 811.29***
(38) 823.41***
(39) 826.09***
(40) 825.21***
(41) 842.89***
(42) R2 (%) 28.12 31.19 31.06 35.87 35.62 35.66 39.28 N 1,251 1,251 1,251 1,251 1,251 1,251 1,251 Note: Log scale. Significance: ***p < 0.01; **p < 0.05; *p < 0.10. Models are reported using random-effects with AR1 adjustments. Huber-White robust standard errors are shown in parentheses. Models include year or sector (SIC 4-digit) dummies but the coefficients are not reported for the brevity. All of the variable in the interaction terms have been centered. We use the log value of the reciprocal of the HHI as the market competition (i.e., large value of this measure means more competitive industries).

31
Table 9: System GMM Estimation Results Model 1
(t-stat.) Model 2 (t-stat.)
Model 3 (t-stat.)
Model 4 (t-stat.)
DV: Rivals’ Tobin’s q ln(Y) ln(Y) ln(Y) ln(Y) Firm’s S/W patent -0.132**
(0.054) -0.080*
(0.051) -0.084**
(0.049) Firm’s H/W patent 0.031
(0.049) 0.029
(0.050) 0.015
(0.051) Firm’s S/W patent × H/W patent -0.030**
(0.029) -0.029**
(0.031) Firm’s S/W patent × Market competition 0.079**
(0.121) Firm’s H/W patent ×Market competition 0.050
(0.102) Rivals’ S/W patent 0.087**
(0.048) 0.082** (0.049)
0.083** (0.049)
0.081** (0.048)
Rivals’ H/W patent 0.064* (0.041)
0.065* (0.041)
0.062* (0.041)
0.063* (0.042)
Rivals’ firm size -0.128***
(0.075) -0.115**
(0.072) -0.113***
(0.073) -0.114***
(0.074) Rivals’ R&D intensity 0.160*
(0.081) 0.076
(0.082) 0.051
(0.080) 0.048
(0.083) Rivals’ advertising intensity -0.056
(0.002) 0.017
(0.003) 0.030
(0.003) 0.035*
(0.003) Rivals’ net income 0.123***
(0.010) 0.124***
(0.011) 0.124***
(0.011) 0.127***
(0.012) Industry Tobin’s q 0.076
(0.082) 0.074
(0.083) 0.076
(0.083) 0.084*
(0.084) Market competition 0.061
(0.806) 0.054
(0.807) 0.057
(0.812) 0.054
(0.811) Intercept 0.684***
(0.912) 0.634*** (0.913)
0.509***
(0.914) 0.685***
(0.915) F-value (df) 15.70
(14, 419) (p < 0.01)
18.34 (16, 419) (p < 0.01)
21.56 (17, 419) (p < 0.01)
24.12 (19, 419) (p < 0.01)
N 1,251 1,251 1,251 1,251 Diagnostic tests
Arellano-Bond test for AR(2) in first differences (z-stat.) -0.97
(p = 0.331) -1.22
(p = 0.223) -1.34
(p = 0.180) -1.54
(p = 0.124) Hansen test of over identifying restrictions chi2 (df) 63.69 (68)
(p = 0.626) 122.10(108)
(p = 0.798) 136.29(170)
(p = 0.973) 152.05(238)
(p = 1.000) Difference-in-Hansen test of exogeneity of instrument subsets
GMM instruments Hansen test excluding group χ2 (df) 50.66 (54)
(p = 0.604) 104.99(108)
(p = 0.564) 117.89(135)
(p = 0.853) 127.56(189)
(p = 1.000) Difference (null H = exogenous) χ2 (df) 13.03 (14)
(p = 0.524) 17.11 (28)
(p = 0.946) 18.40 (35)
(p = 0.991) 24.49 (49)
(p = 0.999) Exogenous variables
Hansen test excluding group χ2 (df) 47.56 (56)
(p = 0.782) 108.25(124)
(p = 0.842) 118.81(158)
(p = 0.991) 143.35(226)
(p = 1.000) Difference (null H = exogenous) χ2 (df) 16.13 (12)
(p = 0.185) 13.85 (12)
(p = 0.310) 17.47 (12)
(p = 0.133) 8.70 (12)
(p = 0.728) Note: Significance: ***p < 0.01; **p < 0.05; *p < 0.10. Huber-White robust standard errors are shown in parentheses. Models include year dummies but the coefficients are not reported. We report two-step estimators, which are asymptotically efficient and robust to any panel-specific autocorrelation and heteroscedasticity. We correct for the downward bias in the standard errors using the Windmeijer correlation (Windmeijer 2005).