COMPETITIVE EQUILIBRIA IN MARKET ENVIRONMENTS
18
EXCHANGE ECONOMIES AND LOSS EXPOSURE: EXPERIMENTS EXPLORING PROSPECT THEORY AND COMPETITIVE EQUILIBRIA IN MARKET ENVIRONMENTS Mikhail Myagkov and Charles R. Plott California Institute of Technology 1. INTRODUCTION Recent years have found attempts to integrate ideas from a psychology research tradition with ideas from economics. The integration is difficult because the purposes of the two scientific enterprises differ and the methodologies differ. Nevertheless, the lessons from one approach can sometimes find applications in the other. This paper is an attempt to accomplish such an intellectual arbitrage by merging experimental methods from economics with theory suggested by psychology. The central focus of the experiments reported below is a psychological theory, called prospect theory (Kahneman and Tversky, 1979 ), which has received substantial attention in the decision literature. The substance of prospect theory is the process of individual decision making as opposed to a substance of market activity and price formation typical of economics. For the most part economists have not been interested in the process of individual decisions. Instead, economics has proceeded on the assumption that the consequences of the individual decision making process, whatever they might be, will become manifest in the form of an individual preference relation. Thus, individual choices will be reflections of the attitudes that are summarized by the concept of a preference. The individual in economics is captured by a preference relation over states of the world. By contrast the individual in psychology is a complex of processes that might be subject to any number of influences that are sometimes summarized by a concept of framing. Consistency such as transitivity does not follow from psychological theory. Individuals can order things if asked to do so, but the ordering is labile and may bear no relationship to choices. In fact, it is not even clear if the concept of a preference is relevant from the point of view of prospect theory. Tversky, Sattath and Slovic (1988, p.383) put the issue well, "If different elicitation procedures produce different orderings of options, how can preferences and values be defined? And in what sense do they exist?" In summary, the substance of research from psychology is that preferences are labile (Kahneman and Tversky, 1986; Kahneman and Tversky, 1981 ) because the process used by individuals to make decisions is subject to subtle framing effects. Thus while the processes used by individuals may be stable the existence of a summarizing characteristic of an individual such as a relatively stable or unchanging (non labile) preference is denied. The apparent differences between the psychological view of the individual and the economic view of the individual seem to emerge from three sources. First, prospect theory is about a process of decision and not necessarily about a preference that exists as some stable or constant property of an individual. The principles of the psychological model address the nature of the steps that occur when a process of decision is invoked. Secondly, the theory addresses one time decisions as opposed to repeated decisions or perhaps even "substantially considered" decisions that might take place in markets. Third, the sources of data are questionnaires and interviews as opposed to the market choices that are typical of data in economics. Furthermore the purpose of the questionnaires is not to measure some property of an individual (such as the slope of an indifference curve) as would be the case in economics; the purpose is to demonstrate properties of a decision making process that might produce substantially different decisions under slightly altered conditions. Thus, a tension between the two disciplines can easily result from a lack of realization that they are focused on different aspects of behavior and different sources of data. The purpose of the research reported here is to ask if prospect theory and the methods used to support it, can be employed to produce a model that captures data in a purely economic context. The research cannot be viewed as a test of prospect theory as developed by psychologists because it is being applied to a context and in a manner that differs substantially from what the originators of the theory intended. The differences are so dramatic that it might be more appropriate to refer to the theory that is to be applied here as "extended prospect theory" rather than prospect theory in order to emphasize that the liberties taken with the theory reside entirely with the present authors and not with the psychologists that are proponents of the theory. The "extended prospect theory" is a theory of preferences as opposed to prospect theory, which is a theory of decision making process.
Transcript of COMPETITIVE EQUILIBRIA IN MARKET ENVIRONMENTS

4/23/2015 080394
http://darkwing.uoregon.edu/~myagkov/0801.html 1/18
EXCHANGE ECONOMIES AND LOSS EXPOSURE: EXPERIMENTS EXPLORING PROSPECT THEORY ANDCOMPETITIVE EQUILIBRIA IN MARKET ENVIRONMENTS
Mikhail Myagkov and Charles R. Plott
California Institute of Technology
1. INTRODUCTION
Recent years have found attempts to integrate ideas from a psychology research tradition with ideas from economics. Theintegration is difficult because the purposes of the two scientific enterprises differ and the methodologies differ. Nevertheless,the lessons from one approach can sometimes find applications in the other. This paper is an attempt to accomplish such anintellectual arbitrage by merging experimental methods from economics with theory suggested by psychology.
The central focus of the experiments reported below is a psychological theory, called prospect theory (Kahneman andTversky, 1979 ), which has received substantial attention in the decision literature. The substance of prospect theory is theprocess of individual decision making as opposed to a substance of market activity and price formation typical of economics.For the most part economists have not been interested in the process of individual decisions. Instead, economics hasproceeded on the assumption that the consequences of the individual decision making process, whatever they might be, willbecome manifest in the form of an individual preference relation. Thus, individual choices will be reflections of the attitudesthat are summarized by the concept of a preference.
The individual in economics is captured by a preference relation over states of the world. By contrast the individual inpsychology is a complex of processes that might be subject to any number of influences that are sometimes summarized by aconcept of framing. Consistency such as transitivity does not follow from psychological theory. Individuals can order thingsif asked to do so, but the ordering is labile and may bear no relationship to choices. In fact, it is not even clear if the conceptof a preference is relevant from the point of view of prospect theory. Tversky, Sattath and Slovic (1988, p.383) put the issuewell, "If different elicitation procedures produce different orderings of options, how can preferences and values be defined?And in what sense do they exist?" In summary, the substance of research from psychology is that preferences are labile(Kahneman and Tversky, 1986; Kahneman and Tversky, 1981 ) because the process used by individuals to make decisions issubject to subtle framing effects. Thus while the processes used by individuals may be stable the existence of a summarizingcharacteristic of an individual such as a relatively stable or unchanging (non labile) preference is denied.
The apparent differences between the psychological view of the individual and the economic view of the individual seem toemerge from three sources. First, prospect theory is about a process of decision and not necessarily about a preference thatexists as some stable or constant property of an individual. The principles of the psychological model address the nature ofthe steps that occur when a process of decision is invoked. Secondly, the theory addresses one time decisions as opposed torepeated decisions or perhaps even "substantially considered" decisions that might take place in markets. Third, the sourcesof data are questionnaires and interviews as opposed to the market choices that are typical of data in economics. Furthermorethe purpose of the questionnaires is not to measure some property of an individual (such as the slope of an indifference curve)as would be the case in economics; the purpose is to demonstrate properties of a decision making process that might producesubstantially different decisions under slightly altered conditions. Thus, a tension between the two disciplines can easilyresult from a lack of realization that they are focused on different aspects of behavior and different sources of data.
The purpose of the research reported here is to ask if prospect theory and the methods used to support it, can be employed toproduce a model that captures data in a purely economic context. The research cannot be viewed as a test of prospect theoryas developed by psychologists because it is being applied to a context and in a manner that differs substantially from whatthe originators of the theory intended. The differences are so dramatic that it might be more appropriate to refer to the theorythat is to be applied here as "extended prospect theory" rather than prospect theory in order to emphasize that the libertiestaken with the theory reside entirely with the present authors and not with the psychologists that are proponents of thetheory. The "extended prospect theory" is a theory of preferences as opposed to prospect theory, which is a theory of decisionmaking process.

4/23/2015 080394
http://darkwing.uoregon.edu/~myagkov/0801.html 2/18
Exchange economies were created in which only losses can occur. If the principles of prospect theory are assumed to dictateproperties of a stable individual preference as opposed to a property of the process used to make decisions, then the(extended and modified) theory has definite consequences for what should be observed. More precisely, prospect theoryimplies concavity of indifference curves in the loss domain as opposed to the usual convexity assumption of economics.With the usual convexity assumptions violated the competitive equilibria in an exchange economy have distinct propertiesif the equilibria exist. The research reported here inquires whether or not those properties are observed.
The second section of the paper outlines relevant aspects of ("extended") prospect theory and the questions to be posed bythe research. The third section of the paper contains the details of the experimental environments. The forth section containsa specification of the models that are needed to produce predictions about market behavior. The fifth section contains theresults and the final section summarizes and concludes the paper. An appendix contains the instructions used in theexperiments.
2. RESEARCH QUESTIONS
A fundamental difference exists between prospect theory and the traditional expected utility hypothesis as it is applied ineconomic context. The expected utility hypothesis rests on the proposition that choices are made as if there exists apreference relation over lotteries over final states. It is as if the final outcome is the source of value and choices reflect aprocess of optimization modulated by attitudes toward risk. By contrast, prospect theory does not proceed on thepresumption that a preference exists for final states. Individual decisions reflect optimization based on values but thesevalues rest upon changes of states from some reference point, which for purposes of discussion, could be viewed as a statusquo. Furthermore, the value function is postulated to have a very distinct shape.
Briefly put, prospect theory rests on four axioms.
(i) Decision utilities. Decisions reflect a maximization based upon decision utilities.
(ii) Reference dependence. The carriers of decision utilities are changes in states (prospects) as opposed to outcomes or finalstates. These changes are relative to some outcome called the reference point.
(iii) Loss aversion. The decision utility function is steeper in the losses than in the gains. That is, the negative of a givenmovement in the loss direction from the reference point outweighs a positive of an equal movement in the gain direction.
(iv) Diminishing sensitivity. The decision utility function is convex in the loss domain and concave in the gain domain.
The theory has not been systematically applied to market environments but it has been the foundation for an alternative tothe expected utility hypothesis as a descriptive theory of decisions. By implication, since the expected utility hypothesis isroutinely used in economics, the theory might serve as an alternative foundation for market models. Exactly how one mightapply the theory is not clear since the concept of a reference point in a rapidly moving market situation is itself not clear andto date there is no substantial evidence that prospect theory, as articulated by psychologists, is applicable to markets.However, some claims have been reported in the literature (Kahneman and Tversky, 1986; Kahneman and Tversky, 1991;Kahneman, Knetsch and Thaler 1990) that traces of phenomena predicted by the theory, have been detected.
The approach taken in this research is to create a market in which only "losses" can be realized and to study the resultingmarket behavior. Subjects were paid a flat amount of money ($60) in cash before the experiment began, which they keptduring the course of the experiment. Once in the experiment they could only lose. Literally, they paid money to theexperimenter. The amount of loss depended upon the decision they made to buy and to sell lotteries, which were thefunctional equivalent of insurance.
Each individual was given an initial endowment of units of lottery (insurance) which could be sold for cash. Or, if theindividual wished (s)he could use cash to buy units of lottery(insurance) from other individuals. The setting was that of anexchange economy to which a standard competitive model might be applied. If individuals were risk averse then theindifference curves would take the usual convex properties and the competitive equilibria would necessarily be of one class.If individuals were risk seeking then the indifference curves would take a concave property and the competitive equilibriawould have a boundary property of a different class. Intuitively speaking, if the indifference curves of the Edgeworth Box areconvex then the competitive equilibria tend to have an interior property and if the indifference curves are concave then thecompetitive equilibria tend to take a boundary property. The following sections of the paper make these properties precise.
4/23/2015 080394
http://darkwing.uoregon.edu/~myagkov/0801.html 3/18
A day or two prior to the experiment, subjects were given a classroom questionnaire to complete. This questionnairecontained choices between lotteries similar to those that were used in Kahneman and Tversky ( 1979) to demonstrate a riskseeking propensity in the loss domain. Thus, a measurement similar to the ones used by psychologists was taken. Thepurpose was to compare behavior as revealed in the questionnaire with behavior revealed in the markets.
The following four general questions are posed for research.
(1) Is there any consistent equilibration behavior observed within and across experimental markets? Unlike many previousmarket studies, the preferences explored in the experiments reported here have not been induced. If the reference pointchanges depending upon the context of the decision then preferences might exhibit labile properties and as a result themarkets might be erratic.
(2) Can market adjustments be associated with the equilibrium predications of the competitive model? As will be discussedlater, the competitive model contains reasonably precise predictions about market behavior. However, there are very fewstudies in which the underlying parameters might not be convex. How the markets might behave under such circumstances isa question of general interest.
(3) If patterns of equilibration are observed do they imply the existence of risk averse people , do they imply the existence ofrisk seeking people or do they imply the existence of both? The standard model typically assumes that people will be riskaverse while a reasonable application of prospect theory would produce people that are risk seeking. Is risk seeking in thelosses a property of individual preferences? Such a discovery would be of special interest because subjects in marketexperiments are generally observed exhibiting risk avoiding behavior (sealed bid experiments and speculation experimentsare typical).
(4) Is there any relationship between answers to the questionnaires and the behavior exhibited in the markets? Do thequestionnaires produce measurements that predict behavior in the context of operating markets? Do questionnaires capture aproperty of an individual as opposed to a process of decision? Psychologists typically do not view the questionnaire asmeasuring a property of an individual and instead view it as a demonstration of the operation of certain aspects of a decisionprocess. Economists are typically skeptical of any methodology in which questionnaires are used, so the question is ofrelevance along at least two dimensions.
3. EXPERIMENTAL ENVIRONMENT, DESIGN AND PROCEDURES
A total of ten experiments were conducted. The first nine of them ( as summarized in Table 1 ) were held under identicaleconomic and incentive environments. Experiments are indexed by the date of the experiment. The tenth one was a "control"experiment. Its purpose and design will be discussed in the "Results" section of the paper. Until then we discuss only firstnine experiments. Each experiment involved six to ten subjects. Subjects for some experiments were recruited from theCalifornia Institute of Technology and the experiments were conducted at the Caltech Laboratory for ExperimentalEconomics and Political Science. Other subjects were recruited from classes at the University of Southern California and theexperiments were conducted at the USC Experimental Economics Laboratory.
Subjects participated in one or two identical experiments. In all but 0324 and 0509 experiments the subjects were firsttimeparticipants. We call them "inexperienced subjects" ( see Table 1). All of the subjects who were used in 0324 and 0509experiments were secondtime participants ( "experienced subjects") recruited from subject pools of one of the previousexperiments with the firsttime participants. Some subjects in the Caltech experiment were experienced from other (unrelated)experiments. None of the subjects from USC had such prior experience.
The economic and incentive environment was as follows. Subjects were given $60 cash before the beginning of theexperiment (they were handed the money in cash). They were told that the money was theirs but as a result of the experimentthey could lose some of it. They were told that the amount of the loss would depend upon the decisions they would makeduring the market and on the outcome of a roll of dice. The word "loss" was used in the instructions in much the same way asit is used in these paragraphs.
In the economic environment there were two goods that could be traded. Each subject was told that (s)he faced two possiblelosses: Loss A and Loss B. That is, Total loss = Loss A + Loss B. Each individual was given an initial endowment of variableM and X. The initial endowment of M was m0 = 1000 and the initial endowment of X was x0 = 20 units. For trading purposesM could be viewed as cash on hand and X was units of inventory. The final loss exposure for a period of trading was

4/23/2015 080394
http://darkwing.uoregon.edu/~myagkov/0801.html 4/18
Loss A = < $20 (1/100) m > and
Loss B = <0 Prob 1/2 or $40 x Prob 1/2>
where m is the amount of M held at the end of a period and x is the amount of X held at the end of the period.
As can be seen the variable M is literally money embedded in a loss framework and the variable X is a quantity of insurance.The expected value of Loss B offset from a one unit increase in X is $0.50. Since the value of one unit of M is $0.01 thetradeoff that leaves total expected loss unchanged is 50 units of M for one unit of X. That is, the risk neutral price of X shouldbe $0.50.
Subjects were trained to participate in a multiple unit double auction (MUDA) as implemented through a computerizedmarket. Standard training procedures were followed. The variable M as defined appeared as cash on hand and X wasinventory.
Subjects in USC participated in three ( in one in Caltech ) practice market periods without payoff or exposure. These wereused to test and train subjects about the accounting and how the markets functioned. The practice periods were followed byreal periods in which the outcomes or final holdings ( m and x ) represented actual loss exposures. At the end of several realperiods one period was chosen at random (One of the subjects rolled dice.) and the lotteries that resulted from the tradingduring that period were actually played (Once again a subject rolled the dice.). The losses were collected from the subjectsand they were allowed to go. The instructions and accounting forms are included in the appendix. Subjects first read theinstructions and then were asked to answer the questions in an exercise that in essence tested their understanding of thecontent of the instructions.
A questionnaire was administered to the entire classes from which subjects were later recruited. No reference to thequestionnaire was made during the experiment or was it associated with the experiment in any other way.
The questionnaire itself is included as Appendix 1. The questions themselves include the relevant questions form Kahnemanand Tversky (1979). As can be seen from the Appendix they are of the form
"What would you prefer to lose: $50 for sure or $100 with probability = 1/2?"
"What would you prefer to win: $200 for sure or $400 with probability = 1/2?".
An individual that prefers a lottery to the expected values of the lottery is exhibiting risk seeking type of answers. Thestylized fact that has emerged from the Kahneman and Tversky research is that people are risk seeking in the losses. The datain support of this stylized fact are almost exclusively answers to questionnaires.
4. MODEL
The model that will be applied to guide the analysis will be the general competitive equilibrium for an exchange economy. Itis well known that this model is reasonably accurate under conditions in which preferences are induced and thus can beassumed to be known and fixed (Noussair, Plott and Riezman 1995). Furthermore, it is known that the predictions of themodel are also accurate under preference conditions that produce market instability (Plott and George 1992). Thus theanalysis will rest on a general assumption that regardless of the preferences that may be present in the economies, the marketswill seek the competitive equilibrium as long as one exists. Of course under the conditions of the experiments reported herethe preferences are not known and according to the psychology model might not be fixed or might not even exist; and, ifpreferences do exist in the form suggested by the model from psychology, extended prospect theory, then they will exist in aform that can cause market instability in the sense that individuals will always want to move to a boundary of an opportunityset. In this section the model will be developed under several assumptions about what preferences might be.
As will be demonstrated in this section, the patterns of equilibrium behavior under different assumptions about preferencescan differ dramatically. The analysis will first focus on the case in which all individuals are either risk averse, all risk seekingor all risk neutral. The primary focus will be on the shapes of indifference curves and the implied demand curves underconditions of competition. The analysis will then address cases in which different numbers of individuals might be riskaverse (RA) and risk seeking (RS) and the related problems of equilibrium.
The key distinction for theory is the axiom of risk seeking in the losses. If individuals choose to maximize expected

4/23/2015 080394
http://darkwing.uoregon.edu/~myagkov/0801.html 5/18
(decision) utility and if individuals are risk seeking in the losses then individual indifference curves are concave to the origininstead of convex. In such case the individuals have an incentive to move to a corner solution of a budget set at any given setof prices. If individuals are risk averse then they might want to move to the boundary of an opportunity set under some pricesbut there always exist prices at which they would want to remain on the interior of the opportunity set. The consequences willbe for competitive equilibria to have certain boundary cases if the agents in the experiment are risk seeking while interiorequilibria can also exist if the agents are risk averse. This special property of the equilibria will form the bases for theevaluation of results.
The first proposition to be established is the relationships among assumptions about risk seeking propensities, risk aversionand the shapes of indifference curves. From the point of view of the model the individual must choose a combination of twocommodities, M and X. Preferences over these two commodities reflect the fact that different combinations dictate differentlotteries over monetary losses that the individual must experience. Different indifference curves for m and x (the finalholdings of M and X respectively ) will result from different assumptions about the characteristics of an individual’spreferences over these resulting lotteries, if indeed a concept of preference is relevant to attitudes toward lotteries recall insome interpretations of prospect theory individuals do not have preferences in the form used by economics and employedhere.
The following notation is used hereafter :
M = the notation for the numeraire
m0 = the initial endowment of M
m = the quantity of m held at the end of a period
X = the notation for the commodity
x0 = the initial endowment of X
x = the quantity of X held at the end of a period
F y= the derivative of the function F(.) with respect to the variable y.
The lotteries defined by the choice of m and x are Loss A for sure and Loss B with a .5 probability. These prospects can berecombined into a choice of lotteries dictated by a choice of x and m, and are of the form:
probability .5 loss = $(20m/100)
probability .5 loss =$(60m/100 x)
so the expected value of the loss is 40 m/100 .5 x.
Three general background assumptions will be used throughout.
(a) The commodity space is two dimensional as characterized by the variables M and X, which characterize exposure tolotteries of monetary losses or changes in wealth from some current value w. M takes values 0 m 2000 and X takes values 0ó x ó 40.
(b) Individuals preferences over lotteries are as if the individuals wished to maximize the expected value of a (twicedifferentiable) utility function of money.
Assumptions (a) and (b) can be summarized by an assumption that the individuals act as if they wished to chose m and x tomaximize
EUi (w,m,x) = 0.5 Ui (w, m/100 20) + 0.5 Ui ( w, m/100 20 + x 40)
where w is the value of current wealth. Ordinarily the expected utility hypothesis would assume that the function was of theform U( w+ w). Here the distinction is made because of the following assumption.

4/23/2015 080394
http://darkwing.uoregon.edu/~myagkov/0801.html 6/18
(c) The relevant reference point for purposes of application of prospect theory is w. Furthermore the analysis will suppress wsince it is assumed to be the same throughout the experiment.
Of course this suppression is not really consistent with psychological reasoning since the reference point is presumed to becontext dependent and thus might take any form at all in such a complex environment as a market.
Indifference Curves.
The proposition to be stated below demonstrates that the indifference curves in two dimensional space, under the generalassumptions above, are concave to the origin if the individual is risk seeking as suggested by prospect theory. If theindividual is risk averse the indifference curves will have the usual convexity property and if the individual is risk neutralthen the indifference curves will be straight lines with a well defined slope.
PROPOSITION 1. Consider a utility function satisfying the general assumptions (a), (b) and (c) above. If
1. U (z)>0 for any z .
2. U (z)<0 for any z<0 if a subject is RiskAverse in losses.
3. U (z) > 0 for any z < 0 if a subject is RiskSeeking in losses.
4. U (z) = 1 and U (z) = 0 if a subject is RiskNeutral
then in the MN case the indifference curves of the final holdings of M and X satisfy the following properties: (wheresubscripts represent partial derivatives)
1. x m < 0 for any m : 0<m<20.
2. x mm > 0 (Convex) if a subject is RiskAverse in negatives.
3. x mm < 0 (Concave) if a subject is RiskSeeking in negatives.
4. x m = 0.02 and x mm = 0 if a subject is RiskNeutral.
SUPPORT. See Appendix 3.
The typical indifference curves for all types of subjects are shown in Figures 1a, 2a and 3a. For risk averse individuals theindifference curves must have the usual convex to the origin shape (Figure 1a). For risk seeking individuals the preferencesare concave to the origin as shown in Figure 2a. For risk neutral individuals the curves are straight line with the designatedslope of 0.02 (Figure 3a). Notice that the slopes of all curves are less than or equal to 0.02 regardless of attitudes toward riskof loss.
Excess Demand Functions.
The analysis will ultimately lead to a consideration of various aspects of competitive equilibria. Useful tools to help oneunderstand the possibilities under various conditions are the demand functions. Demand functions are solutions to theconstrained optimization problem:
MAX.m,x 0.5U(m/100 20) + 0.5U(m/100 20 + x 40)
subject to
m+P x m0 + Px0 , 0 m 2000, 0 x 40, where m0=1000, x0=20
P is the price of inventory X expressed in terms of units of M per unit of X. The initial endowments of M and X are designatedby m0 and x0. A similar problem exists where the lottery is the numeraire except in that case prices of M are stated in terms ofthe number of units of X it would take to buy one unit of M. A solution to the maximization problem produces the individualdemand curves.
Since the functional forms of the utility function are not specified, only the qualitative features of excess demand functions

4/23/2015 080394
http://darkwing.uoregon.edu/~myagkov/0801.html 7/18
can be obtained. Some general properties of the excess demand functions will be discussed for all three cases of risk aversion,risk seeking and risk neutrality. Begin with a price of 50 in Figure 1a. It is the diagonal line from the upper left to the lowerright. This price plays an important role in determination of the demand equations. Any transactions made at a price of 50preserves the expected value of initial endowments. In other words, a risk neutral person would be indifferent between buyingor selling at that price. If the trade increased variance of final money a risk averse person would not move along this price linebut a risk neutral person might and a risk seeking person would.
First consider the excess demand functions of a risk averse individual and continue to study Figure 1a, which illustrates thesolutions of the utility maximization problem. The demand functions derived from this exercise are of the form of thefunctions represented in Figure 1b. If the price P is lower than 50 then by Proposition 1, the quantity demanded above theinitial endowment will be equal 20. In other words all risk averse subjects will be willing to buy 20 units of X to add to theirinitial endowment, which is equivalent to buying as much insurance as is possible. If the insurance cost is less than theexpected value of the loss, a risk averse person will always buy. If the price is equal to 50 then the quantity demanded by arisk averse person is also equal to 20. The individual would prefer to spend the money an avoid the exposure to risk that isimplicit in a fair bet. At prices that range from 50 to p** (Figure 1a) the quantity demanded falls continuously from 20 tosome negative q** (Figure 1b). At the low price the risk averse person is a buyer of insurance but as the price get high thepurchases fall and if the price of insurance is high enough then in spite of the risk aversion the individual will sell insurance.At prices from p** to + the individual has no use for the money because of the boundary on the values that m can take, andas a result the demand is goes from q** to 0 proportional to 1/P.
Figure 2a illustrates the solutions to the utility maximization problem for a risk seeking individual and Figure 2b graphs thequalitative features of the resulting demand functions. At any price of 50 or above a risk seeking individual will always be onthe sellers side of the X market. A risk seeking individual prefers the risk and variance in wealth so would always prefer totake the money and assume the risk of a "fair bet". Thus, at prices above 50 the risk averse person will always have an excessdemand of 20. However, because of the constraints on the value of M their demand for X will increase from 20 to 0proportional to 1/P as P increases.
At some prices below 50 risk seeking individual would participate as a seller of insurance. At a price slightly below 50, (s)hewould prefer to take the cash and assume the risk. However there is a sufficiently low price, equal to p* (Figures 2a and 2b), atwhich a risk seeking person is indifferent between 20 and 20. Such a price will always exist because of the continuity of theutility function. If the price is less than p* then the risk seeking individual will demand 20 units of X. At that p* the price ofinsurance is so low that the risk seeking individual will buy it because the increase in expected wealth more thancompensates for the fact that the variance in wealth will fall as a result of the purchase.
All risk neutral subjects will be on the buyers side of the market if the price is lower than 50 and on the sellers side if the priceis higher than 50. At the price equal to 50 they are indifferent between all points that are within the interval [ 20, 20 ]. Figure3b presents a typical demand function of a risk neutral person.
It is important to note that with only one exception the individual excess demand functions are continuos. The onlyexception occurs in the case of the excess demand function of a risk seeking person, which has one point of discontinuity at aprice of p*. At that price the function has two values: 20 and 20.
Competitive Equilibria.
With the properties of the individual excess demand functions established the analysis can focus on the possible properties ofequilibria that can emerge from an exchange economy. Important to this determination will be the relative numbers of riskaverse (A), risk seeking (S) and risk neutral (N) in "losses" individuals that happen to exist in the economy. Recall thatpreferences are not controlled in these experiments and that the individual brings to the market whatever preferences orattitudes that he or she has.
The problem, can be formally written within the framework of a Mperson, twogoods, pureexchange economy. Thusconsider M individuals A of whom are risk averse, S are risk seeking and N are risk neutral in losses. The preferences andutilities are assumed and defined in Proposition 1.
There are two goods in the system: "francs", denoted by M and "units of inventory", denoted by X. Any individual is allowedto have 0 X 40 and 0 M 2000 in his possession. Extra francs or units of inventory do not increase utility. The twogoods have value in the sense that an increase or either or both will decrease exposure to a monetary loss. Initial endowmentsare denoted as m0 and x0 where m0 = 1000 and x0= 20. The notation of price P is determined as an amount of francs used to

4/23/2015 080394
http://darkwing.uoregon.edu/~myagkov/0801.html 8/18
acquire one unit of X.
Individual excess demand functions derived under the conditions of the economy are as described in the paragraphs above.The attention now turns to equilibria. The possibility of nonconvexities makes any discussion of equilibria rather complex.In particular the existence of equilibria depends upon a relatively delicate balancing of the number of individuals withdifferent types of preferences. The Walrasian dynamics drives the system in the consistent way but the price itself might besupported only by a delicately balanced allocation. Recall that in the case of non convex preferences there is a tendency togo to the boundaries. Since everyone wants on the boundary (and all initial endowments are equal) the number of people thatwant to sell must exactly equal the number of people that want to buy.
Formally, a competitive equilibrium exists in the system if and only if there is a price p* at which total excess demand(D(p)= Qi(p), where Qi(p) is an individual excess demand) has a value of 0, D(p*)=0. Figures 1b, 2b and 3b show that theshapes of the individuals excess demand curves depend on types of the individuals. That implies that the shape of the totalexcess demand curve and the equilibrium price depend upon the relative numbers of risk averse, risk seeking and risk neutralindividuals in the system. The following three propositions use the notion of the total excess demand to provide sufficientconditions for the existence of a competitive equilibrium and to compute equilibrium prices under different relative N, S andA. Proofs of the Propositions can be found in the Appendix 3.
PROPOSITION 3. If there are only Risk Averse subjects in the system (S=N=0) then under the conditions on the preferencesand identical initial endowments a competitive equilibrium always exists at a price strictly higher than 50.
PROPOSITION 4. (S=0) If there are no RiskSeeking subjects in the system then under the conditions on the preferences andidentical initial endowments a competitive equilibrium always exists. Equilibrium price is higher than 50 if A>N and equalto 50 otherwise.
PROPOSITION 5. Under the conditions on preferences, identical initial endowments and even number of subjects acompetitive equilibrium always exists. Equilibrium price is lower than or equal to 50 if S A+N and greater than or equal to50 if S A+N. Moreover, if S > A+N then equilibrium price is strictly lower than 50.
The following two observations follow directly from the Propositions 35.
Observation A. Only individual maximum net trades should be observed if the equilibrium is at a price less than 50. That is, ifthe equilibrium price is lower than 50 then all individuals should trade the maximum of 20 units.
Observation B. The number of buyers should be equal to the number of sellers in the market if the equilibrium is at a priceless than 50 . The market volume of net trades should be [20 (M/2)] at equilibrium prices less than 50 .
The Table 2 summarizes the major results of this section. The equilibrium price predictions of the competitive model arelisted conditional on the relevant environmental assumptions.
It is important to note that the theoretical analysis proceeds on the assumption that there is always an even number of peoplewho follow the expected utility hypothesis and either have risk avoiding, risk seeking or risk neutral preferences. If someonedoes not participate or if an individual has preferences that are substantially different from the ones postulated then thedynamics of the markets still could be similar to that postulated in Propositions 35 because of the limited influence oneindividual can have by virtue of the constraints on the budget set. Of course existence of equilibrium in the model is anotherthing and the presence of such individuals could force the system into an environment in which the equilibrium does notexist in the competitive model. If for some reason an individual wants only a few units then delicate balancing of individualsis impossible and the logic applied to generate existence in the models applied here is destroyed.
5. RESULTS
The time series of all periods of all nine experiments are shown in Figures 715. Shown there are the contract prices as theyoccurred in time. The vertical bars represent the change of periods. A large black vertical bar represents the change from thepractice periods to the periods for which the consequences would result in actual losses. While the figures show all dataincluding the practice periods, only the real payoff periods are considered in the data analysis discussed in this section. Thepractice session is included only for illustrative purposes. The horizontal dotted line is the reference price of 50.
4/23/2015 080394
http://darkwing.uoregon.edu/~myagkov/0801.html 9/18
The impression from the figures is that in all but one experiment transaction prices were consistently lower than 50 and thatin most cases prices settled to some sort of an "assymptote". The only exception is experiment 0501. The impression issupported by the first result. The importance of the result is that according to the model , the implication of such prices is thatat least half of the subjects in the experiments were risk seeking.
RESULT 1. The transaction prices tend to be no higher than the risk neutral level of 50. The estimated asymptote of suchmovements were lower than 50.
SUPPORT. The first claim of result relies on the data presented in the Table 3. The numbers in the Table are averagetransaction prices across actual payoff periods and experiments. Notice that there are only seven exceptions to the statementof the result and six of these exceptions exist only in experiment 0501. In many periods of several experiments the averageprices were within one cent of the risk neutral price of 50 thereby suggesting the hypothesis that subjects were risk neutraland that subjective transaction cost would account for the difference. This possibility is discussed later in the paper. For now,it must be remembered that virtually all transactions were made below the riskneutral level of 50 ( see Figures 715).
For the second claim of the result, the destination and the direction of the equilibration process must be determined. Thedestination and the direction of the price convergence was evaluated by the application of a simple dynamic model,[Noussair, Plott, Reizman, 1995]. The model assumes that price (dependent variable) may start from a different origin for eachexperiment, but the convergence is assumed to be to a common asymptote in all experiments. Formally the model is asfollows:
Pit = B11D1(1/t) + ... + B1KDK + B2((t1)/t) + uit
where i is the index of the experiment, Dj are dummy variables that take value 1 if i=j and value 0 otherwise, t is timemeasured in terms of experimental period number, K is number of experiments, Pit is the average price in period t of theexperiment i, u is a random variable, distributed normally with 0 mean. B1i measures origin of the price convergence processand B2 is an asymptote.
Data in Table 4 show ordinary least squares estimation of the model. The estimated asymptote was 46.11 and the risk neutralequilibrium price was at 50. Thus, the statistical model suggests that the price equilibration was to the price lower than therisk neutral level of 50.
The next result is focused on the convergence process and the degree to which it can be described as being toward thecompetitive equilibrium . All experiments involved an even number of subjects so by Propositions 5 and 6 and under thegeneral maintained hypothesis, a competitive equilibrium existed in all nine experiments. Prices and final holdings shouldbe considered. Price patterns were considered in Result 1. The conclusions about the destination of the price movementprocess, combined with the patterns of competitive equilibria predicted by the model, suggest the extent to which patterns ofnet changes of final holdings are consistent with the view that the process was converging toward a competitive equilibrium.It is important to note that the result addresses a convergence process because none of the processes could be said to haveperfectly equilibrated.
RESULT 2. Market movement toward a competitive equilibrium was observed across experiments. The
propensity for movement toward competitive equilibrium quantities is more pronounced as subjects have experience in morethan one experiment.
SUPPORT. The first step of the support is to show that a tendency of price equilibration in a sense of a falling variance ofprice, was observed across experiments. Data in Table 5 show that the standard deviations of the prices were lower in the finalperiods of every experiment , compared to earlier periods, thus suggesting price equilibration.
The next step is to determine, if one of several patterns of competitive equilibria predicted by the model was observed acrossexperiments. The competitive model predicts a pattern of prices and closely related final holdings. We know from Result 1that prices as well as the asymptotes of the process were no higher than 50 in all but one experiment.
Observation A is that the equilibrium final holdings are at the boundaries if prices are below 50. Observation B is that inequilibrium the number of sellers should equal the number of buyers given the transaction prices are less than 50 and theobservation also contains a prediction for the total volume. Observations A and B as well as Result 1 imply that inequilibrium each subject should have bought or sold 20 units of inventory, thus making final holdings equal to 40 or 0.

4/23/2015 080394
http://darkwing.uoregon.edu/~myagkov/0801.html 10/18
Data on final holding is a bit less decisive than on prices, but relevant statistics are in Table 6. Shown there are the numbersof individuals who increased or decreased their holding of X by various levels. The last two periods of an experiment wereaveraged for each individual and used as the measure to indicate the individual’s position. The numbers of buyers areapproximately equal to the numbers of sellers (40 vs 38), and we find fifty seven out of seventy eight people have moved halfway ( at least nine units ) or more toward the boundaries. This is more than 73% of the individuals.
The fact that not all of the individuals have moved to the boundaries shows up again in the volume numbers. Data in Table 7show the time series of net trade volumes across experiments. In five out of nine experiments the volumes were substantiallylower than the predictions of the competitive model and there were no clear signs of volume convergence to the predictedquantities. The relevance of this phenomena will be discussed later in the paper where individual behavior of subjects will beconsidered.
The subjects who participated in two experiments tended to have higher net changes of final holdings in the secondexperiment in which they participated. Data in Table 8 compare average ( of the last two periods ) final holdings of thesubjects for the USC experiments: 0316,0317,0324 and for the Caltech experiments:0501,0502,0505,0509. The first twoexperiments ( 0316 and 0317 ) in the USC experiments and the first three experiments ( 0501, 0502, 0505) in the Caltech setinvolved inexperienced subjects. All of the subjects in the USC, 0324 and in Caltech, 0509 had the experience of previousparticipation in one of the earlier experiments. First, notice that six of the seven subjects who came close to the boundaries (bought or sold more than twothirds of the theoreticaly predicted quantities ) during their first experience kept that tendencyfor their second particiaption. Secondly, fifteen of twenty subjects under consideration increased the absolute values of theirfinal holding changes the second time of participation. Thus, the evidence for movement toward a competitive equilibriumallocation is stronger in markets in which subjects were experienced.
In summary, price convergence receives substantial support but allocation results are less so. Movement toward theboundaries occurs, but in the USC experiments the movement is incomplete resulting in volumes that are less than thecompetitive prediction. While the evidence is thus mixed, we conclude that a tendency of convergence toward a competitiveequilibrium was observed across experiments .
The next result states the implications of the particular competitive equilibrium observed, as related to the numbers ofdifferent types of preferences. As Proposition 6 states, because prices are so low, there must be more risk seeking people in thesystem than risk averse and risk neutral combined. Result 3 says that there are individuals that are risk seeking in the losses,but it also makes explicit the fact that such properties of individuals can be observed in market behavior. Later it will beshown that it is possible not only say that there were risk seeking people in the system but also separate them from risk aversepeople.
RESULT 3. The number of risk seeking subjects in the experiments was no less then the number of risk averse and risk neuralsubjects combined.
SUPPORT. Proposition 6 states that only in the cases in which the number risk seeking subjects is no less than the number ofnon risk seeking ones ( S N+A), can the competitive equilibrium price be at some level which is strictly lower than 50.Average period prices (Table 3) as well as econometric data (Table 4 ) demonstrate that that was the case in the experiments.Result 2 states that the convergence was toward a competitive equilibrium. Thus, it is possible to apply Propositions 5 and 6to the experimental data and conclude that the number of risk seeking subjects in the experiments was no lower then thenumber of non risk seeking ones.
The conclusion is consistent with the diminishing sensitivity axiom of prospect theory, which predicts such a behavior inlosses. However, the price equilibration across experiments, identified in the previous paragraphs, has one major implication,which is very important for the discussion of the relevance of prospect theory for economics from a methodological point ofview. Namely, equilibration suggests that, contrary to prospect theory as advanced by psychologists, preferences exist and donot exhibit labile properties depending on reference point changes. This issue will be pursued toward the end of the resultssection.
The next result evolves from an inquiry that has two forms. First, do the questionnaires used extensively in psychologicalstudies lead to measurements of properties of people that will be manifest in market behavior? The second form is a corollaryto the first. Is risk seeking in the negatives a property of individual preferences or is it a property of the way that people thinkabout things? Is it a property of preference or is it a property of the process of preference formation? As it turns out the
4/23/2015 080394
http://darkwing.uoregon.edu/~myagkov/0801.html 11/18
questionnaires have a biased property but nevertheless provide strong predictive powers about market behavior. Thus, onecannot reject the notion that the questionnaires measured a property of preference as opposed to a feature of cognition.
The analysis will consist of three steps. First, the subjects will be classified as RA or RS according to their behavior in theexperiments. Secondly, the same classification will be completed according to their answers to the questionnaires.Comparison of two classifications will provide support for the statement of results.
A classification of the subjects by their behavior in the experiments is developed by using the equilibrium patterns suggestedby the model. Subjects can be classified into three different categories, according to their final holdings . Only two lastperiods of every experiment were used in the analysis. Data in Table 9 show the results of such a classification.
1. Risk Seeking ("RS") This class contains subjects who satisfy the following condition:
They moved at least half way toward the "sellers" boundary on average, i.e. they sold at least ten units of X on average in thelast two periods of the experiment.
2. Possibly Risk Averse ("RA") This class contains subjects who satisfy the following condition:
They moved at least half way toward the "buyers" boundary on average, i.e. they bought at least ten units of X on average inthe last two periods in the experiment.
The competitive model predicts (Propositions 5 and 6) that in equilibrium, when the prices are sufficiently lower than the riskneutral price, risk seeking people can demonstrate the same behavior as risk averse people: buying units of inventory. On theother hand, if a subject is on the sellers’ side of the market and prices are below 50 then that subject is exhibiting riskseekingbehavior. Thus, formally, the numbers in Table 9 represent lower bounds of the numbers of the risk seeking people in theexperiments and the upper bounds of the numbers of the risk averse subjects.
3. "?" It is hard to say about subjects. This class contains subjects who did not demonstrate a "consistent pattern" of behavior.In other words, these were subjects who:
i. may have been moving in a direction of the boundaries, but did not demonstrate any pattern of consistency.
ii. were trading around the status quo, instead of moving toward some boundary, but showed no consistent behavior.
iii. were not buying or selling anything at all.
iv. demonstrated a mix of i, ii and iii.
Data in Table 9 demonstrate the results of the classification. Notice that approximately two thirds of all subjects (53 out of82) were classified as RS or RA and the other third was classified as "?". Since, as discussed in the previous paragraphs, thosesubjects who were classified as RA could in fact be RS if prices were sufficiently low , the results of such a classificationshould be interpreted to be that there was no less than 50% of the people in the experiments that were risk seeking. Thisclassification is consistent with the claim of Result 3 that risk seeking accounts for a substantial proportion of behavior.
The classification provides a possible insight about the weaknesses in the support for equilibration. Recall from the supportof the Result 2 that the total net volumes of trades were lower than predicted by the competitive model. Now it becomes clearthat such a phenomena is likely due to the great number of subjects who were classified as "?". The common feature of mostof such subjects is that they did not move far from the status quo. In other words they all had low net volumes across periodsand as a result they could not be classified as RA or RS. Data in Table 7 show that the net volumes were approximately 1050% lower than ones predicted by the model. On the other hand one third of subjects were classified as "?", thus providingsupport for the claim that the "?" subjects were responsible for low net volumes.
A classification of the subjects according to their answers to the questionnaires was done. All of the subjects were asked toanswer the following questions: What would you prefer to loose:
For Sure With probability

4/23/2015 080394
http://darkwing.uoregon.edu/~myagkov/0801.html 12/18
1/2
1 $500 $1000
2 $20 $40
3 $3000 $4000 (p=.8)
4 $7.50 $15
5 $1 $2
According to their answers they were qualified using two different types of classifications:
Type 1 classification:
RiskAverse 3 or more answers "for sure" ;
RiskSeeking 3 or more answers "with probability=1/2"
Type 2 classification: (according to the answers to single question)
RiskSeeking Would prefer to loose $40 with probability=1/2 instead of loosing $20 for sure.
Questionnaires were completed by all 82 subjects who participated in the experiments.
According to the Type 1 criteria 66(80%) were "RiskSeeking"
16(20%) were "RiskAverse"
According to the Type 2 criteria 61(74%) were "RiskSeeking"
21(26%) were "RiskAverse"
With the measurements above completed the result can now be stated. The essence of the result is that the questionnaireshave predictive power about behavior in markets.
RESULT 4. There is strong consistency between answers to the questionnaires and experimental market behavior. However,the questionnaire has a substantial bias that overestimates the number of risk seeking individuals relative to the number ofrisk averse individuals. [ The error rate of risk seeking answers in the questionnaire is greater than the error rate of risk averseanswers to the questionnaire. That is, an individual responding in a risk averse manner in the questionnaire was more likelyto behave that way (RA) in the experiment than was a person who was RiskSeeking in the questionnaires.]
SUPPORT. The numbers in Table 10 represent relationships between the experimental data and the data from thequestionnaires. If only subjects who were classified as RA or RS are considered then the probability that a subject whoappears to be RS according to the questionnaires would demonstrate the same kind of behavior in the experiment (p(RSexp|RSquest)) is equal to .65 (.63 for type 2 of classification). Similarly p(RAexp|RSquest)=.35 (.37) ,p(RAexp|RAquest)=.87 (.80), p(RSexp|RAquest)=.13(.20). Two conclusions follow about relevance of the questionnaires forpredicting market behavior. First, answers to the questionnaires do produce measurements that can be used as a roughprediction of the behavior in the context of operating markets, since the probability of consistent ( with the answers) behavioris .73. Secondly, the likelihood of a deviation in the experiment from the answer given to the questionnaire is two and a halftimes higher ( 35/13) for risk seeking subjects (questionnaire) rather than for risk averse ones (questionnaire). It is importantto note that the results are the same for both types of classification. In other words choice of either of the two different typesof classification does not change the results. Finally, the fact that the number of RA people was likely overestimated and thenumber of RS people was underestimated implies even stronger consistency between answers and actions than presentedabove.

4/23/2015 080394
http://darkwing.uoregon.edu/~myagkov/0801.html 13/18
Results Robustness : Two tests.
The core of the results presented in the previous sections consists of two major conclusions. First, people do demonstrate riskseeking behavior in losses. Secondly, answers to the questionnaires can be used as a predictive power for individual behaviorin real markets. These conclusions are based on the predictions of the model developed in the paper and data obtained fromthe experiments. Of course, since the data do not perfectly fit the model, there might be alternative explanations. In thissection we discuss the outcomes of two "control" experiments that were designed to explore two alternative explanations ofthe data.
The motivation for the first control experiment was the fact that in many experiments transaction prices were very close ( apenny below ) to the risk neutral level of 50. In view of that data a possibility existed that that the subjects were risk neutraland that transaction costs could account for any lack of accuracy of the model. To test this hypothesis ( risk neutrality ) acontrol experiment ( 0509) was conducted. This experiment was an exact replica of all previous ones except for how thesubjects were chosen. All subjects who participated in experiment 0509 had already participated in one of the previousCaltech experiments: 0501, 0502 or 0505. Most importantly, all but one of the subjects chosen for 0509 were those thatcould be classified as risk seeking as a result of their first participation. Data in Table 3 show that in the three experiments(0501,0502 and 0505) prices were close to the risk neutral level of 50. Thus, if the subjects were risk neutral then thetransaction prices in the experiment 0509 should be also near 50. On the other hand, if the risk seeking interpretation of thedata is correct , then, as the model implies, the prices in experiment 0509 should be significantly below 50.
The last column in Table 3 presents transaction prices for the experiment 0509 ( control experiment ). It is clear that the priceswere not only below 50 but are far below ( about 20% ) the prices in the experiments 0501, 0502 and 0505. Since marketprices were substantially below the risk neutral equilibrium, the model implies that there are more risk seeking subjects thanrisk averse and risk neutral combined, so the hypothesis about risk neutrality can be rejected.
The second control experiment was conducted to explore the idea that the observed risk seeking behavior could be explainedas a general risk preference, as opposed to simply risk seeking in losses. If subjects change their risk seeking behavior to riskaverse behavior when the experimental conditions are formulated in terms of gains as opposed to losses, then the hypothesisof general risk preference can be rejected. In other words the question was: are the risk seeking subjects people that prefer risktaking in general, or is it the case that preferences are different for gains as opposed to losses? The test was performed usingan experiment with a translation of the origin of the payoffs to a "gains" environment. First, subjects were paid $10 upfrontand were given 1000 units of money (m) and 20 units of inventory ( x ) as initial holdings. Secondly, their incentives to tradewere formulated in terms of potential gains:
Total Gain = Gain A + Gain B
Gain A = < (1/100) m > and
Gain B = <0 Prob 1/2 or $ x Prob 1/2> .
Note that for both types of design ( losses and gains ) the exante expected amounts of money a subject could earn were thesame. Thus, general preferences over final states of the world yield behavior that should be the same for both types ofexperiments. Subjects who were used in this second control experiment were those who participated in 0509. Recall, thesesubjects demonstrated clear risk seeking behavior in losses. Therefore, if no differences exist for the subjects between lossesand gains, one would expect risk seeking behavior and prices above the "expected value’. That is, transaction prices goabove the risk neutral level of 50 due to risk seeking individuals who drive the price up because they enjoy the variance inwealth. On the other hand, if the subjects have asymmetric risk attitudes in the gains and losses, then the subjects wouldswitch to the risk averse behavior when the lotteries are formulated in terms of gains. As a consequence , the transactionprices in the second control experiment would be below the risk neutral level of 50.
Figure 16 presents time series of transaction prices for the second control experiment. The horizontal line corresponds to therisk neutral level (50). Notice that all transaction prices are below 50. This implies that the subjects who demonstrated strongrisk seeking behavior when the lotteries involved losses switched to risk averse behavior when the same lotteries involvedgains. Thus, the hypothesis that the subjects were risk preferring in general and exhibited no asymmetric behavior, can berejected.

4/23/2015 080394
http://darkwing.uoregon.edu/~myagkov/0801.html 14/18
Conjectures.
A paradox can be observed in the data. On one hand the individuals selected for experiment 0509 continued to exhibit riskseeking behavior throughout the second experience. On the other hand data exists that suggest an evolution of risk attitudeswhen learning becomes a factor. In other words, for many subjects, the risk attitudes after experience, are different from thoseinitially. For example, Figures 715 show that in most of the experiments price convergence was occurring in the trainingperiods. The early prices were consistently lower suggesting that people were becoming more risk averse as they gainedexperience. The following two conjectures represent an attempt to approach the problem of learning.. The conjectures shouldnot be interpreted as results but rather as a starting point of a discussion about this issue.
CONJECTURE 1. Support of specific implications of the loss aversion axiom of prospect theory, such as an "endowmenteffect", "status quo bias" or "tradeoff vs. improvement" is stronger in the experiments involving inexperienced subjects anddisappears with experience.
SUPPORT. The result is a direct implication of the data presented in Table 8. The source of support is a comparison of thebehavior of the subjects who participated in the experiments 0316, 0317, 0501, 0502 and 0505 as inexperienced subjects,with their behavior when they participated in the experiments 0324 and 0509. The latter behavior was substantially differentfrom the former. Such a difference in behavior of the same people participating in the same experiment, suggests thatexperience matters.
As were discussed in the support of Result 2, in the first set of experiments ( subjects were inexperienced ) the final holdingsof eight of twenty subjects were near the origin ( less than 10 units were traded ), implying status quo bias. In other words thestatus quo was the chosen option for the subjects. At the same time, however, the phenomena cannot be due to the status quobias as derived from prospect theory. At the prices that existed in these markets, if people are risk seeking as they must beunder the conditions of prospect theory from which the status quo bias is derived, the competitive equilibrium haveindividuals only on the boundaries selling insurance. Thus while a status quo bias is observed it cannot be due to prospecttheory. At the same time, in the second set of experiments (subjects were experienced) the final holdings of only four oftwenty subjects were near the origin, implying boundary final holdings as predicted by the competitive model and inagreement with other experiments.
Moreover, fifteen of the twenty subjects increased the absolute values of their final holdings during their second experiment.The conclusion is that inexperienced the subjects in the experiments demonstrated a capacity to make very few changes intheir holdings. With experience and understanding their behavior changed. Thus degree of experience and not a status quobias derived from prospect theory accounts for their behavior.
The conjecture above suggests that when people do not feel confident about their understanding of a situation they will beconservative and chose to make very little changes in what they have. It is possible to use prospect theory to explain suchphenomena. The explanation could go as follows. A natural feature of uncertainty, as opposed to risk, is the possibleexistence of negative prospects that are possibly weighted so high that inaction results. With exposure to the decisionenvironment comes a better understanding and as a consequence the imagined, possibly negative prospects disappear and theother features of the decision process emerge. While this explanation is crude, it appears that some such modification ofprospect theory is necessary for the last result to be explained.
The discussion and results above hold implications about the nature of circumstances under which prospect theory can beapplied in its current form. Since the real prospect theory (and not the extended prospect theory examined here) is about adecision process, it might not be surprising if the nature of the axioms/laws of the process is subject to evolution withexperience and understanding. The conjecture that is developed next suggests that some of the central phenomena identifiedby prospect theory is not a stable feature of human choice behavior. It goes away with experience and perhaps with reflection.
CONJECTURE 2. With experience, risk seeking in the losses evolves into either risk neutral of risk averse behavior.
SUPPORT. Price convergence from below in most experiments (Table 3) suggests that the incidence of risk seeking behavioris getting weaker as the experiment continues. The competitive model implies (Propositions 46), that the more RS subjectsare in the system the less will be the equilibrium price and the more RA subjects are in the system the higher will be theequilibrium. Table 3 shows that the prices were consistently increasing in 7 out of 9 MN experiments. Although it isimpossible to claim that RiskSeeking behavior always disappears with experience, obvious tendencies of the phenomena

4/23/2015 080394
http://darkwing.uoregon.edu/~myagkov/0801.html 15/18
were observed in four experiments.
The above conjectures are of potential importance because it helps isolate the nature of the decision process and its possiblerelationship to properties of an individual. Convergence in economic environments seems to occur at many different levels.Clearly prices and quantities have a convergence property. However, individual decision rules seem to evolve and individualunderstanding of a situation and the attitudes of other individuals seem to undergo a transformation during the course ofdecisions and market activity. A controversial hypothesis/philosophy was advanced to describe this evolution , called thediscovered preference hypothesis Plott (forthcoming), and while that hypothesis is so simple that it is not likely to surviveclose examination, the above two conjectures seem to be part of the phenomena that the discovered preference hypothesiswas advanced to cover.
6. CONCLUSIONS
This research began with questions motivated by psychological research. Prospect theory has had a considerable impact onthe decision literature. The question posed by the research reported here was whether or not the predictions of an " extendedprospect theory" could find support in markets.
Exchange economies were created in which only losses could occur. Preferences over losses were not controlled in theunusual manner in which preferences are induced. Instead the objective was to determine if the "preferences revealed" bymarket actions had properties that one might expect from having studied the psychological based literature.
Risk seeking in the loss domain was observed in the markets studied. Its existence lends support to two fundamentalproperties of prospect theory. First, since risk averse behavior has been widely documented in the positive domain inexperimental markets, we can conclude that there is an asymmetry between gains and losses. That asymmetry is afundamental property of prospect theory. As a corollary, we can conclude that there are such things as "gains" and "losses",the existence of which implies the existence of another fundamental feature of prospect theory, a reference point. Finally, wecan conclude that risk seeking in the losses is a frequent occurrence. It was a property of over one third of the peopleobserved in these markets.
The patterns of results lend strong support to features of prospect theory as decision process. The more fundamental questionto be posed is whether individuals are ONLY a bundle of decision processes, rules of thumb that have no necessaryrelationship to an underlying attitude or coherence of an underlying preference. First it should be emphasized that a patternof coherence is evident in the markets. Convergence to understandable equilibria occurred. It follows that the "referencepoint" was not so subject to moment to moment "framing" that preferences became so labile that they had no coherence.These markets behaved as if a large proportion of individuals had reasonably coherent and stable preferences. Of course, alarge proportion of these preferences were exactly of the form that one would have expected from a reading of prospecttheory, as stated by the "extended prospect theory".
Psychologists have long maintained that a relevant domain of prospect theory is "one time decisions". The results reportedhere support that presumption and stimulate a question regarding whether or not that is the only circumstance in which thetheory applies. The results reported here suggest that the first impulses experienced by a decision maker would seem to bedescribed by the theory. Features of prospect theory are clearly present when people are confused. The support for the statusquo bias is an example. The difference in behavior of those that give a risk seeking response to a questionnaire as opposed tothose that give a risk averse response is another body of evidence that conservatism is a consequence of incompleteunderstanding. After all, the theory is about a process of decision, so it is not particularly surprising that its features are mostevident in situations in which individuals are involved in a process of decision.
Whether or not "considered opinions" are governed by the same processes as are immediate impulses involves deeper andmore complex experiments than have been performed to date. The final conjecture of the paper is that some of the features ofprospect theory will disappear with practice or perhaps even with reflection. In particular, the conjecture is that risk seekingin the losses is a property of inexperience that will give way to risk averse behavior. Of course one implication of theconjecture is that the concept and importance of a reference point will also fade. The idea that the evolution of attitudes has adirection toward the more classical lines of preference theory has been vigorously criticized. Nevertheless, the data presentedhere provides additional support for such a presumption.
4/23/2015 080394
http://darkwing.uoregon.edu/~myagkov/0801.html 16/18
REFERENCES.
Daniel Kahneman and Amos Tversky, "Prospect Theory: An Analysis of Decision Under Risk." Econometrica, 1979, Volume47:26391.
Daniel Kahneman and Amos Tversky, "The Framing of Decisions and the Psychology of Choice." Science 211:45358.
Daniel Kahneman and Amos Tversky, "Rational Choice and the Framing of Decisions.’’ Journal of Business, 1986 vol. 59no. 4 pt. 2.
Daniel Kahneman, Jack L. Knetsch and Richard H. Thaler, "Experimental Tests of the Endowment Effect and the CoaseTheorem." Journal of Political Economy, 1990, vol. 98, no. 6.
Daniel Kahneman and Amos Tversky, "Loss Aversion in Riskless Choice: A ReferenceDependent Model." The QuarterlyJournal of Economics, November 1991.
Charles N. Noussair, Charles R. Plott,and Raymond G. Riezman , "An Experimental Investigation of the Patterns ofInternational Trade." American Economic Review, June 1995.
Charles R. Plott, "Rational Individual Behavior in Markets and Social Choice Processes." Forthcoming in The RationalFoundations of Economic Behaviour, K. Arrow, E. Colombatto, M. Perlaman and C. Schmidt (eds). London, Macmillan andNew York, St. Martin’s Press, 1995.
Charles R. Plott and Glen George "Marshallian vs. Walrasian Stability in an Experimental Market." Economic Journal, (May1992):43760.
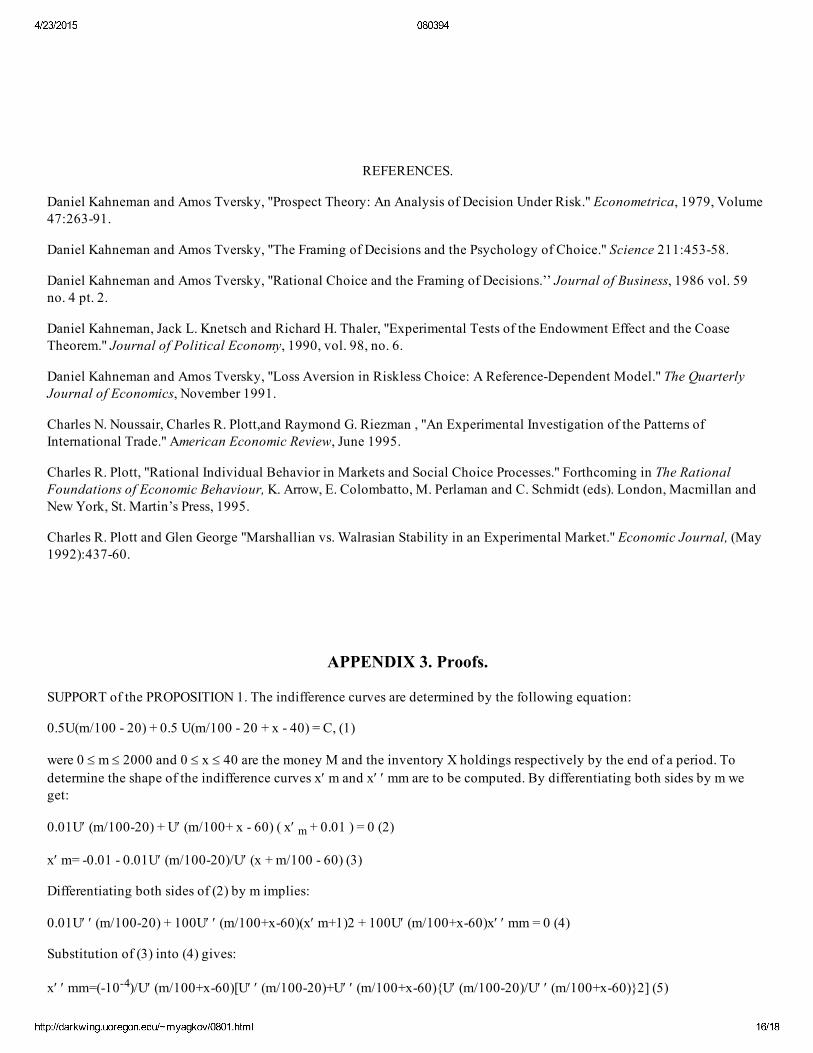
APPENDIX 3. Proofs.
SUPPORT of the PROPOSITION 1. The indifference curves are determined by the following equation:
0.5U(m/100 20) + 0.5 U(m/100 20 + x 40) = C, (1)
were 0 m 2000 and 0 x 40 are the money M and the inventory X holdings respectively by the end of a period. Todetermine the shape of the indifference curves x m and x mm are to be computed. By differentiating both sides by m weget:
0.01U (m/10020) + U (m/100+ x 60) ( x m + 0.01 ) = 0 (2)
x m= 0.01 0.01U (m/10020)/U (x + m/100 60) (3)
Differentiating both sides of (2) by m implies:
0.01U (m/10020) + 100U (m/100+x60)(x m+1)2 + 100U (m/100+x60)x mm = 0 (4)
Substitution of (3) into (4) gives:
x mm=(104)/U (m/100+x60)[U (m/10020)+U (m/100+x60)U (m/10020)/U (m/100+x60)2] (5)

4/23/2015 080394
http://darkwing.uoregon.edu/~myagkov/0801.html 17/18
By substituting into (5) the properties of the derivatives listed in the hypothesis of the proposition the first three conclusionsof the proposition follow immediately. One may also notice that for all types of subjects
U (x=40, m=0)= 0.02 and 0.01 U ( x, m=20) 0.02. (6)
From this the fourth conclusion of the proposition follows.
Proof of the PROPOSITION 3. Figure 4 shows the shape of the total excess demand in this case.
For every i, since all subjects are risk averse, Qi(50)=20>0 and Qi(+ )<0, and D(50)>0 and D(+ )<0.
The continuity of Qi(p) implies the continuity of D(p), which in turn implies that there exists p* such that 50<p*<+ andD(p*)=0.
Proof of the PROPOSITION 4. Figure 5 shows how the total excess demand changes if N (N A) risk neutral subjects areadded to the system. For the risk neutral subjects the excess demand function takes values in the interval from 20 to +20(Qi(50)=[20;20] ). . For the risk averse subjects Qi(50)=20. Thus at price p=50 the total excess demand correspondence isequal to the interval [d1;d2]. That is D(50) = [d1;d2], where d1=20N+20A and d2=20(A+N). If A>N then 0<d1<d2 and theproposition is reduced to the Proposition 3. If A N then d1 0 d2. The proposition is proved , since at the price of 50 thetotal excess demand function has a value of 0 (0 D(50) = [d1;d2]).
Proof of the PROPOSITION 5.. Figure 6 shows the total excess demand function when S,A and N are greater than 0.
Notation:
=p1 ,..., pL set points of discontinuity of D(p) ( pj<50 for any j and L S) in increasing order.
nj is the number of the individuals whose demand is discontinuous at pj
We need to prove that there exist a p* such that D(p*)=0.
Let us note that D( ) < 0.
First, let us determine the total excess demand D(p) at p=50. By definition D(p)= Qi(p). For the risk neutral subjects Qi(50)[20;20]. For the risk averse subjects Qi(50)=20. For the risk seeking subjects Qi(50)=20. Repeating the similar argument inProposition 4, at p=50 D(50) = [d1;d2] where d1= 20(N+S)+20A, d2=20S+20(A+N).
If d2>0 (S<A+N) then for the two possible cases (d1 0 < d2 and 0<d1 d2) the proof is similar to the proofs of the Proposition 3and 4. The equilibrium price is greater than or equal to 50.
If d2=0 (S=A+N) then 50 there exist multiple equilibria. First, notice that 50 is an equilibrium price. Secondly, if the price isabove 50 then supply is always greater than demand. Therefore no equilibria exist. On the other hand if the price falls a littlebelow 50 then demand is still equal to supply. This continues until all risk seeking people are willing to sell. Threfore thereexist an interval [a ; 50] of equilibrium prices, where 0 < a < 50.
Finally, let us consider the case when d2<0 i.e. S>A+N.
The correspondence D(p) is strictly positive at the price equal to 0 (D(0)=20(N+S+A), strictly negative at the price equal to 50(D(50) = [d1;d2] and d2<0 ) and has L points of discontinuity at the interval [0;50]. It will be shown that the set of the valuesof D(p) on the above interval is a set of S+1 consecutive integers from 40K1 to 40KL, where K1=(N+A+S)/2 (positive) and KL=(A+NS)/2 (negative).
Secondly, let us construct D(p)= Qi(p) for p [0,50). For the risk averse and risk neutral subjects Qi(p)=20 if p [0,50). Thus,the only subjects whose excess demand functions have different values in the interval are risk seeking ones. For a riskseeking subject Qi(p)=20 if p<pj, 20 if p>pj, 20 or 20 if p=pj, where pj . This implies that D(p) is constant in any openinterval (pj;pj+1). One may notice that there are L+1 such intervals, since there are L points of discontinuity. Let us denote

4/23/2015 080394
http://darkwing.uoregon.edu/~myagkov/0801.html 18/18
D(p)=40Kj if p (pj1;pj). At p=pj, nj of risk seeking subjects are indifferent between +20 and 20. Thus, the total excessdemand of those nj subjects at the price p equal to pj is the set of nj+1 integers: 20nj, 20nj40, ... , 20nj. Moreover, the totalexcess demand of the same nj subjects is equal to 20nj if p is less than pj and is equal to 20nj if p is greater than pj. The totalexcess demand of everybody else is constant near pj. This implies that D(pj )D(pj+ )=40(Kj+1Kj)=20nj(20)nj=40nj . Thusall Kj can be determined by
induction. Formally:
If p ; pj1,pj , p (pj1;pj) then D(p)=40Kj , j=1 ... L
where Kj is defined as follows:
K1=(A+N+S)/2 [ Positive Integer, since there is an even number of subjects]
Kj+1=Kj nj
If p ; p=pj then D(p)=40Kj , 40(Kj1), ... , 40Kj+1
Thus at the interval [0;50) D(p) has the following values:
40K1, 40(K11) , .... , 40KL, where K1=(A+N+S)/2>0 and KL=K1 nj=K1S=(A+NS)/2 < 0 . This implies that one of the valuesis zero.
The proposition is proved.