COMPETITION)AND)FACILITATION)BETWEEN)SEAGRASSAND ... Final report V2.… ·...
13
COMPETITION AND FACILITATION BETWEEN SEAGRASS AND CALCIFYING ALGAE (HALIMEDA AND PENICILLUS) IN THE CARRIBEAN COASTAL ECOSYSTEM Vera van Berlo, supervised by Rebecca James, Marieke van Katwijk and Tjisse van der Heide ABSTRACT The Caribbean coastal ecosystem could protect shorelines from wave erosion. Key elements are the calcifying algae (Halimeda spp. and Penicillus spp.) that are main producers of carbonate sediment, and are early successional species that help to stabilise the sediment. Calcifying algae occur in mixed communities with seagrasses. Seagrass appears to both facilitate the algae and compete with them. In this experiment, four treatments were established ranging from full density to bare density (full patches of seagrass, thinned patches of seagrass (50%) with calcifying algae, patches with only algae and patches with only algae and seagrass roots), in order to explore how the presence and abundance of seagrass affects the growth and longterm persistence (abundance and recruitment) of these algae. Growth rates were not influenced by seagrass in our field experiments. However, measuring recruitment over time gives evidence that there is a balance between competition and facilitation by seagrasses. On one hand, calcifying algae get outcompeted by a lack of free space; on the other hand a facilitative effect appears that is possibly related to the seagrass providing a shelter for young recruits. An adequate mixed community of seagrass and calcifying algae could provide a climate proof Caribbean coast: seagrass might provide a highpH refuge for calcifying algae, and calcifying algae will help seagrass meadows recover faster from storm disturbance – both protecting the shore from wave erosion. INTRODUCTION The Caribbean marine system is threatened by human population growth, overfishing and pollution. Climatic threats of rising sea levels and temperatures, increased storminess and ocean acidification are further enhancing the dangers the area already faces (Gledhill et al. 2008). These changes will affect the system’s ecosystem structure and functioning, resulting in a loss of marine biodiversity, fisheries and shorelines. Coastal habitats can serve as a climate buffer by attenuating wave height and energy, and thus protecting shorelines from wave erosion. When they cannot keep up with sea level rise, they will become deeper, and disturbance by waves will increase. Calcifying algae are one of the key species in these habitats and are the first colonizers, followed by seagrass (Williams 1990). Previous research has shown that the majority of sediment is from biogenic input, dominated by calcareous green algae (Harney et al. 2003). In the Caribbean, the ability of bays and lagoons to keep up with sealevel rise depends on the presence and activity (sediment accretion) of these carbonate sediments. Calcareous algae also create matrices between corals, which leads to reef accretion and provides a place for nursery and larval settlement (Koch 2013) and they are important contributors to coastal primary production; acting as a carbon sink and providing habitat and a food source for a.o. commercial fish; enhancing biodiversity. In the Caribbean coastal ecosystem, calcifying algae occur closely together with seagrasses in mixed communities, possibly forming a facilitative species interaction. When shallow bays are densely covered by seagrass, the pH of seawater will locally be high during the day due to the removal of CO 2 from the water by photosynthesis. This enhances calcification rates by changing the saturation state of calcium carbonate, which means that locally the negative effects of climate change on calcifying algae could be
Transcript of COMPETITION)AND)FACILITATION)BETWEEN)SEAGRASSAND ... Final report V2.… ·...
COMPETITION AND FACILITATION BETWEEN SEAGRASS AND CALCIFYING ALGAE (HALIMEDA AND PENICILLUS) IN THE CARRIBEAN COASTAL ECOSYSTEM Vera van Berlo, supervised by Rebecca James, Marieke van Katwijk and Tjisse van der Heide ABSTRACT The Caribbean coastal ecosystem could protect shorelines from wave erosion. Key elements are the calcifying algae (Halimeda spp. and Penicillus spp.) that are main producers of carbonate sediment, and are early successional species that help to stabilise the sediment. Calcifying algae occur in mixed communities with seagrasses. Seagrass appears to both facilitate the algae and compete with them. In this experiment, four treatments were established ranging from full density to bare density (full patches of seagrass, thinned patches of seagrass (50%) with calcifying algae, patches with only algae and patches with only algae and seagrass roots), in order to explore how the presence and abundance of seagrass affects the growth and long-‐term persistence (abundance and recruitment) of these algae. Growth rates were not influenced by seagrass in our field experiments. However, measuring recruitment over time gives evidence that there is a balance between competition and facilitation by seagrasses. On one hand, calcifying algae get outcompeted by a lack of free space; on the other hand a facilitative effect appears that is possibly related to the seagrass providing a shelter for young recruits. An adequate mixed community of seagrass and calcifying algae could provide a climate proof Caribbean coast: seagrass might provide a high-‐pH refuge for calcifying algae, and calcifying algae will help seagrass meadows recover faster from storm disturbance – both protecting the shore from wave erosion. INTRODUCTION The Caribbean marine system is threatened by human population growth, overfishing and pollution. Climatic threats of rising sea levels and temperatures, increased storminess and ocean acidification are further enhancing the dangers the area already faces (Gledhill et al. 2008). These changes will affect the system’s ecosystem structure and functioning, resulting in a loss of marine biodiversity, fisheries and shorelines. Coastal habitats can serve as a climate buffer by attenuating wave height and energy, and thus protecting shorelines from wave erosion. When they cannot keep up with sea level rise, they will become deeper, and disturbance by waves will increase. Calcifying algae are one of the key species in these habitats and are the first colonizers, followed by seagrass (Williams 1990). Previous research has shown that the majority of sediment is from biogenic input, dominated by calcareous green algae (Harney et al. 2003). In the Caribbean, the ability of bays and lagoons to keep up with sea-‐level rise depends on the presence and activity (sediment accretion) of these carbonate sediments. Calcareous algae also create matrices between corals, which leads to reef accretion and provides a place for nursery and larval settlement (Koch 2013) and they are important contributors to coastal primary production; acting as a carbon sink and providing habitat and a food source for a.o. commercial fish; enhancing biodiversity. In the Caribbean coastal ecosystem, calcifying algae occur closely together with seagrasses in mixed communities, possibly forming a facilitative species interaction. When shallow bays are densely covered by seagrass, the pH of seawater will locally be high during the day due to the removal of CO2 from the water by photosynthesis. This enhances calcification rates by changing the saturation state of calcium carbonate, which means that locally the negative effects of climate change on calcifying algae could be

ameliorated (Semesi et al. 2009a, Unsworth et al. 2012). A study of Koch et al. (2013) shows that the photosynthetic uptake of dissolved inorganic carbon (DIC) leads to increased CO3
2-‐ levels and an increased pH (0.5-‐0.7 units), creating an environment more advantageous for calcification. Furthermore, seagrass protect other organisms, including calcifying algae, from storms, trap mineral sediment and provide a refuge for young (algal) recruits by reducing hydrodynamic energy (Harney & Fletcher 2003). It can stabilize calcareous sediments and prevent erosion. However, under optimal conditions the seagrasses are likely to compete with rhizophytic calcifying algae that grow within seagrass meadows (Barry et al. 2013, Davis & Fourqurean, 2001) for light, space and nutrients. To determine whether this species interaction will affect the response of calcifying algae to climate change, we have conducted manipulative field experiments. The emphasis in this lies on the density of seagrass meadows and the different effects on Halimeda and Penicillus – which are both main calcifying algal species in the Caribbean area (APPENDIX 1). The main goal of this study was to determine how competition and facilitation between calcifying algae and seagrass affect the growth of algae. For this, the physiological response (growth and calcification rates) and (2) the long-‐term persistence (abundance and recruitment) of Halimeda and Penicillus in different seagrass densities were quantified in relationship to abiotic factors. This resulted in more insight in the climate buffering role of calcifying algae protecting the Caribbean shorelines. MATERIALS AND METHODS Experimental design In order to test how algae growth and recruitment are influenced by different seagrass densities (Thalassia testudinum – eelgrass and Syringodium filiforme – manatee grass) in the Caribbean coastal system, the seagrass density in naturally existing seagrass beds was changed by clipping shoots at sediment level. In total, four treatments were established ranging from full density to bare density (full patches of seagrass (control), thinned patches of seagrass (50%) with calcifying algae, patches with only algae (control) and patches with only algae and seagrass roots). For each experimental treatment, five plots of 150 x 150 cm were created; the borders were marked with pins on each corner and fenced off with string, and were equipped with material to protect it from boats/kayaks. Size of the plots was selected due to results of a pilot study of Meyers (2010) that indicated increases in canopy flow speeds due to reductions in seagrass shoot density could be detected within patches of at least 1 m x 1 m, as well as because of the time-‐consuming business of maintaining the adjusted seagrass cover when the plot size would become bigger. The treatments were assigned randomly to the plots and all of them were placed ≥2 m from the edge of the seagrass bed and ≥ 1 m from each other. Thinning was applied as it provided a robust way of researching the impact of seagrass densities; when seagrass plots are selected based already on the density, the environmental settings may not be similar. For the full density treatment no shoots were removed, half of the shoots were removed for the 50% treatment (by cutting every other shoot) and all of the shoots were removed from the patches of the bare treatment by cutting below the meristem. The already unvegetated patches were used for the treatment without any seagrass roots, as taking all roots out would have disturbed the sediment too much. The thinning procedure was repeated every week, also giving the opportunity to clean and check the instruments at the same time. Patches with no shoot removal were likewise disturbed by simulating blade removal. Every plot was divided into 5 subplots of 30 x 30 cm (20 cm from the edge of the plot and one in the middle, see APPENDIX 2), in which several measurements were taken (that are described below).

The calcifying algae of interest were Halimeda spp. and Penicillus spp. In order to start off the experiment with plots that are as comparable as possible, we have adjusted the algae density so that all plots contained 8-‐12 Halimeda spp. and 2 Penicillus spp. per 30 x 30 cm. CPCe 4.1 (CoralPointCount) was used to analyse the composition of the plots and the actual seagrass cover by assigning 50 simple random points in a photo of a 30 x 30 cm quadrat placed randomly within the plot. The seagrass cover is respectively 97.2 ± 2.5, 51.9 ± 7.4, 0.4 ± 0.8 and 0.0 ± 0.0 %; the seagrass biomass is respectively 219 ± 49, 103 ± 16, 0 ± 0.0 and 0.0 ± 0.0 g m-‐1 for the four treatments. We waited for eight days for the plots to recover before taking any measurements. The whole experiment was conducted between October 27th, 2015 and January 30th, 2016 at the bay between Cul de Sac and Petite Clef island located at the North-‐East coast of French Saint Martin (N 18 6 10.2, W 63 1 14.6) (FIGURE 1). The site could be described as semi-‐sheltered with moderate touristic activity (boats, kayaks, snorkelers). The seagrass beds were characterized by mixed T. testudinum and S. filiforme beds in ~100 cm water depth that experienced at daily tidal range of ~10-‐20 cm. The average shoot length before starting the experiment was ~18 cm.
FIGURE 1. Maps with location of the research site. A shows the island
of Saint Martin with Cul-‐de-‐Sac located at
the North-‐East coast of the island (bordered in red). B shows the area
of Cul-‐de-‐Sac, Pinel island and Petite Chef. C shows the locations of
the plots in between the dock and Petite Chef.
The plots are marked in red.
A
C
B

Recruitment and growth The amount of Halimeda spp. and Penicillus spp. (and possibly other calcifying algae) in the middle of each subplot (15 x 15 cm) was counted at the beginning of the experiment in order to monitor recruitment. These measurements were re-‐taken on a two-‐weekly basis. The results were expressed in net loss or increase, so that the change in algal abundance (sum algae/# occupied quadrants) and total algal biomass could be determined in time. The algae shoots in the recruitment plots were used for determining size class abundance and average dry weight at the end of the experiment. All algae were removed from the center subplot, dried to a constant weight in a 60°C drying oven. After which the Halimeda spp. shoots were classified as small (<10 segments), medium (10-‐50 segments) or big (>50 segments), and the dry material was weighed to determine dry-‐weight biomass per individual (for Penicillus) and # segments (for Halimeda spp.) Similar sized individuals of H. incrassata (three finger leaf alga) and P. capitatus (shaving brush alga) were selected and transplanted into the plots to measure growth rates (thalli of 6 – 10 cm). All algae were collected from the same position in Cul-‐de-‐Sac bay, and were cleaned of all visible epiphytes and labelled. One of each species was replanted in each subplot and secured to the sediment with a metal pin and string. Before replanting photos were taken of H. incrassata, and with ImageJ, the number of segments was counted and root length was determined. After five weeks, the relative net growth (# segments after/# segments before * 100), the percentage of new segments, the percentage of lost segments and the relative net root growth (length after/length before * 100) was determined. The relative growth rates of P. capitatus were assessed by measuring root, stalk and brush length before and after the experiment. Every week, these algae were checked for their presence and replaced if necessary. The CaCO3-‐content of the algae was determined by placing the segments in 10 HCl for 1 hour, after which they were put in fresh water for several hours to remove the acid. After rinsing they were placed in a drying oven at 60°C until a constant weight was reached, placed in a desiccator and reweighed. The calcified content was calculated by deriving the difference of the dry-‐weight of the calcified and the somatic samples. After discovering the calcifying algae were not tolerant to being replanted, another growth experiment was conducted. In every plot one (6 – 10 cm tall) individual of H. monile was dyed with a 1% alizarin red stain. 5 ml of the dye solution was injected in a 1 L plastic bag that covered the algae and was anchored to the sediment with pins. After 24h the bags were removed and 17 days later the algae were removed, bleached, and the percentage net growth rates were determined by counting the number of dyed and the undyed segments. Abiotic factors In both a vegetated and an unvegetated area, two water samples (one 50 ml and one 10 ml) were taken 2 cm from the bottom on a monthly basis. The DIC (10 ml) samples were poisoned with 10 μl HgCL2 and run through an Apollo SciTech DIC analyzer that comprises an acidification and purging unit in combination with a LICOR-‐7000 infrared detector. DIC concentrations are calculated with Dickson’s reference samples. The 50 ml samples were poisoned with 20 μl HgCL2, after which total alkalinity was determined using the Metrohm alkalinity titrator. With CO2SYS (Pierrot et al. 2006), the concentrations of other chemical seawater inorganic carbon system parameters were calculated and can be found in TABLE 1. On January 21st, 2016, another 10 ml nutrient sample was collected the same way, was filtered and stored in a freezer until being analysed with the nutrient analyser (TRAACS) for ammonium nitrite/nitrate, phosphate and silicate, of which the results are shown in TABLE 2.

TABLE 1. Measured and calculated physical and chemical seawater inorganic carbon system parameters in unvegetated (U) and vegetated (V) areas measured at a pressure of 0.8 dbar. Salinity (S in PSU), temperature (T in ⁰C), total alkalinity (TA in mmol kg -‐1SW) and pH were measured. These parameters were used to calculate the seawater carbon chemistry with the program CO2SYS (Pierrot et al. 2006) with the use of K1, K2 constants from Merbach et al. (1973) refit by Dickson and Millero (1987). Total CO2 (TCO2), HCO3
-‐, CO32-‐ and CO2 in mmol kg -‐1SW,
partial pressure of CO2 (pCO2) in ppmv, pH in NBS scale (mol kg-‐1 SW). Ω = CaCO3 saturation state of the seawater; aragonite (arag) and calcite (cal). S T TA TCO2 pH pCO2 HCO3
-‐ CO32-‐ CO2 ΩCal ΩArag
V 35.4 28.5 2394 1871 8.28 197 1506 360 5.1 8.7 5.8 UV 35.4 28.5 2375 1869 8.26 207 1515 348 5.4 8.4 5.6 TABLE 2. Measured nutrient levels in µmol L-‐1 in unvegetated (U) and vegetated (V) areas. Date Area NH4 NO2 NO3 NOX PO4
11-23-15 V 16.97 ± 11.42 0.02 ± 0 0.19 ± 0.11 0.21 + 0.11 0.16 ± 0.13
U 8.92 ± 1.80 0.005 ± 0.007 0.10 ± 0.10 0.11 ± 0.11 0.07 ± 0.04
1-15-16 V 8.40 ± 3.34 0.02 ± 0.01 0.53 ± 0.11 0.55 ± 0.13 0.06 ± 0.02
U 8.01 ± 6.07 0.03 ± 0.01 0.49 ± 0.49 0.51 ± 0.02 0.04 ± 0.01 Every two weeks – at dawn and midday – pH and salinity measurements were taken in each plot within the seagrass canopy using an Orion pH meter and electrode and conductivity meter in order to obtain the maximum diel pH changes. Within the middle of each treatment, automatic HOBO temperature-‐ and light loggers were secured to the sediment with metal pins within the canopy and moved weekly between the treatment’s five plots. Data was downloaded every week and Hoboware was used to display the results. The daily light maximum and average and the daily maximum, minimum and average temperature were used for the analysis. To provide quantitative measures of erosion and/or sedimentation in the seagrass habitats, erosion pins made of steel pins, were placed in the center of each subplot at a known depth. The depth of the pins was retrieved monthly and converted to the sediment change in mm per day. Plaster blocks of 4 x 3 x 2 cm were created for measuring mass transfer rates on a monthly basis in each subplot. One part of tap water is mixed with two parts of gypsum putting them – after shaking the bubbles out for 1.5 minutes and together with a metal pin – in a mould. They are dried to a constant weight and deployed onto the erosion pins 10 cm above the ground, perpendicular to the water motion for 24 hours. Once retrieved, the blocks are dried and re-‐weighed, and the decrease in weight per day is determined, giving a measure of the movement of solutes through the water column. Data analysis Differences in recruitment, growth, size classes, biomass, CaCO3, nutrients, DIC, alkalinity, salinity, pH, light, temperature, erosion and mass transfer between treatments (and, if relevant, dates) were tested by using ANOVA, when assumptions of normality and equality of variances were met. If it showed a significant difference, pairwise comparisons were applied. Each plot was treated as a replicate, and within these replicates, the five subplot samples per experiment were averaged for analysis. The middle plot (see APPENDIX 2) was used separately for all analysis as well, because it was expected to be influenced the most by its treatment because of its position.

RESULTS Recruitment Before applying the treatments, the amount of algae within each 15x15 cm plot was similar (ranging from 3.48 – 4.16, see FIGURE 2). After 3 weeks, an increase in algae is shown in the 0% roots treatment (6.12), mainly caused by an increase of Halimeda spp. and to a lesser amount by Penicillus spp. This significant net increase continues over time: after 3 months the plots with this treatment contain about 2.5 times as many algae. A less gradual change over time is shown in the 50% treatment. The first two months the amount of algae is stable, whereas the numbers go from approximately 4 to more than 10 within the last month. The amount of algae within the 100% treatment increases just slightly over time (with a maximum of 4.80), just as the 0% no roots treatment (with a maximum of 6.00). A two-‐way ANOVA of the total recruits shows a P-‐value of 4.25 * 10-‐20 for different dates and 1.73 * 10-‐5 for different treatments (see APPENDIX 3, TABLE 4, 5 and 6). The highest average number of Halimeda individuals enumerated was 10.4 at the 29th of January in the 50% treatment. With an average of 2.0 at the same date in the 0% roots plots, the highest amount of Penicillus spp. was reached. Udotea spp. seems to disappear after December. As Penicillus spp. and Udotea spp. were not normally distributed, ANOVA could not be executed.
FIGURE 2. Mean number of Halimeda spp. (green), Penicillus spp. (blue) and Udotea spp. (yellow) individuals in subplots with different treatments (100%, 50%, 0% seagrass cover with or without roots) of 15x15 cm measured at different dates.
0
2
4
6
8
10
12
100%
50%
0% ro
ots
0% no roots
100%
50%
0% ro
ots
0% no roots
100%
50%
0% ro
ots
0% no roots
100%
50%
0% ro
ots
0% no roots
100%
50%
0% ro
ots
0% no roots
100%
50%
0% ro
ots
0% no roots
10-‐29-‐15 11-‐19-‐15 12-‐17-‐15 12-‐29-‐15 1-‐16-‐16 1-‐29-‐16
Mean am
ount of algae per 15x15 cm
Date and treatment
Halimeda spp. Penicillus spp. Udotea spp.

When H. incrassata is divided into three size classes (FIGURE 3), it can be seen that only one individual with more than 50 segments is found in the 50% treatment. The 100% plots did not comprise any H. incrassata. With averages of 0.8 (SE = 1.3), the 0% roots subplots contained small (< 10) and medium (10 – 50 segments) and 0.2 (SE = 0.45) big (< 50) thalli, compared to 0.6 small and 0.4 medium and big thalli (all sizes SE = 0.89) in the 0% no roots treatment. H. monile is more abundant (4.2 ± 4.4, 10.2 ± 8.1, 6.0 ± 3.8 and 3.6 ± 4.6 respectively for all treatments), showing overall a high proportion of medium sized individuals (2.4 ± 3.0, 6.2 ± 6.2, 3.4 ± 2.7 and 1.4 ± 2.2). The increase in recruitment within the 0% roots treatment is gradual, which is supported by FIGURE 3 that presents a relatively big share of the Halimeda spp. to be medium sized or big. No significant differences were found within different treatments or size classes.
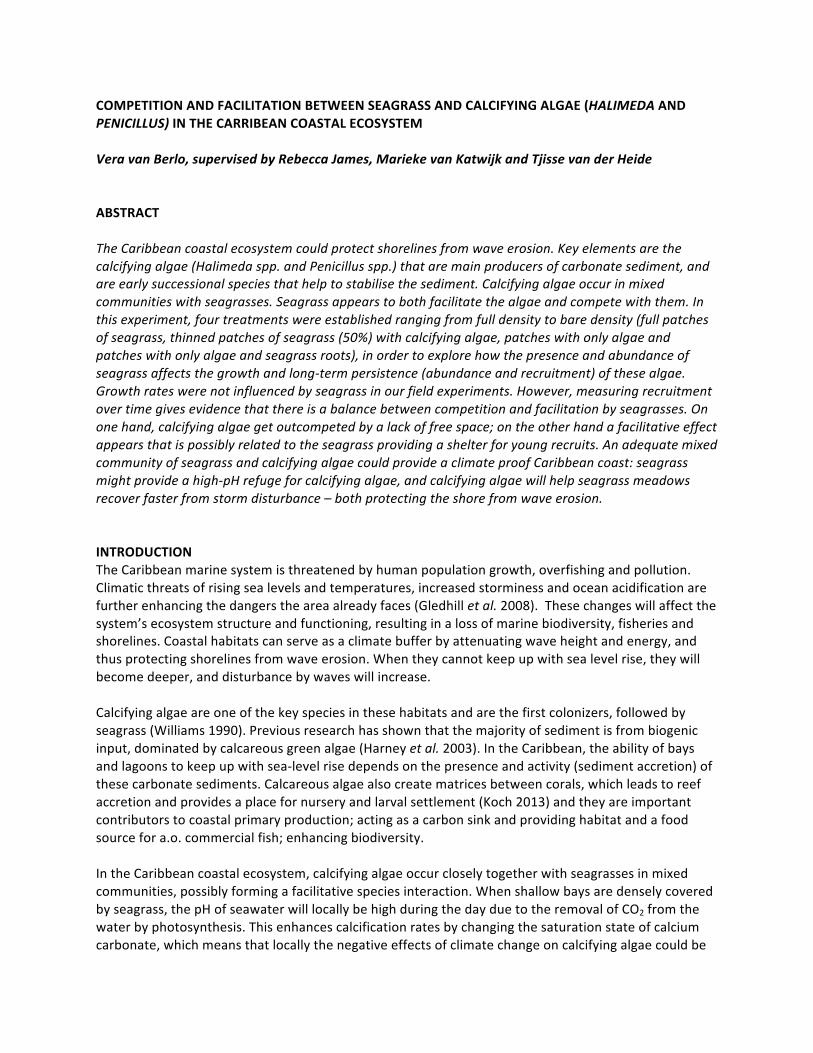
FIGURE 3. Mean amount of three types of size classes (<10 segments, green; 10-‐50 segments, blue; >50 segments – yellow) H. incrassata and H. monile. In subplots with different treatments (100%, 50%, 0% seagrass cover with or without roots) of 15x15 cm measured at 1-‐29-‐16. In FIGURE 4 is shown that the final biomass of seagrass in the 100% treatment is 4.93 ± 1.10 g dw-‐1 per 15x15 cm (219 ± 49 g dw-‐1m-‐1) and in the 50% treatment 2.32 ± 0.36 g per 15x15 cm (103 ± 16 g dw-‐1m-‐1) (APENDIX 3, TABLE 7 AND 8). The recruitment plots contained a small mass of H. incrassata (respectively 0.00 for 100%, 0.17 for 50%, 0.54 for 0% roots and 0.35 g dw-‐1 for 0% no roots) and Penicillus spp. (0.06, 0.06, 0.55 and 0.24 g dw-‐1per 15x15 cm) and a big mass of H. monile (3.35, 10.32, 2.06 and 4.06 g dw-‐1), showing a non-‐significant difference between the treatments. Udotea was only present in the 0% no roots treatment (one individual that weighted 0.17 g). The total amount of biomass was 8.44, 12.96, 5.44 and 5.17 g dw-‐1for respectively the 100%, 50%, 0% roots and 0% no roots recruitment plots, for which the difference was non-‐significant. Combining the data in FIGURE 3 and 4, the dry weight per individual algae (per size class) can be calculated (see APPENDIX 3, TABLE 9). TABLE 10 on the same page demonstrates non-‐significant differences between treatments. The heaviness of the algae in the 0% no roots treatment was caused by the presence of three very big algae. Although FIGURE 4 indicates that the total biomass production in
0
2
4
6
8
10
12
100% 50% 0% roots 0% no roots
100% 50% 0% roots 0% no roots
H. incrassata H. monile
Mean am
ount of H
alim
eda pe
r 15x15 cm
Species and treatment
<10 segments 10-‐50 segments >50 segments

the 50% treatment is 1.5 times higher than in the 100% treatment, and about 3-‐4 times higher in the 0% treatments, no significant differences were found. Even though the seagrass cover was more than twice as high, the dry-‐weight of the 50% treatment is mainly determined by the amount of H. monile, which has a higher specific weight.
FIGURE 4. Mean biomass (g dw-‐1) in subplots of 15x15 cm measured at 1-‐29-‐16 for different treatments (100%, 50%, 0% seagrass cover with or without roots). The species are subdivided into three size groups (small, <10 segments; medium, 10-‐50 segments; big, >50 segments). H. incrassata is displayed in light green, H. monile in dark green, Penicillus spp. in blue, Udotea spp. in yellow and seagrass species in grey. Growth During a five week period, the daily percentage number of new Halimeda segments produced ranged from 0.00 to 3.63 %. On average, individual algae grew 0.78 % new segments per day. Between 0.00 and 5.98 % segments were lost per individual per day, with an average loss of 0.98 %. Comparing the daily percent net growth (new growth minus loss of tissue from storm activity, grazing, etc.), lost segments or new segments showed no significant differences between treatments (see APPENDIX 3, FIGURE 8 and TABLE 11). A weak positive correlation (R = 0.397) was found between the size before treatment and the number of new segments, indicating that plant size was not a very strong predictor of growth. Three of the treatments (50%, 0% roots, 0% no roots) show an average decrease of root length, although this differs not significantly from the slight growth of root length seen in the 100% treatment or amongst each other (APPENDIX 3, FIGURE 9). The alizarin staining experiment results can be found in APPENDIX 3, FIGURE 10. It shows that after 17 days, Halimeda monile has grown between 2 and 84 new segments. This results in a % growth of 2.35-‐54.55%. As the data was not normally distributed, an ANOVA could not be performed. When the standard deviation and the mean amount of old and new segments and the % new segments were compared within treatments, no differences were found. The graph seems to display a bigger range in
0
1
2
3
4
5
6
7
100% 50% 0% roots 0% no roots
Mean biom
ass g
per 15x15 cm
Treatment
H. incrassata (<10 segments) H. incrassata (10-‐50 segments) H. incrassata (>50 segments)
H. monile (<10 segments) H. monile (10-‐50 segments) H. monile (>50 segments)
Penicillus spp. Udotea spp. Seagrass

the amount of new segments grown in the 0% roots treatment. A weak positive correlation (R = 0.370) was found between the number of old and new segments, which indicates that tissue loss does not affect tissue growth strongly. APPENDIX 3, FIGURE 11 shows a slight daily root growth per day for Penicillus spp. The length of the stalk stayed the same during the five week period in which the experiment took place and the brush length seems to have decreased. The data is not normally distributed (neither after transformation), so no ANOVA could be executed. However, when looking at the means and standard deviations, no differences were shown in the growth of individuals’ roots, stalk and brush between treatments. The percentage of CaCO3 per dry weight of Halimeda incrassata. Individuals varies between 82 – 84%, which is higher than the part of Penicillus capitatus that is calcified (61 – 71%) (APPENDIX 3, FIGURE 12). The percentage is significantly higher for H. incrassata in the 100% treatment compared to the 0% roots treatment (P = 0.025; see APPENDIX 3, TABLE 12 and 13). The amount of CaCO3 in P. capitatus significantly differs in all treatments; an increasing percentage is shown when comparing 0% roots, 0% no roots, 50% and 100% (from high to low), with a trend between 0% roots and 0% no roots. Abiotic factors In the pH graph (APPENDIX 3, FIGURE 13), a clear increase in pH during the day is displayed, as in all measurements, the pH at 6:00 AM is lower (varying between 7.95 – 8.14) than at 12:00 AM (8.18 – 8.28). In the beginning of the experiments, the morning pH was higher and the afternoon pH lower, indicating less photosynthetic and respirational activity. There is no significant difference between treatments. However, dates mutually differ significantly from each other (APPENDIX 3, TABLE 14 AND 15). The salinity of the site is between 35.2 – 35.8 (see APPENDIX 3, FIGURE 14), with a difference of ~0.15 between (lower) morning and (higher) midday measurements. Significant differences are found in both timeslots. Salinity levels at 12.00h are significantly higher (P = 0.019) in the 0% no roots than in the 0% roots treatment and a trend is found between 100% and 0% no roots (P = 0.078). The daytime salinity is significant higher at October 5th and December 3rd, and significantly lower at 11-‐5-‐2015 and 3, significantly lower at January 8th (APPENDIX 3, TABLE 16, 17 and 18). During the experiment, both the average, minimum and maximum temperature dropped (APPENDIX 3, FIGURE 15). This might cause a drop in photosynthesis as well, as shown in the pH graph. The slightly higher temperature in the 0% roots treatment and could point to the temperature buffering effect of seagrass. There are significant difference between the maximum per treatment, showing a slightly higher temperature for the 0% roots treatment and lower numbers for the 100% and 50% treatment (a trend is found comparing the (higher) 0% roots maximum temperature and the (lower) 0% no roots maximum. The average and minimum temperature do not show any significant differences (APPENDIX 3, TABLE 19, 20 and 21). The daily average light intensity at the bed level varies between 4300-‐6100 lux (APPENDIX 3, FIGURE 16). There is a big difference between cloudy (10000 lux) and sunny (50000 lux) days. Maximum light intensity is significantly higher in the 0% roots treatment compared to the 0% no roots treatment, and a trend shows a higher intensity for the 0% roots compared to the 50% treatment (APPENDIX 3, TABLE 22). The average intensity is higher in the 0% roots plots compared to the 100% and 0% no roots plots.
The majority of the plots have sedimentation or no net change, ranging to a maximum of 67 mm (APPENDIX 3, FIGURE 17). The 0% roots treatment shows significantly less sedimentation than the other treatments (APPENDIX 3, TABLE 23 and 24). There is a trend between the 50% plots and the 100% and 0% no roots plots, indicating that these 50% plots have a lower amount of sedimentation (0.20 ± 0.15) compared to 100% (0.34 ± 0.36) and 0% no roots (0.34 ± 0.40) plots. Dissolution rates vary between 50-‐60% (APPENDIX 3, FIGURE 18). This corresponds with an absolute loss of 3.83g Ca (which makes up 23.28% of the blocks). Rates differ in time: the first measurement, taken at November 16th, shows significantly lower numbers than the measurements taken in December. The 0% no roots blocks decreases more than the other treatments (53.5% compared to 57.2% (100%), 57.5% (50%) and 58.9% (0% roots) APPENDIX 3, TABLE 25, 26 and 27). DISCUSSION AND CONCLUSION Recruitment was influenced by seagrass density, as could be seen in our manipulated plots: a gradual increase in the amount of algae took place within the 0% roots treatment and a less gradual increase was shown in the 50% treatment for the last month of the three-‐month experimental period. The amount of algae within the control treatments increases just slightly over time. This implies that a change in the amount of algae is not only dependent on seasonal changes, but does relate to the density of the seagrass cover. These results indicate that the seagrass is limiting the recruitment of the calcifying algae and a competitive relationship exists between calcifying algae and seagrass, which might be the result of reaching a population limit related to the amount of resources available (Biber et al. 2004). Yet, as the 0% no roots treatment didn’t show an increase in algae, the seagrass at the same time is beneficial to the algae. The gradual increase of Halimeda spp. in the 0% roots plots was represented in the relatively big share of medium sized and large algae. A big portion of small algae was expected to be found in the 50% treatment based on the sudden invasion during the last month, however, this was not the case. This is most probably caused by the fact that only one subplot per plot was used to determine biomass. Another explanation relates to sedimentation that took place, so that the younger recruits were covered in sediment and it were not observed in earlier measurements. Halimeda spp. seems to benefit more from lower seagrass densities, which is in line with previous research that shows that Halimeda is much more storm resistant and thus would have a lower dependence on the facilitation of seagrass than Penicillus, which is easily uprooted and poorly tolerant to sediment burial (Cruz Palacios & van Tussenbroek 2005). Our research also shows that individuals of Halimeda spp. contain a bigger share of CaCO3 than Penicillus spp. individuals, which could make Halimeda both more susceptible to a changing climate (more vulnerable to higher pH levels) and less susceptible (through its calcification is firmer and therefore less sensitive to storms), although this is not extensively researched yet. There are indications that Penicillus spp. grow in plots with higher density of seagrass. Because of its morphology this species can be benefited more by seagrass (as suggested by Cruz Palacios & van Tussenbroek 2005) although this result is – due to the small amount of replicates – not very reliable. Udotea spp. seems to disappear after December, which can possibly be explained by seasonal changes in abiotic factors, reproductive activity and/or abundance of herbivorous fishes. The balance between competition and facilitation, measured here as the impact of the presence and abundance of seagrass affecting growth and long-‐term persistence (abundance and recruitment) of

calcifying algae (Halimeda spp. and Pencillus spp.), displayed no significant difference in growth rates. None of our three growth experiments (the five week H. incrassata and Penicillus spp. experiments and the experiment on H. monile with alizarin red) showed any differences caused by the treatments. The five week experiment gives an indication of H. incrassata and Penicillus spp. growth rates in stress – after transplantation, which possibly explains the net decrease of amount of segments. As transplantation is not necessary for the alizarin-‐red dying method with H. monile, it gives more reliable results of growth rates in the field. As no difference is shown between treatments in this specific experiment, it indicates that growth rates are not particularly impacted by surrounding seagrass, indicating that the algae are not limited in nutrients, light and space when looking at growth it itself. However, this result could also relate to our experimental design. Except for limitations in plot size and the amount of replicates – which will be discussed more extensively later on – another restriction of our experiment was the fact that we did not measure grazing. It might be that the amount of grazing is influenced by seagrass density, which could cancel out possible differences in treatments. It is therefore highly recommended to conduct further field experiments using anti-‐grazer barriers. We found no clear evidence in any of the abiotic measurements that explained a difference in recruitment. A slightly higher maximum temperature combined with a higher average and maximum light intensity and less sedimentation in the 0% roots plots could have influenced the amount of recruits, but as none of this data also supports the increase of recruits in the 50% plots this is not likely. Therefore, the increase of recruitment with seagrass thinning was most likely due to an increase of free space. This could be provoked by the opening up of the canopy which stimulates algae recruits to grow (McCoy 2015). However, there appears to be a facilitative effect too. We did not find any directions that could imply a change in sediment stabilization (erosion/sedimentation measurements) or attenuation of hydrodynamical forcing (mass transfer rates/calcium dissolution). However, the seagrass can provide a refuge for young recruits, which might allow the early sexual stage of the algae (the gametophytes) to have a better chance of settlement and development (although this statement needs proof). It would be of great interest to explore this possibility in more detail in further research. Other explanations for the absence of significant abiotic factor results that clearly indicate what causes the difference in recruitment might relate to the research setup. It is very likely that the plots are still being influenced by the surrounding canopy, as they are limited in size. For further research it is therefore highly recommended to increase the size of the plots, based on preliminary measurements of pH, temperature, light and mass transfer. Also, it was hard to compare the two bare plots. The 0% no roots treatment was very different: the (unstable) sediment layer was thicker, there was greater bed shear stress and the plots were deeper (± 150 cm compared to ± 80 cm), making it advisable to repeat similar experiments with a treatment in which the roots are manually removed. Additional recommendations for further research include: 1) looking at different seagrass densities to investigate if there is a tipping point for competition that neutralizes facilitation, 2) explore if this interaction differs in different wave regimes (for different algae), 3) performing a longer experiment to investigate the fate of the new recruits, 4) repeat these measurements with more replicates. It is crucial to have a more detailed understanding of the impact of climate change on the Caribbean coastal ecosystem, concerning the projected sea level rise and increase in storm frequency and severity. Know-‐how of the relationship of key species in this system (seagrasses and calcyfing algae) is essential for assessing impacts. Our research shows that in the future, seagrass might provide a high-‐pH refuge for calcifying algae, and calcifying algae will help seagrass meadows recover faster from storm

disturbance by being the first successors and stabilizing the sediment allowing for seagrass to move in – allowing for a climate proof ecosystem. LITERATURE Barry, Savanna C., Thomas K. Frazer, and Charles A. Jacoby. "Production and carbonate dynamics of Halimeda incrassata (Ellis) Lamouroux altered by Thalassia testudinum Banks and Soland ex König." Journal of Experimental Marine Biology and Ecology 444 (2013): 73-‐80. Biber, P.D., M.A. Harwell and W.P Cropper Jr. “Modeling the dynamics of three functional groups of macroalgae in tropical seagrass habitats.” Ecological Modelling 175 (2004) 25–54. Cornwall, Christopher E., et al. "Concentration boundary layers around complex assemblages of macroalgae: Implications for the effects of ocean acidification on understory coralline algae." Limnology and Oceanography 58.1 (2013): 121-‐130. Cornwall, Christopher E., et al. "Diffusion boundary layers ameliorate the negative effects of ocean acidification on the temperate coralline macroalga Arthrocardia corymbosa." (2014): e97235. Cruz-‐Palacios, Vania, and Brigitta I. Van Tussenbroek. "Simulation of hurricane-‐like disturbances on a Caribbean seagrass bed." Journal of Experimental Marine Biology and Ecology 324.1 (2005): 44-‐60. Davis, Braxton C., and James W. Fourqurean. "Competition between the tropical alga, Halimeda incrassata, and the seagrass, Thalassia testudinum."Aquatic Botany 71.3 (2001): 217-‐232. Dickson, A.G., and F.J. Millero. A comparison of the equilibrium constants for the dissociation of carbonic acid in seawater media, Deep-‐Sea Res., 34, 1733-‐1743, 1987. Enríquez, Susana, and Nadine Schubert. "Direct contribution of the seagrass Thalassia testudinum to lime mud production." Nature communications 5 (2014). Gledhill, Dwight K., et al. "Ocean acidification of the greater Caribbean region 1996–2006." Journal of Geophysical Research: Oceans (1978–2012) 113.C10 (2008). Harney, J. N., and C. H. Fletcher III. "A budget of carbonate framework and sediment production, Kailua Bay, Oahu, Hawaii." Journal of Sedimentary Research 73.6 (2003): 856-‐868. Hendriks, I. E., Olsen, Y. S., Ramajo, L., Basso, L., Steckbauer, A., Moore, T. S., Howard, J., and Duarte, C. M.: Photosynthetic activity buffers ocean acidification in seagrass meadows, Biogeosciences, 11, 333–346, doi:10.5194/bg-‐11-‐333-‐2014, 2014. IUCN. IUCN Red List. Retrieved September 3rd 2015 from http://www.iucnredlist.org/. Koch, Marguerite, et al. "Climate change and ocean acidification effects on seagrasses and marine macroalgae." Global Change Biology 19.1 (2013): 103-‐132. Mazarrasa, Inés, et al. "Seagrass meadows as a globally significant carbonate reservoir." Biogeosciences Discussions 12.5 (2015): 4107-‐4138. McCoy, S.J. and N.A. Kamenos. “Coralline algae (Rhodophyta) in a changing world: integrating ecological, physiological and geochemical responses to global change.” J. Phycol. 51, 6–24 (2015). DOI: 10.1111/jpy.12262.

Mehrbach, C., C.H. Culberson, J.E. Hawley, and R.M. Pytkowicz. Measurement of the apparent dissocieation constants of carboinic acid in sweater at atmospheric pressure, Limnol. Oceanogr., 18, 897-‐907, 1973. Meyers, A.C., "Depositional dynamics in seagrass systems of Tampa Bay, FL: Influence of hydrodynamic regime and vegetation density on ecosystem function" (2010). Graduate Theses and Dissertations. http://scholarcommons.usf.edu/etd/1714. Nature foundation St. Maarten. “Response Plan for the Effects of Climate. Change on the Marine and Coastal Zones of St. Maarten”. N.D. Pierrot, D. E. Lewis,and D. W. R. Wallace. 2006. MS Excel Program Developed for CO2 System Calculations. ORNL/CDIAC-‐105a. Carbon Dioxide Information Analysis Center, Oak Ridge National Laboratory, U.S. Department of Energy, Oak Ridge, Tennessee. doi: 10.3334/CDIAC/otg.CO2SYS_XLS_CDIAC105a. Semesi, I. Sware, Sven Beer, and Mats Björk. "Seagrass photosynthesis controls rates of calcification and photosynthesis of calcareous macroalgae in a tropical seagrass meadow." Mar. Ecol. Prog. Ser 382.4 (2009a). Semesi, I. Sware, Juma Kangwe, and Mats Björk. "Alterations in seawater pH and CO 2 affect calcification and photosynthesis in the tropical coralline alga, Hydrolithon sp.(Rhodophyta)." Estuarine, Coastal and Shelf Science 84.3 (2009b): 337-‐341. Van Tussenbroek, Brigitta I., and Jent Kornelis Van Dijk. "Spatial and temporal variability in biomass and production of psammophytic Halimeda (bryopsidales, chlorophyte) in a Caribean reef lagoon.” Journal of Phycology43.1 (2007): 69-‐77. Short, Frederick T., and Robert G. Coles, eds. Global seagrass research methods. Vol. 33. Elsevier, 2001. Unsworth, Richard KF, et al. "Tropical seagrass meadows modify seawater carbon chemistry: implications for coral reefs impacted by ocean acidification."Environmental Research Letters 7.2 (2012): 024026. Williams, S.L. 1990. Experimental Studies of Caribbean Seagrass Bed Development. Ecological Monographs, Vol. 60, No. 4 (Dec., 1990), pp. 449-‐469.