Competition and Innovation in Developing Countries
30
“Competition and Innovation in Developing Countries” TESIS PARA OPTAR AL GRADO DE MAGÍSTER EN ANÁLISIS ECONÓMICO Alumno: Rolando Campusano Gárate Profesor Guía: Roberto Alvarez Espinoza Santiago, diciembre de 2012
Transcript of Competition and Innovation in Developing Countries

“Competition and Innovation in Developing Countries”
TESIS PARA OPTAR AL GRADO DE
MAGÍSTER EN ANÁLISIS ECONÓMICO
Alumno: Rolando Campusano Gárate
Profesor Guía: Roberto Alvarez Espinoza
Santiago, diciembre de 2012

2
Competition and Innovation in Developing Countries1
Rolando Campusano2
Universidad de Chile
Abstract
Using the Climate Investment Survey from the World Bank, we find a negative
relationship between competition and innovation in developing countries. This
result supports the idea of Schumpeter (1942) that competition can harm
innovation. We deal with endogeneity issues using as instrument the interaction
between industry turnover and entry regulation in the U.S. The basic idea is that
entry regulations have a more pronounced and negative effect on competition in
those industries with more natural entry. For this, we find that relevant
competition is at the country-level rather than at country-industry level. Finally,
we find no evidence of heterogeneity on this relationship across firms and
industries.
JEL CODES: O31, O32, D22, L10, Q55
Keywords: Competition, Product and Process Innovation and Firm Behavior.
1 I would like to thank to my supervisor Roberto Alvarez whose support, advice, and continuous discussions
not only made this thesis happen but also helped me to be a better economist. Also I would like to thank the
participants of internal Master of Economic Analysis seminars, participants of 2012 Chilean Economic
Society Annual Meeting, and participants of INTELIS Research Center seminar for their helpful suggestions
and comments. Finally, this investigation may not have been possible without the support of the Millennium
Scientific Initiative of the ―INTELIS Centre‖ (Project Nº NS100017). The usual disclaimers apply. 2 [email protected]

3
1. – Introduction
Competition and innovation are main drivers of productivity, growth, and development
(Aghion et al. (2006)). This is especially true in developing countries where innovation may
help to ―catch-up‖ with developed nations (Cameron (1998), Griliches (1998), and Bravo-
Ortega & Garcia (2011)), specifically behind these two drivers is that theory realized that they
are continuously connected (Schumpeter (1934, 1942), Arrow (1962), Aghion and Howitt
(2006), among others) even when the relationship between them is not yet clear or conclusive.
With the creative destruction concept, Schumpeter (1942) points to a linear and negative effect
of competition over innovative activities and hence in firms’ performance.3 He found that
stronger incentives for monopolist over competitive firms exist for innovation because these
kinds of firms can capture gains of innovation without any probability of free riding by
competitors. Later Arrow (1962), Scherer (1980), and Porter (1990) questioned Schumpeter’s
results, finding a positive net effect of competition over innovation because of fears of being
run out the market by potential entrants’ innovations. Thus the incumbent firms have to
innovate in order to survive against entrants.
Empirical evidence exists supporting both sides, negative effect papers include: Hamberg
(1964); Mansfield (1964); Kraft (1989); Aghion and Howitt (1992); Crepon, et al. (1998);
Campante and Katz (2007); and Gorodnichenko, Svejnar and Terrell (2008). Meanwhile for
positive effect papers, there are: Geroski (1990), Blundell et al. (1995, 1999), Nickell (1996),
Carlin et al. (2004), Ayyagari et al. (2011), and Correa (2012). Nevertheless, and due to no
consensus in literature, Aghion et al (2005), following Scherer (1967), produces a non-linear
relation between competition and innovation using a theoretical model that captures both
trends and comes up with an inverse U relation between competition and innovation where,
depending on the initial level of competition, you may find positive or negative effect. So in a
very competitive market, profit gains from innovative activities are almost zero. Meanwhile
as competition decreases, profit gains from catching-up with the leader increase until there is
not any difference in efficiency of competitors. Above this point, gains of innovation start
decreasing and the inverted U and the trade-off between competition and innovation appears.
3 In a preview book, Schumpeter (1934) points out the change in his thoughts over the time.

4
Since Aghion et al. (2005) several empirical studies test this non-linear relationship between
competition and innovation, both finding that this relationship holds (Hashmi (2005), Lee
(2005), Lee and Sung (2005) and Polder and Veldhuizen (2012)) and doesn’t (Aiginger and
Falk (2005), Tingvall and Poldahl (2006)). Even the results of Aghion et al. (2005) seems to
be inconsistent because Correa (2012), using the same data, found the existence of structural
break in the middle of the sample and when taking that into account, the inverted U
relationship disappears showing that those results are incorrect, the inverted U relationship
doesn’t necessary exist, and that there is a positive relationship between innovation and
competition during the first subsampole and no relationship at all in the second subsample.
In summary,4
the literature on firm growth, innovation and competition suggests that
innovation is likely to be one of the most important channels through which competition
affects economic growth, although there lacks a consensus on the relationship between them.
Additionally, the evidence of this relationship for developing countries is very scarce and
incomplete. Moreover, most of the literature identifies an endogeneity problem which they do
not address or used outdated methods to do so (Cohen and Levin (1989) and Cohen (2010)).
This investigation looks to contribute to the literature in competition and innovation using
firm-level data for more than 24,000 firms from 70 developing countries. The main research
addresses if there is a relationship between competition and innovation for developing
countries, if this effect is heterogeneous among different industries and firms, and if it remains
for different types of innovation.
Using the same approach of Aghion et al. (2005) and then by using a probability model with
instrumental variables to deal with endogeneity we find that there exists a negative and robust
effect of competition over the level of innovation and the probability to engage in product or
process innovation. This is probably in line with Schumpeter (1942) and with modern self-
discovery theories developed by Hausmann and Rodrik (2003), empirically proved for export
diversification and discovery by Klinder and Lederman (2011), and for competition and
innovation by Gorodnichenko, Svejnar and Terrell (2008). These results remain at different
industry classifications, and we do not found significant difference between them. In fact, we
4 For a complete literature review see Cohen and Levin (1989), Gilbert (2006), and Cohen (2010).

5
found that country-specific competition is what matters the most for firm decision, not
industry specific competition or even country-industry competition.
The rest of the paper is structured as follows. The next section describes the dataset used in
this paper, present some important definitions (innovation, competition, and covariates) and
descriptive statistics. The third section presents the methodology and how the endogeneity is
addressed, and the fourth section discusses and presents econometrics results for the
relationship between competition and innovation. Finally section 5 provides the main
conclusions and findings.
2. – Data
To address this paper’s objectives, we use the World Bank Investment Climate Survey pooled
cross-section database (ICS)5 that consists of firm survey responses of over 24,000 2-digit
sector firms in 70 developing countries between the years of 2002 and 2006.6 This data comes
from a random size-industry-location stratified survey that captures information of the
characteristics of the local businesses, and the investment climate facing by the firms and its
impact on performance by reporting detailed information on firm employment, age, industry,
ownership, legal status, number of establishments, and other information.
Innovation Definition
A great advantage of this survey over other ones available is its broad coverage of the extent
of innovation activities undertaken by firms. Previously, there has been very little consistent
data across countries on the nature of innovative activities undertaken by firms. Moreover, the
available data typically only covers developed countries and focuses on patents or R&D
expenditures. This data does not only have R&D expenditure data, but also of different kinds
of innovative activities that a firm undertakes three years prior to the survey.7 This allows us
to measure the level of innovation in a broader sense of the word, leveling innovation with
three different variables reflecting output measures of innovation that allow us to analyze the
5 Available previous registration at http://www.enterprisesurveys.org/
6 Gross version of this database consists for more than 70,000 2-digit sector firms in more than 90 countries. But
we restrict it to developing countries, manufactures, and for those not missing data. 7 The more updated version of the Enterprises Surveys carried by the World Bank lacks information about
innovative activities.

6
intensive (probability to commit innovative activities) and extensive margin (the level of
innovation committed by the firm). The intensive margin is addressed using two variables: the
first one corresponds to a Product innovation dummy equal to 1 when the firm undertakes
activities 1 (―Developed a major new product line‖) or 2 (―Upgraded an existing product line‖)
and zero otherwise, and the second one corresponds to a Process dummy that is 1 when the
firm reported undertaking activity 3 (―Introduced new technology that changed the way that
the main product is produced‖) and zero otherwise. The extensive margins is address using a
count index that correspond to the sum of the 3 innovative activities reported to be undertaken
during the three years prior the survey following the approach of La Porta et al. (1998) and
Ayyagari et al. (2011).
Table 1 Descriptive Statistics
Variable Observations Mean Std. Dev. Min Max
Innovation Variables
Aggregate Index 15,790 1.34 1.03 0.00 3.00
Core Innovation Dummy 19,457 0.52 0.50 0.00 1.00
Innovative Dummy 19,457 0.39 0.49 0.00 1.00
Competition Measure
Boone Index 19,457 -0.48 0.40 -1.94 -0.01
Lerner Index 19,431 0.36 0.26 0.00 1.00
HH 19,457 0.18 0.23 0.01 0.99
Control Variables
Log (L) 19,371 4.20 1.64 0.00 10.73
Log (Age) 18,517 2.55 0.89 0.00 5.26
Exporter 19,457 0.31 0.46 0.00 1.00
State-Owned 18,626 0.04 0.20 0.00 1.00
Foreign 18,838 0.09 0.28 0.00 1.00
White-Collar 19,371 0.05 0.07 0.00 0.50
Between 0-50 CU 17,893 0.11 0.32 0.00 1.00
Between 50-80 CU 17,893 0.55 0.50 0.00 1.00
Between >80 CU 17,893 0.34 0.47 0.00 1.00
Emp/Manager Owner 19,457 0.03 0.16 0.00 1.00
Note: This descriptive statics are conditioned to non-missing value of Core Innovation
Dummy and non-missing value of competition definition. Without this condition observation
grows up to more than 24,000.
Table 1 presents the descriptive statistics of the sample used, specifically innovation variables
and shows that, on average, firms undertake 1.34 innovative activities during the past three
years: 52% of the firms perform Product Innovation and 39% of firms perform Process

7
Innovation. This is proven to be a large number of innovations over the real indicators, but
corresponds to a usual output of innovation surveys and remains high in every country-
industry in this sample.
Competition Definition
In this paper, the definition of competition plays a very important role; if we have a poor
measure then the results would be biased and the interpretation would be wrong. There are a
few different methodologies to measure the level of competition inside an industry8 and the
most common are the price cost margin (PCM) approach with the Lerner Index and the market
concentration approach with the Herfindahl–Hirschman (HH) Index. These measures suffer
from various theoretical and empirical problems; specifically HH Index is not suited for small
(open) economies, as it only expresses domestic industrial power, and does not necessarily
represent the competition pressure for firms. Meanwhile, the Lerner index has been proven to
provide a poor theoretical measure of competition (Boone 2008a), this is especially relevant
for empirical studies (Griffith et al. (2005)) because it is found to be particularly poorly
correlated with alternative measures of competition (Boone et al. (2007), Duhamel and Kelly
(2011)).
Boone (2008a) proposed a theoretical new measure based on relative profits-elasticity solving
previous measures problems, taking into account the heterogeneity of efficiency of firms in a
market. His approach is based on the idea that competition rewards efficiency. More efficient
firms will have higher market shares and higher profits than less efficient ones and that effect
should be stronger for a more competitive market. Numerous investigators study the empirical
application of this measure and their benefits (Gustavsson and Karpaty (2011), Boone et al.
(2011), Schiersch and Schmidt-Ehmcke (2010), Polder and Veldhuizen (2012), and Peroni and
Gomes Ferreira (2012))). Thus we use a standard of the methodologies previously mentioned,
estimating the following equation in every industry-country-year to collect the Boone-index:
log log
log
8 For a complete discussion of different measures and its problems see Boone (2000) and Griffith, Boone and
Harrison (2005).

8
Where log correspond to the logarithm of the profits of the firm i in every industry j and
country c, correspond to Total Variable Cost, and following Bérubé, Duhamel and
Ershov (2012) we add to control for size and efficiency of the firm
in order to get a good identification of the index.9 Total Variable Cost is always negatively
related with profits, so the Boone Index is always negative. Nevertheless, and for the purpose
of the estimations, we use the absolute value of this index in order to get a more interpretable
estimator. So, the Boone index corresponds to the coefficient from the country-industry-
year estimations shown above and represents the profit elasticity of cost over profits where
higher absolute value indicates greater sensitivity of firm profits to cost and for higher
competition intensity. This measure corresponds to a relative measure of competition and does
not allow us to identify the difference between a monopoly markets vs. a perfect competition
one. Nevertheless, in theory, a Boone Index near infinity could be related to perfect
competition and near zero to more uncompetitive conditions.
This index is monotonously related to various competition parameters, unlike other commonly
used measures such as the Lerner Index or the HH (Boone et al. (2007)). Table 2 shows the
pairwise correlation matrix between different usual measures of competition or concentration
(HH Index, Lerner, and Boone Index) and some competition parameters available in the
dataset (number of competitors, suppliers, and customers, existence of State owned or Foreign
competitor, and the influence of these competitors over their prices, products, and processes).
As this table shows, a significant correlation exists among these competition parameters and
the significance is higher and greater than Lerner and HH Index, and unlike the Lerner index,
this correlation proves the monotonously relationship between this competition parameters and
Boone index.
In order to understand the composition and the distribution of the Boone Index, Table 3
presents an analysis of variance of the Boone Index and shows that country variable explains
more than 67.1% of the model variance of the index, while industry variations are almost
8.3%, year 10.62% and residuals of the model represent 13.99%. This is an interesting
preview estimation result, telling us that what really matters in the decision to innovate is the
9 To ensure robust Boone index estimates, industries in the country-year that did not have more than 20 firm
observations were omitted from the dataset.

9
competition at the country-level than the industry or even the country-industry-level. This
result directly affects our empirical strategy preventing us to use country fixed effect in order
to get a good identification.10
Table 2 Pair-wise correlation
Boone
Index
Lerner
Index
HH
Index
N° of
Comp.
N° of
Supp.
Foreign
Comp.
State
Comp.
Inf. For.
Comp.
Hyp.
Monop
Boone Index 1.000
Lerner Index -0.520 1.000
0.000
HH Index 0.131 -0.020 1.000
0.000 0.002
N° of Comp. 0.267 -0.186 -0.018 1.000
0.000 0.000 0.061
N° of Supp. 0.328 -0.220 -0.075 0.327 1.000
0.000 0.000 0.000 0.000
Foreign Comp. -0.092 -0.028 0.000 0.226 0.092 1.000
0.000 0.087 0.971 0.000 0.000
State Comp. 0.189 -0.131 0.047 0.157 -0.050 -0.609 1.000
0.000 0.000 0.003 0.000 0.003 0.000
Inf. For. Competitor 0.052 -0.019 0.081 -0.070 0.009 0.108 -0.098 1.000
0.069 0.468 0.000 0.001 0.656 0.000 0.003
Hyphotetical Monop. -0.212 0.158 -0.003 0.035 -0.024 0.066 -0.054 0.003 1.000
0.000 0.000 0.798 0.032 0.132 0.000 0.029 0.871
Note: Pairwise correlation between competition definitions and the number of competitors, number
of suppliers, if the firm faces a foreign or state competitor, if the firm decisions are influenced by
competitor moves and the firm believes about the reaction of customers against an hypothetical
increase in 10% of the product prices (hypothetical monopolist test). 5% Confidence p-value below
pairwise correlation.
Endogeneity: Instrument Definition
As Aghion et al. (2005) and others note, there exists a reverse causality effect from innovation
on industry structure. So, this structure may change as a result of firm’s innovation decisions
and the character of competition as well as the pressure to innovate. This issue may produce
endogeneity in the competition indicator, and we use instrumental variable (IV) as an
approach to solve it. The IV instruments have to fulfill two main conditions to get unbiased
10
In order to test this result we run Country fixed effects regressions and lose significance on Boone index as
predicted. This regressions are reported in the Appendix

10
estimators of the competition over innovation. First, they must be correlated with the
endogenous explanatory variables, conditional on the other covariates, and cannot be
correlated with the error term in the explanatory equation. So, following the approaches of
Rajan and Zingales (1998) and Micco and Pages (2006), we construct an instrument that
allows us to exploit differences across sectors and countries based on the interaction between
countries’ entry regulation data from the Doing Business Project from the World Bank11
and
U.S. industry turnover data taken from Fisman and Sarria-Allende (2004). Entry regulation for
one side negatively affects the number of firms in an industry leading to a less competitive
market, while higher industry firm turnover is correlated with a more competitive industry.
Using data from the U.S. as a frictionless and baseline measure of industry turnover gives us
an exogenous measure of how the industry behaves. The interaction between these two
variables gave us an indicator that affects the market structure through firm entry regulation
for every country and to relate it with an exogenous measure of industry turnover, without
affecting the firm’s decision to undertake innovative activities. These factors make this
variable a good instrument candidate.
Table 3 Boone Index ANOVA
% of
Variance
Country 67.10%
Industry 8.29%
Year 10.62%
Residuals 13.99%
Total 100%
3. – Empirical Strategy
In order to fulfill the aims of this paper, we estimate the next equation.12
where represent the innovation measure of the firm in country , industry and year t,
and correspond to a continuous or dichotomic variable depending on the case,
corresponds to the Boone Index from the estimation described in the previous section,
11
Doing Business Project from the World Bank takes the data from Djankov et al. (2002) and extends the index
to more countries and years. 12
In Poisson model we also control for non-linearity of competition, labor, and age.

11
corresponds to usual covariates used in literature, to industry-year fixed effects, and
to country-industry-year clustered standard errors, while allowing for observations within
country-industry-year group to be correlated in some unknown way.
We estimate the former equation following two approaches, using instrumental variables to
deal with endogeneity. In the first, following Aghion et al. (2005), we estimate a Poisson
count model with a control function of the aggregated index of innovation over the
competition measure, and in second place we estimate a Probit model with instrumental using
product and process innovation dummies as dependent variables, while capturing the effect of
competition over the probability of innovating.
We are particularly interested in evaluating the effects of competition over the probability of
innovation on different industries and firms. So we compute the marginal effects at the sample
mean of each regressor and analyze how these marginal effects change with firm and industry
characteristics. In addition to these basic results, we re-estimate these marginal effects with
different industry classifications subsamples, such as the OECD Classification of technology
sectors made by Hatzichronoglou (1997), Pavitt’s (1984) Taxonomy update used by Bérubé,
Duhamel, and Ershov (2012), and, in the spirit, of Aghion et al. (2005) using the distance to
the frontier to get neck-and-neckness firms.13
These estimations allow us to not only
understand how the relationship between competition and innovation behaves among different
kinds of industries14
and to test hypotheses about how firms behave along different industry
classifications, but also to check for robustness of preview results.
The vector X of firm-specific variables includes characteristics that are expected to affect
innovation and that are part of standard covariates used in the literature (Hamberg (1964),
Kraft (1989), Ayyagari et al. (2010), Gustavsson and Karpaty (2011), Polder and Veldhuizen
(2012), among others). For instance, we consider the impacts of size, age, exporter status, firm
capacity utilization, white-collar proportion of employment, and employee (or manager)
ownership over innovation (both probability and level). White-collar proportion and employee
ownership are directly related with innovation decision making. Meanwhile, firm capacity
13
As Aghion et al. (2005) more neck-and-neck firms are those firms below median technological country gap. 14
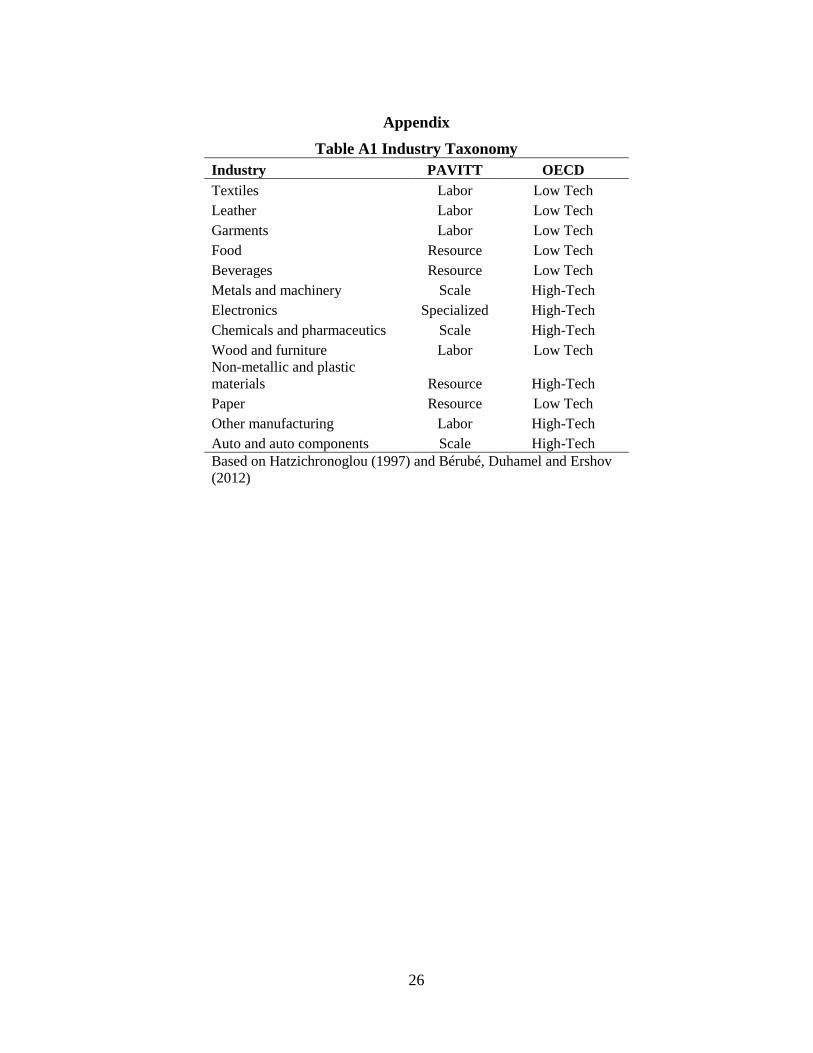
In Appendix you can find the correspondence of industries and the PAVITT and OECD classifications.

12
utilization is more greatly related with the firms’ period of production and the effect on
innovation.
Table 4 Variable Definitions Variable Definition
Log (L) Log of employment
Log (Age) Log of Age
Exporter Exporter Dummy
Sate-Owned Sate Owned Company Dummy
Foreign Foreign Ownership (More than 52% of the property)
White-Collar Percentage of employment that is skilled
Capacity Utilization 3-categories: 1[CU<50%], 2[50%<CU<80%] and 3[CU>80%]
Emp/Manager Owner Principal owner of the firm are employees or the manager
The white-collar proportion is percentage of white-collar workers over total employment. Size
is measured as log of total employment. Firm capacity utilization corresponds to three
dummies for 0 to 50%, 50 to 80%, and more than 80%. Employee (or manager) ownership
corresponds to a dummy variable equal to 1 if the owners of the firm are either employees or
managers. Finally, exporter status and state and foreign ownership correspond to dummy
variables equal to 1 if the firm sell abroad, belongs to the state, or a foreigner respectively.15
As Table 1 shows, 31% of the firms are exporters, while 4% are state owned, 9% are foreign,
and 3% are employee (or manager) owned. On average firms are about 19 years old with
around 308 employees; 5% of total employment is white-collar and, on average, firms are
running at a medium scale, using between 50% and 80% of installed capacity.
4. – Results
This section presents and discusses the results of the estimation of the empirical estimations
that test the relationship between competition and innovation. It first presents Aghion et al.
(2005) approach, and then shows the results using a probability model with instrumental
variables. The main result we found is a persistent negative effect of innovation over the level
of innovation undertaked by the firm.16
15
Table 4 summarizes variable definitions. 16
In order to check for robustness (and to control for more developed countries in the sample) we re-estimate by
dropping 10th decile of GDP per capita and also compute from more basic to complete specifications ,without
significant changes in the main results.

13
Table 5 Aggregate Index: Intensive Margin
(1) (2) (3) (4)
Agg. Index Agg. Index Agg. Index Agg. Index
|Boone Index| -0.763** -0.361 -0.302 -0.298
(0.385) (0.421) (0.412) (0.411)
|Boone Index|^2 -0.268*** -0.295*** -0.282*** -0.282***
(0.0624) (0.0701) (0.0688) (0.0688)
Log(L) 0.235*** 0.231*** 0.232***
(0.0354) (0.0344) (0.0347)
Log^2(L) -0.0176*** -0.0173*** -0.0175***
(0.00455) (0.00435) (0.00439)
Log(Age) 0.0149 0.0192 0.0183
(0.0316) (0.0310) (0.0310)
Log(Age)^2 0.000206 0.000542 0.000608
(0.00629) (0.00620) (0.00621)
Exporter 0.140*** 0.125*** 0.124***
(0.0249) (0.0235) (0.0234)
State-Owned -0.318*** -0.292*** -0.297***
(0.0879) (0.0876) (0.0890)
Foreign -0.155*** -0.151*** -0.154***
(0.0352) (0.0349) (0.0352)
Percentage of White Collars 0.00731 0.0447 0.0377
(0.293) (0.280) (0.281)
Between 50-80% of Cap. Use 0.190*** 0.190***
(0.0382) (0.0382)
More than 80% of Cap. Use 0.165*** 0.165***
(0.0300) (0.0300)
Employees/Manager Owner -0.103**
(0.0508)
Residuals 1.608*** 1.315** 1.215** 1.210**
(0.379) (0.411) (0.399) (0.398)
Constant 0.345 -0.415 -0.555* -0.560*
(0.237) (0.327) (0.332) (0.331)
Observations 15,942 14,994 14,765 14,765
Industry-Year FE YES YES YES Yes
Control Function Estimation. Country-Industry-Year clustered Standard errors in
parentheses. * significant at 10 %; ** significant at 5 %; *** significant at 1 %

14
In addition to what we just mentioned, we also found results support for Shumpeterian ideas
that bigger firms tend to innovate more, perhaps because bigger firms may have greater access
to innovation scale economies and more stability to undertake these kind of activities. State
and Foreign owned firms tend to innovate less while exporters tend to innovate more. Finally
manager and employee owned firms innovate less.
Unlike previous estimations that tried to understand innovation levels, the second approach is
used to understand the probability in undertaking innovative activities. Table 6 presents the
results for a probability model with instrumental variables.17
In this case, the results remain
quite similar with the Poisson case. We found a negative and persistent effect of the level of
competition over the probability of innovation in for both product and process innovation.
This means that moving from the 10th
percentile of competition to the 90th
percentile of
competition implies an average decrease in undertaking product innovation by 20.39% and,
for the case of process innovation, a decrease in the probability by 24.25%.
For the case of product and process innovation we also find support for the Shumpeterian
ideas that bigger firms tend to carry on more innovation activities. Meanwhile, in the case of
firm age, we did not find any relationships with respect to process innovation, while in the
case of product innovation we found a positive and significant effect. As in the preview
estimations, exporter status is positively correlated the probability in innovation for both
kinds, and state owned firms are less likely to commit any kind of innovation. Results also
show that for the case of process innovation, being a foreign-owned firm is negatively
associated with undertaking this kind of innovation.
Finally, we found that there exists a kind of non-linear effect of firm capacity utilization over
the probability of innovation, where it’s more likely to innovate if the firm capacity utilization
is more than 50% but less than 80%.
Besides the relationship testing, it’s necessary to test the instruments’ validity in order to gain
a truly better estimator than non-instrumental variable estimations. In all instrumental variable
17
As in Poisson model approach, we restrict the sample to 9/10 decile and compute from more basic to more
complete specifications without remarkable changes in the results.

15
estimations tables, we present two instruments tests. One is the Cragg-Donald (2009) statistics
that test weak instrument null hypothesis against the alternative of strong instruments. This
statistic is defined as the lowest eigenvalue of the concentration matrix, and when this
eigenvalue is highest than the Stock and Yogo (2002) critic value at a bias size, number of
endogenous repressors, and number of instruments, then we reject the hypothesis of weak
instruments. Despite Cragg-Donald (2009) statistic, the literature also uses F-Statistics of first
stage as a weak instrument test and, when this statistic is above 10, we can conclude that our
instruments are good.
Table 6 Innovation Probabilities: Extensive Margin Product Innovation Process Innovation
(1) (2) (3) (1) (2) (3)
|Boone Index| -0.424*** -0.443*** -0.443*** -0.521*** -0.535*** -0.535***
(0.130) (0.124) (0.124) (0.116) (0.115) (0.115)
Log(L) 0.019* 0.020* 0.020* 0.029** 0.031** 0.031**
(0.011) (0.011) (0.011) (0.012) (0.012) (0.012)
Log(Age) 0.015** 0.019*** 0.019*** -0.001 0.003 0.003
(0.007) (0.007) (0.007) (0.006) (0.006) (0.006)
Exporter 0.069*** 0.069*** 0.069*** 0.048*** 0.047*** 0.047***
(0.019) (0.019) (0.019) (0.016) (0.016) (0.016)
State-Owned -0.129*** -0.132*** -0.134*** -0.120*** -0.128*** -0.131***
(0.047) (0.047) (0.048) (0.043) (0.043) (0.043)
Foreign (d) -0.022 -0.021 -0.022 -0.044** -0.044** -0.045**
(0.020) (0.021) (0.021) (0.018) (0.018) (0.019)
White-Collar over L -0.181 -0.184 -0.187 -0.135 -0.126 -0.129
(0.173) (0.169) (0.169) (0.177) (0.178) (0.178)
Between 50-80% of Cap. Use 0.078*** 0.078*** 0.068*** 0.068***
(0.015) (0.015) (0.017) (0.017)
More than 80% of Cap. Use 0.059*** 0.059*** 0.053*** 0.053***
(0.013) (0.013) (0.013) (0.013)
Employees/Manager Owner -0.037 -0.042
(0.035) (0.034)
Observations 17,539 16,829 16,829 17,539 16,829 16,829
Industry-Year FE YES YES YES YES YES YES
Cragg-Donald 322.5 327.4 328.3 322.5 327.4 328.3
First Stage F-Statistic 27.36 626.4 1447.9 27.36 626.4 1447.9
Marginal Effects Reported. Country-Industry-Year Clustered standard errors in parentheses. * significant at 10 %; **
significant at 5 %; *** significant at 1 %

16
As shown in the tables, all Cragg-Donald statistics remain above their critical value at 10% of
bias (the lower number)18
and all F-statistics remain over 10. Thus we can conclude that we
have a good and strong instrument.
Looking for heterogeneity among firms and industries
Although we don’t address the evidence of heterogeneity through firms and industries in the
preview estimations, we do attempt to find this by using different subsample estimations. In
this case we restrict the sample and divided it into different groups of industries using standard
taxonomies. In Table 7 we shows the results using neck and no-neck firms division19
where
no-necks are those firms that are above the median of sales over employment and necks are
those that are below median of sales over employment in the country-industry. In addition, in
Table 8 we show the results using OECD taxonomy of technical industry classification. In this
case we group the firms in two categories - the Low-Tech firms industries and High-Tech
industries20
- using medium-low to medium-high industries.21
Finally in Table 9 we show the
results using an updated form of PAVITT taxonomy that is an input upstream classification
reclassified into five categories. The supplier-dominated category was broken into Resources
and Labor; the production intensive was defined as Scale-intensive and Specialized suppliers;
and Science-based remained a single category.22
For both, neck and no-neck firms, we found that there exists a negative and persistent effect of
competition over the probability to innovate. On average moving from a highly uncompetitive
industry (10th
percentile of competition) to a very competitive industry (90th
percentile of
competition) means an average decrease in the probability to innovate by about 20.59% in the
18
Critical values for 1 endogenous regressor and 1 excluded instrument: 10% maximal bias size: 16.38; 15%
maximal bias size: 8.96; 20% maximal bias size 6.66; and 25% maximal bias size: 5.53. 19
As neck firms are defined to be closer to the technological frontier, one may expect that these firms are
positively correlated with more competition, while in no-neck firms we can expect the opposite. 20
In this case, more technological industries are used to face fierce competition, so we expect to find a positive
correlation between competition and innovation in this case. 21
In this sample no very high-tech industries were found. 22
In this database we found firms belonging to the Resource, Labor and Scale intensive categories. In this case
we may expect that Resource and Scale firms are more likely to be related with competition because they have to
improve their process in order to reduce cost, depend less of scale or reduce their demand of resources to stay
competitive. Labor-intensive firms are less capable of reacting to competition, so one may expect to find little or
no relationship with competition in this case.

17
case of product innovation and 25.03% in the case of process innovation. Now, if we separate
this effect for neck and no-neck firms, we find that this movement generally implies an equal
decrease in the probability to innovate around 22%.
Table 7 Tech-NoTech Results
Product Innovation Process Innovation
Low-Tech High-Tech Low-Tech High-Tech
|Boone Index| -0.406* -0.477*** -0.509** -0.561***
(0.175) (0.119) (0.167) (0.0921)
Log(L) 0.0166 0.0226 0.0360** 0.0233
(0.0124) (0.0166) (0.0138) (0.0153)
Log(Age) 0.0117 0.0306** -0.00826 0.0191
(0.0105) (0.0114) (0.00732) (0.0107)
Exporter 0.0495* 0.0927** 0.0276 0.0681**
(0.0204) (0.0294) (0.0174) (0.0233)
State-Owned -0.143 -0.134** -0.149* -0.119**
(0.0812) (0.0511) (0.0693) (0.0436)
Foreign -0.0736* 0.0274 -0.0910** -0.00218
(0.0362) (0.0281) (0.0306) (0.0277)
White-Collar over L -0.338 -0.0669 -0.279 0.00349
(0.271) (0.171) (0.296) (0.162)
Between 50-80% of Cap. Use. 0.0838*** 0.0702*** 0.0701** 0.0637**
(0.0241) (0.0174) (0.0260) (0.0210)
More than 80% of Cap. Use 0.0725*** 0.0435* 0.0570** 0.0489*
(0.0187) (0.0187) (0.0186) (0.0203)
Employees/Manager Owner -0.0506 -0.0193 -0.0560 -0.0179
(0.0485) (0.0376) (0.0510) (0.0343)
Observations 9,404 7,425 9,404 7,425
Industry-Year FE YES YES YES YES
Cragg-Donald 203.5 134.0 203.5 134.0
First Stage F-Statistic 34.46 62.38 34.46 62.38
Marginal Effects Reported- Country-Industry-Year Clustered standard errors in
parentheses. * significant at 10 %; ** significant at 5 %; *** significant at 1 %
For technology sector estimations results seems to be very similar to the neck and no neck
estimations. There also exists a negative and persistent effect of competition over innovation.
Doing the above exercise, moving from an uncompetitive sector to a competitive sector

18
implies an average decrease in probability to innovate for about a 21.49% in the case of low-
tech sectors and 14.80% in the case of high-tech sectors.
Table 8 PAVITT Taxonomy Results Product Innovation Process Innovation
Labor Resource Scale Labor Resource Scale
|Boone Index| 0.767 -0.437** -0.469*** -0.809** -0.439** -0.569***
(1.245) (0.166) (0.132) (0.310) (0.138) (0.0975)
Log(L) 0.0138 0.0435*** 0.0256 -0.00973 0.0588*** 0.0256
(0.0365) (0.00970) (0.0170) (0.0443) (0.00868) (0.0159)
Log(Age) 0.0225 0.00700 0.0347** -0.00869 -0.0134 0.0225
(0.0366) (0.0100) (0.0130) (0.0170) (0.00769) (0.0124)
Exporter 0.00569 0.0721* 0.0884* 0.0255 0.0311 0.0728*
(0.124) (0.0281) (0.0361) (0.0339) (0.0195) (0.0286)
State-Owned 0.244 -0.0720 -0.201** -0.282* -0.0782 -0.173**
(0.521) (0.0901) (0.0717) (0.136) (0.0594) (0.0589)
Foreign (d) 0.125 0.0235 0.0349 -0.202* -0.0556* 0.0365
(0.540) (0.0331) (0.0319) (0.0888) (0.0241) (0.0238)
White-Collar over L 0.795 -0.0184 -0.208 -0.951 0.171 -0.0669
(1.947) (0.222) (0.182) (0.619) (0.202) (0.187)
Between 50-80% of Cap. Use. -0.0358 0.0679*** 0.0792*** 0.0892* 0.0531** 0.0781***
(0.285) (0.0189) (0.0204) (0.0350) (0.0197) (0.0232)
More than 80% of Cap. Use. 0.000202 0.0619** 0.0550* 0.0600 0.0430* 0.0654**
(0.249) (0.0214) (0.0228) (0.0448) (0.0194) (0.0237)
Employees/Manager Owner 0.122 -0.0172 -0.0267 -0.187 0.0116 -0.0291
(0.405) (0.0353) (0.0385) (0.0985) (0.0388) (0.0384)
Observations 4,493 5,596 5,647 4,493 5,596 5,647
Industry-Year FE YES YES YES YES YES YES
Cragg-Donald 2.107 258.5 101.3 2.107 258.5 101.3
First Stage F-Statistic 422.7 224.3 180.3 422.7 224.3 180.3
Marginal Effects Reported. Country-Industry-Year Clustered standard errors in parentheses
* significant at 10 %; ** significant at 5 %; *** significant at 1 %
At last, for the Pavitt taxonomy estimations, results show that there also exists a negative and
persistent effect of competition over innovation for Resource and Scale intensive industries.
Meanwhile, for Labor intensive industries, the results also show a negative relationship but
only for process innovation. As to the same exercise above, moving from a noncompetitive
industry to a very competitive leads to an average decrease in the probability of innovation for

19
about 19.7 % in the case of Resource intensive industries, 15.8% in the case of Scale intensive
industries, and 30.3 % for the case of Labor intensive industries.23
Table 9 Neck-and-Neckness Results
Product Innovation Process Innovation
No-Neck Neck No-Neck Neck
|Boone Index| -0.461** -0.418*** -0.525*** -0.556***
(0.148) (0.126) (0.128) (0.137)
Log(L) 0.0121 0.0242* 0.0273* 0.0316*
(0.0133) (0.0113) (0.0137) (0.0134)
Log(Age) 0.00707 0.0306*** -0.00516 0.0116
(0.00820) (0.00900) (0.00659) (0.00988)
Exporter 0.0732** 0.0442* 0.0302 0.0442**
(0.0235) (0.0184) (0.0211) (0.0157)
State-Owned -0.195** -0.0624 -0.182** -0.0751*
(0.0672) (0.0420) (0.0611) (0.0367)
Foreign -0.0649* -0.0187 -0.0861*** -0.0371
(0.0299) (0.0227) (0.0256) (0.0206)
White-Collar over L -0.279 -0.173 -0.221 -0.115
(0.184) (0.165) (0.187) (0.205)
Between 50-80% of Cap. Use. 0.0941*** 0.0548** 0.0860*** 0.0414*
(0.0208) (0.0176) (0.0226) (0.0173)
More than 80% of Cap. Use. 0.0648*** 0.0429* 0.0717*** 0.0297
(0.0174) (0.0195) (0.0178) (0.0163)
Employees/Manager Owner -0.0644 0.00796 -0.0794 0.0127
(0.0503) (0.0306) (0.0487) (0.0294)
Observations 7800 8499 7789 8328
Industry-Year FE YES YES YES YES
Cragg-Donald 184.5 205.0 184.5 205.0
First Stage F-Statistic 13.50 197.2 13.50 197.2
Marginal Effects Reported- Country-Industry-Year Clustered standard errors in parentheses. *
significant at 10 %; ** significant at 5 %; *** significant at 1 %
23
Labor intensive industry results must be taken with caution because it may be driven by a bad behavior of the
instrument for this subsample. Cragg-Donald statistics are below the 10% bias Stock and Yogo critic value, and
there is not any significance of the instrument on the first-stage.
20
Finally, there seems to be no remarkable changes in the relationship between covariates and
innovation probability and it seems that instruments are working well, with nearly all having
F-statistics over 10 and Cragg-Donald statistics over 10% bias Stock and Yogo critic values.
5. – Conclusions
Using the Climate Investment Survey from the World Bank, we found a negative and
persistent relationship between competition and innovation. These results are quite different
from the majority of the literature where most findings are a positive or non-linear effect. But,
unlike others, we focus on developing countries, use an innovation measure in the broader
sense of the word, and use the Boone index competition measure. Thus we prove it to be
monotonically related with real competition inside an industry and have better properties than
other measures typically used.
Moreover, using the same methodology of Aghion et al. (2005), we indeed found a nonlinear
relationship but this a negative relationship with slightly non-linearity than an inverted U.
This is probably because of the characteristics of our dataset; developing countries are
characterized by low levels of appropriability and institutions and thus the higher the
competition, the lower the incentives to innovate. Moreover, and related to Rodrik’s (2005)
self-discovery discussion, our results are coherent with the theory that predicts a negative
relationship between competition and innovation. Higher competition reduces private
incentives to invest and discover cost reductions in new activities and therefore creates lower
levels of innovation.
There seems to be no relevant heterogeneity in firms’ responds to competition at the industry
classification level. A few particularly interesting results are that low-tech industries tend to be
more sensitive to competition than high-tech industries, while neck firms do not present any
differences with no-neck firms. Moreover, competition does not have any effect in labor-
intensive industries
Finally besides preview results, competition in developing countries varies more at cross-
country levels than at industry levels and, we try to deal with endogeneity problems providing
evidence of a exogenous and good instrument.
21
References
Aghion, P., N. Bloom, R. Blundell, R. Griffith and P. Howitt, 2005, Competition and
innovation: an inverted U relationship, Quarterly Journal of Economics, vol. CXX, no.
2, pp. 701–728.
Aghion, P. and P. Howitt, 2006, Appropriate growth policy: A unifying framework,
Journal of the European Economic Association, vol. 4(2-3), pp. 269– 314.
Aghion, P., R. Blundell, R. Griffith, P. Howitt and S. Prantl, 2006, The effects of entry
on incumbent innovation and productivity, Working Paper 12027, National Bureau of
Economic Research, Cambridge MA.
Aiginger, K., and Falk, M., 2005, The inverted U: new evidence on the relationship
between innovation and competition, (Working Paper, WIFO(Austrian Institute for
Economic Research)).
Arrow, K., 1962, Economic welfare and the allocation of resources for innovations, in R.
Nelson, ed., The rate and direction of Inventive Activity, Princeton University Press,
Princeton.
Ayyagari, M., Demirgüç-Kunt, A., and Maksimovic, V., 2010, Firm innovation in
emerging markets: The role of finance, governance, and competition. Journal of
Financial and Quantitative Analysis, vol. 1, 1–70.
Bérubé, C., Duhamel, M., and Ershov, D., 2012, Market incentives for business
innovation: Results from Canada. Journal of Industry, Competition and Trade, vol. 12.
Blundell, R., Griffith, R., and van Reenen, J., 1995, Dynamic count data models of
technological innovation, Economic Journal, vol. 105(429), pp. 333–344.
Blundell, R., Griffith, R., and van Reenen, J., 1999, Market share, market value and
innovation in a panel of British manufacturing firms, Review of Economic Studies,
vol. 66(3), pp. 529– 554.
Boone, J., 2000a, Competition, CEPR Discussion Paper 2636, CEPR.

22
Boone, J., R. Griffith and R. Harrison, 2005, Measuring competition, AIM Working
Paper 22, IFS.
Boone, J., J. van Ours and H. van der Wiel, 2007, How (not) to measure competition,
CPB Discussion Paper 91, CPB.
Boone, J., 2008, A new way to measure competition, Economic Journal, vol. 118, pp.
1245– 1261.
Bravo-Ortega, C., and García, A., 2011, R&D and Productivity: A Two Way Avenue?,
World Development, Volume 39, Issue 7, Pages 1090-1107
Cameron, G., 1998, Innovation and Growth: a survey of the empirical evidence, Ph.D.
thesis, Nuffield College, Oxford.
Carlin, W., Schaffer, M. and Seabright, P., 2004, A minimum of rivalry: Evidence from
transition economies on the importance of competition for innovation and growth,
Contributions to Economic Analysis and Policy, vol. 3(1), pp. 1–43.
Cohen, W.M. and Levin, R.C., 1989. Empirical studies of innovation and market
structure, Handbook of Industrial Organization, in: R. Schmalensee & R. Willig (ed.),
Handbook of Industrial Organization, edition 1, volume 2, chapter 18, pages 1059-
1107 Elsevier.
Cohen, Wesley M., 2010, Chapter 4 - Fifty Years of Empirical Studies of Innovative
Activity and Performance, In: Bronwyn H. Hall and Nathan Rosenberg, Editor(s),
Handbook of the Economics of Innovation, North-Holland, Volume 1, Pages 129-213
Correa, J., 2012, Innovation and competition: An unstable relationship. Journal of Applied
Econometrics.
Cragg, J.G. and Donald, S.G (2009), Testing identifiability and specification in
instrumental variable models. Econometric Theory, 9, no 02:222–240.
Djankov, S., La Porta, R., Lopez-De-Silanes, F. and Shleifer, A. 2002. The Regulation
Of Entry, The Quarterly Journal of Economics, MIT Press, vol. 117(1), pages 1-37

23
Fisman, R. and Sarria-Allende, V., 2004. Regulation of Entry and the Distortion of
Industrial Organization, NBER Working Papers 10929, National Bureau of Economic
Research, Inc.
Geroski, P., 1990, Innovation, technological opportunity and market structure, Oxford
Economic Papers, vol. 42, pp. 586–602.
Gilbert, R., 2006, Looking for Mr. Schumpeter: Where Are We in the Competition-
Innovation Debate?, NBER Chapters, in: Innovation Policy and the Economy, Volume
6, pages 159-215 National Bureau of Economic Research, Inc.
Griliches, Z., 1998, R&D and productivity: The econometric evidence, Chicago University
Press.
Gorodnichenko, Y., Svejnar, J. and Terrell, K., 2008. Globalization and Innovation in
Emerging Markets, Working Papers 583, Research Seminar in International
Economics, University of Michigan.
Gustavsson, P. and Karpaty, P., 2011, Service-sector competition, innovation and R&D,
Economics of Innovation and New Technology, 20:1, 63-88
Hamberg, D., 1964, Size of firm, oligopoly, and research: The evidence, Canadian Journal
of Economics and Political Science, vol. 30, pp. 62–75.
Hashmi, A., 2005, Competition and Innovation: The Inverted-U Relationship Revisited,
University of Toronto working papers.
Hausmann, R. and Rodrik, D., 2003. Economic development as self-discovery, Journal of
Development Economics, Elsevier, vol. 72(2), pages 603-633, December.
Hatzichronoglou, T., 1997, Revision of the High-Technology Sector and Product
Classification, OECD Science, Technology and Industry Working Papers, 1997/02,
OECD Publishing.
Klinger, B. and Lederman, D., 2011, Export discoveries, diversification and barriers to
entry," Economic Systems, Elsevier, vol. 35(1), pages 64-83, March.

24
Kraft, K., 1989, Market structure, firm characteristics and innovative activity, The Journal
of Industrial Economics, vol. 37(3), pp. 329–336.
La Porta, R., Lopez-de Silanes, F., Shleifer, A., and Vishny, R., 1998, Law and finance.
The Journal of Political Economy 106, 6, pag. 1113–1155.
Lee, C. Y., 2005, A new perspective on industry R&D and market structure, Journal of
Industrial Economics 53, 101-122.
Lee, C. Y., and Sung, T., 2005, Schumpeter's legacy: A new perspective on the
relationship between firm size and R&D, Research Policy 34, 914-931.
Mansfield, E., 1964, Industrial Research and Technological Innovation: An Econometric
Analysis, New York, Norton.
Micco, A. and Pagés-Serra C., 2008, The Economic Effects of Employment Protection:
Evidence from International Industry-Level Data, Research Department Publications
4496, Inter-American Development Bank, Research Department.
Nickell, S., 1996, Competition and corporate performance, Journal of Political Economy,
vol. 104, pp. 724–746.
Pavitt, K., 1984. "Sectoral patterns of technical change: Towards a taxonomy and a
theory," Research Policy, Elsevier, vol. 13(6), pages 343-373, December.
Peroni, C., and Ferreira, I, 2012, Competition and innovation in Luxembourg. Journal of
Industry, Competition and Trade, vol. 12, 93–117
Porter, M., 1990, The competitive advantage of nations, MACMILLAN.
Polder, M. and Veldhuizen, E., 2012, Innovation and Competition in the Netherlands:
Testing the Inverted-U for Industries and Firms, Journal of Industry, Competition and
Trade, Vol. 12, pp 1—25.
Rajan, R.G. and Zingales, L., 1998. "Financial Dependence and Growth," CRSP working
papers 344, Center for Research in Security Prices, Graduate School of Business,
University of Chicago.

25
Scherer, F., 1967, Market structure and the employment of scientists and engineers,
American Economic Review, vol. 57, pp. 524–531.
Scherer, F., 1980, Industrial Market Structure and Economic Performance, Rand McNally,
Chicago, 2nd ed.
Schiersch, A. and Schmidt-Ehmcke, J., 2010, Empiricism Meets Theory: Is the Boone-
Indicator Applicable?, DIW Berlin Discussion Paper No. 1030.
Schumpeter, J., 1934, The Theory of Economic Development: An Inquiry into Profits,
Capital, Credit, Interest, and the Business, Harvard University Press, Cambridge.
Schumpeter, J., 1942, Capitalism, Socialism and Democracy, New York: Harper.
Stock, J.H. and Yogo, M., (2002), Testing for weak instruments in linear iv regression.
NBER Working Paper.
Tingvall, P.G., and Poldahl, A.,2006, Is there really an inverted U- shaped relation
between competition and R&D?, Economics of Innovation and New Technology 15,
101.
26
Appendix
Table A1 Industry Taxonomy
Industry PAVITT OECD
Textiles Labor Low Tech
Leather Labor Low Tech
Garments Labor Low Tech
Food Resource Low Tech
Beverages Resource Low Tech
Metals and machinery Scale High-Tech
Electronics Specialized High-Tech
Chemicals and pharmaceutics Scale High-Tech
Wood and furniture Labor Low Tech
Non-metallic and plastic
materials Resource High-Tech
Paper Resource Low Tech
Other manufacturing Labor High-Tech
Auto and auto components Scale High-Tech
Based on Hatzichronoglou (1997) and Bérubé, Duhamel and Ershov
(2012)
27
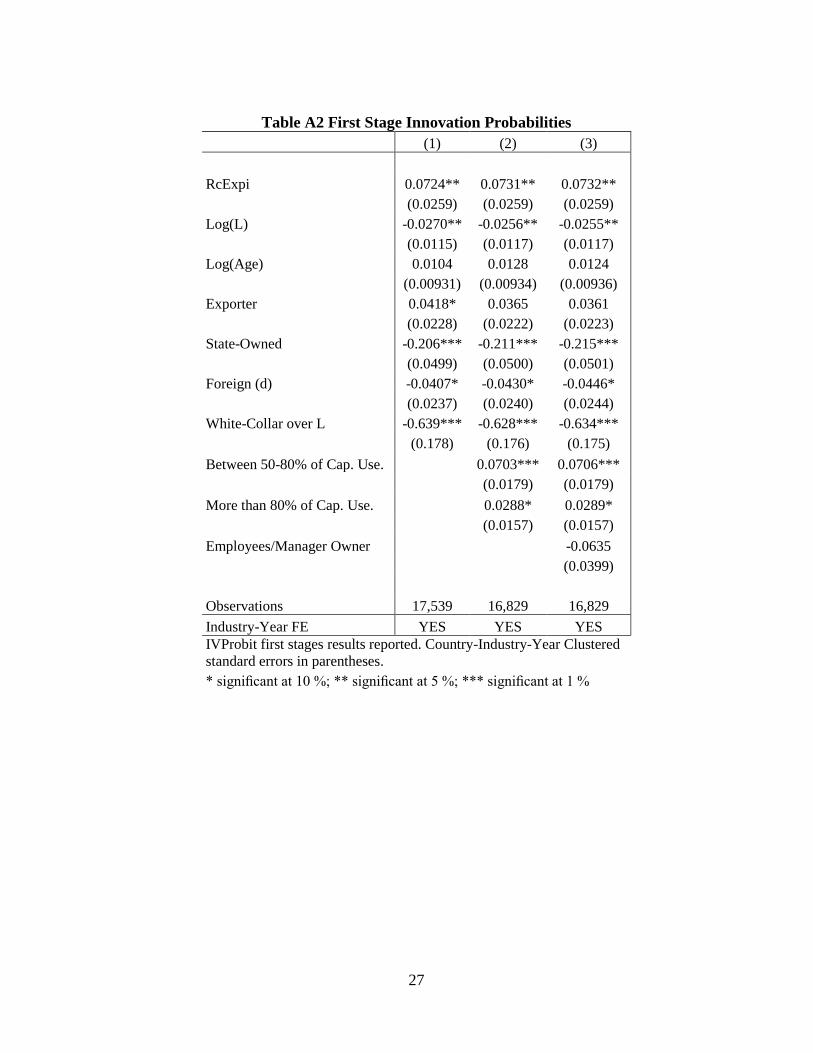
Table A2 First Stage Innovation Probabilities
(1) (2) (3)
RcExpi 0.0724** 0.0731** 0.0732**
(0.0259) (0.0259) (0.0259)
Log(L) -0.0270** -0.0256** -0.0255**
(0.0115) (0.0117) (0.0117)
Log(Age) 0.0104 0.0128 0.0124
(0.00931) (0.00934) (0.00936)
Exporter 0.0418* 0.0365 0.0361
(0.0228) (0.0222) (0.0223)
State-Owned -0.206*** -0.211*** -0.215***
(0.0499) (0.0500) (0.0501)
Foreign (d) -0.0407* -0.0430* -0.0446*
(0.0237) (0.0240) (0.0244)
White-Collar over L -0.639*** -0.628*** -0.634***
(0.178) (0.176) (0.175)
Between 50-80% of Cap. Use. 0.0703*** 0.0706***
(0.0179) (0.0179)
More than 80% of Cap. Use. 0.0288* 0.0289*
(0.0157) (0.0157)
Employees/Manager Owner -0.0635
(0.0399)
Observations 17,539 16,829 16,829
Industry-Year FE YES YES YES
IVProbit first stages results reported. Country-Industry-Year Clustered
standard errors in parentheses.
* significant at 10 %; ** significant at 5 %; *** significant at 1 %
28
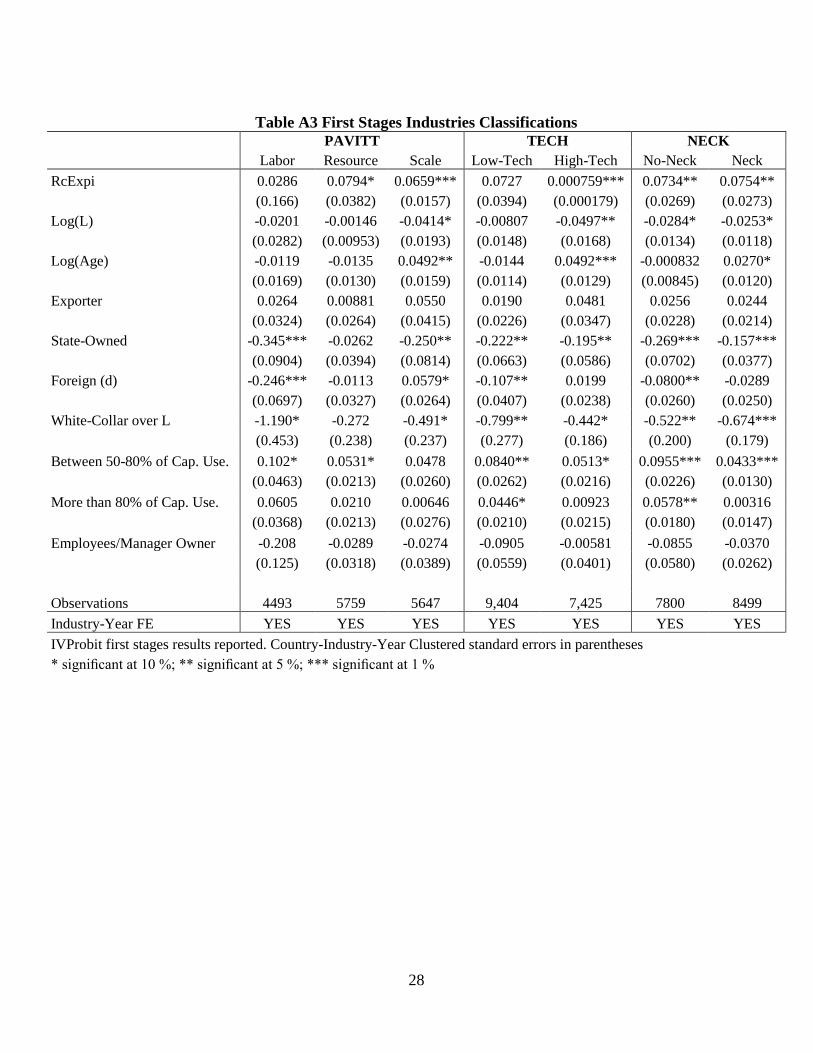
Table A3 First Stages Industries Classifications PAVITT TECH NECK
Labor Resource Scale Low-Tech High-Tech No-Neck Neck
RcExpi 0.0286 0.0794* 0.0659*** 0.0727 0.000759*** 0.0734** 0.0754**
(0.166) (0.0382) (0.0157) (0.0394) (0.000179) (0.0269) (0.0273)
Log(L) -0.0201 -0.00146 -0.0414* -0.00807 -0.0497** -0.0284* -0.0253*
(0.0282) (0.00953) (0.0193) (0.0148) (0.0168) (0.0134) (0.0118)
Log(Age) -0.0119 -0.0135 0.0492** -0.0144 0.0492*** -0.000832 0.0270*
(0.0169) (0.0130) (0.0159) (0.0114) (0.0129) (0.00845) (0.0120)
Exporter 0.0264 0.00881 0.0550 0.0190 0.0481 0.0256 0.0244
(0.0324) (0.0264) (0.0415) (0.0226) (0.0347) (0.0228) (0.0214)
State-Owned -0.345*** -0.0262 -0.250** -0.222** -0.195** -0.269*** -0.157***
(0.0904) (0.0394) (0.0814) (0.0663) (0.0586) (0.0702) (0.0377)
Foreign (d) -0.246*** -0.0113 0.0579* -0.107** 0.0199 -0.0800** -0.0289
(0.0697) (0.0327) (0.0264) (0.0407) (0.0238) (0.0260) (0.0250)
White-Collar over L -1.190* -0.272 -0.491* -0.799** -0.442* -0.522** -0.674***
(0.453) (0.238) (0.237) (0.277) (0.186) (0.200) (0.179)
Between 50-80% of Cap. Use. 0.102* 0.0531* 0.0478 0.0840** 0.0513* 0.0955*** 0.0433***
(0.0463) (0.0213) (0.0260) (0.0262) (0.0216) (0.0226) (0.0130)
More than 80% of Cap. Use. 0.0605 0.0210 0.00646 0.0446* 0.00923 0.0578** 0.00316
(0.0368) (0.0213) (0.0276) (0.0210) (0.0215) (0.0180) (0.0147)
Employees/Manager Owner -0.208 -0.0289 -0.0274 -0.0905 -0.00581 -0.0855 -0.0370
(0.125) (0.0318) (0.0389) (0.0559) (0.0401) (0.0580) (0.0262)
Observations 4493 5759 5647 9,404 7,425 7800 8499
Industry-Year FE YES YES YES YES YES YES YES
IVProbit first stages results reported. Country-Industry-Year Clustered standard errors in parentheses
* significant at 10 %; ** significant at 5 %; *** significant at 1 %

29
Table A4 Aggregate Index with industry and country FE.
(1) (2) (3) (4)
Agg. Index Agg. Index Agg. Index Agg. Index
|Boone Index| 0.0210 -0.0362 -0.0933 -0.0943
(0.326) (0.347) (0.335) (0.335)
|Boone Index|^2 0.0363 0.0799** 0.0794** 0.0795**
(0.0412) (0.0391) (0.0388) (0.0388)
Log(L) 0.192*** 0.193*** 0.193***
(0.0271) (0.0266) (0.0267)
Log^2(L) -0.00643** -0.00719** -0.00720**
(0.00299) (0.00289) (0.00290)
Log(Age) 0.0595* 0.0574* 0.0573*
(0.0307) (0.0298) (0.0298)
Log(Age)^2 -0.0188** -0.0177** -0.0177**
(0.00587) (0.00572) (0.00572)
Exporter 0.0519** 0.0501** 0.0499**
(0.0180) (0.0180) (0.0180)
State-Owned 0.0236 0.0340 0.0314
(0.0323) (0.0323) (0.0331)
Foreign -0.106*** -0.103*** -0.104***
(0.0265) (0.0268) (0.0268)
Percentage of White Collars 0.882*** 0.874*** 0.874***
(0.142) (0.142) (0.142)
Between 50-80% of Cap. Use. 0.0907*** 0.0907***
(0.0239) (0.0239)
More than 80% of Cap. Use. 0.107*** 0.107***
(0.0237) (0.0237)
Employees/Manager Owner -0.0241
(0.0333)
Residuals -0.200 -0.238 -0.183 -0.182
(0.321) (0.339) (0.328) (0.328)
Constant -0.0154 -0.474** -0.504** -0.504**
(0.167) (0.192) (0.191) (0.191)
Observations 15942 14994 14765 14765
Industry-Year FE YES YES YES YES
Country-Year FE YES YES YES YES
Control Function Estimation. Country-Industry-Year clustered Standard errors in
parentheses
* significant at 10 %; ** significant at 5 %; *** significant at 1 %

30
Table A5 Innovation Probabilities with industry and country FE. Product Innovation Process Innovation
(1) (2) (3) (1) (2) (3)
|Boone Index| -0.161 0.0556 0.0558 -0.0974 0.103 0.103
(0.184) (0.120) (0.120) (0.221) (0.156) (0.156)
Log(L) 0.0626*** 0.0652*** 0.0651*** 0.0708*** 0.0736*** 0.0738***
(0.00485) (0.00426) (0.00426) (0.00417) (0.00365) (0.00364)
Log(Age) -0.0112** -0.0123** -0.0123** -0.0164** -0.0167** -0.0167**
(0.00532) (0.00521) (0.00521) (0.00554) (0.00537) (0.00537)
Exporter 0.0486*** 0.0505*** 0.0506*** 0.0260** 0.0239* 0.0236*
(0.0109) (0.0113) (0.0113) (0.0121) (0.0126) (0.0127)
State-Owned -0.00625 -0.000911 -0.000162 -0.0127 -0.0146 -0.0172
(0.0195) (0.0194) (0.0199) (0.0186) (0.0187) (0.0190)
Foreign (d) -0.0597*** -0.0533*** -0.0530*** -0.0595*** -0.0544** -0.0551**
(0.0152) (0.0154) (0.0154) (0.0170) (0.0183) (0.0183)
White-Collar over L 0.444*** 0.460*** 0.460*** 0.384*** 0.404*** 0.405***
(0.0907) (0.0884) (0.0883) (0.0888) (0.0879) (0.0880)
Between 50-80% of Cap. Use. 0.0442*** 0.0442*** 0.0410** 0.0410**
(0.0114) (0.0114) (0.0154) (0.0154)
More than 80% of Cap. Use. 0.0563*** 0.0563*** 0.0549*** 0.0547***
(0.0117) (0.0117) (0.0147) (0.0147)
Employees/Manager Owner 0.00976 -0.0294*
Observations 15,006 14,473 14473 15247 14710 14710
Industry-Year FE Yes Yes Yes Yes Yes Yes
Country-Year FE Yes Yes Yes Yes Yes Yes
Cragg-Donald 437.3 461.9 461.9 437.3 461.9 461.9
First Stage F-Statistic 1,117.5 2,340.5 4.39066e+10 1,117.5 2,340.5 3.05622e+10
Marginal Effects Reported. Country-Industry-Year Clustered standard errors in parentheses
* significant at 10 %; ** significant at 5 %; *** significant at 1 %