COMPETE FR Text 061023 final - Choose your...
195
Project funded by the European Commission – DG TREN Disclaimer: This report represents the views of the authors. These views are not neces- sarily those of the European Commission and should not be relied upon as a statement of the Commission or DG-TREN. COMPETE Analysis of the contribution of transport policies to the competitiveness of the EU economy and comparison with the United States COMPETE Final Report Analysis of the contribution of transport policies to the competitiveness of the EU economy and comparison with the United States Version 2.1 October 2006 Co-ordinator: ISI Fraunhofer Institute Systems and Innovation Research, Karlsruhe, Germany Partners: INFRAS INFRAS Zurich, Switzerland TIS Transport, Innovation and Systems Lisbon, Portugal EE Europe Economics London, United Kingdom
Transcript of COMPETE FR Text 061023 final - Choose your...

Project funded by the
European Commission – DG TREN
Disclaimer: This report represents the views of the authors. These views are not neces-sarily those of the European Commission and should not be relied upon as a statement of the Commission or DG-TREN.
COMPETE Analysis of the contribution of transport policies to the competitiveness of the EU economy and comparison with the United States
COMPETE Final Report
Analysis of the contribution of transport policies to the competitiveness of the EU economy and
comparison with the United States
Version 2.1
October 2006
Co-ordinator:
ISI Fraunhofer Institute Systems and Innovation Research, Karlsruhe, Germany
Partners:
INFRAS INFRAS Zurich, Switzerland
TIS Transport, Innovation and Systems Lisbon, Portugal
EE Europe Economics London, United Kingdom


COMPETE
Analysis of the contribution of transport policies to the competitiveness of the EU economy and com-parison with the United States
Report information:
Report no: 2
Title: COMPETE Final Report: Analysis of the contribution of transport policies to
the competitiveness of the EU economy and comparison with the United
States
Authors: Wolfgang Schade, Claus Doll (ISI), Markus Maibach, Martin Peter (INFRAS),
Fernando Crespo, Daniela Carvalho, Goncalo Caiado (TIS), Maurizio Conti,
Andrew Lilico, Nazish Afraz (EE)
Version: 2.1
Date of publication: 31.08.2006 (with editing corrections October 23rd 2006)
This document should be referenced as:
Schade W, Doll C, Maibach M, Peter M, Crespo F, Carvalho D, Caiado G, Conti M, Lilico A, Afraz N
(2006): COMPETE Final Report: Analysis of the contribution of transport policies to the competitiveness
of the EU economy and comparison with the United States. Funded by European Commission – DG
TREN. Karlsruhe, Germany.
Project information:
Project acronym: COMPETE
Project name: Analysis of the contribution of transport policies to the competitiveness of the EU economy and comparison with the United States.
Contract no: TREN/05/MD/S07 .5358 5
Duration: 01.01.2006 – 31.08.2006
Commissioned by: European Commission – DG TREN
Lead partner: ISI - Fraunhofer Institute Systems and Innovation Research, Karlsruhe, Ger-many.
Partners: INFRAS – Infras, Zurich, Switzerland.
TIS - Transport, Innovation and Systems, Lisbon, Portugal.
EE - Europe Economics, London, United Kingdom.
Document control information:
Status: Accepted
Distribution: COMPETE partners, European Commission
Availability: Public (only once status above is accepted)
Quality assurance: Ms Mahler-Johnston
Coordinator`s review: Dr. Wolfgang Schade
Signature: Date:


COMPETE Final Report: Contents - i -
Table of contents:
EU and US fact sheet ....................................................................................... 1
Foreword........................................................................................................... 2
Executive summary.......................................................................................... 5
1 Transport policy in the European Union and the United States .......... 24
1.1 Strategic policy documents in the EU and the US..................... 24
1.2 Transport policy implementation in the EU and the US............. 25
1.3 Policies and trends affecting transport cost, congestion and logistics ..................................................................................... 26
2 Transport operating cost in the EU and the US .................................... 28
2.1 Methodology.............................................................................. 28 2.1.1 Systems delimitation and structure ........................................... 28 2.1.2 Procedure for quantitative estimation........................................ 30
2.2 Operating costs 2005 ................................................................ 31 2.2.1 Total operating costs per country .............................................. 31 2.2.2 Cost structures .......................................................................... 33
2.3 Trends....................................................................................... 37 2.3.1 The influence factors................................................................. 37 2.3.2 Development in the past ........................................................... 38 2.3.3 Future trends............................................................................. 40
3 Congestion in Europe and the US .......................................................... 43
3.1 Introduction ............................................................................... 43
3.2 Applied approaches towards congestion monitoring ................. 43 3.2.1 Inter-urban road transport ......................................................... 43 3.2.2 Urban roads .............................................................................. 47 3.2.3 Scheduled transport services .................................................... 49
3.3 The Panorama of congestion .................................................... 50 3.3.1 Inter-urban road transport ......................................................... 50 3.3.2 Urban road congestion.............................................................. 53 3.3.3 Rail transport............................................................................. 55

- ii - COMPETE Final Report: Contents
3.3.4 Aviation delays .......................................................................... 58 3.3.5 Waterborne transport ................................................................ 61 3.3.6 Conclusions............................................................................... 63
3.4 Towards a harmonised approach for Europe ............................ 63 3.4.1 Requirements towards a congestion monitoring system ........... 63 3.4.2 Methodological options towards a harmonised approach ......... 64 3.4.3 Recommendations by mode...................................................... 69
3.5 Conclusions and research needs .............................................. 71
4 Congestion: Impacts and sector responses.......................................... 72
4.1 Economic impacts of congestion: An overview ......................... 72 4.1.1 General impact patterns............................................................ 72 4.1.2 General empirical evidence....................................................... 75
4.2 Sector analysis.......................................................................... 76 4.2.1 Transport industry ..................................................................... 77 4.2.2 Delivery and Retail .................................................................... 86 4.2.3 Manufacturing industry.............................................................. 87 4.2.4 Banking and insurance.............................................................. 88 4.2.5 Individual transport.................................................................... 89
4.3 Vulnerability of sectors and countries........................................ 89 4.3.1 An index for economic vulnerability to congestion..................... 89 4.3.2 Results ...................................................................................... 90
4.4 Conclusions............................................................................... 93
5 Structural change and its implications for transport............................ 95
5.1 Mega-trends affecting transport ................................................ 95
5.2 Implications of structural changes for development of logistics ..................................................................................... 97
5.3 Changes of trade patterns and trade flows of the EU and US ........................................................................................... 102
5.4 Structural change of the economies........................................ 109
5.5 Bottlenecks in future logistic systems...................................... 112
6 Impact of transport infrastructure on economic growth .................... 120
6.1 Background of the economic analysis..................................... 120

COMPETE Final Report: Contents - iii -
6.2 The impact of infrastructure policy in the EU and the US........ 125 6.2.1 Introduction ............................................................................. 125 6.2.2 The results of the simulated models........................................ 126
6.3 Conclusions............................................................................. 133
7 Developments of productivity in the transport sector........................ 135
7.1 Background of the economic analysis..................................... 135
7.2 Productivity of transport in the EU and the US........................ 136 7.2.1 Labour productivity growth rates ............................................. 136 7.2.2 Labour productivity levels........................................................ 139 7.2.3 Labour productivity in the transport sector: a finer
disaggregation......................................................................... 141 7.2.4 TFP in the transport and communication sector...................... 142 7.2.5 Conclusions............................................................................. 143
7.3 Impact of transport policies on productivity ............................. 144 7.3.1 Econometric analysis of transport policies on transport
productivity growth .................................................................. 145 7.3.2 Econometric analysis of the linkages between productivity
growth in the transport sector and productivity growth in some transport using sectors. ................................................. 153
7.4 Indirect employment effects of the transport sector................. 154
7.5 Conclusions............................................................................. 157
8 Importance of transport for competitiveness in the economies of the EU and the US.................................................................................. 158
8.1 The economic importance of transport .................................... 158
8.2 The influence of transport on competitiveness........................ 161
9 Conclusions ........................................................................................... 164
10 Further research questions................................................................... 165
11 Glossary of terms .................................................................................. 166
12 References.............................................................................................. 168

- iv - COMPETE Final Report: Contents
List of tables
Table 1: Glance on structural parameters of the EU and the US ................................... 1
Table 2: Summary of results of the seven COMPETE areas ......................................... 3
Table 3: Passenger and freight modal-split in EU15 and US in 2000 in [%]................... 6
Table 4: Total transport operating cost in the EU and the US (2005) in [bn. EUR] ........ 7
Table 5: Average transport operating costs per veh-km in the EU and the US (2005) in EUR/veh-km (for rail: EUR/train-km) ..................................... 8
Table 6: Average transport operating costs per passenger-km and ton-km in the EU and the US (2005) in EUR/pkm and EUR/tkm................................ 8
Table 7: Synthesis of country reviews - aviation............................................................ 9
Table 8: Travel time index in EU and US cities 2003 ................................................... 11
Table 9: Economic characteristics of operating costs................................................... 28
Table 10: Structure and elements of operating cost ..................................................... 29
Table 11: Total transport operating costs in the EU and the US (2005) – Data in bn. EUR .............................................................................................. 31
Table 12: Influence factors relevant for the development of transport operating cost ..................................................................................................... 37
Table 13: Future development of average transport operating costs (per vkm, in real prices) .......................................................................................... 42
Table 14: Summary of studies on inter-urban congestion, methodologies................... 46
Table 15: Summary of studies on inter-urban congestion, selected results ................. 47
Table 16: Summary of studies on urban congestion, methodologies ........................... 48
Table 17: Summary of studies on urban congestion, selected results ......................... 49
Table 18: International comparison of congestion figures 1993 ................................... 52
Table 19: Synthesis of country reviews - inter-urban road .......................................... 53
Table 20: Travel time index in EU and US cities 2003 ................................................. 54
Table 21: Synthesis of country reviews - urban road.................................................... 54
Table 22: Railway punctuality figures in EU and US .................................................... 56
Table 23: Synthesis of country reviews - rail transport ................................................ 57
Table 24: Summary of European and US airport analyses .......................................... 60
Table 25 – Resume of percentage of delayed flight and causes by airport and region.................................................................................................. 60
Table 26: Synthesis of country reviews - aviation........................................................ 61

COMPETE Final Report: Contents - v -
Table 27: Results for selected EU and US seaports .................................................... 62
Table 28: Synthesis of country reviews - waterborne transport.................................... 63
Table 29: Synthesis of country reviews - aviation........................................................ 63
Table 30: Assessment of traffic congestion measures ................................................. 65
Table 31: Assessment of congestion indicators ........................................................... 67
Table 32: Reasons of congestion according to multiple studies................................... 68
Table 33: Overview of reactions to congestion and their impacts ................................ 72
Table 34: Calculated shipping delay costs, by industry ................................................ 76
Table 35: Cost for impediments (Road freight and busses/coaches) ........................... 78
Table 36: Reliability ratio (relation between value of time and additional value for reliability) for different journey purposes............................................. 79
Table 37: Index on vulnerability on congestion, year 2000........................................... 92
Table 38: Relation between global economic mega-trends and international logistic trends...................................................................................... 97
Table 39: Road haulage logistical qualitative effects matrix ....................................... 100
Table 40: Rail transport logistical qualitative effects matrix ........................................ 101
Table 41: Air transport logistical qualitative effects matrix.......................................... 101
Table 42: Maritime transport logistical qualitative effects matrix ................................ 102
Table 43: Resume of potential bottlenecks per European regional cluster ................ 114
Table 44: Resume of potential bottlenecks per US regional cluster ........................... 118
Table 45: Elasticities of Output with respect to Public and Private Capital and Labour............................................................................................... 123
Table 46: Basic equations for the model with leisure (leisure) and the model of Barro and Sala I Martin (BSIM)......................................................... 127
Table 47: Transport-related parameters and initial values. EU15 and USA ............... 128
Table 48 Compounded LP growth for EU15 and new member states and US in the transport sector, 1979 - 2003 ............................................................ 138
Table 49: Selected LP levels (1995 € per hour) for EU15 and new member states and US in the transport sector, 1980 - 2003....................................... 141
Table 50: LP levels (1995€ per hour) in transport sub-sectors in the EU15 and USA .................................................................................................. 142
Table 51: TFP growth regression. Transp&Comm. sector ........................................ 150
Table 52: Summary of multiplier effects....................................................................... 156

- vi - COMPETE Final Report: Contents
List of figures
Figure 1: Total operating costs in relation to GDP.......................................................... 7
Figure 2: Average congestion costs for EU15, Switzerland and Hungary .................... 10
Figure 3: Time series of punctuality data for selected railway undertakings ................ 12
Figure 4: Long-term comparison between delay rates in US and European air transport.............................................................................................. 13
Figure 5: Relations between different operating cost measures (yellow boxes) with the corresponding influence factors (white boxes) ...................... 31
Figure 6: Total operating costs in relation to GDP in 2005 ........................................... 32
Figure 7: Average costs (per pkm) for passenger transport – EU, CH and USA.......... 34
Figure 8: Average costs (per tkm) for freight transport – EU, CH and USA ................. 34
Figure 9: Average costs (per vehicle-km) for road passenger and road freight transport.............................................................................................. 35
Figure 10: Average costs (per train-km) for rail transport – aggregated data............... 36
Figure 11: Share of commercial and individual transport costs in the EU and USA..... 36
Figure 12: Transport price development vs. consumer price index in the EU and the USA .............................................................................................. 39
Figure 13: Transport price development for the EU and the US (Index: 1996 = 100)..................................................................................................... 39
Figure 14: Average congestion costs for EU15, Switzerland and Hungary .................. 51
Figure 15: Time series of punctuality data for selected railway undertakings .............. 57
Figure 16: Long-term comparison between delay rates in US and European air transport.............................................................................................. 59
Figure 17: Reaction patterns of the transport sector to congestion and related consequences..................................................................................... 73
Figure 18: Reaction patterns within passenger transport ............................................. 74
Figure 19: Reaction patterns within freight transport .................................................... 75
Figure 20: Transport intensity and congestion vulnerability index per sector (average of 11 countries). Index: 1 (not vulnerable) up to 5 (very vulnerable) .......................................................................................... 91
Figure 21 – Overview of changes in economic activity and road freight transport 1985-1995........................................................................................... 99
Figure 22: Schematic representation of the main increases in the trade flows for the EU Member States analysed ...................................................... 108
Figure 23: Clusters of regions for analysis of potential congestion and bottleneck in transport and logistics ................................................................... 119

COMPETE Final Report: Contents - vii -
Figure 24: Welfare Effects of changes in parameters................................................. 132
Figure 25: LP growth compared in EU15 and US: 1980 – 2003 (complete transport sector)................................................................................ 138
Figure 26: Labour productivity levels in the EU and the US transport sectors (1979-2002) € per hour..................................................................... 140
Figure 27: Contributions of transport to employment and production......................... 159

- viii - COMPETE Final Report: Contents
List of abbreviations
ACA Additional Cost Approach (for congestion measurement)
ACI Airports Council International
AEA Association of European Airlines
AFTM, ATM Air flight traffic management
AUS Australia
AUT Austria
b€ Billion EURO
BLX Belgium & Luxemburg
bn Billion
BTD OECD STAN Bilateral Trade Database
CAN Canada
CEDR Centre of European Directors of Roads (Brussels)
CER Centre of European Railways and Infrastructure Operators (Brussels)
CHE Switzerland
CHPS Czech Republic, Hungary, Poland and Slovakia countries
CODA Central Office for Delay Analyses, Eurocontrol (Brussels)
ConsHH Consumption of households
CZE Czech Republic
DB Deutsche Bahn AG (German Railways)
DNK Denmark
DWL Deadweight Loss Approach (for congestion measurement)
EC European Commission
ECMT European Conference of Ministers of Transport
ESA European System of Accounts
ESP Spain
ETS (European) Emission Trading System
EU European Union
EU15, EU-15 15 EU member states before May 2004
EU10, EU-10 10 new member states acceding to the EU in May 2004
EU8, EU-8 8 of the 10 NMS excluding Cyprus and Malta
FCD Floating car data
FHWA US Federal Highway Administration
FIN Finland
FRA France
GBR United Kingdom

COMPETE Final Report: Contents - ix -
GDP Gross domestic product
GER Germany
GPS Global positioning system
GRC Greece
GVA Gross-value added
HGV heavy goods vehicle (> 12t gross weight)
HUN Hungary
IATA International Air Traffic Association
ICAO International Civil Aviation Orgainsation
IEA International Energy Agency
InterP Production of intermediates
IO-table Input-Output-table
IRL Ireland
ITA Italy
IVEC Index on vulnerability of the economy to congestion
JIT Just-in-time
JTV journey time reliability/variation
km kilometre
kph kilometres per hour
LGV light goods vehicle (< 12t gross weight)
LOS Level of Service
LP Labour productivity
m€ Million EURO
MotorV Road vehicle production sector
MSCP marginal social cost pricing
NLD The Netherlands
NLE Narrow Logistics Expenditure
NMS 10 new member states of the EU as of May 2004
NMS5, NMS-5
5 of the NMS i.e. Czech Republic, Hungary, Poland, Slovenia, and Slovakia
NOR Norway
OECD Organisation for economic co-operation and development
OthVeh Sector for production of trains, ships, planes (= non-road vehicles)
P. T. Public Transport
PBKAL Paris-Brussels-Cologne-Amsterdam-London high-speed rail network
PCU passenger car unit
pkm passenger kilometres

- x - COMPETE Final Report: Contents
POL Poland
PQA Perceived Quality Approach (for congestion measurement)
PRT Portugal
SAFETEA-LU Safe, Accountable, Flexible, Efficient Transportation Equity Act: A Legacy for Users (US Transport Strategy of 2005)
SUV Sports utility vehicle
SVK Slovakia
SWE Sweden
t tons
TEA-21 US Transportation Equity Act for the 21st Century
TFP Total factor productivity
tkm ton kilometres
TMC traffic message channel
TTI Texas Transportation Institute
UCT Unaccompanied combined (freight) transport
UIC International Union of Railways (Paris)
UK United Kingdom
US United States of America
US-DOT United States Department of Transportation
US-EIA United States Energy Information Administration
vkm vehicle kilometres
VOT value of time


COMPETE Final Report: EU and US fact sheet - 1 -
EU and US fact sheet
Table 1: Glance on structural parameters of the EU and the US
European Union United States
Unit EU15 EU10 EU25 US
2000 2004 2000 2004 2000 2004 2000 2004
Area 1000
km²
3,236 738 3,974 9,360
Population mill 377 381 75 74 452 455 282 294
GDP (current
prices)
bill
EURO
8,710 9,963 381 486 9,091 10,449 10,689 (5)
9,434 (5)
Cars 1000 179,020 189,672(1)
20,567 22,824(1)
199,587 212,496 (1)
191,930 (3)
205,672 (3)
Motorways km 51,625 55,093 (2)
2,863 3,038 (2)
54,488 58,131 (2)
55,567 (4)
56,818 (4)
Railways km 151,781 49,997 201,778 159,792
Passenger
performance
bill-
pkm
4,779 972 5,751 5,970 7,586 8,087 (1)
Freight
performance
bill-
tkm
3,078 385 3,463 3,804 5,383 5,524 (1)
(1) 2003. (2) 2002. (3) includes car, pickups and sports-utility-vehicles. (4) includes interstates, freeways and expressways. (5) in current dollars: 2000: 9,817; 2004: 11,734 bill $.
Source: EC 2002, EC 2005a, ERF 2004, EUROSTAT 2006a, FHWA 2004, own calculations

- 2 - COMPETE Final Report: Foreword
Foreword
Competitiveness is a key word of today's policy discourse. Nevertheless, competitiveness con-
stitutes a concept with many different meanings and even conflicting definitions. In a US
study similar to COMPETE the authors Lakshmanan, Anderson and Li (2005) quote that in the
literature the position can be found that the concept of competitiveness can be assigned to
companies but not at all to nations. It becomes even more difficult when it comes to the
question of how transport fosters competitiveness of a nation.
However, Lakshmanan et al. then argue in a qualitative manner to conclude that the "physi-cal and non-physical infrastructure of the US transport systems are key ingredients of the
competitiveness of US firms in the international arena." Though the intention of the authors
might have been to present a robust causal chain how transport improved the US competi-
tiveness analysing trade data, transport evolution, transport cost data etc. it is finally a quali-
tative argumentation stating that high quality transport generates scale economies in capital
service provision, logistical savings of time and cost, locational flexibility for companies and
national economic integration creating scale economies for transport users and hence im-
proves the competitiveness of the whole nation.
COMPETE tackles the same question of how transport contributes to the competitiveness of
the EU and, additionally, how effective it is compared with the US. Though COMPETE broad-
ened the scope of analysis by including congestion impacts, by analysing structural change
and by analyses applying economic models the finally proved, quantified causal chain on how
transport actually improves competitiveness of nations could not be provided.
COMPETE succeeded in elaborating and quantifying a large number of data for the EU and
the US like transport operating cost data, congestion data, trade data, data on the economic
and spatial structure and finally the productivity of the transport sector. However, the final
step to quantify the impact of transport on competitiveness is left open and, similar to the
Lakshmanan et al. study, has to be bridged by a qualitative line of arguments.
The summary of this line of arguments is provided in Table 2 on the following page. Finally
we would argue that:
concerning intra-regional transport the status of the EU transport system with
higher sophistication of logistic systems and larger supply of transport alternatives
contributes better to the competitiveness of the EU than the US transport system for
the US.
concerning inter-regional transport from or to the EU and the US both transport sys-
tems are of equal effectiveness in promoting competitiveness, though the EU system
disposes of a more sophisticated port structure and better land connections while
the US system has a more developed air transport system.
Furthermore, we would argue that besides the more advantageous spatial structure of the EU
compared with the US also the EU transport policy of the past 15 years contributed success-
fully to improve the logistics system and the co-evolution of alternative modes and by that
succeeded to foster European competitiveness, not only as such but also in comparison with
the US.

COMPETE Final Report: Foreword - 3 -
Table 2: Summary of results of the seven COMPETE areas Area Topic EU25 US Spatial structure Economic centre 50% of GDP concentrated within
<1200 km distance
4 economic centres with distances
>3000 km
Average pop-density of
medium size cities
2,280 persons/km² for 122 cities with
0.2 to 1 million inhabitants
1,360 persons/km² for 90 cities with
0.2 to 1 million inhabitants
Transport policy Similar national and
supra-national objectives
Balancing modes, eliminating bottle-
necks, user orientation, globalisation,
efficiency, safety, security
Safety, mobility, global connectivity,
environmental stewardship, security,
put people first
Similar policy implementa-
tion
Planning and creating supra-national
transport infrastructure
Planning and creating supra-federal-
state transport infrastructure
Foster transport innovations Foster transport innovations
Policy differences Focus on transport charging Focus on low fuel taxation
High-speed rail network Few high-speed rail lines
Operating cost Transport expenditure 19% of GDP in 2005 24% of GDP in 2005
Unit cost passenger
in 2005
Road: 27 EUROcent/pkm
rail: 17 EUROcent/pkm
Road: 23 EUROcent/pkm
rail: 11 EUROcent/pkm
Unit cost freight
in 2005
Road truck: 14 EUROcent/tkm
rail: 11 EUROcent/tkm
Road truck: 20 EUROcent/tkm
rail: 1 EUROcent/tkm
Congestion Policy priority Top priority Top priority
Public view More severe problem Not a severe problem, growing impor-
tance
Congestion monitoring Fragmented, best for air transport,
mostly kept private for rail
Urban roads and air well-developed,
else fragmented
Urban road transport In capitals and urban arterials In urbanized areas
Interurban road transport In EU economic centre Port hinterland and highway crossings
Rail Inter-operability at border crossings,
high speed and port hinterland
Systematic punctuality problem at
long-distance services
Ports Rotterdam approaches limits, most
other ports well below capacity
Most ports at capacity, limited alterna-
tives esp. at Pacific Coast
Airports Severe for major hubs and related
network carriers
Severe for Eastern US hubs; top-5
airports below capacity limits
Most affected sectors Transport services (esp. road freight,
airlines, logistics), food, retail
Transport services (esp. airlines)
Structural change Trade Strongest growth Intra-EU Strongest growth NAFTA, China
Logistics Strong growth of logistics sector Moderate growth of logistics sector
Bottlenecks North-Atlantic ports, central road
network, international railways
Pacific ports, some urban road net-
works
Economics Productivity of transport EU15 high growth in 1990ies Moderate growth in 1990ies
Total factor productivity
of transport (TFP)
TFP differentials partly explained by
differences in capital intensity between
countries
Similar growth as in top performing
countries of EU15
Share of transport on
production
10% in 2002 of which 4.2% transport
equipment, 5.8% transport services
6.2% in 2002 of which 3.2% transport
equipment, 3% transport services
Competitiveness Intra-EU and Intra-US
transport, respectively
Though more congested, the transport system in the EU seems to be less con-
strained due to advantages of spatial structure, partially less costly modes,
higher sophistication of logistics and the greater supply of alternative modes.
Hence, it better contributes to the competitiveness of the EU than the US trans-
port system for the US.
International transport
from/to EU or US, respec-
tively
Advantages of the EU ports system and availability of more land connections
stand against the more developed US air transport system such that Europe
gains in global freight shipment competitiveness, while the US manages global
passenger flows more efficiently. The relatively higher dependency of air trans-
port increases US vulnerability (security issues are influencing quality and capac-
ity more and more).
Source: COMPETE


COMPETE Final Report: Executive summary - 5 -
Executive summary
Background
The European Commission tendered this study broadly to analyse the importance of trans-
port in fostering European competitiveness and to capture the role of a number of influenc-
ing factors shaping the impacts of transport, in particular the operating cost and congestion.
A core element of the analysis should be the comparison between the EU and the US. The
main objectives of the COMPETE project are fivefold:
To analyse past, current and expected future trends of operation costs of transport
for the EU and US.
To draw a Panorama of Congestion for the EU and the US.
To describe trends of structural economic change and their potential impacts on
transport.
To investigate how changes in costs and congestion, in economic structures as well
as of transport policies affect the productivity of the transport sectors, and
To estimate how the transport system itself influences productivity and competitive-
ness of the European economies.
Transport policies in the EU and the US
The broad concepts of transport polices in the EU and the US are comparable, as the EU for-
mulated in its White Paper of 2001 the four main objectives (1) shifting the balance between
modes of transport, (2) eliminating bottlenecks, (3) placing users at the heart of transport
policy and (4) managing the globalisation of transport. The US sets out in the strategic plan
for 2003 to 2008 the objectives (1) safety, (2) mobility, (3) global connectivity, (4) environ-
mental stewardship and (5) security. Of course, the latter objective was also considered in the
EU as a high priority after the terrorist attacks in September 2001.
Also both, the EU and the US have recently highlighted the objective of transport to generate
innovations and vice versa the need to bring innovations into the transport system, in particu-
lar new propulsion concepts and alternative fuels. In terms of introduction of transport pric-
ing policies the US is converging towards the EU, as the latter is promoting transport pricing
since about a decade while in the US only in recent policy programs transport pricing is con-
sidered as an option to be tested in pilot applications.
Another significant difference between the two policy approaches concerns fuel taxation. In
the EU countries fuel taxation is about five to fifteen times higher than in the US. The usage
of fuel tax revenues in the US is strictly dedicated for infrastructure provision, in particular
highways, while in some EU countries at least a share of fuel tax revenues goes into the gen-
eral government budget.
Besides a reflection on the transport policies in the EU and the US a glance on the actual
situation of transport should provide the starting point for the following analyses. Table 3
presents the modal-split for passenger and freight transport for the year 2000 comparing the

- 6 - COMPETE Final Report: Executive summary
EU15 with the US. Obviously car transport is the dominating mode of passenger transport for
both regions. In the EU15 rail and bus attract significantly higher shares than in the US, while
air transport is nearly double in size in the US than in the EU15.
For freight transport the differences are even more significant with road being the strongest
mode in EU15 while it is rail in the US1, though road also holds a strong position in the US.
The most amazing differences for freight transport concern rail and sea shipping which differ
by about five times with rail being stronger in the US and sea shipping in the EU15.
Table 3: Passenger and freight modal-split at pkm and tkm for EU25, EU15 and US [%]
Passenger modes EU25 2003
EU15 2000
US 2000
Freight Modes EU25 2003
EU15 2000
US1 2000
Passenger car (1) 76.8 77.8 84.8 Road 43.5 44.3 29.8
Bus / coach 8.1 8.6 3.4 Rail 10.1 8 38.3
Railway 5.8 6.4 0.3 Inland waterways 3.3 4 9.4
Tram + metro 1.2 1.0 0.3 Oil pipeline 3.4 2.7 15.1
Waterborne 0.6 0.5 Sea
(domestic/intra-EU)
39.6 40.9 7.4
Air
(domestic / intra-EU)
7.5 5.9 11.2
Source: EC 2003, EC 2005c, (1) including two wheelers and light vans in US
Despite these differences in the actual transport situation - which to a significant extent are
due to the different geographic structure of the EU and the US with longer travel distances in
the US - the transport policies in both world regions are rather congruent with respect to the
core topics of COMPETE i.e. to reduce transport cost and congestion, to improve transport
productivity and overall competitiveness.
Total operating cost in the EU and the US
Total operating cost in the EU25 account for 1982 bn EUR or 19% of GDP. For the US, the
corresponding figure is 2’278 bn EUR or 24% of national GDP (see Table 4). The biggest part
in the EU25 are operating cost for road passenger transport (64%). The second largest part is
road freight transport with 22% in EU25. In contrast, in the US road passenger and road
freight transport reach similar shares with 45% for the former and 47% for the latter. The
total operating costs for the other modes (rail, air, water) are in both regions considerably
lower.
1 A recent publication of the US-DOT (2006a) provides different modal shares for freight given as composite esti-
mates measured in terms of ton-miles for the single modes in the year 2002: road: 37.2%, rail: 33.7%, inland-waterway: 11.9%, air: 0.3%, pipeline: 16.9%. The difference emerges due to the inclusion of a number of sectors that in statistics derived from the US Commodity Flow Survey (like the one shown in Table 3) have not been considered.

COMPETE Final Report: Executive summary - 7 -
Table 4: Total transport operating cost in the EU and the US (2005) in [bn. EUR]
Transport mode EU15 NMS5* EU25** USA Road passenger 1'239 37 1'276 1'039Road freight 420 20 441 1'072Rail 84 7 92 26Air 155 6 162 137Water 12 n.d.a. 12 4Total 1'911 71 1'982 2'278
* NMS5 means the following 5 countries of EU10: Czech Republic, Hungary, Poland, Slovenia, and Slovakia. ** Without Baltic countries, Malta and Cyprus. n.d.a.: no data available. Source: COMPETE calculations.
The most important influencing factor on total operating cost (i.e. total expenditures of
transport users for their transport activity) is transport performance of each country, which is
based on national transport statistics. Comparing the total operating costs in relation to GDP
of European countries, Western Europe has a higher share of GDP than Eastern Europe (cal-
culated for NMS5). Looking at the different countries, we observe a high share of costs in the
US as well as in Finland, France and Denmark and a low share in Slovakia and Ireland (see
Figure 1).
Several reasons are to consider in order to interpret the country-wise results properly. A main
reason is the higher share of individual passenger transport due to higher income (e.g. higher
density of cars, more leisure trips). This explains the relatively lower share of costs to GDP in
Europe. Another reason is the national transport levels, for example the high level of passen-
ger and freight kilometres per capita or per GDP of US and Finland compared to other Euro-
pean countries. A third element (as well true for Finland) is the level of average costs. Finland
for example reveals – compared to other countries – rather high costs per vehicle kilometre as
well as high freight transport intensity. The US on the other hand have rather low costs per
vkm, but also a high (freight) transport intensity with comparably lower efficiency (e.g. load
factors).
0%
5%
10%
15%
20%
25%
30%
35%
BE CZ DK DE GR ES FR IE IT LU HU NL AT PL PT SL SK FI SE UK CH US EU-15 NMS-5*
Relative Costs (in relation to GDP)
Road Passenger Road Freight Rail Air Water
Figure 1: Total operating costs in relation to GDP
Source: COMPETE calculations. See section 2 and COMPETE Annex 1.

- 8 - COMPETE Final Report: Executive summary
Average operating cost
Average operating cost can be distinguished per unit of transport performance (pkm or tkm)
and per vehicle-kilometre (vkm). These values differ significantly between the different re-
gions of the EU and the US. In some cases, the EU provides more efficient transport services
while in others it is the US. Table 5 and Table 6 show that for road transport it is always that
the EU15 is the most expensive region in terms of cost per vkm, followed by the US and the
NMS (here NMS5). However, due to the higher load factors in the EU15 the cost per tkm of
road freight transport is most expensive in the US followed by the EU15 and then the NMS.
Table 5: Average transport operating costs per veh-km in the EU and the US (2005) in EUR/veh-km (for rail: EUR/train-km)
Transport mode EU-15 NMS-5* EU25** USA Passenger cars (EUR/veh-km) 0.43 0.21 0.42 0.29Buses (EUR/veh-km) 1.87 0.67 1.78 1.77Coaches (EUR/veh-km) 1.33 0.59 1.22 1.42HDV (EUR/veh-km) 0.89 0.34 0.85 0.87LDV (EUR/veh-km) 1.11 0.46 1.03 1.00Rail (passenger & freight) (EUR/train-km)
27.74 11.42 24.99 23.77
* NMS-5 means the following five of the ten new EU member states: Czech Republic, Hungary, Poland, Slovenia, and Slovakia. ** Without Baltic countries, Malta and Cyprus.
Table 6: Average transport operating costs per passenger-km and ton-km in the EU and the US (2005) in EUR/pkm and EUR/tkm
Transport mode EU-15 NMS-5* EU25** USA
Passenger Passenger cars (EUR/pkm) 0.28 0.10 0.27 0.23Buses (EUR/pkm) 0.12 0.04 0.11 0.20Coaches (EUR/pkm) 0.10 0.03 0.09 0.07Rail passenger (EUR/pkm) 0.19 0.03 0.17 0.11Air passenger (EUR/pkm) 0.45 0.77 0.46 0.15Freight HDV (EUR/tkm) 0.15 0.07 0.14 0.20LDV (EUR/tkm) 5.39 1.81 5.05 3.46Rail freight (EUR/tkm) 0.12 0.06 0.11 0.01Air (EUR/available tkm)*** 0.75 0.84 0.75 0.47Short Sea Shipping (EUR/tkm) 0.009 n.d.a. 0.009 0.004Inland Waterways (EUR/tkm) 0.008 n.d.a. 0.008 0.006
* NMS-5 means the following five of the ten new EU member states: Czech Republic, Hungary, Poland, Slovenia, and Slovakia. ** Without Baltic countries, Malta and Cyprus. *** available tkm rely to passenger and freight transport. n.d.a.: no data available.
Source: COMPETE calculations. See section 2 and COMPETE Annex 1.
Future trends of operating cost
Due to a number of trends the average operating cost for transport is expected to slightly
rise in the future. Major reasons will be the continuous increase of quality of transport, the
increase of fuel prices due to a number of reasons like scarcity effects or climate policy ap-

COMPETE Final Report: Executive summary - 9 -
proaches. Dampening effects would come from the further liberalisation process in Europe
and the modal-shift e.g. towards rail presupposed that rail transport further improves its
quality.
The total operating costs are expected to grow even stronger due to the combination of
real price increases and growth of transport demand.
Panorama of Congestion
The COMPETE project has developed a detailed Panorama of Congestion by interviewing
experts in all European Member States, the US and Switzerland, supported by global as well
as country-wise literature reviews on transport quality measures, the status of congestion and
related policy options. The interviews were based on a questionnaire that partially is filled by
international experts and partially by COMPETE project partners on the basis of telephone
interviews and literature reviews. In addition, two separate case studies on comparing the
situation in European and US airports and seaports have been carried out as these two mar-
kets appear highly dynamic.
Table 7 briefly summarises the findings by mode and draws a direct comparison between
Europe and the US (for details see section 3 and Annex 3). It gets obvious that, besides avia-
tion, the EU is facing less congestion problems than the US. Thus, the EU seems to be better
prepared to take the expected rise in international freight transport. In particular the better
situation in seaports makes Europe competitive in the fast growing trans-continental logistics
market.
Table 7: Synthesis of country reviews
Mode Europe US
Inter-urban roads
Mainly Randstad and Ruhr areas and urban access C ➘
Highway intersections and around agglomerations B ➘
Urban roads Severe congestion in some cities, no general problem
C ➘ Steadily increasing but not perceived as major problem
D ➘
Rail Only at port hinterland lines; technical standards B ➔
Considerable lag in grade-separated facilities in major lines
D ➘
Aviation Problems in major hubs (London, Paris); airspace
C ➘ Constant investments and still recovery from 9/11
B ➚
Waterborne transport
Only port hinterland trans-port (Rotterdam) B ➔
Port capacity and conges-tion on hinterland routes D ➘
Legend: A (= congestion-free) to E (totally congested): Current situation. ➘➘ (fastly declining quality) to ➚➚ (clearly improving conditions): expected future transport system quality
Panorama of Congestion: interurban road transport
Quantitative information from official studies on inter-urban road congestion in Europe and
the US is sparse and heterogeneous. The most comprehensive data sets are provided by the
UNITE project (Nash et al. 2002) and by Maibach et al. (2004) mainly for Western European
countries (Figure 2).

- 10 - COMPETE Final Report: Executive summary
Average congestion costs
0
20
40
60
80
100
120
140
160
Austria
Belgium
Denmark
Finlan
d
France
German
y
Greece
Hunga
ry
Irelan
dIta
ly
Luxe
mburg
Netherl
ands
Portug
alSpa
in
Sweden
Switzerl
and UK
Euro
/ 10
00 v
ehic
le-k
m
UNITE, all vehicle types Infras/IWW, passenger cars Inffas/IWW, HGVs
Figure 2: Average congestion costs for EU15, Switzerland and Hungary
Source: Infras/IWW: Maibach et al. (2004), UNITE: Nash et al. (2002)
The state of road congestion across Europe differs between countries and regions:
Germany, the Benelux countries and the southern part of the UK take an out-
standing position as here the density of large urban areas causes considerable con-
gestion on the entire trunk road network.
France, Poland, Spain and a number of periphery countries perceive congestion on
the trunk road network as a problem around urban areas.
In particular in Poland an additional problem is the poor physical quality of trunk
roads.
In a large number of periphery countries, including Scandinavia, the Baltic countries,
Slovakia, Slovenia and Greece inter-urban congestion is not a real issue.
The Alpine countries are mainly affected by congestion caused by holiday and lei-
sure car traffic. But different to Switzerland, the Brenner route in Austria suffers a
congestion risk from heavy lorry traffic.
In the US inter-urban congestion is a problem at interstate highway crossings and around
metropolitan areas. In particular hinterland connections to important ports are frequently
congested. Nevertheless, across the entire country congestion currently appears much less
expressed than in Europe.
Forecasts of congestion for the US and for most European countries assume a rise in conges-
tion levels. This appears particularly alarming for the anyway highly congested areas in the
UK, the Netherlands and the Ruhr area, but also for US interstate highway crossings.

COMPETE Final Report: Executive summary - 11 -
Panorama of Congestion: urban road transport
Urban road congestion to a large extent depends on the size of the city and on the (non-)
availability of high quality alternative modes. Table 8 presents the travel time index, e. g. the
ratio between average and free flow speeds in peak traffic, for some European cities and for
an average over 85 US urban areas, where available over time.
Table 8: Travel time index in EU and US cities 2003 Area Travel time index
1993 2004 1993-2004
Paris, Ile-de-France 1,34
Greater Copenhagen area 1.40
Greater London 1.84
Average of other English cities 1.24 1.32 0.08
US 85 Area Average 1.28 1.37 0.09
US Very large average (13 areas) 1.38 1.48 0.10
US Large average (26 areas) 1.19 1.28 0.09
US Medium average (30 areas) 1.11 1.18 0.07
US Small average (16 areas) 1.06 1.10 0.04 Source: Own estimations; Schrank and Lomax (2006)
The most congested urban areas are located in the UK, in Central and in Southern Europe.
The most affected agglomerations are Paris, London, Prague, Athens and the big Spanish and
Italian cities. In some cases, e. g. Prague, peak traffic has spread out to the off-peak periods,
such that off-peak is only visible during night time. For other big and medium-sized capitals,
such as Berlin, Zurich, Vienna, Warsaw, Stockholm, Helsinki or Copenhagen usual peak hour
or only mild congestion is reported. In most of these cases congestion is rather a problem of
access links as is reported for Polish and French Conurbations.
Though the TTI Urban Mobility Study (Schrank and Lomax, 2006) reports a significant in-
crease in urban congestion, remarkably, it is not considered a major problem for most US
citizens as the ability to relocate to non-congested areas within a city or across states is high.
Other urban problems, such as security, school quality and environment, are considered more
severe. The TTI mobility index shows that congestion rises more dynamically in large and me-
dium sized areas than in very large agglomerations.
Panorama of Congestion: rail transport
Comparing annual punctuality figures of European and US railways (Figure 3) indicates, that
European companies are generally more punctual than Amtrax on the US. But it also gets
obvious that long-distance services are less reliable than local services

- 12 - COMPETE Final Report: Executive summary
Internatinal punctuality rates
40%
50%
60%
70%
80%
90%
100%
110%
1998 1999 2000 2001 2002 2003 2004 2005
Pun
ctua
lity
(diff
eren
t mar
gins
)
Amtrax total Amtrax long distance Eurostar high speedEurope Intermodal Trains UK total UK Long distanceCzech Railways Spain - AVE high speed Spain - Talgo 200Spain - long distance Switzerland, SBB Cargo
Figure 3: Time series of punctuality data for selected railway undertakings
In Europe major rail bottlenecks include the French high speed lines, French and German lines
which have not been upgraded for high speed trains (e.g. East-West connections in France
and the Rhine axes), and the connections from Dutch seaports to the German border. Fur-
ther, capacity shortages on the German network reach out to Switzerland and to the Nether-
lands. The New member states report that the physical quality of the network, of the stations
and the rolling stock, incident and track works cause more delays than pure capacity re-
straints.
Due to missed investments in the past, US networks are even more congested. Major bottle-
necks are the lag in grade-separated facilities in the Los Angeles and Chicago regions causing
considerable problems in freight shipment.
Panorama of Congestion: aviation
For Europe the results show capacity shortages at the London airports, being much more
critical than at other major hubs, such as the Paris airports, Frankfurt or Madrid. Most of the
US airports have still not recovered from the 2001 crises. Among the top-5 US airports only
Los Angeles urgently suffers from congestion and in Atlanta some problems with ATM delays
are indicated. Chicago, Dallas and Las Vegas operate below their capacity limits and show no
signs of severe congestion.
Comparing the long-term trends in overall delayed flights between Europe and the US (Figure
4) reveals that delay rates in the two regions across all airports are similar, but the EU devel-
opment appears slightly more dynamic. While until the mid 1990s intra-European flights have
been more on time, their punctuality has dropped significantly after the Kosovo conflict in
1999 and since then has remained worse than US punctuality figures.

COMPETE Final Report: Executive summary - 13 -
European and US average air traffic delay rates
0%
5%
10%
15%
20%
25%
30%
35%
1992 1993 1994 1995 1996 1997 1998 1999 2000 2001 2002 2003 2004 2005
Del
ays
>15
min
utes
USA, major air carriers Europe, Top-27 airports
Figure 4: Long-term comparison between delay rates in US and European air transport
Sources: BTS (2006) and AEA (2000 to 2006)
Panorama of Congestion: waterborne traffic
Case studies of 20 European and US ports and the COMPETE country reviews show a clear
discrepancy between the highly congested US ports and the European market. EU ports and
inland navigation networks do not operate under full capacity utilisation and thus are ready
to take the strong increase in container movements expected for the coming decades. In con-
trast, the US faces a strategic problem as most ports are located within urban areas and thus
can not be further expanded.
International practice of measuring congestion and delays
In road transport there are several applied approaches to measure congestion, which widely
differ between countries in Europe. In England annual measurements of travel speeds on
urban and inter-urban roads are performed since 1993, while since 1998 in the Netherlands
the extension and duration of traffic jams on motorways are automatically detected and as-
sessed and the region of Ile-de-France continuously evaluates speed and flow measurements
on motorways. Other countries or regions, such as Germany, Switzerland, the French Medi-
terranean arc, Scotland and the Greater Copenhagen Region perform one-off studies on traf-
fic congestion mainly based on modelling traffic flows. The most continuous and comprehen-
sive approach, however, is followed by the US. The Urban Mobility Study models urban con-
gestion in 85 areas of different size using time series of traffic flows dating back to 1982.
In scheduled transport the measurement of delays is rather straightforward compared to road
transport. To maintain operations, railway companies are generally well-informed about level
and causes of delays. However, to large extent these delay statistics are kept secret. Flight
delays in Europe are published by Eurocontrol and by the Association of European Airlines’
(AEA) annual consumer reports since 1999. Similar reports are available for the US Depart-
ment of Transport. Delay statistics in the shipping sector are only kept by some ports for in-
ternal controlling purposes.

- 14 - COMPETE Final Report: Executive summary
European approach for congestion measurement
The review of studies in the field and the Panorama of Congestion have shown that the US
and Canada are quite advanced in measuring and monitoring congestion on their road net-
works, compared to Europe. Although there are interesting indicators in some Member
States, a regular monitoring of road congestion between countries is hardly possible. Hence,
on the basis of the studies reviewed the following recommendations for a harmonised and
pragmatic approach for congestion measurement in Europe emerge:
Congestion monitoring should be based on transparent indicators which can be
measured regularly. Most interesting are delay based indicators (in relation to a
benchmark such as free flow travel speed for road transport and a maximum late
time in scheduled services).
The delay monitoring must be dynamic by providing robust time series and it must
reflect the compliance of current traffic quality with policy targets. Therefore the
reference travel speed in road transport or the delay margin in air traffic must be
held constant over time. For road 60% of free flow or maximum permitted speed is
recommended. In rail passenger 5 minutes and in high quality rail freight and in
aviation 30 minutes delay margins are recommended.
Most urgent is the elaboration of a European system of a quality monitoring for
road transport, based on traffic speed monitoring on specific sections and daytimes
and the development of representative speed-flow functions across Europe, espe-
cially focussed on the TEN-T network and on critical urban access links.
In first instance recurrent congestion on a selected day in the year should be moni-
tored in road transport. In a later stage all delay causes should be added by estab-
lishing a continuous monitoring scheme. In scheduled transport all delay purposes
by delay cause should be considered.
Data sources in road transport are speed and flow measurements by automatic
counting posts (UN, national or local) or floating car vehicles. Speed-flow diagrams
should be estimated case by case to capture local conditions.
Further it is recommended to establish a European road traffic control centre har-
monising and assessing traffic messages. As a very first step towards such a system
for traffic conditions the daily number of traffic messages can be evaluated by sever-
ity and cause towards an initial traffic quality indicator. This approach is in particular
suitable for motorways.
For rail transport it is recommended to enforce railway companies to present de-
tailed annual delay statistics, comparable to the Eurocontrol analyses in air transport.
In a second stage the analysis of additional time losses due to missed connections is
recommended (for rail and hub airports).

COMPETE Final Report: Executive summary - 15 -
Index on vulnerability of the economy to congestion (IVEC)
Since, only the transport sector itself disposes of partly quantitative information on the eco-
nomic vulnerability to congestion and related costs of congestion we developed a quantita-
tive indicator measuring the sectoral vulnerability to congestion, the so-called Index on vul-nerability of the economy to congestion (IVEC).
The IVEC combines quantitative information on the transport intensity of the different sectors
and data from the input-output-tables together with qualitative information on a sector like
the relevance of Just-in-Time production patterns, the involvement in transport chain issues,
the perishableness of goods, the relevance on the demand side such as delivery to clients in
urban areas and the quality of infrastructure.
The IVEC was calculated for 11 countries including the US. Taking the sectoral average across
the 11 countries it revealed a high vulnerability to congestion for the transport sectors them-
selves, the food and retail sector and the agricultural products sector as well as some service
sectors that provide services in urban areas like health and social work as well as post and
communications sector.
The IVEC can then be aggregated on country level for the 11 countries to provide an aggre-
gate picture for the potential vulnerability of the countries to congestion. This potential re-
flects quantitative aspects like transport intensity and sectoral structure as well as qualitative
elements like quality of domestic infrastructure. The calculation of the IVEC then results into
four groups of countries in terms of their economic vulnerability to congestion:
Group 1 “Low vulnerability”: Czech Republic, Germany, Hungary.
Group 2 “Mean vulnerability”: Spain, US, France.
Group 3 “Increased vulnerability”: Poland.
Group 4 “high vulnerability”: United Kingdom, Netherlands, Finland, Denmark.
The IVEC does not show whether a country suffers today from congestion, but whether the
economic structure of a country (of sectors and transport intensity per sector) is generally
more or less vulnerable to congestion. This means if two countries have a similar high level of
congestion, the country with a higher IVEC will be more negatively influenced in its economic
performance e.g. due to the specific sectoral structure.
A comparison of IVEC information with the Level-of-Service (LOS) information from the Pano-
rama of Congestion provides insights on for which countries the economic development is
already burdened by negative impacts from congested (inter-urban) roads. Three examples
can be distinguished:
(a) Finland has a high vulnerability to congestion (IVEC=167) but the LOS-indicator is “A” for
inter urban roads, such the Finland has to take care that LOS-indicator does not detoriate in
order to avoid retarding influences from congestion on economic activity.
(b) Germany has a low vulnerability (IVEC=86) but a LOS-indicator of “D” for inter-urban
roads, such that despite of a poor LOS-indicator the German economy is not strongly nega-
tively influenced by congestion because the general structure of the economy is not very vul-
nerable to congestion.

- 16 - COMPETE Final Report: Executive summary
(c) The Netherlands have a quite high IVEC (=156) and a LOS-indicator of “E” on inter-urban
roads, so the economic development is already suffering from congestion.
Hence, out of these three countries the combined IVEC and LOS indicators would suggest
that additional investments to improve inter-urban road capacity would be most effective and
efficient in the Netherlands.
Impact of congestion on transport users
Since businesses could take a number of strategies to avoid or minimize the negative impacts
of congestion, interviews with representatives of different sectors have been conducted to
find out how congestion is perceived by the sectors and which countermeasures are taken.
The interesting picture emerged that – besides the transport sector itself – most sectors do
not see congestion as a problem for the success of their business. Based on the interviews
and a literature review on the potential impacts of congestion, we draw the following con-
clusions:
The economic consequences of congestion must be differentiated into GDP-relevant
and not-GDP-relevant. GDP-relevant are the direct costs by suffering and avoiding
congestion and the indirect costs due to decreased reliability of different economic
sectors. In addition, congestion has an increasing effect on labour cost. Not GDP
relevant are the time losses of passenger transport, except for business purposes
(e.g. delays in air transport).
The transport sector is highly affected and vulnerable to congestion, especially road
transport, if non recurring congestion is affecting reliability. As a potential cause of
loss of clients, reliability can be much more important than direct costs. Therefore
the transport and logistics sector use several strategies such as night haulage, infor-
mation and planning instruments to increase reliability. Besides the transport sector,
the food and retail sector with delivery to urban areas is very vulnerable to conges-
tion as well. Both confirm the results of the IVEC sectoral indicators.
For other sectors, congestion is not seen as a major problem, although the relevance
is increasing. Congestion is one (amongst many others) factor to induce change of
location (e.g. shopping and production sites) leading to urban sprawl.
It is difficult to pass congestion costs over to consumers in the freight sector. Quality
differentiation is only common for specific transport services, such as express deliv-
ery and high speed rail, where penalties for late arrival are used.
In order to quantify economic impacts of congestion costs, the value of time (VOT)
approach is most relevant. It covers however not all related costs. Most important is
an additional valuation of reliability. The empirical relevance is quite heterogeneous.
Most scientific studies point out that the size of reliability costs is about 10 to 20 %
of the value of time costs. At maximum – according to road hauliers replies – the ra-
tio can reach more than 100%. A differentiation according to economic sectors
might be useful, since the relevance varies between sectors and countries consid-
erably.

COMPETE Final Report: Executive summary - 17 -
There are influences of congestion on competitiveness between modes of the trans-
port sector. In general, rail transport is supposed to profit from congestion in urban
areas and specific corridors. Intra-modal distortion in competitiveness is however not
significant. The vulnerability between European countries and the US is quite differ-
ent, depending on the structure of the economy, the transport intensity and the
quality of infrastructure. The vulnerability is higher in Northern&Central European
countries with high network density and Eastern European countries with low infra-
structure quality. Compared to that the vulnerability of the US transport sector is
less significant, besides for the US air transport sector which is facing strong compe-
tition and hence is rather vulnerable to congestion.
In order to consider the different economic impacts, measures to overcome congestion must
be seen in a broader context. Besides efficient pricing and infrastructure enlargement, incen-
tives to shift to public transport in urban areas and sensitive corridors, information systems in
order to anticipate congestion properly, quality controlling and penalty systems for fair pric-
ing of transport and maximal conditions for environmentally sound use of off peak situations
(esp. night haulage) and increase of load factors are important. The EU policies in regard to
improvement of rail interoperability, road management systems and air traffic management
play an important role to improve transport infrastructure quality and to minimise economic
impacts of congestion.
Mega-trends, structural changes and impacts on logistics
The most dominant trend is globalisation, of course. The globalization process must be un-
derstood as a set of inter-connected world-wide mega-trends, with relevant impacts on logis-
tic processes at micro level and, consequently, on transport systems. The main mega-trends
can be identified as follows:
Population change, that can affect the transport sector in several ways: an in-
crease in population increases transport demand (both for passengers and freight)
with a potential source of congestion; or the reduction in population expected for
many EU countries in the years to come can affect negatively, for instance, the sus-
tainability of public transport systems through the revenue side and reduced popula-
tion density.
Opening of national economies, with the entry of new international economic
players like China and India, the creation of multinational free trade areas (like
NAFTA or the EU Internal Market) and the subsequent rise of international trade.
Increase of international investment, with the global spread of activities of the
multinational enterprises that extend their production and distribution activities to
several countries throughout the world.
Advances in technologies, turning information and communication equipments
portable, cheaper and affordable, triggering the emergence of new services and
products and allowing a reduction in information and communication costs of
transport, stimulating the global interchange of products.

- 18 - COMPETE Final Report: Executive summary
Scaling down these trends to Europe they imply an integration of the New Member States
(NMS) into the internal market, a continuous increase of Intra-European trade flows, a strong
increase of trade flows to and from China and India, a specialisation of EU15 on the produc-
tion of high-technology manufactured goods and a secondarisation of the NMS economies.
These trends translate into a number of developments shaping future logistics in particular
(1) the concentration of production at specific locations to gain economies of scale and
economies of density, (2) the development of hub-satellite networks (for similar reasons), (3)
the increase in vehicle size (again economies of scale, and scarce infrastructure), and (4) the
growing use of inter-modal loading units.
Potential bottlenecks for European logistic systems in the future
The described mega-trends and the resulting transport and logistic trends adapt future Euro-
pean transport flows in terms of modal-split as well as direction and size of flows. Consider-
ing the capacity and the quality of infrastructure in European regions five major potential
bottlenecks for long-distance transport can be identified:
Ports bottleneck in the North-Atlantic and Baltic ports, which offer good quality in-
frastructure but, in some cases operate close to capacity.
Railway bottleneck in Eastern Europe due to partially low quality infrastructure and
problems with interoperability and cross-border integration of networks.
Railway bottleneck in Southwest Europe due to significant interoperability problems
and partially low quality networks that are poorly interconnected.
Road bottleneck in Eastern Europe due to high density of transport flows running on
networks of varying quality and facing significant local bottlenecks.
Road bottleneck in Central Europe due to high density of transport flows operating
already close to capacity and facing significant regional bottlenecks.
Impact of transport infrastructure on economic growth
To analyse the impact of transport infrastructure on economic growth two approaches have
been followed: first, a thorough literature review collected the state-of-the-art in terms of
empirical findings and in terms of setting-up economic models to analyse the impacts for the
European countries, and, second, two such models have been set-up and calibrated to ana-
lyse the impact of past investments onto transport infrastructure. The following findings
could be derived from the two approaches:
Economic theory suggests that transport infrastructure promotes economic growth
by reducing transportation costs – thereby increasing specialisation and the degree
of division of labour - promoting the development of spatial clusters of economic
sectors and promoting innovation.
Our review of the empirical evidence of the impact of infrastructure on economic
growth suggests that the elasticity of output with respect to public capital is in the

COMPETE Final Report: Executive summary - 19 -
0.1-0.2 range, i.e. a one per cent increase in public capital would tend to increase
output by 0.1-0.2 per cent.
Our growth model suggests that a plausible figure for the elasticity of output with
respect to public infrastructure is at the bottom of or even slightly below this 0.1-0.2
range.
On macroeconomic level, we did not find convincing evidence that transport infra-
structure is too low in the EU (or, equivalently, that the rate of return to transport
infrastructure expenditure is higher than the cost of funds) or too low relative to the
US.
Productivity development of transport and impacts on other sectors
Three steps have been undertaken to analyse the productivity of the transport sector both in
relation to transport policies and their impacts on productivity and in relation to productivity
impacts on transport using sectors. First, data and literature on the productivity development
of transport in the EU and the US is collected and analysed. In parallel, labour productivity
and total factor productivity (TFP) are considered. Second, an econometric analysis of the
influence of transport policies on transport productivity is undertaken, focusing in particular
on infrastructure and liberalisation policies. Third, again applying an econometric analysis TFP
growth of transport using sectors is linked to TFP growth of transport sectors. The following
findings could be obtained by the analysis:
Labour productivity growth in the transport sector has been higher in the past 15
years in the EU than in the US and, as a result, labour productivity levels in the
transport sector are high relative to the US. There is also evidence of a process of
convergence in the levels of labour productivity in the transport sector within the
EU.
The econometric evidence suggests that countries with less technology advanced
transport sectors tend to experience faster productivity growth rates in their trans-
port sectors.
Liberalisation has limited direct effects on productivity growth in the transport sec-
tor, but instead appears to work indirectly by making catch–up more rapid and by
increasing the productivity impact of additional infrastructure expenditure.
Economic importance of transport
The two transport sectors, i.e. manufacturing of transport equipment and transport services,
constitute an important element of the European economies, which developed different than
in the US. The importance of transport as a self-contained economic sector can be measured
as its contribution to employment and production of the different economies. Comparing the
two regions EU15 and US it can be stated that about 10 years ago transport equipment was
of similar importance contributing about 1.4-1.8% of total employment. This declined
slightly to 1.2-1.5% in 2002. Transport services have a roughly double-size share than trans-

- 20 - COMPETE Final Report: Executive summary
port equipment on employment and remained nearly stable between 1995 and 2002 for the
US and the EU15.
More significant are the differences of the contribution of transport to the total production
of the economies. For transport equipment we first observe that the share on production is
more than double the share on employment both in 1995 and even more pronounced in
2002, and second that in the EU15 the share is growing until 2002, while it decreases in the
US. The share of transport services develops similarly with a slight decline in the US and a
moderate growth in the EU15 between 1995 and 2002.
In total in 2002 the share of the two transport sectors on production amounts to 10% for
the EU15 and 6.3% for the US. A significant part of this difference of importance of trans-
port between the EU15 and the US emerged in the period between 1995 and 2002, which is
actually a period where a number of European transport policies and developments became
effective, such that it can be argued that the EU policies contributed significantly to this posi-
tive development. Two things should be kept in mind looking at these results: first, different
data sources provide a bandwidth of results e.g. looking at input-output tables, which are
not available for all countries for both points of time, the share of transport on total produc-
tion value also amounts to about 10% while taking the values of the EUROSTAT Structural
Business Statistics transport would account 13% of total production value of the EU25. Sec-
ond, this result refers to monetary values and hence is not valid in the analysis of decoupling
of transport, which focuses on decoupling of physical units (volume or performance) from
monetary units (GDP).
Impact of transport on competitiveness
Three approaches enable to describe the impact of transport on competitiveness: first, the
share of transport cost on total product cost indicates the potential impact of transport on
the competitiveness of the transported goods. The ECOTRA study (TRT 2006) showed that
besides for agricultural products with at maximum 10% share of transport cost the shares
are small and hence the influence of transport on competitiveness according to this indicator
is small. Second, and leading to a similar conclusion is the share of transport intermediate
input to total output of transport using sectors calculated from the input-output tables. On
average the value for the EU15 countries is 2.2% though for some sectors it can be above
10%, which then becomes significant for competitiveness.
Third, an analysis of labour productivity (LP) and total factor productivity (TFP) provides an
indicator for competitiveness by comparing LP and TFP across countries. In particular LP in the
EU15 showed a strong increase during the 1990ies, which implies increased competitiveness
against the US.
However, these indicators for competitiveness are all monetary indicators, though transport
also affects other aspects like reliability and travel time which do not show up in these mone-
tary indicators but can be relevant for competitiveness. In particular in the case of reliability
this is confirmed by the sectoral interviews of COMPETE.

COMPETE Final Report: Executive summary - 21 -
Impact of European transport policies on competitiveness
The previous analyses have shown that liberalisation together with implementation of new
transport infrastructure may induce an improvement of competitiveness of transport sectors.
In particular this holds for the railway sector, which in the past 15 years was subject to sig-
nificant liberalisation and infrastructure policies in Europe. These policies e.g. enabled new
entries on the freight rail market that are specialized on specific sectors as well as long-
distance cross-border transport of freight rail.
Especially some sectors that are of significant importance for the European economies, like
automobiles and chemicals, benefited most from these improvements that fostered the com-
petitiveness of railways. Today it can be observed that both sectors increasingly use railways
for their transport purpose (e.g. block trains for automobiles). Since, these sectors are core
sectors constituting the European competitiveness on the world markets it can be expected
that the European transport policies exerted positive stimuli for this development and hence
for European competitiveness.
Conclusions on future transport policies to promote European competitiveness
Basically we argue in COMPETE that the past and current EU transport policy is successful in
promoting European competitiveness, though it was not always the core focus of transport
policies to foster competitiveness. But also European policies to reduce environmental im-
pacts of transport or to revitalise the railways contributed to two assets that fostered Euro-
pean competitiveness in comparison with the US: first, the push to generate innovations
coming from environmental policies and policies to promote intermodality and interoperabil-
ity within the EU transport system, and second, the supply of transport alternatives let it
be public transport or cycling for urban areas or long-distance rail transport or short-sea-
shipping for freight transport. Of course, these policies do not enfold their positive stimuli in
short-term but in our comparison of EU and US over 15 years it seems that they significantly
contributed to the success of the EU transport system and its provision of services in this pe-
riod. Hence, we suggest to continue both the environmental policies and the policies to pro-
vide transport alternatives always having a close look on how this could contribute to gener-
ate innovations for the EU. An example of this would be the shift to light-weight fuel effi-
cient cars as well as alternative transport fuels for road transport that should both reduce
environmental impacts and stimulate innovations.
Looking at the US with a fivefold modal-share of rail freight it seems, even when considering
the geographic differences, that railways in the EU should reasonably capture a larger share
of modal-split in particular in what concerns long distance transport. Hence, policies that
foster cross-border rail transport (e.g. interoperability, cross-border rail infrastructure) and rail
freight reliability (e.g. dedicated freight networks) are of high importance to catch-up to the
US in this feature.
From the mere point of view of competitiveness it would be suggested that the EU aspires to
benefit more from its geographic advantage i.e. from the fact that 50% of its GDP is gener-
ated in about 20% of its area in the centre of Europe, while the US is facing a situation with
four far-off economic centers. Comparably shorter transport distances and high benefits of

- 22 - COMPETE Final Report: Executive summary
agglomeration provide such a region with a natural competitive edge, but the transport sys-
tem has to be enabled to cope with the arising problems of density and potential congestion.
Of course, the EU by building up the inter-city high speed network between Paris, Brussels,
Cologne, Amsterdam and London (PBKAL), by extending capacity of airports and ports in the
region (mainly driven by national and regional authorities) and by encouraging member
states to introduce sophisticated road, rail access and airport pricing and traffic demand man-
agement systems is aware of the situation, but on the other hand such a policy is constrained
by the cohesion objective of the EU, which is putting more emphasis on the connections
with(in) peripheral regions of the EU. In particular, the road pricing instruments provided by
directives 2006/38/EC and its preceding legislations bares the danger of raising the costs for
remote countries to access the core markets of the Community (Viegas at al. (2005)). Here
seems to emerge a conflict of objectives between competitiveness and cohesion.
In the EU15 the economic importance of transport services has been grown significantly
compared to the US. Improvement of quality of services and in particular reliability of trans-
port services should have contributed to this development. As shown by the user survey on
congestion impacts reliability is most important for many transport using sectors. Hence, EU
policy to foster competitiveness will have to further increase quality of services and reliability.
This could come from a number of different measures like (congestion) road pricing, im-
proved intermodality and interoperability of railways.
An important aspect in the future should be the maintenance of transport infrastructure
since deterioration of infrastructure would reduce quality of service and reliability and hence
competitiveness. This is in particular important as at the same time in the next few decades a
significant share of transport infrastructure reaches an age where it has to be renewed or at
least where its maintenance has to be increased to preserve the quality of service. This is a
long-term problem and a long-term risk for competitiveness that has to be tackled by long-
term strategic planning by the EU. Since this is mostly a national task, the EU task should be
to point out to this risk (e.g. by asking for monitoring quality and maintenance of existing
infrastructure) and by developing guidelines for undertaking the strategic maintenance plan-
ning on national level.
Of course, liberalisation of transport markets in the EU - having reached different degrees of
liberalisation for the different modes - promoted EU competitiveness by increasing efficiency
and reducing cost. But looking e.g. at US air transport where market liberalisation and de-
regulation led to a situation that the whole sector over many years produces a deficit and is
highly vulnerable to external shocks like the 9/11 terrorist attacks any liberalisation should
take care that it does not overdraw. Liberalisation is able to kick-off the causal chain towards
more competition, lower prices but also lower margins and hence greater vulnerability e.g. to
external shocks but also to the impacts of congestion. Hence, any liberalisation policy has to
carefully observe, first, if margins would become too low for the transport sectors to avoid
for the sector as a whole not to be resilient against external shocks anymore, and second, if
trends towards oligopolistic or even monopolistic market power develop that would reverse
the benefits of liberalisation and would establish new barriers to market entry. In such cases,
a further liberalisation, though it might bring about further short-term efficiency gains,
should not be beneficial for competitiveness in the long run.

COMPETE Final Report: Executive summary - 23 -
Structure of this report
This report is structured into 9 sections. Following this Executive Summary is the brief com-
parison between EU and US transport policies. Section 2 provides transport operating costs
for all modes and section 3 explains the status and measurement of congestion in the EU and
the US. Section 4 presents the impacts and the sectoral responses to congestion. Section 5
deals with mega-trends, their influences on logistics and transport as well as the structural
economic changes linked to both. Section 6 discusses the impact of transport infrastructure
on economic growth, while section 7 describes modelling and impact assessment of produc-
tivity in the transport sector. Section 8 uses the previous sections and elaborates on the im-
portance of transport for competitiveness of the EU and the US. This is followed by the con-
clusions, a section on further research questions and the references. Eight annexes, which are
provided as separate documents complete this report.

- 24 - COMPETE Final Report: Transport Policy in EU and US
1 Transport policy in the European Union and the United States
1.1 Strategic policy documents in the EU and the US
The major strategic transport policy documents of the EU are the White Paper on "The future
development of the common transport policy - A global approach to the construction of a
Community framework for sustainable mobility" (EC 1992) and the White Paper on "Euro-
pean Transport Policy for 2010: time to decide" (EC 2001), which is reviewed by external
consultants in detail in 2005 (e.g. De Ceuster 2005). An adaptation of European strategies is
published in "Keep Europe moving - Sustainable mobility for our continent" (COM(2006)
314, EC 2006). These strategic documents are accompanied by a number of modal- or topic-
related policy documents e.g. on infrastructure funding, on revitalising of railways, on mo-
torways of the sea.
The four major objectives of the 2001 White Paper are (1) shifting the balance between
modes of transport, (2) eliminating bottlenecks, (3) placing users at the heart of transport
policy and (4) managing the globalisation of transport. The review of this White Paper
though confirming the objectives of both previous White Papers slightly shifted the focus and
added a new objective by putting less emphasis on modal-shift and more emphasis on effi-
ciency improvements of the major modes, in particular road, and by highlighting that trans-
port is one of the drivers for innovative solutions that could both improve the transport sys-
tem of Europe and become an asset of Europe to be exported to the world market.
The US transport policy in the last two decades developed through three major acts related
to surface transport: the International Surface Transportation Efficiency Act (ISTEA) in 1991,
the Transportation Equity Act for the 21st Century (TEA-21, US-DOT 1998) and the Safe, Ac-
countable, Flexible, Efficient Transportation Equity Act: A Legacy for Users (SAFETEA-LU, US-
DOT 2005a) in 2005. Separate acts like the Wendell H. Ford Aviation Investment and Reform
Act for the 21st Century (AIR21) in 2000 for air transport covered the other modes. Every 3
to 5 years the US-DOT publishes a strategic plan for about the following 5 years. Currently
the Strategic Plan 2003 to 2008 promoting the strategic objectives: safety, mobility, global
connectivity, environmental stewardship and security provides the guidelines for policy-
making (US-DOT 2003). From time-to-time long-term visions for the transport system are
prepared by the US-DOT like "The Changing Face of Transportation" (US-DOT 2000). The
latter also emphasizes the EU White Paper objective to "place users at the heart of transport
policy" stating to develop a "vision that puts people first and strives to leave no one behind".
Summarising the strategic documents it can be noted that the major objectives are quite similar between the EU and the US e.g. providing mobility, increasing safety and security,
managing globalization and protecting the environment. However, some differences can be
observed looking closer into the details. One difference concerns transport pricing policies:
the EU has strongly promoted these policies in the recent years (e.g. by publishing a White
Paper, several directives and fostering research) but decreased the emphasis in the recent
review, while pricing policies have not been in the focus of TEA-21 but receive more atten-
tion in the current strategic documents of the US. Of course, these opposing tendencies in
the EU and the US reflect the different degree of implementation of transport pricing in the
two world regions.

COMPETE Final Report: Transport Policy in EU and US - 25 -
On the other hand, to promote innovations for transport and by transport has been earlier
emphasized by the US policy and there the review of the EU White Paper is catching-up the
US headstart. In practice, this can be observed e.g. at the "race" for developing new engines
and cars to shift the transport system towards alternative fuels like biofuels or hydrogen
where the EU established the Hydrogen and Fuel Cell Technology Platform (HFP) while the US
founded e.g. the California Fuel Cell Partnership (CaFCP) and the FreedomCAR and Vehicle
Technologies (FCVT) initiative.
1.2 Transport policy implementation in the EU and the US
At a first glance the structure of the EU and the US the latter being one country since more
than 200 years and the former being a grouping of 25 countries with different cultures and
policy-making contexts seems to be quite different. However, also the US integrates 50 Fed-
eral States, some of them like California as large as the largest European countries, to form
the nation. This similarity also shows up in major elements of the transport policy: first, both
EU and US develop plans and fund infrastructure to create supra-national transport infra-structure. For the EU these are the Trans-European-Transport-Networks (TEN-T) starting with
the 14 projects of the Essen list in 1994, extended to 19 projects plus Galileo in 2001 and in
2005 after the accession of 10 new member states comprising 30 priority projects with fund-
ing requirements of 225 billion EURO for the major projects. In the US the three past trans-
port acts amounted to similar orders of magnitude for spending on highways and transit in-
frastructure and improvements (ISTEA about 150 billion $, TEA-21 about 200 billion $ and
SAFETEA-LU about 240 billion $ of which about 77% are dedicated to highways, each for a
period of 5-6 years). The SAFETEA-LU act includes programs similar to the concept of the
TEN-T like the High Priority Projects Program, the National Corridor Infrastructure Improve-
ment Program and the National Highway System Program. All these programs are defined to
implement a US nationwide i.e. cross-federal states highway and corridor system (including
also a few high-speed rail corridors), which in fact is rather close to the TEN-T basic idea of
generating a European-wide multi-modal transport network.
A further similarity between EU and US strategic policy making is the consideration of cross-border (or close to border) infrastructures, which received special attention by the
EU e.g. expressed by higher EU funding shares for cross-border infrastructures. In addition to
the US national corridor programs further specific programs to build transport infrastructure
to connect to the US neighbours Canada and Mexiko like the Coordinated Border Infrastruc-
ture (discretionary) program form part of TEA-21 and SAFETEA-LU, respectively. In both
cases, the EU and the US the lower regional benefits and the higher significance of such
cross-border infrastructure for trade and globalization provide the argument for the (supra-
)national funding.
Congestion is recognised as a significant and growing problem in both the EU and the US
policy documents. The US SAFETEA-LU beyond its program on Congestion Mitigation Provi-
sions includes a program to establish a nationwide harmonised Real-Time Management In-
formation System, which should collect real-time performance information of the national
highway system to steer measures against congestion and to relief congestion. In the EU such
a harmonised system is not foreseen, yet. But suggestions how such a congestion monitoring
can be started are given in this report.

- 26 - COMPETE Final Report: Transport Policy in EU and US
The US National policy promotes cycling and walking modes as in TEA-21 it is one of the
objectives to foster these modes. In SAFETEA-LU the program Safe Routes to School is set-up,
which should enable walking and cycling for children on their way to school. In the EU the
subsidiarity principle hinders the EC to develop cycling or walking policies since these are
clearly local issues. However, the EU indirectly aspires to positively influence urban transport
policy via the CIVITAS program and those projects of CIVITAS that promote sustainable urban
mobility including better opportunities for walking and cycling. The review of the 2001 EC
White Paper (EC 2006) also foresees to develop an Urban Transport Green Paper for 2007.
The most significant difference between the transport policy of the EU and US concerns the
level of fuel taxation and hence fuel prices. Taxation of fuel in the European countries is
about five to fifteen times higher than in the US, where it is about 6 Eurocent/l gasoline. In
the US more than 80% of the fuel tax revenues go into highway funding and about 15%
into funding of transit systems. Similar approaches are followed in European countries
though the dedication for infrastructure funding is less strict or not even required.
1.3 Policies and trends affecting transport cost, congestion and logistics
Three mega-trends can be identified that are of utmost importance for the transport system.
The first mega-trend are the demographic changes affecting in particular passenger trans-
port. This trend differs to some extent between the EU and the US. Common to both regions
is the ageing of the societies, which changes the transport patterns increasing the impor-
tance of the patterns of the "grey hair" generations. However, in the EU the birth rates are
reduced significantly in the past years such that population in the future is stagnating or even
will decline, which is not expected for the US, yet. This means, for the EU population growth
as one of the drivers of passenger transport will cease in the years to come reducing also the
contribution of passenger transport to congestion.
The second mega-trend is constituted by globalization. Increasing globalisation drives the
economic interaction between different countries and world regions and, hence, trade flows
are growing leading to a continuous increase of freight transport. But also passenger trans-
port is fostered by globalisation due to the growing number of business trips in the global
economy and the growth in tourism always looking for farther destinations. For both, pas-
senger and freight transport this implies longer distances and longer transport chains and
hence increased cost per trip that have to be counterbalanced by improved transport effi-
ciency to keep transport viable.
The third mega trend is the price increase of fossil fuel, which is driven by the continuous
growth of world demand due to the fast economic development in countries like China and
India and the limitations on the supply side i.e. the geological restrictions to pump more
crude oil out of the existing wells (peak-oil) and the limitations of the refinery capacity. Grow-
ing crude oil price will of course drive the transport fuel prices and hence the transport cost.
However, the linkage between crude oil price and the price for gasoline or diesel is damp-
ened by the fuel taxes, which differ significantly between the EU and the US. The lower fuel
taxes in the US lead to relatively higher fuel price increases for transport in the US, while in
the EU where in some countries the taxes paid on fuel are higher than the crude oil cost such
that a 100% increase of crude oil price would on average result only into a 40% increase of
fuel price in the EU (see also ECORYS 2006). In that sense, the transport cost in the US will

COMPETE Final Report: Transport Policy in EU and US - 27 -
grow stronger than in the EU by the raise of the crude oil price. This holds for road transport,
while e.g. air transport does not pay fuel taxes at all such that the crude oil price increases
directly feed through into the air transport cost.

- 28 - COMPETE Final Report: Transport operating cost in EU and US
2 Transport operating cost in the EU and the US
2.1 Methodology
2.1.1 Systems delimitation and structure
Transport operation costs are those costs directly related to the production and the use of
transport services. These costs are borne by private and public transport operators and are
thus internal costs. From a macroeconomic point of view, these costs occur in the financial
balance of the transport sector and other economic sectors. In order to allocate economic
consequences properly, it is important to distinguish between commercial transport and indi-
vidual transport services on the one hand and public and private transport services on the
other hand:
Table 9: Economic characteristics of operating costs Commercial Individual
Public/ Profes-sional
Transport operating cost are beard by the transport provider and passed to an economic sector using this transport services: Professional freight transport (all modes):
Professional passenger transport such as air transport, rail/bus transport, taxi for commercial use (business trips occurring as costs in the financial balance of eco-nomic sectors,
Transport operating costs are beard by the pro-ducer and passed to the individual user. For the individual user, the costs are end consumption:
Passenger commuter, shopping and lei-sure/tourism trips with public transport (rail/bus, air transport)
Private Transport operating costs are beard by the internal transport provider and are relevant for commercial purposes:
Internal freight transport (esp. road), commercial passenger car trips with own car.
Transport operating costs are beard by the indi-vidual user and are completely end consump-tion:
Passenger car transport for commuter, shopping and leisure/tourism trips
The table indicates that operating costs can be seen from different angles. The producer's
perspective focuses on the production of transport services. Within economic balances, this
accounts for public/professional transport providers for commercial and individual use. These
costs are usually included in economic Input-Output-Tables. In order to get a full picture, it is
necessary to add the private transport services. The user's perspective is focussing on trans-
port prices. Within the commercial sector, these costs are occurring in the economic balance
as transport costs and are included in national Input-Output-Tables. The use of individual
transport however is end consumption and must be added to the transport sector in order to
get a full picture.
In order to quantify transport operating costs, we will refer to the producer's perspective:
How much do public and private transport operators pay for the production of transport ser-
vices? In order to get a proper systems delimitation, the following issues have to be consid-
ered:

COMPETE Final Report: Transport operating cost in EU and US - 29 -
• Transport services and infrastructure: From a producer's point of view, infrastructure
costs are considered by the price which is paid for infrastructure use. This can be in-
cluded in charges and taxes (such as for road transport) or in direct infrastructure fees
(such as track prices for rail or landing charges for air transport).
• Time costs of individual transport (e.g. value of times for drivers) are not considered,
since they are not included in macroeconomic accounts.
• Operating costs for ‘normal traffic conditions’ and congestion costs: In order to dis-
tinguish operating costs and congestion costs, it is important to define a so-called
accepted level of service, on which basis operating costs for specific transport modes
may be estimated: Within this study operating costs (without congestion costs) and
congestion costs for transport users will be distinguished. Financial deficit of public
institutions and external accident and environmental costs will not be considered,
Operating costs are based on the following cost elements:
Table 10: Structure and elements of operating cost Element Structure Description
Traffic modes and means Road
Rail
Aviation
Inland Waterways
Short sea shipping
Passenger car, HDV2, LDV, Buses, Coaches
Passenger/Freight
Passenger/Freight
Freight
Freight
Cost components - Wear and tear
- Personnel
- Capital cost
- Energy cost
- Insurance
- Infrastructure charge
- Other taxes and charges
- Additional cost
- Variable costs of vehicle / rolling stock use (e.g. maintenance)
- Drivers wages/Wages of other personnel
- Depreciation/Interest of invested capital (e.g. rolling stock)
- Fuel and/or electricity costs (incl. fuel/energy taxes)
- Insurance premia
- Charges dedicated to infrastructure use
- Other taxes and charges, such as Vehicle circula-tion tax, purchase tax, road or track user charges, environmental charges
- Overhead, additional costs for further services
Countries EU 25, US and Swit-zerland
Territoriality principle
Base year Most recent Traffic performance based on 2004 figures,
2 LDV: Light duty vehicles, HDV: Heavy duty vehicles

- 30 - COMPETE Final Report: Transport operating cost in EU and US
2.1.2 Procedure for quantitative estimation
Operating costs of different transport modes in different transport countries are depending
on many factors, such as
Transport volumes
Fleet structure and age
Market prices and financing conditions of equipment (vehicle market, garage, main-
tenance equipment, interest rates, insurance etc.): These prices are in addition de-
pendent of the level of liberalisation of the equipment market.
Energy consumption (depending on average energy use of the fleet)
Structure of charges and taxes (infrastructure use, road taxes, environmental taxa-
tion)
Wage level (usually depending on general economic conditions according to GDP
per capita
Level of competition/liberalisation of the transport sector.
There are two approaches possible to consider these influence factors per country and per
transport mode:
Top down: Transport costs per country based on input-output table information:
This approach follows the logic of the production of public/professional provision of
transport services. The approach however is too narrow, since private transport and
individual passenger road transport is not included. In addition the available infor-
mation within input-output tables is very rough.
Bottom up: Estimation of specific costs per transport mode and –mean and aggre-
gation according to national transport levels.
Within COMPETE, we use a harmonised bottom up approach, which starts from typical spe-
cific costs for exemplary transport means and countries. These countries cover a representa-
tive set all over EU25 and US. Since data sources are however not always consistent (different
years, different structure of cost elements etc.), a transfer procedure is necessary, in order to
get information for all countries and make specific cost comparable. The use of a transfer
mechanism based on selected macroeconomic key indicators such as national fleet structure
information, average fuel consumption, GDP per capita purchase power parity adjusted, na-
tional interest rates and different levels of liberalisation. For the specific modes, the following
procedures were used (see details in COMPETE Annex 1):
Road: Information from a representative set of countries (based on different sources) for operating costs of a typical average vehicle; value adjustment procedure and ag-gregation with the figures of EUROSTAT (2006b)
Rail: Information of international railways statistics for most of the countries, value adjustment transfer and aggregation
Air transport: Information of individual airlines and international air statistics
Waterways: Information of international studies and specific countries.

COMPETE Final Report: Transport operating cost in EU and US - 31 -
2.2 Operating costs 20053
2.2.1 Total operating costs per country
Total transport cost in EU25 account for 1’988 bn EUR which corresponds to 19% of the
GDP. For the US, the corresponding figure is 2’278 bn or 24% of national GDP. The biggest
part (54%) are operating cost for road passenger transport. The second largest part is road
freight transport (36%). Here the share is much bigger in the US than in Europe. The total
operating costs for other modes (rail, air, water) are considerably smaller.
Table 11: Total transport operating costs in the EU and the US (2005) – Data in bn. EUR
Transport mode Western Europe (EU15)
Eastern Euro-pe*
EU25** USA
Road passenger 1'239 37 1'276 1'039Road freight 420 20 441 1'072Rail 84 7 92 26Air 155 6 162 137Water 12 n.d.a. 12 4Total 1'911 71 1'988 2'278
* NMS-5 means the following five of the ten new EU member states: Czech Republic, Hungary, Poland, Slovenia, and Slovakia. ** Without Baltic countries, Malta and Cyprus. n.d.a.: no data available. Source: own calculations (for details see COMPETE Annex 1).
When discussing the differences between the total or average operating costs of the differ-
ent countries, it is very important to bear in mind that the costs are not only influenced by
the cost level per country (which is best reflected in the average costs per vehicle-kilometre),
but also by other factors like the mileage (veh-km per year), the transport performance
(tkm/year, pkm/year) and the load factors (t/veh) and occupancy rates (p/veh). These relations
are visualised in Figure 5.
Averageoperating costsper veh-km
Total operatingcosts per year
Operating costsin relation to GDP
Averageoperating costsper pkm or tkm
Mileage(veh-km/year)
Total GDP per year
Transport performance(tkm/y, pkm/y)
Load factors(t/veh) & occup. rates (p/veh)
Averageoperating costsper veh-km
Total operatingcosts per year
Operating costsin relation to GDP
Averageoperating costsper pkm or tkm
Mileage(veh-km/year)
Total GDP per year
Transport performance(tkm/y, pkm/y)
Load factors(t/veh) & occup. rates (p/veh)
Figure 5: Relations between different operating cost measures (yellow boxes) with the corresponding influence factors (white boxes)
3 Detailed figures per country can be seen in COMPETE Annex 1.

- 32 - COMPETE Final Report: Transport operating cost in EU and US
The most important influence factor is the transport performance of each country, based on
national transport statistics. Comparing the relative costs (in relation to GDP) of European
countries, Western Europe has a higher share of GDP than Eastern Europe. Looking at the
different countries, we see (besides the US) a high share of costs in Finland and France and
Denmark and a low share in Slovakia and Ireland. There are several reasons to consider in
order to interpret the country-wise results properly. A main reason is the higher share of indi-
vidual passenger transport due to higher income (e.g. higher density of cars, more leisure
trips). This explains the relatively lower share of costs in the new member states in Eastern
Europe. Another reason are the national transport levels (mileage, transport performance),
for example the high level of passenger and freight kilometres per capita or per GDP of US
and Finland compared to other European countries. A third element (as well true for Finland)
are the level of average costs (see next section). Finland for example has – compared to other
countries – rather high costs per vehicle kilometre and a high freight transport intensity. The
US on the other hand have rather low costs per vkm, but also a very high (freight) transport
mileage which leads to high operating costs in total and in relation to GDP.
The relative data of total operating costs in relation to the GPD (Figure 6) is a figure that
helps to compare the total operating costs between the different countries. However, it has
to be pointed out that the total operating costs of a country do not only cover costs which
are part of the GDP, but all costs for operating transport means. A considerable part of the
total operating costs, however, are not part of the GDP, mainly the imports which are sub-
tracted from GDP calculations. The main part of the fuel costs, for example, corresponds to
imports. In addition, a great part of the vehicle costs can be attributed to imports, depending
of course on the countries automotive sector. Therefore, the data in Figure 6 does not state
that in the US, for example, 24% of the GDP is generated by transport. However, it shows
that the total expenditures paid by the US transport users for their transport operations in the
US corresponds to 24% of the US GDP in 2005.
0%
5%
10%
15%
20%
25%
30%
35%
BE CZ DK DE GR ES FR IE IT LU HU NL AT PL PT SL SK FI SE UK CH US EU-15 NMS-5*
Relative Costs (in relation to GDP)
Road Passenger Road Freight Rail Air Water Source: COMPETE calculations. For details see COMPETE Annex 1:
Figure 6: Total operating costs in relation to GDP in 2005

COMPETE Final Report: Transport operating cost in EU and US - 33 -
2.2.2 Cost structures
The comparison of average costs (per tkm, per pkm) is interesting between road and rail.
Figure 7 shows the result for passenger transport. With 0.27 EURcent per pkm, Western
Europe has the highest level of costs. Besides higher input prices, the relatively higher share
of taxes is a major reason. Rail costs are in comparison considerably lower. This is due to bet-
ter load factors (especially in urban areas or frequented corridors) on the one hand and due
to the fact, that railways do not recover their full infrastructure costs, compared to road
transport. In other words: Their taxes and infrastructure charges are considerably lower. The
difference is however smaller in Western Europe than in Eastern Europe or the US. The dif-
ferences between individual countries are quite significant and are depending very much on
transport performance (pkm, tkm), which means that countries with a high transport per-
formance have comparably lower average costs per pkm or tkm, which could be seen as a
kind of economies of scale of larger transport systems.
Figure 8 shows the results for freight transport. The difference between Western and Eastern
Europe is considerably higher, mainly influenced by lower wage levels for drivers. Most inter-
esting is the difference between road and rail in the United States. The most important rea-
sons tend to be the very high load factors of the railways due to their high efficiency (much
longer trains, double stack containers).
When looking at the average costs per tkm for road freight transport it is remarkable that the
costs are higher in the US than in EU-25, although this is vice versa for the average costs per
veh-km (see Figure 9). The reason for this is the big difference between the road freight load
factors (t/vehicle) in the US and in Europe. According to the traffic data, the average load
factor for heavy duty vehicles is 7.4 tons/vehicle for EU-15, whereas it is only 5.0 tons/vehicle
in the USA. This lower load factor in road freight transport in the US leads to a lower effi-
ciency per ton-kilometer.
In fact, when comparing the average costs per vehicle-km or train-km (Figure 9, Figure 10)
with the average costs per ton-km or passenger-km (Figure 7, Figure 8), it must be stressed
that the average costs per tkm and pkm are highly dependent on the load factors (tons per
vehicle) and occupancy rates (passengers per vehicle) of trucks, vans, railways, buses, cars,
etc.

- 34 - COMPETE Final Report: Transport operating cost in EU and US
0.00
0.05
0.10
0.15
0.20
0.25
0.30
0.35
0.40
0.45
0.50
BE CZ DK DE GR ES FR IE IT LU HU NL AT PL PT SL SK FI SE UK CH US EU-15 NMS-5*
Average Costs (in EUR/pkm)
Road Passenger Rail Passenger
Source: COMPETE calculations. For details see COMPETE Annex 1.
Figure 7: Average costs (per pkm) for passenger transport – EU, CH and USA
0.00
0.05
0.10
0.15
0.20
0.25
0.30
0.35
0.40
BE CZ DK DE GR ES FR IE IT LU HU NL AT PL PT SL SK FI SE UK CH US EU-15 NMS-5*
Average Costs (in EUR/tkm)
Road Freight Rail Freight
Source: COMPETE calculations. For details see COMPETE Annex 1.
Figure 8: Average costs (per tkm) for freight transport – EU, CH and USA
Generally speaking, the average operating costs per vkm, pkm and tkm are the highest in EU-
15, followed by the USA and the lowest in the new member states (NMS-5). The only excep-
tion of this is the average cost per ton-km in the US (see Figure 8), which is very small for rail
freight transport (see explanation below) and unexpectedly high for road freight transport
(reasons explained above).
The most striking fact is the extremely low rail freight operating cost per tkm in the USA
compared to Europe. Here again, the main reason is the big difference between the load

COMPETE Final Report: Transport operating cost in EU and US - 35 -
factors since the average costs per train-km are only a little smaller in the US than in EU-15
(see Figure 10). Whereas the average load factor in EU-15 is 320 t/train, the load factor in the
United States is more than eight times higher (3000 t/train), according to the available trans-
port data. This is mainly because distances in rail freight transport are much longer in the US
and train compositions consist of much more wagons than in Europe, which can – amongst
others – be explained by geographical and topographical circumstances. Other studies show
very similar data of the average costs per tkm of freight trains in the US (e.g. Lakshmanan et
al. 2005 show average rail freight operating costs of about 1-1.5 EURcent/tkm) and therefore
support our data.
The differences between EU-15 and the NMS-5 are similar for all transport modes when look-
ing at the average costs per vehicle-km and train-km (Figure 9andFigure 10). When looking
at the average costs per passenger-km and ton-km, however, it can be seen that road pas-
senger costs are much lower in the new member states than in the EU-15. The main reason
for this is the significantly high difference in the average occupancy rate of passenger cars
(number of passengers per vehicle): in the EU-15, the average occupancy rate of passenger
cars (which dominates the road passenger category) is 1.54, whereas in the NMS-5 the aver-
age occupancy rate is 2.16 persons per car.
Figure 9 and Figure 10 show the distribution of cost categories on average costs for road and
rail. As for road passenger transport, capital costs, fuel costs and taxes and charges are pre-
dominant, personnel costs are most important for road freight. The share of fuel costs (incl.
excise duties) in the US is considerably lower than in Europe. For rail transport, personnel
costs and running costs are predominant. It is interesting, that the difference between West-
ern Europe and US is rather small, if average costs are expressed as costs per train km.
Road Passenger (passenger cars)
0.00
0.05
0.10
0.15
0.20
0.25
0.30
0.35
0.40
0.45
0.50
EU-15 NMS-5* USA
Average Costs (in EUR/veh-
km)
Road Freight (HDV)
0.00
0.20
0.40
0.60
0.80
1.00
1.20
EU-15 NMS-5* USA
Average Costs (in EUR/veh-
km)
Wear and Tear Capital Costs Personnel Costs Fuel Costs
Insurance Costs Taxes and Charges Additional Costs Source: COMPETE calculations. For details see COMPETE Annex 1.
Figure 9: Average costs (per vehicle-km) for road passenger and road freight transport

- 36 - COMPETE Final Report: Transport operating cost in EU and US
Rail Transport (Pass. & Freight)
0.00
5.00
10.00
15.00
20.00
25.00
30.00
EU-15 NMS-5* USA
Average Costs (in EUR/train-km)
Add. Costs (wear & tear, material, infra. charges, etc.) Capital CostsPersonnel Costs Energy CostsInsurance Costs Taxes & Charges (w/o infra. charges)
Source: COMPETE calculations. For details see COMPETE Annex 1.
Figure 10: Average costs (per train-km) for rail transport – aggregated data
Figure 11 refers to the economic and sectoral structure of operating costs. Around 25% of
road passenger transport is for commercial business. Around 20% of road freight transport is
internal transport, not carried out by professional road hauliers, and around one third of air
transport is for business activities. In total around two thirds (Europe) and three fourth (US) of
the transport operating cost is for commercial activities.
0
500'000
1'000'000
1'500'000
2'000'000
2'500'000
EU25 USA
Total Costs (in Mio. EUR)
Individual Private
IndividualProfessional
Commercial Private
CommercialProfessional
EU25
21%
38%7%
34%
<
USA
26%
46%
3%
25% CommercialProfessional
Commercial Private
IndividualProfessional
Individual Private
<<<<<<<<<<
Source: COMPETE calculations. For details see COMPETE Annex 1.
Figure 11: Share of commercial and individual transport costs in the EU and USA

COMPETE Final Report: Transport operating cost in EU and US - 37 -
2.3 Trends
2.3.1 The influence factors
Operating cost levels and structures have changed over time. This holds for all modes. The
following Table 12 shows the most important influence factors:
Table 12: Influence factors relevant for the development of transport operating cost Element Development
Past and Future
Relevance for different modes
Effect on operating cost
General trans-port develop-ment/ Transport demand
Increase in the past and in the future
Road and air transport and container shipping are most dynamic (EU and US)
Increase in total cost closely related to GDP growth; probably no change of av-erage costs per pkm/tkm unless the increased trans-port demand leads to scarce infrastructure which means higher op. costs
Liberalisation in the transport sector and pro-ductivity poten-tials
Different speeds in different sectors will carry on
Most dynamic development in the road freight and air trans-port sector (US has been more dynamic in the past, EU is more dynamic since EU enlargement)
Pressure on operating cost (esp. running cost, person-nel cost)
Capital financing conditions (liber-alisation, rolling stock market, interest rates)
Improved efficiency in the rolling stock market, improved conditions
Rolling stock markets and fi-nancing instruments have be-come global. More capital in-tensive sectors (rail, air) are profiting (EU and US)
Capital cost will probably increase because interest rates are generally getting higher in the future and future technological pro-gress (increasing quality of rolling stock) tends to result in higher investment costs
Energy prices and efficiency
Fossil fuels: increase in the late past and in the future.
Different trends for electricity price: de-crease due to liberali-sation processes vs. increase due to higher prices of fossil fuels for electricity generation.
Road and esp. air transport will face increased prices, with bigger substitution potential for road. Rail transport might profit from lower or at least stable energy prices.
Energy cost will increase for air transport and probably road transport. Energy cost for rail transport might re-main stable or at least in-crease slower.
Transport taxa-tion and charges
Depending on trans-port policy (internali-sation of external cost, climate policy)
More dynamics in Europe than in US, esp. for road transport. Rail: Infrastructure charges might develop along competi-tiveness in relation to road
The volume of taxes and charges might increase slightly, esp. for road and air transport.
Source: COMPETE elaboration

- 38 - COMPETE Final Report: Transport operating cost in EU and US
2.3.2 Development in the past
The following figures show the development in the past, based on specific studies and price
indices for input factors and transport services. The transport prices have inspite of efficiency
gains increased both in EU and the US in nominal terms. The growth rates in the EU and in
the US (plus 25 and 30% respectively) between 1996 and 2005 are similar. However there
are differences in development over time. Due to earlier liberalisation processes, the devel-
opment in the US faces a reduction in transport prices in the late 90ies.
In real terms – compared to the consumer price development – transport prices and operat-
ing costs have increased in the EU slightly, whereas the development in the US is along the
general price index, i.e. no significant change in real terms.
Considering country-wise results, we refer to a study of NEA (2004) for the road haulage
sector:
Total road haulage costs (in nominal prices): In most countries of Western Europe
road haulage costs have increased by about 20-30% between 1995 and 2004. Ex-
ceptions are Spain (+37%) and Great Britain (+46%) where road haulage costs have
grown more. The reason for this development are increases in capital costs and ad-
ditional costs (taxes, wear and tear, insurance) which have been above-average in
Spain and Great Britain. In addition, fuel costs have risen more in Great Britain than
in the other countries analysed.
Labour costs have increased permanently in all countries of Western Europe ana-
lysed. Between 1995 and 2004 the labour costs rose by about 25 - 30% in Ger-
many, Denmark, Belgium, Austria and the Netherlands. In other countries, however,
labour costs have increased by 40-50% in the same period (Spain, Italy, France,
Great Britain).
In most countries the capital costs have remained more or less stable in the last ten
years. In Germany and Great Britain, capital costs in the road haulage sector have
increased by about 10-15% between 1995 and 2004. In Spain, capital costs have
grown even by 24% in the same time. In Sweden and Belgium, capital costs have
decreased by about 10% and in Italy by over 15%.
Whereas for personnel and capital costs, the price development has been more or
less continuously in the last ten years, the fuel cost development shows different
phases. Between 1995 and 1998, the fuel costs have been more or less stable in all
European countries (slightly increased costs in 1996 and 1997). Then, after a slight
drop in 1998, fuel prices rose quickly in 1999 and 2000 by about 20-40%. Between
2001 and 2004, fuel prices remained more or less constant with slight ups and
downs. Overall, fuel prices have increased between 1995 and 2004 by about 30-
45% in most countries of Western Europe. In Sweden (+16%) and Belgium (+24%)
the prices have risen less than in the other countries whereas in Germany (+55%)
and above all in Great Britain (+73%) fuel prices have increased by over 50% in the
last ten years.

COMPETE Final Report: Transport operating cost in EU and US - 39 -
Transport prices vs. total consumer prices
100
105
110
115
120
125
130
1996 1997 1998 1999 2000 2001 2002 2003 2004 2005
Price index (1996=100)
Transport prices - EU Transport prices - USATotal consumer prices EU Total consumer prices USA
Source: EUROSTAT online database (www.eu.int/comm/eurostat), online statistical database of the US Bureau of Transportation Statistics (www.bts.gov)
Figure 12: Transport price development vs. consumer price index in the EU and the USA
EU 25
95
100
105
110
115
120
125
130
135
1996 1997 1998 1999 2000 2001 2002 2003 2004 2005
Transport total Road freight Road passengerRail transport (passenger) Air transport (passenger) Consumer Price Index total
USA
95
100
105
110
115
120
125
130
135
1996 1997 1998 1999 2000 2001 2002 2003 2004 2005
Transport total Freight transport Passenger transport (road, rail)
Air transport Consumer Price Index total
Source: EUROSTAT online database (www.eu.int/comm/eurostat), online statistical database of the US Bureau of Transportation Statistics (www.bts.gov)
Figure 13: Transport price development for the EU and the US (Index: 1996 = 100)

- 40 - COMPETE Final Report: Transport operating cost in EU and US
2.3.3 Future trends
The level of operating cost will remain an important factor of competitiveness fort the trans-
port sector. However it is important to state that transport quality is the other decisive factor.
The increase of transport prices in the past (as shown above) is strongly related to the in-
crease of transport quality (e.g. due to rail and road infrastructure extension, larger and more
modern passenger cars, modernisation of railway rolling stock, etc.). In the near future, this
quality development will remain on the agenda and lead to a further increase of operating
cost. Most decisive are the following issues:
Further development of the liberalisation process, especially in Europe: One can ex-
pect a convergence process between Eastern and Western Europe in the road sector
and a consolidation of the fast changes in the air transport sector.
Further development of energy prices and related climate policy approaches: All ex-
isting forecast show an increase in fossil fuel prices due to scarcity effects on the
one hand (peak oil) and climate policy approaches, such as Emission Trading Sys-
tems (ETS) and post Kyoto principles. Most vulnerable for this development is the
aviation sector, where around 30 to 40% of operating costs are related to fuel cost.
Compared to other transport sector, the substitution potential is quite low. The car
manufactures sector has shown that fuel efficiency gains have been offset by the in-
creasing weight and power of new vehicles, in addition to the generalisation of new
functions such as air condition. Therefore the positive effects of the efficiency gains
on the operating costs are more than outweighed. Larger and more powerful pas-
senger cars also lead to increasing investment costs (capital costs) and therefore
higher operating costs. An important example for the increasing weight and power
of new vehicles is the development of so-called sports utility vehicles (SUV).
Relative importance of competitiveness road-rail: In order to increase competitive-
ness, the rail sector (esp. freight) has to increase its productivity in due time. The
speed of the future productivity increase in the rail sector is depending on the level
of implementation of the EU railways policy in different countries (increase of trans-
national interoperability, increase of labour productivity, increase of service quality).
The development in the transalpine market shows, that there is still a price increase
for (subsidised) combined transport services, since railways do not pass their reduced
operating cost to shippers, in order to gain profit for necessary future investment
(rolling stock, terminals).
The following table summarises the expected development for the different modes in a quali-
tative way. It shows that average operating cost (per vehicle-km) will develop relatively
above the general price development, which means an increase in real terms. There is a
tendency that re-regulation processes and fuel prices are increasing the costs in those trans-
port sectors, where fuel prices are playing a predominant role and infrastructure scarcity is
increasing. The productivity effects in the past might not hold on in a similar way in the fu-
ture. This is especially true for air transport, where there are no real potentials for a further
decrease of operating cost. Still big potentials are visible within the rail sector (and partly for
ports), especially in running cost for cross-border freight transport.

COMPETE Final Report: Transport operating cost in EU and US - 41 -
In total, this means that average operating costs and thus (within competitive transport mar-
kets) transport prices will increase more than in the past in nominal terms. In real terms there
are slight increases. Total operating costs (i.e. expenditures on transport) however are in-
creasing still rapidly due to general transport growth.
It has to be stressed that all the statements in Table 13 refer to average costs per vehicle-
kilometre. The unit costs per ton-km and passenger-km are – additional to the factors de-
scribed in Table 13 – further dependent on the future development of load factors in freight
transport and occupancy rates in passenger transport. The future trends in occupancy rates
of passenger cars is difficult to predict. Since the number of multi-car households is generally
further increasing and individual transport is getting stronger and stronger, the occupancy
rate of passenger cars will further decrease (ceteris paribus). This process might be stopped or
at least slowed down if road pricing schemes for passenger cars are becoming more common
in the European Union and energy prices continues to grow. In road freight transport, load
factors are presumably increasing slightly in the future since further efficiency gains will be
achieved due to competition in the road haulier sector and new charging systems for heavy
duty vehicles (distance-based road charges). In the air transport sector, load factors and oc-
cupancy rates will significantly increase in the future, since larger aircraft will be introduced,
above all in long-distance transport.

- 42 - COMPETE Final Report: Transport operating cost in EU and US
Table 13: Future development of average transport operating costs (per vkm, real prices) Transport mode
Cost factor Road passenger Road freight Rail Air Water
Private transport: no personnel cost. Public transport: Ongoing liberalisa-tion process in public transport leads to decreasing costs.
Cost pressure from Eastern Europe. However, liberali-sation process in the road freight sector is already very advanced. Therefore, little scope for decreas-ing costs.
Ongoing liberali-sation process in the rail sector leads to cost pressure.
Further cost pressure from low cost carriers and due to liber-alisation process in the air trans-port sector. However a con-solidation proc-ess has to be expected.
Wages are already low due to global competition. Fur-ther liberalisation process (above all for ports) will hardly change the situation.
Personnel costs
Personnel costs will rise generally in the long term, if workforce is getting scarcer in the EU (due to demographic development). In the short term, however, there can be an ongoing pressure on
wages because the level of unemployment is still high. Capital costs
Interest rates are generally getting higher in the future compared to the low level nowadays.
Future technological progress tends to result in higher investment costs. Liberalisation process in rolling stock sector has already taken place and led to productivity gains (e.g. rail sector).
Fuel costs
Continuous increase in fuel prices (petrol, diesel)
Continuous in-crease in fuel prices (petrol, diesel)
Electricity costs will remain more or less stable (liberalisation in electricity sector vs. increasing fossil fuel price).
Continuous increase in fuel prices (kerosene)
Continuous in-crease in fuel prices (diesel, oil)
Infrastruc-ture costs (charges, taxes)
Infrastructure is getting scarcer. KM-charges and road pricing will be im-portant.
Infrastructure is getting scarcer and external costs are being inter-nalised.
Falling costs due to productivity gains of the rail (infrastructure) sector. Opposite effect because of growing infra-structure scarcity.
Infrastructure is getting scarcer, especially in big hubs. Environ-mental charges are on the politi-cal agenda (in-tegration ETS)
Port infrastructure (terminals) are getting scarcer
Additional costs
Costs will develop along the general price development
Total oper-ating costs (per vkm)
Private transport: The increase in fuel costs will have big-ger effects in the US, since the aver-age fuel consump-tion is higher in the US than in Europe.
Infrastructure scarcity is more pronounced in Europe than in US. In EU15 infra. scarcity is prob-lem of limited road capacity vs in EU8 it is rather a problem of poor infrastructure quality. Internali-sation of external costs is an EU issue.
Higher potential for cost reduction in the EU since the liberalisation process is already more advanced in the US.
Higher potential for productivity gains in the EU since the liberali-sation process is already more advanced in the US.
Bigger potential for increased produc-tivity gains in East-ern European ports.
Comparison of different regions: - EU 25 - Western Europe - Eastern Europe - USA
In Eastern Europe personnel costs will increase compared to Western Europe. Source: COMPETE

COMPETE Final Report: Panorama of Congestion in EU and US - 43 -
3 Congestion in Europe and the US
3.1 Introduction
Traffic congestion emerges from the mutual disturbance of vehicles, trains or aircrafts when
transport infrastructure capacity approaches saturation. In terms of the consequences a dif-
ference between road transport and scheduled services appears. In road transport congestion
is perceived by increasing mutual disturbance, reduced manoeuvrability and consequently by
decreasing vehicle speeds while in scheduled transport slots or tracks are pre-planned and
thus, at least theoretically, congestion is precluded. In this case the scarcity of infrastructure is
more obvious than road-like congestion effects. In both, road and scheduled transport, con-
gestion brings about a rising unreliability in travel times.
The measurement of congestion may emerge from various rationales, including the monitor-
ing of transport system quality over time or against policy targets, indicating the need for
policy interventions, verifying the effect of policy measures or assessing the impact of trans-
port conditions on social welfare and economic competitiveness in absolute terms, over time
or across regions. Each of these purposes demands for specific attributes of congestion indi-
cator systems.
In this chapter the order of magnitude of transport congestion in the 25 EU Member States,
Switzerland, the US and Canada are presented after a brief overview of existing studies.
Emerging from best practices in assessing transport congestion the chapter then proposes a
stepwise approach towards the establishment of the European harmonised methodology for
monitoring congestion. The information on which the analyses are based on was collected by
interviewing relevant bodies in the Member States and the US and by an extended literature
review. More detailed information on the panorama of congestion is provided by Annex 2
and by the country reports in Annex 3.
3.2 Applied approaches towards congestion monitoring
In recent years an increasing number of studies and policy approaches on measuring and
quantifying transport congestion have emerged. The Trans-Atlantic comparison shows, that
the tradition to carry out congestion monitoring in urban areas is far more developed in the
United States than in Europe. On the other hand Europe’s attempt in quantifying trunk road
performance is more developed than in the US. These differences are to a large extent driven
by the characteristics of transport problems, which are dominated by the high population
density in Europe in contrast to the fast growing mega cities in the US. Selected approaches
from Europe, the US and Canada are described in turn.
3.2.1 Inter-urban road transport
3.2.1.1 Recent activities in Europe and the US
Road congestion on the European trunk road network has been addressed by a number of
studies and is officially observed by some individual countries. On a pan-European level the
most comprehensive studies delivering primary data are the UNITE project funded by the
European Commission’s 5th framework programme (Nash et al. 2002) and the study “Exter-
nal Costs of Transport” launched by the International Union of Railways (Maibach et al.

- 44 - COMPETE Final Report: Panorama of Congestion in EU and US
2004). UNITE has collected delay data for all modes in 12 out of 18 European countries,
which were used to assess congestion costs by the difference of actual against average travel
speeds. In contrast the UIC-Study has applied several measures derived from a European road
transport model, including the delay approach, the welfare-economic deadweight loss ap-
proach and estimates of expected road pricing revenues to quantify urban and inter-urban
road congestion. Further the EC-funded study TEN-STAC (NEA et al., 2003) has evaluated
several scenarios of Trans-European corridors. As one of the measures applied congestion
was computed by comparing actual to free flow travel speeds.
In the US inter-urban congestion is assessed by the White Paper on freight transport bottle-
necks (Cambridge Systematics 2005b). The study identifies major bottlenecks, in particular
where important ports are located within urban centres and at freeway intersections. The
report estimates total costs of roughly 9 billion Euros ($7.8 billion) compared to 1.6 billion
Euros estimated for the EU15 and Switzerland by Maibach et al. (2004).
On the country level, approaches to monitor congestion are known from the UK, Germany,
France, Belgium, Denmark, the Netherlands, Switzerland and from the US. In contrast to the
European studies the national surveys mainly focus on monitoring traffic quality rather than
on assessing congestion costs. The following paragraphs briefly introduce the national proce-
dures applied.
In the UK separate approaches are taken by the Department for Transport for England and by
the Scottish Executive. The DfT carries out peak and off-peak speed measurements by the
floating car technique every two years since 1993 (DfT 2005). Measures proposed to monitor
congestion are time lost per vehicle mile and the best performance of the 10% lowest peak
hour speeds. For Scottish roads archived flow data are used to model congestion indicators,
including additional travel time, costs and travel time reliability (Scottish Executive 2003).
Both methods limit the assessment to recurrent congestion against free flow traffic condi-
tions.
Since 1998 the Netherlands track congestion on their inter-urban road network by measuring
and accounting the length of traffic jams by motorway segment (AVV 2005). Further, some
countries, including Austria, Switzerland and the Netherlands are preparing or operate online
traffic quality information systems.
Apart from these regular approaches, a number of one-off studies on traffic congestion have
been reviewed: The German Ministry for Transport, Building and Urban Development has
carried out a bottleneck study applying the Level-of-Service approach to the motorway net-
work in 2000 and 2015 (IVV and Brilon 2004).
In Switzerland the Office for Road Transport (ASTRA) has assessed the costs of congestion on
Swiss roads for 1996 (Infras 1998) by analysing congestion records in combination with traf-
fic flow data. in 2002 a separate study for the Canton Zug using speed measurements was
performed (Infras 2003) and currently ASTRA has tendered an update of the 1996 study for
the entire country.
In the course of the Lyon-Turin high speed line the PACA region in southern France, CETE
Mediterranee (2004) have carried out a study on the congestion in major urban areas and on
the trunk road network in the region. The study analyses the saturation of motorways and

COMPETE Final Report: Panorama of Congestion in EU and US - 45 -
urban access links relative to total capacity limits and a “discomfort threshold” comparable to
LOS-Level E as defined by the US Highway Capacity Manual.
In the US the Highway Performance Monitoring System (HPMS) regularly monitors traffic
data, which forms the basis for the Urban Mobility Study (Schrank and Lomax 2006). Inter-
urban highway congestion is, however, not measured on a regular basis for passenger traffic
yet, but the Federal Highway Administration (FHWA) has currently initiated a study to close
this gap (CS and TTI 2005). For inter-urban freight transport, Cambridge Systematics (2005)
estimates truck congestion and forecasts it to 2020 in the basis of HPMS data.
3.2.1.2 Methods applied
The studies can be characterised by several issues as follows:
By the method of recording traffic conditions: They might either be measured as
travel speeds or by accounting traffic jams. Speed measurements can be performed
by dedicated measurement vehicles, by speed measurement via induction loops or
radar, by applying traffic volume measurements to speed-flow diagrams or by a
combination out of these methods.
By geographical and time scope: Congestion measures might either capture entire
networks or selected links of particular importance. Further monitoring might be
continuous over the year or be carried out at selected days or hours of day.
By the scope of congestion: Studies distinguish between “recurrent” and “non-
recurrent” congestion. Recurrent congestion only considers regular congestion
caused by traffic overloads, while non-recurrent includes all delay purposes.
By the type of indicators computed: There is a great number of congestion indica-
tors, including the travel time index (= actual by reference travel time), speed index
(= actual by free-flow speed), time lost per vehicle kilometre, share of traffic below a
particular threshold, share nof vehicle or network kilometres affected by congestion,
etc.
Table 14 gives an overview of the methodologies applied by the national studies and moni-
toring procedures reviewed. The pros and cons of the different methodologies will be dis-
cussed in more detail in Section 3.4 towards a harmonised approach for Europe including all
modes of transport.

- 46 - COMPETE Final Report: Panorama of Congestion in EU and US
Table 14: Summary of studies on inter-urban congestion, methodologies Country / reference
Data source Geographical scope
Scope of con-gestion
Reference condition
Indicators
UNITE (Nash et al. 2002)
National speed / delay statistics
EU15, CH, EE, HU; trunk roads
Time and oper-ating costs, recurrent
All-time average speed
Total / average con-gestion costs
Maibach et al. (2004)
European trans-port model
EU15 + CH, all trunk roads
Time and oper-ating costs, recurrent
Free-flow speed
Delay costs, Dead-weight loss MSCP revenues
TEN-STAC (NEA et al, 2003)
European trans-port model
EU25, TEN corridors
Time costs, recurrent
Road ca-pacity limit
Total time costs
England (DfT, 2003)
Floating cars during 6 months
Most busy trunk road sections
recurrent, time losses
Night time speed at lowest traffic levels
Time loss per vehicle km
Scotland (Scottish executive, 2003)
Modelling + measurement vehicles
Trunk roads recurrent, time losses
Total time loss, time loss per vkm, Total costs, journey time reliabilityShare of vkm by LOS
Germany (IVV, Brilon 2004)
Modelling with empirical speed flow curves
Motorway network 2000, 2015
Time losses, recurrent
75 kph for cars at dry weather
Share of network-km with min. 30 cong. hours per year
France (CETE Metditerra-nee, 2004)
Transport net-work model
Motorways, PACA privince (soutern France)
Time losses, recurrent
road capac-ity, discom-fort thresh-old
Hours per day above capacity / dinscomfort,days p. a. with min. one cong. hour
Netherlands (AVV 2005)
Traffic jam detec-tion by induction loops
Entire trunk road network
Time losses, all purposes
Duration and lengh of queues
Total congestion se-verity (km*min)
Switzerland (Infras 1998)
Traffic jam counts, flow data analysis
National roads and agglom-erations
Time, operating, environmental and accident costs
Off-peak speed
Total tim, energy, environmental and accident costs
USA (Cam-bridge Sys-tem. 2005)
HPMS data, mod-elling
Highway intersections
time losses of freight transport
n. a. Time losses per sec-tion; time costs
vkm = vehicle-kilometre, MSCP = Marginal social cost pricing
Table 15 provides some selected results. The figures indicate that goals and approaches of
the studies are very heterogeneous, such that a comparison of congestion levels between
countries or regions is not straight forward on this basis. This incompatibility is due to differ-
ences on all levels of the characteristics as described by the above enumeration.

COMPETE Final Report: Panorama of Congestion in EU and US - 47 -
Table 15: Summary of studies on inter-urban congestion, selected results
Study Indicator Segment year Value UNITE (Nash et al. 2002)
Total costs share of GDP
Mainly motorways, partly trunk and urban roads
1998 1.2 %
Maibach et al. (2004) Total costs share of GDP
All roads, passenger All roads, Freight
2000 1.11 % 0.02 %
TEN-STAC (NEA et al, 2003)
Total costs share of GDP
Parts of TEN, passenger and freight
2000 0.01 %
England (DfT, 2003) Time lost per vkm (seconds)
Motorways, weekday peak Trunk roads, weekday peak
2000
6.7 7.6
Scotland (Scottish Executive 2003)
Time lost per vehicle kilometre (seconds)
All trunk roads, all periods 2003 4.95
Germany (IVV, Brilon 2004)
Share of frequently con-gested network
Motorways 2000 2015
31 % 42 %
France (CETE Met-diterranee, 2004)
Days above discomfort threshold
Motorways in PACA province 2000 > 70 %
Netherlands (AVV 2005)
Total traffic jams (mill. km*minutes)
All motorways 2000 2005
8.0 10.5
Switzerland (Infras 1998)
Total time costs, M€ Excl. small delays,M€
All roads 1996 710 412
USA (Cambridge Systematics 2005)
Time losses (mill. h) Time costs by GDP
Motorway intersections 2004 243.3 0.07 %
vkm = vehicle-kilometre, M€ = million Euros
3.2.2 Urban roads
On a trans-European scale the case studies of the UNITE project (Doll 2002) has computed
marginal external urban congestion costs for morning peak traffic in four European medium-
size cities: Brussels, Edinburgh, Salzburg and Helsinki using the Saturn traffic model.
Since 1993 the UK department for Transport (DfT) records travel speeds in English urban ar-
eas and on major inter-urban road links (DfT, 2005). Urban and inter-urban speed studies are
carried out in alternate years, whereas for London Transport for London performs similar
measurements for the British capital every three years. Further comparable travel speed
measurements are provided by the UK Commission on Integrated Transport for a number of
world cities (Dunning 2005) and by the OECD (OECD 1998).
The most advanced study on urban road congestion in Europe is carried out by Hvid 2004 on
the wider Copenhagen region (Hvid 2004). The study has carried out extensive speed and
flow measurements across the Copenhagen road network in order to derive location-specific
speed-flow curves. These where then used to determine area-wide and street-specific con-
gestion measures.
The prefecture of the Ile-de-France province provides analysis of traffic flow data on the main
arterial around Paris dating back to 1998. Measured are traffic volumes, travels speeds and
traffic jams by course for 15 Sections of the motorway and national road network in Ile-de-
France (Prefecture de la région d’Ile-de-France 2005). Further, Appert (2004) proposes a
saturation indicator giving the relation between current and free flow speed as a measure of
congestion in Lille, Marseille and Lyon. Estimates of congestion-related time, operating and

- 48 - COMPETE Final Report: Panorama of Congestion in EU and US
pollution costs for cars and urban buses in large Spanish cities 1995 are available from Mu-
ñoz de Escalona (2004) resulting from traffic model applications.
As concerns the monitoring of traffic quality in urban areas over time the US and Canada are
far ahead of many European countries or regions. As part of the Mobility Monitoring Pro-
gramme the US Urban Mobility Report is unique as it tracks trends for 85 urban areas since
1982 to date. It computes levels of recurrent congestion on urban highways and arterials
based on road network and traffic density data for peak hours at a typical day. The major
indicators are annual delays per traveller and the travel time index. Moreover, time costs and
fuel wasted for private vehicles and additional operating costs for commercial vehicles are
estimated.
Referring to the TTI methodology in 2006 Transport Canada has issued as study on the costs
of traffic congestion, including delays, fuel consumption and greenhouse gas emissions for
nine Canadian cities (TC 2006).
The methodological aspects tracked for urban congestion monitoring are equal to the inter-
urban case (see Section 3.2.1). As above, Table 16 presents some methodological issues of
the above mentioned studies and Table 17 shows a selection of results.
Table 16: Summary of studies on urban congestion, methodologies Country / reference
Recording method
Geographical scope
Scope of congestion
Reference speed
Indicators
US (Schrank, Lomax 2006)
Volume data + capacity func-tions
85 cities, arterials + major local links
time, fuel, recurrent + all purposes
Designed travel speed
Travel time index, total costs
UNITE (Doll 2002)
Transport models
4 medium-sized cities
recurrent, time losses
Equilibrium travel speed
Marginal social costs
England (DfT, 2004)
Floating cars during 6 months
Links > 10000 veh/day + links of local importance
recurrent, time losses
Weekday off-peak speed
Time loss per vehicle km
Paris (Prefec-ture Ile-de-France 2005)
continuous by induction loops + police reports
Ile-de-Frace, main arterials
Time losses, all purposes
60 kph length of traffic jams; vkm below 60 kph
France (Ap-pert)
Network model application
Montpellier, Nice. Lille
Time losses. recurrent
None Speed index
Copenhagen (Hvid 2004)
Traffic volumes + local speed-flow curves
Greater Copenha-gen, city roads and motorways
Time losses. recurrent
average off-peak speed
Share of critical congestion, time lost per vkm
Spain (Muñoz de Escalona, 2004)
Regression from Madrid & Barcelona
Details: Madrid and Barcelona; all cities over 200000 inh.
Not available Not available Time costs operating costspollution costs

COMPETE Final Report: Panorama of Congestion in EU and US - 49 -
Table 17: Summary of studies on urban congestion, selected results Study Indicator Segment year Value US (Schrank, Lomax 2006)
Travel time index All areas Very large areas Medium sized areas
2003 1.37 1.48 1.18
Average annual delay per traveller (
All areas Very large areas Medium sized areas
2003 47 61 25
UNITE (Doll 2002) Marginal social costs (Euro-Cent / vkm)
Brussels Edinburgh Salzburg Helsinki
1998 25.2 11.6 16.4 4.3
England (DfT, 2004) Seconds lost per vehi-cle kilometre (weekday peak)
Greater London other conurbations Other large urban areas All urban areas (inkl. London)
2000 65.8 34.4 36.9 46.4
Paris (Prefecture de la région d’Ile-de-France 2005)
Share of traffic vol-umes below 60 kph
Ile-de-France, main arterials A86 By-pass
2003 1998 2003 1998
18 % 16 % 20 % 19 %
Seconds lost per vkm Municipality Motorways
2001 50 25
Copenhagen (Hvid 2004)
Network affected by critical congestion
Municipality Motorways
2001 2 % 11 %
France (Appert) Speed index = atual / free flow speed
Montpellier LIlle
n. a. 0.68 0.72
Switzerland (Infras 2003)
Total hours lost per day, share by purpose
Commuters Business Leisure Freight
2000 42 % 17 % 35 % 5 %
Total time costs (million Euros)
Madrid, cars Madrid urban buse
1995 1301 199
Spain (Muñoz de Escalona, 2004)
Total costs per inhabitant(Euros)
Madrid Barcelona
1995 486 264
3.2.3 Scheduled transport services
For scheduled transit services only a very limited number of studies addressing the problem of
congestion exist. First, this can be explained by the limited policy relevance as scheduled ser-
vices are regulated by service and network operators. Second, data availability is often a
problem and finally, the presence of time tables suggests very simple indicators, which are
less attractive for research.
The most important scientific study on congestion in rail, air and public transit is the UNITE
project (Nash et al. 2003) suggesting a simple delay approach. The necessity of weighting
train or plane delay figures with the affected passengers and the problem of missed connec-
tions is discussed, but, due to data availability, not considered in the practical estimation of
congestion costs. Further approaches exist on the urban level. The Copenhagen congestion
study (Hvid 2004) has estimated speed-flow curves for urban services and the congestion
study for Switzerland (Infras 1998 ) has addressed the problem of P. T. delays using data
from the operators.

- 50 - COMPETE Final Report: Panorama of Congestion in EU and US
Statistical information and the development of delay indicators in air transport in Europe is
provided by several sources for Europe and the US in comparable quality. In the rail sector
Europe suffers from the presence of a large number of former state owned and now partly
privatised railway undertakings, which do usually not provide access to delay data. A positive
exception is the UK, where Network Rail publishes detailed delay analyses. For urban services
a limited number of municipalities, such as London, Dublin and Paris, publish statistics of per-
formance indicators.
Besides the delay of services, congestion in scheduled transport also has a dimension related
to the comfort of travelling and the crowding of vehicles. This fact is discussed in the UNITE
project, but has been dropped from the transport cost analysis due to the non-availability of
respective quantitative information. Nevertheless the problem of overcrowded services is ac-
knowledged by some member states, e. g. France (Sauvant 2002) and the UK (House of
Commons 2002). In the UK the installation of automatic passenger counting devices has just
started, but will take some time to be universal. Detailed figures, however, are needed as
average deily or yearly values do not allow to adequately analyse overcrowding effects. Even-
tually, we disregard the related effects in analysing the congestion situation in Europe and
the US, but acknowledge it being a topic for further investigation.
3.3 The Panorama of congestion
For drawing a panorama of congestion for Europe and the US the literature review presented
above is complemented by the results of the COMPETE country reviews carried out for the 25
EU member states, Switzerland and the US and by two specific studies on EU and US mari-
time and aviation markets. The detailed country reviews have been collected in Annex 3,
while the specific air and port studies are integrated in Annex 2 to this report.
3.3.1 Inter-urban road transport
3.3.1.1 Evidence from available studies
A panorama of inter-urban road congestion based on quantitative figures is best presented
by international studies as national approaches are rare and differ widely in their methods
and assumptions. Mainly for western Europe the UNITE project (Nash et al. 2003) and the
study “External Costs of Transport” by Infras and IWW (Maibach et al. 2004) deliver the most
comprehensive results. The average costs per vehicle kilometre of all vehicle types (UNITE)
and separately for passenger cars and HGVs (Infras/IWW) for the EU-15, Switzerland and
Hungary are depicted in Figure 2 for the year 2000 4.
Maibach et al. (2004) finds the highest average costs for the UK, Benelux, France, Germany,
Switzerland and Italy, forming the so-called “blue banana” of industrialised areas across
4 For Maibach et al. (2004) average costs relate to the deadweight loss measure. The difference between HGV
and passenger car congestion costs explains by the higher value of time and the higher capacity units of HGVs. for the UNITE values a breakdown by passenger and freight vehicles was not possible.

COMPETE Final Report: Panorama of Congestion in EU and US - 51 -
Europe 5. The se results are only partly confirmed by the UNITE estimates, which are compa-
rably low for the Netherlands and high for Austria and Spain. Moreover, UNITE reports high
congestion costs for Hungarian inter-urban roads.
Average congestion costs
0
20
40
60
80
100
120
140
160
Austria
Belgium
Denmark
Finlan
d
France
German
y
Greece
Hunga
ry
Irelan
dIta
ly
Luxe
mburg
Netherl
ands
Portug
alSpa
in
Sweden
Switzerl
and UK
Euro
/ 10
00 v
ehic
le-k
m
UNITE, all vehicle types Infras/IWW, passenger cars Inffas/IWW, HGVs
Symbols and source: Infras/IWW: Maibach et al. (2004), UNITE: Nash et al. (2002)
Figure 14: Average congestion costs for EU15, Switzerland and Hungary
Table 18 presents rather old figures for the year 1993, but they provide an insight into the
affected network and the users’ perception of congestion conditions. The figures reveal that
within Europe the UK and the Netherlands suffer most from congestion, while the road qual-
ity is perceived very good in Scandinavia and in the US.
5 The dominance of the Dutch and the UK figures, but also the high average congestion costs for Switzerland, are
reported to be overestimated by the underlying transport model, which is mainly due to differences in the net-work representation.

- 52 - COMPETE Final Report: Panorama of Congestion in EU and US
Table 18: International comparison of congestion figures 1993
Road network (km/1000 inh.)
1993
Motorways (km/million inh.) 1993
Congestion (% of links) 1993*
Perceived road quality 1995**
USA*** 14,5 331 -- 9 Japan 6,2 37 (1987) -- 6,2 United Kingdom 6,2 56 24,1 5,9 Germany 7,6 136 7,9 8,3 France 15,8 129 4,5 8,5 the Netherlands 6,1 141 14,8 5,9 Belgium 12,9 169 5,9 8,3 Denmark 13,7 127 0 9,1
Source: ECMT 1998
3.3.1.2 Evidence from Country reviews
The COMPETE country reviews have taken a more qualitative view on the problem of conges-
tion in the Member states, Switzerland and the US. The results are broadly in line with the
indicators presented in Figure 2, but look behind the local drivers of congestion. This is not
always capacity shortage, but – in particular in some New Member States – a problem of
road infrastructure quality. Further the analyses reveal that in Europe congestion is mainly a
problem of urban access links with the exception of the very densely populated Randstad
region (Netherlands) and the Ruhr area (Germany). Freight traffic is particularly penalised by
capacity problems in port hinterland transport, e. g. at Rotterdam and Rostock.
Table 19 draws the comparison between the US and six European regions by summarising
the COMPETE country reviews 6. The table classifies current congestion from “A” (no prob-
lems) to “E” (severe regular congestion across large parts of the networks) and the expected
direction, in which transport quality emerges. Besides the more peripheral regions Scandina-
via, the Baltic states, southern Europe and Ireland, many European regions show dense or
saturated networks.
In contrast, the US reports problems only at highway intersections and some neuralgic spots.
These bottlenecks are, similar to Europe, located at seaports and at interstate road crossings.
In both, Europe and the US, congestion tends to worsen in the future. In its “State of Logis-
tics Report 2006” the US Council of Supply Chain Management Professionals (CSCMP) pro-
vides US transport infrastructure no better than the mark “D+” and constitutes, that the US
has lost ground against foreign countries concerning the state of transport infrastructrure.
The study concludes that the US was not prepared to take the expected strong growth in the
logistics sector in the coming decades (CSCMP 2006).
Besides investment in new or improved road infrastructure, a number of member states and
the US have implemented or plant to install ITS solutions for traffic demand management as
a means to fight congestion. The recent introduction of electronic road pricing in Germany
and Austria, however, do not indicate an influence on congestion levels to date. Thus, active
6 A detailed summary by country including information on data collection methods and policy plans is contained
in Annex 2. The individual country reports are collected in Annex 3

COMPETE Final Report: Panorama of Congestion in EU and US - 53 -
traffic control measures, e. g. ramp access control and speed regulations, appear to be more
appropriate. The US department of Transport has recently published a national strategy to
fight congestion (DOT 2006b), calling on investments, technical solutions, incentives and soft
measures in order to address the problem of congestion from many sides. Also the UK De-
partment for Transport follows a policy strategy particularly relating to congestion reduction
in the Ten Year Plan 2000 (DfT 2000b). Other consistent national strategies are not known.
Table 19: Synthesis of country reviews - inter-urban road Region Current state of congestion Expected development of congestion LOS
slope
United States
Serious congestion on interstate highway crossings and where congestion is caused by metropolitan areas
Increase due to lag of grade-separated junctions and access points. Particular prob-lem for port access traffic.
B ➘
Ger-many and Alpine
High congestion in Ruhr area; Brenner corri-dor and urban access routes; no Problems in rest of Austria and Switzerland
High increase in Germany, no severe prob-lems in Alpine region due to rail investments and road charging
B-D ➘
France and Benelux
Particular Randstad region (NL); international motorways are currently close to saturation
Stagnating demand in BE; increasing border crossing traffic in FR, NL and LU B-E ➘
UK and Ireland
Perceived a major issue by government par-ticularly in England, less severe in Ireland
Stablelisation by policy measures in the UK; increase due to truck traffic in Ireland B-D ➔
Scandi-navia and Baltic
Few times per year on holidays on limited network part on two lane roads
No information, but due to Scandinavia’s remote location no dramatic change ex-pected
B ➔
Central Europe
Good: Slovenia and Hungary; bad road quality in Poland and Slovakia; all: bottle-necks around big cities
Pessimistic due to lag between fastly grow-ing traffic and infrastructure investments B-D ➘
South-ern Europe
Only in specific parts under construction in fairy days and some weeks in summer
No information for IT, No congestion pre-dicted in the next 10-15 years C ➔
Source: COMPETE
3.3.2 Urban road congestion
3.3.2.1 Evidence from available studies
There is no unique way in Europe to assess urban congestion. The most advanced ap-
proaches are followed by the UK department for Transport and Transport for London by
regularly measuring vehicle speeds. For English towns, Paris and Copenhagen the available
information was sufficient to estimate a travel time index similar to that computed by the
Texas Transportation Institute for the US (Schrank and Lomax 2006). The Travel time index
gives the ratio between the actual average and the free flow travel speed and thus indicates
the increase of journey times due to congestion7.
Table 20 reveals that the development of the travel time index indicating the severity of con-
gestion in English cities is in line with the development of urban congestion in the US be-
tween 1993 and 2004. The same holds for the comparison of 2004 values except for Lon-
don, which seems to suffer extraordinarily under congestion.
7 As the data sources are quite different the comparability of the results presented in Table 20 is restricted.

- 54 - COMPETE Final Report: Panorama of Congestion in EU and US
Table 20: Travel time index in EU and US cities 2003 Area Travel time index
1993 2004 1993-2004
Paris, Ile-de-France 1,34
Greater Copenhagen area 1.40
Greater London 1.84
Average of other English cities 1.24 1.32 0.08
US 85 Area Average 1.28 1.37 0.09
US Very large average (13 areas) 1.38 1.48 0.10
US Large average (26 areas) 1.19 1.28 0.09
US Medium average (30 areas) 1.11 1.18 0.07
US Small average (16 areas) 1.06 1.10 0.04 Source: Own estimations; Schrank and Lomax (2006)
3.3.2.2 Evidence from Country reviews
The comparison of European and US cities based on the synthesis of the COMPETE country
reviews (Annex 3) is presented by Table 21. The most congested urban areas are located in
the UK, in Central and in Southern Europe. The most affected agglomerations are Paris, Lon-
don, Prague, Athens and the big Spanish and Italian cities. In some cases, e. g. Prague, peak
traffic has spread out to the off-peak periods, such that off-peak is only visible during night
time.
For other big and medium-sized capitals, such as Berlin, Zurich, Vienna, Warsaw, Stockholm,
Helsinki or Copenhagen usual peak hour or only mild congestion is reported. In most of
these cases congestion is rather a problem of access links. However it needs to be stated that
the reduction of urban congestion in Europe is partly due to the increasing sprawl of urban
areas, which also considerably impacts daily travel and commuting times.
Table 21: Synthesis of country reviews - urban road Region Current state of congestion Expected development of congestion LOS
slope
United States
Steadily increasing in spread and severity, but not perceived a major problem, even in large metropolitan areas
Congestion continues to grow; transport improvements do not keep pace with demand growth
D ➘
Germany and Alpine
Typical peak hour congestion in DE and AT; access problem in CH due to regulation
Only increasing problems at urban by-passes expected C ➔
France and Benelux
Major bottlenecks: Paris, Brussels Lyon and Bordeaux; other usual peak traffic
Expected increase in France and Luxem-burg against decrease in Belgium B-D ➘
UK and Ireland
Greater London area highly congested; other cities rather modest
Increasing demand in medium term pre-dicted; long-term relaxation for IE C–E ➘
Scandinavia and Baltic
Moderate congestion even in capitals Further reduction by road tolling in Stock-holm; some increase expected for Helsinki B- C ➔
Central Europe
Very big Problem in Prague and Budapest; other usual peak and access congestion
Further increase due to catching-up in economic development; insufficient con-struction
B- E ➘
Southern Europe
Severe congestion in big and some me-dium sized cities besides Cyprus and Malta
Strong increase for Athens and in Italy and Spain; positive expectations for Lisbon C - E ➘
Source: COMPETE

COMPETE Final Report: Panorama of Congestion in EU and US - 55 -
The TTI Urban Mobility Study (Schrank and Lomax 2006) shows that congestion in US cities
had been increasing significantly along all dimensions (duration, geographical sprawl and
severity) since the 1980s. Further, the model calculations reveal that congestion rises more
dynamically in large and medium sized areas than in very large agglomerations. Remarkably,
congestion is not considered a major problem for most US citizens as the ability to relocate to
non-congested areas within a city or across states is high. US Citizens tend to value conges-
tion less critical than e. g. social security, health care, school quality or safety in bigger ag-
glomerations on a national level.
3.3.2.3 Prospects and policy options
The future expectations for both, the congested cities in Europe and the US, are rather pes-
simistic. Limited space availability makes capacity extension measures less applicable. The
country reviews report on a variety of alternative measures envisaged by individual countries
or cities. While capacity expansion programmes are particularly reported for the US, Germany
and Poland, other countries focus more on traffic management, ITS and the promotion of
public transport. Intelligent Transportation Systems (ITS) receives attention by most countries
hoping that they could gain extra capacity and thus reduce congestion. Against the current
trend Budapest plans to replace signalling systems by roundabouts.
The greater London area is probably the most congested zone in Europe. However, the intro-
duction of the London Congestion Charge in 2003 has considerably improved the situation.
Vehicle speeds have been rising by 5% and both, the frequency and the punctuality of public
transport has considerably improved. Similar positive experiences have been made by the trial
of the Stockholm congestion charge and by city access control in Zurich.
3.3.3 Rail transport
3.3.3.1 Evidence from available studies
Giving a comprehensive picture of the quality of Europe’s railway market is rather difficult as
detailed punctuality figures by delay cause are treated as private information by many railway
undertakings. Thus, only annual delay figures and peace-wise information on causes or on
specific services is available. And even this information is to be treated with care as first,
regular delays may be eliminated by the railway undertakings through adjusting time tables
and second, the values often reflect the delay at the trains’ final destination, which does in
no way reflect the passengers or shipments affected. Moreover, additional travel times of
passengers due to missed connections are not captured by official delay statistics.

- 56 - COMPETE Final Report: Panorama of Congestion in EU and US
Table 22: Railway punctuality figures in EU and US
Country / company Type of service Margin Punctuality Year
US, Amtrax Long-distance passengerShort-distance passenger
20 - 30 min. 10 - 20 min.
53 % 77 %
2003 2003
Europe Thanys Eurostar
5 min. n. a.
84.4 % 89.2 %
2005 01-10/2004
Germany, DB Passenger 5 min. 95 % 2004
UK, all operators Long distance sector London & south east Regional sector
10 min. 5 min. 5 min.
79 % 85 % 82 %
2005/06 2005/06 2005/06
France, RFF South-east HSL North HSL Atlantic HSL
5 min. 5 min. 5 min.
82.2 % 87.1 % 86.3 %
2005 2005 2005
Poland, PKP Passenger 5 min. 97.0 % 2004
Switzerland, SBB Passenger 5 min. 92.3 % 2004
Finland, RHK Inter-Urban Urban
5 min. 3 min.
97.6 % 90.0 %
2004 2004
Czech Republic All passenger 5 min. 92.3 % 2005/1
Spain High speed – AVE High speed – Talgo 200 Long distance trains
3 min. 10 min. 10 min.
99.8 % 97.5 % 95.9 %
2004 2004 2004
Europe, UIRR Intermodal freight 60 min. 72 % 2004
Germany, Railion Freight 30 min. 90.6 % 2004
Switzerland, SBB Cargo Freight n. a. 92.3 % 2004
Finland Freight 15 min. 94 % 2004
Source: Data from country reports in Annex 3
The comparison shows that US quality standards in rail punctuality are far below the high
standards of European railway undertakings. But the distances in the US, and thus total travel
times, are much longer in the US and Amtrax reports on mixed passenger and freight ser-
vices, while EU punctuality figures are usually restricted to passenger services. Time series of
punctuality presented in Figure 15 show that there might be high fluctuations in on-time
arrivals and that long-distance services are generally below the average of all services.

COMPETE Final Report: Panorama of Congestion in EU and US - 57 -
Internatinal punctuality rates
40%
50%
60%
70%
80%
90%
100%
110%
1998 1999 2000 2001 2002 2003 2004 2005
Pun
ctua
lity
(diff
eren
t mar
gins
)
Amtrax total Amtrax long distance Eurostar high speedEurope Intermodal Trains UK total UK Long distanceCzech Railways Spain - AVE high speed Spain - Talgo 200Spain - long distance Switzerland, SBB Cargo
Figure 15: Time series of punctuality data for selected railway undertakings
3.3.3.2 Evidence from Country reviews
Table 23 summarises the reviews of EU Member States, Switzerland and the US on rail con-
gestion. In Europe the major bottlenecks are the French high speed lines and the connections
from Dutch seaports to the German border. Further, capacity shortages on the German net-
work reach out to Switzerland and to the Netherlands. The New member states report that
the physical quality of the network, of the stations and the rolling stock, incident and track
works cause more delays than pure capacity restraints.
Table 23: Synthesis of country reviews - rail transport Region Current state of congestion Expected development of congestion LOS
slope
United States Freight: Considerable problems due to the lag in grade-separated facilities in the Los Angeles and Chicago regions.
Further increase due to lag of railway com-panies in funds to finance expensive invest-ments
D ➘
Germany and Alpine
Considerable German rail bottlenecks affect-ing traffic in Switzerland
Major capacity extensions; Alpine routes remain affected by capacity limit in Germany A-C ➚
France and Benelux
High speed and freight lines in France and the Netherlands saturated; relaxed in Belgium
Additional traffic until 2012 +15% which will increase the saturation A-D ➘
UK and Ireland
Current recovery in UK; some minor conges-tion in Ireland
Additional demand due to economic devel-opment and hard coal imports B-C ➔
Scandinavia and Baltic
Few congested track segments; incidents and low technical standard in Baltic states
Delay reduction through policy and invest-ments; demand driven increases in Latvia A-C ➚
Central Europe
Problems: Old equipment, construction works and incidents; border crossings
Partly solving and partly retaining current problems C ➔
Southern Europe
Only some minor delays on long-distance lines due to bad infrastructure quality
Improvement for Spain, more delays ex-pected in Athens region
A- B ➔
Source: COMPETE

- 58 - COMPETE Final Report: Panorama of Congestion in EU and US
In contrast, US networks are highly congested. Major bottlenecks are the lag in grade-
separated facilities in the Los Angeles and Chicago regions causing considerable problems in
freight shipment. This phenomenon is similar to the case of the Dutch seaports.
3.3.3.3 Prospects and policy options
The general prospects for service quality in the European railway market are stable to posi-
tive. In particular the huge investment programmes of the Alpine countries and other initia-
tives manage to accommodate demand increases except for the case of Rotterdam port hin-
terland transport. Here the newly constructed Betuve Lijn will only be able to serve the addi-
tional demand to Germany and not contribute to improve overall railway quality in the Neth-
erlands.
Overall there is no consistent strategy of national network operators and rail carriers to re-
duce delays. Apart from investment in new capacities, the separation of passenger and
freight traffic, construction of high speed lines, peak load pricing and the modernisation of
rolling stock and signalling and train control systems are mentioned by the country reviews.
The introduction of the European Train Control System (ETCS) could help to make interna-
tional train operations more efficient and reliable.
The US problem is a financing one. Railway companies lag of sufficient resources to invest in
new capacity. Therefore, current capacity problems are expected to further increase. The in-
vestments in grade-separated intersections and truck-train interchange facilities by the US
SAFETEA-LU policy program will not suffice to reverse this development.
3.3.4 Aviation delays
3.3.4.1 Evidence from available studies
In Europe flight delays are published by Eurocontrol and by the Association of European Air-
lines (AEA). Eurocontrol delay statistics focus on delays caused by Air Traffic Management
(AFTM), but also report total delays due to other reasons. Due to their availability by Airport,
the subsequent analyses are based on the results of the annual AEA consumer reports (AEA
2006). Similar consumer reports are available for the US (DOT 2006), which form the basis of
the official US transportation statistics (BTS 2006).
Following the detailed analysis concerning delays and capacity per region and airport, subse-
quently a comparison on delays between the USA and Europe is presented. The long term
trends are illustrated by Figure 16. It shows that delay rates in the two regions across all air-
ports are similar, but the EU development appears slightly more dynamic. While until the mid
1990s intra-European flights have been more on time, their punctuality has dropped signifi-
cantly after the Kosovo conflict in 1999 and since then has remained worse compared to US
punctuality figures.

COMPETE Final Report: Panorama of Congestion in EU and US - 59 -
European and US average air traffic delay rates
0%
5%
10%
15%
20%
25%
30%
35%
1992 1993 1994 1995 1996 1997 1998 1999 2000 2001 2002 2003 2004 2005
Del
ays
>15
min
utes
USA, major air carriers Europe, Top-27 airports
Figure 16: Long-term comparison between delay rates in US and European air transport
Sources: BTS (2006) and AEA (2000 to 2006)
3.3.4.2 Evidence from case studies on selected airports
An analysis of six top European and the five top US airports has been performed by compar-
ing the development of passenger and delays by purpose in the context of past and future
investment programmes. It is argued that a parallel growth in passenger numbers and delay
rates indicates the airport operates at its capacity limit. But it is acknowledged that, besides
airport infrastructure capacity, the efficiency off air traffic management (ATM) and the per-
centage of systemic reactionary delays are fully or partly out of the airport’s responsibility.
For Europe the results show capacity shortages at the London airports, while the Paris air-
ports, Frankfurt and Madrid are not considered to suffer from congestion. Most of the US
airports have still not recovered from the 2001 crises. Among the top-5 US airports only Los
Angeles urgently suffers from congestion and in Atlanta some problems with ATM delays are
indicated. Chicago, Dallas and Las Vegas operate below their capacity limits and show no
signs of severe congestion. Table 24 resumes the results of the airport case studies.

- 60 - COMPETE Final Report: Panorama of Congestion in EU and US
Table 24: Summary of European and US airport analyses
Europe United States
London Heathrow: Highest percentage of delayed flights among top-10 airports; opera-tion close to capacity limits. Current construc-tion of Terminal 5 will reduce delays.
Atlanta: Highest share of ATM-caused delays indicates airspace congestion; however sufficient infrastructure capacity due slow demand growth and substantial past investments
London-Gatwick: Single runway; performance similar to Heathrow with even stronger increase in delays, which indicates heavy congestion.
Chicago: Demand reduction and significant delay reductions. Unlikely to suffer from congestion.
Paris-Orly: One of the least congested airports among top-10.
Dallas: Low delay rates and only slight passenger increase. No congestion problems.
Paris-CDG: Not congested despite the high percentage of ATM delays due to its hub func-tion.
Los Angeles: Currently congested; 2005 signifi-cant increase in delays with high share of airline related causes. Large 10 year investment plan.
Frankfurt: 3rd largest European hub and best performance of delayed flights. Future large expansions planned in Germany (Frankfurt, Munich and Berlin-Brandenburg International)
Las Vegas: Constant delay rate with high share of reactionary delays. No current congestion problems.
Madrid: High passenger growth with significant decline of delayed flights – starting from a high level. Most important ATM and reactionary delays; overall far from congestion.
Source: Own survey
Table 25 compares annual delay rates over time and by purpose for the top-5 airports in
Europe and the US. The currently worse performance of European airports can be a clear
indicator of higher congestion in Europe compared to the US. This can be supported by the
different contexts of both industries: the USA is going through an important crisis (not yet
recovered from the 2001 events) and has a certain level of spare capacity in most airports. On
the contrary, the European industry has grown strongly in the last decade and its airports and
airspace have been or still are more congested, despite the efforts on investments for capac-
ity expansion.
Table 25 – Resume of percentage of delayed flight and causes by airport and region
Source: own elaboration from AEA and BTS data
2001 2002 2003 2004 2005 Airline Airport Weather Late Arr.EUROPEAverage 26.9 24.2 21.0 23.2 24.5 6.9 7.9 0.9 8.8London Heathrow 24.0 25.7 22.5 27.8 28.4 7.8 9.3 0.7 10.6Paris CdG 30.3 26 24.4 22.7 25.0 7.9 8.7 0.8 7.6Frankfurt 20.3 18 16.8 18.3 20.5 4.2 5.5 1.4 9.4Madrid 32.4 30.2 21.5 23.3 25.3 6.1 10.2 0.5 8.5Amsterdam 27.3 21.1 19.7 23.7 23.3 8.6 5.9 0.9 7.9USAAverage 23.8 17.7 17.7 20.8 20.7 4.8 9.1 0.6 6.2Atlanta : : : 23.2 24.5 4.3 14.5 0.6 4.6Chicago : : : 26.1 22.2 4.1 11.5 0.6 6.0Los Angeles : : : 17.0 18.7 6.3 6.2 0.5 5.7Dallas : : : 16.1 16.9 3.6 6.4 0.9 6.1Las Vegas : : : 21.4 21.3 5.5 6.9 0.5 8.4
Region Percentage of delays Sources of delay 2005 (%)

COMPETE Final Report: Panorama of Congestion in EU and US - 61 -
3.3.4.3 Evidence from Country reviews
The assessment of the COMPETE country reviews on air transport presented by Table 26 re-
veals the analysis of the airport case studies by showing a higher level of congestion for
European than for US airports. Nevertheless, none of the systems can be considered as criti-
cally congested.
Table 26: Synthesis of country reviews - aviation Region Current state of congestion Expected development of congestion LOS
slope
United States
Since 1987 no increase in total delayed flights though steady traffic growth; main cause: weather.
Following the past trend average delays will further decrease B ➚
Germany and Alpine
Currently capacity limits in Frankfurt and Munich; low to medium delay rates
German investment plans will cause over-capacities; possible lag in Switzerland C ➔
France and Benelux
Limited infrastructure and airspace capacity Due to dynamic growth in demand congestion is expected to rise in the future D ➘
UK and Ireland
No information No information
Scandinavia and Baltic
Information on Baltic countries only: no cur-rent congestion problems
Congestion problems expected due to eco-nomic growth A ➘
Central Europe
Severe problems in Budapest only; capacity problems in Prague have been solved
Strong demand growth in Warsaw and Buda-pest will increase capacity problems A-D ➘
Southern Europe
Large airports approach but have not yet reached capacity limits
All big airports besides Lisbon expect im-provement of capacity situation A-C ➔
Source: COMPETE
While the analyses coincide for Germany and Spain, a large discrepancy between the two
analyses concerns the Paris airports. While the country review states limited infrastructure
and airspace capacity, the AEA punctuality figures analysed indicate no major problems. This
might be explained by an efficient flight management at the airports and the French Air Traf-
fic Control Centre.
3.3.5 Waterborne transport
3.3.5.1 Evidence from case studies on selected seaports
Within the seaport case study four US and 16 European seaports have been studied. The
results show clearly that port congestion is a US problem. Table 27 presents the main state-
ments for each individual port.

- 62 - COMPETE Final Report: Panorama of Congestion in EU and US
Table 27: Results for selected EU and US seaports
Country Current state of congestion Expected development of con-gestion
Long Beach (US Pa-cific)
Road and rail increasingly congested, terminals equally congested
As traffic increases, problems may worsen
Miami (US Atlantic) Problem landside: gate, location close to city
Increasing
Tacoma (US Atlan-tic)
Strong hinterland congestion Problems may rise without action
Corck (US Atlantic) Constant inland congestion Sharp rise London (UK, inland seaport)
No structural congestion on maritime side
Probable worsening on hinterland
Humber (UK, east coast)
No congestion No immediate worsening
Felixstowe (UK, south east coast)
No congestion No worsening expected
Hamburg (Germany, North)
Congestion occurs, but not quanti-fied
No worsening
Rotterdam (Netherl., Atlantic)
Only congestion on hinterland side; Pessimistic
Antwerp (Belgium, Atlantic)
Sometimes congestion, especially at terminals
Situtatiion will improve: new quays, better rail, inland navigation and trucking system
Zeebruges (Belgium, Atlantic)
Mainly congestioni in hinterland No immediate worsening
Marseille (France) Only congestion for tankers Other commodity types may be affected too
Portuguese ports (Atlantic)
No congestion No worsening
Rostock (Germany, Baltic)
Congestion at gates and at terminal; peak congestion in hinterland trans-port
Road situation may get worse
Aarhus (Denmark, Baltic and North Sea)
Minor congestion at terminals Worsening through overflow from other ports
Kotka (Finland, Bal-tic))
No real congestion No worsening expected
Rauma (Finland, Baltic)
No recurrent congestion No worsening
Gdynia (Poland, Bal-tic)
No congestion, at least not on mari-time side
Worsening if no measures
Barcelona (Spain, Med.)
Some inland congestion No worsening expected
Genova (Italy, Med.) Minor congestion in hinterland No clear view Source: COMPETE
3.3.5.2 Evidence from country reviews
The results in Table 28 show a clear discrepancy between the highly congested US ports and
the European market and thus fully confirm the results of the seaports case study. EU ports
and inland navigation networks do not operate under full capacity utilisation and thus are
ready to take the strong increase in container movements expected for the coming decades.
In contrast, the US faces a strategic problem as most ports are located within urban areas
and thus can not be further expanded.
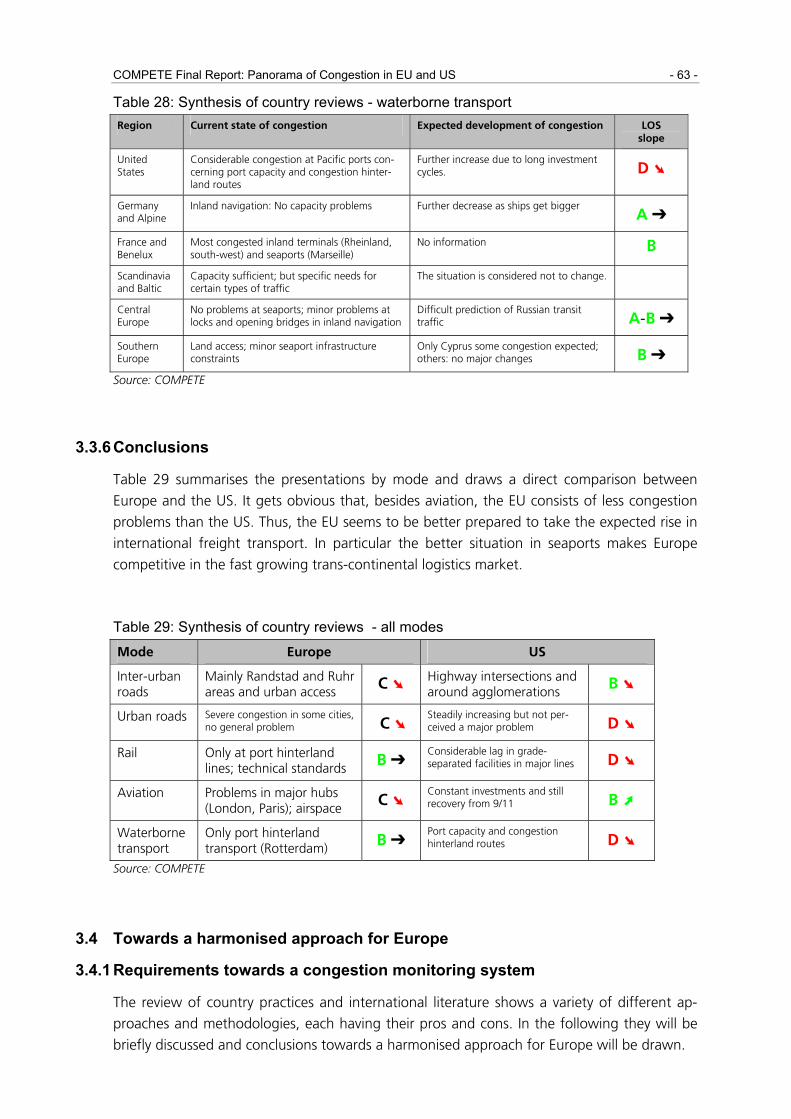
COMPETE Final Report: Panorama of Congestion in EU and US - 63 -
Table 28: Synthesis of country reviews - waterborne transport Region Current state of congestion Expected development of congestion LOS
slope
United States
Considerable congestion at Pacific ports con-cerning port capacity and congestion hinter-land routes
Further increase due to long investment cycles. D ➘
Germany and Alpine
Inland navigation: No capacity problems Further decrease as ships get bigger A ➔
France and Benelux
Most congested inland terminals (Rheinland, south-west) and seaports (Marseille)
No information B
Scandinavia and Baltic
Capacity sufficient; but specific needs for certain types of traffic
The situation is considered not to change.
Central Europe
No problems at seaports; minor problems at locks and opening bridges in inland navigation
Difficult prediction of Russian transit traffic A-B ➔
Southern Europe
Land access; minor seaport infrastructure constraints
Only Cyprus some congestion expected; others: no major changes B ➔
Source: COMPETE
3.3.6 Conclusions
Table 29 summarises the presentations by mode and draws a direct comparison between
Europe and the US. It gets obvious that, besides aviation, the EU consists of less congestion
problems than the US. Thus, the EU seems to be better prepared to take the expected rise in
international freight transport. In particular the better situation in seaports makes Europe
competitive in the fast growing trans-continental logistics market.
Table 29: Synthesis of country reviews - all modes
Mode Europe US
Inter-urban roads
Mainly Randstad and Ruhr areas and urban access C ➘
Highway intersections and around agglomerations B ➘
Urban roads Severe congestion in some cities, no general problem C ➘
Steadily increasing but not per-ceived a major problem D ➘
Rail Only at port hinterland lines; technical standards B ➔
Considerable lag in grade-separated facilities in major lines D ➘
Aviation Problems in major hubs (London, Paris); airspace
C ➘ Constant investments and still recovery from 9/11 B ➚
Waterborne transport
Only port hinterland transport (Rotterdam) B ➔
Port capacity and congestion hinterland routes D ➘
Source: COMPETE
3.4 Towards a harmonised approach for Europe
3.4.1 Requirements towards a congestion monitoring system
The review of country practices and international literature shows a variety of different ap-
proaches and methodologies, each having their pros and cons. In the following they will be
briefly discussed and conclusions towards a harmonised approach for Europe will be drawn.

- 64 - COMPETE Final Report: Panorama of Congestion in EU and US
There are several rationales behind establishing congestion monitoring systems, including
user information and the indication of policy action needs. But the most relevant from the
perspective of a European approach is assumed to be the monitoring and benchmarking of
congestion trends between regions and over time, allowing to assess transport infrastructure
quality and policy interventions in order to verify policy targets. Therefore, quality indicators
should apply to the following criteria:
1. Practicability and costs: The approach should be economical in terms of resource
consumption and costs.
2. Robustness: Reliable time series are essential and regional comparisons are desirable.
The results should not be too sensitive towards methodological details.
3. Intermodality: The measure should allow comparisons across modes.
4. Transparency: Users and decision-makers should be able to understand what is meas-
ured and the final indicators should match their perception of traffic quality.
5. Significance: Given the wide range of user information requirements and policy tar-
gets the scheme should be comprehensive by covering all congestion causes and it
should result in indicators which are meaningful for decision processes.
Further there are several desired properties of congestion indicators, including the differentia-
tion in space and time and the option to set threshold levels in order to indicate the compli-
ance with policy goals. Subsequently, the options for congestion and delay monitoring sys-
tems in road, rail and air transport will briefly be discussed and assessed along the above cri-
teria. A main focus is on road transport, since the analysis has shown that there is no com-
prehensive and comparable indicator across EU MS available.
3.4.2 Methodological options towards a harmonised approach
3.4.2.1 Measuring traffic conditions
The observation of traffic conditions (especially for road) is possible by several technical
means, including contemporary induction loops, camera based or radar systems. Practical
procedures can be distinguished by what is measured (the occurrence of traffic jams or travel
speeds) and by their regularity (continuous vs. sampling selected periods).
All variants can be classified as robust and transparent due to their intuitive approach and
they are applicable to all modes. Besides the sample measurement of traffic speeds all con-
gestion and delay causes are captured. The costs of automatic observation depend on the
availability of modern detectors in road transport, which are usually available in Western
Europe for traffic control purposes, while in the new member states detector systems are
currently built up. Accordingly, the main components are those costs associated with data
processing.
Model based approaches determine travel speeds on the basis of traffic volume data and
speed-flow functions in road transport. Contemporary traffic management systems also take
into consideration real-time traffic observations to adjust the model results. Modelling con-

COMPETE Final Report: Panorama of Congestion in EU and US - 65 -
gestion in scheduled transport is very difficult due to the time-table dependence of train and
aircraft movements.
The information requirements are limited, which makes modelling approaches to congestion
possible at low costs. However, the results are strongly depending on model parameters, in
particular on speed-flow functions; this has a negative impact on transparency and on ro-
bustness. Further, in case only archived flow data is used, the identification of all congestion
purposes has to be addressed by other data sources.
Finally, traffic conditions can be assessed by interviewing traffic users. This approach is
cheap and universal to all modes, but does not deliver quantitative results and varies with the
quality of the survey. Overall questionnaire-based indicators are not recommended to build
up a European monitoring system. Table 30 gives an overview of the procedures and their
assessment.
Eventually, two alternatives for quantifying congestion are recommended: For all modes the
observation of travel speeds, delays and traffic conditions provides a robust way of establish-
ing an inter-modal quality monitoring system. In road transport the modelling of congestion
based on archived flow and capacity data provides a cost-efficient way to generate time se-
ries of recurrent congestion on the TEN network dating back to the early 1990s. Data is
available by the UN Economic Commission for Europe, by most member states and most
likely by a number of bigger cities.
Table 30: Assessment of traffic congestion measures Variant Practical exam-
ples Practicability and costs
Robust-ness
Inter-modality
Trans-parency
Compre-hensive-ness
Over-all
Observation Continuous speed measurement
Ile-de-France [1], rail UK [2 ], air EU [3 ] US [4 ]
depends on equipment
robust all modes Intuitive all causes ++
Sample speed measurement
England [5], Swit-zerland [6]
med. costs, personnel
sample size depend.
all modes Intuitive recurrent only +
Continuous con-gestion measure-ment
Netherlands [7], Ile-de-France [1]
depends on equipment
robust all modes Intuitive all causes ++
Archived traffic messages
Switzerland [8] low costs robust over time
all modes Intuitive all causes + Modelling
Using archived flow data
Switzerland [8], US [9], Scottland [10], Denmark [11], Germany [12]
low costs Sensitive to model parameters
difficult for non-road
strong assump-tions
mainly recurrent ++
Archived plus real time traffic data
Traffic manage-ment services [13]
depends on equipment
Sensitive models
all modes Complex all causes + Questionnaires
One-off / frequent Euroe [14] low costs, personnel
poll size depend.
all modes Intuitive all cau-ses, qualitative
0 Sources: [1] Prefecture d'Ile-de-France (2006) - [2] Network Rail (2005) - AEA (2006) - [4] DOT (2006) - [5] DfT (2005) - [6] Infras (2003) - [7] AVV (2005) - [8] Infras (1998) - [9] TTI (2006) - [10] Scottish Executive (2003) - [11] Hvid 2004 - [12] IVV/Brilon (2004) - [13] E. g. NRW (Germany), Paris - [14] CEDR (2005)

- 66 - COMPETE Final Report: Panorama of Congestion in EU and US
3.4.2.2 Congestion indicators
After travel speed or congestion data has been collected it needs presented by significant
indicators, which allow to judge the prevailing situation against social or policy goals. The
review of current practice in Europe and the US a large number of indicators has been identi-
fied, which are, however, partly derived from one another. Depending on the type of infor-
mation provided and the scope of the indicators they have been grouped into five types,
which are assessed along the above criteria as follows. Details are presented by Table 31.
Total delay based measures (total time losses of all passengers involved compared to a
reference speed) are interesting in order to have an overall figure which can be directly trans-
lated in economic terms. However, aggregation is difficult (only possible with model input)
and costly.
Average delay indicators are easy to compute, robust, comparable and applicable to all
modes and significant to benchmark policy targets. The most transparent from the viewpoint
of the users seem to be the development of average speeds and the average prolongation of
travel times as expressed by the travel time index. In order to derive an indicator, it is impor-
tant to distinguish between different daytimes (peak; off-peak).
Reliability measures take account of the importance of the unreliability of service levels for
transport users. However, they are somewhat more difficult to compute as benchmarks are
only in scheduled transport directly available and data over a longer time period has to be
used to determine statistical deviation measures from average conditions. Further, they are
not always easy to understand for consumers.
Level-of-Service indicators describe traffic conditions by the quality of traffic from free
flow to stand-still. Applied categorisations distinguish between six (TRB 2000 and FGSV
2005) or only two (AVV 2005) conditions. LOS measures computed from speed and flow
data are criticised as the definition of service levels is somewhat artificial and changes within
a class do not appear in the results. The categorisation is less problematic in case observed
traffic quality data, e. g. through congestion detectors, are applied. LOS measures allow to
categorise networks and thus to describe bottlenecks on a larger geographical, e.g. Trans-
European, scale.
Economic efficiency measures determine current congestion externalities and optimal
congestion charges per vehicle kilometre and the potential social surplus or delay reduction in
case congestion charging, improved operational treatment or better transit services would be
applied. The computation of these indicators requires the application of complex traffic mod-
els which rely on several sensitive parameters, which are partly difficult to obtain. Due to
theoretical reasons the application of these measures is difficult for scheduled transport ser-
vices.

COMPETE Final Report: Panorama of Congestion in EU and US - 67 -
Table 31: Assessment of congestion indicators
Indicator and description Appli-cation cases
Practi-cability
Robust-ness
Inter-modal-
ity
Trans-par-ency
Sig-nifi-
cance
Overall
Total delay-based measures
Total annual time lost 4, 5, 8 easy med. yes high med. + Total annual time lost by delay cause 13,14,15 easy med. yes high high ++ Total fuel wasted and air emissions 6, 8 cost f.. med yes high high + Total annual resource costs 4,6,7,8,9 cost f. med. yes med. low + Total resource costs related to GDP 6, 7 cost f. med. yes med. med. + Annual time lost per traveller 8 easy med. yes high low 0 Total time lost per network-km 4, 5 easy high yes high med. + Annual length of traffic jams 9, 10 easy high yes med. med. + Average delay measures
Average travel speed 1, 2, 11 easy high yes high high ++ Time loss per vkm to free flow conditions 3, 4, 5 easy high yes med. high + Average additional time costs 5, 6, 7 easy med. yes med. med. + Average additional operating costs 6, 7 med. med yes med. med. + Travel time index = current / free flow times 8 easy high yes high high ++ Travel speed index = current / free flow speed 4, 5,10 easy high yes med. high + Reliability measures
Journey time reliability (% trips >115% TTav) 4 difficult high yes med. med. 0 Buffer time index (TT95 – TTav per km) 7 difficult high yes med. med. 0 Time loss of 90 percentile network section 1 difficult high yes med. med. 0 Service-level related indicators
Capacity utilisation (current volume / capac-ity)
easy med. yes high med. +
Share of vkm / pkm / tkm by service level 5 easy med. yes med. high + Share of delays by service level 5 med. med. yes med. med. + Share of travel time by service level 5 med. med. yes med. med. + Share of trips by service level 4 difficult med. yes med. med. 0 Network length by service level 5, 12 easy med. yes med. high ++ Duration of each service level 4 easy med. yes med. med. + Length of traffic jams per network km 10 easy high yes med. high ++ Economic efficiency indicators
Total deadweight loss 7 difficult low no low low 0 Expected congestion pricing revenues 7 difficult low difficult med. low 0 Current marginal external congestion costs 6, 7 med. med. principally med. low 0 Equilibrium congestion pricing charges 6, 7 difficult low difficult low med. + Average deadweight loss per vkm 7 difficult low difficult low low 0 Delay savings by operational treatments 8 difficult low principally low low 0 Delay savings by improved public transport 8 difficult low no low low 0 Sources: [1] DfT (2005) – [2] Infras (2003) – [3] DfT (2000) – [4] Scottish Executive (2003) – [5] Hvid (2004) – [6] Nash et al. (2002) – [7] Maibach et all (2004) – [8] Schrank and Lomax (2006) – [9] Appert, M. – [9] Infras (1998) – [10] AVV (2005) – [11] Infras (2003) – [12] IVV/Brilon (2004) – [13] Prefecture d'Ile-de-France (2006) – [14] Network Rail (2005) – [15] AEA (2006)
Symbols: veh.: vehicles, TTav [seconds]:average annual travel time in the respective time segment, TT95 [sec-onds]: 95-percentile travel time in the respective time segment
From the perspective of individual traffic users the development of travel speeds and the rela-
tive increase of travel timed due to congestion appear intuitive and significant to benchmark
policy targets. From the viewpoint of infrastructure operators the classification of network
lengths by service levels provides a good overview of where investment or regulation meas-

- 68 - COMPETE Final Report: Panorama of Congestion in EU and US
ures might be applied. For all of these indicators similar expressions exist, which might well
be used instead. Annual total values are highly relevant concerning the analysis of delay
causes and the related emissions of air pollutants and greenhouse gases.
The delay monitoring must be dynamic by providing robust time series and it must reflect the
compliance of current traffic quality with policy targets. Therefore the reference travel speed
in road transport or the delay margin in air traffic must be held constant over time. For road
60% of free flow or maximum permitted speed are recommended. In rail passenger 5 min-
utes and in high quality rail freight and in aviation 30 minutes delay margin are recom-
mended. However, local derivations are possible.
3.4.2.3 The scope of a congestion monitoring
Congestion and delay causes: For policy purposes both concepts, recurrent and all-causes
delays, can be meaningful as they apply to different policy targets and instruments (invest-
ment, demand management, safety programmes, infrastructure management, and others).
Table 32 reveals that across all modes capacity shortage in most cases is only one reason of
delays. In addition mutual effects between different causes have to be considered. Thus, the
above evaluation criteria require monitoring methodologies to address all delay causes.
Table 32: Reasons of congestion according to multiple studies Mode
Study, area Congestion / delay cause
Capacity Construc-tion works
Accidents Weather Other
Road TTI Urban Mobility Rep. 30 %-60 % 40 %-70 % CEDR (2005) 1): 40% 41 % 18 % 9 % 9 % Hessen, Germany 30 % 30 % 10 % 30% France, Ile de France 85 % 4 % 11 % Netherlands 82 % 5 % 13 % Rail UK Network Rail 32 % 1) 44 % 1) 10 % 14 % Air US, DOT 36 % 4 % 60 % 3) Europe, AEA 30 % 4 % 66 % 3) Europe, Eurocontrol 2) 11 % - - 11 % 78 % 3)
1) Number of cases; 2) ATFM En-Route delays; 3) Airlines: 51%, Airport: 19%, security: 4%, miscellaneous: 4%, 3) network management, 4) asset defects,
Congestion effects: Besides time losses, congestion causes increased fuel consumption and
additional atmospheric emissions. Wasted fuel and additional pollutants can be quantified via
speed-dependent consumption and emission functions in road transport. For time, fuel and
atmospheric emissions a variety of unit cost estimates or consumer prices exist, which can be
applied to express congestion effects in physical quantities or monetary terms.
Spatial scope: Road congestion assessment may focus on a selected set of links (Dft 2000),
estimate total network effects by single link measurements (Scottish Executive 2003) or
measure congestion on entire networks (IVV and Brilon 2004). Given the different standards
of European roads, for a harmonised approach it seems to be more practicable to analyse
selected segments of the TEN and major arterials of selected cities.

COMPETE Final Report: Panorama of Congestion in EU and US - 69 -
Time scope: Traffic quality may be measured continuously over the whole year or be per-
formed at selected time periods only. In case of computing trip- or kilometre-specific indica-
tors of recurrent congestion, such as the relative increase in journey time due to congestion,
one-time measurements are totally sufficient. In case annual values are to be produced, con-
tinuous measurements or an extrapolation is required. Determining non-recurring congestion
eventually demands for a measurement over a longer period of time.
3.4.3 Recommendations by mode
3.4.3.1 Trans-European road network
For road transport in general, it is important to distinguish between comparable measured
congestion data and modelled data. In order to have a common starting point, a pragmatic
approach to produce comparable speed data seems to be most appropriate. On the Trans-
European road network it is proposed to first initiate a simple speed-monitoring system by
defining several important interurban links. This speed monitoring should cover a certain sec-
tion of a road link. The average speed (peak/off peak) can be used to assess time series for
different type of roads. This monitoring approach follows the practice of France, the Nether-
lands and Scotland. In order to enlarge the sample, secondly a modelling study is recom-
mended assessing the development of traffic densities and capacities and their influence on
speed on selected links across the Union. Traffic count and road capacity data is available
from UNECE (2000) and from national sources. Under consultation of the Member States the
study would propose a set of corridors to be surveyed. From a methodological point of view
the study would have to propose international speed-flow and fuel consumption functions
for different traffic and infrastructure conditions across the EU. A starting point may be FGSV
(1997). Further, the study would have to survey the dimension of non-recurrent congestion
by monitoring spot. According to the US and UK cases, the study should then be carried out
on a regular basis.
An additional approach is the use and regular analysis of existing radio data on road traffic
problems on the national motorway network. The establishment of a European road traffic
monitoring centre is proposed. This should receive and process information on traffic discon-
tinuities on the Trans-European network from national motorway operators. Respecting the
technical equipment in the Member States, the European road traffic control centre would
process electronic incident detection information as well as radio messages and traffic vol-
ume data.
In the long run a standardisation of incident detection systems is desirable and should be
fostered by the Community.
3.4.3.2 Urban networks
As concerns urban transport the monitoring system should start with a limited number of
cities of different size. Most of the European capitals and big cities consist of traffic man-
agement centres and even provide online-maps on the state of traffic on major roads. The
starting point is again a continuous measurement of traffic speed on the main road network
entering urban areas. The inter-urban modelling approach could be extended to major urban

- 70 - COMPETE Final Report: Panorama of Congestion in EU and US
express ways and arterials in order to obtain a series of comparable indicators across Europe.
The local verification of speed flow functions is then, however, of great importance.
Further, a number of cities have recently initiated automatic floating car data systems. From
this data the generation of congestion indicators as presented above is easily feasible at low
costs and should be fostered by the EC. This de-centralised approach would respect the dif-
ferent geographical and structural conditions of the urban areas, but would make a compari-
son of the results very difficult.
3.4.3.3 Rail transport
In a first step train delays at selected European stations and the respective number of passen-
gers debarking should be monitored across all day periods at several representative weeks
during the year. In the light of the emerging importance of passenger rights agreements
across Europe and to understand more clearly the need for policy interventions (e.g. consid-
eration of quality indicator as a basis for the differentiation of public service obligations), the
railway companies should be obliged to report regularly on their punctuality and delay
causes. A starting point could be the reporting scheme of Network Rail in the UK. It is impor-
tant to distinguish between interurban and urban railway transport segments.
To provide a better ground for the Communities investment funding the rail network opera-
tors should provide data on current capacity utilisation, on construction activities and on the
quality of trans-European railway corridors.
In a second step the problem of missed connections should be addressed by monitoring a set
of representative international travel relations. The statistical and methodological basis should
be provided by a dedicated survey.
3.4.3.4 Aviation
In aviation Eurocontrol statistics on flight regions should be made available by single airports.
Alternatively, Eurostat could take over or complement the AEA statistics by non-AEA member
airlines.
As for the aviation sector, the problem of missed connections should be addressed by a
methodological study in the field, which would select flight relations to be monitored or sta-
tistical procedures to assess all missed connections on major European airports.
3.4.3.5 Seaports
Currently there is no common reporting standard on vessel waiting times by European or US
maritime ports. As there are certainly capacity problems, which can only be solved by long-
run investment programmes such a port congestion monitoring system should be initiated by
the EC.
3.4.3.6 Inland navigation
There is certainly no capacity problem in the European inland navigation network. Thus, there
is no need for action by the EC.

COMPETE Final Report: Panorama of Congestion in EU and US - 71 -
3.5 Conclusions and research needs
The survey has shown that Europe, compared to the US is more vulnerable to air and inter-
urban road congestion, while in the case of rail and maritime shipping the US faces more
severe problems. In all cases current forecasts show an increasing tendency, but comprehen-
sive and comparable indicators are only partly available. This is especially true for road trans-
port. Although there are interesting indicators in some Member States, a comparison be-
tween countries as a basis for regular congestion and delay monitoring is hardly possible.
The survey of methods has indicated some need for additional research in the field of con-
gestion and delays:
Elaboration of a European quality monitoring system for road transport, based on
traffic speed measurements on specific sections and daytimes.
Development of representative speed-flow functions across Europe, especially focus-
sed on the TEN-T network and on critical urban access links.
Analysis of the drivers and magnitudes of non-recurrent congestion on the Euro-
pean road and railway network.
Ways to equalise the quality standards within European traffic message systems and
flow chart data information.
Statistical methods to account for the passengers missing their connections due to
delays in scheduled transport (esp. rail and hub airports).

- 72 - COMPETE Final Report: Congestion: Impacts and sector responses
4 Congestion: Impacts and sector responses
4.1 Economic impacts of congestion: An overview
4.1.1 General impact patterns
Congestion is increasing transport costs and is decreasing transport quality. Due to the vari-
ous interrelations between transport and the economy, there is an impact on the economy as
a whole, with different importance for the various sectors. In order to show impact patterns
of congestion, it is necessary to distinguish different dimensions:
Passenger and freight transport, individual and commercial transport: Whereas
freight transport is fully commercial and affects economic sectors according to their
transport intensity, passenger transport has to be treated differently. Only parts of
passenger transport (esp. professional transport service providers, business trans-
port) are directly linked to economic activities.
Short and long term reactions: In the short term, mainly reactions to time depend-
ency are relevant (such as changing routings and delivery times), long term reactions
also include changes in spatial organisation.
In order to have an economic sound structure, different costs have to be distinguished. At
the same time it is important to differentiate between scheduled and non-scheduled trans-
port. The following Table 33 is presenting an overview.
Table 33: Overview of reactions to congestion and their impacts Reaction Impact
Short term
Non recurring congestion
Infrastructure provider: Traffic man-agement/information Transport user: Waiting
Infrastructure provider: Costs for reorganisation
Transport user: Time and operating cost
Transport service demand: Additional costs due to less reliability
Public: Additional accident and environmental cost
Recurring congestion
Infrastructure provider: Traffic man-agement/information
Transport user: Detours and time shift, as long as costs are lower than waiting.
For scheduled transport, the reaction is anticipated in the schedule. The costs are hidden as scarcity costs (opportunity cost of non-providing optimal schedule)
Infrastructure provider: Costs for reorganisation
Transport user: Avoidance costs, time and operating cost
Transport service demand: Additional costs due to less reliability (lower than for non recurring congestion)
Public: Additional accident and environmental cost
(Scarcity costs for scheduled transport)
Long term Infrastructure provider: Improved traffic management/pricing and infrastructure enlargement
Transport user: Reorganisation of trans-port demand, change of relations and locations
Transport service demand: Change of production structure and location
Infrastructure provider: Additional cost of infrastructure
Transport user and service demand: Adaptation cost and benefits of enlarged infrastructure
Source: COMPETE elaboration
The table states that there are different reaction and impact patterns for different actors.
Infrastructure supply and demand and transport service supply and demand for scheduled

COMPETE Final Report: Congestion: Impacts and sector responses - 73 -
and non scheduled transport are the main dimensions. It has to be considered that - from an
operational point of view - only parts of these impacts can be measured in proper terms,
such as increased time and operating cost in the short term for the transport users, as the
panorama of congestion in the previous Section 3.3 suggests.
Therefore a qualitative analysis of the reactions and impacts of the main actors is the focus of
the following analysis.
The following figures illustrate the most important reaction and impact patterns. Figure 17
starts with the reaction patterns within the transport sector itself. Firstly it is important to
consider that congestion events or delays only cover a part of the impacts, namely those
which are either not anticipated or where reaction costs are higher than the cost to suffer
congestion and delays. It is evident that it is hardly possible to measure the additional part of
congestion in proper quantitative terms. There will be an important difference between
scheduled and non-scheduled transport. A second important issue is the fact that congestion
is increasing not only transport costs (time and operating cost), but also external costs such as
increased emissions (esp. due to increased detouring and standstill procedures). A third con-
clusion is that different reasons for congestion have to be considered. The economic conse-
quences of temporary constructions sites on a specific motorway for example will affect
economy differently than permanent scarcity of infrastructure.
Capacity problemConstruction siteAccident others
AnticipatedNot anticipated
Congestion
Evasion, Time shift, other routing
Suffering: Waiting Reaction: Otherrelation, increase of productivity, changeof location
short term long term
Increased time, increased operating cost, increased enviromental and accident costs
Transport cost and demand: Individual transport, Transport sector, auxiliary transport, transport demanding sectors
RoadRailAirWaterways
Passenger – freightTransport intensity
Figure 17: Reaction patterns of the transport sector to congestion and related conse-quences
Figure 18 illustrates the most important impact patterns in passenger transport. Most of the
congestion impacts for the users have an indirect impact to economy. A major part of con-
gestion is related to users of individual transport, such as for commuter, leisure and shopping

- 74 - COMPETE Final Report: Congestion: Impacts and sector responses
purposes. Most vulnerable hereby is commuter transport in urban areas, facing daily conges-
tion especially in road transport. The most important reaction is a time shift (earlier start of
journey) and a modal shift (e.g. to public transport). This part of congestion is related to the
economics of density of urban areas: Congestion is an inevitable part of urban transport structure. Spatial development of the settlement area and location of inhabitants and indus-
try is strongly interlinked with this density issues: Congestion or low traffic quality in urban
areas might accelerate urban sprawl and thus the loss of economics of density and weaken-
ing of the position of public transport. Within leisure and shopping transport, the most im-
portant links are related to economic strategies of the food and retail sector (see section 4.2.)
and some tourism spots. An important issue are the specific congestion events at the begin-
ning of holidays (e.g. in France, where holidays starts at the same date for all inhabitants) and
at specific bottlenecks (e.g. transalpine congestion at weekends). This part of the congestion
illustrates specific societal needs and does not affect the economic sectors in general. In con-
trast to that, transport for business purposes is affecting costs and reliability in all those sec-
tors which are depending on time sensitive activities such as meetings and contacts with cli-
ents. This is especially interesting for globally acting service sectors (see section 4.2).
Congestion
Business transport: Higher cost(operating staff) lower reliability
Individualtransport:
Commuter:Welfare loss, change of location
Leisure/shopping: Welfare losschange of demand
Transport suppliers(e.g. air transport, taxi) – Transport intensive sectors
Competitivenessurban employers
Competitivenesstourism industry
Competitivenessof passengertransport intensive sectors
Figure 18: Reaction patterns within passenger transport
Figure 19 relates to freight transport. It is evident that the value added chain may be affected
directly due to congestion. The more transport intensive and the more time dependent trans-
port demand, the higher the vulnerability of a sector. This is most important for Just-in-Time
production structures where reliability is essential and the transport chain (different modes,
e.g. combined transport, different actors involved) must function properly in order to guaran-
tee maximal transport quality as an important precondition of labour division at European or
global scale.
Within some sectors there is an interlinkage between passenger and freight transport, usually
being a trade off for optimal traffic conditions: Traffic preference in peak hours, delivery
times etc.

COMPETE Final Report: Congestion: Impacts and sector responses - 75 -
Congestion
Transport sector:Freight forwarders
Transport auxiliarysector/shippers
Freight transportdemandValue added chain
Higher costLower reliability
Increased auxiliaryServices/Increased prices/Modalshift/
Re-engineering
Increased prices for intermediatesIncreased stocksOther contractorsInsourcing – OutsourcingAlternative location/Change of production patterns
PerishablenessJust in time conditionsTransport intensity
Competitiveness of transport and other sectors
Figure 19: Reaction patterns within freight transport
4.1.2 General empirical evidence
There are quite some reports looking at the overall economic impacts of congestion, based
on value of time (VOT) assumptions. This is summarised in our congestion panorama in the
previous section 3.3. Of major interest within this section is the differentiation along sectors.
The NCHRP report for the US (2001) states the sensitivity of urban congestion (with example
for Chicago and Philadelphia) and for industry. The model based approach stated that indus-
tries with broader worker requirements and higher levels of truck shipping absorb relatively
higher cost associated with congestion. Congestion is reducing agglomeration benefits and
thus economics of density. The report suggests that delivery markets in urban areas are most
affected in the US. The study summarises general cost approaches for business values of
freight delays, based mainly on revealed preference surveys. The willingness to pay to reduce
delays for shipper is around 40 to 50 US $ per hour.
A recent study of Cambridge Systematics for the US (2005a) has shown that shippers and
carriers value transit time in the range of $25 to $200 per hour. The cost of unexpected delay
can add another 20 percent to 250 percent, depending on the time sensitivity of goods.
There are also additional costs such as the costs of remaining open for longer hours to proc-
ess late deliveries; Penalties or lost business revenue associated with missed schedules, costs
of spoilage for time-sensitive, perishable deliveries and costs of maintaining greater inventory
to cover the undependability of deliveries, Costs of reverting to less efficient production
scheduling processes; and the additional costs incurred because of access to reduced markets

- 76 - COMPETE Final Report: Congestion: Impacts and sector responses
for labour. The study also states important regional impacts such as urban sprawl and pro-
duction shifts of congestion sensitive industries.
A study carried out by the Washington Research Council (2001) states that congestion is in-
flating local cost of living by comparing congestion and consumer price indices: Increases in
congestion may have added more than 0.5 percent per year to the Seattle area (congestion is
notorious) inflation rate over the last 17 years. The resulting higher prices cost local consum-
ers more than $9 billion in 2000. This figure seems rather high, since it is difficult to analyse
the detailed cause-effect relation between costs of congestion and overall growth properly.
Another study from Weisbrod et al. (2003) has stated that the reliability costs (costs due to
not reliable delivery) constitute an important part of congestion. The costs per hour for dif-
ferent sectors are as follows:
Table 34: Calculated shipping delay costs, by industry In US$ Direct user Reliability
cost Value of shipment
Agriculture 25 7 16’800
Mining 25 0.8 5’500
Manufacturing 26 11 34’700
Service/Other 0 0 135
Source: Weisbrod (2003), figures rounded
4.2 Sector analysis
Most of the available studies on congestion impacts to economy are related to the measure-
ment of congestion for traffic management purposes and to measure time costs. The differ-
entiation of traffic purposes makes clear, that a considerable part of the costs is related to
individual passenger transport, as it is for operating costs (where individual transport ac-
counts for more than 30% of costs). There are only few studies available which show the
relevance of congestion costs for different economic sectors (impact, relevance, vulnerability,
strategies). This might be interpreted as a sign that there is no major straight and critical rele-
vance for the competitiveness of different economic sectors in Europe and in the United
States for the time being. An exception is road freight transport and aviation. Fact is, that the
issue of congestion will gain importance in the future. Therefore we concentrated the analy-
sis on different interesting sectors with different type and level of vulnerability. Besides desk
research a number of qualitative interviews have been carried out with economic stake-
holders in various sectors and different countries. In order to have a qualitative overview, we
developed a questionnaire containing the following key questions:
What is the relevance of congestion for your sector (in general, for your input mar-
kets, for your output markets)?
Which types of cost arise and which impacts and reaction patterns are typical for
your sector? What are your main strategies to tackle congestion?
What is the influence of (growing) congestion for your competitiveness?

COMPETE Final Report: Congestion: Impacts and sector responses - 77 -
The following chapters are summarising these findings. The detailed questionnaire and re-
sponses are summarised in COMPETE Annex 4.
4.2.1 Transport industry
4.2.1.1 Road transport
Due to dynamic changes in the transport and logistics sectors and liberalisation within the
transport markets, there is a widespread range of actors, which are differently affected by
congestion: Long range hauliers (partly integrated in bigger logistic suppliers combining dif-
ferent modes of transport), short range hauliers and delivery vans (esp. in urban areas), spe-
cialised transport like construction or terminal haulage, bus and coach operators. Road haul-
iers face increased competition especially in Europe, which leads to efficiency gains, but also
to a high vulnerability to congestion, since margins are very low. An important effect of liber-
alisation is the change of size of firms. According to the German logistics report (2005), the
average size of firms increased in the last ten years by 50%, showing the relevance of
economies of scale and scope.
Congestion is a very important issue for the road transport sector. The reasons however have
to be differentiated: Only parts of congestion are capacity related, as a study commissioned
by IRU (IRU 1998a) points out. Total barriers to road transport consist of capacity related traf-
fic congestion, delays at border crossings, traffic bans (e.g. construction sites), blockades,
speed limit constraints. In UK and Italy, about 60% to 70% of time losses were stated as
capacity related congestion. In other countries of the sample (i.e. France) the share is consid-
erably smaller. About 40 to 50% of time losses is related to congestion in Eastern Europe.
The share of congestion of total transport time ranges from 5% (UK, Italy) up to 22% in Po-
land (IRU 1998a).
The most important impact of congestion is decreased reliability: The bigger the share of non
recurring congestion, the higher is the risk of low reliability. All interview partners have high-
lighted this effect as most important. Since competition is very high, the risk of loosing clients
and business is significant. These risks are significantly higher than the direct costs in form of
increased personnel and energy costs. The above mentioned study (IRU 1998a) estimated
these costs for a set of countries. The study concludes (although based on a rather small
sample) that the missed opportunity costs are in the order of 1.2 times of the base transport
costs.

- 78 - COMPETE Final Report: Congestion: Impacts and sector responses
Table 35: Cost for impediments (Road freight and busses/coaches) UK France Italy Czech Re-
public Poland
Road Freight:
Loss of travel time (monet. terms)
% of road expenditures
% of GDP
3.2%
0.16%
2.3%
0.14%
1.3%
0.09%
8.3%
1.27%
28.8%
2.6%
Total loss including lost business
opportunities (monetary terms)
% of road expenditures
% of GDP
7.1%
0.35%
5.0%
0.32%
2.8%
0.19%
- -
Busses and Coaches
Loss of travel time (monet. terms)
% of road expenditures
0.4%
16.3%
6.2%
3.3%
3%
Total loss including lost business
opportunities (monetary terms)
% of road expenditures
1.2%
45.6%
17.3%
9%
9.1%
Source: IRU (1998a)
The interviews carried out within this study support the thesis, that VOT related estimations
underestimate the total costs of travel time. Compared to other studies, the ratio between
direct costs and reliability costs seems however quite high, see as well the study of Weisbrod
cited above. Another study in the Netherlands (Bozuwa et al. 1999) has estimated the indi-
rect costs of congestion to 8-11% of direct costs. A study from Leeds University has esti-
mated a willingness to pay of 85 pence per minute8 to increase reliability of transport, which
is an even lower share. In the US a survey (Golob/Regan 2000) indicates that for nearly 90%
of respondents, schedules are missed because of congestion. For 25% this happens often or
very often. Some evidence for that can also be collected by looking at the practice of valuing
travel time and reliability.
Within cost benefit analysis, another approach to weigh reliability is used. The reliability ratio
is the ratio of the value of one minute of standard deviation (i.e. value of reliability) to the
value of one minute of average travel time. The following table summarises the recommen-
dations. The ranges are quite conservative and thus compatible with the scientific studies and
show that reliability is not that costly than the IRU study points out. In this regard, the IRU
study can be seen as an upper bound (maximal risk).
8 This value comes on top of the general value of time, which has not been analysed in the study.

COMPETE Final Report: Congestion: Impacts and sector responses - 79 -
Table 36: Reliability ratio (relation between value of time and additional value for reliabil-ity) for different journey purposes Journey purpose Mode Reliability ratio
Commuting (passenger) Car 0.8
Business (passenger) Car 0.8
Other (passenger) Car 0.8
All (passenger) Train 1.4
All (passenger) Bus/tram/metro 1.4
Commercial Goods Traffic Road 1.2 Source: Hamer et al. (2005), Kouwenhoven et al. (2005a)
The interviews showed that the possibility to shift additional costs to transport prices is very
limited since consumers will not accept higher prices and low reliability at the same time.
Therefore the road hauliers industry has developed several strategies to avoid congestion.
Most important is the shift of transport (bundling, unbundling, long range haul, delivery to
urban areas) to off peak situation. This is especially important for the food supply chain (see
Mc Kinnon 2003). The additional costs by driving through the night can be seen as long term
evasion cost of congestion.
These costs do harm road hauliers competitiveness. According to the interviews, there is
however no major intramodal discrimination. An issue in EU15 is the strong competition with
road hauliers from Eastern Europe (EU8) due to lower operating cost (e.g. drivers wages).
Moreover the competitiveness of the road freight sector as a whole is affected, since it faces
a very high level of pressure due to liberalisation and globalisation and the change in logistics
markets which has reduced margins. For specific corridors, railways have become an alterna-
tive. Big road hauliers therefore use combined transport and railways services as an alterna-
tive. Most important in this respect is transalpine transport, where specific measures (such as
tolls, night bans etc.) lead to a strong shift towards combined transport road-rail.
The interviews have stated a tendency that vulnerable sectors to congestion (such as just in
time-production or food and retail, see further below) tend to insource the transport chain, in
order to gain a better overview. Bigger retailers and manufacturers therefore use their own
fleet for input or output delivery. In fact, only big freight forwarders are able to supply reli-
able service packages for the industry independently. The bigger the size of the business
model of a logistics provider, the better the internal traffic management systems, the higher
the competitiveness and the strategic response to congestion. Interesting examples can be
found in Germany (Deutsche Post and DHL) or Stinnes-Schenker-Railion (collective logistics
road and rail).
The road freight transport industry has developed an general policy approach to overcome
congestion. It consists of several elements, such as modern traffic management and informa-
tion systems, in order to anticipate recurrent and non recurring congestion, efficiency in-
crease (increased use of off peak, increase of weight limit) and pressure to increase infra-
structure. IRU has launched the so called 3I strategy (Infrastructure, Innovation, Incentives).
Important elements are own lanes for trucks to overcome passenger car related congestion

- 80 - COMPETE Final Report: Congestion: Impacts and sector responses
and delay penalties for construction site managers (infrastructure)9. Bonus-malus or quality
systems within the sector is however not (yet) common.
A comparison between EU and US makes clear, that the congestion issue is more important
for EU-road freight transport, since urban and interurban problems are relevant and transal-
pine capacity restrictions and competition between Eastern and Western Europe are overlap-
ping the congestion issue. Thus the IRU policy (although generally defined) is mainly relevant
for Europe.
With respect to road transport, it is also relevant to have a brief look to passenger transport.
Individual car transport is the main transport segment suffering from road congestion (see
section 4.2.5). Within an economic sector analysis however, the economic consequences are
much less relevant since most of the costs can be expressed as individual losses of consumer
rents and welfare which are not directly relevant in monetary terms. Other (professional
transport) segments are taxis and urban bus transport. Both are negatively affected in urban
road congestion by additional time and operating costs. Whereas taxis can shift time losses to
the consumer (by increased prices), the schedules and thus the potential of urban public
transport is limited in peak hours. The consequences are however less severe if there is a
strong separation of tracks or bus lines.
4.2.1.2 Rail transport
The delay risk in the rail transport industry is depending on different factors such as infra-
structure deficits (capacity, security and traffic management systems), traction deficits (rolling
stock failures) and operational interlinkages between infrastructure and traction (interopera-
bility problems). Therefore the analysis (reactions, impacts) has to consider different transport
segments (with different market positions and different actors), especially the role of infra-
structure and train operators.
The most time sensitive segment is high speed rail, in competition with short haul air trans-
port. Due to the advantage of own tracks, some operators (e.g. France, Italy, Spain, Ger-
many) are very successful and use specific quality controlling systems; delays are minor. In
some countries (such as US, Spain, Germany, Austria), penalties (e.g. reimbursement to pas-
sengers in cases of delay) are common, in order to compensate passengers for time losses.
According to the interviews, this segment is prioritised by infrastructure operators. The per-
formance might become critical, if network functions (connection to regional trains, passage
of highly frequented nods) become important. In such cases, the delay risk is increasing.
There is however no major competition between railway operators. Germany (due to its cen-
tral geographical position and network outline) is slightly more vulnerable than Spain or
France. The approaching of major agglomeration areas is also a quality problem in the US
(e.g. Chicago region).
The delay risk of urban rail has an influence on the competitiveness of public transport ver-
sus private car transport. In general the interviews show that there are – although critical rail
bottlenecks in urban areas exists – still advantages for the railways. The bottleneck problems
9 There is an interesting trade off while planning road infrastructure maintenance. The shift of maintenance to
night hours (in order not to harm passenger transport) leads to barriers for freight transport.

COMPETE Final Report: Congestion: Impacts and sector responses - 81 -
in urban rail systems are mainly limiting the potential to divert road transport (and related
congestion). Due to natural monopoly situation of urban public transport however, there is
no influence on intermodal competitiveness. Compared to the US, the vulnerability due to
increasing rail capacity problems in urban areas is higher in Europe.
The quality problems of railways are most relevant for crossborder rail freight services,
where additional actors (such as combined transport providers) are involved and competition
between railway operators is gaining relevance. Due to low infrastructure quality (capacity)
and crossborder interoperability problems, the risk of delays and deterioration of quality and
reliability is a major reason for low competitiveness compared to road, especially in countries
where transport during the night is possible for road and rail. An interesting market is trans-
alpine transport, where improved quality is essential to divert traffic from road to rail. Since
wagon load freight usually is not very time sensitive, the vulnerability in this traditional rail
segment is rather low. It is bigger for combined transport with hub and spoke terminal and
gateway systems, where rail and road transport chains have to fit together. But crossborder
quality problems are harming competitiveness significantly. The Swiss transport policy for
instance is using a quality indicator to measure delays of combined transport trains. Although
Switzerland has a high level of punctuality in the rail system as a whole (see chapter 310) and
is promoting combined transport heavily and improves also infrastructure quality, only some
55% of transalpine combined transport trains are ‘punctual’ (means have a delay of less than
30 minutes to schedule). 10% of the trains face delays of 6 hours and more. The most im-
portant reasons are lack of infrastructure and lack of crossborder organisation (e.g. availabil-
ity of rolling stock). The increased use of direct traction (no more change of locomotives at
the borders and the use of multifunctional locomotives), has improved the situation in the
last years, however at low level.
Compared to the situation in Europe, delay problems and related competitiveness of the
freight railways industry in the US is less important since there are significantly less interop-
erability problems and productivity is considerably higher.
The problems in the railway industry are very much quality related affecting the whole sys-
tem. Thus the quantitative capacity problem (scarcity of tracks) is only one issue and mainly
relevant in dense areas where different rail segments (esp. urban and interurban) cannot be
separated fully. In general however, other quality deficits such as old train management sys-
tems and non-optimal collaboration of actors within the rail system are more important, es-
pecially in Eastern Europe. Compared to all other transport sectors, intramodal competition
due to railways liberalisation and free access is still a minor issue.
The costs of delays are in general shifted to the train operators (reorganisation of trains, addi-
tional trains and personnel, delay management) and to the railways users (time losses, less
reliability in freight delivery). As stated above, only high speed passenger transport has devel-
oped a system to reimburse losses of passengers.
There are ongoing attempts to overcome these quality problems with a strong role of the EU
railpackages aiming at increasing capacity (bottleneck minimisation), interoperability and
competition. An important cornerstone is the development of the European train manage-
10 The overall punctuality of passenger trains is above 90%.

- 82 - COMPETE Final Report: Congestion: Impacts and sector responses
ment system (ERTMS) with different levels of train control (ETCS). An additional tendency is
the separation of passenger and freight networks, which becomes more and more reality.
Proposals to include quality indicators and related bonus-malus systems in the freight sector
will gain importance, although the most recent attempts of the EU third railway package
have been rejected.
Germany has introduced a quality oriented system within a new track pricing scheme, where
infrastructure or traffic related delays are considered within the track price, providing incen-
tives to reduce delays and improve quality. It will be interesting to monitor the effects of this
system with respect to quality improvement.
4.2.1.3 Air transport
Air transport has faced a considerable change in the last 10-15 years due to increased liber-
alisation and competition. Most important is the reaction of the sector to new business mod-
els (e.g. Low Cost Carriers, network carriers, regional carriers) and to remarkable growth
rates due to liberalisation (lower fares, increased supply) and globalisation (increased demand
for intercontinental services and capacity and demand increase in Asia and in the near East
such as Saudi Arabia). The delays statistics (see section 3) of ATM-managers and airports
show that there are several influence factors to consider: Airport capacity (runways, termi-
nals), ATM-capacity and quality (in the surroundings of major cities, en route, based on tech-
nical potentials to bundle air traffic movements in a safe way) and airline oriented issues (air-
craft failures, connections). In addition there are several exogenous factors such as weather
and increased security problems. The latter has gained significant importance due to in-
creased risk of terror attacks after the events of 9/11.
The existing delays statistics for Europe and the US show considerable differences. Whereas
in Europe airline related delays are most important, the influence of the weather (especially in
winter times) seems to dominate delay causes in the US. Airports and ATM related problems
seem to be a minor issue. However, in order to analyse sector impacts properly, it is impor-
tant to differentiate these results considering the growth potential and the competitive situa-
tion of the air transport industry and the different type of actors and transport segments.
Network carriers are depending on a sound collaboration with their main hub airport. The
hub system has to guarantee time sensitive connection flights in order to increase load fac-
tors for long haul flights. Delays of connection flights are harming the whole transport chains
and are a crucial factor for the competitiveness of the industry. The strategy of global allianc-
ing has formed several major actors where intercontinental competition (between Europe
and the US) is an issue. Especially hub systems such as London, Paris, Frankfurt or Milan in
Europe and Atlanta, Chicago, New York in the US and related airlines are vulnerable to de-
lays. For network carriers, the capacity situation of their hub airports today and in future is a
crucial factor for their competitiveness. In this respect a sound collaboration of airline and
airport is vital. Facing the recent developments due to security problems, long realisation
times for infrastructure enlargement, increased fuel prices and the high level of competition,
a limitation of growth due to limited infrastructure capacity is harming competitiveness heav-
ily. This is true for all network carriers (US and Europe). The interviews have shown that some
airports (esp. Eastern US, London, Frankfurt, Milan) face increasing capacity problems.

COMPETE Final Report: Congestion: Impacts and sector responses - 83 -
The direct delay costs in the short run are minor for the airports (reorganisation, terminal
limitation). Most of the costs of delays are shifted to the airline and to the passengers. Delay
penalties are not common, but reimbursement for cancelled flights. But there are also in-
creased operating costs for the airlines, such as waiting times, costs for holding flights at
crowded airports (esp. hub airports) and administrative costs (e.g. rescheduling, re-routing).
Due to the increased competition there is a tendency that passengers have to bear the main
share of related costs in terms of waiting time. The shift to flight prices however is hardly
possible.
A recent survey of IATA (2006) has shown that more than 60% of passengers are judging air
transport quality as very important or vital and the reduction of delays is the main concern for
network carriers. The study has analysed the airline network benefit showing that these
benefits (based on network carriers and alliances) are considerable and important as a com-
petitive factor of regions as a whole.
Regional (intra Europe or US) traffic is affected at a similar level since delays in relation to
flight times are considerably higher than for intercontinental flights. An additional element is
the high level of competition between network carriers and low cost carriers. The latter are in
a more favourable situation with respect to delay risks, since their connectivity is less impor-
tant and their approach to avoid major hubs and use regional airports11 is part of the overall
strategy to save costs. On the other hand their slots are usually very short. If low cost carriers
miss their slots, there is no possibility (while too costly) to reallocate the airline service. In gen-
eral low cost carriers are less able to bear costs of delays, since there is no potential for addi-
tional planes or services. This leads to the fact, that passengers have to bear nearly all costs of
delays in form of time losses. Although low cost carriers are in a rather strong competitive
situation, delays are affecting the image in due time and have an influence on their competi-
tiveness.
Compared to that, tourism and charter air transport is in general not very time sensitive
since alternative airports and less critical time slots can be used.
General aviation services and business jets are for a high level business segment an impor-
tant alternative to avoid deteriorating quality and increased delay risks. According to the in-
terviews, the enormous growth of this segment is related to increased quality problems of
major hubs.
Air cargo faces on the one hand similar problems than network carriers, since belly cargo is
part of passenger flight. Pure cargo operators are using (like road hauliers) off peak slots to
organise their worldwide traffic. This leads to the situation that cargo hub systems are used
during the night causing considerable noise at sensitive times for residentials. In Frankfurt for
example, more than 100 cargo planes are leaving the airport after midnight. As soon as night
bans are discussed to protect densely populated areas, there are increased risks of additional
cost for the air cargo industry. The air cargo industry has partly already reacted (especially in
Europe) by using road (and combined rail) alternatives for feeder transport with short dis-
tances.
11 Such as Standstad in London or Hahn in Frankfurt.

- 84 - COMPETE Final Report: Congestion: Impacts and sector responses
The competitiveness of the industry is weakened especially for hub carriers which are de-
pending on reliable connections. In Europe, the competition between road and high speed
rail is visible. Especially for relations with duration below 3 hours, there are strong arguments
for high speed trains. According to the interviews however, the potential of using high speed
rail for hub services is very limited. Comparing the situation between EU and US, one can
state, that in general the US aviation sector – due to its importance and due to the increased
security risks for the time being – is more vulnerable to congestion and deterioration of qual-
ity. On the other hand there is no major competitive issue to other modes. Europe faces more
competition on short distances by terrestrial transport. In addition, it is more difficult to
enlarge capacity at major hubs due to limited space and densely populated areas.
The air transport industry has elaborated several reports where the potential losses of not
increasing capacities have been quantified. Eurocontrol states in its study "Challenges to
Growth" (2004), that today, most airports have some spare capacity. In fact, for the first 133
airports, nearly 30% of existing capacity remains unused at 2003 typical busy hour traffic
levels. This situation however will deteriorate quickly due to high growth rates. Eurocontrol
concludes that the existing capacity will exhaust and more than 17% of growth (by 2025)
cannot be satisfied. An important reason for this high growth rates are the dynamics in Asia
and the Near East. The answers of different European airports and Airlines including ACI and
AEA to a survey carried out by the European Commission with regard to the capacity, effi-
ciency and safety situation (2005) shows, that there are increased limits for network carriers.
The airline industry is very sceptical on the potentials of intermodal approaches to overcome
capacity and safety problems.
The air transport industry in the EU and US has recognized these problems a while ago.
Nearly all major hub airports are therefore engaged in extension plans, whereas other air-
ports (namely in Italy and Spain) have been enlarged recently. The open sky agreements and
the strategies to improve air traffic management are additional corner stones. Modern sys-
tems might reduce delays at airports in the LTO cycle by up to 10%, leading also to consider-
able fuel savings. Whereas the US was leading in modernised CNC/ATM systems in former
times, their systems need to be improved in due time. Compared to Europe there is however
no single sky problem. In addition, airlines are considering bigger aircraft volumes (esp. Air-
bus) to increase loading capacity per air traffic movement.
Another possibility to improve capacities is the use of slot allocation and pricing instruments.
Peak load pricing at hub airports might flatten daily frequencies. According to the interviews,
there is however very limited potential. The experience in London Heathrow shows, that
there are only short term effects visible. After the General Aviation has skipped from London
Heathrow, the capacity (and the delays) remained stable.
4.2.1.4 Ports
In general ports are facing enormous growth rates for container shipping. There are severe
capacity restrictions, especially for terminal capacities, quays to berth and crane capacities.
The interviews with port officials in Northern Europe have shown that bottlenecks are most
relevant, where port owned terminals are used (e.g. Bremerhaven, Gent, Antwerp). This leads
to unpredictability of port usage (user conflicts), to rescheduling and relocation of ships and
to time delays. As an example, Bremerhaven states an actual delay of 11 to 36 hour per ship.

COMPETE Final Report: Congestion: Impacts and sector responses - 85 -
In Antwerp and Rotterdam delays of several days are common. The example of Portland in
the US shows, that in extreme situation, even a closure of ports is possible. Congestion of
road and rail (access to ports) is judged in different ways. Certain ports do not see road and
rail access as a major constraint, since port terminals can be used as buffers. Rotterdam for
instance uses free road lanes for trucks accessing the port. On other ports, however, land
transport connections are a severe problem, since road and rail infrastructure is limited (e.g.
Hamburg or certain US ports such as the ports of Los Angeles and Long Beach).
The port industry reacts by time shifts (more terminal handling at night times) and improved
planning by early rescheduling of ships. Due to the character of goods (less time sensitive),
the costs are mainly directly relevant for port operators (management costs of delays and
capacity handling), less for the final shippers, as long the delay can be communicated to end
haul transporters and to shippers.
The main mid term reaction is capacity increase with huge investments and the implementa-
tion of new models such as hub and spoke systems, using big ports for general handling and
smaller ports for feeder transports. This is visible at Italian ports (Gioia Tauro as a hub port,
where enough land is available). This concept (due to land scarcity) is more difficult to im-
plement at ports in Northern Europe. There are shifts visible to Eastern Europe, where the
Baltic states and the Black Sea ports are quite dynamic. A main difference between EU and
US is the role of the ports within general logistics. Whereas in the US, the distribution of hin-
terland transport is located inland away from ports infrastructure, Europe uses the ports
themselves as distribution centres. The major reason is land scarcity. Thus the mid term pos-
sibilities to expand capacities are better in the US than in Europe.
4.2.1.5 Logistics and auxiliary transport
The auxiliary transport and logistic sector is covering all modes. Most important is road trans-
port. According to the interviews, the relevance of congestion is big to mean. Due to night
time delivery, long distance transport has a punctuality of 90-95%. In contrast to that, rail-
ways have a punctuality of 75-85% with an average speed of 25-28 km/h. The most critical
bottlenecks in Europe are transalpine corridors and the Ruhr Area. However the delays are
quite small compared to the duration for loading/unloading (3 hours per trip). Critical are not
anticipated temporal access restrictions, especially in urban areas.
The interviews also stated, that congestion is not part of the planning procedures and not
part of cost calculations. But cost increases due to congestion are visible. One hour delay
costs around 50-60 EUR per vehicle. Night time deliveries cost 10% more than daytime deliv-
eries. Up to no however, penalties are rarely issued for haulage companies. There are liability
payments including the costs for extra transports, which have to be undertaken, but there
are no liability payments for haulage companies of carriers in case of production losses. In
general economies of scale play a predominant role: The bigger the size of the firm, the more
possibilities to react to congestion. In very critical delay cases, there is a shift to combined
transport (rail) and to express deliveries by plane (use of KEP services such as DHL). In such
cases, where reliability have to be guaranteed, the clients are willing to pay the added value.
If there are non recurring congestion events and no short term improvement of quality possi-
ble, a shift to the clients is very difficult. In the long term, the logistics industry is changing
locations using cargo centres at sites with low congestion risk. However there is a trade off

- 86 - COMPETE Final Report: Congestion: Impacts and sector responses
between accessibility and minimal congestion. A major problem is still Eastern Europe. Al-
though transport costs are considerably lower, the low quality and reliability weighs that to
some extent out. Hence there is a huge structural change in Eastern Europe (trend to bigger
and more professional entities) visible.
Compared to the EU, the US has more favourable conditions due to geographic conditions
and settlement patterns with less density. However the quality of the road network is worse
than in Western Europe. In general there is less vulnerability to congestion in the US. As we
already have seen by comparing operating costs, the transport efficiency of the road sector in
(Western) Europe is higher than in the US from the viewpoint of logistics actors.
4.2.2 Delivery and Retail
The food and delivery sector is highly affected by congestion. The ECOTRA report has shown
that the supply chain of processed food is very transport intensive: The added value of deliv-
ery and retail accounts for around 6% of total production cost for processed food; 43% of
this value is related to transport. The overall incidence of transport costs on the final prices of
goods is on average in the range of 5-10% for processed food.
As an example (Spain), the retail channel structure for food consists of 81% modern distribu-
tion (hypermarkets, supermarkets) and 19% traditional or specialised (increased share of
modern).
Most critical is the transport of perishable goods and the delivery for retailers in urban areas.
But also customers might suffer (by their individual shopping trips) of congestion. Whereas
long distance trips are usually carried out by night road haul or rail transport, the delivery to
urban areas uses early morning slots with delivery vans. Late delivery means significant pro-
duction losses, a critical issue in a very dynamic market with a high level of competition and
low margins. The higher the number of logistical processes in the transport chain, the higher
the risk of congestion, as the transport survey in UK has shown (UK KPI survey 2002 in
McKinnon 2004a). Since delivery has to use several transport legs compared to other sectors,
it is specifically vulnerable to congestion. Bigger retail companies therefore tend to control
their sensitive transport chains by themselves.
The interviews however showed that there is no directly measurable and explicit cost increase
of congestion which could be shifted to consumers. Most of the interviewees stated as well,
that the whole sector is affected in the same way and there is no difference between actors.
Besides insourcing of sensitive transport and better planning procedures, a major strategy of
retailers is the use of outlets outside of densely urban areas with high congestion risk. A
good example is Walmart which – in contrast to other actors- does not state congestion as a
major problem. The suburban location outside of cities shift congestion costs to the con-
sumer in form of higher transport costs, due to longer distances. This cannot be seen as an
isolated strategy due to congestion however. More important are cheap land prices for huge
areas and good accessibility by road.
The retail sector is the only economic sector (besides the transport sector itself) which has
carried out own studies. The AEA food miles study (DEFRA 2002) has estimated congestion

COMPETE Final Report: Congestion: Impacts and sector responses - 87 -
costs for retail markets of nearly 5 billion Pounds12 (77% in urban areas; 52% passenger cars
of individual shopping transport and 48% of freight delivery, out of that 43% of light duty
vehicles). Compared to the interviews carried out, these figures seem rather high, but the
tendency and the structure can be supported. Another interesting evidence is the impact of
the London Congestion Scheme to the retail sector. Whereas the retail sector claimed losses
due to the charge, London Transport (Ernst&Young 2006) came to the conclusion, that there
is no major impact. That means: the additional cost for shopping purposes outweighed the
advantage of having less congestion in peak hours, making shopping in the central London
area more attractive.
Comparing different regions, one can state, that the problem of congestion is more severe in
Europe than in the US, since urban patterns are more dense and big retailers (such as Wal-
mart) are located in suburbs.
4.2.3 Manufacturing industry
4.2.3.1 Car manufacturing
The car manufacturing logistics is highly organised with vertical organisation patterns and
Just-in-Time production structures. According to the ECOTRA study, the global transport in-
tensity is max. 4% (TRT 2006). The interviews with international players such as VW, BMW or
Daimler Chrysler have shown that congestion is not regarded as a major problem. This holds
true for up- and downstream transport and the conditions for commuters. In accordance to
that the NEI study (2001) stated no considerable influence of transport cost to the automo-
tive sector.
But the sector is – due to its production structures –sensitive to congestion, since reliability
plays a predominant role. There are differences between these players due to specific loca-
tion of the production sites in relation to access motorways and nearby urban areas. The JIT
conditions refer to 70% of new production units and to 30% of old units. The suppliers JIT
share is around 20%. Depending on that, the time sensitivity is around ½ hour - ½ day.
The industry has used several strategies to overcome congestion. Besides the ones already
stated within the road hauliers and logistic sector, the car manufacturing industry is using
railway transport for non time sensitive goods, since railways can be used as rolling store-
houses. Efficient block trains are preferred for the delivery of cars to customer sites. Train
quality (wagon load) is however not always sufficient. Volkswagen for example changed in
the Czech Republic from rail to road transport. All manufacturers reported major problems
with rail transport through France to Spain. However none of the interviewed manufacturers
or suppliers reported a stop of production due to traffic congestion.
Another important strategy to save costs and – in this respect – also to overcome congestion
are new production models, where productions process are concentrated at the same loca-
tion (within specific collaborating production units). An example for that is the SMART fac-
12 According to the input-output tables of UK, the turnover of the food industry in UK (2001) amounts to 58.7
billion pound.

- 88 - COMPETE Final Report: Congestion: Impacts and sector responses
tory in Hambach, Germany. Such production structures are (upstream) very robust towards
reliable JIT processes. 13
Compared to Europe, the situation in the US is even better, since car manufacturers have
changed their locations to remote areas (e.g. Chrysler). In general the interviews showed that
congestion is only in major agglomerations (e.g. Detroit) an issue for the industry.
4.2.3.2 Electronic industry
The industry is quite broad and entails electronics and electro technics, such as household
appliances and media appliances. The relevance of transport therefore varies quite signifi-
cantly. The interviews have been concentrated on end products, since just in time delivery
related congestion is an important issue. Transport plays a big role in the electronic sector.
The interviews best guess amounts to 5%. Most relevant are transports from production
plants to clients and transports of components to production plants while the output delivery
of goods has a 2-3 times higher transport intensity than input delivery of components (Sony).
Besides supply transports and delivery to end consumers, the delivery of spare parts is also
rather time critical.
Transport in the electronic sector in most cases is outsourced to professional providers. The
most important reasons for outsourcing are costs in the first place and professional handling
in the second place.
The general impact of congestion is rated as medium. Most important are higher production
cost (due to higher time costs) and risk of late delivery (loss of quality). In order to avoid de-
lays, time shift strategies and explicit planning procedures are most relevant. In addition pro-
duction sites and delivery gates are located in peripheral areas close to motorway connection.
Overall, the congestion costs are estimated below 0.1% of transport costs in the electronic
industry sector.
4.2.4 Banking and insurance
The service sector is quite different to the other sectors since JIT production and freight
transport is no important issue. Due to that general transport intensity is quite low. Transport
mainly consists of business travel to clients and between business partners in different loca-
tions/segments of the company. On average, according to the interviews, travel costs amount
to 1-2% of the total costs. Most important is air transport.
Most global companies in the finance and insurance sector outsource their business travel
organisation. The main reason for outsourcing is a higher professionalism of those agencies
and economies of scope. According to the interview partners extern travel agencies negotiate
better contracts with airlines.
The interviews have shown that congestion in general is no specific issue. Also commuter
related congestion (of staff) is not directly relevant. There are no processes like claims for
higher wages visible. Bigger organisations however build incentives to use public transport
and to avoid building of parking areas.
13 This is no contrast to globalisation trends. Moreover it is a concentration of the value chain (at different pro-
duction sites worldwide) at one place in order to save transport costs for value added services.

COMPETE Final Report: Congestion: Impacts and sector responses - 89 -
The outsourcing of travel activities however indicates that travel costs and reliability are an
issue in business transport, especially in regard to long distance air transport. Another visible
strategy is the use of business jets within the high key and very time sensitive management
segments of the sector. Hence there is a certain vulnerability of the service sector to increas-
ing capacity constraints and delays in the aviation sector, leading to cancelling of flights and
meetings, higher administrative costs and increasing personnel costs. This will be increasingly
important in the future since the global service patterns of banking and insurance has led to
a significant increase of travel activities. The international travel activities of UBS (Switzerland)
for instance have increased by 80% within the last 5 years. This has led to several strategies
to decrease transport intensity by video conferencing and bundling of activities in foreign
countries. But according to the interviews, these strategies are not directly related to conges-
tion.
The service sector has –due to increased costs in central urban areas – shifted several units
into suburban areas, such as less client intensive data processing and controlling activities.
This is primarily an answer to increased land costs and not directly related to traffic conges-
tion either. This indicates that urban sprawl can be related to congestion.
Comparing different regions in Europe and the US, one can state that the major problems
related to delays are located at the most important hubs, which are at the same time also
important headquarters for the banking and insurance sector (such as London, Frankfurt and
New York).
4.2.5 Individual transport
In order to mirror the sector analysis it is interesting to look finally at the different segments
of individual transport. Commuter transport is related to all sectors and definitely vulnerable
to congestion in urban peak hours. No economic sector according to our interviews however
stated this as a direct cost issue of economic relevance. The same is true for shopping activi-
ties, with respect to the delivery sector. But it can be stated that business strategies tend to
overcome peak hours and dense transport infrastructure by shifting the related costs to the
commuters and consumers. This accelerates urban sprawl and weakens the advantages of
agglomerations density. In this respect, the time losses of commuters and shoppers are not
directly GDP relevant, but significant benefit losses on an individual level (in economic terms:
loss of consumer rents). A similar statement can be made for leisure and tourism transport
where congestion is mainly individual and not directly relevant for GDP related activities (e.g.
for the tourism industry).
This is however different for business travels, where specifically air transport (for the service
sector, see above) is important and GDP relevant costs are occurring.
4.3 Vulnerability of sectors and countries
4.3.1 An index for economic vulnerability to congestion
The information above is mainly qualitative. Only the transport sector has partly quantitative
information on the economic vulnerability and related costs. The analysis however has shown

- 90 - COMPETE Final Report: Congestion: Impacts and sector responses
clearly the most relevant elements, such as the transport intensity, the relevance of Just in
Time production patterns, the involvement in transport chain issues, the perishableness of
goods, the relevance on the demand side such as delivery to clients in urban areas and the
quality of infrastructure.
Based on this qualitative information, we compare a set of countries building up a transpar-
ent indicator to measure and compare the economic vulnerability of different countries to
congestion. The indicator does not show the vulnerability on actual congestion. Furthermore
the indicator provides information whether the specific economic structure of a country (mix
of sectors and transport intensities per sector) is more or less vulnerable to congestion:
Within this respect, the indicator is showing a potential, not an actual performance.
Based on this qualitative information, we compare a set of countries building up a transpar-
ent indicator to measure and compare the vulnerability to congestion. We base our analysis
on the Input-Output-Tables of EU-25 and the US. The following working steps have been
carried out:
Transport intensities of different sectors for each of the countries.
Qualitative evaluation of the vulnerability of the sectors per country to congestion ac-
cording to sector specific criteria.
International comparison of an “Index on vulnerability of the economy to con-gestion” (IVEC) for EU-25 und the US.
Details on the definition of the index and the different variables are shown in the Annex 4.
4.3.2 Results
The IVEC has been calculated for 11 countries with base year 2000. A lower index indicates a
lower vulnerability, an IVEC of 100 shows a “medium” vulnerability of congestion. The fol-
lowing Figure 20 shows the overall results for the vulnerability of sectors of the selected
countries (on average). Transport intensity shows the level of transport costs in relation to
total turnover per sector. The congestion vulnerability index is an aggregate of different crite-
ria.

COMPETE Final Report: Congestion: Impacts and sector responses - 91 -
0%
5%
10%
15%
20%
25%
30%
35%
40%
Transport intensity (in %)
0
0.5
1
1.5
2
2.5
3
3.5
4
Congestion vulnerability index
Transport Intensity Index Congestion vulnerability
Figure 20: Transport intensity and congestion vulnerability index per sector (average of 11 countries). Index: 1 (not vulnerable) up to 5 (very vulnerable)

- 92 - COMPETE Final Report: Congestion: Impacts and sector responses
The Figure 20 shows the high relevance of the transport sector itself and those sectors with
JIT production structures (Food, Manufacturing).
Table 37 shows the results for the index per country. The index related information has been
translated to qualitative information. Considering as well the quality of infrastructure, an
overall vulnerability of a country can be elaborated.
Table 37: Index on vulnerability on congestion, year 2000 Country IVEC
Index points IVEC qualita-tively
Quality of infrastructure
Overall vul-nerability on congestion
Czechia 78 ++ 0 +
Denmark 172 -- 0 --
Finland 167 -- + -
France 120 - ++ +
Germany 86 + + ++
Hungary 91 + + ++
Netherlands 156 -- ++ 0
Poland 125 - -- --
Spain 112 - 0 -
United Kingdom 143 -- + -
United States 117 - 0 - Source: own calculation based on IOT-information, qualitative congestion impact analysis and information on the quality of infrastructure
Four Groups of countries may be identified:
Group 1 “Low vulnerability”: Czechia, Germany, Hungary (IVEC < 100)
Group 2: “Mean vulnerability”: Spain, US, France (IVEC between 101-120)
Group 3 “Increased vulnerability”: Poland (IVEC between 121-140)
Group 4 “high vulnerability”: United Kingdom, Netherlands, Finland, Denmark (IVEC
> 141)
The analysis of the four group shows, that the different degrees of vulnerability on conges-
tion is not mainly due to the sectoral structures of the countries. The main reason of the dif-
ferent vulnerability is the fact that countries of group 3 and 4 with increased and high vul-
nerability show higher transport intensities for the country overall and for the single sectors
than the countries of group 1 and 2. More than three quarters are explained by the higher
transport intensities.
This means that high vulnerability of a country is more due to higher transport intensities of
the countries to a large part independent from the sectoral structure. Netherlands, Hungary
and Spain are the countries where the sectoral structure explains the highest share of the
country’s vulnerability; between 26%-38%.
Adding infrastructure quality, the ratio changes somehow, especially for the Netherlands, UK
and Poland.
COMPETE Final Report: Congestion: Impacts and sector responses - 93 -
The IVEC does not show whether a country suffers today from congestion, but whether the
economic structure of a country (of sectors and transport intensity per sector) is generally
more or less vulnerable on congestion. This means if two countries have already a similar
high level of congestion, the country with a higher IVEC will be more negatively influenced in
its economic performance due to the specific sectoral structure.
Therefore a comparison of IVEC information with the LOS information from the panorama of
congestion in chapter 3 is interesting. It shows in which countries economic development is
already burdened with negative impacts from congested (inter-urban) roads. Three examples:
(a) Finland has a high vulnerability of congestion (IVEC=167) but the LOS-indicator is “A” for
inter urban roads, so Finland has to take care that LOS-indicator does not get worse in order
to avoid retarding influence from congestion on economic activity.
(b) Germany has a low vulnerability (IVEC=86) but a LOS-indicator of “D” for inter-urban
roads, so despite of a low LOS-indicator the German economy is not strongly negatively in-
fluenced by congestion because the general structure of the economy is not very vulnerable
to congestion.
(c) The Netherlands have a quite high IVEC (=156) and a LOS-indicator of “E” on inter-urban
roads, so the economic development is already suffering from congestion. Hence, out of
these three countries considered, additional investments to improve inter-urban road capacity
in the Netherlands would be most effective and efficient.
4.4 Conclusions
Based on our findings, we draw the following conclusions:
Economic consequences of congestion must be differentiated. GDP relevant are di-
rect costs by suffering and avoiding congestion and indirect costs due to decreased
reliability of different economic sectors. Not GDP relevant are the time losses of pas-
senger transport, except for business purposes (e.g. delays in air transport).
The transport sector is highly affected and vulnerable to congestion, especially road
transport and aviation. Both sectors are liberalised and in a strong competitive situa-
tion. Besides congestion, other competitive factors (such as fuel costs, wages, and
security) are of increasing importance. Congestion (recurring and non recurring) is
increasing costs and affecting reliability. For the case of possibly loosing of clients,
reliability can be much more important than direct costs. Therefore the transport
and logistics sector use several strategies such as night haulage, information and
planning instruments to avoid congestion. The aviation sector (especially network
carriers) is strongly depending on the possibilities to increase hub capacity in the
near future. Besides the transport sector, the food and retail sector with delivery to
urban areas is very vulnerable as well.
For other sectors, congestion is not seen as a major problem, although the relevance
is increasing. Congestion is one (amongst many others) factor to induce change of
location (e.g. shopping and production sites) leading to urban sprawl.

- 94 - COMPETE Final Report: Congestion: Impacts and sector responses
It is difficult to pass congestion costs over to consumers. Quality differentiation is only common for specific transport services, such as express delivery and high speed rail and some passenger flights, where penalties for late arrival or reimbursement for cancellation are used.
Comparing the vulnerability between Europe and the US, one can state that the Eu-ropean economic sectors are more vulnerable to congestion, due to the dense net-work, the many actors and interoperability problems, and due to smaller land ca-pacities to enlarge transport infrastructure. Within the transport sector, the US avia-tion industry however is strongly affected by capacity problems, since competition is very strong for network carriers and other factors (such as time losses for passengers due to security measures) are increasingly important.
In order to quantify economic impacts of congestion costs, the value of time (VOT) approach is useful. It covers however not all related costs. Most important is an ad-ditional valuation of reliability. The empirical relevance is quite heterogeneous. Most scientific studies point out that the share or reliability costs is 10 to 20 % of the value of time costs. In maximum – according to road hauliers replies – the ratio can reach more than 100%. A differentiation according to economic sectors might be useful, since the relevance varies between sectors and countries considerably.
There are influences on competitiveness of the transport sector between modes. In general rail transport is supposed to profit from congestion in urban areas and spe-cific corridors. Intramodal distortion in competitiveness is however not significant. The vulnerability between European countries and the US is quite different, depend-ing on the structure of the economy, the transport intensity and the quality of infra-structure. The vulnerability is higher in Northern European countries with high net-work density and Eastern European countries with low infrastructure quality. Com-pared to that the vulnerability of the US transport sector is less significant.
In order to consider the different economic impacts, measures to overcome conges-tion must be seen in a broader context. Besides efficient infrastructure pricing, infra-structure capacity and quality enlargement, incentives to shift to public transport in urban areas and sensitive corridors, information systems in order to anticipate con-gestion properly, quality controlling and penalty systems for fair pricing of transport and maximal conditions for environmentally sound use of off peak situations (esp. night haulage) and increase of load factors are important. The EU policies in regard to improvement of rail interoperability, road management systems and air traffic management play an important role to improve transport infrastructure quality and to minimise economic impacts of congestion.
In countries with much congestion and a high structural vulnerability of the econ-omy on congestion the economy is most negatively influenced by congestion and suffering from losses in economic competitiveness due to congestion. Additional in-frastructure investments seem most effective in countries where the indicator of the economy to congestion is high and the actual level of service (on roads and rail) is low. Whereas UK, the Netherlands and Germany are highly congested, the general impact of congestion to national economy will be more relevant in UK and the Netherlands than in Germany, since these countries face a high vulnerability indica-tor.

COMPETE Final Report: Structural change and its implications for transport - 95 -
5 Structural change and its implications for transport
5.1 Mega-trends affecting transport
The evolution of the EU economy in general and its transport sector in particular cannot be
understood isolated from the context of the globalisation process of the national economies
and societies. The globalization process itself must be understood as a set of inter-connected
macro-economic world-wide mega-trends, with relevant impacts on logistic processes at mi-
cro level and, consequently, in transport systems. The analysis of future transport trends (see
section 5.2 and Annex 5 - section 2.6) was framed by the study of these on-going mega-
trends. The main macro-trends can be identified as follows (further information concerning
each mega-trend can be found in Annex 5):
Population change, that can affect transport sector in several ways, according to its
evolutions: the increase in population increases mobility and transport (both for pas-
sengers and freight) demand with a potential source of congestion, or the reduction
in population can affect negatively, for instance, the sustainability of public transport
systems through the revenue side; Additionally, population growth is accompanied by
trends affecting its location, particularly its concentration in major urban and costal
areas;
Opening of national economies, with the entry of new international economic
players like China and India, the creation of multinational free trade areas (like NAFTA
or the EU Internal Market) and the subsequent rise of international trade. In parallel,
services represent a growing share of the overall economy and are playing an espe-
cially important role in developed countries;
Increase of international investment, with the generalisation of the activities of
the multinational enterprises that extend their production and distribution activities to
several countries throughout the world. Furthermore, the increase in international in-
vestment, together with the opening of national economies, is accompanied by an
increased division of labour;
Advances in technologies, turning information and communication equipments
portable, cheaper and affordable, triggering the emergence of new services and
products and allowing a reduction in information and communication costs of trans-
port, stimulating the global interchange of products.
The association of the above presented global mega-trends has triggered or accelerated a set
of logistic related trends, more or less internationalised according to the geographical scale
where market companies operate. In total the logistic trends considered are 20 and the rela-
tionship with the 4 mega-trends is fully developed in Annex 5. The logistic trends are:
Spatial concentration of production and inventory;
Development of break-bulk / transhipment systems;
Creation of hub-satellite networks;
Concentration of international trade on hub ports;

- 96 - COMPETE Final Report: Structural change and its implications for transport
Rationalisation of the supply base;
Vertical disintegration of production;
Wider geographical sourcing of supplies;
Wider distribution of finished products;
Postponement / local customisation;
Increased direct delivery;
Time-compression principles applied in retail and manufacturing;
Increase in retailers' control over supply chain;
Growth of “nominated day” deliveries and timed delivery systems;
Changes in freight modal split;
Reduction in international transport costs;
Impact of legislation and regulation;
Increased use of information and communications technology;
Developments in vehicle and handling technology;
Complexity, Packaging, Modularity;
Globalisation, growth of E-commerce and dematerialisation of freight.
Table 38 presents the relationships between the 4 mega-trends and the specific trends de-
tected in logistics. The mega-trends with more weight in triggering the changes in logistics
and transport systems are those related to the extension of the global economic activity
throughout the world (opening of national economies and increase of international invest-
ment) and the one related to the reduction of transport costs due to communication and
information activities (advances in technologies).
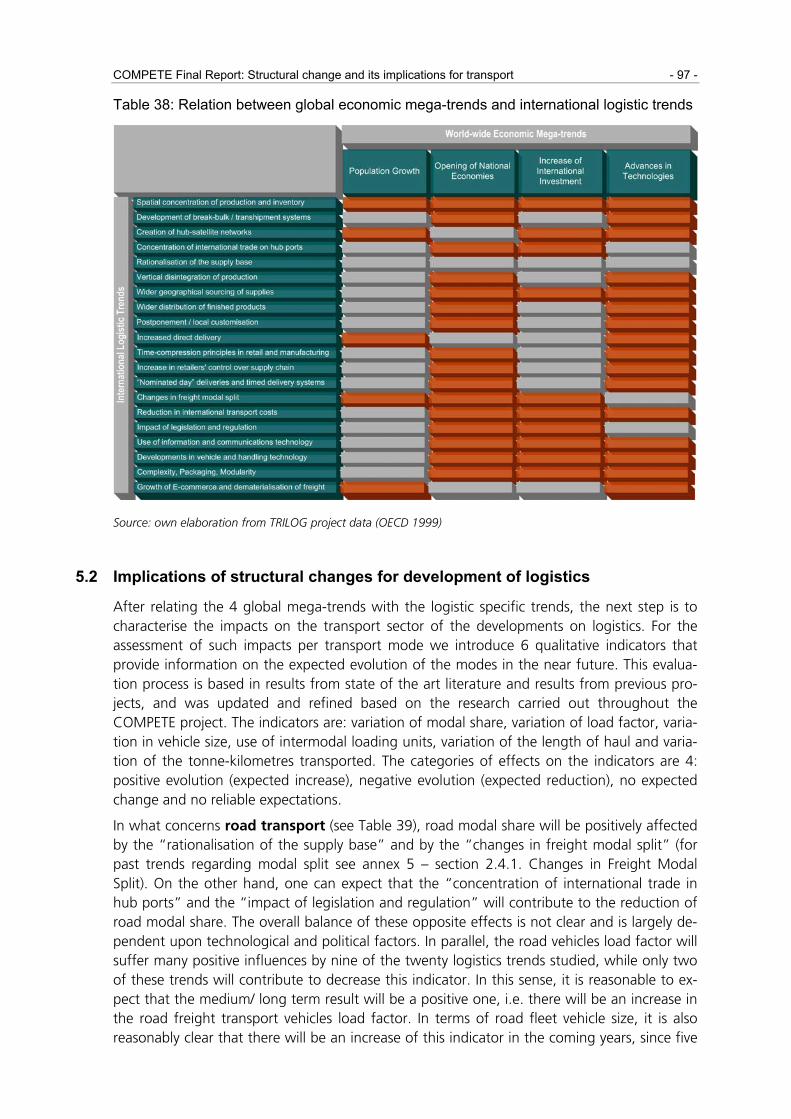
COMPETE Final Report: Structural change and its implications for transport - 97 -
Table 38: Relation between global economic mega-trends and international logistic trends
Source: own elaboration from TRILOG project data (OECD 1999)
5.2 Implications of structural changes for development of logistics
After relating the 4 global mega-trends with the logistic specific trends, the next step is to characterise the impacts on the transport sector of the developments on logistics. For the assessment of such impacts per transport mode we introduce 6 qualitative indicators that provide information on the expected evolution of the modes in the near future. This evalua-tion process is based in results from state of the art literature and results from previous pro-jects, and was updated and refined based on the research carried out throughout the COMPETE project. The indicators are: variation of modal share, variation of load factor, varia-tion in vehicle size, use of intermodal loading units, variation of the length of haul and varia-tion of the tonne-kilometres transported. The categories of effects on the indicators are 4: positive evolution (expected increase), negative evolution (expected reduction), no expected change and no reliable expectations.
In what concerns road transport (see Table 39), road modal share will be positively affected by the “rationalisation of the supply base” and by the “changes in freight modal split” (for past trends regarding modal split see annex 5 – section 2.4.1. Changes in Freight Modal Split). On the other hand, one can expect that the “concentration of international trade in hub ports” and the “impact of legislation and regulation” will contribute to the reduction of road modal share. The overall balance of these opposite effects is not clear and is largely de-pendent upon technological and political factors. In parallel, the road vehicles load factor will suffer many positive influences by nine of the twenty logistics trends studied, while only two of these trends will contribute to decrease this indicator. In this sense, it is reasonable to ex-pect that the medium/ long term result will be a positive one, i.e. there will be an increase in the road freight transport vehicles load factor. In terms of road fleet vehicle size, it is also reasonably clear that there will be an increase of this indicator in the coming years, since five

- 98 - COMPETE Final Report: Structural change and its implications for transport
logistic trends will positively affect it, and only one will contribute to its reduction. Attention should be paid to the fact that this indicator will probably rise within the legal limitations already imposed and that no changes to these restrictions are expected. The use of inter-modal loading units is also going to increase. Seven of the logistic trends will influence posi-tively this change, while none will contradict it. Apparently, also the indicator “tonnes-kilometres” will increase in the future, as long as the trends such as: i) the concentration of spatial concentration; ii) transhipment systems and iii) hub-satellite networks, also maintain its evolution (more detailed information is presented in Annex 5). However, this presupposi-tion is highly dependent upon political and technological progress, namely in what concerns energy alternatives.
The organisation of production systems since the early 80s was largely influenced by two major factors: the relative low prices of oil and the absence of internalisation of external costs associated with transport. However, at this moment, both factors seem to be following a path for change. Concerning the internalisation of external transport costs, the issue has been on the political agenda during the last decade, especially in the European Union. Impor-tant efforts have been done to calculate the real costs of each transport mode and internalise them in order to reveal the “true modal cost” and reflect it in the transport prices (with a potential effect for modal change, due to the expected changes in prices). Concerning the low prices of oil, after the recent increase in oil prices, all forecasts expect sustained higher prices than during the previous decades, with variable trends to be followed in the future, depending on the source. The United States Energy Information Administration (EIA) pro-vided a forecast in June 2006 for the time horizon of 2030, in which the increase in prices is quite constant, varying prices between near the 60$ per barrel (US EIA 2006). In this context, it is quite likely that this decade will see some developments in logistics. If transport is not any more a cheap leg of the logistic chain, several trends that have domi-nated logistics since the 80s could reverse. For instance, the spatial concentration of produc-tion in the low labour cost countries of Asia could stop due to the large increase of the over-all production price including transport to the markets in Europe and the USA. This could mean that factories would “relocate back” to Europe (strong candidates are the NMSs and the Candidate Countries) or to some locations outside Europe with lower salaries but nearer the consumption countries. The dimension of this undoing of the logistics trends prevailing for the last 20 years will depend after all on the capacity of the logistic and transport system to adapt to the current energy prices trend. In the following figure the evolution between 1985 and 1995 (in percentage) of several road freight transport related indicators are pre-sented for five European countries.

COMPETE Final Report: Structural change and its implications for transport - 99 -
Breakdown France Germany Netherlands Sweden United King-dom
Value of production and imports Value density Weight of produced and im-ported goods Modal split Products transported by road Handling factor Road tonnes-lifted Average length of haul Tonne-kilometres Vehicle carrying capacity Load factor Average payload Empty running Vehicle-kilometres
+28%+23%+4%
+10%+14%+2%
+16%+36%+57%+15%+7%
+23%-21%+28%
+14%-2%
+16% +20%+33%
-2%+31%+4%
+33%N.A.N.A.N.A.N.A. N.A.
+17% -3%
+21% 0%
+21%+3%
+25%+29% +60%+24%
-3% +20%
-7%+30%
+82% +51% +21% +11% +34% -20% +8%
+37% +48% +28%
-4% +22%
-7% +18%
-4%-32%
-7% +1% +1%
+18%+18% +24%+46% +9%-4%+4%-5%
+37%
Figure 21 – Overview of changes in economic activity and road freight transport 1985-95 Source: Redefine Summary Report
For rail transport (see Table 40) the modal share indicator is balanced by five positive influ-
ences and four negative. The overall balance will largely depend upon the strength of the
“impacts of legislation and regulation”. However, it can be argued that most European coun-
tries which will modernise their rail infrastructures, adapt their institutional frameworks and
allow access to the network of private logistic operators, will, most likely, register an increase
in this indicator. No clear estimations can be drawn concerning the final results in the me-
dium and long run concerning the indicators load factor and vehicle size, which are very
much dependent upon the evolution of the previous indicator. It is also important to put in
perspective the relevance of the indicator load factor in this particular transport mode. In
fact, the size of freight trains is easily changeable according to the load volumes to transport;
therefore the second indicator (“vehicle size”14) is more useful. The use of intermodal load
units is also expected to increase in rail transport, as well as the length of haul (rail freight is
getting more flexible, but it is in the longer hauls where it is more competitive with the road)
and the tonnes-kilometres transported.
In what concerns air transport (see Table 41), one can expect a potential increase in the
modal share. The separation between passengers and cargo, not only operational but also
institutional, has contributed to the better performance of the air freight sector. On the other
hand, time to market is an increasingly important variable in most logistic chains. Particularly,
freight with a high value and low volume will have significant potential to be transported by
air. No reliable forecast can be made regarding the effects of logistic trends in the indicators
load factor and vehicle size(for past information - 1990 to 1999 - concerning the load factor
and vehicle size indicator please see Annex 5 – section 2.1.2). The high use of intermodal
units is already a reality, especially in “belly” transport15. On the other hand, the length of
haul and the indicator tonnes-kilometres will most likely increase in the air freight transport
during the coming years.
14 Being vehicle size the total length of the train 15 as oposed to all-cargo airplanes, “belly” transport refers to cargo transport in ULD (unit loading
device) in the “belly” of passengers aircrafts.

- 100 - COMPETE Final Report: Structural change and its implications for transport
Finally, in maritime transport (see Table 42), although five logistic trends will contribute
positively to increase the modal share of this transport mode, the overall final result is not
totally clear, and will depend largely upon the configuration of international logistic chains
and the evolution of trade agreements and partnerships. The load factor associated with
maritime vessels will most likely not suffer any significant change in the coming years, due to
the international logistic trends. However, one can expect an increase concerning the indica-
tors vehicle size (for instance, container vessels are continuously increasing its size and cargo
capacity; nowadays 6.000 TEUs vessels are quite common in transoceanic routes), use of in-
termodal loading units (containerisation of cargo), length of haul (the commercial relation-
ships between commercial blocks America-Asia-Europe are scaling) and tonnes-kilometres
(longer haul and larger cargo capacities).
Table 39: Road haulage logistical qualitative effects matrix
Source: own elaboration

COMPETE Final Report: Structural change and its implications for transport - 101 -
Table 40: Rail transport logistical qualitative effects matrix
Source: own elaboration
Table 41: Air transport logistical qualitative effects matrix
Source: own elaboration

- 102 - COMPETE Final Report: Structural change and its implications for transport
Table 42: Maritime transport logistical qualitative effects matrix
Source: own elaboration
5.3 Changes of trade patterns and trade flows of the EU and US
The following section presents the resume of the analysis of the main commercial flows, their
evolution through time and types of transported goods traded. The overall objective is to
provide insights of the evolution of the external sector of the national economies and the
implications in the transport sector. In more detail, the technical objectives of the analysis are
the following:
To investigate the evolution and changes in commercial partnerships and associated
trade flows in order to check changes in transport flows and transport modes han-
dling them;
To point out the qualitative effects from the changes in the use of the available
modes and freight transport shares and forecast the future sign of potential qualita-
tive changes in the use of the available freight modes;
Provide conclusions concerning the modes, networks or geographic areas with a po-
tential for congestion or with present or future bottlenecks for transport and logistics
in the EU.
The data used for the analysis come from different sources: STAN Bilateral Trade Database
statistics from the OECD for the analysis of international commercial flows (OECD 2006),
Eurostat (2004) and North American Transportation Statistics (2006) concerning transport
statistics in Europe and the USA. The period of analysis was in the majority of the countries
1988-2004, being it reduced in several cases due to the unavailability of some data.
Given the time limits for the study, in total 11 countries were analysed, in agreement with
the Commission services, concerning specific national case studies. The conclusion per coun-
try concerning the trade patterns and their effect in the transport sectors are the following:

COMPETE Final Report: Structural change and its implications for transport - 103 -
1) Denmark present a very high level degree of stability on its trade flows, with an econ-
omy very integrated in the EU Internal market. The main trends concerning the trade
flows since 1988 are: the progressive integration of the Danish external sector in the EU
internal market through the reinforcement of the commercial relationships with several
EU Member States; and the extension of its trade flows into the global trends, with in-
creased relationships with China. The main effects in the Danish transport sector for the
near future according to the present international trade trends are the following:
Intensive use of the land modes, due to the preferential partnership with Germany
and other growing flows with other EU Member States;
Intensive use of the port sector, given the growing trade flows with countries of the
Baltic area and North Sea (UK and Norway), and the increasing commercial flows with
overseas countries, especially with China. The situation of several European hub ports
can soften this pressure, as some are very near to Denmark: Bremen, Hamburg and
Rotterdam;
2) Finland presents a mixture of commercial partnerships with several changes in the con-
figuration of its main import providers and export purchasers. There are 3 groups of part-
ners that can be highlighted: regional non-EU Member State partners (Russia, Norway)
and other Baltic states in lesser degree; EU Member States (Germany, Sweden, France
and Netherlands mainly); and overseas partners (USA, China and Japan). The main effects
in the near future on the transport sector would be:
Strong increase in the land based modes due to the large increase of the trade flows
with the Russian Federation. The most likely mode increasing its share would be the
road, as the situation of the Russian railway network would determine the capacity
for responding to the demand for transport;
The port sector will continue its growth path since the early 90s, due to the increase
in maritime activity in the Baltic region and the growing partnerships of Finland with
several EU Member States and overseas countries. Since 1996, the Finish port sector
has a growth rate of 32% of the total transported tonnes;
3) France presents very stable commercial partnerships and flows, being the main importers
and exporters amongst the same group of countries, mainly EU Member States. The most
relevant variations in terms of partnerships are the growing role of Spain both as importer
and exporter and the role of China as booming overseas partner. The main effects in the
near future on the transport sector would be:
Most flows are concentrated on neighbour countries (Germany, Spain, Switzerland,
Italy and Belgium), putting more pressure in the land based modes. The most likely
effect is a rise in the share of road haulage, due to the shorter distances covered and
to the present trend of reduction of the rail freight share;
The French port sector will continue to grow, as it concentrates 66% of the total ex-
tra-EU French trade and handles also important flows from the Mediterranean and
Baltic routes. In this context, the global phenomenon of the rise of the Chinese econ-
omy will play a key role in the evolution of the tonnage handled by the port sector;

- 104 - COMPETE Final Report: Structural change and its implications for transport
4) Germany can be considered as pivotal in the trade and transport sectors of the EU for
two reasons: first, it is the main EU economy, generating very large flows of imports and
exports not only with all EU Member States, but also extra-EU trade, and the subsequent
transport flows; and second, its geographical situation in the core of Europe means that
its networks also support trade between other European countries. The set of German
commercial partners has been very stable through the period analysed, with well defined
activities as main importer/exporter within the EU and as key global importer/exporter.
The main effects in the near future on the transport sector would be:
The recovery of the rail share on the total tonnes transported by the land modes de-
pends largely on the evolution of the railway infrastructure in the emerging German
partners, the NMSs. If it cannot cope with the expected (and already ongoing) in-
crease in trade, road transport will increase its share and put more pressure on the al-
ready congested German network;
Maritime transport is key for the extra-EU German relationships and for trade in sev-
eral long haul intra-EU routes. The strong increases of commercial flows to/from the
US and China will rise as potential sources for congestion in the German ports and
associated Hinterland networks;
5) The Netherlands present an interesting case of “specialisation” concerning the trade
flows: exports flows are very EU oriented, having imports a more “global” orientation.
This intense process of globalisation started in the late 80s. In both cases the main part-
nerships are neighbour countries and other EU Member States, with the inclusion of sev-
eral overseas partners concerning imports. The main effects in the near future on the
transport sector would be:
The port sector is crucial for the fluent relationships of the Dutch economy, with
some of the most important European hubs. The ports sector will suffer from more
pressure and a high potential for congestion, not only for the Dutch trade flows, but
also due to the concentration of European trade flows passing through them;
The strong relationships with neighbour countries and other EU Member States and
the commercial flows concentrated in the Dutch hub ports will put increasing pres-
sure in the land based modes as far as they continue to grow. Of special importance
will be the extra-EU relationships, that tend to use the Dutch port system.
6) Spain is a case study for evolution of the external relationships of its economy and the
evolution of the transport sector. As the Netherlands, Spain presents a characteristic of
double integration: first, with the strengthening of the intra-EU partnerships; and second
with the increasing integration in the global trade relationships. This dual evolution has
been handled quite separately by the maritime sector (mainly the global integration, ex-
tra-EU trade) and the road haulage (the intra-EU trade). The main effects in the near fu-
ture on the transport sector would be:
The road haulage is so high in Spain because of the interoperability problems of the
railways. This mode is suffering from a lack of modernisation, that means that in the
near future any increase in the intra-EU trade will be directly translated into a more
intensive use of the road network;

COMPETE Final Report: Structural change and its implications for transport - 105 -
The port sector in Spain has experienced a large growth in the last decades, being the
main mode for the Spanish extra-EU trade and getting increasing importance in intra-
EU long haul routes in the Mediterranean and with the North Atlantic and Baltic ar-
eas. There are no important congestion problem in the ports (in aggregate terms
there is some excess of capacity) but the associated networks are already congested
at some points.
7) The UK is, of all the European countries analysed, the one with the highest proportion of
extra-EU trade over total trade, due to its traditional relationship with the USA. Moreover,
both imports and exports have a very similar structure regarding the main partnerships,
with a high level of stability in the last decades. The most important new partners are
China and Spain, two different trends, globalisation and integration in the EU internal
market. The main effects in the near future on the transport sector would be:
Of course, the port sector is crucial in the British commercial interchanges. It is evi-
dent that the pressure of further increases in imports and exports will put more pres-
sure in the port sector and rise the potential for congestion. Complementary land
based networks and their connections to ports must be also taken into account;
Concerning the land based modes, the UK has followed since the 90s an interesting
trend of reduction of the road freight share over the total volume of transported ton-
nes using land based modes. This can be due to the process of rail liberalisation in the
UK, which is more advanced than in any other EU Member State, and to the highly
developed presence in the rail freight market of specialised private operators;
8) The Czech Republic trade flows during the period are characterised by the strengthen-
ing of relationships with the former EU15 Member States, specially with Germany, a
trend that verifies also in Hungary and Poland. Of these three NMSs, the Czech Republic
is the one with higher increases in trade and with the most focused commercial flows.
The main effects in the near future on the transport sector would be:
The preferential Czech trade partnerships determine the transport modes used for
commerce: the flows are extremely intense, both imports and exports, with Germany
(especially), Austria and the Slovak Republic. Most of these commercial interchanges
are performed using the road network. The trend followed by the Czech economy
(increase in the average value of imports and exports) suggest further pressure on the
road mode with a potential for more congestion;
The rise of the road share has been complemented with a fall of the rail freight share
due to several reasons, but the most important seems to be that the Czech rail net-
work is lagging in terms of its ability to respond to the needs of the logistics opera-
tors, mainly due to its need for modernisation.
9) Hungary has a very similar evolution in several aspects to that of the Czech Republic: a
common set of partners, a very similar evolution in the composition of imports and ex-
ports and a parallel evolution in the transport sectors. Hungary presents (as the Czech
Republic) a fast integration in the EU internal market with strong regional partnerships.
The main effects in the near future on the transport sector would be:

- 106 - COMPETE Final Report: Structural change and its implications for transport
The road sector has increased its freight share in the last decade and it is expected
that it will continue to grow in the near future, due to the increasing commercial rela-
tionships with its neighbour countries, Slovakia, Czech Republic and specially Austria,
haul distances where the road is more competitive;
The railway share has been fairly stable since 1998 but in the near future it is ex-
pected more pressure from the road operators (more competence) and from the lo-
gistics operators asking for a higher integration of rail freight in the logistic chains as
complexity of transport operation rises.
10) Poland is undergoing an accelerated process of integration in the EU internal market, as
the Czech Republic and Hungary. The evolution of the transport sector and the composi-
tion of import and export flows are also very similar to those of the other NMSs studied.
It is important to remark the high integration with Germany, first partner concerning im-
ports and exports. The main effects in the near future on the transport sector would be:
The land based sectors have followed a trend since 1993 of intense shift from rail to
road freight. It seems quite likely that the share of road haulage will continue to
grow, putting more pressure in the road network and increasing the potential for
congestion, specially in the road connections with Germany, the top supplier and
purchaser of the Polish economy;
The maritime transport in Poland has grown steadily in Poland, being the mode used
by the overseas commercial partnerships and (potentially) in some intra-EU commer-
cial routes of long distance. To this it must be added the increasing integration of the
Polish ports in the Baltic region trade. In this context, it is foreseeable a more inten-
sive use of the sector in the near future.
11) The US has gone through a process of commercial and trade integration due to the im-
plementation of the NAFTA agreement in 1994, that has meant a significant rise in trade
activity between the signing countries, USA, Canada and Mexico. However, in aggre-
gated terms, the effect of the NAFTA agreement in the ranking of Top10 commercial
partners for imports and exports has been very limited, mainly because Mexico and Can-
ada where already before the agreement amongst the US preferential trade partners. As
first economy of the world, the structure of the US trade partnerships is very complex
with three trade blocks quite well defined: NAFTA countries, Canada and Mexico; Euro-
pean countries, all EU Member States; Far East countries, China, Taiwan, Korea and Ja-
pan. The main effects in the near future on the transport sector would be:
The long distances travelled by the external US trade determines largely the transport
mode used. In the commercial relationships with Canada and Mexico, with a trend to
reduce the share of road haulage and increase the shares of rail freight and maritime
transport. It is expected a similar evolution in the near future;
The US port sector is key for handling most of the extra-NAFTA external commerce of
the USA. The trade flows through the Pacific towards Japan, Taiwan and China, and
through the Atlantic towards the EU. The development of the port sector will be es-
pecially important in the Pacific routes given the pattern of high growth rate followed

COMPETE Final Report: Structural change and its implications for transport - 107 -
by the Chinese economy and the increasingly intense relationship with the US econ-
omy.
Figure 22 presents a schematic representation of the main variations in the value of trade
flows between countries, according to the values of the detailed analysis presented in Annex
5. The objective of such representation is to put together in one figure all the main increases
in trade flows (both intra and extra-EU) for the countries analysed and draw some qualitative
conclusions concerning the main regions and transport networks affected. The final objective
is to set the basis for the analysis of the potential bottlenecks in transport and logistics that
serves as conclusion of this chapter.
From Figure 22 we can highlight the high concentration of rising trade flows around Ger-
many, with the former EU15 Member States and the NMSs. Thus, central Europe will face, if
trade trends evolve under the same parameters of nowadays, a more intense use of the land
based modes. This will be especially important in countries with rail infrastructure needing
modernisation, as in such situations road haulage will increase its share steadily. This can be
the case of Poland, Czech Republic and Hungary. Another important transport area will be
the North Atlantic and Baltic regions, where the increasing trade flows from overseas part-
ners (USA, China, Japan, etc) concentrate. The port sector will be of utmost importance, as
well as the accesses to the associated land based networks.

- 108 - COMPETE Final Report: Structural change and its implications for transport
Figure 22: Schematic representation of the main increases in the trade flows for the EU Member States analysed
Source: own elaboration

COMPETE Final Report: Structural change and its implications for transport - 109 -
5.4 Structural change of the economies
From the analysis of the trade flows and types of transported good we can derive important
conclusions concerning the structural changes of the national economies. There are two indi-
cators of relevance:
Evolution of the composition of the main NSTR categories of goods: changes in the
shares of the NSTR categories provide an indicator on the evolution of the economy
and productive system. For instance, reductions in imports and exports of agricultural
goods and an increase in imports and exports of manufactured goods during a period
of time might indicate that the secondary sector of the economy is gaining weight
against the primary sector;
Evolution of the composition of imports and exports in terms of the technological
level of the traded manufactured goods. This classification presents imports and ex-
ports of manufactured goods classified in 4 categories: low technology manufactures,
medium-low technology manufactures, medium-high technology manufactures and
high technology manufactures. The increase of the share over total transactions of
the higher technology categories might indicate an increase in the production with a
high value on the ratio value/weight and a specialisation of the national industry in
the production of higher value goods.
These two indicators were checked for all the countries under analysis in this section, being
the detailed results presented in Annex 5. Following we present a resume of the results per
country and the potential effect of the changed observed in the national transport sectors. It
is important to remark that the conclusions we present are related with the potential effect
of the structural changes on the share of the land based modes, those with a higher ten-
dency to shift modes due to changes of its value per unit.
1) Denmark: the composition of Danish imports and exports is quite stable throughout the
period, being the manufactured goods the base of both figures. Imports total value pre-
sents a percentage of manufactured goods between 88% and 92% for the total value of
imports, and between 92% and 94% for exports. The share of the medium and high
technology manufactures grew during the period from 47.8% to 51.7% for imports and
40% to 50.5% for exports. The low increase in the average value of manufactured goods
and the stability of the share of manufactured goods over total trade does not suggest a
relevant change in the economy. There are no relevant changes expected in the transport
sector due to structural economic changes;
2) Finland: the composition of imports and exports consist mainly of manufactured goods,
especially in exports, with a very stable share around 97% of the total value. The share of
medium and high technology manufactures over total manufactures exported was
43.7% in 1988 and 49% in 2004. The low increase in the average value of manufactured
goods and the stability of the share of manufactured goods over total trade does not
suggest a relevant change in the economy. There are no relevant changes expected in the
transport sector due to structural economic changes;
3) France: the type of goods exported has followed a trend for increasing the value of
goods, changing the proportion of medium and high technology manufactures from

- 110 - COMPETE Final Report: Structural change and its implications for transport
56.2% in 1988 to 64.9% in 2004. Over the total value of exports, manufactured goods
had an increase on their share from 90.9% in 1988 to 94.7% in 2004, with a reduction
for those years of the agricultural goods exported from 6.7% to 3.12% respectively
(more than a 50% reduction). This means that there is a significant shift in the value of
produced and traded goods, with a potential impact in the increase of the use of road
and reduction in the use of rail freight;
4) Germany: the share of manufactured goods over total imports and exports has been
stable during the period, with values around 94% for exports and 83% for imports. Con-
cerning the value of medium and high technology manufactures, the proportion over to-
tal manufactured imports changed from 48.6% in 1988 to 62.1% in 2004, and over
manufactured exports from 64.5% to 70.8% respectively. There is a clear trend for spe-
cialisation of the German economy in the production of higher value goods. This can
have an impact in the increase of the share of road transport and reduction on rail
freight, but the impact would be lessened as the German transport sector is a very ma-
ture one, with high stability and a high degree of development;
5) Netherlands: The share of medium-low technology imports decreased since 1988 from
49%, to 35% in 2004. At the same time, in 1988 the share of medium and high tech-
nology exports was 47%, being almost 60% in 2004. Combined to the figures of the
imports, these numbers are consistent with the structural trend of the more developed
economies that area following a path of specialisation in the production of high value
goods. This can have an impact in the increase of the share of road transport and reduc-
tion on rail freight, although the effect would be small due to development of the Dutch
transport sector;
6) Spain: Spanish exports follow the trend of specialisation in medium and high technology
goods of most developed economies. The share of manufactured goods over total ex-
ports also rose in the period, from 89.3% to 91.5%, with reductions in the share of ex-
ports related to agriculture goods, from 9.4% to 6.1%. In terms of its technological level,
the types of goods exported have also changed: in 1988 the majority of exports were
medium and low technology goods (51.5% of the total manufactured exports), and in
2004 the majority were medium and high technology goods (almost 57% of the total
manufactured exports). This increase in the value of transported goods can have an im-
pact in the increase of the share of road transport and reduction on rail freight, which is
in fact the trend nowadays;
7) UK: The structure of imports and exports has changed since 1988 in the same way as in
other developed EU economies: the share of manufactured goods over total imports and
exports has increased, as well as the share of the medium and high technology manufac-
tures over total manufactures imported and exported. This means that the UK economy
has increased its specialisation, like other European countries, producing more valuable
goods. This increase in the value of transported goods can mean an increase of the share
of road transport and reduction on rail freight, although the effect would be small due to
the maturity and high development of the UK transport sector;
8) Czech Republic: Since 1993, the proportion of mining and quarrying products over total
imports has fallen 50%, from 10% to 5%. In the same period, the percentage of manu-

COMPETE Final Report: Structural change and its implications for transport - 111 -
factured goods imported changed from 84% to 92%. Second, the structure of exports
has changed also, as in 1993 almost 88% of the exports were manufactured goods and
in 2004 this number rose up to 96%. The most relevant change however was the shift
from medium and low to medium and high technology exports: in 1993, the figures were
40% and 60%, and in 2004 had changed to 60% and 40% respectively. The combina-
tion of the changes on imports and exports has a clear origin: the increase in the value of
the produced goods by the Czech economy, derived of the changes on its national indus-
try and the relocation of firms. The Czech economy is following an accelerated evolution
towards modern production (and transport) structures. This can affect the transport sec-
tor increasing the share of road transport and reduction on rail freight;
9) Hungary: As in the Czech case, the average aggregated value of the produced goods by
the Czech economy has grown, most likely derived of the changes on its national industry
and the relocation of firms devoted to manufacture of goods. The trend on imports and
exports is to increase the proportion of manufactured goods and to increase the propor-
tion of medium and high technology goods over total manufactures. Again, this can af-
fect the rail share, as it is the mode with a more traditional market in large volume goods
and traditionally less flexible than the road;
10) Poland: As in the other two NMSs analysed, the evolution of imports and exports in
terms of the types of products purchased and produced reveals a pattern of modernisa-
tion of the Polish economy. The structure of imports has undertaken a structural change
in the period under analysis, increasing the share of manufactured goods and decreasing
the shares of mining and agricultural products. For the type of exported manufactures in
terms of their technological level, there is observed a significant change: in 1992 31% of
the exports were medium and high technology goods, being 44% in 2004. This shift to
higher value goods can affect the transport sector increasing the share of road transport
and reduction on rail freight;
11) USA: The exported goods follow a trend already analysed for several EU Member States:
the US economy has increased the technological level (and thus the value per unit) of the
produced and exported goods. Between 1990 and 2004, the proportions agricultural
product, mining products and manufactured goods over total exports changed from
7.3% to 4.4% (a reduction of 39%), from 1.92% to 1.1% (a reduction of 44%) and
from 85.5% to 89.9%, respectively. In terms of the technological level of the exported
manufactures, there is an increase in the proportion of medium and high technology
manufactures over total exports: in 1990 it was 71.8%, being 75.2% in 2004, an in-
crease of 4.7% during the period.
For Germany a time series of input-output tables comprising 71 sectors exists for the period
1991 until 2000. COMPETE analysed these tables aggregating them to 32 sectors with se-
perate sectors for road, rail, air, water and auxiliary transport services (including logistics) as
well as production of transport equipment to derive the dynamics of the development in par-
ticular of and between the transport sectors. The main findings of this analysis were:
The transport sectors behave rather cyclical following closely to the general
business cycles of the German economy and to some extent the world economy.
This is caused by:

- 112 - COMPETE Final Report: Structural change and its implications for transport
o The road vehicle sector, which is closely linked to the German economic
cycles e.g. demonstrated by the German boom after the reunification
(1991-1992) while most of the world was in a recession, and
o the transport service sectors, which as transport is a derived demand
stimulated by other activities including economic activities such that the
transport service sectors follow the cycle of the driving economic activities.
o The export of road vehicles, which is one of the largest export sectors of
Germany and which closely follows the trends of world economic devel-
opment.
Intermodality and cooperation between different modes has significantly in-
creased during that time since the transport service sectors continuously increased
the shares of intermediate inputs that they received from other transport service sec-
tors. This was more pronounced for auxiliary services (including logistics), road, air
and water transport than for rail transport. For the latter sector some stagnation in
terms of intermodality improvements could be observed in the first half of the pe-
riod, while at the end of the second half of the period it also showed strongly grow-
ing involvement in the exchange of intermediate inputs between the transport sec-
tors. This should also be the result of German and European policies promoting in-
termodality and railway transport.
5.5 Bottlenecks in future logistic systems
Following the structural analysis in the previous sections the main conclusions concerning
potential bottlenecks in the European transport system affecting the development of logistics
are presented. In general terms, we can separate the national specific effects or local bottle-
necks from regional or modal bottlenecks. The first type is out of the scope of the present
study, as it requires the analysis of the national and local transport networks in order to iden-
tify the “black spots” and circumstances hindering the development of logistics and trans-
port. The second group, regional and modal bottlenecks are presented in the following pages
in a synthetic manner, trying to provide a general vision of the most important obstacles for
smooth transport and logistics between the countries analysed.
For the presentation of the evaluation of the potential bottlenecks per region, an approach
based in three parameters and implemented in two stages was used. The 3 parameters are:
The evolution of the structure of the transport sectors from the IOT and STAN data, in
qualitative terms, taking as base the trends identified in the analysis and the expected
evolution in the near future;
The evolution of the trade flows derived from the analysis undertaken previously;
The state of the networks in qualitative terms, an issue not analysed in this project and
that will be taken as exogenous data.

COMPETE Final Report: Structural change and its implications for transport - 113 -
These three parameters will be combined in an approach with the objective to identify the
main regional bottlenecks per transport mode and the main causes underlying them. The two
stages of the approach are the following:
1) Clusterisation of the European countries analysed into groups according to criteria con-
cerning their tight commercial relationships, the volume of the trade exchanged, the re-
sult from the analysis of the trade flows (see Figure 22 in page 108), their mutual inte-
gration of transport networks and the nature of the (potential) common transport prob-
lems. The same country can belong to several clusters, as can have with different coun-
tries strong commercial links or different “network problems”. The clusters selected are:
Southwest EU (Spain and France), Central EU (France, Germany and the Netherlands),
Eastern EU (Germany, Poland, Hungary and the Czech Republic), Inland Baltic (Finland
and the Russian Federation) and Baltic & North Atlantic (all ports in those areas). After-
wards, the description of each cluster is presented, the state of the network and the
main expected potential bottlenecks for logistics. Table 43 shows the different clusters
for further analysis;
2) Characterisation for the potential for congestion of the national and regional (suprana-
tional) networks within each cluster defined previously, attending to two criteria:
Quality of the network under stake, in terms of overall geographical density, con-
tinuity between countries and state of conservation (physical quality). The “quality of
the network” will be measured using a 3 degree scale from 1 (high quality) to 3 (low
quality), according to the following criteria:
3 = low quality of the network: some basic connections between major cit-
ies, ports or between borders still missing, frequent discontinuity of network
in technical terms and frequent conservation problems;
2 = medium quality: isolated problems concerning missing major connec-
tions, continuity, missing links and conservation;
1 = high quality: uncommon situations regarding missing major connections,
continuity and conservation.
Demand for transport services in the mode under stake, measured with reference
to the expected development of the demand in the short term according to the
analysis of the national transport sectors evolution. The “demand for transport ser-
vices” will be measured using a 3 degree scale from 1 (low demand) to 3 (high de-
mand), according to the following criteria:
1 = low demand: transport mode with no or weak growth expected and/or
low modal share;
2 = medium demand: transport mode with positive growth expected, but its
modal share is not amongst the highest;
3 = high demand: transport mode with a strongly positive growth expected
and/or with a high modal share.

- 114 - COMPETE Final Report: Structural change and its implications for transport
The combination of both indicators will produce a third indicator, the bottleneck potential indicator, which will be the final synthesis of the expected network congestion and bottle-
neck problems derived from trade, transport and logistic flows. The indicator will consist as
well of a three points scale:
1 = low potential: isolated bottlenecks will occur namely in terms of interop-
erability problems, some intermodal operations and congestion in high de-
mand links;
2 = medium potential: some bottlenecks in ordinary operations occur in the
network;
3 = high potential: frequent bottlenecks in ordinary operations occur in the
network, jeopardising the normal flows or goods and passengers in a system-
atic manner.
The indicator is derived from the results of the “quality of network” and “demand for trans-
port services” indicators. The result is derived calculating the mean of both results. For in-
stance, values 1 and 3 would result in a 2 for the “bottleneck potential indicator”. In case the
average value has a decimal case (for instance, values 2 and 3 result in a 2.5) the number
would be rounded to the upper case (in the example, 3).
The assessment of the situation of the networks in the clusters selected is done through the
observation of the situation of the Trans-European Networks in the first place and through
expert opinion. The TEN-T were selected as a proxy for the quality of the networks because a
high density of TEN-T in a country implies an overall good quality of the transport network
and the existence of major links to the most important cities, ports and other connection
points. We include the maps of the TEN-T in Table 43,
Table 44 and Figure 23.
Table 43 presents the resume of the values of the “bottleneck potential indicator” for the
five clusters considered.
Table 43: Resume of potential bottlenecks per European regional cluster CLUSTER: Southwest EU
Network Description Bottleneck potential
Roads
1) Quality of road network (density, continuity, conservation): 1 2 3
Observations: Will continue to increase length and extension in the short/ medium
term, mainly highways in Spain (TENs category); The conservation state is good (important highway network already
in place); Good international highway links.
2) Demand for road transport services: 1 2 3
Observations: demand will continue to increase (short term) due to: Overall growth which has characterized this sector in Spain (first
transport mode in output value) and France (second transport mode in output value);
Low quality and severe interoperability problems concerning interna-tional links.
Potential 1 2 3
Railways 1) Quality of rail network (density; continuity; conservation): 1 2 3
Potential 1 2 3

COMPETE Final Report: Structural change and its implications for transport - 115 -
Observations: Low quality of the Spanish network with real improvements concern-
ing freight operations only in the medium term (due to large invest-ments planned);
International interoperability very difficult, with gauge, signaling and power problems.
2) Demand for rail transport services: 1 2 3
Observations: Reduced interest of international operators due to network quality
and interoperability problems yet to be solved; Potential rise of demand only in the medium term after significant
improvement of the overall quality of the network and respective ser-vices.
Ports
1) Quality of maritime infra-structures (capacity; accessibility and services): 1 2 3
Observations: Some accessibility problems persist in some ports concerning the
links to land transport networks; In general, the operational capacity is good and has grown in the last
decade, specially in Spain, with large investments underway con-cerning handling capacity (quays, warehousing facilities, etc).
2) Demand for maritime transport services: 1 2 3
Observations: Mode highly devoted to international trade and long intra-EU connec-
tions, being the first mode for external trade of both Spain and France;
With a potential to grow, due to the environmental issues and trans-port policy agenda of the EC;
Still, maritime not amongst the main transport modes in terms of tones transported and output value.
Potential 1 2 3
CLUSTER: Central EU
Network Description Bottleneck potential
Roads
1) Quality of road network (density, continuity, conservation): 1 2 3
Observations: Very good quality and continuity of the network, with no missing links
and with high density in geographical terms.
2) Demand for road transport services: 1 2 3
Observations: Will continue to grow in the short term taking into account the overall
growth of the sector in the countries of the area; Important international transport activities mostly carried out by road; Intermodal transport highly developed (high output value figure in all
countries) with intensive use of road legs.
Potential 1 2 3
Railways
1) Quality of rail network (density; continuity; conservation): 1 2 3
Observations: The quality of the network is good in terms of density, continuity and
conservation; Some interoperability problems persist, especially for long course
transnational trains (power, signaling, etc).
2) Demand for rail transport services: 1 2 3
Observations: High demand both for passenger and freight services, with special
demand on the latter; Countries with well developed logistic sectors and intermodal spe-
cialized operators integrating rail legs in their operations; Demand expected to grow due to increasing use of rail freight.
Potential 1 2 3

- 116 - COMPETE Final Report: Structural change and its implications for transport
CLUSTER: Eastern EU
Network Description Bottleneck potential
Roads
1) Quality of road network (density, continuity, conservation): 1 2 3
Observations: Quality of network quite variable, with some links still missing in the
NMSs and a low density network, compared to the EU15; Some local bottlenecks exist.
2) Demand for road transport services: 1 2 3
Observations: demand will continue to grow due to: Overall growth of the sector in the NMSs; Increasing commercial flows between the countries of the cluster.
Potential 1 2 3
Railways
1) Quality of rail network (density; continuity; conservation): 1 2 3
Observations: Good quality network in Germany but rather variable in the NMSs; Interoperability can be difficult but it is expected an improvement in
the short term due to investments underway.
2) Demand for rail transport services: 1 2 3
Observations: Overall demand is growing in the NMSs due to the increasing trade
flows between the countries forming the cluster; Increasing involvement of private multimodal and logistics operators; Traditional high use of rail transport with high shares in some coun-
tries of the cluster, although decreasing in some cases;
Potential 1 2 3
CLUSTER: Inland Baltic
Network Description Bottleneck potential
Roads
1) Quality of road network (density, continuity, conservation): 1 2 3
Observations: Quality of the network is variable as well as the network density; Continuity of networks is high but local bottlenecks exist; Winter condition have strong negative influence.
2) Demand for road transport services: 1 2 3
Observations: Growing international trade in the area (especially Finland-Russia)
but flows still not too high.
Potential 1 2 3
Railways
1) Quality of rail network (density; continuity; conservation): 1 2 3
Observations: Low quality of the network is in some areas; Expected increase of quality and interoperability in the medium term
due to large EU investments (including EC’s Priority Projects).
2) Demand for rail transport services: 1 2 3
Observations: Growing international trade in the area (especially Finland-Russia)
but flows still not too high.
Potential 1 2 3
CLUSTER: Baltic & North Atlantic
Network Description Bottleneck potential
Ports
1) Quality of maritime infra-structures (capacity; accessibility and services): 1 2 3
Observations: Good capacity of ports with on-going investments in some to im-
prove handling and storage capacity (keeping up with demand
Potential 1 2 3

COMPETE Final Report: Structural change and its implications for transport - 117 -
growth); In general, well developed links to road and rail networks with only
specific or local bottlenecks. 2) Demand for maritime transport services:
1 2 3 Observations: Mode highly devoted to international trade and intra-EU connections,
traditionally strong in the area in all countries of the cluster; Some ports are real gateways for Europeans trade flows and entry
door for imports, concentrating large amounts of cargo; Increases in extra-EU trade (both imports and exports) will provoke
immediate increases of the demand.
Source: COMPETE

- 118 - COMPETE Final Report: Structural change and its implications for transport
Table 44: Resume of potential bottlenecks per US regional cluster USA
Network Description Bottleneck potential
Roads
1) Quality of road network (density, continuity, conservation): 1 2 3
Observations: Road network completed, punctual capacity improvements and
maintenance works; 2) Demand for road transport services:
1 2 3 Observations: demand will continue to increase; capacity improvement
constrained by environmental concerns;
Potential 1 2 3
Railways
1) Quality of rail network (density; continuity; conservation): 1 2 3
Observations: Bottlenecks in the form of overpasses and bridges with single tracks,
sidings too short to accommodate 7000 foot trains and at-grade road crossing without proper warning devices
2) Demand for rail transport services: 1 2 3
Observations: On some major routea trunk line capacity is a problem because
some parts of the major routes are single track; Road acess congestion remains a significant problem whenerver
trucks need to access truck/rail interchange facilities; Acessibility improvements are a key component of many state trans-
portation programmes;
Potential 1 2 3
Ports
1) Quality of maritime infra-structures (capacity; accessibility and services): 1 2 3
Observations: At present, there are proposals to build major new ports in British
Columbia and Baja California and additional terminal space in other main ports;
If trans-pacific container flow even remotely approach the levels pro-jected for them in 2020, the main ports of Los Angeles, Oakland and Seattle will require major operational improvements;
2) Demand for maritime transport services:
1 2 3 Observations: Congestion at and around the nations’s seaports is a problem pri-
marily because of the concentration of maritime traffic at a small number of locations;
At the ports of Gulf of mexico and the Atlantic Ocean, congestion is somewhat less problemeatic than on the Pacific;
The huge volumes of vehicle traffic make land accessibility a serious problem on greater New York and other major urban areas;
Potential 1 2 3
Source: COMPETE

COMPETE Final Report: Structural change and its implications for transport - 119 -
Southwest EU
Baltic & North Atlantic
Inland Baltic
Eastern EU
Central EU
Southwest EU
Baltic & North Atlantic
Inland Baltic
Eastern EU
Central EU
Figure 23: Clusters of regions for analysis of potential congestion and bottleneck in trans-port and logistics
Source: COMPETE

- 120 - COMPETE Final Report: Impact of transport infrastructure on economic growth
6 Impact of transport infrastructure on economic growth
6.1 Background of the economic analysis
The theoretical literature on growth models exhibits a broad consensus on the mechanisms
through which, at the microeconomic level, transport infrastructure might affect economic
and productivity growth: transport infrastructure might reduce transportation costs, which
allows a reduction in private sector costs and an increase in specialisation and the degree of
division of labour. In addition, transport infrastructure may bring about changes in factor
markets and firm location decisions that allow the development of spatial clusters of eco-
nomic sectors, which in turn affects innovation and allows further reduction in costs.
The literature also implies that non-linearities in the effects of transport infrastructure on
economic growth may be important: for instance, additions to an under - developed trans-
port network, or new investments in low - quality stock, or investments aimed to alleviate
congestion problems eliminating bottlenecks would all be likely to generate relatively larger
benefits, ceteris paribus, than if these were a developed high quality transport network or a
network with no congestion problems. However, the literature is as yet not able to offer a
robust explanation of the links between transport investment, the network dimension of
transport infrastructure and economic growth.
The empirical literature developed fairly independently of the theoretical work. While the
theoretical literature has sought to apply microeconomic considerations to model the trans-
port infrastructure-economic growth relation, empirical studies –especially the studies which
adopted the production function approach- have mainly followed a “macroeconomic black
box” approach which does not spell out in detail the mechanisms that drive the effects of
transport infrastructure on productivity growth. This is rather unfortunate, as, often, the
aggregate impact of public infrastructure might be a poor proxy for the impact that specific
transport projects might have on aggregate growth.
Having said that, the empirical evidence surveyed for this report (see COMPETE Annex 6 for
the complete literature review) seems to suggest that public capital in general might have a
positive effect on the level of economic activity, though perhaps not as large as suggested by
some of early production functions based studies.
For both the US and the EU, production function studies have tended to identify quite large
returns for public capital and for transportation infrastructure in particular.
For the US, most of the recent empirical evidence based on production function studies has,
in general, identified positive elasticities of output with respect to public capital: for instance,
Boarnet et al (1996) found elasticities in the 0.16-0.2216 range, Duggal (1999) found an elas-
ticity of about 0.27 and Shioji (2001) reports an elasticity of about 0.27.
The average magnitude of the elasticities identified in the most recent studies contrasts with
both the seminal contribution of Aschauer (1989) – who identified an elasticity of output
16 In other words, a one percent increase in public capital stock would lead to about 0.16-0.22 percent increase
in output.

COMPETE Final Report: Impact of transport infrastructure on economic growth - 121 -
with respect to public capital of about 0.35- and with most of the papers that immediately
followed the Aschauer’s study and that in general found very small elasticities or even no
impact of public infrastructure on output (see, for instance, Tatom (1991), Holtz-Eakin (1994)
and Kelejian and Robinson (1997)).
The evidence for the EU seems to provide a similar picture to that we have just briefly
sketched for the US: most studies estimating production functions (or employing the related
total factor productivity regression approach) in fact identify a positive effect of public infra-
structure on output and productivity.
With some notable exceptions (for instance, Sturm and de Haan (1995) and Stephan (2003)
who find elasticities in the range of 0.6-0.8 and 0.38-0.6517
, respectively and Delgado and
Alvarez (2000), Evans and Carras (1994) and a few others studies which reported insignifi-
cant elasticities) the elasticities of output with respect to the stock of public capital tend to
range between 0.10 and 0.20, a far smaller value than the 0.35 originally identified by As-
chauer (1989) and more in line with the findings of Munnell (1990) who found an elasticity
of about 0.15.
For example, Bajo Rubio and Sosvilla-Rivero (1993) estimated a production function using
time series data for the Spanish economy using the Phillips and Hansen procedure and found
an elasticity of output with respect to public capital of about 0.2, depending on the exact
specification of the production function.18
Kamps (2005) followed Aschauer (2000)19
and estimated an endogenous growth model
which allows exploring the non linear link that might exist between economic growth and
infrastructure capital (the non linearity arising from the government financing public capital
through a tax levied on the private sector) and deriving the growth maximising public capital
stock: he found that, for a panel made up of the EU15, the elasticity of output with respect
to public capital was about 0.20, a very similar result from Kamps (2004) who reported an
elasticity of about 0.22 from a production function for a panel of OECD countries.
Picci (1999) estimated a production function for the Italian regions and found, after first dif-
ferencing the variables to take into account possible non stationarity, an elasticity of about
0.18.20
Stephan (2001) estimated a production function for a panel of German and French regions
and found a positive elasticity of about 0.08-0.11.
Similar results have also been identified by Kemmerling and Stephan (2002) who built a po-
litical economy model in which a production function with public capital was estimated to-
gether with two equations explaining the investment decisions by German local authorities
and the allocation of funds from higher tier governments in Germany. Estimating the model
17 This would correspond, in his sample, to a rate of return of about 43-73 per cent and 26-45 per cent, depend-
ing on the output to public capital ratio. 18 They also found that the marginal productivity of public capital was slightly higher than that of private capital
(0.61 versus 0.36, respectively), which they interpreted as a suggestion that even in the presence of a complete crowding out of private capital, private output would still be increased by increasing public capital.
19 Who built on Barro (1990). 20 It is interesting to note that the regressions in levels yield a much higher value (about 0.5).

- 122 - COMPETE Final Report: Impact of transport infrastructure on economic growth
using appropriate econometric techniques, they found that the elasticity of output with re-
spect to public capital was positive and significant.
A similar approach was followed by Cadot et al (1999 and 2004) for a panel of French re-
gions: they in fact estimated a production function together with an equation to explain the
infrastructure investment decisions and found positive and significant elasticities, in the order
of about 0.08 and 0.10.
It is difficult to comment on the overall reliability and “quality” of the results. However, in
general, we might observe that the largest results for the elasticity of output with respect to
private capital could cast some doubts on the overall reliability of the econometric exercise
that produced them. For instance, Sturm and de Haan (1995) observed that their “large”
elasticity of public capital is associated to a really low or even negative elasticity of output
with respect to private capital, a result which is difficult to reconcile with standard economic
theory. In fact, if we make the standard assumptions that private firms combine capital and
labour to maximize profits, we expect, as formally shown, for instance, in standard economic
growth models a la Ramsey that the marginal product of capital will be equal to the real in-
terest rate, which depends, among the other things, on the rate of time preference and the
risk-profile of the investment. A negative of nearly zero elasticity of output with respect to
private capital would therefore be difficult to reconcile with standard economic theory.
In Table 45 we have reported the elasticities of output with respect to private capital, labour
and public capital for some of the studies we have discussed above. It is difficult to identify a
clear pattern between private and public capital elasticities from the results shown in Table
45.
However, the two studies with the highest public capital elasticities tend to find private capi-
tal elasticities which are either negative (Sturm and de Haan, 1995) or substantially lower
than public capital elasticities, while those studies which report the lowest public capital elas-
ticity also find, in general, much higher private capital elasticities21
We noted above that the finding of a negative or nearly zero elasticity of private capital is not
easy to reconcile with neoclassical economic theory. In general, a natural expectation might
be that private capital should command a higher return than public capital, unless there are
serious shortages of public infrastructure in the economy, because it would seem reasonable
to assume that the risk profile of private investments is generally higher than that of public
investment. However, in financial economics it is not risk per se, but systematic risk (i.e. non-
diversifiable risks, arising, for example, because of a correlation between the risks and the
general economic cycle) that is the driver of returns. Following this insight, it might be ex-
pected that, in fact, public infrastructure expenditure returns should be greater than those
from private capital — for example if transport infrastructure using sectors such as freight
tended to produce high returns when the economy in general is doing well but low returns in
recessions, which usually is the case.
21 An exception is Cadot et al (2004) who find a private capital elasticity which is higher than that of public capi-
tal but who also find a perhaps unrealistic elasticity of labour which, according to standard marginal productiv-ity theory, it should reflect the share of labour in total income.

COMPETE Final Report: Impact of transport infrastructure on economic growth - 123 -
Table 45: Elasticities of Output with respect to Public and Private Capital and Labour
Public capital Private capital Labour
Bajo-Rubio and Sosvilla-Rivero (1993)
0.18 0.43 0.39
Sturm and de Haan (1995) 0.63 to 0.80 -0.61to 0.82 0.93 to
Picci (1999) 0.18 to 0.36 0.07 to .17 0.46 to .83
Stephan (20003) 0.38 to 0.65 0.10 to .30 0.26 to .50
Cadot et al (2004) 0.08 0.18 0.77
Kemmerling and Stephen (2002)
0.17 0.57 0.32
Percoco (2004) 0.14 to 0.18 0.16 to 0.28 0.62 to 0.72
Delgado and Alvarez (1999)
-0.03 0.63 0.25
A careful analysis of both the theoretical and empirical literature seems to suggest that the
relationship between public capital and production might be too complex to be tackled from
the oversimplified perspective of the production function approach.
The cost function approach –based on a behavioural model of production which permits the
identification of the direct and indirect effects that public infrastructure might have on the
cost structure and productivity growth of the private sector- as well as studies that adopt a
more “structural” approach (whereby infrastructure effects are incorporated into more gen-
eral models of the economy) seem to back the theoretical insights that public capital and
transport infrastructure might have a beneficial effect in fostering economic growth and the
level of output.
However, they also seem to suggest that the returns of public infrastructure are positive, but
somewhat lower than those identified by production function studies.
For instance, the US evidence (see e.g. Morrison et al (1996), Nadiri et al (1998), Cohen et al.
(2003a and 2003b)) seems to suggest that public infrastructure tends to reduce private sector
production costs and that the returns to public infrastructure are in general positive.
The empirical studies based on EU samples which adopted the cost function approach display
some variability, with some which find elasticities very close to zero (see, for instance, Mo-
reno et al. (2003) and Bosca et al. (2002) and La Ferrara and Marcellino (2000)), with other
studies finding elasticities in the order of about -0.05/-0.1 (which means that an increase of 1
per cent in the capital stock would lead, on average, to a reduction of private costs in the
order of 0.05-0.1 per cent), such as Zugasti et al. (2003) or Canaleta et al. (1998) and Rovolis
and Spence (2002) and, finally, a minority finding cost elasticities of about 0.20, such as Seitz
and Licht (1995).

- 124 - COMPETE Final Report: Impact of transport infrastructure on economic growth
Even if it is difficult to find a consistent pattern across studies, it seems fair to conclude that,
with some notable exceptions, there is evidence that, for the EU, cost function based studies
seem to identify quite small elasticities of cost with respect to public capital. Although the
elasticities as well as the returns identified in cost function studies are not directly comparable
to these derived using a production function approach there seems to be some evidence that
the former tend to be fairly smaller than the latter.
Furthermore, cost function studies show that aggregate results often exhibit considerable
variability across regions and across sectors, although a consistent pattern does not seem to
have emerged yet: for instance, it is not clear whether more developed regions are more
likely, on average, to gain from public capital or whether a particular sector is likely to benefit
more from public infrastructure than others. A robust answer to this issue would require per-
haps better information on the stock of public infrastructure than is provided by the use of
monetary values: for instance, virtually all the studies are silent on very relevant issues such as
the quality of the infrastructure stock, or the levels of congestion.
The other main approach that we have identified in the literature review, namely the Vector
Auto Regression (VAR) models, tends to provide a broadly similar picture for both the US and
the EU, with public capital displaying small albeit positive effects on output.
The literature review reported in COMPETE Annex 6 and that we have briefly summarised
here seems to suggest that public infrastructure capital tends to display positive effects on
private output and production costs.
However, in our view, a precise quantification of the effects of public infrastructure on out-
put and economic and productivity growth is difficult to make, for a series of reasons.
First of all, some studies (see, for instance, Canaleta et al. (1998), Pereira and Roca (1999)
and Zugasti et al. (2001) in the case of Spain or Mamatzakis (1999) in the case of Greece)
have suggested that there is significant variability of infrastructure returns and elasticities
across regions and sectors and that it is extremely difficult to rationalise this variability: in
other words, there is not consistent evidence suggesting that some sectors or regions are
more likely to gain (or to loose) more than others.
Second, there is fairly robust empirical evidence that seems to support the insights offered by
the theoretical literature that public infrastructure might have non-linear effects on the level
of economic activity and growth: this is often picked up in cost and production function stud-
ies by positive -but declining over time- returns to public capital and transportation infrastruc-
ture.
Furthermore, the role that quality and network aspects of transport infrastructure (as well as
congestion effects) might play in “driving” the overall effect of public infrastructure on out-
put, even if quite clear from a theoretical perspective, have not yet been investigated in much
depth in the empirical literature.
Having said that, our conclusion is that the evidence of small albeit positive benefits -in terms
of higher output and economic growth stemming from public capital and, especially, from
transport infrastructure - seems to find a broad support in the empirical literature. (Note that
this differs from the conclusions of the earlier literature, e.g. Gramlich (1994) or Sturm and
de Haan (1998))

COMPETE Final Report: Impact of transport infrastructure on economic growth - 125 -
There are some further qualifications.
The first is that there is some evidence suggesting that empirical studies that have used sam-
ples at regional level have identified lower impacts of public and transport infrastructure on
economic growth than studies based on aggregate national data, the reason being that the
former neglect the spill over effects of public infrastructure across regions.
This could be one of the possible explanations for the lower estimates that are generally
found in the cost function approach, which relied almost exclusively on regional level data,
with respect to the time series studies which adopted a production function approach. Some
studies (e.g. Cohen et al, 2003a, 2003b) have indeed identified the existence of spill over
effects of transport infrastructure and have concluded that neglecting them would lead to
underestimating the overall impact of transport infrastructure on private sector costs and
productivity.
In second place, while many studies have reported rates of returns from public infrastructure
investment, very few have actually compared them with the costs incurred by the govern-
ments (one notable exception being Morrison et al. (1996)). In other words, it should be re-
marked that even if a positive rate of return is a necessary condition for public infrastructure
investment to be “productive”, it is not a sufficient condition for it to be also worthwhile.
In fact, it would first be necessary to compute a user cost of public funds which should con-
sider depreciation, the opportunity costs and the marginal cost of public funds: if the user
cost were higher than the rate of return, then public infrastructure investment would be con-
suming more resources than it would be generating. 22
Finally, it should be observed that, even if the return of transport infrastructure were higher
than its user cost, it would not necessarily follow that the government should invest in trans-
port infrastructure. Given limited resources, the government might well decide to invest in
other kinds of public investments. Put it simply, the gross rate of return of transport infra-
structure should be compared to that of other types of public investment expenditures.
Unfortunately, the empirical literature that we have reviewed is not very helpful on this.
There is some evidence that core infrastructure (which is closely related to the concept of
transport infrastructure) seems to generate higher returns than other forms of public infra-
structure, such as offices and buildings. However, there does not seem to be, to the best of
our knowledge, any robust theoretical and empirical attempt to compare returns to transport
infrastructure to these of other non infrastructure public investments, such as public expendi-
ture in education, R&D or health care.
6.2 The impact of infrastructure policy in the EU and the US
6.2.1 Introduction
Developing on the foundation given by the theoretical models presented in the literature
review and in order to analyse the impact of transport infrastructure on growth in the EU and
22 We can note that the few studies that have compared the return of public infrastructure with its cost have
generally found that the rates of return were actually higher than the user cost, even if the difference was fal-ling over time.

- 126 - COMPETE Final Report: Impact of transport infrastructure on economic growth
US economies, we present here the results of simulations of two growth models dealing with
transport infrastructure. Two different approaches to modelling the effect of transport infra-
structure on growth will be used.
The first approach assumes that transport infrastructure has two purposes: a) improving the
productivity of labour and therefore making the economy more productive and; b) making it
easier for people to spend time in leisure activities by reducing the travel time from individu-
als’ residences to leisure locations. The second approach has been derived by the analysis of
Barro and Sala i Martin (1992 and 2004) that take into account the fact that transport infra-
structure (as many other publicly-provided services) is subject to congestion, i.e. for a given
quantity of infrastructure the quantity available to a single individual declines as other indi-
viduals use the facility.
The two approaches attempt to analyse two different aspects of the effects of transport in-
frastructure on economic growth: the first focuses on the effects of infrastructure on labour
supply (via its influence on leisure) and given the particular form of the production function
will not be capable of generating positive growth rates in the long run. It will therefore be
used mainly to analyse what the transitional dynamics towards the balanced growth path
look like according to different values of the parameters. The second will be capable of gen-
erating positive growth rates even in the long run. Although the model will not be capable of
giving a deep understanding of the effects of congestion on productivity, given its level of
aggregation, it will be useful to understand some of the perverse effects that congestion can
have on the production process. For brevity we label the two different approaches as leisure
and BSIM respectively.
As in all models the results would depend on the approach chosen, on the particular form of
the functions used as well as on the assumption on the magnitude of the parameters. There-
fore it is difficult to draw general conclusions based only on a few models. However we be-
lieve that they do provide interesting insights on the likely effects of transport infrastructure
on economic growth.
6.2.2 The results of the simulated models
6.2.2.1 Main features and parameters of the two models
In this section of the report we will present the main results of the simulations of the two
modelling approaches that we described above. Table 46 presents the basic equations for the
two models. The analytical results of the model along with a more detailed description of
how the models are developed can be found in the COMPETE Annex 6. The production
function describes how output (Y) is produced using the available capital stock (K), the
amount of time spent in labour (L), the number of workers (N)23, the stock of transport infra-
structure (TI), the amount of transport costs (T) and a technological parameter (A). In the first
model the amount of transport infrastructure influences total output reducing transport
costs, as described by the last set of equations.
23 We will assume that total number of workers is normalized to unity so that all variables can be thought as per-
capita values.

COMPETE Final Report: Impact of transport infrastructure on economic growth - 127 -
The utility function describes how economic agents derive their utility from consumption (C)
and leisure (1-L) i.e. the share of time spent in non-working activities. In the BSIM model
agents only derive utility from consumption so there is no possibility of choosing between
work and leisure. The capital and infrastructure accumulation functions state that the varia-
tion in capital and infrastructure from one period to another (indicated by a dot over the
variables) is given by the amount of investment (I and IT respectively) minus the share of the stock that depreciates over time ( 1δ and 2δ ). Finally, the allocation function states that out-
put can be consumed, invested in capital or invested in transport infrastructure.
Given the level of aggregation of the model and our interest in the effects of transport infra-
structure our definition of the initial value of the variables is slightly different from the stan-
dard of economics textbooks. Capital is defined as the sum of private and public capital mi-
nus transport infrastructure capital. Therefore it includes public infrastructures that are not
related to transport (e.g. hospitals) as well as private capital. The detailed procedure to calcu-
late the initial value of transport infrastructure is described in COMPETE Annex 6
Consumption is the sum of private and public consumption and transport infrastructure is the
value of infrastructure capital.
Table 46: Basic equations for the model with leisure (leisure) and the model of Barro and Sala I Martin (BSIM)
Leisure BSIM
Production func-tion
[ ] bb LNTAKY −−= 1)1( α
⎟⎠⎞
⎜⎝⎛=
YTIAKY
Utility function ( )
γτϑ
γ
−−−
+=−−
1)]1)(1[()ln()1(,
1LCLCu η
η
−−
=−
11)(
1CCu
Capital accumula-tion
KIK 1δ−=& KIK 1δ−=&
Infrastructure ac-cumulation
TIITIT 2δ−=& TIITIT 2δ−=&
Allocation function ITICY ++= ITICY ++=
Effects of infra-structure
φ−= TIT ; ψτ −= TI -
Table 47 reports the values of some of the most important parameters and initial values for
both the EU15 and the US economies. COMPETE Annex 6 describes in detail under what
assumption and how these values can be obtained. Per capita transport infrastructure is
higher in the US than in the EU15, since we do not have separate data on the time wasted
due to the presence of transport costs this automatically implies that the elasticity of trans-
port costs with respect to the level of transport infrastructure in the US will be lower than in
the EU15.

- 128 - COMPETE Final Report: Impact of transport infrastructure on economic growth
While the procedure used for the calibration of all the parameters and the initial values will
be discussed in the Annex 6 we shall mention here how we have calibrated the novel pa-
rameters in the two models, i.e. Φ, Ψ and α, and under what assumptions. The first two rep-
resent the elasticity of transport costs (respectively in the production and utility function) with
respect to transport infrastructure. The last (which is assumed to be smaller than unity)
measures the relative weight of the effect of transport infrastructure per unit of output on
total output relative to the effect of the capital stock. Given that in the production function L
represents the share of time that individuals spend working and in the utility function (1-L)
the share of time spent in leisure activities24 it is possible to interpret T and τ as the amount
of time that is lost due to the presence of transport costs25.
Table 47: Transport-related parameters and initial values. EU15 and USA
TI IT δ2 Φ ψ α
EU15 7.72 0.73 0.05 0.93 0.93 0.1
USA 11.03 1.04 0.05 0.79 0.79 0.1
The effects of transport costs on leisure τ are analogous, but not exactly equal, to those on
labour productivity in the production function. We believe that it is useful to think of trans-
port costs as a factor that reduces the time available to be spent in leisure activities. We could
think of many examples of transport costs influencing leisure activities: an inefficient airport
that retards the departure for a week-end, the absence of motorways to reach a village in the
countryside, the lack of train connections that makes it difficult to reach a ski resort and so
on. We can use the equations in the two models to describe the procedure to derive the
values of the parameters Φ, Ψ and α. Starting from the production function of the leisure
model it is possible to calculate the elasticity of output with respect to transport infrastruc-
ture as:
1)1()1( −−− −−= φφφ TITIbTIdTIYdY
We know the initial value of the transport infrastructure from previous calibration. Thus two
unknowns remain in the equation: the first is Ф and the second is the value of the elasticity
itself. We now have two alternative ways to estimate the value of Ф. The first possibility is to
plug a value of the elasticity into the equation and solve the equation numerically for Ф. In
COMPETE Annex 6 we show that econometric estimates of TI
dTIY
dy
are around the value of 0.1
so that such a calculation is feasible. The second possibility stems from the interpretation that
24 We are assuming that the total amount of time that an individual can use is normalised to unity. 25 For practical purposes we can think of T as a combination of two different parts i.e. the share of the workforce
employed in the transport sector that could be employed in other activities and the share of commuting time that is necessary to go to and come back from the workplace. The former component recognizes that the workers employed in the transport sector could be working in different sectors and therefore producing more consumption goods while the latter component simply states that the time spent commuting between the workplace and people’s residences could be used in productive activities so that the overall productivity of the economy is reduced.

COMPETE Final Report: Impact of transport infrastructure on economic growth - 129 -
we suggested for transport costs as time subtracted from other productive activities. Once
we have an estimate of this value we can simplify the equation and calculate Ф. We decided
to exploit both these possibilities and used a two step iterative procedure to get a value for Ф.
The first step estimates Ф using a value of the elasticity as close as possible to 0.1. We then
use this estimate coupled with an estimate for the amount of time lost due to transport (that
can be calculated via the formula φ−TI ) and calculate the implied value Ф from the second
possibility. We iterate this process modifying the elasticity so that the two estimates of Ф con-
verge26,27. The assumption that all time spent commuting could be used for productive activ-
ity may be criticized as it contradicts the evidence that in general it is taken from leisure, in-
creasing the disutility of working and taking people out from the workforce. However trans-
port infrastructure also affects leisure through the parameter Ψ. We believe that a large
commuting time makes an economy less productive and therefore has effect on production.
It would be wrong to assume that an improvement in the transport infrastructure of an
economy would only increase the share of time spent in non-working activities. It will affect
both production and leisure activities.
Using the production function of the BSIM model it is possible to get an estimate of the value
of α in a way that is analogous to the procedure we used to calculate Ф. To do this we calcu-
late the elasticity of output with respect to transport infrastructure as:
αα
αα
+=⎟
⎠⎞
⎜⎝⎛
+=
−
11
1
YTI
YTI
TIdTIYdY
We can therefore calculate α and get the calibrated parameter as 0.1. Φ, Ψ and α are the most
important parameters since they determine the effect of transport infrastructure on output
and utility in the different models.
6.2.2.2 The leisure model
In this section we report the main results of the simulations of the leisure model for both the
EU15 and the US economy. Before we turn to discussing the results it is worth spending a
few words on a simple use of the leisure model using the elasticity equation of the previous
paragraph. The equation that we used to get an estimate of Ф can also be used to get an
estimate of the elasticity of output with respect of transport infrastructure. While in the pre-
vious paragraph we assumed to know the value of the elasticity (from econometric estimates)
and the value of TI to get an estimate of Ф we can assume to have an estimate of the time
wasted due to the presence of transport costs and get a value for the elasticity. We can write
the simple equation: )1()1( TTbTIdTIYdY
−−= φ and use the calibrated values of the parameters
to get an estimate of the elasticity. This procedure seems to support estimates towards (or
26 See the appendix for the other assumptions that need to be made for this process to be feasible. 27 From a purely theoretical point of view this procedure could be replicated to get an estimate of ψ using the
elasticity of utility with respect to transport. Unfortunately there is no easy way to get an econometric estimate of the utility since it is not directly measurable. We are therefore forced to assume that the value of the two parameters is the same. This is equivalent to assuming that, for a given level of transport infrastructure, the same percentage of leisure as work is lost. In the simulations however we analyze the effects of changes in ψ on growth.

- 130 - COMPETE Final Report: Impact of transport infrastructure on economic growth
even below) the lower end of the econometric estimates of this variable — around 0.1. Our
result is derived using an estimate of about 13% for the amount of total labour time in the
economy used in transport costs28.
From a comparison of the results for the US and the EU, it is clear that the model predicts
(unsurprisingly) very similar patterns for the US and the EU15.29 However, the differences in
the level of the variables that are present at the initial point grow at the end of the simula-
tion. The US has a higher level of output, consumption, capital stock and transport infrastruc-
ture. The result that there is no catching-up is a positive feature of the model: even now
growth seems more robust in the US and it is unlikely that this trend will be reversed soon for
the EU15. The difference in levels of consumption, capital, infrastructure and output are per-
sistent, however their magnitude seem too high given that in forty years the US economy
should be twice the size (in per capita terms) the EU15 economy. Another interesting charac-
teristic of the model is that it predicts a constantly decreasing labour effort apart from the
very first periods. A reduction of the time dedicated to work activities is a well known empiri-
cal regularity. The initial increase in labour effort might be due to a wrong estimation of the
weight that agents give to leisure or to a wrong calibration of the initial value of this variable.
It is also positive, since it is a well known empirical regularity that labour effort in the EU15 is
constantly below the US level.
An interesting point to be analyzed is the composition of the economies simulated by the
model. The initial values that we calibrated are roughly 82% for consumption, 17% for in-
vestments and 1% for investment in transport infrastructure for both the US and the EU15
economies. The values of these variables in the quasi-equilibrium of the last periods are again
very similar for both economies but significantly different from the initial values. Consump-
tion represents roughly 68% of total product while the two kinds of investment are respec-
tively 29% and 3%. The highest increase in both cases is therefore represented by the
amount invested in transport infrastructure that triples its share.
Given the focus of this study we are interested in the effects of the modifications of the pa-
rameters related to transport infrastructure. There are two parameters that are related to
transport infrastructure that we modified: the first one is its depreciation rate (that we as-
sumed equal to the depreciation rate of capital) and the second the elasticity of transport
costs in the utility function that we assumed equal to the elasticity in the production func-tion. With regards to the depreciation rate we ran a simulation where 2δ equals 0.021 (so
that after thirty years the value of transport infrastructure would be 1/1000 of the initial
value) while all other parameters are unchanged. Both in the EU and the US the effects on
the performance of the system are minimal: only minor changes to output and consumption
growth take place. However, effects on consumption are positive while on output negative.
Gross investment in transport infrastructure declines since the share of infrastructure that
needs to be replaced due to depreciation is lower; however there are no particular differ-
ences in net investments. Therefore the share of output allocated to investment in transport
declines while both consumption and investment in capital rise.
28 Backed by the data presented in the COMPETE Annex 6. 29 Refer to COMPETE Annex 6 for graphs that compare the results.

COMPETE Final Report: Impact of transport infrastructure on economic growth - 131 -
While we have empirical reasons to believe that the rate of depreciation 2δ is roughly equal
to 0.021 we cannot rely on estimates to have alternative values of Ψ. We have therefore
been forced to carry out a purely speculative analysis. We ran two simulations: the first with a
value of Ψ which is twice as much as the value of Φ; the second with Ψ half the value of Φ.
In the first scenario then a 1% increase in the transport infrastructure would reduce the time
wasted due to the presence of transport costs in leisure activities by a double amount with
respect to the reduction that it would have in production activity. In the second scenario the
effectiveness of transport infrastructure in the reduction of costs would be double in the pro-
duction activities. In the first scenario output and consumption growth would decline. What
drives the result is the fact that leisure activities become much less costly in terms of time
wasted and therefore economic agents substitute consumption for leisure given that trans-
port infrastructure is growing. Furthermore, given the specific form of the production func-
tion the gap in the effects on transport costs is increasing in the value of transport infrastruc-
ture so that transport costs are less pervasive in leisure activities as times passes. An opposite
result emerges when we run the second scenario with output and growth growing sharply.
Labour effort is at a higher level than in other scenarios. Leisure activities are very expensive
due to the presence of very high transport costs since the increase in transport infrastructure
is not effective enough in reducing costs.
One issue of interest concerns the effects of changes in transport infrastructure (stock or in-
vestment): Is the amount of infrastructure in the EU15 optimal, i.e. the one that maximizes
growth and total welfare? The answer to this question would obviously have potential policy
implications.30 To address this, we modified the initial value of transport infrastructure and
analysed the effects on growth and welfare. As we know that many parameters depend on
the value of TI, we re-calibrated the model according to fictitious values of initial transport
infrastructure and tested whether the highest growth rates for output and consumption are
obtained for the current level of infrastructure. The results of the simulations in this case sug-
gest that there is no evidence of a large gap in transport infrastructure in the EU15 or in the
US if the objective is to maximize consumption and output growth. By changing the value of
initial transport infrastructure (and all the parameters that depend on it) in the EU15 it is not
possible to get higher growth for consumption and output, while in the US a 10% increase
in initial infrastructure would lead to higher growth. The latter result is surprising given that
the per capita stock in the US is higher than in Europe, however it is likely that the non-
linearities in the production and utility function are driving the result.
As a further check we also analyzed the effects of changes in the initial transport infrastruc-
ture on welfare, i.e. on the sum of utilities of economic agents. We ran a number of simula-
tions and checked the relationship between these two variables. At very low levels of initial TI
there is a positive effect on total welfare of increases in the stock. At lower levels of transport
infrastructure there is a positive and significant effect on welfare, however at current levels of
infrastructure the effects are minimal. Thus, although the model does predict that higher
welfare would be achieved at higher transport infrastructure levels, uncertainties associated
30 We note again that if a level of initial transport infrastructure, higher than that currently in the EU15, is opti-
mal, one direct implication is that the marginal benefit of additional transport infrastructure expenditure ex-ceeds the cost of funds.

- 132 - COMPETE Final Report: Impact of transport infrastructure on economic growth
with the many approximations of the model due to the presence of parameters, initial values
and numerical rounding (illustrated in Figure 24) our view is that this result does not support
the conclusion that there is currently any material under-provision of transport infrastructure
in the EU15.
- 1 0 0 % 0 % 1 0 0 % 2 0 0 % 3 0 0 % 4 0 0 % 5 0 0 %
% c h a n g e i n p a r a m e t e r
Wel
fare
T IΦΨδ 2
Figure 24: Welfare Effects of changes in parameters
6.2.2.3 The BSIM model
The peculiar characteristic of the BSIM model is that it can take into account congestion ef-
fects31. However since total output depends on its own value, this creates problems in the
numerical calculation that lead to instability in the results, and small changes in the value of
the parameters have a big impact on the path that the economy follows. Therefore we use
this model only to illustrate that congestion could, in principle, have detrimental effects on
growth but it is impossible for such a model to be used for policy recommendations. The
main analytical result of the model is that the market outcome can be inefficient from a wel-
fare perspective: single agents have the incentive to use the infrastructure more than its op-
timal level as they do not take into account the negative congestion effect. An advantage of
the BSIM over the leisure model is that, given the particular form of the production function
it can provide constant and positive growth rates on the balanced growth path. The results of
the model confirm the better performance of the US economy with respect to the EU15.
However, predicted growth rates are unreasonably high (23% and 11% per period respec-
tively) notwithstanding the fact that we have increased the discount rate sensibly. According
to the measure of congestion that Barro and Sala i Martin use, i.e. the share of infrastructure
over output, the EU15 is more congested than the USA, both at the beginning of the period
31 See the appendix for a discussion of the analytical characteristics of the BSIM model and for a discussion of its
features.

COMPETE Final Report: Impact of transport infrastructure on economic growth - 133 -
(0.15 and 0.14 respectively) and on the balanced growth path, where the difference be-
comes even larger (0.27 and 0.19 respectively). The difference in congestion is clearly one
factor that drives the higher growth of the American economy.
Barro and Sala I Martin (1992 and 2004) model congestion in a particular way, i.e. the ratio
between transport infrastructure32 and output. In the general presentation of their research they assume a general functional form such as )( Y
Gf where G is the amount of public
spending in the economy. They assume that f has a positive first derivative and a negative
second derivative. What these assumptions mean is simply that an increase of G with respect
to Y increases total output but the amount of the increase tends to zero as G grows. An in-
crease in G therefore implies an increase in total output, but an increase in total output also
implies a more congested economy and a subsequent decrease in total output. It is therefore
difficult to simulate numerically a model of this kind as the variable Y depends on its own
value. In a number of alternative simulations that we tried a number of non-linearities with a
high variability of the rates of growth emerged. It can be proved33 that the optimal ratio G/Y
in this model must satisfy the condition )/(1
1)/()/('
YGYGfYGf
−= . With the Cobb Douglas
functional form that we used in the numerical simulations, that is equivalent to what Barro
and Sala I Martin have used in their 1992 paper, the condition becomes:
)/(111
YGYG
−=⎟
⎠⎞
⎜⎝⎛
−
α 34. This ratio is the one that maximises overall growth. There are three
solutions to this equation, namely 1
)/(+
=ααYG and ±∞=)/( YG . Therefore it is optimal
either to have a low share35 of public capital (or transport infrastructure in our case) or to
have an infinitely high level of infrastructure. In the first case transport infrastructure would
be highly congested but the marginal product of infrastructure would be high. In the second
case the marginal product would be negligible but there would be no congestion. Of course
the only value that is economically significant is the first one as it can be calibrated. It might
naturally be assumed that an initial value of transport infrastructure that satisfied this condi-
tion would maximise growth and welfare. Unfortunately when such a value is used the sys-
tem cannot reach a steady state.
6.3 Conclusions
The main results of this section can be summarized as:
The existence of small albeit positive benefits - in terms of higher output and economic
growth - stemming from public capital and, especially, from transport infrastructure-seems to
32 They think that also other publicly provided goods such as water systems, police and fire services and courts
are subject to congestion, therefore they use G to define public expenditure as a whole. 33 See Barro and Sala I Martin (2004) p. 225 for details.
34 Starting from α)/()/( YGYGf = we get
1)/()/(' −= αα YGYGf and therefore
11
)/()/()/(
)/()/(' −
−
== YGYGYG
YGfYGf αα
α
α
35 The value of G with the parameters calibrated in our EU15 and US model is 0.1.

- 134 - COMPETE Final Report: Impact of transport infrastructure on economic growth
find a broad support in the empirical literature, unlike what earlier literature reviews e.g.
Gramlich (1994) or Sturm and de Haan (1998) seemed to suggest.
Production function studies seem to identify elasticities of output with respect to public capi-
tal of about 0.10-0.20, while cost function-based studies seem to identify somewhat smaller
effects.
The literature review has identified the existence of variability in the effects of public infra-
structure on private output and costs across regions and sectors.
A few studies have also identified the existence of important spillover effects, although the
research in this area still seems to be at an early stage of development.
The leisure model predicts well the reduction of time spent in working activities as well as the
relative position of the EU15 with respect to the US.
The model works well also in showing no catching up of the EU15 towards the US levels.
Growth seems more robust in the US and it is unlikely that this trend will be reversed soon.
However, the difference in growth seems too high as it implies that the US economy should
be twice the size (in per capita terms) of the EU15 in forty years.
The leisure model supports estimates towards (or even below) the lower end of the econo-
metric estimates of the elasticity of output with respect to transport infrastructure — around
0.1. Our result is derived using an estimate of about 13% for the amount of total labour time
in the economy used in transport costs.
The model suggests that there is no evidence of a lack of transport infrastructure in the
EU15. An increase in the value of this parameter would not lead to any significant effect on
growth or welfare. However, this result is obtained using national aggregates without any
regional differentiation e.g. in urban areas and rural areas. Such a differentiation seems to be
reasonable as the congestion analysis (see Section 3.3) revealed that congestion is mainly a
problem of large urban areas in Europe.

COMPETE Final Report: Developments of productivity in the transport sector - 135 -
7 Developments of productivity in the transport sector
7.1 Background of the economic analysis
The transport sector is an important contributor to value added. In 2003 the contribution of
EU transport total value added ranged from about 2.2 per cent in Ireland to 7.2 per cent in
Finland. The figures are similar for the new member states of Czech Republic, Hungary and
Poland. Across the EU, transport services contribute to about 4.3 per cent of total value
added, while in the US the contribution is slightly lower, at about 3 per cent.
The importance of the transport sector for the efficient functioning of the wider economy
should not be undervalued, given that the transport sector operates the networks over which
goods are delivered and people can travel. Better functioning transport sectors might in fact
stimulate long run output growth in the economy by allowing for an increase in market size,
which in turn might make it easier for private firms to exploit scale economies and specialisa-
tion and the creation of industrial clusters and agglomeration economies (see section 6.1.)
Differences in the relative productivities of the transport sectors and/or the different dynamics
in the patterns of transport productivity growth might have a role to play in explaining differ-
ent growth patterns across countries.
It is therefore important to evaluate the productivity levels and growth rates in the transport
sectors of the EU countries, as well as to compare the overall EU situation with that of the
US.
One of the aims of this section of the COMPETE report is precisely to analyse and discuss
such evidence.
In section 7.2 we will use the available empirical evidence as well as our own estimates to
discuss the productivity levels as well as growth rates in the transport sectors of the EU coun-
tries and the US. Given data availability problems, the analysis will be mainly centred on la-
bour productivity, rather than on the more theoretically robust total factor productivity. One
of the main results of our analysis is that the EU has experienced higher rates of labour pro-
ductivity growth over the 1979-2002 period than the US and that, from the second half of
the 1980s onwards, the level of labour productivity in the EU transport sector has been con-
sistently higher than in the US.
However, it should be recognised the higher labour productivity in the EU might be due to
higher capital investment, rather than by inherently higher efficiency in the production proc-
ess. The evidence which we report for the transport and communication sector confirms in
part this analysis, which shows that, in terms of total factor productivity levels, the US consis-
tently had one of the three most productive transport and communication sectors in the
group of EU15 plus US in terms of total factor productivity.
The second goal of this section is to analyse the impact that selected transport policies had
on productivity growth in the transport sector. The transport sector productivity growth
might be in fact explained by congestion problems and associated policies, infrastructure and
liberalisation policies, R&D expenditure and so forth. In section 7.3 we will seek to use

- 136 - COMPETE Final Report: Developments of productivity in the transport sector
econometric analysis to evaluate the impact that some policies might have had in the past in
stimulating productivity growth in the EU (and US) transport sectors.
In section 7.4 we will instead present some additional evidence on the importance of the
transport sector for the total economy in the EU countries, by computing the indirect em-
ployment effects of the transport sector, i.e. the number of jobs created by the transport
sector in the wider economy, using standard input-output analysis.
7.2 Productivity of transport in the EU and the US
The main aim of section 7.2 is to provide the reader with a background of the developments
of productivity levels and productivity growth in the transport sectors of the EU member
states and the US.
For reasons related to data availability, productivity will be mainly analysed in terms of labour
productivity, which in this report has been defined as value added divided by the number of
hours worked. In particular, we will analyse the behaviour of labour productivity growth
rates (section 7.2.1), as well as the evidence related to labour productivity levels (section
7.2.2) in the transport sector. In section 7.2.3 we will repeat the analysis at a finer level of
disaggregation, discussing the evidence on labour productivity growth and levels in four
transport sub-sectors: water, land, air and support transport. Finally, section 7.2.4 will pro-
vide some evidence related to total factor productivity growth rate which avoids the major
shortcoming of using labour productivity to compare the relative “competitiveness” of differ-
ent sectors at a single point in time or the behaviour of a sector through time, namely the
fact that labour productivity might increase (or it may be higher in a country with respect to
others) just because of capital accumulation, rather than because of inherently more ad-
vanced technology, higher managerial skills and so forth.36
7.2.1 Labour productivity growth rates
Below we present selected average LP growth rates for the EU15 member states and selected
new member states within the total transport sector.
It is noticeable that the average rate of LP growth differs significantly between the periods
1979-1990 and 1990-2003. These differences are also between countries which one might
expect to exhibit similar behaviour, for example Luxembourg and Belgium. However, one
should be aware that differences may refer to underlying structural differences between
countries and between transport sub-sectors. For example, labour market conditions, the
size of the labour force involved in the activity, and demand patterns might all be used to
explain why apparently similarly sized countries exhibit fluctuations in LP growth. Further,
countries might show different levels of resilience in LP growth to common external shocks –
or these shocks might not be common at all.
36 In this work we have broadly followed the same methodology as deployed by O’Mahony and van Ark (eds.) in
EU Productivity and Competitiveness: an industry perspective – can Europe resume the catching-up process?. Further details of our methodological and full data results can be found in Annex 7.

COMPETE Final Report: Developments of productivity in the transport sector - 137 -
In the latter period, for most countries, LP growth declines (though remaining positive). This
may because “easy” gains in LP were made during the 1980s (perhaps through more hours
worked on labour market deregulation), and subsequent gains are harder to make. The ex-
ceptions are Germany, Italy and Greece. In the case of Ireland the drop is steep from 8.8 per
cent during 1979-1990 to 2.3 per cent in 1990-2003.
Over the entire period, all EU15 countries exhibit positive LP growth. Most countries’ overall
growth rate does not deviate far from the mean average of 2.84 per cent. Outliers include
Luxembourg (which consistently experiences high LP growth rates) and Greece. The large
deviation from Greece may be a reflection of joining the EU and rapid catching-up (see the
econometric results discussed in COMPETE Annex 7).
The three new Member State countries have experiences of both positive and negative LP
growth. In the case of Poland, since 1996 LP has been continuously rising, with an overall
compounded rate of 5.33 per cent. There has been more fluctuation in the cases of the
Czech Republic and Hungary and this is reflected in lower overall growth. Indeed, on aver-
age, the Czech Republic experienced falls in LP. The divergence in LP growth trends both
inter-country and intra-country in the new Member State countries is perhaps not surprising,
given the huge structural changes made to their economies during this period. One might
expect, that the immediate reaction to market liberalisation is for LP rates to fall temporarily,
then rise consistently. The fact that Hungary and Poland both demonstrate overall positive LP
growth suggests this line of argument might be relevant. The negative LP growth rate re-
corded in the Czech Republic may be evidence of country specific shocks.
The figures mask considerable variation in year-by-year LP growth rates. For example, in
2000, at the height of the technology boom one might expect that most countries receive a
positive labour productivity shock. This is indeed the case for some countries such as Den-
mark and Portugal, which record growth rates of 8.96 per cent and 9.43 per cent respec-
tively. The biggest growth comes in Greece at 20.90 per cent. However, there remain some
member states that record negative growth rates, namely: France, Ireland, Sweden and the
UK. This might because these four countries already had a high utilisation of IT by workers,
so there was less productivity to be gained.

- 138 - COMPETE Final Report: Developments of productivity in the transport sector
Table 48 Compounded LP growth for EU15 and new member states and US in the transport sector, 1979 - 2003
Member State 1979-2003 1979-1990 1990-2003
Austria 2.15% 3.17% 1.46%
Belgium 2.00% 3.42% 0.98%
Denmark 2.99% 4.35% 2.09%
Finland 2.41% 2.60% 2.44%
France 2.08% 3.25% 1.27%
Germany 2.73% 1.94% 3.62%
Greece 5.23% 4.06% 6.05%
Ireland 1.34% 8.83% 2.26%
Italy 2.18% 1.25% 1.52%
Luxembourg 6.74% 6.80% 7.22%
Netherlands 1.82% 2.09% 1.73%
Portugal 3.74% 4.28% 2.55%
Spain 2.25% 3.32% 1.52%
Sweden 2.20% 4.28% 3.58%
UK 2.68% 3.73% 2.01%
Czech Republic* - - -2.36%
Hungary* - - 1.85%
Poland* - - 5.33%
US 1.42% 1.51% 1.59%
* For the new member states, the first year of calculated LP is 1996. Source: Europe Economics calculations.
The graph below compares LP growth rates between the EU15 and the US.
-6.00%
-4.00%
-2.00%
0.00%
2.00%
4.00%
6.00%
8.00%
10.00%
12.00%
1980
1982
1984
1986
1988
1990
1992
1994
1996
1998
2000
2002
EU15 USA
Figure 25: LP growth compared in EU15 and US: 1980 – 2003 (complete transport sector)

COMPETE Final Report: Developments of productivity in the transport sector - 139 -
What the graph shows is that the US has experienced somewhat greater LP growth rate fluc-
tuations, especially in the early 1980s. Unlike the EU15, in some years, LP actually declined in
the USA, albeit only slightly in the years 1997 and 1998. In contrast, the EU15 consistently
enjoys positive LP growth.37 However, from the above graph, one cannot conclusively say
that the EU15 has a higher level of LP than the US – instead it has a higher LP growth rate,
which might be evidence of catching up to the US’s higher starting point.
7.2.2 Labour productivity levels
A further interesting point of comparison between countries and between the EU15 and the
US is that of LP levels. By estimating levels one can make statements as to whether particular
countries are more productive than others. Table 49 sets out a comparison of transport sec-
tor productivity levels. Here it is given in € per hour – that is to say, the value added in Euros
for each hour of work. The conversion rates for non-Euro countries are taken from the IMF’s
International Financial Statistics, using an average for 1995.38
If one begins by looking at the end of the period, one can see that there remains a large dis-
parity in the levels of LP in EU15 countries. The highest levels can be found in Luxembourg,
Italy, Sweden, Denmark, Finland, the Netherlands and Belgium at over €30 per hour. In con-
trast, Greece only has an LP of about €11 an hour. These figures intuitively correspond to the
states of the respective economies at the time. One is not surprised to see low levels of pro-
ductivity in the UK in 1980 given its economic situation at the time.
What is also interesting to investigate are the levels at which each country started and ended.
A number of countries that began the period with the highest levels of LP also end the period
with highest levels of LP. The most conspicuous exception is Luxembourg, which in 1980
had an LP of about €9 per hour but by 2003 had reached €47 – the highest in any country.
This would seem to indicate that, in general, the countries with the highest LP levels at the
beginning of the period kept their lead by capitalising on their productive sectors. However,
there appears to be some evidence of convergence in the levels of labour productivity (per-
haps to a common production frontier of efficiency): some more robust results will however
be provided with the econometric models discussed in section 7.3.
As might have been expected, the new Member States have far lower levels of LP when
compared to the older EU15 member states. In fact, overall LP levels for the transport sector
in these new Member States in 2003 is lower than was the case in old Member States in
1993 (except for Greece). However, given past LP growth one might reasonably conjecture
that these new Member States will catch up to have levels of LP similar to those of EU15
countries. From the calculated results, LP level growth slows between 2000 and 2003, so the
absolute difference between new Member States and old ones should narrow.
37 Our results for LP growth rates are comparable to those of O’Mahoney and Ark (2003) in EU Productivity and
Competitiveness: an industry perspective – can Europe resume the catching-up process.
38 These figures are not converted into purchasing power parity.

- 140 - COMPETE Final Report: Developments of productivity in the transport sector
0.000
5.000
10.000
15.000
20.000
25.000
30.000
35.000
1979
1981
1983
1985
1987
1989
1991
1993
1995
1997
1999
2001
EU15 USA
Figure 26: Labour productivity levels in the EU and the US transport sectors (1979-2002) € per hour
Figure 26 compares LP levels between the EU15 and the US in the transport sector. At the
beginning of the period, LP levels in the EU15 and US are quite similar, €16.06 and €15.96
respectively. During the early 1980s, US LP levels grow faster than those of the EU15, and
so by 1984 the US is actually slightly more productive than the EU15. However, this situation
does not last and from the mid-1980s, the EU15 records uniformly positive growth in LP
translating into a steadily increasing LP level. In contrast, growth in the US is more variable
and actually negative in some instances. The result of these divergent growth paths means
that by the end of the period in 2002, despite starting with broadly equal LP levels in the
transport sector, the EU15 is significantly more productive in the transport sector than the
US: €30 per hour compared to €22. This corresponds to faster LP growth rates in the EU15
compared to the US. Explanations might include a more than proportional growth in hours
worked in the US than in the EU, but also differences in exogenous variables such as chang-
ing population densities and size.

COMPETE Final Report: Developments of productivity in the transport sector - 141 -
Table 49: Selected LP levels (1995 € per hour) for EU15 and new member states and US in the transport sector, 1980 - 2003
Member State 1980 1984 1988 1992 1996 2000 2003
Austria 18 20 23 28 26 30 30
Belgium 21 24 27 31 30 30 33
Denmark 16 17 24 28 31 34 36
Finland 18 19 21 25 30 32 32
France 19 21 24 26 27 30 29
Germany 13 14 14 17 23 26 25
Greece 3 4 5 5 6 10 11
Ireland 12 11 11 14 17 19 16
Italy 21 23 25 29 34 33 35
Luxembourg 9 11 17 23 36 42 47
Netherlands 21 24 24 25 29 32 32
Portugal 8 9 11 13 13 16 18
Spain 12 14 16 18 20 21 21
Sweden 20 19 23 26 29 31 34
UK 11 12 16 17 20 20 21
Czech Republic - - - - 5 3 4
Hungary - - - - 3 4 4
Poland - - - - 3 4 5
US 16 19 19 20 21 23 - Source: own computations
It should be remembered, however, that despite the above data results, when one examines
total value added growth aggregated across the economy, the US is stronger than the EU15
(4.25 per cent for the period 1996-2000 compared to 2.72 per cent). The transport sector is
only one of many components of total value added.
7.2.3 Labour productivity in the transport sector: a finer disaggregation
The transport sector consists of four sub-sectors: land, water, air and supporting services.
Supporting services to transport include activities such as travel agents, travel caterers and
logistics. In this section we focus on comparing these different sub-sectors’ LP levels in the
EU15 and the USA.
Our results indicate that whilst the US had a LP advantage in the land and water sectors at
the beginning of the period, by 2002 the EU15 had overtaken the US in all sectors. In the
water sector, the EU in 2002 was over 2.5 times more productive. The US also lags signifi-

- 142 - COMPETE Final Report: Developments of productivity in the transport sector
cantly in supporting and air industries. The fact that the EU15 overtakes the US is consistent
with its higher LP growth rates.39
These large differences may be explained by two reasons: first, exogenous structural factors
like a larger population, greater urban density and, possibly, higher capital accumulation in
the EU than in the US, and, second, European policy in particular the creation of a single
market increasing the market size for transport companies and the transport policy itself fos-
tering e.g. competition in the transport sector, intermodality, supra-national infrastructures
and by all that providing higher quality transport services, which would then be reflected in
higher labour productivity as shown in Table 50.
Table 50: LP levels (1995€ per hour) in transport sub-sectors in the EU15 and USA
EU15 USA
Sector Land Water Air Support Land Water Air Support
1980 13.25 17.65 20.32 17.86 15.20 20.21 18.01 17.11
1984 15.44 20.53 26.44 21.42 17.33 19.38 23.06 20.97
1988 17.66 25.64 29.79 24.16 17.60 19.20 20.73 20.83
1992 19.64 30.31 34.21 27.02 19.44 23.44 21.80 20.60
1996 22.37 42.70 44.86 31.49 18.96 24.62 25.52 21.28
2000 22.93 55.96 52.22 32.51 19.84 26.40 28.23 25.05
2002 24.32 63.93 53.93 35.22 19.14 24.09 31.08 25.99 Source: own computations
7.2.4 TFP in the transport and communication sector.
Output in the transport sector does not solely depend on labour input; there is a significant
capital contribution as well. The transport sector has large capital components in the form of
transport infrastructure and transport equipment. Thus it is important to consider all factors
of production, as differences in LP levels might simply reflect different capital intensities.40
However, due to data constraints (namely missing data on capital stocks in the transport sec-
tor)41 it was only possible to calculate Total factor productivity (TFP) for the transport and
communication sector. Essentially, TFP refers to the change in output which is not explained
39 We can note that these results are broadly consistent with those of Denis, McMorrow and Röger (2004) in An
analysis of EU and US productivity developments (a total economy and industry level perspective) (DG ECOFIN) 40 An example might be the UK, which performs quite poorly in terms of labour productivity levels but, as of
2002, was one of the countries with the highest TFP level in the transport and communication sector. 41 Here, the trade-off has to be taken into account between not making this analysis to consider the capital in-
tensity of transport, because of lack of data, or to make the analysis knowing base on the trans-port&communication sector accepting that this has limited comparability with the other results for the trans-port sector only. However, we took the choice that it is more important to analyse the influence of the capital intensity on labour productivity and hence used the transport&communication sector for this analysis.

COMPETE Final Report: Developments of productivity in the transport sector - 143 -
by the change in all inputs. In this case inputs encompass both labour and capital goods. The
main data source for capital stocks was the STAN database.42
Before discussing the TFP results, we should bear in mind that they relate to the wider trans-
port and communication sector and that for some countries we had to construct the capital
stock series, which involved some unavoidable assumptions. The implications of including the
communications sector is discussed below with the analysis of the results.
TFP growth is computed using a Tornqvist index approach, as explained in some more detail
in section 7.3 and in COMPETE Annex 7.
Our computations suggest that TFP growth rates in the US compare favourably with a num-
ber of EU member states. However, year on year there are large fluctuations between the
EU15 countries. Further, while in the stage of the period investigated (1980-1995), European
countries record higher rates of TFP growth, in the later periods the US enjoys higher levels of
TFP growth (1996-2000). For example, in 2000 the US registered faster growth in TFP than
the economies of France, Germany, Italy, Spain and the UK. This may be because of greater
growth of the capital stock in the EU15 compared to the US.
Nonetheless, it should be recalled that these figures should be treated with care because they
include the communication sector – the higher US figures may actually be biased by the pres-
ence of ICT growth, which is quite plausible given the technology boom of the late 1990s.
We also computed a multilateral index of total factor productivity following the Caves et al
(1982) methodology. The results (shown in the COMPETE Annex 7) suggest that Belgium
and Italy had been the “frontier” country (i.e. the country with the highest relative TFP level)
in the 1980s and 1990s, respectively, for most of the time, but that the US have often been
in the group of three countries with the highest relative TFP in the transport and communica-
tion sector. Our computations also suggest that a convergence process in relative TFP levels
has been taking place within the EU, as the falling value of the standard deviation of relative
TFP level seems to suggest.
7.2.5 Conclusions
In conclusion, this section has summarised our results for LP and TFP calculations. The picture
that emerged was similar to that of existing studies, i.e. LP growth in the EU15 has been
greater than that of the USA. We also calculated LP levels in the transport sector as a whole
and in individual sub-sectors. These calculations confirmed that the higher LP growth rates
have led to the EU15 enjoying a significant LP advantage of the US.
In contrast, the picture for TFP is not so clear-cut. One must stress here again that the results
are based on transport and communications sector and that we had to make some quite
strong assumptions to build the gross capital stock used to compute the TFP for some coun-
tries. A comparison of TFP relative levels show that, indeed, the US performed pretty well as
compared with the EU, as in most years they rank among the first three countries with the
42 The methodology for estimating the capital stock is described in the annexes.

- 144 - COMPETE Final Report: Developments of productivity in the transport sector
highest relative TFP level. Furthermore, there is some evidence that countries that started the
sample period with low relative TFP levels have been experiencing faster TFP growth over the
entire sample period.
7.3 Impact of transport policies on productivity
In this section we summarise the main results of the econometric analysis of the impact of
some transport policies on productivity growth.
There are potentially many policies and variables that might have had an impact on produc-
tivity growth in the EU transport sector, such as expenditure on infrastructure, liberalisation
policies, measures aimed to alleviate congestion problems, and so forth.
For instance, liberalisation policies might foster productivity growth in the transport sector
because they might provide managers the right incentives to cut slacks and inefficiency and
to introduce both product and process innovations43. There are different liberalisation poli-
cies that have been introduced over the recent years. These are referred to the degree of
public ownership in the sector, the existence of price regulation, the existence of third party
access to the network in the case of essential facilities like the railways network, and so forth.
The degree of liberalisation in the transport sectors of all OECD countries increased over the
1979-2003 period. For instance, the index of liberalisation, as measured by the liberalisation
indices built by the OECD, in the EU15 and the US was about 5.7 and 3.2, respectively, in
1980 but it fall to 2.3 and 1.2 in the EU15 and the US, respectively, in 2002.44
It is reasonable to expect that the increased levels of liberalisation in the transport sector
should be associated, ceteris paribus, with higher productivity growth which in turn should
lead to lower prices for both passengers and for transport user sectors.
Other policies that might be expected to affect the competitiveness of the transport sector
are infrastructure expenditure policies and policies aimed to alleviate and fight congestion. In
fact, new and improved transport infrastructure as well as policies aimed to alleviate conges-
tion and bottlenecks in urban as well as non-urban areas could reduce transportation costs
and increase the scope for inter-modal competition (e.g. train-air) which in turn could lead to
faster productivity growth in the transport sector.
While, in principle, it would have been desirable to include in the empirical analysis as many
variables as possible that could proxy for the main policies introduced by EU countries over
the last twenty years or so, data constraints for most of the countries on one side, and the
necessity to include as many countries as possible into the analysis on the other –to give an
as broad as possible overview of the EU- have forced us to mainly focus on two sets of poli-
cies, namely infrastructure and liberalisation.45
43 See, for a review of the theoretical issues related to the effects of competition on productivity growth, Griffith
et al (2006). 44 The OECD indices of liberalisation go from 0 to 6, with 0 indicating a fully liberalised sector. 45 Another transport-related policy that we have considered in the econometric analysis was referred to the exis-
tence of inter-city road pricing in each country and in each year of our sample (the variable took the value of one when an inter-city road pricing policy was applied and zero otherwise). However, it was always largely in-significant and therefore it has been omitted from the final version of our econometric models.

COMPETE Final Report: Developments of productivity in the transport sector - 145 -
Although it might have been preferable to be able to include other variables into the analysis,
especially these proxyng for the levels of congestion, indicators related to the expansion of
infrastructure and the degree of liberalisation are perhaps the two most important and might
therefore provide at least some useful insights in our attempt to explain productivity growth
developments in the EU and US transport sectors.
For the infrastructure policies, the only data available were a monetary value of the total pub-
lic capital stock in the economy as a whole, or physical indicators like length of motorways,
roads and railways. Both types of variables have drawbacks: the public capital stock covers
not just transport infrastructure, but also capital items such as hospital and schools. There is
however some evidence in the economic literature on the macroeconomic effects of public
infrastructure on economic growth we have surveyed, that the wider public capital stock
tends to have lower effects on economic growth than public infrastructure aggregates more
intimately related to transport infrastructure. Therefore our estimates based on the public
capital stock can be thought of as providing a conscious underestimate of the “true” effect
of transport infrastructure on the productivity growth rates of the transport sector.
The physical measures of infrastructure, though more closely related to the concept of trans-
port infrastructure, suffer from many drawbacks, namely the large measurement errors and
the missing data in some years for many EU countries. Therefore, although we have used the
physical infrastructure variables in our analysis (mainly to cross-check some findings) the re-
sults we will discuss will be based on the public capital stock growth rates as the main “infra-
structure policy” variable that we have used in the econometric analysis.
The liberalisation policy variables that we have considered have been based on recently re-
leased OECD indices which seek to measure the level of liberalisation in some transport sub-
sectors, namely airlines, roads and the railways.
The remainder of this section is organised as follows: in section 7.3.1 we will present our
main findings on the effects of public capital stock on productivity growth rate in the trans-
port sector, while in section 7.3.2 we will discuss a rather different issue, namely the role
played by productivity growth in the transport sector in productivity developments in some
transport-user sectors.
7.3.1 Econometric analysis of transport policies on transport productivity growth
As we argued in section 7.2.4, TFP growth is a better indicator than LP growth. In fact, LP
might grow because of technological innovations and product innovations, managerial im-
provements, but also because of an increase in the capital deepening of the sector, i.e. an
increase in the capital to labour ratio. Therefore, higher LP levels might be the result of a
higher capital stock rather than an inherently more efficient production process. TFP is sup-
posed to address this shortcoming of LP and it is therefore a theoretically more rigorous
method to assess productivity levels and productivity growth in a sector.
However, due to data availability problems, it has not been possible to measure TFP growth
in the transport sector for many EU countries. The data problems were however not insur-
mountable in the case of the wider transport and communication sector, for which we have
been able to compute TFP growth for the EU 15 countries (with the exception of Luxemburg)

- 146 - COMPETE Final Report: Developments of productivity in the transport sector
and the US. We therefore decided to undertake our econometric analysis using as the rele-
vant productivity indicator the TFP growth in the transport and communication sectors of the
EU15 countries (with the exception of Luxembourg) and the US for the period 1979-2003.46.
We however cross checked the main results using LP growth in the transport sectors as the
dependent variable of the econometric analysis (the results are discussed in Annex 7).
7.3.1.1 Econometric analysis: TFP growth regressions in the transport and com-munication sector
The main econometric specification we have estimated was based on equations 1 and 2 as
follows:
(1) itittititititi vOutgapTelTranspKgGapTFP ++∆+∆+∆++=∆ − .5,4,21,10, lnln ααααα
(2) titiit uev .++= λ
Where tiTFP ,ln∆ is the rate of growth of total factor productivity for the transport and
communication sector of country i at time t47
; tiKg ,ln∆ is the rate of growth of the public
capital stock in the economy as a whole of country i at time t. tiKg ,ln∆ will have two kinds
of effect on tiTFP ,ln∆ . First, because of the definition of tiTFP ,ln∆ , there is a purely
mathematical effect (witch we might term, a “bias”)48. Second, there is the economic effect
– which is what we are interested in. To isolate the economic effect, which we called *2α ,
we adjust 2α by “adding back” the mathematical effect (correcting for the bias). This cor-
rection is country-specific, but the average bias is about 0.06, i.e. *2α = 2α +0.06.
tiTransp ,∆ is the change in the liberalisation index in the transport sector of country i be-
tween the years t and t-1 and it was computed as the average of the OECD indices for the road, airlines and railways sectors; tiTel .∆ is the change in the liberalisation index for the
communication sector between years t and and t-1, 1, −tiGAP is the distance from the techno-
logical frontier of country i in time t-1 and itOutgap is the output gap in the economy as a
whole of country i at time t which is aimed to proxy for the impact of country-specific busi-
ness cycles on TFP growth.
46 For some countries, the full time series of data was, unfortunately, not available. See COMPETE Annex 7 for
details. 47 The rate of growth of Total Factor Productivity has been computed using a Tornqvist index:
itititititititit KHVATFP ln))(211(ln)(
21lnln 11 ∆+−−∆+−∆=∆ −− αααα , where H and K are
the hours of work and the gross capital stock employed in the sector and α is the labour share in value added. Value added and the gross capital stock have been converted in US dollars using GDP PPP exchange rates. For this and other details see COMPETE Annex 7.
48 Referring to COMPETE Annex 7 for a more exhaustive explanation, the bias stems from the fact that the capital stock we have used to compute TFP growth in the transport sector is the sum of private capital stock (e.g. vehi-cles, buildings, software) and the public infrastructure capital (e.g. roads). In this case, the effect of the public capital stock (as a proxy for transport infrastructure) is likely to provide a downwards biased estimate of the ef-fect of its true effect on “private sector” TFP growth (i.e. computed using only the private capital stock as the capital input).

COMPETE Final Report: Developments of productivity in the transport sector - 147 -
Table 5149 summarises our main results for the TFP growth regressions in the transport and
communication sectors.50
One of the main results that is robust across all the specifications reported in Table 51 –and
which is consistent with the findings of some recent literature- is the negative coefficient for
1, −tiGAP , which says that countries that lag further behind the frontier tend to have faster TFP
growth rates than countries that already operate near the industry technology frontier, per-
haps because in the former countries there is more scope for imitation of new processes and
products already introduced in more technology advanced countries.
Column 1 of Table 51 shows that the rate of growth of the public capital stock has a positive
impact on the rate of growth of TFP in the transport and communication sector and that the
coefficient is significant at exactly the 10 per cent level of confidence. The point estimate
suggests that an additional one percentage point increase in the rate of growth of the public
capital stock in the economy as a whole would add about 0.34 percentage points to the rate
of growth of TFP in the transport and communication sector. Recalling that 0.34 is likely to
provide a downwards biased estimate of *2α , we might say that *
2α is approximately equal to
0.40. However, we should also take into account that our measure of the public infrastruc-
ture capital includes other public capital items that are not related to the transport and com-
munication sectors, like hospitals and schools. In this case, a one per cent increases in the
total economy public capital amounts to less than one percent increase in the stock of public
capital in the transport and communication sector. In particular, we have assumed that the
ratio between transport and communication public infrastructure and total public infrastruc-
ture is about 0.5-.0.651 the overall effect of a one per cent increase in the stock of transport
and communication public infrastructure should be approximately an additional 0.67-0.80
(0.40/0.6; 0.40/0.5) percentage points to the TFP growth rate in the transport and communi-
cation sector. This result (see COMPETE Annex 7 for details) would approximately correspond
to an additional 0.05-0.06 percentage points in the rate of growth of TFP in the economy as
a whole, which would also correspond to an elasticity of output with respect to the public
capital stock, in the economy as a whole, of about 0.05-0.06. Our literature review on the
macroeconomic effects of the public capital stock on aggregate output generally identifies an
elasticity of output with respect to public capital of about 0.10/0.20. In our own growth
model discussed in section 6.2 of the COMPETE report suggests that an elasticity in the 0.05-
0.10 range would appear to be a reasonable estimate. Our findings for the transport and
communication sector therefore generates a result which, “transferred” to the economy as a
whole, would suggest a value which is just at the lower bound of this range.
49 In each table we have reported the coefficients point estimates as well as (in parenthesis) the p value for the t
test of significance. 50 The full sets of results as well as a discussion of the econometric methodology are reported and discussed in
the COMPETE Annex 7.
51 Picci (1999) has reported data for Italy which show that core infrastructure (defined as roads, airports, rail-roads, subways, ports, telecommunication infrastructure, electrical lines and water) amount to about 60 per cent of total government infrastructure. We therefore have assumed that a range of 50 per cent to 60 per cent for the ratio between transport and communication public infrastructure stock and total public infrastructure stock could provide a reasonable approximation.

- 148 - COMPETE Final Report: Developments of productivity in the transport sector
In column 2 we explored the linkages that might exist between productivity growth, liberali-
sation and infrastructure allowing the impact of the rate of growth of public capital on TFP
growth to vary with the degree of liberalisation in the transport sector: the results seem to
provide some evidence (statistically significant at the 10 per cent level) that the impact of infrastructure tends to be higher in more liberalised sectors ( tikg ,ln∆ *Tr1): in more liberalised
transport sectors, an additional percentage point in the rate of growth of the public capital
stock would add about 0.7 percentage points to TFP growth in the transport and communi-
cation sector, while we can not reject the null hypothesis that in the less liberalised sectors
the impact of the public capital stock is not significantly different from zero. Considering the biases of the 2α coefficient discussed above and performing similar computations,, we might
say that in more liberalised transport sectors an additional percentage point of the rate of
growth of the public capital stock would tend to add 1.3-1.5 percentage points to TFP
growth in the transport and communication sector, while we can not reject the null hypothe-
sis that the overall effect is zero in the less liberalised transport sectors. For instance, in the
US, the average value of liberalisation in the transport sector was about 1.2; while in the EU
it was about 2.252: this would mean that in the US the impact of an additional percentage
point of the rate of growth of the public capital stock would tend to add 1.3-1.5 percentage
points to TFP growth in the transport and communication sector, while for many EU coun-
tries we could not reject the null hypothesis that it would not have any effect.
Liberalisation thus would seem to operate through the effectiveness of infrastructure rather
than directly on the rate of TFP growth, as can be seen from the insignificant coefficient of tiTransp ,∆ .
In column three we tested the robustness of these main findings by inserting in the regres-
sion the level of liberalisation in the airlines, railways and road transport sectors separately.
As we can see, the coefficient of the public capital stock is lower than in column one and it is
no longer significant53. Furthermore, we can see that higher degrees of liberalisation in the
airlines sector would seem to reduce TFP growth in the transport and communication sector,
while there is some (statistically weak) evidence that higher levels of liberalisation in the rail-
ways would tend to increase TFP growth in the transport and communication sector.54 We
have however some concerns that including the levels of the sub-transport indices rather
than an aggregate one is a correct procedure to follow, given the low share of value added
covered by some of these sub-transport indices, and the possibility of identifying a chance
correlation in the data: this is especially the case for the airlines, which amount to just about
6 per cent of the transport and communication sector value added in the EU.
Our results in the transport and communication sector therefore would seem to provide
some evidence that higher growth rates of the public capital stock might have a small albeit
positive effect on the TFP growth rate of the sector. The evidence does not however appear
52 The value for the EU was obtained through a weighted average of the EU15 member states. 53 Furthermore, the inclusion of the airlines, road and railways sector liberalisation indices drives down to insig-
nificant the effect of the rate of growth of the public capital stock also when we allow the impact to vary with the degree of liberalisation.
54 The labour productivity growth regression confirms that the degree of liberalisation has a positive impact on LP growth, while the negative impact of airlines liberalisation is not confirmed.

COMPETE Final Report: Developments of productivity in the transport sector - 149 -
to be particularly robust: as the result in column 1 shows, the coefficient is marginally signifi-
cant. Furthermore, the results displayed in column 2, as well as the results (not shown) using
labour productivity growth in the transport sector only as the dependent variable do still find
a positive impact on productivity growth, but the significance level declines substantially.
Therefore our result about the effect of the rate of growth of the public capital stock on pro-
ductivity growth rates should be taken with extreme caution.
Unlike previous studies that can be found in the economic literature, there would not seem
to be robust evidence that liberalisation directly affects TFP growth in the transport and
communication sector, although there is some evidence that it might affect it indirectly.
For instance, Nicoletti and Scarpetta (2003) have used a panel of OECD industries to assess
the impact that product market regulation had on total factor productivity growth and find
that, in general, liberalisation tends to increase productivity growth, especially fostering the
pace of productivity catch-up for countries that lag behind the industries’ technological fron-
tiers.
Alesina et al (2005) analysed the impact that regulation had on investment in the transport,
communication and utility sectors, using OECD panel data. Their main results were that liber-
alisation -and, in particular, entry liberalisation- had a positive impact on private investment
and that the marginal effect of liberalisation tends to be higher when the policy reform is
“large”, when the change in the policy took place at an already high level of liberalisation
and especially for these countries that were early liberalisers.
Griffith et al. (2006) in a report for DG Economic and Financial Affairs examined the impact
of competition (measured by the mark-up) and liberalisation had in labour and total factor
productivity growth in a panel of EU countries.55 For the service sector, which includes trans-
port, they found that higher mark-ups – taken as a proxy for the degree of competition -
tends to reduce total factor productivity growth, even if their failure to control for its possible
endogeneity, does not allow the authors to interpret their finding as a causation rather than
simple correlation.
Finally, Griffith and Harrison (2004), in what seems to be the study most similar to ours, es-
pecially in terms of sample size and focus on a single sector, were not able to identify any
positive effect of the degree of liberalisation on TFP growth on OECD data for the water, gas
and electricity sector.
A possible explanation for our finding could be that liberalisation does not play a major role
in driving productivity growth in the transport sector, and that other variables, like R&D ex-
penditure, or the degree of congestion, which we have not controlled for in the analysis, play
a far larger role: if that were indeed the case, the error term would capture the effect of
these omitted variables and the standard error would tend to be larger, making it difficult to
precisely measure the effect of the included variables.56
55 They also looked at the determinants of investments, employment and R&D. 56 Furthermore, if some of these variables, like the congestion levels were in fact correlated with the degree of
liberalisation, we might expect some bias in the liberalisation coefficients.

- 150 - COMPETE Final Report: Developments of productivity in the transport sector
There would however appear to be some evidence that liberalisation operates mainly through
its impact on the effectiveness of the public capital stock in stimulating higher TFP growth
rates rather than directly. Furthermore, the regressions that are based on labour productivity
growth in the transport sector only provide some evidence that the “technology” gap effect
tends to be stronger for these countries with a more liberalised transport sector.
Table 51: TFP growth regression. Transp&Comm. sector
Source: own calculations
Dependent variable
TFPln∆
1 2 3
Indep. vari-able
1, −tiGAP -0.047 (0.03)
-0.045 (0.05)
-0.054 (0.01)
tikg ,ln∆ 0.345 (0.10)
0.204 (0.36)
tiTransp ,∆ -0.007 (0.38)
-0.007 (0.43)
tiTel .∆ 0.005 (0.44)
0.004 (0.47)
tiTel . -0.002 (0.71)
tiRoad . -0.004 (0.24)
tiRail . -0.004 (0.12)
tiAirl .
tikg ,ln∆ *Tr1 0.700
(0.09)
tikg ,ln∆ *Tr2 0.414
(0.21)
tikg ,ln∆ *Tr2 0.441
(0.19)
tikg ,ln∆ *Tr4 0.284
(0.26)
Time eff yes
Fix eff yes
F test (p value)
0.0000

COMPETE Final Report: Developments of productivity in the transport sector - 151 -
7.3.1.2 Conclusions
The aim of this section is to briefly summarise the main results of the econometric analysis
discussed in the previous section.
One of the most robust results of the econometric analysis is that we have found that coun-
tries that lag further behind the industry technological frontier experience faster TFP
growth57: the regression coefficient is in fact remarkably stable and highly significant across
all the regression specification in 7.3.1. This result confirms, for the transport and communi-
cation sector, the findings of Griffith et al (2004) and Nicoletti and Scarpetta (2003) who also
find broadly similar results for a panel of OECD manufacturing and manufacturing and ser-
vices sectors, respectively.
A similar result is also obtained in the case of the labour productivity growth regressions,
where we found that countries with lower levels of LP tend to experience faster LP growth.
The TFP as well as the LP growth regressions do not provide convincing evidence that liberali-
sation (or changes in the degree of liberalisation) tends to clearly increase productivity growth
in the transport sector.
There is some weak evidence that increases in the degree of liberalisation directly increase
labour productivity growth, but the coefficients are poorly determined, and the significance
level is never lower than 0.10-0.12 (with the exception of the railways-specific index, which is
significant at the 10 per cent level and which could therefore suggest that liberalisation in the
railways might have had a positive impact on LP growth in the transport sector).
In the case of the TFP growth regression in the transport and communication sector, the in-
clusion of an aggregate transport sector liberalisation index suggests that liberalisation is
beneficial to TFP growth, but the coefficient is never significant or nearly significant; further-
more, the inclusion of individual sub-sector indices provides some evidence that railways lib-
eralisation tends to increase TFP growth – thus confirming the LP growth analysis in the
transport sector - while airlines liberalisation tends to decrease it.
A possible explanation for these findings could be that liberalisation does not play a major
role in driving productivity growth in the transport sector, and that other variables, like R&D
expenditure, or the degree of congestion, which we have not controlled for in the analysis,
play a far larger role: if that were indeed the case, the error term would capture the effect of
these omitted variables and the standard error would tend to be larger, making it difficult to
precisely measure the effect of the included variables.58
Furthermore, the fact that our TFP growth measure is based on the composite Transport and
Communication sector might have included some noise in the estimations and, therefore,
standard errors might have been inflated. Finally, it is possible that the effects of liberalisa-
tion needs more time to materialise, for instance because of the existence of adjustment
costs.
57 This result provides some further support to our empirical finding, discussed in section 7.2, that there has been
a convergence process in the TFP levels within the EU transport and communication sector. 58 Furthermore, if some of these variables, like the congestion levels were in fact correlated with the degree of
liberalisation, we might expect some bias in the liberalisation coefficients.

- 152 - COMPETE Final Report: Developments of productivity in the transport sector
This does not, however, means that liberalisation does not have material effects. We have
seen that liberalisation might operate indirectly through other channels. In particular, in
more liberalised sectors the impact of increases of the rate of changes of the public capital
stock (which we used as a proxy for the transport infrastructure capital) was magnified: an
additional percentage point of the rate of growth of the public capital stock would tend to
add 1.3-1.5 percentage points to TFP growth in the transport and communication sector in
the most liberalised transport sectors. Furthermore, in more liberalised sectors, the conver-
gence towards the industry frontier (measured as the country with the highest transport la-
bour productivity level) tends to be slightly faster than in the most intensively regulated coun-
tries.
The evidence regarding the direct impact of infrastructure is mixed. We discussed in
COMPETE Annex 7 the drawbacks of our proxy for the stock of transport infrastructure, the
most important being that it is only loosely connected with the stock of transport infrastruc-
ture, as it accounts for also of such items as hospitals, schools, etc. However it has been
widely used in the literature on the macroeconomic effects of infrastructure on economic
growth and, above all, there is some evidence that it tends to provide somewhat smaller ef-
fects than core infrastructure capital, which is more closely associated with transport infra-
structure: therefore it should be possible to argue that our result is a lower bound of the
“true” effect of transport infrastructure. Furthermore, alternative variables59 like km of
roads, motorways or railway tracks are measured with substantial error and they do not pro-
vide year on year variation, within each country, sufficiently large to allow the researcher to
identify the parameter of interest.
Having said that, our results do not show strong evidence that the rate of growth of the pub-
lic capital stock has a positive impact on the rate of growth of TFP in the transport and com-munication sector, as the coefficient of tikg ,ln∆ is indeed positive but poorly determined (it
is significant, even in the best TFP growth regression, exactly at 10 per cent). However, this
result is not confirmed when we focus the analysis on the labour productivity growth in the
transport sector: in this case, although the coefficient for the rate of growth of the public
capital stock is positive, it is never significantly different form zero at the usual levels of confi-
dence.
Which of the two sets of results is more “reliable” as an indicator of the likely effects of in-
frastructure expenditure programs on productivity growth in the transport sector is not im-
mediately clear. For instance, we are not in a position to argue that the failure of the labour
productivity model to show a significant positive effect of the public capital stock on labour
productivity growth is due to the fact that the latter is the wrong indicator to consider or
that, instead, the positive effect in the TFP model is due to the inclusion of the communica-
tion sector activities.
What would be required to provide more robust result would be the expansion of databases
like the Groningen Growth Accounting Database or the STAN database and, above all, the
59 Which we used in the regressions but that always turned out to be highly insignificant, with t values close to
zero.

COMPETE Final Report: Developments of productivity in the transport sector - 153 -
estimation of sufficiently long time series of the infrastructure capital for as many as possible
EU countries.
7.3.2 Econometric analysis of the linkages between productivity growth in the transport sector and productivity growth in some transport using sectors.
Developments in productivity growth in the transport sectors are important because the sec-
tor produces intermediate inputs that will be then purchased by other sectors (transport user
sectors): high rates of growth of labour or total factor productivity might have important im-
plications for the economic development of some sectors that make an intensive use of
transport. The sectors that we have considered in this report are financial intermediation;
transport equipment; chemicals, rubber and plastics; food, drinks and tobacco and retail and
wholesale. The main goal of the analysis has been to explore whether and to what extent
productivity growth in the transport sector might have led to productivity growth in transport
user sectors.
The econometric model we have estimated for the five sectors mentioned above in the EU 15
(less Luxembourg) and the US, for the period 1979-200360, is the following61:
(1) itititjijt vOutgapTPTFP ++∆+=∆ lnln 0 αα
ijtTFPln∆ is the rate of growth of total factor productivity in country i, sector j at time t;
itTPln∆ is the productivity growth in the transport sector in country i at time t, which could
be either the rate of growth of total factor productivity in the transport and communication
sector or the rate of growth of labour productivity in the transport sector. The coefficient of
itTPln∆ has been allowed to vary over the sectors, so that we are able to estimate the impact
of transport productivity growth in each of the five transport user sectors.62
The results (not shown) suggest that the impact of TFP growth in the transport and commu-
nication sector (or of labour productivity growth in the transport sector only) is never signifi-
cant: this would imply that higher productivity growth within the transport sector does not
seem to be correlated with higher TFP growth rates in the five transport user sectors.
There can be different reasons for this result, the first one being the very stylised nature of
the econometric model of equation 1.
First of all, it might be the case that productivity gains in the transport sector could lead to
higher productivity in the transport user sectors but not to higher growth rates.
Secondly, our TFP growth refers to the Transport and Communication sector, and therefore
we have to acknowledge that our findings might have been driven by productivity develop-
ments in the Communication rather than in the Transport sector.
60 As explained in Annex 7, for some countries the full time series 1979-2003 was not available. 61 Full details of the econometric estimation, as well as the drawbacks of such a model have been reported in
annex 7. 62 FI stands for financial intermediation, RW stands for the retail and wholesale sector, CRP stands for chemicals,
rubber and plastics and FBT stands for food, beverages and tobacco.

- 154 - COMPETE Final Report: Developments of productivity in the transport sector
Furthermore, it is possible that in these sectors-although they have been selected because, a
priori, it was considered reasonable to assume that they might be more affected than others
from productivity developments in the transport sector - transport costs represent a small
share of costs. This, in turn, could make it difficult to identify the effects that productivity
developments in the transport sector might have had on the productivity growth of these
transport user sectors.
Finally, we could expect a positive and significant impact of higher TFP growth in the trans-
port sector on the TFP growth of transport user sectors only in the presence of increasing
returns to scale and/or positive mark-ups in the transport user sectors.
In fact, the Solow residual can be decomposed in three components which can be decom-
posed in three components which can be attributed to technical change, scale economies
and mark-up. Assuming that it might be difficult to capture the technical change in the
transport user sectors induced by producitvity growth in the transport sector, the scale
economies and mark-up channels would appear to be the most likely channels through
which productivity growth in the transport sector can impact on the productivity growth of
transport user sectors.
In the case of scale economies, we can note that if a sector is producing with a technology
that exhibits increasing returns to scale, then an increase in production, brought about by the
cheaper inputs made available by productivity developments in the transport sector, would
be associated with a less than proportional increase in inputs and with an increase in produc-
tivity growth (as measured by the Solow residual).
As for the mark-up, if the transport user sectors were perfectly competitive, the higher pro-
ductivity in the transport sector would be passed on to the transport user sectors that would
pay lower prices for some of their inputs, which, in turn, would be passed to the final con-
sumers: given the degree of scale economies, that should not affect the rate of growth of the
transport users’ Solow residual. However, when output prices depart significantly from mar-
ginal costs (i.e. in the presence of substantial positive mark-ups) the lower input prices would
not be entirely passed on to consumers, and, as a result, we could expect a higher Solow
residual.
Our results could therefore suggest that either economies of scale are approximately constant
in the five transport user sectors or that their mark ups are reasonably small and these five
sectors are therefore approximately competitive.63
7.4 Indirect employment effects of the transport sector
In this section, we summarise the additional employment effects that arise due to direct em-
ployment in the transport sector. Detailed results are presented in COMPETE Annex 7.
63 However, given the very stylized nature of the analysis, one should not interpret these results to argue that in
particular markets within the five transport user sectors we have considered there are not significant competi-tion problems.

COMPETE Final Report: Developments of productivity in the transport sector - 155 -
Two types of employment effects arise from direct employment: linkage effects and induced
effects. Linkage effects refer to the jobs created in the supply or distribution chain, while
induced employment or the income multiplier effect is that which arises due to expenditure
of the incomes that employees in the transport sector earn. This additional expenditure cre-
ates further jobs as the money is spent on goods and services – a ripple effect.
In the absence of availability of a computable general equilibrium model (CGE) or alternative
fully specified economic models like econometric or system dynamics models the method
that we consider to be the most suitable for assessing sector level change is to use multipliers
derived from Input-Output tables. The Input-Output tables allow us to derive the Leontief
inverse, which provides information on how much input is required from all other sectors to
provide a €1 of output in the sector of interest. We derive output effects from the Leontief
inverse tables, and then use industry level output-employment ratios to determine gross em-
ployment effects.
The model provides gross estimates of employment i.e. it does not take into account that
some employment is displaced from other productive uses, and therefore the results are bi-
ased upwards. We adjust these estimates to present net employment effects, which sub-
tracts from the total those employees who might have been displaced from other productive
uses. The last data we have available to us to provide a possible adjustment to gross em-
ployment is a set of four case-studies conducted by the DfEE (now known as the DfES)64,
which calculates an average re-absorption rate of 52%. In the absence of better data, we use
the figure of 52% as a benchmark, and present both gross and net estimates.
An important caveat is that the use of Leontief multipliers in the I-O tables is intended for
marginal changes in the output of a particular sector. The multipliers we have calculated can
be used to estimate the effects of other potential changes in the transport sector, for exam-
ple, an increase in output in the rail transport sector of €10m. We would suggest caution in
extending these results to very large changes65: the effect of transport on the economy is
likely to be non-linear and therefore it is not generally acceptable to apply marginal results to
the entire sector, or to changes that are very large as compared to the sector as a whole.
In addition the model does not give general equilibrium effects, i.e. it does not take into ac-
count possible changes in other industries and the resultant shifts in employment that would
arise as the transport sector expands or contracts. The model also does not take account of
movements in unemployment in entirely unrelated industries, and so did not involve any pre-
diction about aggregate employment or unemployment levels.
National Income multipliers:
The techniques used to estimate the induced employment that arises from the expenditure of
income created by an injection to the economy is more straightforward. A national income
multiplier of 1.1 is widely used and accepted.66 This multiplier suggests that 10 direct jobs in
64 Moore, Barry and David O’Neill (1996) The Impact of redundancies on local labour markets and the post re-
dundancy experience Research Studies RS23, Department for Education and Employment 65 The size of the change can be judged in proportion to the size of the sector. Clearly a change which would
double the size of the sector, for example, would not be considered marginal. 66 For example, in the English Partnerships (September 2004) “Additionality Guide: A Standard Approach for
Assessing the Additional Impact of Projects”.

- 156 - COMPETE Final Report: Developments of productivity in the transport sector
the transport sector lead to an additional one job in the wider economy. The table below
summarises the results
Table 52: Summary of multiplier effects
Railways67 Land Transport
Water Transport
Air transport
Supporting and auxiliary transport activities
Weighted average68
Gross Link-age effect
UK 2.27 1.54 3.02 3.02 3.34 2.69
Finland 1.28 1.61 2.08 1.92 1.51
Germany 1.35 2.28 3.20 2.26 1.91
USA 2.56 1.85 4.67 2.32 1.2 1.73
Net Link-age Effect
UK 1.09 0.74 1.45 1.45 1.60 1.29
Finland 0.61 0.78 1.00 0.92 0.73
Germany 0.65 1.10 1.54 1.08 0.92
USA 1.23 0.89 2.24 1.11 0.58 0.83
Income multiplier effect
All coun-tries
1.1 1.1 1.1 1.1 1.1 1.1
Cumulative multiplier (gross)
UK 2.50 1.69 3.32 3.32 3.67 2.96
Finland 1.41 1.77 2.29 2.11 1.67
Germany 1.49 2.51 3.52 2.49 2.10
USA 2.82 2.04 5.14 2.55 1.32 1.90 Source: own calculations
The interpretation of the multipliers in the table above is, for example, in the UK, for every
100 jobs created directly in the transport sector, a total of 269 jobs are created in the econ-
omy as a whole, out of which 169 are external to the transport sector.
In summary, the table indicates that there are substantial indirect effects, with variation both
across sub-sectors and countries. The air and water transport sectors appear to have the
strongest external effects while land transport seems to have the lowest. These effects are
likely to be key in conducting cost-benefit analysis of additional transport investment as it
gives a more accurate picture of employment created than direct effects alone.
67 Consistent data for the Leontief inverse, output and employment in the transport sub-sector was only available
for the UK. For the remaining countries, transport is included in the Land Transport sector. 68 Weighted on the basis of proportion of revenue.
COMPETE Final Report: Developments of productivity in the transport sector - 157 -
7.5 Conclusions
The main results of this section can be summarized as:
Labour productivity growth in the transport sector over the period 1979/2002 has been, on
average, stronger in the EU than in the US.
While in 1979 the US and the EU had similar levels of labour productivity in the transport
sector, in 2002 the EU labour productivity was significantly higher than in the US.
TFP levels in the transport and communication sector show a somewhat different picture,
with the US being in most years among the three countries with the highest TFP level.
The econometric analysis found some evidence that countries with lower levels of TFP or LP
tended to experience higher LP and TFP growth rates over the sample period.
The econometric analysis has also provided some, admittedly weak, evidence that public in-
frastructure might stimulate TFP growth in the transport and communication sector, espe-
cially in countries with more liberalised transport sectors.
Higher degrees of liberalisation in the railway sector seems to be associated with faster rates
of growth of TFP in the transport and communication sector and higher rates of growth of LP
in the transport sector.
Our input/output analysis seems to suggest that there are substantial indirect employment
effects, with variation both across sub-sectors and countries. The air and water transport sec-
tors appear to have the strongest external effects while land transport seems to have the
lowest.

- 158 - COMPETE Final Report: Importance of transport for competitiveness
8 Importance of transport for competitiveness in the econo-mies of the EU and the US
The economic importance of transport can be measured in several different ways. Four op-
tions have been presented throughout this report:
By estimating the contribution to macroeconomic totals like output, production
value or employment.
By estimating the total expenditures spent for transport i.e. the operating costs of
transport.
By estimating the role of transport in the exchange of intermediate products be-
tween sectors.
By modelling transport productivity and its impacts on the productivity of other sec-
tors.
The following two sections present the findings on the importance of transport, first, focus-
ing on the role of transport as one self-contained sector of the economy, and second as a
facilitator of competitiveness.
8.1 The economic importance of transport
Though transport constitutes a derived demand it has a role to play on its own for the Euro-
pean economy. This can be shown by looking at the two main sectors of transport, which is
the production of transport equipment (i.e. cars, trucks, buses, planes, ships, trains, two-
wheelers) and the provision of transport services (i.e. rail, road, water, air and auxiliary
transport services).
Looking at the share of transport equipment and transport services for the two major macro-
economic indicators employment and production for the two points of time 1995 and 2002
we observe: first, significant shares of transport and, second, differences of levels and devel-
opment trends for the EU15 and the US (see Figure 27)69.
Transport equipment is of similar importance for employment in both regions laying in
the range of 1.43% (US) and 1.89% (EU15) in 1995, respectively, and reducing slightly in
importance for direct employment to 1.25% (US) and 1.55% (EU15). Transport services
contribute a more than twofold higher share to direct employment. Again the US shows
the lower share with 3.13% while it reaches 3.73% for the EU15 in 1995. Here the trends
until 2002 differ as in the US employment remains stable while in the EU15 it is increasing
slightly to 3.96%.
69 For the EU10 no comprehensive past data is available. Looking at selected EU10 countries that dispose of data,
different tendencies than for EU15 can be observed. E.g. production value and employment of transport ser-vices are declining due to strongly growing car-ownership and private road transport. On the other hand for transport equipment in some countries both employment and production value are growing due to location of new road vehicle manufacturing plants in these countries.

COMPETE Final Report: Importance of transport for competitiveness - 159 -
Looking at the contribution of transport to production the trends are quite different. In
1995 transport equipment in the US contributed 3.75% of total production. In the EU15
the share was slightly lower with 3.62%. In both regions it is at least double the employment
share of the total. Until 2002 the trends of production of transport equipment in the US and
EU15 differ. For the US a decline to 3.22% is observed (-14%) and for the EU15 a growth
reaching a share of 4.2% (+16%).
For the production of transport services the levels and developments also differ between
the US and the EU15. In the US the share is reduced from 3.32% to 3.04% of total produc-
tion (-8%). For EU15 it is the opposite: the share grows from 5.38% to 5.82% (+8%), which
to large extent comes from the auxiliary transport services (e.g. logistics, travel agencies) and
much less from the modal transport services.
The trends of total transport importance (equipment plus services) in the US and the EU15
accordingly differ significantly. For the US we observe a slight decline of the importance of
transport between 1995 and 2002 consistently for both employment (from 4.55% to 4.38%)
and production (from 7.07% to 6.26%). However, for the EU15 only the share on total em-
ployment is reduced (from 5.62% to 5.51%), while the share of total transport on produc-
tion is growing by more than 11% starting at 9% in 1995 and reaching 10.02% in 2002.
This confirms that transport on its own constitutes already one of the most relevant sectors in
the EU15 in terms of economic importance and that its importance is growing.70
Shares of transport sectors on employment and production [%]
0
2
4
6
8
10
12
1997 2002 1995 2002 1995 2002 1995 2002
Employment Production Employment Production
US EU15
Transport Equipment Transport Services
Source: own calculations based on EUROSTAT Structural Business Statistics (Online), OECD STAN (Online).
Figure 27: Contributions of transport to employment and production
70 The numbers for production in Figure 27 come from the OECD STAN Online statistics and include some as-
sumptions on missing values to fill data gaps for a few countries. Taking the numbers from the EUROSTAT Structural Business Statistics on sectoral production value following the NACE classification the share of total transport production value (equipment plus services) on total production value would even be higher reaching 13% for the EU25 in 2002. This number would even be larger when sales and maintenance of motor vehicles and sales of fuel would also be considered.

- 160 - COMPETE Final Report: Importance of transport for competitiveness
Looking at the results in Figure 27 three things should be kept in mind: first, different data
sources provide a bandwidth of results e.g. looking at input-output tables, which are not
available for all countries for both points of time, the share of transport on total production
value of EU15 in 2002 amounts to 10-11% which is similar than values derived from the
OECD STAN but smaller than can be calculated on the base production value taken from the
EUROSTAT Structural Business Statistics.71 In all three cases, it should be kept in mind that
the reference total is not GDP, but the total of all production or production value taken from
the respective statistics. Second, this result refers to monetary values and hence is not valid in
the analysis of decoupling of transport, which focuses on decoupling of physical units (vol-
ume or performance) from monetary units (GDP, output, production value). E.g. the increase
in logistic services would not show up in the physical units but would be included in the
monetary units, which is of course affecting these results since logistics are strongly growing
in the last decade.
The result of growing importance of transport in the European economies is also confirmed
by the analysis of labour productivity of transport services (section 7.2), which concluded
that LP grew stronger in the EU than in the US. A deeper analysis focussing on total factor
productivity development revealed that this is partially due to higher capital investments in
the EU than in the US (i.e. transport infrastructure, vehicles) as in terms of TFP growth the US
always ranks amongst the top 3 of the analysed countries. Nevertheless, this confirms that
the European infrastructure policy e.g. fostering the implementation of European transport
networks and the construction of inter-modal transport terminals provides positive stimuli for
the economy.
In terms of operating cost (section 2.2), which can be seen as expenditures of an economy
for their transport activity, the US spends a higher share of their GDP for transport. This dif-
fers from the picture drawn by the share of transport on production (Figure 27). However,
the operating cost present partially a narrower picture as they cover merely the transport
activity, while e.g. logistics activities are excluded and by these activities the EU generates a
larger share of their transport production, and partially a broader picture as the operating
cost include expenditures made in non-transport sectors like financial services (e.g. vehicle
insurance), energy (e.g. fuel) or trade and repair (e.g. vehicle maintenance).
However, the operating cost analysis seems to indicate another success of the European
transport sector and policy as the average cost per tkm of road freight in the US is much
higher than in the EU, which could result from the higher input of auxiliary services (i.e. logis-
tics) in the EU leading to better organised freight transport (e.g. higher load factors, better
choice of most efficient alternative mode).
We have started this discussion of the economic importance of transport by looking at the
direct shares of the various transport sectors on the economy. Now, we turn towards the
contribution of transport to the production of other sectors, i.e. the intermediate input of the transport service sectors in relation to the production of other sectors documented by
71 Some countries report in their Input-Output-Tables much higher growth of transport importance than derived
for the EU15 from the OECD STAN database with +11%. For instance, transport importance measured as share of transport output to total output, i.e. total use in the IO-Tables, grew between 1995 and 2000 for Denmark by +25.1%, for Germany by +23.6% and for Austria by +15.6%.

COMPETE Final Report: Importance of transport for competitiveness - 161 -
input-output-tables. This share reflects the dependence of other sectors on transport services
in monetary terms. However, with 1.9% for the US and 2.2% for the EU15 it is much smaller
than what we have identified as the overall contribution to production above. The differences
emerge because of two main reasons: first, own account transport is not included in the in-
termediates of the transport service sectors of the IO-tables, which should increase this share
by roughly one third (derived from Klaus/Kille 2006). Second, private passenger transport also
accounts for a significant share of production of the transport sectors (measured in terms of
operating cost about one third of European expenditures).
It should be pointed out that all the previous analyses focus on the monetary footprint of
transport. Changes of the usage of time, in particular time savings through transport im-
provements, are only considered as far as they reduce the capital cost (e.g. if fewer vehicles
are needed) or wage expenditures (e.g. if fewer personnel is required). But in microeconomic-
founded Cost-Benefit-Analysis (CBA), which for instance is used to assess the viability of
transport infrastructure projects, the time savings on average contribute the largest share of
benefits (e.g. in the previous German cross-modal federal infrastructure plan about 70% of
benefits were time savings). To capture a similar indicator as GDP for the national level of
analysis it would be required to establish a reporting of (travel) time usage indicators docu-
menting for which purposes time is used.72 However, there is some evidence that transport
improvements that possibly would reduce travel times often are not used to save time but to
increase transport distances and to dedicate a constant time budget for transport.
One aspect of this report considers explicitly the time component of transport, which is the
congestion analysis. Congestion increases travel time that can be monetised similar as in a
CBA and can be put into relation to GDP. With delay cost that amount to about 0.7% of
GDP for the EU15 congestion reaches a noticeable level. Three points affecting the impor-
tance of congestion should be mentioned: first, from the efficiency point of view a certain
level of congestion is reasonable as otherwise the infrastructure would be over-dimensioned
and hence inefficient. Second, a large share of this delay cost affects private passenger trans-
port. Third, the interviews conducted with key persons of different economic sectors revealed
that besides for two sectors (one of which is the transport services sector itself and the other
one is banking and insurance, which is expecting problems for high-level managers due to
rising congestion of air transport) congestion is not seen as a problem, but reliability. More
precise, the delays caused by congestion are not seen as a significant negative influence on
economic activity, as long as they are reliable (i.e. occur regularly and thus can be considered
in transport scheduling like the early morning peak-periods), while the uncertainty about arri-
val times is seen as an obstacle for economic success.
8.2 The influence of transport on competitiveness
We can treat competitiveness from three different angles: first, the cost of intermediate in-
puts into products and services is a determining influence on competitiveness of products or
sectors, and, second, the relative labour productivity or total factor productivity of sectors
72 Such an attempt is made for Germany to analyse comprehensively the time use of different person groups and
the time flows between the groups i.e. the time spent of adults for child care e.g. driving of children to school or kindergarden (Stahmer/Herrchen/Schaffer 2004).

- 162 - COMPETE Final Report: Importance of transport for competitiveness
compared with the competitors in other countries provides an indicator for competitiveness
of a sector. Third, high export shares or dynamic growth of exports also constitute an indica-
tion of significant competitiveness of sectors or economies.
We have shown by analysis of input-output tables that the share of transport intermediate
input to output is rather small with on average 2.2% for the EU15. However, some sectors
reach levels of above 10% in some countries e.g. trade and the transport service sectors
themselves. For such sectors transport policies may play a significant role for their competi-
tiveness.
The input-output results are confirmed by the ECOTRA study (TRT 2006). This study identified
the shares of transport input in comparison with the value of the final product. The highest
share is observed for processed food with 5-10% (e.g. tuna 5.7%, tomatoes 9.5%). For
automobiles the share is slightly below 4% and for textiles in the range of 1-3% (e.g. Jeans
0.9%, suit 2.8%). Especially the automobile sector belongs to the crucial sectors of many
European economies as it is contributing significant shares of exports. On the other hand
with 4% transport input it reaches a non-negligible level of automobile production value.
Looking at the transport activities of the automobile sector it can be observed that it is one of
the sectors which is increasingly using rail transport, in particular block trains. To large extent
this seems to be enabled by the European transport policy of the past 15 years, which focus-
sed on the revitalising of railways in particular by liberalisation e.g. enabling new entries on
the freight railway market that specialised for specific goods or sectors like automobiles or
chemicals; by harmonisation simplifying or even enabling for the first time significant cross-
border rail freight traffic, which is especially important for rail transport that disposes of
competitive advantages in particular for longer transport distances; and by promoting the
concept of dedicated freight railways, which increases the speed and reliability of rail freight
transport. All three measures are still in the process of continued implementation such that it
can be expected that in the future they will deliver further contributions to increase the com-
petitiveness of rail freight and hence of important sectors like automobiles or chemicals.
The analysis of the development of labour productivity and total factor productivity (sections
7.2 and 7.3) shows that especially labour productivity of the EU15 revealed a catch-up in
comparison with the US in the 1990ies, which would mean that the EU increased its com-
petitiveness compared to the US. However, looking at TFP the US always is amongst the
three top countries of the EU15 plus US group of countries. This indicates that capital in-
vestment was a driver of the labour productivity growth increasing capital intensity in the
transport sectors. This seems plausible also in the light of the EU policies to invest into TEN-T
and into inter-modal terminals as well as other goods handling facilities and equipment.
The econometric analysis of TFP growth suggests that investment into public transport and
communication infrastructure affects the growth of the transport sector and hence on the
whole economy (though with small elasticities of about 0.05 to 0.06). Our growth model
produced a similar prediction for the effect of transport infrastructure expenditure on eco-
nomic growth (in the range 0.05-0.1). These results are of interest particularly because they
are compatible with the results of previous empirical studies (discussed in our literature re-
view), but at (or even slightly below) the lower end of the range found previously.

COMPETE Final Report: Importance of transport for competitiveness - 163 -
For the influence of liberalisation the econometric analysis found no robust evidence of a
significant general direct impact. However, together with the construction of new infrastruc-
ture, liberalisation exhibited a significant positive impact on TFP growth — i.e. as a conse-
quence of liberalisation new infrastructure could be used more productively. In addition, in
the rail sector, liberalisation had a mild positive direct effect on productivity — this may tend
to support our arguments above that in this sector the European transport policy had a sig-
nificant impact on productivity of the sector and hence also on competitiveness of sectors
using rail transport in a growing manner like automobiles and chemicals.
Another issue relevant for competitiveness concerns potential future bottlenecks in the trans-
port system, which would affect reliability as this was mentioned as the most crucial issue by
most of the interviewed sectors. The most crucial issue seems to be the bottleneck of the
ports in the North Atlantic and Baltic regions and the Hinterland connections of some of
these ports. Though the ports infrastructure mostly is of good quality two of the most dy-
namic economic developments affect these ports: first, the continuous strong growth of
world trade (globalisation and extraordinary economic growth of China and India) which to
large extent passes through these ports as far as European exports to other world regions are
concerned, and second the growing containerisation of freight transport (which even leads in
some cases to bulk transport stored in containers) with its specific needs for load-
ing/unloading, storage and Hinterland distribution. If such bottlenecks affect reliability over a
longer period, like in the 2004 crisis at the Los Angeles/Long Beach ports in the US, the com-
petitiveness of European economies could be affected.

- 164 - COMPETE Final Report: Conclusions & further research
9 Conclusions
The COMPETE project tackled a number of complex issues circling around transport, conges-
tion, structural change and competitiveness of the European Union as such and in compari-
son with the US. As far as possible COMPETE aspired to provide hard facts for these issues,
which was not always possible.
The Panorama of Congestion broadly revealed that road congestion is mainly a problem for
selected cities in Europe, in particular the capitals, for the trunk road network in some Cen-
tral European countries and for the suburban arterials in a number of other European cities.
In contrast, in the US road congestion is not seen as a major issue, neither for interurban
transport nor for urban transport.
Despite this perception of congestion not being important the US and Canada set-up conges-
tion monitoring systems that can provide a blueprint for Europe to establish an own conges-
tion monitoring system that enables to observe congestion and to track the impacts of poli-
cies on congestion. Such a monitoring system would be started on selected sections of the
TEN-T networks and in selected large cities including the European capitals and would meas-
ure the delays caused by congestion.
Both in the EU and the US congestion is or could become relevant for those ports and their
Hinterland connections that serve a large share of international trade in particular those flows
using containers.
A sectoral analysis concerning the vulnerability to congestion concluded that only a few sec-
tors like transport services themselves, agriculture, food and retail sector reveal a high vulner-
ability to congestion. This result is confirmed both by setoral interviews and by the construc-
tion of a quantitative Index on Vulnerability of the Economy to Congestion (IVEC) based on
input-output tables for 11 countries. The interviewees pointed out that delays themselves are
not a significant problem but (un-)reliability would pose a thread to their businesses.
The econometric analysis of transport suggests that the elasticity of output to infrastructure
investments is in the range of 0.05 – 0.1, which is slightly lower than in the literature. Fur-
thermore a catch-up process of labour productivity of the EU15 compared with the US is ob-
served for the mid 1990ies such that at the beginning of this century the EU15 reached a
significantly higher level of labour productivity of their transport service sectors than the US.
The importance of transport for the economy seems to be higher for the EU than for the US,
which is a difference that largely developed over the past 10 years, which was a period with
strong transport policy-making by the EU, such that this should, at least partially, be a conse-
quence of European transport policy.
In particular, the EU policy of liberalisation, harmonisation and implementation of new (cross-
border) infrastructure for railways was successful as it raised productivity and hence competi-
tiveness of the railway sector, which was then more attractive for important economic sectors
of several EU countries like automobiles and chemicals. Both sectors significantly increased
the demand for rail freight service e.g. for transport of automobiles on block trains.

COMPETE Final Report: Conclusions & further research - 165 -
10 Further research questions
Though in theory the COMPETE project was a consultancy service, we had to treat it to a
large extent as a research project generating new knowledge but also ending with some new
research questions that could not be answered directly. This section briefly outlines a number
of these research questions dividing them into research and consultancy questions.
Research questions:
How reliable and comparable are international input-output-tables for transport
economic analysis i.e. how is own-account transport treated and to which extent is
transport only a correction factor to balance IO-tables (could be consultancy if only
practice of preparing IO-tables is collected by survey).
What is the value of reliability for passenger and freight transport i.e. willingness-to-
pay and meta analysis, proposal for standard valuation (differentiating recurring and
non-recurring congestion).
What is the option value of offering alternative modes to transport users and of be-
ing more resilient to external shocks. Is it more efficient to be resilient but more
costly as a transport sector or more vulnerable, less costly and the government pays
the sector in case of external shocks.
Cohesion vs competitiveness of the EU: how to design transport policies to make
them both fit together.
Is there an advantage e.g. in terms of employment of a self-sufficient regional econ-
omy in comparison with a trade and transport growth driven globalised economy.
Do innovations of transport generate spillovers to the rest of economy and what is
the size of these spillovers (differentiate two kind of innovations new technology
and new organization).
How does increased competitiveness of the transport sector affect and drive the
competitiveness of the whole economy i.e. probably requires full economic models
like CGE, econometric or system dynamics economic models. In particular, the us-
ability of an explicit time component in such model makes it useful.
Consultancy questions:
Surveying of trends of out-/insourcing logistics in sectors in the EU and the US.
Implementation of congestion monitoring system developed with the work of
COMPETE on the Panorama of Congestion.
In-depth analysis of congestion costs in the aviation and in the road freight sector
including development of delay costs and mechanisms of cost shifting in competitive
markets based on standardised surveys. For aviation the comparison between EU
and US would be useful.

- 166 - COMPETE Final Report: Glossary
11 Glossary of terms
Term Explanation Convoy kilometres Convoy kilometres, in the context of this report, refers to output in the public
transport sector defined in terms of the capacity provided for public transport, rather than the actual utilisation of the service.
Cost function It is a function which relates costs of production to a set of input prices and output level. It results from the cost-minimising behaviour of firms.
Diminishing returns A fall in the marginal product of an input that occurs as additional units of the input are added to production, holding all other inputs constant
Divisia index The Divisia index is a weighted sum of growth rates, where the weights are the components' shares in total value.
Economies of scale When an expansion in output leads to less than proportionate increase in costs, so that average costs per unit decrease
Economies of density In a network industry, returns to density tells the increase in costs brought about by changes in output, keeping network characteristics (e.g. customers or network length) fixed.
Elasticity Elasticity measures the percentage change that will occur in one variable in response to a one percentage change in another variable, holding all other things constant. Elasticity of substitution measures the elasticity of the ratio of two inputs to a production function with respect to the ratio of their marginal products. With competitive demands, this is also the elasticity with respect to their price ratio.
Homogeneity of degree N A function y is said to be homogenous of degree N when, if you scale all argu-ments in the function by a factor x, the value of the function is multiplied by xN.
Marginal cost The marginal cost is the change in cost that arises to produce an additional unit of output.
Marginal product The change in output as one more unit of an input is added, holding all other inputs constant.
Optimisation problem The optimisation problem for a firm usually involves profit maximisation: which is either to maximise production for a given level of costs, or minimise costs for a given level of output. An optimal level of inputs is chosen, given assumptions regarding the parameters of the production and cost function. For a consumer the optimisation problem involves maximising utility by choos-ing levels of consumption of goods, subject to a budget constraint.
Perpetual inventory method It is one of the most widely used methods to build capital stock series from data on gross fixed capital formation and assumptions on the initial capital stock, scrap rates and (if the final objective is net, rather than gross, capital stock) depreciation rates.
Present value The present value of a stream of monetary values adjusts the funds for time preferences by discounting appropriately (usually with the rate of interest)
Production function A function that specifies the relationship between output and the inputs of production.
Public good A good that has the property that one individual's consumption of it does not reduce others' ability to consume (non-rivalrous). It is also not possible to ex-clude some consumers from consuming the good once the good has been provided (non-excludable).
Returns to scale In a production function framework, returns to scale tell, for a given increase in all inputs, the increase in output: there are increasing returns to scale when the increase in output is more than proportional than the increase in inputs.
Shadow price of public infrastructure
The shadow price of public infrastructure is measured as minus the derivative of the cost function with respect to the stock of public infrastructure, so that a positive value means that an extra unit of public infrastructure reduces private costs. The shadow price of public infrastructure might also be defined as the gross return of public infrastructure
Socially optimum A socially optimum equilibrium is one where the net social benefits are maxi-mised (this includes both private costs and benefits and externalities imposed on others)

COMPETE Final Report: Glossary - 167 -
Social user cost of public infrastructure
It might be defined as the sum of the depreciation rate, the opportunity cost of public capital and the shadow price of public funds.
Total factor productivity Total factor productivity is a measure of the output of an industry or economy relative to the size of its factor inputs. A growth in TFP is the growth of real output beyond what can be attributed to increases in the quantities of labour and capital employed.
Tornqvist approximation Tornqvist approximation is a discrete-time approximation to a Divisia index, in which averages over time fill in the quantities of capital and labour.
Utility function A function that defines how the utility (well-being) of an individual changes with consumption of the goods, which can also be defined broadly to include lei-sure.

- 168 - COMPETE Final Report: References
12 References
ACI - Airports Council International (2005): “Air capacity, efficiency and safety in Europe”. General Comments on Commission Staff Working Document. http://ec.europa.eu/ trans-port/air/consultation/2005_11_30_en.htm.
AEA - Association of European Airlines (2005): "AEA Comments on the Commission Staff Working Document Airport capacity, efficiency and safety in Europe". November 14, 2005.
AECOM (2001): "Freight Benefit/Cost Study: Compilation of the Literature". FHWA, US De-partment of Transportation. http://ops.fhwa.dot.gov/freight.
Airlines Gate (2001): “Airports and Airspaces Congestion Issues”. The World of Commercial Aviation. http://airlinesgate.free.fr/articles/.
Appert, M (2004): “Dynamiques territoriales méditerranéenne : dynamiques urbaines méditerra-néenne – Evaluation de la congestion des réseaux routiers urbains : les cas de Montpellier, Nice et Lille”. Report, University of Montpellier.
Aschauer DA (1989): “Is public expenditure productive?”. In: Journal of Monetary Economics, vol. 23, pp. 177-200.
Aschauer DA (2000): “Do states optimize? Public capital and economic growth”. In Annals of Regional Science, vol. 43, 3, pp. 343-363.
AVV (2005): "Filemonitor 2005". Adviesdienst Verkeer en Vervoer, Rotterdam, February 2005.
BAG - Bundesamt für Güterverkehr (2004): "Marktbeobachtung Güterverkehr, Jahresbericht 2003". Köln.
Bajo Rubio O, Sosvilla Rivero S (1993): “Does public capital affect private sector perform-ance?”. In: Economic Modelling, pp. 179-185.
Barkeley M (2004): “Airport Capacity Benchmark Report”. US Department of Transportation, Federal Aviation Association (FAA). http://www.faa.gov/events/benchmarks/.
Barnes G, Langworthy P (2003): "The Per-mile Costs of Operating Automobiles and Trucks". University of Minnesota, Minneapolis.
Barro R, Sala I Martin K, (1992): "Public finance in models of economic growth". In: Review of Economic Studies, 59, p. 645 – 661.
Barro R, Sala I Martin K, (2004): "Economic Growth". MIT Press.
Baum H (2001): "Kapazitätssituation der Verkehrsinfrastruktur in Deutschland". Institut für Verkehrswissenschaft an der Universität zu Köln, 2001. Studie für das FOCUS Magazin, in Auszügen veröffentlicht in Focus Nr. 50 vom 10.12.2001, p. 244 - 250.
Bell MGH, Quddus MA, Schmöcker JD, Fonzone A (2004): "The impact of the congestion charge on the retail sector". Centre for Transport Studies, Imperial College London. www.johnlewispartnership.co.uk/assets/pdf/BellReport.pdf.
Bennett, S (2005): "World Cities Research - Report on Comparable Medium Sized Cities". Report prepared for the UK Commission on Integrated Transport. MVA, March 2005.

COMPETE Final Report: References - 169 -
BGL (2002): "Verkehrswirtschaftliche Zahlen (VWZ) 2002". Bundesverband Güterkraftver-kehr, Logistik und Entsorgung (BGL) e. V., Frankfurt am Main.
BGL (2006): "Kosteninformationssystem für leistungsorientierte Kalkulation von Strassengü-tertransporten". Bundesverband Güterkraftverkehr, Logistik und Entsorgung (BGL) e. V., Frankfurt am Main.
Bisignani G (2006): “State of the Industry Annual General Meeting and World Air Transport Summit 2006”. International Air Transport Association (IATA). http://www.iata.org /pressroom/speeches/2006-06-05-01.htm.
Boarnet M (1996): “Spillovers. The direct and indirect economic effect of transportation in-frastructure”. In: Department of Urban and Regional Planning and Institute for Transporta-tion Studies, University of California, Irvine. UCTC, 340.
Bozuwa J, Van der Flier M, Tollenaar R, Vocks L (1999): "Transport costs in relation to Europe’s competitiveness on a global level". Institute for Perspective Technological Stud-ies. NEI, Rotterdam.
Bremmer D, Cotton K, Cotey D, Prestrud Ch, Wetstby G (2004): "Measuring Congestion: Learning From Operational Data". Washington State Department of Transportation. http://plan4operations.dot.gov/Docs/WSDOT.pdf.
Brooks MR, Hodgson JR, Frost JD (2006): "Short Sea Shipping on the East Coast of North America: An analysis of opportunities and issues". Canada–Dalhousie University.
BTS (2005): "National Transportation Statistics 2005". Bureau of Transportation Statistics (BTS), U.S. Department of Transportation. Washington DC.
BTS (2006): National Transportation Statistics. Online Document accessed June 2006. URL: http://www.bts.gov/publications/national_transportation_statistics/ .
Cadot O, Roller LH, Stephan A (1999): “A political economy model of infrastructure alloca-tion: an empirical assessment”. In: CEPR Discussion paper, 2336.
Cadot O, Roller LH, Stephan A (2004): “Contribution to productivity or pork barrel? The two faces of infrastructure investment”. In: DIW Discussions Papers, 458.
Cambridge Systematics (2004): "Cross Border Short-sea Shipping Study". Final Report pre-pared for Transport Canada.
Cambridge Systematics (2005a): "Traffic Congestion and Reliability: Trends and Advanced Strategies for Congestion Mitigation". Final Report, Texas Transportation Institute. http://ops.fhwa.dot.gov/congestion_report_04/index.htm.
Cambridge Systematics (2005b): "An Initial Assessment of Freight Bottlenecks on Highways." White paper, prepared for Federal Highway Administration Office of Transportation Policy Studies.
Canaleta CG, Arzoz PP, Garate MR (1998): “Public capital, regional productivity and spatial spillovers”. In: University of Navarra, mimeo.
CEDR (2004): "European Road Users Survey 2004". Conference of European Directors of Roads, I&O Research Enschede.
CETE Méditerranée (2004) : “Analyse de la saturation routière en PACA” (Provence – Alpes – Côte d’Azur). Report.

- 170 - COMPETE Final Report: References
Cohen J, Morrison C (2003a): “Airport infrastructure spillovers in a network system”. In: Journal of Urban Economics, vol. 54, pp. 459-473.
Cohen J, Morrison C (2003b): “Public infrastructure investment, inter-state spillovers, and manufacturing costs”. Mimeo.
Crowhurst E (2003): "Traffic Speeds in English Urban Areas" 2002. Department for Trans-port. London, March 2003.
CSCMP (2006) : "2State of Logistics Report 2006". Council of Supply Chain Management Professionals.
De Ceuster G et al. (2005): "ASSESS - Assessment of the contribution of the TEN and other transport policy measures to the mid-term implementation of the White Paper on the European Transport Policy for 2010", Final Report.
DEFRA (2005): "The Validity of Food Miles as an Indicator of Sustainable Development". Final Report. AEA Technology on behalf of DEFRA (Department for Environment, Food and Ru-ral Affairs, UK). Didcot UK.
Delgado Rodriguez MJ, Alvarez Ayuso I. (2000): “Public productive infrastructure and eco-nomic growth”. In: ERSA 39th Congress.
Denis, McMorrow, Röger (2004): "An analysis of EU and US productivity developments (a total economy and industry level perspective)". Economic Papers, European Commission DG ECFIN, Brussels.
DETR (1998): "National Road Traffic Forecasts" (Great Britain) 1997. Working Paper No. 4, Constraining Forecast Traffic Growth to the Road Network: The Fitting-On Process. De-partment for the Environment, Transport and the Regions, 1998.
DETR (2006): "National strategy to reduce congestion on America’s transportation network", Department for the Environment, Transport and the Regions, May 2006.
DfT (2000) Transport, Statistics, Roads (2000): "A measure of road traffic congestion in Eng-land", Method and 2000 Baseline figures. London, 2000.
DfT (2001): "Vehicle Speeds in Great Britain" 2000, Department for Transport, Local Gov-ernment and the Regions. Statistical Bulletin (01)18. London, July 2001.
DfT (2003): "Vehicle Speeds in Great Britain" 2002. Department for Transport, Local Gov-ernment and the Regions, Statistical Bulletin (03)24. London, June 2003.
DfT (2005): "Vehicle Speeds in Great Britain" 2004, Department for Transport, Local Gov-ernment and the Regions. Statistical Bulletin (05)23. London, May 2005.
DfT (2006). "Transport Trends 2005 edition". Transportation Statistics, Department for Transport (DfT) London, UK. http://www.dft.gov.uk/stellent/groups/dft_transstats/ documents/downloadable/dft_transstats_035650.pdf.
Direction Régionale de l’Équipement d’Ile-de-France (2004): "Les Déplacements sur le réseau de vois rapides urbaines d’Ile-de-France". www.sytadin.equipement.gouv.fr.
Dodgson J, Lane B (1997): "The Cost of Road Congestion in Great Britain". NERA Briefing Paper. www.nera.com/image/3897.pdf.

COMPETE Final Report: References - 171 -
Doll C (2002): "Transport User Cost and Benefit Case Studies". UNITE (UNIfication of ac-counts and marginal costs for Transport Efficiency) Deliverable 7. Funded by 5th Frame-work RTD Programme. ITS, University of Leeds, Karlsruhe, November 2002.
DOT (2006): "Air Travel Consumer Report". Issue February 2006. Edited by the Office of En-forcement and Proceedings, Department of Transportation, Washington DC.
DOT (2006b): "National Strategy to Reduce Congestion on America’s Transportation Net-work". Department of Transport, Washington DC, May 2006.
Duggal V, Saltzman C, Klein L (1999): “Infrastructure and productivity: a nonlinear ap-proach”. Journal of Econometrics, vol. 92, pp. 47-74.
Dunning J (2005): "World Cities Research", Final Report on Comparable World Cities. Report prepared for the UK Commission on Integrated Transport. MVA, March 2005.
EC - European Commission (1992): "The future development of the common transport policy - A global approach to the construction of a Community framework for sustainable mobil-ity". COM (1992) 494, Brussels.
EC - European Commission (1998): "Fair Payment for Infrastructure Use: A phased approach to a common transport infrastructure charging framework in the EU". COM (1998) 466, Brussels.
EC - European Commission (2000): "The Auto-Oil II Programme". A report from the services of the European Commission: Directorates General for Economic and Financial Affairs, En-terprise, Transport and Energy, Environment, Research and Taxation and Customs Union.
EC - European Commission (2001): "White Paper: European Transport Policy for 2010: time to decide". http://europa.eu.int/comm/energy_transport/library/lb_texte_complet_ en.pdf. Accessed July 25th 2005.
EC – European Commission (2002): "European Union: Energy & Transport in Figures 2002". Published by EC DG-TREN and EUROSTAT, Brussels.
EC - European Commission (2003): " European Union: Energy & Transport in Figures 2003". Published by EC DG-TREN and EUROSTAT, Brussels.
EC – European Commission (2005a): "European Union: Energy & Transport in Figures 2005". Published by EC DG-TREN and EUROSTAT, Brussels. http://ec.europa.eu/dgs/ en-ergy_transport/figures/pocketbook/2005_en.htm.
EC - European Commission (2005b): “Air capacity, efficiency and safety in Europe”. Commis-sion Staff Working Document, . http://ec.europa.eu/transport/air/consultation/ 2005_11_30_en.htm
EC – European Commission (2005c): “Transport and Energy in Figures 2005”. Directorate General for Energy and Transport in co-operation with Eurostat.
EC - European Commission (2006): "Keep Europe moving - Sustainable mobility for our con-tinent. Mid-term review of the European Commission’s 2001 Transport White Paper". http://ec.europa.eu/transport/transport_policy_review/index_en.htm. Accessed June 29th 2006.
ECMT – European Conference of Ministers of Transport (1998): "Round Table 110: Road Congestion in Europe". Paris.

- 172 - COMPETE Final Report: References
Economic Development Research Group (2005): "The Cost of Congestion to the Economy of the Portland Regions". http://www.portlandalliance.com/pdf/Congestion_Report.pdf.
ECORYS (2006): "Analysis of the impact of oil prices on the socio-economic situation in the transport sector". Draft Final Report. ECORYS Transport and Consultrans on behalf of the European Commission, DG TREN. Rotterdam.
Edinburgh City Centre Management Company (2004): "Proposed Congestion Charge Scheme for Edinburgh: An Assessment of its Potential Impact on the Retail Sector". Edin-burgh.
ERF – European Union Road Federation (2004): "European Road Statistics: 2004". Brussels.
Ernst & Young (2006): "Review of Transport for London’s Assessment of the Business and Economic Impacts of the Congestion Charge in Chapter 6 of Impacts Monitoring – Third Annual Report 2005". Final Report, Ernst & Young.
ESRC Transport Studies Unit (2004): "The Economic Costs of Road Traffic Congestion". Dis-cussion Paper from Rail Freight Group. University College London, UK.
EUROCONTROL (2004): "Challenges to Growth Study 2004 (CTG04)". European Organisa-tion for the Safety of Air Navigation, Eurocontrol.
EUROSTAT (2004). “Extra EU trade of Member States by mode of transport”. Statistics in Focus, Eurostat. http://epp.eurostat.ec.europa.eu/cache/ITY_OFFPUB/KS-NZ-04-003/EN/KS-NZ-04-003-EN.PDF
EUROSTAT (2006a): "Online Statistics". http://epp.eurostat.ec.europa.eu/portal/ page?_pageid=0,1136173,0_45570701&_dad=portal&_schema=PORTAL.
EUROSTAT (2006b): "Relative price levels for new passenger cars in Europe for 2004". Statis-tics in focus, Economy and Finance 3/2006. Eurostat, Luxembourg.
Evans P, Karras G (1994): “Is government capital productive? Evidence form a panel of seven countries”. In: Journal of Macroeconomics, vol. 16, pp. 271-279.
FGSV (1997): "EWS - Empfehlungen für Wirtschaftlichkeitsstudien an Straßen" (Recommen-dations for the economic assessments of roads), Forschungsgesellschaft für Straßen- und Verkehrswesen, Köln.
FGSV (2005): "HBS – Handbuch für die Bemessung von Straßenverkehrsanlagen" (Handbook for the dimensioning of road facilities). Forschungsgesellschaft für Straßen- und Verkehrs-wesen (FGSV), Köln, edition 2001, revised 2005.
FHWA – Federal Highway Administration (2004): "Highway Statistics 2004". https://www.fhwa.dot.gov/policy/ohim/hs04/mv.htm.
Frost (2006): “Innovation Spurs North American Air Traffic Management Markets”. HIS Aero-space. http://aero.ihs.com/news-06Q2/frost-air-traffic-management.jsp.
Giuliano G, Brien Th, Dell’aquila P, Hayden S (2005): "The Terminal Gate Appointment Sys-tem at the Ports of Los Angeles and Long Beach: An Assessment". TRB 2006 Annual Meeting CD-Rom. http://www.metrans.org/nuf/documents/Giuliano_OBrien.pdf.
GLA (2005): "The congestion charge’s impact on retail – The London experience", Working Paper 12, Greater London Authority (GLA) Economics, Authors: M. Quddus, A. Carmel and M. g. H. Bell. London.

COMPETE Final Report: References - 173 -
Golob TF, Regan AC (2000): "Freight Industry Attitudes Towards Policies to Reduce Conges-tion". Transportation Research-E, Vol. 36, pp. 55 - 57.
Gramlich EM (1994): “Infrastructure Investment: a review essay”. In: Journal of Economic Literature, vol. 32, pp. 1176-1196.
Griffith R, Redding S, Van Reenen J (2004): “Mapping the two faces of R&D: productivity growth in a panel of OECD industries”. In: The Review of Economics and Statistics, vol. 86, pp. 883-895.
Günthner W (2001): "Technische und logistische Maßnahmen zur weiteren Entwicklung der Verkehre über die deutschen und österreichischen Donauhäfen". Studie Donau-Logistik, Garching bei München.
Hamer, R., Jong, G. De, Kroes, E.P. (2005): "The value of reliability in Transport – Provisional values for the Netherlands based on expert opinion". RAND Technical Report Series, TR-240-AVV, Netherlands.
Hansen M, Gosling G, Margulici JD, Wei WB (2001): ”Influence of Capacity Constraints on Airline Fleet Mix“. Institute of Transportation Studies. Research Reports. http://repositoiries.cdlib.org/its/reports/UCB-ITS-RR-2001-6.
Hartwig KH (2005): "Volkswirtschaftliche Effekte unterlassener Infrastrukturinvestitionen". Institut für Verkehrswissenschaft, Westfälische Wilhelms-Universität Münster, Münster.
Head K, Ries J, Swenson D (1995): "Agglomeration Benefits and Location Choice: Evidence from Japanese Manufacturing Investment in the United States". Journal of International Economics, Vol. 38(3/4, May), pp. 223 - 247.
Holtz-Eakin D (1994): “Public-sector capital and the productivity puzzle”. In: The Review of Economics and Statistics, vol. 76, pp. 12-21.
House of Commons (2002): "Overcrowding on Public Transport". Seventh Report of Session 2002-03, Volume 1. House of Commons Transport Committee, London.
Hvid EL (2004a): "Traffic Congestion Costs (in the wider Copenhagen Region)". English summary report, COWI A/S, Copenhagen, August 2004.
Hvid EL (2004b): "Trængselskortlægning i Hovedstadsområdet". Full report to the Traffic con-gestion costs study (Danish only).
HypoVereinsbank (2005): "Europas Beste – Vorbilder für deutsche Metropolen im Standort-wettbewerb?!" Hamburg – München – Köln. http://www.hypovereinsbank.de /media/pdf/HVB_Metropolenstudie_Berlin_Nov_05.pdf.
IATA - International Air Traffic Association (2006): "Airline network benefits". IATA Economic Briefing No3.
INFAS/DIW (2004): "Mobilität in Deutschland 2002 - Kontinuierliche Erhebung zum Ver-kehrsverhalten". KONTIV Ergebnisbericht. Institut für angewandte Sozialwissenschaft (In-fas) und Deutsches Institut für Wirtschaftsforschung (DIW) im Auftrag des Bundesministe-riums für Verkehr, Bau- und Wohnungswesen, Bonn und Berlin.
Infras (1998): "Astra - Staukosten im Strassenverkehr". Schlussbericht. Infras, Bern, 31.12.1998.
Infras (2003): "Stau und Langsamfahrkosten im Kanton Zug". Amt für Raumplanung Kanton Zug. Bern, 22.05.2003.

- 174 - COMPETE Final Report: References
IRU (1998a): "Economic Cost of Barriers to Road Transport". Executive Summary. The Hague Consulting Group on behalf of the International Road Transport Union (IRU). Geneva.
IRU (1998b): "Economic Cost of Barriers to Road Transport". Full Report. The Hague Consult-ing Group on behalf of the International Road Transport Union (IRU). Cambridge.
IVV/Brilon (2004): "Engpassuntersuchung für das BAB-Netz - Stufe 2". Report to the Federal Ministry for Transport, Building and Housing (BMVBS), Referat S10. Aachen, Bochum, Oc-tober 2004.
Kamps C (2004): “New estimates of Government net capital stocks for 22 OECD countries 1960-2001”. In: IMF working papers, 67.
Kamps C (2005): “Is there a lack of public capital in the European Union?”. In: Kiel Institute of World Economics.
Karp A (2005): “Maxing Out East. Congestion and capacity constraints are threatening the East Coast’s top cargo airports.” Air Cargo World. http://www.aircargoworld.com/ ar-chives/.
Kelejian H, Robinson D (1997): “Infrastructure productivity estimation and its underlying econometric specifications: a sensitivity analysis”. In: Regional Science, vol. 76, pp. 115-131.
Kemmerling A, Stephan A (2002): “The contribution of local public infrastructure to private productivity and its political economy: evidence from a panel of large German cities”. In: Public Choice, vol. 113, pp.403-422.
Klaus P, Kille C (2006): "Die TOP 100 der Logistik – Marktgrößen, Marktsegmente und Marktführer in der Logistikdienstleistungswirtschaft". 4th edition, Deutscher Verkehrs Ver-lag, Hamburg.
Koopmans C, Kroes E (2004): "Estimation of Congestion Costs in the Netherlands". Discus-sion Paper No. 28, Universiteit van Amsterdam. SEO.
Kouwenhoven M., Jong GC de, Rietveld P (2005a): "Reliability Ratio’s voor het Goerderen-veroer". Final report to AVV. RAND Technical Report Series, WR-274-AVV, Netherlands.
La Ferrara EL, Marcellino M (2000): “Is public expenditure productive?”. In: mimeo, Universi-ta’ Bocconi.
Lakshmanan TR, Anderson WP, Li D (2005): "Growth of U.S. Trade and Industrial Competi-tiveness: The Role of Transportation". Report prepared for the US-DOT, Boston.
Lakshmanan TR, Anderson WP (2002): "Transportation Infrastructure, Freight Services Sector and Economic Growth". Centre for Transportation Studies, Boston University. http://www.ncgia.ucsb.edu/stella/meetings/20020115/Lakshmanan.pdf.
Link H, Stewart L, Maibach M, Sansom T, Nellthorp J (2000): "The Accounts Approach". UNITE (UNIfication of accounts and marginal costs for Transport Efficiency) Deliverable 2. Funded by 5th Framework RTD Programme. ITS, University of Leeds, Leeds, October 2000.
Maibach M, Rothengatter W, Banfi S, Doll C, Sieber N, Zuber J (2000): "External Costs of Transport 1995". Final Report to the International Union of Railways (UIC), Paris. Zurich, Karlsruhe, April 2000.

COMPETE Final Report: References - 175 -
Maibach M, Rothengatter W, Doll C, Schneider C, Schmedding, D and Schreyer, C (2004): "External Costs of Transport – Update Study". Final Report to the International Union of Railways (UIC), Paris. Zurich, Karlsruhe, October 2004.
Mamatzakis EC (1999): “Public infrastructure, private input demand, and economic perform-ance of the Greek industry”. In: Queen Mary & Westfield College Working Paper, 406.
McKinnon A (2003): "The Effects of Transportation Investments on Logistical Efficiency". Heriot-Watt University, Edinburgh UK.
McKinnon A (2004a): "The Impact of Increasing Traffic Congestion on Logistical Efficiency". Logistics Research Centre, Heriot-Watt University, Edinburgh UK.
McKinnon A (2004b): "Logistics in an Era of Congested Infrastructure". Logistics Research Centre, Heriot-Watt University, Edinburgh UK. www.tnn.co.uk/research/plonearticle. 2004-10-27.7615857255.
METRANS (2002): "Transportation, International Trade and Economic Competitiveness". American Association of State Highway and Transportation Officials (AASHTO), Long Beach, California, US.
Ministerio de Fomento (2006): "Observatorio de costes del transporte de mercancías por carretera". Ministerio de Fomento España, Secretaría General de Transportes, Dirección General de Transportes por Carretera.
Moore B, O’Neill D (1996): "The Impact of redundancies on local labour markets and the post redundancy experience". Research Studies RS23, Department for Education and Em-ployment.
Moreno R, Lopez Bazo E, Artis M (2003): “On the effectiveness of private and public capital”. In: Applied Economics, vol. 35, pp. 727-740.
Morrison C, Schwartz AE (1996): “State infrastructure and productive performance”. In: The American Economic Review, vol. 86, pp. 1095-1111
Munnel AH (1990): “How does public infrastructure affect regional economic perform-ance?”. In: New England Economic Review, pp. 11-32.
Muñoz de Escalona, Francisco (2004): La congestión del tráfico urbano. Causas, medidas, costes. Contribuciones a la Economía, September 2004.
Nadiri MI, Mamuneas T (1998): “The effects of public infrastructure and R&D capital on the cost structure and performance of the U.S. manufacturing industries”. In: The Review of Economic and Statistics, vol. 76, pp. 22-37.
Nash Ch, Sansom T (1999): "Calculating Transport Congestion and Scarcity Costs". Final Report of the Expert Advisors to the high Level Group on Infrastructure Charging (Work-ing Group 2, ITS).
Nash et al. (2003): "UNITE" (UNIfication of accounts and marginal costs for Transport Effi-ciency) Final Report for Publication, Funded by 5th Framework RTD Programme.
NCHRP Report 463 (2001): "Economic Implications of Congestion”. Transportation Research Board, National Academy Press, Washington D.C.
NEA (2004): "Cost comparison and cost developments in the European road haulage sector". NEA Transport research and planning. Rijswijk (NL).

- 176 - COMPETE Final Report: References
NEI (2001): "Competition in East-West Road Transport Markets". An executive summary of a study, commissioned by the IRU. http://www.iru.org/Publications/PDF/ Competition.pdf.
Network Rail (2005): Annual Report 2004.
Nicoletti G, Scarpetta S (2003): “Regulation, productivity and growth: OECD evidence”. In: Economic Policy, April, pp.9-72.
North American Transportation Statistics (2006): "North American Merchandise Trade statis-tics". U.S. Department of Transportation, Bureau of Transportation Statistics; U.S. De-partment of Commerce, Census Bureau; Statistics Canada, Transport Canada; Instituto Mexicano del Transporte, Instituto Nacional de Estadística, Geografía e Informática, Secre-taría de Comunicaciones y Transportes.
O’Mahoney, Ark (2003): "EU Productivity and Competitiveness: an industry perspective – can Europe resume the catching-up process".
OECD - Organisation for Economic Co-operation and Development (1995): "Urban Travel and Sustainable Development". Paris.
OECD – Organisation for Economic Co-operation and Development (1999): “TRILOG-Europe project". End Report.
OECD – Organisation for Economic Co-operation and Development (2006): "STAN Bilateral Trade Database". http://cs4-hq.oecd.org/oecd/.
Pereira A, Roca Sagales O (1999): “Public capital formation and regional development in Spain”. In: Review of Development Economics, vol. 3, pp. 281-294.
Picci L (1999): “Productivity and Infrastructure in the Italian Regions”. In: Giornale degli Economisti a Annali di Economia.
Quddus M, Carmel A, Bell M (2005): "The congestion charge‘s impact on retail - The Lon-don experience". Working Paper No. 12, Greater London Authority. City Hall.
RECORDIT (2001): "REal COst Reduction of Door-to-door Intermodal Transport (RECORDIT) - Deliverable D5: Identification and calculation of taxes charges and subsidies". NO-INRO/ ISIS /Gruppo CLAS/ ZEW /ENPC/ Cranfield University/IER/ TETRAPLAN.
Regan A, Golob T (1999): "Freight Operators’ Perception of Congestion Problems and the Application of Advanced Technologies: Results from a 1998 Survey of 1200 Companies Operating in California". Transportation Journal 38 (3): pp. 57.
REVENUE (2005): "Revenue Use form Transport Pricing (REVENUE)". Case Studies Specifica-tion. REVENUE Project Deliverable D3. S. Suter, U. Springer, A. de Palma, R. Lindsey, S. van der Loo, A. Ricci, P. Fagiani, P. Moilanen, M. van der Hoofd, M. Carmona and J. Baker. Funded by 5th Framework RTD Programme. ISIS, Rome.
RHA (2006): "Goods Vehicle – Operating Costs 2006". Road Haulage Association (RHA).
Robusté F, Monzón A (1995): "Una metodología simple para estimar los costes derivados de la congestión del tráfico en ciudades. Aplicación a Madrid y Barcelona". Congreso Na-cional de Economía. Las Palmas de Gran canaria. Diciembre, 1995. CIES, vol. 3 “Economía del Transporte”, pp. 117-123.

COMPETE Final Report: References - 177 -
Rovolis A, Spence N (2002): “Duality theory and cost function analysis in a regional context: the impact of public infrastructure capital in the Greek regions”. In: Annals of Regional Science, vol. 36, pp. 55-78.
Sauvant A. (2002) “Des réserves importantes de capacité à long terme dans les principales lignes ferroviaires à grande vitesse et les grands aéroports parisiens”. Notes de Synthèse du SES.
Schade W, Schaffer A, Czyzewski A, Orlowski W (2004): "Qualitative Assessment of Trans-port Policy Impacts in Accession Countries, Transportation Infrastructure and Policy: A macroeconomic Analysis for the EU". Cambridge Econometrics. http://www.camecon.co.uk/services/projects/Tipmac/pdfs/TIPMAC_D6_040524.pdf.
Schrank D, Lomax T (2005): "The 2005 Urban Mobility Report". Texas Transportation In-stitute (TTI). http://mobility.tamu.edu/.
Scottish Executive (2003): Congestion on Scottish Trunk Roads 2003.
Seitz H, Licht G (1995): “The impact of public infrastructure capital on regional manufactur-ing production cost”. In: Regional Studies, vol. 29, pp. 231-240.
Shioji E (2001): “Public capital and economic growth: A convergence approach”. In: Journal of Economic Growth, vol. 6, pp 205-227.
Smith ASJ (2006): "Are Britain's Railways Costing Too Much?" Journal of Transport Econom-ics and Policy, Volume 40 Part 1, January 2006, pp. 1 - 44.
Sposavic Lazar N (2001): "Mobility and the Cost of Congestion in New Jersey". New Jersey Institute of Technology. Newark. New Jersey. http://transportation.njit.edu/NCTIP/ final_report/Mobility_and_the_Costs_of_Congestion.pdf.
Stahmer C, Herrchen I, Schaffer A (2004): "Sozio-ökonomische Input-Output-Rechnung 1998". German Statistical Office DeStatis, Wiesbaden.
Stephan A (2001): “Regional infrastructure policy and its impact on productivity: a compari-son of Germany and France”. In: DIW Discussions Papers.
Stephan A (2003): “Assessing the contribution of public capital to private production: evi-dence from the German manufacturing sector”. In: International Review of Applied Eco-nomics, vol. 17, pp. 399-418.
Stiftung Warentest (2001): "(Un)puenktlichkeit der Bahn". Stiftung Warentest, 20.11.2003.
Sturm JE, de Haan J (1995): “Is public expenditure really productive? New evidence for the US and the Netherlands”. In: Economic Modelling, vol. 12, pp. 60-72.
Sturm JE, de Haan J (1998): “Modelling government investment and economic growth on a macro level: a review”. In: Brackman S, van Eas, H Kuipers SK (eds), Market Behaviour and Macroeconomic Modelling. MacMillan Press, London.
Tatom JA (1991): “Public capital and private sector performance”. In: Federal Reserve Bank of st. Luis.
TEN-STAC (2003): "Scenarios, Traffic Forecasts, and Analysis of Corridors on the Trans-European Networks - Deliverable D6: Traffic, Bottlenecks, and Environmental Analysis on 25 Corridors".

- 178 - COMPETE Final Report: References
Transport Canada (2006): "The Cost of urban congestion in Canada". Transport Canada Environmental Affairs March 22, 2006.
TRB (2000): "Highway Capacity Manual (HCM)". Edition 2000. Transportation Research Board, Washington D. C., 2000.
TRT (2006): "ECOTRA: Energy use and cost in freight transport chains". Final Report on be-half of the Institute for Prospective Technological Studies (IPTS), EC DG-JRC. TRT Trasporti e Territorio srl, Milano.
TTI/CS (2004): "Monitoring Urban Freeways in 2003: Current Conditions and Trends from Archived Data". US Department of Transportation, Federal Highway Administration, Washington D.C. Texas Transportation Institute and Cambridge Systematics, December 2004.
Ufficio Italiano dei Cambi (2004): "I costi del trasporto internazionale di merci". Ufficio Italia-no dei Cambi (UIC), Roma.
UIC (2006): "International Railway Statistics 2004". Union Internationale des Chemins de fer (UIC). Paris.
UNECE (2000): Census of motor traffic on main international traffic arteries. United Nations Economic Commission for Europe, Paris.
US-DOT – US Department of Transportation (1998): "Transportation Equity Act for the 21st Century (TEA-21)". http://www.fhwa.dot.gov/tea21/index.htm. Accessed June 26th 2006.
US-DOT – US Department of Transportation (2000): "The Changing Face of Transportation". Washington.
US-DOT – US Department of Transportation (2003): "Strategic Plan 2003 – 2008: safer, sim-pler, smarter transportation solutions". http://www.dot.gov/stratplan2008/ strategic_plan.htm. l Accessed June 26th 2006.
US-DOT – US Department of Transportation (2005a): "Safe, Accountable, Flexible, Efficient Transportation Equity Act: A Legacy for Users (SAFETEA-LU)". http://www.fhwa.dot.gov/safetealu/ index.htm. Accessed June 26th 2006.
US-DOT – US Department of Transportation (2005b): "The Electronic Freight Management Initiative". Federal Highway Administration, Washington, D.C. http://ops.fhwa.dot.gov /freight/intermodal/efmi/index.htm.
US-DOT - US Department of Transportation (2006a): "Freight in America -A New national picture". Washington D.C.
US-DOT – US Department of Transportation (2006b): "Air travel Consumer Report: Aviation Consumer Protection Division". http://airconsumer.ost.dot.gov/reports/2006/feburary/ 0602atcr.pdf.
US-EIA – US Energy Information Administration (2006): "International Energy Outlook 2006".
Vanhove F, De Ceuster G (2003): "Traffic Indices for the use of the Belgian motorway net-work". Working Paper No. 2003-01, Transport & Mobility, Leuven.

COMPETE Final Report: References - 179 -
Vickermann R (2005): "Evaluating the wider economic impacts of congestion charging schemes: the limitations of conventional modelling approaches". Centre for European, Regional and Transport Economics, University of Kent. Paper for 45th ERSA Congress Am-sterdam 2005, http://www.kent.ac.uk/economics/staff/rwv/WorkingPapers/ ERSA2005-congestioncharging.pdf.
Viegas, J. M. (2005): "Inter-Urban Road Pricing for Trucks in Europe". Research in Transpor-tation Economics, vol. 11. Elsevier.
VTPI (2006): "The Cost of Driving". Victoria Transport Policy Institute (VTPI). www.vtpi.org/tdm/tdm82.htm.
Washington Research Council (2001): "Congestion Inflates Local Cost of Living". http://www.researchcouncil.org/Briefs/2001/PB01-27/CongestionCPI.htm.
Weisbrod G, Vary D, Treyz G (2003): "Measuring the Economic Costs of Urban Traffic Con-gestion to Business". Transportation Research Record, Issue No. 1839, pp. 98 - 106.
Wharton D (2005): "Congestion charging schemes for Australian cities". Posted Monday, 25 July 2005 in Australia’s e-journal of social and political debate. http://www.onlineopinion.com.au/view.asp?article=3662.
Winsor-Cundell E (2003): "The retail survey: The impact of the congestion charge on the re-tail sector". The London Chamber of Commerce and Industry, London. www.londonchamber.co.uk/DocImages/395.pdf.
Zugasti A, Garcia RG, Maldonado JS (2001): “The effects of public infrastructure on the cost structure of Spanish industries”. In: Spanish Economic Review, vol. 3, pp. 131-150.


![Recent Development To Compete or Not to Compete: Illinois ... · 2017] To Compete or Not to Compete 1237 invalidate agreements that preclude employees from working for competitors](https://static.fdocuments.in/doc/165x107/6098987e936214473479030d/recent-development-to-compete-or-not-to-compete-illinois-2017-to-compete-or.jpg)