Sovereign Bunkruptcy in the EU in the Comperative Perspective
Upload
sheraz-khanCategory
view
280download
8
Chapter 1
Introduction
1.1 Introduction to Project:
This project is about doing comparative analysis of four companies selected from food industry
of Pakistan. For comparative analysis we have chosen the companies which are NATIONAL
FOOD LIMITED, NESTLÉ PAKISTAN, ENGRO FOODS LIMITED and SHEZAN
INTERNATIONAL LIMITED. These companies for many years are dealing in food products.
These companies have ample range of food products and their products are highly appreciated in
the market.
1.2 Source of Data:
Main data source is published annual reports of National Foods Ltd, Nestle Pakistan, Engro
Foods Ltd, and Shezan International Limited for the year ended at 2009, 2010, 2011, 2012, 2013
and 2014.
1.3 Methodology of Project
Methodology of project is based on Balance Sheet Analysis, Income Statement Analysis and
Ratio Analysis, for examining financial statements of any business it is best tool. We study the
relation among various sections of annual reports through ratio analysis. Ratios are often
considered a useful tool to find out that how company is doing in market and what their
economic position is. The purpose of ratio analysis is to find out at which position company is
performing week and how to improve it. Financial statements and their notes are the best source
for calculating ratios. In income statement and balance sheet analysis we study and compare the
performance of one company with other company.
Balance Sheet
Income Statement
Cash Flow Statement
1

1.4Performance Parameter:-
1.4.1Liquidity Ratios: Liquidity ratio explains that how much company is liquidated and
have ability to pay their obligations from the cash they have.
Quick ratio:
Quick ratio is use to find out the liquidity of a company. These are the assets which can be
quickly converted into cash within the 90 days.
Quick ratio = (Current asset - inventory)/ Current Liabilities.
Net Working Capital:-
Net working capital measures how much cash company has to pay its debt. A positive net
working capital shows that company have extra money that when they pay their debt.
Networking Capital = Current assets - Current liabilities
Current ratio:-
Current ratio measures that how much Current Assets Company has to pay their short term
obligations. A company having high current ratio shows that company is performing well while
lower current ratio indicated that company not performing well and also have high portion of
short term obligation which is not good for company.
Formula: Current Assets/ Current Liabilities
1.4.2 Profitability ratio:
Profitability ratio is a financial ratio which measures the company profitability regarding the
expenses and cost that company has incurred. For most of the profitability ratio, higher the ratio
from competitor means that company is performing well from rival firms.
Return on assets:-
This ratio tells us about the profitability of a company on their assets. When this ratio is higher
its good for company because they are earning more the investment they have made for the
purchasing of assets.
2

Return on Asset = Net income / Total assets
Return on equity:-
This ratio measures efficiency of a firm’s that unit of shareholders' equity is generating profit for
a firm. This ratio tells about how the firm will use their recourses to generate profit. The return
on equity is helpful tool for comparative study of firm competing in same industry.
Return on Equity = Net income/ Shareholder’s equity
Net profit margin:-
This is the ratio which tells us about how much of the net income is earned by company on their
sales.
NPM= Net income/ Net sales
Gross profit margin:-
GPM is a ratio which measure the financial health of a firm by dividing cost of goods sold from
total sales, which show that how much money lift after paying of cost. Gross profit margin is
used by investors to compare similar firms of an industry or yearly comparison in a company.
Gross Profit Margin = Gross Profit / Sales
1.4.3 Activity Analysis Ratio: - Activity ratio some time refer as management ratios,
it is used that to what extent a firm is using its total assets for example inventories and fixed
assets. Inventory and assets turnover are the ratios which are more frequently used.
Assets turnover ratio:-
This ratio can be calculated by dividing total sale by net assets. When this ratio is higher it’s
good for company because higher the ratio means that company is utilizing their assets
efficiently. Assets turnover ratio= Net sales/ Total assets
Inventory Turnover Ratio:-
Inventory turnover ratio show that how much inventory is converted into sales and then replace
during a fiscal year.
Inventory Turnover Ratio = Set sales / Inventory
3

1.4.4 Capital Structure Analysis:-
These are the ratio used for find out the solvency and liquidity of the company.
Debt equity ratio:-
This is an important ratio used by analyst and investors to measure the true risk in a company.
This ratio tells the investors that how much debt is employed in the capital of company. Higher
the ratio is a indication that company is aggressive in debt financing and low ratio indicate that
company has low liabilities which is a good point for attracting investors.
Debt to equity ratio = Net debt / Total shareholder’s equity
Debt to Asset Ratio:-
This ratio shows that how much debt is utilized in assets of the company rather than financed by
shareholder’s equity. The ratio is used to find out the financial risk of a business.
Debt to Asset ratio= Net debt/ Net assets
1.4.5 Capital Market Analysis Ratio:-
Some ratios are not calculated from balance sheet or income statement, but they are calculated
from market performance of the stock of company. These ratio measures the profit generation of
the company not just concern with the price of the stocks.
Earnings per share:-
In this ratio net profit is divided by outstanding share of the company.
Earnings per share = Net income / Number of outstanding shares
Payout ratio:-
It is a ratio of dividend being compensated to the shareholder’s. This ratio is used to find out that
what company is doing with their net income. The money that company not paid to their
shareholder’s as dividend is added to retained earnings of company.
Payout ratio= Dividends /Earning per share
PE Ratio:-
4
This ratio shows the linkage among price of the stock and earnings per share. This ratio is trendy
for stock analysis.
P/E = Stock price / Earnings per share
1.5 LIMITATION OF PERFORMANCE PARAMETERS:
In these performance parameters we use to analyze past performance of company on the basis of
which we cannot predict future trend and performance of company that it will achieve.
These parameters only focus on quantitative aspect and do not take account of qualitative aspect
of the company.
The main source of these parameters is financial statement and corporation website which
incorporate biasness of corporation so using these as foundation will deform project reliability
Business used major alteration and calculates approximately in account preparation but these
approximation and adjustments may be wide of the mark which will also affect project
credibility.
5

Chapter 2
History of Companies
2.1 NESTLÉ (Great Food, Good Life)
Nestle was build up in 1905. It was built in collaborations with Anglo Swiss milk company,
which was build up in 1866. Company was founded by George page, Charles Page and Farine
Lactee, who were siblings. The company was offering milk and baby food items at the start.
Nestle then take over many organizations which include Crosse and Blackwell, Rowntree
Mackintosh, Libby’s, Findus and Gerber.
Nestlé start with pasteurization milk and letter it was so developed that now days it is the leading
firm in providing food item, with having so many sub brands.. As of now Nestlé is dealing
filtered water, breakfast oats, Coffee, candy parlor, dairy items, dessert, pet sustenance’s,
different drinks, rack stable, chilled Ice cream, Infant nourishment, execution nourishment,
human services nourishment, refrigerated items and snacks. Twenty nine of Nestlé's brands that
offers about one billion Swiss franc yearly (about $ 1.12 billion). Nestlé has approximately 442
plants, which work in 85diffrent nations, and having approximately 328,000 employees working.
Nestle is one of the principle shareholders of L'Oréal, the world's biggest beauty care products
organization.
2.1.1 NESTLÉ in Pakistan
Nestle Pakistan Limited (NPL), formerly famous as Nestle Milkpak Company Limited, is a
subsidiary company of Nestle SA. It is listed on the KSE and LSE. For nine years in a string, the
corporation has won a place between the top twenty five companies of the KSE.
Nestle Pakistan serving their customers in Pakistan since 1988, the parent company Nestle
(Swiss-Base) obtain shares in Milk Pack Limited. Now days Nestle has completely set their self
according t needs of Pakistani people. Nestle Pakistan products are apparently considered as safe
products, delicious foods and full of nutrition, as a leading organization in sector which they
6

operate. Nestle Pakistan distribution system is so good that their products are reached to
everywhere in the country. Connivance is at the heart of the Nestlé way of thinking, and there
summit is to convey products to individuals'
2.2 Products:
Ambient Dairy: Ambient Dairy include following products.
NESTLÉ BUNYAD: NESTLÉ BUNYAD is prepared with Vitamin C and Iron, so that two
glasses daily help fulfill 60% of a child’s Guideline Daily Amounts.
NESTLÉ MILO: it is available in pack of 200ml ready to drink. It is in chocolate flavor that
gives you energy.
NESTLÉ MILKPAK: it nourishes people of Pakistan from since three decades.
NESTLÉ MILKPAK Cream: this product of nestle is available in rich, soft and lovely flavor that
quench your thirst.
NESTLÉ NIDO: It provides complete nourishment for children because Nestle believes mother
lover their children’s without any condition and always search to find quality product for their
child’s.
NESTLÉ NESVITA Calcium Plus: This product specially targeting women’s that work in
offices or home and tired from all day work to restore their energy and charge their lives.
NESTLÉ EVERYDAY: This cream is available for making coffee and tea. It having a great taste
and make perfect cup.
2.2.1 Juices
NESTLÉ FRUITA VITALS
This product of Nestle Pakistan is available in Apple, Red Grape Nectar, Pineapple, Guava,
Peach, & Orange variants.
NESFRUTA: Nesfruta comes in 200ml and also 1000ml.
7

2.2.2 Bottled Water
NESTLÉ PURE LIFE: Nestle serves broad variety of distilled bottle water to their customers.
Nestle guarantee their customer that they provide well quality product that are produced under
strict hygienic process
Range of Products:
Nestlé Pure Life is available in the different packaging formats:
18 Liter
5 Liter
1.5 Liter
0.5 liter
2.2.3 Culinary & Food:
NESTLÉ MAGGI NOODLES: This is easy to make and trusted product around the word
offered by Nestle, MAGGI is offered in Pakistan since last twenty years, generations from two
decades having grown up with the favorite MAGGI quickly served. MAGGI gives power to
mothers to show their love toward their children in cooking instantly cooking MAGGI for them.
Baby Food:
NESTLÉ CERELAC: From birth to 3 years of grow old, baby goes through a period of speedy
development and growth. Choosing the best nourishment for your baby can be tricky and
confusing and you always wonder if it’s just right. Nestle cerelac provide complete nourishment
for the baby.
Breakfast Cereals
NESTLÉ KOKO KRUNCH: KOKO KRUNCH is a delicious chocolate tasted rich cereals
loved by kids. Made with the goodness of whole grain
NESTLÉ CORN FLAKES: It not only serves a tasty morning meals but it contains ten
essential minerals and including calcium, vitamins & iron for a nutritious start to the day.
8

2.2.4 Coffee
NESCAFÉ: Four thousand cups of NESCAFÉ coffee are drunk around the world every second
by people, and every cup is enjoyed. NESCAFÉ is a brand that is loved by customers. People
emotions are connected to it and it bring people join.
NESCAFÉ GOLD: This is product loved by younger to keep their self energetic and fresh.
Coffee beans have rich taste and lovely smell.
NESCAFÉ 3 in 1: It is mixture of milk a little bit sugar and milk for making quick cup of
coffee.
2.2.5 Confectionery:
Kit Kat: Kit Kat is our no.1 global brand in confectionery and a valuable asset in our group. It
has a perfect balance of 69% milk
The given below is basic facts as regards Nestlé Pakistan:
Ticker: NESTLÉ
Country of operation: PAKISTAN
Stock exchange: KSE
Industry incorporated: Food & Beverages
Sub Industry: Different food products
2014 Sales: 96,457,743,000 (Dec 2014)
total employees: 2,422(2014)
Market Capital: 408,146,256,000
Year: ends in December
Total Outstanding Shares: 45,349,551
Type of Share: Ordinary share
9

2.3 ENGRO FOODS LIMITED (The Local Flavor with a global Vision)
Engro Foods Limited was built-in 2005 as a diversified industry of the Engro Group. EFL plant
is established at Sukkhur on twenty three acre land, its capacity of receipting milk 8,000,000
ltrs/day and ultra high temperature milk capacity of 800,000 ltrs /day. Engro Foods Limited plant
was build at expenditure of Rupees one billion, Engro Food has employees of about 1749 people
at the end of 2014.
Engro Foods started the food business by milk processing and then selling it to final customers.
Engro Food ltd vision was to grab the growth opportunities that persist in market of this sector.
Company is curious about their social responsibilities and making products environmental
friendly. Thus they want to improve live of people living at remote areas and take over the
scarcity.
Core Values:
1. To be leader of the market.
2. To bring in pioneering products.
3. To be globally focused and detain diversified market.
4. To keep up quality and work for unremitting improvement.
5. External & society Involvement.
6. The focal point should be personal growth and improvement.
7. Passionate search of revenue.
8. To keep pleased morals and integrity.
9. Environmental clean, nutrient and safe products should be made.
10. To promote partnership and teamwork.
2.3.1 Products:
OLPERS: Engro Foods launched their first product by the name of OLPERS. When Engro
Foods offer Olpers there were strong rival firms existed in the market. Opler capture market
share after few years as it was launched; it was because of its quality and features in the product.
Olper’s milk is Engroo food limited standard and homogenize pure UHT milk with 3% fat and 9
10

% non-fats. Olper’s is a premier brand, and targeting the customers who are quality conscious. It
is accessible in easy to open, six layered Tetra Pak Brick Aseptic red packaging and comes with
a 3 months shelf life. Olper’s is offered in four packs of 200 ml, 500ml, 1000 ml and 1500 ml
packs,.
OLPER’s LITE: This is hi calcium and low fat milk for younger’s who are health conscious
and want active life, it having nutrients that boost energy, without gaining extra weight. This
product is formed with special care to offer a quality product to customers of Pakistan who are
health conscious. Olper’s is available in liquid form in market, it is low fat milk that having basic
nutrition’s so that adults could get their basic health requirements.
OLPER Badam Zafran Milk: EFL launched flavored milk encouraged by the customary
flavors of badam, zafran and rose, especially for those children’s who don’t like smell of milk.
Olper's flavored milk is rich in nutrition, creamy and healthy and same ingredients like natural
milk. This product was launched for the first time in 2011in 250 ml packs. Enormously well-
liked within a rising sector of the industry, It is the paramount choices for everybody who desire
a taste of zafran, badam and rose in every packs of milk.
OLPER’s cream: This product has make a new trend on the table of meal and in kitchens, it is
widely used as food item changing taste of people. It was launched for the first time in 2006 and
after that I has capture market by its unique taste, Olper's Cream is used in day to day meals is
the country UTH cream that are loved by its customers and they are gradually increasing.
Olper's Lassi: Lassi is a revitalizing liquid from prepared from milk and yoghurt. This drink is
used in summers, and prepared in tetra pack, is offered in various flavors.
Dairy Omung: Dairy Omung is a dairy brand that provides premium milk to customers that are
price conscious. Dairy Omung targeting house wives who are responsible for health of their
family and kitchen.
Omung Dubala: Omung Dubala was offer in 2010; it is a low price high quality product, which
is alternative to dairy base cream. Omung Dobala help customer by maintaining balance of
requirement between living and eating habits
11

Tarang: Tarang is Pakistan number one tea making brand, it is specialized tea milk which make
a cup of tea with perfect taste. Tarang gives quality more than the money you pay for, Tarang is
available in liquid as well as in powder formats so to extent choice for customers. Tarang has
manifestly fresh odor, strong taste and focus on eye capturing making tea for every customers,
Tarang is the profitable brand since 2007, after catching hearts of millions of peoples form
Pakistan.
TARKA: Tarrka is Engro Food Limited best desi ghee distinctive for its pure taste and rich
smell, Tarka was launched in 2005. Tarka taste in your cooking add more taste to you food and
increase your desire for to have more.
ICE CREAM: Omoré's has wide and delicious range of flavor that glorious to treat everyone,
Omore’s was launched in 2009. Omoré is a delicious ice-cream and frozen variety that seeks to
cater to a broad variety of customer. Offered in more than 40 Stock keeping units including
cones, ice-lolly, cups, sticks of different sizes, this brand has develop into a family name
crossway of Pakistan.
The below is the basic details about Engro Foods Limited:
Ticker: EFood
Country: PAKISTAN
Industry incorporated: Food & Beverages
Sub Industry: Different food products
2014 Sales: 96,457,743,000 (Dec 2014)
Total employees: 1750(2014)
Market Capital: 106,409,946,650.00
Year Ends: year ends in December
Total Outstanding shares: 763,890,500
Type of Share: Ordinary
12

2.4 SHEZAN International LimitedShezan Company was implicit as a private limited organization on May 13, 1964, the firm was
developed with the aim of to be a leading business of the market in preparing product of juices,
sharbats, pickles, James and squashes. Pakistan has a very great atmosphere for developing vast
verity of products. Throughout the hundreds of years Pakistani specialists have obtained and
created one of a kind strain of extraordinary organic product assortments, supreme for their well-
off savor and flavor. Shezan International Limited was joint venture of the Shah Nawaz Group of
Pakistan. The agribusiness foundation of the Pakistani supports affected them to build up this
agriculture based firm.
To prepare natural product in Pakistan which could be easily available to the final customer’s
innovative ideas was given by the American corporations, Shezan got to be leading the way in
preparation of juices from the pulps of fruits. Shezan is currently the biggest firm in preparing
the food products and meeting the requirements of Pakistan and export necessities. With the
authorization of Pakistan government in 1971 the Shah Nawaz Group gets hold of every one of
the shares of Alliance Industrial Development Corporation with the authorization of the Pakistan
Government. Shezan Int had since demonstrated supported development in mutually the
residential and sends out practical life. Shezan International has been consistently growing its
product production limit all over the time. In1980 and 1981 they introduce a new plant in
Karachi with aim to provide food for Karachi, Sindh and sends out interest. In 1983 they plant a
new plant for filling bottles in Lahore. In 1987 they build a tetra brick plant for making the
packed juices in the beverage industry of Pakistan.
2.4.1 ProductsShezan International presents wide range of food items. Shezan international has wide portfolio
of products and is vast in their field. They have different products like juices, jams and ketchups.
The organization is integrated in the preparing, producing, trade and offering of these things.
AllPure:
Shezan international offer another juices series by the name of AllPure; these juices are prepared
from natural fruits. Shezan International provides wide range of juices to enhance the taste of
13

customers by pure juice. For the better taste of customers they make juices in the pure natural
form so that customers could enjoy it.
Different flavors are available in this series like
PINEAPPLE, APPLE, MANGO, ORANGE, TROPICAL and GRAPES.
Bottled Juice:
The Bottle juice offered by Shezan International has a very exceptional prevalent and loved by
youngsters. It freshen the mind of customers by its present taste. people of Pakistan has shown
their love and affections for this product.
Standard Juices:
Company gives their supreme parity to good taste. Regular juices are accessible in different
flavors and they are considered as a great selection by the customers. It is accessible in following
flavors.
LEMON BARLEY, PUNCH, APPLE, LYCHEE and ORANGE
Twist:
This is a different brand offered in good-looking, slender and simple packaging, these juices are
well thought-out that they are dwelling. Twist juice are offered in following flavors.
APPLE, RASPBERRY, PINEAPPLE, FRUIT PUNCH, MANGO-STRAWBERRY and
MANGO
Syrups:
Syrups are offer by Shezan International in wide range. It can be mixed with chilled water for
quenching thirst. Syrups are offered in different flavors.
LIME CORDIAL, POMEGRANATE, SANDAL, ROSE and SAMARKAND
14

Vinegar:
Artificial and high standard vinegar are prepared by Shezan International which are available in
various packages in market.
Sauces:
In business of ketchup Shezan International has their own standard. In dinner peoples prefer
Ketchup offered by Shezan International. In market they are offered if different sizes eg 10kg
drum. Additionally Shezan International is offering onion and chilly sauces too.
Jams:
Company prepares products from the items that they grown from their ground which is the
reason behind why Shezan is famous for quality in business sector. Its jams can be used in meal
whatever the time is. It is accessible in the accompanying tastes.
PLUM, ORANGE, MANGO, MIXED FRUITS and APPLE
Quench:
This product offered by Shezan International is to take rid from warmth just by mixing with cold
water and take it. It dose restoration to body in moments. It has just two taste lime and lemon.
Mango Nectar:
Pakistan is famous for its mangos; Shezan international uses quality mangos for extracting
nectars from mangos. It is 100% immaculate and is finest distinct option for soft drinks and soda
pops.
Pickles:
It offers a quality and standard pickles that are liked by families because of its exceptional taste.
Different sizes are available in it.
Ispaghol: It also offers to deliver quality Husk in light of the fact that it is useful for the health
of customers. Customers used it for two reasons first that it is slow in digestion and second it lifts
the feelings of hunger. Extra calories are lost and make you skinny looking slim.
15

The subsequent are the basic details regarding Shezan Limited:
Ticker: SHEZ
Country: PAKISTAN
Industry: Beverages
Sub Industry: Different foods product
2014 Sales: 676,052,700.00 (June 2014)
Currency: Pakistan Rupees
Market Capital: 3,764,580,000.00
Fiscal Year Ends: June
Shares Outstanding: 6,000,000.00
Share Type: Ordinary
2.5 National FoodsDiscovering the Symphony of Flavors
National Foods started its business in 1970 and began as a Spice organization. Three decades of
a short period later it has expanded into a vast verity food company with more than 120 items
and 170 or more SKU for the domestic business sector and more than 100 separated items for the
international markets.
Skilled HR from inside of the organizations has fuelled awesome growth by excelling well-
designed management. Indeed, after thirty years the organization's primary priority still depends
on consumer needs for developing product with the altering according to drift in business sector.
In this creative era of regularly evolving standard of living, fuelled by the widespread step up of
technology; customers have been constrained to change their food habits. National Foods
respond to this assessment of creating inventive food items in light of ease and fast readiness in
accordance to modern way of and retain traditional qualities through its great amass of food
items.
16

The brand fulfills its vital promise by dependably conveying value to its buyers. National Foods
make its relationship strong with families by bringing people all together on traditional events
like seasonal holidays, festivals, feasts and in daily life.
2.5.1 Products:
National Foods Masala Products:
National Food ingredients are carefully chosen and mixed to ensure the right mix up and ideal
taste. National Foods utilizes modern innovative procedures to acquire exhaustive blending of
spices, and henceforth the specific flavor that is our specialty. Our spices depend on the most
well known and traditional ethnic dishes the subcontinent brings to the table. We give our
customers recepies that are simple and easy to utilize. National recipes include a wide verity of
more than 48 delectable dishes, for example curries, biryanis, kababs and some more.
National Food Snacks Products:
National Foods snacks have wide range trying that will feel your taste buds snappy. At whatever
point, wherever, snacks simply add flavor to your taste experience. National Food Snacks are
pure lure and fun to the food side.
National Food Spices and Ingredients Products:
National Foods has a scope of basic dishes which give comfort to the cooking environment.
Flavors and fixings are the primarily essentials for any Pakistani dish. To see how to utilize
them, when to utilize them and in what amounts, is viewed as a art that must be comprehended
with experience. The color, the smell and the taste, everything that is so essential for a dish to
turn out immaculate is controlled by the right and auspicious utilization of flavor and spices.
National Foods Spices and Ingredients are similar to little spell that meet up to work magic.
National Food Salt Products:
National Food utilizes the most advanced refining methods, which include cleaning, washing and
centrifuging. Deliberately picked crude material, at the starting stage and guarantees most
extreme purity of the salt. Special handling empowers the free stream of National Foods salt.
17

National Foods is the spearheading maker of iodized salt in Pakistan. Because of their aggressive
situating, iodized salt is currently synonymous with National Foods in Pakistan.
Fruitily and James:
National Foods Fruitily moment drink blend is far beyond reviving refreshment. Every serving
of Fruitily is overflowing with crucial nutrients that not just give the energy that your body and
mind require additionally abandon you refreshed, supported and livened up.
National Jams make life more productive by bringing you mouthwatering natural product
spreads and satisfaction. National Jams are presently an affix on the table at morning and are
available in an assortment of tastes.
Ketchup, Pickle and Chutney:
Ketchup is prepared from 100% fresh tomatoes. It's a perfect equalization of bitter and sweet,
which change the most straightforward of nourishment into sound and scrumptious dinners
The taste, smell and kind of National's pickles catch the genuine substance of Pakistani tradition.
The lusciously spicy and tart extent of pickles is all set from the best ingredients including
flavorsome oils, newly picked vegetables and food products, and the spice mix.
National Foods has an energizing scope of tangy and wonderful chutneys. The scope of chutneys
incorporates energizing and delectable flavors. Whether utilized as a dinner supplement or as a
dipping sauce, these chutneys include the component of Pakistani taste through their interesting
traditional.
Rice and Dessert: Beautifully separate, pearl white grains of National Rice dependably flicker
and burst with flavor. Basmati rice is accessible in different pressing.
National Foods offers a delightful and pleasant scope of divine desserts. The extent has an
variety of items and is not just constrained to traditional desserts, for example, kheers and
faloodas additionally incorporates contemporary treats, for example, jams and custards.
The accompanying are the important insights about National Food Limited
18

Ticker: NATF
Country: PAKISTAN
Industry: Food & Beverages
Sub Industry: different food products
2014 Sales: 972,525,000.00 (June 2014)
Currency: Pakistan Rupees
Market Capital: 12,797,706,480.00
Fiscal Year Ends: June
Shares Outstanding: 41,443,350.00
Share Type: Ordinary
19

Chapter 3
Horizontal and Vertical Analysis
3.1 Vertical Analysis of Summarized Balance Sheet and profit & loss Statements of year
2014 of National Foods, Engro Foods,
Shezan Limited, Nestle limited.
Table 3.1: Vertical analysis of balance sheet
National
Foods
Engro Foods Nestle Shezan Limited
Assets
NON-CURRENT ASSETS 26.69 63.09 64.42 31.77
CURRENT ASSETS 73.31 36.91 35.58 68.23
Total Assets 100% 100% 100% 100%
Liability and Shareholders’
equity
SHARE CAPITAL AND
RESERVES
44.32 45.04 24.42 56.00
NON-CURRENT
LIABILITIES
2.90 25.93 21.89 2.55
CURRENT LIABILITIES 52.78 29.03 53.69 41.55
Total liabilities and Share
holder equity
100% 100% 100% 100%
Following are the comparative vertical analysis of National foods Ltd, Engro Foods, Shezan
Limited, Nestle Limited. It is summarized balance sheet in which we are comparing these four
companies on vertical basis.
20

3.1.1 Current Assets: Current assets are that which has high liquidity are known as current
assets. Current assets include cash and bank balance, stock in trade, store, spares and trade debts.
In our report National foods have 73.31% current assets, Engro Foods has 36.91%, Nestle
Limited has 35.58% and Shezan Limited has 62.23% of current assets. This data shows that
liquidity of National Food limited has 73.31%, while on the other hand data also suggest that
National Food Limited unable to convert their assets into long term investment to generate more
profit.
3.1.2 Long-term Assets: Assets that company held for more than one year. Long-term assets
company use for increasing its process. In this report National Foods have 26.69%, Engro Foods
has 63.09%, Nestle Limited has 64.42% and Shezan Limited has 31.77% long-term assets.
Nestle and Engro foods have almost same percentage of long term assets meaning that both
companies have transformed their current assets into long term assets. It shows that company
using their assets efficiently.
3.1.3 Share holder’s Equity: Shareholder’s equity signify the money by which a firm is
funded through common and preferred shares. If equity of a company is high it means that
company has paid or having less liability. While on the other hand negative equity suggest that
company has more liability then share holder’s equity. Nestle Limited has 24.42% of
shareholder’s equity of the total liabilities and shareholder’s equity, so this means that an asset
funded by shareholders is only 24.42% while rest is funded through long and short term liability.
The remaining company’s healthy equity is almost half of the assets. Shareholders are liable for
the losses and profit of company.
3.1.4 Current Liabilities: The obligations or due payment that company should have to pay
within one year are current liabilities. If firm has low current assets then current liabilities then
they will be taking more debt to pay their obligations.
In our report National Foods (73.31%:52.78%), Engro Foods (36.91%:29.03), Nestle Limited
(35.58%:53.69%), and Shezan Limited (68.23%:47.55%) of current assets to current liabilities.
All companies can be considered healthy except Nestle Limited current assets to current
liabilities. Shezan limited have highest ratio after paying their short-term liabilities it have
21

remaining 26.68% of current assets left. It means that Shezan limited have excess of current
assets. They should have to invest those extra assets in other department in order to generate
more profit.
3.1.5 Long Term Liabilities: These liabilities are those debts which are unpaid for more than
single year. It should be paid from the assets and future yield of the company. Engro foods have
25.93% which is higher than others while Nestle limited have 21.89%, National Foods have
2.90% and Shezan limited have lower then all 2.55%. It shows that Shezan limited and National
Foods have low debt and obligations then comparison to Nestle Limited and Engro Foods. Engro
Foods and Nestle limited have a lot of debts to be paid, having a lot of debts leading to
bankruptcy.
3.2 Vertical Analysis of Profit and Loss statement:
Following are the comparative vertical analysis of National foods Ltd, Engro Foods, Shezan
Limited, Nestle Limited. It is summarized Profit and loss statement in which we are comparing
these four companies on vertical basis. All values are in percentage and in summarized form.
All details are given below table.
Values in %age
National
Foods
Engro Foods Nestle Shezan Limited
Sales 100.00 100.00 100.00 100.00
CGS (64.95) (81.18) (71.67) (70.05)
Gross Profit 35.05 18.82 28.33 29.95
Distribution Expenses (19.76) (10.90) (11.49) (18.83)
Administration Expenses (3.66) (2.98) (2.20) (3.20)
Other operation Expenses (0.80) (0.24) (1.52) (2.40)
Other Income 0.73 0.70 0.54 0.79
Operating Profit 11.51 5.41 13.65 6.34
Other Expenses - (1.38) - -
22

Finance Cost (0.90) (2.87) (2.23) (0.42)
Profit Before Tax 10.61 1.14 11.42 5.92
Taxation (3.33) 0.92 (3.19) (2.086)
Net Income 7.29 2.06 8.23 3.84
Table 3.2: Vertical analysis of Income statement
3.2.1 Summary of profit and Income statement: In this report after analyzing the income
statement of these four companies Nestle Limited have more net income the rest of companies.
Nestle Limited has 8.23% net income of their total sales. National Foods is few points back then
Nestle Limited, which means that both companies have well invested their assets and generate
more profit from it. While Engro foods have low percentage of net income which at some point
means that they are not using their assets efficiently.
Horizontal Analysis for balance sheet and income statement for year 2014 for
National Foods, Engro Foods Ltd, Nestle Limited and Shezan Limited
3.3 Horizontal Analysis: This analysis is the contrast of two year financial information of
the firm over the two years. When doing horizontal analysis it should be done for same period to
show effect of financial statement of the company over that period.
Value in %age
National Foods Engro Foods Nestle Shezan Limited
2014 2013 2014 2013 2014 2014 2014 2013
Assets
Non-Current Assets 19.23 12.61 1.13 31.5 32.67 20.00 11.01 71.53
Current Assets 16.36 42.55 18.38 22.61 6.38 21.57 (13.65)
23

Total Assets –
Current Liabilities
28.06 19.88 6.78 8.3 (1.06) 2.75 18.01 3.74
Liability And
Shareholders’
Equity
Issued Share Capital
And Reserves
25.01 0.00 10.00 6.81 6.48 2.58 14.81 13.53
Share Capital
Reserve
32.31 29.92 8.05 1.79 6.73 2.70
Non-Current
Liabilities
3.11 18.30 13.16 12.8 (21.46) 16.06 35.98 (11.10)
Unappropriated
Profit
34.73 28.34 24.43 13.10 7.19 (18.59) 21.58 (10.74)
Total liabilities and
Share holder equity
28.06 19.88 6.78 8.3 (1.06) 2.75 18.01 3.74
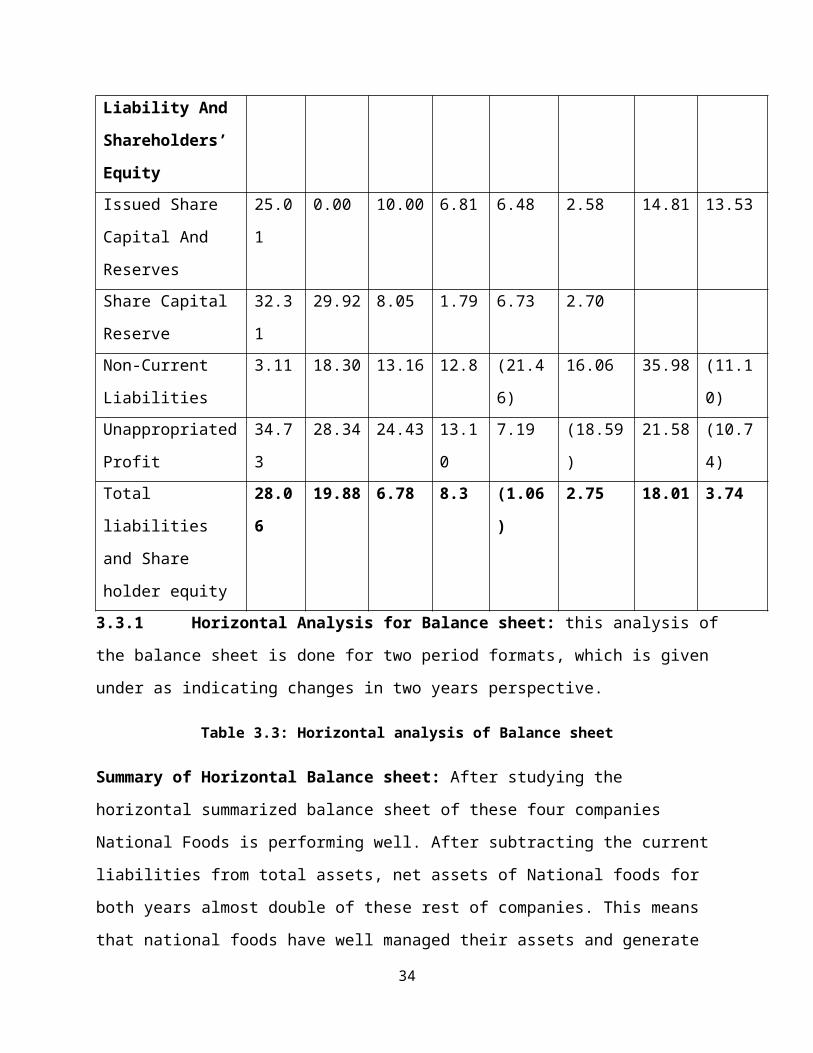
3.3.1 Horizontal Analysis for Balance sheet: this analysis of the balance sheet is done for two
period formats, which is given under as indicating changes in two years perspective.
Table 3.3: Horizontal analysis of Balance sheet
Summary of Horizontal Balance sheet: After studying the horizontal summarized balance
sheet of these four companies National Foods is performing well. After subtracting the current
liabilities from total assets, net assets of National foods for both years almost double of these rest
of companies. This means that national foods have well managed their assets and generate profit
in well mannered. Nestle Limited have low percentage of 2.75% in previous year and in current
year they have negative percentage which means that Nestle have paid their debts because of
which their value came negative. Shezan limited in previous have 3.74% of their net assets while
in current year they increase it to 18.01% which mean that they not only pay off their liabilities
but they also well managed their assets and generate profit because of which their assets
increased. Engro food in current year has decrease in their net assets which because of paying
liabilities and also using portion of unappropriated income in different investments.
24

3.3.2 Horizontal analysis for Income statement: we are doing the horizontal analysis of these
four company, we will be comparing their performance in the income statement on percentage
base that which company is good on net income level.
Table 3.4: Horizontal analysis of income statement
Conclusion: In this report we had done comparative horizontal analysis of these four companies,
Engro Foods having highest percentage of Net income from the previous year. Engro foods have
also decreased their distribution expenses and other expenses which show good impact on their
net income. Nestle limited having good percentage of increase in their net income. They have
high increase in their other income which has ultimately good impact on their net income which
goes increase. National food having also a little bit good but the last one is Shezan limited which
just increase 4.1% of their net income from previous year. The good point for Shezan Limited is
that they reduce their finance cost which will help them in the coming years.
25

Chapter 4
Comparative Analysis
4.1 Liquidity Ratio
These ratios are used to find out that whether the firm would be able to pay their short term debts
in near future or not. Does they have enough resources that they would pay off their debts or
not? There are various ratios given below.
4.1.2 Current ratio
This ratio is used to find out that whether a firm would be able to pay off their short term debts
or not. This ratio is higher than one is good for company. Lower then one shows that firm have
liquidity problems.
Table 4.1: Current ratio
Current ratio
Company/Years 2009 2010 2011 2012 2013 2014
NATIONAL
FOODS 1.13 1.01 1.23 1.33 1.30 1.41
ENGRO FOODS
LTD1.35 1.79 2.00 1.8 1.44 1.3
NESTLE
PAKISTAN0.85 0.85 0.81 0.84 0.99 0.70
SHEZAN INT 1.96 1.75 1.64 1.70 1.65 1.64
Among these four companies SHEZAN INT online Ltd. is more liquid then ENGRO FOODS LTD,
NATIONAL FOODS and NESTLE PAKISTAN.
26

4.1.2 Quick Ratio
This ratio is more liquid then current ratio. In this ratio we remove some portion form current
assets which are hard to convert into cash. When this ratio is higher it means that company is
more liquidate and is in better position.
Quick Ratio = (Cash + Accounts Receivable + Short-Term Securities) / Current Liabilities
Table 4.2: Quick ratio
Quick ratio
Company/Years200
9
201
0
201
1
201
2
201
32014
NATIONAL
FOODS 0.33 0.20 0.21 0.40 0.51 0.55
ENGRO FOODS
LTD0.6 0.91 1.18 0.9 0.75 0.62
NESTLE
PAKISTAN0.37 0.38 0.38 0.44 0.49 0.36
SHEZAN INT 0.62 0.56 0.54 0.38 0.51 0.54
This ratio is also like current ratio which also shows the liquidity of the company. Among the
three companies ENGRO LIMITED is extra liquid then SHEZAN INT, NESTLE PAKISTAN
and then NATIONAL FOODs LTD.
Ranking in terms of Liquidity
Table 4.3: Rank on Base of Liquidity of firm
Rankin
gCurrent ratio Quick ratio
1 SHEZAN INTENGRO FOODS
LTD
2ENGRO
FOODS LTDSHEZAN INT
3NATIONAL
FOODS
NESTLE
PAKISTAN
4 NESTLE NATIONAL
27

PAKISTAN FOODS
4.2 Debt Ratio
4.2.1 Debt to Equity Ratio:
This ratio is used to find out that how much debt is taken by firm. When the percentage of this
ratio is low it means that firm has taken less debt and vice versa. Less debt means that company
having more part of equity. High ratio is risky and low is good.
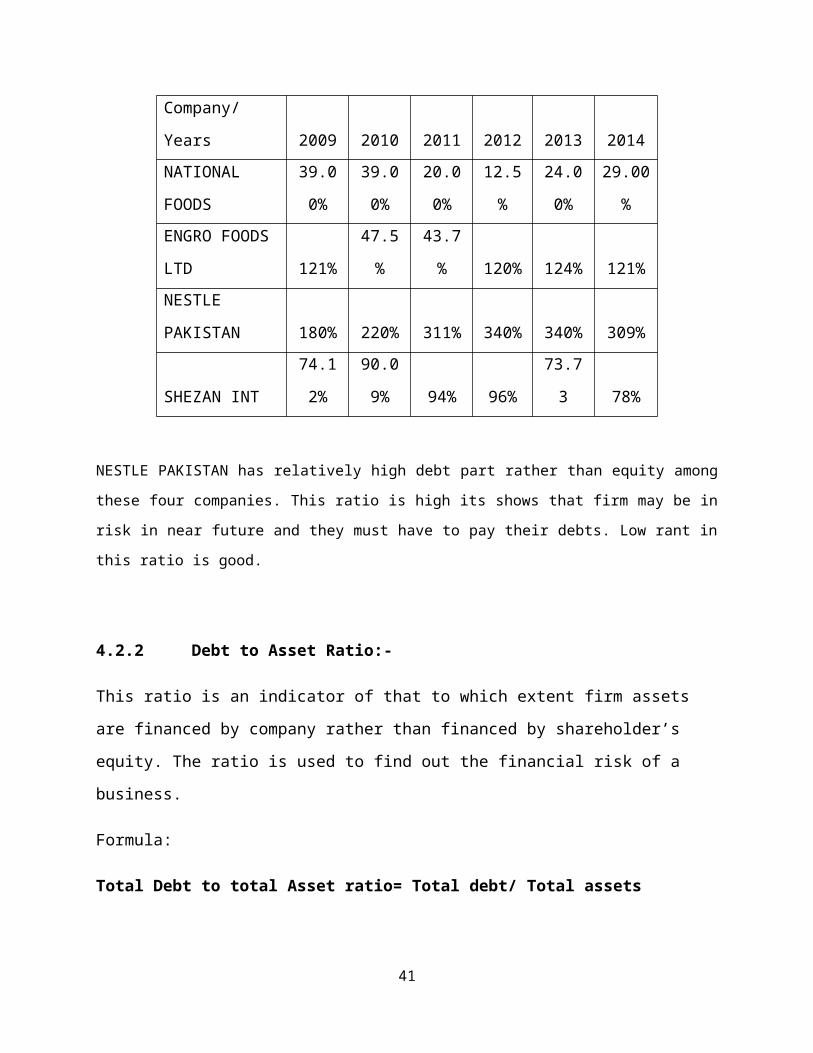
Table 4.4: Debt to equity
Total debt to equity ratio
Company/Years 2009 2010 2011 2012 2013 2014
NATIONAL
FOODS
39.00
%
39.00
%
20.00
% 12.5%
24.00
%
29.00
%
ENGRO FOODS
LTD 121% 47.5% 43.7% 120% 124% 121%
NESTLE
PAKISTAN 180% 220% 311% 340% 340% 309%
SHEZAN INT
74.12
%
90.09
% 94% 96% 73.73 78%
NESTLE PAKISTAN has relatively high debt part rather than equity among these four companies. This
ratio is high its shows that firm may be in risk in near future and they must have to pay their debts. Low
rant in this ratio is good.
4.2.2 Debt to Asset Ratio:-
This ratio is an indicator of that to which extent firm assets are financed by company rather than
financed by shareholder’s equity. The ratio is used to find out the financial risk of a business.
Formula:
Total Debt to total Asset ratio= Total debt/ Total assets
28

Table 4.5: Debt to Asset
Total debt to Total Asset
Company/Years 2009 2010 2011 2012 2013 2014
NATIONAL
FOODS 64% 72% 93% 79% 60%55%
ENGRO FOODS
LTD
62.10
%
70.17
%
16.38
%
54.84
%
55.94
%
54.29
%
NESTLE
PAKISTAN 67% 75% 78% 77% 78%75%
SHEZAN INT43% 48% 51%
42.44
% 44%
44.49
%
NESTLE PAKISTAN has a comparatively privileged debt part in their assets rather than other
four companies. This shows that Nestle Pakistan is using more debt then other firms and which
dangerous for the firm in near future. Low rank in this ratio is good.
Rank on base of Debt ratios.
Table 4.6: Rank on base of debt ratios
Rankin
g
Debt to equity
ratio
Debt to Asset
ratio
1NESTLE
PAKISTAN
NESTLE
PAKISTAN
2NATIONAL
FOODS
NATIONAL
FOODS
3ENGRO
FOODS LTD
ENGRO FOODS
LTD
4 SHEZAN INT SHEZAN INT
29

4.3 Activity Ratio
These ratios are used to find out the firm sales on per assets and inventories. Assets include
current and fixed assets. This ratio finds out the firm efficiency in in well usage of their
resources. So it is used to find out whether the firm are changing their assets and inventory in to
sale or not.
4.3.1 Inventory Turnover
This is an important ratio which tells about that how well the firm is using their inventory. It is to
find out that does the invested money by the firm is generating profit or not? This is the best ratio
to find out the usage of inventory in efficient way.
Inventory Turnover =
Net sales
Inventory
Table 4.7: Inventory Turnover
Inventory Turnover
Company/Years 2009 2010 2011 2012 2013 2014
NATIONAL
FOODS 3.29 2.69 2.44 2.94 3.22 3.05
ENGRO
FOODS LTD9.9 10.2 9.8 9.7 9.0 10.3
NESTLE
PAKISTAN9.2 8.1 9.18 9.85 10.88 9.87
SHEZAN INT 3.61 4.19 3.64 4.58 5.68 5.89
When this ratio is high it indicates that maximum utilization of inventory in efficient way.
30

4.3.2 Assets turnover ratio:-
This is the ratio of net sales divided by the net assets of the given year of the firm. When this
ratio is higher it means that firm using their assets in efficient way to make profit and vice versa.
Assets turnover ratio= Net sales/ Total assets
Table 4.8: Assets Turnover
Asset Turnover
Company/
Years2009 2010 2011 2012 2013 2014
NATIONAL
FOODS 204% 167% 190% 226% 201% 195%
ENGRO
FOODS LTD160% 170% 180% 181% 160% 170%
NESTLE
PAKISTAN184%
224.82
%
185.23
%
155.46
%
166.57
%184%
SHEZAN INT 201% 218% 217% 230% 249% 251%
On the basis of asset turnover ratio Shezan Int is performing better then rest of companies, they
are utilizing their assets to word good performance. Shezan Int is followed by National foods that
are performing good to utilize their assets more and generate more profit.
Ranking in terms of activity ratios
Table 4.9: Ranks on the base of activity ratios
RankInventory Turnover
Asset Turnover
1ENGRO FOODS
LTDSHEZAN INT
2NESTLE
PAKISTAN
NESTLE
PAKISTAN
31

3 SHEZAN INTNATIONAL
FOODS
4NATIONAL
FOODS
ENGRO FOODS
LTD
4.4 Profitability/Performance
Every firms are mostly anxious about their profitability. These ratios are often used to determine
the company's profitability and their performance. This is important for the management and
owners of the business. This is used to show the investors that how profitable firm is.
4.4.1 Gross Profit Margin:
This ratio is about that how firm taking control over the cost of their inventories, manufacturing
cost and shifting that cost to their customers. If this ratio is high so it will be good for that
company.
Gross Profit/Net Sales = __%.
Table 4.10: Gross Profit Margin
Gross Profit Margin
Company/Years 2009 2010 2011 2012 2013 2014
NATIONAL
FOODS
29.97
%
29.55
%
28.51
%
32.52
%
64.71
%
35.05
%
ENGRO FOODS
LTD 18.5% 21.0% 22.2% 25.7% 21.6%18.8%
NESTLE
PAKISTAN 29% 27% 22%
26.25
%
27.99
%
28.32
%
SHEZAN INT29% 27% 26%
28.46
%
30.15
%
29.95
%
When gross profit margin of the firm is high its shows that firm is profitable. National Food
having high GPM percentage is high which mean that NF is converting their inventories at low
cost to final product.
32

4.4.2 Net Profit Margin:
This ratio is very simple; it is frequently used for finding about the profitability of a firm. This
ratio tells us about that how much of sales are illustrated in the net income.
Formula = Net Income/Net Sales =
Both values are taken as of income statement
Table 4.11: Net Profit Margin
NPM
Company/Years 2009 2010 2011 2012 2013 2014
NATIONAL
FOODS 3.71% 1.93% 4.18% 8.14% 7.88%7.29%
ENGRO FOODS
LTD -3.2% 0.8% 3.0% 6.5% 0.6%2.1%
NESTLE
PAKISTAN 10%
11.10
% 7.20% 7.42% 6.8%8.2%
SHEZAN INT 3.76% 3.03% 3.33% 4.33% 4.39% 3.84%
When net profit margin of a firm is high its mean that company is performing well. Nestle
Pakistan is generating more profit from their sale because their NPM percentage is higher than
rest of companies, followed by National Foods.
4.4.3 Return on Asset (ROA):
In profitability perspective this ratio is important to find out that spending on assets would be
profitable or not. It find out the on the amount invested on the assets. It is about well
management of the assets.
Net Income/Total Assets =
Table 4.12: Return on Asset
Return on Asset
Company/Years 2009 2010 2011 2012 2013 2014
NATIONAL 7.60% 3.24% 8.08% 18.46 15.84 14.22%
33
FOODS % %
ENGRO FOODS
LTD9.33% 9.50% 5.81% 4.97% 2.62% 6.45%
NESTLE
PAKISTAN
16.18
%
17.94
%
13.27
%
11.53
%11.2% 15%
SHEZAN INT 7.57% 6.59% 7.23% 9.4%10.95
%9.66%
When this ratio is higher its good for company because it shows that firm are using their assets in
a good way to generate more sales.
4.4.4 Return on Equity (ROE):
In the investor perspective this ratio is important to find out return on the money they are
investing. By this ratio investors will make a decision that weather they should invest or not in a
specific firm.
ROE = Net Income/Stockholder's Equity
Table 4.13: Return on Equity
Return on Equity
Company/Years 2009 2010 2011 2012 2013 2014
NATIONAL
FOODS 23.81%
12.39
%27.70%
50.28
%43.96% 36.55%
ENGRO FOODS
LTD(12.9%) 3.4% 12.3% 25.9% 2.0% 7.7%
NESTLE
PAKISTAN48.10%
49.71
%61.33%
50.73
%49.5% 62.79%
SHEZAN INT 13.17%12.59
%14.75%
18.59
%19.02% 17.24%
34
In broad-spectrum, the greater the proportion, the earning capacity would be higher on common
equity, with a few special cases, it tell us that the business is utilizing money of shareholders in a
good way. Nestle Pakistan is performing better they generating more on equity portion of their
share holders. They utilizing equity portion in positive way and generating more profit from rest
of companies.
Rank on the base of effectiveness & operations
Table 4.8: Ranking in terms of effectiveness & operations
Rank GPM NPM ROA ROE
1NATIONAL
FOODS
NESTLE
PAKISTAN
NESTLE
PAKISTAN
NESTLE
PAKISTAN
2NESTLE
PAKISTAN
NATIONAL
FOODS
NATIONAL
FOODS
NATIONAL
FOODS
3 SHEZAN INT SHEZAN INT SHEZAN INT SHEZAN INT
4 ENGRO FOODS ENGRO FOODS ENGRO FOODS ENGRO FOODS
.4.5 Market Performance
4.5.1 Earnings per Share (EPS):
This ratio is about that how much part of net income is paid to the outstanding share of the firms.
This ratio shows the profitability of the firm.
Table 4.95:EPS
EPS
35

Company/Years 2009 2010 2011 2012 2013 2014
NATIONAL
FOODS 2.69 1.67 4.45 11.26 13.01 13.68
ENGRO FOODS
LTD1.08 1.22 1.18 1.05 0.55 1.02
NESTLE
PAKISTAN66
90.6
9
102.9
4
129.3
2
129.3
7105.85
SHEZAN INT17.0
8
17.7
923.43 34.56 34.34 32.77
Earnings per share of Nestle Pakistan in more than rest of companies, followed by Shezan Int.
this is a good gesture for company. High earning per share attract investors to invest in company
stock.
4.5.2 Payout Ratio:
This is the ratio of the amount of income which is rewarded in form of dividends to stockholders.
This ratio is used by the investors to find out that how income is used by the firms.
It can be calculated as:
Table 4.16: Payout Ratio
Payout Ratio
Firm/Years 2009 2010 2011 2012 2013 Average
NATIONAL
FOODS 41.84 57.45 44.93 42.63 46.17 58.50
ENGRO FOODS
LTD0.00 34.32 39.42 0.00 0.00 40.29
NESTLE
PAKISTAN61.52 82.70 63.12 54.13 96.62 97.23
SHEZAN INT 33.72 58.20 33.72 29.12 30.77 27.07
36

Mostly this ratio depends on the company dividend policy. Nestle Pakistan is performing well
according to this ratio. They are paying more dividends to their shareholders which give them
opportunity to catch more investor from market.
4.5.3 PE Ratio
This ratio is used for to determine the link among the share price and the firm earnings. This
ratio is mostly admired for share analysis.
P/E = Stock Price / Earning per share
Table 4.17: PE Ratio
P/E Ratio
Firm’s/Years 2009 2010 2011 2012 2013 2014
NATIONAL
FOODS 65.13 30.50 30.65 32.22 48.89 73.20
ENGRO FOODS
LTD12.28 14.75 15.52 57.62 11.33 15.36
NESTLE
PAKISTAN25 27.45 53.57 42.53 71.89 73.21
SHEZAN INT 3.9 10.2 14.4 20.96 29.27 37.90
When price to earnings ratio is low that is good for the company because that means that
investors have to pay less for one getting more earning. For example, if the price to earnings
ratio is 20 so it means that investor are willing to pay twenty rupees to receive earning of one
rupee. Price to earnings ratio shows that weather the company is performing very well or
company is performing poorly. Shezan Int is performing well on base of this ratio, their investor
will get more profit on paying less.
37

Ranking on base of Market share performance
Table 18: Ranking in terms of Market performance
Ranking Earning per ratio Payout P/E
1 NESTLE PAKISTAN NESTLE PAKISTAN SHEZAN INT
2 NATIONAL FOODS NATIONAL FOODS ENGRO FOODS LTD
3 SHEZAN INT SHEZAN INT NESTLE PAKISTAN
4 ENGRO FOODS LTD ENGRO FOODS LTD NATIONAL FOODS
Chapter 5
Conclusion and recommendations
5.1 Conclusion:
The conclusion of our project is that on base of ratio Nestle Pakistan is performing well in the
market. Nestle Pakistan is one of the biggest multi-national company working in Pakistan.
Customer of Nestle Pakistan shows positive response toward their products, which increase their
sales revenue by 15.85% in 2014, and 9.26% increased in 2013. In these previous years company
has offered more diversified product and was accepted in the market. Company net profit grows
by 35.15% in 2014, 12% in 2013, 25.62% in 2012, 28% in 2011 and 10% in 2010. This is
excellent for the company which came for increase in sales. Nestle Pakistan is also having more
number of employee then other companies that we include in our project. Nestle Pakistan has
total employees of about four thousand and two hundred.
Current and acid test ratio of the company is excellent in all six years and almost stood above
one which is good. However company has also borrowed high investments which increase risk
of the company. They have to pay that debt in near future but they have plenty of assets to cover
38

their finance cost. Company Earnings per share and Payout ratio is high they are paying more
dividends to their share holders and there earning per share is more, followed by National Foods.
Engro Foods are the company whose ratios are appalling in contrast of other companies like
Shezan International and National Foods limited. Engro Foods net profit margin and gross profit
margin is lower than other companies. Their sales were also decreased from last year which
affects their sales and net profit ratio. Engro Foods revenue in previous was very low and even in
some years its growth were negative, but in 2014 they increase their revenue by 25 percent
which is a good point for the company that they are improving. In 2014 Engro Foods ice-cream
product sale show increase which is because of they make products related to customers and
excellence in their distribution channel. Their distribution channel management wasn’t good also
which mostly affect their sales and now they are recovering back from these problems. The
companies that we included in our project Engro Foods is the second one that providing more
employment in Pakistan following Nestle Pakistan.
5.2 Recommendations:
Nestle Pakistan have good current ratio then National foods, Shezan international and Engro
Foods limited, but this high ratio have also a bad aspect means that company have extra cash.
Company need to invest that cash in different project and generate more profit. Cash on hand
lose its value so investing it in project is a good option.
Nestle debt ratio is higher than Shezan International, Engro Foods limited and National Foods.
Company has done aggressive debt financing which is not for company. They have increased
their risk and also have to pay more finance cost in future while pay the debt.
Engro Foods net profit margin, gross profit margin, ROA and ROE is low respective of these
other three companies. Their sales were low which affect its profitability ratio. Their sales are
affected by their bad management and lack of proffer distribution channels. They should have to
work on their distribution channels and management, so that they manage their operation that
goes smoothly. They should also have to find new markets for their products and do time
delivery or open store units in different areas which will quick their distribution process.
39

National Foods is unable to quickly convert their inventories into assets, which will increase
their warehouse cost for the inventory. National Food have to quicken the process and should
maintain their standards.
ReferencesComparing and Analyzing Financial Statements to Make an Investment Decision: Case Study of
Automotive Industry. (2012).
Engrofoods.com,. (2016). Engro Food - Financial Reports., from
http://www.engrofoods.com/downloads.html
Nestlé© Pakistan Financial Reports. Retrieved from
http://www.nestle.pk/investors/financialreports
Financial Reports | National Foods.
from http://nfoods.com/investor-relations/financial-report/
Financial. Shezan.biz.
from http://www.shezan.biz/financial
Shezan International Limited, 2009-2014, Published Annual Reports for Stakeholders, Karachi Stock Exchange.
40
Nestle Ltd., 2009-2014, Published Annual Reports for Stakeholders, Karachi Stock Exchange
Engro Foods Limited, 2009-2014, Published Annual Reports for Stakeholders, Karachi Stock Exchange. National Foods Ltd., 2009-2014, Published Annual Reports for Stakeholders, Karachi Stock Exchange
41