Compensation Consultants: Whom do they serve? Evidence ......3 consultant will serve whoever has the...
51
* We are appreciative of the helpful comments from Daewoung Choi (discussant), Brandon Cline, Steve Ferris, and Ralph Walkling. We would also like to thank the seminar and conference participants at the University of Missouri and the 2018 Eastern Finance Association’s (EFA) annual meeting for their helpful suggestions. Compensation Consultants: Whom do they serve? Evidence from Consultant Changes * January 11, 2019 Ryan Chacon Department of Finance University of Missouri Columbia, MO 65211 (619) 781-7948 [email protected] Rachel E. Gordon Department of Finance Towson University Towson, MD 21252 (410) 704-3019 [email protected] Adam S. Yore Department of Finance University of Missouri Columbia, MO 65211 (573) 884-1446 [email protected] Abstract: We use compensation consultant turnover to investigate optimal or excessive CEO compensation recommendations by consultants. Prior literature contends that consultants issue outsized pay recommendations in order to achieve repeat business; we present evidence suggesting their interests are, instead, aligned with shareholders’ desire to appropriately pay the CEO. We find that boards are more likely to dismiss their consultant when CEO pay is abnormally large. These pay-related switches are associated with a decrease in CEO compensation the following year and are concentrated at firms with stronger corporate governance. Lastly, directors representing shareholders’ interests are rewarded with higher votes in annual elections. JEL Classification: G30, G34, J33, M52 Keywords: compensation consultants, executive compensation, director elections, corporate governance
Transcript of Compensation Consultants: Whom do they serve? Evidence ......3 consultant will serve whoever has the...

* We are appreciative of the helpful comments from Daewoung Choi (discussant), Brandon Cline, Steve Ferris, and Ralph Walkling. We would
also like to thank the seminar and conference participants at the University of Missouri and the 2018 Eastern Finance Association’s (EFA) annual meeting for their helpful suggestions.
Compensation Consultants: Whom do they serve?
Evidence from Consultant Changes*
January 11, 2019
Ryan Chacon
Department of Finance
University of Missouri
Columbia, MO 65211
(619) 781-7948
Rachel E. Gordon
Department of Finance
Towson University
Towson, MD 21252
(410) 704-3019
Adam S. Yore
Department of Finance
University of Missouri
Columbia, MO 65211
(573) 884-1446
Abstract: We use compensation consultant turnover to investigate optimal or excessive CEO
compensation recommendations by consultants. Prior literature contends that consultants issue
outsized pay recommendations in order to achieve repeat business; we present evidence suggesting
their interests are, instead, aligned with shareholders’ desire to appropriately pay the CEO. We
find that boards are more likely to dismiss their consultant when CEO pay is abnormally large.
These pay-related switches are associated with a decrease in CEO compensation the following
year and are concentrated at firms with stronger corporate governance. Lastly, directors
representing shareholders’ interests are rewarded with higher votes in annual elections.
JEL Classification: G30, G34, J33, M52
Keywords: compensation consultants, executive compensation, director elections, corporate governance

1
“What consultant is ever going to get another assignment if he says you should pay your CEO
down in the fourth quartile? It isn’t that the people are evil or anything, it’s just that the nature of
the situation produces a result that is not consistent with how representatives of owners should
behave.”
- Warren Buffet, Berkshire Hathaway Annual Meeting, May 2017
1. Introduction
Approximately 90% of large public firms in the United States routinely retain
compensation consultants to provide guidance in setting executive pay packages.1 These
consultants provide services such as supplying proprietary data on the compensation of other firms,
selecting a list of peers to benchmark pay, and guiding the compensation committee through
compliance with regulatory and tax related issues. Perhaps most importantly, they offer
recommendations about formulating appropriate compensation contracts for top management.
Research shows that the size and structure of CEO compensation packages significantly affect firm
performance (Mehran, 1995; Core, Holthausen and Larker, 1999) and, in particular, excessive
CEO compensation is associated with the destruction of shareholder wealth (Bebchuck, Cremers,
and Peyer, 2011). It is, therefore, important to understand whether the usage of compensation
consultants actually benefits shareholders or is simply an extension of management’s power in an
effort to garner excess pay.
In this paper, we explore whether the use of compensation consultants serves shareholders’
interests or, alternatively, provides a mechanism by which management can earn compensation
rents. To that end, we examine instances when the board decides to change consultants where these
motivations should be most evident. We then study the subsequent impact on CEO compensation
to assess the question of whom consultants serve. The consultant industry has frequently been the
target of criticism by regulators, business leaders, and academics for the potential conflicts of
1 In our sample, the percentage of firms in the S&P 900 using consultants increased almost monotonically from 86.9% in 2006 to 94.5% in 2014.

2
interest that exist. These conflicts of interest are most apparent when consultants are dismissed and
new ones are hired.
As the lead-in Buffet quote suggests, many of these critics argue that rent-seeking
managers shop consultants, hiring those recommending the most lucrative pay packages. The
conflicts of interest facing the industry are broadly classified into two groups by the literature:
cross-selling and repeat business (Murphy and Sandino, 2010). Cross-selling is defined as the
conflict consultants face when they provide other services, such as benefits administration, to the
firm unrelated to compensation consulting. Some consultants may fear that they are less likely to
be rehired by the firm (i.e., earn repeat business) if they do not recommend outsized pay packages
to top management. However, the implicit assumption underlying this argument is that managers,
who desire excessive compensation, control the retention or dismissal of the consultant.
In current practice, the board of directors is ultimately responsible for approving CEO pay.
Furthermore, while management occasionally retains their own compensation consultants or
influences who is chosen, our data suggests that it is the board contracting with the compensation
advisor at nearly 90% of firms.2 Thus, we present the alternative argument that the repeat business
motivation may not be a conflict, but rather an incentive. If the board acts in the best interest of
the shareholders, and they hold the power to retain or dismiss compensation consultants, then the
consultants would be incentivized to suggest a pay package best aligned with shareholders.
To understand whom the consultants serve, we develop two competing hypotheses: the
Managerial Power hypothesis and the Shareholder Power hypothesis. A profit maximizing
2 It is typically clear in the firm proxy statement as to which party is responsible for retaining the consultant. For example: :
“In determining executive compensation for fiscal 2008, the Compensation Committee engaged F.W. Cook as its independent consultant.
This selection was made directly by the Compensation Committee. F.W. Cook provides no other compensation or benefit consulting services to ADC.” (ADC Tele communications DEF-14A filing, fiscal year 2008)
“In connection with the Company’s March 2011 annual compensation review meeting, management retained Compensia, Inc. to conduct
an independent review of the 2010 compensation peer group and the 2010 compensation peer group….” (Expedia DEF-14A filing, fiscal
year 2011)

3
consultant will serve whoever has the power to award them repeat business. Under the Managerial
Power hypothesis, compensation consultants are incentivized to suggest higher than optimal CEO
pay in order to achieve repeat business. In contrast, under the Shareholder Power hypothesis,
consultants serve the shareholders, by way of their representatives on the board, and are
incentivized to suggest optimal levels of CEO pay.
To test these hypotheses, we use a direct, easily observable ex-post measure of whether the
consultant achieved repeat business or not – consultant turnover. Such turnover is incredibly
common as over one in five firms decide to change consultants each year. This event provides
insight into two sub-questions. First, what motivates firms to change their compensation
consultant? Second, what impact does a change in consultant have on future pay
recommendations? The Managerial Power hypothesis suggests that consultants are evaluated (and
retained) based on their ability to justify or camouflage excessive pay to minimize social outrage
costs. If unhappy with current compensation, management can advocate for dismissing the existing
consultant and appoint a new advisor who would be more likely to recommend higher salaries.
The Shareholder Power hypothesis predicts that consultants are evaluated (and retained) based on
their ability to recommend optimal pay levels. A new consultant is expected to be more successful
at recommending optimal pay levels.
Naturally, the moderating factor between these two hypotheses is the capability of top
management to influence the board’s choice of consultants. We explore the influence of corporate
governance on managerial versus shareholder power in this context. Prior research suggests certain
factors that affect shareholders’ power relative to management. Specifically, shareholder power
increases when there is a higher percentage of board independence, a lower percentage of board
members hand-picked by the CEO, the CEO and chairman of the board are separate roles, and

4
when the CEO has shorter tenure. For brevity, we refer to these qualities as measures of strong
governance. We hypothesize that results consistent with the Managerial Power (Shareholder
Power) will be concentrated in firms with weak (strong) governance.
Using a sample of 6,230 firm-year observations of S&P 500 and S&P 400 (collectively
S&P 900) firms that employ a compensation consultant from 2006 to 2014, we present four
primary findings that address these questions. First, we find that firms are more likely to switch
compensation consultants following excessive levels of CEO pay. More specifically, boards
dismiss their consultant when abnormal compensation is positive, but there is no consultant change
following negative abnormal compensation. Second, this effect is most pervasive under strong
governance using commonly employed measures of board monitoring quality. Interestingly, we
find that changes in consultants are insensitive to CEO pay when board monitoring is weak.
However, they are positively related to pay when the board is actively monitoring the CEO.
Third, a change in compensation consultant is associated with subsequent declines in CEO
pay. Again, the effect is only present for CEOs with positive abnormal compensation. The results
from our primary tests are economically meaningful. CEO pay falls by $195,000 following a
consultant change for CEOs identified as previously overpaid. There is no identifiable effect for
CEOs that are arguably underpaid. Finally, our results indicate that shareholders reward the board
of directors for upholding their best interests. By examining over 20,000 individual director
elections, we find that the board of directors receives higher vote totals following a consultant
change when the CEO is overpaid. The effect is stronger for those directors serving on the
compensation committee. This finding suggests that the heightened shareholder support at the
ballot box is a result of the consultant change. Overall, our results are most consistent with the
Shareholder Power hypothesis.

5
One concern over these results is that the decision to dismiss a compensation consultant is
a choice variable with its own observable and unobservable determinants. Consequently, the
change in compensation consultants may be an endogenous decision by the firm leading to a self-
selection bias in the data. That is, firms switching consultants and those retaining consultants are
not randomly assigned. We address this endogeneity concern using a two-stage Heckman
treatment effects model where we achieve identification by using industry-by-industry time-series
variation in the number of consulting options available in the marketplace as a source of locally
exogenous variation. This test explicitly leverages the variation induced by the 2010 SEC
regulation that caused multiservice consulting firms to spinoff their pay advisory services, thereby
exogenously increasing the number of options in the market. The results are robust in this setting
and do not appear to be driven by self-selection bias. There is little evidence suggested by these
tests that unobserved heterogeneity drives the changes in pay, while we continue to find that
consultant changes are associated with declines in outsized CEO pay packages following the
advisor’s turnover.
Our research contributes to the growing compensation consultant literature in several ways.
First, while most studies have focused on the problem of cross-selling conflicts, this paper
addresses and reframes the repeat business conflict of interest, on which there is only a nascent
literature (Murphy and Sandino, 2010). We are the first, to our knowledge, to examine the
determinants of consultant switching behavior for large U.S. public companies in this context.3
We provide empirical support that consultants are incentivized by their ability to recommend
optimal pay. Second, our evidence adds to the larger debate regarding whether or not compensation
3 Goh and Gupta (2010) examine consultant switching in a sample of 350 United Kingdom firms from 2002 to 2008 and find that a consultant switch increases CEO pay. This finding is contrary to the primary results in this paper but explainable by a different country, time period, sample
size, and empirical method.
6
consultants face conflicts of interests that are detrimental to shareholders. To date, most of the
literature presents mixed results either finding support for conflicts of interest (Goh and Gupta,
2010; Cho, Hyun, and Sin, 2015; Chu, Faase, and Rau, 2017) or finding no significant evidence
for such conflicts (Cadman, Carter, and Hillegeist, 2010; Murphy and Sandino, 2010; Armstrong,
Ittner, and Larcker, 2012).4 Our paper suggests that such conflicts might be mitigated under the
right governance structure. Lastly, this study contributes to how boards can design optimal CEO
compensation contracts. Understanding the role and incentives of consultants in setting executive
pay levels allows shareholders and regulators to better monitor firm compensation practices.
2. Literature Review and Hypothesis Development
In this section we discuss the existing literature on compensation consultants, the potential
conflicts of interest inherent when retaining these consultants, and the rules issued by securities
regulators meant to curtail abuses. Building upon prior research, we develop two testable
hypotheses that guide our econometric analysis in order to shed light on the motivations for
employing compensation consultants.
2.1 Literature review and regulatory action
As evident by the volume of scholarship on the topic,5 designing an optimal compensation
contract that incentivizes top management to work in shareholders’ interest is challenging. It is not
surprising that around 90 percent of firms in the S&P 900 hire a consultant for expert assistance
with this process (Murphy and Sandino, 2010; Armstrong et al. 2012; Chu et al., 2017). Engaging
a consultant provides the board access to proprietary data on CEO pay at public and private peer
firms and may offer legal cover should a pay package ever be challenged in a court of law.
4 Murphy and Sandino (2010) find evidence for the cross selling conflict of interest and no result for the repeat business conflict of interest. 5 See Aggarwal (2007) and Murphy (2013) for excellent reviews on the subject.

7
However, many firm compensation committees simply follow the consultant’s recommendations
(Bebchuk and Fried, 2004). Doing so effectively hands shareholders’ delegated control rights on
CEO pay over to the compensation consultant. If managers influence which advisor is hired, then
there is the potential for conflicts of interest and self-dealing.
Prior evidence suggests that consultants face conflicts of interest when providing their
advisory services (Murphy, 1999; Bebchuk and Fried, 2003, 2004; Waxman, 2007). A stylized
fact in the compensation consultant literature is that firms using compensation consultants have
considerably higher total and equity-based pay than firms that do not retain consultants (Conyon,
Peck, and Sadler, 2009). Murphy and Sandino (2010) suggest two primary ways a compensation
consultant’s objectivity may be compromised: the lack of independence due to the other services
that the compensation consultant offers to the firm (i.e., cross-selling), and the incentive to
recommend higher than optimal pay to increase the likelihood of repeat business.
A typical regulatory response to perceived abuses in CEO pay is mandated disclosure,
under the assumption that sunlight is the best disinfectant (Murphy, 2013). In the last ten years,
the Securities and Exchange Commission (SEC) has issued a series of new regulations specifically
targeting the pay advisory industry. On August 11, 2006, the SEC issued Release 33-8732, which
modified the required disclosures under the Securities Exchange Acts of 1933 and 1934
(commonly known as the “Securities Acts”), effective November 7, 2006. This new rule mandated
that publicly traded U.S. corporations identify and describe the role of all consultants who provide
advice on executive compensation.6
On December 16, 2009, the SEC specifically targeted cross-selling conflicts for
compensation consultants with Release 33-9089.7 Effective February 28, 2010, if a firm hires a
6 https://www.sec.gov/rules/final/2006/33-8732a.pdf 7 https://www.sec.gov/rules/final/2009/33-9089.pdf
8
compensation consultant and the consultant provides other services to the firm in excess of
$120,000, the firm is required to disclose both the fees charged for compensation consulting and
the fees charged for other services. The 2009 rule caused a structural break in the compensation
consultant industry. Many of the largest “multi-service” consultants spun off their compensation
divisions to avoid the fee disclosure requirement.8 Firms could then continue to work with the
parent company and disclose fees, switch to the newly created spin off, or switch to a different
consultant altogether. Most recently, on June 20, 2012, the SEC amended Item 407(e)(3)9 in
Regulation S-K to again specifically address conflicts of interest. This rule, effective September
25, 2012, was part of the Dodd-Frank Act implementation and requires an assessment by the
compensation committee of the level of independence of the compensation consultants hired.
Following the 2006 disclosure requirements, several studies have examined the role and
conflicts of interest that compensation consultants may face using the new data created by these
regulations (Murphy and Sandino, 2010; Armstrong et al., 2012; Cho et al., 2015; Chu et al., 2017).
Examining concerns over cross-selling, Murphy and Sandino (2010) study both U.S. and Canadian
firms and find that consultants also offering non-pay advisory services provide higher pay
recommendations.10 In other work, Chu et al. (2017) focus on firms that switched to the newly
created spinoff consultants resultant from the 2009 SEC regulation. CEOs at these firms were paid
significantly more than those who stayed with the multi-service consultant or switched to a
different consultant. They interpret this result as evidence that firms who switched to newly created
spinoffs were the firms that were most affected by the cross-selling conflict of interest.
8 Notable spinoffs include: Towers Watson spun off Pay Governance. Aon Hewitt spun off Meridian. Mercer Human Resources spun off
Compensation Advisory Partners. 9 https://www.sec.gov/rules/final/2011/33-9330-secg.htm 10 Cadman et al. (2010) also test for the cross-selling conflict of interest but do not find a relation between CEO pay and potential conflicts of
interest of the compensation consultant.
9
The repeat business conflict of interest, however, has garnered much less attention in the
literature. Murphy and Sandino (2010) were the first to look at this conflict by examining whether
the consultants are hired by management or the compensation committee. However, they find no
evidence of the repeat business conflict of interest. Two notable studies, Goh and Gupta (2010)
and Cho et al. (2015), follow up their work. Similar to our paper, Goh and Gupta (2010) study 350
firms in the United Kingdom from 2002 to 2008. They show that firms who switch consultants in
a given year are paid more than matched firms that do not switch consultants, suggesting that
powerful managers have co-opted compensation consultants. However, a generalization to
domestic firms is uncertain given the differences in firm characteristics and governance regimes
between U.S. and U.K. listed companies. Cho et al. (2015) examine a small subset of firms that
report fees following the 2009 rule and show a positive relation between level of fees and CEO
pay levels. Both of these studies provide some limited evidence for the use of consultants to
support excessive pay packages and interpret the findings as evidence of a repeat business conflict.
Overall, the extant evidence on repeat business is incomplete and little work has been done on why
U.S. firms choose to switch compensation consultants, suggesting the need for more research.
2.2 Managerial power and shareholder hypotheses
We develop two competing hypotheses that shed light on our research question about the
motivations for engaging with a new compensation consultant. A profit maximizing consultant
firm will serve whoever has the power to retain them in order to earn repeat business (Murphy and
Sandino, 2010). Given the potentially negative implications to the firm of an overcompensated
CEO or a poorly designed pay package (Bebchuck et al., 2011), it is important to understand
whether management or shareholders hold the power to retain or dismiss a given compensation
consultant. If management has the power to retain the consultant, then the consultant will be

10
incentivized to reward management by advocating for higher than optimal pay. We label this
conflict of interest the Managerial Power hypothesis and it is similar to the repeat business conflict
of interest as put forth in Murphy and Sandino (2010).
The retention of a compensation consultant is a clear indication of whether they were
successful in obtaining repeat business from the firm hiring them. Examining pay prior to this
decision should be informative as to the motivations for such a change. Specifically, under the
Managerial Power hypothesis, we expect to find that firms change consultants following low
levels of CEO pay and retain those consultants when pay is high. The problem should be
particularly perverse at companies where the CEO is powerful and corporate governance is weak.
If management actively shops for consultants to earn compensation rents, then examining
the CEO’s pay package following the change should also be revealing. If there is a consultant
change and the Managerial Power hypothesis holds, we expect that the new consultant would be
more apt to reward managers with excessive pay. Therefore, in this case, CEO pay should rise
following the hiring of a new pay advisor. Further, we would expect that shareholders will express
disapproval with the compensation committee for allowing such opportunism. The Managerial
Power hypothesis predicts that changes in consultants should be associated with lower vote totals
for the compensation committee members when they go up for election at the annual meeting.
Managerial Power Hypothesis: Firms change compensation consultants following periods
where the CEO earns low abnormal pay and retain consultants when pay is abnormally
high. Following a change in consultants, CEO abnormal pay should increase in response.
Shareholders will withhold “for” votes in director elections for the compensation
committee members following a consultant switch.
If, however, shareholders ultimately hold the power through their representatives on the
board, then the consultant will be incentivized to serve the shareholders and recommend optimal
CEO pay levels. In this case, the repeat business motive is not a conflict of interest, but rather a

11
mechanism through which the consultant is incentivized to serve the shareholders. The board will
dismiss consultants that recommend overly generous compensation. We present this alternative
motivation to the Managerial Power hypothesis and label it the Shareholder Power hypothesis.
In this view, we expect to find that firms change consultants following their inability to
recommend the appropriate compensation contract. Finding such evidence would suggest that
consultants are evaluated and retained based on their ability to recommend optimal pay levels and
failure to do so means they did not achieve repeat business. As in the first hypothesis, the
Shareholder Power hypothesis might also suggest a change in consultants following periods of
abnormally low CEO pay, albeit for different reasons. For example, firms desire to retain high
quality CEOs and remuneration is a primary talent retention mechanism (Bizjak, Lemmon, and
Naveen, 2008). Thus, abnormally frugal compensation contracts may also be costly to shareholders
if they cause a high quality CEO to take a position elsewhere. The net effect depends upon the
relative costs of possibly losing a talented CEO balanced against the savings from limiting pay-
related agency problems.
Therefore, if a consultant change occurs following low levels of CEO pay, we cannot
distinguish between these two hypotheses. If, however, the change in consultants occurs after
excessive pay (i.e., positive abnormal compensation), this is consistent with the Shareholder
Power, but not the Managerial Power, hypothesis. Results in support of the Shareholder Power
hypothesis should be focused in firms with strong corporate governance where the board represents
the shareholder and is less apt to be influenced by management when choosing a pay advisor.
Under the Shareholder Power hypothesis, if there is a change, the new consultant would
be more successful at recommending optimal CEO pay. Therefore, following excessive pay,
consultant changes should result in declining CEO pay. Furthermore, under this hypothesis,

12
shareholders should be pleased with the compensation committee for choosing a better pay advisor
to design the CEO’s contract and will accordingly express that support with higher vote totals.
Shareholder Power Hypothesis: Firms change compensation consultants following periods
where the CEO earns high abnormal pay. Following a change in consultants, CEO
abnormal pay should decrease in response. Shareholders will award more “for” votes in
director elections for the compensation committee members following a consultant switch.
3. Sample Selection, Research Design, and Descriptive Statistics
In this section we discuss our sample selection and the structure of our primary empirical
tests to examine our testable hypotheses. We also present descriptive statistics on our sample firms
and the compensation consultant industry, as employed by major U.S. companies.
3.1 Sample selection
Our initial sample includes all firms listed in the Execucomp database as members of either
the S&P 500 Large Cap or S&P 400 Midcap (referred to as the S&P 900) indices for any duration
between 2006 and 2014. We collect data on compensation consultants by hand from DEF-14A
proxy statements found on the SEC’s Electronic Data Gathering, Analysis, and Retrieval
(EDGAR) system. The start of the sample period (2006) coincides with the first year that firms
were required to disclose detailed information regarding their compensation consultant. To assess
whether or not there was a change in consultant when there is no proxy in the previous year, we
count a change if the current consultant is different from the consultant listed in the last proxy
statement available. Therefore, we drop firm-years in which the firm does not file a proxy
statement. After these initial screens, we have 8,700 firm-year observations.
We remove firms from the sample that never hire a consultant during our period of study.
Based on previous literature, firms that never hire a compensation consultant appear to be
systematically different from those who hire consultants (Murphy and Sandino, 2017; Armstrong
et al., 2012); in particular, CEOs in these firms are paid consistently less than those who hire

13
consultants. Further, the focus of this study is on consultant switching and our hypotheses only
speak to companies engaging with consultants. This filter eliminates about 3% of the firm-years,
reducing our sample to 8,390 firm-year observations. If a firm hires a consultant in at least one
year during the sample, they are retained for all years.11
Next, we obtain firm characteristics, stock returns, CEO compensation, and corporate
governance variables from Compustat, CRSP, Execucomp, and ISS (RiskMetrics/IRRC),
respectively. All variables are defined in Appendix A. Our final sample is the intersection of all
S&P 900 firms that hire a consultant in at least one year and have non-missing data from each
database. After all data screens, we have a final sample of 6,230 firm-year observations
representing 989 unique firms. All regression estimations are for the 2007-2014 sample period.
3.2 Research design
3.2.1 Consultant switches
The most direct ex-post measure of whether a compensation consultant achieved repeat
business is whether they were retained for the next year. We exploit this setting to examine the
determinants of a firm changing consultants. We believe looking at these changes provides the
clearest signal of the firm’s and consultant’s motivations. While it is possible that a consultant
could resign, we believe the majority of the consultant changes are initiated by the sample firm.
Our key variable of interest is the change in consultant. It is an indicator variable that
equals one if the consultant retained in year t is different from the one retained in the prior year. A
consultant change also includes a situation when firms have no consultant in the prior year to
retaining one or vice versa.12 One concern may be that this situation is different from firing a
11 We do retain non-switchers so as not to bias our sample. That is, firms that retain a compensation consultant, but never switch, also remain in the
sample throughout the entire time. 12 This includes if a firm has two consultants in year t-1 and 1 consultant in year t (or vice versa). This type of change occurs in 8% of our sample.
Our primary results are robust to the exclusion of these cases of consultant changes.

14
current consultant and hiring a new one. The motivation, however, in our context is similar: firms
may hire a consultant because they wish to justify excessive pay (Managerial Power) or they may
do so to achieve optimal pay levels (Shareholder Power). Conversely, when firms stop using any
consultant, a similar intuition applies. Firms may decide not to retain a new one because the firm
is dissatisfied with the consultant’s ability to advocate generous CEO pay (Managerial Power) or
the consultant’s ability to recommend optimal CEO pay (Shareholder Power).
3.2.2 Econometric framework
To test our competing Managerial Power and Shareholder Power hypotheses, we propose
two primary empirical tests. The first test examines the determinants of changing consultants. We
run a Probit regression model of the following form:
𝐶ℎ𝑎𝑛𝑔𝑒 𝑖𝑛 𝐶𝑜𝑛𝑠𝑢𝑙𝑡𝑎𝑛𝑡𝑡
= 𝛼 + 𝛽1𝐴𝑏𝑛𝑜𝑟𝑚𝑎𝑙 𝑃𝑎𝑦𝑡−1 + 𝛽2𝐹𝑖𝑟𝑚 𝐶ℎ𝑎𝑐𝑡𝑒𝑟𝑖𝑠𝑡𝑖𝑐𝑠𝑡−1
+ 𝛽3𝐺𝑜𝑣𝑒𝑟𝑛𝑎𝑛𝑐𝑒 𝐶ℎ𝑎𝑐𝑡𝑒𝑟𝑖𝑠𝑡𝑖𝑐𝑠𝑡−1 + 𝛽4𝐶𝑜𝑛𝑠𝑢𝑙𝑡𝑎𝑛𝑡 𝐶ℎ𝑎𝑐𝑡𝑒𝑟𝑖𝑠𝑡𝑖𝑐𝑠𝑡−1
+ 𝑌𝑒𝑎𝑟 𝐹𝐸 + 𝐼𝑛𝑑𝑢𝑠𝑡𝑟𝑦 𝐹𝐸 + 𝜀
(1)
where the dependent variable is an indicator variable that takes the value of one when the firm has
changed consultants from the previous year and zero otherwise. Firm Characteristics include the
natural logarithm of total assets, the market-to-book ratio, return on assets (ROA), institutional
ownership, number of analysts, annual stock returns, and the debt-to-asset ratio. Governance
Characteristics include CEO age, CEO tenure, CEO turnover, a dual class firm indicator, board
size, the percentage of board independence, the percentage of outside board members considered
busy, a CEO/Chairman duality indicator, a classified board indicator, the percentage of the outside
board members co-opted by the CEO, and an indicator for whether the firm engaged in M&A
activity. Consultant characteristics include an indicator for whether the consultant is an industry
specialist, an indicator for whether they are multi-service consultants, and an indicator for if the

15
firm retains more than one consultant. All variables are constructed as of the fiscal year prior to
the consultant change. We use year and industry fixed effects to absorb any time or industry
invariant unobserved heterogeneity. Throughout all tests, standard errors are clustered at the firm
level (Rogers, 1993) to account for serial dependence in the error term (Petersen, 2009).
The key variable in this analysis relates to abnormal CEO pay prior to the consultant switch
(Abnormal Payi,t-1). Specifically, we are concerned with whether or not the CEO received above
or below optimal pay levels. The optimal level of CEO pay, however, is inherently unobservable.
To address this challenge, we calculate abnormal pay following Yermack (2006) by assuming that
the appropriate level of CEO pay is a function of firm size, time on the job, shareholder wealth
creation, industry, and year. Abnormal pay is, therefore, the residual from a calendar year cross-
sectional regression explaining CEO pay, where the independent variables in the regression are
the log of sales, CEO tenure, abnormal stock returns, and industry fixed effects.
𝑇𝑜𝑡𝑎𝑙 𝐶𝑜𝑚𝑝𝑒𝑛𝑠𝑎𝑡𝑖𝑜𝑛𝑖,𝑡
= 𝛼 + 𝛽1ln (𝑆𝑎𝑙𝑒𝑠)𝑡 + 𝛽2𝐶𝐸𝑂 𝑇𝑒𝑛𝑢𝑟𝑒𝑡 + 𝛽3𝐴𝑏𝑛𝑜𝑟𝑚𝑎𝑙 𝑆𝑡𝑜𝑐𝑘 𝑅𝑒𝑡𝑢𝑟𝑛𝑡
+ 𝐼𝑛𝑑𝑢𝑠𝑡𝑟𝑦 𝐹𝐸 + 𝜀
(2)
Abnormal Pay = Actual Total Compensation - Predicted Total Compensation (3)
where Salesi,t is net sales in millions for firm i at time t, and CEO Tenurei,t is the total number of
years the current CEO has served in that role at the company. Abnormal Stock Returni,t is the net
of market model cumulative abnormal stock returns for the fiscal year, where a value greater than
zero reflects a CEO that is paid higher than predicted.13 Appendix A defines all variables.
Regressing the change of a compensation consultant on Abnormal Payt-1 is informative in
distinguishing between the Managerial Power and the Shareholder Power hypotheses. A negative
13 Our results are robust to the use of industry-adjusted pay. We take the CEO total pay (TDC1 in EXECUCOMP) and subtract the average of the FF48 industry of all firm-years within the EXECUCOMP database. A value greater than zero reflects a CEO who is paid above the industry average
for that year. See Table 10.
16
coefficient would imply that firms are more likely to change consultants following low levels of
abnormal CEO pay. We note that this may be consistent with both hypotheses, depending on the
relative costs of pay-related agency problems verses the potential loss of good talent. Conversely,
a positive coefficient would imply that high abnormal CEO pay leads to the dismissal of their
compensation consultant. This may lend some support for the Shareholder Power hypothesis,
depending on the relative costs of pay-related agency problems verses the potential loss of good
talent. However, such evidence would be against the Managerial Power hypothesis.
We also run regressions where we split the abnormal pay variable based on positive and
negative values of abnormal pay. This separation focuses on the primary case of interest: when
abnormal pay values are high (e.g., the CEO received excessive compensation). Accordingly, we
create two variables, Positive Abnormal Payt-1 and Negative Abnormal Payt-1. Our testable
hypotheses have differing predictions for these two variables. Positive Abnormal Payt-1 is equal to
Abnormal Payt-1 when it is greater than zero and zero otherwise. Under the Managerial Power
hypothesis, Positive Abnormal Pay should take a negative coefficient, but it should load positively
under the Shareholder Power hypothesis. Negative Abnormal Payt-1 is equal to Abnormal Payt-1
when it is negative and zero otherwise. When regressing the consultant change indicator on this
variable, the Managerial Power hypothesis would predict a negative coefficient, but the sign is
ambiguous under the Shareholder Power hypothesis.
To further distinguish between the competing hypotheses, we focus on four corporate
governance variables from prior literature to distinguish between the Shareholder Power and
Managerial Power hypotheses: board independence, co-opted boards, CEO/chairman duality, and
CEO tenure. When the board is comprised of independent directors without compromising ties to
management, they are more likely they are to look out for shareholders (Weisbach, 1988; Dahya
17
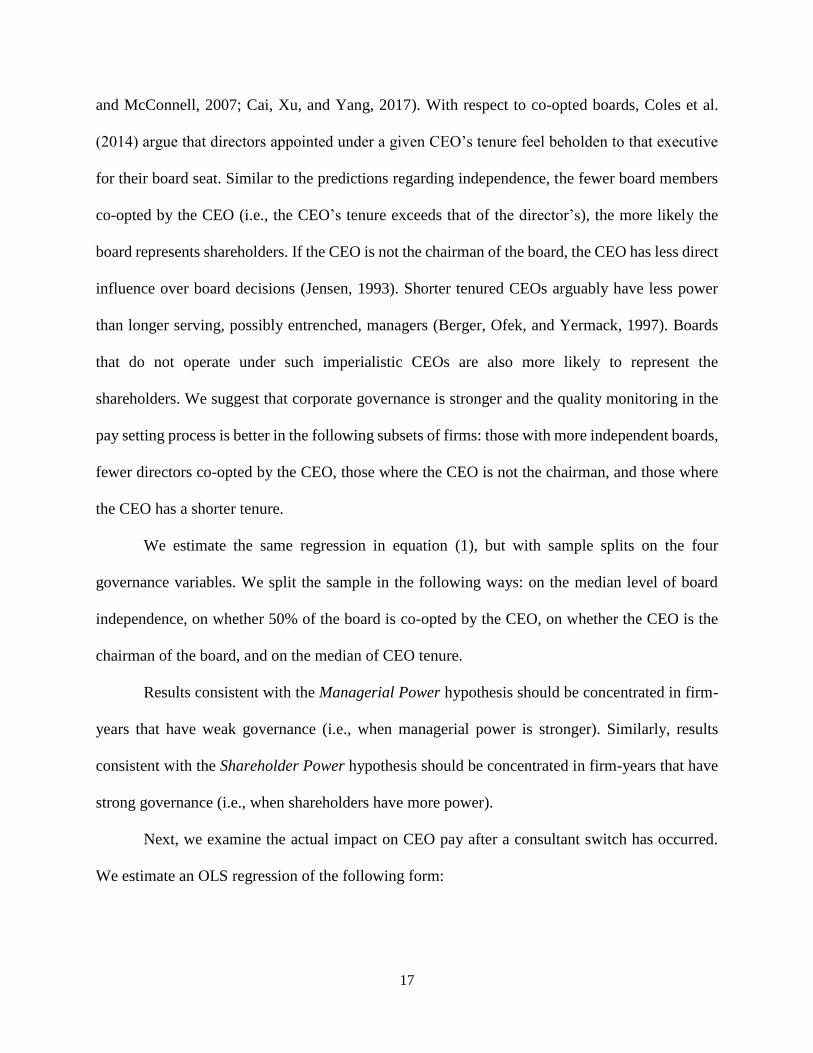
and McConnell, 2007; Cai, Xu, and Yang, 2017). With respect to co-opted boards, Coles et al.
(2014) argue that directors appointed under a given CEO’s tenure feel beholden to that executive
for their board seat. Similar to the predictions regarding independence, the fewer board members
co-opted by the CEO (i.e., the CEO’s tenure exceeds that of the director’s), the more likely the
board represents shareholders. If the CEO is not the chairman of the board, the CEO has less direct
influence over board decisions (Jensen, 1993). Shorter tenured CEOs arguably have less power
than longer serving, possibly entrenched, managers (Berger, Ofek, and Yermack, 1997). Boards
that do not operate under such imperialistic CEOs are also more likely to represent the
shareholders. We suggest that corporate governance is stronger and the quality monitoring in the
pay setting process is better in the following subsets of firms: those with more independent boards,
fewer directors co-opted by the CEO, those where the CEO is not the chairman, and those where
the CEO has a shorter tenure.
We estimate the same regression in equation (1), but with sample splits on the four
governance variables. We split the sample in the following ways: on the median level of board
independence, on whether 50% of the board is co-opted by the CEO, on whether the CEO is the
chairman of the board, and on the median of CEO tenure.
Results consistent with the Managerial Power hypothesis should be concentrated in firm-
years that have weak governance (i.e., when managerial power is stronger). Similarly, results
consistent with the Shareholder Power hypothesis should be concentrated in firm-years that have
strong governance (i.e., when shareholders have more power).
Next, we examine the actual impact on CEO pay after a consultant switch has occurred.
We estimate an OLS regression of the following form:

18
∆𝑇𝑜𝑡𝑎𝑙 𝑃𝑎𝑦𝑡,𝑡−1
= 𝛼 + 𝛽1∆𝐶𝑜𝑛𝑠𝑢𝑙𝑡𝑎𝑛𝑡𝑡,𝑡−1 + 𝛽2𝐴𝑏𝑛𝑜𝑟𝑚𝑎𝑙 𝑃𝑎𝑦𝑡−1
+ 𝛽3∆𝐶𝑜𝑛𝑠𝑢𝑙𝑡𝑎𝑛𝑡𝑡,𝑡−1 ∗ 𝐴𝑏𝑛𝑜𝑟𝑚𝑎𝑙 𝑃𝑎𝑦𝑡−1
+ 𝛽4∆𝐹𝑖𝑟𝑚 𝐶ℎ𝑎𝑟𝑎𝑐𝑡𝑒𝑟𝑖𝑠𝑡𝑖𝑐𝑠𝑡,𝑡−1 + 𝛽5∆𝐺𝑜𝑣𝑒𝑟𝑛𝑎𝑛𝑐𝑒 𝑉𝑎𝑟𝑖𝑎𝑏𝑙𝑒𝑠𝑡,𝑡−1
+ 𝛽6𝛥𝐶𝑜𝑛𝑠𝑢𝑙𝑡𝑎𝑛𝑡 𝑉𝑎𝑟𝑖𝑎𝑏𝑙𝑒𝑠𝑡,𝑡−1 + 𝑌𝑒𝑎𝑟 𝐹𝐸 + 𝐼𝑛𝑑𝑢𝑠𝑡𝑟𝑦 𝐹𝐸 + 𝜀
(4)
where the dependent variable is the change in total CEO pay from year t-1 to year t. Changes in
firm characteristics and governance variables are used where appropriate as well as a control for
prior M&A deal-making. We control for both the change and the level of firm size and consultant
characteristics as these models. We apply a similar approach to the previous regressions by
bifurcating abnormal pay into its positive and negative components. We use industry and year
fixed effects to absorb any time or industry invariant unobserved heterogeneity. Standard errors
are clustered at the firm level.
The primary variable of interest is the interaction between the change in consultant and
abnormal pay. For robustness, we use three specifications of this interaction for the abnormal pay
variable. First, we use the continuous abnormal pay variable. Second, we use an indicator variable
that equals one when abnormal pay is greater than zero. Third, we use an indicator that equals one
when the abnormal pay variable is greater than the within-sample median.
Next, we examine the effect of changing consultants on subsequent director votes. We test
whether there is a relation between the proportions of “for” votes for the board of directors
following the change of consultant. A favorable shareholder reaction to a change in compensation
consultant would manifest in a greater proportion of “for” votes for the board member, consistent
with the Shareholder Power hypothesis. If, however, the shareholders are unhappy with the change
of consultant, we would expect to see fewer “for” votes in the following election, consistent with
the Managerial Power hypothesis. We estimate the following model to test these hypotheses:
19
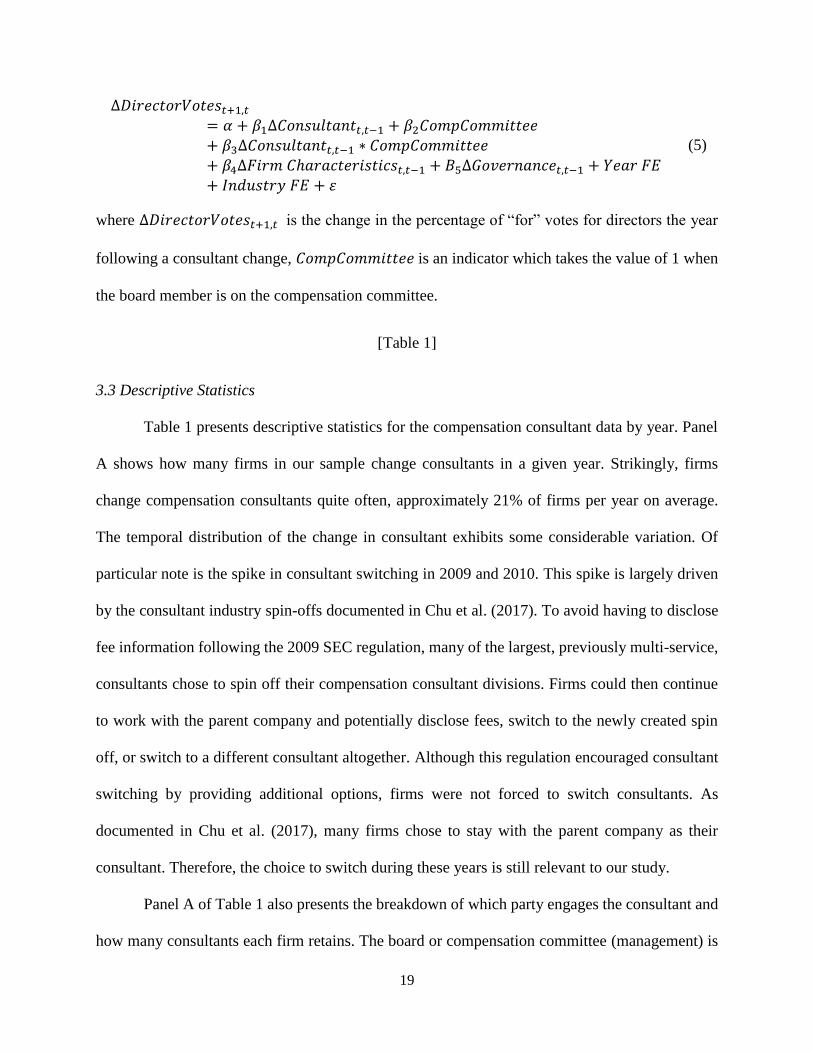
∆𝐷𝑖𝑟𝑒𝑐𝑡𝑜𝑟𝑉𝑜𝑡𝑒𝑠𝑡+1,𝑡
= 𝛼 + 𝛽1∆𝐶𝑜𝑛𝑠𝑢𝑙𝑡𝑎𝑛𝑡𝑡,𝑡−1 + 𝛽2𝐶𝑜𝑚𝑝𝐶𝑜𝑚𝑚𝑖𝑡𝑡𝑒𝑒+ 𝛽3∆𝐶𝑜𝑛𝑠𝑢𝑙𝑡𝑎𝑛𝑡𝑡,𝑡−1 ∗ 𝐶𝑜𝑚𝑝𝐶𝑜𝑚𝑚𝑖𝑡𝑡𝑒𝑒+ 𝛽4∆𝐹𝑖𝑟𝑚 𝐶ℎ𝑎𝑟𝑎𝑐𝑡𝑒𝑟𝑖𝑠𝑡𝑖𝑐𝑠𝑡,𝑡−1 + 𝐵5∆𝐺𝑜𝑣𝑒𝑟𝑛𝑎𝑛𝑐𝑒𝑡,𝑡−1 + 𝑌𝑒𝑎𝑟 𝐹𝐸+ 𝐼𝑛𝑑𝑢𝑠𝑡𝑟𝑦 𝐹𝐸 + 𝜀
(5)
where ∆𝐷𝑖𝑟𝑒𝑐𝑡𝑜𝑟𝑉𝑜𝑡𝑒𝑠𝑡+1,𝑡 is the change in the percentage of “for” votes for directors the year
following a consultant change, 𝐶𝑜𝑚𝑝𝐶𝑜𝑚𝑚𝑖𝑡𝑡𝑒𝑒 is an indicator which takes the value of 1 when
the board member is on the compensation committee.
[Table 1]
3.3 Descriptive Statistics
Table 1 presents descriptive statistics for the compensation consultant data by year. Panel
A shows how many firms in our sample change consultants in a given year. Strikingly, firms
change compensation consultants quite often, approximately 21% of firms per year on average.
The temporal distribution of the change in consultant exhibits some considerable variation. Of
particular note is the spike in consultant switching in 2009 and 2010. This spike is largely driven
by the consultant industry spin-offs documented in Chu et al. (2017). To avoid having to disclose
fee information following the 2009 SEC regulation, many of the largest, previously multi-service,
consultants chose to spin off their compensation consultant divisions. Firms could then continue
to work with the parent company and potentially disclose fees, switch to the newly created spin
off, or switch to a different consultant altogether. Although this regulation encouraged consultant
switching by providing additional options, firms were not forced to switch consultants. As
documented in Chu et al. (2017), many firms chose to stay with the parent company as their
consultant. Therefore, the choice to switch during these years is still relevant to our study.
Panel A of Table 1 also presents the breakdown of which party engages the consultant and
how many consultants each firm retains. The board or compensation committee (management) is

20
stated as the engaging party 89% (8%) of the time. The engaging party is unclear in 3% of the
cases. Approximately 9% of all firm-years retain two or more consultants (most of which retain
only two). Divided firms, firms where both the board and the management hire separate
consultants, make up about 6% of the sample.
Panel B of Table 1 presents details on firms that switch consultants. We classify consultants
along several dimensions. We classify firms by whether they have high market share or low market
share. A consultant has high market share if the consultant has greater than five percent market
share within our sample and low market share otherwise. Following Chu et al. (2017), we classify
whether the firm is a multiservice consultant or a single service consultant. Multiservice
consultants are larger firms offering a variety of other services to the firm. These services tend to
be more lucrative to the consultant than compensation consulting; thus, these consultants have
typically been the target of the aforementioned cross-selling conflict of interest.
Lastly, we classify a consultant as an industry specialist or generalist based on the
concentration of industries of the consultant’s clients. If the difference in size between the
consultant’s largest industry and second largest industry is greater than one standard deviation (of
all industries) then the consultant is classified as an industry specialist. According to this measure,
the following consultants are determined to be industry specialists: Frederic W Cook, Mercer,
Pearl Meyer, Compensia, Hay Group, Steven Hall & Partners, and FPL Advisors. Overall, more
firms in our sample tend to use a consultant with high market share, a consultant that only provides
compensation consulting, and one that is a generalist.
Further, we split our sample into two distinct time periods. The 2007 to 2010 time period
represents the start of when firms must disclose compensation consultants and also contains
significant other regulation affecting the consultant industry. The second sample is from 2011 to

21
2014 and is a sample with fewer confounding events present. The largest shift in consultant
characteristics that occurs between the two samples is the use of multiservice consultants or single
service consultants. In the 2007 to 2010 sample, 48.38% of firms use multiservice consultants.
Comparatively, in the 2011-2014 period, that percentage decreased to 22.39%. This drop is largely
a function of the large multiservice consultants spinning off their single service consulting firms.
We next examine consultant’s characteristics when firms switch. Perhaps unsurprisingly,
most firms switch laterally within the same type of consultant: from high market share to high
market share (and low market share to low market share) and from multiservice to multiservice
and single service to single service consultants. While there is a significant subset of firms that
switch across categories, it appears that most firms have a type of consultant they prefer. Potential
reasons for this include board preferences, firm size and complexity, and industry specialization.14
[Table 2]
Table 2, Panel A presents the top 15 consultant firms and their respective market shares.
As noted in the literature, several consultants hold a considerable portion of the market share, even
with the 2009 and 2010 SEC regulations’ impact. For example, Towers Watson in 2009 spun off
Pay Governance and many of their current clients chose to switch to Pay Governance (Towers
Watson shrunk from 26.5% in 2009 to 11.7% in 2011 and Pay Governance grew to 9.0% in 2011).
By 2014, Towers Watson had retained only 8.7% of the market share and Pay Governance retained
9.4%. As of 2014, Frederic W. Cook has the greatest market share at 22.5%. Frederic W. Cook
was the largest “specialist” consultant (meaning they offered no cross-selling services) leading up
14 While consultant tenure would also be interesting to examine, we are precluded from calculating consultant tenure because firms only began
consistently reporting consultant names in 2006.
22
to the 2009 SEC rule, and as the multi-service consultants spun off portions of their businesses,
Frederic W. Cook enjoyed a lasting increase in market share from 16.9% in 2009 to 18.9% in 2010.
Panel B of Table 2 describes the industry concentration by consultant. Industry
specialization is likely a factor firms consider when selecting consultants and it appears at least
some consultants do specialize in a particular industry. For example, 66.86% of Compensia’s
clients are in the business equipment industry representing a specialization while FPL Advisors
exclusively consults for financials (all of them are REITs). Towers Watson is an example of a
“generalist,” having clients across a broad spectrum of industries. Panel C of Table 2 examines the
scope of the top 15 consultants. There is considerable variation in consultant size. Towers Watson
(Willis) is the largest multiservice consultancy with 112 US offices and a large international
presence. Many of the single service consultants have one to three US offices and limited or no
international presence.
[Table 3]
Table 3 presents firm, compensation, and board characteristics for the companies in the
sample. Of particular interest are the abnormal and industry-adjusted pay variables. Mechanically,
abnormal pay is on average near zero (our sample cuts create some deviation) with the median
being slightly negative. The industry-adjusted total pay has a positive average and median (with
the first quartile being slightly positive), suggesting that the average CEO in our sample is paid
higher than the industry average. This univariate statistic is natural as our sample is for S&P 900
firms and the industry average calculation is for all firms in EXECUCOMP, including the CEOs
at firms listed in the S&P 600 Small Cap index that tend to be paid less. Our results are robust to
the use of within sample industry-adjusted pay. Other firm characteristics and board characteristics
23
are in-line with previous literature (Faulkender and Yang, 2010; Cai, Kini, and Williams, 2016).
To mitigate the influence of outliers, all variables are winsorized at the 1% and 99% level.
4. Results
4.1 Why do firms switch compensation consultants?
Table 4 presents results of the Probit regressions examining the determinants of consultant
switching. Columns 1 to 3 use the abnormal pay variable as the primary variable of interest and
columns 4 to 6 split abnormal pay into its positive and negative components. The columns differ
in the additional variables included that relate to other influences on whether the firm changes
consultants. In columns 1 to 3, the coefficients on abnormal pay are all positive and statistically
significant, indicating that higher abnormal CEO pay increases the likelihood that the firm changes
compensation consultants. For example, the marginal effect for column 3 is 0.0019 meaning that
an increase of one standard deviation in abnormal pay leads to a 4% increase in the likelihood of
changing consultants. Given that the unconditional probability of changing consultants is 20.8%,
this effect is economically relevant.
It is unclear, at this point, whether this finding is driven by CEOs who are under- or over-
paid. For example, a positive and significant loading would be consistent with the argument that
the firm likely changes consultants following excessive pay or retains consultants when pay is
abnormally low. To more directly address our hypotheses, we turn to columns 4 to 6 of Table 4.
These regressions indicate clearly that the effect is driven by the positive side of abnormal pay.
That is, firms are more likely to switch consultants following excessive CEO pay. The coefficient
on positive abnormal pay is consistently larger and more statistically significant than the abnormal
pay variable in columns 1 to 3. The marginal effect for column 6 signifies a 6.1% increase in the
likelihood of changing compensation consultants with a one standard deviation increase in the

24
CEO’s excessive pay in the prior year. Furthermore, the coefficient on the negative component of
abnormal pay is never statistically significant. Overall, the results on CEO pay are consistent with
the Shareholder Power hypothesis; it appears that firms are more likely to change consultants
following excessive levels of pay.
Focusing on control variables that are statistically significant in specifications, there are
three interesting results. In all specifications, the prior year stock return loads negatively and
significantly, suggesting that firms are more likely to change consultants following poor firm
performance. Firms are also more likely to change their consultant when the CEO is younger and
the CEO is not the chairman of the board. The last two results indicate a higher likelihood of
consultant turnover when the manager is less powerful. We find no evidence that consulting
switches are driven by merger activity.
It is plausible that variables omitted from our specifications may influence the firm’s
decision to provide the CEO with abnormal pay for a given period and any subsequent
compensation changes. As a further test, we re-estimate models (3) and (6) of Table 4 using firm
and year fixed effects to control for some of these possible firm-specific omitted variables. The
results are similar. The coefficient for abnormal compensation remains positive 0.0133 (p-value
0.05). When split, the coefficient on positive abnormal pay is 0.0181 (p-value 0.04) and remains
statistically insignificant for negative abnormal pay (unreported). Collectively, evidence from
Table 4 appears consistent with Shareholder Power and against the Managerial Power hypothesis.
4.2 Determinants: Governance Splits
Next, we rerun the tests using the governance splits between firms with strong versus weak
governance in Table 5. Given that the result in Table 4 is consistent with the Shareholder Power
hypothesis, we expect the positive and significant coefficient for abnormal pay (or positive

25
abnormal pay) to be concentrated in firms with strong governance. Panel A of Table 5 reports
results of regressions using the traditional abnormal pay variable and Panel B reports regressions
using the abnormal pay variable split on its positive and negative components.
Columns 1 and 2 of Panel A present results for the sample split on the median of board
independence. The coefficient on abnormal pay is positive and significant at the 5% level when
the board has a greater level of independence. When the board is below the median level of
independence, the coefficient is close to zero and insignificant (0.0004 coefficient with a 0.95 p-
value). Columns 3 and 4 of Panel A present results for the sample split on whether the board is co-
opted by the CEO. Similar to the sample split on independence, the coefficient on abnormal pay
for the subsample where the board is not co-opted by the CEO is positive and significant at the
10% level. The coefficient in the subsample with a co-opted board is statistically insignificant.
Columns 5 and 6 of Panel A present results for the sample split on whether the CEO is the chairman
of the board. The coefficient on abnormal pay does not appear to be significantly different based
on this sample split. Lastly, when the CEO has a tenure below the median, the coefficient on
abnormal pay is positive and significant at the 5% level and close to zero and insignificant when
the CEO has had a long tenure.
When we split abnormal pay into its positive and negative components and run the
governance splits, the results are even stronger (Table 5, Panel B). For all four governance splits,
in the strong governance sample, the positive component of abnormal pay is positive and
significant. The coefficients are not statistically significant in any of the four governance splits
that we identify as having weak governance. Additionally, the negative component of abnormal
pay is not significant in any specification.

26
Together, the results in Table 5 present consistent support for the Shareholder Power
hypothesis and against the Managerial Power hypothesis. On each sample split, the positive result
is stronger when shareholders have more power and insignificant when the manager is likely to
have more power. Combined with previous results, evidence supports the Shareholder Power
hypothesis. Firms are more likely to change their consultant when the CEO is paid excessively,
their board is attentive, and shareholders have the power to act. The evidence supports the
interpretation that consultants are evaluated on their ability to recommend optimal pay levels.
4.3 Regressions of the change in consultant on change in CEO pay
After examining the determinants of the choice to change consultants, we examine what
happens to the level of CEO pay following the consultant switch in Table 6. Column 1 uses the
continuous abnormal pay variable. Column 2 uses an indicator variable that takes the value of one
when abnormal pay is positive, zero otherwise. Column 3 uses an indicator variable that takes the
value of one if the abnormal pay is greater than the median abnormal pay in the sample. Lastly,
column 4 uses the previous split of abnormal pay into positive and negative values. The primary
variable of interest in each specification is the interaction coefficient between a change in
consultant and the abnormal pay variable. For columns 2 and 3 that use an indicator variable, the
interaction can be interpreted as the impact of switching consultants on the change in CEO pay
when the CEO has previously been overpaid. For the specifications using the continuous variables
(columns 1 and 4), the interaction reveals whether the effect of changing consultants on the change
in CEO pay depends on the level of abnormal CEO pay.
In all four specifications, the interaction variable is negative and statistically significant.
This significance implies that when the CEO is overpaid and the firm switches consultants, the
subsequent year’s CEO pay decreases. In terms of economic magnitude, for every million dollars

27
of abnormal CEO pay in the previous year, the CEO’s total compensation the following year
decreases by approximately $445,000. However, when the firm changes compensation consultants
following periods of excessive pay, the CEO’s total compensation reduces by another $135,500.
Together, this represents a total decrease in pay for the CEO of $580,500. Focusing on strictly
excessive abnormal pay, the consultant change reduces CEO compensation by an additional
$195,000 (column 4). This evidence is consistent with the Shareholder Power hypothesis and
against the Managerial Power hypothesis. When the compensation consultant changes,
particularly when the CEO has been overpaid, it results in a decrease in CEO pay.
There are two additional important findings. First, the coefficient on the change in
consultant is not significantly different from zero when the CEO is underpaid. Second, when the
interaction is removed, the coefficient on change in consultant is not significantly different from
zero (untabulated). Both of these are informative findings. The effect of changing consultant on
subsequent CEO pay appears to be driven primarily by when the CEO is excessively paid. While
the Shareholder Power hypothesis predicts that any deviation from optimal pay would trigger a
consultant switch and subsequent correction, it is logical to assume this effect is more prevalent
when the CEO is paid excessively than underpaid. It is not often that shareholders complain that
their CEO is underpaid, however, the opposite is a persistent occurrence. Additionally, these
results are inconsistent with the Managerial Power hypothesis. Under the Managerial Power
hypothesis, we expect that a consultant change would have the greatest impact on CEO pay when
the CEO was previously underpaid. However, we find no such relation.
The estimates on our control variables are omitted to conserve space, but they are in line
with prior research. Higher stock returns are associated with increases in CEO pay, as are changes
in firm size (Gabaix and Landier, 2008). Consistent with Grinstein and Hribar (2004) and Fich,

28
Starks, and Yore (2014), corporate deal-making is also associated with increases in CEO pay.
Increases in leverage conversely lead to declines in pay (Gilson and Vetsuypens, 1993; John and
John, 1993).
Overall, the results from Table 6 lend support for the Shareholder Power hypothesis.
Regardless of the specification, the interactions between the change in consultant and the abnormal
pay variables are negative and significant. This finding implies that when a firm changes its
compensation consultant following excess CEO pay, CEO pay declines in the subsequent year.
4.4 Endogeneity Concerns
One concern is that the change in consultant is subject to a potential self-selection bias.
Specifically, the change in consultant is a choice variable; the firm chooses whether to change its
current consultant. As such, firms changing consultants are not randomly assigned. If there is some
omitted variable that impacts both the choice to change consultants and the change in pay (the
dependent variable in equation 2) then the OLS estimates will be biased and inconsistent.
To address this concern, we employ a standard Heckman two stage treatment effects model.
In the first stage, we run a Probit regression modeling the choice to change consultants. Next, we
calculate the Inverse Mills Ratio from this regression and add it as a control variable in equation
two. The loading on the Inverse Mills Ratio and its impact on the coefficients can determine the
extent of the self-selection bias and its impact on the key results. Importantly, while the system is
technically identified by the nonlinearity of the first stage Probit model under the assumption of
bivariate normality, it is highly recommended to use an instrument in the first stage that is omitted
from the second stage regression to ensure proper identification (Li and Prabhala, 2007).

29
We use the number of compensation consulting firms available per industry in t-1 as our
instrument to identify the system.15 For the instrument to be valid, it must satisfy both the relevance
and exclusion conditions. First, the instrument must meaningfully influence the board’s choice to
change consultants. The relevance condition is testable by examining the statistical significance of
the coefficient in the first stage regression. Second, the instrument must not have a relation with
the dependent variable in the second stage regression (i.e., change in CEO pay) except through its
influence on the choice to change consultants. This exclusion condition is not testable and must be
supported through economic reasoning.
We contend that the number of options in the compensation consulting market, specifically
within a given industry, is likely to impact whether a firm changes its consultant, but is unlikely to
affect the following year’s change in CEO pay. When more compensation consultants are active
in the market, firms have a greater choice, which should increase the likelihood of a given firm
changing compensation consultants. Conversely, if the number of consultants decreases, the
number of choices decreases; therefore, the firm would be less likely to change its compensation
consultant that year. In particular, our instrument takes advantage of the 2010 SEC regulation (i.e.,
Release 33-9089) that caused many consultants to spinoff new advisory firms. Although our
instrument identifies all year-to-year and within industry changes, this regulation increased the
size of the consulting marketplace and our instrument exploits this exogenous variation.
Regardless of whether the number of consulting firms increases or decreases for a given year, it is
not clear how the number of advisors would influence the internal deliberations of the CEO’s
compensation at any given individual firm in the subsequent year.
15 We define industry using one-digit SIC codes. We count a consultant firm as being available in the industry if they
have any clients in that specific industry for a given year. We then sum the number of distinct consultants in a given
industry each year to obtain our instrument.
30
In Table 7, we report the first stage Probit regression with the instrument included. The
vector of independent variables is the same as those used in Table 4, but the estimates are omitted
to conserve space. Columns 1 and 2 use the abnormal pay variable with and without fixed effects.
Columns 3 and 4 use the abnormal pay split between positive and negative values with and without
fixed effects. Regardless of the specification, results are consistent. Both the abnormal pay variable
and positive abnormal pay variable continue to load positively and significantly. In fact, in all
specifications, the magnitude and significance are larger than in Table 4 without the instrument
included. Moreover, the instrument loads positively and is statistically significant at the 1% level
in all specifications, indicating the instrument satisfies the relevance condition. Our estimates
suggest that, as the number of available consulting options increase within the firm’s industry,
firms are more likely to change consultants. The marginal effects at sample means suggest that
increasing the number of consultant options in a given industry by one standard deviation increases
the likelihood of changing consultants by 2.2 percentage points to 23%
Table 8 presents the results of the second stage OLS regression with the Inverse Mills Ratio
from the first stage added as a control variable. Columns 1 and 2 present results using the abnormal
pay with and without fixed effects. Columns 3 and 4 present results using the abnormal pay split
between the positive and negative variables with and without fixed effects. In all specifications,
our primary results retain their sign and significance. Following a change in consultants, CEO pay
falls, particularly when they were overpaid in the prior year.
Further, we note that the Inverse Mills Ratio is statistically insignificant in all
specifications, implying that self-selection bias is not a major concern in our regressions. When
the exclusion condition is not met, the second stage model may suffer from multicollinearity issues
because the Inverse Mills Ratio is correlated with second stage variables (Lennox, Francis, and
31
Wang, 2011). High multicollinearity can inflate the standard errors, but may also indicate that the
model is not correctly specified. We report the variance inflation factors (VIF) for our endogenous
variable (consultant change) and our Inverse Mills Ratio in Table 8. All VIFs are below the
accepted critical value of 10, indicating that multicollinearity is not an issue in our specifications
(Greene, 2008).
4.5 Impact on Votes for Directors
Finally, we observe how shareholders react to a consultant change when they use their
“voice” in the director elections for the members of the compensation committee. Specifically, we
examine the number of “for” votes the committee member receives in the year following a
compensation consultant change. Provided the consultant change helps align the CEO’s incentives
and is in the shareholders’ best interests for the firm, then more shareholders should show support
for directors in the year following the change and vote “for” a given director. Conversely, if the
compensation consultant change is primarily motivated by management looking to obtain excess
pay, then shareholders show their displeasure by withholding “for” votes for directors.
Using a sample of 20,242 director votes from the ISS Voting Analytics database, we
regress whether there was an increase in the percent of ‘for’ votes a director receives from the
previous year on whether there was a change in compensation consultants in the previous year.
We utilize additional control variables following the models outlined in Cai, Garner, and Walkling
(2003) and Field, Souther, and Yore (2018). Results are tabulated in Table 9. All specifications
include meeting clustered standard errors with firm and year fixed effects. As members of the
compensation committee tend to play a more significant role in CEO compensation, we focus on
the effect for directors on the compensation committee in column 2. The results show that in the

32
year following a change in compensation consultants, directors on the compensation committee
receive an additional 0.48% increase in votes.
Further, we explore shareholders’ reactions to a compensation consultant change when the
CEO was previously overpaid (column 3) or if there was a consultant change and that results in a
subsequent a decrease in CEO abnormal pay (column 4). In both of these instances, shareholders
reward the directors for changing consultants due to excessive pay with more “for” votes. For
example, directors receive a 5.3% increase in the percent of “for” votes when the CEO was
previously overpaid and the firm changes consultants. Overall, there appears some evidence that
there is a direct effect on directors when the company decides to change compensation consultants.
Particularly for members of the compensation committee and when the CEO is excessively paid,
these directors appear to garner more shareholder approval, further supporting our Shareholder
Power hypothesis.
4.6 Robustness
For robustness, we explore two main areas of concern: our main measure of abnormal pay
and the effect of regulation on the consulting industry. The main measure we use throughout our
estimations is abnormal pay. For robustness, we use an industry-adjusted CEO pay measure to
replace our abnormal CEO pay variables in all specifications (untabulated). In all specifications,
the results are quantitatively and statistically similar to our earlier findings. When CEOs receive
compensation higher than their industry peers, it leads to a greater likelihood that the firm changes
compensation consultants, supporting the Shareholder Power hypothesis (coefficient of 0.0095,
p-value = 0.02). Further, when the CEO is excessively paid compared to the industry and the firm
changes consultants, the CEO receives a subsequent reduction in compensation (coefficient of -
0.086, p-value = 0.00).

33
As noted, the significant regulation in 2009 created a shift in the compensation consultant
industry due to the mandatory disclosure of fees if a firm received additional services in excess of
$120,000 from their compensation consultant. This regulation created a number of consultant spin-
offs, which caused a spike in the percentage of firms that switched compensation consultants in
the 2009-2010 period (11-18% higher changes than the average). We examine the robustness of
our results by re-estimating the regressions only from 2011 to 2014 to avoid the shift in the
consultant industry after the 2009 regulation as well as year by year. Our results are quantitatively
similar and statistically significant. The coefficient for abnormal pay for the 2011-2014 period is
0.0133 (p-value = 0.05) (unreported), indicating a positive relationship between excessive CEO
pay and a firm changing compensation consultants. These results further support the Shareholder
Power hypothesis.
5. Conclusions
Compensation consultants face the repeat business incentive, whereby they wish to
continue providing services in future years. Whether this incentive creates a conflict of interest
depends on whom the consultants serve. If the consultant serves management’s desire to earn
excess pay, the repeat business incentive is in fact a conflict of interest. If, however, the consultant
serves the shareholders, the repeat business is a mechanism by which the incentives of the
consultant and those of the shareholders are aligned to recommend the best possible pay package
for the CEO. We argue that the consultant will serve whomever has the power to retain them for
future business. In this paper, we test two competing hypotheses to shed light on which party has
this power: the Managerial Power hypothesis and the Shareholder Power hypothesis. To test these
hypotheses, we utilize a unique event that speaks directly to whether the consultant earned repeat
business: consultant switching.

34
Under the Managerial Power hypothesis, consultants are evaluated (and retained) based
on their ability to recommend excessive CEO pay. In contrast, if the Shareholder Power hypothesis
holds, consultants should be evaluated (and retained) based on their ability to recommend optimal
levels of CEO pay. In this instance, a new consultant would be one who could be more successful
at recommending optimal pay levels.
We find strong and robust support for the Shareholder Power hypothesis and little support
for the Managerial Power hypothesis. Firms tend to change consultants following excessive levels
of CEO pay. When the CEO has been paid excessively, a consultant switch is associated with a
decrease in CEO pay in the following year. This finding is robust to endogeneity concerns and
different proxies for optimal levels of CEO pay. In addition, we find evidence that directors benefit
from a change in compensation consultants by receiving more shareholder support in their votes
further supporting the Shareholder Power hypothesis. Overall, our results suggest that the
considerable criticism of the compensation consultant industry may be overstated.

35
References
Aggarwal, R. K., 2007. Executive Compensation and Incentives, Handbook of Empirical Corporate Finance
Volume 2, pp. 498-534.
Armstrong, C.S., Ittner, C.D. and Larcker, D.F., 2012. Corporate governance, compensation consultants, and
CEO pay levels. Review of Accounting Studies, 17(2), pp.322-351.
Bebchuk, L.A. and Fried, J.M., 2003. Executive compensation as an agency problem. Journal of Economic Perspectives, 17(3), pp.71-92.
Bebchuk, L. and Fried, J., 2004. Pay without performance (Vol. 29). Cambridge, MA: Harvard University Press.
Bebchuk, L.A., Cremers, K.M. and Peyer, U.C., 2011. The CEO pay slice. Journal of Financial Economics,
102(1), pp.199-221.
Berger, P.G., Ofek, E. and Yermack, D.L., 1997. Managerial entrenchment and capital structure decisions. The
Journal of Finance, 52(4), pp.1411-1438.
Bizjak, J.M., Lemmon, M.L. and Naveen, L., 2008. Does the use of peer groups contribute to higher pay and
less efficient compensation?. Journal of Financial Economics, 90(2), pp.152-168.
Cadman, B., Carter, M.E. and Hillegeist, S., 2010. The incentives of compensation consultants and CEO pay.
Journal of Accounting and Economics, 49(3), pp.263-280.
Cai, C., Kini, O. and Williams, R., 2016. Do compensation consultants have distinct styles?. Available at SSRN:
https://ssrn.com/abstract=2724072
Cai, J., Garner, J.L. and Walkling, R.A., 2009. Electing directors. The Journal of Finance, 64(5), pp.2389-2421.
Cai, Ye and Xu, Jin and Yang, Jun, Paying by Donating: Corporate Donations Affiliated with Independent
Directors (August 15, 2017). Kelley School of Business Research Paper No. 16-51. Available at SSRN:
https://ssrn.com/abstract=2801817
Cho, J.H., Hyun, J.H. and Shin, J.Y., 2015. Compensation Consultant Fees and CEO Pay. Available at
SSRN: https://ssrn.com/abstract=2615675
Chu, J., Faasse, J. and Rau, P.R., 2017. Do compensation consultants enable higher CEO pay? A disclosure rule
change as a separating device. Management Science. 64(10), pp.4915-4935
Conyon, M.J., Peck, S.I. and Sadler, G.V., 2009. Compensation consultants and executive pay: Evidence from
the United States and the United Kingdom. Academy of Management Perspectives, 23(1), pp.43-55.
Coles, J.L., Daniel, N.D. and Naveen, L., 2008. Boards: Does one size fit all?. Journal of Financial Economics, 87(2), pp.329-356.
Coles, J.L., Daniel, N.D. and Naveen, L., 2014. Co-opted boards. The Review of Financial Studies, 27(6),
pp.1751-1796.
Core, J.E., Holthausen, R.W. and Larcker, D.F., 1999. Corporate governance, chief executive officer
compensation, and firm performance1. Journal of Financial Economics, 51(3), pp.371-406.
Dahya, J. and McConnell, J.J., 2007. Board composition, corporate performance, and the Cadbury committee
recommendation. Journal of Financial and Quantitative Analysis, 42(3), pp.535-564.
Faulkender, M. and Yang, J., 2010. Inside the black box: The role and composition of compensation peer groups.
Journal of Financial Economics, 96(2), pp.257-270.
Fich, E.M., Starks, L.T. and Yore, A.S., 2014. CEO deal-making activities and compensation. Journal of
Financial Economics, 114(3), pp.471-492.
36
Field, L., M. Souther, and A.Yore. 2018. At the Table But Can’t Break Through the Glass Ceiling:
Board Leadership Positions Elude Diverse Directors. 2nd Annual Financial Institutions, Regulation and
Corporate Governance Conference. Available at SSRN: https://ssrn.com/abstract=2810543.
Gabaix, X. and Landier, A., 2008. Why has CEO pay increased so much?. The Quarterly Journal of Economics,
123(1), pp.49-100.
Gilson, S. and Vetsuypens, M., 1993. CEO compensation in financially distressed firms: An empirical analysis.
The Journal of Finance, 48(2), pp. 425-458.
Goh, L. and Gupta, A., 2010. Executive compensation, compensation consultants, and shopping for opinion:
Evidence from the United Kingdom. Journal of Accounting, Auditing & Finance, 25(4), pp.607-643.
Greene, WH, 2008, Econometric Analysis, 8th Edition, Pearson.
Grinstein, Y. and Hribar, P., 2004. CEO compensation and incentives: Evidence from M&A bonuses. Journal
of Financial Economics, 73(1), pp.119-143.
Jensen, M.C., 1993. The modern industrial revolution, exit, and the failure of internal control systems. The Journal of Finance, 48(3), pp.831-880.
John, T. and John, K. 1993. Top-Management compensation and capital structure. The Journal of Finance, 48(3),
pp.949-974.
Lennox, C.S., Francis, J.R. and Wang, Z., 2011. Selection models in accounting research. The Accounting Review, 87(2), pp.589-616.
Li, K., and N. Prabhala. 2007. Self-selection models in corporate finance. In Handbook of Corporate Finance: Empirical Corporate Finance, edited by B. E. Eckso. Amsterdam, The Netherlands: North Holland
Mehran, H., 1995. Executive compensation structure, ownership, and firm performance. Journal of Financial Economics, 38(2), pp.163-184.
Murphy, K.J. and Sandino, T., 2010. Executive pay and “independent” compensation consultants. Journal of Accounting and Economics, 49(3), pp.247-262.
Murphy, K.J. and Sandino, T., 2017, Compensation Consultants and the Level, Composition and Complexity of
CEO Pay. Harvard Business School Accounting & Management Unit Working Paper No. 18-027.
Available at SSRN: https://ssrn.com/abstract=3041427 or http://dx.doi.org/10.2139/ssrn.3041427
Murphy, K.J., 1999. Executive compensation. Handbook of Labor Economics, 3, pp.2485-2563.
Murphy, K.J., 2013. Executive compensation: Where we are, and how we got there. In Handbook of the Economics of Finance (Vol. 2, pp. 211-356). Elsevier.
Rogers, William, 1993, Regression Standard Errors in Clustered Samples, Stata Technical Bulletin 13, 19-23.
Waxman, H., 2007. Executive pay: Conflicts of interest among compensation consultants. United States House
of Representatives Committee on Oversight and Government Reform Majority Staff. December.
Weisbach, M.S., 1988. Outside directors and CEO turnover. Journal of Financial Economics, 20, pp.431-460.

36
Table 1 . Usage of Compensation Consultants, 2007-2014 In Table 1, we present descriptive statistics by year for firms in our sample that use compensation consultants, as reported in their DEF14-A proxy statements.
The sample consists of all firms in the S&P500 or S&P400 that use a compensation consultant at any point in the sample period. Panel A presents the number
of firms per year that change consultants, who engages the compensation consultant and the number of consultants retained. Panel B provides further details
regarding how firms switch between compensation consultants. Each variable is defined in the appendix.
Panel A: Consultant Engagement 2007 2008 2009 2010 2011 2012 2013 2014 All
Total Firms 536 818 812 794 830 818 817 805 6,230
# Firms that Change Consultants 126 136 257 307 157 96 126 91 1,296
% Firms that Change Consultants 23.5% 16.6% 31.7% 38.7% 18.9% 11.7% 15.4% 11.3% 20.8% % Hired by Board 84.0% 84.2% 86.7% 89.4% 90.5% 91.8% 93.4% 94.0% 89.5%
% Hired by Management 11.6% 11.7% 10.2% 7.8% 6.1% 5.0% 3.8% 3.7% 7.3%
% Unclear 4.5% 4.0% 3.1% 2.8% 3.4% 3.2% 2.8% 2.2% 3.2% % Firms Hiring One Consultant 91.0% 91.2% 89.0% 88.7% 89.4% 90.2% 90.5% 89.2% 89.9%
% Firms Hiring Two Consultants 7.6% 7.5% 10.2% 10.7% 10.1% 9.2% 8.9% 10.1% 9.4%
% Firms Hiring Three+ Consultants 1.3% 1.3% 0.7% 0.6% 0.5% 0.6% 0.6% 0.7% 0.8% % Divided Firms 5.4% 5.0% 5.6% 6.1% 6.1% 6.1% 6.0% 5.6% 5.6% Panel B: Firms that Switch Consultants All Years 2007-2010 2011-2014 # Obs % Firms # Obs % Firms # Obs % Firms Use High Market Share Consultant 3,956 63.50% 1,924 65.00% 2,032 62.14% Use Low Market Share Consultant 2,274 36.50% 1,036 35.00% 1,238 37.86% Use Multi-Service Consultant 2,164 34.74% 1,432 48.38% 732 22.39% Use Single-Service Consultant 4,066 65.26% 1,528 51.62% 2,538 77.61% Use Industry Specialist 2,445 39.25% 886 29.93% 1,559 47.68% Use Generalist 3,785 60.75% 2,074 70.07% 1,711 52.32% # Obs % Switchers # Obs % Switchers # Obs % Switchers Switch from High to Low Market Share 186 14.35% 117 14.16% 69 14.68% Switch from Low to High Market Share 172 13.27% 98 11.86% 74 15.74% Switch High to High Market Share 632 48.77% 454 54.96% 178 37.87% Switch Low to Low Market Share 306 23.61% 157 19.01% 149 31.70% Switch Single to Multi-Service 111 8.56% 82 9.93% 29 6.17% Switch Multi- to Single Service 315 24.31% 211 25.54% 104 22.13% Switch Single to Single Service 502 38.73% 210 25.42% 292 62.13% Switch Multi- to Multi-Service 368 28.40% 323 39.10% 45 9.57% Switch Generalist to Industry Specialist 254 19.60% 139 16.83% 115 24.47% Switch Industry Specialist to Generalist 79 6.10% 37 4.48% 42 8.94% Switch Generalist to Generalist 792 61.11% 579 70.10% 213 45.32% Switch Specialist to Industry Specialist 171 13.19% 71 8.60% 100 21.28%
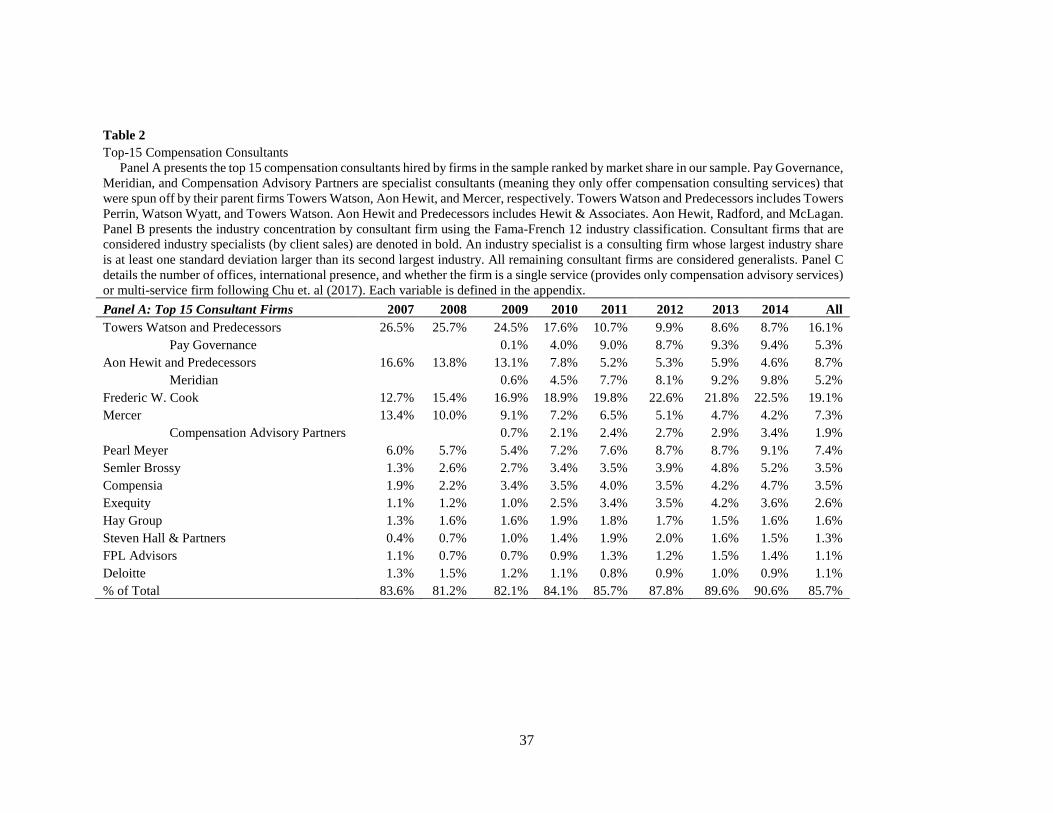
37
Table 2 Top-15 Compensation Consultants Panel A presents the top 15 compensation consultants hired by firms in the sample ranked by market share in our sample. Pay Governance,
Meridian, and Compensation Advisory Partners are specialist consultants (meaning they only offer compensation consulting services) that
were spun off by their parent firms Towers Watson, Aon Hewit, and Mercer, respectively. Towers Watson and Predecessors includes Towers
Perrin, Watson Wyatt, and Towers Watson. Aon Hewit and Predecessors includes Hewit & Associates. Aon Hewit, Radford, and McLagan.
Panel B presents the industry concentration by consultant firm using the Fama-French 12 industry classification. Consultant firms that are
considered industry specialists (by client sales) are denoted in bold. An industry specialist is a consulting firm whose largest industry share
is at least one standard deviation larger than its second largest industry. All remaining consultant firms are considered generalists. Panel C
details the number of offices, international presence, and whether the firm is a single service (provides only compensation advisory services)
or multi-service firm following Chu et. al (2017). Each variable is defined in the appendix.
Panel A: Top 15 Consultant Firms 2007 2008 2009 2010 2011 2012 2013 2014 All Towers Watson and Predecessors 26.5% 25.7% 24.5% 17.6% 10.7% 9.9% 8.6% 8.7% 16.1%
Pay Governance 0.1% 4.0% 9.0% 8.7% 9.3% 9.4% 5.3% Aon Hewit and Predecessors 16.6% 13.8% 13.1% 7.8% 5.2% 5.3% 5.9% 4.6% 8.7%
Meridian 0.6% 4.5% 7.7% 8.1% 9.2% 9.8% 5.2% Frederic W. Cook 12.7% 15.4% 16.9% 18.9% 19.8% 22.6% 21.8% 22.5% 19.1% Mercer 13.4% 10.0% 9.1% 7.2% 6.5% 5.1% 4.7% 4.2% 7.3%
Compensation Advisory Partners 0.7% 2.1% 2.4% 2.7% 2.9% 3.4% 1.9% Pearl Meyer 6.0% 5.7% 5.4% 7.2% 7.6% 8.7% 8.7% 9.1% 7.4% Semler Brossy 1.3% 2.6% 2.7% 3.4% 3.5% 3.9% 4.8% 5.2% 3.5% Compensia 1.9% 2.2% 3.4% 3.5% 4.0% 3.5% 4.2% 4.7% 3.5% Exequity 1.1% 1.2% 1.0% 2.5% 3.4% 3.5% 4.2% 3.6% 2.6% Hay Group 1.3% 1.6% 1.6% 1.9% 1.8% 1.7% 1.5% 1.6% 1.6% Steven Hall & Partners 0.4% 0.7% 1.0% 1.4% 1.9% 2.0% 1.6% 1.5% 1.3% FPL Advisors 1.1% 0.7% 0.7% 0.9% 1.3% 1.2% 1.5% 1.4% 1.1% Deloitte 1.3% 1.5% 1.2% 1.1% 0.8% 0.9% 1.0% 0.9% 1.1% % of Total 83.6% 81.2% 82.1% 84.1% 85.7% 87.8% 89.6% 90.6% 85.7%
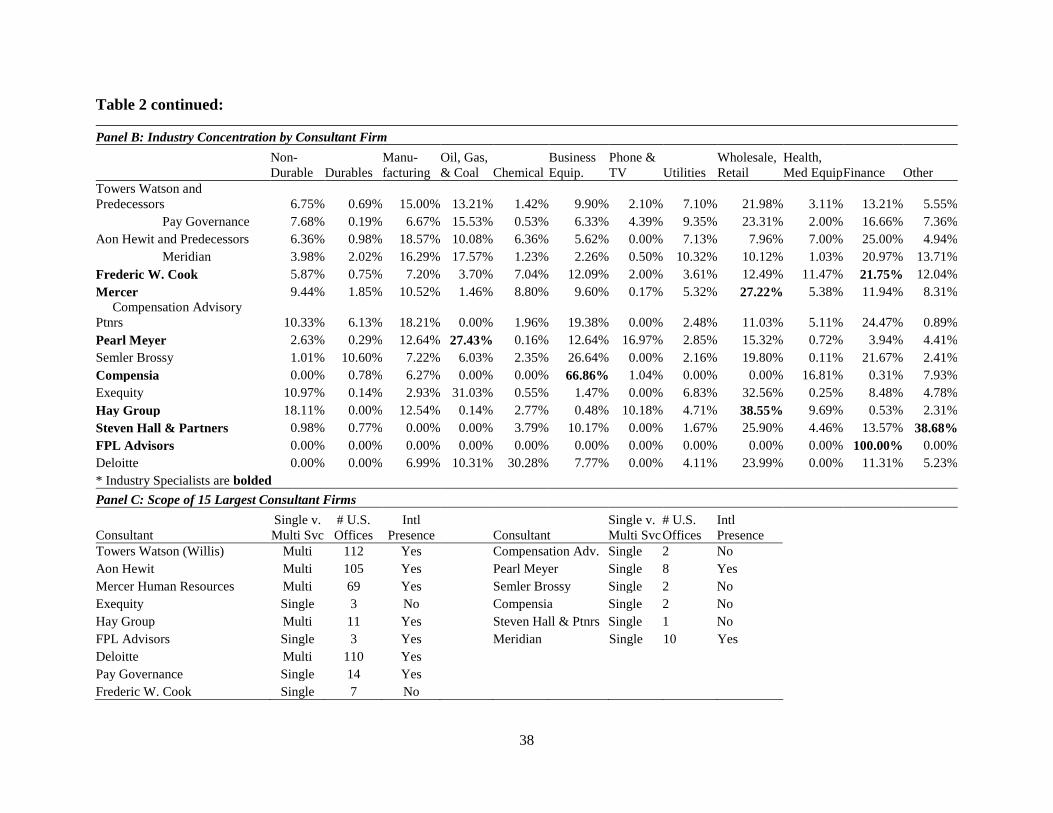
38
Table 2 continued:
Panel B: Industry Concentration by Consultant Firm
Non-
Durable Durables
Manu-
facturing
Oil, Gas,
& Coal Chemical
Business
Equip.
Phone &
TV Utilities
Wholesale,
Retail
Health,
Med Equip Finance Other
Towers Watson and
Predecessors 6.75% 0.69% 15.00% 13.21% 1.42% 9.90% 2.10% 7.10% 21.98% 3.11% 13.21% 5.55%
Pay Governance 7.68% 0.19% 6.67% 15.53% 0.53% 6.33% 4.39% 9.35% 23.31% 2.00% 16.66% 7.36%
Aon Hewit and Predecessors 6.36% 0.98% 18.57% 10.08% 6.36% 5.62% 0.00% 7.13% 7.96% 7.00% 25.00% 4.94%
Meridian 3.98% 2.02% 16.29% 17.57% 1.23% 2.26% 0.50% 10.32% 10.12% 1.03% 20.97% 13.71%
Frederic W. Cook 5.87% 0.75% 7.20% 3.70% 7.04% 12.09% 2.00% 3.61% 12.49% 11.47% 21.75% 12.04%
Mercer 9.44% 1.85% 10.52% 1.46% 8.80% 9.60% 0.17% 5.32% 27.22% 5.38% 11.94% 8.31%
Compensation Advisory
Ptnrs 10.33% 6.13% 18.21% 0.00% 1.96% 19.38% 0.00% 2.48% 11.03% 5.11% 24.47% 0.89%
Pearl Meyer 2.63% 0.29% 12.64% 27.43% 0.16% 12.64% 16.97% 2.85% 15.32% 0.72% 3.94% 4.41%
Semler Brossy 1.01% 10.60% 7.22% 6.03% 2.35% 26.64% 0.00% 2.16% 19.80% 0.11% 21.67% 2.41%
Compensia 0.00% 0.78% 6.27% 0.00% 0.00% 66.86% 1.04% 0.00% 0.00% 16.81% 0.31% 7.93%
Exequity 10.97% 0.14% 2.93% 31.03% 0.55% 1.47% 0.00% 6.83% 32.56% 0.25% 8.48% 4.78%
Hay Group 18.11% 0.00% 12.54% 0.14% 2.77% 0.48% 10.18% 4.71% 38.55% 9.69% 0.53% 2.31%
Steven Hall & Partners 0.98% 0.77% 0.00% 0.00% 3.79% 10.17% 0.00% 1.67% 25.90% 4.46% 13.57% 38.68%
FPL Advisors 0.00% 0.00% 0.00% 0.00% 0.00% 0.00% 0.00% 0.00% 0.00% 0.00% 100.00% 0.00%
Deloitte 0.00% 0.00% 6.99% 10.31% 30.28% 7.77% 0.00% 4.11% 23.99% 0.00% 11.31% 5.23%
* Industry Specialists are bolded
Panel C: Scope of 15 Largest Consultant Firms
Consultant
Single v.
Multi Svc
# U.S.
Offices
Intl
Presence Consultant
Single v.
Multi Svc
# U.S.
Offices
Intl
Presence Towers Watson (Willis) Multi 112 Yes Compensation Adv. Single 2 No Aon Hewit Multi 105 Yes Pearl Meyer Single 8 Yes Mercer Human Resources Multi 69 Yes Semler Brossy Single 2 No Exequity Single 3 No Compensia Single 2 No Hay Group Multi 11 Yes Steven Hall & Ptnrs Single 1 No FPL Advisors Single 3 Yes Meridian Single 10 Yes Deloitte Multi 110 Yes Pay Governance Single 14 Yes Frederic W. Cook Single 7 No

39
Table 3
Descriptive Statistics In Table 3, we present descriptive statistics for the universe of firms listed in the S&P500 or S&P400 indices that
have ever hired a pay advisor with complete data for the 2007-2014 period. Panel A presents firm characteristics,
panel B presents compensation and CEO variables, and panel C presents Board Characteristics. Variables are
calculated using data from Compustat, CRSP, Execucomp, and ISS(Riskmetrics). All variables are described in the
Appendix. Total Assets and Sales are in millions and all compensation variables are in thousands.
Panel A: Firm Characteristics Mean Std Q1 Median Q3
Total Assets 24,634 67,625 2,494 5,944 16,883
Market-to-Book 3.0297 2.9737 1.4216 2.1953 3.4899
ROA 0.0539 0.0653 0.0205 0.0497 0.0871
Sales 10,561 20,205 1,569 3,588 9,664
Stock Return 0.0459 0.3075 (0.1475) 0.0141 0.1919
LT Debt to Assets 0.2339 0.1643 0.1047 0.2184 0.3407
Merger 0.2053 0.4040 0.0000 0.0000 0.0000
Panel B: Compensation Variables Mean Std Q1 Median Q3
Salary & Bonus 1155.18 834.25 785.83 990.00 1212.50
Equity 4562.83 4200.87 1741.75 3507.51 6277.71
Other Pay 1839.40 2032.66 581.87 1289.54 2361.65
Total Pay 7626.24 5733.58 3760.13 6171.10 9784.18
Abnormal Pay 8.77 4331.00 -2323.79 -619.10 1459.70
Industry Adjusted Total Pay 3777.47 5600.11 17.53 2300.50 5852.89
CEO Age 56.26 6.29 52.00 56.00 60.00
Tenure 7.86 6.75 3.00 6.00 10.41
CEO Turnover 0.10 0.30 0.00 0.00 0.00
Panel C: Board Characteristics Mean Std Q1 Median Q3
Classified Board 0.39 0.49 0.00 0.00 1.00
Dual Class Shares 0.04 0.20 0.00 0.00 0.00
Board Size 10.00 2.08 9.00 10.00 11.00
% Board Independent 81.46 9.61 75.00 83.33 90.00
CEO Chairman 0.53 0.50 0.00 1.00 1.00
% Outsider Busy Board 29.02 19.55 14.29 28.57 42.86
% Outsider Board Co-opted 46.89 33.66 18.18 42.86 75.00
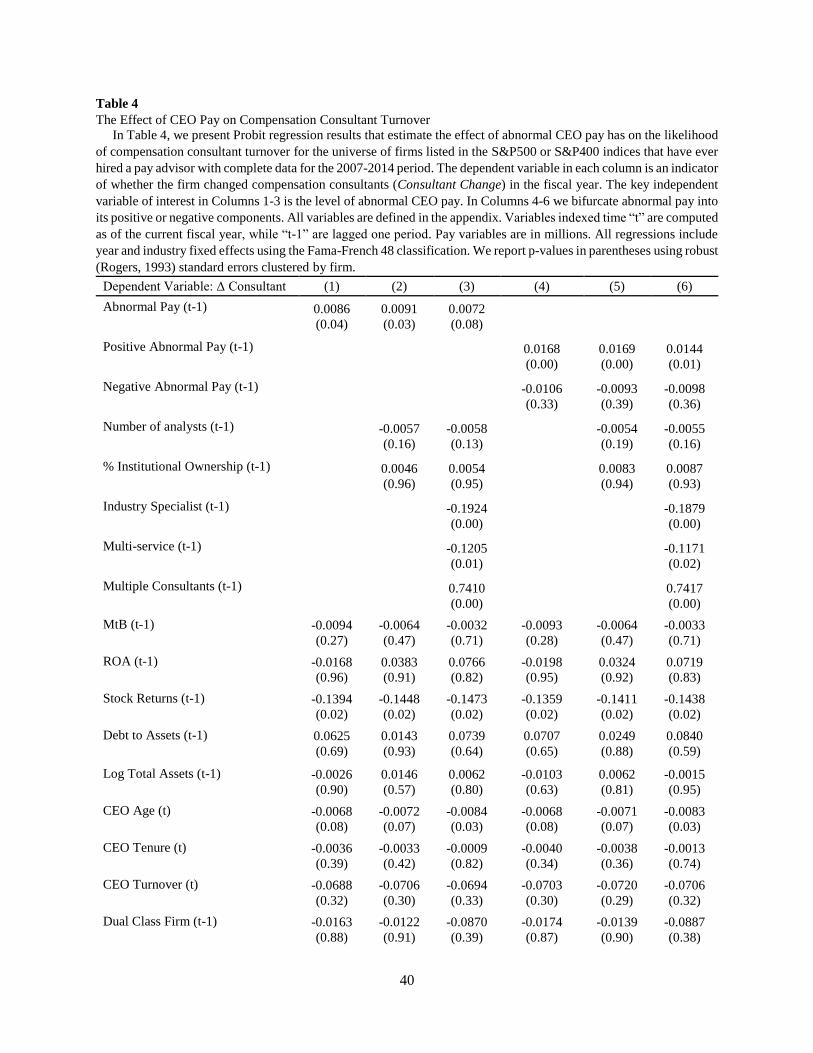
40
Table 4
The Effect of CEO Pay on Compensation Consultant Turnover
In Table 4, we present Probit regression results that estimate the effect of abnormal CEO pay has on the likelihood
of compensation consultant turnover for the universe of firms listed in the S&P500 or S&P400 indices that have ever
hired a pay advisor with complete data for the 2007-2014 period. The dependent variable in each column is an indicator
of whether the firm changed compensation consultants (Consultant Change) in the fiscal year. The key independent
variable of interest in Columns 1-3 is the level of abnormal CEO pay. In Columns 4-6 we bifurcate abnormal pay into
its positive or negative components. All variables are defined in the appendix. Variables indexed time “t” are computed
as of the current fiscal year, while “t-1” are lagged one period. Pay variables are in millions. All regressions include
year and industry fixed effects using the Fama-French 48 classification. We report p-values in parentheses using robust
(Rogers, 1993) standard errors clustered by firm.
Dependent Variable: Δ Consultant (1) (2) (3) (4) (5) (6)
Abnormal Pay (t-1) 0.0086 0.0091 0.0072 (0.04) (0.03) (0.08)
Positive Abnormal Pay (t-1) 0.0168 0.0169 0.0144 (0.00) (0.00) (0.01)
Negative Abnormal Pay (t-1) -0.0106 -0.0093 -0.0098 (0.33) (0.39) (0.36)
Number of analysts (t-1) -0.0057 -0.0058 -0.0054 -0.0055 (0.16) (0.13)
(0.19) (0.16)
% Institutional Ownership (t-1) 0.0046 0.0054 0.0083 0.0087 (0.96) (0.95)
(0.94) (0.93)
Industry Specialist (t-1) -0.1924 -0.1879 (0.00)
(0.00)
Multi-service (t-1) -0.1205 -0.1171 (0.01)
(0.02)
Multiple Consultants (t-1) 0.7410 0.7417 (0.00)
(0.00)
MtB (t-1) -0.0094 -0.0064 -0.0032 -0.0093 -0.0064 -0.0033 (0.27) (0.47) (0.71) (0.28) (0.47) (0.71)
ROA (t-1) -0.0168 0.0383 0.0766 -0.0198 0.0324 0.0719 (0.96) (0.91) (0.82) (0.95) (0.92) (0.83)
Stock Returns (t-1) -0.1394 -0.1448 -0.1473 -0.1359 -0.1411 -0.1438 (0.02) (0.02) (0.02) (0.02) (0.02) (0.02)
Debt to Assets (t-1) 0.0625 0.0143 0.0739 0.0707 0.0249 0.0840 (0.69) (0.93) (0.64) (0.65) (0.88) (0.59)
Log Total Assets (t-1) -0.0026 0.0146 0.0062 -0.0103 0.0062 -0.0015 (0.90) (0.57) (0.80) (0.63) (0.81) (0.95)
CEO Age (t) -0.0068 -0.0072 -0.0084 -0.0068 -0.0071 -0.0083 (0.08) (0.07) (0.03) (0.08) (0.07) (0.03)
CEO Tenure (t) -0.0036 -0.0033 -0.0009 -0.0040 -0.0038 -0.0013 (0.39) (0.42) (0.82) (0.34) (0.36) (0.74)
CEO Turnover (t) -0.0688 -0.0706 -0.0694 -0.0703 -0.0720 -0.0706 (0.32) (0.30) (0.33) (0.30) (0.29) (0.32)
Dual Class Firm (t-1) -0.0163 -0.0122 -0.0870 -0.0174 -0.0139 -0.0887 (0.88) (0.91) (0.39) (0.87) (0.90) (0.38)

41
Board Size (t-1) 0.0111 0.0104 0.0049 0.0114 0.0108 0.0052 (0.35) (0.39) (0.68) (0.34) (0.37) (0.67)
% Independent (t-1) -0.0023 -0.0024 -0.0022 -0.0019 -0.0021 -0.0019 (0.30) (0.27) (0.31) (0.38) (0.35) (0.39)
% Outsider Busy (t-1) -0.0007 -0.0007 -0.0004 -0.0006 -0.0006 -0.0003 (0.55) (0.55) (0.74) (0.59) (0.59) (0.78)
CEO/Chairman (t-1) -0.1260 -0.1263 -0.1131 -0.1191 -0.1196 -0.1069 (0.01) (0.01) (0.01) (0.01) (0.01) (0.02)
Classified Board (t-1) 0.0236 0.0244 0.0263 0.0252 0.0259 0.0277 (0.59) (0.57) (0.55) (0.56) (0.55) (0.53)
% Outsiders Co-opted (t-1) 0.0008 0.0008 0.0008 0.0008 0.0008 0.0009 (0.28) (0.30) (0.25) (0.27) (0.29) (0.24)
Merger (t-1) -0.0079 -0.0065 0.0016 -0.0075 -0.0063 0.0018
(0.87) (0.89) (0.97) (0.88) (0.90) (0.97)
Constant -0.1705 -0.2237 -0.3308 -0.1700 -0.2244 -0.3345 (0.78) (0.72) (0.66) (0.79) (0.72) (0.66)
Observations 6,230 6,230 6,230 6,230 6,230 6,230
Pseudo R-squared 0.0659 0.0663 0.0945 0.0665 0.0668 0.0949

42
Table 5
The Moderating Effect of Corporate Governance
In Table 5, we present Probit regression results that estimate the effect of abnormal CEO pay has on the likelihood
of compensation consultant turnover when bifurcated by four different measures of corporate governance. The models
are run on the universe of firms listed in the S&P500 or S&P400 indices that have ever hired a pay advisor with
complete data for the 2007-2014 period. The dependent variable in each column is an indicator of whether the firm
changed compensation consultants (Consultant Change) in the fiscal year. Each column represents a subsample of
firms with either strong or weak governance indicators. Panel A use abnormal pay as the main pay variable and Panel
B uses the separation of abnormal pay into positive and negative values. All specifications include the Additional
Controls listed in Table 4, Column 3 but are suppressed for brevity and all variables are defined in the appendix.
Variables indexed time “t” are computed as of the current fiscal year, while “t-1” are lagged one period. Pay variables
are in millions. All regressions include year and industry fixed effects using the Fama-French 48 classification. We
report p-values in parentheses using robust (Rogers, 1993) standard errors clustered by firm.
Panel A: The Moderating Effect of Corporate Governance for Abnormal Pay on Consultant Turnover
Board
Independence Co-opted Board CEO Chairman CEO Tenure
High Low No Yes No Yes Short Long
(1) (2) (3) (4) (5) (6) (7) (8)
Abnormal Pay (t-1) 0.0123 0.0004 0.0105 0.0031 0.0086 0.0056 0.0146 -0.0003
(0.05) (0.95) (0.10) (0.59) (0.18) (0.32) (0.03) (0.96)
Additional Controls Yes Yes Yes Yes Yes Yes Yes Yes
Observations 3,184 3,028 3,207 3,003 2,956 3,266 3,104 3,107
Pseudo R-Squared 0.122 0.089 0.124 0.088 0.103 0.109 0.117 0.090
Panel B: The Moderating Effect of Corporate Governance, Split by Positive and Negative Abnormal Pay
Board
Independence Co-opted Board CEO Chairman CEO Tenure
High Low No Yes No Yes Short Long
(1) (2) (3) (4) (5) (6) (7) (8)
Positive Abnormal Pay (t-1) 0.0218 0.0068 0.0257 0.0035 0.0226 0.0075 0.0274 0.0035 (0.01) (0.40) (0.01) (0.65) (0.02) (0.32) (0.00) (0.63)
Negative Abnormal Pay (t-1) -0.0113 -0.0145 -0.0207 0.0021 -0.0187 0.0006 -0.0126 -0.0097 (0.48) (0.32) (0.20) (0.89) (0.24) (0.97) (0.46) (0.52)
Additional Controls Yes Yes Yes Yes Yes Yes Yes Yes
Observations 3,184 3,028 3,207 3,003 2,956 3,266 3,104 3,107
Pseudo R-Squared 0.123 0.090 0.126 0.088 0.104 0.109 0.119 0.090

43
Table 6 The CEO Pay Response to Compensation Consultant Turnover
In Table 6, we present OLS regression results of the change in CEO pay following compensation consultant
turnover for the universe of firms listed in the S&P500 or S&P400 indices that have ever hired a pay advisor with
complete data for the 2007-2014 period. The dependent variable is the change in total pay for the CEO. All variables
are defined in the appendix. Variables indexed time “t” are computed as of the current fiscal year, while “t-1” are
lagged one period. Pay variables are in millions. All specifications include the Additional Controls listed in Table
4, Column 3 but are suppressed for brevity and all variables are defined in the appendix. All regressions include
year and industry fixed effects using the Fama-French 48 classification. We report p-values in parentheses using
robust (Rogers, 1993) standard errors clustered by firm.
Dependent Variable: Δ Total Pay
(1) (2) (3) (4)
Change in Consultant (t) -0.0298 0.1184 0.0923 0.2578
(0.84) (0.49) (0.56) (0.12)
Abnormal Pay (t-1) -0.4450
(0.00) Change Consultant * Abnormal Pay -0.1355
(0.00) Abnormal Pay > 0 -2.0560
(0.00) Change Consultant * Abnormal Pay >0 -0.5828
(0.03) Abnormal Pay > Median -2.3266
(0.00) Change Consultant * Abnormal Pay > Median -0.5467
(0.06) Positive Abnormal Pay -0.5510
(0.00)
Change Consultant * Positive Abnormal Pay -0.2137
(0.00)
Negative Abnormal Pay -0.1947
(0.00)
Change Consultant * Negative Abnormal Pay 0.0479
(0.45)
Firm Controls Yes Yes Yes Yes
Governance Controls Yes Yes Yes Yes
Consultant Controls Yes Yes Yes Yes
Observations 6,230 6,230 6,230 6,230
Adj. R-squared 0.261 0.080 0.093 0.276
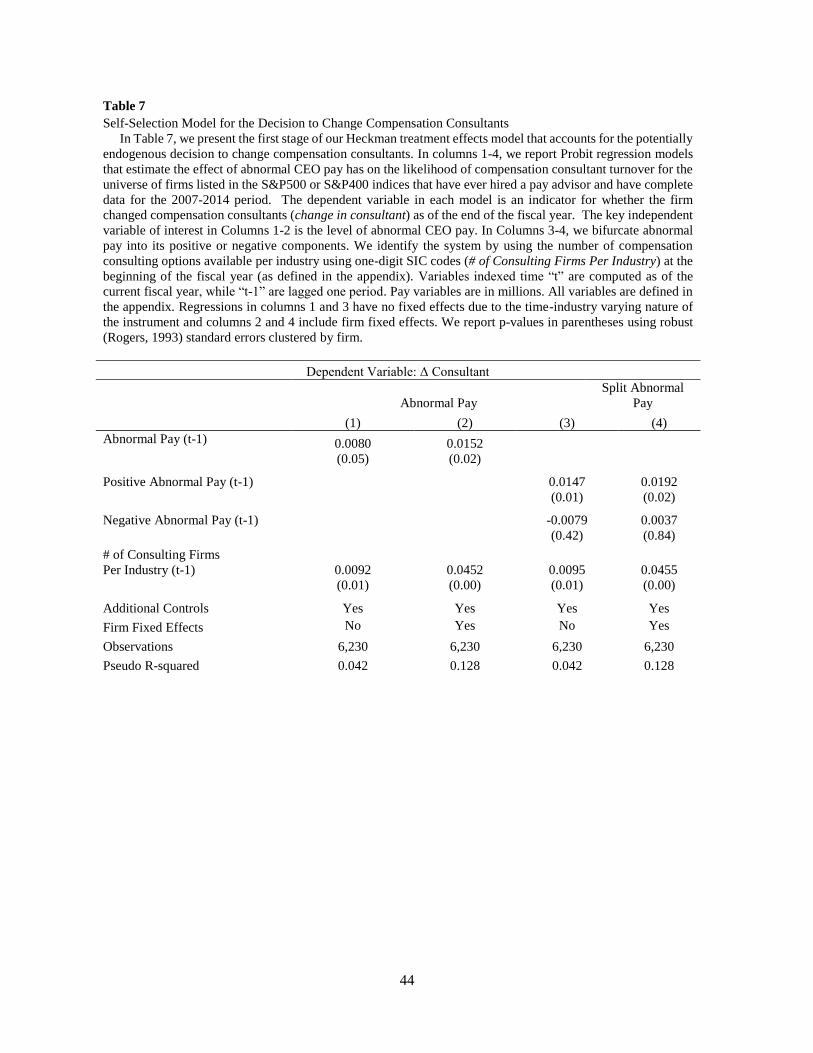
44
Table 7 Self-Selection Model for the Decision to Change Compensation Consultants In Table 7, we present the first stage of our Heckman treatment effects model that accounts for the potentially
endogenous decision to change compensation consultants. In columns 1-4, we report Probit regression models
that estimate the effect of abnormal CEO pay has on the likelihood of compensation consultant turnover for the
universe of firms listed in the S&P500 or S&P400 indices that have ever hired a pay advisor and have complete
data for the 2007-2014 period. The dependent variable in each model is an indicator for whether the firm
changed compensation consultants (change in consultant) as of the end of the fiscal year. The key independent
variable of interest in Columns 1-2 is the level of abnormal CEO pay. In Columns 3-4, we bifurcate abnormal
pay into its positive or negative components. We identify the system by using the number of compensation
consulting options available per industry using one-digit SIC codes (# of Consulting Firms Per Industry) at the
beginning of the fiscal year (as defined in the appendix). Variables indexed time “t” are computed as of the
current fiscal year, while “t-1” are lagged one period. Pay variables are in millions. All variables are defined in
the appendix. Regressions in columns 1 and 3 have no fixed effects due to the time-industry varying nature of
the instrument and columns 2 and 4 include firm fixed effects. We report p-values in parentheses using robust
(Rogers, 1993) standard errors clustered by firm.
Dependent Variable: Δ Consultant
Abnormal Pay
Split Abnormal
Pay
(1) (2) (3) (4)
Abnormal Pay (t-1) 0.0080 0.0152
(0.05) (0.02)
Positive Abnormal Pay (t-1)
0.0147 0.0192
(0.01) (0.02)
Negative Abnormal Pay (t-1) -0.0079 0.0037
(0.42) (0.84)
# of Consulting Firms
Per Industry (t-1) 0.0092 0.0452 0.0095 0.0455 (0.01) (0.00) (0.01) (0.00)
Additional Controls Yes Yes Yes Yes
Firm Fixed Effects No Yes No Yes
Observations 6,230 6,230 6,230 6,230
Pseudo R-squared 0.042 0.128 0.042 0.128
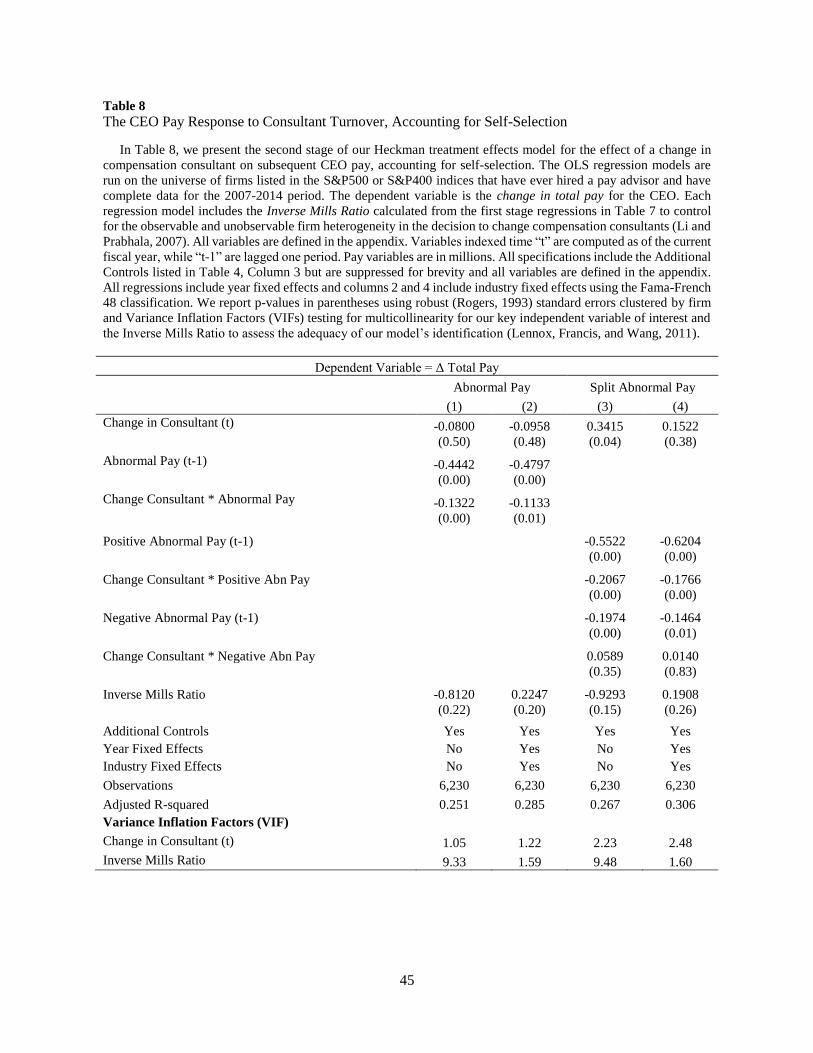
45
Table 8 The CEO Pay Response to Consultant Turnover, Accounting for Self-Selection
In Table 8, we present the second stage of our Heckman treatment effects model for the effect of a change in
compensation consultant on subsequent CEO pay, accounting for self-selection. The OLS regression models are
run on the universe of firms listed in the S&P500 or S&P400 indices that have ever hired a pay advisor and have
complete data for the 2007-2014 period. The dependent variable is the change in total pay for the CEO. Each
regression model includes the Inverse Mills Ratio calculated from the first stage regressions in Table 7 to control
for the observable and unobservable firm heterogeneity in the decision to change compensation consultants (Li and
Prabhala, 2007). All variables are defined in the appendix. Variables indexed time “t” are computed as of the current
fiscal year, while “t-1” are lagged one period. Pay variables are in millions. All specifications include the Additional
Controls listed in Table 4, Column 3 but are suppressed for brevity and all variables are defined in the appendix.
All regressions include year fixed effects and columns 2 and 4 include industry fixed effects using the Fama-French
48 classification. We report p-values in parentheses using robust (Rogers, 1993) standard errors clustered by firm
and Variance Inflation Factors (VIFs) testing for multicollinearity for our key independent variable of interest and
the Inverse Mills Ratio to assess the adequacy of our model’s identification (Lennox, Francis, and Wang, 2011).
Dependent Variable = Δ Total Pay
Abnormal Pay Split Abnormal Pay
(1) (2) (3) (4)
Change in Consultant (t) -0.0800 -0.0958 0.3415 0.1522 (0.50) (0.48) (0.04) (0.38)
Abnormal Pay (t-1) -0.4442 -0.4797 (0.00) (0.00)
Change Consultant * Abnormal Pay -0.1322 -0.1133 (0.00) (0.01)
Positive Abnormal Pay (t-1) -0.5522 -0.6204 (0.00) (0.00)
Change Consultant * Positive Abn Pay -0.2067 -0.1766 (0.00) (0.00)
Negative Abnormal Pay (t-1) -0.1974 -0.1464 (0.00) (0.01)
Change Consultant * Negative Abn Pay 0.0589 0.0140 (0.35) (0.83)
Inverse Mills Ratio -0.8120 0.2247 -0.9293 0.1908 (0.22) (0.20) (0.15) (0.26)
Additional Controls Yes Yes Yes Yes
Year Fixed Effects No Yes No Yes
Industry Fixed Effects No Yes No Yes
Observations 6,230 6,230 6,230 6,230
Adjusted R-squared 0.251 0.285 0.267 0.306
Variance Inflation Factors (VIF)
Change in Consultant (t) 1.05 1.22 2.23 2.48
Inverse Mills Ratio 9.33 1.59 9.48 1.60

46
Table 9
Shareholder Response to Consultant Turnover in Director Elections
In Table 9, we examine the shareholder response in director elections in response to a change in compensation
consultant and whether the pre-change level of CEO pay moderates their response. In columns 1-4, we report OLS
regression models of whether there was an increase in the percentage of “for” votes a director receives in the year
following a change in the compensation consultant for the firm. Consultant Change is an indicator variable taking the
value of one if the firm changed compensation consultants in year t, zero otherwise. All regressions include firm and
year fixed effects and we report p-values in parentheses computed using robust (Rogers, 1993) standard errors
clustered by annual meeting.
Dependent Variable: Increase in Percent "For" Votes (t+1)
(1) (2) (3) (4)
Change in Consultant (t) -0.0118 -0.0136 -0.0394 -0.0117
(0.02) (0.02) (0.02) (0.03)
Compensation Committee Member
-0.0170
(0.01)
Change in Consultant (t) *
0.0048
Compensation Committee Member
(0.02)
CEO Overpaid (t)
-0.0012
(0.02)
Change in Consultant (t) *
CEO Overpaid (t)
0.0529
(0.03)
Decrease in Abnormal CEO pay (t+1)
0.0114
(0.02)
Consultant Change *
0.0017
Decrease in Abnormal CEO pay (t+1)
(0.04)
Academic Experience 0.0211 0.0213 0.0203 0.0199
(0.01) (0.01) (0.01) (0.01)
Finance Experience 0.0222 0.0199 0.0224 0.0212
(0.01) (0.01) (0.01) (0.01)
Legal or Consulting Experience -0.0055 -0.0051 -0.0060 -0.0057
(0.01) (0.01) (0.01) (0.01)
Political Experience 0.0208 0.0203 0.0225 0.0201
(0.02) (0.02) (0.02) (0.02)
Military Experience -0.0064 -0.0054 -0.0060 -0.0061
(0.06) (0.06) (0.06) (0.06)
Undergrad Degree 0.0135 0.0157 0.0142 0.0136
(0.01) (0.01) (0.01) (0.01)
Advanced Graduate Degree 0.0059 0.0054 0.0080 0.0060
(0.01) (0.01) (0.01) (0.01)
MBA Degree -0.0062 -0.0054 -0.0078 -0.0060
(0.01) (0.01) (0.01) (0.01)
Residual ISS Vote 'For' Rec -0.4096 -0.4145 -0.4098 -0.4118
(0.02) (0.02) (0.02) (0.02)
Log Assets -0.0413 -0.0414 -0.0303 -0.0308
(0.05) (0.05) (0.05) (0.05)
Return on Assets -0.0738 -0.0737 -0.0657 -0.0716
(0.11) (0.11) (0.11) (0.11)
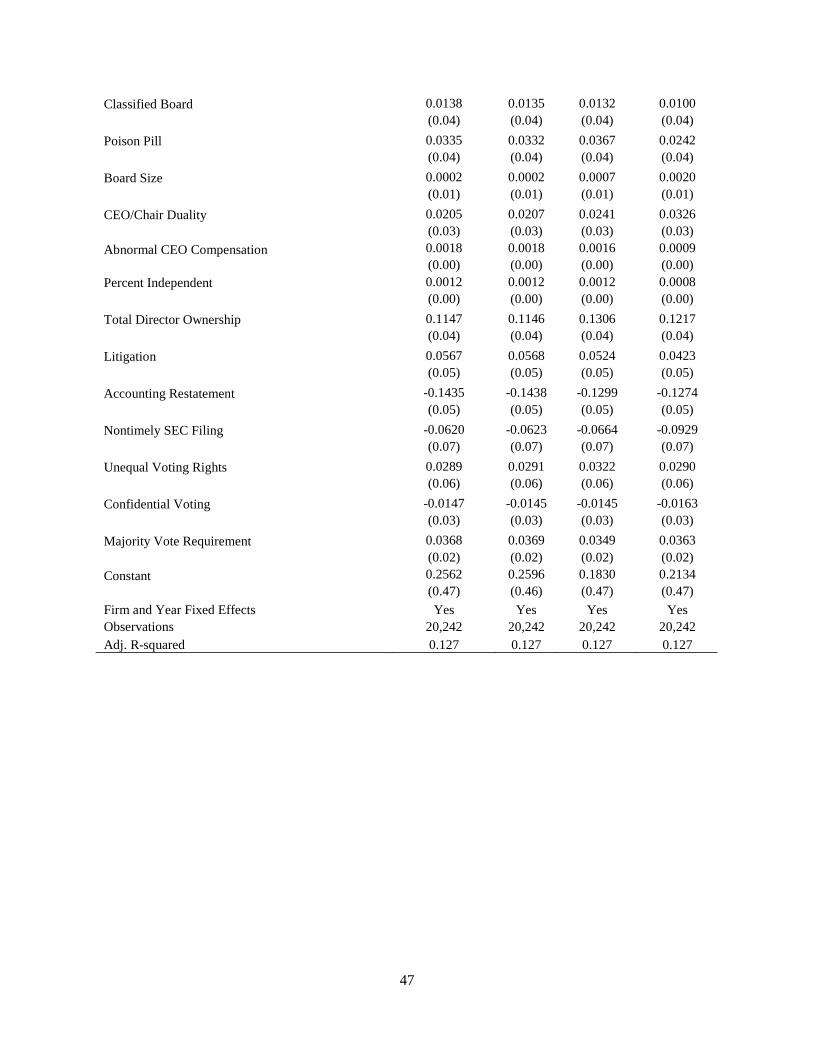
47
Classified Board 0.0138 0.0135 0.0132 0.0100
(0.04) (0.04) (0.04) (0.04)
Poison Pill 0.0335 0.0332 0.0367 0.0242
(0.04) (0.04) (0.04) (0.04)
Board Size 0.0002 0.0002 0.0007 0.0020
(0.01) (0.01) (0.01) (0.01)
CEO/Chair Duality 0.0205 0.0207 0.0241 0.0326
(0.03) (0.03) (0.03) (0.03)
Abnormal CEO Compensation 0.0018 0.0018 0.0016 0.0009
(0.00) (0.00) (0.00) (0.00)
Percent Independent 0.0012 0.0012 0.0012 0.0008
(0.00) (0.00) (0.00) (0.00)
Total Director Ownership 0.1147 0.1146 0.1306 0.1217
(0.04) (0.04) (0.04) (0.04)
Litigation 0.0567 0.0568 0.0524 0.0423
(0.05) (0.05) (0.05) (0.05)
Accounting Restatement -0.1435 -0.1438 -0.1299 -0.1274
(0.05) (0.05) (0.05) (0.05)
Nontimely SEC Filing -0.0620 -0.0623 -0.0664 -0.0929
(0.07) (0.07) (0.07) (0.07)
Unequal Voting Rights 0.0289 0.0291 0.0322 0.0290
(0.06) (0.06) (0.06) (0.06)
Confidential Voting -0.0147 -0.0145 -0.0145 -0.0163
(0.03) (0.03) (0.03) (0.03)
Majority Vote Requirement 0.0368 0.0369 0.0349 0.0363
(0.02) (0.02) (0.02) (0.02)
Constant 0.2562 0.2596 0.1830 0.2134
(0.47) (0.46) (0.47) (0.47)
Firm and Year Fixed Effects Yes Yes Yes Yes
Observations 20,242 20,242 20,242 20,242
Adj. R-squared 0.127 0.127 0.127 0.127

48
Appendix Source, definition, and construction of all variables used in analysis.
Variable Database Description
Change Consultant DEF 14-A
Equal to 1 if the firm’s consultant has changed in any of
the following 3 ways:
1) Firm switches from using one consultant to using
another
2) Firm uses no consultant the previous year and uses at
least one in current year (includes going from 1 to 2
consultants)
3) Firm uses a different number of consultants in year (t)
compared to year (t-1).
Multi-Service Firm DEF 14-A Firm provides other services in addition to compensation
advisory services following Chu et. al (2017)
Industry Specialist DEF 14-A Firm whose largest industry share is at least one standard
deviation larger than its second largest industry.
Multiple Consultants DEF 14-A Equal to 1 if the firm hires more than 1 consultant in a
given year
Total Assets COMPUSTAT Total Assets (AT)
Market-to-Book COMPUSTAT PRCC_F*CSHO/CEQ
ROA COMPUSTAT NI/AT
LT Debt to Assets COMPUSTAT Long Term debt to Total Assets
Stock Return CRSP Fiscal year buy-and-hold stock return net of the CRSP
value-weighted index return.
Salary+Bonus EXECUCOMP Salary (SALARY) + Bonus (BONUS)
Equity EXECUCOMP Sum of Option and Stock awards
(OPTION_AWARDS_FV+STOCK_AWARDS_FV)
Other Pay EXECUCOMP Total Pay - Salary - Bonus - Equity
Total Pay EXECUCOMP Total CEO compensation, as reported (TDC1)
Industry Adjusted Pay EXECUCOMP
Current Total Pay (TDC1) minus the average pay of the
Fama-French 48 Industry for full Execucomp database
with available data.
Abnormal Pay EXECUCOMP
Similar to Yermack (2006), abnormal pay is the residual
from regressions predicting CEO pay. Regressions are run
on a calendar year basis and the independent variables are
the log of sales, CEO Tenure, abnormal returns and
industry.
CEO Age EXECUCOMP CEO Age (in years)
CEO Tenure EXECUCOMP Estimated tenure of CEO (years) based on years in
Execucomp database.
CEO Turnover EXECUCOMP Equal to 1 if there was CEO turnover in fiscal year t
Classified Board ISS(RiskMetrics) Equal to 1 if firm has a classified board
(CBOARD="YES" or "1")
Dual Class Firm ISS(RiskMetrics) Equal to 1 if firm has dual class shares
(DUALCLASS="YES" or "1")

49
Appendix Continued
Board Size ISS(RiskMetrics) Number of board members reported by firm-year in
RMDirectors
% Board Independent ISS(RiskMetrics) Percentage of Board that is listed as Independent in the
RMDirectors Set (Classification="I")
CEO Chairman ISS(RiskMetrics) Equal to 1 if for a given firm-year, a director has both
Employment_CEO=1 and Employment_Chairman=1
% Outsider Busy Board ISS(RiskMetrics) The percentage of outside directors who hold 3 or more
directorships
% Outsider Board Co-opted ISS(RiskMetrics) The percentage of outside directors who have a shorter tenure
than the CEO
Merger SDC Equal to 1 if the firm initiated a merger during the given year.
Poison Pill ISS(RiskMetrics) Equal to 1 if the firm has a poison pill in place.
Number of analysts I/B/E/S Number of analysts covering the firm in each fiscal year
% Institutional Ownership 13-F Filings Percentage of common stock held by institutions from
Thompson Reuters.
Increase in % 'For' Director
Votes
ISS Voting
Analytics
Equal to 1 if the director receives an increase in the percentage
of ‘For’ votes from the previous fiscal year.
Total Director Ownership ISS(RiskMetrics) The total amount of shares the director owns.
Litigation Stanford SCACs Equal to 1 if the firm was targeted with a class action lawsuit
during the fiscal year.
Accounting Restatement Audit Analytics Equal to 1 if the earnings are restated.
Nontimely SEC Filing Audit Analytics Equal to 1 if the filing is late.
Residual ISS Vote 'For' Rec Various Residual from a LPM model following Table 5 in Field,
Souther, and Yore (2018).
Unequal Voting Rights ISS(RiskMetrics) Equal to 1 if the firm has dual class shares.
Confidential Voting ISS(RiskMetrics) Equal to 1 if the firm has confidential voting.
Majority Vote Requirement ISS(RiskMetrics) Equal to 1 if director elections have a majority vote provision.

![images.acswebnetworks.comimages.acswebnetworks.com/1/3061/SundayJune28th20… · Web view[Jesus said to the twelve:] 40“Whoever welcomes you welcomes me, and whoever welcomes](https://static.fdocuments.in/doc/165x107/5fc0d4d3e602da0d816c1175/web-view-jesus-said-to-the-twelve-40aoewhoever-welcomes-you-welcomes-me-and.jpg)