Compensation Consultants and the Level, Composition … Files/18-027_0c1615e5... · ·...
44
Compensation Consultants and the Level, Composition and Complexity of CEO Pay Kevin J. Murphy Tatiana Sandino Working Paper 18-027
Transcript of Compensation Consultants and the Level, Composition … Files/18-027_0c1615e5... · ·...

Compensation Consultants and the Level, Composition and Complexity of CEO Pay
Kevin J. Murphy Tatiana Sandino
Working Paper 18-027

Working Paper 18-027
Copyright © 2017 by Kevin J. Murphy and Tatiana Sandino
Working papers are in draft form. This working paper is distributed for purposes of comment and discussion only. It may not be reproduced without permission of the copyright holder. Copies of working papers are available from the author.
Compensation Consultants and the Level, Composition and Complexity of CEO Pay
Kevin J. Murphy University of Southern California
Tatiana Sandino Harvard Business School
Compensation Consultants and the Level, Composition and Complexity of CEO Pay
Kevin J. Murphy
Marshall School of Business University of Southern California
Los Angeles, CA 90089-0804 E-mail: [email protected]
Phone: (213) 740-6553
Tatiana Sandino
Harvard Business School Harvard University Boston, MA 02163
E-mail: [email protected] Phone: (617) 495-0625
August 28, 2017
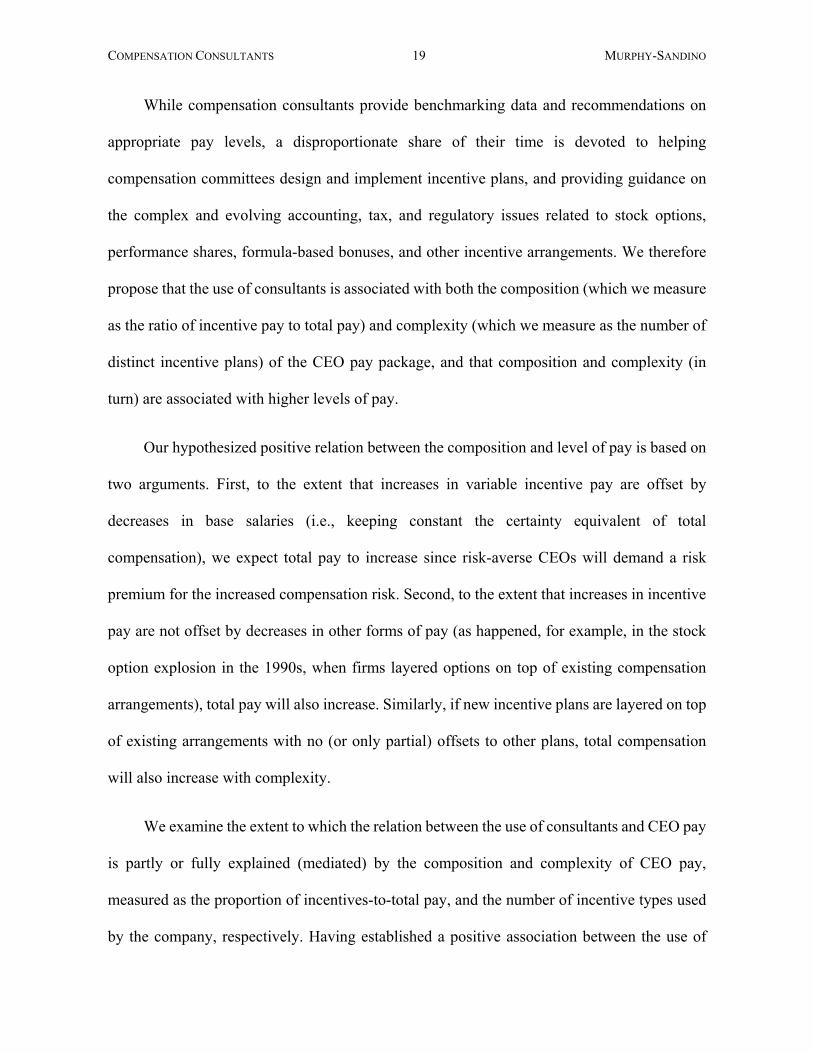
Abstract
Firms that use consultants have higher-paid CEOs. We show that this positive and robust association is not only driven by consultant conflicts of interest but also (and even to a larger degree) by the composition and complexity of pay: firms using consultants compensate their CEOs with a higher percentage of incentive pay and more complex incentive plans, which in turn, are associated with higher levels of pay. We also show that, among firms that do not retain consultants, firms that pay more to their CEOs and use more complex incentive plans, are more likely to hire compensation consultants the following year. Finally, we show that shareholders “Say-on-Pay” votes are more favorable for companies using compensation consultants, but this association is also explained by the composition and complexity of CEO pay.

COMPENSATION CONSULTANTS 1 MURPHY-SANDINO
1. Introduction
Large corporations routinely retain compensation consultants to advise on the level and
structure of compensation for their directors and top executives. Conceptually, these
consultants can mitigate agency problems by recommending plans that better align the
incentives of shareholders and CEOs, and by providing survey data useful in ensuring that the
CEO is paid his/her competitive market wage. However, critics of high executive pay such as
Crystal (1991) and Bebchuk and Fried (2003) argue that consultants – seeking repeat business
and eager to sell other services – have exacerbated rather than mitigated agency problems.
Concerns that consultants have facilitated perceived excesses in executive pay led the
Securities and Exchange Commission (SEC) in 2006 to require companies to identify any
consultants who provided advice on executive compensation. The SEC’s disclosure
requirements were followed by Congressional hearings on consultants’ conflicts of interest in
December 2007, expanded SEC disclosure rules in 2009 requiring disclosures of fees paid to
consultants when those consultants provide other services, and provisions in the 2010 Dodd-
Frank Act (effective in 2014) requiring boards to consider independence factors in selecting
consultants and disclosing any potential consultant conflicts of interest.
Comparisons of CEO pay in firms retaining and not retaining compensation consultants
appear to support the concerns of the critics. Figure 1 shows the average percentage difference
in expected total compensation for CEOs in firms retaining consultants compared to pay in
firms not retaining consultants from 2006 to 2014, and also shows the additional differences
in CEO pay associated with firms retaining the same consultants for (often more lucrative)
actuarial, benefits administration, or other services in addition to providing advice on

COMPENSATION CONSULTANTS 2 MURPHY-SANDINO
compensation.1 We consider these “consultants providing other services” conflicted because
they are making pay recommendations for executives who presumably influence whether the
consultants are hired to provide these additional services. The “CEO Pay Premiums” associated
with both consultants providing and not providing other services depicted in the figure are
based on regression results discussed below in Section 3, and control for firm size and a variety
of other firm, industry, CEO, and governance characteristics.
In spite of all the criticism levied at consultants providing other services, Figure 1
suggests that the CEO Pay Premium from using consultants that do not provide other services
has grown from 34% in 2006 to 50% in 2014, reaching a maximum of 68% in 2012. Over the
same period, the additional CEO Pay Premium associated with using consultants rendering
other services has fallen from 20% in 2006 to 11% in 2014; it was actually negative in 2013.
The figure therefore suggests that the CEO Pay Premium is large and persistent, but not driven
exclusively by consultants with conflicts of interest associated with the provision of services
beyond executive pay advice.
The purpose of this paper is to explain the CEO Pay Premium associated with the use of
consultants. While theory and recent empirical evidence potentially explain why consultants
that offer other services might recommend higher pay levels for executives who, in turn, might
hire them to provide additional services, the relation between CEO pay levels and the use of
consultants that do not provide other services is more puzzling. We hypothesize (and show)
1 Prior academic studies documenting higher 2006 CEO pay in companies using consultants include Cadman,
Carter, and Hillegeist (2010), Armstrong, Ittner, and Larcker (2012), and (early versions of) Murphy and Sandino (2010). In addition, an October 2007 report issued by the Corporate Library (Higgins, 2007) concluded that companies using consultants offer significantly higher 2006 pay than companies not using consultants. Murphy and Sandino (2010) document an additional CEO pay premium for firms retaining “conflicted” consultants who offer other services; Conyon, Peck, and Sadler (2009) (using UK data) and Cadman, Carter, and Hillegeist (2010) (using different proxies for conflicts of interest) find no evidence that conflicts of interest lead to high pay.

COMPENSATION CONSULTANTS 3 MURPHY-SANDINO
that the CEO Pay Premium associated with consultants is related to the composition and
complexity of the CEO pay package. In particular, we show that the expected level of CEO
pay is positively related to both the percentage of total pay conveyed in the form of
discretionary bonuses, target bonuses and target equity awards (which we call “composition”)
and to the natural logarithm of one plus the count of the different types of incentive plans
(which we call “complexity”).2 In turn, we show that the composition and complexity of the
pay package is related to the use of consultants, with causality plausibly going in both
directions. Moreover, we document a positive relation between consultant use and “Say-on-
Pay” shareholder votes, and show that this positive relation is also explained by the
compensation and complexity of CEO pay.
We explore the role of consultants on CEO pay using a nine-year time series from 2,347
ExecuComp firms and 16,588 firm-years reporting the use (or non-use) of consultants from
the introduction of the 2006 disclosure rules through the end of fiscal 2014. We begin by
documenting the CEO Pay Premium suggested by Figure 1, showing that our results are
curiously sensitive to dropping 26 observations from 10 firms with total CEO pay less than
one dollar per month.3 After dropping these outliers, we show that adding firm fixed effects to
the pooled cross section time series reduces the CEO Pay Premium for consultants that do not
provide other services from 49.6% to 8.3%, while reducing the additional premium associated
with consultants providing other services from 10% to 4.4%.
2 Incentive plans include (1) discretionary bonuses; (2) non-equity (formula based) bonuses; (3) stock options;
(4) restricted stock; and (5) performance shares; the possible number of incentive plans therefore ranges from zero to five.
3 As discussed in detail in Section 3 and the Appendix, dropping these 26 observations (out of 14,311 observations with complete data) in a pooled cross-sectional time-series regression where the dependent variable is ln(CEO Total Pay) increases the R-square from .365 to .530. In addition, the coefficient on “Uses Consultant” (which defines the CEO Pay Premium) more than doubles and becomes highly significant in regressions with firm fixed effects.

COMPENSATION CONSULTANTS 4 MURPHY-SANDINO
Next, we use mediation analysis (Baron and Kenny, 1986) to test whether the observed
CEO Pay Premium associated with consultants is “mediated by” (or explained by) our proxies
for composition and complexity. First, we show that both proxies are positively related to the
use of consultants in regressions with firm fixed effects, suggesting that firms switching from
not using consultants to using consultants increase both the percentage of incentive to total pay
and the number of different incentive plans. Second, we show that CEO pay is positively
related to our proxies for both composition and complexity. The relation between CEO pay
and composition (i.e., the percentage of incentive pay) is expected, plausibly reflecting a
compensating differential for risky pay. The relation between CEO pay and complexity (i.e.,
the number of incentive plans) is more puzzling, but it appears that companies introducing new
CEO incentive plans layer the new plans over existing ones, thereby increasing the levels of
CEO pay. Third, we show that controlling for composition and complexity reduces the CEO
Pay Premium associated with consultants not providing other services from 8.3% to 3.4%,
while the additional premium associated with consultants providing other services decreases
only from 4.4% to 4.3%. The result that the CEO Pay Premium associated with consultants
declines but remains (marginally) significant after these controls suggests that composition and
complexity partially (but not fully) mediate the relation between CEO pay and the use of
consultants.
We then analyze the firm’s decision to retain a consultant based on a subsample of firms
that have not used consultants over the prior three years. We show that firms with more pre-
existing incentive plans (especially performance shares, stock options, and formula-based
bonus plans) are more likely to retain consultants. This result suggests that the relation between
the use of consultants and complexity discussed in the previous paragraph is nuanced with

COMPENSATION CONSULTANTS 5 MURPHY-SANDINO
causality plausibly running in both directions: on one hand, consultants add to complexity by
recommending and designing additional incentive plans; on the other hand, firms are more
likely to retain consultants when they already have, or they anticipate having, more complex
pay packages. The relation between incentive plans and subsequent consultant retention is
particularly salient for performance shares, stock options, and formula-based bonuses, where
compensation consultants (and other advisors) not only help compensation committees with
designing the plans, but also with navigating myriad tax, accounting, disclosure, and other
regulatory issues associated with those plans.
We also show that, among firms not using consultants over the prior three years, firms
with higher CEO pay (even after controlling for composition and complexity) are more likely
to retain consultants in the following year. This result suggests that the CEO Pay Premium
associated with consultants is (partially) explained by the fact that firms with high-paid CEOs
are more likely to seek the services of consultants than are firms with low-paid CEOs. Thus,
in contrast to the critic’s view that consultants “cause” high CEO pay, this result suggests that,
in a sense, high pay causes consultants.
Finally, we explore the relation between the use of consultants and firm outcomes.
Pursuant to the Dodd-Frank rules in 2010, firms are required to hold non-binding votes
approving the firm’s executive compensation policies. We show that the percentage of
favorable “Say-on-Pay” votes is positively related to the use of consultants before controlling
for compensation composition or complexity. We then show that this effect is fully mediated
by our proxy for complexity: shareholders appear to vote favorably when the firm offers more
types of incentive compensation (holding constant total compensation and the overall
percentage of incentive pay), including formula-based bonus plans, performance shares, stock

COMPENSATION CONSULTANTS 6 MURPHY-SANDINO
options, and restricted stock. Adding complexity (or the dummies for the different types of
complex incentive plans) to the regression eliminates the positive effect of consultant usage.
Similar results, related to the effects of complex incentive plans, are obtained when analyzing
Institutional Shareholder Service (ISS) recommendations for Say-on-Pay votes rather than
actual voting outcomes.
Our study contributes to an emerging literature exploring the role of compensation
consultants on executive pay. Murphy and Sandino (2010) find mixed evidence and Cadman,
Carter and Hillegeist (2010) find no evidence for the prediction that CEO pay is higher in firms
employing consultants with potential conflicts-of-interest (e.g., those providing non-executive
pay services to the firm or not working exclusively for the board). Conyon, Peck and Sadler
(2009), Cadman, Carter and Hillegeist (2010), and Armstrong, Ittner and Larcker (2012)
examine the relationship between CEO pay and the use of compensation consultants, using
2006 data from the United States and, in the case of Conyon, Peck and Sadler (2009), additional
2003 data from the United Kingdom. Similar to our results in Section 3 below, these studies
document a positive association between the use of consultants and CEO pay. However,
Armstrong, Ittner and Larcker (2012) find no evidence of differences in pay between a sample
of firms using consultants and a matched sample of firms not using consultants once they
consider governance characteristics among their matching criteria. In addition, Cadman, Carter
and Hillegeist (2010) present suggestive time-series results using changes in 2006-2007
compensation, concluding that changes in the use of consultants have limited effects on
changes in CEO pay. Goh and Gupta (2010) use a longer time-series of firms, analyzing 350
firms in the United Kingdom from 2002-2008. They conclude that firms that switch their main
consultants receive higher increases in salaries and bonuses and less equity pay than do firms

COMPENSATION CONSULTANTS 7 MURPHY-SANDINO
retaining their consultants. They do not find evidence that companies that start using
consultants increase or decrease pay or any component of pay.
We extend Armstrong-Ittner-Larcker’s single-year analysis by considering nine years,
extend Cadman, Carter and Hillegeist (2010) by analyzing a larger number of firms over a
longer time series, and extend Conyon, Peck and Sadler and Goh and Gupta by analyzing panel
data from the U.S. rather than from the U.K. Our study is the first to show that the positive
association between the use of consultants and CEO pay, previously documented in cross-
sectional analysis, is robust to firm fixed effects and over time. It is also the first to show that,
contrary to what many critics suggest, the cross-sectional association between the use of
consultants and CEO pay is, in large part, driven by the composition and complexity of the pay
package.
To our knowledge, our study is the first to use a long time series of U.S. data to explore
the extent to which the levels, composition, and complexity of pay affect a firm’s decision to
hire pay consultants, and the first to examine how consultant use, composition, and complexity
interact to affect Say-on-Pay votes and ISS recommendations.4
The rest of the paper is organized as follows. Section 2 presents our data sources and
describes information about the use of executive compensation consultants in the United
States. Section 3 examines the relationship between the use of conflicted and non-conflicted
consultants and the level and structure of CEO pay, and analyzes the extent to which the CEO
Pay Premium is explained by the composition and complexity of the pay package. Section 4
4 A contemporaneous study, Gong, Mande, and Son (2017), examines the effect of consultant use on Say-on-Pay
votes.

COMPENSATION CONSULTANTS 8 MURPHY-SANDINO
explores the effect of consultants on Say-on-Pay votes and ISS recommendations. Section 5
concludes.
2. The Use of Executive Compensation Consultants in U.S. Corporations
2.1. Evolving Disclosure Rules on Executive Compensation Consultants
In 2006, the SEC introduced for the first time a set of disclosure rules for executive
compensation consultants. The rules, applying to publicly traded corporations with fiscal year
closings after December 15, 2006, require these firms to identify any consultants that provide
advice on executive or director compensation; to indicate whether or not the consultants are
appointed by the companies’ compensation committees; and to describe the nature of the
assignments for which the consultants are engaged. The SEC expanded this rule in 2009 to
require firms to disclose fees paid to their executive compensation consultants whenever the
consultants received more than $120,000 for providing any other services to the firm beyond
those related to executive and director pay. The SEC exempted from these requirements firms
that retain at least one compensation consultant that works exclusively for the board, and also
exempted disclosing consultants that affect executives’ and directors’ compensation only
through providing advice related to broad-based plans that do not discriminate executives
and/or directors from other employees. The 2009 rule became effective for corporations filing
their proxy statements after February 2010.
More recently, Section 952 the Dodd-Frank Wall Street Reform Act of 2010 (“Dodd-
Frank”) instructed the SEC to expand the rules once more to ensure that compensation
committees have authority and funding to retain compensation consultants (a right that would
in principle increase independence from management). In addition, while neither the Act nor
the June 2012 Final Rule issued by the SEC required compensation advisors to be independent,

COMPENSATION CONSULTANTS 9 MURPHY-SANDINO
the SEC imposed a list of independence criteria that boards must consider in retaining a
consultant.5 In addition, proxy statements issued in connection with annual shareholder
meetings in 2013 and after must disclose whether the work of the consultant has raised any
conflict of interest and, if so, the nature of the conflict and how the conflict is being addressed.
2.2. Consultant Data
Taking advantage of the SEC disclosure rules described above, we extracted
compensation consultant information in the years 2006 through 2014 from the proxy
statements of 2,347 firms (16,588 firm years). Our sample comprises all firms included in the
Standard and Poor’s ExecuComp dataset that filed proxy statements after the SEC disclosure
rules requiring the identification of compensation consultants took effect in 2006.6 For 2011-
2014, we supplemented our hand-collected data with consultant data extracted from ISS’s
Incentive Lab database. Figure 2 depicts the use of compensation consultants by our sample
firms from 2006 to 2014, showing that the percentage of ExecuComp firms using
compensation consultants rose from 78% in 2006 to 86% in 2014.
While some consultants are “boutique” firms focused exclusively on executive
compensation, many are integrated corporations offering a full-range of compensation,
benefits, actuarial and other human resources services. The bottom line in Figure 2 summarizes
the percentage of our sample firms reporting that one or more of their consultants have conflicts
5 In particular, compensation committees must consider: (1) whether the firm retaining the compensation
consultant engages the consultant for other services beyond executive or director pay advice; (2) the amount of fees that the client firm pays to the compensation consultant as a percentage of the consultant’s total revenues; (3) the policies and procedures of the consultant designed to prevent conflicts of interest; (4) any business or personal relationship between the compensation adviser representing the consultant and a member of the compensation committee; (5) whether the compensation adviser representing the consultant owns any stock in the client firm; and (6) any business or personal relationship between the compensation consultant and the client firm’s executive officers.
6 We exclude 31 firm-years where the proxy statements do not report compensation for the CEO.

COMPENSATION CONSULTANTS 10 MURPHY-SANDINO
of interest due to providing services beyond giving advice on executive or director pay.
Information on “other services” reflect three sources: (a) voluntary firm disclosures of other
services (2006-2011); (b) fee disclosures for other services as mandated by the 2009 SEC rules
(2009-2014); and (c) information from Schedule B of Form 5500 identifying the company’s
actuary (available for firms with defined-benefit pension plans 2006-2007, 2009-2011).7 As
shown in Figure 2, among companies retaining consultants, the percentage of companies
reporting that they used consultants that provided other services grew from 10% to 19% from
2006 to 2009, but has decreased monotonically to only 3% in 2014. The timing of the peak and
the subsequent decrease is consistent with the increased scrutiny on consultant independence
and the 2009 rule requiring fee disclosure for consultants providing other services.
Table 1 presents summary statistics for our primary variables for firm-years grouped
based on whether the company retained a consultant for that year. As evident from the table,
the use of consultants is associated with higher total compensation and more extensive use of
equity-based pay. In addition, the average number of types of incentive plans for firm-years
with consultants (2.6) is significantly higher than the number of types of incentive plans for
firm-years without consultants (1.7). CEOs in firm-years with consultants are more likely to
receive grants of restricted shares, performance shares, and stock options than firm-years
without consultants, and are also more likely to have formula-based non-equity bonus plans.
7 Our Form 5500 methodology follows Murphy and Sandino (2010). Schedule B (which included actuarial
information) was unavailable for Form 5500s filed in 2008. For the 2011-2014 period, we categorized firms that used a single consultant but did not disclose fees (or disclosed fees less than $120,000) as firms using “consultants that did not provide other services” and firms with any disclosed fees above $120,000 as firms using “consultants that provided other services.” Unless there is explicit information on other services in the proxy statement, we are unable to classify firms with multiple consultants that do not disclose fees under either category and have dropped those observations from our tests that included “consultant that provided other services” as an explanatory variable.

COMPENSATION CONSULTANTS 11 MURPHY-SANDINO
In contrast, CEOs in firm-years with consultants are less likely to receive discretionary bonuses
and receive, on average, a lower percentage of favorable advisory “Say on Pay” votes.
3. Understanding the Relation Between the Use of Consultants and CEO Pay
In this section we document the relation between the use of compensation consultants
and CEO pay, and examine the extent to which the observed relation can be explained or
“mediated” by compensation composition and complexity. Figure 3 depicts the Baron and
Kenny (1986) mediation framework, adjusted for our setting. The first step in a mediation
analysis is to establish the effect of the use of consultants (the “treatment”) on the level of CEO
pay (the “outcome”), depicted in the figure by the arrow labeled A. The “mediator” is any
variable that might be affected by the treatment and might, in turn, affect the outcome. Our
hypothesis is that the composition and complexity of pay are mediator variables, which are
affected by the use of consultants and which, in turn, lead to higher levels of CEO pay. Thus,
the second step in a mediation analysis is to establish a relationship between the use of
consultants and the composition and complexity of pay (arrows labeled B1 and B2,
respectively), followed by establishing a relationship between the composition and complexity
and the level of CEO pay (arrows labeled C1 and C2, respectively). If controlling for pay
composition and complexity completely eliminates the CEO Pay Premium (i.e., the observed
relation between consultants and the level of CEO pay), we would conclude that composition
and complexity “fully mediate” the relation between consultants and CEO pay. If the CEO Pay
Premium is reduced but not eliminated by composition and complexity, we would conclude
that the mediation is “partial.”

COMPENSATION CONSULTANTS 12 MURPHY-SANDINO
Section 3.1 documents the existence of a positive and significant relation between the
use of consultants and CEO pay from 2006-2014 (i.e., arrow A in Figure 3), and shows that
this relation is robust to controlling for firm fixed effects. In Section 3.2, we show that the CEO
Pay Premium associated with consultants is partially (but not fully) mediated by the
composition and complexity of pay. In Section 3.3 we examine the possibility that the
composition, complexity, and level of CEO pay precede (i.e., potentially create demand for),
rather than result from, the retention of compensation consultants, suggesting a reverse
direction for arrows A, B1, and B2 in Figure 3. We elaborate on our research methods and
results in each of the following sub-sections.
3.1. Consultants and the Level of CEO Pay
Following the 2007 proxy season (i.e., the first year when firms were required to disclose
the identity of their compensation consultants), several academic and professional cross-
sectional studies documented a strikingly large CEO pay premium associated with the use of
consultants.8 Our objective is to examine factors that may explain this association. We begin
by replicating and documenting this CEO pay premium based on the following pooled
regression:
Ln(Total Pay) = β0 + β1 (Firm used consultant)
+ β2 (Firm used consultant that provided other services)
+ β3 (Firm characteristics)
+ β4 (Industry dummies) + β5 (Year effects) + (1)
8 See, in particular, Armstrong, Ittner, and Larcker (2012); Cadman, Carter, and Hillegeist (2010); (early versions
of) Murphy and Sandino (2010); and Higgins (2007).

COMPENSATION CONSULTANTS 13 MURPHY-SANDINO
Our dependent variable, Ln(Total Pay), is the natural logarithm of the firm’s CEO
expected total compensation, calculated as the sum of salary, discretionary bonus, the target
value of non-equity incentives, the grant-date value of restricted stock, performance shares,
and stock options, and other compensation (including perquisites, signing bonuses, termination
payments, above-market interest paid on deferred compensation). Our explanatory variable of
interest (“Firm used consultant”) is an indicator variable identifying whether the firm used one
or more consultants that year.
Allegations that consultants are complicit in perceived abuses in pay are typically focused
on conflicts of interest created when consultants provide other services beyond pay advice,
because the decisions to engage the consulting firm in these more-lucrative corporate-wide
consulting areas are often made or influenced by the CEO who is benefited or harmed by the
consultant’s pay recommendations.9 In order to assess whether the CEO pay premium
associated with the use of consultants is explained by the use of consultants that provide other
services, our regressions include in indicator variable, “Firm used consultant that provided
other services,” that identifies whether the firm uses one or more consultants that provide
services beyond executive or director pay advice.
We control for other key determinants of CEO pay described in prior literature. We
include Ln(Revenues) (a measure of size estimated as the natural logarithm of prior-year firm
sales) among our explanatory variables since it is well documented that larger firms pay more
to their CEOs to attract greater talent (e.g., Rosen 1982). We control for the ratio of book-to-
9 For example, the December 2007 report from the US House of Representatives Committee on Oversight and
Government Reform, “Executive Pay: Conflicts of Interest Among Compensation Consultants” (the “Waxman Report”), warned about conflicts of interest arising when the “consultants who are advising on executive pay are simultaneously receiving millions of dollars from the corporate executives whose companies they are supposed to assess.”

COMPENSATION CONSULTANTS 14 MURPHY-SANDINO
market assets (assets divided by assets plus market value of equity minus book value of equity)
since executives receive lower pay and incentive pay in firms with lower growth options (e.g.,
Smith and Watts 1992). We include the firm’s shareholder return over the previous year in
our regressions to account for the positive association between CEO pay and firm performance
(Murphy 1985). We also control for the presence of a new CEO (a dummy variable equal to 1
if a new CEO took office in that year), to account for one-time payments provided to either
incoming CEOs (e.g., signing bonuses or options mega-grants) or outgoing CEOs (e.g.
severance payments), or to consider the possibility that the CEO was not paid for the full year.
We also include industry dummies based on the Fama-French classification to account for
other industry characteristics.10
In addition to controlling for firm and industry characteristics, our multivariate
regressions include a variety of governance variables similar to those employed by Armstrong,
Ittner, and Larcker (2012): a dummy variable indicating whether the CEO also holds the
position of Chairman; an indicator for whether the CEO is the founder of the firm;11 the
percentage of common shares owned by the CEO; the number of directors; the percentage of
independent directors; the percentage of “old” directors (defined as those who are 70 years or
older); the average number of public company boards in which non-employee directors served;
and the percentage of independent directors hired after the CEO took office. We obtain data
on CEO ownership and identify founders and CEO/Chairman combinations from ExecuComp;
10 Specifically, we employ the 5 Industry Portfolios Fama/French classification (described at:
http://mba.tuck.dartmouth.edu/pages/faculty/ken.french/Data_Library/changes_ind.html) plus an additional dummy variable for the financial services sector (SIC codes 6000 to 6999). Our results are robust to using alternative Fama-French classifications.
11 We define founders as (1) individuals identified as founders in ExecuComp; or (2) individuals serving as CEO prior to the company’s initial public offering.

COMPENSATION CONSULTANTS 15 MURPHY-SANDINO
our remaining governance variables are obtained from Equilar.12 Finally, we include year fixed
effects to account for economic fluctuations.
Column (1) of Table 2 reports coefficients from estimating equation (1) using ordinary
least-squares regressions with robust standard errors, clustered by firm. Consistent with results
from prior studies from the 2007 proxy season, we find a positive and statistically significant
association between the use of consultants and CEO pay levels. Firms retaining consultants
(but not using those consultants for other services) pay approximately 53% more to their CEOs
(computed as e0.4271 - 1) than firms not using consultants. Firms using their consultants for other
services pay their CEOs approximately 11% more than firms retaining consultants but not
using them for other services.13 These results are consistent with those reported in Figure 1,
where year-by-year analyses suggest that CEOs of firms using consultants are paid
significantly more than CEOs in firms not using consultants, with an additional premium for
consultants proving other services, after controlling for all the same variables that appear in
Table 2, column (1) (except year fixed effects). As expected, the coefficients on company size
are positive and significant in Table 2, while the coefficients of the ratio of book-to-market
assets are negative and significant. CEO pay is generally higher when the CEO is also the
chairman of the board, a larger percentage of directors are 70 or older, the board members sit
on multiple boards, and the firm has a greater percentage of directors appointed after the CEO
took office. On the flip side, CEO pay is generally lower when the CEO is a founder of the
company and/or holds a greater percentage of the firm’s shares. Contrary to expectations, we
12 Equilar includes the name and age of each director in the Russell 2000, but does not maintain a unique identifier
for each director. Our measure of “average number of boards” for each director is based on name and birth year, and therefore potentially overstates directorships for directors with common names.
13 Computed as e.4271+.0686 - e.4271.

COMPENSATION CONSULTANTS 16 MURPHY-SANDINO
find that CEO pay is lower in firms with greater shareholder returns (though, as we explain
below, this association becomes insignificant once we control for firm fixed effects).
While the results in Table 2, column (1) are consistent with the hypothesis that
consultants lead to higher pay, they are also consistent with the existence of omitted factors
that are related both to the level of pay and the firm’s decision to retain a consultant. To the
extent that these omitted factors are specific to the firm and invariant over time, we can control
for them using firm fixed effects in a pooled cross-sectional time-series dataset.
Table 2, column (2) presents results from estimating equation (1), substituting firm fixed-
effects for industry fixed-effects:
Ln(Total Pay) = β0 + β1 (Firm used consultant)
+ β2 (Firm used consultant that provided other services)
+ β3 (Firm characteristics)
+ β4 (Firm fixed effects) + β5 (Year effects) + (2)
Column (2) shows that both the relationship between the use of consultants and CEO pay and
the additional premium associated with consultants providing other services become
insignificant after controlling for firm fixed effects.
In conducting our robustness analysis for this paper, we discovered that our results are
highly sensitive to a handful of outliers: CEOs who receive less than one dollar per month in
total compensation. These outliers become influential because our dependent variable is
ln(CEO Pay), where pay is measured in $1000s, so that ln(CEO Pay) for CEOs with minuscule
pay is a large negative number. We identified 26 firm-years in 10 firms (from a total of 14,311
firm-years from 2,031 firms in Table 2) where the CEOs were paid $12 or less. Columns (3)
and (4) of Table 2 replicate the analyses in columns (1) and (2) after dropping these 26
observations. While the coefficients in column (3) are not substantially different from those in

COMPENSATION CONSULTANTS 17 MURPHY-SANDINO
column (1), it is notable that eliminating these 26 observations (0.18% of our sample) increases
the explanatory power of the regression from R2 = .365 in column (1) to R2 = .530 in column
(3). Eliminating these same observations from the fixed effects regression changes the
coefficient on “Firm used consultant” from a statistically insignificant 0.0377 to a highly
significant 0.0799, and changes the coefficient on “Firm used consultant that provided other
services” from a statistically insignificant 0.0214 to a highly significant 0.0397. Based on these
results, we exclude these 26 firm-years from the remainder of our analysis.14 Appendix Table
A1 lists the firm-year observations that we excluded. As shown in this table, 24 of the 26
observations with annual compensation of $12 or less corresponded to CEOs taking a symbolic
$1 for the year (most of them, prominent entrepreneurs such as Steve Jobs, Larry Page, and
Marc Benioff).
The results in Table 2, column (4) suggest an 8.3% CEO pay premium associated with
the use of consultants after controlling for firm fixed effects, and an additional 4.4% premium
associated with using a consultant that provided other services.15 The fact that the additional
CEO pay premium associated with the use of consultants providing other services is small
relative to the CEO pay premium for consultants not providing such services suggests that the
observed relation between pay and the use of consultants reflects more than conflicts of interest
related to the provision of other services.
The results in Table 2 are generally robust to alternative specifications where we: (a)
substitute the Ln(Revenue) variable for alternative measures of size using Ln(Assets) and
14 Our results are robust to excluding all observations from the ten firms that paid their CEOs $12 or less in any
sample year, and not simply the outlier firm-year observations. 15 The premium for using consultants is computed as e.0799 - 1 while the additional premium for using a consultant
providing other services is computed as e.0799 +.0397 - e.0799.

COMPENSATION CONSULTANTS 18 MURPHY-SANDINO
Ln(Market Value of Equity); or (b) exclude observations corresponding to years when the CEO
was new. These alternative specifications yield similar results to those reported in Table 2,
except that excluding new CEO observations in our replication of column (4) of Table 2
renders insignificant the incremental consultant effect associated with the provision of other
services (the main effect of consultant use remains highly significant).
In summary, our results in Table 2 and Figure 1 show that the association between the
use of consultants and the level of CEO pay observed throughout our sample period is
persistent and robust, and that this association is not fully (nor mostly) explained by the use of
consultants that provide other services. Our data, however, enable us to explore further other
explanations for this relation. More concretely, in the following section we examine whether
the relation between the use of consultants and CEO pay is explained by the composition and
complexity of the CEO pay package.
3.2. Mechanisms Potentially Explaining the CEO Pay Premium Associated with the Use of Consultants
As noted above, allegations that consultants are complicit in perceived abuses in pay are
typically focused on conflicts of interest created when consultants provide other services
beyond pay advice. However, as shown in Figure 1 and Table 2, the CEO Pay Premium
associated with using consultants is largely driven by firms whose consultants provide no other
services beyond compensation advice. Moreover, the CEO Pay Premium has generally
increased over time, even as the percentage of firms whose consultants provide other services
has dwindled (see Figure 2). Indeed, by 2014, most consultants are retained directly by the
compensation committee, work exclusively for that committee, and meet the standards of
“independence” defined by the SEC. The empirical relation between CEO pay and the use of
consultants must therefore reflect more than biased advice from conflicted consultants.
COMPENSATION CONSULTANTS 19 MURPHY-SANDINO
While compensation consultants provide benchmarking data and recommendations on
appropriate pay levels, a disproportionate share of their time is devoted to helping
compensation committees design and implement incentive plans, and providing guidance on
the complex and evolving accounting, tax, and regulatory issues related to stock options,
performance shares, formula-based bonuses, and other incentive arrangements. We therefore
propose that the use of consultants is associated with both the composition (which we measure
as the ratio of incentive pay to total pay) and complexity (which we measure as the number of
distinct incentive plans) of the CEO pay package, and that composition and complexity (in
turn) are associated with higher levels of pay.
Our hypothesized positive relation between the composition and level of pay is based on
two arguments. First, to the extent that increases in variable incentive pay are offset by
decreases in base salaries (i.e., keeping constant the certainty equivalent of total
compensation), we expect total pay to increase since risk-averse CEOs will demand a risk
premium for the increased compensation risk. Second, to the extent that increases in incentive
pay are not offset by decreases in other forms of pay (as happened, for example, in the stock
option explosion in the 1990s, when firms layered options on top of existing compensation
arrangements), total pay will also increase. Similarly, if new incentive plans are layered on top
of existing arrangements with no (or only partial) offsets to other plans, total compensation
will also increase with complexity.
We examine the extent to which the relation between the use of consultants and CEO pay
is partly or fully explained (mediated) by the composition and complexity of CEO pay,
measured as the proportion of incentives-to-total pay, and the number of incentive types used
by the company, respectively. Having established a positive association between the use of

COMPENSATION CONSULTANTS 20 MURPHY-SANDINO
consultants and CEO pay (arrow A in Figure 3), a mediation analysis requires us to examine
both: (a) whether the use of consultants is associated with CEO pay packages that include a
higher incentive component and/or more complex pay (arrows B1 and B2 in Figure 3), and (b)
whether the CEO pay premium associated with the use of consultants is reduced or mitigated
after controlling for the size of the incentive component and use of complex pay measures
(arrows C1 and C2 in Figure 3). To do this, we run the following regressions:
Incentives-to-Total Pay = β0 + β1 (Firm used consultant)
+ β2 (Firm used consultant that provided other services)
+ β3 (Firm characteristics) + β4 (Firm fixed effects)
+ β5 (Year effects) + (3)
Ln (# Incentive Types) = β0 + β1 (Firm used consultant)
+ β2 (Firm used consultant that provided other services)
+ β3 (Firm characteristics) + β4 (Firm fixed effects)
+ β5 (Year effects) + (4)
Ln(Total Pay) = β0 + β1 (Firm used consultant)
+ β2 (Firm used consultant that provided other services)
+ β3 (Incentives-to-Total Pay)
+ β4 Ln(# Incentive Types) + β5 (Firm characteristics)
+ β6 (Firm fixed effects) + β7 (Year effects) + (5)
Equation (3) examines whether the use of consultants is associated with the CEO’s pay
composition (i.e., the extent to which the firm relies on incentive compensation for its CEO).
Equation (4) tests the relation between the use of consultants and incentive pay complexity.
We proxy for incentive pay complexity using the natural logarithm of the sum of 1 plus the
values of 5 dummy variables indicating whether the CEO’s pay package includes a
discretionary bonus, formula-based bonus plans, grant values of time-lapse restricted stock
(i.e., restricted shares vesting solely with the passage of time), performance shares (i.e.,

COMPENSATION CONSULTANTS 21 MURPHY-SANDINO
restricted shares vesting upon the attainment of performance goals), or stock options. Equation
(5) examines whether CEO total pay is associated not only with the use of consultants, but also
with the CEO’s pay composition and complexity variables, as well as other control variables.
If coefficient β1 in equation (5) were no longer significant in this model, the result would
support full mediation by the CEO’s pay composition and complexity. If coefficient β1
decreased but were still significant in equation (6), the result would suggest partial mediation
by the CEO pay composition and complexity variables.
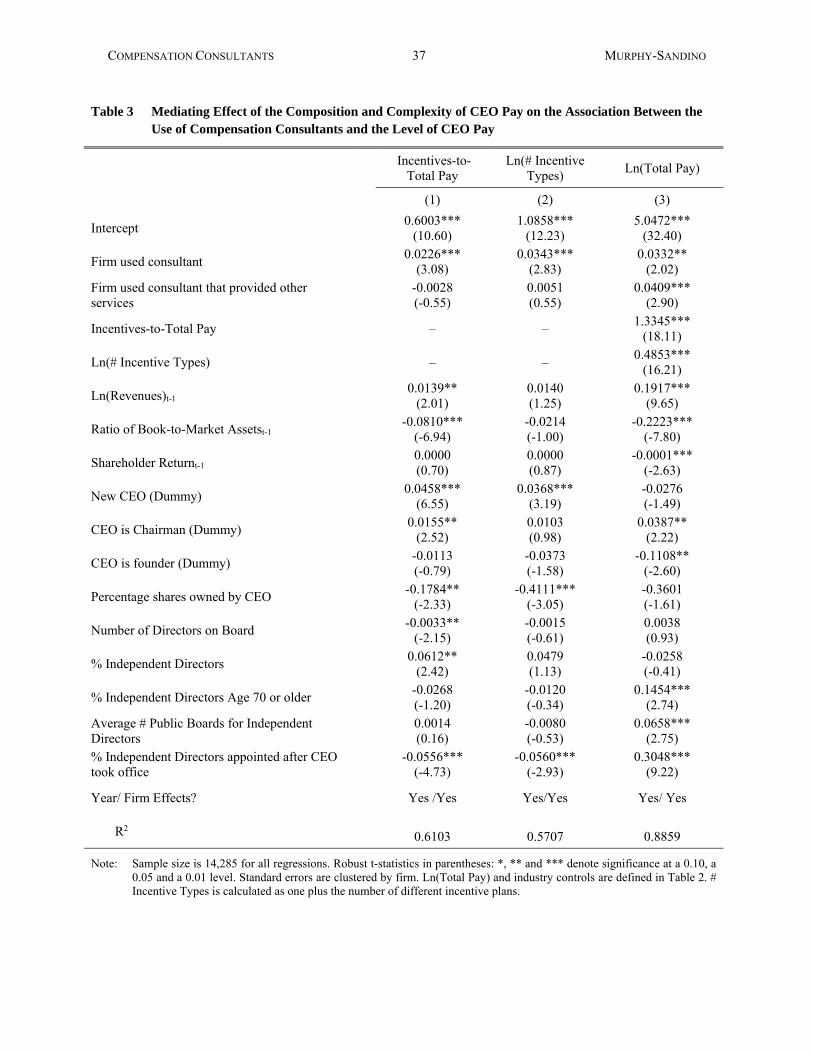
Table 3, columns (1) and (2), shows that the use of consultants is associated with both
higher incentives-to-total pay and a larger number of incentive types. Using a consultant is
associated with an increase of 2.3 percentage points (t=3.08) in the incentives-to-total pay ratio.
The additional change in the incentives-to-total pay ratio associated with consultants that
provide other services is negative but insignificant. Similarly, the use of a consultant is
associated with a 3.5% increase (t=2.83) in the number of incentive types used to compensate
the CEO, with no additional change associated with consultants that provide other services.
Consistent with arrows labeled C1 and C2, respectively in Figure 3, Table 3, column (3)
shows that both mediators significantly predict CEO pay. Specifically, an increase in 2.3
percentage points in the incentives-to-total pay ratio (due to the use of consultants) is
associated with a 3.1% increase in CEO total pay (calculated as e(1.3345*0.0226) – 1), while a 3.5%
increase in the Ln(# Incentive Types) (due to the use of consultants) is associated with a 1.7%
increase in CEO total pay (calculated as e(0.4853*0.0343) – 1). We test the significance of the
mediation effect of each of these variables by estimating the following Z-statistic, based on the
coefficients estimated in Table 3, columns (1)-(3) (Baron and Kenny 1986, Kenny, Kashy and
Bolger 1998):
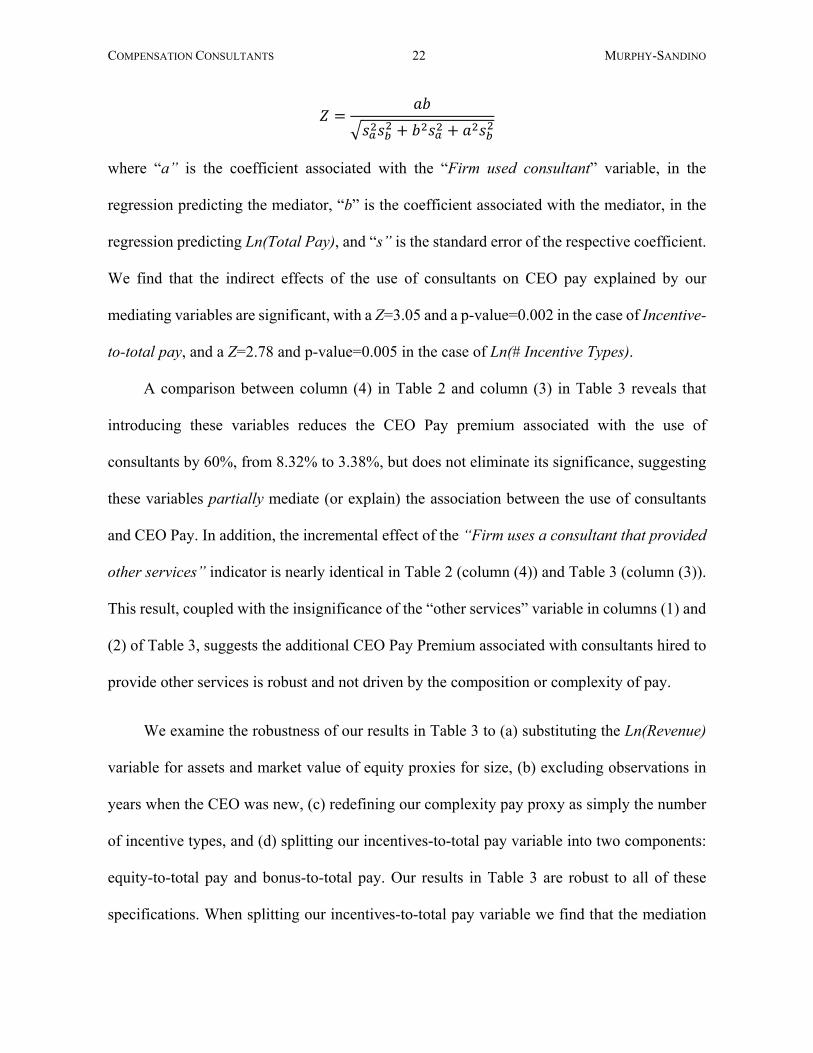
COMPENSATION CONSULTANTS 22 MURPHY-SANDINO
where “a” is the coefficient associated with the “Firm used consultant” variable, in the
regression predicting the mediator, “b” is the coefficient associated with the mediator, in the
regression predicting Ln(Total Pay), and “s” is the standard error of the respective coefficient.
We find that the indirect effects of the use of consultants on CEO pay explained by our
mediating variables are significant, with a Z=3.05 and a p-value=0.002 in the case of Incentive-
to-total pay, and a Z=2.78 and p-value=0.005 in the case of Ln(# Incentive Types).
A comparison between column (4) in Table 2 and column (3) in Table 3 reveals that
introducing these variables reduces the CEO Pay premium associated with the use of
consultants by 60%, from 8.32% to 3.38%, but does not eliminate its significance, suggesting
these variables partially mediate (or explain) the association between the use of consultants
and CEO Pay. In addition, the incremental effect of the “Firm uses a consultant that provided
other services” indicator is nearly identical in Table 2 (column (4)) and Table 3 (column (3)).
This result, coupled with the insignificance of the “other services” variable in columns (1) and
(2) of Table 3, suggests the additional CEO Pay Premium associated with consultants hired to
provide other services is robust and not driven by the composition or complexity of pay.
We examine the robustness of our results in Table 3 to (a) substituting the Ln(Revenue)
variable for assets and market value of equity proxies for size, (b) excluding observations in
years when the CEO was new, (c) redefining our complexity pay proxy as simply the number
of incentive types, and (d) splitting our incentives-to-total pay variable into two components:
equity-to-total pay and bonus-to-total pay. Our results in Table 3 are robust to all of these
specifications. When splitting our incentives-to-total pay variable we find that the mediation

COMPENSATION CONSULTANTS 23 MURPHY-SANDINO
results are driven by the equity-to-total pay and pay complexity variables, but not by the bonus-
to-total pay variable. Furthermore, we find that the “Firm used consultant” effect is fully
mediated (or explained) by the equity-to-total pay and pay complexity variables.
In summary, we find that the association between the use of consultants and CEO Pay is
largely explained by the CEO’s pay composition and complexity. This effect is more
pronounced for firms not using consultants than for firms using consultants.
3.3. Do Higher CEO Pay, Incentive Pay or Pay Complexity Precede the Use of Consultants?
While our analyses suggest that the use of consultants leads to higher reliance on
incentives, complex incentive plans, and CEO pay (consistent with the direction of the arrows
B1, B2, and A in Figure 3), it is possible that the causal effects we inferred were reversed. We
examine this possibility by modeling the decision to use consultants as a function of the level,
composition, and complexity of pay in the previous year. Table 4 presents logistic regressions
examining the determinants of the decision to use a compensation consultant.
The dependent variable in Table 4 is a dummy variable equal to one if the firm retained
a consultant in the following year (t+1). The sample includes firms not using consultants over
the prior three years (t, t-1 and t-2) or not using consultants in 2006 or in the first year when
they appeared in our data (if after 2006).16
The independent variables in column (1) of Table 4 include the natural logarithm of total
compensation, the number of directors on the compensation committee, and all of the
independent variables in Table 2, column (4) (including industry and year controls) except for
16 Our inclusion criteria for 2006 may retain some observations where consultants were used in 2005 or 2004 (i.e.,
before mandatory disclosure of consultants). However, we excluded from our Table 4 sample 2006 data in cases where the text of the proxy indicated that consultants were used prior to 2006. Similarly, we excluded from our Table 4 sample first-year observations for firms joining our data when the proxy statements indicated prior consultant retention.

COMPENSATION CONSULTANTS 24 MURPHY-SANDINO
the “Firm used consultant” and the “Firm used consultant that provided other services”
dummy variables.
The coefficient on Ln(Total Pay) in column (1) of Table 4 is positive and statistically
significant, suggesting that, among firms that have not used consultants for the last three years,
firms with higher pay in year t are more likely to use consultants in year t+1. To gauge the
economic significance of this result, we examine the effect of increasing the level of Ln(Total
Pay) one standard deviation around the mean on the firm’s probability of employing a
consultant in year t+1. Holding all control variables at mean levels, we find that a one standard-
deviation increase in Ln(Total Pay) around the mean leads to a 4.6 percentage points increase
in the probability of employing a consultant on the following year (from 16.8% half a standard
deviation below the average Ln(Total Pay), to 21.4% half a standard deviation above the
average Ln(Total Pay)). Additionally, the likelihood of using consultants in the following year
is negatively related to the percentage of common shares owned by the CEO and to the
percentage of independent directors 70 years old or older, and positively related to the number
of directors on the compensation committee and the percentage of independent directors.
In column (2) of Table 4, we add the composition and complexity of pay as potential
predictors of the use of consultants. The coefficients on Ln(Total Pay) and Ln(# Incentive
Types) are positive and statistically significant, while the coefficient on Incentives-to-Total
Pay is insignificant. Holding all other variables at the mean, a one standard-deviation increase
in the Ln(# Incentive Types) variable around the mean results in an increase of 5.1 percentage
points in the probability of using a consultant the next year (from 16.3% half a standard
deviation below the average Ln(# Incentive Types), to 21.4% half a standard deviation above
the average Ln(# Incentive Types)). These results suggest that it is not only high levels of pay,

COMPENSATION CONSULTANTS 25 MURPHY-SANDINO
but also complexity of pay, that precedes the use of consultants after controlling for industry,
firm, and governance characteristics.
Column (3) of Table 4 breaks down complexity of pay into its components and reveals
that the types of incentives most likely to predict the use of consultants are incentive plans
including performance shares, stock options, and formula-based bonuses. Compensation
committees routinely retain consultants and other advisors to help design these plans and
navigate the complex (and continually changing) accounting, tax, and disclosure rules
associated with them. Our results reinforce our prediction that complex types of incentives
drive the use of consultants. Moreover, including controls for different types of incentives leads
to a decrease in the coefficient on Ln(Total Pay) in column (3) relative to columns (1) and (2),
suggesting the types of incentives are correlated both with the level of pay and the use of
consultants.
The results in Table 4 are robust to substituting the Ln(Revenue) variable for Ln(Assets)
or Ln(Market Value of Equity). In summary, Table 4 suggests that higher pay and, especially,
higher pay complexity precede the use of consultants in companies who had not been
employing consultants.
Overall, the results of this section suggest that the association between the use of
compensation consultants and CEO pay is not only explained by conflicts of interest, but also
by the type of incentive packages implemented around the time those consultants are hired.
We find evidence suggesting that:
a) the effect of the use of consultants on CEO pay is mediated by the pay packages’
reliance on incentive pay and complex incentives;

COMPENSATION CONSULTANTS 26 MURPHY-SANDINO
b) the complexity of CEO incentive pay may not only mediate the effect of the use of
consultants on CEO pay, but also precede the use of consultants (becoming a relevant
variable that should be controlled for when analyzing the relation between the use of
consultants and CEO pay);
c) firms paying more to their CEOs and using more complex incentive pay are more
likely to hire consultants.
4. Do Shareholders Value the Use of Compensation Consultants?
Section 3 suggests that CEO pay is higher in firms that use consultants, and that the CEO
pay premium associated with using consultants is largely explained by the greater use of
incentive pay and complex pay. It also documents a higher likelihood of retaining consultants
by firms that already paid more (and paid more in the form of incentive pay) to the CEO before
using consultants.
These results, however, do not speak to whether consultants influence pay in ways that
are perceived positively by shareholders. On one hand, our results may suggest that firms hire
consultants for justifiable economic reasons (i.e., to design complex incentive pay packages to
improve the alignment between the CEO’s and the shareholders’ interests, or to help
compensation committees understand and navigate regulatory consequences). Alternatively,
our results may suggest that consultants are hired to legitimize excessive levels of pay, and that
they use complex incentive packages to camouflage rent extraction (Bebchuk and Fried 2003).
Under Section 951 of the Dodd-Frank Wall Street Reform and Consumer Protection Act
(“Dodd-Frank Act”) passed in July 2010, shareholders are asked to approve the company’s
executive compensation practices in a non-binding “Say on Pay” vote occurring at least every
three years (with an additional vote the first year and every six years thereafter to determine

COMPENSATION CONSULTANTS 27 MURPHY-SANDINO
whether the votes will occur every one, two, or three years). To fulfill their required fiduciary
duties to vote proxies, institutional investors routinely rely on Institutional Shareholder Service
(ISS) and other proxy-advisory firms for recommendations on how to vote on Say-on-Pay and
other proxy matters. These votes and recommendations allow us to assess whether the use of
consultants, and the composition and complexity of the compensation package, are perceived
favorably by shareholders (suggesting improved alignment in CEO-shareholder interests) or
unfavorably (suggesting potential rent extraction).
Table 5 examines the incremental effect of using consultants on shareholders’ Say-on-
Pay votes and Institutional Shareholder Services (ISS) Say-on-Pay recommendations. Our
model specification is:
Vote = β1 (Firm used consultant) + β2 Residual Ln(Total Pay)
+ β3 (Incentives-to-Total Pay) + β4 Ln(# Incentive Types)
+ β5 (Firm characteristics)+ β6 (Industry dummies) + β7 (Year effects) + (7)
We use two measures of “Vote”. The first is the fraction of “votes for” Say-on-Pay
estimated as
. The second is as a dummy indicating that the ISS
provided a “vote for” Say-on-Pay recommendation. We model the determinants of “Vote”
using OLS regressions when employing our first vote measure and logistic regressions when
using our second vote measure.
Our main analyses examine the effect of having a compensation consultant (“Firm used
consultant”) on Say-on-Pay votes and/or vote recommendations, and whether this effect is
partially explained by the CEO’s composition and/or complexity of pay. We control for
deviations in CEO pay, key determinants of CEO pay (described for equation 1), and industry
and year fixed effects.
Our results in column (1) of Table 5 suggest that firms using consultants receive a
significantly larger fraction of non-binding votes in favor of the proposed executive
COMPENSATION CONSULTANTS 28 MURPHY-SANDINO
compensation plans, where the use of consultants is associated with a 1.2% increase in the
percentage of favorable Say-on-Pay votes. Column (2) shows that the positive voting outcomes
associated with the use of consultants are mediated by the firm’s CEO incentive complexity.
Furthermore, column (3) suggests that the mediation effect is explained by the use of different
types of complex incentive plans, including formula-based bonus plans, performance shares,
stock options, and restricted stock (in order of significance).
Our results in column (4) of Table 5 suggest a positive but statistically insignificant
association between the use of consultants and the ISS pay recommendation. But the results
reported in columns (5) and (6) suggest that the complexity of the CEO’s pay is a significant
determinant of ISS Say-on-Pay recommendations. Our results in Table 5 are robust to
excluding new CEOs, or to using alternative measures of size instead of Ln(Revenues), based
on assets or market value of equity. However, these results are not robust to including firm
fixed effects, except that we continue to observe a larger fraction of votes supporting executive
compensation plans in companies using target bonuses and/or granting performance-based
shares.
Overall, our performance analyses provide weak evidence that shareholders generally
have a positive view on the role of consultants on pay, explained by the higher reliance on
complex incentives in firms using compensation consultants.
5. Conclusions
Concerns that compensation consultants would recommend unreasonably high levels of
CEO pay to their clients, with the objective to please the same executives that may later on
retain their services, led the SEC to implement disclosure rules requiring firms to describe their
use of compensation consultants and to identify potential conflicts of interest from the

COMPENSATION CONSULTANTS 29 MURPHY-SANDINO
consultants’ engagements. Despite initial studies documented a positive association between
the use of compensation consultants and CEO pay, these studies did not provide conclusive
evidence on whether the use of consultants leads to excessive levels of executive pay, whether
high paying firms are more likely to retain consultants, or whether other factors explain the
association between the use of compensation consultants and CEO pay.
This study examines the relationship between the use of consultants and the level and
structure of CEO pay using a panel dataset that includes nine years of data for a sample of
2,347 publicly traded firms in the U.S. Our analysis shows that the use of compensation
consultants is associated with higher levels of pay even after controlling for firm fixed effects.
It also shows that this association is not entirely explained by potential conflicts of interest
associated with the consultants’ provision of other services to the company (a topic examined
in prior studies). We hypothesize and find evidence suggesting that the relation between the
use of consultants and CEO pay is largely explained by the composition and complexity of the
CEO pay package. We also find that firms are more likely to start using consultants when they
already report higher levels of pay and complex pay than other firms not using consultants
prior to the consultant engagement. Finally, we show that shareholders are more likely to
approve executive compensation policies through their Say-on-Pay vote in companies using
compensation consultants, and that this positive association is also explained by the
composition and complexity of CEO pay.
Our study helps clarify the role that compensation consultants play in determining the
level and structure of CEO pay. Overall, we find limited support for the managerial power
view that consultants are mainly used by firms to increase the levels of executive pay or justify
unreasonably high levels of pay. Nevertheless, our results should be interpreted with caution,

COMPENSATION CONSULTANTS 30 MURPHY-SANDINO
since our analyses are based on a period where the increased concern (and disclosure) about
conflicts of interest between compensation consultants and their client firms may have shaped
the nature of the advice provided by these consultants as well as the firms’ approach to
managing compensation consultant engagements.

COMPENSATION CONSULTANTS 31 MURPHY-SANDINO
REFERENCES
Armstrong, Christopher S., Christopher D. Ittner, and David F. Larcker. 2012. “Economic Characteristics, Corporate Governance, and the Influence of Compensation Consultants on Executive Pay Levels.” Review of Accounting Studies. Forthcoming.
Bebchuk, Lucian Ayre and Jesse M. Fried. 2003. “Executive Compensation as an Agency Problem.” Journal of Economic Perspectives 17(3): 71-92.
Cadman, Brian, Mary Ellen Carter, and Stephen Hillegeist. 2010. “The Incentives of Compensation Consultants on CEO Pay,” Journal of Accounting and Economics 49(3): 263-280.
Conyon, Martin C., Simon I. Peck and Graham V. Sadler. 2009. “Compensation Consultants and Executive Pay: Evidence from the United States and the United Kingdom.” Academy of Management Perspectives 23(1): 43-55.
Core, John E., Robert W. Holthausen and David F. Larcker. 1999. “Corporate Governance, Chief Executive Officer Compensation and Firm Performance,” Journal of Financial Economics 51(3): 371-406.
Crystal, Graef. 1991. In Search of Excess: The Overcompensation of American Executives. New York: W.W. Norton & Company.
Eaton, Jonathan and Harvey S. Rosen. 1983. “Agency, Delayed Compensation, and the Structure of Executive Remuneration.” The Journal of Finance 38 (5): 1489-1505.
Goh, Lisa and Aditi Gupta. 2010. “Executive Compensation, Compensation Consultants, and Shopping for Opinion: Evidence from the U.K.” Journal of Accounting, Auditing and Finance 25(4): 607-643.
Gong, James Jianxin, Vivek Mande, and Myungsoo Son. 2017. “Compensation Consultants and Shareholders’ Say on Pay Votes.” Working paper, California State University at Fullerton.
Higgins, Alexandra. 2007. “The Effect of Compensation Consultants: A Study of Market Share and Compensation Policy Advice.” The Corporate Library (October).
Murphy, Kevin J. 1985. “Corporate Performance and Managerial Remuneration. An Empirical Analysis.” Journal of Accounting and Economics 7 (1-3): 11-42.
Murphy, Kevin J. and Tatiana Sandino. 2010. “Executive pay and ‘independent’ compensation consultants.” Journal of Accounting and Economics 49 (3): 247-262.
Prendergast, Canice. 2002. “The Tenuous Trade-off between Risk and Incentives.” Journal of Political Economy 110 (5): 1071-1102.
Rosen, Sherwin. 1982. “Authority, Control, and the Distribution of Earnings.” The Bell Journal of Economics 13 (2): 311-323.
Smith, Clifford W. and Ross L. Watts. 1992. “The investment opportunity set and corporate financing, dividend, and compensation policies.” Journal of Financial Economics 32 (3): 263-292.

COMPENSATION CONSULTANTS 32 MURPHY-SANDINO
Figure 1
Pay Premium for CEOs in Firms Retaining Consultants, 2006-2014
Note: The vertical bars show the average percentage difference in expected total compensation for CEO in firms retaining consultants compared to that in firms not retaining consultants, controlling for firm, CEO, and governance characteristics and based on untabulated regression coefficients from annual regressions analogous to those in column (3) of Table 2 (replacing firm and year effects with industry effects). The data include 14,285 firm years and are based on all ExecuComp firms with fiscal closings after December 15, 2006 (when the rules requiring disclosure of compensation consultants were effective), excluding 26 firm-years from 10 firms reflecting CEOs earning less than $12/year (see the Appendix showing how our results are sensitive to omitting these 26 outliers).
2006 2007 2008 2009 2010 2011 2012 2013 2014
-20%
0%
20%
40%
60%
80%
100%
CE
O P
ay P
rem
ium
for
Fir
ms
wit
h C
onsu
ltan
ts
34%
20%
35%
11%
54%
10%
39%
9%
64%
11%
62%
3%
68%
14%
-3%
60%50%
11%
Pay Premium for Consultants not providing Other Services
Additional Premium for Consultants providing Other Services
54%
46%
64%
48%
76%
65%
82%
61%57%

COMPENSATION CONSULTANTS 33 MURPHY-SANDINO
Figure 2
Percentage of Sample Firms using Consultants, and using Consultants that provide other services, 2006-2014
Note: The top (blue) line depicts the percentage of sample firms in each year that reported retaining one or more compensation consultants. The bottom (red) line depicts the percentage of sample firms, conditional on using consultants, that retained consultants for other services). As described in Section 2, consultants providing other services are identified or inferred from various sources, including the descriptions in the Compensation Discussion and Analysis (CD&A) section of the proxy statement; disclosure of company actuaries in Schedule B of IRS/DoL Form 5500 (for companies with defined-benefit plans); disclosure of fees paid for other services (which is definitive for firms with a single consultant); and the particular consultants used (e.g., whether those consultants, in fact, provide other services).
The data for firms using consultants include 16,588 firm years and are based on all ExecuComp firms with fiscal closings after December 15, 2006 (when the rules requiring disclosure of compensation consultants were first effective). Data on the percentage of firms using consultants that provide other services exclude observations where we could not determine whether the consultant, indeed, provided such services.
78% 80% 81% 80%84% 85% 85% 86% 86%
10% 11% 13%
19% 18%13%
5% 4% 3%
2006 2007 2008 2009 2010 2011 2012 2013 20140%
20%
40%
60%
80%
100%
% o
f E
xecu
Com
p F
irm
s
% of Firms using consultants
Among Firms using consultants, % using consultants that provide other services

COMPENSATION CONSULTANTS 34 MURPHY-SANDINO
Figure 3
Illustration of Baron-Kenny (1986) Mediation Analysis, with CEO pay Composition and Complexity “Mediating” the Relation Between the Use of Consultants and CEO Pay
Composition of CEO Pay(Incentives-to-Total Pay)
Level ofCEO Pay
Use of CompensationConsultants
B1B2
C1C2
A
Complexity of CEO Pay(# Incentive Types)

COMPENSATION CONSULTANTS 35 MURPHY-SANDINO
Table 1 Summary Statistics for Selected Variables, by Consultant Use
Variable Firm-Years with No Consultant
(n = 2,844)
Firm-Years with Consultant
(n = 13,744)
t-test for difference
CEO Total Compensation $3,114,370 $6,725,163 -24.11***
Composition of CEO Pay
All Incentive Pay / Total Pay 51.84% 68.39% -36.02***
All Bonus Pay / Total Pay 25.68% 23.42% 6.60***
All Equity Pay / Total Pay 26.16% 44.97% -35.50***
Complexity of Incentive Plan
Number of types of incentive plans for CEO 1.74 2.63 -43.02***
CEO receives Discretionary Bonus 32.03% 20.11% 14.02***
CEO receives Non-Equity Bonus Target 61.39% 86.42% -32.71***
CEO receives Restricted Stock 32.81% 55.70% -22.58***
CEO receives Performance Shares 14.73% 45.90% -31.73***
CEO receives Stock Options 33.09% 54.77% -21.34***
Say-on-Pay Outcomes (2010-2014) (n=835) (n=6,360)a
Percentage Votes “For” 92.53% 90.94% 3.45***
ISS Recommendation “For” 88.86% 88.75% 0.10
a n=6,356 in the case of ISS Recommendation “For”

COMPENSATION CONSULTANTS 36 MURPHY-SANDINO
Table 2 Coefficients of OLS Regressions Showing the Effect of the Use of Compensation Consultants on the Level of CEO Pay
Dependent Variable: Ln(Total Pay)
Full Sample
Sample Excluding Observations w/CEO Total Pay ≤ $12
Pooled Regression
Firm F.E. Regression
Pooled
Regression Firm F.E.
Regression
(1) (2) (3) (4)
Firm used consultant 0.4271***
(7.63) 0.0377 (0.88)
0.4027***
(10.95) 0.0799***
(3.70) Firm used consultant that provided other services
0.0686*** (2.37)
0.0214 (1.14)
0.0646***
(2.83) 0.0397**
(2.28)
Ln(Revenues)t-1 0.3158***
(11.9) 0.2463***
(4.03)
0.3467*** (25.96)
0.2171*** (9.18)
Ratio of Book-to-Market Assetst-1 -0.3042***
(-4.39) -0.3575***
(-7.86)
-0.3976*** (-8.61)
-0.3407*** (-9.30)
Shareholder Returnt-1 -0.0001* (-1.80)
0.0000 (0.07)
-0.0001* (-1.77)
0.0000 (0.13)
New CEO (Dummy) 0.0032 (0.06)
0.0199 (0.49)
0.0469 (1.64)
0.0513** (2.06)
CEO is Chairman (Dummy) 0.1635***
(4.55) 0.0925**
(2.42)
0.1186*** (5.16)
0.0644*** (3.17)
CEO is founder (Dummy) -0.0866 (-1.26)
-0.1782** (-2.69)
-0.0232 (-0.55)
-0.1441*** (-2.88)
Percentage shares owned by CEO -2.3274***
(-4.86) -1.1646**
(-2.46)
-1.7065*** (-4.98)
-0.7978*** (-2.70)
Number of Directors on Board 0.0110 (1.38)
0.0011 (0.17)
0.0092* (1.88)
-0.0013 (-0.27)
% Independent Directors 0.1119 (0.97)
-0.0493 (-0.47)
0.1786* (1.76)
0.0792 (0.98)
% Independent Directors Age 70 or older 0.1895**
(2.44) 0.1852* (1.68)
0.1130* (1.88)
0.1039 (1.58)
Average # Public Boards for Independent Directors
0.2135*** (6.67)
0.0320 (0.65)
0.2061***
(7.34) 0.0638**
(2.04)
% Independent Directors appointed after CEO took office
0.2306*** (3.71)
0.1991*** (3.33)
0.2100***
(4.59) 0.2034***
(5.34)
Year/Industry/Firm Effects? Yes/Yes/No Yes/No/Yes Yes/Yes/No Yes/No/Yes
R2 0.3647 0.7330 0.5300 0.8142
N 14,311 14,311 14,285 14,285
Note: t-statistics in parentheses; *, ** and *** denote significance at a 0.10, a 0.05 and a 0.01 level. Standard errors are clustered by firm. Ln (Total Pay) is the natural logarithm of the average expected compensation of the CEO, where the CEO’s total (expected) compensation is defined as the sum of salaries, discretionary bonuses, formula-based bonuses (i.e., the target value for non-equity incentives), the grant-date value of restricted stock and stock options and other compensation (including perquisites, signing bonuses, termination payments, above-market interest paid on deferred compensation). Industry controls include dummies for Consumer Products and Services; Health Care; Hi-Tech and Telecommunications; Manufacturing and Energy; and Others. Controls are based on Fama-French definitions to which we have added Financial Services (SIC 6000-6999).
COMPENSATION CONSULTANTS 37 MURPHY-SANDINO
Table 3 Mediating Effect of the Composition and Complexity of CEO Pay on the Association Between the Use of Compensation Consultants and the Level of CEO Pay
Incentives-to-Total Pay
Ln(# Incentive Types)
Ln(Total Pay)
(1) (2) (3)
Intercept 0.6003***
(10.60) 1.0858***
(12.23) 5.0472***
(32.40)
Firm used consultant 0.0226***
(3.08) 0.0343***
(2.83) 0.0332**
(2.02) Firm used consultant that provided other services
-0.0028 (-0.55)
0.0051 (0.55)
0.0409*** (2.90)
Incentives-to-Total Pay – – 1.3345***
(18.11)
Ln(# Incentive Types) – – 0.4853***
(16.21)
Ln(Revenues)t-1 0.0139**
(2.01) 0.0140 (1.25)
0.1917*** (9.65)
Ratio of Book-to-Market Assetst-1 -0.0810***
(-6.94) -0.0214 (-1.00)
-0.2223*** (-7.80)
Shareholder Returnt-1 0.0000 (0.70)
0.0000 (0.87)
-0.0001*** (-2.63)
New CEO (Dummy) 0.0458***
(6.55) 0.0368***
(3.19) -0.0276 (-1.49)
CEO is Chairman (Dummy) 0.0155**
(2.52) 0.0103 (0.98)
0.0387** (2.22)
CEO is founder (Dummy) -0.0113 (-0.79)
-0.0373 (-1.58)
-0.1108** (-2.60)
Percentage shares owned by CEO -0.1784**
(-2.33) -0.4111***
(-3.05) -0.3601 (-1.61)
Number of Directors on Board -0.0033**
(-2.15) -0.0015 (-0.61)
0.0038 (0.93)
% Independent Directors 0.0612**
(2.42) 0.0479 (1.13)
-0.0258 (-0.41)
% Independent Directors Age 70 or older -0.0268 (-1.20)
-0.0120 (-0.34)
0.1454*** (2.74)
Average # Public Boards for Independent Directors
0.0014 (0.16)
-0.0080 (-0.53)
0.0658*** (2.75)
% Independent Directors appointed after CEO took office
-0.0556***
(-4.73) -0.0560***
(-2.93) 0.3048***
(9.22)
Year/ Firm Effects? Yes /Yes Yes/Yes Yes/ Yes
R2 0.6103 0.5707 0.8859
Note: Sample size is 14,285 for all regressions. Robust t-statistics in parentheses: *, ** and *** denote significance at a 0.10, a 0.05 and a 0.01 level. Standard errors are clustered by firm. Ln(Total Pay) and industry controls are defined in Table 2. # Incentive Types is calculated as one plus the number of different incentive plans.

COMPENSATION CONSULTANTS 38 MURPHY-SANDINO
Table 4 Coefficients of Logistic Regressions Showing the Effect of the Level, Composition and Complexity of CEO Pay on the Firms’ Decision to Use Compensation Consultants the Following Year
Firm will use a consultant in year t+1 (Dummy)
(1) (2) (3)
Intercept -4.1662*** (-5.13)
-4.2178*** (-4.87)
-3.8093*** (-4.31)
Ln(Total Pay) 0.2820***(3.42)
0.2087* (1.71)
0.1860*(1.53)
Incentives-to-Total Pay – -0.4899 (-1.07)
-0.3720 (-0.83)
Ln(# Incentive Types) – 0.8204*** (2.91) –
Pay Includes a Discretionary Bonus (Dummy) – – 0.2196 (1.24)
Pay Includes a Formula-Based Bonus (Dummy) – – 0.3372* (1.75)
Pay Includes Restricted Stock (Dummy) – – 0.2234 (1.36)
Pay Includes Stock Options (Dummy) – – 0.3432**(2.05)
Pay Includes Performance Shares (Dummy) – – 0.5762*** (2.97)
Ln(Revenues) -0.0994(-1.59)
-0.0825 (-1.32)
-0.0901(-1.44)
Ratio of Book-to-Market Assets 0.1514 (0.56)
0.0726 (0.26)
0.0831 (0.30)
Shareholder Return -0.0063 (-0.07)
-0.0102 (-0.11)
0.0049 (0.05)
New CEO (Dummy) 0.2453 (0.81)
0.2862 (0.97)
0.3035 (1.03)
CEO is Chairman (Dummy) 0.0637 (0.38)
0.0581 (0.34)
0.0792 (0.46)
CEO is founder (Dummy) 0.0027(0.01)
0.0079 (0.04)
0.0379(0.20)
Percentage shares owned by CEO -3.8350*** (-2.89)
-3.5335*** (-2.71)
-3.6561*** (-2.81)
Number of Directors on Board 0.0215(0.68)
0.0149 (0.47)
0.0156(0.48)
Number of Directors on Compensation Committee 0.1349* (1.86)
0.1349* (1.82)
0.1299* (1.73)
% Independent Directors 2.6805***(4.82)
2.6465*** (4.80)
2.5808***(4.67)
% Independent Directors Age 70 or older -0.9798***(-3.21)
-0.9595*** (-3.18)
-0.9535***(-3.18)
Average # Public Boards for Independent Directors 0.0968 (0.57)
0.1142 (0.68)
0.1060 (0.63)
% Independent Directors appointed after the CEO took office -0.0372 (-0.14)
0.0204 (0.07)
0.0198 (0.07)
Pseudo R2 0.1287 0.1354 0.1387
Note: The sample includes firms not using consultants over the prior three years (t, t-1 and t-2) or not using consultants on the first year when they appeared in the sample. Sample size is 1,495 for all regressions, which include both industry and year fixed effects. Z-statistics in parentheses; *, ** and *** denote significance at a 0.10, a 0.05 and a 0.01 level. Standard errors are clustered by firm. Ln(Total Pay) and industry controls are defined in Table 2. # Incentive Types is calculated as one plus the number of different incentive plans.

COMPENSATION CONSULTANTS 39 MURPHY-SANDINO
Table 5 Coefficients Showing the Effect of Deviations, Composition and Complexity of CEO Pay on Shareholder Say-on-Pay Voting Outcomes and ISS Voting Recommendations (2010-2014)
Dependent Variables: ISS “For” Say-on-Pay Recommendation
(Dummy) (1) (2) (3) (4) (5) (6)
Intercept 0.9943***
(46.97) 0.9572***
(44.38) 0.9920***
(44.09)
2.8654*** (4.95)
1.9576*** (3.19)
2.6356*** (4.28)
Firm Used Consultant 0.0120* (1.89)
0.0072 (1.17)
0.0039 (0.62)
0.2315 (1.29)
0.1245 (0.71)
0.0386 (0.22)
Residual Ln(Total Pay) -0.0666***
(-11.92) -0.0776***
(-12.76) -0.0777***
(-12.60)
-1.5171*** (-13.69)
-1.6771*** (-15.56)
-1.6743*** (-15.53)
Incentives-to-Total Pay – 0.0027 (0.19)
0.0149 (1.09)
– 0.4432 (1.34)
0.6350* (1.96)
Ln(# Incentive Types) – 0.0561***
(6.66) – –
0.9547*** (4.43)
–
Pay Includes a Discretionary Bonus (Dummy)
– – 0.0010 (0.19)
– – -0.1196 (-0.91)
Pay Includes a Target Bonus (Dummy)
– – 0.0275***
(3.53) – –
0.3816** (2.15)
Pay Includes Restricted Stock (Dummy)
– – 0.0079**
(2.10) – –
0.1865* (1.78)
Pay Includes Stock Options (Dummy)
– – 0.0129***
(3.37) – –
0.2510** (2.53)
Pay Includes Performance Shares (Dummy)
– – 0.0268***
(6.69) – –
0.4775*** (4.56)
Ln(Revenues) -0.0031* (-1.82)
-0.0043** (-2.38)
-0.0056*** (-3.09)
-0.0135 (-0.28)
-0.0435 (-0.88)
-0.0653 (-1.31)
Ratio of Book-to-Market Assets -0.0567***
(-6.57) -0.0565***
(-6.60) -0.0543***
(-6.34)
-0.8438*** (-3.83)
-0.8135*** (-3.63)
-0.7829*** (-3.47)
Shareholder Return 0.0435***
(7.52) 0.0437***
(7.56) 0.0444***
(7.73)
1.5803*** (7.37)
1.5992*** (7.39)
1.6129*** (7.43)
New CEO (Dummy) -0.0212***
(-3.65) -0.0216***
(-3.72) -0.0194***
(-3.34)
-0.1888 (-1.02)
-0.2042 (-1.10)
-0.1328 (-0.71)
CEO is Chairman (Dummy) -0.0085**
(-2.00) -0.0081* (-1.93)
-0.0073* (-1.76)
-0.1272 (-1.20)
-0.1179 (-1.10)
-0.1060 (-0.99)
CEO is founder (Dummy) -0.0156**
(-2.24) -0.0149**
(-2.22) -0.0153**
(-2.28)
-0.1822 (-1.22)
-0.1627 (-1.10)
-0.1665 (-1.12)
Percentage shares owned by the CEO
0.1247** (2.33)
0.1906*** (3.79)
0.1854*** (3.65)
0.7570 (0.66)
1.8803* (1.71)
1.7645 (1.51)
Number of Directors on Board 0.0006 (0.70)
0.0005 (0.57)
0.0004 (0.46)
-0.0255 (-1.21)
-0.0241 (-1.10)
-0.0236 (-1.05)
% Independent Directors -0.0169 (-0.80)
-0.0378* (-1.78)
-0.0491** (-2.31)
1.0631**
(2.03) 0.7431 (1.40)
0.5394 (1.00)
% Independent Directors Age 70 or older
-0.0326*** (-3.32)
-0.0294*** (-3.06)
-0.0271*** (-2.82)
-0.5021**
(-1.99) -0.4199* (-1.68)
-0.3887 (-1.56)
Average # Public Boards for Independent Directors
-0.0035 (-0.70)
-0.0068 (-1.39)
-0.0073 (-1.50)
-0.1911 (-1.51)
-0.2601** (-2.07)
-0.2733** (-2.19)
% Indep. Directors appointed after the CEO took office
-0.0314*** (-4.28)
-0.0296*** (-4.13)
-0.0283*** (-4.01)
-0.7316***
(-3.87) -0.6834***
(-3.60) -0.6480***
(-3.43)
Year/Industry Controls? Yes/Yes Yes/Yes Yes/Yes Yes/Yes Yes/Yes Yes/Yes R2 (Pseudo R in col. 4-6) 0.1584 0.1711 0.1752 0.1540 0.1626 0.1666 N 6,585 6,585 6,585 6,581 6,581 6,581

COMPENSATION CONSULTANTS 40 MURPHY-SANDINO
Note: Columns 1-3 present t-statistics in parentheses from OLS regressions modeling the determinants of the proportion of “votes for” Say on Pay. Columns 4-6 present Z-statistics in parentheses from Logit regressions modeling the likelihood of receiving an ISS “for” Say-on-Pay recommendation. *, ** and *** denote significance at a 0.10, a 0.05 and a 0.01 level. Standard errors are clustered by firm. Ln(Total Pay) and industry controls are defined in Table 2. # Incentive Types is calculated as one plus the number of different incentive plans.

COMPENSATION CONSULTANTS 41 MURPHY-SANDINO
APPENDIX
Table A1 Sample CEOs with annual compensation $12 or less
Company Year CEO Total Pay
Uses Consultant?
APPLE INC 2006 Jobs, Steven P $ 1 Yes
APPLE INC 2007 Jobs, Steven P $ 1 Yes
APPLE INC 2008 Jobs, Steven P $ 1 Yes
APPLE INC 2009 Jobs, Steven P $ 1 Yes
APPLE INC 2010 Jobs, Steven P $ 1 Yes
APPLE INC 2011 Jobs, Steven P $ 1 Yes
CITIGROUP INC 2010 Pandit, PhD, Vikram S $ 1 Yes
KINDER MORGAN INC 2013 Kinder, Richard D $ 1 No
KINDER MORGAN INC 2014 Kinder, Richard D $ 1 No
BIOLASE INC 2013 Pignatelli, Federico $ 1 No
BIOLASE INC 2014 Pignatelli, Federico $ 1 Yes
NATIONAL INSTRUMENTS CORP 2011 Truchard, PhD, James J $ 1 Yes
NATIONAL INSTRUMENTS CORP 2012 Truchard, PhD, James J $ 1 Yes
NATIONAL INSTRUMENTS CORP 2013 Truchard, PhD, James J $ 1 Yes
NATIONAL INSTRUMENTS CORP 2014 Truchard, PhD, James J $ 1 Yes
YAHOO INC 2007 Yang, Chih-Yuan $ 1 Yes
YAHOO INC 2008 Yang, Chih-Yuan $ 1 Yes
TAKE-TWO INTERACTIVE SFTWR 2010 Feder, Ben $ 1 Yes
SALESFORCE.COM INC 2006 Benioff, Marc R $ 10 Yes
SALESFORCE.COM INC 2007 Benioff, Marc R $ 10 Yes
ALPHABET INC 2011 Page, Lawrence Edward $ 1 No
ALPHABET INC 2012 Page, Lawrence Edward $ 1 No
ALPHABET INC 2013 Page, Lawrence Edward $ 1 No
ALPHABET INC 2014 Page, Lawrence Edward $ 1 No
DREAMWORKS ANIMATION INC 2006 Katzenberg, Jeffrey $ 1 Yes
DREAMWORKS ANIMATION INC 2008 Katzenberg, Jeffrey $ 1 Yes
Note: We include in this list CEOs who received less than one dollar per month in total compensation for the year. These firm-year outliers had a significant effect on the results reported in Tables 2 and 3 of this paper. Accordingly, they were excluded from all of our regression analyses.