Compensation Consultant Analysis - Audit · PDF fileCompensation Consultant Analysis 3 Figure...
14
August 2008 Compensation Consultant Analysis Briefing
Transcript of Compensation Consultant Analysis - Audit · PDF fileCompensation Consultant Analysis 3 Figure...
August 2008
Compensation Consultant AnalysisBriefing
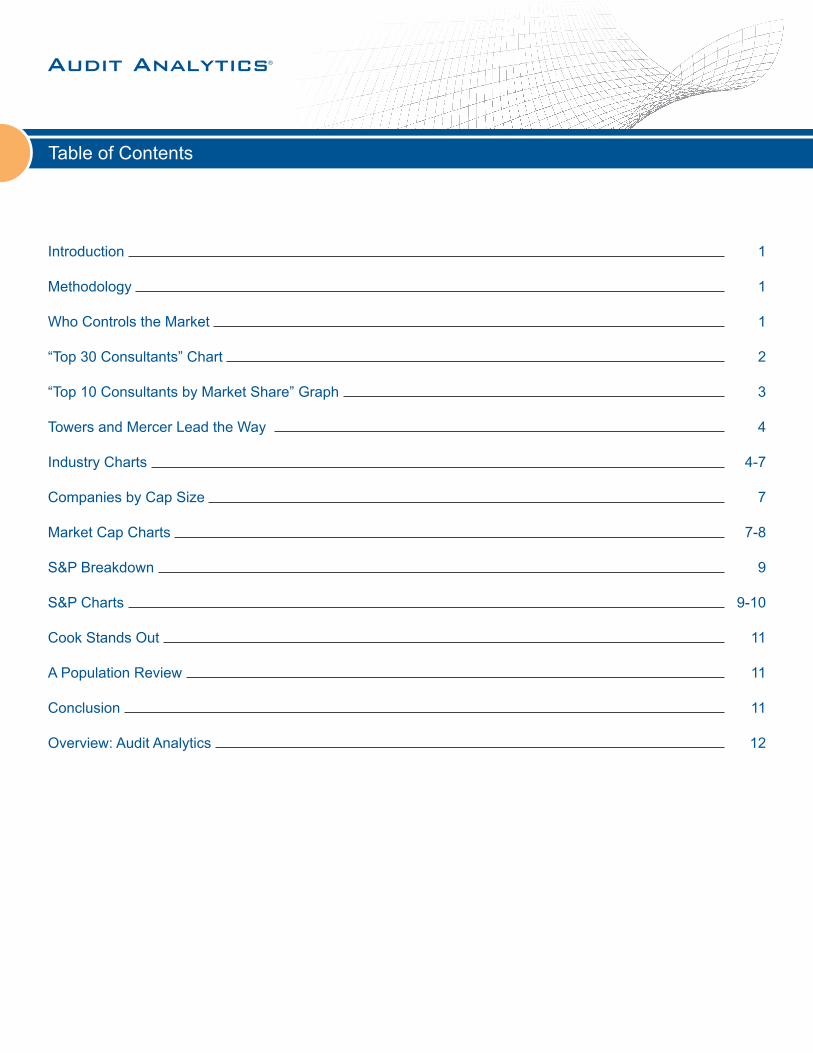
Introduction 1
Methodology 1
Who Controls the Market 1
“Top 30 Consultants” Chart 2
“Top 10 Consultants by Market Share” Graph 3
Towers and Mercer Lead the Way 4
Industry Charts 4-7
Companies by Cap Size 7
Market Cap Charts 7-8
S&P Breakdown 9
S&P Charts 9-10
Cook Stands Out 11
A Population Review 11
Conclusion 11
Overview: Audit Analytics 12
Table of Contents
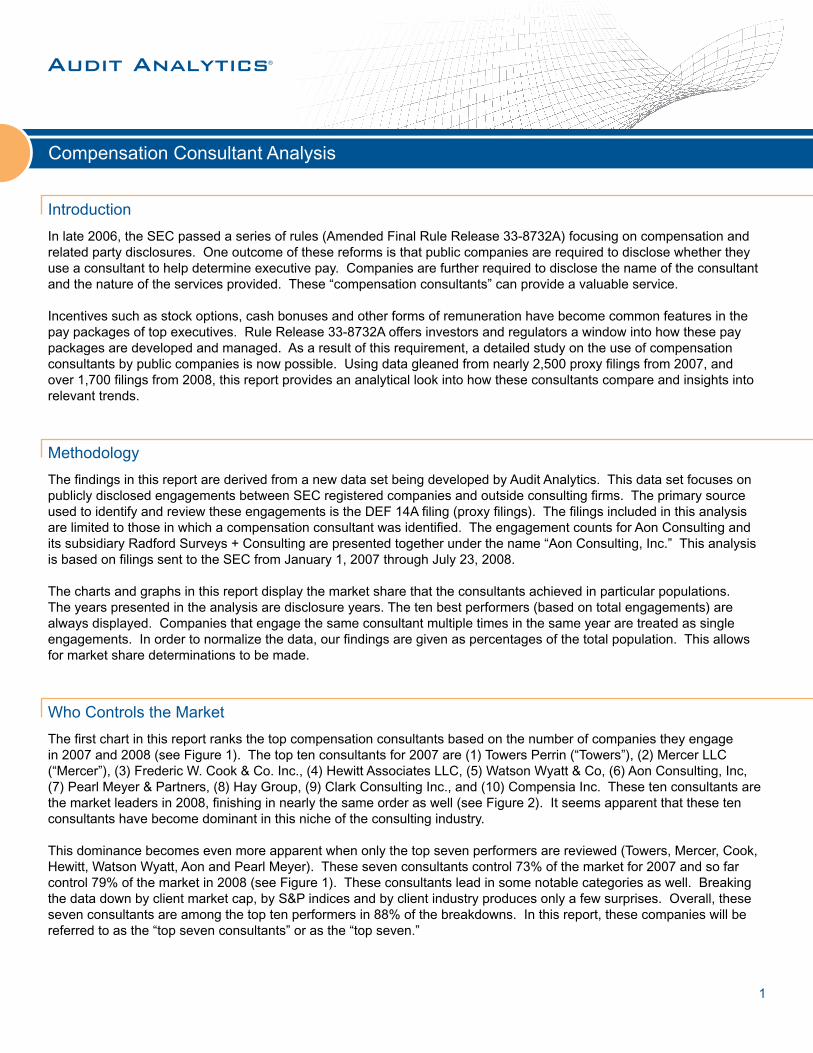
In late 2006, the SEC passed a series of rules (Amended Final Rule Release 33-8732A) focusing on compensation and related party disclosures. One outcome of these reforms is that public companies are required to disclose whether they use a consultant to help determine executive pay. Companies are further required to disclose the name of the consultant and the nature of the services provided. These “compensation consultants” can provide a valuable service.
Incentives such as stock options, cash bonuses and other forms of remuneration have become common features in the pay packages of top executives. Rule Release 33-8732A offers investors and regulators a window into how these pay packages are developed and managed. As a result of this requirement, a detailed study on the use of compensation consultants by public companies is now possible. Using data gleaned from nearly 2,500 proxy filings from 2007, and over 1,700 filings from 2008, this report provides an analytical look into how these consultants compare and insights into relevant trends.
The findings in this report are derived from a new data set being developed by Audit Analytics. This data set focuses on publicly disclosed engagements between SEC registered companies and outside consulting firms. The primary source used to identify and review these engagements is the DEF 14A filing (proxy filings). The filings included in this analysis are limited to those in which a compensation consultant was identified. The engagement counts for Aon Consulting and its subsidiary Radford Surveys + Consulting are presented together under the name “Aon Consulting, Inc.” This analysis is based on filings sent to the SEC from January 1, 2007 through July 23, 2008.
The charts and graphs in this report display the market share that the consultants achieved in particular populations. The years presented in the analysis are disclosure years. The ten best performers (based on total engagements) are always displayed. Companies that engage the same consultant multiple times in the same year are treated as single engagements. In order to normalize the data, our findings are given as percentages of the total population. This allows for market share determinations to be made.
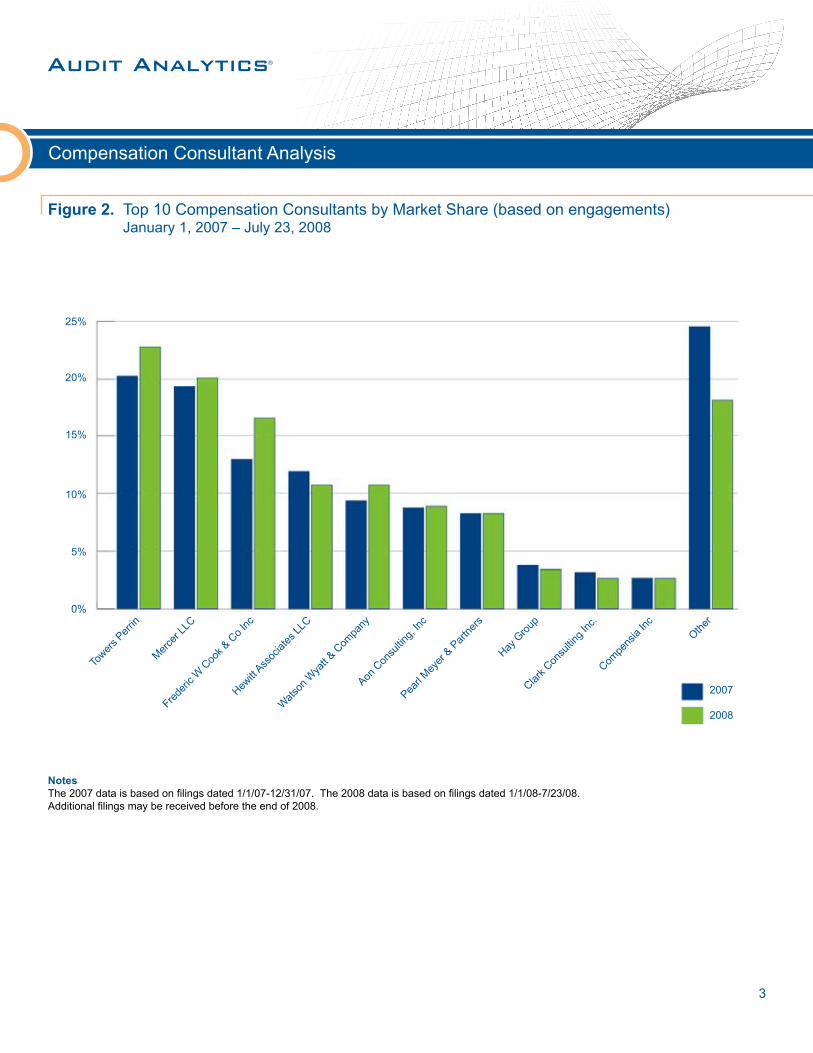
The first chart in this report ranks the top compensation consultants based on the number of companies they engage in 2007 and 2008 (see Figure 1). The top ten consultants for 2007 are (1) Towers Perrin (“Towers”), (2) Mercer LLC (“Mercer”), (3) Frederic W. Cook & Co. Inc., (4) Hewitt Associates LLC, (5) Watson Wyatt & Co, (6) Aon Consulting, Inc, (7) Pearl Meyer & Partners, (8) Hay Group, (9) Clark Consulting Inc., and (10) Compensia Inc. These ten consultants are the market leaders in 2008, finishing in nearly the same order as well (see Figure 2). It seems apparent that these ten consultants have become dominant in this niche of the consulting industry.
This dominance becomes even more apparent when only the top seven performers are reviewed (Towers, Mercer, Cook, Hewitt, Watson Wyatt, Aon and Pearl Meyer). These seven consultants control 73% of the market for 2007 and so far control 79% of the market in 2008 (see Figure 1). These consultants lead in some notable categories as well. Breaking the data down by client market cap, by S&P indices and by client industry produces only a few surprises. Overall, these seven consultants are among the top ten performers in 88% of the breakdowns. In this report, these companies will be referred to as the “top seven consultants” or as the “top seven.”
Compensation Consultant Analysis
1
Introduction
Methodology
Who Controls the Market
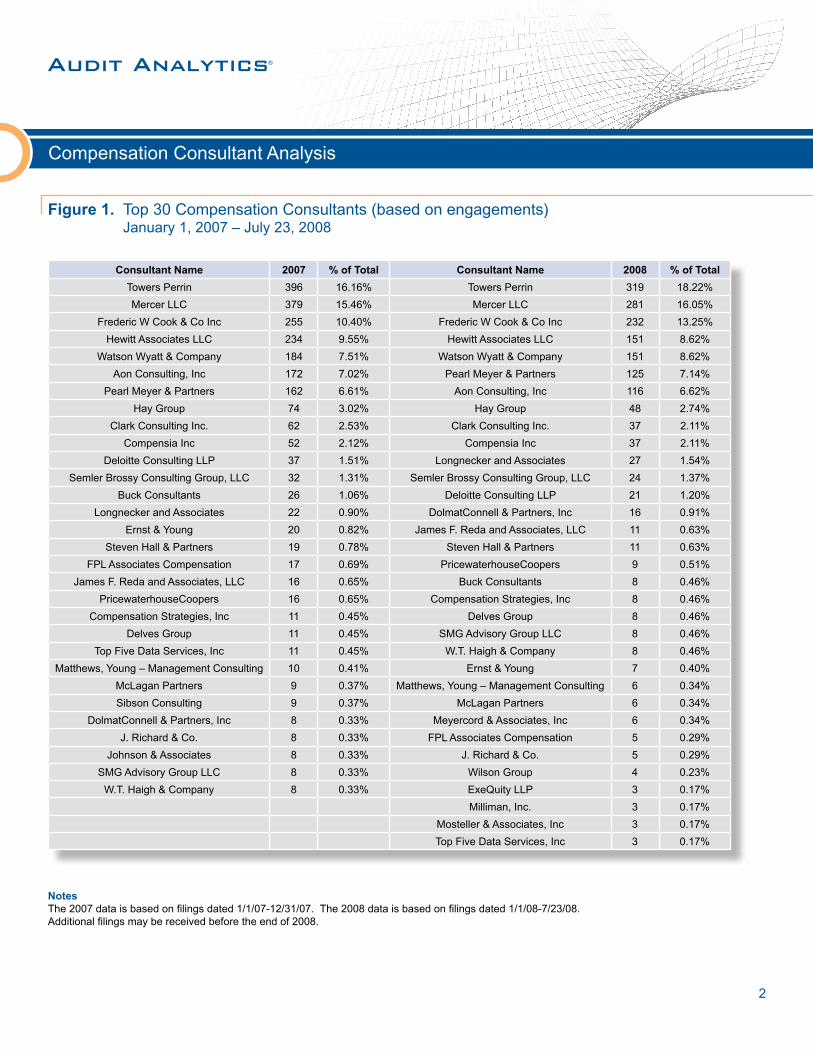
NotesThe 2007 data is based on filings dated 1/1/07-12/31/07. The 2008 data is based on filings dated 1/1/08-7/23/08. Additional filings may be received before the end of 2008.
Compensation Consultant Analysis
2
Consultant Name 2007 % of Total Consultant Name 2008 % of Total
Towers Perrin 396 16.16% Towers Perrin 319 18.22%
Mercer LLC 379 15.46% Mercer LLC 281 16.05%
Frederic W Cook & Co Inc 255 10.40% Frederic W Cook & Co Inc 232 13.25%
Hewitt Associates LLC 234 9.55% Hewitt Associates LLC 151 8.62%
Watson Wyatt & Company 184 7.51% Watson Wyatt & Company 151 8.62%
Aon Consulting, Inc 172 7.02% Pearl Meyer & Partners 125 7.14%
Pearl Meyer & Partners 162 6.61% Aon Consulting, Inc 116 6.62%
Hay Group 74 3.02% Hay Group 48 2.74%
Clark Consulting Inc. 62 2.53% Clark Consulting Inc. 37 2.11%
Compensia Inc 52 2.12% Compensia Inc 37 2.11%
Deloitte Consulting LLP 37 1.51% Longnecker and Associates 27 1.54%
Semler Brossy Consulting Group, LLC 32 1.31% Semler Brossy Consulting Group, LLC 24 1.37%
Buck Consultants 26 1.06% Deloitte Consulting LLP 21 1.20%
Longnecker and Associates 22 0.90% DolmatConnell & Partners, Inc 16 0.91%
Ernst & Young 20 0.82% James F. Reda and Associates, LLC 11 0.63%
Steven Hall & Partners 19 0.78% Steven Hall & Partners 11 0.63%
FPL Associates Compensation 17 0.69% PricewaterhouseCoopers 9 0.51%
James F. Reda and Associates, LLC 16 0.65% Buck Consultants 8 0.46%
PricewaterhouseCoopers 16 0.65% Compensation Strategies, Inc 8 0.46%
Compensation Strategies, Inc 11 0.45% Delves Group 8 0.46%
Delves Group 11 0.45% SMG Advisory Group LLC 8 0.46%
Top Five Data Services, Inc 11 0.45% W.T. Haigh & Company 8 0.46%
Matthews, Young – Management Consulting 10 0.41% Ernst & Young 7 0.40%
McLagan Partners 9 0.37% Matthews, Young – Management Consulting 6 0.34%
Sibson Consulting 9 0.37% McLagan Partners 6 0.34%
DolmatConnell & Partners, Inc 8 0.33% Meyercord & Associates, Inc 6 0.34%
J. Richard & Co. 8 0.33% FPL Associates Compensation 5 0.29%
Johnson & Associates 8 0.33% J. Richard & Co. 5 0.29%
SMG Advisory Group LLC 8 0.33% Wilson Group 4 0.23%
W.T. Haigh & Company 8 0.33% ExeQuity LLP 3 0.17%
Milliman, Inc. 3 0.17%
Mosteller & Associates, Inc 3 0.17%
Top Five Data Services, Inc 3 0.17%
Figure 1. Top 30 Compensation Consultants (based on engagements) January 1, 2007 – July 23, 2008
Compensation Consultant Analysis
3
Figure 2. Top 10 Compensation Consultants by Market Share (based on engagements) January 1, 2007 – July 23, 2008
NotesThe 2007 data is based on filings dated 1/1/07-12/31/07. The 2008 data is based on filings dated 1/1/08-7/23/08. Additional filings may be received before the end of 2008.
25%
20%
15%
10%
5%
0%
Tower
s Per
rin
Mer
cer L
LC
Frede
ric W
Coo
k & C
o In
c
Hewitt
Assoc
iates
LLC
Wat
son
Wya
tt & C
ompa
ny
Aon C
onsu
lting,
Inc
Pearl
Mey
er &
Par
tner
s
Hay G
roup
Clark C
onsu
lting
Inc.
Compe
nsia
Inc
Other
2007
2008
Compensation Consultant Analysis
4
Towers and Mercer Lead the Way
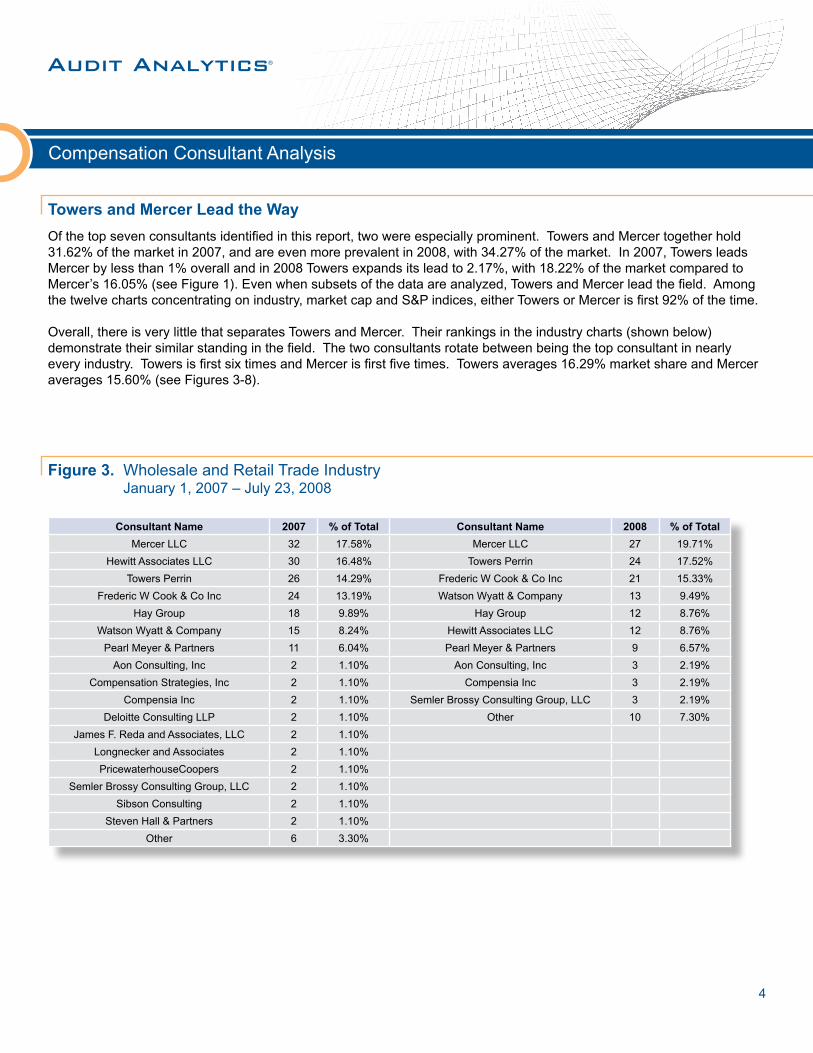
Figure 3. Wholesale and Retail Trade Industry January 1, 2007 – July 23, 2008
Of the top seven consultants identified in this report, two were especially prominent. Towers and Mercer together hold 31.62% of the market in 2007, and are even more prevalent in 2008, with 34.27% of the market. In 2007, Towers leads Mercer by less than 1% overall and in 2008 Towers expands its lead to 2.17%, with 18.22% of the market compared to Mercer’s 16.05% (see Figure 1). Even when subsets of the data are analyzed, Towers and Mercer lead the field. Among the twelve charts concentrating on industry, market cap and S&P indices, either Towers or Mercer is first 92% of the time.
Overall, there is very little that separates Towers and Mercer. Their rankings in the industry charts (shown below) demonstrate their similar standing in the field. The two consultants rotate between being the top consultant in nearly every industry. Towers is first six times and Mercer is first five times. Towers averages 16.29% market share and Mercer averages 15.60% (see Figures 3-8).
Consultant Name 2007 % of Total Consultant Name 2008 % of Total
Mercer LLC 32 17.58% Mercer LLC 27 19.71%
Hewitt Associates LLC 30 16.48% Towers Perrin 24 17.52%
Towers Perrin 26 14.29% Frederic W Cook & Co Inc 21 15.33%
Frederic W Cook & Co Inc 24 13.19% Watson Wyatt & Company 13 9.49%
Hay Group 18 9.89% Hay Group 12 8.76%
Watson Wyatt & Company 15 8.24% Hewitt Associates LLC 12 8.76%
Pearl Meyer & Partners 11 6.04% Pearl Meyer & Partners 9 6.57%
Aon Consulting, Inc 2 1.10% Aon Consulting, Inc 3 2.19%
Compensation Strategies, Inc 2 1.10% Compensia Inc 3 2.19%
Compensia Inc 2 1.10% Semler Brossy Consulting Group, LLC 3 2.19%
Deloitte Consulting LLP 2 1.10% Other 10 7.30%
James F. Reda and Associates, LLC 2 1.10%
Longnecker and Associates 2 1.10%
PricewaterhouseCoopers 2 1.10%
Semler Brossy Consulting Group, LLC 2 1.10%
Sibson Consulting 2 1.10%
Steven Hall & Partners 2 1.10%
Other 6 3.30%
Compensation Consultant Analysis
5
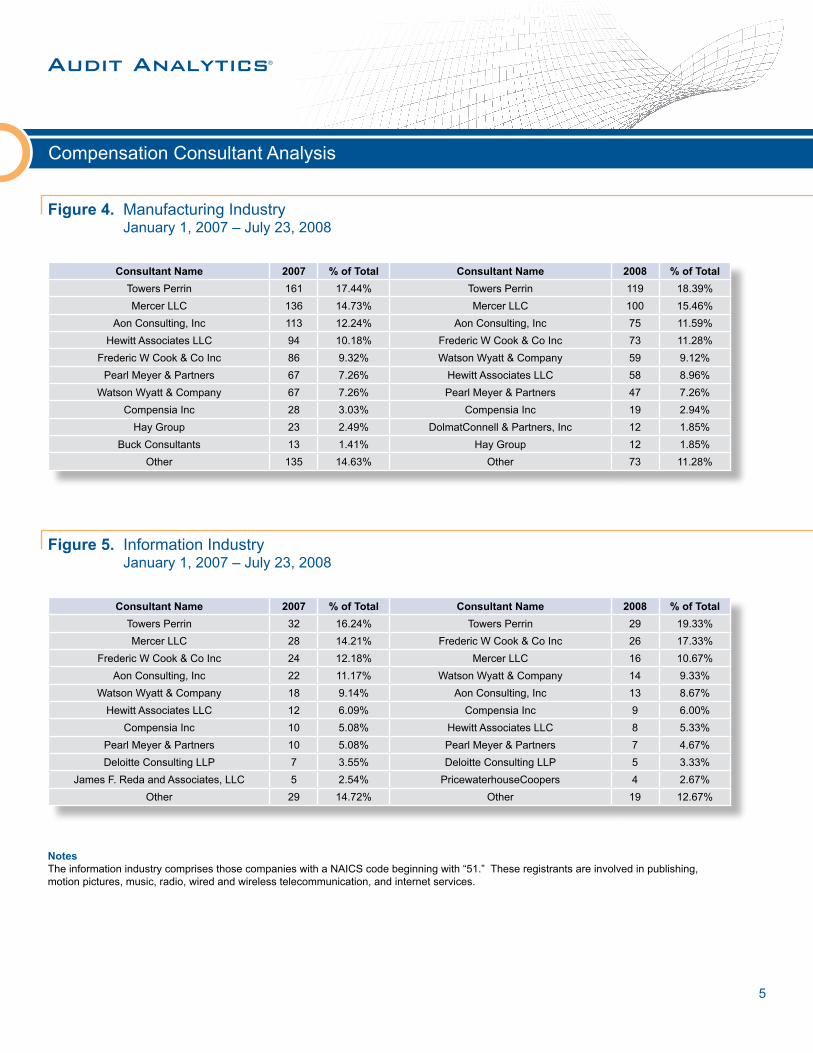
Figure 4. Manufacturing Industry January 1, 2007 – July 23, 2008
Figure 5. Information Industry January 1, 2007 – July 23, 2008
Consultant Name 2007 % of Total Consultant Name 2008 % of Total
Towers Perrin 161 17.44% Towers Perrin 119 18.39%
Mercer LLC 136 14.73% Mercer LLC 100 15.46%
Aon Consulting, Inc 113 12.24% Aon Consulting, Inc 75 11.59%
Hewitt Associates LLC 94 10.18% Frederic W Cook & Co Inc 73 11.28%
Frederic W Cook & Co Inc 86 9.32% Watson Wyatt & Company 59 9.12%
Pearl Meyer & Partners 67 7.26% Hewitt Associates LLC 58 8.96%
Watson Wyatt & Company 67 7.26% Pearl Meyer & Partners 47 7.26%
Compensia Inc 28 3.03% Compensia Inc 19 2.94%
Hay Group 23 2.49% DolmatConnell & Partners, Inc 12 1.85%
Buck Consultants 13 1.41% Hay Group 12 1.85%
Other 135 14.63% Other 73 11.28%
Consultant Name 2007 % of Total Consultant Name 2008 % of Total
Towers Perrin 32 16.24% Towers Perrin 29 19.33%
Mercer LLC 28 14.21% Frederic W Cook & Co Inc 26 17.33%
Frederic W Cook & Co Inc 24 12.18% Mercer LLC 16 10.67%
Aon Consulting, Inc 22 11.17% Watson Wyatt & Company 14 9.33%
Watson Wyatt & Company 18 9.14% Aon Consulting, Inc 13 8.67%
Hewitt Associates LLC 12 6.09% Compensia Inc 9 6.00%
Compensia Inc 10 5.08% Hewitt Associates LLC 8 5.33%
Pearl Meyer & Partners 10 5.08% Pearl Meyer & Partners 7 4.67%
Deloitte Consulting LLP 7 3.55% Deloitte Consulting LLP 5 3.33%
James F. Reda and Associates, LLC 5 2.54% PricewaterhouseCoopers 4 2.67%
Other 29 14.72% Other 19 12.67%
NotesThe information industry comprises those companies with a NAICS code beginning with “51.” These registrants are involved in publishing, motion pictures, music, radio, wired and wireless telecommunication, and internet services.
Compensation Consultant Analysis
6
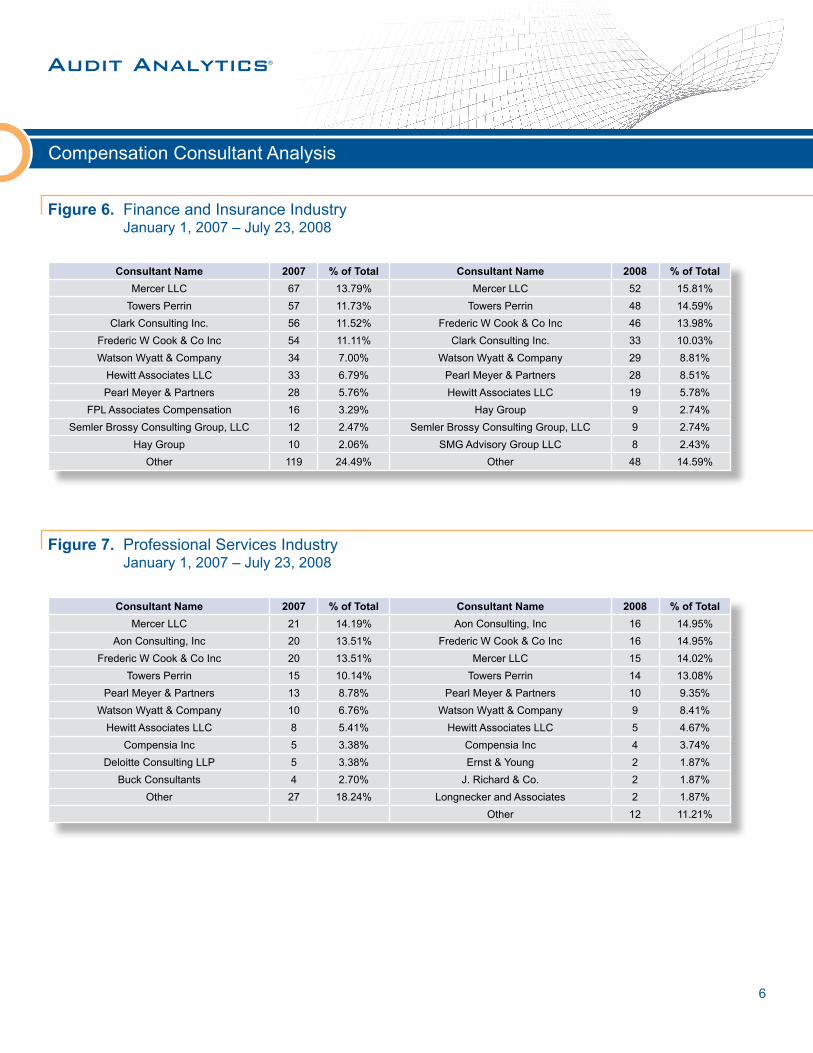
Figure 6. Finance and Insurance Industry January 1, 2007 – July 23, 2008
Figure 7. Professional Services Industry January 1, 2007 – July 23, 2008
Consultant Name 2007 % of Total Consultant Name 2008 % of Total
Mercer LLC 67 13.79% Mercer LLC 52 15.81%
Towers Perrin 57 11.73% Towers Perrin 48 14.59%
Clark Consulting Inc. 56 11.52% Frederic W Cook & Co Inc 46 13.98%
Frederic W Cook & Co Inc 54 11.11% Clark Consulting Inc. 33 10.03%
Watson Wyatt & Company 34 7.00% Watson Wyatt & Company 29 8.81%
Hewitt Associates LLC 33 6.79% Pearl Meyer & Partners 28 8.51%
Pearl Meyer & Partners 28 5.76% Hewitt Associates LLC 19 5.78%
FPL Associates Compensation 16 3.29% Hay Group 9 2.74%
Semler Brossy Consulting Group, LLC 12 2.47% Semler Brossy Consulting Group, LLC 9 2.74%
Hay Group 10 2.06% SMG Advisory Group LLC 8 2.43%
Other 119 24.49% Other 48 14.59%
Consultant Name 2007 % of Total Consultant Name 2008 % of Total
Mercer LLC 21 14.19% Aon Consulting, Inc 16 14.95%
Aon Consulting, Inc 20 13.51% Frederic W Cook & Co Inc 16 14.95%
Frederic W Cook & Co Inc 20 13.51% Mercer LLC 15 14.02%
Towers Perrin 15 10.14% Towers Perrin 14 13.08%
Pearl Meyer & Partners 13 8.78% Pearl Meyer & Partners 10 9.35%
Watson Wyatt & Company 10 6.76% Watson Wyatt & Company 9 8.41%
Hewitt Associates LLC 8 5.41% Hewitt Associates LLC 5 4.67%
Compensia Inc 5 3.38% Compensia Inc 4 3.74%
Deloitte Consulting LLP 5 3.38% Ernst & Young 2 1.87%
Buck Consultants 4 2.70% J. Richard & Co. 2 1.87%
Other 27 18.24% Longnecker and Associates 2 1.87%
Other 12 11.21%
Compensation Consultant Analysis
7
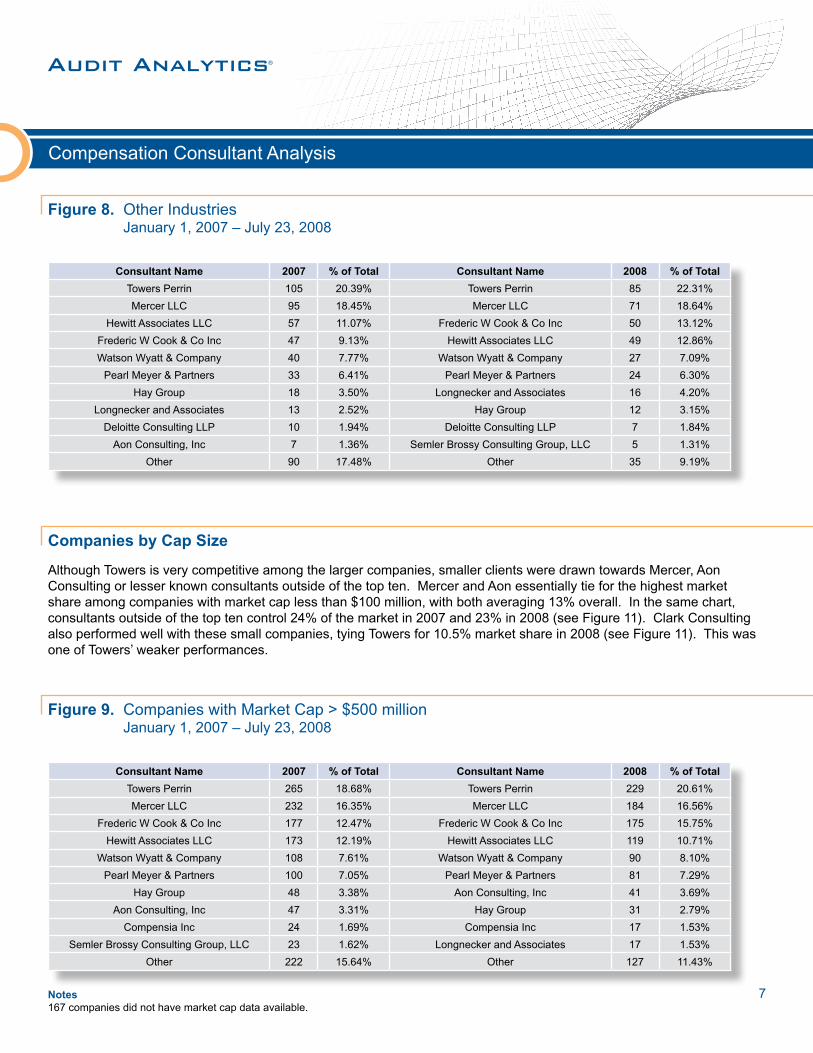
Figure 8. Other Industries January 1, 2007 – July 23, 2008
Figure 9. Companies with Market Cap > $500 million January 1, 2007 – July 23, 2008
Companies by Cap Size
Consultant Name 2007 % of Total Consultant Name 2008 % of Total
Towers Perrin 105 20.39% Towers Perrin 85 22.31%
Mercer LLC 95 18.45% Mercer LLC 71 18.64%
Hewitt Associates LLC 57 11.07% Frederic W Cook & Co Inc 50 13.12%
Frederic W Cook & Co Inc 47 9.13% Hewitt Associates LLC 49 12.86%
Watson Wyatt & Company 40 7.77% Watson Wyatt & Company 27 7.09%
Pearl Meyer & Partners 33 6.41% Pearl Meyer & Partners 24 6.30%
Hay Group 18 3.50% Longnecker and Associates 16 4.20%
Longnecker and Associates 13 2.52% Hay Group 12 3.15%
Deloitte Consulting LLP 10 1.94% Deloitte Consulting LLP 7 1.84%
Aon Consulting, Inc 7 1.36% Semler Brossy Consulting Group, LLC 5 1.31%
Other 90 17.48% Other 35 9.19%
Consultant Name 2007 % of Total Consultant Name 2008 % of Total
Towers Perrin 265 18.68% Towers Perrin 229 20.61%
Mercer LLC 232 16.35% Mercer LLC 184 16.56%
Frederic W Cook & Co Inc 177 12.47% Frederic W Cook & Co Inc 175 15.75%
Hewitt Associates LLC 173 12.19% Hewitt Associates LLC 119 10.71%
Watson Wyatt & Company 108 7.61% Watson Wyatt & Company 90 8.10%
Pearl Meyer & Partners 100 7.05% Pearl Meyer & Partners 81 7.29%
Hay Group 48 3.38% Aon Consulting, Inc 41 3.69%
Aon Consulting, Inc 47 3.31% Hay Group 31 2.79%
Compensia Inc 24 1.69% Compensia Inc 17 1.53%
Semler Brossy Consulting Group, LLC 23 1.62% Longnecker and Associates 17 1.53%
Other 222 15.64% Other 127 11.43%
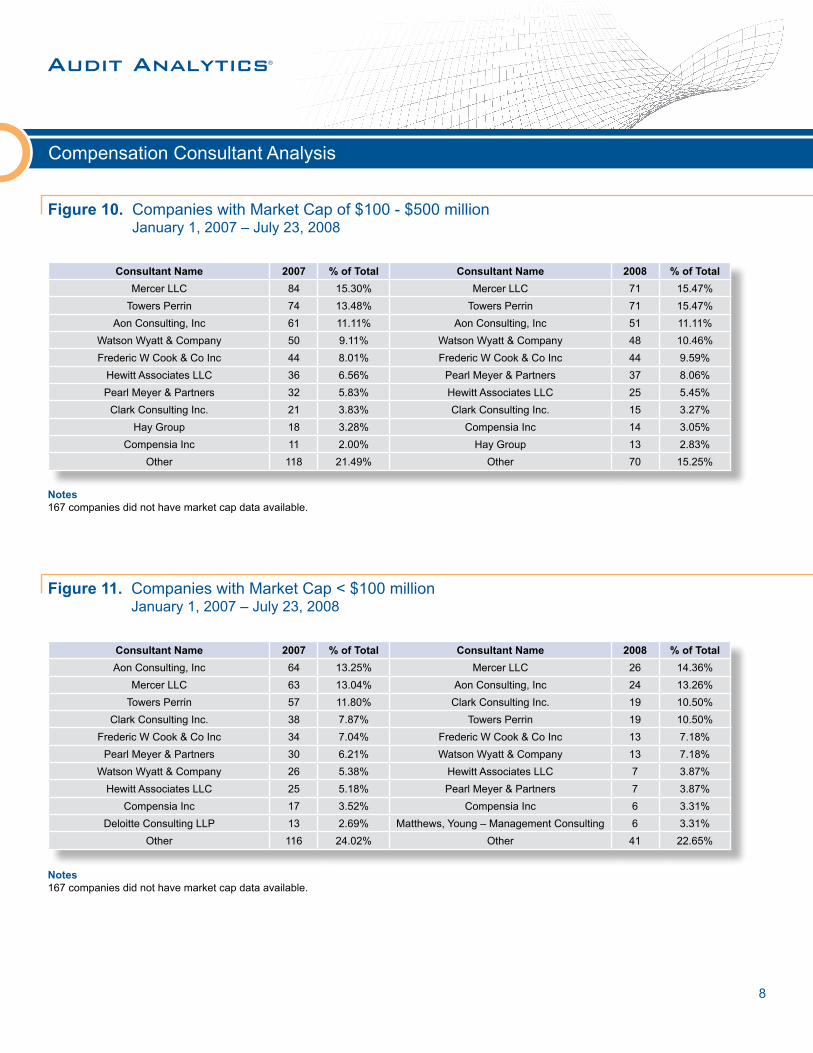
Although Towers is very competitive among the larger companies, smaller clients were drawn towards Mercer, Aon Consulting or lesser known consultants outside of the top ten. Mercer and Aon essentially tie for the highest market share among companies with market cap less than $100 million, with both averaging 13% overall. In the same chart, consultants outside of the top ten control 24% of the market in 2007 and 23% in 2008 (see Figure 11). Clark Consulting also performed well with these small companies, tying Towers for 10.5% market share in 2008 (see Figure 11). This was one of Towers’ weaker performances.
Notes167 companies did not have market cap data available.
Compensation Consultant Analysis
8
Figure 10. Companies with Market Cap of $100 - $500 million January 1, 2007 – July 23, 2008
Figure 11. Companies with Market Cap < $100 million January 1, 2007 – July 23, 2008
Consultant Name 2007 % of Total Consultant Name 2008 % of Total
Mercer LLC 84 15.30% Mercer LLC 71 15.47%
Towers Perrin 74 13.48% Towers Perrin 71 15.47%
Aon Consulting, Inc 61 11.11% Aon Consulting, Inc 51 11.11%
Watson Wyatt & Company 50 9.11% Watson Wyatt & Company 48 10.46%
Frederic W Cook & Co Inc 44 8.01% Frederic W Cook & Co Inc 44 9.59%
Hewitt Associates LLC 36 6.56% Pearl Meyer & Partners 37 8.06%
Pearl Meyer & Partners 32 5.83% Hewitt Associates LLC 25 5.45%
Clark Consulting Inc. 21 3.83% Clark Consulting Inc. 15 3.27%
Hay Group 18 3.28% Compensia Inc 14 3.05%
Compensia Inc 11 2.00% Hay Group 13 2.83%
Other 118 21.49% Other 70 15.25%
Consultant Name 2007 % of Total Consultant Name 2008 % of Total
Aon Consulting, Inc 64 13.25% Mercer LLC 26 14.36%
Mercer LLC 63 13.04% Aon Consulting, Inc 24 13.26%
Towers Perrin 57 11.80% Clark Consulting Inc. 19 10.50%
Clark Consulting Inc. 38 7.87% Towers Perrin 19 10.50%
Frederic W Cook & Co Inc 34 7.04% Frederic W Cook & Co Inc 13 7.18%
Pearl Meyer & Partners 30 6.21% Watson Wyatt & Company 13 7.18%
Watson Wyatt & Company 26 5.38% Hewitt Associates LLC 7 3.87%
Hewitt Associates LLC 25 5.18% Pearl Meyer & Partners 7 3.87%
Compensia Inc 17 3.52% Compensia Inc 6 3.31%
Deloitte Consulting LLP 13 2.69% Matthews, Young – Management Consulting 6 3.31%
Other 116 24.02% Other 41 22.65%
Notes167 companies did not have market cap data available.
Notes167 companies did not have market cap data available.
Compensation Consultant Analysis
9
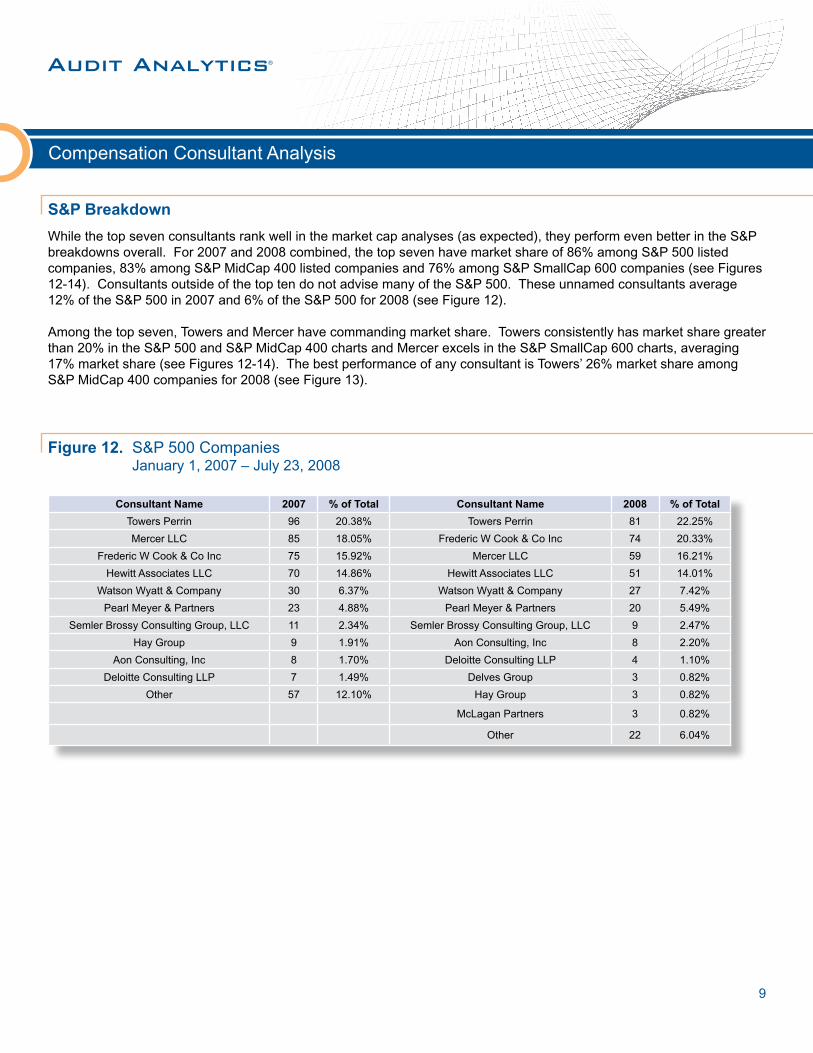
S&P Breakdown
Figure 12. S&P 500 Companies January 1, 2007 – July 23, 2008
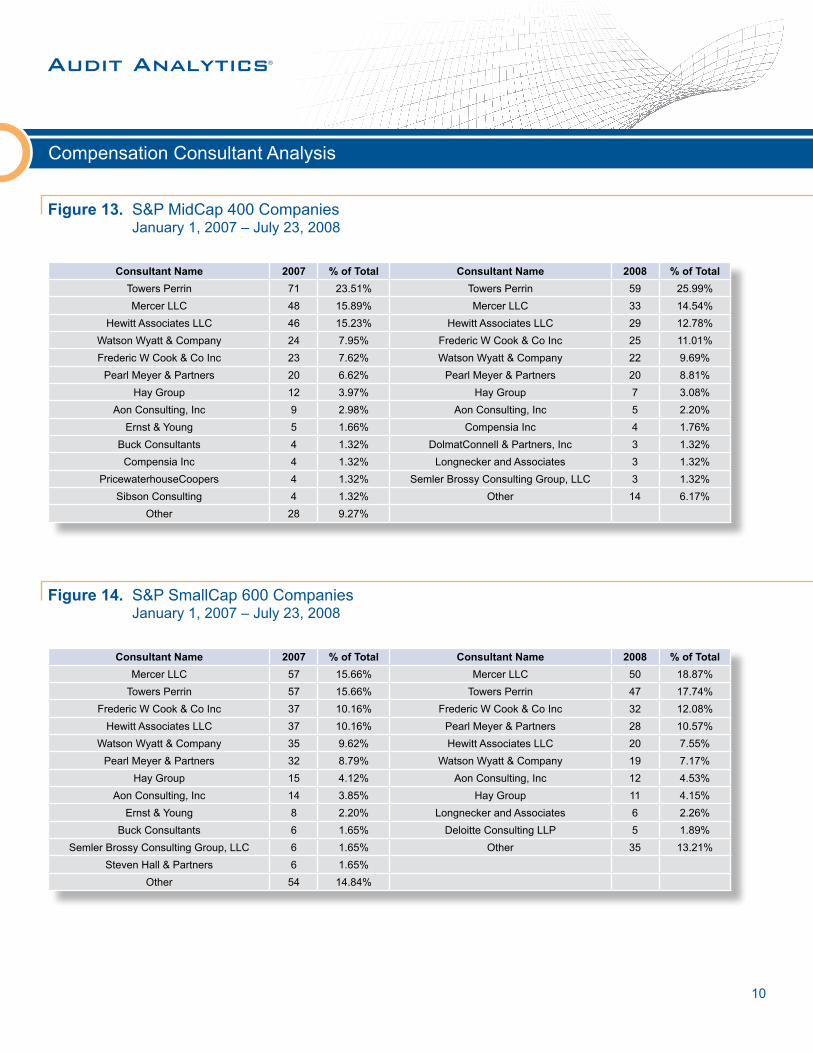
While the top seven consultants rank well in the market cap analyses (as expected), they perform even better in the S&P breakdowns overall. For 2007 and 2008 combined, the top seven have market share of 86% among S&P 500 listed companies, 83% among S&P MidCap 400 listed companies and 76% among S&P SmallCap 600 companies (see Figures 12-14). Consultants outside of the top ten do not advise many of the S&P 500. These unnamed consultants average 12% of the S&P 500 in 2007 and 6% of the S&P 500 for 2008 (see Figure 12).
Among the top seven, Towers and Mercer have commanding market share. Towers consistently has market share greater than 20% in the S&P 500 and S&P MidCap 400 charts and Mercer excels in the S&P SmallCap 600 charts, averaging 17% market share (see Figures 12-14). The best performance of any consultant is Towers’ 26% market share among S&P MidCap 400 companies for 2008 (see Figure 13).
Consultant Name 2007 % of Total Consultant Name 2008 % of Total
Towers Perrin 96 20.38% Towers Perrin 81 22.25%
Mercer LLC 85 18.05% Frederic W Cook & Co Inc 74 20.33%
Frederic W Cook & Co Inc 75 15.92% Mercer LLC 59 16.21%
Hewitt Associates LLC 70 14.86% Hewitt Associates LLC 51 14.01%
Watson Wyatt & Company 30 6.37% Watson Wyatt & Company 27 7.42%
Pearl Meyer & Partners 23 4.88% Pearl Meyer & Partners 20 5.49%
Semler Brossy Consulting Group, LLC 11 2.34% Semler Brossy Consulting Group, LLC 9 2.47%
Hay Group 9 1.91% Aon Consulting, Inc 8 2.20%
Aon Consulting, Inc 8 1.70% Deloitte Consulting LLP 4 1.10%
Deloitte Consulting LLP 7 1.49% Delves Group 3 0.82%
Other 57 12.10% Hay Group 3 0.82%
McLagan Partners 3 0.82%
Other 22 6.04%
Compensation Consultant Analysis
10
Figure 13. S&P MidCap 400 Companies January 1, 2007 – July 23, 2008
Figure 14. S&P SmallCap 600 Companies January 1, 2007 – July 23, 2008
Consultant Name 2007 % of Total Consultant Name 2008 % of Total
Towers Perrin 71 23.51% Towers Perrin 59 25.99%
Mercer LLC 48 15.89% Mercer LLC 33 14.54%
Hewitt Associates LLC 46 15.23% Hewitt Associates LLC 29 12.78%
Watson Wyatt & Company 24 7.95% Frederic W Cook & Co Inc 25 11.01%
Frederic W Cook & Co Inc 23 7.62% Watson Wyatt & Company 22 9.69%
Pearl Meyer & Partners 20 6.62% Pearl Meyer & Partners 20 8.81%
Hay Group 12 3.97% Hay Group 7 3.08%
Aon Consulting, Inc 9 2.98% Aon Consulting, Inc 5 2.20%
Ernst & Young 5 1.66% Compensia Inc 4 1.76%
Buck Consultants 4 1.32% DolmatConnell & Partners, Inc 3 1.32%
Compensia Inc 4 1.32% Longnecker and Associates 3 1.32%
PricewaterhouseCoopers 4 1.32% Semler Brossy Consulting Group, LLC 3 1.32%
Sibson Consulting 4 1.32% Other 14 6.17%
Other 28 9.27%
Consultant Name 2007 % of Total Consultant Name 2008 % of Total
Mercer LLC 57 15.66% Mercer LLC 50 18.87%
Towers Perrin 57 15.66% Towers Perrin 47 17.74%
Frederic W Cook & Co Inc 37 10.16% Frederic W Cook & Co Inc 32 12.08%
Hewitt Associates LLC 37 10.16% Pearl Meyer & Partners 28 10.57%
Watson Wyatt & Company 35 9.62% Hewitt Associates LLC 20 7.55%
Pearl Meyer & Partners 32 8.79% Watson Wyatt & Company 19 7.17%
Hay Group 15 4.12% Aon Consulting, Inc 12 4.53%
Aon Consulting, Inc 14 3.85% Hay Group 11 4.15%
Ernst & Young 8 2.20% Longnecker and Associates 6 2.26%
Buck Consultants 6 1.65% Deloitte Consulting LLP 5 1.89%
Semler Brossy Consulting Group, LLC 6 1.65% Other 35 13.21%
Steven Hall & Partners 6 1.65%
Other 54 14.84%
Compensation Consultant Analysis
11
Cook Stands Out
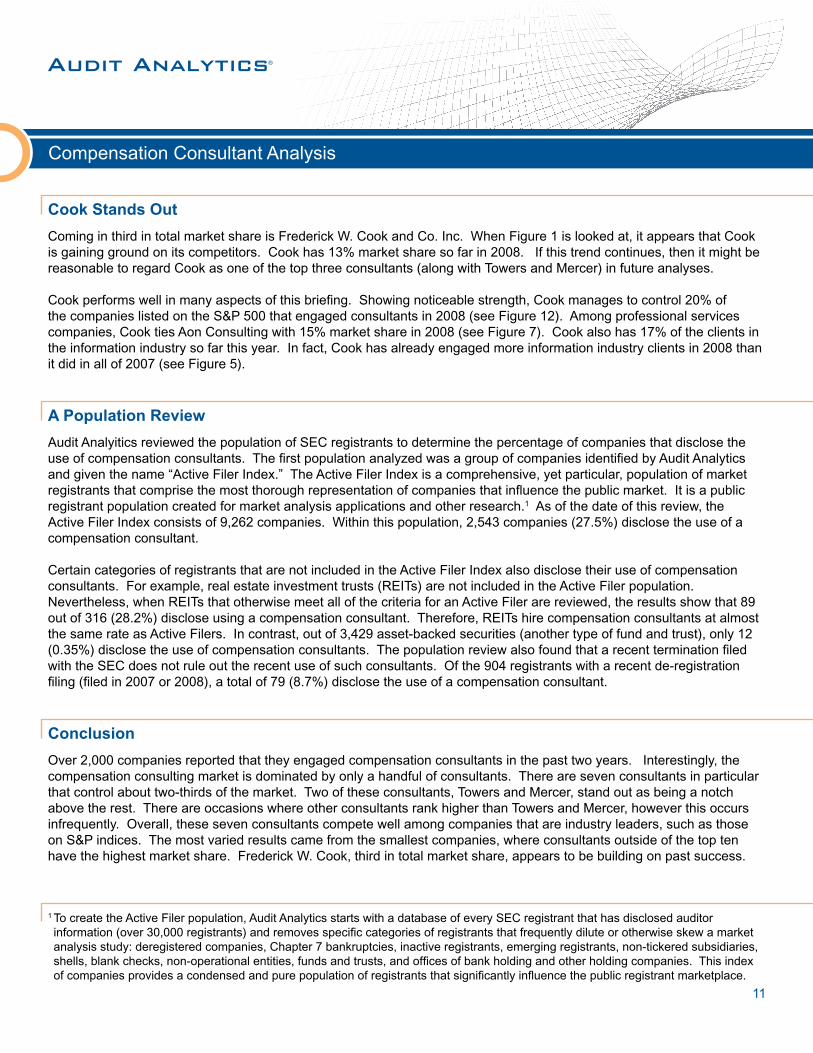
Coming in third in total market share is Frederick W. Cook and Co. Inc. When Figure 1 is looked at, it appears that Cook is gaining ground on its competitors. Cook has 13% market share so far in 2008. If this trend continues, then it might be reasonable to regard Cook as one of the top three consultants (along with Towers and Mercer) in future analyses.
Cook performs well in many aspects of this briefing. Showing noticeable strength, Cook manages to control 20% of the companies listed on the S&P 500 that engaged consultants in 2008 (see Figure 12). Among professional services companies, Cook ties Aon Consulting with 15% market share in 2008 (see Figure 7). Cook also has 17% of the clients in the information industry so far this year. In fact, Cook has already engaged more information industry clients in 2008 than it did in all of 2007 (see Figure 5).
A Population Review
Conclusion
Audit Analyitics reviewed the population of SEC registrants to determine the percentage of companies that disclose the use of compensation consultants. The first population analyzed was a group of companies identified by Audit Analytics and given the name “Active Filer Index.” The Active Filer Index is a comprehensive, yet particular, population of market registrants that comprise the most thorough representation of companies that influence the public market. It is a public registrant population created for market analysis applications and other research.1 As of the date of this review, the Active Filer Index consists of 9,262 companies. Within this population, 2,543 companies (27.5%) disclose the use of a compensation consultant.
Certain categories of registrants that are not included in the Active Filer Index also disclose their use of compensation consultants. For example, real estate investment trusts (REITs) are not included in the Active Filer population. Nevertheless, when REITs that otherwise meet all of the criteria for an Active Filer are reviewed, the results show that 89 out of 316 (28.2%) disclose using a compensation consultant. Therefore, REITs hire compensation consultants at almost the same rate as Active Filers. In contrast, out of 3,429 asset-backed securities (another type of fund and trust), only 12 (0.35%) disclose the use of compensation consultants. The population review also found that a recent termination filed with the SEC does not rule out the recent use of such consultants. Of the 904 registrants with a recent de-registration filing (filed in 2007 or 2008), a total of 79 (8.7%) disclose the use of a compensation consultant.
Over 2,000 companies reported that they engaged compensation consultants in the past two years. Interestingly, the compensation consulting market is dominated by only a handful of consultants. There are seven consultants in particular that control about two-thirds of the market. Two of these consultants, Towers and Mercer, stand out as being a notch above the rest. There are occasions where other consultants rank higher than Towers and Mercer, however this occurs infrequently. Overall, these seven consultants compete well among companies that are industry leaders, such as those on S&P indices. The most varied results came from the smallest companies, where consultants outside of the top ten have the highest market share. Frederick W. Cook, third in total market share, appears to be building on past success.
1 To create the Active Filer population, Audit Analytics starts with a database of every SEC registrant that has disclosed auditor information (over 30,000 registrants) and removes specific categories of registrants that frequently dilute or otherwise skew a market analysis study: deregistered companies, Chapter 7 bankruptcies, inactive registrants, emerging registrants, non-tickered subsidiaries, shells, blank checks, non-operational entities, funds and trusts, and offices of bank holding and other holding companies. This index of companies provides a condensed and pure population of registrants that significantly influence the public registrant marketplace.
Audit Analytics® is the premier public company intelligence service providing independent research to the investment, accounting, insurance, legal, regulatory and academic communities.
Audit Analytics® provides intelligence research on over 20,000 public companies and 1,500 accounting firms. Our data includes detailed categorizations of issues and is considered by many professionals to be the best primary data source for tracking and analysis of the following public company disclosures:
• Sarbanes-Oxley Disclosures Track Section 404 internal control disclosures and Section 302 disclosure controls.
• Auditor Information Know who is auditing whom, their fees, auditor changes, auditor opinions and more.
• Restatements Identify financial restatements by type, auditor and peer group. Analyze by date, period and specific issue.
• Litigation & Legal Disclosures Search all federal litigation by auditor, company and litigation type. Know who is representing whom.
• Corporate Governance Track director & officer changes, audit committee members, C-level executives and their biographies.
Detailed reports are easily created by issue, company, industry, auditor, fees and more and are downloadable into Excel. Daily notifications via email are available for auditor changes, restatements and director & officer changes.
Access to Audit Analytics® is available via on-line user subscription, enterprise data-feeds, daily email notifications and custom research reports.
12
Contacting Audit Analytics®
For more information on subscriptions and data feeds, or to schedule an on-line demonstration, please refer to the contact information below:
Audit Analytics® Sales(508) 476-7007
Audit Analytics® - Public Company Intelligence