Comparisons of winds from satellite SAR, WRF and …...Comparisons of winds from satellite SAR, WRF...
28
Comparisons of winds from satellite SAR, WRF and SCADA to characterize coastal gradients and wind farm wake effects at Anholt wind farm Charlotte Hasager Tobias Ahsbahs Merete Badger Kurt S. Hansen Patrick Volker Vindkraftnet meeting, Ørsted, 9 April 2018 News on satellite SAR
Transcript of Comparisons of winds from satellite SAR, WRF and …...Comparisons of winds from satellite SAR, WRF...

Comparisons of winds from satellite SAR, WRF and SCADA to characterize coastal gradients and wind farm wake effects at Anholt wind farm
Charlotte Hasager
Tobias Ahsbahs
Merete Badger
Kurt S. Hansen
Patrick Volker
Vindkraftnet meeting, Ørsted, 9 April 2018
News on satellite SAR

07 December 2017DTU Wind Energy, Technical University of Denmark
Content
• Anholt wind farm
• Wind speed data
• Coastal wind speed gradient
• Wind farm wake
• Satellite SAR news
2
07 December 2017DTU Wind Energy, Technical University of Denmark3
Anholt wind farm
2013
Anholt wind farm in Kattegat

07 December 2017DTU Wind Energy, Technical University of Denmark
Wind speed data
4
SCADA: 01.2013 – 06.2015 (2.5 years, 10 minute)
Envisat ASAR: 08.2002 – 04.2012 (10 years)
Sentinel-1: 12.2014 – 05.2017 (3 years)
WRF: 01.2002 – 12.2017 (16 years, hourly)

07 December 2017DTU Wind Energy, Technical University of Denmark
SCADA
5
Exclude SCADA data when wind turbines are not grid connected or are not producing power during a complete 10-minute period or is curtailed.
The remaining periods are applicable for analysis after a final examination of the power curve.
Peña, A. et al., 2017. On wake modeling, wind-farm gradients and AEP predictions at the Anholt wind farm. Wind Energy, Science Discussions, 2017, pp.1–18.

07 December 2017DTU Wind Energy, Technical University of Denmark
• 30,000+ ENVISAT ASAR scenes (2002-2012)
• 100,000+ Sentinel-1 A/B SAR scenes (2014->)
https://satwinds.windenergy.dtu.dk/
Satellite SAR wind data archive at DTU

07 December 2017DTU Wind Energy, Technical University of Denmark
WRF
• The total simulated period covers 28 years from 1990 to 2017.
• The computational domain consists of three nests with an 18 km, 6 km and 2 km grid spacing.
• The outermost domain is forced by ERA-Interim Reanalysis. Using Yonsei University Scheme Planetary Boundary Layer scheme.
Further details in Peña, A. & Hahmann, A.N., 2017. 30-year mesoscale model simulations for the “Noise from wind turbines and risk of cardiovascular disease” project, DTU Wind Energy E, Vol. 0055.
7

07 December 2017DTU Wind Energy, Technical University of Denmark
SAR and WRF mean wind speed at 10 m
2002 to 2012

07 December 2017DTU Wind Energy, Technical University of Denmark
Ørsted 01
31
Row A15

07 December 2017DTU Wind Energy, Technical University of Denmark10
Criteria
• Wind direction between 245°and 275°
• Above cut-in wind speed
• Data available for all turbines at Row A
Wind conditions
07 December 2017DTU Wind Energy, Technical University of Denmark
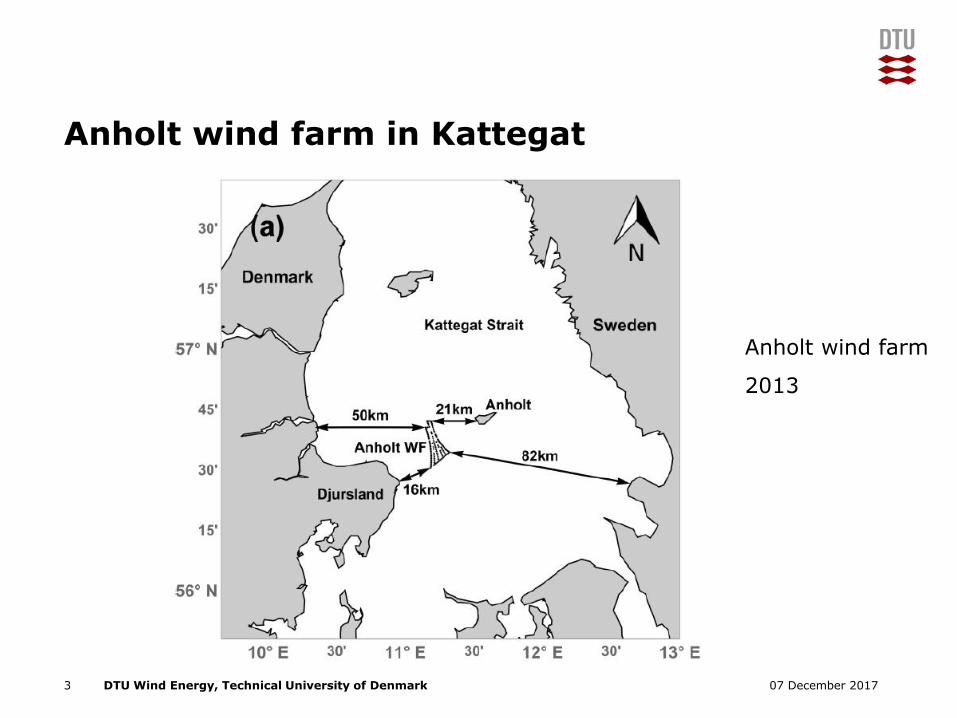
SAR vs. WRF
11
WRF (2002 to 2012) and WRF collocated with SAR.
The maximum deviation of mean wind speeds from the two WRF data sets is below 0.5%.
15

07 December 2017DTU Wind Energy, Technical University of Denmark
SAR vs. WRF vs. SCADA
12
WRF (2002 to 2012), SAR (2002-2012) and SCADA (2013-2015).
07 December 2017DTU Wind Energy, Technical University of Denmark13
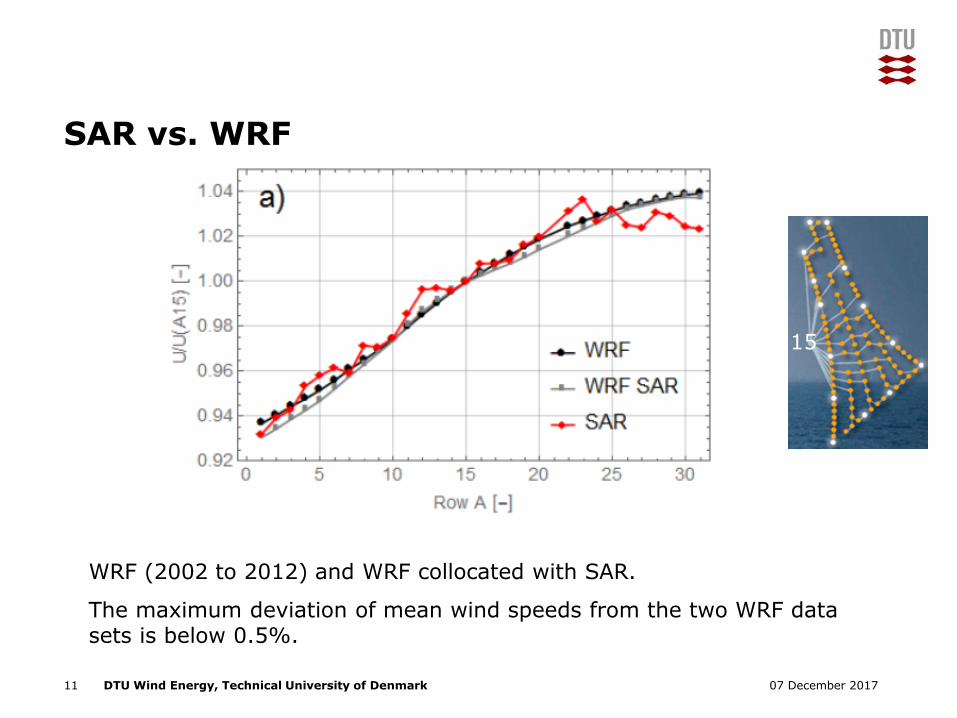
Wind speed variation between North and South turbines at Row A
𝛥𝑈𝑁,𝑆 =
𝑖=𝐴28
𝐴31
𝑈𝑖 −
𝑖=𝐴01
𝐴03
𝑈𝑖

07 December 2017DTU Wind Energy, Technical University of Denmark14
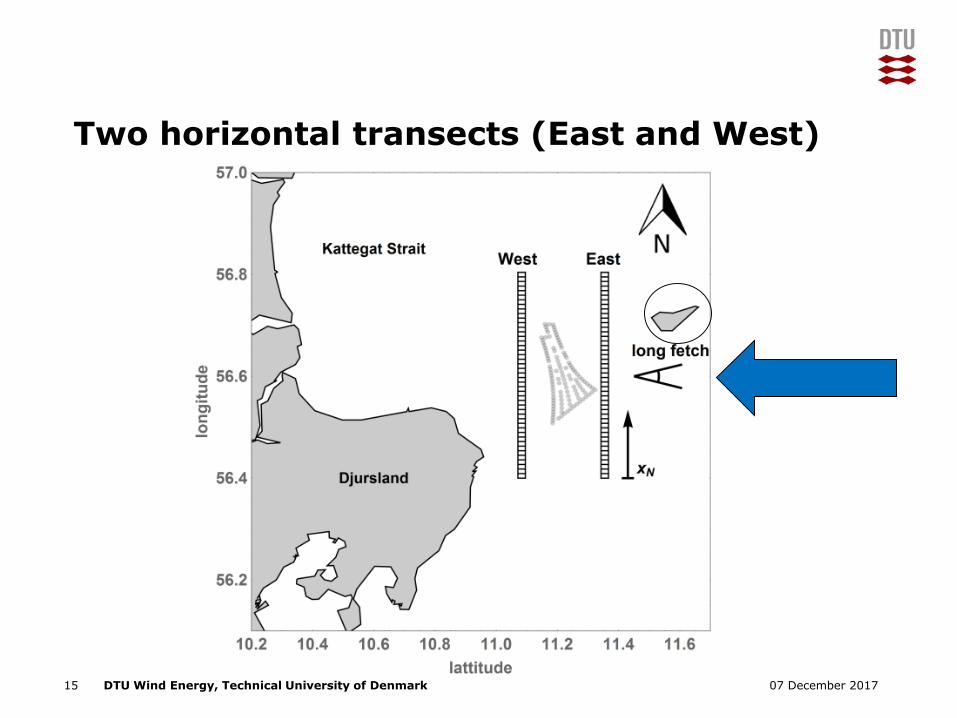
Wind farm wake analysis using SAR only
07 December 2017DTU Wind Energy, Technical University of Denmark15
Two horizontal transects (East and West)

07 December 2017DTU Wind Energy, Technical University of Denmark16
Before wind farm construction

07 December 2017DTU Wind Energy, Technical University of Denmark17
After wind farm construction

07 December 2017DTU Wind Energy, Technical University of Denmark18
Difference (East – West) and ± one std.dev.
Envisat 2002-2012
Sentinel-1 2014-2017

07 December 2017DTU Wind Energy, Technical University of Denmark19
https://www.wind-energ-sci-discuss.net/wes-2018-2/

07 December 2017DTU Wind Energy, Technical University of Denmark
Satellite SAR wind news
20

07 December 2017DTU Wind Energy, Technical University of Denmark
Global wind atlas
21
http://science.globalwindatlas.info/science.html

07 December 2017DTU Wind Energy, Technical University of Denmark
DTU Wind Energy satellite data stationProcessed wind maps:
Define Area Of Interest (AOI)
AOI: Westermost Rough
Time period: Entire archive
➢ 1522 images
22
Format of single netCDF file
https://satwinds.windenergy.dtu.dk/

07 December 2017DTU Wind Energy, Technical University of Denmark
Ease of use
Westermost Rough example:
• More than 1500 single images
– 1500 coordinate systems
– 62GB of data
• Different image coverage
– Full coverage
– Partial coverage
– Subsequent images
• Quantitative studies: Filtering data e.g. for wind direction
– Data format makes this cumbersome
23

07 December 2017DTU Wind Energy, Technical University of Denmark
Solution
• Single netCDF with “time series” of SAR wind fields
• Select AOI on the order of 25 km by 25 km
• Make a UTM coordinates (meters)
– Nearest neighbour (accept up to 250m shift)
– Only full coverage of AOI => constant sampling
– Keep all information
• Implementation in python using xarray
• Output: netCDF file format
For the example:
• 1500 file to 1 file
• 1500 irregular grids to 1 UTM grid
• 62GB to 500MB (15min calculation)
24
1500 single netCDF file
1 single netCDF file

07 December 2017DTU Wind Energy, Technical University of Denmark
Mean wind maps and coastal gradient study
• Consistent sampling is important for wind speed gradients
• No borders between images
25
Mean wind speed from Envisat
Left: All wind directions (445 images)
Right: Images with wind directions between 240 and 300 degrees (77 images)
m/s

07 December 2017DTU Wind Energy, Technical University of Denmark
Wind speeds before and after wind farm construction
26
Left: All wind maps before the wind farm showing mean wind speed (Envisat ASAR)
Right: All wind maps after the wind farm showing mean wind speed (Sentinel-1)
m/s

07 December 2017DTU Wind Energy, Technical University of Denmark
What is this good for?
Fast and easy in:
– Local reprocessing
– Filtering and selecting
– Debugging of analysis
Easily integrate other data sources:
– Can be used for validation and verification on offshore wind speeds
27
07 December 2017DTU Wind Energy, Technical University of Denmark
Acknowledgements
We would like to acknowledge:
• Ørsted and partners for granting access to data from the Anholt wind farm,
• Johns Hopkins University Applied Physics Laboratory and the National Atmospheric and Oceanographic Administration (NOAA) for the use of the SAROPS system,
• ESA for providing public access to data from Envisat ASAR,
• Copernicus for providing public access to data from Sentinel-1.
28


![Overview of the WRF/ChemOverview of the WRF/Chem modeling ...gurme/WRF - 01 - Overview [Compatibility Mode].pdf · Distant line-up for WRF/Chem, with various groups working on these](https://static.fdocuments.in/doc/165x107/5e76b2b733ffb837ea674751/overview-of-the-wrfchemoverview-of-the-wrfchem-modeling-gurmewrf-01-overview.jpg)